2012 Rappahannock-Rapidan Hazard Mitigation Plan.pdf
400
RAPPAHANNOCK‐RAPIDAN MULTI‐JURISDICTIONAL HAZARD MITIGATION PLAN 2012 UPDATE IN COORDINATION WITH: CULPEPER COUNTY FAUQUIER COUNTY MADISON COUNTY ORANGE COUNTY RAPPAHANNOCK COUNTY TOWN OF CULPEPER TOWN OF MADISON TOWN OF ORANGE TOWN OF REMINGTON TOWN OF WARRENTON
-
Upload
khangminh22 -
Category
Documents
-
view
4 -
download
0
Transcript of 2012 Rappahannock-Rapidan Hazard Mitigation Plan.pdf

RAPPAHANNOCK‐RAPIDAN MULTI‐JURISDICTIONAL
HAZARD MITIGATION PLAN
2012 UPDATE
IN COORDINATION WITH:
CULPEPER COUNTY
FAUQUIER COUNTY
MADISON COUNTY
ORANGE COUNTY
RAPPAHANNOCK COUNTY
TOWN OF CULPEPER
TOWN OF MADISON
TOWN OF ORANGE
TOWN OF REMINGTON
TOWN OF WARRENTON

TABLE OF CONTENTS
I. INTRODUCTION II. PLANNING PROCESS III. REGIONAL PROFILE IV. HAZARD IDENTIFICATION V. HAZARD ANALYSIS VI. VULNERABILITY ASSESSMENT VII. CAPABILITY ASSESSMENT VIII. MITIGATION STRATEGY OVERVIEW IX. PLAN MAINTENANCE
APPENDIX A: LOCAL & REGIONAL MITIGATION STRATEGIES
APPENDIX B: FEMA CROSSWALK
APPENDIX C: SUPPORTING DOCUMENTATION
APPENDIX D: PLAN ADOPTION RESOLUTIONS
APPENDIX E: HUMAN CAUSED HAZARD IDENTIFICATION
APPENDIX F: HUMAN CAUSED HAZARD VULNERABILITY ASSESSMENT
PREPARED WITH FUNDING FROM THE VIRGINIA DEPARTMENT OF EMERGENCY MANAGEMENT AND THE FEDERAL EMERGENCY
MANAGEMENT AGENCY

INTRODUCTION
BACKGROUND On October 30, 2000, the Disaster Mitigation Act of 2000, DMA2K, was signed into law. Thus was established the requirement that local and state governments develop and adopt Hazard Mitigation Plans (HMPs) to be eligible for Federal assistance through the Hazard Mitigation Grant Program (HMGP) and the Pre‐Disaster Mitigation (PDM) Program. Both programs are administered by the Federal Emergency Management Agency (FEMA) under the U.S. Department of Homeland Security. The first Rappahannock‐Rapidan Region Multi‐Jurisdictional All Hazard Mitigation Plan was approved by FEMA in 2005 and subsequently adopted by the five member counties – Culpeper, Fauquier, Madison, Orange and Rappahannock – and the towns of Culpeper, Madison, Orange, Remington and Warrenton. In accordance with DMA2K, the plan has been updated and prepared in coordination with FEMA Region III and the Virginia Department of Emergency Management. A Local Mitigation Plan Crosswalk, found in Appendix B, provides a summary of federal and state minimum standards and notes where each requirement is met within the Plan. The Rappahannock‐Rapidan Regional Hazard Mitigation Plan Update 2011 is a continuation of the planning effort begun in 2004 and is an effort among the participating jurisdictions to mitigate the impacts of natural hazards in the Rappahannock‐Rapidan region. In developing the 2011 Plan Update, certain elements of the original plan were retained. Irrelevant and/or outdated information was summarized for reference or removed. The goals, actions, and strategies included in the initial plan have been re‐evaluated and their status updated as completed, deleted, deferred or on‐going. Since the adoption of its first hazard mitigation plan in 2005, based on the 2000 census, the Rappahannock‐Rapidan region has experienced significant population growth along with associated changes in demographics, service demands, transportation needs, and economic development. This plan provides updated mitigation strategies designed to meet the needs of this changing region.
Hazard Mitigation:
Any sustained action taken to reduce or eliminate the long-term risk to
human life and property from hazards.

Rappahannock-Rapidan Regional Hazard Mitigation Plan 2012 Section 1: Page 2
Rappahannock‐Rapidan Region Population: 2000‐2010*
County 2000 2010 Population Change (%)
Culpeper 34,262 46,689 36.27% Fauquier 55,139 65,203 18.25% Madison 12,520 13,308 6.30% Orange 25,881 33,481 29.37% Rappahannock 6,983 7,373 5.6% R‐R Region 134,785 166,054 23.20% Source: U.S. Census Bureau *County populations include incorporated town populations. Hazard mitigation is defined as those actions taken to reduce, or eliminate, the effects of natural hazards on a locality and its population. The purpose of a mitigation plan is to justify the process of determining appropriate hazard mitigation actions. The 2011 Rappahannock‐Rapidan Regional HMP update process involved a comprehensive re‐evaluation of all sections of the previous plan. This document includes:
A detailed characterization of natural hazards that historically affect the Rappahannock‐Rapidan region;
A risk assessment analysis that describes potential losses to physical assets, people and operations;
Goals and objectives developed by each member jurisdiction;
Strategies and actions that will guide mitigation activities; and
A detailed procedure for implementing and monitoring the plan.
PURPOSE As a comprehensive strategy designed to reduce or eliminate the impacts of natural hazards in the region served by the R‐RRC, this plan includes specific programs and policies that may be implemented by member localities to assure readiness and resilience in response to disasters. The purpose of this plan is to:
Protect life and property, as well as natural systems and historic resources, by reducing the potential for damage and economic losses from natural and human‐caused hazards;
Improve community safety;
Increase public understanding, support and demand for hazard mitigation;
Speed response, recovery and redevelopment following disaster events;
Demonstrate a firm commitment to hazard mitigation principles;
Comply with state and federal requirements for local hazard mitigation planning; and
Qualify for grant funding in both the pre‐ and post‐disaster environment.

Rappahannock-Rapidan Regional Hazard Mitigation Plan 2012 Section 1: Page 3
SCOPE This plan focuses on those hazards determined to be of high and moderate risk as identified by a hazard risk assessment conducted in the five‐county region. This approach allows participating jurisdictions to prioritize planning strategies and mitigation actions verified by quantifiable characterizations of hazard risk and vulnerability. A review of past natural disasters in the Rappahannock‐Rapidan region identifies the following natural hazards as posing significant risks to member jurisdictions:
Floods
Hurricanes and Tropical Storms
Severe Thunderstorms and Hail
Tornadoes
Wildfire, Urban Interface Fire
Drought/Extreme Heat
Winter Storms
Landslides In addition to identifying and describing these hazards, the plan analyzes the Rappahannock‐Rapidan region's vulnerability to each. The physical characteristics of each hazard, along with its potential impact on the region's population, built and natural environments, and social and economic infrastructure are addressed in the Vulnerability Assessment. Goals and strategies for hazard mitigation and risk reduction are identified, as is a mechanism for plan maintenance.
AUTHORITY The 2011 Rappahannock‐Rapidan Multi‐Jurisdictional All Hazard Mitigation Plan was developed in accordance with all current applicable state and federal regulations. Upon approval by FEMA, the participating counties and towns will adopt the plan via resolution in accordance with the authority granted to counties and towns under §15.2‐2223 through §15.2‐2231 of the Code of the Commonwealth of Virginia. This plan will be monitored routinely and revised to maintain compliance with federal requirements. This plan was prepared in accordance with the requirements of the Disaster Mitigation Act of 2000 (Public Law 106‐390) and the implementation regulations set forth by the Interim Final Rule published in the Federal Register on February 26, 2002 (44 CFR §201.6) and finalized on October 31, 2007, referred to collectively hereafter as the Disaster Mitigation Act (DMA). While the Act emphasized the need for mitigation plans along with coordinated mitigation planning and implementation efforts, the regulations established requirements that local hazard mitigation plans must meet in order for local jurisdictions to be eligible for certain federal disaster assistance and hazard mitigation funding under the Robert T. Stafford Disaster Relief and Emergency Act (Public Law 93‐288). In addition, the DMA 2000 specifies those criteria required for the preparation and adoption of multi‐jurisdictional, all‐hazard mitigation plans. The Rappahannock‐Rapidan Region Multi‐Jurisdictional Hazard Mitigation Plan 2011 Update, meets all required elements, including:
Documentation of the plan preparation process, including participants;
Documentation of public involvement;
A regional risk assessment that includes:

Rappahannock-Rapidan Regional Hazard Mitigation Plan 2012 Section 1: Page 4
Identification of the hazards likely to affect the area, noting data limitations and
providing an explanation for eliminating hazards from further consideration;
A discussion of past events and descriptions of their severity and resulting effects;
A description of the local vulnerability to the described hazards in terms of the types
and numbers of buildings, infrastructure, and critical facilities located in the region;
An evaluation of potential losses, in dollars, to identified vulnerable structures and a
description of evaluation methods used; and
A determination of vulnerability to guide future land‐use decisions.
A hazard mitigation strategy that includes:
Goals to reduce or avoid vulnerabilities to the identified hazards;
A range of specific mitigation actions and projects to be considered;
An action plan detailing prioritization, implementation and administration of proposed
actions by local jurisdictions. Prioritization must reflect a cost/benefit analysis.
Jurisdiction‐specific action items within multi‐jurisdictional plans;
Documented participation in the planning process by all units of government included in the
plan.
Provisions for reviewing, monitoring and evaluating the progress of the plan’s
implementation, including consideration for the required five‐year update and re‐approval.
Documentation of formal adoption by each unit of government included in the plan.
This plan was developed with input and assistance from the Virginia Department of Emergency
Management and is consistent with the requirements of that agency.
The following table reflects the jurisdictions that participated in the development of the 2004 plan and the 2011 update:
JURISDICTION 2004 PARTICIPATION
PLAN ADOPTION DATE
2011 PARTICIPATION
Culpeper County Yes April 5, 2005 Yes
Fauquier County Yes October 14, 2004 Yes
Madison County Yes March 8, 2005 Yes
Orange County Yes February 22, 2005 Yes
Rappahannock County Yes February 7, 2005 Yes
Town of Culpeper Yes March 8, 2005 Yes
Town of Gordonsville No ‐ No
Town of Madison Yes February 3, 2005 Yes
Town of Orange Yes February 28, 2005 Yes
Town of Remington Yes January 24, 2005 Yes
Town of The Plains* No ‐ Through County*
Town of Washington* No ‐ Through County*
Town of Warrenton Yes March 8, 2005 Yes *The Town of The Plains and the Town of Washington have limited full‐time staff and work with Fauquier
and Rappahannock counties, respectively, on long‐term planning initiatives such as Mitigation planning.

Rappahannock-Rapidan Regional Hazard Mitigation Plan 2012 Section 1: Page 5
PLAN OUTLINE The Rappahannock‐Rapidan Regional Hazard Mitigation Plan Update 2011 is organized as follows:
Section 1: Introduction
Section 2: Planning Process – Plan Requirements, Description of Planning Process, Plan
Update participants
Section 3: Regional Profile – Profile of Rappahannock‐Rapidan region
Section 4: Hazard Identification – Identification and description of Hazards affecting the
Rappahannock‐Rapidan region
Section 5: Hazard Analysis – Description of historical hazard occurrences in the
Rappahannock‐Rapidan region
Section 6: Vulnerability Assessment – Assessment of potential impacts of hazards in the
Rappahannock‐Rapidan region
Section 7: Capability Assessment – Assessment of capability of jurisdiction’s to develop and
implement mitigation strategies and identify realistic goals and opportunities for jurisdiction
response
Section 8: Mitigation Strategy – Overview of relevant mitigation strategies and projects
Section 9: Plan Maintenance – Outline of future mitigation planning efforts and plan update
procedures
Appendix A: Local Mitigation Actions
Appendix B: FEMA Crosswalk
Appendix C: Supporting Documentation
Appendix D: Plan Adoption Resolutions
Appendix E: Hazard Identification (Human Caused Hazards)
Appendix F: Vulnerability Assessment (Human Caused Hazards)

PLANNING PROCESS In developing the Rappahannock-Rapidan Regional Hazard Mitigation Plan 2012, certain elements of the original plan were retained. Irrelevant and/or outdated information was summarized for reference or removed. The goals, actions, and strategies included in the initial plan have been re-evaluated and their status updated as completed, deleted, deferred or on-going. This section describes the planning process undertaken by the Rappahannock-Rapidan Regional Commission and participating jurisdictions in the regional plan update process. Topics include:
• Overview of hazard mitigation planning; • Planning team participation; • Explanation of how the Plan was prepared and updated;
HAZARD MITIGATION PLANNING Hazard mitigation planning is the process of organizing community resources, identifying and assessing hazard risks, and determining how to minimize or manage those risks. While this Plan deals primarily with natural hazards, human-caused hazard risk has also been analyzed and discussed in Appendices E and F. Mitigation planning can be described as the means to break the repetitive cycle of disaster loss. A core assumption of hazard mitigation is that pre-disaster investments will significantly reduce the demand for post-disaster assistance by lessening the need for emergency response, repair, recovery and reconstruction. The primary objective of the planning process is the identification of specific mitigation actions, which when viewed as a whole, represents a comprehensive strategy to reduce the impact of hazards. Responsibility for each mitigation action is assigned to a specific individual, department or agency along with a schedule for its implementation. Plan Maintenance Procedures (located in Section 9 of this Plan) are established to monitor progress, including the regular evaluation and enhancement of the Plan. The maintenance procedures ensure that the Plan remains a dynamic and functional document over time. Mitigation planning offers many benefits, including:
• Saving lives and property; • Saving money; • Speeding recovery following disasters; • Reducing future vulnerability through wise development and post-disaster recovery and
reconstruction; • Expediting the receipt of pre-disaster and post-disaster grant funding; and • Demonstrating a firm commitment to improving community health and safety.
As referenced in Section 1, the Disaster Mitigation Act of 2000 (DM2K) requires state and local governments to develop and formally adopt natural hazard mitigation plans in order to be eligible to apply for Federal assistance under the HMGP. The Act authorizes up to seven percent of HMGP funds available to a State after a disaster to be used for the development of State, tribal, and local mitigation plans.

Planning Process
Rappahannock-Rapidan Regional Hazard Mitigation Plan 2012
Section 2: Page 2
Adoption of this plan and approval from FEMA is required for localities to remain eligible to apply for the five Hazard Mitigation Assistance (HMA) Programs. These HMA programs present a critical opportunity to reduce the risk to individuals and property from natural hazards while simultaneously reducing the reliance on Federal disaster funds. States, Territories, Indian Tribal governments, and communities are encouraged to take advantage of funding provided by HMA programs in both pre- and post-disaster timeframes. Together, these programs provide significant opportunities to reduce or eliminate potential losses to State, Tribal, and local assets through hazard mitigation planning and project grant funding. Each HMA program was authorized by separate legislative action, and as such, each program differs slightly in scope and intent. The guidance applies to the programs of: Hazard Mitigation Grant Program (HMGP), Pre-Disaster Mitigation Program (PDM), Flood Mitigation Assistance Program (FMA), Repetitive Flood Claims Program (RFC), and Severe Repetitive Loss Program (SRL). While the statutory origins of the programs differ, all share the common goal of reducing the risk of loss of life and property due to natural hazards. In general, the local government is a “sub-applicant” that is an eligible entity that submits a sub-application for FEMA assistance to the "Applicant" which would be the Commonwealth of Virginia. If HMA funding is awarded, the sub-applicant becomes the “sub-grantee” and is responsible for managing the sub-grant and complying with program requirements and other applicable Federal, State, Territorial, Tribal, and local laws and regulations. By incorporating the five programs together the HMA consolidates the common requirements for all programs and explains the unique elements of the programs in individual sections. The organization improves the clarity and ease of use of the guidance by presenting information common to all programs in general order of the grant life cycle. The HMA Unified Guidance can be found on FEMA’s website at: http://www.fema.gov/library/viewRecord.do?id=4225.
• Flood Mitigation Assistance Program (FMA): To qualify to receive grant funds to implement projects such as acquisition or elevation of flood-prone homes, local jurisdictions must prepare a mitigation plan. The plan must include specific elements and be prepared following the process outlined in the National Flood Insurance Program’s (NFIP) Community Rating System.
• Hazard Mitigation Grant Program (HMGP): To qualify for post-disaster mitigation funds, local jurisdictions must have adopted a mitigation Plan that is approved by FEMA.
• Pre-Disaster Mitigation Grant Program (PDM): To qualify for pre-disaster mitigation funds, local jurisdictions must adopt a mitigation Plan that is approved by FEMA.
• FEMA/NFIP Severe Repetitive Loss Program (SRL): The SRL program was authorized by the Flood Insurance Reform Act of 2004 to provide funding to reduce or eliminate the long-term risk of flood damage to residential structures under the NFIP which have suffered repetitive losses. SRL properties have at least four NFIP claim payments over $5,000, with at least two of the claims within a 10 year period. SRL properties are also residential structures that have at least two separate claim payments made within a 10 year period with the cumulative amount of the building portion of the claims exceeding the value of the property.
• FEMA/NFIP Repetitive Flood Claim Program (RFC): The RFC program was authorized by the Flood Insurance Reform Act of 2004 to assist States and communities reduce flood

Planning Process
Rappahannock-Rapidan Regional Hazard Mitigation Plan 2012
Section 2: Page 3
damages to properties that have at least one NFIP claim payment. Various hazard mitigation activities are eligible including acquisition, elevation, and dry flood-proofing of residential structures.
PLANNING TEAM ORGANIZATION The Rappahannock-Rapidan Regional Hazard Mitigation Plan 2012 included participation by planning and engineering staff from participating counties and towns, emergency management officials from participating counties and towns, staff members from the Rappahannock-Rapidan Regional Commission, and state agency officials. Participants in the planning process also included: local Police, Fire and Rescue Departments, State Police, regional non-profit organizations, community colleges, utility companies and interested members of the public. Point of contact information for each participating jurisdiction and supporting agency, along with planning team meeting attendance sheets, can be found in Appendix C. In cases where localities were unable to attend planning team meetings, Rappahannock-Rapidan Regional Commission staff met separately with jurisdiction staff to provide project updates and provide assistance with the planning process. PLAN PREPARATION The Rappahannock-Rapidan Regional Hazard Mitigation Plan 2012 is a revision of the 2005 Plan, approved by FEMA in December 2004 and adopted by jurisdictions in 2005. The 2012 version of the RRRC Regional Hazard Mitigation Plan was developed in accordance with the provisions of the Disaster Mitigation Act of 2000(Public Law 106-390), the Pre-Disaster Mitigation Grant Program, 44 Code of Federal Regulations Part 206, and the planning standards adopted by the Virginia department of Emergency Management. It should also be noted that both the original HMP and the updated HMP were prepared in accordance with the process established in the FEMA 386-series of mitigation planning How-To guides, as well as the requirements of the February 26, 2002 IFR and July 1, 2008 Local Multi-Hazard Mitigation Planning Guidance document. The 386-series of guides provided the structure for the process that was used to develop and update the Regional Mitigation Plan. Each section of this updated Plan includes specific information regarding how the FEMA Interim Final Rule requirements were met, as well as the process that was used to obtain and interpret data, determine and prioritize goals, strategies and actions, and implement and monitor elements of the Plan. Development of 2011 Plan Update The Rappahannock-Rapidan Regional Commission coordinated the updates to the Regional Hazard Mitigation Plan 2012, with assistance from FEMA and the Virginia Department of Emergency Management.

Planning Process
Rappahannock-Rapidan Regional Hazard Mitigation Plan 2012
Section 2: Page 4
The Rappahannock-Rapidan Regional Hazard Mitigation Plan includes five counties and eight incorporated towns. To satisfy multi-jurisdictional participation requirements, counties and local towns were required to perform the following tasks: • Participation/Attendance at mitigation planning meetings; • Completion the Local Capability Assessment Survey; • Identification of any unique local hazards apart from the identified regional hazards; • Identification of completed mitigation projects, if applicable; and • Update and develop additional mitigation actions to be included as addenda to 2005
Mitigation Action Plans. Three planning team meetings were held in 2010 to kickoff the process of updating the plan. All meetings were held at the Rappahannock-Rapidan Regional Commission offices and were publically advertised and open to the public. February 23, 2010: RRRC Regional Hazard Mitigation Plan Update Kickoff Meeting
• Hazard Mitigation Overview • Data Collection Guide Review and Format • Project Schedule • Outline of jurisdictional responsibilities
April 20, 2010: RRRC Regional Hazard Mitigation Plan Update Meeting
• Hazard Identification Review • Unique Hazard Identification Review • Hazard History Update & Review
July 13, 2010: RRRC Regional Hazard Mitigation Plan Update Meeting
• Critical Facilities/Asset Inventory Review • Demographic Analysis Update & Review • Mitigation Action & Strategy Review
Throughout 2011 and 2012, local and regional staff completed updates to the hazard identification and analysis, vulnerability analysis, capability assessment and mitigation action strategies sections of the plan. Regional Commission staff also reviewed the man-made hazard appendices from the 2005 RRRC Regional Hazard Mitigation Plan as part of the update process. During the plan update process, a publically accessible survey was made available on the Rappahannock-Rapidan Regional Commission’s website (http://www.rrregion.org) for interested members of the public to provide feedback on the plan update and specify local and regional hazards and vulnerabilities. A copy of the survey can be found in Appendix C: Supporting Documentation. Following coordinated reviews with each of the participating jurisdictions, Rappahannock-Rapidan Regional Commission staff developed the draft 2012 RRRC Regional Hazard Mitigation Plan in March 2012. The draft plan was made available for public review and comment for a three week period ending on April 6, 2012 and a review meeting was held on April 13, 2012 with

Planning Process
Rappahannock-Rapidan Regional Hazard Mitigation Plan 2012
Section 2: Page 5
the Hazard Mitigation planning team. Draft copies of the plan were available via the Regional Commission’s website and hard copies were made available at the Rappahannock-Rapidan Regional Commission and public libraries in the county seats of the five counties in the region. No public comments were received during the public comment period. Comments received from Hazard Mitigation stakeholders after the release of the draft plan were incorporated, as applicable, into the draft 2012 Rappahannock-Rapidan Regional Hazard Mitigation Plan prior to submission to FEMA for conditional approval. Plan Adoption Following conditional approval from FEMA, each participating jurisdiction held a public hearing prior to adoption of the 2012 Rappahannock-Rapidan Regional Hazard Mitigation Plan update. Each county and town held their regularly scheduled board or council meetings at which time the final version of the plan was presented for adoption. These meetings are publicly advertised by law. The meetings provided citizens one final opportunity to comment and suggest possible revisions.

Planning Process
Rappahannock-Rapidan Regional Hazard Mitigation Plan 2012
Section 2: Page 6
Development of 2005 Plan The following section, describing the planning process for the development of the 2005 Rappahannock-Rapidan Regional Hazard Mitigation Plan, is included for reference below: The planning process followed a widely recognized approach that meets the requirements of FEMA and the Virginia Department of Emergency Management. A Local Mitigation Plan Crosswalk, found in Appendix B, provides a summary of federal and state standards of acceptability and notes where each requirement is met within the Plan. The planning process included nine (9) major steps that were completed over the course of 10 months. The steps are displayed in Figure 2.1 and discussed below. First, the primary components of the Plan will be discussed, followed by a description of the three community workshops.
Figure 2.1 A Community-Based Mitigation Planning Process
Hazard Identification& Risk Assessment
Capability Assessment
Community WorkshopsPhase 1
Community WorkshopsPhase 2
Mitigation Strategy
Plan MaintenanceProcedures
Documentation
Adoption/Approval
Community Workshops Phase 3
A COMMUNITY-BASED MITIGATION PLANNING PROCESS
The Community Profile, located in Section 3, describes the makeup of participating counties and municipalities, including prevalent geographic, demographic and economic characteristics. In addition, building characteristics and land use patterns are discussed. This baseline information helps to provide a snapshot of the planning area and thereby assist R-RRC and regional officials recognize those factors that ultimately play a role in describing community vulnerability. The Risk Assessment, found in Sections 4 through 6, describes and analyzes the natural and human-caused hazards present within the Rappahannock-Rapidan Region. This analysis utilizes historical data on past hazard occurrences, and establishes hazard profiles and a hazard risk

Planning Process
Rappahannock-Rapidan Regional Hazard Mitigation Plan 2012
Section 2: Page 7
ranking based on hazard frequency, magnitude and impact. The FEMA HAZUS® loss estimation methodology, combined with the use of existing historical hazard data, was used to conduct the assessment. The findings of the risk assessment enable communities to focus their efforts on those structures or planning areas facing the greatest risk. The Capability Assessment, found in Section 7, provides a comprehensive examination of participating jurisdictions’ capacity to implement meaningful mitigation actions and identifies existing opportunities for program enhancement. Capabilities addressed in this section include staff and organizational capability, technical capability, policy and program capability, fiscal capability, legal authority and political willpower. Information was obtained through the use of detailed questionnaires and the analysis of existing plans, ordinances and relevant documents. The purpose of this assessment is to identify any existing gaps, weaknesses or conflicts in programs or activities that may hinder mitigation efforts, or to identify those activities that can further the overall mitigation strategy. The Community Profile, Risk Assessment and Capability Assessment are considered background studies and form the basis for developing, adopting and implementing the Mitigation Strategy found in Section 8. The Mitigation Strategy is intended to be both strategic (based on long-term goals) and functional (tied to short-term actions). In order to ensure that the Mitigation Strategy is effectively implemented over time, Plan Maintenance Procedures have been established and are found in Section 9. Community Meetings and Workshops The creation of the Plan required a series of meetings and workshops, designed to collect data, inform counties and local governments of the Risk Assessment and Capability Assessment findings, develop mitigation actions, and involve the public. The series of meetings and workshops prompted continuous input and feedback from R-RRC officials, local officials and concerned citizens throughout the planning process. The meetings and community workshops are described below.
Initial Project Kickoff Meeting
The project kickoff meeting was held on January 15, 2004 with the staff of the Rappahannock-Rapidan Regional Commission, staff members from project consultants PBS&J and URS and members of the participating counties and municipalities. Discussions focused on the overall project approach, emphasizing the steps necessary to meet the requirements of the Disaster Mitigation Act of 2000. First, a description of the hazard mitigation planning process was presented, explaining each step and the type of data that would be required to develop the plan. Specific tools, including the Data Acquisition and Categorization Matrix, used to collect necessary risk assessment information, and the Capability Assessment Survey were described. The Public Participation Survey was also introduced. Next, the project timeline was presented. Finally, roles and responsibilities were assigned to members of the planning team, including R-RRC officials, municipal governments and project consultants. Specific roles for the parties involved in the planning process included:

Planning Process
Rappahannock-Rapidan Regional Hazard Mitigation Plan 2012
Section 2: Page 8
Rappahannock-Rapidan Regional Commission • Project Management • Coordination Developing and monitoring inter-local agreements; Meeting and workshop logistics; and Data collection and exchange. • Communications Group e-mail distribution; and Web site postings. • Data Providing demographic profiles for the RRRC region; Providing hazard identification and risk assessment data; and Disseminating Local Capability Assessment Questionnaires to counties and participating municipalities. • Documentation PBS&J & URS
• Technical Assistance • Data Collection • Analysis Hazard Identification and Risk Assessment; Capability Assessment; and Mitigation Strategy Development. • Community Workshops/ Public ParticipationMonthly Progress Reports
County and Municipal Governments
• Coordination Establish single point of contact; Attend community workshops; and Solicit public input/involvement. • Data Hazard Identification; Capability Assessment; and Completed Hazard Mitigation Programs. • Mitigation Strategy Develop goals and mitigation actions; and Establish local implementation procedures (responsibility and timeline). • Plan adoption by governing body Finally, critical “next steps” were discussed, including the need for ongoing coordination throughout the planning process. Specific issues included the need to gather and analyze additional data, such as information associated with human-caused hazards. Future meetings were discussed, including the first planning workshop with each county and participating municipalities and the second workshop that involved the presentation of the risk and capability assessment findings.

Planning Process
Rappahannock-Rapidan Regional Hazard Mitigation Plan 2012
Section 2: Page 9
It was decided that immediately following the second planning workshop, separate brainstorming sessions would be conducted in order to assist each county and participating town formulate regional goals and their jurisdiction-specific mitigation actions. It was also decided that evening public meetings would be held following each workshop to invite public comment on the findings of the risk and capability assessments and solicit input regarding hazard concerns and potential mitigation actions that could be added to those identified by participating county and town officials. Once a draft Plan was completed, it would be presented to local officials and the general public for further comment. The comments would be incorporated and a final draft Plan would be prepared for submittal to the state and FEMA for their review and approval.
Second Planning Workshop The second regional planning workshop was held on April 29, 2004, at the Rappahannock-Rapidan Regional Commission’s Board Room. During this meeting, the PBS&J staff presented the preliminary findings of the Risk Assessment and Capability Assessment to county and municipal officials. Providing officials with a more thorough understanding of hazard risks and the capabilities present to address them set the stage for the next step in the process—the creation of specific mitigation actions designed to reduce future impacts.
Table 2.1 Workshop Information
Meeting Location Date
Kickoff Meeting R-RRC Board Room January 15, 2004 Mitigation Strategy Workshop R-RRC Board Room April 29, 2004
Following the presentation of the risk assessment findings, an interactive session was held to address questions and discuss potential concerns. In addition, each workshop attendee was issued a survey form entitled, “Identification of Hazards Unique to Individual Jurisdictions” designed to capture data on hazards not identified in the Risk Assessment presentation. Next, the Capability Assessment findings were presented. Participating communities that had not submitted surveys to R-RRC prior to the workshop were encouraged to do so as soon as possible. An interactive brainstorming session was conducted in the afternoon with all workshop attendees. A “cardstorming” technique was used to begin building general countywide consensus on the mitigation goals for the Hazard Mitigation Plan. Attendees were asked to identify specific mitigation actions that their county or town could undertake to help them become less vulnerable to identified hazards. Each jurisdiction was encouraged to keep their existing capabilities in mind, in order to develop feasible mitigation actions and recommend specific improvements in existing programs. Workshop participants were asked to spend 30 minutes discussing possible mitigation actions, including policies or projects, with other representatives from their jurisdiction. Following these

Planning Process
Rappahannock-Rapidan Regional Hazard Mitigation Plan 2012
Section 2: Page 10
discussions, individuals were instructed to write down specific mitigation actions on adhesive cards. The cards were then posted on the wall in order for all participants to review and discuss. Community officials were encouraged to elaborate upon each of their proposed mitigation actions. The discussion allowed individuals to clarify their thoughts and recognize similarities and differences across mitigation actions. Next, the group sought to build consensus on the categorization of each proposed mitigation action. Following a brief review of the index cards placed on the wall, the workshop participants began to arrange the mitigation actions into columns that represented separate mitigation categories. Once categorized, each column was labeled by the group and later transformed into the goal statements found in Section 6. The mitigation actions identified during the cardstorming exercise were grouped into the following categories: • Improve and update data • Policy • Planning • Structural Projects • Training • Education and Outreach • Evacuation It was explained to county and municipal officials that following this workshop, they were expected to go back to their respective jurisdictions and convene with appropriate officials to identify additional mitigation actions. These actions, and those identified in the cardstorming exercise, were to be filled out using Mitigation Action Worksheets, provided by R-RRC.1
Once completed, the worksheets were returned to R-RRC and incorporated into the Plan. Finally, the existing actions were reviewed relative to identified hazard vulnerabilities and local capabilities. Based on this review, additional mitigation actions were suggested by the planning team. Proposed actions were derived from an extensive listing of pre-drafted mitigation measures, referred to as the Mitigation Policy Matrix. This approach, emphasizing three distinct phases (cardstorming, in-house mitigation action identification, and expert input via the Mitigation Policy Matrix), was designed to provide each participating jurisdiction with a more comprehensive Mitigation Strategy.
In addition to the regional planning workshops, the Rappahannock-Rapidan Regional Commission, in coordination with FEMA, also hosted a HAZUSMH training class in Warrenton, Virginia. The class was held May 13 and 14, 2004 at the Lord Fairfax Community College. HAZUSMH is discussed in greater detail later in this Plan but is essentially a loss estimation modeling software that FEMA encourages to be used in developing hazard mitigation plans. The workshop was attended by various participants including members of academia, employees from other regional planning offices, and FEMA staff, among others.
1 An example of the Mitigation Action worksheet is located in Section 6, Mitigation Strategy.

Planning Process
Rappahannock-Rapidan Regional Hazard Mitigation Plan 2012
Section 2: Page 11
Involving the Public An important component of this planning process involved public participation. Individual citizen and community-based input provided the entire planning team with a greater understanding of local concerns and increased the likelihood of successfully implementing mitigation actions by developing community “buy-in” from those directly affected by the decisions of public officials. As citizens become more involved in decisions that affect their safety, they are more likely to gain a greater appreciation of the natural hazards present in their community and take the steps necessary to reduce their impact. Public awareness is a key component of an overall mitigation strategy aimed at making a home, neighborhood, school, business or city safer from the potential effects of natural and human-caused hazards. Public input was sought using four methods: 1) public meetings; 2) public participation survey; 3) Web site access; and 4) public library posting of the draft Plan. County-level public meetings were held at two stages of the planning process—following the second planning workshop and upon completion of the draft Plan. County-level public meetings were held to present the findings of the risk and capability assessments and garner input regarding hazard concerns and possible mitigation actions that could be included in the Plan. In many cases, citizens provided localized details of problematic hazards, particularly those that directly affected them.
Table 2.2 First Public Meetings2
Date
Location
April 28, 2004 Town of Orange April 29, 2004 Town of Culpeper April 29, 2004 Town of Warrenton
Citizen concerns were also captured through the use of a Public Participation Survey.3 This tool was distributed to counties and participating municipalities as well as concerned citizens during public meetings. In addition, the survey was posted on the R-RRC public Web site. The survey asked a variety of questions that allowed the public a chance to weigh in on hazard mitigation issues within their communities4
. A total of four surveys were collected from jurisdictions within the region. Comments were incorporated into the Risk Assessment and Mitigation Strategy sections of this Plan.
The second round of public meetings was held in conjunction with the adoption of the Plan. Each county and town held their regularly scheduled board or council meetings at which time the final version of the plan was presented for adoption. These meetings are publicly advertised by law. The meetings provided citizens one final opportunity to comment and suggest possible revisions. 2 Sign-in sheets from the first round of public meetings can be found in Appendix C. 3 A sample of the Public Participation Survey can be found in Appendix C. 4 A summary of all the Public Participation Surveys received can be found in Appendix C.

Planning Process
Rappahannock-Rapidan Regional Hazard Mitigation Plan 2012
Section 2: Page 12
Involving Stakeholders A range of stakeholders was involved in the mitigation planning process. Stakeholder involvement was encouraged through the use of multiple planning workshops, public meetings, press releases, public notices and the notification of stakeholder groups. Appendix C contains information on how the public meetings were advertised. Any potential stakeholders were invited to attend and offer comments. Multi-Jurisdictional Participation The Rappahannock-Rapidan Region Multi-Jurisdictional All-Hazard Mitigation Plan includes five counties and eight incorporated towns. To satisfy multi-jurisdictional participation requirements, counties and local towns were required to perform the following tasks: • Participate in mitigation planning workshops; • Complete the Local Capability Assessment Survey; • Identify completed mitigation projects, if applicable; and • Develop and adopt a local Mitigation Action Plan, including county or town-level goals and
mitigation actions. Each county and town participated in the planning process and has developed local Mitigation Action Plans unique to their jurisdiction. Each county and town will adopt their Mitigation Action Plan separately. This provides the means for jurisdictions to monitor and update their Plan on a regular basis.

REGIONAL PROFILE
AREA AT A GLANCE Made up of the counties of Culpeper, Fauquier, Madison, Orange and Rappahannock, and the incorporated towns of Culpeper, Gordonsville, Madison, Orange, Remington, The Plains, Warrenton, and Washington, the Rappahannock-Rapidan region covers 1,965 square miles (1,257,600 acres) and is home to 166,054 persons. Named for two regionally significant rivers, the area is in north-central Virginia in the foothills of the Blue Ridge Mountains. It is served by the Rappahannock-Rapidan Regional Commission (RRRC), Planning District 9 (PD9), which works within these jurisdictions to encourage and facilitate collaborative solutions to area-wide problems and concerns. With the Town of Culpeper as its approximate geographic center, the region is about seventy miles southwest of Washington D.C., eighty-five miles northwest of Richmond, Virginia, and forty-five miles north-east of Charlottesville, Virginia. As part of the Virginia Piedmont, the area is predominantly rural. It is characterized by thickly forested hillsides, gently rolling farmlands and small towns and villages. Residents enjoy a lifestyle focused on small communities, abundant natural resources, and ready access to outdoor recreation. World class museums, outstanding cultural opportunities and all levels of spectator and participant sports events are available nearby. The relative affordability of the area over the past ten years resulted in a significant increase in population. For the most part, families moving into the region came from Northern Virginia, Washington D.C, Fredericksburg and Charlottes-ville. Newcomers' needs for housing and associated development and services increased demands on the region's resources. Residential communities have sprung up along
Figure 3.1 Overview of the Rappahannock-Rapidan Region

C O M M U N I T Y P R O F I L E
Rappahannock-Rapidan Regional Hazard Mitigation Plan 2012 Section 3: Page 2
primary commuter corridors, straining the area's transportation network. Although the area's economy is rooted in agriculture, an increasing number of residents travel daily to jobs in the surrounding region, including Northern Virginia, Washington, D.C. and Charlottesville. Many of the region’s natural hazards reflect its topography and hydrology. From the Blue Ridge Mountains at its western edge, to the rolling farmland of the Piedmont in the east, the region has a varied geology and unique physiographic character. Because of high elevations and steep slopes, Madison and Rappahannock Counties are prone to flash-floods, sometimes accompanied by landslides. Dense forests in these areas add the possibility of forest fires. Overall, flooding is the most common natural hazard that impacts the region. Rainstorms of historic significance occasionally have produced severe localized flooding. The entire region routinely experiences ice storms, significant snowfall, high winds, forest fires, and the effects of tropical storms and hurricanes.
GEOGRAPHY The counties of the Rappahannock-Rapidan region cover approximately 1,965 square miles. Fauquier County, at 660 square miles, is the largest and almost twice the size of the next largest county, Culpeper, at 389 square miles. Due to its size and proximity to the highly urbanized Northern Virginia area and Washington D.C., about 40 percent of the region's residents live in Fauquier County.
Table 3.1 County Populations and Densities
County Area
(square mi./acres) 2010 Population (U.S.
Census) Persons
per square mile Culpeper 389/248,960 46,689 120 Fauquier 660/422,400 65,203 99 Madison 327/209,280 13,308 41 Orange 355/227,200 33,481 94 Rappahannock 271/173,440 7,373 27 R-RRC Region 1,965/1,257,600 166,054 85
Source: Virginia Association of Counties, 2010 U.S. Census Bureau

C O M M U N I T Y P R O F I L E
Rappahannock-Rapidan Regional Hazard Mitigation Plan 2012 Section 3: Page 3
With steep, heavily forested slopes, and peaks in excess of 3,000 feet, the Blue Ridge Mountains mark the western edge of the region. Many of the larger federal and state owned properties in the region are located here, including Shenandoah National Park, a section of the Appalachian Trail, Sky Meadow State Park, and the Rapidan and Thompson wildlife management areas. The Thompson, Weston and Chester Phelps wildlife management areas, as well as the Whitney State Forest, are in the eastern part of the region where the landscape reflects the character of the Virginia Piedmont - rolling farm fields and forests, punctuated by small villages and towns. The Rappahannock River traverses the region from northwest to southeast. Over 184 miles in length from its headwaters in Shenandoah National Park to its mouth at the Chesapeake Bay, the Rappahannock, along with its tributaries, the Hazel, Hughes, Rush, Thornton, Robinson and Rapidan rivers, drains the greater part of the region. About sixty percent of its watershed is forested, with another seventeen percent devoted to agricultural uses. Lesser portions of the region drain south to the York River and north to the Potomac. Because of significant changes in elevation from the mountainous headwaters' regions in the west to the flatter, gently rolling topography to the east, many streams are characterized as flashy, exhibiting increasing velocity and turbulence downstream and flooding locally during high rain events. On rare occasions, extreme rainfall in the region has resulted in severe landslides and significant flood damage. Global scale weather patterns modified by the region's diverse landscape result in variable climate and weather experiences throughout the five county area. Storms and systems tracking from west to east interacting with more tropical coastal air masses produce a variety of outcomes and conditions. The mass of the Blue Ridge Mountains directs, blocks and modifies the impacts of storms and systems while the relative proximity of the Atlantic Ocean influences temperature and humidity.
Figure 3.2 Geography of the Rappahannock-Rapidan Region

C O M M U N I T Y P R O F I L E
Rappahannock-Rapidan Regional Hazard Mitigation Plan 2012 Section 3: Page 4
Overall, the climate is moderate with an average annual temperature of about 56 degrees. Summer temperatures tend to be in the 70s, while winter temperatures are typically in the 30s. The average annual rainfall is about 42", with snowfall throughout the region averaging about 20" per year.
Figure 3.3 Major River Basins

C O M M U N I T Y P R O F I L E
Rappahannock-Rapidan Regional Hazard Mitigation Plan 2012 Section 3: Page 5
LAND USE
Despite an increase in residential development, much of the land cover in the region remains forested or agricultural.
Table 3.2 Land Cover Percentages
Land Cover Type Culpeper Fauquier Madison Orange Rappahannock
Pasture/Hay 40.3 42.9 29.2 32.3 29.2 Row Crops 3.3 1.9 3.4 2.3 0.6 Low Intensity Residential 1.8 2.4 1 1.4 0.7 Transitional 1.1 0.6 0 1.4 0 Deciduous Forest 30.5 33.7 43.1 36.9 44.3 Evergreen Forest 6.7 4 4 7.8 3.4 Mixed Forest 15.4 13.8 18.4 16.4 21.2 Woody Wetlands 0 0 0 0.6 0 Open Water 0 0 0 0.5 0 TOTAL 99.1 99.3 99.1 99.6 99.4 Source: 2008, National Land Cover Dataset, UVA Geostat Center, http://fisher.lib.virginia.edu/collections/gis/nlcd/
TABLE 3.3
FOREST LAND AREA BY COUNTY: THOUSANDS OF ACRES
COUNTY ACCESSIBLE FOREST NON-FOREST OTHER TOTAL
CULPEPER 109.7 120.7 6.4 236.7
FAUQUIER 203.2 218.1 5.5 426.9
MADISON 93.7 101.1 - 194.9
ORANGE 136.2 82.9 7.9 227.0
RAPPAHANNOCK 134.5 62.9 - 197.4
REGION 677.3 585.7 19.8 1,282.9
Source: Virginia Department of Forestry

C O M M U N I T Y P R O F I L E
Rappahannock-Rapidan Regional Hazard Mitigation Plan 2012 Section 3: Page 6
Table 3.4
Number of Farms and Acres of Farmland 2002 to 2007 Comparison
COUNTY
# FARMS
2002
#FARMS
2007
FARM ACRES
2002
FARM ACRES
2007
% CHANGE IN
FARM ACRES 2002-2007
CULPEPER
669
667
125,121
111,370
-11.0%
FAUQUIER
1,344
1,222
238,135
222,486
-6.7%
MADISON
531
564
102,874
102,757
-0.1%
ORANGE
486
518
104,879
104,606
-0.3%
RAPPAHANNOCK
443
416
78,483
65,084
-17.1%
REGION
3,473
3,387
649,492
606,303
-6.6%
SOURCE: 2007 U.S. CENSUS OF AGRICULTURE
TRANSPORTATION The Rappahannock-Rapidan region is connected by a strong multi-modal transportation network. U.S. Routes 29 and 15 run north - south through the region, providing a connection with the Northeast Corridor cities of Washington, D.C., Philadelphia, New York and Boston. Interstate 66 and U.S. Routes 17 and 522 connect the region east-west. The major eastern U.S. interstates, I-81 and I-95, are each about 30 miles from the heart of the Rappahannock-Rapidan region. I-81, to the west of the region, runs north-south through the Shenandoah Valley. Thirty miles to the east, I-95, the most heavily travelled interstate in the nation, runs north –south connecting all major eastern cities. Both I-66 and I-95 are used heavily by through-travelers, transport companies and those commuting daily to employment in Northern Virginia and the Washington, D.C. metropolitan area. There are over 2,500 miles of primary and secondary roads in the region maintained by the Virginia Department of Transportation. Because of its size, population and proximity to the ever-urbanizing Northern Virginia area, Fauquier County has the highest number of miles of primary and secondary roads. Culpeper is second. Many rural areas are served by private roads maintained by homeowners' associations or individuals. Construction standards and maintenance practices on private roads are variable.

C O M M U N I T Y P R O F I L E
Rappahannock-Rapidan Regional Hazard Mitigation Plan 2012 Section 3: Page 7
Figure 3.4 Major Transportation Routes

C O M M U N I T Y P R O F I L E
Rappahannock-Rapidan Regional Hazard Mitigation Plan 2012 Section 3: Page 8
Table 3.5 Primary and Secondary Roadway Miles by County
Locality Primary Miles % of Region Secondary Miles % of Region Total Miles
Culpeper 75.13 19.600032 484.68 22.89499 559.81 Fauquier 104.98 27.38775 802.08 37.01389 907.06 Madison 62.75 16.33053 306.23 14.13171 368.98 Orange 82.97 21.64567 355.13 16.38832 438.1 Rappahannock 57.48 14.99570 218.85 10.09936 276.33 Total 383.31 100 2,166.97 100 2,550.28 Source: 12/31/07 VDOT Mileage Tables, http://mileagetables.virginiadot.org/default.asp Over the last decade, the Rappahannock-Rapidan region has experienced significant growth, most of which has occurred along the region’s principal travel corridors (Fig. 3.4). These highways, commonly used for commuting and through-traffic, have been identified as primary evacuation routes for use in the event of a natural or man-made disaster. As might be expected, current levels of rush hour congestion suggest the potential for extreme gridlock under evacuation circumstances. Norfolk Southern and CSX Railroad own and operate freight service rail lines that connect the Southeastern U.S. and central Virginia with Washington, D.C. and the Northeast Corridor. With a daily train from Lynchburg, Virginia to Washington, D.C., Amtrak runs the Cardinal and Crescent routes through the region, providing a stop in Culpeper, Virginia. Plans for expanding commuter rail options include extending VRE service from Manassas to Marshall in northern Fauquier County. In addition, there has been consideration of establishing regular commuter rail service along the Norfolk Southern/ Amtrak line that runs north-south through the region. Four publicly owned airports provide general aviation services to the region. Culpeper Regional Airport (KCJR) and Warrenton-Fauquier Airport (KHWY) both average over 120 aircraft operations per day, while Orange County Airport (KOMH) and Gordonsville Municipal Airport average fewer than 30 aircraft operations per day. (Source: www.airnav.com)

C O M M U N I T Y P R O F I L E
Rappahannock-Rapidan Regional Hazard Mitigation Plan 2012 Section 3: Page 9
POPULATION
Figure 3.5 Alternative Transportation Modes

C O M M U N I T Y P R O F I L E
Rappahannock-Rapidan Regional Hazard Mitigation Plan 2012 Section 3: Page 10
From 2000 to 2010 the population of the region grew from 134,785 to 166,054, an increase of 23.2% with most newcomers from Washington D.C. and the Northern Virginia metropolitan area. Despite this increase, the region's population density remains rather low at 85 individuals per square mile in 2010, slightly less than the national average of 87 persons per square mile and considerably less than that of the Commonwealth’s 203 persons per square mile. Both Culpeper and Fauquier counties experienced population increases of over 10,000 from 2000 to 2010, while Orange County grew by over 7,500. Fauquier County overwhelmingly remains the most populous county in the region (Table 3.6). Culpeper and Orange counties’ growth rates of 36.3 percent and 29.4 percent respectively, are more than double the average growth rate for the Commonwealth.
Table 3.6 Population Growth in the Region
Town 2000 Population 2010 Population Percent Change Population
Change
Culpeper 9,664 16,379 69.48 6,715 Gordonsville 1,498 1,496 -0.07 -2 Madison 210 229 9.05 19 Orange 4,123 4,721 14.50 598 Remington 624 598 -4.17 -26 The Plains 266 217 -18.42 -49 Warrenton 6,670 9,611 44.09 2,941 Washington 183 135 -26.23 -48
County* 2000 Population 2010 Population Percent Change Population
Change Culpeper 34,262 46,689 36.27 12,427 Fauquier 55,139 65,203 18.25 10,064 Madison 12,520 13,308 6.29 788 Orange 25,881 33,481 29.36 7,600 Rappahannock 6,983 7,373 5.58 3,390 R-RRC Region 134,785 166,054 23.20 31,269 Virginia 7,079,048 8,001,024 13.02 921,976 Nation 281,424,602 308,745,538 9.71 27,320,936 Source: U.S. Census Bureau; * County populations include incorporated towns Predictions indicate that population growth trends will continue across the region as they have been with most increases occurring in counties that are closest to Northern Virginia and nearby urban areas (Table 3.7).

C O M M U N I T Y P R O F I L E
Rappahannock-Rapidan Regional Hazard Mitigation Plan 2012 Section 3: Page 11
Table 3.7
County Population Projections
County 2010 (U.S. Census) 2020 2030
Culpeper 46,689 61,255 75,221 Fauquier 65,203 83,319 107,168 Madison 13,308 15,624 17,222 Orange 33,481 42,021 50,732 Rappahannock 7,373 8,242 9,066 R-RRC Region 166,054 216,460 259,409
Sources: Virginia Employment Commission Overall, increases in population generally result in more potential impacts from natural hazards. It should be noted, however, that improved construction standards, new building practices and enhanced response programs often offset perceived vulnerabilities. Recent rapid growth in some of the region's counties requires consideration for the possible increase in potentially vulnerable groups including older residents, those with special needs, individuals living on low or fixed incomes and individuals with no, or limited, access to transportation.
HOUSING Due to its size and proximity to Northern Virginia and the I-66 and Route 29 commuting corridors, Fauquier County has the greatest number of housing units in the region. Over the past ten years, however, Culpeper and Orange counties have claimed the greatest rate of population growth along with a corresponding growth in number of housing units. It should be noted, however, that the number of building permits issued in the region has declined after spiking in the middle of the past decade.
Table 3.8 Number of Housing Units
County 2000 (U.S.
Census) 2010 (U.S.
Census) %
Change
Housing Unit Density (sq.
mile)
Culpeper County 12,871 17,657 37.18 45.4
Fauquier County 21,046 25,600 21.64 38.8
Madison County 5,239 5,932 13.23 18.1
Orange County 11,354 14,616 28.73 41.2
Rappahannock County 3,303 3,839 16.23 14.2
R-RRC Region 53,813 67,644 25.70 34.4 Source: U.S. Census

C O M M U N I T Y P R O F I L E
Rappahannock-Rapidan Regional Hazard Mitigation Plan 2012 Section 3: Page 12
The steep decline in the number of residential building permits issued (Table 3.9) and the definite drop in the average sales prices of existing homes(Table 3.10) further emphasize the regional repercussions of the world-wide recession.
Table 3.9 Residential Building Permits
County 2000 2004 2009
Culpeper County 334 1,428 57
Fauquier County 533 703 106
Madison County 106 112 42
Orange County 247 526 61
Rappahannock County 44 58 21
R-RRC Region 1,264 2,827 287 Source: 2010 RRRC Data Summary
Table 3.10
Average Residential Real Estate Selling Price
County 2005 2007 2009
Culpeper County $343,641 $328,619 $196,883
Fauquier County $507,939 $483,296 $325,500
Madison County $296,475 $297,072 $217,622
Orange County $307,256 $319,962 $203,096
Rappahannock County $498,353 $401,297 $359,122
R-RRC Region $400,672 $391,517 $253,641
Source: MRIS
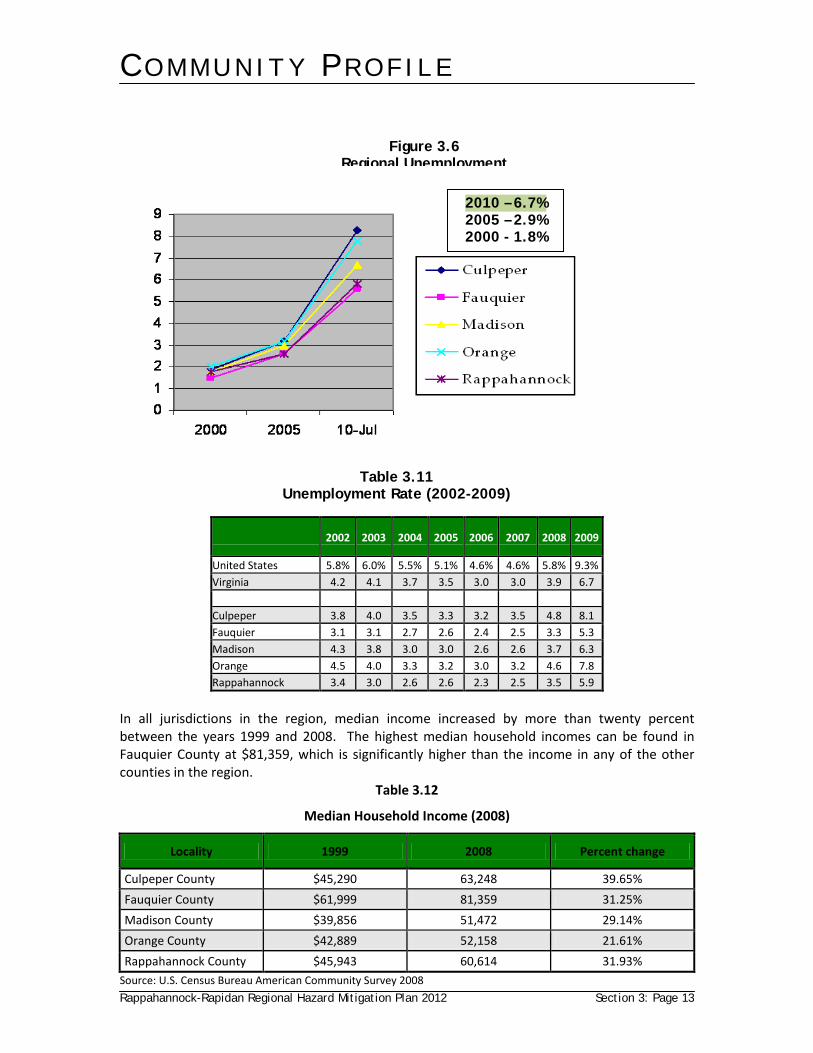
EMPLOYMENT AND INCOME Because of its proximity to Washington, D.C., the Rappahannock-Rapidan region has weathered the current recession better than most areas. Unemployment levels tend to be lower than those in other parts of the state and the nation. Within the region, unemployment historically tends to be higher in the towns than in the counties.
C O M M U N I T Y P R O F I L E
Rappahannock-Rapidan Regional Hazard Mitigation Plan 2012 Section 3: Page 13
2002 2003 2004 2005 2006 2007 2008 2009
United States 5.8% 6.0% 5.5% 5.1% 4.6% 4.6% 5.8% 9.3% Virginia 4.2 4.1 3.7 3.5 3.0 3.0 3.9 6.7 Culpeper 3.8 4.0 3.5 3.3 3.2 3.5 4.8 8.1 Fauquier 3.1 3.1 2.7 2.6 2.4 2.5 3.3 5.3 Madison 4.3 3.8 3.0 3.0 2.6 2.6 3.7 6.3 Orange 4.5 4.0 3.3 3.2 3.0 3.2 4.6 7.8 Rappahannock 3.4 3.0 2.6 2.6 2.3 2.5 3.5 5.9
In all jurisdictions in the region, median income increased by more than twenty percent between the years 1999 and 2008. The highest median household incomes can be found in Fauquier County at $81,359, which is significantly higher than the income in any of the other counties in the region.
Table 3.12
Median Household Income (2008)
Locality 1999 2008 Percent change
Culpeper County $45,290 63,248 39.65%
Fauquier County $61,999 81,359 31.25%
Madison County $39,856 51,472 29.14%
Orange County $42,889 52,158 21.61%
Rappahannock County $45,943 60,614 31.93% Source: U.S. Census Bureau American Community Survey 2008
EMPLOYMENT TRENDS (% UNEMPLOYED)
REGION
Source: VEC
EMPLOYMENT TRENDS (% UNEMPLOYED)
REGION
Source: VEC
EMPLOYMENT TRENDS (% UNEMPLOYED)
REGION
Source: VEC
EMPLOYMENT TRENDS (% UNEMPLOYED)
REGION
Source: VEC
EMPLOYMENT TRENDS (% UNEMPLOYED)
REGION
Source: VEC
EMPLOYMENT TRENDS (% UNEMPLOYED)
REGION
Source: VEC
2010 – 6.7% 2005 – 2.9% 2000 - 1.8%
Figure 3.6 Regional Unemployment
Table 3.11 Unemployment Rate (2002-2009)

C O M M U N I T Y P R O F I L E
Rappahannock-Rapidan Regional Hazard Mitigation Plan 2012 Section 3: Page 14
Agriculture-related employment in the region is higher than the national or state average, but currently employs only 2.5 percent of the region's population, significantly less than the 2000 value of 6 percent. The highest percentages of workers are involved in the state and local government sector (20.93 percent), retail trade (14.16 percent), and health care and social assistance (11.3 percent).
DECLARED DISASTERS Table 3.13
Federally Declared Disasters: Rappahannock-Rapidan Region
1972 - 2010
Locality Affected Date of Storm Description
Entire Region 09/08/1972 Tropical Storm Agnes Culpeper 10/10/1972 Severe Storms and Flooding Orange 10/10/1972 Severe Storms and Flooding Madison 10/10/1972 Severe Storms and Flooding Madison 11/10/1985 Severe Storms and Flooding Rappahannock 05/19/1992 Severe Storms and Flooding Entire Region 04/11/1994 Severe Winter Ice Storm Culpeper 07/03/1995 Severe Storms and Flooding Orange 07/06/1995 Severe Storms and Flooding Rappahannock 07/06/1995 Severe Storms and Flooding
Madison 07/01/1995 Severe Storms and Flooding Entire Region 02/02/1996 Blizzard of 96 (Severe Snow Storm) Fauquier 02/09/1996 Flooding, High Winds and Wind Driven Rain Rappahannock 02/02/1996 Flooding, High Winds and Wind Driven Rain Entire Region 09/16/1996 Hurricane Fran, Associated Severe Storm Conditions Entire Region 02/28/2000 Severe Winter Storms Fauquier 03/27/2003 Severe Winter Storm, Record/Near Record Snowfall,
Heavy Rain, Flooding, and Mudslide Orange 03/27/2003 Severe Winter Storm, Record/Near Record Snowfall,
Heavy Rain, Flooding, and Mudslide Rappahannock 03/27/2003 Severe Winter Storm, Record/Near Record Snowfall,
Heavy Rain, Flooding, and Mudslide Entire Region 09/18/2003 Hurricane Isabel Entire Region 09/12/2005 Hurricane Katrina Evacuation Location Entire Region 12/18/2009 Severe Snowstorm Entire Region 02/5/2010 Severe Winter Storm and Snowstorm Entire Region 02/11/2010 Severe Winter Storms and Snowstorms Culpeper 08/23/2011 Earthquake Orange 08/23/2011 Earthquake
Source: FEMA

HAZARD IDENTIFICATION Requirement §201.6(c) (2) (i): [The risk assessment shall include a description of the type of all natural hazards that can affect the jurisdiction. The plan shall include information on previous occurrences of hazard events and on the probability of future hazard events.]
Communities throughout the United States are vulnerable to any number of natural hazards that threaten life and property. These include: Natural Hazards
Flood
Hurricanes and Coastal Storms
Severe Thunderstorms and Tornados
Wildfire
Drought/Extreme Heat
Winter Storms and Freezes
Hail
Erosion
Dam/Levee Failure
Earthquakes
Sinkholes
Landslides
Some hazards are interrelated while others are made up of elements that are not considered separately. For example, flooding and tornados are often associated with hurricanes, and severe thunderstorms can include damaging lightening. In addition, terrorist‐related incidents or accidents involving chemical, radiological or biological agents can coincide with natural hazard events such as flooding resulting from the destruction of a dam or an accidental chemical release caused by a tornado.
FLOOD Flooding is the most frequent and costly natural hazard in the United States. Nationally, about 150 people are killed in floods each year. Nearly ninety percent of presidential disaster declarations result from natural events in which flooding is a major component. Historically, Virginia's most significant floods have been associated with hurricanes and tropical storms. Usually the result of excessive precipitation, floods may be classified as general floods, characterized by prolonged precipitation over a specific watershed, or flash floods, the product of heavy, localized precipitation of short duration. For the most part, the severity of a flooding event is determined by a combination of overall weather patterns, topography, the type and duration of the precipitation event, existing soil moisture and the extent and type of vegetative cover. Floods are usually long‐term events that may last for several days. They include river, flash, coastal, and urban floods, with the first two being Virginia's most significant and most likely to occur within the Rappahannock‐Rapidan region. River flooding results from excessive precipitation and high runoff volumes over a large area. In Virginia, river flooding often begins with widespread flash flooding of small streams. This may result from a series of small storms or the impact of larger systems including tropical storms, hurricanes, and northeasters. Snowmelt may also contribute to excessive runoff. Flash floods, as the name suggests, strike quickly. Resulting from intense rainfall rates that quickly exceed surface absorption capacity, flash floods are often associated with slow‐moving thunderstorms, hurricanes and

H A Z A R D I D E N T I F I C A T I O N
Rappahannock-Rapidan Regional Hazard Mitigation Plan 2012 Section 4: Page 2
tropical storms. Streams, creeks and drainage‐ways quickly become raging torrents. Occurring more frequently along mountain streams, flash floods also affect highly urbanized areas where impervious surfaces offer no opportunity for infiltration. Rapidly moving walls of water and associated debris can uproot trees, roll boulders, destroy buildings, and obliterate bridges and roads. Flash floods also may result from the sudden release of water blocked by a shifting ice jam or the spontaneous failure of a dam or levee. Coastal floods are usually caused by storm surges, wind‐driven waves, and heavy rainfall associated with hurricanes, tropical storms, northeasters, and other large coastal storms. Flooding in
urban areas occurs when heavy rains or melt‐water intercept wide expanses of pavement where reduced permeability, alteration of natural flow regimes, and inadequate, or clogged, storm drains combine to create excessive runoff. The periodic inundation of floodplains is natural, inevitable and anticipated. Floodplains are designated by the frequency of the event that covers them. This is generally expressed as the statistical probability of flooding in a given year. For example, in any year, the 100‐year flood has a 1 percent chance of occurrence.
Above: The Rapidan River near Rapidan, Virginia. (Source: Rappahannock‐Rapidan Regional Commission)
Table 4.1
National Flood Losses by Water Year (Oct‐Sep) Unadjusted damage amounts in thousands of dollars are as reported, not adjusted for inflation. The Construction Cost Index is used to adjust for inflation. The adjustment factor was applied to the unadjusted estimates to get the column damages estimates "adjusted" to 2007 dollars. The Construction Cost Index was obtained from McGraw Hill Construction Engineering News‐Record.
Year Unadjusted Damages
(K) CCI Adjustment Factor
Adjusted Damages (Billions)
1985 $500,000 4182 2.05 $1.025
1986 $6,000,000 4295 2.00 $12.000
1987 $1,444,199 4406 1.95 $2.816
1988 $225,298 4519 1.90 $0.428
1989 $1,080,814 4615 1.86 $2.010
1990 $1,636,431 4732 1.81 $2.962
1991 $1,698,781 4835 1.77 $3.007
1992 $762,762 4985 1.72 $1.312

H A Z A R D I D E N T I F I C A T I O N
Rappahannock-Rapidan Regional Hazard Mitigation Plan 2012 Section 4: Page 3
1993 $16,370,010 5210 1.64 $26.847
1994 $1,120,309 5408 1.58 $1.770
1995 $5,110,829 5471 1.57 $8.024
1996 $6,121,884 5620 1.52 $9.305
1997 $8,730,407 5826 1.47 $12.834
1998 $2,496,960 5920 1.45 $3.621
1999 $5,455,263 6059 1.41 $7.692
2000 $1,338,735 6221 1.38 $1.847
2001 $7,309,308 6334 1.35 $9.868
2002 $1,211,339 6538 1.31 $1.587
2003 $2,482,230 6695 1.28 $3.177
2004 $13,970,646 7115 1.20 $16.765
2005 $42,010,435* 7446 1.15 $48.312
2006 $3,744,636 7751 1.11 $4.157
2007 $2,609,160 7966 1.08 $2.818
2008 $6,987,392 8310 1.03 $7.197
2009 $1,000,026 8570 1.00 $1.000
*The devastation and loss of life associated with Hurricanes Katrina and Rita were extensive and, to date, not yet quantified. Source: National Oceanic and Atmospheric Administration, Hurricane Research Division
HURRICANES, COASTAL STORMS AND NOR'EASTERS
Hurricanes, tropical storms, nor'easters and typhoons are all cyclonic storms. In the northern hemisphere, these are characterized by counterclockwise rotational air movement around and into a low pressure center. Cyclonic storms are Virginia's weather makers. Tropical cyclones, as the name suggests, form over tropical waters and carry with them the heat and moisture typical of those regions. Damaging forces associated with these storms are high‐level sustained winds, heavy precipitation, and tornados. Wind‐driven waves, storm surges and tidal flooding are of particular concern in coastal areas where flooding can be more destructive than cyclonic winds. The key energy source for a tropical cyclone is the release of latent heat from the condensation of moisture‐laden air. Most hurricanes and tropical storms
Workers clean up Main Street in the Town of Orange, VA after Hurricane Isabel, September 2003. Photo by Kevin Lamb, The Orange County Review.

H A Z A R D I D E N T I F I C A T I O N
Rappahannock-Rapidan Regional Hazard Mitigation Plan 2012 Section 4: Page 4
form in the Atlantic Ocean, Caribbean Sea, and Gulf of Mexico during the Atlantic hurricane season, June through November. The peak of the Atlantic hurricane season is early to mid‐September. On average, about six storms per year reach hurricane intensity in this region. As recorded, about 69 tropical cyclones have tracked directly across Virginia. Virginia averages about one storm per year. While some years are storm‐free, others may witness multiple storms just days or weeks apart. Figure 4.1 (below) integrates data from 1944 to 1999 to indicate the probability of a tropical storm occurring during the June to November Atlantic hurricane season.
Figure 4.1
Probability of a Named Storm
(winds≥39 mph)
Source: National Oceanic and Atmospheric Administration, Hurricane Research Division
As a hurricane develops the barometric pressure at its center falls and winds increase. If the atmospheric and oceanic conditions are favorable, the storm can intensify into a tropical depression. When maximum sustained winds reach or exceed 39 miles per hour, the system is designated a tropical storm, given a name, and monitored closely by the National Hurricane Center in Miami, Florida. Once sustained winds reach or exceed 74 miles per hour, the storm is a hurricane. The Saffir‐Simpson Scale categorizes hurricane intensity based on maximum sustained winds, barometric pressure, and storm surge potential, which are combined to estimate potential damage. Categories 3, 4, and 5 are “major” hurricanes. While hurricanes within this range represent only 20 percent of the storms that make landfall, they account for over 70 percent of the damage. Damage typically associated with each hurricane category is summarized below.

H A Z A R D I D E N T I F I C A T I O N
Rappahannock-Rapidan Regional Hazard Mitigation Plan 2012 Section 4: Page 5
Table 4.2
Saffir‐Simpson Hurricane Wind Scale
Scale Number Category
Central Pressure
mb inches
Wind Speeds mi/hr knots
Observed Damage
1 >=980
>=28.94
74‐95
64‐82
Dangerous winds: Damage to unanchored mobile homes, building roof tops, commercial signage, trees, shrubs, power lines. (Gaston – 2004‐ Atlantic Coast)
2 965‐979
28.50‐28.91
96‐110
83‐95
Extremely dangerous winds: Extensive damage to mobile homes, major roof and siding damage to all structures, trees uprooted, power lines downed, collapse of unreinforced masonry walls. (Isabel – 2003 – Atlantic Coast; Dolly ‐ 2008 ‐ Gulf Coast)
3 945‐964
27.91‐28.47
111‐130
96‐113
Devastating damage: Total destruction of all pre‐1994 mobile homes, extensive damage to all structures, unreinforced masonry buildings may collapse, high‐rise windows blown out, electricity and water service unavailable for several days. (Fran – 1996‐ Atlantic Coast)
4 920‐944
27.17‐27.88
131‐155
114‐135
Catastrophic damage: Extensive damage as noted above, extensive windborne debris damage, high percentage of structural damage to multi‐level apartment buildings, power and water outages for months, area uninhabitable. (Charley – 2004 – Florida West Coast)
5 <"920"
<"27.17"
>"155"
>"135"
Catastrophic damage: area uninhabitable for months, collapse of multi‐story and industrial buildings. (Camille – 1969 – Atlantic Coast; Andrew‐ 1992 – Florida; Katrina – 2005 – Gulf Coast)
Source: National Hurricane Center ‐ 2010

H A Z A R D I D E N T I F I C A T I O N
Rappahannock-Rapidan Regional Hazard Mitigation Plan 2012 Section 4: Page 6
Figure 4.2 Hurricane Strikes 1950 ‐ 2009
Hurricanes often spawn deadly tornados. In addition, flooding frequently results from the heavy rainfall that typically accompanies these storms. Occasionally more damaging than hurricanes, nor'easters have a deserved reputation as Virginia's worst winter storms. Nor'easters result from the interaction of two pressure systems sitting just offshore over the Atlantic. The counterclockwise rotation of a low pressure system and the clockwise rotation of a high pressure system combine to bring wind and moisture to the East Coast from the northeast, hence the name. The ferocity of the storm depends on the strength, dynamics and interaction of the two systems. Nor'easters can erode low‐lying coastal areas with damaging surf, glaze the region with layers of ice and deposit heavy snow across extensive areas. Typically, these storms occur from November through April, but are usually at their worst in January and February.

H A Z A R D I D E N T I F I C A T I O N
Rappahannock-Rapidan Regional Hazard Mitigation Plan 2012 Section 4: Page 7
SEVERE THUNDERSTORMS AND TORNADOS According to the National Weather Service, more than 100,000 thunderstorms occur each year; however, only about 10 percent are classified as severe. Although thunderstorms generally affect only a small area, the extent of their impact is often enhanced by their ability to generate tornados, hailstorms, strong winds, damaging lightning and flash floods. Thunderstorms occur in all regions of the United States and are very common in the Rappahannock‐Rapidan region where topographic and atmospheric conditions combine to create ideal circumstances for generating these powerful storms. Thunderstorms form when moist, unstable air is lifted vertically into the atmosphere by (1) unequal heating of Earth's surface, (2) orographic lifting due to topographic obstruction of air flow, or (3) dynamic lifting along a front. Rising air cools and condenses forming cumulus clouds. Continued lifting and accompanying instability is needed for storm development. Thunderstorms may occur singly, in lines, or in clusters and may move through an area very quickly or linger in place for several hours.
Figure 4.3
Multiple cloud-to-ground and cloud-to-cloud lightning strokes observed during a nighttime thunderstorm. (Photo courtesy of NOAA Photo Library, NOAA Central Library; OAR/ERL/ National Severe Storms Laboratory)

H A Z A R D I D E N T I F I C A T I O N
Rappahannock-Rapidan Regional Hazard Mitigation Plan 2012 Section 4: Page 8
LIGHTNING Lightning is the discharge of electrical energy resulting from the buildup of positive and negative charges within a thunderstorm. The lightning flash occurs within the clouds or between the clouds and the ground. A bolt of lightning can reach temperatures approaching 50,000 degrees Fahrenheit. Lightning rapidly heats the sky as it flashes but the surrounding air cools following the bolt. This rapid heating and cooling of the surrounding air causes thunder. On average, 89 people are killed each year by lightning strikes in the United States.
Table 4.3
Virginia Lightning Statistics 1959 – 2005
Location Deaths Injuries
Open Space 16 39
Under Trees 17 52
On/Near Water 7 18
Golf Course 3 9
On Phone – land line 0 9
On/Near Heavy Equipment 3 9
Near Door/Window 3 15
Other/Unknown 17 18
VDEM: http://www.vaemergency.com/newsroom/history/stats/lightning/index.cfm As might be expected, most injuries and deaths associated with lightning strikes occur during those months when thunderstorms are most prevalent, June, July and August.
Table 4.4
Virginia Lightning Statistics by Month
Month March April May June July August September
Deaths 0 1 11 14 17 17 3
Injuries 7 3 17 42 91 63 10
VDEM: http://www.vaemergency.com/newsroom/history/stats/lightning/index.cfm

H A Z A R D I D E N T I F I C A T I O N
Rappahannock-Rapidan Regional Hazard Mitigation Plan 2012 Section 4: Page 9
Tornados are violent windstorms characterized by twisting, funnel‐shaped clouds extending from a cloud mass to the ground. Usually generated by thunderstorm activity, they may be spawned by hurricanes and other intense low pressure systems. Wind speeds range from 40 to 300 miles per hour. Damage from high winds, flying debris, lightning and hail is often extreme. On Friday September 17, 2004 Tropical Depression Ivan spawned 9 tornados that touched down in Virginia. Around 4:20 P.M. The Meadows neighborhood in Fauquier County, VA (see photo) was hit by a F3 tornado. Twenty‐five homes were damaged; however, there were no injuries. Losses county‐wide were estimated at more than $1.4 million. On average, there are about 1,200 tornados with 80 storm‐related deaths and 1,500 injuries reported across the United States annually. Tornado season runs from late winter to mid‐summer, with the majority of storms in the southeast occurring in the early part of the season. Tornados vary widely in wind speed and surface impact. Most are a few yards wide and touch down only briefly; however, extremely dangerous storms may extend over a mile in width and carve out a path of destruction several miles long. The storm's intensity, size and duration determine its impact. As might be expected, tornados cause the greatest damage to lightly constructed buildings, particularly mobile homes. The Fujita‐Pearson Scale for Tornados was developed to characterize tornado strength and associated damages. Although still commonly used, the Fujita Scale was revised in 2007 to reflect research by structural engineers and meteorologists who more precisely matched wind speed estimates with types of damage to 23 types of buildings and objects including trees, towers and poles. Modifications made to the original scale were limited to ensure that the new Enhanced F‐scale could continue to support the original tornado database.
Photo: Vincent Vala, Culpeper Star-Exponent

H A Z A R D I D E N T I F I C A T I O N
Rappahannock-Rapidan Regional Hazard Mitigation Plan 2012 Section 4: Page 10
Table 4.5
Fujita Scale of Tornado Winds and Damage Enhanced Fujita (EF) Scale (2007)
(statistics 1950‐2007)
F Scale Class. MPH Damage # in VA
% Deaths / Injuries
Damage ($ Mil)
EF Scale Class. MPH
F0 Weak 40‐72 Light. Tree branches snapped; antennas and signs damaged.
183 34 0 / 0 8.2 EF0 Weak 65‐85
F1 Moderate 73‐112 Moderate. Roofs off; trees snapped; trailers moved or overturned.
253 47 1 / 97 65.5 EF1 Moderate 86‐110
F2 Strong 113‐157 Considerable.Weak structures and trailers demolished; cars blown off road.
80 15 3 / 94 148.2 EF2 Strong 111‐135
F3 Severe 158‐206 Roofs & some walls torn off well constructed buildings; some rural buildings demolished; cars lifted and tumbled.
24 4 19 / 104 140.5 EF3 Severe 136‐165
F4 Devastating 207‐260 Houses leveled leaving piles of debris; cars thrown some distance.
2 0.1 4 / 248 50 EF4 Devastating 166‐200
Source: http://www.vaemergency.com/newsroom/history/tornado.cfm

H A Z A R D I D E N T I F I C A T I O N
Rappahannock-Rapidan Regional Hazard Mitigation Plan 2012 Section 4: Page 11
Figure 4.4
Source: American Society of Civil Engineers
In Virginia, tornados occur most frequently in July. The hot, humid conditions typical of this month often generate late afternoon or evening thunderstorms which may result in tornadic activity. Despite their frequency, July tornados tend to be weak, with 91% falling into the F0 or F1 category (see chart). While not as many tornados occur in the Spring and Fall, storms occurring during those seasons tend to be stronger with a greater potential to be deadly.
Table 4.6
Virginia Tornados by Month: 1950‐2007
Intensity Jan Feb Mar Apr May Jun Jul Aug Sep Oct Nov Dec
F/EF0‐F/EF1 10 13 16 37 58 47 80 65 73 20 14 2
F/EF2‐F/EF4 3 0 3 13 13 12 8 13 25 11 5 0
Total 13 13 19 49 71 59 88 78 97 31 19 2
% weak 77 100 84 73 82 80 91 83 74 65 74 100
% Strong 23 0 16 27 18 20 9 17 26 35 26 0
Source: http://www.vaemergency.com/newsroom/history/tornado.cfm

H A Z A R D I D E N T I F I C A T I O N
Rappahannock-Rapidan Regional Hazard Mitigation Plan 2012 Section 4: Page 12
Figure 4.5 (below) summarizes the frequency and strength of extreme windstorms across the United States. Produced by the Federal Emergency Management Agency, the map represents 40 years of tornado history and over 100 years of hurricane history.
Source: Federal Emergency Management Agency

H A Z A R D I D E N T I F I C A T I O N
Rappahannock-Rapidan Regional Hazard Mitigation Plan 2012 Section 4: Page 13
Figure 4.6
Virginia Tornado Counts 1950‐2004
Source: http://www.vaemergency.com/newsroom/history/stats/tornado/tornado_counts2004.pdf
WILDFIRE A wildfire is any unwanted or unplanned fire burning in forests or wildland areas that threatens to destroy life, property or natural resources. Each year, about 1,600 wildfires consume a total of 8,000‐10,000 acres of forest and grassland in Virginia. During the fall drought of 2001, Virginia lost more than 13,000 acres to wildfires. Records indicate that most of Virginia's wildfires are caused by people. As Virginia's population continues to grow, so does the use of forests for recreation and residential development, thereby increasing the risk of wildfires. The wildland/urban interface, defined

H A Z A R D I D E N T I F I C A T I O N
Rappahannock-Rapidan Regional Hazard Mitigation Plan 2012 Section 4: Page 14
as the line, area or zone where structures and other human development meet or interface with undeveloped wildland or vegetative fuels, is an area of particular concern. Over the past 15 years the number of woodland home developments in Virginia has increased from 524 to 2,914 and the number of dwellings in those developments has gone from 18,203 to 138,111. Effective management of this increasingly fragile zone is essential to the conservation of forest resources and the preservation of the built environment. Three percent of forest fires in Virginia are the result of lightning strikes; ninety‐seven percent are caused by humans. Although possible anytime, wildfires in Virginia occur most often in Spring and Fall when the relative humidity tends to be lower, winds tend to be higher and fuels are cured to the point where they readily ignite. In hardwood stands, trees are bare, allowing sunlight to dry and warm the leaves on the forest floor. Fire activity fluctuates each month and varies from year to year. Adequate precipitation reduces fire potential; however, extended periods of warm, dry, windy weather increases fire occurrence. Drought conditions contribute to fire probability and may limit efforts to suppress wildfires in instances where decreased water supplies are inadequate to quickly contain the fire. The potential for wildfires exists throughout the Rappahannock‐Rapidan region; however, areas at greatest risk include those that are heavily forested or at the interface between forests and other land uses. Land management measures including the development of fire roads, storage of water for emergency use, safety buffers, firebreaks, and fuel management can be developed as part of an overall fire defense system to aid in fire control. Education of those who use forested areas for recreation or build in wild land areas is of primary importance in reducing wildfires.
FIGURE 4.7
Culpeper County Wild‐land/Urban Interface & Wildfire Risk Assessment

H A Z A R D I D E N T I F I C A T I O N
Rappahannock-Rapidan Regional Hazard Mitigation Plan 2012 Section 4: Page 15
Drought 2002 – Rapidan River intake pump for Town Of Orange: Photo: The Orange County Review.
DROUGHT/EXTREME HEAT Drought results from an extended period of limited precipitation affecting a fairly broad geographic area. High temperatures, high winds, and low humidity can exacerbate conditions, increasing the likelihood of wildfire. Human demands and actions can accelerate and intensify drought‐related impacts. Droughts are classified as one of following:
Meteorological,
Agricultural,
Hydrological, and
Socio‐economic.
Meteorological droughts are typically defined in terms of precipitation deficits compared to average, or normal, amounts of precipitation over a given period. Crop and livestock needs, and soil water deficits are primary factors in determining agricultural droughts, while hydrological drought is directly related to the effect of precipitation shortfalls on surface water and groundwater supplies. Socio‐economic drought results from precipitation shortages that limit the ability to supply water‐dependent products to the marketplace.
Weekly updated drought monitor maps may be viewed online at the National Drought Mitigation Center: http://drought.unl.edu/dm
FIGURE 4.8

H A Z A R D I D E N T I F I C A T I O N
Rappahannock-Rapidan Regional Hazard Mitigation Plan 2012 Section 4: Page 16
TABLE 4.7
Drought Severity Classification
Category
Description
Possible Impacts
D0
Abnormally Dry
Going into drought: short‐term dryness slowing planting, growth of crops or pastures; fire risk above average. Coming out of drought: some lingering water deficits; pastures or crops not fully recovered.
D1
Moderate Drought
Some damage to crops, pastures; fire risk high; streams, reservoirs, or wells low, some water shortages developing or imminent, voluntary water use restrictions requested.
D2
Severe Drought
Crop or pasture losses likely; fire risk very high; water shortages common; water restrictions imposed
D3
Extreme Drought
Major crop/pasture losses; extreme fire danger; widespread water shortages or restrictions
EXTREME HEAT An extreme heat event is characterized by a prolonged period of temperatures 10 degrees or more above the average high temperature accompanied by high humidity. Under normal conditions, perspiration produced in response to elevated temperatures evaporates, cooling the body. High humidity, however, slows the evaporation process, resulting in discomfort and a greater challenge to the body to maintain normal temperatures. Elderly persons, young children, persons with respiratory difficulties, and those who are sick or overweight are more likely to become victims of extreme heat. Studies indicate that a significant rise in heat‐related illness occurs when excessive heat persists for more than two days.
Extreme heat in urban areas can create health concerns when stagnant atmospheric conditions trap pollutants, resulting in overall poor air quality. In addition, the urban heat island effect can produce significantly higher nighttime temperatures than those in surrounding suburbs. Exposure to two hours of air conditioning per day can significantly reduce the probability of heat‐related illnesses

H A Z A R D I D E N T I F I C A T I O N
Rappahannock-Rapidan Regional Hazard Mitigation Plan 2012 Section 4: Page 17
Table 4.8
Table 4.9
Annual U.S.
Extreme Heat Summary
YEAR
2000
2001
2002 2003 2004 2005 2006 2007
2008
2009
Fatalities
158
166
167 36 6 158 253 105
71
45
Injuries
469
445
378 174 74 298 1,513 1,886
217
204
Source: http://www.economics.noaa.gov/?goal=weather&file=events/temp
HAIL Hailstorms are usually associated with severe thunderstorms. High velocity updrafts within the storm carry ice crystals upward to regions of colder air where moisture precipitates on the crystal and freezes. The added weight causes the crystal to fall. If updrafts are strong enough, the crystal will make several trips up into higher, colder regions, adding a layer of ice each time. Once the weight of the pellet overcomes the force of the updraft, it falls to the ground as part of a hailstorm. Hail size directly reflects the severity of the storm.

H A Z A R D I D E N T I F I C A T I O N
Rappahannock-Rapidan Regional Hazard Mitigation Plan 2012 Section 4: Page 18
Hail dents cars, shatters windows and green houses, damages roofs and damages or destroys crops. Farm animals may be injured. Every year areas of Virginia are impacted by severe thunderstorms producing large hail measuring 0.75‐inch (penny size) or larger. Rarely, however, does the hail reach tennis ball size (2.5 inches) or larger. This large hail occurs once or twice per year on average
Figure 4.9 Annual Frequency of Hailstorms in the United States
Large hail collects on streets and grass during a severe thunderstorm. Larger stones appear to be nearly two to three inches in diameter. (NOAA Photo Library, NOAA Central Library; OAR/ERL/National Severe Storms Laboratory)

H A Z A R D I D E N T I F I C A T I O N
Rappahannock-Rapidan Regional Hazard Mitigation Plan 2012 Section 4: Page 19
WINTER STORMS AND FREEZES Winter storms are variable in their extent and duration. They can range from moderate, short‐lived snowfalls to full‐blown blizzards with blinding, wind‐driven snow lasting several days. Some winter storms may be large enough to impact several states, while others may affect only a single community. Winter storms may include a full range of precipitation, from snow, sleet, and freezing rain to a mix of all three. Sleet hits the ground as a frozen solid, accumulating like snow and causing slippery conditions for pedestrians and motorists. Freezing rain, as the term suggests, falls as a liquid and freezes on contact, creating glazed surfaces and extreme hazards for all modes of mobility. Requiring surface temperatures below 32°F, freezing rain often results in multiple impacts. Even a limited accumulation can add significant weight to power lines and tree limbs, causing them to snap and break, disrupting communications and power, blocking roads and damaging structures. A freeze is characterized by a minimum of several hours of temperatures around 30°F, or lower. Under these conditions, impacts to agriculture are significant, since all but the hardiest herbaceous plants will be affected.
EROSION
Erosion is the transport by water, wind, ice and gravity of weathered materials on Earth's surface. The chemical and/or physical breakdown of rock produces loose particles which may continue to weather in place or be moved to the point at which the weight of the particle overcomes the energy of transport and the particle is deposited. Moving water is the primary agent of transport. Wind energy is second. An increase in velocity of the agent of transport generally increases the size of the particle moved and distance over which it is transported. For example, heavy rainfall adds runoff to a stream. This results in an increase in stream velocity and the amount and particle size of sediment transported. Channel scouring and stream bank destabilization may follow.
Erosion potential is generally determined by a number of factors including surface composition, vegetative cover, topography, weather and climate. Loose, unconsolidated materials on steep slopes with no vegetative cover are far more likely to erode than compacted particles on vegetated plains.
Back-to-back snowstorms of historic proportions plagued the Rappahannock-Rapidan region in winter, 2010. Photo by Vincent Vala, Culpeper Star-Exponent.

H A Z A R D I D E N T I F I C A T I O N
Rappahannock-Rapidan Regional Hazard Mitigation Plan 2012 Section 4: Page 20
Vegetation plays a key role in controlling erosion. It intercepts the force of falling rain, absorbs runoff, slows the velocity of sheet flow and wind and holds soil particles in place. As might be expected, the topography of an area also influences its susceptibility to erosion. The greater the gradient and slope length, the more prone areas are to erosion. Frequency, intensity and duration of rainfall also influence erosion potential.
Sound land management practices in construction and agriculture minimize the impacts of erosion including soil loss, stream degradation, landscape alteration, and landslides. As the importance of effective erosion control has gained increased attention, so have recognition of the need for regulatory programs and the development of erosion control products, practices and site development methodologies. Preservation and/or restoration of natural vegetation and the implementation of erosion and sediment control regulations are recognized as fundamental to managing erosion.
DAM FAILURE With growing awareness of problems associated with aging infrastructure and recognition of populations in downstream areas, the concern for dam safety is increasing. As knowledge of hydrology has increased, so has the interest in improved techniques in dam construction, maintenance and general operation. Currently, there are about 80,000 dams in the United States. Most are privately owned. Other owners include federal, state and local authorities or agencies and public utilities. Dams help manage water for drinking, agriculture and navigation. They impound water to create lakes for recreation, to generate hydroelectric power and to manage floodwaters. Despite their many benefits, if not designed, constructed and maintained properly, dams may pose a significant risk to downstream communities. Failure of even small structures can result in loss of life and significant property damage. The Virginia Department of Conservation and Recreation's Division of Dam Safety has recently (Dec. 2010) updated its safety regulations and is in the process of evaluating the many dams constructed with or without proper permits throughout the Commonwealth. Of particular concern are the many aging impoundments that have not been properly maintained and lie upstream of developed properties.
Dam failure can result from natural events, human-induced events, or a combination of the two. Failures due to natural events such as hurricanes, earthquakes or landslides are significant because there is generally little or no advance warning.

H A Z A R D I D E N T I F I C A T I O N
Rappahannock-Rapidan Regional Hazard Mitigation Plan 2012 Section 4: Page 21
EARTHQUAKES
An earthquake is the movement of Earth's surface in response to radiated seismic energy resulting from volcanic or magmatic activity, slippage or buckling along tectonic plates or other sudden adjustments of subsurface stresses. Earthquake hazards include ground shaking, landslides, faulting, ground liquefaction, tectonic deformation and tsunamis. Earthquakes can result in widespread, extensive damage to the built environment, severe injury and loss of life, and the disruption of the social and economic fabric of the affected area.
Most property damage, injuries and deaths result from structural failure and collapse. The amount and type of damage relates directly to the amplitude and duration of motion which vary according to the size of the quake, its depth, location and regional geology.
Earth's areas of greatest instability occur along the perimeters of its tectonic plates. The North American plate is bounded on the east by the mid‐
Atlantic ridge, located, as the name suggests, in the middle of the Atlantic Ocean between North America and Europe. The western edge of the North American plate abuts the eastern edge of the Pacific plate and marks the west coast of North America. As might be expected, the Pacific coastal area of the United States is far more likely to experience earthquakes than the eastern coastal region of the United States. It should be noted, however, that regions with historically limited seismic activity should not dismiss the possibility of future events. Earthquake prediction is not yet possible and even small quakes can have significant secondary effects.
Earthquakes are measured in terms of their magnitude and intensity. Magnitude is expressed by reference to the Richter Scale, an open‐ended logarithmic scale that describes the energy released through a measure of shock wave amplitude (see Table 4.10). Each unit increase in magnitude on the scale corresponds to a ten‐fold increase in wave amplitude, or a 32‐fold increase in energy. Intensity is most commonly measured using the Modified Mercalli Intensity (MMI) Scale which is based on direct and indirect measurements of seismic effects. A detailed description of the Modified Mercalli Intensity Scale of earthquake intensity and its correspondence to the Richter Scale is given in Table 4.11.
The historic Ritz Hi-Hat building in downtown Culpeper, Virginia was destroyed by the August 23, 2011 earthquake. The picture above shows the demolition and removal phase one week after the earthquake. (Source: Rappahannock-Rapidan Regional Commission)

H A Z A R D I D E N T I F I C A T I O N
Rappahannock-Rapidan Regional Hazard Mitigation Plan 2012 Section 4: Page 22
Table 4.10 Richter Scale
Richter Magnitudes Earthquake Effects
Less than 3.5 Generally not felt, but recorded.
3.5‐5.4 Often felt, but rarely causes damage.
Under 6.0 At most slight damage to well‐designed buildings. Can cause majordamage to poorly constructed buildings over small regions.
6.1‐6.9 Can be destructive in areas up to about 100 kilometers across where people live.
7.0‐7.9 Major earthquake. Can cause serious damage over larger areas.
8 or greater Great earthquake. Can cause serious damage in areas several hundred kilometers across.
Table 4.11
Modified Mercalli Intensity Scale for Earthquakes
Scale Intensity Description of Effects Corresponding Richter Scale Magnitude
I Instrumental Detected only on seismographs
II Feeble Some people feel it <4.2
III Slight Felt by people resting; like a truck rumbling by
IV Moderate Felt by people walking
V Slightly Strong Sleepers awake; church bells ring <4.8
VI Strong Trees sway; suspended objects swing, objects fall off shelves
<5.4
VII Very Strong Mild Alarm; walls crack; plaster falls <6.1
VIII Destructive Moving cars uncontrollable; masonry fractures, poorly constructed buildings damaged
IX Ruinous Some houses collapse; ground cracks; pipes break open
<6.9
X Disastrous Ground cracks profusely; many buildings destroyed; liquefaction and landslides widespread
<7.3
XI Very Disastrous Most buildings and bridges collapse; roads, railways, pipes and cables destroyed; general triggering of other hazards
<8.1
XII Catastrophic Total destruction; trees fall; ground rises and falls in waves
>8.1
Source: North Carolina Division of Emergency Management

H A Z A R D I D E N T I F I C A T I O N
Rappahannock-Rapidan Regional Hazard Mitigation Plan 2012 Section 4: Page 23
The probability that ground motion will reach a certain level during an earthquake is indicated below (Figure 4.10). The data show peak horizontal ground acceleration (the fastest measured change in speed, for a particle at ground level that is moving horizontally due to an earthquake) with a 10 percent probability of exceedance in 50 years.
Figure 4.10 Virginia – Seismic Hazard Probability
Source: United States Geological Survey

H A Z A R D I D E N T I F I C A T I O N
Rappahannock-Rapidan Regional Hazard Mitigation Plan 2012 Section 4: Page 24
Figure 4.11
Depth is in kilometers. Purple Triangles: Cities Purple Star: Capital City Circles: Earthquakes (color represents depth range)
SINKHOLES Sinkholes are common in areas characterized by soluble bedrock including limestone or other carbonates, salt beds, or any rock that can be dissolved naturally by circulating ground water. As rock dissolves, spaces and caverns develop underground. When the weight of the overlying land mass exceeds subsurface support, a sudden collapse may occur. The degree of susceptibility varies with the extent and character of the soluble rock, its location with regard to the water table and local climate conditions.
Sinkholes vary in size. Under natural conditions, sinkholes form slowly and expand gradually. However, human activities such as dredging, construction of impoundments, diversion of surface water, and groundwater removal can accelerate the rate of sinkhole development, resulting in an abrupt collapse.

H A Z A R D I D E N T I F I C A T I O N
Rappahannock-Rapidan Regional Hazard Mitigation Plan 2012 Section 4: Page 25
Although a sinkhole can form without warning, specific signs can signal potential development:
Slumping or falling fence posts, trees, or foundations;
Sudden formation of small ponds;
Wilting vegetation,
Discoloration of well water; and/or
Structural cracks in walls, floors. Sinkhole formation is aggravated and accelerated by urbanization. Development increases water usage, alters natural drainage, overloads surface weight and redistributes surface materials. According to the Federal Emergency Management Agency (FEMA), insurance claims for damage resulting from sinkhole formation have increased 1,200 percent from 1987 to 1991, costing nearly $100 million. Figure 4.12
LANDSLIDES
A landslide is the mass movement of earth material down a slope. The process is driven by gravity and may occur instantaneously with a sudden rush of rock and debris or imperceptibly as very slow movement over time. Landslides may be triggered by natural events such as heavy rainfall, rapid snow melt, stream incision, earthquakes and volcanic eruptions. Certain man‐made changes to the land, such
Driver Trapped in Sinkhole Near Lynchburg,VA (Leonard Harville / January 25, 2010)

H A Z A R D I D E N T I F I C A T I O N
Rappahannock-Rapidan Regional Hazard Mitigation Plan 2012 Section 4: Page 26
as slope modification or drainage alteration, can greatly increase the likelihood of landslides. Landslides are a major geologic hazard. They are widespread, occurring in all 50 states and U.S. territories. Expansion of urban and recreational development into hillside areas results in increased threat of landslides each year. Landslides may wrecking buildings, rupture gas, water, and sewer mains, disrupt power and communication lines and block transportation routes. Soil creep, slope slump, rock slides and debris flows cause property damage, injuries and death. In the United States, landslides cause up to $2 billion in damages annually and result in twenty‐five to fifty fatalities. Areas prone to landslide hazards include those with historic susceptibility, bases of steep slopes, bases of drainage channels and developed hillsides where gravity flow septic systems are installed.
Aerial view of debris flow chutes and flood deposits from the June 27, 1995 flood at Kinsey Run, near Graves Mill in Madison County, Virginia. Photo from The debris Flows of Madison County, Virginia: 34th Annual Virginia Geological Field Conference Guidebook.

H A Z A R D I D E N T I F I C A T I O N
Rappahannock-Rapidan Regional Hazard Mitigation Plan 2012 Section 4: Page 27
Counties in Virginia that are susceptible to landslides. Red = high potential; orange = moderate potential; yellow = moderate to low potential; green = low potential.
Figure 4.13
Landslide Overview Map of the Conterminous United States
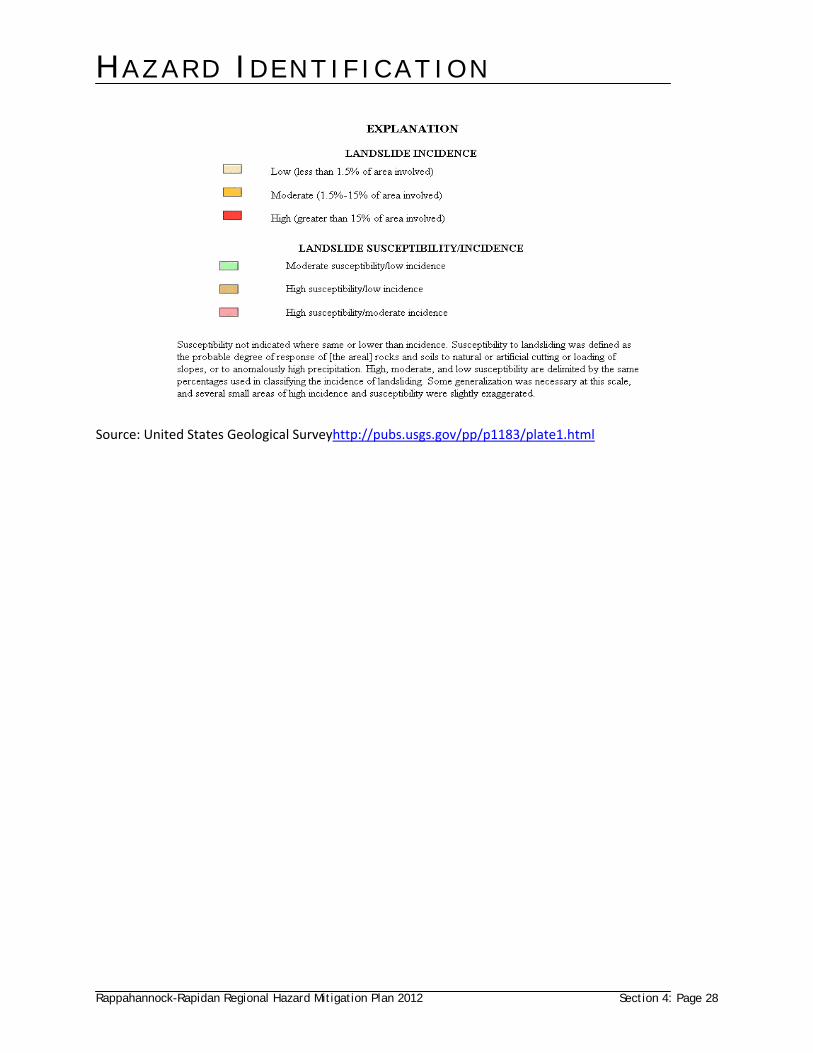
H A Z A R D I D E N T I F I C A T I O N
Rappahannock-Rapidan Regional Hazard Mitigation Plan 2012 Section 4: Page 28
Source: United States Geological Surveyhttp://pubs.usgs.gov/pp/p1183/plate1.html

H A Z A R D I D E N T I F I C A T I O N
Rappahannock-Rapidan Regional Hazard Mitigation Plan 2012 Section 4: Page 29
DATA SOURCES American Society of Civil Engineers (ASCE), “Facts About Windstorms.”
Web site: www.windhazards.org/facts.cfm
Bureau of Reclamation, U.S. Department of the Interior
Web site: www.usbr.gov
Federal Emergency Management Agency (FEMA)
Web site: www.fema.gov National Climatic Data Center (NCDC), U.S. Department of Commerce, National Oceanic and Atmospheric Administration Web site: http://lwf.ncdc.noaa.gov/oa/ncdc.html National Drought Mitigation Center, University of Nebraska‐Lincoln Web site: www.drought.unl.edu/index.htm National Severe Storms Laboratory (NSSL), U.S. Department of Commerce, National Oceanic and Atmospheric Administration Web site: www.nssl.noaa.gov National Weather Service (NWS), U.S. Department of Commerce, National Oceanic and Atmospheric Administration Web site: www.nws.noaa.gov Storm Prediction Center (SPC), U.S. Department of Commerce, National Oceanic and Atmospheric Administration, National Weather Service Web site: www.spc.noaa.gov The Tornado Project, St. Johnsbury, Vermont Web site: www.tornadoproject.com United States Geological Survey (USGS), U.S. Department of the Interior Web site: www.usgs.gov

HAZARD ANALYS I S
44 CFR Part 201.6(c) (2) (i): The risk assessment shall include a description of the type, location and extent of all natural hazards that can affect the jurisdiction. The plan shall include information on previous occurrences of hazard events and on the probability of future hazard events. The Hazard Analysis provides information on historical hazard occurrences in Rappahannock‐Rapidan Region for the natural and man‐caused hazards listed below. This includes an assessment of the location and spatial extent of the event as well as best available data regarding the impact on the region. Natural Hazards
Flood
Hurricanes, Tropical Storms and Nor’easters
Severe Thunderstorms and Tornadoes
Wildfire
Drought/Extreme Heat
Winter Storms and Freezes
Erosion
Earthquakes
Sinkholes
Landslides
Dam/Levee Failure
Historical records were used to identify the level of risk within the planning area. This section includes series of maps that illustrate the location and spatial extent of those hazards within the Rappahannock‐Rapidan Region that have a recognizable geographic significance, such as 100 year floodplains. For those hazards not confined to a particular geographic area, such as thunderstorms and tornadoes, general information on the applicable intensity of these events across the entire planning area is provided.
FLOOD The most common hazard identified in the Rappahannock‐Rapidan region is flooding. Three major rivers, the York, the Rappahannock and the Potomac, all of which have tributaries of significant size, drain the region to the Chesapeake Bay. Runoff from creeks and streams high in the Blue Ridge contribute to the downstream flow, often resulting in flash floods during periods of heavy rain and/or rapid snow melt. Figure 5.1 illustrates the flood hazard areas for the entire region.1 Table 5.1 lists flood events as reported by the National Climatic Data Center (NCDC) that have occurred in the Rappahannock‐Rapidan region from 1/1/1995 until 11/30/2010. Because of the large number of events, details of only a few have been included.2 Historical evidence clearly illustrates the likelihood of flooding in the region. Floods referenced below resulted in a total of 22 deaths, no reported injuries, approximately $95.179M in reported property damages and approximately $40.215M in crop damage claims.
1 The Community Profile section (Section 3 of this Plan) provides additional detail with regard to the region’s geographic position within Virginia and other general geographic characteristics. 2 Details for events recorded in the National Climatic Data Center’s database can be obtained by visiting http://www.ncdc.noaa.gov/oa/ncdc.html.

Flood Hazard AreasRappahannock-Rapidan Regional Hazard Mitigation PlanFlood Zone Data Source: FEMA, Localities
Flood Zones100 Year Flood Zone (No Base Elevation)100 Year Flood Zone (Base Elevation)500 Year Flood ZoneStreams & Bodies of Water
0 5 10 15 20Miles
Map created for Rappahannock-Rapidan Regional Hazard MitigationPlan Update and is intended for general planning purposes only. Datais from various sources and may vary in accuracy and completeness.Date: 5/10/2011 File: Flood_Zones_Region.mxd
Figure 5.1

H A Z A R D A N A L Y S I S
Rappahannock-Rapidan Regional Hazard Mitigation Plan 2012 Section 5: Page 2
Figures 5.2 through 5.11 illustrate in greater detail the flood hazard areas within each county and town, as applicable. It should be noted that the towns of Madison and Orange do not have any floodplains within their corporate boundaries.
Table 5.1
Flood Events: Rappahannock‐Rapidan Region
(01/01/1995 – 11/30/2010)
Location Number of Flood Events
Deaths InjuriesProperty Damage*
Crop Damage*
Culpeper County 40 4 0 $20.4 M $644K
Fauquier County 46 4 0 $20.3M $136K
Madison County 39 5 0 $19.8M $36.831M
Orange County 32 4 0 $18.474M $2.131M
Rappahannock County 29 5 0 $16.209M $474K
REGIONAL TOTALS: 186** 22 0 $95.179M $40.215M
Source: National Climatic Data Center * Approximate numbers based on NCDC records. ** Many of the same events impacted more than one county
Significant Events3:
June 27, 1995 – Graves Mill, Madison County On June 27, 1995, as much as 30 inches of rain fell in a 16‐hour period on the steep slopes of Madison County, triggering hundreds of landslides and producing widespread flooding. Structures were inundated or crushed by flowing debris, pastures and crop‐fields were obliterated and livestock perished. One fatality occurred near Crigglersville. Seven others lost their lives in different parts of the state as a result of this storm. Culpeper, Madison, Orange and Rappahannock counties were declared a major disaster area (FEMA). January 19, 1996 – Entire region Within twelve hours, rising temperatures melted the 20 – 30 inch snow cover. Snowmelt, along with 2 to nearly 5 inches of rain produced extensive regional flooding, the worst in over a decade. The event began with flash floods in the headwaters of all basins. River flooding progressed downstream through January 22nd. Crests ranged from 3 to 21 feet above flood stage. High water caused millions of dollars in damage, closed roads, destroyed homes and businesses, and forced the evacuation of several towns. Although low‐water bridges were closed, a driver of a vehicle with 3 passengers dared the high waters of the Hazel River. All four perished as the automobile was swept downstream.
September 6, 1996 – Entire region Along with significant wind damage, flooding resulted from heavy rains associated with Hurricane Fran. A major disaster was declared. September 18, 2003 – Entire region The combined effects of Hurricane Isabel's high winds and heavy rains and associated flooding, resulted in the declaration of a major disaster for the region and the Commonwealth.
3 Details from events slightly modified from National Climatic Data Center’s storm database.

Flood Hazard Areas: Culpeper CountyRappahannock-Rapidan Regional Hazard Mitigation PlanFlood Zone Data Source: FEMA, LocalitiesFlood Zones
100 Year Flood Zone (No Base Elevation)100 Year Flood Zone (Base Elevation)Streams & Bodies of Water
0 5 10 15 20Miles
Map created for Rappahannock-RapidanRegional Hazard Mitigation Plan Updateand is intended for general planningpurposes only. Data is from varioussources and may vary in accuracy andcompleteness.Date: 5/10/2011 File: Flood_Zones_Culpeper_County.mxd
Figure 5.2
HAZEL RIVER
RAPIDAN RIVER
RAPPAHANNOCK RIVER

Flood Hazard Areas: Town of CulpeperRappahannock-Rapidan Regional Hazard Mitigation Plan
Flood Zone Data Source: FEMA, Localities
Flood Zones100 Year Flood Zone (No Base Elevation)100 Year Flood Zone (Base Elevation)Parcels
0 0.5 1 1.5 2Miles
Map created for Rappahannock-RapidanRegional Hazard Mitigation Plan Updateand is intended for general planningpurposes only. Data is from varioussources and may vary in accuracy andcompleteness.Date: 5/10/2011 File: Flood_Zones_Culpeper_Town.mxd
Figure 5.3

Flood Hazard Areas: Fauquier CountyRappahannock-Rapidan Regional Hazard Mitigation Plan
Flood Zone Data Source: USGS, Localities
Flood Zones100 Year Flood Zone (No Base Elevation)100 Year Flood Zone (Base Elevation)500 Year Flood ZoneStreams & Bodies of Water
0 2.5 5 7.5 10Miles
Map created for Rappahannock-Rapidan Regional Hazard MitigationPlan Update and is intended for general planning purposes only. Datais from various sources and may vary in accuracy and completeness.Date: 5/10/2011 File: Flood_Zones_Fauquier.mxd
Figure 5.4
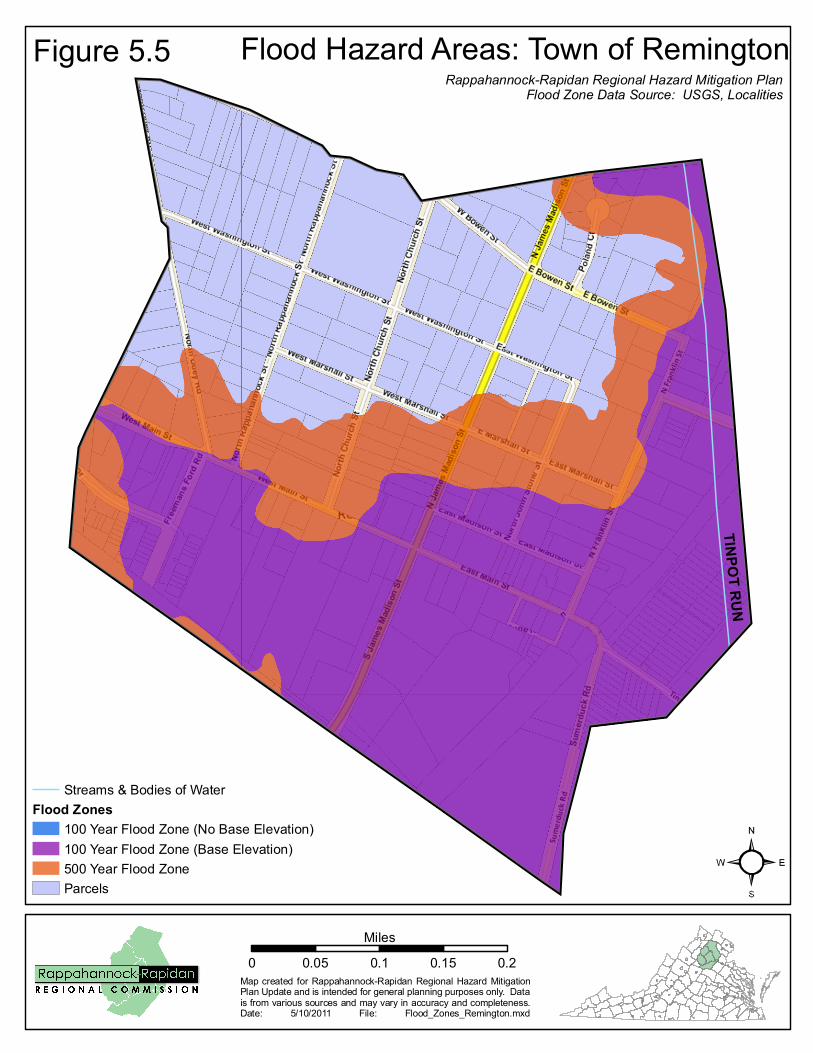
Flood Hazard Areas: Town of RemingtonRappahannock-Rapidan Regional Hazard Mitigation Plan
Flood Zone Data Source: USGS, Localities
Streams & Bodies of WaterFlood Zones
100 Year Flood Zone (No Base Elevation)100 Year Flood Zone (Base Elevation)500 Year Flood ZoneParcels
0 0.05 0.1 0.15 0.2Miles
Map created for Rappahannock-Rapidan Regional Hazard MitigationPlan Update and is intended for general planning purposes only. Datais from various sources and may vary in accuracy and completeness.Date: 5/10/2011 File: Flood_Zones_Remington.mxd
Figure 5.5TINPOT RUN

Flood Hazard Areas: Town of The PlainsRappahannock-Rapidan Regional Hazard Mitigation Plan
Flood Zone Data Source: USGS, Localities
Streams & Bodies of Water100 Year Flood Zone (No Base Elevation)Parcels
0 0.1 0.2 0.3Miles
Map created for Rappahannock-Rapidan Regional Hazard MitigationPlan Update and is intended for general planning purposes only. Datais from various sources and may vary in accuracy and completeness.Date: 6/1/2011 File: Flood_Zones_ThePlains.mxd
Figure 5.6
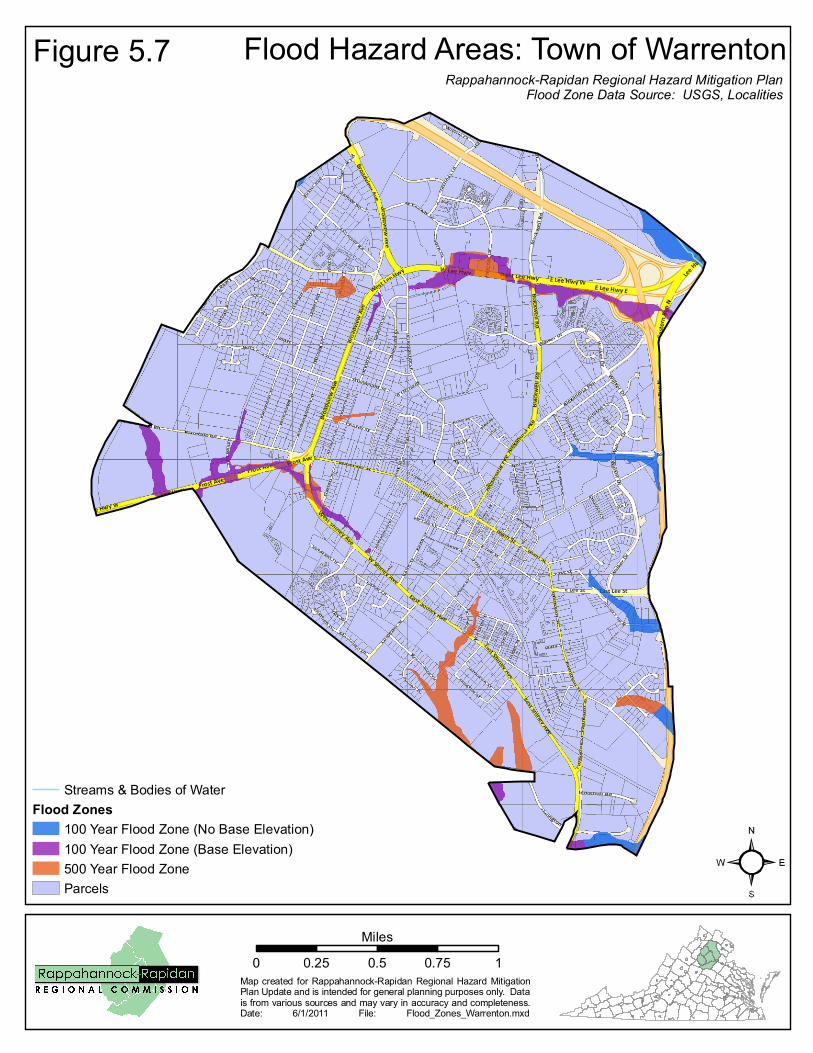
Flood Hazard Areas: Town of WarrentonRappahannock-Rapidan Regional Hazard Mitigation Plan
Flood Zone Data Source: USGS, Localities
Streams & Bodies of WaterFlood Zones
100 Year Flood Zone (No Base Elevation)100 Year Flood Zone (Base Elevation)500 Year Flood ZoneParcels
0 0.25 0.5 0.75 1Miles
Map created for Rappahannock-Rapidan Regional Hazard MitigationPlan Update and is intended for general planning purposes only. Datais from various sources and may vary in accuracy and completeness.Date: 6/1/2011 File: Flood_Zones_Warrenton.mxd
Figure 5.7

Flood Hazard Areas: Madison CountyRappahannock-Rapidan Regional Hazard Mitigation Plan
Flood Zone Data Source: FEMA, LocalitiesFlood Zones
100 Year Flood Zone (No Base Elevation)100 Year Flood Zone (Base Elevation)Streams & Bodies of Water
0 2.5 5 7.5 10Miles
Map created for Rappahannock-RapidanRegional Hazard Mitigation Plan Updateand is intended for general planningpurposes only. Data is from varioussources and may vary in accuracy andcompleteness.Date: 5/16/2011 File: Flood_Zones_Madison_County.mxd
Figure 5.8
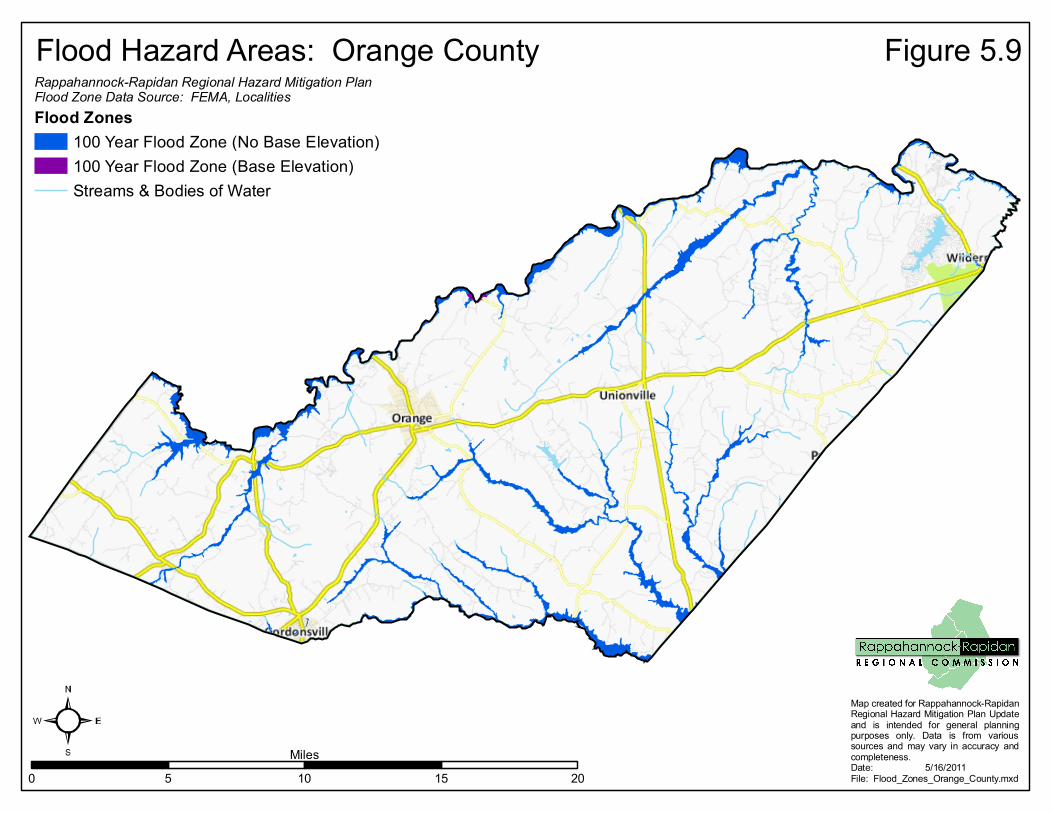
Flood Hazard Areas: Orange CountyRappahannock-Rapidan Regional Hazard Mitigation PlanFlood Zone Data Source: FEMA, LocalitiesFlood Zones
100 Year Flood Zone (No Base Elevation)100 Year Flood Zone (Base Elevation)Streams & Bodies of Water
0 5 10 15 20Miles
Map created for Rappahannock-RapidanRegional Hazard Mitigation Plan Updateand is intended for general planningpurposes only. Data is from varioussources and may vary in accuracy andcompleteness.Date: 5/16/2011 File: Flood_Zones_Orange_County.mxd
Figure 5.9

Flood Hazard Areas: Rappahannock CountyRappahannock-Rapidan Regional Hazard Mitigation PlanFlood Zone Data Source: FEMA, LocalitiesFlood Zones
100 Year Flood Zone (No Base Elevation)100 Year Flood Zone (Base Elevation)Streams & Bodies of Water
0 2.5 5 7.5 10Miles
Map created for Rappahannock-RapidanRegional Hazard Mitigation Plan Updateand is intended for general planningpurposes only. Data is from varioussources and may vary in accuracy andcompleteness.Date: 5/16/2011 File: Flood_Zones_Rappahannock_County.mxd
Figure 5.10

Flood Hazard Areas: Town of WashingtonRappahannock-Rapidan Regional Hazard Mitigation PlanFlood Zone Data Source: FEMA, LocalitiesFlood Zones
100 Year Flood Zone (No Base Elevation)100 Year Flood Zone (Base Elevation)Streams & Bodies of WaterParcels
0 0.1 0.2Miles
Map created for Rappahannock-RapidanRegional Hazard Mitigation Plan Updateand is intended for general planningpurposes only. Data is from varioussources and may vary in accuracy andcompleteness.Date: 5/16/2011 File: Flood_Zones_Washington_Town.mxd
Figure 5.11

H A Z A R D A N A L Y S I S
Rappahannock-Rapidan Regional Hazard Mitigation Plan 2012 Section 5: Page 3
June 2006 Rappahannock County was included with a number of other counties contiguous with the Rappahannock‐Rapidan region in the declaration of a major disaster due to severe storms, tornadoes and flooding.
HURRICANES, TROPICAL STORMS AND NOR’EASTERS HURRICANES AND TROPICAL STORMS Historically, very few hurricanes have tracked directly through the Rappahannock‐Rapidan region. Since 1851, only four hurricanes – three unnamed and Hurricane Hazel in 1954, three tropical storms and four tropical depressions have passed directly through the region (Figure 5.12 – Historic Hurricane Tracks). Additionally, because the region is not located in a coastal zone, most of these hurricanes and tropical storms were weaker than at their peak strength when they passed through the Rappahannock‐Rapidan region (Table 5.2).
Table 5.2
Significant Tropical Cyclones: Rappahannock‐Rapidan Region (1851 – 2010)
Name of Storm
Category (in region) Date
Unnamed Tropical Storm Tropical Storm October 1885
Unnamed Hurricane Tropical Storm August 1893
Unnamed Hurricane H1 September 1893
Unnamed Tropical Storm Tropical Storm October 1905
Unnamed Hurricane Tropical Storm August 1915
Unnamed Hurricane Extratropical Storm June 1934
Hurricane Able Tropical Storm August 1952
Hurricane Hazel Extratropical Storm October 1954
Hurricane Diane Tropical Storm August 1955
Tropical Storm Bret Tropical Depression June 1981
Tropical Storm Chris Tropical Depression August 1988
Source: National Hurricane Center Note: Category indicates strength of storm in Rappahannock‐Rapidan region, rather than highest strength of storm.
NOR'EASTERS The most powerful storms to impact the Rappahannock‐Rapidan region in winter are nor'easters. Unlike hurricanes, which usually move through the region in a 24‐hour period, nor'easters may linger for several days delivering singly, or in combination, high winds, driving rain, heavy snow, sleet and ice. Structural damage, massive power outages and widespread travel problems are common products of such storms. Among the more memorable storms to impact the Rappahannock‐Rapidan region are the following. March 9, 1999: An area of low pressure moved from the Ohio Valley eastward, dropping heavy snow across the Appalachians. In the Rappahannock‐Rapidan region light snow began around daybreak and intensified by mid‐day. A localized band of heavy snow developed that stretched from the Eastern Panhandle of West Virginia, across Winchester, Middleburg and into Fairfax. In the heaviest band, snow fell at a rate of 2 inches an hour, making road clearing

!!
!!
!!
!!
!!
!!
!!
!!
!!
!!
!!
!!
!!
!!
!!
!!
!!
!!
!!
!!
!!
!!
!!
!!
!!
!!
!!
!!
!!
!!
!!
!!
!!
!!
!!
!!
!!
!!
!!
!!
!!
!!
!!
!!
!!
!!
!!
!!
!!
!!
!!
!!
!!
!!
!!
!!
!!
!!
!!
!!
!!
!!
!!
!!
!!
!!
!!
!!
!!
!!
!!
!!
!!
!!
!!
!!
!!
!!
!!
!!
!!
!!
!!
!!
!!
!!
!!
!!
!!
!!
!!
!!
!!
!!
!!
!!
!!
!!
!!
!!
!!
!!
!!
!!
!!
!!
!!
!!
!!
!!
!!
!!
!!
!!
!!
!!
!!
!!
!!
!!
!!
!!
!!
!!
!!
!!
!!
!!
!!
!!
!!
!!
!!
!!
!!
!!
!!
!!
!!
!!
!!
!!
!!
!!
!!
!!
!!
!!
!!
!!
!!
!!
!!
!!
!!
!!
!!
!!
!!
!!
!!
!!
!!
!!
!!
!!
!!
!!
!!
!!
!!
!!
!!
!!
!!
!!
!!
!!
!!
!!
!!
!!
!!
!!
!!
!!
!!
!!
!!
!!
!!
!!
!!
!!
!!
!!
!!
!!
!!
!!
!!
!!
!!
!!
!!
!!
!!
!!
!!
!!
!!
!!
!!
!!
!!
!!
!!
!!
!!
!!
!!
!!
!!
!!
!!
!!
!!
!!
!!
!!
!!
!!
!!
!!
!!
!!
!!
!!
!!
!!
!!
!!
!!
!!
!!
!!
!!
!!
!!
!!
!!
!!
!!
!!
!!
!!
!!
!!
!!
!!
!!
!!
!!
!!
!!
!!
!!
!!
!!
!!
!!
!!
!!
!!
!!
!!
!!
!!
!!
!!
!!
!!
!!
!!
!!
!!
!!
!!
!!
!!
!!
!!
!!
!!
!!
!!
!!
!!
!!
!!
!!
!!
!!
!!
!!
!
!!
!!
!!
!!
!!
!!
!!
!!
!!
!!
!!
!!
!!
!!
!!
!!
!!
!!
!!
!!
!!
!!
!!
!!
!!
!!
!!
!!
!!
!!
!!
!!
!!
!!
!!
!!
!!
!!
!!
!!
!!
!!
!!
!!
!!
!!
!!
!!
!!
!!
!!
!!
!!
!!
!!
!!
!!
!!
!!
!!
!!
!!
!!
!!
!!
!!
!!
!!
!!
!!
!!
!!
!!
!!
!!
!!
!!
!!
!!
!!
!!
!!
!!
!!
!!
!!
!!
!!
!!
!!
!!
!!
!!
!!
!!
!!
!!
!!
!!
!!
!!
!!
!!
!!
!!
!!
!!
!!
!!
!!
!!
!!
!!
!!
!!
!!
!!
!!
!!
!!
!!
!!
!!
!
!!
!!
!!
!!
!!
! !
!!
!!
!!
!!
!!
!!
!!
!!
!!
!!
! !
!!
!!
!!
!!
!!
!!
!!
!!
!!
!!
! !
!!
!!
!!
!!
!!
!!
!!
!!
!!
!!
!!
!!
! !
!!
!!
!!
!!
!!
!!
!!
!!
!!
!!
! !
!!
!!
!!
!!
!!
!!
!!
!!
!!
!!
! !
!!
!!
!!
!!
!!
!!
!!
!!
!!
!!
! !
!!
! !
!!
!!
!!
!!
!!
!!
!!
!!
!!
!!
! !
!!
!!
!!
!!
!!
!!
!!
!!
!!
!!
! !
!!
!!
!!
!!
!!
!!
!!
!!
!!
!!
! !
!!
!!
!!
!!
!!
!!
!!
!
!
!!
!!
!!
!!
!!
!!
!!
!!
!!
!!
!!
!!
!!
!!
!!
!!
!!
!!
!!
HAZE
L 195
4
DIANE
1955
BRET 1981
NOT NAMED 19
27
NOT NAMED 19
15NOT NAMED 1952
NOT N
AMED
1885
NOT N
AMED
1893
NOT NAMED 19
90
NOT NAMED 1905
DENN
IS 19
99
NOT NAMED 1934NOT NAMED 1928
NOT NAMED 19
49
BOB 1979
NOT N
AMED
1883
Historic Hurricane TracksRappahannock-Rapidan Regional Hazard Mitigation PlanHurricane Track Data Source: National Hurricane CenterHurricane Category designations may not representHurricane Category designations while passing throughRappahannock-Rapidan region.
Hurricane: Category 4 (H4)Hurricane: Category 3 (H3)Hurricane: Category 2 (H2)Hurricane: Category 1 (H1)
!! !! !! Tropical Storm (TS)Tropical Depression (TD)CountiesTowns²
0 5 10 15 20Miles
Map created for Rappahannock-Rapidan Regional Hazard MitigationPlan Update and is intended for general planning purposes only. Datais from various sources and may vary in accuracy and completeness.Date: 5/10/2011 File: Historic_Hurricane_Tracks.mxd
Figure 5.12

H A Z A R D A N A L Y S I S
Rappahannock-Rapidan Regional Hazard Mitigation Plan 2012 Section 5: Page 4
impossible. Vehicles, stuck in snow and abandoned, clogged roadways. Both Reagan National and Washington‐Dulles International airports were closed for most of the day. At least 200 abandoned, damaged, or stuck vehicles were towed from I‐95 and I‐66. Traffic accidents and related injuries were common throughout the region. The back‐to‐back blizzards of February, 2010, paralyzed the region with unprecedented snowfall amounts that closed schools, businesses and government offices, challenged road clearing crews and tested the area's ability to respond to public needs in adverse conditions. February 5‐6, 2010: “Blizzard One.” Snow began falling during the morning of the 5th. By 10 A.M. visibility was reduced to 1/2 mile. By early evening with moderate to heavy snow falling, visibility dropped to ¼ mile. Around midnight the effects of 35 mile per hour winds further reduced visibility to 1/16 of a mile. Northeasterly winds of 25‐30 miles‐per‐hour persisted throughout much of the following day with visibility remaining extremely poor through 4 P.M. on the afternoon of February 6th. A total accumulation of 32" was recorded at Marshall, Virginia in the northeastern part of the region.
February 9‐10, 2010: Just one day after “Blizzard One" ended, a winter storm watch was issued. "Blizzard Two" followed. Light snow began to fall in the afternoon hours, of February 9. By midnight, conditions degraded rapidly. Visibility was reduced as wind speed increased. The fine, powdery snow blew around easily as wind gusts increased to 40‐50 miles‐per‐hour, at times reducing visibility to less than 100 feet. Snow, strong gusty winds and poor visibility continued into the late afternoon of February 10th. Although totals for this storm were less than the first, deep drifts and high roadside snow banks created region‐wide road‐clearing problems. Accumulations of 6 to 10 inches were common throughout the region.
Figure 5.13 ‐ Regional Total Accumulations: Blizzard One

H A Z A R D A N A L Y S I S
Rappahannock-Rapidan Regional Hazard Mitigation Plan 2012 Section 5: Page 5
Table 5.3 Significant Winter Storm Events: Rappahannock‐Rapidan Region
01/01/1995 – 11/30/2010
Location Number of Events
Deaths InjuriesProperty Damage*
Crop Damage*
Culpeper County 61 3 52 $9.85 M $0
Fauquier County 81 4 52 $9.75M $1.2M
Madison County 71 3 52 $10.73M $1.275M
Orange County 64 1 1 $9.554M $0
Rappahannock County 81 2 51 $10.025M $1.275
REGIONAL TOTALS: * 13 208 $49.905M $3.75M
Source: National Climatic Data Center *Many of the same events impacted all counties
According to FEMA, the Rappahannock‐Rapidan region was declared a major disaster area four times between 1995 and 2010 due to severe winter storms and snowstorms. All counties were impacted by these storms which occurred on February 5 – 11(2 storms), 2010; December 18 – 20, 2009; January 25‐31, 2000; and January 13, 2006.
SEVERE THUNDERSTORMS AND TORNADOS
Thunderstorms
Thunderstorms are common throughout the Rappahannock‐Rapidan region and, although most common in summer months, may occur at any time throughout the year. High winds, hail and dangerous lightning often accompany these events. Thunderstorms with wind gusts in excess of 58 mph (50 knots) and/or hail ¾" or more in diameter are classified as a “severe." Wind damage, flash floods, fires, crop and personal property damage may result from thunderstorms, which also may spawn tornados. Figure 5.14 summarizes the likelihood of lightning strikes, while Tables 5.4 and 5.5 provide data on occurrences and impacts of thunderstorms and related phenomena throughout the region.

H A Z A R D A N A L Y S I S
Rappahannock-Rapidan Regional Hazard Mitigation Plan 2012 Section 5: Page 6
Figure 5.14 Virginia Lightning Strike Density Map
Source: Virginia State Climatology Office: 2010 Note: Map based on lightning strike data for 1989.
Table 5.4
Significant Lightning Events: Rappahannock‐Rapidan Region 01/01/1995 – 11/30/2010
Location Number of Events
Deaths Injuries Property Damage*
Crop Damage*
Culpeper County 4 1 1 $30K $0
Fauquier County 7 2 0 $56K $3K
Madison County 2 0 0 $10 $0
Orange County 1 0 0 $1K $0
Rappahannock County 2 0 0 $10K $5K
REGIONAL TOTALS: 16 3 1 $107K $8K
Source: National Climatic Data Center * Approximate numbers based on NCDC records. **
Table 5.5
Severe Thunderstorms and Associated Winds: Rappahannock‐Rapidan Region
(01/01/1995‐ 12/31/2010) *
Location Number of Events
Deaths Injuries Property Damage*
Crop Damage*
Culpeper County 67 0 0 301K 0
Fauquier County 143 0 15 1.43M 2K
Madison County 46 0 0 131K 0
Orange County 60 0 1 484K 5K
Rappahannock County 43 0 1 567K 0
REGIONAL TOTALS: 0 16 2.913M 7K
Source: National Climatic Data Center * Approximate numbers based on NCDC records. **

H A Z A R D A N A L Y S I S
Rappahannock-Rapidan Regional Hazard Mitigation Plan 2012 Section 5: Page 7
Orange County Review; photo-Sandy James
Additionally, 138 hail events are known to have occurred in the region since 1995 (NCDC, 2010). The number of events and amount of damage per county are summarized in Table 5.6.
Table 5.6 Hail Events in the Rappahannock‐Rapidan Region
(01/01/1995‐ 12/31/2010) *
County Number of Hail Events
Property Damage*
Crop Damage*
Culpeper 29 $90K $20K
Fauquier 50 $2.001M $0
Madison 13 $61K $60K
Orange 27 $3K $0
Rappahannock 19 $7K $0
TOTALS: 138 $2.162M $80KSource: National Climatic Data Center * Approximate numbers based on NCDC records.
Significant Hail Events:
April 23, 1999 – Upperville A line of thunderstorms developed in West Virginia during the early afternoon and moved rapidly southeast across Northern Virginia. These storms produced very large hail that damaged cars, roofs, siding, windows and landscaping. Over $1 million in damage was attributed to these fast moving storms. May 13, 2000 – Warrenton A band of thunderstorms produced golf ball to tennis ball sized hail in Warrenton. Hundreds of cars, roofs and windows were damaged in an amount exceeding $1 million. Walnut sized hail was reported in the northwest portion of the county where winds gusted to 65 miles per hour. On June 18, 2008, Orange County experienced a complex and destructive weather event. According to the National Weather Service, a cold front with associated thunderstorms moved across the Appalachians eastward toward Orange County. Heavy rain, severe lightning, and ping‐pong ball size hail accompanied the storm. Local crops sustained substantial damage. As a local newspaper noted, "Early‐planted corn had trouble standing up to the ping pong ball‐sized hail that fell across the area." Sandy James of The Orange County Review documented the damage.

H A Z A R D A N A L Y S I S
Rappahannock-Rapidan Regional Hazard Mitigation Plan 2012 Section 5: Page 8
Tornados Virginia ranks 29th in the nation in the number of tornado events, 25th in tornado deaths, 26th in tornado injuries, and 28thin damages (Storm Prediction Center, 2003). From 1995 through March, 2011, the Rappahannock‐Rapidan region experienced 35 tornado events.
Table 5.7
Tornados: Rappahannock‐Rapidan Region (1995–2011)
County Date F‐Scale Deaths Injuries Property Damage
Crop Damage
Culpeper 09/20/2001 F0 0 0 0 0
09/24/2001 F4 0 2 2M 0
07/10/2003 F0 0 0 0 0
09/08/2004 F1 0 0 50K 0
09/17/2004 F1 0 0 850K 0
09/17/2004 F1 0 0 150K 0
08/30/2005 F0 0 0 5K 0
06/04/2008 F0 0 0 15K 0
Total 8 0 0 3.070M 0
Fauquier 09/06/1996 F0 0 0 0 0
09/24/2001 F1 0 0 20K 0
09/24/2001 F1 0 0 180K 0
05/07/2003 F1 0 0 12K 0
09/08/2004 F2 0 0 500K 0
09/08/2004 F1 0 0 7K 0
09/08/2004 F0 0 0 2K 0
09/17/2004 F3 0 2 250K 0
09/17/2004 F2 0 0 500K 0
09/17/2004 F2 0 0 750K 0
08/30/2005 F0 0 0 50K 0
08/30/2005 F1 0 0 1.5M 0
06/04/2008 F0 0 0 15K 0
06/04/2008 F0 0 0 15K 0
03/13/2011 F1 0 0 0 0
Total 15 0 2 3.811M 0
Madison 09/17/1997F1 0 0 15K 5K
08/09/2000F1 0 0 15K 0
05/02/2004F1 0 0 8K 0
09/17/2004F2 0 0 200K 0
08/30/2005F0 0 0 10K 5k
Total 5 0 0 248K 5K
Orange 07/21/1995F1 0 0 80K 0
09/10/1997F0 0 0 0 0
07/24/1999F1 0 0 50K 0

H A Z A R D A N A L Y S I S
Rappahannock-Rapidan Regional Hazard Mitigation Plan 2012 Section 5: Page 9
County Date F‐Scale Deaths Injuries Property Damage
Crop Damage
09/24/2001F1 0 0 5K 0
06/06/2002F1 0 0 10K 0
09/08/2004F0 0 0 5K 0
09/17/2004F1 0 0 150K 0
09/17/2004F2 0 0 75K 0
Total 8 0 0 375K 0
Rappahannock 08/30/2005 F0 0 0 50K 0
07/23/2008 F0 0 0 15K 0
Totals 2 0 0 65K 0
RRRC Total 35 0 2 7.504M 5KSource: National Climatic Data Center
Figure 5.15 – Historic Tornado Strikes illustrates where these tornado touched down in the region. The Fujita‐Pearson Scale classification of each tornado is indicated for each occurrence and dates are provided for those tornadoes rated F2 or higher.
WILDFIRE According to the Virginia Department of Forestry (VDOF), there were 354 recorded wildfires in the region from 1995‐2010. Almost 50% were caused by debris burning. Other causes include equipment use, unattended campfires, unsupervised children, smoking and lightning. No deaths or injuries were recorded as resulting from these fires. Total property damage was $212,613.00 with 1.4% of all events resulting in damage of $10,000 or more. Of particular interest is the value of property saved over this same time period ‐ $59.3 M. These figures reflect the growing risk of loss due to the intrusion of the built environment into the region's forests – the expansion of the wildland – urban interface. The VDOF's wildfire risk assessment, conducted on a county‐by‐county level, examines six variables:
Historic occurrence of wildfires in the area;
Population density;
Slope;
Aspect;
Land cover; and
Distance from roads.
Variables are weighted according to their applicability to the region evaluated. Structures surrounded by or adjacent to wildland fuels, in areas historically prone to wildfires, and on steep slopes are at a greater risk than those in areas with limited fuels, a low fire occurrence rate and relatively flat terrain. Data incorporated into the risk assessment model was used to:
Identify areas favorable to wildfire development and advancement;
Examine the spatial relationship between high risk areas and woodland home communities, fire stations and fire hydrants;
Identify areas requiring more detailed analysis.
Figure 5.16 shows the Wildfire Risk Assessment in the region, according to the Virginia Department of Forestry. Within the Rappahannock‐Rapidan region, Rappahannock and Madison counties are at greatest risk for wildfires. With heavily forested slopes marking their western boundaries, their proximity to the forests of Shenandoah National Park and relatively steep terrain, the two

!!
!
!
!
!
!
!
!
!
!
!
!
!
!
!
!
!
!
!
!
!
!
!
!
!
!
!
!
!
!
!
!
!
!
!
!
!
!
!
!
!
!
!
!
!
!
!
!
!
!
!
!
!
!
!
!
!
!
!
!
!
!
!
!
!
!
!
!
!
!
!
!
!
!
!
!
!
!
!
!
!
!
!
!
!
!
!
!
!
!
!
!
9/8/2004
6/3/1980
9/17/2004
9/17/2004
9/17/2004
9/17/2004
9/17/2004
9/17/2004
9/24/2001
6/24/1996
9/27/1993
7/25/1985
6/19/1978
6/12/1976
8/17/1965
9/30/1959 10/18/1990
10/13/1983
Historic Tornado StrikesRappahannock-Rapidan Regional Hazard Mitigation PlanHistoric Tornado Data Source: National Weather ServiceTornadoes classified F2 or higher are labeled by date; Tornadoes classified F1 or lower are not labeled
Historic Tornado Strikes! F0! F1
! F2! F3! F4²
0 5 10 15 20Miles
Map created for Rappahannock-Rapidan Regional Hazard MitigationPlan Update and is intended for general planning purposes only. Datais from various sources and may vary in accuracy and completeness.Date: 2/21/2011 File: Historic_Tornado_Strikes.mxd
Figure 5.15

Wildfire Risk AssessmentRappahannock-Rapidan Regional Hazard Mitigation PlanWildfire Risk Data Source: Va. Dept. of Forestry
VA DEPT OF FORESTRY FIRE INCIDENTS (2002-08)Wildfire Potential Risk
HighModerateLow
0 5 10 15 20Miles
Map created for Rappahannock-Rapidan Regional Hazard MitigationPlan Update and is intended for general planning purposes only. Datais from various sources and may vary in accuracy and completeness.Date: 2/22/2011 File: Wildfire_Risk_Assessment.mxd
Va. Dept. of Forestry Fire Incidents (2002-08)
Note: Data is from VDOF internal fire reports and does not include firesoutside of VDOF jurisdiction or those without specific locational information.
CountyCulpeperFauquierMadisonOrangeRappahannock
Number8059868743
Acres126.086.5194.674.262.7
Figure 5.16

H A Z A R D A N A L Y S I S
Rappahannock-Rapidan Regional Hazard Mitigation Plan 2012 Section 5: Page 10
counties incorporate a number of factors that make them particularly vulnerable. In 2002, both counties shared the impacts of a huge wildfire, most of which was confined to Shenandoah National Park, that burned over 24,800 acres. Although the damage to forested areas in Rappahannock and Madison was minimal compared with that documented in the park, the conditions that generated the blaze and contributed to its movement were present in both counties. Rapid, efficient and effective response by local firefighters and park personnel limited the movement of the blaze outside of the park. Table 5.8 summarizes wildfire data for the region for the period 2005 – 2010, as recorded by the VDOF.
Table 5.8 Wildfire: Rappahannock‐Rapidan Region
2005 ‐ 2010
County Events Acres Impacted Total Damage* Value Total Saved*
Culpeper 69 209 $70,970 13.5M
Fauquier 60 171 $11,075 23.9M
Madison 81 110 $68,668 2.4M
Orange 98 169 $30,715 4.9M
Rappahannock 46 133 $31,185 14.6M
REGIONAL TOTALS: 354 792 $212,613 59.3M
Source: Virginia Department of Forestry *Estimates
DROUGHT Since 1995, there have been several periods of drought recorded in the Rappahannock‐Rapidan Region. The National Climatic Data Center attributes nearly $140 million in crop loss to these events.
Table 5.9 Drought: Rappahannock‐Rapidan Region (1995–2010)
County
Dates Reported
8/95
7/97
8/98
11‐12/98
5 ‐ 9 /99
7‐10/02
7/07
8/07
10/07
Culpeper
x
x x x x x
Fauquier
x x
x x x x x x x
Madison
x x x x x x x x
Orange
x x x x x x x
Rappahannock
x x x x x x x x
Source: National Climatic Data Center

H A Z A R D A N A L Y S I S
Rappahannock-Rapidan Regional Hazard Mitigation Plan 2012 Section 5: Page 11
Significant Drought Event During the summer of 2002 Virginia experienced a significant drought resulting from the cumulative impacts of three years of precipitation deficits. While this drought did not reach the level of severity of the drought of record (1930‐1932), increased water demands, as compared with those of the 1930s, resulted in substantial impacts to the Commonwealth and its economy. The intensity of the drought peaked in late August, 2002. Wildfire indices were at levels previously unrecorded in Virginia, the majority of agricultural counties had applied for Federal drought disaster designation, stream flows were at record lows, and thousands of individual private wells failed. During the third week of August, several public water supply systems across the state were on the brink of failure. Several large municipal systems had fewer than sixty days of water‐supply capacity remaining in reservoirs, while some smaller rural systems that rely primarily on withdrawals from free‐flowing streams, such as the town of Orange, had only a few days supply available. On August 30, 2002 Governor Warner took the unprecedented action of declaring a drought emergency and issued Executive Order #33, requiring the elimination of non‐essential water use in large areas of the Commonwealth and naming the Deputy Secretary of Natural Resources as the Commonwealth Drought Coordinator. Executive Order #39, the Virginia Water Supply Initiative, followed on December 13, 2009. This required the development of the Commonwealth’s Drought Response Technical Advisory Committee, charged with the development of a water supply, drought monitoring and response plan (www.deq.virginia.gov).
EXTREME HEAT Because human response to heat depends on the interaction of multiple meteorological variables including temperature, humidity, cloud cover and regional experience, extreme heat criteria and designation are not absolute. Generally, an extreme heat event is characterized by a prolonged period of temperatures 10 degrees or more above the average high temperature accompanied by high humidity.
Table 5.10

H A Z A R D A N A L Y S I S
Rappahannock-Rapidan Regional Hazard Mitigation Plan 2012 Section 5: Page 12
Table 5.11
Extreme Heat Events: Rappahannock‐Rapidan Region (1995–2010)
Location Number of Events
Culpeper County 16
Fauquier County 15
Madison County 14
Orange County 16
Rappahannock County 15
Regional Average: 15
Source: National Climatic Data Center
Regionally, 3 deaths and 230 illnesses were attributed to extreme heat during the period 1995 – 2010.
WINTER STORMS AND FREEZES Most significant winter storms in the Rappahannock‐Rapidan region are nor'easters (Section 5, p. 5). From 1995 to 2010 there have been about 72 significant winter storms resulting in 13 deaths and 208 injuries, along with $50 million in property damage and $3.75 million in crop loss.
Table 5.12 Significant Winter Storm Events: Rappahannock‐Rapidan Region
01/01/1995 – 11/30/2010
Location Number of Events
Deaths InjuriesProperty Damage*
Crop Damage*
Culpeper County 61 3 52 $9.85 M $0
Fauquier County 81 4 52 $9.75M $1.2M
Madison County 71 3 52 $10.73M $1.275M
Orange County 64 1 1 $9.554M $0
Rappahannock County 81 2 51 $10.025M $1.275
REGIONAL TOTALS: * 13 208 $49.905M $3.75M
Source: National Climatic Data Center *Many of the same events impacted all counties
From 1995 through 2010, six extreme cold and wind‐chill events were recorded. One death was attributed to extreme cold in January, 2007. Although $25, 000 in crop loss was attributed to unseasonably cold temperatures in March, 1998, no losses were directly related to extremely cold temperatures.
EROSION (SEE LANDSLIDES) Unless one considers landslides to be part of this process, there have been no erosion events of historic magnitude or significance in the Rappahannock‐Rapidan region. Erosion is an everyday occurrence, an ongoing process that continually alters Earth's surface. The region's steep slopes, numerous streams, exposed farmland and un‐stabilized building sites are areas where erosion commonly occurs;

H A Z A R D A N A L Y S I S
Rappahannock-Rapidan Regional Hazard Mitigation Plan 2012 Section 5: Page 13
however, government agencies at the local, state and federal levels, as well as educational institutions, work diligently to inform the citizenry of the importance of erosion control and the management practices that may be implemented to address it.
EARTHQUAKES
According to the Virginia Department of Mines, Minerals and Energy, earthquake activity in Virginia has been low‐magnitude but persistent. The first documented earthquake in Virginia took place in 1774 near Petersburg. Many others have occurred since then, including an estimated magnitude 5.9 (VII) event in 1897 centered near Pearisburg in Giles County. This was the second largest earthquake in the eastern U.S. It was felt across twelve states, an area of at least 280,000 square miles. Since 1977, when Virginia Tech expanded its seismograph array, more than 175 quakes have been detected as originating beneath Virginia. Of these, at least twenty‐eight were large enough to be felt at the surface. Thus, Virginia averages about six earthquakes per year, of which one is felt at the surface.
Virginia's past seismic activity has been concentrated in two areas: the central Piedmont along the James River, and the New River Valley in Giles County (see Fig. 5.17). Since all parts of the Commonwealth have experienced seismic activity in the past, the entire state should be considered susceptible to earthquakes. The Rappahannock‐Rapidan region lies to the north of Virginia's identified seismic belts; however, the effects of earthquakes are often experienced at great distances from their epicenters. The large earthquakes that occurred in New Madrid, Missouri in 1811 and 1812, and the Charleston, S.C. quake of 1886, were all strongly felt in the region. Most recently, on August 23, 2011, a magnitude 5.8 earthquake centered near Mineral, Virginia (about 15 miles south of the Rappahannock‐Rapidan region) caused damage to the Rappahannock‐Rapidan region. In the region, damages were most evident in the town of Culpeper, where one building was destroyed and several were condemned. In the Rappahannock‐Rapidan region, Culpeper County was designated for Public Assistance (Assistance to State and local governments and certain private non‐profit organizations for emergency work and the repair or replacement of disaster‐damaged facilities) by FEMA, while Individual Assistance (assistance to individuals and households) designations were provided by FEMA for Culpeper and Orange counties.
FIGURE 5.17– SEISMIC ZONES IN VIRGINIA GILES COUNTY SEISMIC ZONE ‐ PINK; CENTRAL PIEDMONT SEISMIC ZONE – YELLOW | SOURCE: VIRGINIA DMME

H A Z A R D A N A L Y S I S
Rappahannock-Rapidan Regional Hazard Mitigation Plan 2012 Section 5: Page 14
FIGURE 5.18 – SEISMICITY OF VIRGINIA, 1990 ‐ 2006 CIRCLES = EARTHQUAKES (DEPTH IN KM INDICATED BY COLOR) | SOURCE: USGS
Figure 5.19 Geological and Seismic Information for Virginia
Source: USGS National Seismic Hazard Mapping Project

H A Z A R D A N A L Y S I S
Rappahannock-Rapidan Regional Hazard Mitigation Plan 2012 Section 5: Page 15
Figure 5.20 summarizes the expected earthquake intensity levels with 10 percent probability of exceedence in 50 years4 based on the national U.S. Geological Survey map of peak acceleration. As mapped, the greater part of the region sits within a zone of 3 percent peak ground acceleration with a very small area in a zone of 2 percent peak ground acceleration. Thus the region, as a whole, is in an area of relatively limited seismic risk. The entire Commonwealth is subject to earthquake activity; however, western and central regions are most vulnerable to potential damage. The following list of earthquake events that have occurred in the Rappahannock‐Rapidan region since 1875 has been compiled from National Geophysical Data Center records (Table 5.13).
Table 5.13
Significant Seismic Events Impacting the Rappahannock‐Rapidan Region
1774 ‐ 1984
Date Location Recording
Occurrence
Distance from Epicenter (Miles)
Modified Mercalli Intensity
1/3/1885 Warrenton 59 Unknown
9/1/1886 Madison 634 Unknown
4/10/1918 Orange 58 Unknown
1/6/1935 Culpeper 924 Unknown
5/311966 Culpeper 101 3.1
11/20/1969 Culpeper 296 4.3
9/5/1972 Montpelier 24 3.3
7/30/1981 Orange 8 1.4
5/6/1982 Montpelier 10 2.0
8/7/1984 Gordonsville 30 4.2
Source: National Geophysical Data Center
SINKHOLES Sinkholes are common in areas characterized by soluble bedrock including limestone or other carbonates, salt deposits or any rock that can be dissolved naturally by circulating ground water.The geology of the Rappahannock‐Rapidan region limits the likelihood of sinkhole development; however, subsidence events associated with the decay of buried construction debris or woody material from land‐clearing activities, as well as slumping resulting from leaking underground water lines, do occur. Due to the rarity of true sinkhole development in the region, no data on their occurrence has been compiled, nor maps generated. No information regarding the probability of sinkhole development could be found for the region.
LANDSLIDES
Landslides are Virginia's most widespread geologic hazard. The most disastrous landslide events are associated with heavy rainfall along the steep slopes of the Blue Ridge Mountains and the Appalachians, but slumping, sliding, and creep can occur even on fairly gentle slopes if local conditions exceed the natural stability of the site. Areas that are prone to mass movement include areas of previous landslides; the bases of steep slopes, particularly slopes burned by forest and brush fires; the margins of drainages; and developed hillsides, particularly where septic systems are used. Research has
4 This national base map is presented and discussed in the Hazard Identification section of this Plan. The zones indicated on the regional map are based on the national map.

Earthquake: Peak Ground AccelerationRappahannock-Rapidan Regional Hazard Mitigation PlanPGA Data Source: USGSPeak Horizontal Acceleration with 10% probability ofexceedence in 50 years.
Peak Ground Acceleration (%g)23
0 5 10 15 20Miles
Map created for Rappahannock-Rapidan Regional Hazard MitigationPlan Update and is intended for general planning purposes only. Datais from various sources and may vary in accuracy and completeness.Date: 5/10/2011 File: EQ_Peak_Ground_Acceleration.mxd
Figure 5.20

Landslide Susceptibility & IncidenceRappahannock-Rapidan Regional Hazard Mitigation PlanLandslide Susceptibility Data Source: USGSHigh Incidence is greater than 15% of area is involvedin landsliding.Moderate Incidence is between 1.5% and 15% of area is involved in landsliding.Low Incidence is less than 1.5% of area is involvedin landsliding.
Landslide Susceptibility & IncidenceHigh Susceptibility/Moderate IncidenceLow Susceptibility/Low Incidence
0 5 10 15 20Miles
Map created for Rappahannock-Rapidan Regional Hazard MitigationPlan Update and is intended for general planning purposes only. Datais from various sources and may vary in accuracy and completeness.Date: 5/10/2011 File: Landslide_Susceptibility.mxd
Figure 5.21

H A Z A R D A N A L Y S I S
Rappahannock-Rapidan Regional Hazard Mitigation Plan 2012 Section 5: Page 16
revealed that about fifty‐six percent of recent landslides occurred on slopes that had been altered in some way by development.
Because of the prevalence of steep slopes, numerous streams, shallow soils and other contributing factors, the western portions of Fauquier, Rappahannock, and Madison counties are particularly vulnerable to landslides. Overall, according to the U.S. Geological Survey5, the region is split between a zone of high susceptibility/moderate incidence and low incidence (Figure 5.21).
LEFT: On June 27, 1995, an intense storm dumped approximately 30 inches of rain on Madison County in a period of 16 hours. This resulted in hundreds of debris flows in the Graves Mill area of the county and the area was declared a disaster area by the Federal Emergency Management Agency.
Figure 5.22
Vulnerable Soils for Fauquier and Madison Counties
On June 27, 1995, an intense storm dumped approximately 30 inches of rain on Madison County in a period of 16 hours. This resulted in hundreds of debris flows in the Graves Mill area of the county and the area was declared a disaster area by the Federal Emergency Management Agency. Figure 6.7 (in the Vulnerability Assessment section) shows the area impacted by this event.
5 This national base map is presented and discussed in the Hazard Identification section of this risk assessment. The terms used here are more thoroughly defined in that section.

H A Z A R D A N A L Y S I S
Rappahannock-Rapidan Regional Hazard Mitigation Plan 2012 Section 5: Page 17
DAM/LEVEE FAILURE Dam failure includes the collapse, overtopping, breaching or other events that result in the uncontrolled release of water or sludge from an impoundment with subsequent downstream flooding. Dam or levee failures may occur with little warning. They may result from the effects of intense storms, debris jams or sudden snow melt. Dam failure may result from any one or combination of the following:
Prolonged periods of rainfall and flooding;
Inadequate spillway capacity;
Internal structural erosion;
Improper maintenance;
Improper design, material selection; and/or construction;
Negligent operation;
Failure of upstream structure(s);
High winds creating erosion by wave action;
Intentional criminal acts.
Virginia's recent (2008) revisions to its dam classification and regulatory system bring it into alignment with that used in the National Inventory of Dams maintained by the U.S. Army Corps of Engineers. Hazard potential is directly related to anticipated adverse downstream impacts should the given dam fail.
Table 5.14 Virginia Dam Classification
Hazard Potential Failure Effects Inspection
High Probable loss of human life, serious economic impact (buildings, facilities, major roads, etc.)
Annual, with inspection by professional engineer every 2 years.
Significant
May cause loss of human life or appreciable economic impact (buildings, secondary roads, etc.)
Annual, with inspection by professional engineer every 3 years.
Low No expected loss of human life, no more than minimal economic impact.
Annual, with inspection by professional engineer every 6 years.
The owner of each regulated dam, whether high, significant or low hazard, is required to obtain an Operation and Maintenance Certificate. This must include an assessment of the dam by a licensed professional and an Emergency Action Plan which must be filed with the appropriate local emergency official and the Virginia Department of Emergency Management. Certification types within the region include MR for regular operation and maintenance and MC indicating conditional certification. OC classification indicates ongoing evaluation for classification status.
There are no comprehensive databases of historical dam failures in Virginia. According to the Virginia Department of Conservation and Recreation there are 48 state regulated dams in the Rappahannock‐Rapidan region. Of those, 8 are classified as high hazard potential, 13 are significant and 27 are low (see Figure 5.23 – Dam Classification).

Dam Inventory & ClassificationRappahannock-Rapidan Regional Hazard Mitigation PlanDam Inventory and Hazard Source: HAZUS MH MR4, VA DCRHazard Data is based on Virginia Department of Conservationand Recreation database
Dam ClassificationDCR Regulation & Hazard
HighSignificantLowNon-Regulated Dam
0 5 10 15 20Miles
Map created for Rappahannock-Rapidan Regional Hazard MitigationPlan Update and is intended for general planning purposes only. Datais from various sources and may vary in accuracy and completeness.Date: 6/2/2011 File: Dam_Classification.mxd
Figure 5.23

H A Z A R D A N A L Y S I S
Rappahannock-Rapidan Regional Hazard Mitigation Plan 2012 Section 5: Page 18
Table 5.15: Regulated Dams – by County
Culpeper
Hazard Potential
Classification
High Significant Low MC MR OC
Mountain Run 8A x x
Mountain Run 11 x x
Mountain Run 50 x x
Mountain Run 13 x x
Mountain Run 18 x x
South Wales x x
Cole 1 x x
Troiano x x
TOTALS: 2 2 4 4 4
Fauquier
Warrenton x x
DiGiulian x x
Thompson x x
Kinloch Farm x x
Springhill Farm x x
Barr x x
Johnson x x
Clifton Lower x x
Coventry x x
Mellott x x
Lake Brittle x x
Winslow x x
Hideaway Hills x x
Warrenton Lakes ‐ Lower
x x
Licking Run x x
Cedar Run 3 x x
Willow Pond Farm x x
Volgenau x x
TOTALS: 3 8 7 9 8 1

H A Z A R D A N A L Y S I S
Rappahannock-Rapidan Regional Hazard Mitigation Plan 2012 Section 5: Page 19
Madison
Hazard Potential
Classification
High Significant Low MC MR OC
White Oak x x
Beautiful Run 2A x x
Beautiful Run 4 x x
Beautiful Run 5 x x
Beautiful Run 6 x x
Beautiful Run 7 x x
Beautiful Run 10 x x
Beautiful Run 11 x x
Beautiful Run 1B x x
Hablutzel x x
Malvern x x
Deep Run Farm x x
Totals 2 10 4 8
Orange
Lake of the Woods x x
Lake Orange x x
Grymes Mill x x
Northrup x x
Keaton's Run x x
James A. Strong x x
Decoursey x x
Spring Vale x x
Orange Raw Water Reservoir
x
Totals 3 1 5 2 6
Rappahannock
Whippoorwill x x
Totals 1 1
REGION TOTALS:
8 13 27 19
27
1
Source: Virginia Department of Conservation and Recreation – Division of Dam Safety, May 2011

H A Z A R D A N A L Y S I S
Rappahannock-Rapidan Regional Hazard Mitigation Plan 2012 Section 5: Page 20
DATA SOURCES American Society of Civil Engineers (ASCE), “Facts About Windstorms.” Web site: www.windhazards.org/facts.cfm Bureau of Reclamation, U.S. Department of the Interior Web site: www.usbr.gov Federal Emergency Management Agency (FEMA), Department of Homeland Security Web site: www.fema.gov National Climatic Data Center (NCDC), U.S. Department of Commerce, National Oceanic and Atmospheric Administration Web site: http://lwf.ncdc.noaa.gov/oa/ncdc.html National Geophysical Data Center Web site: http://www.ngdc.noaa.gov/ National Hurricane Center, National Oceanic & Atmospheric Administration (NOAA) Web site: http://www.nhc.noaa.gov/ National Severe Storms Laboratory (NSSL), U.S. Department of Commerce, National Oceanic and Atmospheric Administration Web site: www.nssl.noaa.gov National Weather Service (NWS), U.S. Department of Commerce, National Oceanic and Atmospheric Administration Web site: www.nws.noaa.gov Storm Prediction Center (SPC), U.S. Department of Commerce, National Oceanic and Atmospheric Administration, National Weather Service Web site: www.spc.noaa.gov The Tornado Project, St. Johnsbury, Vermont Web site: www.tornadoproject.com United States Geological Survey (USGS), U.S. Department of the Interior Web site: www.usgs.gov Virginia Department of Conservation and Recreation Web site: www.dcr.virginia.gov/

VU L N E R A B I L I T Y A S S E S S M E N T
44 CFR Requirement
44 CFR Part 201.6(c)(2)(ii): The risk assessment shall include a description of the jurisdiction's vulnerability to the hazards described in paragraph (c)(2)(i) of this section. The description shall include an overall summary of each hazard and its impact on the community. The plan should describe vulnerability in terms of: (A) The types and numbers of existing and future buildings, infrastructure, and critical facilities located in the identified hazard areas; (B) An estimate of the potential losses to vulnerable structures identified in paragraph (c)(2)(ii)(A) of this section and a description of the methodology used to prepare the estimate; (C) Providing a general description of land uses and development trends within the community so that mitigation options can be considered in future land use decisions.
The Hazard Analysis of the Rappahannock-Rapidan region has identified those hazards listed below as significant threats to the area. The potential impacts of hazards as reviewed in Section 4 and quantified in Section 5 have been assessed and grouped according to potential impact and, where appropriate, relevance to associated events. For example, the category "Winter Storms" now includes events characterized by extreme cold since the sub-category "Freezes" has been determined to be relatively insignificant. All assessments are based on best available data. Natural Hazards
• Flood
• Hurricanes and Tropical Storms
• Severe Thunderstorms and Tornadoes
• Wildfire
• Drought/Extreme Heat
• Winter Storms
• Earthquakes
• Landslides
• Dam/Levee Failure
ASSESMENT METHODOLOGIES Assessment tools used include:
• HAZUS®MH MR4; • GIS (Non-HAZUS) Risk Assessment; and • Mitigation scorecard
HAZUS®MH, a geographic information loss estimation software tool, available through the Federal Emergency Management Agency, was partnered with regional and local GIS analysis to provide a quantitative assessment of potential hazards. Qualitative information was derived from data provided by members of the Advisory Committee who assigned values to the likelihood of occurrence, spatial extent and potential of each hazard studied. It should be noted that the vulnerability determinations presented in this section are based on best available data and represent an approximation of risk. While useful in understanding relative risk and potential loss, all such analyses include inherent uncertainty reflecting incomplete knowledge and the approximations and simplifications that are an integral part of any loss estimation methodology. HAZUSMH Risk Assessment Methodology HAZUSMH is FEMA’s nationwide standardized loss estimation software package, built on an integrated GIS platform. In this risk assessment, HAZUSMH MR4 was used to produce regional profiles and estimated losses for three of the hazards addressed in this section: flood, hurricane winds and earthquake. The HAZUSMH MR4 risk assessment methodology is parametric, in that distinct hazard and inventory parameters—such as wind speed and building type, for example—were modeled using the HAZUSMH software to determine the impact (damages and losses) on the built environment. Figure 6.1 shows a conceptual model of HAZUSMH methodology.

V U L N E R A B I L I T Y A S S E S S M E N T
Rappahannock-Rapidan Regional Hazard Mitigation Plan 2012 Section 6: Page 2
Figure 6.1 Conceptual Model of HAZUSMH Methodology
It is important to note that for those hazards where HAZUSMH MR4 was used, “worst case scenario” results were produced to show the maximum potential extent of damages for those hazards. It is understood that any smaller events that could occur would likely create lesser losses than those calculated here.
Explanation of GIS-based (Non-HAZUSMH) Risk Assessment Methodology
The general steps used in the GIS-based assessment conducted independently of the HAZUSMH software are summarized below:
• In addition to the HAZUSMH MR4 analysis for the region’s flood vulnerability, a spatial analysis utilizing ESRI ArcGIS 9.3.1 was completed. GIS data was collected from local, state and national sources for this analysis. Floodplain data obtained from FEMA was used in combination with local GIS data layers, including tax parcel databases, structure footprints and digital orthophotography. The flood risk was assessed by calculating assessed improvement values of structures and parcels located in identified flood hazard areas. Results are detailed in the flood vulnerability section below.
• For the severe thunderstorm, tornado, winter storm, drought and wildfire hazards, best available data on historical hazard occurrences (limited to NOAA National Climatic Data Center records and Virginia Department of Forestry data for wildfire) was used to produce an annualized loss estimate of potential damages. Using this data, annualized loss estimates were generated by totaling the amount of property damage over the period of time for which records were available, and calculating the average annual loss. GIS was used to show the correlations between potential future events and residential population distribution throughout the county. In instances where multiple counties are affected and the value for property damage reflects the total for the affected area, professional judgment was used in extracting a reasonable share for each county in

V U L N E R A B I L I T Y A S S E S S M E N T
Rappahannock-Rapidan Regional Hazard Mitigation Plan 2012 Section 6: Page 3
the Rappahannock-Rapidan Region to produce an annualized loss estimate of potential damages in the Rappahannock-Rapidan Region.
• For the erosion and dam/levee failure hazards, meaningful historical data (meaning data which would have included property damages and other essential indicators) was virtually non-existent, and therefore annualized potential losses for these hazards is assumed to be negligible.
Explanation of Hybrid Approach
As described in the preceding commentary, the quantitative assessment focuses on potential loss estimates, while the qualitative assessment is comprised of a scoring system built around values assigned by the Mitigation Advisory Committee to the likelihood of occurrence, spatial extent and potential impact of each hazard presented here. For likelihood of occurrence, the following four options were available to members of the Mitigation Advisory Committee: Highly Likely, Likely, Possible or Unlikely. For spatial extent, three options were offered to describe the area which might be expected to be affected: Large, Moderate or Small. For potential impact, the choices consisted of: Catastrophic, Critical, Limited or Minor. Table 6.1 provides the criteria associated with each label.
Table 6.1
Criteria for Qualitative Assessment
Assigned Value
Definition
Likelihood of Occurrence
Highly Likely 3 Near 100% annual probability
Likely 2 Between 10 and 100% annual probability
Possible 1 Between 1 and 10% annual probability
Unlikely 0 Less than 1% annual probability
Spatial Extent
Large 3 More than 50% of area affected
Moderate 2 Between 10 and 50% of area affected
Small 1 Less than 10% of area affected
Potential Impact
Catastrophic 4 High number of deaths/injuries possible. More than 50% of property in affected area damaged or destroyed. Complete shutdown of facilities for 30 days or more.
Critical 3 Multiple deaths/injuries possible. More than 25% of property in affected area damaged or destroyed. Complete shutdown of facilities for more than one week.
Limited 2 Minor injuries only. More than 10% of property in affected area damaged or destroyed. Complete shutdown of facilities for more than one day.
Minor 1 Very few injuries, if any. Only minor property damage and minimal disruption on quality of life. Temporary shutdown of facilities.
The values assigned for each option chosen are added together for each hazard to arrive at a total score. For example, in the Rappahannock-Rapidan Region flood is considered Highly Likely (3), with a Moderate reach (2), with a Critical potential impact (3). This gives the flood hazard a total hazard rating of 8 (10

V U L N E R A B I L I T Y A S S E S S M E N T
Rappahannock-Rapidan Regional Hazard Mitigation Plan 2012 Section 6: Page 4
being the highest possible score.) This presents the flood hazard as the highest ranking hazard for the planning area. All conclusions are presented in “Conclusions on Hazard Risk” at the end of this section. Findings for each hazard are detailed in the hazard-by-hazard vulnerability assessment that follows, beginning with an overview of the planning area.

V U L N E R A B I L I T Y A S S E S S M E N T
Rappahannock-Rapidan Regional Hazard Mitigation Plan 2012 Section 6: Page 5
OVERVIEW OF VULNERABILITY IN THE REGION According to the U.S. Census Bureau, in 2010 the population of the Rappahannock-Rapidan Region was 166,054, a 23% increase from 2000. Virginia's population in 2010 was 8,001024, having increased by 13.02% since 2000 when it was 7,079,048. The average number of persons per square mile in the Rappahannock-Rapidan region in 2010 was 85 (Fig. 6.2 – Population Density), an increase of 12 persons per square mile from 72 per square mile in 2000. The total dollar exposure of buildings within the Rappahannock-Rapidan Region is estimated to be $15,125,256,000. This is based on HAZUSMH MR4 inventories of 60,407 residential, commercial, industrial and other buildings located within the region.1 Total dollar exposure accounts for both the building and its contents, which is based on a percentage of the building’s value. Figures 6.3 through 6.5 show the distribution of residential, commercial and industrial property exposure throughout the county by census tract. 2
Development Trends
A general analysis of current land uses and development trends is essential in formulating mitigation options that influence future land use decisions. As was noted previously (Section 3), although the region remains primarily rural, it has experienced a 23 percent increase in population over the last 10 years. Most of this growth has occurred in localities closest to Washington, D.C. – Fauquier and Culpeper counties – and along major transportation routes. Critical Facilities
The Rappahannock-Rapidan region's critical facilities are listed below (Table 6.2). Included is information listed in the HAZUS database along with edits provided by representatives of participating localities. Figure 6.6 is a visual display of the data included in HAZUSMH.
Table 6.2 Critical Facilities in the Rappahannock-Rapidan Region (HAZUSMH Inventory and Local Input)
County Jurisdiction Facility Name Facility Type
Culpeper Culpeper Culpeper Regional Hospital Hospital
Culpeper Elkwood Culpeper Regional Airport Airport
Culpeper Culpeper Culpeper EMS Building Emergency Coordination
Culpeper Culpeper Culpeper Emergency Operations
Center Emergency Operations
Culpeper Culpeper Reva Volunteer Fire & Rescue Fire Station
Culpeper Brandy Station Brandy Volunteer Fire Dept Fire Station
Culpeper Culpeper Salem Volunteer Fire & Rescue Fire Station
1 HAZUSMH MR4 uses U.S. Census, Dunn & Bradstreet (2006) and R.S. Means (2006) data for its default inventories. Values not reflected in HAZUSMH MR4 are not reflected. 2 The remaining 1 percent is classified as “other” and includes agriculture, education, government and religious buildings.

Population Density | 2010 U.S. CensusRappahannock-Rapidan Regional Hazard Mitigation PlanPopulation Density by Census Block Group,2010 U.S. Census
Census Block GroupsPOPULATION / SQMI2
< 5050 - 100100 - 250250 - 500> 500
0 5 10 15 20Miles
Map created for Rappahannock-Rapidan Regional Hazard MitigationPlan Update and is intended for general planning purposes only. Datais from various sources and may vary in accuracy and completeness.Date: 6/1/2011 File: RRRC_Pop_Density.mxd
Figure 6.2

Residential Exposure by Census TractRappahannock-Rapidan Regional Hazard Mitigation PlanResidential Dollar Exposure Source: HAZUS MH MR4Data is shown using 2000 Census Tracts and includesbuilding stock and contents values
Residential Dollar Exposureby Census Tract
<$250 Million$250M to $500M>$500 Million
0 5 10 15 20Miles
Map created for Rappahannock-Rapidan Regional Hazard MitigationPlan Update and is intended for general planning purposes only. Datais from various sources and may vary in accuracy and completeness.Date: 6/2/2011 File: Residential_Exposure.mxd
Figure 6.3

Commercial Exposure by Census TractRappahannock-Rapidan Regional Hazard Mitigation PlanCommercial Dollar Exposure Source: HAZUS MH MR4Data is shown using 2000 Census Tracts and includesbuilding stock and contents values
Commercial Dollar Exposureby Census Tract
<$100 Million$100M to $200M>$200 Million
0 5 10 15 20Miles
Map created for Rappahannock-Rapidan Regional Hazard MitigationPlan Update and is intended for general planning purposes only. Datais from various sources and may vary in accuracy and completeness.Date: 6/2/2011 File: Commercial_Exposure.mxd
Figure 6.4

Industrial Exposure by Census TractRappahannock-Rapidan Regional Hazard Mitigation PlanCommercial Dollar Exposure Source: HAZUS MH MR4Data is shown using 2000 Census Tracts and includesbuilding stock and contents values
Industrial Dollar Exposureby Census Tract
<$25 Million$25M to $50M>$50 Million
0 5 10 15 20Miles
Map created for Rappahannock-Rapidan Regional Hazard MitigationPlan Update and is intended for general planning purposes only. Datais from various sources and may vary in accuracy and completeness.Date: 6/2/2011 File: Industrial_Exposure.mxd
Figure 6.5

$
$
$
$
$
$
$
$
$
$
$
$$
$
$$
$
$
$
$
$
$
$
$
$
$
$
$
$
$
$
$
$
$
$
$
$
$
$$$$$
$$$$$$
$$$$$
$
$
$
$
n
n
n
nnn
n
n
n
n
n
n
n
n
n
n
n
nn
n
n
n
nn
n
n
n
n
n
n
nn
n
n
n
n
n
n
n n
n
n
n
n
nn
n
n
nn
nn
n
®v
®v
¥
¥
¥
¥
¥
¥
¥
¥
¥
¥
¥
¥
¥
¥
¥
¥
¥
¥
¥
¥
¥
¥
¥
¥
¥
¥
¥
¥¥ ¥
¥
¥¥
¥
¥¥
¥ ¥
¥
¥
¥¥
¥
Critical FacilitiesRappahannock-Rapidan Regional Hazard Mitigation PlanOther Facilities include Water, Wastewater, Electric, Natural Gas, Oil and Haz Mat Facilities identifed by HAZUS-MH MR4¥ Fire & Rescue Stations®v Hospitalsn Schools$ Other HAZUS Identified Facilities
²0 5 10 15 20
Miles
Map created for Rappahannock-Rapidan Regional Hazard MitigationPlan Update and is intended for general planning purposes only. Datais from various sources and may vary in accuracy and completeness.Date: 2/21/2011 File: Critical_Facilities.mxd
Figure 6.6

V U L N E R A B I L I T Y A S S E S S M E N T
Rappahannock-Rapidan Regional Hazard Mitigation Plan 2012 Section 6: Page 6
County Jurisdiction Facility Name Facility Type
Culpeper Culpeper Culpeper County Sheriff’s Office Police Station
Culpeper Culpeper Culpeper Police Dept Police Station
Culpeper Culpeper Culpeper Christian School School
Culpeper Culpeper St. Luke’s Lutheran School School
Culpeper Lignum Alice C Tyler Village of Children School
Culpeper Culpeper Epiphany Catholic School School
Culpeper Culpeper G.W. Carver-Pied. Tec Ed Center School
Culpeper Culpeper Central VA Regional Program School
Culpeper Culpeper A. G. Richardson Elementary School
Culpeper Culpeper Culpeper County High School
Culpeper Culpeper Culpeper County Middle School
Culpeper Culpeper Farmington Elementary School
Culpeper Culpeper Pearl Sample Elementary School
Culpeper Culpeper Sycamore Park Elementary School
Culpeper Culpeper Emerald Hill Elementary School
Culpeper Culpeper Eastern View High School School
Culpeper Culpeper Yowell Elementary School School
Fauquier Warrenton Fauquier Hospital Hospital
Fauquier Midland Fauquier-Warrenton Airport Airport
Fauquier Warrenton CFREM Offices Emergency Management
Fauquier Bealeton Lois Volunteer Fire Dept Fire Department
Fauquier Orlean Orlean Volunteer Fire Dept Fire Department
Fauquier Goldvein Goldvein Volunteer Fire Dept Fire Department
Fauquier Broad Run New Baltimore VFC and Rescue Fire & Rescue
Fauquier Catlett Cedar Run Volunteer Rescue Squad
Fire Department

V U L N E R A B I L I T Y A S S E S S M E N T
Rappahannock-Rapidan Regional Hazard Mitigation Plan 2012 Section 6: Page 7
County Jurisdiction Facility Name Facility Type
Fauquier Warrenton Warrenton VFC Fire Department
Fauquier Remington Remington VFC and Rescue Fire & Rescue
Fauquier Marshall Marshall VFC Fire Department
Fauquier The Plains The Plains VFC and Rescue Fire & Rescue
Fauquier Upperville Upperville VFC Fire Department
Fauquier Warrenton Warrenton Vol. Rescue Squad Rescue Station
Fauquier Catlett Catlett VFC Fire Department
Fauquier Marshall Marshall Vol. Rescue Squad Rescue Station
Fauquier Warrenton Warrenton Police Police Station
Fauquier Warrenton Sheriff's Dept-Detention Center Police Station
Fauquier Warrenton Criminal Court Public Safety
Fauquier Warrenton Sheriff's-Criminal Investigation Police Station
Fauquier Warrenton Fauquier County Sheriff's Office Police Station
Fauquier Warrenton Adult Detention Facility Government Building
Fauquier Warrenton Fauquier County Courthouse (old) Government Building
Fauquier Warrenton Fauquier County Courthouse
(new) Government Building
Fauquier Multiple locations
Fauquier County Schools and Government Building
Government Building
Fauquier Warrenton Warren Green Administrative
Building Government Building
Fauquier Warrenton Parks and Recreation Gym Government Building
Fauquier Warreton Warrenton-Fauquier Joint Communications Center
Government Building
Fauquier The Plains Wakefield School School
Fauquier Remington Cornerstone Christian Academy School
Fauquier Midland Midland Christian Academy School
Fauquier Warrenton C. M. Bradley Elementary School
Fauquier Bealeton Cedar Lee Middle School
Fauquier Warrenton Fauquier High School

V U L N E R A B I L I T Y A S S E S S M E N T
Rappahannock-Rapidan Regional Hazard Mitigation Plan 2012 Section 6: Page 8
County Jurisdiction Facility Name Facility Type
Fauquier Catlett H. M. Pearson Elementary School
Fauquier Marshall Marshall Middle School
Fauquier Warrenton P. B. Smith Elementary School
Fauquier Remington Margaret M. Pierce Elementary School
Fauquier Warrenton W. C. Taylor Middle School
Fauquier Marshall W. G. Coleman Elementary School
Fauquier Warrenton Warrenton Middle School School
Fauquier Bealeton Liberty High (Shelter) School
Fauquier Bealeton Mary Walter Elementary School
Fauquier Bealeton Grace Miller Elementary School
Fauquier New Baltimore C. Hunter Ritchie Elementary School
Fauquier New Baltimore Kettle Run High School School
Fauquier New Baltimore Greenville Elementary School School
Fauquier New Baltimore Auburn Middle School (Shelter) School
Fauquier Warrenton Brumfield Elementary School
Fauquier Marshall Claude Thompson Elementary School
Fauquier Remington M.M. Pierce Elementary School
Fauquier Midland Southeastern Alternative School School
Fauquier Middleburg Montessori School of Middleburg School
Fauquier Mountainside Montessori School
Fauquier Lois Atkins Head Start School
Fauquier Multiple locations
Fauquier Community Child Care (9 facilities) Daycare
Fauquier Warrenton Children of America Daycare
Fauquier Bealeton Children of America Daycare
Fauquier Warrenton Jack and Jill Daycare
Fauquier Maplewood Childcare Center Daycare

V U L N E R A B I L I T Y A S S E S S M E N T
Rappahannock-Rapidan Regional Hazard Mitigation Plan 2012 Section 6: Page 9
County Jurisdiction Facility Name Facility Type
Fauquier Piedmont Child Development
Center Daycare
Fauquier Bealeton Southern Fauquier Child Development
Daycare
Fauquier Multiple locations Walnut Grove Childcare Facility Daycare
Fauquier Walnut Grove Academy Daycare
Fauquier Warrenton Warrenton Baptist Tiny Tot Care Center
Daycare
Fauquier Warrenton Fauquier County Garage Fuel Site
Fauquier Morgan Oil Fuel Site
Fauquier Warrenton Oak Springs Nursing Home Nursing Home
Fauquier Warrenton Overlook Nursing Home Nursing Home
Fauquier America House Nursing Home
Fauquier The Oaks Nursing Home
Fauquier Moffett Manor Nursing Home
Fauquier Blue Ridge Christian Home Nursing Home
Fauquier Warrenton Warrenton Manor Nursing Home
Fauquier Warrenton Waste Water Plant Waste Water Plant
Fauquier Marshall Marshall Water Plant Water Treatment
Plant
Fauquier Remington Remington Water Plant Water Treatment Plant
Fauquier Vint Hill Vint Hill Water Plant Water Treatment
Plant
Fauquier Warrenton Warrenton Water Treatment Plant Water Treatment
Plant
Fauquier Marsh Run Generation Facility Utility
Fauquier Remington Remington Combustion Turbine
Station Utility
Fauquier Bealeton Marsh Run Mobile Home Park Residential
Madison Madison Madison County Sheriff's Office Police Station
Madison Madison Madison Fire Company Fire and Rescue
Madison Madison Madison Rescue Squad Fire and Rescue

V U L N E R A B I L I T Y A S S E S S M E N T
Rappahannock-Rapidan Regional Hazard Mitigation Plan 2012 Section 6: Page 10
County Jurisdiction Facility Name Facility Type
Madison Madison Madison Emergency Medical
Services Medical Services
Madison Madison School Bus Maintenance Shop Mechanical Services
Madison Madison Rapidan Service Authority Water Treatment
Plant
Madison Madison School Board Offices School Offices
Madison Aroda Cornerstone Christian School School
Madison Woodberry Forest Woodberry Forest School School
Madison Aroda Oak Grove Menonite School School
Madison Madison Madison County High School
Madison Madison Madison Primary School
Madison Madison Waverly Yowell Elementary School
Madison Madison William H. Wetsel Middle School
Madison Criglersville Criglesrville Elementary School
Madison Madison Early Learning Center School
Madison Madison Skyline CAP School
Madison Town of Madison First Friends Pre-school School
Madison Madison Rainbow Preschool Day Care
Madison Pratts Countryside Rest Home Nursing Home
Madison Novum Meadowbrook Nursing Home at
Novum Nursing Home
Madison Brightwood Morgan’s Nursing Home Nursing Home
Madison Madison Autumn Care of Madison Nursing Home
Madison Aroda Mountain View Nursing Home Nursing Home
Madison Madison Sevenoaks Pathwork Center Nursing Home
Orange Orange Orange County Airport Airport
Orange Gordonsville Gordonsville Municipal Airport Airport
Orange Orange Orange County E-911 Center Emergency Operations

V U L N E R A B I L I T Y A S S E S S M E N T
Rappahannock-Rapidan Regional Hazard Mitigation Plan 2012 Section 6: Page 11
County Jurisdiction Facility Name Facility Type
Orange Gordonsville Gordonsville VFC Fire Station
Orange Orange Orange VFC Fire Station
Orange Mine Run Mine Run VFC Fire Station
Orange Barboursville Barboursville Volunteer Fire Fire Station
Orange Rapidan Rapidan Volunteer Fire Dept Fire Station
Orange Locust Grove Lake-Woods Fire & Rescue Fire & Rescue
Orange Mine Run Mine Run Volunteer Rescue Rescue Squad
Orange Barboursville Barboursville Volunteer Rescue Rescue Squad
Orange Gordonsville Gordonsville Volunteer Rescue Rescue Squad
Orange Orange Orange County Rescue Squad Rescue Squad
Orange Orange Orange County Sheriff’s Office Police Station
Orange Orange Orange Police Police Station
Orange Gordonsville Gordonsville Police Dept Police Station
Orange Orange Grymes Memorial School School
Orange Unionville Faith Christian Academy School
Orange Unionville Lightfoot Elementary School
Orange Orange Orange County High School
Orange Orange Orange Elementary School
Orange Orange Prospect Heights Middle School
Orange Unionville Unionville Elementary School
Orange Locust Grove Locust Grove Elementary School
Orange Locust Grove Locust Grove Middle School (old) School
Orange Gordonsville Gordon-Barbour Elementary School School
Orange Locust Grove Locust Grove Middle School (new) School
Orange Orange Town of Orange Public Works
Facilities Government Building
Orange Orange Town of Orange Administrative Building
Government Building

V U L N E R A B I L I T Y A S S E S S M E N T
Rappahannock-Rapidan Regional Hazard Mitigation Plan 2012 Section 6: Page 12
County Jurisdiction Facility Name Facility Type
Orange Orange Orange County Courthouse Government Building
Orange Multiple Locations
County Administrative Buildings Government Building
Orange Multiple Locations
County Parks & Recreation Facilities Government Building
Orange Multiple Locations County Waste Facilities Government Building
Orange Gordonsville Gordonsville Town Hall Government Building
Orange Orange Central Virginia Regional Jail Government Building
Orange Orange Orange Train Depot Other
Orange Orange Town of Orange Water Treatment Plant
Water Treatment
Orange Orange Rapidan Service Authority Water
Treatment Plant Water Treatment
Orange Orange Rapidan Service Authority
Wastewater Treatment Plant Wastewater Treatment
Orange Orange Town of Orange Wastewater Treatment Plant
Wastewater Treatment
Orange Multiple Locations
Power substations (REC, Dominion) Utility
Orange Orange Shining Stars Childcare Daycare
Orange Orange Dogwood Village Nursing Home
Orange Orange President Madison Inn Nursing Home
Orange Rapidan Holiday Home for Adults Nursing Home
Orange Gordonsville Village at Gordon House Assisted Living
Orange Orange AmeriHouse Assisted Living
Orange Orange Belleview Senior Apartments Assisted Living
Orange Orange W.A. Brockman Oil Company Fueling Station
Rappahannock Washington Sheriff's Office Police Station
Rappahannock Castleton Massanova Christian Academy School
Rappahannock Flint Hill Wakefield Country Day School School
Rappahannock Washington Rappahannock County High School
Rappahannock Washington Rappahannock Elementary School

V U L N E R A B I L I T Y A S S E S S M E N T
Rappahannock-Rapidan Regional Hazard Mitigation Plan 2012 Section 6: Page 13
County Jurisdiction Facility Name Facility Type
Rappahannock Washington Rappahannock Office of Emergency Management
Emergency Management Office
Rappahannock Washington Rappahannock County Courthouse Government Building
Rappahannock Washington Rappahannock County
Administrative Buildings Government Building
Rappahannock Washington Co 1 Fire and Rescue Fire Department
Rappahannock Flint Hill Flint Hill Volunteers Fire Fire Department
Rappahannock Sperryville Co 2 Fire and Rescue Fire Department
Rappahannock Amissville Co 3 Fire and Rescue Fire Department
Rappahannock Co 4 Fire and Rescue Fire Department
Rappahannock Castleton Co 5 Fire and Rescue Fire Department
Rappahannock Sperryville Co 7 Fire and Rescue Fire Department
Rappahannock Chester Gap Co 9 Fire and Rescue Fire Department
Rappahannock Sperryville Hearthstone School School
Rappahannock Washington Child Care and Learning Center Day Care
Rappahannock Washington Rappahannock County Co-Op Co-Op

V U L N E R A B I L I T Y A S S E S S M E N T
Rappahannock-Rapidan Regional Hazard Mitigation Plan 2012 Section 6: Page 14
FLOOD The vulnerability assessment for the flood hazard in the Rappahannock-Rapidan Region is based on two separate methodologies. The primary methodology utilized the Flood Modeling capabilities of HAZUSMH MR4, using the default data provided with HAZUSMH MR4. The basic analysis used the Flood Hazard Analysis process defined in chapter 3 of the HAZUSMH MR4 User Manual – Running HAZUS Flood with Default Data.
Table 6.3 – HAZUS Flood Hazard Analysis Process
Riverine Hazard Coastal Hazard User Data
Define Terrain (Input DEM) Define Terrain (Input DEM) Import FIT Projects, User-Defined Depth Grids,
HEC-RAS .FLT Grids Import FIT Projects, User-Defined Depth Grids
Develop Stream Network No Equivalent Create New Scenario
Select Reaches, FIT Projects, User-Defined Depth Grids, HEC-RAS Grids
Select Shorelines, FIT Projects, User-Defined Depth Grids
Hydrology No Equivalent No Equivalent Characterize Shoreline
Delineate Floodplain (Hyrdraulics Analysis) for suite, single return period, specific discharge, annualized
return periods
Delineate Floodplain (Frontal dune erosion, WHAFIS, wave runup, zone determination) for suite, single return period, annualized return
periods Develop Floodplain Depth Grid (Completed Base Hazard Analysis)
Optional Hazard Analysis Perform What If – Levee Assessment Perform What If – Flow Regulation
Perform What If – Velocity Grid
Optional Hazard Analysis Perform What If – Long-Term Erosion Perform What If – Shore Protection
For the Rappahannock-Rapidan region, the analysis consisted of a Riverine Hazard assessment only. The HAZUSMH MR4 hydraulics analysis was run for return periods of 10, 50, 100, 200 and 500 years in order to develop an annualized loss estimate for the entire region. The HAZUS Flood Model analysis returned 130 reaches in the Rappahanock-Rapidan region, which were in turn divided into six scenarios in order to minimize processing time for the hydraulics analysis. The HAZUS analysis returned an annualized loss estimate of $31,250,000 for the Rappahannock-Rapidan study region. The secondary methodology utilized for the flood hazard vulnerability assessment was a spatial analysis of the structures and floodplains in the Rappahannock-Rapidan region. Using the maps developed in the Hazard Analysis,3
At-Risk Structures
a table was created to capture the number and value of at-risk structures (Table 6.4) based on their intersection with known flood hazard boundaries.
A total of 10,141 parcels within the region have been identified through GIS analysis as intersecting with the 100-year floodplain. Of these parcels, 6,044 were identified as having
3 Maps showing the spatial extent of flooding in the Rappahannock-Rapidan Region including all five counties and the municipalities of Culpeper, Gordonsville, Warrenton, and Remington, based on floodplain data from FEMA and the localities in the region are shown under “Flood” in the Hazard Analysis section (Section 5 of this Plan).

V U L N E R A B I L I T Y A S S E S S M E N T
Rappahannock-Rapidan Regional Hazard Mitigation Plan 2012 Section 6: Page 15
improvements on the property. The total improvements on these parcels intersecting the 100-year floodplain amounted to an assessed value of $1,678,275,300. Where data was available, these parcels were further analyzed to determine if the structures on those parcels were located in the 100-year floodplain. This analysis generated a total of 1,052 structures that are located in the floodplain. These “floodplain structures” amount to an assessed value of $188,472,700.
Table 6.4 Overview of Flood Vulnerability in the Rappahannock-Rapidan Region
Jurisdiction NFIP Entry Date
Effective FIRM
Parcels Intersecting Floodplain
100-Year Floodplain (Zones AE and A)
Parcels with Structures
Intersecting Floodplain
Structures Intersecting Floodplain
Assessed Value
Annualized Losses
Culpeper County 7/1/87 6/18/07 1,422 74 108 $56,096,200 $560,962
Culpeper 3/2/89 6/18/07 505 132 154 $47,729,600 $477,296
Fauquier County 11/1/79 2/6/08 5,358 189 210 $39,207,000 $392,070
Remington 3/18/80 2/6/08 278 89 125 $6,595,600 $65,956
The Plains NP 10 0 0 $0 $0
Warrenton 8/1/79 2/6/08 149 13 29 $2,984,100 $29,841
Madison County 4/3/89 1/5/07 796 118 276 $25,338,600 $253,386
Madison NSHA None 0 0 0 $0 $0
Orange County 9/10/84 1/2/08 867 19 36 $4,692,400 $46,924
Gordonsville NP 28 5 6 $686,300 $6,863
Orange 1/2/08 1/2/08 0 0 0 $0 $0 Rappahannock County4 8/24/84
1/5/07 715 71 108 $5,142,900 $51,429
Washington 1/5/07 1/5/07 13 0 0 $0 $0
REGIONWIDE TOTALS 10,141 710 1,052 $188,472,700 $1,884,727
*Total value of all parcels intersecting the floodplain.
Annualized Losses for Flood
The HAZUSMH MR4 Flood Hazard Riverine Analysis generated an annualized loss estimate of $31,250,000 for the region. Table 6.5 shows the annualized loss estimates by county, inclusive of capital stock losses (building damage cost, contents damage cost and inventory loss) and income losses (relocation loss, capital related loss, wages losses and rental income loss).
4 The digital data layers for Rappahannock County do not overlay exactly with each other. The analysis was performed anyway, using this inaccurate data. In order to determine the flood hazard risk more accurately, better data should be developed.

V U L N E R A B I L I T Y A S S E S S M E N T
Rappahannock-Rapidan Regional Hazard Mitigation Plan 2012 Section 6: Page 16
Table 6.5 - HAZUSMH MR4 Flood Hazard Annualized Losses, by County In Thousands of Dollars
Capital Stock Losses Income Losses
County Building Damage
Contents Damage
Inventory Loss
Relocation Loss
Capital Related
Loss
Wages Losses
Rental Income
Loss
Total
Culpeper 5,642 4,732 65 1 0 7 0 10,447 Fauquier 6,472 5,441 113 2 1 11 0 12,040 Madison 1,421 1,018 14 0 0 1 0 2,454 Orange 2,140 2,410 82 0 0 7 0 4,639
Rappahannock 922 738 10 0 0 0 0 1,670 R-R Region 16,597 14,339 284 3 1 26 0 31,250
From the non-HAZUS GIS analysis, two annualized loss figures were calculated. The first figure was generated by assuming 100 percent loss to all improvements on parcels intersecting the floodplain during a 100-year flood event. This annualized loss estimate was $16,782,753. The second annualized estimate was generated by assuming 100 percent loss to all improvements on parcels with structures intersecting the floodplain during a 100-year flood event. This annualized loss estimate was $1,884,727.
National Flood Insurance Program Data
As of February 28, 2011, there were 406 properties enrolled in the National Flood Insurance Program in the Rappahannock-Rapidan Region. These policies amounted to $285,643.00 in total premiums and $10,102,390.00 in total insurance coverage (Table 6.6).
Table 6.6
National Flood Insurance Policy Information for the Rappahannock Rapidan Region
Community Name Policies in force Insurance in force, whole Premiums in force
Culpeper County 35 $9,003,100.00 $16,725.00 Culpeper 39 $9,970,500.00 $23,405.00 Fauquier County 123 $30,953,900.00 $94,970.00 Remington 46 $8,745,000.00 $36,671.00 Warrenton 24 $6,355,300.00 $19,566.00 Madison County 43 $9,423,900.00 $27,668.00 Madison 0 Orange County 51 $14,385,200.00 $23,797.00 Gordonsville 0 Orange 2 $630,000.00 $738.00 Rappahannock County 43 $11,557,000.00 $42,103.00 Washington 0 REGION TOTALS: 406 $10,102,390.00 $285,643.00 Data as of 2/28/2011

V U L N E R A B I L I T Y A S S E S S M E N T
Rappahannock-Rapidan Regional Hazard Mitigation Plan 2012 Section 6: Page 17
Repetitive Loss Properties
The identification of repetitive loss properties is an important element to conducting a local flood risk assessment, as the inherent characteristics of properties with multiple flood losses strongly suggest that they will be threatened by continual losses. Repetitive loss properties are also important to the National Flood Insurance Program, since structures that flood frequently put a strain on the National Flood Insurance Fund. Under the NFIP, FEMA defines a repetitive loss property as “any NFIP-insured property that, since 1978 and regardless of any change(s) of ownership during that period, has experienced: a) four or more paid flood losses; or b) two paid flood losses within a 10-year period that equal or exceed the current value of the insured property; or c) three or more paid losses that equal or exceed the current value of the insured property.” A strong goal of FEMA is to reduce the numbers of structures that meet these criteria, whether through elevation, acquisition, relocation or a flood control project that lessens the potential for continual losses. According to FEMA, there are currently 5 repetitive loss properties within the jurisdictions of the Rappahannock Rapidan Region (Table 6.7).5 However, because of the relatively low amount of claims paid for these properties, none of these properties are on FEMA’s national “Target 10,000” list of the most concerning repetitive loss properties in the Nation. Specific addresses of the properties shown in here are deliberately not included in this Plan as required by law.6
Table 6.7 NFIP Repetitive Loss Properties in the Rappahannock Rapidan Region
Jurisdiction Flood Zone
Number of Insured Losses
Total NFIP Claims Paid
Mitigated?
Madison AE 2 $19,668 No Madison AE 2 $38,011 No
Culpeper A 2 $46,864 No Orange A 2 $69,790 No Warrenton A 2 $15,795 No TOTAL 10 $190,131
Source: Federal Emergency Management Agency HURRICANES AND TROPICAL STORMS Historical evidence shows that the Rappahannock-Rapidan Region is vulnerable to damaging hurricane and tropical storm-force winds.7 While the Rappahannock-Rapidan region has historically seen several hurricanes pass through the region, the tropical storms generally weaken as they move over land and do not possess the same power as they do when they make landfall in more coastal areas of Virginia and the East Coast of the United States. Loss estimates for wind were developed based on probabilistic scenarios using HAZUSMH (Level 1 analysis).8
5 Data from FEMA was provided to R-RRC officials by the Virginia Division of Emergency Management.
Table 6.8 shows number of structures damaged and estimated losses for 50, 100 and 500-year return periods. In order to provide a summary of potential wind-related losses, an annualized loss estimate of $139,000 was derived from the HAZUSMH assessment.
6 NFIP repetitive loss data is protected under the federal Privacy Act of 1974 (5 U.S.C. 552a) which prohibits personal identifiers (i.e., owner names, addresses, etc.) from being published in local mitigation plans. 7 Refer to the Hazard Analysis section of this risk assessment for detailed historical information. 8 According to FEMA’s HAZUS Web site, “a Level 1 analysis yields a rough estimate based on the nationwide database and is a great way to begin the risk assessment process and prioritize high-risk communities.”

V U L N E R A B I L I T Y A S S E S S M E N T
Rappahannock-Rapidan Regional Hazard Mitigation Plan 2012 Section 6: Page 18
Table 6.8
HAZUSMH Estimates of Potential Losses for Hurricane-force Winds
Level of Event Approximate Number of Structures Damaged Estimated Losses
50-year Storm 14 $180,000 100-year Storm 33 $1,586,000 500-year Storm 1,236 $16,132,000
SEVERE THUNDERSTORMS AND TORNADOES Historical evidence shows that most of the state is vulnerable to thunderstorm and tornado activity. These particular hazards are often associated with one another, as tornadoes often result from severe thunderstorm activity. Tornadoes may also occur during a tropical storm or hurricane. However, because it cannot be predicted where thunderstorm and tornado damage may occur, the total dollar exposure figure of $13,672,365,000 for buildings and facilities within the region is considered to be exposed and could potentially be affected. For the severe thunderstorm and tornado hazards, best available data on historical hazard occurrences (limited to NOAA National Climatic Data Center records) was used to produce an annualized loss estimate of potential damages for each county. Using this data, annualized loss estimates were generated by totaling the amount of property damage for each county over the period of time for which records were available, and calculating the average annual loss. In instances where multiple counties are affected and the value for property damage reflects the total for the affected area, the average property damage for each county was calculated to produce an annualized loss estimate of potential damages for each county. Damages associated with lightning and hail activity were included in the severe thunderstorm calculations. Based on historic property damages, a regional annualized loss estimate of $351,800 was generated for severe thunderstorms. A regional annualized loss of $500,600 was generated for tornadoes.
WILDFIRE Based on information obtained from the Virginia Department of Forestry for events reported from 2005-2010 included in the Hazard Analysis section of this plan, the annualized loss for the region is $42,523. Fires that occurred on federal lands are not included in this assessment. This will lower the actual expected annualized loss for certain counties, especially those with portions of their county located in Shenandoah National Park.
DROUGHT The entire Rappahannock-Rapidan Region is vulnerable to drought. Since 1995, the counties in the Rappahannock-Rapidan region have been affected by drought on several occasions, most notably in 1999 and 2002. The National Climatic Data Center attributes nearly $140 million in crop loss to these events. However, it should be noted that those total losses are for all counties included in the NCDC database of the event and often include many counties outside of the Rappahannock-Rapidan region. In the NCDC database, the value associated with each event is not broken down by county so it is difficult to determine separate annualized losses by county. It is assumed that all buildings and facilities are exposed to drought but would experience negligible damage in the occurrence of a drought event, but crop damages would naturally suffer the greatest amount of damage. This is of particular importance to officials in this region,

V U L N E R A B I L I T Y A S S E S S M E N T
Rappahannock-Rapidan Regional Hazard Mitigation Plan 2012 Section 6: Page 19
as farming is a major industry in the region. Additionally, before this period, very little historical data exists on past drought events. Therefore it is very difficult to determine an annualized loss that can be expected for the region for drought. Based upon the events discussed in the Hazard Analysis section, the regional annualized loss estimate for the Rappahannock-Rapidan Region is $2,046,333. The majority of that value is for losses to crops and farmlands caused by drought events from 1995 to 2010. The annualized loss estimate for drought is somewhat inflated because of the unusually high periods of drought that have occurred recently and the lack of historical drought data before 1995 to counterbalance the recent events.
WINTER STORMS For the winter storm hazard, best available data on historical hazard occurrences (limited to NOAA National Climatic Data Center records) was used to produce an annualized loss estimate of potential damages for each county. Using this data, annualized loss estimates were generated by totaling the amount of property damage for each county over the period of time for which records were available, and calculating the average annual loss. In instances where multiple counties are affected and the value for property damage reflects the total for the affected area, the average property damage for each county was calculated to produce an annualized loss estimate of potential damages for each county. Unlike hazards such as tornadoes that typically impact a specific location, winter storms most often affect large geographic areas and often impact multiple counties. Based on estimated historical property damages for the Rappahannock-Rapidan Region due to winter storms, an annualized loss estimate of $167,8649
for this hazard was calculated. Potential losses may be further inflated by additional factors not represented in this estimate, such as costs associated with the removal of snow from roadways, debris clean-up, some indirect losses from power outages, etc.
A qualitative factor in terms of vulnerability to winter storms in the Rappahannock-Rapidan Region is the fact that severe winter storms occur more frequently than in other parts of the state and therefore there is, not surprisingly, a high level of awareness on the part of residents in the region in preparing for and responding to winter storm conditions in a manner that will minimize the danger to themselves and others. This heightened awareness is especially important to cutting down on the number of traffic accidents caused by negligent drivers.
EROSION Erosion vulnerability for the region is difficult to determine because there are no historical records for previous occurrences of erosion events. Vulnerability is limited to areas along rivers, creeks and streams to areas of steep slopes. Future updates to this Plan will attempt to address erosion vulnerability in greater detail.
EARTHQUAKES According to the maps in the Hazard Analysis section, the region’s risk to earthquakes can be considered limited; however, the risk of potential losses should a significant earthquake event occur—for example an earthquake registering 8.5 on the Richter Scale—is considered to be moderate. Still, USGS Earthquake Search reports just five measurable earthquakes in the
9 The winter storm annualized loss estimate includes damages associated with nor’easters.

V U L N E R A B I L I T Y A S S E S S M E N T
Rappahannock-Rapidan Regional Hazard Mitigation Plan 2012 Section 6: Page 20
region since 1974, all with magnitude less than 3.2 on the Richter Scale. Using HAZUSMH MR4’s probabilistic earthquake modeling program, an annualized loss estimate of $240,000 was derived for the Rappahannock-Rapidan region. The August 23, 2011 earthquake had an epicenter in Mineral, Louisa County, Virginia, located outside of the Rappahannock-Rapidan region. Damages were most severe in Louisa County, but there were significant damages in Culpeper and Orange counties, resulting in FEMA identifying those counties as eligible for Individual Assistance on December 29, 2011.
SINKHOLES
Any damage resulting from a sinkhole or landslide would be localized and, due to the uniform nature of risk to these hazards on a countywide scale, it is not possible to generate maps or tables showing potential loss estimates or particularly at-risk structures or properties. Because sinkholes have occurred in the region in the past, it can be expected that they will occur again in the future, however, vulnerability is considered to be negligible because these events are very random and do not effect a large area.
LANDSLIDES
There is no simple methodology in place for determining the region’s vulnerability to landslides. The maps in Section 5 provide a general indication of the areas that could expect to experience a landslide, however, it is extremely difficult to determine the number of buildings and people at risk. Future updates of this Plan will explore this landslide vulnerability is greater detail. However, as a result of the June 27, 1995 storm that wreaked havoc in Madison County, the United States Geological Survey (USGS) conducted a survey that analyzed the damage caused by that storm and did a limited amount of project areas of potential future damages (See Figure 6.9). This report can be obtained from the USGS or online at http://geohazards.cr.usgs.gov/pubs/ofr/97-438/97-438.html.

V U L N E R A B I L I T Y A S S E S S M E N T
Rappahannock-Rapidan Regional Hazard Mitigation Plan 2012 Section 6: Page 21
Figure 6.7 USGS Landslide Study for Madison County

V U L N E R A B I L I T Y A S S E S S M E N T
Rappahannock-Rapidan Regional Hazard Mitigation Plan 2012 Section 6: Page 22
DAM/LEVEE FAILURE Figure 6.8 shows the location of dams in the Rappahannock-Rapidan Region in relation to population density. Whereas this may not support any conclusive correlation between dam breaches or failures and affected populations, it does aid the planning process by visually placing all known state-regulated dams in direct relationship to population distribution. Future updates of the Plan may include a detailed analysis of the property directly downstream of the high hazard dams in order to better determine the amount of property vulnerable to a dam breach.
FUTURE VULNERABILITY
Portions of the Rappahannock-Rapidan Region are experiencing rapid development as the Washington, DC metropolitan area continues to move westward. The vulnerability of future buildings, infrastructure and critical facilities is a great concern to community leaders across the region. As discussed in the Capability Assessment section of this Plan, many of the day-to-day activities in local governments in the region are designed to deal with these challenges.
Land uses and development trends in the region are briefly discussed in this section and in the Community Profile. Future Plan updates will address development trends and future vulnerability (to include the number and types of future buildings, infrastructure, and critical facilities located in the identified hazard areas) in more detail, in particular for hazards with a spatially defined hazard boundary, such as flood.
UNIQUE RISKS FOR LOCAL JURISDICTIONS Four jurisdictions – the Town of Orange (2005), Rappahannock County (2005), Culpeper County (2012) and the Town of Culpeper (2012) identified unique risks as part of the Hazard Mitigation planning process. These risks are summarized below.
Jurisdiction: Town of Orange Unique Hazards:
• Railroad goes right through the middle of East Main Street. Various chemicals and hazardous materials are transported by train frequently.
• Natural Gas Plant in Unionville (piped throughout county) • Proximity to North Anna Nuclear Power Plant • Interstate corridor (Interstates 64 and 95) increases truck traffic
Populations at Risk: The entire population – dependent on type of chemical or event and wind direction. Special Populations at Risk: Nursing residents, senior citizens, mental health assisted facility Property at Risk: There are approximately thirty businesses in downtown that are vulnerable to the railroad. For all the other hazards, the entire county and all the property within the county are at risk to the listed unique hazards.

Dam Hazard & VulnerabilityRappahannock-Rapidan Regional Hazard Mitigation PlanDam Inventory and Hazard Source: HAZUS MH MR4, VA DCRHazard Data is based on Virginia Department of Conservationand Recreation databasePopulation Data Source: 2010 U.S. Census
Dam ClassificationDCR Regulation & Hazard
HighSignificantLowNon-Regulated Dam
0 5 10 15 20Miles
Map created for Rappahannock-Rapidan Regional Hazard MitigationPlan Update and is intended for general planning purposes only. Datais from various sources and may vary in accuracy and completeness.Date: 6/2/2011 File: Dam_Vulnerability.mxd
Figure 6.8
Census Block GroupsPOPULATION / SQMI2
< 5050 - 100100 - 250250 - 500> 500

V U L N E R A B I L I T Y A S S E S S M E N T
Rappahannock-Rapidan Regional Hazard Mitigation Plan 2012 Section 6: Page 23
Officials from Madison and Rappahannock Counties also wished to note an increase of their wildfire hazard risk ranking from “Low” to “High.”
Jurisdiction: Rappahannock County Unique Hazard: The presence of Shenandoah National Park means that wildfire is both a heightened risk as well as an unmanageable one. Populations at Risk: The entire population (approximately 300-500 people) along the Western border of the County. 1/5 of the County is in the park. Special Populations at Risk: None Property at Risk: 125 houses, valued at approximately $16 million, 50 commercial structures valued at approximately $12 million
Jurisdiction: Culpeper County Unique Hazards:
• Earthquake Populations at Risk: The entire population Special Populations at Risk: All populations are at risk. Property at Risk: In response to the August 23, 2011 earthquake and associated damage, Culpeper County officials identified the earthquake hazard as a high-risk hazard in the county.
Jurisdiction: Town of Culpeper Unique Hazards:
• Dams at Lake Pelham and Mountain Run Lake Populations at Risk: Town of Culpeper, portions of Culpeper County Special Populations at Risk: Aging population, Assisted Living facilities Property at Risk: Town estimates commercial and residential structures at risk to be 1,048. Cost would require additional study. Key Facilities/Infrastructure at Risk: Town of Culpeper Water Treatment and Wastewater Treatment facilities and electric utilites

V U L N E R A B I L I T Y A S S E S S M E N T
Rappahannock-Rapidan Regional Hazard Mitigation Plan 2012 Section 6: Page 24
Table 6.9 Summary of Potential Annualized Losses
(From Quantitative Assessment)
Hazard Estimated Annualized Losses
Drought $2,046,333 Flood $1,884,727* Tornades $500,600 Severe Thunderstorms (includes Lightning & Hail) $351,800 Earthquakes $240,000 Winter Storms $167,864 Hurricanes $139,000 Wildfire $42,522** Sinkholes Unknown Landslides Unknown Erosion Unknown Dam/Levee Failure Unknown
*Table includes flood hazard estimate generated by non-HAZUS GIS analysis (see Section 6, page 13) **Virginia DOF estimates indicate that over $11,000,000 in property is saved annually as a result of DOF fire response in the Rappahannock-Rapidan region Based upon the qualitative approach defined in detail under Methodologies Used, the risk from natural hazards in the Rappahannock-Rapidan Region was weighed by the Mitigation Advisory Committee and criteria was used to assign values to the likelihood of occurrence, spatial extent affected, and potential impact of each hazard. These values combined to form a total rating for each hazard (Table 6.9). The top three hazards identified through this process are flood, hurricanes and tropical storms and winter storms.
Table 6.10 Hazard Risk Ratings
(From Qualitative Assessment)
Hazard Likelihood Spatial Extent Potential Impact
HAZARD RATING
Flood Highly Likely (3) Moderate (2) Critical (3) 8 Hurricanes and Tropical Storms Possible (1) Large (3) Critical (3) 7 Winter Storms Likely (2) Large (3) Limited (2) 7 Severe Thunderstorms and Tornadoes
Highly Likely (3) Small (1) Limited (2) 6
Drought Possible (1) Large (3) Limited (2) 6 Wildfire Highly Likely (3) Moderate (2) Minor (1) 6 Earthquakes Possible (1) Large (3) Minor (1) 5 Dam/Levee Failure Possible (1) Moderate (2) Limited (2) 5 Landslides Likely (2) Small (1) Minor (1) 4 Erosion Likely (2) Small (1) Minor (1) 4 Sinkholes Possible (1) Small (1) Minor (1) 3

V U L N E R A B I L I T Y A S S E S S M E N T
Rappahannock-Rapidan Regional Hazard Mitigation Plan 2012 Section 6: Page 25
The conclusions drawn from the qualitative and quantitative assessments, combined with final determinations from the Mitigation Advisory Committee, were fitted into three categories for a final summary of hazard risk based on High, Moderate or Low designations (Table 6.11). The three high-risk hazards identified through this process are the flood, the hurricane and tropical storm, and the winter storm hazard. The three moderate-risk hazards identified are the drought, severe thunderstorm and tornadoes and wildfire hazards. All other hazards are classified as low risk.10
Table 6.11 Estimated Risk Levels for the Rappahannock-Rapidan Region
(Combination of Qualitative and Qualitative Assessments)
HIGH RISK HAZARDS Flood
Hurricanes and Tropical Storms Winter Storms
MODERATE RISK HAZARDS Drought
Severe Thunderstorms and Tornadoes Wildfire
LOW RISK HAZARDS
Earthquakes Sinkholes, Landslides Dam/Levee Failure
Erosion
It should be noted that although some hazards may show Moderate or Low risk, hazard occurrence is still possible. Also, any hazard occurrence could potentially cause a sizable impact and losses could be extremely high (i.e., an F5 tornado or a destructive earthquake).
10 Human caused hazards have been similarly ranked in Appendix E.

CAPAB IL ITY ASSESSMENT
PURPOSE The Rappahannock‐Rapidan region's capability assessment was conducted to determine the ability of participating localities to develop and implement a comprehensive hazard mitigation strategy and to identify opportunities, or needs, to establish or enhance specific policies, programs or projects. The assessment was used to determine the feasibility of achieving proposed goals and objectives based on an understanding of the organizational capacity of those agencies or departments tasked with their implementation. By inventorying each jurisdiction's relevant ordinances, programs and policies it was possible to determine local capabilities and identify gaps, shortfalls and weaknesses that might compromise effective hazard mitigation. In addition, proven programs of verifiable benefit were identified and targeted for continued support and possible enhancement. The assessment helped determine the practicality of specific mitigation actions and the likelihood of their implementation in consideration of a local government's planning and regulatory framework, level of administrative and technical support, amount of fiscal resources and current political climate. Coupled with the Risk Assessment, the Capability Assessment helped identify and refine appropriate mitigation actions for incorporation into the Mitigation Strategy section of the Hazard Mitigation Plan and ensured that specific goals and objectives are realistically achievable.
PROCEDURE For the 2012 plan update, the Hazard Mitigation Committee and RRRC staff reviewed and revised the inventory of local plans, regulations and ordinances developed in the 2005 Hazard Mitigation Plan (table 7.1). A description of the 2005 Capability Assessment Survey can be found below:
In order to facilitate the inventory and analysis of local government capabilities throughout the Rappahannock‐Rapidan Region, a detailed Capability Assessment Survey was distributed to the participating Rappahannock‐Rapidan Region local municipal jurisdictions, including five counties and six towns. The survey questionnaire, which was completed by applicable local government officials, requested information on a variety of “capability indicators” such as existing local plans, policies, programs or ordinances that contribute to and/or hinder the community’s ability to implement hazard mitigation actions. Other indicators included information related to each jurisdiction’s fiscal, administrative and technical capabilities such as access to local budgetary and personnel resources for mitigation purposes.
Participating jurisdictions were also given the opportunity to provide additional information for the capability assessment through four worksheets developed specifically for the 2012 plan update. These worksheets requested information on each locality’s regulatory capabilities,

C A P A B I L I T Y A S S E S S M E N T
Rappahannock-Rapidan Regional Hazard Mitigation Plan 2012 Section 7: Page 2
administrative/technical resources, fiscal resources and additional local capabilities. Copies of the worksheets can be found in Appendix C: Supporting Documentation.
FINDINGS Findings are summarized as follows. Information is presented based on the five categories of local capability:
Planning and Regulatory Capability
Emergency Management
General Planning
Floodplain Management
Administrative/Technical Capability
Fiscal Capability
Planning and Regulatory Capability
Planning and regulatory capability is demonstrated by the formulation and implementation of plans, ordinances, programs and policies by a jurisdiction that reflects commitment to responsible growth and land management with a clear focus on community safety and welfare. Along with effective land use and transportation planning, capability is expressed by the presence and enforcement of comprehensive zoning and subdivision ordinances and building codes, as well as effective emergency response and mitigation planning. Attention to, and protection of, environmental, historical and cultural resources are additional elements of demonstrated capability. This assessment provides an overview of the key planning and regulatory tools and programs in place, or under development, in the Rappahannock‐Rapidan region. Along with identifying potential effects on loss reduction, this information will help determine opportunities to address existing gaps, weaknesses or conflicts among existing strategies and will facilitate integrating this plan with existing planning mechanisms. Table 7‐1 provides a summary of the relevant tools already adopted or being developed by the Rappahannock‐Rapidan region’s participating local governments.

C A P A B I L I T Y A S S E S S M E N T
Rappahannock-Rapidan Regional Hazard Mitigation Plan 2012 Section 7: Page 3
Table 7‐1 Relevant Plans, Ordinances, and Programs
Jurisdiction
Nat
ional
Flo
od In
sura
nce
Pro
gram
NFIP
Com
munit
y Rat
ing
Syst
em
Haz
ard
Mit
igat
ion P
lan
Dis
aste
r R
ecov
ery
Pla
n
Com
preh
ensi
ve L
and U
se P
lan
Flo
odpla
in M
anag
emen
t Pla
n
Stor
mw
ater
Man
agem
ent
Pla
n
Emer
gency
Oper
atio
ns
Pla
n
Con
tinuit
y of
Oper
atio
ns
Pla
n
Rad
iolo
gica
l Em
erge
ncy
Pla
n
SAR
A T
itle
III P
lan
Evac
uat
ion P
lan
Tra
nsp
orta
tion
Pla
n
Cap
ital
Impro
vem
ents
Pla
n
His
tori
c Pre
serv
atio
n P
lan
Zonin
g O
rdin
ance
Subdiv
isio
n O
rdin
ance
Flo
od D
amag
e Pre
venti
on O
rdin
ance
Buildin
g C
ode
Fir
e C
ode
Rip
aria
n B
uff
er/
Wet
land
Pre
serv
atio
n
Non
-Gov
ernm
enta
l O
rgan
izat
ion
Open
Spac
e Pre
serv
atio
n
Public/
Pri
vate
Par
tner
ship
s
Culpeper County – xx X X Δ X X X X X X X X X X X X X
Town of Culpeper ‐ xx X X Δ X X X ● ● ● ● X X X X X X ● Δ X
Fauquier County ‐ xx X X X X X X X X X X X X X X X X X X X X X X
Town of Warrenton – xx X X X X X ● X X X X X X X X X
Town of Remington – xx X X X X X Δ ● ● ● ● ● X X X ● ● X
Madison County ‐ xx X X X X X X X X X X X X X X
Town of Madison ‐ xx X X ● ● ● ● ● X X X ● ●
Orange County ‐ xx X X Δ X X Δ X X X X X X X X X X X X X
Town of Orange ‐ xx X x X Δ ● ● X X X X ● ●
Rappahannock County X X X X X X X X X X X X X X X X
X – in place and being implemented, or being developed Δ ‐ Use State Plan ● ‐ Use County Plan/Ordinance
Emergency Management
Hazard mitigation is recognized as one of the four primary aspects of emergency management. Others are preparedness, response and recovery. All are interconnected and interdependent, as indicated by Figure 7‐1. Planning for each aspect is critical to the development of a comprehensive emergency management program and key to the successful implementation of hazard mitigation actions. Hazard Mitigation Plan – A community's blueprint for reducing the impact of natural and human‐caused hazards on people and the built environment. The essential elements of a hazard mitigation plan include a risk assessment, capability assessment and mitigation strategy. The Rappahannock‐Rapidan region's first All Hazard Mitigation Plan was adopted in 2005. Since

C A P A B I L I T Y A S S E S S M E N T
Rappahannock-Rapidan Regional Hazard Mitigation Plan 2012 Section 7: Page 4
then it has been maintained and implemented by the Rappahannock‐Rapidan Regional Commission and each of the participating localities.
Disaster Recovery Plan ‐ guides the physical, social, environmental and economic recovery and reconstruction process following a disaster. Often, hazard mitigation principles and practices are incorporated into local disaster recovery plans to capitalize on opportunities to break the cycle of repetitive disaster losses.
Survey results indicate that only three of the jurisdictions have their own disaster recovery plan, three reference the state plan and the remaining jurisdictions do not have a disaster recovery plan. All localities should consider whether to develop their own disaster recovery plan that would incorporate mitigation opportunities into the disaster recovery process.
Emergency Operations Plan – Includes detailed responsibilities and procedures to be followed to deploy resources in response to an emergency or disaster. Periodic review and update of emergency operations plans assures improved readiness. Focusing on preparedness and response, rather than hazard mitigation, emergency operations planning has been determined to have a moderate effect on loss reduction.
Each of the five counties in the Rappahannock‐Rapidan Region Emergency Management maintains its own emergency operations plan that also covers their respective jurisdictions.
Continuity of Operation Plan: Establishes a chain of command, line of succession, and plans for backup or alternate emergency response resources in case of an extreme emergency. Developing a continuity of operation plan is an example of hazard mitigation.
With the development of a continuity of operations plan by Culpeper County since the original plan was written, the region now has three jurisdictions with such a plan in place. Each of the other jurisdictions is encouraged to consider preparing their own continuity of operations plans as a possible mitigation action for inclusion this Plan.
Radiological Emergency Plan: Delineates roles and responsibilities for assigned personnel and the means to deploy resources in the event of a radiological accident.
Four of the five counties in the Rappahannock‐Rapidan Region have a radiological emergency plan. Three towns rely on their respective county plans. One county and two towns do not have a plan.
SARA Title III Emergency Response Plan: Outlines the procedures to be followed in the event of a chemical emergency such as the accidental release of toxic substances. These plans are required by federal law under Title III of the Superfund Amendments and Re‐authorization Act (SARA), also known as the Emergency Planning and Community Right‐to‐Know Act (EPCRA).

C A P A B I L I T Y A S S E S S M E N T
Rappahannock-Rapidan Regional Hazard Mitigation Plan 2012 Section 7: Page 5
Culpeper County is now included in the number of jurisdictions within the region that have a SARA Title III Emergency Response Plan, bringing the total to all five. One town has its own plan, one relies on the county and two do not have a plan.
General Planning
The development and implementation of effective hazard mitigation plans and activities routinely involves agencies, organizations and individuals beyond the emergency management profession. Additional stakeholders may include local planners, public works officials, economic development specialists and others. Because concurrent local planning efforts often address hazard mitigation goals, the Capability Assessment Survey included questions regarding each jurisdiction’s general planning capabilities and the degree to which hazard mitigation is integrated into other ongoing planning efforts. Comprehensive Land Use Plan: Establishes the overall vision for a community and serves as a guide for future decision making. Typically, a comprehensive plan includes a summary of current and expected demographic conditions, land use patterns, transportation networks and facilities and community resources. The integration of hazard mitigation measures into the comprehensive plan can greatly enhance the likelihood of achieving risk reduction goals, objectives and actions.
As required by the Commonwealth, all jurisdictions within the region have a comprehensive land use plan.
Capital Improvements Plan: Guides the scheduling of spending for public improvement projects. A capital improvements plan can serve as an important mechanism to guide future development away from identified hazard areas. Limiting public spending in hazardous areas is one of the most effective long‐term mitigation actions available to local governments.
Four of the five counties in the Rappahannock‐Rapidan region maintain Capital Improvements Plans. Of the participating towns, the Town of Culpeper and Town of Orange also have adopted Capital Improvements Plans.
Historic Preservation Plan: Guides the impact of community decisions on historic structures or districts within a community. An often overlooked aspect of the historic preservation plan is the assessment of buildings and sites located in areas subject to natural hazards to identify the most effective way to reduce future damage.1 Effective strategies may involve relocation or retrofits to protect buildings that do not meet current standards buildings and/or are within a historic district and cannot be moved.
All five counties in the Rappahannock‐Rapidan region have historic preservation plans and/or ordinances in place. Three of the five participating towns also have such plans in place.
1 See Protecting the Past from Natural Disasters. 1989. Nelson, Carl. National Trust for Historic Preservation: Washington D.C.

C A P A B I L I T Y A S S E S S M E N T
Rappahannock-Rapidan Regional Hazard Mitigation Plan 2012 Section 7: Page 6
Zoning Ordinance: Protects public health, safety and welfare by regulating the location, type and density of development occurring within a jurisdiction. A powerful planning tool, a zoning ordinance can effectively eliminate development in identified hazard areas.
All participating jurisdictions have a zoning ordinance. Subdivision Ordinance: Regulates residential, commercial and industrial development along with associated infrastructure. Subdivision design that accounts for natural hazards can dramatically reduce impacts to development.2
All participating jurisdictions have a subdivision ordinance. Building Codes, Permitting and Inspections: Regulate construction standards by reviewing plans, issuing permits and inspecting for compliance. Decisions regarding the adoption of building codes that account for hazard risk, the permitting process required both before and after a disaster, and the enforcement of inspection protocols all affect the level of hazard risk faced by a community.
All five counties have a building code, one town has its own building code, and four towns use their respective county’s code.
The adoption and enforcement of building codes by local jurisdictions are routinely assessed through the Building Code Effectiveness Grading Schedule (BCEGS) program developed by the Insurance Services Office, Inc. (ISO).3 Assessment results are provided to ISO’s member private insurance companies, which in turn, may offer ratings credits for new buildings constructed in communities with strong BCEGS classifications. Communities with well‐enforced, up‐to‐date codes typically have fewer losses, reflected in lower insurance rates. Personnel qualifications, continuing education opportunities and number of inspections conducted daily are included in the assessment which determines a jurisdiction's grade. Grades range from 1 to 10, with the lower grade preferred. A BCEGS grade of 1 represents exemplary commitment to building code enforcement, and a grade of 10 indicates less than minimum recognized protection. Table 7.2 lists the BCEGS ratings for the jurisdictions in the region.
2 For additional information regarding the use of subdivision regulations in reducing flood hazard risk, see Subdivision Design in Flood Hazard Areas. 1997. Morris, Marya. Planning Advisory Service Report Number 473. American Planning Association: Washington D.C. 3 Participation in BCEGS is voluntary and may be declined by local governments if they do not wish to have their local building codes evaluated.
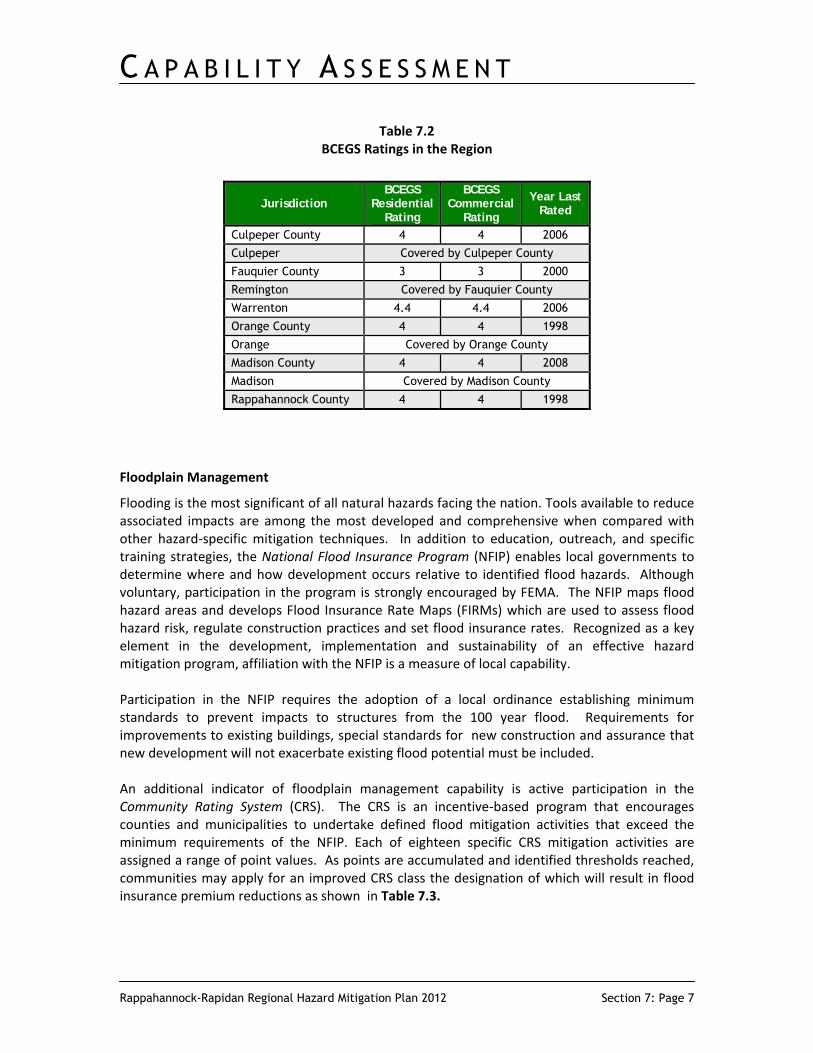
C A P A B I L I T Y A S S E S S M E N T
Rappahannock-Rapidan Regional Hazard Mitigation Plan 2012 Section 7: Page 7
Table 7.2 BCEGS Ratings in the Region
Floodplain Management
Flooding is the most significant of all natural hazards facing the nation. Tools available to reduce associated impacts are among the most developed and comprehensive when compared with other hazard‐specific mitigation techniques. In addition to education, outreach, and specific training strategies, the National Flood Insurance Program (NFIP) enables local governments to determine where and how development occurs relative to identified flood hazards. Although voluntary, participation in the program is strongly encouraged by FEMA. The NFIP maps flood hazard areas and develops Flood Insurance Rate Maps (FIRMs) which are used to assess flood hazard risk, regulate construction practices and set flood insurance rates. Recognized as a key element in the development, implementation and sustainability of an effective hazard mitigation program, affiliation with the NFIP is a measure of local capability. Participation in the NFIP requires the adoption of a local ordinance establishing minimum standards to prevent impacts to structures from the 100 year flood. Requirements for improvements to existing buildings, special standards for new construction and assurance that new development will not exacerbate existing flood potential must be included. An additional indicator of floodplain management capability is active participation in the Community Rating System (CRS). The CRS is an incentive‐based program that encourages counties and municipalities to undertake defined flood mitigation activities that exceed the minimum requirements of the NFIP. Each of eighteen specific CRS mitigation activities are assigned a range of point values. As points are accumulated and identified thresholds reached, communities may apply for an improved CRS class the designation of which will result in flood insurance premium reductions as shown in Table 7.3.
Jurisdiction BCEGS
Residential Rating
BCEGS Commercial
Rating
Year Last Rated
Culpeper County 4 4 2006
Culpeper Covered by Culpeper County
Fauquier County 3 3 2000
Remington Covered by Fauquier County
Warrenton 4.4 4.4 2006
Orange County 4 4 1998
Orange Covered by Orange County
Madison County 4 4 2008
Madison Covered by Madison County
Rappahannock County 4 4 1998

C A P A B I L I T Y A S S E S S M E N T
Rappahannock-Rapidan Regional Hazard Mitigation Plan 2012 Section 7: Page 8
Table 7‐3 CRS Premium Discounts, By Class
CRS Class Premium Reduction
1 45%
2 40%
3 35%
4 30%
5 25%
6 20%
7 15%
8 10%
9 5%
10 0
Source: FEMA
Participation in the CRS is voluntary. Any community that is in full compliance with the rules and regulations of the NFIP may apply to FEMA for a CRS classification better than class 10.
There are currently no CRS communities in the Rappahannock‐Rapidan Region. Floodplain Management Plan: Provides a framework for the development and implementation of corrective and preventative measures to reduce flood‐related impacts.
Several of the participating jurisdictions have Floodplain Management Plans in place, while others have specific references to floodplains within their respective local ordinances.
Stormwater Management Plan: Addresses flooding associated with stormwater runoff and is focused on the design and implementation of construction practices to reduce the impact of urban flooding.
Two counties and one town have local stormwater management regulations in place, with one other county and two towns governed by state‐level stormwater management regulations.
Administrative and Technical Capability
The ability of a locality to develop and implement mitigation projects, policies and programs is related directly to its capacity to dedicate staff time and resources to those purposes. Administrative capability is demonstrated by the identification of sufficient, qualified personnel, effective and efficient assignment of tasks, and comprehensive program oversight. Effective Inter‐departmental and intergovernmental communication and cooperation also reflects administrative capability. Technical capacity and capability is determined by evaluating specific knowledge and skills, as well as the assessment of appropriate certifications and licensing requirements.

C A P A B I L I T Y A S S E S S M E N T
Rappahannock-Rapidan Regional Hazard Mitigation Plan 2012 Section 7: Page 9
In general, the counties in the region have a high level of administrative and technical capability, through administrative, emergency management, building and planning/zoning staff. It should be noted that, in the region, only Fauquier County has a dedicated floodplain manager, though the other counties have staff with floodplain management capabilities. In general, the larger towns (Culpeper, Orange, Warrenton) are able to provide administrative and technical oversight via their own staff, but the smaller towns (Madison, Remington, The Plains, Washington) rely heavily on their respective county staffs for technical assistance.
Fiscal Capability
The level of funding available determines a locality's ability to develop and implement policies and projects in all areas of interest and responsibility. Costs associated with hazard mitigation planning and program development vary widely from funds needed to meet staffing requirements to those for the acquisition of costly equipment and, sometimes, flood‐prone homes. Often, substantial commitments are needed from local, state and federal sources. Grant writing and administration is a key component towards implementation of local and regional mitigation strategies. In general, jurisdictions in the Rappahannock‐Rapidan region rely on staff to identify, develop and administer grants for identified projects in their localities. Most of these staff members also have other primary job functions, in addition to their grant responsibilities. The Rappahannock‐Rapidan Regional Commission offers grant‐writing and administrative assistance to its member jurisdictions and also facilitates inter‐jurisdictional grant efforts, as applicable. While most of the counties and larger towns in the Rappahannock‐Rapidan region have the technical expertise to carry out large scale grant‐funded projects, local matching funds can be difficult to secure. Given the economic climate during the past 5 to 7 years, local matching funds are stretched even further. The smaller towns in the region have limited budgets and limited staff and would be unlikely to meet mitigation grant matching requirements.

MITIGATION STRATEGY
INTRODUCTION A mitigation strategy provides participating localities with the basis of actions for reducing the impacts of identified hazards. Based on the findings of the Risk Assessment and the Capability Assessment, the mission statement, goals and actions that follow are intended to guide both the day‐to‐day operations and the long‐term approach taken by counties and towns to reduce the impacts of hazards. Components of the Mitigation Strategy include:
Mitigation Goals;
Identification and Analysis of Mitigation Measures; and
Mitigation Action Plan
The R‐RRC Hazard Mitigation Plan, as revised, continues to be both comprehensive and strategic. The plan includes a thorough review of identified hazards and targets policies and projects that will reduce future impacts and assist the region, and its localities, in achieving compatible economic, environmental and social goals. In addition, the plan links policies and project to agencies, departments or individuals responsible for their implementation. When possible, funding sources to be used in project implementation are identified. The Mitigation Action Plan (MAP) lists specific tactics, including descriptions, those responsible for implementation, potential funding sources, and estimated completion dates. This format provides a comprehensive checklist that can be used as a monitoring tool and ready reference of proposed policies and projects. Planning Approach The Plan follows a traditional planning approach, beginning with a mission statement that provides the overall guiding principle, goals designed to meet the intent of the mission statement, and mitigation actions which include policies or projects designed to reduce the impacts of future hazard events. Each step provides a clearly defined set of policies and projects based on a rational framework for action. The components of the planning framework are as follows: Mission Statement: Provides the guiding principle of the Hazard Mitigation Plan. Goals: Provide the framework for achieving the intent of the mission
statement. Hazard Mitigation Policies: Proposed actions agreed to by members of the Planning Team. Hazard Mitigation Projects: Specific actions to address defined vulnerabilities to existing
buildings or systems; potential funding sources are included. Mitigation Action Plan: Prioritized listing of policies and projects, including mitigation
techniques, hazards addressed, individual or organization

M I T I G A T I O N S T R A T E G Y
Rappahannock-Rapidan Regional Hazard Mitigation Plan 2012 Section 8: Page 2
responsible for implementation, estimated completion date, and potential funding source(s).
MISSION STATEMENT Reduce the impacts, both physical and monetary, of natural hazards on the jurisdictions within the Rappahannock‐Rapidan Region through effective hazard mitigation techniques.
MITIGATION GOALS The goals listed below are the result of an inclusive planning process described in Section 2. The goals were created as part of a brainstorming session, where county and municipal representatives agreed upon broad mitigation categories that provided the basis for the formulation of regional mitigation goals. Mitigation categories and goal statements are listed below:
Mitigation Categories
The categories developed at the regional Mitigation Strategy Workshop were evaluated, commonalities were identified across counties, and goal statements were developed that encompass the Rappahannock‐Rapidan Region. These goal statements are:
Mitigation Goals
Goal #1: Improve and update data needed for hazard mitigation purposes within the Rappahannock‐Rapidan Regional Commission and local jurisdiction offices. Goal #2: Implement policies that incorporate mitigation planning into the framework of local government in the Rappahannock‐Rapidan Region. Goal #3: Implement sound planning techniques throughout the region that compliment the benefits of hazard mitigation. Goal #4: Implement cost effective structural projects throughout the region to reduce the impact of future disaster events. Goal #5: Conduct training throughout the region for employees to improve response capabilities of local emergency management officials and to educate local officials of benefits of hazard mitigation techniques. Goal #6: Implement meaningful education and outreach projects throughout the region to educate the public about the dangers of natural hazards and how they can protect their families and their property. Goal #7: Improve regional evacuation capabilities and plan for the potential impacts of a potential evacuation of the Washington D.C. area.
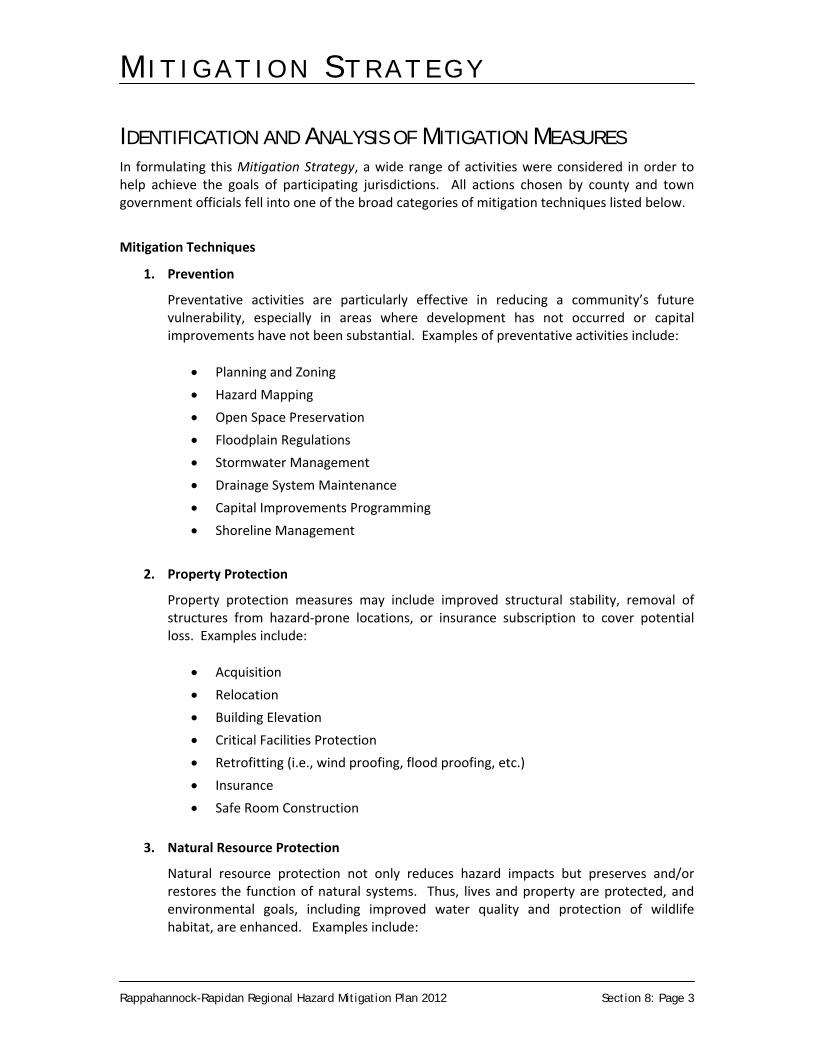
M I T I G A T I O N S T R A T E G Y
Rappahannock-Rapidan Regional Hazard Mitigation Plan 2012 Section 8: Page 3
IDENTIFICATION AND ANALYSIS OF MITIGATION MEASURES In formulating this Mitigation Strategy, a wide range of activities were considered in order to help achieve the goals of participating jurisdictions. All actions chosen by county and town government officials fell into one of the broad categories of mitigation techniques listed below.
Mitigation Techniques
1. Prevention
Preventative activities are particularly effective in reducing a community’s future vulnerability, especially in areas where development has not occurred or capital improvements have not been substantial. Examples of preventative activities include:
Planning and Zoning
Hazard Mapping
Open Space Preservation
Floodplain Regulations
Stormwater Management
Drainage System Maintenance
Capital Improvements Programming
Shoreline Management
2. Property Protection
Property protection measures may include improved structural stability, removal of structures from hazard‐prone locations, or insurance subscription to cover potential loss. Examples include:
Acquisition
Relocation
Building Elevation
Critical Facilities Protection
Retrofitting (i.e., wind proofing, flood proofing, etc.)
Insurance
Safe Room Construction
3. Natural Resource Protection
Natural resource protection not only reduces hazard impacts but preserves and/or restores the function of natural systems. Thus, lives and property are protected, and environmental goals, including improved water quality and protection of wildlife habitat, are enhanced. Examples include:

M I T I G A T I O N S T R A T E G Y
Rappahannock-Rapidan Regional Hazard Mitigation Plan 2012 Section 8: Page 4
Floodplain Protection
Riparian Buffers
Fire Resistant Landscaping
Erosion and Sediment Control
Wetland Restoration
Habitat Preservation
Slope Stabilization
4. Structural Projects
Structural mitigation projects reduce hazard impacts by modifying the environment or hardening structures. Examples include:
Reservoirs/Dam Stabilization
Detention and Retention Basins
Channel Modification/Stabilization
Storm Sewer Construction/Maintenance
5. Emergency Services
Although not typically considered a mitigation technique, emergency services minimize the impact of a hazard on people and property. Actions taken immediately prior to, during, or in response to a hazard event include:
Warning Systems
Search and Rescue
Evacuation Planning and Management
Flood Mitigation Techniques
6. Public Information and Awareness
Public Information and awareness activities are used to advise residents, business owners, potential property buyers and visitors about hazards and mitigation techniques they can use to protect themselves and their property. Examples of measures used to educate and inform the public include:
Outreach and Education
Training
Speaker Series, Demonstration Events
Property Disclosure
Hazard Expositions

M I T I G A T I O N S T R A T E G Y
Rappahannock-Rapidan Regional Hazard Mitigation Plan 2012 Section 8: Page 5
MITIGATION ACTION PLAN The mitigation actions developed and adopted by participating jurisdictions are listed in Appendix A, Locally‐specific Mitigation Actions. Figure 8.1 represents the general format in which each mitigation action was recorded. Each action was designed to achieve the goals identified in the R‐RRC Mitigation Strategy. Each jurisdiction’s mitigation actions form the basis of their Mitigation Action Plan. By identifying specific projects and policies, the Mitigation Action Plans provide the framework for participating localities to engage in distinct actions that will reduce the impacts of future hazard events and disasters.
Figure 8.1
Mitigation Action Worksheet
Mitigation Action
a. Community Name:
b. Action Item (Describe):
c. Hazard(s):
d. Lead Agency/ Department Responsible:
e. Estimated Cost:
f. Funding Method: (General Revenue, Contingency/ Bonds, External Sources, etc.)
g. Implementation Schedule:
h. Priority:
a. Community Name
b. Action Item: Identify and describe specific actions that, if accomplished, will reduce vulnerability and risk in the impact area. Actions should match mitigation goals.
c. Hazard(s): Describe/list hazard(s) the action attempts to mitigate.
d. Lead Agency/ Department Responsible: Identify the local agency, department or organization best suited to accomplish this action.
e. Estimated Cost: If applicable, estimate the cost to accomplish the mitigation action.
f. Funding Method: If applicable, indicate how the action will be funded; funds may be provided from existing operating budgets (General Revenue), a previously established contingency fund (Contingency/ Bonds), or a federal or state grant (External Sources).

M I T I G A T I O N S T R A T E G Y
Rappahannock-Rapidan Regional Hazard Mitigation Plan 2012 Section 8: Page 6
g. Implementation Schedule: Indicate when the action will begin, and when it is expected to be completed.
h. Priority: Indicate whether the action is a 1) High priority – short‐term immediate – reducing overall risk to life and property; 2) Moderate priority – an action that should be implemented in the near future due to political or community support or ease of implementation; 3) Low priority – an action that should be implemented over the long term that may depend on the availability of funds. Prioritizing mitigation actions for each jurisdiction was based on the following five (5) factors: (1) effect on overall risk to life and property; (2); ease of implementation; (3) political and community support; (4) a general economic cost/benefit review1; and (5) funding availability.
As mentioned above, each action was prioritized by the jurisdiction that identified the action. An overall ranking of High, Moderate or Low was given to each action based on analysis of the action in terms of the five factors listed above.
Mitigation Techniques in the R‐RRC Planning Area
County and town officials reviewed the findings of the Capability Assessment and Risk Assessment in order to determine feasible and effective mitigation techniques. The Disaster Mitigation Act of 2000 specifies that state and local governments should prioritize actions based on the level of risk a hazard poses to the lives and property of a given jurisdiction. The Mitigation Matrix (Figure 8.2) served as a general guide; assisting local governments to make sure that they addressed, at a minimum, those hazards posing the greatest threat. Mitigation techniques, including prevention, property protection, natural resource protection, structural projects, emergency services, and public information and awareness were noted in the matrix if adopted by a participating jurisdiction. It is important to note that local and regional Mitigation Action Plans in the R‐RRC planning area included an array of actions, not just those addressing high and moderate risk hazards.
Figure 8.2 Mitigation Matrix
MITIGATION TECHNIQUE
HIGH RISK HAZARDS MODERATE RISK HAZARDS
Flood
Hurricanes and
Tropical Storms
Severe Thunderstorm and Tornadoes
Winter Storms
Drought Earthquake Wildfire
Prevention X X X X X X X
1 Only a general economic cost/benefit review was considered through the process of selecting and prioritizing mitigation actions for each jurisdiction. Mitigation actions with “high” priority were determined to be the most cost effective and most compatible with each jurisdiction’s unique needs. A more detailed cost/benefit analysis will be applied to particular projects prior to the application for or obligation of funding, as appropriate.

M I T I G A T I O N S T R A T E G Y
Rappahannock-Rapidan Regional Hazard Mitigation Plan 2012 Section 8: Page 7
Property Protection X
Natural Resource Protection
X X
Structural Projects X X X X X X X
Emergency Services X X X X X X X
Public Information and Awareness
X X X X X X X
The bulk of the mitigation actions identified by local governments in Appendix A address the flood hazard. This is primarily because of two reasons: 1) The flood hazard was identified through the Risk Assessment to be one of the high risk hazards that impact the region, and 2) The flood hazard is probably the easiest hazard to plan for and mitigate the impacts of. There are also mitigation actions to address each of the other high and moderate risk hazards identified in the Risk Assessment, as well as other lower risk hazards, however, this is an element of the Plan that should be improved over time as new mitigation techniques for different hazards are identified. Over time, each jurisdiction should identify at least one mitigation action to address each of the hazards that impact the region. As part of the 2012 revision to the Rappahannock‐Rapidan Regional Hazard Mitigation Plan, participating jurisdictions updated the progress on the proposed mitigation strategies from the 2005 plan. A full listing of the progress to date on the 2005 strategies can be found in Appendix A: Local Mitigation Strategies. In general, most localities have made progress on the 2005 mitigation strategies, through ordinance reviews, floodplain reviews and management and GIS implementation and development. Some of the efforts to date include:
Orange County addressed several of its mitigation strategies, including a county‐wide evacuation plan and the development of a terrorism response plan, as part of its ongoing Emergency Operations plan updates.
Fauquier County addressed several of its mitigation strategies through updated ordinances, including retaining natural vegetative bed in stormwater channels to reduce erosion, requiring developers to plan for on‐site sediment rates and revising and updating the county’s regulatory floodplain maps.
Culpeper County addressed mitigation strategies for stormwater runoff through zoning ordinance policies requiring more trees to be preserved and planted in landscape designs
Several jurisdictions upgraded and/or installed Reverse 911 systems to improve public safety communication during the period between the 2005 plan and the 2012 update
The Town of Warrenton completed traffic signal coordination that previously caused significant problems for emergency vehicles trying to enter and exit the Town Police and Fire stations

PLAN MAINTENANCE PROCEDURES The Plan Maintenance Procedures section discusses how identified mitigation strategies will be implemented by participating jurisdictions and how the Plan will be evaluated and updated over time. This section also discusses how the public will continue to be involved in the hazard mitigation planning process. This section was updated as part of the 2012 Hazard Mitigation Plan Update.
ADOPTION The 2012 revision of the Rappahannock‐Rapidan Hazard Mitigation Plan is expected to be adopted by participating jurisdictions in early Fall 2012. All resolutions for adoption of the plan will be included in Appendix D of the Plan. Public comment was solicited during the drafting of the plan revision and prior to adoption by each participating jurisdiction. Local emergency management officials, planners and RRRC staff were available to discuss the project at all public meetings and hearings.
IMPLEMENTATION Each jurisdiction participating in this Plan is responsible for implementing specific mitigation actions as prescribed in the Mitigation Strategy section (Section 8). Each action has been assigned to a specific person or local government office that is responsible for implementing that specific action. Since each jurisdiction has specific mitigation actions that will be implemented, they have adopted their locally specific Mitigation Strategy section of the Plan separately. Consequently, individual jurisdictions may update that specific section of the Plan without meeting with the remainder of the R‐RRC Hazard Mitigation Committee. Separate adoption of locally specific actions is required so that each jurisdiction is not responsible for the action(s) of the jurisdiction involved in the planning process. Separate adoption of locally specific actions also allows for each jurisdiction to retain flexibility over its prioritized strategies within the overall plan in between each five‐year update of the Plan. A review of the progress on the 2005 local mitigation strategies is included as part of Appendix A: Local Mitigation Strategies. In general, most localities have made progress on the 2005 mitigation strategies, through ordinance reviews, floodplain reviews and management and GIS implementation and development. Some of the efforts to date include:
Orange County addressed several of its mitigation strategies, including a county‐wide evacuation plan and the development of a terrorism response plan, as part of its ongoing Emergency Operations plan updates.
Fauquier County addressed several of its mitigation strategies through updated ordinances, including retaining natural vegetative bed in stormwater channels to reduce

P L A N M A I N T E N A N C E P R O C E D U R E S
Rappahannock-Rapidan Regional Hazard Mitigation Plan 2012 Section 9: Page 2
erosion, requiring developers to plan for on‐site sediment rates and revising and updating the county’s regulatory floodplain maps.
Culpeper County addressed mitigation strategies for stormwater runoff through zoning ordinance policies requiring more trees to be preserved and planted in landscape designs
Several jurisdictions upgraded and/or installed Reverse 911 systems to improve public safety communication during the period between the 2005 plan and the 2012 update
The Town of Warrenton completed traffic signal coordination that previously caused significant problems for emergency vehicles trying to enter and exit the Town Police and Fire stations
For each identified action, potential funding sources have also been listed that may be used when the jurisdiction begins seeking funding for implementation of the action. These funding sources are not meant to be the only potential funding sources or strategies, but do provide an initial starting point for new projects, as well as projects already in progress. Participating jurisdictions also identified new strategies as part of the 2012 plan update process, all of which are included in Appendix A. It will be the responsibility of each participating jurisdiction to determine additional implementation procedures beyond their Mitigation Action Plan. This includes integrating the Plan into other planning documents, processes or mechanisms such as comprehensive or capital improvement plans, where appropriate. For further integration into existing planning documents, each participating jurisdiction should create a process by which the requirements of this hazard mitigation plan will be incorporated into other local plans. During the planning process for new and updated local planning documents, such as the comprehensive plan, capital improvements plan, or emergency management plan, the local planner or emergency management coordinator should provide a copy of the hazard mitigation plan to each respective advisory committee member. The local planner or emergency management coordinator should recommend to those persons making revisions to the afore noted plans that the goals and strategies of the new or revised planning documents should remain consistent with the goals and strategies of the hazard mitigation plan and not contribute to increasing the effects of natural hazards within the community. As referenced above, between the 2005 plan adoption and 2012 plan revision, several jurisdictions successfully modified existing plans and ordinances to incorporate previously identified mitigation strategies into other long‐term planning and emergency management efforts. Local officials, planners and emergency management personnel should continue to advocate for review and inclusion of identified mitigation strategies into relevant local plans and ordinances, as necessary.
EVALUATION AND ENHANCEMENT Periodic revisions and updates of the Plan are required to ensure that the goals and objectives of the Plan are kept current, taking into account potential changes in hazards vulnerability and mitigation priorities. More importantly, revisions may be necessary to ensure that the Plan is in

P L A N M A I N T E N A N C E P R O C E D U R E S
Rappahannock-Rapidan Regional Hazard Mitigation Plan 2012 Section 9: Page 3
full compliance with federal regulations and state statutes. This portion of the Plan outlines the procedures for completing such revisions and updates.
Five‐Year Plan Review
The Plan will be reviewed every five (5) years to determine whether there have been any significant changes in the R‐RRC region that might affect the Plan. Increased development, increased exposure to certain hazards, the development of new mitigation capabilities or techniques, and changes to federal or state legislation are examples of changes that may affect the condition of the Plan. This review also gives community officials an opportunity to evaluate those actions that have been successful and to explore the possibility of documenting those losses avoided. The five‐year update will be coordinated by R‐RRC through the Regional Hazard Mitigation Planning Committee at which time all local amendments should be incorporated into the Regional Plan. The Plan will also be submitted to the State Hazard Mitigation Office for formal review. Each jurisdiction is encouraged to make yearly reviews and minor changes without approval from the R‐RRC (see Local Plan Amendment Process below).
Plan Monitoring
R‐RRC will be responsible for the continued coordination of the monitoring of this plan. The Emergency Management Coordinator from each county will make yearly updates to R‐RRC on the progress of the implementation of their mitigation actions. The yearly reports should coincide with the anniversary of the approval date of this plan, or other annual benchmark date as identified by the Hazard Mitigation Committee members. The Emergency Management Coordinator will also be responsible for coordinating the yearly reporting activities of the towns within their respective counties and for coordinating the reconvening of the appropriate Hazard Mitigation Committee members for future meetings. If any of the counties or towns that participated in this planning effort wish to not participate in future updates of the Plan, they must notify R‐RRC staff in writing.
Disaster Declarations
Following a disaster declaration, the Plan will be reviewed by each effected jurisdiction to reflect lessons learned or to address specific circumstances arising from the changing conditions surrounding subsequent disaster events. Following local review, proposed changes to the Mitigation Strategies can be adopted by each jurisdiction, while broader changes to the 2012 Hazard Mitigation Plan will be discussed by the RRRC Board, Hazard Mitigation Committee, Regional Emergency Coordinators and other stakeholders as part of the ongoing maintenance of the Plan in between five‐year updates. RRRC will maintain proposed changes to the entire plan document for use in the subsequent five‐year Plan update process.
Reporting Procedures

P L A N M A I N T E N A N C E P R O C E D U R E S
Rappahannock-Rapidan Regional Hazard Mitigation Plan 2012 Section 9: Page 4
The results of the five‐year review should be summarized in a report prepared for the R‐RRC Board of Directors. The report will include an evaluation of the effectiveness and appropriateness of the Plan, and will recommend, as appropriate, any required changes or amendments to the Plan. The report will also include an evaluation of implementation progress for each of the proposed mitigation actions, identifying reasons for delays or obstacles to their completion along with recommended strategies to overcome them.
Local Plan Amendment Process
Participating counties and towns can amend their Mitigation Actions at any time. An amendment to the Plan should be initiated only by the local governing body, either on its own initiative or upon the recommendation of the chief elected official, planner, or emergency management officials.
Minor revisions and clarifying changes can be made by the local governing body without going through the public participation and adoption process. Examples of these changes include:
Minor spelling and grammatical corrections; and
Minor corrections to statistics, dates and calculations. The local point of contact for each jurisdiction shall make an annual report to R‐RRC documenting any changes made to the Mitigation Actions.
CONTINUED PUBLIC INVOLVEMENT Public input was an integral part of the completion of both the original R‐RRC Regional All‐Hazards Mitigation Plan and the 2012 update. As is the case with any officially adopted plan or ordinance, any significant change to this Plan shall require a public hearing and all meetings involving the hazard mitigation committee, including five‐year update meetings and interim meetings, will be advertised and accessible to the public.
All relevant project documents, including the 2005 plan and identified mitigation strategies, as well as the 2012 plan update meeting documents and dates and draft plan materials are available via the Rappahannock‐Rapidan Regional Commission website.
Other efforts to involve the public in the maintenance, evaluation and revision process will be made as necessary. These efforts may include:
Advertising meetings of the Hazard Mitigation Planning Committee in the local paper, on public bulletin boards and/or in city and county office buildings;
Utilizing local media to update the public of any maintenance or periodic review activities taking place;
Utilizing city and county Web sites to advertise any maintenance or periodic review activities taking place; and
Keeping copies of the Plan in all public libraries within the county.
The Virginia Department of Emergency Management or members of the R‐RRC Planning Team may also provide suggestions.

APPENDIX A:
MITIGATION STRATEGIES
Appendix A contains the locally and regionally identified mitigation strategies for the 2012 RRRC Regional Hazard Mitigation Plan
• Rappahannock-Rapidan Regional Commission Page 2-3 • Culpeper County Page 4 • Town of Culpeper Page 5 • Fauquier County Page 6-7 • Town of Remington Page 8 • Town of Warrenton Page 8 • Madison County Page 9 • Town of Madison Page 9 • Orange County Page 10-11 • Town of Orange Page 12 • Rappahannock County Page 13

2012 Rappahannock‐Rapidan Region Mitigation Strategies
Rappahannock‐Rapidan Regional Commission Strategies (Region‐wide)
Project #
Strategy Year Added
Hazard(s) Addressed
Priority Estimated Cost Funding Sources
Lead Agency/Department
Status/Schedule Comments
1 Coordinate inter‐regional meetings (with surrounding PDCs) to ensure linkage with evacuation and other emergency planning of adjoining jurisdictions, as well as EOC interoperability within and outside of region
2005 Multiple High None other than staff time
None needed
Rappahannock‐Rapidan Regional Commission
Completed RRRC has participated, with member jurisdictions, in meetings with surrounding localities. RRRC staff should also commit to regular attendance/participation in regional emergency coordinating meetings in the future.
2 Update floodplain maps across the region as means of improving floodplain management and ensure each jurisdiction maintains ordinances in compliance with NFIP requirements.
2005 Flood Moderate Dependent on extent of changes needed
FEMA Local Jurisdictions, Rappahannock‐Rapidan Regional Commission
Ongoing Continue to monitor for additional changes; respond to jurisdiction requests for assistance as needed.
3 Conduct NFIP, CRS and Flood Prevention information sessions around the region to improve awareness of flood insurance and how communities can reduce the effects of the flood hazard.
2005 Flood Moderate Dependent on number of workshops and attendees
FEMA; VDEM
Local Jurisdictions, Rappahannock‐Rapidan Regional Commission
Ongoing
4 Broaden Hazard Mitigation Committee to include representation from National Parks Service, Soil and Water Conservation Districts, Red Cross, HOAs, employers, schools
2005 All Moderate None other than staff time
None needed
Rappahannock‐Rapidan Regional Commission
Completed 2012 Plan update included participation by community colleges, employers, National Parks Service
5 Develop Emergency Preparedness manual and distribute across the region to help prepare for all hazards
2005 Multiple High Dependent on size and number of copies to be distributed
FEMA Rappahannock‐Rapidan Regional Commission
Ongoing, as Funding allows
Should also work with other agencies in similar efforts, such as VDEM, Virginia Department of Health
6 Facilitate continued sharing of GIS maps/data, impact studies, ordinances, plans, etc. among member jurisdictions
2005 Multiple High None other than staff time
None needed
Rappahannock‐Rapidan Regional Commission
Completed
7 Facilitate further review of earthquake hazard and its impacts on the region in order to develop locally relevant mitigation strategies
2012 Earthquake High Staff time; VDEM/FEMA assistance
None needed initially
Rappahannock‐Rapidan Regional Commission
Within 1 year To include additional HAZUS analysis
8 Wildfire prevention and training programs, including support of Firewise training for interested localities, support and publication of Virginia Department of Forestry applications and data sets
2012 Wildfire Moderate Staff time; Dependent on training and workshop need
None needed initially
Rappahannock‐Rapidan Regional Commission
As funding allows
9 Regional Water Supply Planning support to those jurisdictions without water supply plans in place
2012 Drought Moderate Staff time VDEM; DEQ Rappahannock‐Rapidan Regional Commission
As funding allows
10 GIS Data Analysis of Virginia Department of Forestry’s Wildland‐Urban Interface zones with recent imagery and projected growth areas in region
2012 Wildfire Modearte Staff time DOF grants Rappahannock‐Rapidan Regional Commission
As funding allows
11 Assist local jurisdictions with development of Continuity of Operations Planning, if not currently in place
2012 Multiple Low Staff time Local, State, Federal funds
Local jurisdictions, RRRC
Ongoing
12 Identify the four missing addresses for repetitive loss properties in the region.
2012 Flood Moderate Staff time None needed
Local Jurisdictions, RRRC
Within 1 year
13 Improve water monitoring capabilities along major rivers in the region (including additional monitor stations and improved data tracking capabilities)
2012 Flood Moderate Unknown FEMA: HMGP
Local Jurisdictions, RRRC
As funding allows
Rappahannock-Rapidan Regional Hazard Mitigation Plan 2012 Appendix A: Page 2

14 Mitgation of flood‐prone properties including, but not limited to, acquisition, elevation, relocation, and dry & wet flood proofing of flood prone structures, and mitigation reconstruction for NFIP‐defined Severe Repetitive Loss properties only
2012 Flood Moderate Unknown FEMA Local Jurisdictions, RRRC
As funding allows
15 Consider participation in the Community Rating System as a means to reduce the flood insurance premiums of citizens in the region and to foster better floodplain management practices
2012 Flood Moderate Unknown FEMA Local Jurisdictions, RRRC
As funding allows
Rappahannock-Rapidan Regional Hazard Mitigation Plan 2012 Appendix A: Page 3

2012 Rappahannock‐Rapidan Region Mitigation Strategies
Culpeper County
Project #
Strategy Year Added
Hazard(s) Addressed
Priority Estimated Cost Funding Sources
Lead Agency/Department Status/Schedule Comments
1 Develop a coordinated GIS department and improve GIS usage and capacity across county departments; Improve Emergency Operations Center use of GIS
2005 Multiple Moderate Staff Salary, Training
FEMA, Local Funds
Culpeper County Planning; Emergency Management
Ongoing
2 Enhance current GIS capabilities/data to expand in‐house hazard mitigation capabilities
2005 Multiple Moderate Staff Salary, Training
FEMA, Local Funds
Culpeper County Planning; Emergency Management
Ongoing
3 Develop policies for early drought conservation measures 2005 Drought Moderate Staff time None needed initially
Culpeper County Environmental Services
Ongoing County is currently developing water supply plan in conjunction with Town of Culpeper
4 Develop Public Awareness campaign for flooding, hurricanes and tropical storms
2005 Flood, Hurricane, Tropical Storms
Moderate $1,000 annually FEMA, local funds
Culpeper County Emergency Services
Ongoing
5 Develop county‐wide warning and alert system 2005 All Hazards Moderate Dependent upon upgrades needed
FEMA, VDEM, ISP
Culpeper County Emergency Services
Ongoing Reverse 911 system is in place; need to continue to monitor for upgrades and interoperability
6 Participate in ICS scenario exercises in conjunction with other local jurisdictions
2012 Multiple Moderate Staff time None other than staff time
Culpeper County Emergency Services
Ongoing
7 Implement Town & County Water & Sewer agreement 2012 Multiple High Unknown Local Funds Culpeper County Administration
Long‐term
8 Retain thick vegetative cover on public lands flanking river to reduce erosion
2005 Flood Moderate Staff time None needed Culpeper County Planning Deleted
9 Limit the percentage of allowable impervious surface within developed parcels to reduce the impact of erosion and to lessen the impact of flooding
2005 Flood Moderate Staff time None needed Culpeper County Planning Completed In place, reference Culpeper County Code, chapter 11A
10 Design a “natural runoff” or “zero discharge” policy for stormwater subdivision design to reduce the impacts of downstream flooding
2005 Flood Moderate Staff time None needed Culpeper County Planning Deleted
11 Require more trees be preserved/planted in landscape designs to reduce the amount of stormwater runoff
2005 Flood Moderate Staff time None needed Culpeper County Planning Completed In place, reference article 33 of Zoning Ordinance
12 Require clustering for PUDs in the zoning ordinance that reduce or eliminate development in known hazard areas (generally flood zones)
2005 Flood Moderate Staff time None needed Culpeper County Planning Completed Floodplain ordinance in place, reference article 8A or Zoning Ordinance
13 Ensure zoning ordinance encourages higher densities only outside of known hazard areas
2005 Flood Moderate Staff time None needed Culpeper County Planning Deleted
14 Increase minimum lot size for development in known hazard areas 2005 Flood Moderate Staff time None needed Culpeper County Planning Deleted
15 Require setbacks from delineated hazard areas (e.g. wetlands, steep slopes)
2005 Multiple Moderate Staff time None needed Culpeper County Planning Deleted
16 Join the Community Rating System program to reduce the flood insurance premiums of citizens in Culpeper County and to foster better floodplain management practices
2005 Flood Moderate Staff time Local Funds Culpeper County Emergency Services
Deleted
17 Buy out or elevate repetitive flood risk homes 2005 Flood Moderate Dependent on number of homes
FEMA Funds Culpeper County Planning Deleted
18 Install generators in shelter locations for use in times of displacement/evacuations
2005 Multiple Moderate $30,000 per generator
FEMA Funds Culpeper County Emergency Services
Completed
19 Make sure the new EOC is designed and built in such a way as to be resistant to the effects of natural hazards
2005 Multiple Moderate Dependent on EOC design
FEMA Funds Culpeper County Emergency Services
Completed
Rappahannock-Rapidan Regional Hazard Mitigation Plan 2012 Appendix A: Page 4

2012 Rappahannock‐Rapidan Region Mitigation Strategies
Town of Culpeper
Project #
Strategy Year Added
Hazard(s) Addressed
Priority Estimated Cost Funding Sources
Lead Agency/Department Status/Status/Schedule Comments
1 Enhance current GIS capabilities to expand in‐house hazard mitigation capacity
2005 Multiple Moderate Dependent on level of enhancement
FEMA, Local funds
Town of Culpeper Department of Planning and Community Development
Ongoing Upgrades included in Capital Improvements Plan
2 Acquire Global Positioning System (GPS) units to locate critical public infrastructure
2005 Multiple High $11,000 ‐ $15,000 FEMA Town of Culpeper Completed
3 Technology upgrades to allow the Town to more efficiently respond to disasters
2005 Multiple High Dependent upon upgrades identified
Grant funds Town of Culpeper Administration Ongoing Installation of AMR systems ongoing through FY 2014 to improve security of public utility systems
4 Improve security and protection measures for Town’s water plant and water supply reservoirs
2005 Multiple High Dependent upon level of enhancement
Federal funding
Town of Culpeper Department of Public Works
Ongoing Installation of AMR systems ongoing through FY 2014; Installation of additional well systems to provide increase in MGD in testing phase
5 Improve security and protection measures for Town’s electric utility and distribution system
2005 Multiple High Dependent upon level of enhancement
Federal funding
Town of Culpeper Director of Light and Power
Ongoing Installation of AMR systems ongoing through FY 2014 with remote access, dual port system
6 Improve security and protection measures for Town’s wastewater utility
2005 Multiple High Dependent upon level of enhancement
Federal funding
Town of Culpeper Department of Public Works
Ongoing Emergency generators installed at multiple points; additional perimeter fencing installed to date
7 Provide vegetative buffers where appropriate to offset effects of potential flooding
2005 Flooding Moderate Staff time None other than staff time
Town of Culpeper Departments of Planning and Community Development, Public Works
Ongoing Streambank segments identified on Mountain Run to promote soil retention
8 Employ the use of impervious surfaces, only where practical, to counteract the effects of flooding in developed areas of town
2005 Flooding Moderate Staff time None other than staff time
Town of Culpeper Departments of Planning and Community Development, Public Works
Ongoing
9 Construct Inner Loop road between route 229 and route 522 to provide additional traffic options during flood events
2012 Flooding, Multiple
Moderate Estimates at VDOT VDOT, FHWA Town of Culpeper, VDOT 2016 Completion Date
10 Utilize old VDOT Residency property to further streamline maintenance efficiency
2012 Winter Weather, multiple
Moderate Staff time None other than staff time
Town of Culpeper Department of Public Works
Ongoing
11 Complete and implement mitigation planning policies for dams at Lake Pelham and Mountain Run Lake
2012 Flooding High Staff time DCR, staff time
Town of Culpeper Departments of Public Works, Planning and Community Development
Ongoing
12 Participate in ICS scenario exercises in conjunction with other local jurisdictions
2012 Multiple Moderate Staff time None other than staff time
Town of Culpeper Departments of Public Works, Planning and Community Development
Ongoing
Rappahannock-Rapidan Regional Hazard Mitigation Plan 2012 Appendix A: Page 5

2012 Rappahannock‐Rapidan Region Mitigation Strategies
Fauquier County
Project #
Strategy Year Added
Hazard(s) Addressed
Priority Estimated Cost Funding Sources
Lead Agency/Department Status/Schedule Comments
1 Build new Emergency Operations Center and Emergency Communications Center
2005 Multiple High Undetermined FEMA HMGP, EMPG Grants
CFREM Planning ongoing
Lack of funding
2 Relocation of structures out of the floodplain 2005/2012 Flood Low Dependent upon number structures identified
FEMA HMGP, FMA
Fauquier County Community Development
No action taken Requires study of non‐conforming homes in updated FIRM maps; Retain strategy as refined in 2012
3 Join the Community Rating System program to reduce the flood insurance premium of citizens in Fauquier County and to foster better floodplain management practices
2005/2012 Flood Moderate Staff time None needed Fauquier County Community Development
Ongoing County now has Certified Floodplain Manager on staff; Retain strategy as refined in 2012 in coordination with Emergency Services
4 Improve generator capacity at shelters/schools 2005 Multiple High $35,000 per generator FEMA HMGP, PDM
CFREM As funding allows
5 Develop Code Red System throughout county 2005/2012 Multiple Moderate Unknown Local funds CFREM As funding allows
6 Prohibit or limit floodplain development through regulatory and/or incentive based measures
2005/2012 Flood Low Staff time None needed Fauquier County Community Development
As necessary Zoning Ordinance updated in 2007 and 2009 to conform to federal law and updated FIRM maps. Retain strategy as refined in 2012.
7 Establish and manage riparian buffers along rivers and streams to minimize erosion and flooding
2005/2012 Flood Low Staff time None needed Fauquier County Community Development
As staff time allows
Retain strategy as refined in 2012, given pending stormwater and Chesapeake Bay regulations at state level
8 Incorporate into emergency response plans the procedure for tracking high water marks following a flood
2005/2012 Flood Low Staff time None needed CFREM As necessary
9 Retain thick vegetative cover on public lands flanking river to reduce the potential of erosion
2005/2012 Flood Low Staff time None needed Fauquier County Community Development
As staff time allows
This is a continuing county coordination effort with special management areas, state and federal agencies. Retain strategy as refined in 2012.
10 Sign a Cooperating Technical Partner (CTP) Agreement with FEMA.
2005/2012 Flood Moderate Staff time FEMA Grants Fauquier County Community Development
As staff time allows
Requires Floodplain Manager and GIS to work with FEMA to determine county eligibility; and Board of Supervisors authorization to pursue such a designation
11 Determine county’s eligibility for Coordinating Cooperative Partner designation
2012 Flood Moderate Staff time Local Funds Fauquier County Community Development
As staff time allows
12 Limit the percentage of allowable impervious surface within developed parcels
2005/2012 Flood Low Staff time None needed Fauquier County Community Development
As necessary Monitor pending regulations at state and federal level for changes to impervious surface reductions. Retain strategy as refined in 2012.
13 Encourage residents to keep storm drains clear of debris during storms
2005/2012 Flood Moderate Staff time None needed Fauquier County Community Development
As necessary Work with HOAs and John Marshall Soil and Water Conservation District to coordinate education and outreach materials
14 Develop Mobile Data Transmission System that is interoperable with Northern Virginia Public Safety agencies
2005/2012 Multiple High Unknown Local, State, Federal funds
CFREM Ongoing
15 Require developers to plan for on‐site sediment retention. 2005 Flood High Staff time None needed Fauquier County Community Development
Ongoing Completed on a regular basis during development review.
16 Develop an open space acquisition, reuse and preservation plan targeting hazard areas.
2005 Flood Low $50,000 to develop plan, additional unknown
FEMA HMGP Fauquier County Community Development
Ongoing Part of county planning process as necessary
17 Prohibit any development within the floodplain areas 2005 Flood Low Staff time None needed Fauquier County Community Development
Completed Incorporated into County Ordinance
18 Revise and update regulatory floodplain maps 2005 Flood Moderate ‐‐ FEMA: MMP Fauquier County Community Development
Completed Updated floodplain maps adopted and monitored.
Rappahannock-Rapidan Regional Hazard Mitigation Plan 2012 Appendix A: Page 6

19 Designate a local floodplain manager/CRS coordinator that achieves Certified Floodplain Manager certification
2005 Flood Moderate Staff time None needed Fauquier County Community Development
Completed County has certified Floodplain Manager on staff as of 2010
20 Substitute porous surfaces/pavement for impervious pavement when appropriate to reduce flooding caused by runoff
2005 Flood Low Staff time None needed Fauquier County Community Development
As necessary Low priority, handled on case‐by‐case basis
21 Retain natural vegetative bed in stormwater channels to reduce erosion
2005 Flood Low Staff time None needed Fauquier County Community Development
Completed
Rappahannock-Rapidan Regional Hazard Mitigation Plan 2012 Appendix A: Page 7

2012 Rappahannock‐Rapidan Region Mitigation Strategies
Town of Remington
2012 Rappahannock‐Rapidan Region Mitigation Strategies
Town of Warrenton
Note: The Town of Warrenton opted against identifying new strategies during this Plan Update in order to focus on the number of ongoing efforts currently underway at the Town.
Project #
Strategy Year Added
Hazard(s) Addressed
Priority Estimated Cost Funding Sources
Lead Agency/Department Status/Schedule Comments
1 Elevate buildings/buy‐out land in floodplain. 2005 Flood Moderate Unknown FEMA, Local Funds
Town of Remington Administration
As needed
2 The water treatment plant for the Town of Remington on Confederate Boulevard needs a backup generator.
2005 Multiple High $35,000 per generator FEMA, Local Funds
Town of Remington Superintendant
As funding allows
3 Ensure plans for new water treatment facility at 5th Street include backup power generation
2012 Multiple High Dependent upon identified solution
Local funds Town of Remington Superintendant
Concurrent with facility development
4 The sewer plant that serves the Town of Remington needs a backup generator 2005 Multiple High $30,000 per generator FEMA Funds Town of Remington Superintendant
Completed
Project #
Strategy Year Added
Hazard(s) Addressed
Priority Estimated Cost Funding Sources Lead Agency/Department Status/Schedule Comments
1 Coordinate all traffic signals in town. Currently the signals are not coordinated and can cause major problems for emergency vehicles trying to enter and exit the police and fire stations
2005 Multiple Moderate $50,000 Local Funds, VDOT Town of Warrenton Department of Public Works and Utilities
Ongoing Phase I completed. Town is working to interconnect the signals via wireless during phase II.
2 Verify street addresses and ensure compliance with posting requirements.
2005 All Hazards High Staff time None needed Town of Warrenton Department of Planning and Community Development
Ongoing
3 Join the Community Rating System program to reduce the flood insurance premiums of citizens in the Town of Warrenton and to foster better floodplain management.
2005 Flood Moderate Staff time None needed Town of Warrenton Departments of Public Works and Utilities & Planning and Community Development
Ongoing Town has identified this as a planned effort across departments.
4 Update floodplain map for the Town of Warrenton 2005 Flood High $85,000 FEMA Funds Town of Warrenton Department of Public Works and Utilities
Completed
5 Improve enforcement of erosion and sediment control measures to reduce erosion and flooding problems caused by sedimentation.
2005 Flood Low Staff time None needed Town of Warrenton Department of Planning and Community Development
Ongoing
6 Additional staff training for GIS applications. 2005 Multiple Moderate $2,000 to $4,000; Dependent upon software needs; training needs
Local Funds Town of Warrenton Departments of Public Works and Utilities & Planning and Community Development
Ongoing
7 Increase snow removal capabilities 2005 Winter Storms
Moderate Additional staff time and funding for new equipment
Dependent upon need for new equipment
Town of Warrenton Department of Public Works and Utilities
Ongoing
Rappahannock-Rapidan Regional Hazard Mitigation Plan 2012 Appendix A: Page 8

2012 Rappahannock‐Rapidan Region Mitigation Strategies
Madison County
Note: Madison County opted against identifying new strategies during this Plan Update due to staffing limitations and the desire to push resources toward previously identified strategies.
2012 Rappahannock‐Rapidan Region Mitigation Strategies
Town of Madison
Note: The Town of Madison opted against identifying new strategies during this Plan Update due to limited staffing and the desire to push resources toward previously identified strategies.
Project #
Strategy Year Added
Hazard(s) Addressed
Priority Estimated Cost Funding Sources Lead Agency/Department Status/Schedule Comments
1 Identify the two repetitive loss properties in the county.
2005 Flood Moderate Staff time None needed Madison County Emergency Management
Ongoing
2 Develop a HAZMAT team to handle possible spills on Route 29
2005 Hazardous Materials
Moderate Dependent on number of team members and equipment needed
Hazardous Material Emergency Management grant
Madison County Emergency Management
As funding allows
3 Expand emergency shelter capabilities for natural disasters and large‐scale evacuation
2005 Multiple Moderate Dependent upon improvements needed FEMA Madison County Emergency Management
Ongoing
Project #
Strategy Year Added
Hazard(s) Addressed Priority Estimated Cost Funding Sources Lead Agency/Department
Status/Schedule Comments
1 Improve stormwater runoff with the implementation of stormwater management techniques
2005 Flood High Town staff has estimates FEMA, USDA, Soil and Water Conservation
Town of Madison Administration
As funding allows
2 Protect utilities by placing overhead wires and cables underground
2005 High winds, tornadoes, hurricanes, winter storms
Moderate Town staff has estimates for existing line burial; future line burial would be taken care of via ordinance amendments
CDBG Town of Madison Administration
As funding allows, long‐term
Rappahannock-Rapidan Regional Hazard Mitigation Plan 2012 Appendix A: Page 9
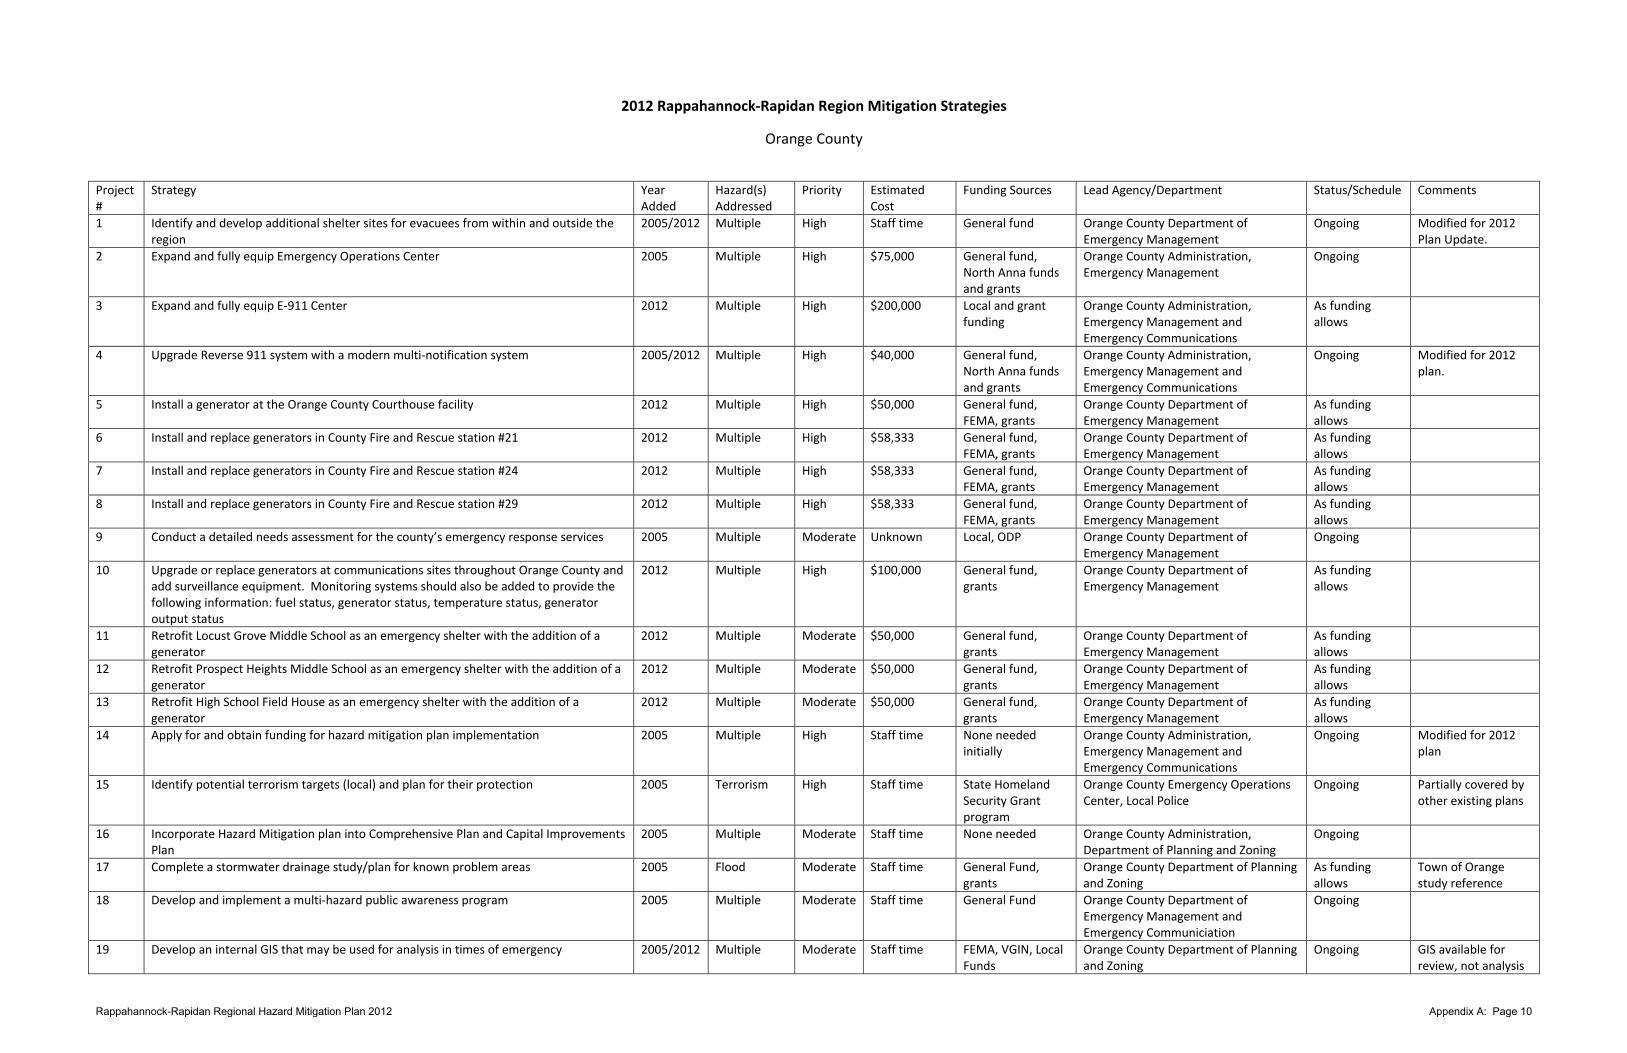
2012 Rappahannock‐Rapidan Region Mitigation Strategies
Orange County
Project #
Strategy Year Added
Hazard(s) Addressed
Priority Estimated Cost
Funding Sources Lead Agency/Department Status/Schedule Comments
1 Identify and develop additional shelter sites for evacuees from within and outside the region
2005/2012 Multiple High Staff time General fund Orange County Department of Emergency Management
Ongoing Modified for 2012 Plan Update.
2 Expand and fully equip Emergency Operations Center 2005 Multiple High $75,000 General fund, North Anna funds and grants
Orange County Administration, Emergency Management
Ongoing
3 Expand and fully equip E‐911 Center 2012 Multiple High $200,000 Local and grant funding
Orange County Administration, Emergency Management and Emergency Communications
As funding allows
4 Upgrade Reverse 911 system with a modern multi‐notification system 2005/2012 Multiple High $40,000 General fund, North Anna funds and grants
Orange County Administration, Emergency Management and Emergency Communications
Ongoing Modified for 2012 plan.
5 Install a generator at the Orange County Courthouse facility 2012 Multiple High $50,000 General fund, FEMA, grants
Orange County Department of Emergency Management
As funding allows
6 Install and replace generators in County Fire and Rescue station #21 2012 Multiple High $58,333 General fund, FEMA, grants
Orange County Department of Emergency Management
As funding allows
7 Install and replace generators in County Fire and Rescue station #24 2012 Multiple High $58,333 General fund, FEMA, grants
Orange County Department of Emergency Management
As funding allows
8 Install and replace generators in County Fire and Rescue station #29 2012 Multiple High $58,333 General fund, FEMA, grants
Orange County Department of Emergency Management
As funding allows
9 Conduct a detailed needs assessment for the county’s emergency response services 2005 Multiple Moderate Unknown Local, ODP Orange County Department of Emergency Management
Ongoing
10 Upgrade or replace generators at communications sites throughout Orange County and add surveillance equipment. Monitoring systems should also be added to provide the following information: fuel status, generator status, temperature status, generator output status
2012 Multiple High $100,000 General fund, grants
Orange County Department of Emergency Management
As funding allows
11 Retrofit Locust Grove Middle School as an emergency shelter with the addition of a generator
2012 Multiple Moderate $50,000 General fund, grants
Orange County Department of Emergency Management
As funding allows
12 Retrofit Prospect Heights Middle School as an emergency shelter with the addition of a generator
2012 Multiple Moderate $50,000 General fund, grants
Orange County Department of Emergency Management
As funding allows
13 Retrofit High School Field House as an emergency shelter with the addition of a generator
2012 Multiple Moderate $50,000 General fund, grants
Orange County Department of Emergency Management
As funding allows
14 Apply for and obtain funding for hazard mitigation plan implementation 2005 Multiple High Staff time None needed initially
Orange County Administration, Emergency Management and Emergency Communications
Ongoing Modified for 2012 plan
15 Identify potential terrorism targets (local) and plan for their protection 2005 Terrorism High Staff time State Homeland Security Grant program
Orange County Emergency Operations Center, Local Police
Ongoing Partially covered by other existing plans
16 Incorporate Hazard Mitigation plan into Comprehensive Plan and Capital Improvements Plan
2005 Multiple Moderate Staff time None needed Orange County Administration, Department of Planning and Zoning
Ongoing
17 Complete a stormwater drainage study/plan for known problem areas 2005 Flood Moderate Staff time General Fund, grants
Orange County Department of Planning and Zoning
As funding allows
Town of Orange study reference
18 Develop and implement a multi‐hazard public awareness program 2005 Multiple Moderate Staff time General Fund Orange County Department of Emergency Management and Emergency Communiciation
Ongoing
19 Develop an internal GIS that may be used for analysis in times of emergency 2005/2012 Multiple Moderate Staff time FEMA, VGIN, Local Funds
Orange County Department of Planning and Zoning
Ongoing GIS available for review, not analysis
Rappahannock-Rapidan Regional Hazard Mitigation Plan 2012 Appendix A: Page 10

20 Develop and incorporate database information for GIS use 2005 Multiple Moderate Staff time General fund Orange County Department of Planning and Zoning
Deleted Revised in 2012 plan, strategy #19
21 Identify flood inundation zones for all dams regulated through the Virginia Department of Conservation and Recreation Dam Safety program
2005 Flood Moderate Staff time General fund, DCR Orange County Department of Planning and Zoning
As funding allows
22 Upgrade or replace outdated storage shed at the Orange County Sheriff’s office 2012 Multiple High Unknown General fund, FEMA
Orange County Department of Emergency Management, Sheriff’s Office
As funding allows
23 Install and replace generators in county fire and rescue stations 2005 Multiple High $160,650 General fund Orange County Department of Emergency Communications
Deleted Revised in 2012 plan, strategies #5 through 8
24 Prepare for loss of electricity at vulnerable facilities 2005 Multiple High Staff time General fund Orange County EOC Completed
25 Create an evacuation plan and clean up scenario in the event of a train derailment resulting in a toxic spill
2005 Hazardous Materials
Moderate Dependent on location
HMEP grants Orange County/Town or Orange Completed Included in County Emergency Operations Plan
26 Identify/prepare evacuation routes and shelter locations for natural or man‐made disasters
2005 Multiple Moderate Staff time General Fund, FEMA grans
Orange County EOC Completed Included in County Emergency Operations Plan
27 Develop a terrorism response plan 2005 Terrorism Moderate Staff time General fund Orange County Administration, EOC, Planning
Completed Partially covered through other plans
28 Design an early warning system for hazard events 2005 Multiple Moderate Staff time General fund Orange County EOC, Law enforcement Completed
29 In the floodplain ordinance, identify “flooding due to manmade structure” as a concern within the County, also determine ways to regulate development within the flood inundation zones as a function of the floodplain ordinance
2005 Flood Moderate Staff time General fund Orange County Planning and Zoning Completed Floodplain ordinance in place
30 Prepare for radiological problems from North Anna nuclear power station 2005 Hazardous Materials
High Staff time HMEP grants Orange County EOC Completed
31 Prevent development between Lake of the Woods Dam and the Rapidan River 2005 Flood Moderate Staff time General fund Orange County Planning and Zoning Completed Addressed through Dam Inundation statute
Rappahannock-Rapidan Regional Hazard Mitigation Plan 2012 Appendix A: Page 11

2012 Rappahannock‐Rapidan Region Mitigation Strategies
Town of Orange
Project #
Strategy Year Added
Hazard(s) Addressed
Priority Estimated Cost Funding Sources Lead Agency/Department Status/Schedule Comments
1 Plan for derailment of freight trains which pass through center of town (4,000 pop) – Large tank cars, chlorine, anhydrous, etc.
2005 Hazardous Materials
Moderate/High Dependent upon location and event
Hazardous Materials Emergency Preparedness grant
Town of Orange; Railroad Ongoing Also consider short‐term safety improvements at rail crossings
2 Implement preferred recommendation of the 2006 Baylor Creek Stream Restoration Study
2012 Flood Moderate Dependent upon recommendations implemented
Federal/State level grants Town of Orange Department of Community Development
As funding allows
3 Perform floodplain mapping of Town to determine base flood elevations.
2012 Flood Low Staff time None needed initially Town of Orange Department of Community Development
As staffing allows
4 Purchase residences in area(s) subject to recurrent flooding
2005 Flood, Hurricane, Tropical Storms
Low Dependent on number to be acquired
FEMA, local funds FEMA, Insurance Dependent on several factors
Modified for 2012 plan
5 Prepare for flow of people during an emergency 2005 Multiple Moderate Dependent on planning and implementation
HMEP, PDM Town of Orange Deleted
6 Assist in adoption of ordinance in building in known flood zones
2005 Flood Low Staff time None needed Town of Orange Community Development
Deleted
Rappahannock-Rapidan Regional Hazard Mitigation Plan 2012 Appendix A: Page 12

2012 Rappahannock‐Rapidan Region Mitigation Strategies
Rappahannock County
Project #
Strategy Year Added
Hazard(s) Addressed
Priority Estimated Cost
Funding Sources
Lead Agency/Department Status/Schedule Comments
1 Improve GIS data within the county in order to perform more accurate risk assessments.
2005 Multiple Low $10,000 to $15,000
Local Funds, Grants
Rappahannock County E‐911 Coordination
Ongoing
2 Develop/revitalize relationship with Red Cross for shelter operations planning. 2005 Multiple High None needed initially
None needed initially
Rappahannock County Emergency Coordination
Ongoing
3 Join the Community Rating System program to reduce the flood insurance premiums of citizens in the Rappahannock County and to foster better floodplain management practices.
2005 Flooding Low $1,000 to $3,000
Local Funds Rappahannock County Administration Ongoing
4 Coordinate wildfire planning with Shenandoah National Park. 2005 Wildfire High None needed initially
None needed initially
Rappahannock County Administration/Emergency Coordination
Ongoing
5 Promote “Firewise” fire protection by providing literature/brochures with each building permit issued in County for rural area construction.
2005 Wildfire Moderate <$1,000 annually
General Funds
Rappahannock County Administration Completed Has been implemented and part of continuing local coordination
6 Design and build a new EOC. 2005 All Hazards High Unknown General Funds, FEMA
Rappahannock County Administration Deferred Lack of funding
7 Identify relocation of commercial uses in floodplain 2005 Flooding Moderate $1 to 1.5M FEMA HMP Grants
Rappahannock County Building Official Deferred Lack of funding
8 Install emergency generators at county emergency shelters – Amissville Fire Department, Washington Fire Department
2012 All Hazards Moderate Unknown General Funds, FEMA
Rappahannock County Emergency Coordination
As funding allows
9 Install emergency generators at primary county emergency shelters at Rappahannock Elementary School and Rapppahannock County High School
2012 All Hazards Moderate Unknown General Funds, FEMA
Rappahannock County Emergency Coordination
As funding allows
Rappahannock-Rapidan Regional Hazard Mitigation Plan 2012 Appendix A: Page 13

APPENDIX B:
FEMA CROSSWALK
Appendix B contains a copy of the Local Hazard Mitigation Plan Review Crosswalk for the 2012 RRRC Regional Hazard Mitigation Plan. The plan was submitted to FEMA in May 2012 for review.
Note: The FEMA Crosswalk will be included in the final plan, pending review and comments from FEMA.

LOCAL MITIGATION PLAN REVIEW CROSSWALK
J U L Y 1 , 2 0 0 8 A - 1
INSTRUCTIONS FOR USING THE PLAN REVIEW CROSSWALK FOR REVIEW OF LOCAL MITIGATION PLANS Attached is a Plan Review Crosswalk based on the Local Multi-Hazard Mitigation Planning Guidance, published by FEMA in July, 2008. This Plan Review Crosswalk is consistent with the Robert T. Stafford Disaster Relief and Emergency Assistance Act (Stafford Act), as amended by Section 322 of the Disaster Mitigation Act of 2000 (P.L. 106-390), the National Flood Insurance Act of 1968, as amended by the National Flood Insurance Reform Act of 2004 (P.L. 108-264) and 44 Code of Federal Regulations (CFR) Part 201 – Mitigation Planning, inclusive of all amendments through October 31, 2007.
SCORING SYSTEM N – Needs Improvement: The plan does not meet the minimum for the requirement. Reviewer’s comments must be provided. S – Satisfactory: The plan meets the minimum for the requirement. Reviewer’s comments are encouraged, but not required.
Each requirement includes separate elements. All elements of a requirement must be rated “Satisfactory” in order for the requirement to be fulfilled and receive a summary score of “Satisfactory.” A “Needs Improvement” score on elements shaded in gray (recommended but not required) will not preclude the plan from passing. When reviewing single jurisdiction plans, reviewers may want to put an N/A in the boxes for multi-jurisdictional plan requirements. When reviewing multi-jurisdictional plans, however, all elements apply. States that have additional requirements can add them in the appropriate sections of the Local Multi-Hazard Mitigation Planning Guidance or create a new section and modify this Plan Review Crosswalk to record the score for those requirements. Optional matrices for assisting in the review of sections on profiling hazards, assessing vulnerability, and identifying and analyzing mitigation actions are found at the end of the Plan Review Crosswalk. The example below illustrates how to fill in the Plan Review Crosswalk.:
Assessing Vulnerability: Overview Requirement §201.6(c)(2)(ii): [The risk assessment shall include a] description of the jurisdiction’s vulnerability to the hazards described in paragraph (c)(2)(i) of this section. This description shall include an overall summary of each hazard and its impact on the community. Element
Location in thePlan (section or annex and page #)
Reviewer’s Comments
SCORE
N S
A. Does the new or updated plan include an overall summary description of the jurisdiction’s vulnerability to each hazard?
Section II, pp. 4-10 The plan describes the types of assets that are located within geographically defined hazard areas as well as those that would be affected by winter storms. �
B. Does the new or updated plan address the impact of each hazard on the jurisdiction?
Section II, pp. 10-20
The plan does not address the impact of two of the five hazards addressed in the plan.
Required Revisions: Include a description of the impact of floods and earthquakes on the assets.
Recommended Revisions: This information can be presented in terms of dollar value or percentages of damage.
�
SUMMARY SCORE �

LOCAL MITIGATION PLAN REVIEW CROSSWALK
J U L Y 1 , 2 0 0 8 A - 2
LOCAL MITIGATION PLAN REVIEW SUMMARY The plan cannot be approved if the plan has not been formally adopted. Each requirement includes separate elements. All elements of the requirement must be rated “Satisfactory” in order for the requirement to be fulfilled and receive a score of “Satisfactory.” Elements of each requirement are listed on the following pages of the Plan Review Crosswalk. A “Needs Improvement” score on elements shaded in gray (recommended but not required) will not preclude the plan from passing. Reviewer’s comments must be provided for requirements receiving a “Needs Improvement” score.
Prerequisite(s) (Check Applicable Box) NOT MET MET 1. Adoption by the Local Governing Body: §201.6(c)(5) OR
2. Multi-Jurisdictional Plan Adoption: §201.6(c)(5)
AND
3. Multi-Jurisdictional Planning Participation: §201.6(a)(3)
Planning Process N S 4. Documentation of the Planning Process: §201.6(b) and §201.6(c)(1)
Risk Assessment N S
5. Identifying Hazards: §201.6(c)(2)(i)
6. Profiling Hazards: §201.6(c)(2)(i)
7. Assessing Vulnerability: Overview: §201.6(c)(2)(ii) 8. Assessing Vulnerability: Addressing Repetitive Loss Properties. §201.6(c)(2)(ii)
9. Assessing Vulnerability: Identifying Structures, Infrastructure, and Critical Facilities: §201.6(c)(2)(ii)(B)
10. Assessing Vulnerability: Estimating Potential Losses: §201.6(c)(2)(ii)(B)
11. Assessing Vulnerability: Analyzing Development Trends: §201.6(c)(2)(ii)(C)
12. Multi-Jurisdictional Risk Assessment: §201.6(c)(2)(iii) *States that have additional requirements can add them in the appropriate sections of the Local Multi-Hazard Mitigation Planning Guidance or create a new section and modify this Plan Review Crosswalk to record the score for those requirements.
SCORING SYSTEM Please check one of the following for each requirement.
N – Needs Improvement: The plan does not meet the minimum for the requirement. Reviewer’s comments must be provided.
S – Satisfactory: The plan meets the minimum for the requirement.
Reviewer’s comments are encouraged, but not required.
Mitigation Strategy N S
13. Local Hazard Mitigation Goals: §201.6(c)(3)(i) 14. Identification and Analysis of Mitigation Actions: §201.6(c)(3)(ii)
15. Identification and Analysis of Mitigation Actions: NFIP Compliance. §201.6(c)(3)(ii)
16. Implementation of Mitigation Actions: §201.6(c)(3)(iii)
17. Multi-Jurisdictional Mitigation Actions: §201.6(c)(3)(iv)
Plan Maintenance Process N S 18. Monitoring, Evaluating, and Updating the Plan: §201.6(c)(4)(ii)
19. Incorporation into Existing Planning Mechanisms: §201.6(c)(4)(ii)
20. Continued Public Involvement: §201.6(c)(4)(iii)
Additional State Requirements* N S
Insert State Requirement
Insert State Requirement
Insert State Requirement
LOCAL MITIGATION PLAN APPROVAL STATUS
PLAN NOT APPROVED
See Reviewer’s Comments
PLAN APPROVED

LOCAL MITIGATION PLAN REVIEW CROSSWALK
J U L Y 1 , 2 0 0 8 A - 3
Local Mitigation Plan Review and Approval Status Jurisdiction: Rappahannock-Rapidan Region
Title of Plan: Rappahannock-Rapidan Regional Hazard Mitigation Plan
Date of Plan: 4/20/2012
Local Point of Contact: Patrick Mauney
Address: 420 Southridge Parkway, #106 Culpeper, VA 22701 Title:
GIS Program Manager Agency: Rappahannock-Rapidan Regional Commission Phone Number: 540.829.7450
E-Mail: [email protected]
State Reviewer:
Title: Date:
FEMA Reviewer:
Title: Date:
Date Received in FEMA Region [Insert #]
Plan Not Approved
Plan Approved
Date Approved
Jurisdiction:
NFIP Status*
Y N N/A CRS Class
1. Culpeper County, Virginia X
2. Fauquier County, Virginia X
3. Madison County, Virginia X
4. Orange County, Virginia X
5. Rappahannock County, Virginia X
* Notes: Y = Participating N = Not Participating N/A = Not Mapped

LOCAL MITIGATION PLAN REVIEW CROSSWALK
J U L Y 1 , 2 0 0 8 A - 4
Local Mitigation Plan Review and Approval Status Jurisdiction: Rappahannock-Rapidan Region
Title of Plan: Rappahannock-Rapidan Regional Hazard Mitigation Plan
Date of Plan: 4/20/2012
Local Point of Contact: Patrick Mauney
Address: 420 Southridge Parkway, #106 Culpeper, VA 22701 Title:
GIS Program Manager Agency: Rappahannock-Rapidan Regional Commission Phone Number: 540.829.7450
E-Mail: [email protected]
State Reviewer:
Title: Date:
FEMA Reviewer:
Title: Date:
Date Received in FEMA Region [Insert #]
Plan Not Approved
Plan Approved
Date Approved
Jurisdiction:
NFIP Status*
Y N N/A CRS Class
1. Town of Culpeper, Virginia X
2. Town of Madison, Virginia X
3. Town of Orange, Virginia X
4. Town of Remington, Virginia X
5. Town of Warrenton, Virginia X
* Notes: Y = Participating N = Not Participating N/A = Not Mapped

LOCAL MITIGATION PLAN REVIEW CROSSWALK
J U L Y 1 , 2 0 0 8 A - 5
PREREQUISITE(S) 1. Adoption by the Local Governing Body
Requirement §201.6(c)(5): [The local hazard mitigation plan shall include] documentation that the plan has been formally adopted by the governing body of the jurisdiction requesting approval of the plan (e.g., City Council, County Commissioner, Tribal Council).
Element
Location in the Plan (section or annex and page #) Reviewer’s Comments
SCORE NOT MET
MET
A. Has the local governing body adopted new or updated plan?
Appendix D, page 1
B. Is supporting documentation, such as a resolution, included?
Appendix D, pages 2 - 11
SUMMARY SCORE
3. Multi-Jurisdictional Planning Participation
Requirement §201.6(a)(3): Multi-jurisdictional plans (e.g., watershed plans) may be accepted, as appropriate, as long as each jurisdiction has participated in the process … Statewide plans will not be accepted as multi-jurisdictional plans.
Element
Location in the Plan (section or annex and page #)
Reviewer’s Comments
SCORE NOT MET
MET
A. Does the new or updated plan describe how each jurisdiction participated in the plan’s development?
Section 2, pages 3 - 5
B. Does the updated plan identify all participating jurisdictions, including new, continuing, and the jurisdictions that no longer participate in the plan?
Section 1, page 4
SUMMARY SCORE
2. Multi-Jurisdictional Plan Adoption
Requirement §201.6(c)(5): For multi-jurisdictional plans, each jurisdiction requesting approval of the plan must document that it has been formally adopted.
Element
Location in the Plan (section or annex and page #) Reviewer’s Comments
SCORE NOT MET
MET
A. Does the new or updated plan indicate the specific jurisdictions represented in the plan?
Section 1, page 4
B. For each jurisdiction, has the local governing body adopted the new or updated plan?
Appendix D, pages 2 - 11
C. Is supporting documentation, such as a resolution, included for each participating jurisdiction?
Appendix D, pages 2 - 11
SUMMARY SCORE

LOCAL MITIGATION PLAN REVIEW CROSSWALK
J U L Y 1 , 2 0 0 8 A - 6
PLANNING PROCESS: §201.6(b): An open public involvement process is essential to the development of an effective plan.
4. Documentation of the Planning Process
Requirement §201.6(b): In order to develop a more comprehensive approach to reducing the effects of natural disasters, the planning process shall include: (1) An opportunity for the public to comment on the plan during the drafting stage and prior to plan approval; (2) An opportunity for neighboring communities, local and regional agencies involved in hazard mitigation activities, and agencies that have the authority to
regulate development, as well as businesses, academia and other private and non-profit interests to be involved in the planning process; and (3) Review and incorporation, if appropriate, of existing plans, studies, reports, and technical information.
Requirement §201.6(c)(1): [The plan shall document] the planning process used to develop the plan, including how it was prepared, who was involved in the process, and how the public was involved.
Element
Location in thePlan (section or annex and page #)
Reviewer’s Comments
SCORE N S
A. Does the plan provide a narrative description of the process followed to prepare the new or updated plan?
Section 2, pages 3 – 12
B. Does the new or updated plan indicate who was involved in the current planning process? (For example, who led the development at the staff level and were there any external contributors such as contractors? Who participated on the plan committee, provided information, reviewed drafts, etc.?)
Section 2, pages 3 – 5; Appendix C, pages 73 - 79
C. Does the new or updated plan indicate how the public was involved? (Was the public provided an opportunity to comment on the plan during the drafting stage and prior to the plan approval?)
Section 2, pages 4 – 5; Appendix C, pages 96 - 101
D. Does the new or updated plan discuss the opportunity for neighboring communities, agencies, businesses, academia, nonprofits, and other interested parties to be involved in the planning process?
Section 2, page 3; Section 9, pages 2 - 4
E. Does the planning process describe the review and incorporation, if appropriate, of existing plans, studies, reports, and technical information?
Section 7, pages 1 - 9
F. Does the updated plan document how the planning team reviewed and analyzed each section of the plan and whether each section was revised as part of the update process?
Section 2, page 4
SUMMARY SCORE

LOCAL MITIGATION PLAN REVIEW CROSSWALK
J U L Y 1 , 2 0 0 8 A - 7
RISK ASSESSMENT: §201.6(c)(2): The plan shall include a risk assessment that provides the factual basis for activities proposed in the strategy to reduce losses from identified hazards. Local risk assessments must provide sufficient information to enable the jurisdiction to identify and prioritize appropriate mitigation actions to reduce losses from identified hazards.
5. Identifying Hazards Requirement §201.6(c)(2)(i): [The risk assessment shall include a] description of the type … of all natural hazards that can affect the jurisdiction. Element
Location in the Plan (section or annex and page #)
Reviewer’s Comments
SCORE
N S
A. Does the new or updated plan include a description of the types of all natural hazards that affect the jurisdiction?
Section 4, pages 1 - 29
SUMMARY SCORE
6. Profiling Hazards Requirement §201.6(c)(2)(i): [The risk assessment shall include a] description of the … location and extent of all natural hazards that can affect the jurisdiction. The plan shall include information on previous occurrences of hazard events and on the probability of future hazard events.
Element
Location in thePlan (section or annex and page #)
Reviewer’s Comments
SCORE N S
A. Does the risk assessment identify the location (i.e., geographic area affected) of each natural hazard addressed in the new or updated plan?
Section 5, pages 1 - 20
B. Does the risk assessment identify the extent (i.e., magnitude or severity) of each hazard addressed in the new or updated plan?
Section 5, pages 1 – 20
C. Does the plan provide information on previous occurrences of each hazard addressed in the new or updated plan?
Section 5, pages 1 – 20
D. Does the plan include the probability of future events (i.e., chance of occurrence) for each hazard addressed in the new or updated plan?
Section 5, pages 1 - 20
SUMMARY SCORE

LOCAL MITIGATION PLAN REVIEW CROSSWALK
J U L Y 1 , 2 0 0 8 A - 8
7. Assessing Vulnerability: Overview Requirement §201.6(c)(2)(ii): [The risk assessment shall include a] description of the jurisdiction’s vulnerability to the hazards described in paragraph (c)(2)(i) of this section. This description shall include an overall summary of each hazard and its impact on the community.
Element
Location in thePlan (section or annex and page #)
Reviewer’s Comments
SCORE N S
A. Does the new or updated plan include an overall summary description of the jurisdiction’s vulnerability to each hazard?
Section 6, pages 1 – 25
B. Does the new or updated plan address the impact of each hazard on the jurisdiction?
Section 6, pages 1 - 25
SUMMARY SCORE
8. Assessing Vulnerability: Addressing Repetitive Loss Properties Requirement §201.6(c)(2)(ii): [The risk assessment] must also address National Flood Insurance Program (NFIP) insured structures that have been repetitively damaged floods.
Element
Location in thePlan (section or annex and page #)
Reviewer’s Comments
SCORE N S
A. Does the new or updated plan describe vulnerability in terms of the types and numbers of repetitive loss properties located in the identified hazard areas?
Section 6, page 17
Note: This requirement becomes effective for all local plans approved after October 1, 2008.
SUMMARY SCORE
9. Assessing Vulnerability: Identifying Structures Requirement §201.6(c)(2)(ii)(A): The plan should describe vulnerability in terms of the types and numbers of existing and future buildings, infrastructure, and critical facilities located in the identified hazard area … .
Element
Location in thePlan (section or annex and page #)
Reviewer’s Comments
SCORE N S
A. Does the new or updated plan describe vulnerability in terms of the types and numbers of existing buildings, infrastructure, and critical facilities located in the identified hazard areas?
Section 6, pages 1 – 25
Note: A “Needs Improvement” score on this requirement will not preclude the plan from passing.
B. Does the new or updated plan describe vulnerability in terms of the types and numbers of future buildings, infrastructure, and critical facilities located in the identified hazard areas?
Section 6, pages 1 – 25
Note: A “Needs Improvement” score on this requirement will not preclude the plan from passing.
SUMMARY SCORE
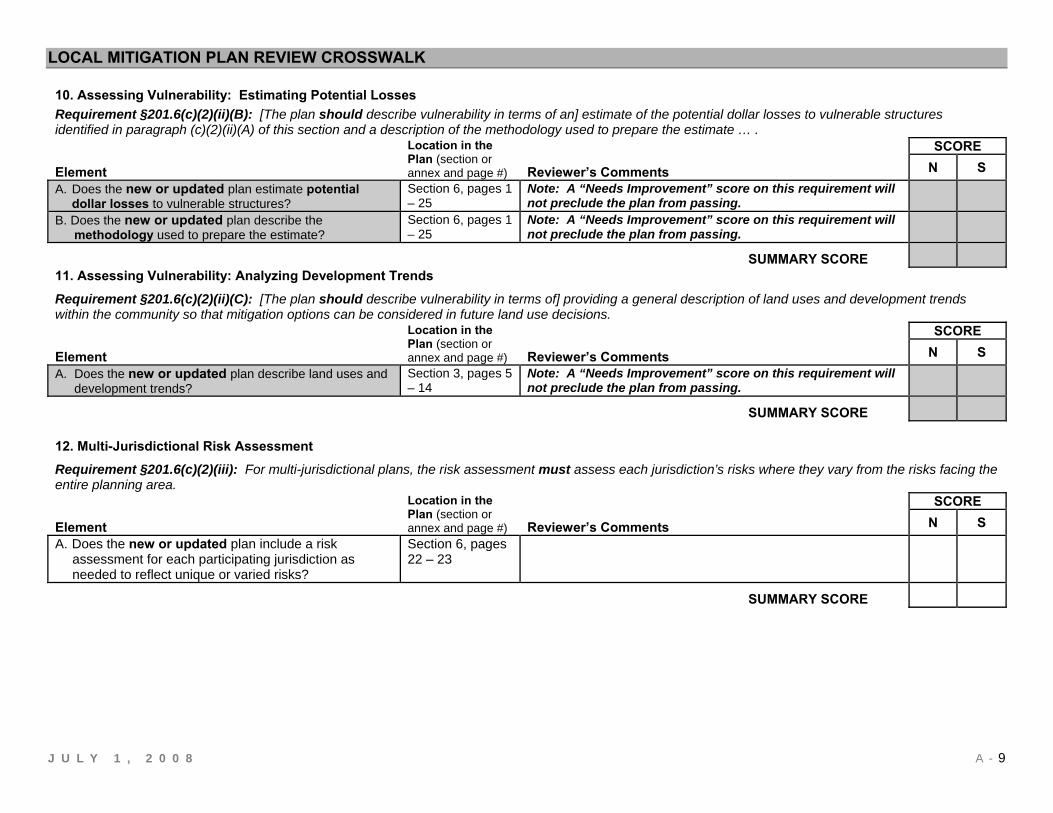
LOCAL MITIGATION PLAN REVIEW CROSSWALK
J U L Y 1 , 2 0 0 8 A - 9
10. Assessing Vulnerability: Estimating Potential Losses Requirement §201.6(c)(2)(ii)(B): [The plan should describe vulnerability in terms of an] estimate of the potential dollar losses to vulnerable structures identified in paragraph (c)(2)(ii)(A) of this section and a description of the methodology used to prepare the estimate … .
Element
Location in thePlan (section or annex and page #)
Reviewer’s Comments
SCORE N S
A. Does the new or updated plan estimate potential dollar losses to vulnerable structures?
Section 6, pages 1 – 25
Note: A “Needs Improvement” score on this requirement will not preclude the plan from passing.
B. Does the new or updated plan describe the methodology used to prepare the estimate?
Section 6, pages 1 – 25
Note: A “Needs Improvement” score on this requirement will not preclude the plan from passing.
SUMMARY SCORE
11. Assessing Vulnerability: Analyzing Development Trends
Requirement §201.6(c)(2)(ii)(C): [The plan should describe vulnerability in terms of] providing a general description of land uses and development trends within the community so that mitigation options can be considered in future land use decisions.
Element
Location in thePlan (section or annex and page #)
Reviewer’s Comments
SCORE N S
A. Does the new or updated plan describe land uses and development trends?
Section 3, pages 5 – 14
Note: A “Needs Improvement” score on this requirement will not preclude the plan from passing.
SUMMARY SCORE
12. Multi-Jurisdictional Risk Assessment
Requirement §201.6(c)(2)(iii): For multi-jurisdictional plans, the risk assessment must assess each jurisdiction’s risks where they vary from the risks facing the entire planning area.
Element
Location in thePlan (section or annex and page #)
Reviewer’s Comments
SCORE N S
A. Does the new or updated plan include a risk assessment for each participating jurisdiction as needed to reflect unique or varied risks?
Section 6, pages 22 – 23
SUMMARY SCORE

LOCAL MITIGATION PLAN REVIEW CROSSWALK
J U L Y 1 , 2 0 0 8 A - 10
MITIGATION STRATEGY: §201.6(c)(3): The plan shall include a mitigation strategy that provides the jurisdiction’s blueprint for reducing the potential losses identified in the risk assessment, based on existing authorities, policies, programs and resources, and its ability to expand on and improve these existing tools.
13. Local Hazard Mitigation Goals
Requirement §201.6(c)(3)(i): [The hazard mitigation strategy shall include a] description of mitigation goals to reduce or avoid long-term vulnerabilities to the identified hazards.
Element
Location in thePlan (section or annex and page #)
Reviewer’s Comments
SCORE N S
A Does the new or updated plan include a description of mitigation goals to reduce or avoid long-term vulnerabilities to the identified hazards?
Section 8, page 2
SUMMARY SCORE
14. Identification and Analysis of Mitigation Actions
Requirement §201.6(c)(3)(ii): [The mitigation strategy shall include a] section that identifies and analyzes a comprehensive range of specific mitigation actions and projects being considered to reduce the effects of each hazard, with particular emphasis on new and existing buildings and infrastructure.
Element
Location in thePlan (section or annex and page #)
Reviewer’s Comments
SCORE N S
A. Does the new or updated plan identify and analyze a comprehensive range of specific mitigation actions and projects for each hazard?
Section 8, pages 3 – 7; Appendix A, pages 2 – 13
B Do the identified actions and projects address reducing the effects of hazards on new buildings and infrastructure?
Section 8, pages 2 – 7
C. Do the identified actions and projects address reducing the effects of hazards on existing buildings and infrastructure?
Section 8, pages 2 – 7
SUMMARY SCORE

LOCAL MITIGATION PLAN REVIEW CROSSWALK
J U L Y 1 , 2 0 0 8 A - 11
15. Identification and Analysis of Mitigation Actions: National Flood Insurance Program (NFIP) Compliance
Requirement: §201.6(c)(3)(ii): [The mitigation strategy] must also address the jurisdiction’s participation in the National Flood Insurance Program (NFIP), and continued compliance with NFIP requirements, as appropriate. Element
Location in the Plan (section or annex and page #)
Reviewer’s Comments
SCORE
N S
A. Does the new or updated plan describe the jurisdiction (s) participation in the NFIP?
Section 6, page 15 Note: This requirement becomes effective for all local mitigation plans approved after October 1, 2008.
B. Does the mitigation strategy identify, analyze and prioritize actions related to continued compliance with the NFIP?
Appendix A, page 2 Note: This requirement becomes effective for all local mitigation plans approved after October 1, 2008.
SUMMARY SCORE
16. Implementation of Mitigation Actions
Requirement: §201.6(c)(3)(iii): [The mitigation strategy section shall include] an action plan describing how the actions identified in section (c)(3)(ii) will be prioritized, implemented, and administered by the local jurisdiction. Prioritization shall include a special emphasis on the extent to which benefits are maximized according to a cost benefit review of the proposed projects and their associated costs. Element
Location in the Plan (section or annex and page #)
Reviewer’s Comments
SCORE
N S
A. Does the new or updated mitigation strategy include how the actions are prioritized? (For example, is there a discussion of the process and criteria used?)
Section 8, page 6
B. Does the new or updated mitigation strategy address how the actions will be implemented and administered, including the responsible department , existing and potential resources and the timeframe to complete each action?
Section 8, pages 5 – 6; Appendix A, pages 2 – 13
C. Does the new or updated prioritization process include an emphasis on the use of a cost-benefit review to maximize benefits?
Section 8, page 6
D. Does the updated plan identify the completed, deleted or deferred mitigation actions as a benchmark for progress, and if activities are unchanged (i.e., deferred), does the updated plan describe why no changes occurred?
Section 8, page 7; Section 9, pages 1 – 2; Appendix A, pages 2 - 13
SUMMARY SCORE

LOCAL MITIGATION PLAN REVIEW CROSSWALK
J U L Y 1 , 2 0 0 8 A - 12
17. Multi-Jurisdictional Mitigation Actions
Requirement §201.6(c)(3)(iv): For multi-jurisdictional plans, there must be identifiable action items specific to the jurisdiction requesting FEMA approval or credit of the plan.
Element
Location in thePlan (section or annex and page #)
Reviewer’s Comments
SCORE N S
A Does the new or updated plan include identifiable action items for each jurisdiction requesting FEMA approval of the plan?
Appendix A, pages 2 – 13
B. Does the updated plan identify the completed, deleted or deferred mitigation actions as a benchmark for progress, and if activities are unchanged (i.e., deferred), does the updated plan describe why no changes occurred?
Section 8, page 7; Section 9, pages 1 – 2; Appendix A, pages 2 – 13
SUMMARY SCORE
PLAN MAINTENANCE PROCESS
18. Monitoring, Evaluating, and Updating the Plan Requirement §201.6(c)(4)(i): [The plan maintenance process shall include a] section describing the method and schedule of monitoring, evaluating, and updating the mitigation plan within a five-year cycle.
Element
Location in the Plan (section or annex and page #)
Reviewer’s Comments
SCORE
N S
A. Does the new or updated plan describe the method and schedule for monitoring the plan, including the responsible department?
Section 9, pages 2 -4
B. Does the new or updated plan describe the method and schedule for evaluating the plan, including how, when and by whom (i.e. the responsible department)?
Section 9, pages 2 – 4
C. Does the new or updated plan describe the method and schedule for updating the plan within the five-year cycle?
Section 9, pages 2 – 4
SUMMARY SCORE

LOCAL MITIGATION PLAN REVIEW CROSSWALK
J U L Y 1 , 2 0 0 8 A - 13
19. Incorporation into Existing Planning Mechanisms Requirement §201.6(c)(4)(ii): [The plan shall include a] process by which local governments incorporate the requirements of the mitigation plan into other planning mechanisms such as comprehensive or capital improvement plans, when appropriate.
Element
Location in the Plan (section or annex and page #)
Reviewer’s Comments
SCORE
N S
A. Does the new or updated plan identify other local planning mechanisms available for incorporating the mitigation requirements of the mitigation plan?
Section 7, pages 2 – 3; Section 9, page 2
B. Does the new or updated plan include a process by which the local government will incorporate the mitigation strategy and other information contained in the plan (e.g., risk assessment) into other planning mechanisms, when appropriate?
Section 9, page 2
C. Does the updated plan explain how the local government incorporated the mitigation strategy and other information contained in the plan (e.g., risk assessment) into other planning mechanisms, when appropriate?
Section 8, page 7; Section 9, pages 2 -3; Appendix A, pages 2 - 13
SUMMARY SCORE
Continued Public Involvement
Requirement §201.6(c)(4)(iii): [The plan maintenance process shall include a] discussion on how the community will continue public participation in the plan maintenance process.
Element
Location in thePlan (section or annex and page #)
Reviewer’s Comments
SCORE N S
A. Does the new or updated plan explain how continued public participation will be obtained? (For example, will there be public notices, an on-going mitigation plan committee, or annual review meetings with stakeholders?)
Section 9, pages 2 - 4
SUMMARY SCORE

LOCAL MITIGATION PLAN REVIEW CROSSWALK
J U L Y 1 , 2 0 0 8 A - 14
MATRIX A: PROFILING HAZARDS This matrix can assist FEMA and the State in scoring each hazard. Local jurisdictions may find the matrix useful to ensure that their plan addresses each natural hazard that can affect the jurisdiction. Completing the matrix is not required.
Note: First, check which hazards are identified in requirement §201.6(c)(2)(i). Then, place a checkmark in either the N or S box for each applicable hazard. An “N” for any element of any identified hazard will result in a “Needs Improvement” score for this requirement. List the hazard and its related shortcoming in the comments section of the Plan Review Crosswalk.
Hazard Type
Hazards Identified Per Requirement
§201.6(c)(2)(i) A. Location B. Extent C. Previous
Occurrences D. Probability of
Future Events
Yes N S N S N S N S Avalanche Coastal Erosion Coastal Storm Dam Failure Drought Earthquake Expansive Soils Levee Failure Flood Hailstorm Hurricane Land Subsidence Landslide Severe Winter Storm Tornado Tsunami Volcano Wildfire Windstorm Other Other Other
Legend:
§201.6(c)(2)(i) Profiling Hazards A. Does the risk assessment identify the location (i.e., geographic area affected) of each hazard addressed in the new or updated plan? B. Does the risk assessment identify the extent (i.e., magnitude or severity) of each hazard addressed in the new or updated plan? C. Does the plan provide information on previous occurrences of each natural hazard addressed in the new or updated plan? D. Does the plan include the probability of future events (i.e., chance of occurrence) for each hazard addressed in the plan?
To check boxes, double
click on the box and
change the default value to “checked.”

LOCAL MITIGATION PLAN REVIEW CROSSWALK
J U L Y 1 , 2 0 0 8 A - 15
MATRIX B: ASSESSING VULNERABILITY This matrix can assist FEMA and the State in scoring each hazard. Local jurisdictions may find the matrix useful to ensure that the new or updated plan addresses each requirement. Completing the matrix is not required.
Note: First, check which hazards are identified in requirement §201.6(c)(2)(i). Then, place a checkmark in either the N or S box for each applicable hazard. An “N” for any element of any identified hazard will result in a “Needs Improvement” score for this requirement. List the hazard and its related shortcoming in the comments section of the Plan Review Crosswalk. Note: Receiving an N in the shaded columns will not preclude the plan from passing.
Hazard Type
Hazards Identified Per Requirement §201.6(c)(2)(i)
§201
.6(c
)(2)(i
i) A
sses
sing
Vul
nera
bilit
y: O
verv
iew
A. Overall Summary
Description of Vulnerability
B. Hazard Impact
§201
.6(c
)(2)(i
i) A
sses
sing
Vul
nera
bilit
y: I
dent
ifyin
g St
ruct
ures
A. Types and Number of Existing Structures
in Hazard Area (Estimate)
B. Types and Number of Future
Structures in Hazard Area (Estimate)
§201
.6(c
)(2)(i
i) A
sses
sing
Vul
nera
bilit
y: E
stim
atin
g Po
tent
ial L
osse
s A. Loss Estimate B. Methodology
Yes N S N S N S N S N S N S Avalanche Coastal Erosion Coastal Storm Dam Failure Drought Earthquake Expansive Soils Levee Failure Flood Hailstorm Hurricane Land Subsidence Landslide Severe Winter Storm Tornado Tsunami Volcano Wildfire Windstorm Other Other Other
Legend: §201.6(c)(2)(ii) Assessing Vulnerability: Overview
A. Does the new or updated plan include an overall summary description of the jurisdiction’s vulnerability to each hazard?
B. Does the new or updated plan address the impact of each hazard on the jurisdiction? §201.6(c)(2)(ii)(A) Assessing Vulnerability: Identifying Structures
A. Does the new or updated plan describe vulnerability in terms of the types and numbers of existing buildings, infrastructure, and critical facilities located in the identified hazard areas?
B. Does the new or updated plan describe vulnerability in terms of the types and numbers of
future buildings, infrastructure, and critical facilities located in the identified hazard areas? §201.6(c)(2)(ii)(B) Assessing Vulnerability: Estimating Potential Losses A. Does the new or updated plan estimate potential dollar losses to vulnerable structures?
B. Does the new or updated plan describe the methodology used to prepare the estimate?
To check boxes, double
click on the box and
change the default value to “checked.”

LOCAL MITIGATION PLAN REVIEW CROSSWALK
J U L Y 1 , 2 0 0 8 A - 16
MATRIX C: IDENTIFICATION AND ANALYSIS OF MITIGATION ACTIONS This matrix can assist FEMA and the State in scoring each hazard. Local jurisdictions may find the matrix useful to ensure consideration of a range of actions for each hazard. Completing the matrix is not required. Note: First, check which hazards are identified in requirement §201.6(c)(2)(i). Then, place a checkmark in either the N or S box for each applicable hazard. An “N” for any identified hazard will result in a “Needs Improvement” score for this requirement. List the hazard and its related shortcoming in the comments section of the Plan Review Crosswalk.
Hazard Type
Hazards IdentifiedPer Requirement
§201.6(c)(2)(i)
A. Comprehensive Range of Actions
and Projects Yes N S
Avalanche Coastal Erosion Coastal Storm Dam Failure Drought Earthquake Expansive Soils Levee Failure Flood Hailstorm Hurricane Land Subsidence Landslide Severe Winter Storm Tornado Tsunami Volcano Wildfire Windstorm Other Other Other
Legend: §201.6(c)(3)(ii) Identification and Analysis of Mitigation Actions A. Does the new or updated plan identify and analyze a comprehensive range of specific mitigation actions and projects for each hazard?
To check boxes, double
click on the box and
change the default value to “checked.”

APPENDIX C:
SUPPORTING DOCUMENTATION
Appendix C contains the following supporting documentation for the 2012 RRRC Regional Hazard Mitigation Plan:
• Meeting Announcements/Press Releases • Meeting Agendas • Meeting Summaries • Steering Committee presentations • Meeting Sign-in Sheets • 2012 RRRC Regional Hazard Mitigation Data Collection Guide • Public Participation Survey form

1
planinfo
From: Deirdre Clark [[email protected]]Sent: Monday, January 11, 2010 10:28 AMTo: '[email protected]'; '[email protected]';
'[email protected]'; '[email protected]'; '[email protected]'; '[email protected]'; '[email protected]'; '[email protected]'; '[email protected]'; '[email protected]'; '[email protected]'; '[email protected]'; '[email protected]'; '[email protected]'; '[email protected]'; '[email protected]'; '[email protected].'; '[email protected]'; '[email protected]'; '[email protected]'; '[email protected]'; '[email protected]'; '[email protected]'; '[email protected]'; '[email protected]'; '[email protected]'; '[email protected]'; '[email protected]'; '[email protected]'; '[email protected]'; '[email protected]'; '[email protected]'; '[email protected]'; '[email protected]'; '[email protected]'; '[email protected]'; '[email protected]'; '[email protected]'; '[email protected]'; '[email protected]'; '[email protected]'; '[email protected]'; '[email protected]'; '[email protected]'; '[email protected]'; '[email protected]'; '[email protected]'; '[email protected]'; '[email protected]'; '[email protected]'; '[email protected]'; '[email protected]'; '[email protected]'; '[email protected]'; '[email protected]'; '[email protected]'; '[email protected]'; '[email protected]'; '[email protected]'
Cc: 'Howard, Amy'Subject: R-R Region All Hazard Mitigation Plan Update - Save the Date!Attachments: Meeting1.Ltr.1.8.10.doc
Good Morning All, Please find attached notification of our upcoming kickoff of the revision of the Rappahannock‐Rapidan Region Multi‐Jurisdictional All Hazard Mitigation Plan. A hard copy of this letter will follow by mail. Please plan to join us on Wednesday, February 3rd at the Culpeper Depot (109 South Commerce Street, Culpeper, VA 22701) from 10 AM to noon to initiate the revision process. Please indicate your availability to attend by January 27, 2010. The names and contact information of any other applicable representatives from your locality or organization are requested by that time, as well. Hope to see you on the 3rd! Deirdre Deirdre B. Clark, Regional Planner Rappahannock‐Rapidan Regional Commission 420 Southridge Parkway, Suite 106 Culpeper, Virginia 22701 540.829.7450 [email protected]
Rappahannock-Rapidan Regional Hazard Mitigation Plan 2012 Appendix C: Page 2

OFFICERS CHAIRMAN JAMES RISNER VICE-CHAIRMAN ROBERT COINER TREASURER HUNT CHEATWOOD SECRETARY & EXECUTIVE DIRECTOR JEFFREY P. WALKER COMMISSIONERS CULPEPER COUNTY SUE D. HANSOHN RUTH B. UPDIKE TOWN OF CULPEPER THOMAS HUGGARD JAMES RISNER FAUQUIER COUNTY ANTHONY I. HOOPER CHESTER W. STRIBLING TOWN OF REMINGTON CALLIE R. KYHL TOWN OF THE PLAINS ROBERT GURTLER TOWN OF WARRENTON POWELL L. DUGGAN W. HUNT CHEATWOOD MADISON COUNTY JAMES L. ARRINGTON VACANT TOWN OF MADISON WILLIAM L. LAMAR ORANGE COUNTY JULIE JORDAN GROVER C. WILSON, JR. TOWN OF ORANGE JOHN BAILEY HARRY C. HOPKINS, JR. TOWN OF GORDONSVILLE ROBERT COINER RAPPAHANNOCK COUNTY JOHN W. McCARTHY ROGER WELCH TOWN OF WASHINGTON JOHN FOX SULLIVAN As of January 2010 420 Southridge Parkway, Suite 106, Culpeper, Virginia 22701
Phone 540.829.7450 Fax 540.829-7452 www.rrregion.org www.rrcommute.org www.thevirginiapiedmont.org
January 11, 2010 RE: Rappahannock-Rapidan Regional All-Hazards Mitigation Plan Revision
Dear Stakeholder:
The Rappahannock-Rapidan Regional Commission (RRRC) is pleased to announce the receipt of a grant from the Virginia Department of Emergency Management (VDEM) to help fund the required update of the Rappahannock-Rapidan Regional All Hazards Mitigation Plan. Please join us on February 3, 2010, 10am to noon, at the Culpeper Depot (109 South Commerce Street, Culpeper, VA 22701) for the kick-off of this important initiative. Representatives from VDEM will be in attendance to discuss program requirements and the revision process. The original plan may be accessed at VDEM's website: http://www.vdem.state.va.us/library/plans/mitigation.cfm. As you know, the purpose of this mandatory planning process is to help ensure region-wide preparedness for natural hazards, and local eligibility for funding under the Pre-Disaster and Hazard Mitigation Grant Programs. Input from all RRRC member jurisdictions is essential to develop a revised plan that accurately reflects local and regional hazard history, vulnerabilities and capabilities, as well as mitigation goals and strategies. Due to the complexity and specific nature of analysis needed to complete plan requirements, RRRC welcomes your participation as well as that of any additional colleagues and members of your staff as you deem appropriate. The expertise, insight and continued involvement of community development professionals, emergency services coordinators, appointed and elected officials, transportation experts, informed citizens and others will maximize opportunities for efficiency in developing a comprehensive update. Please call 540.829.7450 or e-mail [email protected] by January 27, 2010 to indicate your availability to attend this meeting. The names and contact information of any other applicable representatives from your locality or organization are requested by that time, as well. We look forward to working with you on this initiative and appreciate your participation. Sincerely,
Deirdre B. Clark Regional Planner
Rappahannock-Rapidan Regional Hazard Mitigation Plan 2012 Appendix C: Page 3

Rappahannock-Rapidan Region All-Hazards Mitigation Plan Update
Concerned about local and regional hazard preparedness? Plan to participate in the update of the region's hazard mitigation plan. Following the recent award of grant funding from the Virginia Department of Emergency Management (VDEM), the Rappahannock-Rapidan Regional Commission (R-RRC) is
preparing to initiate the update of the All-Hazard Mitigation Plan for Culpeper, Fauquier, Madison, Orange and Rappahannock counties and their respective municipalities. Updating the plan will help ensure region-wide preparedness for natural hazards, and meet requirements for funding eligibility under the Pre-Disaster and Hazard Mitigation Grant Programs. A revision team made up of representatives from all RRRC member jurisdictions will collaborate to develop a plan that accurately reflects local and regional hazard history, identifies vulnerabilities and capabilities, and determines mitigation strategies. Interested citizens, planning professionals, emergency services coordinators, law
enforcement officers, appointed and elected officials, and transportation experts are invited to attend the kick-off of this important initiative. It will be held on February 3, 2010, 10am to noon, at the Culpeper Depot (109 South Commerce Street, Culpeper, VA 22701). Representatives from RRRC and VDEM will discuss program requirements, the revision process and participation opportunities. The original plan may be accessed at VDEM's website: http://www.vdem.state.va.us/library/plans/mitigation.cfm. For additional information, please contact Deirdre Clark, RRRC Regional Planner, at 540.829.7450 or [email protected].
Rappahannock-Rapidan Regional Hazard Mitigation Plan 2012 Appendix C: Page 4

1
planinfo
From: Deirdre Clark [[email protected]]Sent: Tuesday, February 02, 2010 2:00 PMTo: '[email protected]'; '[email protected]';
'[email protected]'; '[email protected]'; '[email protected]'; '[email protected]'; '[email protected]'; '[email protected]'; '[email protected]'; '[email protected]'; '[email protected]'; '[email protected]'; '[email protected]'; 'Lanny'; '[email protected]'; '[email protected]'; '[email protected]'; '[email protected].'; '[email protected]'; '[email protected]'; '[email protected]'; '[email protected]'; '[email protected]'; '[email protected]'; '[email protected]'; '[email protected]'; '[email protected]'; '[email protected]'; '[email protected]'; '[email protected]'; '[email protected]'; '[email protected]'; '[email protected]'; '[email protected]'; '[email protected]'; '[email protected]'; '[email protected]'; '[email protected]'; '[email protected]'; '[email protected]'; '[email protected]'; '[email protected]'; '[email protected]'; '[email protected]'; '[email protected]'; '[email protected]'; '[email protected]'; '[email protected]'; '[email protected]'; '[email protected]'; '[email protected]'; '[email protected]'; '[email protected]'; '[email protected]'; '[email protected]'; '[email protected]'; '[email protected]'; '[email protected]'; '[email protected]'; '[email protected]'; '[email protected]'; '[email protected]'
Cc: 'Howard, Amy'Subject: R-RRC Meeting - Hazard Mitigation Plan Update
Importance: High
Good Afternoon All, Due to the inclement weather forecast for tomorrow, our meeting has been re‐scheduled as follows: February 23rd, 10 AM‐noon R‐RRC Offices 420 Southridge Parkway, Suite 106 Culpeper, VA 22701 Please share this notice with those who might have planned to attend but were not on the original distribution list. Thank you! Looking forward to working with you on the 23rd! Deirdre Deirdre B. Clark, Regional Planner Rappahannock‐Rapidan Regional Commission 420 Southridge Parkway, Suite 106 Culpeper, Virginia 22701 540.829.7450 [email protected]
Rappahannock-Rapidan Regional Hazard Mitigation Plan 2012 Appendix C: Page 5

Rappahannock-Rapidan Regional Commission
420 Southridge Parkway Suite 106
Culpeper, VA 22701
PRESS RELEASE
FOR IMMEDIATE RELEASE
Date: February 16, 2010
Contact: Deirdre Clark
Phone: (540) 829-7450
Fax: (540) 829-7452
Please publish this meeting announcement in your Community Calendar/Events section. Thank you.
The Rappahannock-Rapidan Regional Commission is hosting a kickoff meeting for an update to the Regional Hazard Mitigation Plan on February 23, 2010 from 10am to 12pm at the Regional Commission offices:
420 Southridge Parkway, #106
Culpeper, VA 22701
This meeting was postponed from February 3, 2010 due to inclement weather. Please see below for additional information.
Rappahannock-Rapidan Regional Hazard Mitigation Plan 2012 Appendix C: Page 6

Rappahannock-Rapidan Region
All-Hazards Mitigation Plan Update
Concerned about local and regional hazard preparedness? Plan to participate in the update of the region's hazard mitigation plan. Following the recent award of grant funding from the Virginia Department of Emergency Management (VDEM), the Rappahannock-Rapidan Regional
Commission (R-RRC) is preparing to initiate the update of the All-Hazard Mitigation Plan for Culpeper, Fauquier, Madison, Orange and Rappahannock counties and their respective municipalities. Updating the plan will help ensure region-wide preparedness for natural hazards, and meet requirements for funding eligibility under the Pre-Disaster and Hazard Mitigation Grant Programs. A revision team made up of representatives from all RRRC member jurisdictions will collaborate to develop a plan that accurately reflects local and regional hazard history, identifies vulnerabilities and capabilities, and determines
mitigation strategies. Interested citizens, planning professionals, emergency services coordinators, law enforcement officers, appointed and elected officials, and transportation experts are invited to attend the kick-off of this important initiative. It will be held on February 3, 2010, 10am to noon, at the Culpeper Depot (109 South Commerce Street, Culpeper, VA 22701). Representatives from RRRC and VDEM will discuss program requirements, the revision process and participation opportunities. The original plan may be accessed at VDEM's website: http://www.vdem.state.va.us/library/plans/mitigation.cfm. For additional information, please contact Deirdre Clark, RRRC Regional Planner, at 540.829.7450 or [email protected].
Rappahannock-Rapidan Regional Hazard Mitigation Plan 2012 Appendix C: Page 7

1
planinfo
From: Deirdre Clark [[email protected]]Sent: Wednesday, April 14, 2010 12:26 PMTo: Adrienne Garreau ([email protected]); Amy Howard ([email protected]);
Amy Utley ([email protected]); Arthur Candenquist; Barbara Roach; Betty Grayson ([email protected]); Bill Deal; Bo Tucker; 'Bob Coiner'; Bruce Sterling; Bruce Sterling ([email protected]); 'Bryan Hill'; Bryan Wolfe; Carl Pumphrey; 'Charley Banks'; Charlie Ray Fox; Chris Bogert; Chris Jenkins; Christopher Spare ([email protected]); Connie Novak ([email protected]); Connie Smith ([email protected]); 'Craig Johnson'; 'Cynthia Bambara'; Danny McClung; 'David Cubbage'; Debbie Kendall ([email protected]); E. Thomas Williams ([email protected]); Erik Weaver ([email protected]); Frank Bossio ([email protected]); Fritz Alderman; Gene Leggett ([email protected]); 'Graham Grosveror'; James Branch Jr ([email protected]); James Clark; James Fenwick ([email protected]); James Steward ([email protected]); Jeff Dodson ([email protected]); Jeff Koenig; Jeff Muzzy; John Bailey; John Egerston ([email protected]); John Harkness; John McCarthy ; Joshua Bateman ([email protected]); 'Julie Jordan'; Karen Beck-Herzog ([email protected]); 'Kathy Hatter'; Kenneth McLawhon; Kimberley Johnson; Kurt Hildebrand; Lanny Simmons ([email protected]); Lewis Jenkins ([email protected]); Lisa Robertson; Lou Battle; Mark Amos; 'Mark Borchers'; Maxie Brown ([email protected]); Maxie Rozell; Neil Drumheller; 'Patrick Mulhern'; Paul McCulla ([email protected]); Richie Burke ([email protected]); Rick Carr; Robert Butler ([email protected]); Robert Finks; 'Robert Gurtler'; Robert Thornhill Jr ([email protected]); 'Russell James'; Sabrina Martyn ([email protected]); Sam McLearen ([email protected]); Sara Makely; 'Sarah Sitterle'; Scott Barlow ([email protected]); Sheila Farmer-Dumas ([email protected]); [email protected]; Thomas Billington; Tracy Turman ([email protected]); 'Willie Lamar'
Subject: Rappahannock-Rapidan Regional All Hazard Mitigation Plan Update MEETINGAttachments: Agenda-WorkSession1.doc
RE: Meeting – April 20, 10 AM, 420 Southridge Parkway, Culpeper Good Afternoon All, Please see agenda (attached) for next Tuesday’s meeting. We hope you’ll be available to join in a discussion of the information collected to date. Please note that Christopher Strong, Warning Coordination Meteorologist, National Weather Service, will be joining us by phone to provide information on new tools that may be of interest to local governments and emergency responders and answer any questions we may have regarding weather characteristics and events in our region. Please let me know if you plan to attend. Thank you – Deirdre Deirdre B. Clark, Regional Planner Rappahannock‐Rapidan Regional Commission 420 Southridge Parkway, Suite 106 Culpeper, Virginia 22701 540.829.7450
Rappahannock-Rapidan Regional Hazard Mitigation Plan 2012 Appendix C: Page 8

Rappahannock-Rapidan Regional Commission
420 Southridge Parkway Suite 106
Culpeper, VA 22701
PRESS RELEASE
FOR IMMEDIATE RELEASE
Date: April 14, 2010
Contact: Deirdre Clark
Phone: (540) 829-7450
Fax: (540) 829-7452
Please publish this meeting announcement in your Community Calendar/Events section. Thank you.
The Rappahannock-Rapidan Regional Commission is hosting a steering committee meeting for the 2010 Regional Hazard Mitigation Plan update on April 20, 2010 from 10am to 12pm at the Regional Commission offices:
420 Southridge Parkway, #106
Culpeper, VA 22701
Rappahannock-Rapidan Regional Hazard Mitigation Plan 2012 Appendix C: Page 9

1
planinfo
From: Deirdre Clark [[email protected]]Sent: Monday, June 28, 2010 12:00 PMTo: 'Deirdre Clark'; Adrienne Garreau ([email protected]); Amy Howard
([email protected]); Amy Utley ([email protected]); Arthur Candenquist; Barbara Roach; Betty Grayson ([email protected]); Bill Deal; Bo Tucker; 'Bob Coiner'; Bruce Sterling; Bruce Sterling ([email protected]); 'Bryan Hill'; Bryan Wolfe; Carl Pumphrey; 'Charley Banks'; Charlie Ray Fox; Chris Bogert; Chris Jenkins; Christopher Spare ([email protected]); Connie Novak ([email protected]); Connie Smith ([email protected]); 'Craig Johnson'; 'Cynthia Bambara'; Danny McClung; 'David Cubbage'; Debbie Kendall ([email protected]); E. Thomas Williams ([email protected]); Erik Weaver ([email protected]); Frank Bossio ([email protected]); Fritz Alderman; Gene Leggett ([email protected]); 'Graham Grosveror'; James Branch Jr ([email protected]); James Clark; James Fenwick ([email protected]); James Steward ([email protected]); Jeff Dodson ([email protected]); Jeff Koenig; Jeff Muzzy; John Bailey; John Egerston ([email protected]); John Harkness; John McCarthy ; Joshua Bateman ([email protected]); 'Julie Jordan'; Karen Beck-Herzog ([email protected]); 'Kathy Hatter'; Kenneth McLawhon; Kimberley Johnson; Kurt Hildebrand; Lanny Simmons ([email protected]); Lewis Jenkins ([email protected]); Lisa Robertson; Lou Battle; Mark Amos; 'Mark Borchers'; Maxie Brown ([email protected]); Maxie Rozell; Neil Drumheller; 'Patrick Mulhern'; Paul McCulla ([email protected]); Richie Burke ([email protected]); Rick Carr; Robert Butler ([email protected]); Robert Finks; 'Robert Gurtler'; Robert Thornhill Jr ([email protected]); 'Russell James'; Sabrina Martyn ([email protected]); Sam McLearen ([email protected]); Sara Makely; 'Sarah Sitterle'; Scott Barlow ([email protected]); Sheila Farmer-Dumas ([email protected]); [email protected]; Thomas Billington; Tracy Turman ([email protected]); 'Willie Lamar'
Cc: 'Patrick Mauney'Subject: RRRC Hazard Mitigation Plan Update - Meeting: July 13th
Dear RRRC Hazard Mitigation Plan Update Team, Just a reminder of our upcoming meeting to be held on July 13, 9AM to noon. If you have not yet done so, please complete and return all data sheets by July 1, 2010. As was noted previously, information from all localities is needed to meet participation requirements and to assure that everyone’s concerns are included as we move forward in developing mitigation strategies. The agenda for the meeting on July 13th will focus on a summary and discussion of all data collected to date. This will include:
. An update of critical facilities – see Section 6, p. 5*
. An overview and update of regional vulnerability – see Section 6*
. Relevant plans, ordinances and programs update – see Table 7‐1, Section 7, p.4* *original plan
. Drafts of Section 1 and 3 will be circulated. Please review Sections 6, 7 and 8 with attention to adequacy of information, changes in vulnerability and conditions since the original plan was completed and consideration for possible additional unique risks (Section 6, p. 20). In order to facilitate discussion, please bring your copy of the original plan to the meeting.
Rappahannock-Rapidan Regional Hazard Mitigation Plan 2012 Appendix C: Page 10

2
As was noted at our last meeting, the revision process will now need to include input from planning and zoning specialists in each locality. We look forward to working with you on July 13th – please let us know if you plan to attend. Thank you! Deirdre Deirdre B. Clark, Regional Planner Rappahannock‐Rapidan Regional Commission 420 Southridge Parkway, Suite 106 Culpeper, Virginia 22701 540.829.7450 [email protected]
Rappahannock-Rapidan Regional Hazard Mitigation Plan 2012 Appendix C: Page 11

Rappahannock-Rapidan Regional Commission
420 Southridge Parkway Suite 106
Culpeper, VA 22701
PRESS RELEASE
FOR IMMEDIATE RELEASE
Date: June 28, 2010
Contact: Deirdre Clark
Phone: (540) 829-7450
Fax: (540) 829-7452
Please publish this meeting announcement in your Community Calendar/Events section. Thank you.
The Rappahannock-Rapidan Regional Commission is hosting a steering committee meeting for the 2010 Regional Hazard Mitigation Plan update on July 13, 2010 from 9am to 12pm at the Regional Commission offices:
420 Southridge Parkway, #106
Culpeper, VA 22701
Rappahannock-Rapidan Regional Hazard Mitigation Plan 2012 Appendix C: Page 12

Subject: Rappahannock-Rapidan Regional Hazard Mitigation Plan - Draft Review MeetingFrom: Patrick Mauney <[email protected]>Date: 03/28/2012 8:42 AMTo: Patrick Mauney <[email protected]>BCC: Sarah Sitterle <[email protected]>, [email protected], Town of Remington<[email protected]>, [email protected], John Cooley <[email protected]>,[email protected], Gregg Zody <[email protected]>, [email protected], [email protected],"Lasher, Terrance J. (DOF)" <[email protected]>, [email protected], "Hatter, Kathryn (VDH)"<[email protected]>, Carl Pumphrey <[email protected]>, Betty Grayson<[email protected]>, Jim Hoy <[email protected]>, [email protected], Arthur Candenquist<[email protected]>, Richie Burke <[email protected]>, [email protected],[email protected], John Egertson <[email protected]>, TOM WILLIAMS<[email protected]>, TONYA HOOSER <[email protected]>,[email protected], William Lamar <[email protected]>, Barbara Roach <[email protected]>,[email protected], "Howard, Amy" <[email protected]>, [email protected],[email protected], [email protected], Rick Carr <[email protected]>, Patrick Mulhern<[email protected]>, Bob Gurtler <[email protected]>, Frank Bossio <[email protected]>, PaulMcCulla <[email protected]>, John McCarthy <[email protected]>, Julie Jordan<[email protected]>, MCAdmin <[email protected]>, Greg Woods<[email protected]>, [email protected], Kenneth McLawhon <[email protected]>
Good Afternoon,
There will be a meeting to review the draft 2012 Rappahannock‐Rapidan Regional Hazard Mitigation Plan on:
Friday, April 13, 20129:30 AMRRRC Conference Room420 Southridge Parkway, #106Culpeper, VA 22701
The draft 2012 Plan has been posted at http://www.rrregion.org/mitigation. This is an update to the original Rappahannock‐Rapidan Regional Hazard Mitigation Plan, adopted by each participating jurisdiction in 2005, and includes updated data,hazard and vulnerability assessments for the region and updated mitigation strategies developed by each participatingjurisdiction.
At the draft review meeting, RRRC staff will provide an overview of the Plan Update process, changes from the 2005 plan andreview of local and regional mitigation strategies, will review public comments received on the draft plan and discuss the nextsteps in the Plan Update, including adoption at the local level.
Please feel free to contact me with any questions or comments on the draft plan and I would request that you forward thismessage on to others in your organization that may be interested in reviewing and/or providing comments on the draft plan.
Thank you,
Patrick Mauney--Patrick L. MauneyGIS Program ManagerRappahannock-Rapidan Regional Commission420 Southridge Parkway, Suite 106Culpeper, VA 22701P: 540.829.7450http://www.rrregion.org
Attachments:
20120413 Agenda - Draft Review Meeting.pdf 54.0 KB
Rappahannock-Rapidan Regional Hazard Mitigation Plan -...
Rappahannock-Rapidan Regional Hazard Mitigation Plan 2012 Appendix C: Page 13

Rappahannock-Rapidan Regional Commission 420 Southridge Parkway Suite 106
Culpeper, VA 22701
PRESS RELEASE FOR IMMEDIATE RELEASE
Date: March 19, 2012 Contact: Patrick Mauney Phone: (540) 829-7450 Fax: (540) 829-7452 Please publish this meeting announcement in your Community Calendar/Events section. Thank you. The Rappahannock-Rapidan Regional Commission is hosting a meeting to review the draft 2012 Regional Hazard Mitigation Plan update on Friday, April 13, 2012 at 9:30 a.m. at the Regional Commission offices: 420 Southridge Parkway, #106 Culpeper, VA 22701 The draft 2012 Regional Hazard Mitigation Plan can be viewed online at http://www.rrregion.org/mitigation. Hard copies of the draft plan are viewable at the following locations: Rappahannock-Rapidan Regional Commission 420 Southridge Parkway, #106 Culpeper, VA 22701 Culpeper County Public Library 271 Southgate Shopping Center Culpeper, VA 22701 Fauquier County Public Library (Warrenton Branch) 11 Winchester Street Warrenton, VA 20186 Madison County Public Library 402 North Main Street Madison, VA 22727 Orange County Public Library (Main Branch) 146A Madison Road Orange, VA 22960 Rappahannock County Public Library 4 Library Road Washington, VA 22747 Public comment on the draft plan will be accepted until 5pm on April 6, 2012. Comments can be submitted to: Patrick Mauney Rappahannock-Rapidan Regional Commission
Rappahannock-Rapidan Regional Hazard Mitigation Plan 2012 Appendix C: Page 14

420 Southridge Parkway, Suite 106 Culpeper, VA 22701 or via email to: [email protected]
* * * The Rappahannock-Rapidan Regional Commission (RRRC), founded in 1973 under the Regional Cooperation Act, serves the counties of Culpeper, Fauquier, Madison, Orange and Rappahannock, and towns of Culpeper, Gordonsville, Madison, Orange, Remington, The Plains, Warrenton and Washington. One of 21 Regional or Planning District Commissions across the state, the Commission provides cost-effective planning-related technical assistance to member jurisdictions, a concerted approach to inter-jurisdictional cooperation and collaboration, and a forum for the interaction of residents, area elected officials, and agency representatives.
Rappahannock-Rapidan Regional Hazard Mitigation Plan 2012 Appendix C: Page 15

Rappahannock-Rapidan Regional Hazard Mitigation Plan 2012 Appendix C: Page 16
Administrator
Callout
Rappahannock News, March 29, 2012

Rappahannock-Rapidan Regional Hazard Mitigation Plan 2012 Appendix C: Page 17
Administrator
Callout
Orange County Review, April 5, 2012

Rappahannock-Rapidan Regional Hazard Mitigation Plan 2012 Appendix C: Page 18
Administrator
Callout
Fauquier Times-Democrat, March 30, 2012

Rappahannock-Rapidan Regional Hazard Mitigation Plan 2012 Appendix C: Page 19
Administrator
Callout
Culpeper Star-Exponent, April 10, 2012

Rappahannock-Rapidan Region All-Hazard Mitigation Plan Revision
Kick-Off Meeting
420 Southridge Parkway, Suite 106
Culpeper, VA 22701
Tuesday, February 23, 2010
10 A.M.
______________________________________________________________________________
AGENDA
I. Welcome and Introductions
II. Project Overview
III. Amy Howard, Mitigation Planning Coordinator - Virginia Department of Emergency Management
IV Project Schedule and Tasks
V. Data Collection Guide
VI. Jurisdictional Responsibilities
VII. Steering Committee
VIII. Next Steps
Rappahannock-Rapidan Regional Hazard Mitigation Plan 2012 Appendix C: Page 20

Rappahannock-Rapidan Region All-Hazard Mitigation Plan Revision
Work Session #1
420 Southridge Parkway, Suite 106
Culpeper, VA 22701
540.829.7450
Tuesday, April 20, 2010
10 A.M.
__________________________________________________________________________________________________
AGENDA
I. Welcome and Introductions
II. Project Update
• Work Sheets 1, 2, & 3 - Data Summary To-Date
• Discussion
III. Christopher Strong, National Weather Service
Warning Coordination Meteorologist
• See links below*
• Questions/Comments
IV. Next Steps
• Worksheets 4 through 9**
V. Timeline Review
VI. Jurisdictional Responsibilities
VII. Steering Committee Update
VIII. Next Meeting
_________________________________________________________________________________________________
* New emergency managers web page ... http://www.weather.gov/washington/em.php
* Advanced Hydro Prediction System (AHPS) page ... http://newweb.erh.noaa.gov/ahps2/index.php?wfo=lwx
* Mobile Weather for PDAs and cell phones ... http://mobile.weather.gov
* For Ems - PDA alerting service called iNWS with graphical and text alerts ... http://inws.wrh.noaa.gov/
_________________________________________________________________________________________
**Please complete and return Worksheets 4 through 9 by May 25th
, 2010 to:
Deirdre Clark -OR - Patrick Mauney
[email protected] [email protected]
Rappahannock-Rapidan Regional Hazard Mitigation Plan 2012 Appendix C: Page 21

Rappahannock-Rapidan Region All-Hazard Mitigation Plan Revision
Work Session #2
420 Southridge Parkway, Suite 106
Culpeper, VA 22701
540.829.7450
Tuesday, July 13, 2010
9 A.M.
__________________________________________________________________________________________________
AGENDA
I. Welcome and Introductions
II. Project Update
• Data Summary
• Common Concerns
III. Critical Facilities/Assets Review and Update
IV. Next Steps
• Mitigation Action Review – 2005
• Proposed Mitigation Actions
V. Timeline Review
VI. Jurisdictional Responsibilities
VII. Steering Committee Update
VIII. Next Meeting
_________________________________________________________________________________________________
Deirdre Clark Patrick Mauney
[email protected] [email protected]
Rappahannock-Rapidan Regional Hazard Mitigation Plan 2012 Appendix C: Page 22

Rappahannock-Rapidan Regional Hazard Mitigation Plan 2012 Draft Review Meeting
420 Southridge Parkway, Suite 106 Culpeper, VA 22701
540.829.7450 Friday, April 13, 2012
9:30 A.M. __________________________________________________________________________________________________
AGENDA
I. Welcome and Introductions
II. Draft Plan Review • Planning Process Overview • Changes from 2005 Hazard Mitigation Plan • Review of Mitigation Strategies
III. Review of Public Comments IV. FEMA Hazard Mitigation Assistance Program Review
• Grant Programs • Fundable Projects
V. Next Steps
• Submission to VDEM, FEMA • Adoption at local level • Future Plan Maintenance
_________________________________________________________________________________________________
Rappahannock-Rapidan Regional Hazard Mitigation Plan 2012 Appendix C: Page 23

Rappahannock-Rapidan Region All-Hazard Mitigation Plan Revision
Kick-Off Meeting
Rappahannock-Rapidan Regional Commission
Meeting Minutes – February 23, 2010
Attendees:
Deirdre Clark Rappahannock-Rapidan Regional Commission
Amy Howard Virginia Department of Emergency Management
Charley Banks Virginia Department of Conservation and Recreation
Bruce Sterling Virginia Department of Emergency Management
Neil Drumheller County of Culpeper
Willie Lamar Town of Madison
Brian Wolfe Rappahannock Electric Cooperative
Sarah Sitterle Town of Warrenton
Jeff Koenig National Park Service/Shennandoah National Park
Danny McClung Town of Culpeper
Fritz Alderman Town of Culpeper
Terry Lasher Virginia Department of Forestry
Chris Jenkins Town of Culpeper
Scott Roy Town of Culpeper
Adrienne Garreau Fauquier County
Lou Battle Warrenton Police Department
Arthur Candenquist Rappahannock County
Kathy Hatter Virginia Department of Health
Sara Makely Fauquier County
Graham Grosvers Fauquier County
Bo Tucker Town of Warrenton
Patrick Mauney Rappahannock-Rapidan Regional Commission
Jenny Biche’ Rappahannock-Rapidan Regional Commission
Project Overview
Deirdre Clark, Regional Planner
Rappahannock-Rapidan Regional Commission
Ms. Clark provided the attendees with folders that included a timeline for project tasks, a time and
travel log, and a data collection guide. Everyone was asked to maintain their time and travel log
and return the completed worksheets 1-3 to Mrs. Clark or Patrick Mauney by March 17, 2010 (see
contact information listed below). Mrs. Clark reminded those present that each jurisdiction had
pledged to participate fully in the plan revision, and that the time and travel log and data collection
guide would provide documentation of in-kind services and materials associated with their
participation.
Rappahannock-Rapidan Regional Hazard Mitigation Plan 2012 Appendix C: Page 24

The Data Collection Guide contains worksheets that will facilitate the collection of data needed to
update the Regional All-Hazard Mitigation Plan. Attendees were asked to review the existing plan
at: http://www.vdem.state.va.us/library/plans/mitigation.cfm or email Ms. Clark for a copy of the
plan on a CD.
The Disaster Mitigation Act of 2000 requires that state and local governments develop and adopt a
hazard mitigation plan in order to be eligible for federal mitigation grant funding. These funds
include the Hazard Mitigation Grant Program and the Pre-Disaster Mitigation program, both of
which are administered by the Federal Emergency Management Agency under the Department of
Homeland Security. Participation in the Regional All-Hazard Mitigation Plan will allow localities
to be eligible for either program.
The Regional All-Hazard Mitigation Plan is comprised of the following components:
• The Risk Assessment Process-comprised of three components: hazard identification,
vulnerability assessment and capability assessment
• Critical Asset/Vulnerability Assessment-which will result in a detailed inventory of:
essential infrastructure, vulnerable facilities, hazardous materials facilities and natural
assets
• Capability Assessment-made up of: regulatory tools, administrative/technical resources,
fiscal and capabilities narrative
Amy Howard, Mitigation Planning Coordinator
Virginia Department of Emergency Management
Ms. Howard stated that she is also the contact for FEMA projects. Her power-point presentation
may be viewed on line at www.rrregion.org. She suggested forming subcommittees based on
committee member expertise. An example would be a flood subcommittee or snow subcommittee
made up of representatives from each locality that had experience handling those types of disasters.
It is also required that the plan include public participation. This can be done through outreach,
media, workshops, information on electric bill inserts, etc. Have citizens know what mitigation is
and provide measureable strategies in the plan. Ms. Howard encouraged the committee to
cooperate and work with other localities outside the region. It was mentioned that evacuees of the
Washington Metropolitan area would travel to this region and therefore conversations with
representatives from that area would be beneficial.
The Hazard Assessment worksheets that were provided in the folders will first be completed
locally, then combined regionally. Localities that have access to relevant maps were asked to
forward that information to Patrick Mauney so that he may compile the regional data. Links were
provided in the power point presentation to assist each locality in completing their risk assessment.
The NCDC website can provide snowfall records and the VDEM website contains local data.
Examples of vulnerability include people with pets (identify hotels or shelters that will allow
evacuees to bring their pets), the aging population and families with small children. FEMA’s
HAZUS software enables users to identify the annual dollar loss for a particular disaster and
computes vulnerability indexes. For example, if the roof of a local high school collapsed, HAZUS
could be used to determine the annual cost of the loss for that community. HAZUS is available to
each locality and training can be provided.
Under Goals & Strategies, focus should be on implementation. Localities should review earlier
goals and strategies and determine if they were accomplished - did you do what you said you would
Rappahannock-Rapidan Regional Hazard Mitigation Plan 2012 Appendix C: Page 25

do? If a strategy was eliminated or changed due to staff turn over or lack of funding, state so in the
plan. Livestock may be an issue in the event of an evacuation that may need to be addressed in the
plan. Should Washington DC evacuate to the region, how will the region accommodate the
masses? The plan will be reviewed every five years; however Ms. Clark will work with localities
to provide yearly reports. It was suggested that at this time it might be wise to list a department as a
contact rather than a particular person in the event of staff turn over.
In the original plan, Human Related Disasters was not the focus, and it was suggested that the
committee review and analyze it further and expand the committee to include the local hospitals
and community colleges. Ms. Howard stated that if the plan were to include information on
terrorism, two editions would need to be created; one for public viewing and one to remain
confidential. FEMA will assign a tracking identification number to monitor those who utilize the
confidential plan. A comment was made that after 9/11 local maps removed the identification of
such buildings as water treatment facility locations and that the committee may want to take that
into consideration as they go forward with their planning. Lastly, communication was identified as
a key component in the success and accuracy of the plan and the committee will look at how to
effectively do that in a rural area.
Project Schedule and Tasks
Each attendee will complete worksheets 1-3 and forward the information to Ms. Clark or Mr.
Mauney by March 17, 2010. At that time Ms. Clark will compile the information and the
committee will meet in April, 2010 to review the findings. Progress reports will be on-going and
will include the information provided on the time and travel log each committee member is
maintaining.
Data Collection Guide
Additional forms and worksheets may be accessed at www.rrregion.org. The Data Collection
Guide was created based on a template and therefore some information/questions may relate to our
region and some may not. The information requested is an update only. The original plan should
be reviewed before completing the Guide. Ms. Howard stated that FEMA prefers at least one new
strategy per locality in each update of the plan. Once worksheets 1-3 have been completed, the
committee can reconvene to look at the remaining worksheets. Worksheet 1 lists the possibility and
frequency of each hazard. Worksheet 2 provides the opportunity to comment on specific hazards
and provide documentation of each. Ms. Howard suggested that each hazard should be evaluated
seasonally when considering its effect. For example, flooding in a local park may not be as
disruptive to users in winter as it might be in spring or summer. It was observed that Pandemic
Disasters were not included in the worksheets. It will be up to the committee to decide if they wish
to add Pandemics and other events. Discussion of all hazards is encouraged to assure full
consideration of possible events.
Jurisdictional Responsibilities
Attendees from each locality were asked to complete "team" forms requiring contact information
for individuals in specific departments in their town or county. These should be forwarded to Ms.
Clark or Mr. Mauney within the next few weeks. It was recognized that not all jurisdictions have
staff serving in these specific roles or that one staff member might serve as a point of contact for
many types of information. Contact details provided will facilitate requests for information in the
future. Absent were representatives from the towns of Gordonsville, Remington, and Orange, as
well as The Plains and Orange County.
Rappahannock-Rapidan Regional Hazard Mitigation Plan 2012 Appendix C: Page 26

Steering Committee
Ideally, each locality will be represented on the Steering Committee (see attachment). This
representative will be the point of contact for their locality and report back to their community. As
planned. the Steering Committee will meet quarterly; however, subcommittees may meet more
frequently.
Next Steps
• Each representative will review the original Region All-Hazard Mitigation Plan
• Each representative will complete worksheets 1-3 and return by March 17, 2010 focusing
on new data and inter-jurisdictional data from the last five years
• Pay attention to the increase in population and its effects (new schools, new transportation
issues, new fire stations, etc.)
• Look ahead—where do we need to improve?
• Focus on tasks we CAN do
• Talk to your colleagues and get them involved, discuss with the public
• Provide contact information for local citizens who may want to participate, focusing on
aging population and families with young children
NEXT ALL-HAZARD MITIGATION PLAN REVISION MEETING: April XX, 2010
Deirdre Clark Patrick Mauney
Rappahannock-Rapidan Regional Commission Rappahannock-Rapidan Regional Commission
420 Southridge Parkway, Suite 106 420 Southridge Parkway, Suite 106
Culpeper, VA 22701 Culpeper, VA 22701
[email protected] [email protected]
(540) 829-7450 (540) 829-7450
Rappahannock-Rapidan Regional Hazard Mitigation Plan 2012 Appendix C: Page 27
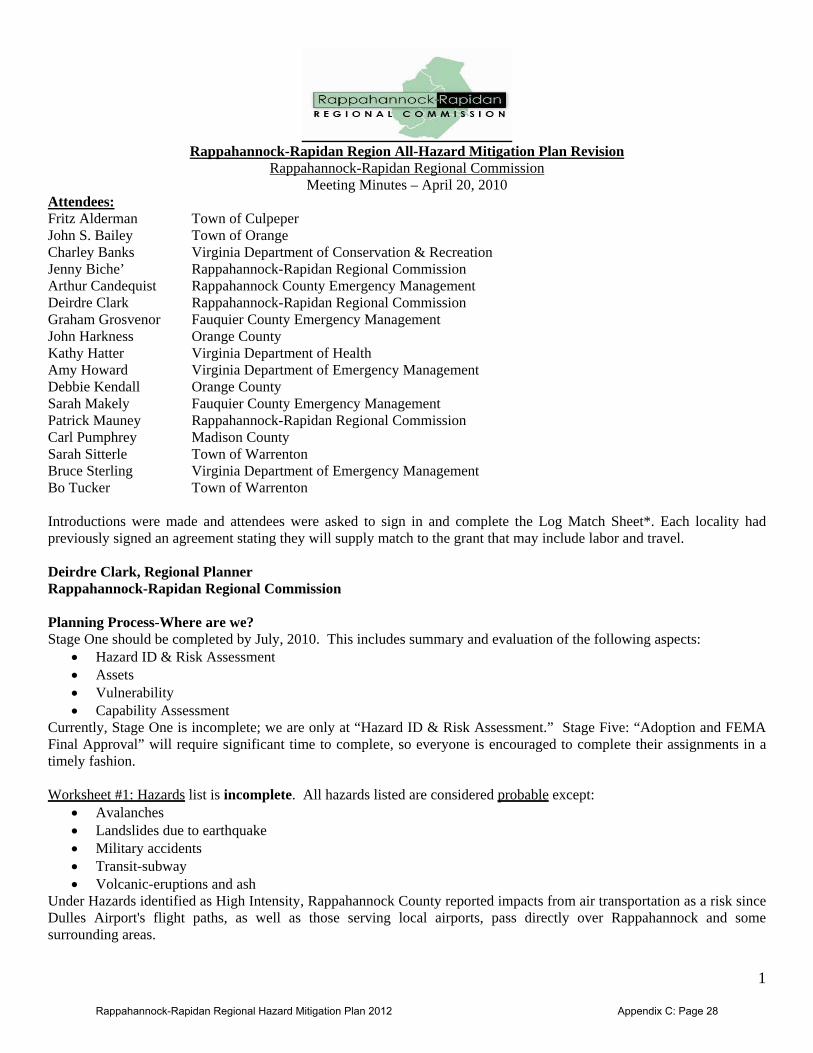
Rappahannock-Rapidan Region All-Hazard Mitigation Plan Revision
Rappahannock-Rapidan Regional Commission Meeting Minutes – April 20, 2010
Attendees: Fritz Alderman Town of Culpeper John S. Bailey Town of Orange Charley Banks Virginia Department of Conservation & Recreation Jenny Biche’ Rappahannock-Rapidan Regional Commission Arthur Candequist Rappahannock County Emergency Management Deirdre Clark Rappahannock-Rapidan Regional Commission Graham Grosvenor Fauquier County Emergency Management John Harkness Orange County Kathy Hatter Virginia Department of Health Amy Howard Virginia Department of Emergency Management Debbie Kendall Orange County Sarah Makely Fauquier County Emergency Management Patrick Mauney Rappahannock-Rapidan Regional Commission Carl Pumphrey Madison County Sarah Sitterle Town of Warrenton Bruce Sterling Virginia Department of Emergency Management Bo Tucker Town of Warrenton Introductions were made and attendees were asked to sign in and complete the Log Match Sheet*. Each locality had previously signed an agreement stating they will supply match to the grant that may include labor and travel. Deirdre Clark, Regional Planner Rappahannock-Rapidan Regional Commission Planning Process-Where are we? Stage One should be completed by July, 2010. This includes summary and evaluation of the following aspects:
• Hazard ID & Risk Assessment • Assets • Vulnerability • Capability Assessment
Currently, Stage One is incomplete; we are only at “Hazard ID & Risk Assessment.” Stage Five: “Adoption and FEMA Final Approval” will require significant time to complete, so everyone is encouraged to complete their assignments in a timely fashion. Worksheet #1: Hazards list is incomplete. All hazards listed are considered probable except:
• Avalanches • Landslides due to earthquake • Military accidents • Transit-subway • Volcanic-eruptions and ash
Under Hazards identified as High Intensity, Rappahannock County reported impacts from air transportation as a risk since Dulles Airport's flight paths, as well as those serving local airports, pass directly over Rappahannock and some surrounding areas.
1
Rappahannock-Rapidan Regional Hazard Mitigation Plan 2012 Appendix C: Page 28

2
Worksheet #2: Historic Hazard Events Fauquier County was the only locality that listed the snow storms in December 2009 and February 2010 as historic events. It was noted that both storms were declared disasters by the Commonwealth. The December storm was declared a federal disaster. That determination has not yet been made regarding the February storm. Please review what state disasters have been declared in your locality since 2005 and record on worksheet #2. Worksheet #3: Unique Hazard Risk Terry Lasher, Virginia Department of Forestry, Warrenton Office, states that portions of each county in our region within response area are at risk of wildland fires. The USDA Department of Forestry defines Wild Urban Interface as “…zone where structures and other human developments meet, or intermingle with, undeveloped wildlands…where wildfire poses the biggest risk to human lives and structures. Terry provided maps (see Work Session 1 power-point*) identifying structures at risk in Rappahannock and Culpeper counties. As the housing development increases over the next several years, more and more people will build in the rural, mountainous areas of the region, increasing the hazard risk. Identify now what tools will be needed and determine whether or not they are currently available. Christopher Strong, Warning Coordination Meteorologist National Weather Service Teleconference Mr. Strong stated that our region was at risk for every weather threat except tidal surge from hurricanes. Flooding, tropical storms and flash flooding were identified as the greatest risk for the region. Tornados, thunderstorms with severe winds or hail, snow storms and fog threats should also be considered. Localities should have a warning coordination plan that will provide information to the public quickly and efficiently. Examples include the NOAA radio system that provides text alerts to the general public and Fire Support that enables state emergency staff to receive daily reports that are point specific. NOAA radio alerts can be accessed by PDAs, cell phones and home phones. Rappahannock County shared information about their “Code Red” system that has had a directly beneficial impact on their response. They have utilized it both for wildland fires and for the recent snow storm. Warning information is sent to citizens who subscribe via email, text messaging, or voice mail. There is no charge to the citizens for this service. Fauquier County is looking at a similar system. It was suggested that IFLOW, a program that uses rain gauges to predict flash flooding, be incorporated into the Code Red or selected warning coordination system. Localities need to be able to identify and locate the threat and communicate the information to its citizens quickly. Mr. Strong provided links (see Agenda 4/20/10*) that may be helpful when completing the worksheets and researching alert systems. He suggested reviewing "inws", an interactive National Weather Service site that provides timely weather information. NEXT STEPS: Worksheets 4 through 9 Worksheets 4 & 5: Determining Vulnerability Inventory Your Assets
• Critical facilities (hospitals, police stations, schools, pet shelters, etc.) & vulnerable populations (low income, people with pets, handicap, elderly, etc.);
• Number of buildings, infrastructure and critical facilities at risk/located in hazard areas (has been built or had a change in structure in the last five years: i.e., school roof replaced due to snow storm damage);
• Indentify repetitive loss properties & severe repetitive loss properties (Amy Howard can provide a list of repetitive losses for your area—includes only those structures that had flood insurance and filed a claim).
Inventory what is available and what is needed: i.e. Transportation options for citizens during an evacuation. How will you reach the elderly/disabled in rural areas and what will they need to be able to evacuate? Local utility companies may assist by furnishing information/surveys in their utility bills to their customers. What options do citizens have for their pets or livestock should they need to evacuate?
Rappahannock-Rapidan Regional Hazard Mitigation Plan 2012 Appendix C: Page 29

3
Worksheets 6, 7, 8 & 9: Capability Assessment • What resources are available? • What are our limitations? • Regulatory/Administrative/Technical/Fiscal
What’s in place now? What do we need? Do you have a warning system? Looking at growth & development, is it effective? Efficient? Capability Assessment:
• Measures each jurisdiction’s competency and ability to implement hazard mitigation activities • Identifies existing gaps, conflicts, weaknesses in local programs, plans and policies (mitigation opportunities that
grants may address) • Identifies mitigation measures already in place (FEMA requires a blanket statement that evaluates, acquires or
mitigates a floodplain strategy) • Identifies mitigation opportunities (i.e. Fire grant debris clean up/maintenance, NOAA radio/Reverse 911, etc.)
Plan, Policy Program or Ordinance in place? Does it need improvement? Who responds? Each locality is asked to complete “R-RRC All Hazard Mitigation Plan Revision Team worksheets 4-9*. If the locality is listed separately in the grant, then each locality must be represented. The representative may be a citizen, it is not required that the representative be a staff person. Capability Indicators
• National Flood Insurance Program (NFIP) participation • Community Rating System (CRS) participation • Building Code Effectiveness Grading Schedule (BCEGS) • Fire-wise Community
STAGE TWO—Are we there yet?
• Mitigation Goals and Objectives • Development of Mitigation Strategies
Risk & Capability Assessment = Foundation for Identification of Mitigation Actions GOALS AND STRATEGIES
• Review your locality’s current goals (on line at www.rrregion.org/mitigation.html) and determine relevance (list may need to be edited as some goals may be unattainable and we will be required to be accountable for them to FEMA)
• Determine progress in terms of existing mitigation strategies • Develop new strategies that reflect updated risk and capability assessments
The next meeting is tentatively scheduled for Tuesday, June 15, 2010 at 10:00am at the Rappahannock Rapidan Regional Commission. Each locality is asked to determine who would be the best participant from their staff to address the issues in the next stage (staff familiar with ordinances, codes, compliances, etc.). Please forward their contact information to Deirdre Clark prior to the next meeting.
NEXT ALL-HAZARD MITIGATION PLAN REVISION MEETING: Tentatively scheduled for June 15, 2010 @ RRRC
Deirdre Clark Patrick Mauney R-RRC R-RRC 420 Southridge Parkway, Suite 106 420 Southridge Parkway, Suite 106 Culpeper, VA 22701 Culpeper, VA 22701 [email protected] , 540.829.7450 [email protected], 540.829.7450 * All referenced documents may be accessed at http://www.rrregion.org/mitigation.html.
Rappahannock-Rapidan Regional Hazard Mitigation Plan 2012 Appendix C: Page 30

Rappahannock-Rapidan Region All-Hazard Mitigation Plan Revision
Work Session #2 Rappahannock-Rapidan Regional Commission
Meeting Minutes – July 13, 2010 Attendees: Fritz Alderman Town of Culpeper Cynthia Bambara Lord Fairfax Community College Josh Bateman Town of Orange Jenny Biche’ Rappahannock-Rapidan Regional Commission Chris Boies Lord Fairfax Community College Deirdre Clark Rappahannock-Rapidan Regional Commission John Harkness Orange County Debbie Kendall Orange County Terry Lasher Virginia Department of Forestry Sharon Lee Town of Remington Patrick Mauney Rappahannock-Rapidan Regional Commission Isabel McLoughlin Rappahannock-Rapidan Regional Commission Jimmy Steward Town of Remington Eric White Rappahannock Electric Cooperative Overview Following introductions, attendees were asked to sign in and complete the Log Match Sheet* to document time and travel as required by the grant agreement. Deirdre Clark provided a project update. Discussion focused on the following concerns:
• Stage One: Currently incomplete; requires that all participating localities provide information regarding: o Hazard ID & Risk Assessment o Assets o Vulnerability o Capability Assessment
• Mitigation strategies and actions must be specific and linked to gaps and/or needs identified by the locality; • The development of mitigation strategies and actions will require collaboration among staff and elected officials
from each locality; • All required reviews, approvals and adoption must be completed by the end of October, 2011; • Public meetings will be held to assure inclusion of all interests and concerns; • A comprehensive review of all plan sections is required. Each participating locality must provide updated
information (MOA:10.08) • Review of information provided to date (see Mitigation Plan Update, Workshop #2, July 13, 2010:
http://www.rrregion.org/mitigation.html).
Next steps - Assets and Critical Facilities Inventory - findings lead to Stage Two: • Identification of mitigation goals and objectives
Review your locality’s current goals* and determine relevance Determine progress in terms of existing mitigation strategies Hold meetings with planners, first responders, and other appropriate individuals to analyze,
list and discuss opportunities • Develop new strategies that reflect updated risk and capability assessments • Risk and capability assessments are the foundation for the identification of mitigation actions
o Gaps equal opportunities
1
Rappahannock-Rapidan Regional Hazard Mitigation Plan 2012 Appendix C: Page 31

2
Patrick Mauney provided information on HAZUS software data that will be used to identify and inventory local resources. He indicated that the HAZUS inventory is not necessarily comprehensive. Each jurisdiction is encouraged to add assets and critical resources to the inventory. Clarification of these categories was provided as follows:
• Asset - any manmade or natural feature that has value, including people; buildings; infrastructure such as bridges, roads, sewer and water systems; lifelines such as electricity and communication resources; and environmental, cultural, or recreational features such as parks, dunes, wetlands, and landmarks
• Critical facility - those that are essential to the health and welfare of the locality and especially important in disaster management and recovery. Critical facilities include transportation systems, lifeline utility systems, high potential loss facilities, and hazardous material facilities. Each locality needs to determine and identify its assets and critical facilities. Examples to consider include:
o Government Offices o Water Supply Systems o Water Treatment Facilities o Transportation Systems o Nursing Homes o Electric Company o VDOT Maintenance Facilities o Public Transportation (school buses for evacuation)
The vulnerability of critical facilities must be carefully considered. Worksheet #4 of the Data Collection Guide might be helpful in making that determination. It was suggested that in addition to the facilities themselves, thought be given to the infrastructure that serves them. Mitigation Action Worksheets and Guidelines are provided to assist with the next phase of the revision. Consider partnering with adjacent/regional partners across county/town lines and discuss opportunities. Review findings from 2004, as well as most recent updates provided to VDEM in 2009, and ask:
• Are they still relevant? • Are they achievable? • Should they be eliminated/reconsidered/updated/improved? • Does the technology need to be updated?
In order to allow time for discussion and collaboration, Mitigation Action Worksheets should be completed by late September 2010. R-RRC will be happy to meet to discuss proposed actions and the overall plan. The Steering Committee will meet quarterly to:
• Discuss proposed mitigation actions and review to identify collaborative opportunities • Schedule and plan public meetings • Review section drafts • Plan the review and approval process
Worksheets 1-9 are now due. If anyone has any questions or needs assistance, please contact: Deirdre Clark Patrick Mauney R-RRC R-RRC 420 Southridge Parkway, Suite 106 420 Southridge Parkway, Suite 106 Culpeper, VA 22701 Culpeper, VA 22701 [email protected] , 540.829.7450 [email protected], 540.829.7450 * All referenced documents may be accessed at http://www.rrregion.org/mitigation.html.
Rappahannock-Rapidan Regional Hazard Mitigation Plan 2012 Appendix C: Page 32

1
Rappahannock-Rapidan Regional Hazard Mitigation Plan 2012
Rappahannock-Rapidan Regional Commission Meeting Minutes – April 13, 2012
Attendees: Patrick Mauney Rappahannock-Rapidan Regional Commission Gregg Zody Orange County John Cooley Town of Orange Tom Williams Culpeper County Emergency Management Tonya Hooser Culpeper County Emergency Management Scott Hudson Virginia Department of Emergency Management Arthur Candequist Rappahannock County Emergency Management Sara Makely Fauquier County Emergency Management Bo Tucker Town of Warrenton Hank Milans Town of Culpeper P Mauney welcomed meeting participants and thanked them for the continuing participation and support for the Plan Update. Meeting attendees introduced themselves and explained their role in the Hazard Mitigation planning effort. Patrick Mauney, GIS Program Manager Rappahannock-Rapidan Regional Commission Rappahannock-Rapidan Regional Hazard Mitigation Plan Draft Review P Mauney reviewed the Regional Hazard Mitigation Plan Update process, including discussion of the data collected from the participating jurisdictions and stakeholders:
Hazard Inventory & Probability Historic Hazard Events Unique Hazard Identification Critical Facilities/Asset Inventory Local & Regional Capability Assessment
o Regulatory o Administrative o Fiscal o Technical
Mitigation Strategy Updates/Additions In 2010, three stakeholder meetings were held, offering local and regional stakeholders the opportunity to provide data and gather information to be utilized in completing the plan updates. Several jurisdictions completed the data collection guides during this time frame. Updated GIS mapping, hazard assessment and analysis and vulnerability analyses were completed in late 2010 and early 2011. Also in 2011, the Regional Commission reached out to the other jurisdictions and held individual meetings with these stakeholders in order to complete the data collection process and the draft plan was released in March 2012 for review by the public.
Changes from 2005 Plan P Mauney reviewed the major changes from the 2005 Regional Hazard Mitigation Plan.
Complete Data Update: Sections 3 (Regional Profile), 4 (Hazard Identification), 5 (Hazard Analysis) and 6 (Vulnerability Analysis) all were updated to reflect changes in demographics and hazard events since the drafting of the 2005 Plan
Rappahannock-Rapidan Regional Hazard Mitigation Plan 2012 Appendix C: Page 33

2
Section 5 (Hazard Analysis) was updated to include references to hazard events that occurred since the 2005 Plan, including the major winter storms of 2009-2010 and the August 2011 Earthquake
Section 6 (Vulnerability Analysis) was updated to include: o Additional unique hazards identified
Town of Culpeper: Dam/Levee Failure at Mountain Run Lake and Lake Pelham Culpeper County: Earthquake (higher risk relative to region)
o Revised Vulnerability Estimates based on HAZUS modeling, floodplain updates HAZUS modeling for Earthquake, Hurricane and Flood GIS-based Flood Analysis using updated parcel and tax-value information and updated DFIRM
maps, as applicable o Revised Hazard Rankings
High Hazards (Same as 2005): Flood, Hurricane/Tropical Storm, Winter Storms Moderate Hazards: Drought, Severe Thunderstorm/Tornado, Wildfire (identified as low-risk in
2005 plan) Appendix A: Mitigation Strategy Updates
o Review of Regional Strategies: Addition of several strategies related to flood, earthquake and wildfire in response to risk rankings in section 6
o Local Strategies updated to reflect completion, progress and/or deletion
NEXT STEPS: Draft Plan Submission to VDEM & FEMA No Public Comment was received prior to the April 6, 2012 closing date. Jurisdictions are welcome to send additional changes to P Mauney within 1 week (April 20, 2012) before the Regional Commission will send the draft plan to VDEM for review. The remaining steps will include:
Late April 2012: Submission to VDEM for review (30 day review) May 2012: Incorporation of requested changes from VDEM Late May 2012: Submission to FEMA for review June 2012: Incorporation of requested changes from FEMA Summer 2012: Conditional Approval (pending adoption) expected from FEMA Summer 2012: Local Adoption process begins
* All referenced documents may be accessed at http://www.rrregion.org/mitigation.html.
Rappahannock-Rapidan Regional Hazard Mitigation Plan 2012 Appendix C: Page 34

Rappahannock- Rapidan Kick-Off Meeting
February 23, 2010February 23, 2010
Culpeper, VirginiaCulpeper, Virginia
Why does hazard mitigation Why does hazard mitigation
matter?matter?
Hazard MitigationHazard Mitigation
……is a sustainable action that is a sustainable action that will reduce or eliminate injury to will reduce or eliminate injury to citizens, damages to structures citizens, damages to structures and allow continuity of critical and allow continuity of critical society functionssociety functions……
Rappahannock-Rapidan Regional Hazard Mitigation Plan 2012 Appendix C: Page 35

Support of Floodplain Support of Floodplain
Mitigation EffortsMitigation Efforts
�� Support the participation of your Support the participation of your communities in the NFIP, as communities in the NFIP, as needed.needed.
�� Support the implementation and Support the implementation and enforcement of floodplain enforcement of floodplain ordinances, as needed.ordinances, as needed.
�� Work with local officials and real Work with local officials and real estate professionals to promote estate professionals to promote flood insurance policies.flood insurance policies.
Planning Process:Planning Process:
�Adoption
� FEMA final approval
�MitigationGoals and Objectives
�Mitigation Strategies
�Capability Assessment
�Hazard ID and Risk Assessment
�VDEM and FEMA Reviews
�Conditional Approvals
� Final DraftPlan
�PlanMaintenance Procedures
�Draft Plan
Fourth StageThird StageSecond StageFirst StageKickoff Meeting
Rappahannock-Rapidan Regional Hazard Mitigation Plan 2012 Appendix C: Page 36

Role of PDCs in Planning Role of PDCs in Planning
ProcessProcess
�� Coordinate the processCoordinate the process
�� Ensure participation of all Ensure participation of all
jurisdictionsjurisdictions
�� Manage resourcesManage resources
Build the Planning TeamBuild the Planning Team
�� Determine necessary resourcesDetermine necessary resources
�� Form subcommittees if necessaryForm subcommittees if necessary
�� Organize the teamOrganize the team
�� Establish responsibilitiesEstablish responsibilities
Rappahannock-Rapidan Regional Hazard Mitigation Plan 2012 Appendix C: Page 37

Involve the PublicInvolve the Public
�� Invite to Steering Committee Invite to Steering Committee
meetingsmeetings
�� Use local mediaUse local media
�� Distribute literatureDistribute literature
�� Conduct outreach activitiesConduct outreach activities
�� Host public workshops Host public workshops
�� Encourage public to review planEncourage public to review plan
Capability AssessmentCapability Assessment
�� How capable is each locality and the How capable is each locality and the
region to implement successful region to implement successful
mitigation actions?mitigation actions?
�� What resources are available?What resources are available?
�� What are your limitations?What are your limitations?
Rappahannock-Rapidan Regional Hazard Mitigation Plan 2012 Appendix C: Page 38

Rappahannock Rapidan Regional Rappahannock Rapidan Regional
Commission Geographical AreaCommission Geographical Area
�� Includes the counties and Towns of Culpeper, Fauquier, Madison, Includes the counties and Towns of Culpeper, Fauquier, Madison,
Orange and Rappahannock, VirginiaOrange and Rappahannock, Virginia
�� The region stretches from Shenandoah National Park in the west tThe region stretches from Shenandoah National Park in the west to o
within forty miles of Washington D.C. to the eastwithin forty miles of Washington D.C. to the east
�� The North Anna River which flows into Lake Anna, location of theThe North Anna River which flows into Lake Anna, location of the
North Anna Nuclear Power Plant, marks the southern most boundaryNorth Anna Nuclear Power Plant, marks the southern most boundary
of the region.of the region.
�� The topography varies from mountainous in the west to rolling The topography varies from mountainous in the west to rolling
piedmont in the east.piedmont in the east.
�� The area is predominately rural, the region is punctuated by The area is predominately rural, the region is punctuated by
increasingly urbanized and growing towns and centers.increasingly urbanized and growing towns and centers.
Rappahannock Rapidan Rappahannock Rapidan
Overview and PopulationOverview and Population
Population: 165,461
Rappahannock-Rapidan Regional Hazard Mitigation Plan 2012 Appendix C: Page 39
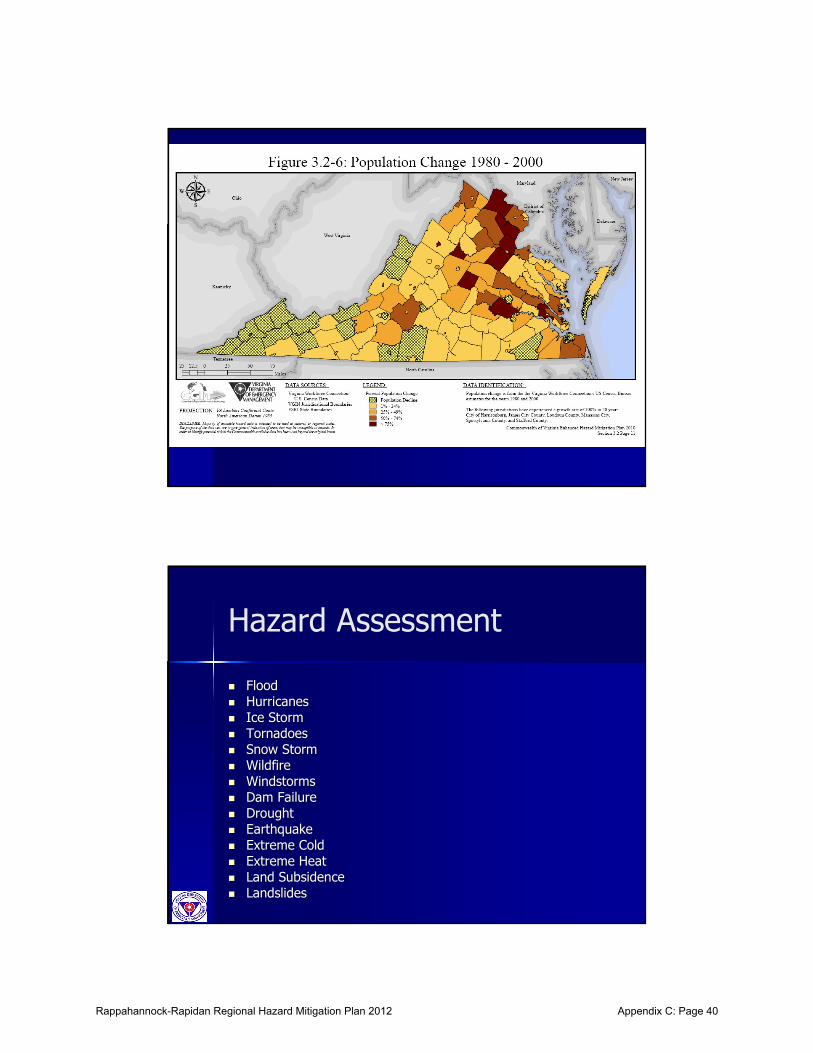
Hazard Assessment
�� FloodFlood
�� HurricanesHurricanes
�� Ice StormIce Storm
�� TornadoesTornadoes
�� Snow StormSnow Storm
�� WildfireWildfire
�� WindstormsWindstorms
�� Dam FailureDam Failure
�� DroughtDrought
�� EarthquakeEarthquake
�� Extreme ColdExtreme Cold
�� Extreme HeatExtreme Heat
�� Land SubsidenceLand Subsidence
�� LandslidesLandslides
Rappahannock-Rapidan Regional Hazard Mitigation Plan 2012 Appendix C: Page 40

RappahannockRappahannock--Rapidan RCRapidan RC
Regional Hazard Mitigation PlanRegional Hazard Mitigation Plan
FEMA Approved on May 15, 2005FEMA Approved on May 15, 2005
Hazard Identification TableHazard Identification Table
Table 6.10
Estimated Risk Levels for the Rappahannock-Rapidan Region (Combination of Qualitative and Qualitative Assessments)
HIGH RISK HAZARDS
Flood
Hurricanes and Tropical Storms
Winter Storms
MODERATE RISK HAZARDSSevere Thunderstorms and Tornadoes
Drought
LOW RISK HAZARDS
Earthquakes, Sinkholes, Landslides
Wildfire
Dam/Levee Failure
Erosion
Historical Frequencies (Tornado)Historical Frequencies (Tornado)
Rappahannock-Rapidan Regional Hazard Mitigation Plan 2012 Appendix C: Page 41

Historic Frequencies (Winter Weather)
Probability (Hurricane Wind)
Rappahannock-Rapidan Regional Hazard Mitigation Plan 2012 Appendix C: Page 42
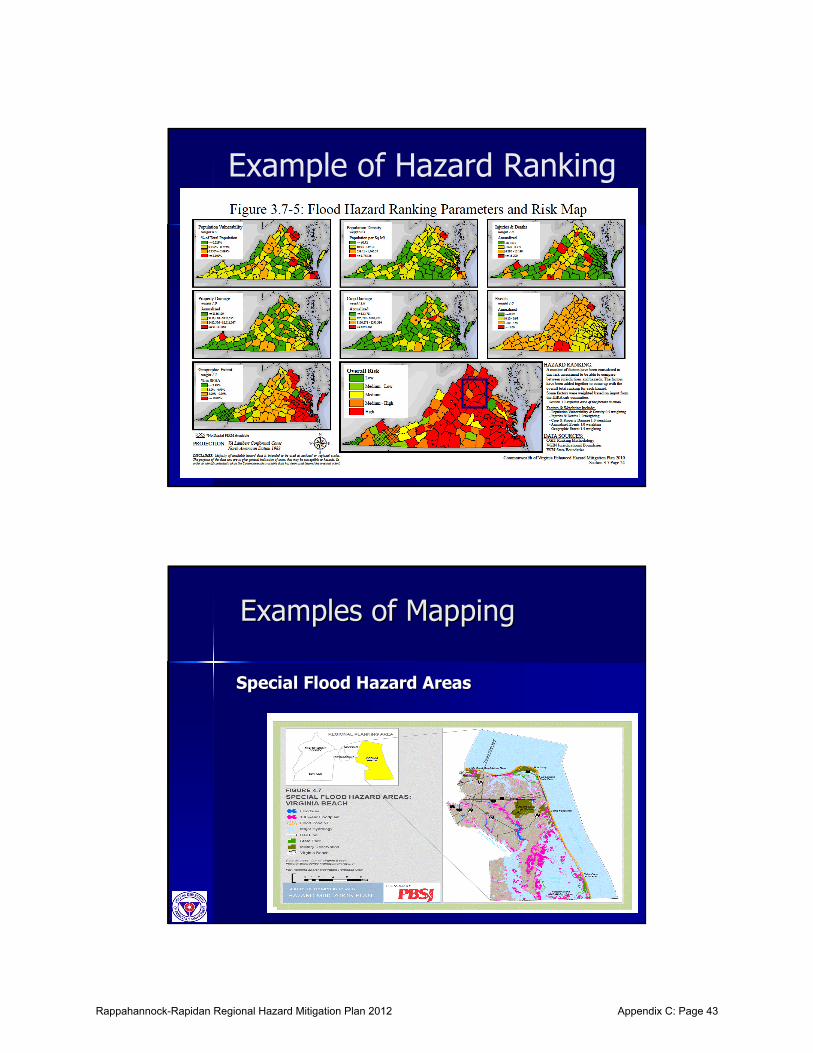
Example of Hazard Ranking
Examples of MappingExamples of Mapping
Special Flood Hazard AreasSpecial Flood Hazard Areas
Rappahannock-Rapidan Regional Hazard Mitigation Plan 2012 Appendix C: Page 43

Presidentially Declared DisastersPresidentially Declared Disasters
Rappahannock-Rapidan Regional Hazard Mitigation Plan 2012 Appendix C: Page 44

Risk AssessmentRisk Assessment
�� Identify the location of the hazardIdentify the location of the hazard
�� Identify the magnitude or severity of Identify the magnitude or severity of
the hazard (How bad can it get?)the hazard (How bad can it get?)
�� Provide information on previous Provide information on previous
occurrences of hazards.occurrences of hazards.
�� Include probability of future eventsInclude probability of future events
Helpful Data SourcesHelpful Data Sources
�� FEMA Map Service CenterFEMA Map Service Center–– http://msc.fema.gov/webapp/wcs/stores/servlet/http://msc.fema.gov/webapp/wcs/stores/servlet/FemaWelcomeView?storeId=10001&catalogId=1FemaWelcomeView?storeId=10001&catalogId=10001&langId=0001&langId=--11
�� NCDC DatabaseNCDC Database–– http://www4.ncdc.noaa.gov/cgihttp://www4.ncdc.noaa.gov/cgi--win/wwcgi.dll?wwEvent~Stormswin/wwcgi.dll?wwEvent~Storms
�� VDEM Historical HazardsVDEM Historical Hazards–– http://www.vaemergency.com/threats/index.cfmhttp://www.vaemergency.com/threats/index.cfm
�� Local Flood Hazard Data Local Flood Hazard Data –– Emergency Emergency Reports/Damage ReportsReports/Damage Reports
Rappahannock-Rapidan Regional Hazard Mitigation Plan 2012 Appendix C: Page 45

Determining VulnerabilityDetermining Vulnerability
�� Inventory your assetsInventory your assets–– Critical facilities and vulnerable populationsCritical facilities and vulnerable populations
–– Include estimates of the number and types of Include estimates of the number and types of
structures at riskstructures at risk
–– Indentify repetitive loss properties (RFC) and Indentify repetitive loss properties (RFC) and
severe repetitive loss properties (SRL)severe repetitive loss properties (SRL)
�� FEMAFEMA’’s HAZUS Softwares HAZUS Software
�� Estimate annualized LossEstimate annualized Loss
Examples of MappingExamples of Mapping
Repetitive Repetitive
Loss Loss
PropertiesProperties
Rappahannock-Rapidan Regional Hazard Mitigation Plan 2012 Appendix C: Page 46

Examples of MappingExamples of Mapping
Repetitive Repetitive
Loss Loss
PropertiesProperties
Vulnerability IndexVulnerability Index
Example Algorithm used:Example Algorithm used:
–– Vulnerability = $$ Loss/Square Vulnerability = $$ Loss/Square
FootageFootage
–– $$ $$ = Building Damage + Contents = Building Damage + Contents
Damage + Loss of Function + Damage + Loss of Function +
Community ImpactsCommunity Impacts
Rappahannock-Rapidan Regional Hazard Mitigation Plan 2012 Appendix C: Page 47

Goals and StrategiesGoals and Strategies
�� Revise goals to see if they are still Revise goals to see if they are still relevant for plan revision.relevant for plan revision.
�� Evaluate mitigation strategies and Evaluate mitigation strategies and report on their progress.report on their progress.
�� Eliminate strategies that are no longer Eliminate strategies that are no longer relevant.relevant.
�� Include new strategies that result from Include new strategies that result from the updated HIRA.the updated HIRA.
Original Plans GoalsOriginal Plans Goals
�� Goal #1: Improve and update data needed for hazard mitigation pGoal #1: Improve and update data needed for hazard mitigation purposes within urposes within the Rappahannockthe Rappahannock--Rapidan Regional Commission and local jurisdiction Rapidan Regional Commission and local jurisdiction offices. offices.
�� Goal #2: Implement policies that incorporate mitigation planninGoal #2: Implement policies that incorporate mitigation planning into the g into the framework of local government in the Rappahannockframework of local government in the Rappahannock--Rapidan Region. Rapidan Region.
�� Goal #3: Implement sound planning techniques throughout the regGoal #3: Implement sound planning techniques throughout the region that ion that compliment the benefits of hazard mitigation. compliment the benefits of hazard mitigation.
�� Goal #4: Implement cost effective structural projects throughouGoal #4: Implement cost effective structural projects throughout the region to t the region to reduce the impact of future disaster events. reduce the impact of future disaster events.
�� Goal #5: Conduct training throughout the region for employees tGoal #5: Conduct training throughout the region for employees to improve response o improve response capabilities of local emergency management officials and tcapabilities of local emergency management officials and to educate local o educate local officials of benefits of hazard mitigation techniques.officials of benefits of hazard mitigation techniques.
�� Goal #6: Implement meaningful education and outreach projects tGoal #6: Implement meaningful education and outreach projects throughout the hroughout the region to educate the public about the dangers of natural region to educate the public about the dangers of natural hazards and how hazards and how they can protect their families and their property.they can protect their families and their property.
�� Goal #7: Improve regional evacuation capabilities and plan for Goal #7: Improve regional evacuation capabilities and plan for the potential the potential impacts of a potential evacuation of the Washington D.C. aimpacts of a potential evacuation of the Washington D.C. area.rea.
Rappahannock-Rapidan Regional Hazard Mitigation Plan 2012 Appendix C: Page 48

Plan Maintenance SectionPlan Maintenance Section
�� Establish method for reviewing and Establish method for reviewing and
reporting annually.reporting annually.
�� Determine responsible group(s) for Determine responsible group(s) for
plan review/implementation.plan review/implementation.
Questions?Questions?
Rappahannock-Rapidan Regional Hazard Mitigation Plan 2012 Appendix C: Page 49

RAPPAHANNOCK-RAPIDAN REGION
MULTI-JURISDICTIONAL
ALL-HAZARD MITIGATION PLAN
UPDATE
Workshop #1 – April 20, 2010
1
Planning Process – Where Are We?Stage One
� Hazard ID & Risk Assessment
� Assets
� Vulnerability
� Capability Assessment
Stage Two
� Mitigation Goals & Objectives
� Mitigation Strategies
Stage Three
� Plan Maintenance Procedures
� Draft Plan
Stage Four
� VDEM & FEMA Reviews
� Conditional Approvals
� Final Draft
Stage Five
� Adoption
� FEMA Final Approval
2
Rappahannock-Rapidan Regional Hazard Mitigation Plan 2012 Appendix C: Page 50

STAGE ONE:
Hazard and Risk Assessment: Incomplete
Worksheet #1- Hazards List
ALL HAZARDS LISTED CONSIDERED PROBABLE EXCEPT:
• Avalanches
• Landslides due to earthquake
• Military accidents
• Transit – subway
• Volcanic - eruptions and ash
3
STAGE ONE ….
Hazard and Risk Assessment: Incomplete
Hazards Identified as High Intensity
• Drought*
• Flood*
o Heavy Rain
o Rapid Snow Melt
• Utility Interruption*
o Communication
o Electricity
• Extreme Heat*
• Hurricane*
• Transportation Incident
o Air
• Wildland Fire
o Urban Interface
o Public Land*
o Private Land
* High area impact 4
Rappahannock-Rapidan Regional Hazard Mitigation Plan 2012 Appendix C: Page 51

Historic Hazard Events
• Snowstorm – December 18-20, 2009
o 16”-24” snow
o Presidentially Declared Disaster DR-1874
• Snowstorm – February 5-6, 2010
o 22”- 35” snow
Others since 2005?
5
Unique Hazard Risk?
6
Rappahannock-Rapidan Regional Hazard Mitigation Plan 2012 Appendix C: Page 52

Wildland Urban Interface
…zone where structures and other human
developments meet, or intermingle with,
undeveloped wildlands….. where wildfire
poses the biggest risk to human lives and
structures. USDA Dept. of Forestry
Virginia Department of Forestry – “Portions of
each county within response area are at risk.”
7
Virginia Department of Forestry
Wildland-Urban Interface: Culpeper
Structures at risk – 128 (2009)
8
Rappahannock-Rapidan Regional Hazard Mitigation Plan 2012 Appendix C: Page 53

Virginia Department of Forestry
Wildland-Urban Interface: Rappahannock
Structures at risk – 64 (2009)
9
10
Rappahannock-Rapidan Regional Hazard Mitigation Plan 2012 Appendix C: Page 54

NEXT… DETERMINING VULNERABILITY
Worksheets 4 & 5
o Inventory Your ASSETS
�Critical facilities & vulnerable populations
�Number & types of structures at risk
�Number of buildings, infrastructure and critical
facilities located in hazard areas
�Identify repetitive loss properties & severe
repetitive loss properties
11
Consider….
� Essential infrastructure
� Special needs
�Hazardous material facilities
�Natural assets
� Impacts of growth and development
� Future development trends
12
Rappahannock-Rapidan Regional Hazard Mitigation Plan 2012 Appendix C: Page 55

Capability Assessment …Worksheets 6,7,8 &
9
�What resources are available?
� What are our limitations?
�Regulatory/Administrative/Technical/Fiscal
13
Capability Assessment
�Measures each jurisdiction’s competency and
ability to implement hazard mitigation
activities
�Identifies existing gaps, conflicts, weaknesses
in local programs, plans, and policies
�Identifies mitigation measures already in
place
�Identifies mitigation opportunities
14
Rappahannock-Rapidan Regional Hazard Mitigation Plan 2012 Appendix C: Page 56

Capability Assessment
Plan, Policy Program or Ordinance Status
Hazard Mitigation Plan
Comprehensive Plan
Floodplain Ordinance
Open Space Management Plan
Stormwater Management Plan
Emergency Operations Plan
Hazardous Materials Facility Plan
Evacuation Plan
Continuity of Operations Plan15
Capability Indicators -
�National Flood Insurance Program (NFIP)
Participation
�Community Rating System (CRS) Participation
�Building Code Effectiveness Grading Schedule
(BCEGS)
� Firewise Community
16
Rappahannock-Rapidan Regional Hazard Mitigation Plan 2012 Appendix C: Page 57

STAGE TWO – are we there yet?
� Mitigation Goals and Objectives
� Development of Mitigation Strategies
*Risk & Capability Assessment = Foundation
for Identification of Mitigation Actions*
17
Goals and Strategies
� Review current goals and determine
relevance
�Determine progress in terms of existing
mitigation strategies
�Develop new strategies that reflect updated
risk and capability assessments
18
Rappahannock-Rapidan Regional Hazard Mitigation Plan 2012 Appendix C: Page 58

Helpful Data Sources
• FEMA Map Service Center
– http://msc.fema.gov/webapp/wcs/stores/servlet/FemaWelcomeView?storeId=10001&catalogId=10001&langId=-1
• NCDC Database
– http://www4.ncdc.noaa.gov/cgi-win/wwcgi.dll?wwEvent~Storms
• VDEM Historical Hazards
– http://www.vaemergency.com/threats/index.cfm
• Local Flood Hazard Data – Emergency Reports/Damage Reports
19
www.rrregion.org
20
Rappahannock-Rapidan Regional Hazard Mitigation Plan 2012 Appendix C: Page 59

1
RAPPAHANNOCK-RAPIDAN REGION
MULTI-JURISDICTIONAL
ALL-HAZARD MITIGATION PLAN
UPDATE
1
Workshop #2 – July 13, 2010
Planning Process – Where Are We?Stage One ‐ INCOMPLETEINCOMPLETE
Hazard ID & Risk Assessment
Assets
Vulnerability
Capability Assessment
Stage Two
Mitigation Goals & Objectives
Mitigation Strategies
Stage Three
Plan Maintenance Procedures
Draft Plan
Stage Four
VDEM & FEMA Reviews
Conditional Approvals
Final Draft
Stage Five
Adoption
FEMA Final Approval
2
Rappahannock-Rapidan Regional Hazard Mitigation Plan 2012 Appendix C: Page 60

2
VDEM Requirements:
• “A comprehensive review must be done for all plan sections (Planning Process Risk and Vulnerabilitysections (Planning Process, Risk and Vulnerability Assessment, Capability Assessment, Mitigation Goals/Strategy, and the Plan Maintenance Process).”
3
STAGE ONE: findings continued…..
Assets (worksheet #4)
o Specific to locality
Vulnerability (worksheet #5)
o Impact of prolonged power outage
o Transportation limitations – public and private
o Development in remote, difficult‐to‐access locations
Si ifi h i d i f i lo Significant growth since adoption of previous plan
o Some localities have implemented improved warning systems
4
Rappahannock-Rapidan Regional Hazard Mitigation Plan 2012 Appendix C: Page 61

3
Capability Assessment ‐ Regulatory (worksheet #6)
• Include link/information on how to obtain documentsdocuments
• Review and update Table 7‐1
• Other locality‐specific plans/tools
o Steep slopes
o Wildfire
• Identify gaps = OPPORTUNITIES!
5
Jurisdiction
Floo
d In
sura
nce
Pro
gram
mm
unit
y R
atin
g Sy
stem
ard M
itig
atio
n P
lan
ster
Rec
over
y Pl
an
hensi
ve L
and U
se P
lan
lain
Man
agem
ent
Pla
n
ater
Man
agem
ent
Pla
n
ency
Opera
tion
s Pla
n
ity
of O
per
atio
ns
Pla
n
ogic
al E
mer
gency
Pla
n
AR
A T
itle
III P
lan
Evac
uat
ion P
lan
ansp
orta
tion
Pla
n
l Im
pro
vem
ents
Pla
n
ic P
rese
rvat
ion P
lan
onin
g O
rdin
ance
div
isio
n O
rdin
ance
Preve
nti
on O
rdin
ance
Buildin
g C
ode
Fire
Cod
e
ffer/
Wetl
and P
rese
rvat
ion
ern
menta
l Org
aniz
atio
n
Spac
e P
rese
rvat
ion
/Pri
vate
Par
tner
ship
sRelevant Plans, Ordinances ,Programs: (See section 7, p. 4 – 2005 Plan)
Nat
ional
F
NFI
P C
om
Haz
a
Dis
as
Com
pre
h
Floo
dpl
Stor
mw
a
Emerg
e
Con
tinu
Rad
iolo SA E
Tra
Cap
ita
His
tor Zo
Subd
Floo
d D
amag
e
Rip
aria
n B
uf
Non
-Gov
e
Open
Public/
Culpeper County
Town of Culpeper
Fauquier County
Town of Warrenton
Town of Remington
6
Madison County
Town of Madison
Orange County
Town of Orange
Town of Gordonsville
Rappahannock County
Rappahannock-Rapidan Regional Hazard Mitigation Plan 2012 Appendix C: Page 62

4
Capability Assessment , cont...
Technical (worksheet 7)
Fi l ( k h t 8) Fiscal (worksheet 8)
Narrative (worksheet 9)
7
Findings of Risk Assessment & Capabilities Assessments ‐
NEEDED TO PROCEED TO ……
8
Rappahannock-Rapidan Regional Hazard Mitigation Plan 2012 Appendix C: Page 63

5
Mitigation Goals & Objectives
• Review and determine status of previous iti ti ti S S ti 10mitigation actions – See Section 10
Completed?
Relevant?
Next Steps?
• Identify potential hazard mitigation actionsIdentify potential hazard mitigation actions that your jurisdiction will consider to reduce the effect of natural hazards
9
Mitigation Action Summary
MITIGATION ACTION
Community Name:
Action Item (describe):
Category:
Hazard(s):
Lead Agency/Department Responsible:
Estimated Cost:
Funding Method:
Implementation Schedule:
Priority:
10
Rappahannock-Rapidan Regional Hazard Mitigation Plan 2012 Appendix C: Page 64

6
Next Steps……….
11
Rappahannock-Rapidan Regional Hazard Mitigation Plan 2012 Appendix C: Page 65

4/16/2012
1
Rappahannock-Rapidan Regional
Hazard Mitigation Plan
2012 Update
Draft Review Meeting – April 13, 2012
Plan Update Process – Where Are We?Stage One ‐ Completed
Hazard ID & Risk Assessment
Asset Inventory
Vulnerability
Capability Assessment
Stage Two ‐ Completed
Mitigation Goals & Objectives
Mitigation Strategies
Stage Three ‐ Completed
Plan Maintenance Procedures
Draft Plan
Stage Four ‐ Pending
VDEM & FEMA Reviews
Conditional Approvals
Final Draft
Stage Five ‐ Pending
Adoption
FEMA Final ApprovalRappahannock-Rapidan Regional
Hazard Mitigation Plan 2012
Rappahannock-Rapidan Regional Hazard Mitigation Plan 2012 Appendix C: Page 66

4/16/2012
2
• February 2010: Kickoff Meeting
Plan Update Process Review
– Data Requested
• Hazard Inventory & Probability
• Update of Hazard Events (Since 2004)
• Identification of Unique Hazards
Rappahannock-Rapidan Regional Hazard Mitigation Plan 2012
• April & July 2010: Stakeholder Meetings
Plan Update Process Review
– Data Requested
• Critical Facilities update (new buildings, assets)
• Capability Assessment update– Regulatory, Technical, Administrative Changes (Ordinance updates, local plans)
Rappahannock-Rapidan Regional Hazard Mitigation Plan 2012
Rappahannock-Rapidan Regional Hazard Mitigation Plan 2012 Appendix C: Page 67

4/16/2012
3
• 2010/2011
Plan Update Process Review
– Local Activities
• Review of 2004 Mitigation Actions– Updates on progress
– Addition of new mitigation actions as necessary
– RRRC Activities
• Data collection and revisions for Plan sections 3 4 5 &• Data collection and revisions for Plan sections 3, 4, 5 & 6
• GIS & Mapping updates
• Revision of Plan Sections 1‐9
Rappahannock-Rapidan Regional Hazard Mitigation Plan 2012
• 2012
Plan Update Process Review
– RRRC Activities
• Hold individual meetings with jurisdictions to complete data updates, mitigation strategy review (as necessary)
• Finalize Draft Plan
• Public Comment Period
Rappahannock-Rapidan Regional Hazard Mitigation Plan 2012
Rappahannock-Rapidan Regional Hazard Mitigation Plan 2012 Appendix C: Page 68

4/16/2012
4
Review of Changes from 2004 Plan
• Data Updates
S ti 3 D hi L d U Hi t i H d t– Section 3: Demographics, Land Use, Historic Hazards, etc
– Sections 4 through 6: Hazard Identification, Analysis
• Section 5: Hazard Analysis
– All Hazards reviewed & updated with relevant additions since 2004 (Winter Storms 2009/10 Earthquake 2011)since 2004 (Winter Storms 2009/10, Earthquake 2011)
Rappahannock-Rapidan Regional Hazard Mitigation Plan 2012
Review of Changes from 2004 Plan
• Section 6: Vulnerability Analysis
Additi l U i H d Id tifi d– Additional Unique Hazards Identified• Town of Culpeper: Dam/Levee Failure
• Culpeper County: Earthquake
– Data revised for each identified hazard• Updated GIS data from jurisdictions
• HAZUS Estimates for Flood, Hurricane, Earthquake
U d t d hi t i l l d t• Updated historical loss data
– Hazard Ranking Changes• Flood, Hurricane/Tropical Storm, Winter Storm Rank High
• Severe Thunderstorm/Tornado, Drought, Wildfire Rank Moderate
Rappahannock-Rapidan Regional Hazard Mitigation Plan 2012
Rappahannock-Rapidan Regional Hazard Mitigation Plan 2012 Appendix C: Page 69

4/16/2012
5
• Local Strategies
Mitigation Strategy Updates
• Regional Strategies
Rappahannock-Rapidan Regional Hazard Mitigation Plan 2012
• FEMA HMA Program: http://www.fema.gov/government/grant/hma/index.shtm
FEMA Hazard Mitigation Assistance
http://www.fema.gov/government/grant/hma/index.shtm– Five Grant programs
– Most applicable to Rappahannock‐Rapidan Region are the Pre‐Disaster Mitigation (PDM) and Hazard Mitigation Grant Program (HMGP)
– Other programs are Flood Mitigation Assistance (FMA), Repetitive Flood Claims (RFC) and Severe Repetitive Loss (SRL) – all flood related
• PDM: Annual Federal appropriations, VDEM administered
• HMGP: Funds awarded post‐disaster declaration – VDEM will have funds available from DR‐4042 and DR‐4045
(Earthquake and Tropical Storm Lee remnants declarations)
• Potential Changes for FY2013 at Federal level
Rappahannock-Rapidan Regional Hazard Mitigation Plan 2012
Rappahannock-Rapidan Regional Hazard Mitigation Plan 2012 Appendix C: Page 70

4/16/2012
6
Localities are required to have a FEMA-approved and locally adopted Hazard Mitigation Plan in order to qualify for Hazard Mitigation Assistance funds
Rappahannock-Rapidan Regional Hazard Mitigation Plan 2012
• Additional Jurisdiction Feedback
• Submission to VDEM for Review
Next Steps
• Submission to VDEM for Review– Incorporation of VDEM Requested Changes
• Submission to FEMA for Review– Incorporation of FEMA Requested Changes
– Conditional Approval
• Local AdoptionP bli H i R l i f Ad i– Public Hearing, Resolution of Adoption
– Plan is Active upon first adoption (5‐year update period)
– Jurisdictions eligible for HMGP funding after local adoption
Rappahannock-Rapidan Regional Hazard Mitigation Plan 2012
Rappahannock-Rapidan Regional Hazard Mitigation Plan 2012 Appendix C: Page 71

4/16/2012
7
• Plan Maintenance Procedures (2012 through 2017)– Annual Updates to RRRC/VDEM
Next Steps
Annual Updates to RRRC/VDEM• Mitigation Strategy progress
• RRRC coordination through Regional Emergency Managers
– Plan Review following all declared disasters
– Next full update likely to begin in 2016
• Interim local changes– Mitigation strategies can be added/revised at local level at any time
Rappahannock-Rapidan Regional Hazard Mitigation Plan 2012
Rappahannock‐Rapidan Regional Hazard Mitigation Plan 2012
http://www rrregion org/mitigationhttp://www.rrregion.org/mitigation
Plan Contact:
Patrick MauneyGIS Program ManagerRRRC420 Southridge Parkway, #106Culpeper VA 22701
Rappahannock-Rapidan Regional Hazard Mitigation Plan 2012
Culpeper, VA 22701
Rappahannock-Rapidan Regional Hazard Mitigation Plan 2012 Appendix C: Page 72

R-RRC ALL-HAZARD MITIGATION PLAN REVISION
STEERING COMMITTEE
GRANT # PDM-2009-000-002
JURISDICTION REPRESENTATIVE E-MAIL PHONE ADDRESS Culpeper County Tom Williams [email protected] 540.727.7161 15166 Richmond Road
Culpeper, VA 22701 Town of Culpeper Fritz Alderman [email protected] 540.829.8260 400 S. Main Street
Culpeper, VA 22701 Fauquier County Sara Makely [email protected]
540.347.6996 78 W. Lee St., Suite 101
Warrenton, VA 20186 Town of Warrenton Sarah Sitterle [email protected]
540.347.2405 P.O. Drawer 341
Warrenton, VA 20188 Town of Remington Sharon Lee [email protected]
540.439.3220 P. O. Box 267
Remington, VA 22734 Town of The Plains --
-- -- --
Madison County Carl Pumphrey
[email protected] 540.948.7508 538 South Main Street Madison, VA 22727
Town of Madison Willie Lamar [email protected]
540.949.6717 23 Washington Circle Madison, VA 22727
Orange County John Harkness [email protected]
540.661.5428 P.O. Box 111 Orange, VA 22960
Town of Orange John Harkness [email protected]
540.661.5428 P.O. Box 111 Orange, VA 22960
Town of Gordonsville -- --
-- --
Rappahannock County Richie Burke [email protected]
540.675.5340 P.O. Box 222 Washington, VA 22727
Town of Washington Richie Burke [email protected] 540.675.5340 P.O. Box 222 Washington, VA 22727
OTHER Shenandoah NP
Jeff Koenig [email protected] 540.999.3500x3441 Shenandoah National Park 3655 U.S. Highway 211 East Luray, VA 22835
Rappahannock-Rapidan Regional Hazard Mitigation Plan 2012 Appendix C: Page 73

VA. Dept. of Forestry Terry Lasher, DOF [email protected] 540.347.6305 675 Frost Avenue Warrenton, VA 20186
Va. Dept of Health Kathy Hatter, VDH [email protected] Va. DCR Charley Banks, DCR [email protected] 804.371.6135 203 Governor Street, Suite 206
Richmond, VA 23219
Rappahannock Electric Maxie Rozell
VDEM Amy Howard, VDEM [email protected] 804. 897.6500 x 6534
10501 Trade Court Richmond, VA 23236
VDEM Bruce Sterling, VDEM [email protected] 540.829.7371 P.O. Box 1386 Culpeper, VA 22701
Culpeper Hospital Amy Utley [email protected] 540.829.4336 P.O. Box 592 Culpeper, VA 22701
Fauquier Hospital Tracy Turman [email protected] 540.316.3855 500 Hospital Drive Warrenton, VA 20186
Lord Fairfax Community College (Warrenton)
Cindy Bambara [email protected] 540.351.1516 6480 College Street Warrenton, VA 20187
Germanna Community College (Culpeper)
Mark Borchers [email protected] 18121 Technology Drive Culpeper, VA 22701
Rappahannock-Rapidan Regional Hazard Mitigation Plan 2012 Appendix C: Page 74

R-RRC ALL HAZARD MITIGATION PLAN REVISION
, , MEETING SIGN-IN Date:~z//O GRANT # PDM-2009-000-002
---,-_.._ JURISDICTIONI E-MAIL PHONE
NAME ORGANIZATION l:MftJ:.'01 __ !\'-fH' 4;)', A'-iu.Jc~V Al \lbE~ 'liN'-L\ Y\O 1.<...1(j0Vdl ~ .i,db L~\. , \ \ If(1 \'-S.d'-'¥U S'1'L'_<;'St):')---.;j;r rx tJ;) -C J\f;",-) f<fv !~ cYXClb>--- -haC\!" v i"n, iru,o~~·/' ,!,v ~y ,.'~ <-c.)'..1"'- f)p J.f - '37/ - " I 3 j'".
~)t~uC,Q [' , -. Y ;;''Y;1 ~ jY" 9,·
Al ,1"[)J1~m he7t,L_____ 1QiZ>'J1lhi Ikil.(§J CuC /;.""jX"·Qj,¢.r~ 7J7 ·$<tt2C. R <;1 VDeN\ hrvq 'J t P(I.~, (jJ I/"I<.H., I",,'I"~;"";', ' ,;/ (;., ~ _.:::-.:...- 1>?(
!J,r"-~:1r-(!"'.~.r:~·---'P~e. L_~n ",, __ Ifun , ,;>, - ,/!i)q40Y-- 1r?-, ,(,~.'" -;;'G, -,@ Vff; .t;;~,' 4 <?,~ .,Y6fi' 4, 2/..:... I
\:), \.(f(dI,"') <ll.t:4J4 00 I+e. 'f\:0r.:YJ" "'HYJQIC rz. £1,,'C'\' Ic.. ~<2;) !f1IU-ec.C OOA 5yo S'1I- SCtl I ,":cL rwt, (' ,+t (I.. v(L 1. b j - " ',f(~ ..t( < J i0 ~t r/tI'R.It 'QY.!.~@.(t"'J'::r,,;:Jh fll \;(f tCV,r,trvt/iV1 S'f/ 1/5' !( , 9-1 () -2;>4Z.-:~'')"", ~t· 1(0" ... " tiP ,S ,f}fff'1-1 .J ~ ~}:' ,(. "",-{' ".. 1 .c~ Vl~"~_5ir~'~'___ <'YO -- '11"1, 3 k'& ' ~,.. 3(fL j(
D,1"V~ /lJ~-L,/.N('~ TDc....,;./v Or- c.~i../LfJC;Ct?7L I (j~,.. " I, e: """ /,. "/I~/:J,"" +0 ~<-yp -- if"Z$ . 1i'2 -; .3
h/Ti-"]l<»~ZA~ .:1..'<:_. ___...._ ......... " " L"'/d~' "'''' ./'", 4,~ "''':/'B 1.;--4"'9:_:"'z,.,;> $"'.' r-r~"""" ~SqCl"- \Jl'iff ·t:ev-r-,l ,/c<>h,._ '2.,,t'(::V,o«'h" U S4u' 347--l1~5
(J \.. ll.' <, -~ .;: I '<;.,l.v..s C. eM/::. ',vL~.a.4'!1.,e '°9~_~..p:_c;...ffH.H ., ~10 ~,5"<ft;l_~L£J (<cxrr K (:'-1 kW Ai M~ r'.u, 'jh >'1P /' S'(0,-/,41 ,·u Jv1 e LlRl/'/-o f)i .. -f')'1 ~-' ;;/S --I, :k'Clc~1M,-e C~"r" 0Jw,,,- 'f" c:. r-:<::u~ l, ,\.,.l 7''::' t<-"k --a,-t:l!v( t:&~' ,0 ! T ~_ • <: ~- ')Y't:}, ,;(/ f~7'7!/
~-d,'-- CI v v::, c/~..I,.· ;,.J P. i, j ""-.I \I' l1~r'A \70 I 1"::,/A.\,,-\:,\"f,iill..8r.:1l< IO,J.(h'lV .Ic.,o\/ 5'//1 ::>'t7" ! i tJ7
)J£:n-f.J(( C~.g,N()eA/o/ ,-k5'r- RMi/t (M>JI>JlJt:jck, C.t;J If C \)/2 Je' C s. c,,,,-,- S~l 6?r: j '7~":'J
\';c:~ ~tl-tv~ . __________,__' yJ) H___________......___.. lCo:vlc·(~"'",i..~_(
R-RRC ALL HAZARD MITIGATION PLAN REVISION , t::./' /.'
MEETING SIGN-IN !Date: GRANT # PDM-2009-000-002 ....
.t.-;¢;U"'lJ'!}/:/",':,Fl<e;f""" /,/",,",' "'
'-' l JURISDICTION/ I E-MAIL I PHONE NAME ORGANIZATION
,
", " ,~-, .' " ' '/"" " l ,/I, ie'"
kS'./i'VM. G",S.lLJc.'C';v =t r C'(4/,,/'/ LCt<Wv/ ! r:N~' ',/4 ~cIJ~P";';#1 tf/c, ..,,,,:J 7!JC,,;z;;C 3'1l" ,.... -"It' __e' / .•,- . -J.. ,_ .M· J' , ""t·· f/_·
I ,(,f",. ,,('~' < ) ~~. m____ ~ j <~ i.,p.' I'd... ~-,l t v' '"'t ~"r---..,j ~..- <t I~ .t./..-z..jl(..(',1'".c:2 ~(.!'rlffs'~'::;i;, /'..J V "! ~~ ~) ~ 7 7 ~ /('t j ;:r vi
f-- I I I 1
I 1 _.- I·· ... j ...~
f--- I··· I I ....
I 1 1... ··--+1--
L. '.. .... , _ ,
Rappahannock-Rapidan Regional Hazard Mitigation Plan 2012 Appendix C: Page 76

Rappahannock-Rapidan Regional Hazard Mitigation Plan 2012 Appendix C: Page 77

R-RRC ALL HAZARD MITIGATION PLAN REVISION
MEETING SIGN-IN Date:� GRANT # PDM-2009-000-002~t.,/tJ
JURISmCTIONI E·M~ PHONE 1-.----NAME.. ORGANIZATION ._ .__
._6..'.- l.l )~,~e.., ~~~ ~o.t\l9<l~~ £Iec. £.ru\('~L
~J~Q.Ad~1l -qr.~~~d .~~ .. _~"_ d~ciatfe'J
_~" J&d l.-5ztrunrlhJ _ R'M,:! I!)I~- ('/!.t1~1j::'8 ·fC'lcJfLiJ {(ltJ'ler~C&.1'
~ffi . _... Thll.llU f\t&>il/\lm~lV17.)WlU()ff-g
•� ~ c!l- )k",::'/li'>(... 1'')/4"~)<2 Cov.-'-Y ~l)rul-ft'>l(iJ >
_G ('{s Bp..&J:_ Lf(;e..- ,..., / r-c'bo.'er~Jf ~_~O·m-71~'l
_W,," ffl ItA.- ICt:<mCo ClACk...d L P(,(!J eJJeunbttr4, '$'fD .35-J-I/~i10 IE:,4U1 L.""Slo'C� '\J:D6t" ~ k:~"""f' lc.sh, Silo -3.47-<sBt:
Sk.;;Q,:~0=~=~. ,.. - 'hUM Ci~'6im'':6--t~h . 1;~)11 oyt'LYu":i3, .' .7.~rb·\I~?~~
f _. •[)r> / ~/ C/< 1'.~::'___ _~ __... .-; ~, C, />Y?(c-(;:~:/V-,/_~{; <"'./_<;(':~::_-{ ('/ (',J) (,.</:) [Of' ':J,: ,~~", ._\)J< -'", / :? :;/,:~- ......;/ ;Yl,"
DEIl'{T)l'l'£::: CLAfl'ft:; ~-~ffL j
~,lYJ'z.! 13 {dte;; _ J-I
~!.'1::t:l<;;L ,f1t:';jPtl.<&i/f(.,Id;/ =±__~.'! ,_ __~ __1_ I
7ZtJr?fl't::::Jk( g"'J:';:J&!i:'ii::~·i_,,_ =1e.--..tI� _
f I + 1
1 1-- 1 I ~
Rapidan REG ION A l'-''''CYo :5:S ION
Rappahannock-Rapidan Regional Hazard Mitigation Plan 2012 Appendix C: Page 78

Rappahannock-Rapidan Regional Hazard Mitigation Plan 2012 Appendix C: Page 79

Rappahannock-Rapidan Region All-Hazard Mitigation Plan Revision - 2010
DATA COLLECTION GUIDE*
Please return all completed worksheets and supporting documentation to: Deirdre Clark OR Patrick Mauney Rappahannock-Rapidan Regional Commission Rappahannock-Rapidan Regional Commission 420 Southridge Parkway, Suite 106 420 Southridge Parkway, Suite 106 Culpeper, VA 22701 Culpeper, VA 22701 [email protected] [email protected]
* Please complete and return Worksheets 1, 2 and 3 by March 17, 2010.
*Please complete and return Worksheets 4 through 9 by May 25, 2010.
Rappahannock-Rapidan Regional Hazard Mitigation Plan 2012 Appendix C: Page 80

Rappahannock-Rapidan Region All-Hazard Mitigation Plan Revision - 2010
Overview
DATA COLLECTION GUIDE
Hazard mitigation planning is the process by which threats to localities are identified and the likelihood of impacts determined. Goals to mitigate those threats are developed and appropriate strategies to eliminate or reduce impacts are determined, prioritized, and implemented. FEMA approval of the updated all-hazard mitigation plan will qualify participating jurisdictions for federal support for pre- and post-disaster hazard mitigation projects.
The collection and analysis of significant information is needed to assure the development of a useful updated plan that meets the needs of each participating jurisdiction and the requirements of the Disaster Mitigation Act, 2000. Essential data includes general background information from each locality, hazard and risk information, current codes, ordinances, regulations and procedures related to loss minimization as well as an assessment of each locality's technical and organizational abilities to perform hazard mitigation and/or loss prevention functions. The cooperation of each jurisdiction in supplying needed information is critical to the development of a successful plan. _____________________________________________________________________________ What is Mitigation? As defined by FEMA, hazard mitigation is “any sustained action taken to reduce or eliminate long-term risk to human life and property from a hazard event.” As might be expected, savings from mitigation activities are highly cost-effective. On average, in addition to saving lives and preventing injuries, each dollar spent on mitigation saves about $4 in avoided future losses (National Institute of Building Science Multi-Hazard Mitigation Council 2005).
Generally, mitigation means reducing long-term risk from hazards to acceptable levels through predetermined measures accompanying physical development. Examples include strengthening structures to withstand high winds or snow loads, elevating, removing or limiting development in flood-prone areas, clearing defensible space around residences in Wildfire Urban Interface (WUI) areas, and designing development away from areas of geological instability. Participation As was acknowledged by a signed letter of intent (September, '08), each participating locality has agreed to "participate fully in the plan revision, acknowledging that such participation shall include, but not be limited to, local attendance/representation at upcoming planning and public meetings, responses to detailed inquiries and data requests, and fulfillment of the local match requirement by providing and tracking in-kind services and materials associated with those activities described above." Opportunities to participate in the revision process include, but are not limited to, the following: • Participate in region-wide planning meetings; • Track hours to meet grant match requirements; • Serve on the steering committee. • Provide data to be used to complete the hazard profile and vulnerability assessment; • Develop problem statements, based on the risk assessment and input from the public and each locality; • Develop a local mitigation strategy to include the identification of projects specific to each jurisdiction; • Participate in public outreach activities including public meetings; • Review, edit and approve draft plan documents; and • Assist in the adoption of the plan through formal resolution.
Rappahannock-Rapidan Regional Hazard Mitigation Plan 2012 Appendix C: Page 81

Data Collection Guide
The attached worksheets were developed to facilitate the collection of data needed to update the Regional All-Hazard Mitigation Plan. In addition to supplying needed information, the completed data sheets will serve as evidence of each locality's participation in the planning process. Locality representatives are reminded to review the existing plan at: http://www.vdem.state.va.us/library/plans/mitigation.cfm and to consult their Mitigation Strategies Update as prepared for VDEM in June, 2009. These may be viewed at http://www.rrregion.org/mitigation.
The Risk Assessment Process The risk assessment process includes three components: hazard identification, vulnerability assessment, and capability assessment. Data needs and worksheets for each of the risk assessment components are included in this guide. This information will be used to form the basis of your jurisdiction’s updated mitigation strategy.
Hazard Identification and Ranking – Worksheets #1, #2, and #3. Worksheet #1: Inventory and Attributes This will be used to quantify and compare the characteristics of each hazard, thereby determining which are most significant hazard identification and ranking is a means to quantify and compare the characteristic of each of the hazards, and identify those that are most significant for planning purposes. Use the following to guide the completion of worksheet #1(attached). Hazard Inventory:
• List all hazards that may occur, researching newspapers, historical records, internet websites and relevant sources. Hazard Attributes - factors related to the occurrence of each hazard, without any consideration of potential impacts.
• Probability: Based on past experience, how likely is it that an event will occur in the future? • Frequency: Use recall and documentation to demonstrate how often a hazard has occurred. • Area Affected: Did/does the event occur in isolated areas, affecting only a single unit of government, a wider
area, affecting multiple units of government, or a regional, affecting the entire county or many counties?
Worksheet #2: Historic Hazard Events List, describe and document significant hazard events. Research historical records, newspapers, websites, agencies and organizations for documentation of location, magnitude, injuries, deaths, extent of damage, etc.
Worksheet #3: Unique Hazard Risks – Local Jurisdictions List, describe and document specific natural hazard risks that are unique to certain localities. _________________________________________________________________________________________________
Critical Asset/Vulnerability Assessment - Worksheets #4 and #5 The completion of this aspect of the assessment will result in a detailed inventory of specific community assets, the damage or destruction of which would compromise public health or safety, or which are particularly vulnerable to identified hazards. These critical facilities are categorized below.
• Essential Infrastructure: Includes public and private utility facilities vital to maintaining or restoring normal services before, during, and after a hazard event. Examples are airports, roads, bridges, communications facilities and towers, correctional facilities, electrical generation/distribution facilities, media outlets, military installations, natural gas supply facilities, public safety (911) communications centers, public safety facilities (police, fire, EMS), public works garages, town/village/city halls, wastewater facilities, water utilities.
• Vulnerable Facilities: Includes childcare centers, community based residential facilities, special needs housing, community centers, campsites, healthcare facilities, hospitals, nursing homes and long term care facilities, historic properties, manufactured homes, and economic assets.
Rappahannock-Rapidan Regional Hazard Mitigation Plan 2012 Appendix C: Page 82

• Hazardous Materials Facilities: Includes structures or facilities that produce, use, or store highly volatile, flammable, explosive, toxic, and/or water-reactive materials.
• Natural Assets: Includes environmentally sensitive areas such as wetlands and floodplains, as well as threatened and endangered species, their habitats and other environmentally significant features. ___________________________________________________________________________________
An evaluation of a locality's hazard mitigation programs and policies is essential to determine its ability to reduce vulnerability and/or respond to an event. The capability assessment considers the regulatory, administrative/technical and fiscal aspects of a locality's programs and policies.
Capability Assessment – Worksheets #6, #7, #8 and #9
• Regulatory Tools: Worksheet #6 lists planning and land management tools typically used by local jurisdictions to implement hazard mitigation activities. Please indicate which are currently in place in your jurisdiction. If this capability or authority is not in place at the local level, please indicate if a higher level of government assumes that responsibility. Along with your comments, please include information on how to obtain the document/information – web site, via e-mail, fax, etc.
• Administrative/Technical Resources: Completion of Worksheet #7 requires the identification of the individuals responsible for hazard mitigation/loss prevention within each locality. Smaller jurisdictions lacking local staff are asked to identify any public resources at the next higher level of government that can provide assistance.
• Fiscal: Indicate which fiscal resources your jurisdiction has access to, or is eligible to use, on Worksheet #8. • Capabilities Narrative: Worksheet #9 provides each locality the opportunity to comment on specific projects,
programs or certifications applicable to their community.
Rappahannock-Rapidan Regional Hazard Mitigation Plan 2012 Appendix C: Page 83

Rappahannock-Rapidan Region All-Hazard Mitigation Plan Update WORKSHEET #1 – HAZARDS LIST
Jurisdiction: _________________________ Point of Contact: __________________________ Phone#: ___________________ E-mail: __________________________
Hazard Probability
Yes / No
Frequency:
occurrences in the
last __ years
Intensity
High / Med / Low
Area affected
High / Med /
Low
5 10 20+
Avalanche
Civil disorder
Coastal storm
Dam failure
Drought
Earthquake
Extreme heat
Flood
induc
ed b
y
coastal
heavy rain
ice jam
rapid snow melt
Hail
HAZMAT release
site
transportation
fixed facility
Hurricane
Landslide
Rappahannock-Rapidan Regional Hazard Mitigation Plan 2012 Appendix C: Page 84

Hazard Probability
Yes / No
Frequency:
occurrences in the
last __ years
Intensity
High / Med / Low
Area affected
High / Med /
Low
5 10 20+
induc
ed
by earthquake
Rain
Lightning
Military accident
Utility interruption
type
communication
Electricity
natural gas
other fuel
Radiological release
site
fixed facility
transportation
Subsidence
sinkhole
Thunderstorm
microburst
Tornado
Terrorist attack
type
armed / hostage
arson
biological
Rappahannock-Rapidan Regional Hazard Mitigation Plan 2012 Appendix C: Page 85

Hazard Probability
Yes / No
Frequency:
occurrences in the
last __ years
Intensity
High / Med / Low
Area affected
High / Med /
Low
5 10 20+
chemical
explosive
nuclear
radiological
Transportation incident
locat
ion /
type
air
rail
primary hwy
local road
transit - surface
transit - subway
Urban fire
conflagration
explosion
Volcanic
eruption
ash
Wildland fire
locat
ion
urban interface
public land
private land
Rappahannock-Rapidan Regional Hazard Mitigation Plan 2012 Appendix C: Page 86

Hazard Probability
Yes / No
Frequency:
occurrences in the
last __ years
Intensity
High / Med / Low
Area affected
High / Med /
Low
5 10 20+
Winter storm
type
extreme cold
ice storm
snow storm
Other hazards:
Rappahannock-Rapidan Regional Hazard Mitigation Plan 2012 Appendix C: Page 87

Rappahannock-Rapidan Region All-Hazard Mitigation Plan Update Worksheet #2:
Historic Hazard Event
Jurisdiction: ______________________________ Point of Contact: __________________________ Phone#: ___________________ E-mail: _________________________________
Please fill out one sheet for each significant hazard event with as much detail as possible. Attach supporting documentation, photocopies of newspaper articles, or other original sources.
Type of event Nature and magnitude of event
Location Date of event Injuries Deaths Property damage Infrastructure damage Crop damage Business/economic impacts Road/school/other closures Other damage Insured losses Federal/state disaster relief funding
Opinion on likelihood of occurring again
Source of information Comments
Rappahannock-Rapidan Regional Hazard Mitigation Plan 2012 Appendix C: Page 88

Rappahannock-Rapidan Region All-Hazard Mitigation Plan Update Worksheet #3:
UNIQUE Hazard Risks for Local Jurisdictions
Jurisdiction: ______________________________ Point of Contact: __________________________ Phone#: ___________________ E-mail: _________________________________ 1. Does your jurisdiction have any unique natural hazard risks not addressed in the region-wide hazard identification and risk assessment worksheet? ___Yes ___No If "Yes", please answer the following questions. 2. What is the unique hazard risk that your community faces? 3. Does this unique hazard risk threaten a distinct geographic area? If so, please describe the area and delineate it on a map. 4. Please provide information regarding the potential consequences of this unique hazard threat. a. How many people are at risk? b. Are any special populations at risk? If so, describe. c. Estimate the number of residential structures at risk and provide a gross estimate of the dollar value of those structures. d. Estimate the number of commercial structures at risk and provide a gross estimate of the dollar
value of those structures. e. Estimate the number of key and special facilities at risk and provide a gross estimate of their dollar value. f. Identify infrastructure and lifelines at risk from this unique hazard.
Rappahannock-Rapidan Regional Hazard Mitigation Plan 2012 Appendix C: Page 89

Rappahannock-Rapidan Region All-Hazard Mitigation Plan Update Worksheet #4
ASSET INVENTORY Jurisdiction: ______________________________ Point of Contact: __________________________ Phone#: ___________________ E-mail: __________________________
Name of Asset Type* Replacement
value Occupancy/
capacity Hazard Specific issues
*EI: Essential Infrastructure; VF: Vulnerable Facilities; HM: Hazardous Materials Facilities; NA: natural assets
Rappahannock-Rapidan Regional Hazard Mitigation Plan 2012 Appendix C: Page 90

Rappahannock-Rapidan Region All-Hazard Mitigation Plan Update Worksheet #5:
Vulnerability Narrative
Jurisdiction: ______________________________ Point of Contact: __________________________ Phone#: _________________________________ E-mail: __________________________________ Number of repetitive loss properties (flooding) Average depth of 100-year floodplain
Describe any hazard-related concerns or issues regarding the vulnerability of special needs populations, such as the elderly, disabled, or low-income.
Describe growth and development trends and future growth areas. How do they relate to hazard areas and vulnerability concerns/issues?
Describe how vulnerability has changed (or not) as a result of implementing successful mitigation actions proposed in the 2005 Plan.
Rappahannock-Rapidan Regional Hazard Mitigation Plan 2012 Appendix C: Page 91

Rappahannock-Rapidan Region All-Hazard Mitigation Plan Update Worksheet #6:
Capability Assessment - Regulatory
Jurisdiction: ______________________________ Point of Contact: __________________________ Phone#: _________________________________ E-mail: __________________________________
Listed below are the planning and land management tools typically used by local jurisdictions to implement hazard mitigation activities. Please indicate which are currently in place in your jurisdiction. If this capability or authority is not in place at the local level, please indicate if a higher level of government assumes that responsibility. Along with your comments, please include information on how to obtain the document/information – web site, via e-mail, fax, etc.
Regulatory Tool (ordinances, codes, plans) Yes/No Comments General or Comprehensive plan
Zoning ordinance
Subdivision ordinance
Growth management ordinance
Floodplain ordinance
Other special purpose ordinance (stormwater, steep slope, wildfire)
Building code
Fire department ISO rating
Erosion or sediment control program
Stormwater management program
Site plan review requirements
Capital improvements plan
Economic development plan
Local emergency operations plan
Other special plans
Flood insurance study or other engineering study for streams
Elevation certificates (for floodplain development)
Other
Rappahannock-Rapidan Regional Hazard Mitigation Plan 2012 Appendix C: Page 92

Rappahannock-Rapidan Region All-Hazard Mitigation Plan Update Worksheet #7:
Capability Assessment – Administrative/Technical Resources
Jurisdiction: ______________________________ Point of Contact: __________________________ Phone#: _________________________________ E-mail:__________________________________
Identify the technical and personnel resources responsible for activities related to hazard mitigation/loss prevention within your jurisdiction. For smaller jurisdictions without local staff resources, indicate public resources at the next higher level of government that can provide technical assistance, if available.
Personnel Resources Yes/No Department/Position Comments Planner/engineer with knowledge of land development/land management practices
Engineer/professional trained in construction practices related to buildings and/or infrastructure
Planner/engineer/scientist with an understanding of natural hazards
Personnel skilled in GIS
Full time building official
Floodplain manager
Emergency manager
Grant writer
Other personnel
GIS Data Resources
(Hazard areas, critical facilities, land use, building footprints, etc.)
Warning Systems/Services
(Reverse 9-11, cable override, outdoor warning signals)
Other
Rappahannock-Rapidan Regional Hazard Mitigation Plan 2012 Appendix C: Page 93

Rappahannock-Rapidan Region All-Hazard Mitigation Plan Update Worksheet #8:
Capability Assessment – Fiscal Resources
Jurisdiction: ______________________________ Point of Contact: __________________________ Phone#: _________________________________ E-mail: __________________________________
Please indicate whether your jurisdiction has access to or is eligible to use the following financial resources for hazard mitigation.
Financial Resources Accessible/Eligible
to Use (Yes/No) Comments Community Development Block Grants
Capital improvements project funding
Authority to levy taxes for specific purposes
Fees for water, stormwater, sewer, gas, or electric services
Impact fees for new development
Incur debt through general obligation bonds
Incur debt through special tax bonds
Incur debt through private activities
Withhold spending in hazard prone areas
Other
Rappahannock-Rapidan Regional Hazard Mitigation Plan 2012 Appendix C: Page 94

Rappahannock-Rapidan Region All-Hazard Mitigation Plan Update Worksheet #9:
Capability Assessment - Narrative
Jurisdiction: ______________________________ Point of Contact: __________________________ Phone#: _________________________________ E-mail: __________________________________ Additional Capabilities
Does your community have any hazard-related certifications, such as Storm Ready or Firewise Communities certification?
Describe any past or ongoing public education or information programs, such as for responsible water use, fire safety, household preparedness, or environmental education.
Describe any other past or ongoing projects or programs designed to reduce disaster losses. These may include projects to protect critical facilities.
Other
Attach additional information if available
Rappahannock-Rapidan Regional Hazard Mitigation Plan 2012 Appendix C: Page 95

Page 1
RRRC Multi-Jurisdictional All Hazard Mitigation Plan SurveyRRRC Multi-Jurisdictional All Hazard Mitigation Plan SurveyRRRC Multi-Jurisdictional All Hazard Mitigation Plan SurveyRRRC Multi-Jurisdictional All Hazard Mitigation Plan Survey
We need your help! Our community is currently engaged in a planning process to become less vulnerable to disasters, and your participation is important to us! Culpeper, Fauquier, Madison, Orange, Rappahannock counties and the towns of Culpeper, Gordonsville, Madison, Orange, Remington, The Plains, Warrenton and Washington are working together to update their Hazard Mitigation Plans. The purpose of these plans is to identify and assess each community’s natural hazard risks (such as floods, hurricanes, and ice storms), and determine how to best minimize or manage those risks. Upon completion, the plan will be presented to each local governing body for adoption and submitted to the Virginia Division of Emergency Management and Federal Emergency Management Agency for review and approval. This survey questionnaire provides an opportunity for you to share your opinions and participate in the mitigation planning process. The information you provide will help us better understand your hazard concerns and can lead to mitigation activities that should help lessen the impact of future hazard events. If you have any questions regarding this survey, or would like to learn about more ways you can participate in the development of our Hazard Mitigation Plan, please contact Patrick Mauney at (540) 8297450 or visit www.rrregion.org.
1. In what town or county do you live?
2. How concerned are you about the possibility of our community being impacted by a disaster?
3. Have you ever experienced or been impacted by a disaster?
1. Introduction
2. Q1
Culpeper County
nmlkj
Fauquier County
nmlkj
Madison County
nmlkj
Orange County
nmlkj
Rappahannock County
nmlkj
Town of Culpeper
nmlkj
Town of Gordonsville
nmlkj
Town of Madison
nmlkj
Town of Orange
nmlkj
Town of Remington
nmlkj
Town of The Plains
nmlkj
Town of Warrenton
nmlkj
Town of Washington
nmlkj
Other (please specify)
nmlkj
Extremely concerned
nmlkj Somewhat concerned
nmlkj Not concerned
nmlkj
Yes
nmlkj
No
nmlkj
Rappahannock-Rapidan Regional Hazard Mitigation Plan 2012 Appendix C: Page 96

Page 2
RRRC Multi-Jurisdictional All Hazard Mitigation Plan SurveyRRRC Multi-Jurisdictional All Hazard Mitigation Plan SurveyRRRC Multi-Jurisdictional All Hazard Mitigation Plan SurveyRRRC Multi-Jurisdictional All Hazard Mitigation Plan Survey4. If yes, please indicate the number of occurrences by disaster type below.
5. Please select the top three hazards you think are the highest threat to your neighborhood:
6. Does your street flood?
7. If yes, please provide the street name or nearest intersection.
8. If yes, how many times did your street flood in the past year?
1 2 3 4 5
Flood nmlkj nmlkj nmlkj nmlkj nmlkj
Hurricane/Tropical Storm nmlkj nmlkj nmlkj nmlkj nmlkj
Tornado nmlkj nmlkj nmlkj nmlkj nmlkj
Wildfire nmlkj nmlkj nmlkj nmlkj nmlkj
Winter Storm nmlkj nmlkj nmlkj nmlkj nmlkj
3. Q4
Other (please specify)
Drought
gfedc
Earthquake
gfedc
Erosion
gfedc
Extreme Temperatures
gfedc
Flooding
gfedc
Hurricanes/Tropical Storms
gfedc
Landslides
gfedc
Manmade Hazards (terrorism, hazardous chemical spill)
gfedc
Mosquito Borne Disease
gfedc
Sinkholes
gfedc
Severe Thunderstorms
gfedc
Tornadoes
gfedc
Wildfires
gfedc
Winter Storms (Ice, Snow)
gfedc
Other (please specify)
gfedc
Yes
nmlkj
No
nmlkj
Rappahannock-Rapidan Regional Hazard Mitigation Plan 2012 Appendix C: Page 97

Page 3
RRRC Multi-Jurisdictional All Hazard Mitigation Plan SurveyRRRC Multi-Jurisdictional All Hazard Mitigation Plan SurveyRRRC Multi-Jurisdictional All Hazard Mitigation Plan SurveyRRRC Multi-Jurisdictional All Hazard Mitigation Plan Survey9. Is your home located in a floodplain?
10. Do you have flood insurance?
11. If you do not have flood insurance, please select the main reason below:
12. Have you taken any actions to make your home or neighborhood more resistant to hazards?
13. If yes, please explain.
14. Are you interested in making your home or neighborhood more resistant to hazards?
4. Q8
55
66
Yes
nmlkj
No
nmlkj
Not Sure
nmlkj
Yes
nmlkj
No
nmlkj
Not Sure
nmlkj
Not located in floodplain
nmlkj
Too expensive
nmlkj
Not necessary because it never floods
nmlkj
Not necessary because I'm elevated or otherwise protected
nmlkj
Never really considered it
nmlkj
Other (please specify)
Yes
nmlkj
No
nmlkj
Yes
nmlkj
No
nmlkj
Rappahannock-Rapidan Regional Hazard Mitigation Plan 2012 Appendix C: Page 98

Page 4
RRRC Multi-Jurisdictional All Hazard Mitigation Plan SurveyRRRC Multi-Jurisdictional All Hazard Mitigation Plan SurveyRRRC Multi-Jurisdictional All Hazard Mitigation Plan SurveyRRRC Multi-Jurisdictional All Hazard Mitigation Plan Survey15. Would incentives such as insurance discounts, property tax breaks or low interest rate home loans motivate you to take additional steps to protect your property from natural disasters and flooding?
16. If no, please explain.
17. What is the most effective way for you to receive information about how to make your home and neighborhood more resistant to hazards?
18. In your opinion, what are some steps your local government could take to reduce or eliminate the risk of future hazard damages in your neighborhood?
19. Are there any other issues regarding the reduction of risk and loss associated with hazards or disasters in the community that you think are important?
55
66
5. Q11
55
66
55
66
6. Q14
Yes
nmlkj
No
nmlkj
Not Sure
nmlkj
Newspaper
gfedc
Television
gfedc
Radio
gfedc
Direct Mailings
gfedc
gfedc
Community website
gfedc
Public meetings
gfedc
Other (please specify)
gfedc
Rappahannock-Rapidan Regional Hazard Mitigation Plan 2012 Appendix C: Page 99

Page 5
RRRC Multi-Jurisdictional All Hazard Mitigation Plan SurveyRRRC Multi-Jurisdictional All Hazard Mitigation Plan SurveyRRRC Multi-Jurisdictional All Hazard Mitigation Plan SurveyRRRC Multi-Jurisdictional All Hazard Mitigation Plan Survey20. A number of communitywide activities can reduce our risk from hazards. In general, these activities fall into one of the following six broad categories. Please tell us how important you think each one is for your community to consider pursuing.
Very Important Somewhat Important Not Important
Prevention: Administrative or regulatory actions that influence the way land is developed and buildings are built. Examples include planning and zoning, building codes, open space preservation, and floodplain regulations.
gfedc gfedc gfedc
Property Protection: Actions that involved the modification of existing buildings to protect them from a hazard or removal from the hazard area. Examples include acquisition, relocation, elevation, structure retrofits, and storm shutters.
gfedc gfedc gfedc
Natural Resource Protection: Actions that, in addition to minimizing hazard losses also preserve or restore the functions of natural systems. Examples include floodplain protection, habitat preservation, slope stabilization, riparian buffers, and forest management.
gfedc gfedc gfedc
Structural Projects: Actions intended to lessen the impact of a hazard by modifying the natural progression of the hazard. Examples include dams, levees, detention/retention basins, channel modifications, retaining walls and storm sewers.
gfedc gfedc gfedc
Emergency Services: Actions that protect people and property during and immediately after a hazard event. Examples include warning systems, evacuation planning,
gfedc gfedc gfedc
Rappahannock-Rapidan Regional Hazard Mitigation Plan 2012 Appendix C: Page 100

Page 6
RRRC Multi-Jurisdictional All Hazard Mitigation Plan SurveyRRRC Multi-Jurisdictional All Hazard Mitigation Plan SurveyRRRC Multi-Jurisdictional All Hazard Mitigation Plan SurveyRRRC Multi-Jurisdictional All Hazard Mitigation Plan Survey
21. Thank your for your participation! This survey may be submitted anonymously. However, if you would like to receive information regarding upcoming public meetings for the hazard mitigation plan update, please provide your name and contact information:
emergency response training, and protection or critical emergency facilities or systems.
Public Education and Awareness: Actions to inform citizens about hazards and the techniques they can use to protect themselves and their property. Examples include outreach projects, school education programs, library materials and demonstration events.
gfedc gfedc gfedc
7. Wrapup
Name:
Address:
Email Address:
Phone Number:
Rappahannock-Rapidan Regional Hazard Mitigation Plan 2012 Appendix C: Page 101

Community Development & Planning
Overview
Hazard Mitigation
Housing
Planning Workshops
Culpeper
Living Lands
Madison
Sperryville
Gordonsville
Marshall
Remington
Warrenton
Orange
Regional Visioning
Rappahannock-Rapidan Region All-Hazard Mitigation Plan
2012 RRRC Regional Hazard Mitigation Draft Plan Materials Available
Please complete our Hazard Mitigation Public Survey
Hazard mitigation planning is the process by which threats to localities are identified, thelikelihood of impacts determined, goals to mitigate those threats are developed andappropriate strategies to eliminate or reduce impacts are determined, prioritized, andimplemented. FEMA approval of the updated all-hazard mitigation plan will qualify participatingjurisdictions for federal support for pre- and post-disaster hazard mitigation projects.
The collection and analysis of significant information is needed to assure the development of auseful updated plan that meets the needs of each participating jurisdiction and therequirements of the Disaster Mitigation Act, 2000. Essential data includes general backgroundinformation from each locality, hazard and risk information, current codes, ordinances,regulations and procedures related to loss minimization as well as an assessment of eachlocality's technical and organizational abilities to perform hazard mitigation and/or lossprevention functions.
The Rappahannock-Rapidan Regional Commission is working with the Virginia Department ofEmergency Management (VDEM) and the Federal Emergency Management Agency (FEMA)on an update to the initial plan, completed in 2004.
The original plan may be accessed at:http://www.vdem.state.va.us/library/plans/mitigation.cfm orhttp://www.rrregion.org/publications.
For additional information, please contact Patrick Mauney at (540) 829.7450 [email protected].
Meeting Schedule & Notes
July 13, 2010 | 9am at Regional CommissionAgendaMinutesPresentation: Hazard Mitigation Status Report
April 20, 2010 | 10am at Regional CommissionAgendaMinutesData Collection Guide [Updated]Presentation: Hazard Mitigation Status Report
February 23, 2010 | Kickoff Meeting, 10am at Regional CommissionAgendaMinutesPresentation: Plan Update Kickoff [VDEM]
Plan Update Documents
DRAFT Hazard Mitigation Plan Maps [.pdf, 20MB]
Emergency Preparedness and Hazard Mitigation http://www.rrregion.org/mitigation
1 of 2 3/14/2012 3:36 PM
Rappahannock-Rapidan Regional Hazard Mitigation Plan 2012 Appendix C: Page 102

DRAFT Section 1: IntroductionDRAFT Section 2: Planning ProcessDRAFT Section 3: Regional ProfileDRAFT Section 4: Hazard IdentificationDRAFT Section 5: Hazard AnalysisDRAFT Section 6: Vulnerability AnalysisDRAFT Section 7: Capability AssessmentDRAFT Section 8: Mitigation Strategy OverviewDRAFT Section 9: Plan MaintenanceDRAFT Appendix A: Local Mitigation StrategiesDRAFT Appendix B: FEMA CrosswalkDRAFT Appendix C: Supporting DocumentationDRAFT Appendix D: Plan Adoption Resolutions
Data Collection Guide & WorksheetsJurisdiction Plan Team ChartJurisdiction Match LogPlan Update Timeline
2004 Plan Strategies
Culpeper CountyFauquier CountyMadison CountyOrange CountyRappahannock CountyTown of CulpeperTown of MadisonTown of OrangeTown of RemingtonTown of Warrenton
Data Source Links
FEMA Map Service CenterNCDC DatabaseVDEM Historical Hazards
Rappahannock-Rapidan Regional Commission420 Southridge Parkway • Suite 106 • Culpeper, VA 22701 • Tel: (540) 829-7450 • Fax: (540) 829-7452
E-mail: [email protected]
Copyright© March 2012 RRRC Web Design by www.robinferriswebdesign.com
Emergency Preparedness and Hazard Mitigation http://www.rrregion.org/mitigation
2 of 2 3/14/2012 3:36 PM
Rappahannock-Rapidan Regional Hazard Mitigation Plan 2012 Appendix C: Page 103

Rappahannock-Rapidan Regional Hazard Mitigation Plan 2012 Appendix C: Page 104
Administrator
Callout
Town of Warrenton Website - 3/16/2012

Rappahannock-Rapidan Regional Hazard Mitigation Plan 2012 Appendix C: Page 105
Administrator
Callout
Town of Orange Website - 3/29/2012

Rappahannock-Rapidan Regional Hazard Mitigation Plan 2012 Appendix C: Page 106
Administrator
Callout
Regional Commission Website Homepage - 3/19/2012

Community Development & Planning
Overview
Hazard Mitigation
Housing
Planning Workshops
Sustainable Agriculture
Culpeper
Living Lands
Madison
Sperryville
Gordonsville
Marshall
Remington
Warrenton
Orange
Regional Visioning
Rappahannock-Rapidan Region All-Hazard Mitigation Plan
2012 RRRC Regional Hazard Mitigation Draft Plan Materials Available
The Rappahannock-Rapidan Regional Commission is accepting public comment on theDRAFT 2012 Rappahannock-Rapidan Regional Hazard Mitigation Plan until 5pm on April 6,2012. A copy of the draft plan can be found below and hard copies are available at thefollowing locations:
Rappahannock-Rapidan Regional Commission420 Southridge Parkway, Suite 106Culpeper, VA, 22701.
Culpeper County Public Library271 Southgate Shopping CenterCulpeper, VA 22701
Fauquier County Public Library (Warrenton Branch)11 Winchester StreetWarrenton, VA 20186
Madison County Public Library402 North Main StreetMadison, VA 22727
Orange County Public Library (Main Branch)146A Madison RoadOrange, VA 22960
Rappahannock County Public Library4 Library RoadWashington, VA 22747
Comments may be directed to:
Rappahannock-Rapidan Regional Commission420 Southridge Parkway, Suite 106Culpeper, VA 22701
or to [email protected].
Please complete our Hazard Mitigation Public Survey
Hazard mitigation planning is the process by which threats to localities are identified, thelikelihood of impacts determined, goals to mitigate those threats are developed andappropriate strategies to eliminate or reduce impacts are determined, prioritized, andimplemented. FEMA approval of the updated all-hazard mitigation plan will qualify participatingjurisdictions for federal support for pre- and post-disaster hazard mitigation projects.
The collection and analysis of significant information is needed to assure the development of auseful updated plan that meets the needs of each participating jurisdiction and the
Emergency Preparedness and Hazard Mitigation http://www.rrregion.org/mitigation.html
1 of 3 3/29/2012 3:48 PM
Rappahannock-Rapidan Regional Hazard Mitigation Plan 2012 Appendix C: Page 107

requirements of the Disaster Mitigation Act, 2000. Essential data includes general backgroundinformation from each locality, hazard and risk information, current codes, ordinances,regulations and procedures related to loss minimization as well as an assessment of eachlocality's technical and organizational abilities to perform hazard mitigation and/or lossprevention functions.
The Rappahannock-Rapidan Regional Commission is working with the Virginia Department ofEmergency Management (VDEM) and the Federal Emergency Management Agency (FEMA)on an update to the initial plan, completed in 2004.
The original plan may be accessed at:http://www.vdem.state.va.us/library/plans/mitigation.cfm orhttp://www.rrregion.org/publications.
For additional information, please contact Patrick Mauney at (540) 829.7450 [email protected].
Meeting Schedule & Notes
April 13, 2012 | 930am at Regional CommissionAgenda
July 13, 2010 | 9am at Regional CommissionAgendaMinutesPresentation: Hazard Mitigation Status Report
April 20, 2010 | 10am at Regional CommissionAgendaMinutesData Collection Guide [Updated]Presentation: Hazard Mitigation Status Report
February 23, 2010 | Kickoff Meeting, 10am at Regional CommissionAgendaMinutesPresentation: Plan Update Kickoff [VDEM]
2012 RRRC Regional Hazard Mitigation Draft Plan
All files below are in .pdf format and are less than 1MB in size unless otherwise noted.
DRAFT Hazard Mitigation Plan Maps [.pdf, 20MB]
DRAFT Section 1: IntroductionDRAFT Section 2: Planning ProcessDRAFT Section 3: Regional ProfileDRAFT Section 4: Hazard Identification [2MB]DRAFT Section 5: Hazard Analysis [17MB]DRAFT Section 6: Vulnerability Analysis [5MB]DRAFT Section 7: Capability AssessmentDRAFT Section 8: Mitigation Strategy OverviewDRAFT Section 9: Plan MaintenanceDRAFT Appendix A: Local Mitigation StrategiesDRAFT Appendix B: FEMA CrosswalkDRAFT Appendix C: Supporting Documentation [8MB]DRAFT Appendix D: Plan Adoption Resolutions
Plan Update Documents
Data Collection Guide & WorksheetsJurisdiction Plan Team ChartJurisdiction Match LogPlan Update Timeline
Emergency Preparedness and Hazard Mitigation http://www.rrregion.org/mitigation.html
2 of 3 3/29/2012 3:48 PM
Rappahannock-Rapidan Regional Hazard Mitigation Plan 2012 Appendix C: Page 108

2004 Plan Strategies
Culpeper CountyFauquier CountyMadison CountyOrange CountyRappahannock CountyTown of CulpeperTown of MadisonTown of OrangeTown of RemingtonTown of Warrenton
Data Source Links
FEMA Map Service CenterNCDC DatabaseVDEM Historical Hazards
Rappahannock-Rapidan Regional Commission420 Southridge Parkway • Suite 106 • Culpeper, VA 22701 • Tel: (540) 829-7450 • Fax: (540) 829-7452
E-mail: [email protected]
Copyright© March 2012 RRRC Web Design by www.robinferriswebdesign.com
Emergency Preparedness and Hazard Mitigation http://www.rrregion.org/mitigation.html
3 of 3 3/29/2012 3:48 PM
Rappahannock-Rapidan Regional Hazard Mitigation Plan 2012 Appendix C: Page 109

Rappahannock-Rapidan Regional Hazard Mitigation Plan 2012 Appendix C: Page 110
Administrator
Callout
Rappahannock County Website - 3/28/2012

Rappahannock-Rapidan Regional Hazard Mitigation Plan 2012 Appendix C: Page 111
Administrator
Callout
Orange County Website - 3/29/2012
Rappahannock-Rapidan Regional Hazard Mitigation Plan 2012 Appendix C: Page 112
Administrator
Callout
Fauquier County Emergency Services Webpage Link - 3/29/2012

APPENDIX D:
PLAN ADOPTION RESOLUTIONS
Appendix D contains adoption resolutions from all participating counties and towns for the 2012 RRRC Regional Hazard Mitigation Plan.
Counties
Culpeper County Adopted: July 3, 2012
Fauquier County Adopted: July 12, 2012
Madison County Adopted: July 10, 2012
Orange County Adopted: July 24, 2012
Rappahannock County Adopted: August 6, 2012
Towns
Town of Culpeper Adopted: July 10, 2012
Town of Madison Adopted: July 5, 2012
Town of Orange Adopted: August 20, 2012
Town of Remington Adopted: July 9, 2012
Town of Warrenton Adopted: August 14, 2012
Rappahannock-Rapidan Regional Commission Adopted: August 22, 2012

Jurisdiction Points of Contact
Culpeper County Frank Bossio County Administrator 302 North Main Street Culpeper, VA 22701 (540) 727-3427 Fauquier County Paul McCulla County Administrator 10 Hotel Street, Suite 204 Warrenton, VA 20186 (540) 422-8001 Madison County Ernie Hoch County Administrator 302 Thrift Road Madison, VA 22727 (540) 948-7500 Orange County Julie Jordan Summs County Administrator P.O. Box 111 Orange, VA 22960 (540) 672-3313 Rappahannock County John McCarthy County Administrator P.O. Box 519 Washington, VA 22747 (540) 675-5330
Town of Culpeper Kimberly Alexander Town Manager 400 South Main Street, Suite 101 Culpeper, VA 22701 (540) 829-8250 Town of Madison William Lamar Mayor 23 Washington Circle Madison, VA 22727 (540) 948-6717 Town of Orange Greg Woods Town Manager 119 Belleview Avenue Orange, VA 22960 (540) 672-5005 Town of Remington Sharon Lee Town Manager P.O. Box 278 Remington, VA 22734 (540) 439-3220 Town of Warrenton Kenneth McLawhon Town Manager P.O. Drawer 341 Warrenton, VA 20188-0341 (540) 347-4505
Rappahannock-Rapidan Regional Commission Jeffrey Walker
Executive Director 420 Southridge Parkway, Suite 106
Culpeper, VA 22701 (540) 829-7450


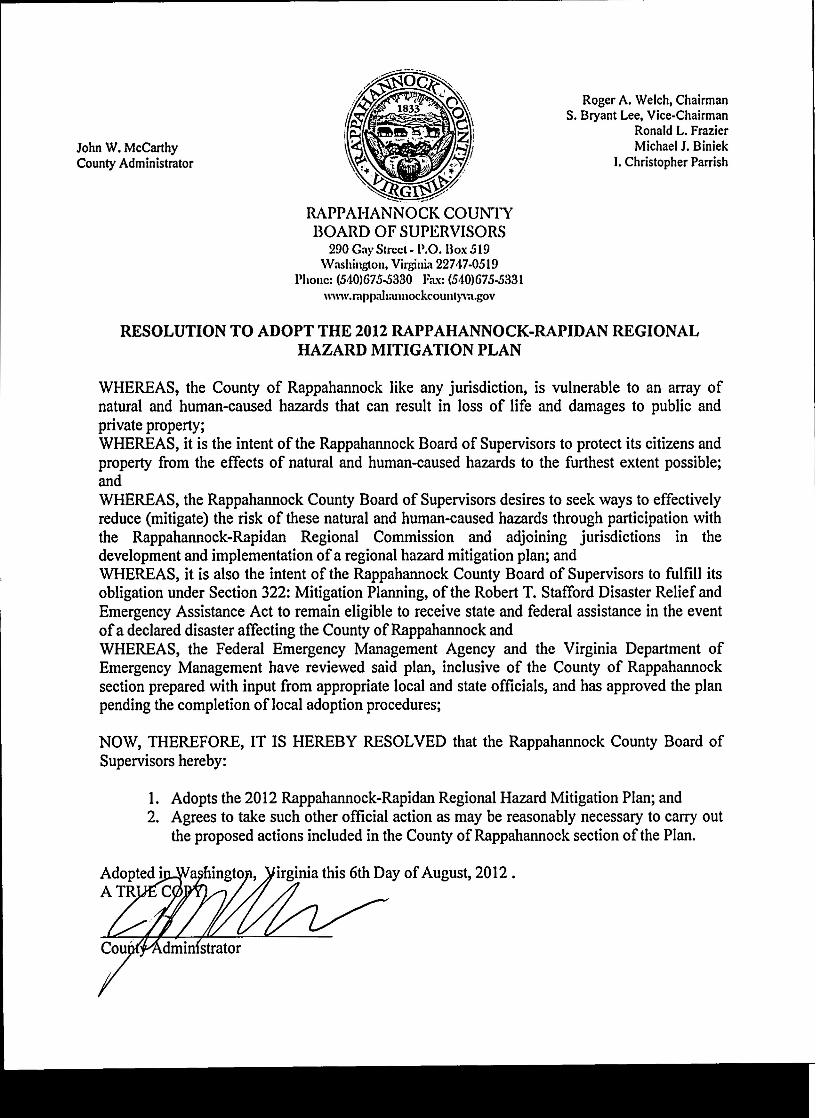
John W. McCarthyCounty Administrator
Roger A. Welch, ChairmanS. Bryant Lee, Vice-Chairman
Ronald L. Frazier
Michael J. Biniek
I. Christopher Parrish
RAPPAHANNOCK COUNTY
BOARD OF SUPERVISORS
290 Gay Street- P.O. Box 519Washington, Virginia 22747-0519
Phone: (540)675-5330 Fax: (540)675-5331
v\'ww.rappali;uuiock.countyva.gov
RESOLUTION TO ADOPT THE 2012 RAPPAHANNOCK-RAPIDAN REGIONALHAZARD MITIGATION PLAN
WHEREAS, the County of Rappahannock like any jurisdiction, is vulnerable to an array ofnatural and human-caused hazards that can result in loss of life and damages to public andprivate property;WHEREAS, it is the intent of the Rappahannock Board of Supervisors to protect its citizens andproperty from the effects of natural and human-caused hazards to the furthest extent possible;and
WHEREAS, the Rappahannock County Board of Supervisors desires to seek ways to effectivelyreduce (mitigate) the risk of these natural and human-caused hazards through participation withthe Rappahannock-Rapidan Regional Commission and adjoining jurisdictions in thedevelopment and implementation of a regional hazard mitigation plan; andWHEREAS, it is also the intent of the Rappahannock County Board of Supervisors to fulfill itsobUgation under Section 322: Mitigation Planning, of the Robert T. Stafford Disaster Relief andEmergency Assistance Act to remain eligible to receive state and federal assistance in the eventof a declared disaster affecting the County of Rappahannock andWHEREAS, the Federal Emergency Management Agency and the Virginia Department ofEmergency Management have reviewed said plan, inclusive of the County of Rappahannocksection prepared with input from appropriate local and state officials, and has approved the planpending the completion of local adoption procedures;
NOW, THEREFORE, IT IS HEREBY RESOLVED that the Rappahannock County Board ofSupervisors hereby:
1. Adopts the 2012 Rappahannock-Rapidan Regional Hazard Mitigation Plan; and2. Agrees to take such other official action as may be reasonably necessary to carry out
the proposed actions included in the County of Rappahannock section of the Plan.
Adopted jATR
strator
irginia this 6th Day of August, 2012 .
NEATPAGEINFO:id=DA5BE428-449B-444F-B301-4D4C000CCAC5


HAZARD IDENTIFICATION HUMAN-CAUSED HAZARDS
FOR OFFICIAL USE ONLY
The United States and its communities are vulnerable to a wide array of human-caused hazards that threaten life and property. These hazards include: Human-caused Hazards
• Terrorism
• Hazardous Materials (HAZMAT)
• Radiological Event
• Energy Pipeline Failures
• Communication Disruption
• Utility Disruption
• Civil Disruption The “Introduction” subsection that follows provides summaries of several key documents used in human-caused hazard identification in an effort to better equip the reader of this Plan with the essential background knowledge to fully understand the hazard descriptions provided in this section.
INTRODUCTION Natural hazard identification and analysis has a long historical statistical basis on which the probability and frequency of the events, damage, and impacts are well documented and upon which future events damage can be predicted. To some degree technological accidents can also be statistically modeled and damage predictions made such as the damage caused by HAZMAT spills, release of radioactive steam, or large blast explosion at chemical or manufacturing plants. The challenge at this time is developing the methodology and analytical models for terrorist threats that have the equivalent veracity and capabilities as natural hazard models and analysis. The federal government focus is now on All Hazards analysis and mitigation. The All Hazards approach addresses natural and human-caused (or manmade) hazards. For the purpose of this Plan, “Human-Caused hazards” are further categorized as “technological hazards” and “acts of terrorism” (definitions and material as put forth in FEMA Publication 386-7). The primary differentiation between those hazards classified as natural versus human-caused is that human-caused hazards originate with intentional or accidental human activity as opposed to those events that occur as a normal process of nature such as a hurricane or earthquake. There are a number of key documents, statutes and directives that have been promulgated in the past two years by the Department of Homeland Security (DHS) that have established parameters upon which a Human-Caused (Manmade) Hazards Assessment and Analysis will be conducted. However, there is still no single DHS directive that definitively states the process of method in which the assessment and analysis shall be conducted. The hazard identification and analysis developed for this project is an emerging state-of-the-practice approach that requires compliance with the Homeland Security Act of 2002, Homeland Security Presidential Decision Directives, and the DHS publications presented in this section. In May 2004, DHS issued the policy for the Safeguarding of Sensitive but Unclassified (For Official Use Only) Information. For the purposes of the human-caused risk assessment, the

H A Z A R D I D E N T I F I C A T I O N H U M A N - C A U S E D H A Z A R D S
FOR OFFICIAL USE ONLY Appendix E: Page 2
information contained herein is considered to meet the definitions and standards as defined in the statutes. Throughout the analysis, the direct document cites and/or language are used to explicitly define those areas which have been adopted as state-of-the-practice and this document is considered to be a Sensitive But Unclassified (For Official Use Only) document. The following subsections provide an overview of the relevant documents and the primary directive or objective of that document. In each subsection, an introduction to the history of the document is provided along with relevant excerpts from the document to provide the reader with a logical flow of the federal to state and state to local requirements. The source document Web site is provided in all cases and specific section or text cites are italicized.
HOMELAND SECURITY ACT OF 2002
Portions of the following material have been taken in whole or in part from The Homeland Security Act of 2002 (www.dhs.gov)) published by the Department of Homeland Security in July 2002. Title I—Department of Homeland Security
Sec. 101. Executive Department; Mission. (a) Establishment.—"There is established a Department of
Homeland Security, as an executive department of the United States within the meaning of Title 5, United States Code.
(b) Mission. —
(1) In General. - The primary mission of the Department is to-
(2) (A) prevent terrorist attacks within the United States; (3) (B) reduce the vulnerability of the United States to terrorism; and (4) (C) minimize the damage, and assist in the recovery, from terrorist attacks that
do occur within the United States." From H.R. 5005-8 the Homeland Security Act of 2002

H A Z A R D I D E N T I F I C A T I O N H U M A N - C A U S E D H A Z A R D S
FOR OFFICIAL USE ONLY Appendix E: Page 3
THE NATIONAL SECURITY STRATEGY
Portions of the following material have been taken in whole or in part from The National Strategy For Homeland Security (www.dhs.gov browse to Press Room Library) published by the Department of Homeland Security in July 2002.
DHS and The National Security Strategy provide the top-level framework for human-caused hazards planning and which is stated as:
“Today no one single government agency has homeland security as its primary mission. In fact, responsibilities for homeland security are dispersed among more than 100 different government organizations. America needs a single, unified homeland security structure that will improve protection against today's threats and be flexible enough to help meet the unknown threats of the future.” The National Security Strategy also states, “The strategy provides direction to the federal government departments and agencies that have a role in homeland security. It suggests steps that state and local governments, private companies and organizations, and individual Americans can take to improve our security and offers incentives for them to do so. It recommends certain actions to the Congress. In this way, the Strategy provides a framework for the contributions that we all can make to secure our homeland.” There are two documents that expand on The National Security Strategy: The National Security Strategy For The Protection of Critical Infrastructure And Key Assets, and The National Strategy to Secure Cyberspace. The documents define the critical infrastructures and systems to be protected. The strategies recognize the need for a systems engineering approach to the analysis and description of infrastructure and cyber systems.
National Strategy for the Physical Protection of Critical Infrastructures and Key Assets
Portions of the following material have been taken in whole or in part from the National Strategy for the Physical Protection of Critical Infrastructures and Key Assets, (www.dhs.gov browse to Press Room Library) published by Department of Homeland Security in February 2003.
The National Strategy for the Physical Protection of Critical Infrastructures and Key Assets states that the strategy, “identifies a clear set of national goals and objectives and outlines the guiding principles that will underpin our efforts to secure the infrastructures and assets vital to our national security, governance, public health and safety, economy, and public confidence.
The Strategy also “provides a unifying organization and identifies specific initiatives to drive our near-term national protection priorities and inform the resource allocation process. Most importantly, it establishes a foundation for building and fostering the cooperative environment in which government, industry, and private citizens can carry out their respective protection responsibilities effectively and efficiently.”

H A Z A R D I D E N T I F I C A T I O N H U M A N - C A U S E D H A Z A R D S
FOR OFFICIAL USE ONLY Appendix E: Page 4
The Strategy also states, “The facilities, systems, and functions that comprise our critical infrastructures are highly sophisticated and complex. They consist of human capital and physical and cyber systems that work together in processes that are highly interdependent. They each encompass a series of key nodes that are, in turn, essential to the operation of the critical infrastructures in which they function. To complicate matters further, our most critical infrastructures typically interconnect and, therefore, depend on the continued availability and operation of other dynamic systems and functions. For example, e-commerce depends on electricity as well as information and communications. Assuring electric service requires operational transportation and distribution systems to guarantee the delivery of fuel necessary to generate power. Such interdependencies have developed over time and are the product of innovative operational processes that have fueled unprecedented efficiency and productivity. Given the dynamic nature of these interdependent infrastructures and the extent to which our daily lives rely on them, a successful terrorist attack to disrupt or destroy them could have tremendous impact beyond the immediate target and continue to reverberate long after the immediate damage is done.”
National Strategy to Secure Cyberspace
Portions of the following material have been taken in whole or in part from the National Strategy To Secure Cyberspace, (www.dhs.gov browse to Press Room Library) published by the Department of Homeland Security in February 2003.
“The National Strategy to Secure Cyberspace outlines an initial framework for both organizing and prioritizing efforts. It provides direction to the federal government departments and agencies that have roles in cyberspace security. It also identifies steps that state and local governments, private companies and organizations, and individual Americans can take to improve our collective cybersecurity. The Strategy highlights the role of public-private engagement. The document provides a framework for the contributions that we all can make to secure our parts of cyberspace. The dynamics of cyberspace will require adjustments and amendments to the Strategy over time.”
Critical Infrastructure Sectors Identified in the National Strategy for the Physical Protection of Critical Infrastructures and Key Assets
• Agriculture • Food • Water • Public Health • Emergency Services • Government • Defense Industrial Base • Information and
Telecommunications • Energy • Transportation • Banking and Finance • Chemical Industry and
Hazardous Materials • Postal and Shipping

H A Z A R D I D E N T I F I C A T I O N H U M A N - C A U S E D H A Z A R D S
FOR OFFICIAL USE ONLY Appendix E: Page 5
Homeland Security Presidential Directive
Portions of the following material have been taken in whole or in part from the Homeland Security Presidential Directive/HSPD-7, (http://www.whitehouse.gov/news/releases/2003/12/20031217-5.htm) published by the White House December 2003. In late 2003 and early 2004, President George W. Bush signed several Homeland Security Presidential Directives (http://www.whitehouse.gov/news/releases/2004/) that defined the role of federal agencies in Homeland Security and Homeland Defense. Homeland Security Presidential Directive 7 (HSPD-7) defines critical infrastructure protection and the role that local communities will play in the development of assessment and reporting methods. Subject: Critical Infrastructure Identification, Prioritization and Protection Purpose
(1) This directive establishes a national policy for federal departments and agencies to identify and prioritize United States critical infrastructure and key resources and to protect them from terrorist attacks.
Background
(2) Terrorists seek to destroy, incapacitate or exploit critical infrastructure and key resources across the United States to threaten national security, cause mass casualties, weaken our economy, and damage public morale and confidence. (3) America's open and technologically complex society includes a wide array of critical infrastructure and key resources that are potential terrorist targets. The majority of these are owned and operated by the private sector and state or local governments. These critical infrastructures and key resources are both physical and cyber-based and span all sectors of the economy. (4) Critical infrastructure and key resources provide the essential services that underpin American society. The Nation possesses numerous key resources, whose exploitation or destruction by terrorists could cause catastrophic health effects or mass casualties comparable to those from the use of a weapon of mass destruction, or could profoundly affect our national prestige and morale. In addition, there is critical infrastructure so vital that its incapacitation, exploitation, or destruction, through terrorist attack, could have a debilitating effect on security and economic well-being. (5) While it is not possible to protect or eliminate the vulnerability of all critical infrastructure and key resources throughout the country, strategic improvements in security can make it more difficult for attacks to succeed and can lessen the impact of attacks that may occur. In addition to strategic security enhancements, tactical security improvements can be rapidly implemented to deter, mitigate, or neutralize potential attacks.

H A Z A R D I D E N T I F I C A T I O N H U M A N - C A U S E D H A Z A R D S
FOR OFFICIAL USE ONLY Appendix E: Page 6
FEMA was renamed the Emergency Preparedness and Response directorate and was given the responsibility to “focus on risk mitigation in advance of emergencies by promoting the concept of disaster-resistant communities, including providing federal support for local governments that promote structures and communities that reduce the chances of being hit by disasters. EP&R will coordinate with private industry, the insurance sector, mortgage lenders, the real estate industry, homebuilding associations, citizens, and others to create model communities in high-risk areas. The Directorate will also lead the DHS response to any sort of biological or radiological attack, and coordinate the involvement of other federal response teams, such as the Army National Guard, in the event of a major incident. Building upon the successes of FEMA, DHS will lead the Nation's recovery from catastrophes and help minimize the suffering and disruption caused by disasters.”
SECURING OUR HOMELAND
Portions of the following material have been taken in whole or in part from Securing Our Homeland (www.dhs.gov) published by the Department of Homeland Security in 2004.
“The National Strategy for Homeland Security and the Homeland Security Act of 2002 served to mobilize and organize our Nation to secure the homeland from terrorist attacks. This exceedingly complex mission requires a focused effort from our entire society if we are to be successful. To this end, one primary reason for the establishment of the Department of Homeland Security was to provide the unifying core for the vast national network of organizations and institutions involved in efforts to secure our Nation. In order to better do this and to provide guidance to the 180,000 DHS men and women who work every day on this important task, the Department developed its own high-level strategic plan. The vision and mission statements, strategic goals and objectives provide the framework guiding the actions that make up the daily operations of the department.”

H A Z A R D I D E N T I F I C A T I O N H U M A N - C A U S E D H A Z A R D S
FOR OFFICIAL USE ONLY Appendix E: Page 7
GUIDANCE FOR DEVELOPING SECTOR SPECIFIC PLANS FOR THE NATIONAL INFRASTRUCTURE PROTECTION PLAN Portions of the following material have been taken in whole or in part from the Guidance For Developing Sector-Specific Plans as Input Into the National Infrastructure Protection Plan, (For Official Use Only, not publicly available) published by the Department of Homeland Security in April 2004. In 2003, the DHS Information Assurance and Infrastructure Protection directorate was established with a focus on Critical Infrastructure Protection and in 2004 released the Guidance For Developing Sector Specific Plans for the National Infrastructure Protection Plan. The guidance states: “A fundamental goal of the National Critical Infrastructure Protection (CIP) Program is to identify and protect infrastructures that are deemed most ‘critical’ in terms of national-level public health and safety, governance, economic and national security, and public confidence. The Department of Homeland Security (DHS) recognizes that such protection requires the cooperation and essential collaboration of federal departments and agencies, state and local governments, and the private sector. Accordingly, to achieve the overarching goal of protection, DHS will coordinate the development of consistent, sustainable, effective, and measurable CIP programs across federal, state, and local governments and the private sector. To guide these efforts, DHS will produce a National Infrastructure Protection Plan (NIPP), a key requirement of Homeland Security Presidential Directive (HSPD) 7. The NIPP design consists of a unifying planning component, including national infrastructure protection goals and performance objectives, a set of individual Sector-Specific Plans, and a national-level cross-sector integration plan. Together, these elements will comprise a comprehensive National Plan for public and private sectors to work together to protect the infrastructure of the United States. These activities are executed in an integrated fashion across private sector, public sector (e.g., non-governmental, but not privately owned), state and local, and federal infrastructures. Similarly, activities are executed across the physical, people, and cyber components of our CI/KR. The resulting output is the national profile of CI/KR risk, used as the basis for decision-making. This program is implemented at two levels: in the context of specific threats and in the absence of specific threat information. This two-pronged approach ensures that specific tactical threats are addressed, while allowing the more strategic implementation of protective programs to address future threats. The NIPP will address activities carried out both within individual CI/KR sectors and nationally across sectors, in coordination with private-sector and state and local stakeholders.”

H A Z A R D I D E N T I F I C A T I O N H U M A N - C A U S E D H A Z A R D S
FOR OFFICIAL USE ONLY Appendix E: Page 8
National Incident Management System
Portions of the following material have been taken in whole or in part from the National Incident Management System, (www.dhs.gov browse to Emergency Preparedness and Response) published by Department of Homeland Security in April 2004. In order to address the coordination of federal, state and local response to any hazard as directed by HSPD-5, in 2004 the draft National Incident Management System (NIMS) and National Response Plan (NRP) were released. “NIMS establishes standardized incident management processes, protocols, and procedures that all responders—Federal, state, tribal, and local—will use to coordinate and conduct response actions. With responders using the same standardized procedures, they will all share a common focus, and will be able to place full emphasis on incident management when a homeland security incident occurs—whether terrorism or natural disaster. In addition, national preparedness and readiness in responding to and recovering from an incident is enhanced since all of the Nation's emergency teams and authorities are using a common language and set of procedures. This system provides a consistent nationwide template to enable federal, State, local and tribal governments and private sector and nongovernmental organizations to work together effectively and efficiently to prepare for, prevent, respond to, and recover from domestic incidents, regardless of cause, size, or complexity, including acts of catastrophic terrorism. HSPD-5 requires all federal departments and agencies to adopt the NIMS and to use it for their individual domestic incident management and emergency prevention, preparedness, response, recovery, and mitigation programs and activities, as well as in support of all actions taken to assist State, local or tribal entities.”
NIMS Components
• Command and Management • Preparedness • Resource Management • Communications and Information Systems

H A Z A R D I D E N T I F I C A T I O N H U M A N - C A U S E D H A Z A R D S
FOR OFFICIAL USE ONLY Appendix E: Page 9
DEPARTMENT OF HOMELAND SECURITY MANAGEMENT DIRECTIVE NUMBER: 11042 SAFEGUARDING SENSITIVE BUT UNCLASSIFIED (FOR OFFICIAL USE ONLY) INFORMATION Portions of the following material have been taken in whole or in part from the Department of Homeland Security Management Directive System MD Number: 11042 Issue Date: 05/11/2004 (www.dhs.gov) published by the Department of Homeland Security in May 2004. As stated earlier in the “Introduction” portion of this section, the hazard identification and analysis developed for this project is an emerging state-of-the-practice approach that requires compliance with the Homeland Security Act of 2002, Homeland Security Presidential Decision Directives, and the DHS publications presented in the preceding subsection. In May 2004, DHS issued the policy for the Safeguarding of Sensitive but Unclassified (For Official Use Only) Information. For the purposes of the Human-Caused risk assessment, the information contained herein is considered to meet the definitions and standards as defined in the statutes. Throughout the analysis, the direct document cites and/or language are used to explicitly define those areas which have been adopted as the state-of-the-practice and this document is considered to be a SBU FOUO document. 1. Purpose This directive establishes Department of Homeland Security (DHS) policy regarding the identification and safeguarding of Sensitive But Unclassified information originated within DHS. It also applies to other Sensitive But Unclassified information received by DHS from other government and non-governmental activities.
2. Scope
This directive is applicable to all DHS Headquarters, components, organizational elements, contractors, consultants, and others to whom access to information covered by this directive is granted.
3. Authorities
Homeland Security Act of 2002.
4. Definitions
Access: The ability or opportunity to gain knowledge of information.
For Official Use Only (FOUO): The term used within DHS to identify unclassified information of a sensitive nature, not otherwise categorized by statute or regulation, the unauthorized disclosure of which could adversely impact a person's privacy or welfare, the conduct of federal programs, or other programs or operations essential to the national interest. Information impacting the national security of the United States and classified Confidential, Secret, or Top Secret under Executive Order 12958, "Classified National Security Information," as amended, or its predecessor or successor orders, is not to be considered FOUO. FOUO is not to be considered classified information.
Need-to-know: The determination made by an authorized holder of information that a prospective recipient requires access to specific information in order to perform or assist in a lawful and authorized governmental function, i.e., access is required for the performance of official duties.

H A Z A R D I D E N T I F I C A T I O N H U M A N - C A U S E D H A Z A R D S
FOR OFFICIAL USE ONLY Appendix E: Page 10
Organizational Element: As used in this directive, organizational element is as defined in DHS MD Number 0010.1, Management Directive System and DHS Announcements.
Protected Critical Infrastructure Information (PCII): Critical infrastructure information (CII) is defined in 6 U.S.C. 131(3) (Section 212(3) of the Homeland Security Act). Critical infrastructure information means information not customarily in the public domain and related to the security of critical infrastructure or protected systems. Protected Critical Infrastructure Information is a subset of CII that is voluntarily submitted to the U.S. Federal Government and for which protection is requested under the PCII program by the requester.
Sensitive Security Information (SSI): Sensitive Security Information (SSI) is defined in 49 CFR Part 1520. SSI is a specific category of information that requires protection against disclosure. 49 USC 40119 limits the disclosure of information obtained or developed in carrying out certain security or research and development activities to the extent that it has been determined that disclosure of the information would be an unwarranted invasion of personal privacy; reveal a trade secret or privileged or confidential commercial or financial information; or be detrimental to the safety of passengers in transportation.

H A Z A R D I D E N T I F I C A T I O N H U M A N - C A U S E D H A Z A R D S
FOR OFFICIAL USE ONLY Appendix E: Page 11
ALL-HAZARDS ANALYSIS Human-caused (Manmade) hazards vulnerability analysis is a relatively new area to be addressed in mitigation planning. The mission of the Department of Homeland Security includes preparing for natural disasters and terrorist attacks through preventative planning, technology, and coordinated efforts. In the event of a natural or manmade disaster, DHS will be the first federal department to utilize a full range of state, local, and private partnerships to alleviate the effects of a potential disaster. Several elements have been given responsibilities for manmade vulnerability assessments and mitigation: the Office of State and Local Government Coordination, the Office for Domestic Preparedness (ODP), the Information Assurance and Infrastructure Protection Directorate, and the Emergency Response and Planning Directorate. Figure AE.1 shows the four steps in the risk assessment process as defined and presented by FEMA in the State and Local Mitigation Planning How-to Guides.
Figure AE.1 Risk Assessment Planning Process
Sources: FEMA 386-2 and 386-7

H A Z A R D I D E N T I F I C A T I O N H U M A N - C A U S E D H A Z A R D S
FOR OFFICIAL USE ONLY Appendix E: Page 12
The Office of State and Local Government Coordination was established to serve as a single point of contact for facilitation and coordination of departmental programs that impact state, local, territorial, and tribal governments. The Office for Domestic Preparedness is the principal component of the Department of Homeland Security responsible for preparing the United States for acts of terrorism. In carrying out its mission, ODP is the primary office responsible for providing training, funds for the purchase of equipment, support for the planning and execution of exercises, technical assistance and other support to assist states and local jurisdictions to prevent, plan for, and respond to acts of terrorism. The Information Assurance and Infrastructure Protection Directorate focuses primarily on analyzing and securing critical infrastructure and protected systems, developing risk assessments and vulnerabilities and assisting with recovery. The Emergency Response and Planning Directorate continues FEMA's efforts to reduce the loss of life and property and to protect the nation's institutions from all types of hazards through a comprehensive, risk-based emergency management program of preparedness, prevention, response, and recovery. It furthers the evolution of the emergency management culture from one that reacts to disasters to one that proactively helps communities and citizens avoid becoming victims. In addition, the Directorate will develop and manage a national training and evaluation system to design curriculums, set standards, evaluate, and reward performance in local, state, and federal training efforts. The Department of Homeland Security has embraced the all-hazards approach, which dates back to the August 2001 FEMA Publication 386-2 and was further expanded with the April 2003 FEMA Publication 386-3, Developing the Mitigation Plan and FEMA Publication 386-7, Integrating Human-Caused Hazards Into Mitigation Planning. FEMA Publication 386-7 broadly defines key terrorism threats as Chemical, Biological, Radiological, Nuclear, and Explosive Blast (CBRNE), Cyber-Attack, and Agriterrorism. While natural hazard analysis using HAZUSMH and other tools based on probability and frequency is well developed, DHS is in the infancy of creating a probability and frequency based analysis for manmade events (currently known as the Comprehensive Analysis and Risk Assessment methodology). The current state-of-the-art is the FEMA Risk Mitigation series publications. FEMA has released a number of Risk Mitigation series publications to provide guidance on terrorist attack mitigation. Of relevance for this effort are FEMA Publication 386-7, Integrating Human-Caused Hazards Into Mitigation Planning and FEMA Publication 426 Reference Manual to Mitigate Potential Terrorist Attacks Against Buildings. FEMA Publication 386-7 is written for planners, responders, and building officials. The vulnerability risk assessment for this plan uses these documents in combination with the HAZUS data set.

H A Z A R D I D E N T I F I C A T I O N H U M A N - C A U S E D H A Z A R D S
FOR OFFICIAL USE ONLY Appendix E: Page 13
FEMA Publication 386-7 Integrating Human-Caused Hazards Into Mitigation Planning
Portions of the following material have been taken in whole or in part from the Department of Homeland Security Risk Mitigation series publications (http://www.fema.gov/fima/rmsp.shtm) published by the Department of Homeland Security. Prior to the events of September 11, 2001, FEMA had released FEMA Publication 386-7, Integrating Human-Caused Hazards Into Mitigation Planning. According to this publication, “The term ‘technological hazards’ refers to the origins of incidents that can arise from human activities such as the manufacture, transportation, storage, and use of hazardous materials. For the sake of simplicity, this analysis assumes that technological emergencies are accidental and that their consequences are unintended. The term ‘terrorism’ refers to intentional, criminal, malicious acts. There is no single, universally accepted definition of terrorism, and it can be interpreted in many ways. Officially, terrorism is defined in the Code of Federal Regulations as ‘...the unlawful use of force and violence against persons or property to intimidate or coerce a government, the civilian population, or any segment thereof, in furtherance of political or social objectives.’ (28 CFR, Section 0.85).
FEMA Publication 426, Reference Manual to Mitigate Potential Terrorist Attacks Against Buildings
Portions of the following material have been taken in whole or in part from the Department of Homeland Security Risk Mitigation series publications (http://www.fema.gov/fima/rmsp.shtm) published by the Department of Homeland Security.
The manual states, “This manual provides guidance to the building science community of architects and engineers, to reduce physical damage to buildings, related infrastructure, and people caused by terrorist assaults.
The manual presents incremental approaches that can be implemented over time to decrease the vulnerability of buildings to terrorist threats. Many of the recommendations can be implemented quickly and cost-effectively.
FEMA Publication 426 contains many how-to aspects based upon current information contained in FEMA, Department of Commerce, Department of Defense, Department of Justice, General Services Administration, Department of Veterans Affairs, Centers for Disease Control and Prevention/National Institute for Occupational Safety and Health, and other publications. The manual describes a threat assessment methodology and presents a Building Vulnerability Assessment Checklist to support the assessment process. It also discusses architectural and engineering design considerations, standoff distances, explosive blast, and chemical, biological, and radiological (CBR) information.
The appendices in this manual include a glossary of CBR definitions as well as general definitions of key terminologies used in the building science security area. The appendices also

H A Z A R D I D E N T I F I C A T I O N H U M A N - C A U S E D H A Z A R D S
FOR OFFICIAL USE ONLY Appendix E: Page 14
describe design considerations for electronic security systems and provide a listing of associations and organizations currently working in the building science security area.”
FEMA Publication 426 is a compilation of many government assessment, blast and CBR design publications material that has historically been restricted or applied to military facilities but has been revised to address the traditional facilities such as commercial office buildings, schools, retail and public facilities. The audience is meant to be the architects, engineers, building owners and contractors responsible for new construction, renovation and retrofit. FEMA Publication 426 is a master publication with primers for commercial buildings, insurance, and architects. In late summer 2004, several terrorists were captured and found to have extensive information on key banking and critical government facilities contained on laptops and hard copy documents, along with engineering analysis and damage assessment applications. The process by which they conducted surveillance and information gathering dates back to 2002 and what is commonly know as “Bin Laden’s Terrorist Bible,” the equivalent of the military manuals for security engineering and antiterrorism force protection. Understanding the methods and techniques of how terrorists collect and analyze information to be used in the identification and targeting of infrastructure, systems and people is essential to developing a mitigation strategy.

H A Z A R D I D E N T I F I C A T I O N H U M A N - C A U S E D H A Z A R D S
FOR OFFICIAL USE ONLY Appendix E: Page 15
MILITARY STUDIES IN THE JIHAD AGAINST THE TYRANTS (BIN LADEN’S TERRORISM BIBLE)
Portions of the following material have been taken in whole or in part from the Military Studies in the Jihad Against the Tyrants (Bin Laden’s Terrorism Bible).
The 180-page volume Military Studies in the Jihad Against the Tyrants is a how-to terrorism manual that was seized from the home of a bin Laden disciple in Manchester, England. The 18-chapter manual offers jihad members guidance on subjects such as assassination, forging documents, and preparing poisons. The manual is broken into the following sections:
• Title, Opening Pages, And Introduction • First Lesson: General Introduction • Second Lesson: Necessary Qualifications and Characteristics for the Organization's
Member • Third Lesson: Counterfeit Currency and Forged Documents • Fourth Lesson: Organization Military Bases "Apartments-Hiding Places" • Fifth Lesson: Means of Communication and Transportation • Sixth Lesson: Training • Seventh Lesson: Weapons: Measures Related To Buying and Transporting Them • Eighth Lesson: Member Safety • Ninth Lesson: Security Plan • Tenth Lesson: Special Tactical Operations • Eleventh Lesson: Espionage (1) Information-Gathering Using Open Methods • Twelfth Lesson: Espionage (2) Information-Gathering Using Covert Methods • Thirteenth Lesson: Secret Writing and Ciphers and Codes • Fourteenth Lesson: Kidnapping and Assassinations Using Rifles and Pistols • Fifteenth Lesson: Explosives • Sixteenth Lesson: Assassinations Using Poisons and Cold Steel • Seventeenth Lesson: Interrogation and Investigation • Eighteenth Lesson: Prisons and Detention Centers
The eleventh lesson has a particularly relevant statement: “Information Sources: Any organization that desires to raise the flag of Islam high and proud, must gather as much information as possible about the enemy. Information has two sources: (1) Public Sources: Using this public source openly and without resorting to illegal means, it is possible to gather at least 80% of information about the enemy. The percentage varies depending upon the government’s policy on freedom of the press and information. (2) Secret Sources: It is possible, through these secret and dangerous methods, to obtain the 20% of information that is considered secret. The one gathering information should be a regular person (trained college graduate) who examines primary sources of information published by the enemy (newspapers, magazines, radio, TV, etc.)” Based on evidence collected in Afghanistan and FEMA distribution records, many terrorist organizations have obtained copies of the FEMA Risk Mitigation series publications and HAZUSMH GIS application. The FEMA data sets coupled with Internet open source searches provide the terrorist organizations with the desired “80%” open source information.

H A Z A R D I D E N T I F I C A T I O N H U M A N - C A U S E D H A Z A R D S
FOR OFFICIAL USE ONLY Appendix E: Page 16
The following subsections now begin to define the human-caused hazards analyzed in this Plan. For this Plan, the definitions provided in FEMA Publication 386-7, Integrating Human-Caused Hazards Into Mitigation Planning were used in whole or in part.
TERRORISM Terrorism is a deliberate strategy with persons' objectives obscured by the fact their acts seem random and indiscriminate. Terrorism is discriminate since it has a definite purpose, but indiscriminate in that the terrorist has neither sympathy nor hate for the randomly selected victim. Communities should use the existing processes and methodologies developed for the successful management of other hazards. Usually, the plans and systems developed for other problems can serve as templates for developing a comprehensive counter-terrorism program. Hazardous material emergency response plans and procedures are helpful in this arena. First responders must remember they are targets and that proactive steps need to be taken to protect the crime scene and the evidence. The Federal Bureau of Investigation (FBI) further characterizes terrorism as either domestic or international, depending on the origin, base, and objectives of the terrorist organization; however, the origin of the terrorist or person causing the hazard is far less relevant to mitigation planning than the hazard itself and its consequences. For the purposes of this Plan, “terrorism” refers to the use of Weapons of Mass Destruction (WMD), including, Chemical, Biological, Radiological, Nuclear and Explosive Blast (CBRNE) weapons; arson, incendiary, and armed attacks; industrial sabotage and intentional hazardous materials releases; and “cyberterrorism.” Within these general categories, however, there are many variations. Particularly in the area of biological and chemical weapons, there are a wide variety of agents and ways for them to be disseminated. High-risk targets include military and civilian government facilities, international airports, large cities and high-profile landmarks. Terrorists might also target large public gatherings, water and food supplies, utilities, and corporate centers. Further, they are capable of spreading fear by sending explosives or chemical, biological and radiological agents through the mail. The Department of State report Patterns of Global Terrorism1
(2003) provides a synopsis of historical attacks and targets. The global weapon of choice has been explosive blast and the primary targets commercial buildings. Explosives are still the primary threat/hazard, but bombings typically affect a relatively small-scale geographical area (city blocks) and less than 10,000 people.
Chemical, biological and radiological attacks are the emerging threat and of great concern because of the large geographic area contaminated, numbers of people potentially affected, and the high economic cost of response and recovery. The term “Weapons of Mass Destruction” (WMD) has various definitions, however common to all is the assumption that WMDs may consist of any of the agents discussed above: chemical, biological, radiological, nuclear, explosive or incendiary. The purpose of a WMD is to cause death or serious injury to persons or significant damage to property, typically assumed to be of a scale that has the potential to overwhelm the capabilities of many local and state governments.
1 This report can be found at http://www.state.gov/s/ct/rls/pgtrpt/.

H A Z A R D I D E N T I F I C A T I O N H U M A N - C A U S E D H A Z A R D S
FOR OFFICIAL USE ONLY Appendix E: Page 17
The use of CBR WMD weapons and the stated intent of terrorist groups to acquire and use the weapons increases the target set and the weapons can affect a single building, an entire city, multiple counties or even states. Like explosive threats, CBR threats may be delivered externally or internally to the building. External ground-based threats may be released at a standoff distance from the building or may be delivered directly through an air intake or other opening. Interior threats may be delivered to accessible areas such as the lobby, mailroom, or loading dock, or they may be released into a secure area such as a primary egress route. There may not be an official or obvious warning prior to a CBR event, the best defense is to be alert to signs of a release occurring.
Communities are vulnerable to terrorist incidents and most have high visibility and vulnerable targets. These critical facilities, sites, systems, and special events in the community are usually located near routes with high transportation access. Examples include:
• Government office buildings, court houses, schools, hospitals, and shopping centers • Dams, water supplies, power distribution systems • Military installations • Railheads, interstate highways, tunnels, airports, ferries, bridges, seaports, pipelines • Recreational facilities such as sports stadiums, theaters, parks, casinos, concert halls • Financial institutions and banks • Sites of historical and symbolic significance • Scientific research facilities, academic institutions, museums • Telecommunications, newspapers, radio and television stations • Chemical, industrial, and petroleum plants; business offices, and convention centers • Law, fire, emergency medical services and responder facilities, and operations centers • Special events, parades, religious services, festivals, celebrations • Planned Parenthood facilities and abortion clinics • Residential properties
Critical facilities, sites, and special events become more appealing during visits by high profile personalities and dignitaries. Sporting events such as the Olympic Games and World Cup increase the probability of terrorist targeting. Additionally, international meetings and conventions provide terrorists an excellent environment in which to articulate their cause through violence. Terrorists have introduced two new wrinkles, which are of growing concern: targeting first responders with secondary devices and Weapons of Mass Destruction (WMD) hoaxes. Terrorists will go to great lengths to ensure an event produces the intended impact, even if it means destroying an entire structure or killing thousands. Commercially available materials agents can be developed into WMD. Science and the Internet have made information relating to WMD technology available to an ever-widening audience, and terrorists and other would-be criminals are using it for WMD experimentation. FEMA Publication 426, Reference Manual to Mitigate Terrorist Attacks Against Buildings provides a table of the threat spectrum, appendices that list the chemical and biological agents properties, effects and exposure. The DHS has adopted five categories of terrorist incidents: chemical, biological, radiological, nuclear, and explosive blast. The following sections are a compilation of FEMA Publication 426 Reference Manual and FEMA Publication E155 Building Security Course materials, draft FEMA Publication 453, Multi-hazards Shelter (Safe Haven) design guide, the CDC-NIOSH guidance documents, and the CDC Public

H A Z A R D I D E N T I F I C A T I O N H U M A N - C A U S E D H A Z A R D S
FOR OFFICIAL USE ONLY Appendix E: Page 18
Health Assessment of Potential Biological Terrorism Agents as adopted by DHS (http://www.fema.gov/fima/rmsp.shtm E155 Course and http://www.dhs.gov browse to Science and Technology).
Chemical
Chemical agents are compounds with unique chemical properties that can produce lethal or damaging effects in humans, animals, and plants. Chemical agents can exist as solids, liquids, or gases depending on temperature and pressure. Most chemical agents are liquid and can be introduced into an unprotected population relatively easily using aerosol generators, explosive devices, breaking containers, or other forms of covert dissemination. Dispersed as an aerosol, chemical agents have their greatest potential for inflicting mass casualties. There are two categories of chemical agents: lethal and incapacitating. The lethal chemicals are subdivided into industrial and warfare. Chemical agents can have an immediate effect (a few seconds to a few minutes) or a delayed effect (several hours to several days). While potentially lethal, chemical agents are difficult to deliver in lethal concentrations. Outdoors, the agents often dissipate rapidly. Chemical agents are also difficult to produce. There are six types of agents:
• lung-damaging (pulmonary) agents such as phosgene; • cyanide; • vesicants or blister agents such as mustard; • nerve agents such as GA (tabun), GB (sarin), GD (soman), GF, and VX; • incapacitating agents such as BZ; and • riot-control agents (similar to MACE).
Biological
Biological agents pose a serious threat because of their accessible nature and the rapid manner in which they spread. These agents are disseminated by the use of aerosols, contaminated food or water supplies, direct skin contact, or injection. Several biological agents can be adapted for use as weapons by terrorists. These agents include anthrax (sometimes found in sheep and cattle), tularemia (rabbit fever), cholera, the plague (sometimes found in prairie dog colonies), and botulism (found in improperly canned food). A biological incident will most likely be first recognized in the hospital emergency room, medical examiners office, or within the public health community long after the terrorist attack. The consequences of such an attack will present communities with an unprecedented requirement to provide mass protective treatment to exposed populations, mass patient care, mass fatality management, and environmental health clean-up procedures and plans. Biological agents are organisms or toxins that can kill or incapacitate people, livestock and crops. The three basic groups of biological agents that would likely be used as weapons are bacteria, viruses and toxins. 1. Bacteria. Bacteria are small free-living organisms that reproduce by simple division and are
easy to grow. The diseases they produce often respond to treatment with antibiotics. 2. Viruses. Viruses are organisms that require living cells in which to reproduce and are
intimately dependent upon the body they infect. Viruses produce diseases that generally do not respond to antibiotics. However, antiviral drugs are sometimes effective.

H A Z A R D I D E N T I F I C A T I O N H U M A N - C A U S E D H A Z A R D S
FOR OFFICIAL USE ONLY Appendix E: Page 19
3. Toxins. Toxins are poisonous substances found in, and extracted from, living plants, animals, or microorganisms; some toxins can be produced or altered by chemical means. Some toxins can be treated with specific antitoxins and selected drugs.
Most biological agents are difficult to grow and maintain. Many break down quickly when exposed to sunlight and other environmental factors, while others such as anthrax spores are very long lived. They can be dispersed by spraying them in the air, or infecting animals that carry the disease to humans as well through food and water contamination.
• Aerosols—Biological agents are dispersed into the air, forming a fine mist that may drift for miles. Inhaling the agent may cause disease in people or animals.
• Animals—Some diseases are spread by insects and animals, such as fleas, mice, flies, and mosquitoes. Deliberately spreading diseases through livestock is also referred to as agriterrorism.
• Food and water contamination—Some pathogenic organisms and toxins may persist in food and water supplies. Most microbes can be killed, and toxins deactivated, by cooking food and boiling water.
Portions of the following material has been taken in whole or in part from the Centers for Disease Control Public Health Assessment of Potential Biological Terrorism Agents (
CDC Report—Public Health Assessment of Potential Biological Terrorism Agents
http://www.cdc.gov/ncidod/EID/vol8no2/01-0164.htm) published by CDC February 2002.
According to the CDC report, “Person-to-person spread of a few infectious agents is also possible. Humans have been the source of infection for smallpox, plague, and the Lassa viruses. The CDC has classified biological agents as one of three priority categories for initial public health preparedness efforts: A, B, or C (Table AE.1). Agents in Category A have the greatest potential for adverse public health impact with mass casualties, and most require broad-based public health preparedness efforts (e.g., improved surveillance and laboratory diagnosis and stockpiling of specific medications). Category A agents also have a moderate to high potential for large-scale dissemination or a heightened general public awareness that could cause mass public fear and civil disruption. Most Category B agents also have some potential for large-scale dissemination with resultant illness, but generally cause less illness and death and therefore would be expected to have lower medical and public health impact. These agents also have lower general public awareness than Category A agents and require fewer special public health preparedness efforts. Agents in this category require some improvement in public health and medical awareness, surveillance, or laboratory diagnostic capabilities, but presented limited additional requirements for stockpiled therapeutics beyond those identified for Category A agents. Biological agents that have undergone some development for widespread dissemination but do not otherwise meet the criteria for Category A, as well as several biological agents of concern for food and water safety, are included in this category. Biological agents that are currently not believed to present a high bioterrorism risk to public health but which could emerge as future threats (as scientific understanding of these agents improves) were placed in Category C. These agents will be addressed nonspecifically through overall bioterrorism preparedness efforts to improve the detection of unexplained illnesses and

H A Z A R D I D E N T I F I C A T I O N H U M A N - C A U S E D H A Z A R D S
FOR OFFICIAL USE ONLY Appendix E: Page 20
ongoing public health infrastructure development for detecting and addressing emerging infectious diseases (Source: Centers for Disease Control and Prevention. Preventing emerging infectious diseases: a strategy for the 21st century. Atlanta: U.S. Department of Health and Human Services;1998. p. 1-74.). Most evaluations of potential risk agents for biological warfare or terrorism have historically been based on military concerns and criteria for troop protection. However, several characteristics of civilian populations differ from those of military populations, including a wider range of age groups and health conditions, so that lists of military biological threats cannot simply be adopted for civilian use. These differences and others may greatly increase the consequences of a biological attack on a civilian population. Civilians may also be more vulnerable to food- or waterborne terrorism, as was seen in the intentional Salmonella contamination of salad bars in The Dalles, Oregon, in 1984 (Torok TJ, Tauxe RV, Wise RP, Livengood JR, Sokolow R, Mauvais S, et al. JAMA 1997;278:389-95.). Although food and water systems in the United States are among the safest in the world, the occurrence of nationwide outbreaks due to unintentional food or water contamination demonstrates the ongoing need for vigilance in protecting food and water supplies (Hennessy TW, Hedberg CW, Slutsker L, White KE, Besser-Wiek JM, Moen ME, et al. N Engl J Med 1996;334:1281-6 and Centers for Disease Control and Prevention. Outbreaks of Shigella sonnei infection associated with eating fresh parsley--United States and Canada, July-August 1998. MMWR Morb Mortal Wkly Rep 1999;48:285-9.). Overall, many other factors must be considered in defining and focusing multiagency efforts to protect civilian populations against bioterrorism. Category A agents are being given the highest priority for preparedness. For Category B, public health preparedness efforts will focus on identified deficiencies, such as improving awareness and enhancing surveillance or laboratory diagnostic capabilities. Category C agents will be further assessed for their potential to threaten large populations as additional information becomes available on the epidemiology and pathogenicity of these agents. In addition, special epidemiologic and laboratory surge capacity will be maintained to assist in the investigation of naturally occurring outbreaks due to Category C "emerging" agents. Linkages established with established programs for food safety, emerging infections diseases, and unexplained illnesses will augment the overall bioterrorism preparedness efforts for many Category B and C agents.”

H A Z A R D I D E N T I F I C A T I O N H U M A N - C A U S E D H A Z A R D S
FOR OFFICIAL USE ONLY Appendix E: Page 21
Table AE.1 Critical Biological Agent Categories for Public Health Preparedness
Biological agent(s) Disease
Category A
Variola major Smallpox Bacillus anthracis Anthrax Yersinia pestis Plague Clostridium botulinum (botulinum toxins) Botulism Francisella tularensis Tularemia Filoviruses and Arenaviruses (e.g., Ebola virus, Lassa virus) Viral hemorrhagic fevers
Category B
Coxiella burnetii Q fever Brucella spp. Brucellosis Burkholderia mallei Glanders Burkholderia pseudomallei Melioidosis Alphaviruses (VEE, EEE, WEEa) Encephalitis Rickettsia prowazekii Typhus fever Toxins (e.g., Ricin, Staphylococcal enterotoxin B) Toxic syndromes Chlamydia psittaci Psittacosis Food safety threats (e.g., Salmonella spp., Escherichia coli O157:H7) Water safety threats (e.g., Vibrio cholerae, Cryptosporidium parvum)
Category C
Emerging threat agents (e.g., Nipah virus, hantavirus)
aVenezuelan equine (VEE), eastern equine (EEE), and western equine encephalomyelitis (WEE) viruses
Source: CDC Report—Public Health Assessment of Potential Biological Terrorism Agents

H A Z A R D I D E N T I F I C A T I O N H U M A N - C A U S E D H A Z A R D S
FOR OFFICIAL USE ONLY Appendix E: Page 22
Nuclear and Radiological Attack
Nuclear threat is the use, threatened use, or threatened detonation of a nuclear bomb or device. At present, there is no known instance in which any non-governmental entity has been able to obtain or produce a nuclear weapon. The most likely scenario is the detonation of a large conventional explosive that incorporates nuclear material or detonation of an explosive in close proximity to nuclear materials in use, storage, or transit. Of concern is the increasing frequency of shipments of radiological materials throughout the world. Nuclear explosions can cause deadly effects—blinding light, intense heat (thermal radiation), initial nuclear radiation, blast, fires started by the heat pulse, and secondary fires caused by the destruction. They also produce radioactive particles called fallout that can be carried by wind for hundreds of miles. Terrorist use of a radiological dispersion device (RDD)—often called ”dirty nuke” or “dirty bomb”—is considered far more likely than use of a nuclear device. These radiological weapons are a combination of conventional explosives and radioactive material designed to scatter dangerous and sub-lethal amounts of radioactive material over a general area. Such radiological weapons appeal to terrorists because they require very little technical knowledge to build and deploy compared to that of a nuclear device. Also, these radioactive materials, used widely in medicine, agriculture, industry and research, are much more readily available and easy to obtain compared to weapons grade uranium or plutonium. Terrorist use of a nuclear device would probably be limited to a single smaller “suitcase” weapon. The strength of such a weapon would be in the range of the bombs used during World War II. The nature of the effects would be the same as a weapon delivered by an inter-continental missile, but the area and severity of the effects would be significantly more limited. There is no way of knowing how much warning time there would be before an attack by a terrorist using a nuclear or radiological weapon. A surprise attack remains a possibility. The danger of a massive strategic nuclear attack on the United States involving many weapons receded with the end of the Cold War. However, some terrorists have been supported by nations that have nuclear weapons programs. If there were threat of an attack from a hostile nation, people living near potential targets could be advised to evacuate or they could decide on their own to evacuate to an area not considered a likely target. Protection from radioactive fallout would require taking shelter in an underground area, or in the middle of a large building. In general, potential targets include:
• strategic missile sites and military bases; • centers of government such as Washington, D.C., and state capitals; • important transportation and communication centers; • manufacturing, industrial, technology and financial centers; • petroleum refineries, electrical power plants and chemical plants; and • major ports and airfields.
Taking shelter during a nuclear attack is absolutely necessary. There are two kinds of shelters—blast and fallout. Blast shelters offer some protection against blast pressure, initial radiation, heat and fire, but even a blast shelter could not withstand a direct hit from a nuclear detonation.

H A Z A R D I D E N T I F I C A T I O N H U M A N - C A U S E D H A Z A R D S
FOR OFFICIAL USE ONLY Appendix E: Page 23
Fallout shelters do not need to be specially constructed for that purpose. They can be any protected space, provided that the walls and roof are thick and dense enough to absorb the radiation given off by fallout particles. The three protective factors of a fallout shelter are shielding, distance, and time.
• Shielding. The more heavy, dense materials—thick walls, concrete, bricks, books and earth—between you and the fallout particles, the better.
• Distance. The more distance between you and the fallout particles, the better. An underground area, such as a home or office building basement, offers more protection than the first floor of a building. A floor near the middle of a high-rise may be better, depending on what is nearby at that level on which significant fallout particles would collect. Flat roofs collect fallout particles so the top floor is not a good choice, nor is a floor adjacent to a neighboring flat roof.
• Time. Fallout radiation loses its intensity fairly rapidly. In time, you will be able to leave the fallout shelter. Radioactive fallout poses the greatest threat to people during the first two weeks, by which time it has declined to about 1% of its initial radiation level.
Any protection, however temporary, is better than none at all, and the more shielding, distance and time, the better.
Electromagnetic Pulse
There are two types of EMP that can be generated; High-Altitude Electromagnetic Pulse (HEMP) and High Power Microwave (HPM) Electromagnetic Pulse. EMP acts like a stroke of lightning but is stronger, faster and briefer. EMP can seriously damage electronic devices connected to power sources or antennas. These include communication systems, computers, electrical appliances, and automobile or aircraft ignition systems. Nuclear EMP can be induced hundreds to a few thousand kilometers from the detonation and is damaging to electronic equipment over a very wide area, and depends on the design of the nuclear device and altitude of the burst. The damage could range from a minor interruption to actual burnout of components. An HMP weapon is a powerful chemical detonation instantly transformed by a special coil device, called a flux compression generator, into a strong electromagnetic field of microwave energy. HPM energy can be focused using an antenna, or emitter, to produce effects similar to HEMP, but only within a very limited range. HPM generates an electromagnetic pulse and intense microwaves that are very damaging to electronics within a small geographic area. Although EMP is unlikely to harm most people, it could harm those with pacemakers or other implanted electronic devices. (Source: CRS Report for Congress)

H A Z A R D I D E N T I F I C A T I O N H U M A N - C A U S E D H A Z A R D S
FOR OFFICIAL USE ONLY Appendix E: Page 24
Explosive Blast
Use of explosives has historically been a favorite tactic of terrorists for a variety of reasons and this is likely to continue into the future. Ingredients for homemade bombs are easily obtained on the open market as are the techniques for making bombs. Also, explosive events are easy and quick to execute. Vehicle bombs have the added advantage of being able to bring a large quantity of explosives to the doorstep of the target undetected. Finally, terrorists often attempt to use the dramatic component of explosions, in terms of the sheer destruction they cause, to generate media coverage in hopes of transmitting their political message to the public. From the standpoint of structural design, the vehicle bomb is the most important consideration. Vehicle bombs are able to deliver a sufficiently large quantity of explosives to cause potentially devastating structural damage. For a vehicle bomb, the critical location is taken to be the closet point that a vehicle can approach. This may be a parking area directly beneath the occupied building, the loading dock, the curb directly outside the facility, or at a vehicle-access control gate where inspection takes place. Another explosive attack threat is the small bomb that is hand delivered. Small weapons can cause the greatest damage when brought into vulnerable, unsecured areas of the building interior, such as the building lobby, mail room and retail spaces. Hand carried explosives are typically on the order of five to ten pounds TNT equivalent. However, larger charge weights, in the 50 to 100 pounds TNT equivalent range, can be readily carried in rolling cases. Mail bombs are typically less than ten pounds TNT equivalent. Rocket Propelled Grenades (RPG), antitank, mortars, and Man Portable Air-Defense Systems (MANPADS) weapons like Stinger missiles present a different type of explosive threat. RPG’s are line-of-sight weapons that can have a variety of warheads and cause extensive damage to a building, but usually limited to ground facilities, although they have been used successfully against slow flying helicopters. MANPADS are typically infrared or radar guided and employed against aircraft. Arson and other incendiary attacks refer to the initiation of fire (which can be of an explosive nature) on or near a target. Incendiary devices are either mechanical, electrical, or chemical
Rocket Propelled Grenades (RPG), antitank, mortars, and Man Portable Air-Defense Systems (MANPADS) weapons like Stinger missiles present one type of explosive threat. Photo courtesy of FEMA.
Destruction caused by the Oklahoma City Bombing. Photo courtesy of FEMA.

H A Z A R D I D E N T I F I C A T I O N H U M A N - C A U S E D H A Z A R D S
FOR OFFICIAL USE ONLY Appendix E: Page 25
devices used to intentionally initiate combustion and start fires. Their purpose is to set fire to other materials or structures. These devices maybe used singularly or in combination. Incendiary devices are firebombs. These devices range from the simple Molotov cocktail (bottle, gasoline, rag, match), to much larger and sophisticated bombs. They may include napalm or any large container filled with flammable fluids and ignited by some sort of fuse. Armor piercing and incendiary tipped ammunition can result in significant damage to almost any structure. Incendiary attacks can last for minutes or hours, and possibly longer depending on the type and quantity of device or accelerant used and the materials (fuels) present at the location of the attack. This type of attack can also result in cascading failures of structures or systems. The Virginia Division of Emergency Management has a Web site with a list of many of the attacks, agents, effects and emergency actions at: http://www.vaemergency.com/prepare/terrorismtoolkit/terrguide/weapons/incendiary.htm
Cyberterrorism
Cyberterroism is a relatively new concept. According to the National Strategy for Homeland Security, terrorists may seek to cause widespread disruption and damage, including casualties, by attacking electronic and computer networks which are linked to critical infrastructures such as energy, financial and securities networks. In addition, terrorist groups are known to exploit information technology and the Internet to plan attacks, raise funds, circulate propaganda, gather information and communicate. In terms of hazard mitigation, cyberterrorism is often explored as a component in business continuity planning. Cyberterrorism threatens the electronic infrastructure supporting the social, health, and economic well being of citizens. Interlinked computer networks regulate the flow of power, water, financial services, medical care, telecommunication networks, and transportation systems. Of primary concern for facilities and infrastructure is failure of Supervisory Control and Data Acquisition (SCADA) system or other critical infrastructure components, and impacts of worms and viruses on Physical Security Equipment (PSE) such as CCTV, entry access control, biometric scanners and other LAN or wireless enabled devices. The public and private sectors' unprecedented dependence on information and communications systems, computers, and networks, demonstrate three realities: Networks are vulnerable to attack from any source, whether it is a foreign intelligence agency or a teenager with a new Macintosh. The result of a youthful hacker could be as devastating as that of a sophisticated terrorist group seeking to intentionally disrupt our way of life. The ability to distinguish a singular hacker-type incident from a cyberterrorist attack may not be readily evident. The tools for conducting cyberterrorism are widely available, broadly advertised, and easily used. There are entire web sites devoted to the identification and use of hacking tools. Potential attackers only require access to a computer and a telecommunications network. (Source: Department of Homeland Security National Security Strategy to Secure Cyberspace) Agriterrorism
The United States agriculture and food systems are vulnerable to disease, pest and poisonous agents that either occur naturally, are unintentionally introduced, or are intentionally delivered by acts of terrorism. America’s agriculture and food system is an extensive, open,

H A Z A R D I D E N T I F I C A T I O N H U M A N - C A U S E D H A Z A R D S
FOR OFFICIAL USE ONLY Appendix E: Page 26
interconnected, diverse, and complex structure providing potential targets for terrorist attacks. The DHS objective is to provide the best protection possible against a successful attack on the United State’s agriculture and food system, which could have catastrophic health and economic effects. In the Homeland Security Presidential Directive (HSPD-9), the President directed the Secretaries of Agriculture, Health and Human Services, and Homeland Security to expand and continue vulnerability assessments of the agriculture and food sectors. These vulnerability assessments should identify requirements of the National Infrastructure Protection Plan developed by the Secretary of Homeland Security, as appropriate, and shall be updated every two years. As stated in HSPD-9, “The Secretary of Homeland Security and the Attorney General, working with the Secretaries of Agriculture, Health and Human Services, the Administrator of the Environmental Protection Agency, the Director of Central Intelligence, and the heads of other appropriate Federal departments and agencies shall prioritize, develop, and implement, as appropriate, mitigation strategies to protect vulnerable critical nodes of production or processing from the introduction of diseases, pests, or poisonous agents. The Secretaries of Agriculture, Health and Human Services, and Homeland Security shall build on existing efforts to expand development of common screening and inspection procedures for agriculture and food items entering the United States and to maximize effective domestic inspection activities for food items within the United States.”

H A Z A R D I D E N T I F I C A T I O N H U M A N - C A U S E D H A Z A R D S
FOR OFFICIAL USE ONLY Appendix E: Page 27
HAZARDOUS MATERIALS (HAZMAT) Hazardous materials (HAZMAT) incidents can apply to fixed facilities as well as mobile, transportation-related accidents in the air, by rail, on the Nation’s highways and on the water. Approximately 6,774 HAZMAT events occur each year, 5,517 of which are highway incidents, 991 are railroad incidents and 266 are due to other causes (FEMA, 1997). In essence, HAZMAT incidents consist of solid, liquid and/or gaseous contaminants that are released from fixed or mobile containers, whether by accident or by design as with an intentional terrorist attack. A HAZMAT incident can last hours to days, while some chemicals can be corrosive or otherwise damaging over longer periods of time. In addition to the primary release, explosions and/or fires can result from a release, and contaminants can be extended beyond the initial area by persons, vehicles, water, wind and possibly wildlife as well. HAZMAT incidents can also occur as a result of or in tandem with natural hazard events, such as floods, hurricanes, tornadoes and earthquakes, which in addition to causing incidents can also hinder response efforts. In the case of Hurricane Floyd in September 1999, communities along the Eastern United States were faced with flooded junkyards, disturbed cemeteries, deceased livestock, floating propane tanks, uncontrolled fertilizer spills and a variety of other environmental pollutants that caused widespread toxological concern.
In November of 2002, this diesel tanker overturned in Madison County, VA. Two lanes of Route 29 S, a major regional thoroughfare, had to be closed until cleanup was completed. Photos by Vincent Vala, Culpeper Star-Exponent.

H A Z A R D I D E N T I F I C A T I O N H U M A N - C A U S E D H A Z A R D S
FOR OFFICIAL USE ONLY Appendix E: Page 28
RADIOLOGICAL EVENT Radiological incidents or emergencies may occur as the result of an accident, or an intentional act that involves the release of radioactive materials through a radiological dispersion device, or “dirty bomb.” Accidental releases of radiation may occur at hazardous waste sites, fixed nuclear facilities, or as the result of a transportation accident involving radiological materials. Transportation accidents may occur in the shipment of radioactive materials within the state in support of fixed nuclear facilities and other users of radioactive materials, including Department of Defense facilities. The primary mode of transportation of radioactive materials is by truck, although shipments also occur by rail, ship or aircraft. A survey of State radiological emergency response plans revealed a broad range of potential sources of radiation from fixed facilities, including: hospitals, nuclear power plants, nuclear propelled ships, hazardous waste sites, and naval shipyards. Increasingly, the Department of Homeland Security, the Centers for Disease Control and other federal authorities have publicized the potential hazards and harmful effects associated with the dispersion of radioactive materials by a terrorist. There are three primary scenarios in which radioactive materials could be intentionally dispersed: use of conventional explosives or other means to spread radioactive materials (a dirty bomb), attack on a fixed nuclear facility, and use of a nuclear weapon. Radioactive contamination and radiation exposure can occur if radioactive materials are released into the environment as the result of an accident, a natural hazard event, or an act of terrorism. Radioactive materials released into the environment can cause air, water, surfaces, soil, plants, buildings, people, or animals to become contaminated. A radiological hazard is the uncontrolled release of radioactive material that can harm people or damage the environment. Radioactive materials released into the environment may follow two broad pathways:
1) Plume exposure pathway, which exposes the body to gamma radiation from deposited material (and inhalation exposure from the passing radioactive plume). The duration of the release leading to potential exposure may range from one-half hour to several days.
2) Ingestion exposure pathway, which results from ingestion of contaminated water or foods. The duration of potential exposure may range from hours to several months.
Figure AE-2 reflects naturally-occurring radiation doses (and doses received during normal activities) to provide a point of reference and for comparison. The threshold for any real consequences begins around 200,000 millirems (mrem). Mild radiation sickness (i.e., nausea, vomiting and diarrhea) may onset after receiving a whole body dose of approximately 200,000 mrem in a short amount of time (generally less than 24 hours). The Lethal Dose (LD), known as the LD50/60, is a single, acute, whole body exposure of around 450,000 mrem. The LD50/60 is defined when 50 percent of all people present at an incident receive 450,000 mrem and die after 60 days after receiving no medical treatment.

H A Z A R D I D E N T I F I C A T I O N H U M A N - C A U S E D H A Z A R D S
FOR OFFICIAL USE ONLY Appendix E: Page 29
Figure AE-2 Common Radiation Doses
Source: FEMA E155 Building Security Course
Low level sources are categorized in three major groups: medical, industrial and laboratory. Hospitals, clinics, laboratories, and research facilities routinely use radiation in the diagnosis and treatment of medical and dental patients. Industrial applications include various flow gauges, research and development facilities, and radiography to non-destructive test welds and castings for flaws. Medical, industrial, and research use of radiological materials similarly dictate the need for local emergency planning.

H A Z A R D I D E N T I F I C A T I O N H U M A N - C A U S E D H A Z A R D S
FOR OFFICIAL USE ONLY Appendix E: Page 30
ENERGY PIPELINE FAILURES The energy infrastructure of the United States is comprised of many components, including the physical network of pipes for oil and natural gas, electricity transmission lines, and other means for transporting energy to the Nation’s consumers. This infrastructure also includes facilities that convert raw natural resources into energy products, as well as the rail network, trucking lines and marine transportation. (U.S. Department of Energy, 2003) Much of this infrastructure is aging, and in addition to the challenges of keeping the infrastructure up-to-date with the latest technological advances and consumer needs, the potential for an energy pipeline failure to become a hazard in-and-of-itself must be considered. The two million miles of oil pipelines in the United States are the principal mode for transporting oil and petroleum products such as gasoline, and virtually all natural gas in the United States is moved via pipeline as well. (DOE, 2003) Much of this oil pipeline infrastructure is old, requiring regular safety and environmental reviews to ensure its safety and reliability. The potential risk of pipeline accidents is a significant national concern. The energy infrastructure is vulnerable to physical and cyber disruption, either of which could threaten its integrity and safety. (DOE, 2003) Disruptions could originate with natural events such as geomagnetic storms and earthquakes, or could result from accidents, equipment failures or deliberate interference. In addition, the Nation’s transportation and power infrastructures have grown increasingly complex and interdependent—consequently, any disruption could have far-reaching consequences. Information on hazardous liquid pipeline accidents from 1986 until 2004 can be found at http://ops.dot.gov/stats/lq_sum.htm.
Virtually all natural gas in the United States is moved via pipeline. (Photo courtesy of the Department of Energy)

H A Z A R D I D E N T I F I C A T I O N H U M A N - C A U S E D H A Z A R D S
FOR OFFICIAL USE ONLY Appendix E: Page 31
Communication Disruption
The telecommunications sector provides voice and data service to public and private users through a complex and diverse public-network infrastructure encompassing the Public Switched Telecommunications Network (PSTN), the Internet, and private enterprise networks. The PSTN provides switched circuits for telephone, data, and leased point-to-point services. It consists of physical facilities, including over 20,000 switches, access tandems, and other equipment. These components are connected by nearly two billion miles of fiber and copper cable (DHS, 2002). The physical PSTN remains the backbone of the infrastructure, with cellular, microwave, and satellite technologies providing the extended gateways to the wireless network for mobile users. Because of the growing interdependencies among the various critical infrastructures, a direct or indirect attack or major disruption caused by natural events could result in cascading effects across the others. Such interdependencies increase the need to identify critical assets and secure them against both physical and cyber threats. Telecommunications and information systems are high-priority targets because of not only the United States’ extensive dependence on information infrastructures for its economic and national security, but also the types of information they carry and their central role in supporting NS/EP requirements. Electronic intrusion will remain a serious threat to the Public Network (PN), NS/EP telecommunications and information systems, and interconnected infrastructure systems. Any protracted loss of critical information infrastructure capabilities could severely harm national security and the national welfare. On a daily basis, the telecommunications sector must contend with a range of potential threats, from traditional natural and human-based threats to its physical infrastructure, such as weather events, unintentional cable cuts, and insider threats (i.e., physical and cyber sabotage). The September 11 attacks revealed the threat terrorism poses to the telecommunications sector’s physical infrastructure. While it was not a direct target of the attacks, the telecommunications sector suffered significant collateral damage. The vulnerability of this sector to natural, technological and human-caused hazards needs to be addressed in mitigation plans. Protecting critical infrastructure and key assets is one of the Department of Homeland Security’s critical mission areas. Since private industry owns and operates approximately 85 percent of the critical infrastructures, government and industry must work together in this mission. Established originally with a focus on protecting the Nation’s cyber infrastructures, CWIN supports critical infrastructure protection across all sectors. It provides a private, protected and reliable network, offering voice and data connectivity to Government and industry partners. The increasing reliance on the public switched network, the Internet, and computer applications to support national security, homeland security, emergency preparedness, and public safety places a premium on trusted systems (i.e., systems that are available, secure, reliable, and survivable even in the face of attacks, failures, or accidents). The September 11 terrorist attacks demonstrated the critical importance of networked information systems in supporting national crisis management and response. Ensuring national leaders, first responders, infrastructure owners, and the public receive timely, accurate, and complete information from trusted networked information systems is crucial to both national and homeland security.

H A Z A R D I D E N T I F I C A T I O N H U M A N - C A U S E D H A Z A R D S
FOR OFFICIAL USE ONLY Appendix E: Page 32
Electromagnetic pulse devices that wreak havoc on communications systems are becoming more and more common and more and more portable. There are some that are as small as a grenade. These could also take out a large number of systems relatively easily. Potential causes of telecommunications disruptions include:
• solar flares impact on satellites; • Electromagnetic Pulse (EMP) weapons; • cyberhacking; • direct assault and equipment damage; and • extended loss of electrical power.
UTILITY DISRUPTION For the purposes of this Plan, utility disruptions will refer to water, sewer and electric power. Natural gas is also a utility that can be disrupted, however it is not covered within the Plan at this time.
Water
The water sector consists of two basic and vital components: fresh water supply and wastewater collection and treatment. Water sector infrastructures are diverse, complex and distributed—ranging from systems that serve rural areas to systems that serve major metropolitan areas. On the supply side, the primary focus of critical infrastructure protection efforts are the public water systems that depend on reservoirs, dams, wells, and aquifers, as well as treatment facilities, pumping stations, aqueducts, and transmission pipelines. As with other critical infrastructure components, the Nation’s water system is vulnerable to acts of terrorism. In recognition of potential threats to water systems, the Environmental Protection Agency—in coordination with industry—has developed vulnerability assessment methodologies for both drinking water and waste water treatment facilities. In response to the Public Health Security and Bioterrorism Preparedness and Response Act of 2002, the EPA has developed baseline threat information to use in conjunction with vulnerability assessments. In order to set priorities among a wide range of protective measures that should be taken, the water sector is focusing on the types of infrastructure attacks that could result in significant human casualties and property damage or widespread economic consequences. In general, there are four primary areas of concentration:
• Physical damage or destruction of critical assets, including intentional releases of toxic chemicals;
• Actual or threatened contamination of the water supply; • Cyber attack on information management systems or other electronic systems; and • Interruption of services from other infrastructure.
Sewer
The second category of utilities in this Plan is sewer. A primary concern with this utility is the increasing use of Internet enabled devices and valves that can be cyber-attacked and cause a sewage release.

H A Z A R D I D E N T I F I C A T I O N H U M A N - C A U S E D H A Z A R D S
FOR OFFICIAL USE ONLY Appendix E: Page 33
Electric Power
The third category of utilities in this Plan is electric power. Almost every form of productive activity—whether in businesses, manufacturing plants, schools, hospitals, or homes—requires electricity. The electric system in the United States is an interconnected, multi-modal distribution system that consists of three major parts: generation, transmission and distribution, and control and communications. Generation assets include fossil fuel plants, hydroelectric dams, and nuclear power plants. Transmission and distribution systems link areas of the grid. Distribution systems manage and control the distribution of electricity into homes and businesses. Control and communications systems operate and monitor critical infrastructure components. The energy infrastructure of the United States is comprised of many components, including the physical network of pipes for oil and natural gas, electricity transmission lines, and other means for transporting energy to the Nation’s consumers. This infrastructure also includes facilities that convert raw natural resources into energy products, as well as the rail network, trucking lines and marine transportation. (U.S. Department of Energy, 2003) Much of this infrastructure is aging, and in addition to the challenges of keeping the infrastructure up-to-date with the latest technological advances and consumer needs, the potential for an energy pipeline failure to become a hazard in-and-of-itself must be considered. The two million miles of oil pipelines in the United States are the principal mode for transporting oil and petroleum products such as gasoline, and virtually all natural gas in the United States is moved via pipeline as well. (DOE, 2003) Much of this oil pipeline infrastructure is old, requiring regular safety and environmental reviews to ensure its safety and reliability. The potential risk of pipeline accidents is a significant national concern. The energy infrastructure is vulnerable to physical and cyber disruption, either of which could threaten its integrity and safety. (DOE, 2003) Disruptions could originate with natural events such as geomagnetic storms and earthquakes, or could result from accidents, equipment failures or deliberate interference. In addition, the Nation’s transportation and power infrastructures have grown increasingly complex and interdependent—consequently, any disruption could have far-reaching consequences.

H A Z A R D I D E N T I F I C A T I O N H U M A N - C A U S E D H A Z A R D S
FOR OFFICIAL USE ONLY Appendix E: Page 34
CIVIL DISRUPTION
Portions of the following material have been taken in whole or in part from www.co.pierce.wa.us/xml/abtus/ourorg/dem/EMDiv/HIVA/civil.pdf Any incident that disrupts a community where intervention is required to maintain public safety is a civil disturbance or disruption. Examples are demonstrations, riots, strikes, public nuisances, and criminal activities. National organizations can create large public and civil disruptions that have significant economic impact. In addition to traditional types of civil disruption (in the form or protests, riots, etc.), the threat of CBR warfare presents a new potential civil disruption. If an agent is released in a community, the panic and hysteria that will follow will likely cause civil disruption as citizens rush to local hospitals to receive treatment and/or vaccination. In the United States, protesters and anarchists tend to practice civil disturbance at large, scheduled peaceful gatherings such as union marches or world and global meetings. They believe all types of governments and global organizations are oppressive and undesirable and should be abolished. Their activities involve disruption of activities, resistance and rejection of all forms of control and authority. Modern anarchists are well-organized, using command centers, tactical communications, and the Internet for planning and operations. Control of anarchists requires police forces trained and experienced in the Incident Command System and riot control. Effects of anarchism include injury to participants and spectators and property damage. The last decade has seen increased rioting and looting, in the United States following sporting events at both professional and college events. Generally, the cities with populations of more than 100,000 are vulnerable to civil disturbances. Smaller college towns also are subject to civil disturbances. The center of state government faces an increased potential for civil disturbance. Communities with concentrations of ethnic groups and disparate economic status are susceptible to civil disorder. The presence of professional sports teams can be a catalyst for disruptive behavior. Historically, these elements are the most likely to fuel and sustain a disturbance. Violent prison or jail uprisings are rare, but are a hazard that communities with these facilities should identify and assess. Additionally, most counties and cites have permanent or temporary facilities for housing prisoners. Studies show that overcrowding is one of the major causes of uprisings. Overcrowding requires implementation of tighter internal controls, which are unpopular with the prison population. The Constitutional rights of prisoners are difficult to accommodate with inadequate facilities making it difficult to maintain essential services, personal safety, and preservation of property while maintaining incarceration. Disruption of service due to terrorist attack refers to the interruption, failure or denial of a service, such as the sabotage or designed breakdown of infrastructure as with an attack on transportation facilities, utilities and other public services. While the Federal Bureau of Investigation found no evidence of terrorism or criminal activity in its investigation of the August 2003 blackout in the Northeast United States, it is clear to see the potential damage and disruption that could be caused by intentional terrorist attack on a nation’s power grids.
VULNERABILITY ASSESSMENT HUMAN-CAUSED HAZARDS
FOR OFFICIAL USE ONLY
This appendix analyzes the impact of the following human-caused hazards on the Rappahannock-Rapidan Region: Human-caused Hazards
• Terrorism • Hazardous Materials (HAZMAT) • Radiological Event • Energy Pipeline Failures • Communication Disruption • Utility Disruption • Civil Disruption
HUMAN-CAUSED (MANMADE) HAZARDS Human-caused hazards vulnerability analysis is a relatively new area to be addressed in mitigation planning. The mission of the Department of Homeland Security (DHS) includes preparing for natural disasters and terrorist attacks through preventative planning, technology, and coordinated efforts. In the event of a natural or manmade disaster, DHS will be the first federal department to utilize a full range of state, local, and private partnerships to alleviate the effects of a potential disaster. As described in the Human-Caused Hazards Identification Section, there are a number of federal state and local agencies involved with all hazards analyses and assessments. The most current information can be found at www.dhs.gov. In addition, the United State Department of Agriculture (USDA), Centers for Disease Control (CDC), Environmental Protection Agency (EPA), and Health and Human Services (HHS) are developing similar plans, but have not reached the same state of maturity as DHS. Future updates of this Plan should include the evolving plans and guidance from the other federal agencies. Several DHS Directorates have been given responsibilities for human-caused vulnerability assessments and mitigation: the Office of State and Local Government Coordination, the Office for Domestic Preparedness (ODP), the Information Assurance and Infrastructure Protection Directorate, and the Emergency Response and Planning Directorate. The following sections are a compilation of the DHS web site, draft DHS publications, and conference discussions intended to provide a relative description of the major initiatives and objectives of the DHS in response to the Homeland Security Presidential Decision Directives, with regard to human-caused hazard assessment. The most recent DHS organization chart includes the Office of State and Local Government Coordination which was established to serve as a single point of contact for facilitation and coordination of Departmental programs that impact state, local, territorial, and tribal governments. In addition, the Office for Domestic Preparedness was moved into the State and Local Office. ODP has been the primary agency responsible for preparing the United States for acts of terrorism. In carrying out its mission, ODP is the primary office responsible for providing

VULNERABILITY ASSESSMENT HUMAN-CAUSED HAZARDS
FOR OFFICIAL USE ONLY Appendix F: Page 2
training, funds for the purchase of equipment, support for the planning and execution of exercises, technical assistance and other support to assist states and local jurisdictions to prevent, plan for, and respond to acts of terrorism. The DHS Information Assurance and Infrastructure Protection Directorate focuses primarily on analyzing and securing critical infrastructure and protected systems, developing risk assessments and vulnerabilities and assisting with recovery. The DHS Emergency Response and Planning (EP&R) Directorate continues FEMA's efforts to reduce the loss of life and property and to protect the nation's institutions from all types of hazards through a comprehensive, risk-based emergency management program of preparedness, prevention, response, and recovery. It furthers the evolution of the emergency management culture from one that reacts to disasters to one that proactively helps communities and citizens avoid becoming victims. In addition, the Directorate will develop and manage a national training and evaluation system to design curriculums, set standards, evaluate, and reward performance in local, state, and federal training efforts. The Directorate also focuses on risk mitigation in advance of emergencies by promoting the concept of disaster-resistant communities, including providing federal support for local governments that promote structures and communities that reduce the chances of being hit by disasters. EP&R will coordinate with private industry, the insurance sector, mortgage lenders, the real estate industry, homebuilding associations, citizens, and others to create model communities in high-risk areas. The Directorate leads the DHS response to any sort of biological or radiological attack, and coordinate the involvement of other federal response teams, such as the National Guard, in the event of a major incident. Building upon the successes of FEMA, DHS will lead the Nation's recovery from catastrophes and help minimize the suffering and disruption caused by disasters. In April 2004, the DHS released the National Incident Management System (NIMS), the Nation's first standardized management plan that creates a unified structure for Federal, state, and local lines of government for incident response. The completion of NIMS follows the October 2003 nationwide deployment of the Initial National Response Plan (INRP) which represented the first step in aligning incident management response and actions between all Federal, state, tribal, local, and private communities. A final National Response Plan is under development and will eventually replace the INRP, while NIMS will continue to provide the Nation's doctrinal guidance for incident management for acts of terrorism, natural disasters, and other emergencies. NIMS strengthens America's response capabilities by identifying and integrating core elements and best practices for all responders and incident managers. Through a balance between flexibility and standardization, and use of common doctrine, terminology, concepts, principles, and processes, execution during a real incident will be consistent and seamless. Responders will be able to focus more on response, instead of organizing the response, and teamwork and assignments among all authorities will be clearly enhanced. Within NIMS, several elements require data from the manmade vulnerability assessment. DHS recommends that communities’ vulnerability assessments methodologies incorporate evaluation of NIMS capabilities into mitigation planning.

VULNERABILITY ASSESSMENT HUMAN-CAUSED HAZARDS
FOR OFFICIAL USE ONLY Appendix F: Page 3
Other key federal agencies and organizations include the Department of Human and Health Services, the Department of Agriculture, the Department of Veterans Affairs, the Environmental Protection Agency, the National Institute of Health and the Centers for Disease Control. Many of these agencies and organizations have facilities (to include alternate operating and/or recovery sites) and staff within the study region or within close proximity. The Department of Homeland Security has embraced the All Hazards approach and broadly defined key terrorism threats as Chemical, Biological, Radiological, Nuclear, and Explosive Blast (CBRNE); Cyber-Attack, and Agriterrorism. However, while natural hazard analysis using HAZUS-MH and other tools based on probability and frequency is well developed, DHS is in the infancy of creating a probability and frequency based analysis for human-caused events. The current state-of-the-art is the FEMA Risk Mitigation series publications and the vulnerability risk assessment for this Plan uses these documents in combination with the HAZUS dataset.
METHODOLOGIES USED Portions of the following material have been taken in whole or in part from the Department of Homeland Security Risk Mitigation series publications (http://www.fema.gov/fima/rmsp.shtm) published by the Department of Homeland Security. The Rappahannock-Rapidan Region Human-caused hazards vulnerability risk assessment uses a combination of HAZUSMH geospatial data, the FEMA Publication 386-7, Integrating Human-Caused Hazards Into Mitigation Planning Guide, and the FEMA Publication, 426, Reference Manual to Mitigate Terrorist Attacks Against Buildings. FEMA 386-7 provides a screening level assessment at the local or regional level, and FEMA 426 provides a detailed vulnerability risk assessment at the site or building level. Currently, the DHS is in the process of developing a national level methodology for human-caused hazards (similar to that used in HAZUSMH for natural disaster analysis). The human-caused vulnerability risk assessment provided in the following sections is a screening level analysis using default data from HAZUSMH and open source research and literature. (Source: FEMA Publication 386-7, p 2 –1)
Assess Risks
The first step in any risk assessment is to identify the hazards that affect your community or state. Most human-caused hazards fall into two general categories: terrorism (intentional acts) and technological hazards (accidental events). These two categories include the following hazards: Terrorism
• Conventional bomb
• Biological agent
• Chemical agent
• Nuclear bomb
• Radiological agent

VULNERABILITY ASSESSMENT HUMAN-CAUSED HAZARDS
FOR OFFICIAL USE ONLY Appendix F: Page 4
• Arson/incendiary attack
• Armed attack
• Cyberterrorism
• Agriterrorism
• Hazardous material release (intentional)
Technological hazards
• Industrial accident (fixed facility) • Industrial accident (transportation)
• Failure of Supervisory Control and Data Acquisition (SCADA) system or other critical infrastructure component
Within these various types of incidents, there are many variations, which illustrates one of the fundamental differences between natural and human-caused hazards. The types, frequencies, and locations of many natural hazards are identifiable and even, in some cases, predictable. They are governed by the laws of physics and nature. Malevolence, incompetence, carelessness, and other behaviors, on the other hand, are functions of the human mind and, while they can be assumed to exist, they cannot be forecast with any accuracy. There is, therefore, the potential for most, if not all, types of human-caused hazards to occur anywhere. In the area of hazard profiling, there are significant differences between natural and human-caused hazards, particularly those related to terrorism. Foremost among these is that terrorists have the ability to choose among targets and tactics, designing their attack to maximize the chances of achieving their objective. Similarly, accidents, system failures, and other mishaps are also largely unforeseeable. This makes it very difficult to identify how and where these hazards may occur. Notwithstanding the difficulty involved with predicting the occurrence of human-caused disasters, the various consequences of these disasters are generally familiar to the sectors of the emergency planning and response community that already specialize in them: injuries and deaths, contamination of and/or damage to buildings and systems, and the like. Numerous authoritative sources exist that can provide detailed information on the nature of all of these hazards; however, more important for the purposes of hazard mitigation than details about the various agents’ characteristics are the ways in which they can impact the built environment and what measures can be taken to reduce or eliminate the resulting damage. Whether intentional or accidental, human-caused disasters—as with natural disasters—involve the application of one or more modes of harmful force to the built environment.

VULNERABILITY ASSESSMENT HUMAN-CAUSED HAZARDS
FOR OFFICIAL USE ONLY Appendix F: Page 5
A full threat and event profile table can be found in FEMA Publication 426 on pages 1-17 through 1-21. This table provides a description of the application mode, duration, extent of effects (static/dynamic) and mitigating and exacerbating conditions of eleven categories of terrorism and technological hazards. As explained in FEMA Publication 386-7, “The vulnerabilities of a given facility, site, system, or other asset can be identified based on two distinct but complementary approaches. First, any given place in the built environment has a certain level of inherent vulnerability that exists independent of any protective or mitigation measures that are applied to it. For example, a football stadium is a setting where thousands of people gather, and a terrorist may find such a target very attractive in that many people would be hurt in an attack. An assessment of such inherent vulnerabilities must be conducted for each asset to determine its weaknesses. Second, the security, design, and other mitigation tools used to protect a place determine its tactical vulnerability.”
Inherent Vulnerability The planning team can assess the inherent vulnerability of each asset based on:
• Visibility: How aware is the public of the existence of the facility, site, system, or location?
• Utility: How valuable might the place be in meeting the objective(s) of a potential terrorist or saboteur?
• Accessibility: How accessible is the place to the public?
• Asset mobility: Is the asset's location fixed or mobile? If mobile, how often is it moved, relocated, or repositioned?
• Presence of hazardous materials: Are flammable, explosive, biological, chemical, and/or radiological materials present on site?
• Potential for collateral damage: What are the potential consequences for the surrounding area if the asset is attacked or damaged?
• Occupancy: What is the potential for mass casualties based on the maximum number of individuals on site at a given time?
Tactical Vulnerability The following list will help the planning team assess the tactical vulnerability of the assets in the community. The tactical vulnerability of each asset is based on: Site Perimeter
• Site Planning and Landscape Design: Is the facility designed with security in mind—both site-specific and with regard to adjacent land uses?
• Parking Security: Are vehicle access and parking managed in a way that separates vehicles and structures?
Building Envelope
• Structural Engineering: Is the building’s envelope designed to be blast-resistant? Does it provide collective protection against chemical, biological, and radiological contaminants?

VULNERABILITY ASSESSMENT HUMAN-CAUSED HAZARDS
FOR OFFICIAL USE ONLY Appendix F: Page 6
Facility Interior • Architectural and Interior Space Planning: Does security screening cover all public and
private areas? Are public and private activities separated? Are critical building systems and activities separated?
• Mechanical Engineering: Are utilities and HVAC systems protected and/or backed up with redundant systems?
Establish Mitigation Priorities
For the purpose of developing a realistic prioritization of human caused hazard mitigation projects, three elements should be considered in concert: the relative importance of the various facilities and systems in the asset inventory, the vulnerabilities of those facilities, and the threats that are known to exist.
Asset criticality The first element, asset criticality, is a measure of the importance of the facility or system to the community. Considerations in determining asset criticality include:
• Is it an element of one of the eight critical infrastructures?
• Does it play a key role in your community’s government, economy, or culture?
• What are the consequences of destruction, failure, or loss of function of the asset in terms of fatalities and/or injuries, property losses, and economic impacts?
• What is the likelihood of cascading or subsequent consequences should the asset be destroyed or its function lost?
Vulnerability By identifying the most exploitable weaknesses of each asset, the planning team can identify vulnerabilities in greatest need of attention. This, in effect, gives the planning team a criterion to use in establishing mitigation priorities so that the community can focus its efforts on addressing the most critical issues.
Threat The last element, threat, is fundamental to the prioritization process but very difficult to quantify. It answers the question “what must we mitigate against?” The frequency of a hazard’s occurrence is an important factor in establishing mitigation priorities, but unfortunately it is impossible to determine with any precision in the case of terrorism (for technological hazards, “threat” can be interpreted to mean the likelihood of some type of human-induced unintentional event). Instead of being influenced by predictable, quantifiable natural forces, terrorism—and to some degree, other technological hazards—is the result of human behavior that often lies outside conventional ideals of appropriateness and rationality and is thus difficult to predict. The most useful application of threat information for mitigation planning purposes, then, will be as a guide to the types of incidents that are relatively most likely to occur. As stated in FEMA Publication 386-7: “The Facility Inherent Vulnerability Assessment Matrix (Figure AF-1) provides a way to record how vulnerable each asset is and enables the planning team to compare how vulnerable the assets are relative to each other. Each asset or facility is evaluated using the matrix below. The appropriate point value for each criterion based on the description in each row is selected, then point values added to get the total for each asset. The vulnerability matrix compares the total scores for all assets ranked in relation to one another for each asset identified.”

VULNERABILITY ASSESSMENT HUMAN-CAUSED HAZARDS
FOR OFFICIAL USE ONLY Appendix F: Page 7
Figure AF-1 Facility Inherent Vulnerability Assessment Matrix
Source: FEMA Publication 386-7
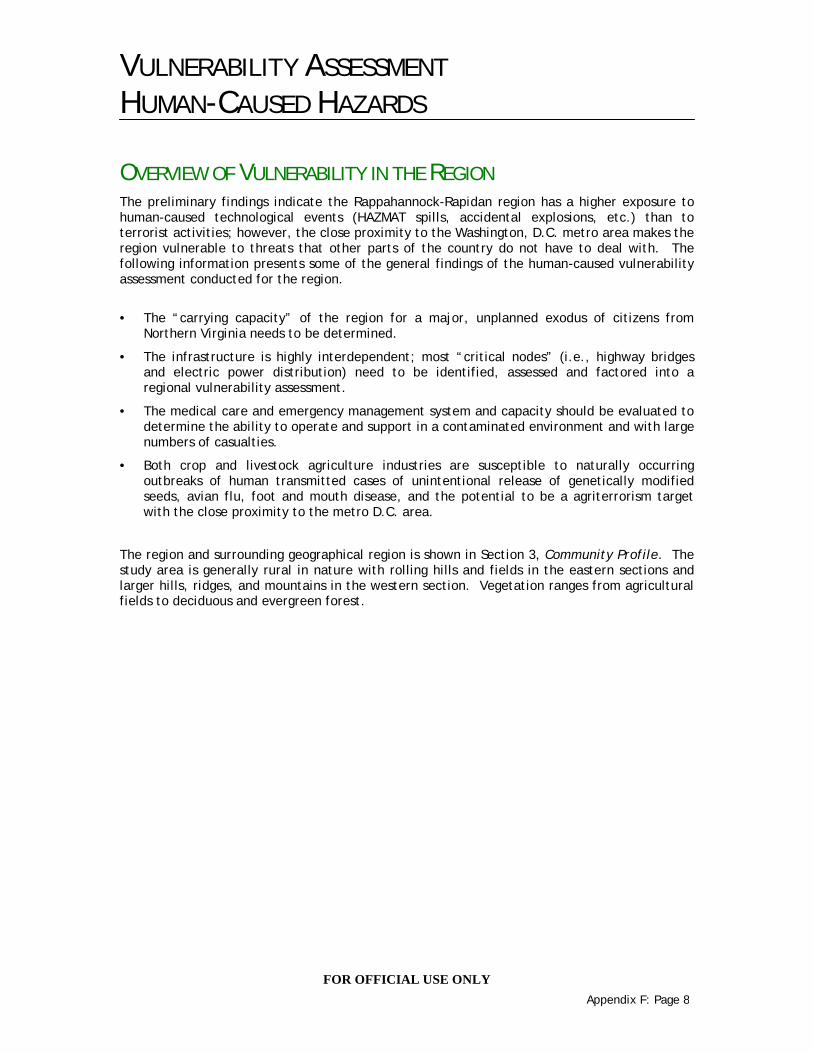
VULNERABILITY ASSESSMENT HUMAN-CAUSED HAZARDS
FOR OFFICIAL USE ONLY Appendix F: Page 8
OVERVIEW OF VULNERABILITY IN THE REGION
The preliminary findings indicate the Rappahannock-Rapidan region has a higher exposure to human-caused technological events (HAZMAT spills, accidental explosions, etc.) than to terrorist activities; however, the close proximity to the Washington, D.C. metro area makes the region vulnerable to threats that other parts of the country do not have to deal with. The following information presents some of the general findings of the human-caused vulnerability assessment conducted for the region.
• The “carrying capacity” of the region for a major, unplanned exodus of citizens from Northern Virginia needs to be determined.
• The infrastructure is highly interdependent; most “critical nodes” (i.e., highway bridges and electric power distribution) need to be identified, assessed and factored into a regional vulnerability assessment.
• The medical care and emergency management system and capacity should be evaluated to determine the ability to operate and support in a contaminated environment and with large numbers of casualties.
• Both crop and livestock agriculture industries are susceptible to naturally occurring outbreaks of human transmitted cases of unintentional release of genetically modified seeds, avian flu, foot and mouth disease, and the potential to be a agriterrorism target with the close proximity to the metro D.C. area.
The region and surrounding geographical region is shown in Section 3, Community Profile. The study area is generally rural in nature with rolling hills and fields in the eastern sections and larger hills, ridges, and mountains in the western section. Vegetation ranges from agricultural fields to deciduous and evergreen forest.

VULNERABILITY ASSESSMENT HUMAN-CAUSED HAZARDS
FOR OFFICIAL USE ONLY Appendix F: Page 9
Figure AF-2 Rappahannock-Rapidan Region
Source: Rappahannock-Rapidan Regional Commission The rivers that give the Rappahannock-Rapidan Regional Commission (Planning District Number 9) its name also serve as boundaries for its five counties. The Rappahannock River separates Fauquier County from Culpeper and Rappahannock counties, and the Rapidan runs between Orange County and Culpeper and Madison counties. Both rivers originate in the Blue Ridge Mountains at the district's western edge and flow through rolling Piedmont terrain to their confluence at the eastern tip of Culpeper County, twelve miles from Fredericksburg. Altitudes in this district range from 4,000 feet in the mountains of the Shenandoah National Park to about 250 to 600 feet in the Piedmont Plateau.
Located between two growing metropolitan areas, Washington and Charlottesville, the region remains predominantly rural, with one of the lowest population densities in the state. Although it lacks a major population center, the development of the Virginia suburbs of Washington, D.C. exerts a strong influence on the entire area. The town of Warrenton, in

VULNERABILITY ASSESSMENT HUMAN-CAUSED HAZARDS
FOR OFFICIAL USE ONLY Appendix F: Page 10
Fauquier County, is less than 50 miles from downtown Washington, D.C. and still closer to points in Northern Virginia. Fauquier and Culpeper counties are included in the Washington, D.C.—Maryland-Virginia-West Virginia Metropolitan Statistical Area (MSA).
Overview of Critical Facilities and Infrastructure
An important element to consider when developing a hazard mitigation plan is critical infrastructure and facilities. These infrastructures and facilities are crucial during times of disaster and it is important for communities to plan for their protection. For this project, the critical facilities that were analyzed were taken from the default data included in the HAZUSMH software. This data was double checked for accuracy with local officials from all participating counties and jurisdictions. For the human-caused vulnerability analysis, the critical infrastructure and facilities were grouped into the following categories:
• Transportation
• High Potential Loss
• Essential
• Utility Systems
To supplement the default information found in HAZUSMH, local emergency management officials were asked to fill out a survey tool to collect information on the various equipment, staffing, training and capability of the local emergency management offices to deal with a human caused hazard event.
TRANSPORTATION
Critical transportation is defined as highway (bridges, tunnels, segments), railway (bridges, tunnels, segments, facilities), light rail (bridges, tunnels, segments, facilities), bus, port, ferry and airport (facilities, runways) facilities and infrastructure. Transportation in the region reflects its connection to the Washington area. Interstate 66 passes east/west through Fauquier County between the Shenandoah Valley and Washington. A major highway, U.S. 29, leads north from Charlottesville through the towns of Madison, Culpeper and Warrenton before winding east through Prince William, Fairfax and Arlington counties. Passenger rail service is available in Culpeper for travel north to New York City and south to New Orleans. The nearest major air service is Washington's Dulles International Airport, in Loudoun County. However, the Charlottesville-Albemarle Airport in Albemarle County is less than ten miles from the southwestern border of the district.

VULNERABILITY ASSESSMENT HUMAN-CAUSED HAZARDS
FOR OFFICIAL USE ONLY Appendix F: Page 11
Figure AF-3 Regional Transportation
Source: Rappahannock-Rapidan Regional Commission

VULNERABILITY ASSESSMENT HUMAN-CAUSED HAZARDS
FOR OFFICIAL USE ONLY Appendix F: Page 12
Figure AF-4 Alternate Transportation Modes
Source: Rappahannock-Rapidan Regional Commission

VULNERABILITY ASSESSMENT HUMAN-CAUSED HAZARDS
FOR OFFICIAL USE ONLY Appendix F: Page 13
Table AF-1 Critical Transportation Facilities and Infrastructure in the Rappahannock-Rapidan Region
(Air and Rail)
County Jurisdiction Facility Name Facility Type
Culpeper Culpeper Culpeper Amtrak Station Passenger Rail Culpeper Culpeper Culpeper Regional Airport Fauquier Warrenton Warrenton-Fauquier Airport Orange Gordonsville Gordonsville Municipal Airport Orange Orange Orange County Airport Airport
Source: HAZUSMH
HIGH POTENTIAL LOSS FACILITIES
High potential loss facilities listed in HAZUSMH are defined as dams and levees, nuclear power production and military installation facilities and infrastructure. The dams included in the HAZUSMH default data have been mapped in the Hazard Analysis Section of this Plan (Figure 5.19). There are no nuclear power production facilities within the boundaries of the Region, although the North Anna nuclear power facility located in Louisa County is located close enough to be considered a risk to the region. A small portion of Quantico Marine Base is located in Fauquier County. That is the only military installation facility and/or infrastructure in the region.
ESSENTIAL FACILITIES
Essential facilities are defined as medical care, emergency response, and school facilities and infrastructure. Table AF-2 shows essential facilities in the region by county and jurisdiction. Figure 6-6 (located in the Vulnerability Assessment section) shows the locations of the essential facilities identified in the HAZUSMH default inventory.
Table AF-2 Critical Essential Facilities and Infrastructure in the Rappahannock-Rapidan Region
(HAZUSMH Inventory and Local Input)
County Location Facility Name Facility Type
Culpeper Brandy Station Brandy Volunteer Fire Dept Fire Station Culpeper Culpeper Reva Volunteer Fire & Rescue Fire Station Culpeper Culpeper Culpeper Regional Hospital Hospital Culpeper Culpeper Culpeper County Sheriff's Office Police Station Culpeper Culpeper Culpeper Police Dept Police Station Culpeper Culpeper St. Luke’s Lutheran School School Culpeper Culpeper Culpeper Christian School School Culpeper Culpeper Epiphany Catholic School School

VULNERABILITY ASSESSMENT HUMAN-CAUSED HAZARDS
FOR OFFICIAL USE ONLY Appendix F: Page 14
County Location Facility Name Facility Type
Culpeper Culpeper G.W. Carver-Pied. Tec Ed Center School Culpeper Culpeper Central VA Regional Program School Culpeper Culpeper A. G. Richardson Elementary School Culpeper Culpeper Culpeper County High School Culpeper Culpeper Culpeper County Middle School Culpeper Culpeper Farmington Elementary School Culpeper Culpeper Pearl Sample Elementary School Culpeper Culpeper Sycamore Park Elementary School Culpeper Culpeper Emerald Hill Elementary School Culpeper Lignum Alice C Tyler Village of Children School Fauquier Warrenton Sunrise Assisted Living Assisted Living Fauquier Fauquier Community Child Care
(9 facilities) Daycare
Fauquier Jack and Jill Daycare Fauquier Maplewood Childcare Center Daycare Fauquier Southern Fauquier Child
Development Daycare
Fauquier Bealeton Walnut Grove Childcare Facility Daycare Fauquier New Baltimore Walnut Grove Childcare Facility Daycare Fauquier Opal Walnut Grove Childcare Facility Daycare Fauquier Warrenton Warrenton Baptist Tiny Tot Care
Center Daycare
Fauquier Broad Run New Baltimore VFC and Rescue Fire Department Fauquier Catlett Cedar Run Volunteer Rescue
Squad Fire Department
Fauquier Catlett Catlett VFC Fire Department Fauquier Marshall Marshall VFC Fire Department Fauquier Marshall Marshall Vol. Rescue Squad Fire Department Fauquier Remington Remington VFC and Rescue Fire Department Fauquier The Plains The Plains VFC and Rescue Fire Department Fauquier Upperville Upperville VFC Fire Department Fauquier Warrenton Warrenton VFC Fire Department Fauquier Warrenton Warrenton Vol. Rescue Squad Fire Department Fauquier Bealeton Lois Volunteer Fire Dept Fire Station Fauquier Goldvein Goldvein Volunteer Fire Dept Fire Station Fauquier Orlean Orlean Volunteer Fire Dept Fire Station Fauquier Fauquier County Garage Fuel Site Fauquier Morgan Oil Fuel Site Fauquier Warrenton Adult Detention Facility Government Building Fauquier Warrenton Fauquier County Courthouse Government Building

VULNERABILITY ASSESSMENT HUMAN-CAUSED HAZARDS
FOR OFFICIAL USE ONLY Appendix F: Page 15
County Location Facility Name Facility Type
Fauquier Warrenton Fauquier County Schools and Government Building
Government Building
Fauquier Warrenton Parks and Recreation Gym (High Priority Shelter)
Government Building
Fauquier Warrenton Warrenton-Fauquier Joint Communications Center
Government Building
Fauquier Warrenton Fauquier Hospital Hospital Fauquier Oak Springs Nursing Home Nursing Home Fauquier Overlook Nursing Home Nursing Home Fauquier Marshall Marshall Manor Nursing Home Nursing Home Fauquier Warrenton Warrenton Police Police Station Fauquier Warrenton Fauquier County Sheriff's
Department, Detention Center, Criminal Court, Criminal Investigation
Police Station
Fauquier Auburn Middle School School Fauquier Southeastern Alternative School School Fauquier Bealeton Cedar Lee Middle School Fauquier Bealeton Liberty High School Fauquier Bealeton Mary Walter Elementary School Fauquier Bealeton Grace Miller Elementary School Fauquier Catlett H. M. Pearson Elementary School Fauquier Marshall Marshall Middle School Fauquier Marshall Northwestern Elementary School Fauquier Marshall W. G. Coleman Elementary School Fauquier Marshall Claude Thompson Elementary School Fauquier Midland Midland Christian Academy School Fauquier Midland Alternative Education Center School Fauquier New Baltimore C. Hunter Ritchie Elementary School Fauquier Remington Cornerstone Christian Academy School Fauquier Remington Margaret M. Pierce Elementary School Fauquier Remington M.M. Pierce Elementary School Fauquier The Plains Wakefield School School Fauquier Warrenton C. M. Bradley Elementary School Fauquier Warrenton Central Elementary School Fauquier Warrenton Fauquier High School Fauquier Warrenton P. B. Smith Elementary School Fauquier Warrenton W. C. Taylor Middle School Fauquier Warrenton Warrenton Middle School Fauquier Warrenton Brumfield Elementary School Fauquier Waste Water Plant Waste Water Plant

VULNERABILITY ASSESSMENT HUMAN-CAUSED HAZARDS
FOR OFFICIAL USE ONLY Appendix F: Page 16
County Location Facility Name Facility Type
Fauquier Marshall Marshall Water Plant Water Treatment Plant
Fauquier Remington Remington Water Plant Water Treatment Plant
Fauquier Vint Hill Vint Hill Water Plant Water Treatment Plant
Fauquier Warrenton Warrenton Water Treatment Plant
Water Treatment Plant
Madison Madison The Nest Day Care Day Care Madison Madison Rainbow Preschool Day Care Madison Aroda Mountain View Nursing Home Nursing Home Madison Brightwood Morgan’s Nursing Home Nursing Home Madison Madison Autumn Care of Madison Nursing Home Madison Madison Sevenoaks Pathwork Center Nursing Home Madison Madison Madison County Sheriff's Office Police Station Madison Aroda Oak Grove Menonite School School Madison Criglersville Criglersville Elementary School Madison Madison Madison County High School Madison Madison Madison Primary School Madison Madison Waverly Yowell Elementary School Madison Madison William H. Wetsel Middle School Madison Madison Apple Tree Academy School Madison Madison Skyline CAP School Madison Woodberry
Forest Woodberry Forest School School
Orange Barboursville Barboursville Volunteer Fire Fire Station Orange Locust Grove Lake-Woods Fire & Rescue Fire Station Orange Rapidan Rapidan Volunteer Fire Dept Fire Station Orange Gordonsville Gordonsville Police Dept Police Station Orange Orange Orange County Sheriff's Office Police Station Orange Orange Orange Police Police Station Orange Gordon-Barbour Elementary School School Orange Locust Grove Locust Grove Middle School School Orange Locust Grove Locust Grove Elementary School Orange Orange Grimes Memorial School School Orange Orange Orange County High School Orange Orange Orange Elementary School Orange Orange Prospect Heights Middle School Orange Unionville Faith Christian Academy School Orange Unionville Lightfoot Elementary School Orange Unionville Unionville Elementary School

VULNERABILITY ASSESSMENT HUMAN-CAUSED HAZARDS
FOR OFFICIAL USE ONLY Appendix F: Page 17
County Location Facility Name Facility Type
Orange Gordonsville Gordonsville VFC Volunteer Fire Station Orange Mine Run Mine Run VFC Volunteer Fire Station Orange Orange Orange VFC Volunteer Fire Station Rappahannock Rappahannock County Co-Op Co-Op Rappahannock Child Care and Learning Center Day Care Rappahannock Washington Rappahannock Office of
Emergency Management Emergency Management Office
Rappahannock Amissville Co 3 Fire and Rescue Fire Department Rappahannock Castleton Co 5 Fire and Rescue Fire Department Rappahannock Chester Gap Co 9 Fire and Rescue Fire Department Rappahannock Sperryville Co 2 Fire and Rescue Fire Department Rappahannock Sperryville Co 7 Fire and Rescue Fire Department Rappahannock Washington Co 1 Fire and Rescue Fire Department Rappahannock Flint Hill Flint Hill Volunteers Fire Fire Station Rappahannock Washington Sheriff's Office Police Station Rappahannock Castleton Massanova Christian Academy School Rappahannock Flint Hill Wakefield Country Day School School Rappahannock Sperryville Hearthstone School School Rappahannock Washington Rappahannock County High School Rappahannock Washington Rappahannock Elementary School
Source: HAZUSMH
There are two other essential facilities in the region that need to be mentioned in this Plan as they are potential targets. They are the TRACON (Terminal Radar Approach Control) facility in Fauquier County and the SWIFT (Society for Worldwide Financial Telecommunication) facility in Culpeper County. The TRACON facility provides radar air traffic control services to aircraft flying into and out of the Baltimore/Washington area. The primary function of the TRACON is to provide a variety of air traffic control services to arrival, departure, and transient aircraft within its assigned airspace. These services include aircraft separation, in-flight traffic advisories and navigational assistance. The facility located at Vint Hill Farms in Fauquier County, Virginia, serves as the primary control services facility for the four major airports in the Washington, D.C./Baltimore area. The SWIFT facility in Culpeper County serves as the U.S. hub for electronic banking activities transferring foreign exchange deposits and loans. It connects 3,049 banks and securities industry members and handles an average of 1.1 million messages per day.

VULNERABILITY ASSESSMENT HUMAN-CAUSED HAZARDS
FOR OFFICIAL USE ONLY Appendix F: Page 18
UTILITY SYSTEMS
Utility systems are defined as potable water, wastewater, oil system, natural gas, electric power and communications facilities and infrastructure. Figure AF-5 shows the utility systems in the region. Table AF-3 lists the utility system facilities in the region as they are found in HAZUSMH.
Table AF-3 Critical Utility Systems and Infrastructure in the Rappahannock-Rapidan Region
(HAZUSMH Inventory)
County Location Facility Name Facility Type
Culpeper Mitchells Coffeewood Correctional Center
Potable Water System Facilities
Culpeper Culpeper SWIFT Facility Private Worldwide Electronic Banking Facility
Culpeper Culpeper WCVA 1490 Radio Station Culpeper Culpeper WCUL CH 276 Radio Station Culpeper Culpeper WPER CH 210 Radio Station Culpeper Culpeper WARN CH 218 Radio Station Culpeper Brandy Station Mount Dumplin STP Waste Water Treatment Facility Culpeper Culpeper Culpeper Water Pollution
Control Facility Waste Water Treatment Facility
Culpeper Culpeper Eheart Subdivision Waste Water Treatment Facility Culpeper Culpeper Ferguson STP Waste Water Treatment Facility Culpeper Elkwood Elkwood Wastewater
Treatment Plant Waste Water Treatment Facility
Culpeper Jeffersonton River Ridge Utility Company
Waste Water Treatment Facility
Culpeper Jeffersonton South Wales Utility STP Waste Water Treatment Facility Fauquier Warrenton Advanced Wastewater
Treatment Plant Potable Water System Facilities
Fauquier Warrenton WPRZ 1250 Radio Station Fauquier Warrenton WKCW 1420 Radio Station Fauquier Fauquier
County Marshall WWT Fauquier County
Waste Water Treatment Facility
Fauquier Remington Remington Regional Wastewater
Waste Water Treatment Facility
Fauquier Warrenton Advanced Wastewater Treatment Plant
Waste Water Treatment Facility
Fauquier Warrenton Fauquier Water Sewer Authority
Waste Water Treatment Facility
Fauquier Warrenton Vint Hill Farms Station Waste Water Treatment Facility

VULNERABILITY ASSESSMENT HUMAN-CAUSED HAZARDS
FOR OFFICIAL USE ONLY Appendix F: Page 19
County Location Facility Name Facility Type
Madison Madison Madison WTP-Rapidan Service Authority
Potable Water System Facilities
Madison Madison Rapidan Service Authority Madison
Waste Water Treatment Facility
Orange Gordonsville Gordonsville Energy LP Electric Power Facility Orange Unionville Transcontinental Gas
Pipeline Corporation Natural Gas Facility
Orange Orange Stanley Petroleum Products
Oil Pipeline Facility
Orange Orange Town of Orange Water Treatment Plant
Potable Water System Facilities
Orange Orange WVCV 1340 Radio Station Orange Orange WJMA-FM CH 255 Radio Station Orange Gordonsville Liberty Fabrics Waste Water Treatment Facility Orange Locust Grove Wilderness Shores STP Waste Water Treatment Facility Orange Orange Locust Grove Elementary
School Waste Water Treatment Facility
Orange Orange Town of Orange Sewage Waste Water Treatment Facility Rappahannock Washington Town of Washington WTP Potable Water System Facilities Warrenton Warrenton WTOP-FM CH 299 Radio Station Warrenton Warrenton WBPS-FM CH 232 Radio Station
Source: HAZUSMH

VULNERABILITY ASSESSMENT HUMAN-CAUSED HAZARDS
FOR OFFICIAL USE ONLY Appendix F: Page 20
TERRORISM The terrorism analysis focused on the primary chemical, biological, radiologic, nuclear and explosives (CBRNE) threats and used the FEMA 386-7 and 426 Reference Manual methodologies to determine the highest potential targets in the region. A common method to evaluate terrorist threats is to analyze five factors: existence, capability, history, intention, and targeting. These five factors are defined in FEMA Publication 426 as:
• Existence addresses the questions: Who is hostile to the assets, organization, or community of concern? Are they present or thought to be present? Are they able to enter the country or are they readily identifiable in a local community upon arrival?
• Capability addresses the questions: What weapons have been used in carrying out past attacks? Do the aggressors need to bring them into the area or are they available locally?
• History addresses the questions: What has the potential threat element done in the past and how many times? When was the most recent incident and where, and against what target? What tactics did they use? Are they supported by another group or individuals? How did they acquire their demonstrated capability?
• Intention addresses the questions: What does the potential threat element or aggressor hope to achieve? How do we know this (i.e., published in books or news accounts, speeches, letters to the editor, informant)?
• Targeting addresses the questions: Do we know if an aggressor (we may not know which specific one) is performing surveillance on our building, nearby buildings, or buildings that have much in common with our organization? Is this information current and credible, and indicative of preparations for terrorist operations (manmade hazards)? The threat/hazard analysis for any building can range from a general threat/hazard scenario to a very detailed examination of specific groups, individuals, and tactics that the building may need to be designed to repel or defend against.
Figure AF-1, found on page 8 of this appendix, shows the methodology that was used to develop the region’s risk screening matrix. Table AF-4 is a completed risk screening matrix for the region. The data used for this analysis was taken from the HAZUSMH default database for the region. The seven criteria used for this analysis (asset visibility, target value to potential threat, asset accessibility, asset mobility, target threat of CBR hazard, collateral damage potential and site population/capacity) were given a score of 1-5 for each potential target category based on the qualifying characteristics for each of those criteria as listed in Figure AF-1. The sums of those scores were then multiplied by values assigned for asset value of target site (ranked on a scale of 1-5), homeland security threat level (for this analysis, it was assumed that the threat level would be “orange” whose value is 6 on a scale of 2-8) to determine the overall inherent vulnerability score. The higher the overall total of the inherent vulnerability score, the higher the target potential for each element.

VULNERABILITY ASSESSMENT HUMAN-CAUSED HAZARDS
FOR OFFICIAL USE ONLY Appendix F: Page 21
Table AF-4 Rappahannock-Rapidan Region Risk Screening Matrix (HAZUSMH)
A
sset
Vis
ibili
ty
Targ
et V
alue
to
Pote
ntia
l Thr
eat
Ass
et A
cces
sabi
lity
Ass
et M
obili
ty
Targ
et T
hrea
t of
CBR
Haz
ard
Colla
tera
l Dam
age
Pote
ntia
l
Site
Pop
ulat
ion/
Capa
city
SUM
Ass
et V
alue
of
Targ
et S
ite
Hom
elan
d Se
curi
ty T
hrea
t (O
rang
e)
Inhe
rent
Vul
nera
bilit
y
Culp
eper
Fauq
uier
Mad
ison
Ora
nge
Rapp
ahan
nock
Approx. Number of Facilities
Transportation Facilities
Highway Segments 5 5 5 5 3 4 5 32 X 4 X 6 = 768 24 63 10 28 23
Highway Bridges 5 4 5 5 0 2 1 22 X 4 X 6 = 528 : 72 176 52 49 83
Highway Tunnels NA NA NA NA NA NA NA NA NA NA NA NA NA NA NA NA
Railway Segments 5 5 4 5 3 4 5 31 X 4 X 6 = 744 9 9 0 17 0
Light Rail NA NA NA NA NA NA NA NA NA NA NA
Buses NA NA NA NA NA NA NA NA NA NA NA
Ferrys NA NA NA NA NA NA NA NA NA NA NA
Ports NA NA NA NA NA NA NA NA NA NA NA
Airports 4 4 3 5 0 1 2 19 X 4 X 6 = 456 : 6 17 1 5 1
High Potential Loss Facilities
Military Installations 3 5 3 5 1 3 1 21 X 0 X 6 = 0 : 0 1 0 0 0
Dams & Levees 4 5 2 5 1 4 1 22 X 5 X 6 = 660 : 19 45 14 11 6
Nuclear Power 5 5 5 5 2 3 1 26 X 3 X 6 = 396 : 0 0 0 0 0
Essential Facilities
Medical Care 4 3 4 5 4 2 2 24 X 5 X 6 = 780 : 1 1 0 0 0
Emergency Response 2 4 1 5 4 3 3 22 X 5 X 6 = 720 : 5 19 1 9 9
Schools 4 4 4 5 1 1 2 21 X 3 X 6 = 396 : 14 20 5 9 3
Utility System Facilities
Potable Water 3 2 3 5 2 3 1 19 X 3 X 6 = 396 : 1 1 1 1 1
Waste Water 3 2 3 5 1 2 1 17 X 2 X 6 = 204 : 5 6 1 6 0
Oil Systems 3 2 3 5 2 3 1 19 X 3 X 6 = 396 : 0 0 0 1 0
Natural Gas 3 2 3 5 1 2 1 17 X 2 X 6 = 204 : 0 0 0 1 0
Electric Power 3 2 3 5 2 3 1 19 X 3 X 6 = 396 : 1 0 0 1 0
Communications 3 2 3 5 1 2 1 17 X 2 X 6 = 204 : 2 6 0 3 0 Source: HAZUSMH and PBS&J Analysis

VULNERABILITY ASSESSMENT HUMAN-CAUSED HAZARDS
FOR OFFICIAL USE ONLY Appendix F: Page 22
The risk-screening matrix was used to examine specific manmade threats in more detail and provided in the following sections. For terrorist attack, three elements are used to describe a buildings or assets ability to withstand the attack, response and recovery:
• Design Basis Threat
• Level of Protection
• Layers of Defense
The Design Basis Threat for the CBR analysis considered the use of HAZMATs, Sarin, Anthrax, Ricin, and Smallpox and the blast analysis considered car bomb and truck bomb size weapons. For most state and local government buildings, the GSA Interagency Security Committee Criteria provide reasonable guidelines to determine a Level of Protection. Layers of defense are used to detect, deny, delay/deter, and devalue the aggressor against the intended target. Specific buildings and critical infrastructure should have detailed building vulnerability assessments conducted. Figure AF-6 provides an example of layers of defense.
Figure AF-6
Example of Layers of Defense
Source: FEMA E155 Building Security Course
The analysis considers the combination of the terrorist threat, tactics, weapons, site and building parameters, Level of Protection and Layers of Defense to evaluate the potential vulnerabilities in a qualitative method. FEMA Publication 426 has a more rigorous analysis for a specific building risk assessment and is beyond the scope of this effort. The following pages are taken from FEMA Publication 426 Table 2-1 and provide a correlation of mitigation measures to threats.

VULNERABILITY ASSESSMENT HUMAN-CAUSED HAZARDS
FOR OFFICIAL USE ONLY Appendix F: Page 23
Figure AF-7 Correlation of Mitigation Measures To Threats (From FEMA 426)

VULNERABILITY ASSESSMENT HUMAN-CAUSED HAZARDS
FOR OFFICIAL USE ONLY Appendix F: Page 24

VULNERABILITY ASSESSMENT HUMAN-CAUSED HAZARDS
FOR OFFICIAL USE ONLY Appendix F: Page 25

VULNERABILITY ASSESSMENT HUMAN-CAUSED HAZARDS
FOR OFFICIAL USE ONLY Appendix F: Page 26

VULNERABILITY ASSESSMENT HUMAN-CAUSED HAZARDS
FOR OFFICIAL USE ONLY Appendix F: Page 27

VULNERABILITY ASSESSMENT HUMAN-CAUSED HAZARDS
FOR OFFICIAL USE ONLY Appendix F: Page 28
Chemical, Biological or Radiological (CBR) Attack
Due to the low population density of the region and minimal number of large public gathering places, the CBR threats are considered to be predominantly HAZMAT materials that can generate plumes and spills of sufficient quantity to impact a significant number of people. However, facilities in the region that may be exposed to Anthrax and Ricin include post office, government, media, and other public spaces. Smallpox would likely be a result of a mass metro area D.C. contamination and flight of the population through the region’s geographic area. A terrorist attack using CBR agents will typically target population centers with low dispersion, low winds, and low humidity to maximize effects of the agent. A CBR attack could cause significant damage on a scale from city blocks to square miles and casualties range from several to several thousand. It is assumed that a strategic or tactical nuclear exchange would not be targeted directly at the localities in the Rappahannock-Rapidan Region and is an extremely low likelihood event, but the effects of a high yield nuclear detonation would be catastrophic on the region. The use of a “Dirty Bomb,” in the region is assumed to be a more likely radiological attack and is further detailed in the Radiological Event section. For the purposes of the CBR analysis HAZMAT materials are not included in this section but are discussed later. The CBR agents of concern include Sarin (nerve gas), Anthrax, Ricin, Small Pox, and high level, low quantity radiation sources (i.e., Cessium 137) used as a dirty bomb. These agents would likely be used in primary public gathering locations with intent to inflict both human casualties, property damage and cause economic damage. Key to defense of this attack is a response and recovery capability with sufficient training and supplies to decontaminate, triage, and evacuate patients to higher order medical care. Multiple jurisdictions and assets may be involved for an extended period of time.
Table AF-5 Potential Impacts of a CBR Event (HAZUSMH Inventory and Local Input)
Facility/Event Primary CBR Agent
Post Office Ricin, Anthrax Malls Sarin, Small Pox Medical Care Facilities Sarin, Small Pox Emergency Response Sarin, Small Pox High Schools Sarin, Small Pox Community College Sarin, Anthrax, Small Pox, Ricin Central Business Districts Sarin, Anthrax, Small Pox, Ricin Commercial, Iconic, State and Federal Facilities Sarin, Anthrax, Small Pox, Ricin
There may be little to no warning that a CBR attack has occurred. Residents in the region should be aware of the following CBR indicators and report all incidents of suspected CBR attacks to local officials.

VULNERABILITY ASSESSMENT HUMAN-CAUSED HAZARDS
FOR OFFICIAL USE ONLY Appendix F: Page 29
Figure AF-8 Indicators That a CBR Attack Has Occurred
Source: FEMA E155 Building Security Course
Blast Attack The Rappahannock-Rapidan Region has a minimal number of potential primary target sites (government, telecommunications, energy, schools, iconic commercial properties, etc.) and most sites have a small resident employee population. Blast effects are typically limited to several city blocks. Key to defense of this attack is a response and recovery capability with sufficient training and supplies to extract, triage, and evacuate patients to higher order medical care. Multiple jurisdictions and assets may be involved for an extended period of time. The blast analysis used the methodology presented in FEMA Publication 426. The range to effects chart of weapon size (in TNT equivalent) was graphically overlaid onto imagery of the site.
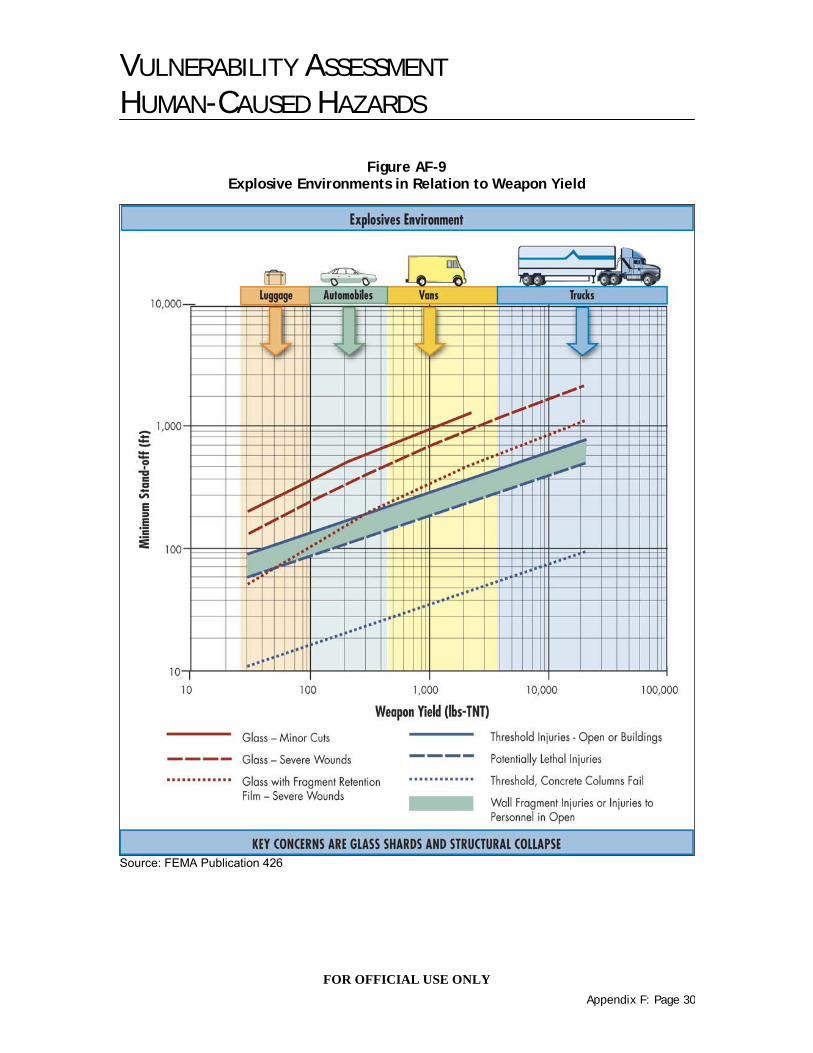
VULNERABILITY ASSESSMENT HUMAN-CAUSED HAZARDS
FOR OFFICIAL USE ONLY Appendix F: Page 30
Figure AF-9 Explosive Environments in Relation to Weapon Yield
Source: FEMA Publication 426

VULNERABILITY ASSESSMENT HUMAN-CAUSED HAZARDS
FOR OFFICIAL USE ONLY Appendix F: Page 31
For the blast analyses for the Towns of Culpeper, Madison, Orange, and Warrenton, the following assumptions were made:
• Small van with 800 lbs of TNT equivalent detonated at town center
• Casualties a function of time of day and extent of structural collapse
• Temporary loss of some functionality of key services likely to occur.
HAZUSMH was used to determine an estimate of the vulnerable populations and buildings located in the blast areas. The following figures provide an aerial overview of the towns of Culpeper, Madison, Orange and Warrenton.
Figure AF-11 2,000-Foot Blast Radius in Culpeper

VULNERABILITY ASSESSMENT HUMAN-CAUSED HAZARDS
FOR OFFICIAL USE ONLY Appendix F: Page 32
Figure AF-12 2,000-Foot Blast Radius in Madison
Figure AF-13
2,000-Foot Blast Radius in Orange

VULNERABILITY ASSESSMENT HUMAN-CAUSED HAZARDS
FOR OFFICIAL USE ONLY Appendix F: Page 33
Figure AF-14 2,000-Foot Blast Radius in Warrenton
Table AF-6 provides an estimate of the population and buildings within a 150-foot radius of the approximate center of the census block, not counting any buildings outside of the 150-foot radius, which potentially may still be impacted by flying debris. HAZUS does not count government employees in the area, so estimates from local sources were used to determine the total number of government employees vulnerable in each jurisdiction. These estimates are presented in bulleted format following Table AF-6 and Table AF-7.

VULNERABILITY ASSESSMENT HUMAN-CAUSED HAZARDS
FOR OFFICIAL USE ONLY Appendix F: Page 34
Table AF-6 Blast Analyses
Vulnerable Population and Exposure in Downtowns (150-Foot Radius—HAZUSMH)
Town Number of Exposed Buildings
Value of Exposed Buildings
Population
Persons Working in Commercial or Industrial Occupancies
Culpeper 21 (57% commercial) $15,085,000 37—during day 69—at night 325
Madison 14 (100% commercial) $1,886,000 13—during day 30—at night
0
Orange 3 $490,000 2—during day 5—at night 15
Table AF-7 provides an estimate of the population and buildings within a 2,000-foot radius of approximate center of target census block, not counting any buildings outside of 2,000-foot radius, which potentially may still be impacted by flying debris.
Table AF-7
Blast Analyses Vulnerable Population and Exposure in Downtowns (2,000-Foot Radius—HAZUSMH
Town
)
Number of Exposed Buildings
Value of Exposed Buildings
Population
Persons Working in Commercial or Industrial Occupancies
Culpeper 460 (95% residential) $121,293,000 606—during day
1,337—at night 947
Madison 115 (99% residential) $23,490,000 115—during day
271—at night 90
Orange 346 (51% residential) $102,190,000 388—during day
884—at night 607
Regional Planning Commission Estimates of Government Employees
• Culpeper o Town of Culpeper—140 o Culpeper County—450
• Madison o Town of Madison—2 o Madison County—100
• Orange o Town of Orange—58 o Orange County—307
• Fauquier o Town of Warrenton—122 o Fauquier County—518

VULNERABILITY ASSESSMENT HUMAN-CAUSED HAZARDS
FOR OFFICIAL USE ONLY Appendix F: Page 35
As with any HAZUSMH use, these numbers are merely estimates based on the values in HAZUS that are derived from U.S. Census 2000 and Dunn and Bradstreet. The distribution of population (residents) shows that more residents are farther out from the target block, so this may impact the potential number of injuries. Of course, depending on the location of the source of the blast, the exposure numbers could change as the radius moves left or right.
The blast analysis illustrates the potential impact of a relatively small weapon that could be easily constructed using readily available materials (TNT, ANFO, detonation cord, oxygen tanks, fuel oils, and other explosives). The first responder’s response and recovery capability for a blast event is primarily dependent upon the ability of on-scene staff to conduct a visual structural analysis to determine the risk of victim extraction versus structural collapse. Statistically, every hour that victims remain trapped dramatically decreases the odds of survival.
Table AF-8 provides a detailed summary of the impact of a blast on the downtown area of the town of Warrenton. This analysis was performed using the methods prescribed in FEMA Publication 426. This analysis was also performed using HAZUSMH so it does not account for the estimated 122 Town staff members, most of which would also be effected by a blast in the downtown Warrenton area.
Table AF-8
Effects of a Blast in Downtown Warrenton (HAZUSMH)
Blast Analysis: 150-Foot Radius
Lethal Injuries Daytime: 10—75
Lethal Injuries Nighttime:
<10
Blast Analysis: 2,000-Foot Radius
Lethal Injuries Daytime:
10—100
Lethal Injuries Nighttime:
<25
Total Population Impacted: 200—400 Disruption/Loss of Functionality Hospital, Water, Electric Power, Emergency
Services, Emergency Shelter
All of the jurisdictions within the region have limited to moderate training and response capability to deal with a blast attack and recovery. Grants are available to jurisdictions that wish to improve their capability. Information on these grants can be found online at:
http://www.ojp.usdoj.gov/odp/grants_goals.htm

VULNERABILITY ASSESSMENT HUMAN-CAUSED HAZARDS
FOR OFFICIAL USE ONLY Appendix F: Page 36
HAZARDOUS MATERIALS (HAZMAT) The HAZMAT analysis determined that the Rappahannock-Rapidan Region is concerned with HAZMAT site storage and transit across the region and the potential for small to medium scale releases. The HAZMAT sites and primary transportation routes are shown in Figure AF-14. A potential HAZMAT spill can be mitigated in several ways to include containment, recovery, and/or volatilization and dispersion. Options to reduce the type and quantity of HAZMATS include rerouting of road and rail cargo to off-peak exposure times and through low-density population areas.
Table AF-9 Past Occurrences of HAZMAT Incidences
Jurisdiction HAZMAT Incident Impact
Culpeper County In the past 10 years, there have been twelve HAZMAT events—all but one involved petroleum products. The other event involved a chlorine leak and the Town of Culpeper’s water plant. A regional HAZMAT team from Fredricksburg responded.
No injuries associated with the 12 HAZMAT events. There have been two farming deaths as a result of manure pits.
Fauquier County Deal with petroleum spills regularly. Actual HAZMAT events have included a chlorine leak, ammonia leak, potassium chlorate and a few others.
No injuries or deaths. Costs were recovered.
Madison County In the past year, a gasoline tanker spilled 6,000 gallons of gas on Highway 29 and ammonium nitrate blasting truck wrecked on Highway 15.
None
Orange County There have been somewhere between 200-500 HAZMAT incidences in the past ten years. Most dealt with fuel spills.
None
Rappahannock County Several small spills including fuel from trucks and vehicles only.
None

VULNERABILITY ASSESSMENT HUMAN-CAUSED HAZARDS
FOR OFFICIAL USE ONLY Appendix F: Page 37
Table AF-10 lists the hazardous materials locations and the chemicals found at each facility. Table AF-11
Table AF-10 Hazardous Materials Locations in the Rappahannock-Rapidan Region
(Toxic Release Inventory)
County Location Name Chemicals Present
Fauquier Warrenton Quarles Petroleum Inc. Warrenton Bulk Pl
N-Hexane, Toluene, 1,2,4-Trimethylbenz , Xylene (Mixed Isomer), Methyl Tert-Butyl ET
Culpeper Culpeper Culpeper Wood Preservers Copper, chromium, arsenic Culpeper Culpeper Continental Teves Polychlorinated Alka Culpeper Culpeper Keller MFG. CO. INC. Xylene (Mixed Isomer) Culpeper Culpeper Rochester Corp. Copper Fauquier Midland Fiberglass ENG. CORP. Styrene Orange Gordonsville Von Holtzbrinck Publishing
Services Disocyanates
Table AF-11 Comprehensive Environmental Response, Compensation, and Liability Information
System (CERCLIS) Database
County Location Name
Culpeper Culpeper Culpeper Wood Preservers Culpeper Culpeper Singleton Drum Fauquier Delaplane Delaplane Landfill Fauquier Marshall Belvoir Station Site Fauquier Marshall Geris Well Site Fauquier Warrenton U.S. Training Center Site B Fauquier Warrenton Vint Hill Farm Station Fauquier Warrenton Warrenton PCE Site Madison Pratts Hawkins Body Shop
Source: Environmental Protection Agency

VULNERABILITY ASSESSMENT HUMAN-CAUSED HAZARDS
FOR OFFICIAL USE ONLY Appendix F: Page 38
Table AF-12 Hazardous Materials Sites Listed In County Emergency Operations Plans
County Location Name Fauquier Bealeton AmeriGas Propane Fauquier Bealeton Payne's Parking Designs Fauquier Catlett Catlett Storage Facility Fauquier Catlett Southern States Fauquier Marshall Marshall Farmers Co-Op Fauquier Marshall Marshall Wastewater Treatment Plant Fauquier Marshall Morgan Oil Company Fauquier Midland Ross Industries, Inc Fauquier New Baltimore Fast Aquatic Center Fauquier Remington Marsh Run Generation Project Fauquier Remington Remington Combustion Turbine Station Fauquier Remington Remington Farmer's Co-Op Fauquier Remington Remington Sewage Treatment Plant Fauquier Remington Trinity Packaging Corporation Fauquier Warrenton AmeriGas Propane Fauquier Warrenton Blackwell Water Filtration Plant Fauquier Warrenton Clark Brothers Gun Shop Fauquier Warrenton G.E.I. Fauquier Warrenton Payne Pools Fauquier Warrenton Quarles Energy Services Fauquier Warrenton Vint Hill Water and Sewage Facility Fauquier Warrenton Warrenton Farmer's Co-Op Fauquier Warrenton Warrenton Sewage Treatment Plant Fauquier Warrenton Warrenton Sewage Treatment Plant Madison Madison Allegheny Power Madison Madison Madison 7-11 Store Madison Madison Madison Amoco and McDonalds Madison Madison Madison Exxon Service Center Madison Madison Madison Sheetz Store #303 Madison Madison Madison Wood Preservers Madison Madison Orange-Madison Co-Op Madison Madison Rapidan Service Authority - Madison Wastewater Plant Madison Madison Rapidan Service Authority - Madison Water Plant Madison Madison Shelby Automotive and Tire Madison Madison Utz and Sheppard Distributors, Inc. Madison Madison VDOT Madison Area Headquarters Madison Madison Verizon Madison RSM (VA57078) Madison Radiant Triple D Sales Company, Inc. Madison Wolftown Wolftown Mercantile Country Store Madison Woodberry Forest Woodberry Forest School Orange Orange Madison Co-Op Rappahannock Rappahannock County Farmers Co-Op
Source: County Emergency Operations Plans

VULNERABILITY ASSESSMENT HUMAN-CAUSED HAZARDS
FOR OFFICIAL USE ONLY Appendix F: Page 39
RADIOLOGICAL EVENT Within the region’s geographical area, there are numerous sources of materials that could be used as weapons to include explosives, HAZMATs, and two nuclear energy plants (North Anna and Surry). On the major radiological event scale is the release of a large high-yield strategic ballistic missile or the use of a low to medium yield tactical weapon. While the probability of these types of weapons being used is considered very small, the consequence is very large. There are no known or obvious primary military or political targets located in the region, however, the close proximity to the Washington, D.C. metro area makes collateral damage a significant factor. In the event of the use of high energy weaponized radiological materials for an attack, the resources and capabilities of the federal government would be required to mitigate, respond and recover and is beyond the capability of this analysis. On the medium radiological event scale, in the geographical area, there are two Virginia nuclear sites; one in North Anna and one in Surry (http://www.dom.com/about/stations/nuclear/northanna/index.jsp). The primary concern from these facilities is radiation release from the Containment Structures and Spent Fuels Storage Pools, similar to the Three Mile Island accident.
North Anna, Dominion 's second nuclear station, generates 1,786 megawatts from its two units. Unit 1 began commercial operation on June, 1978 and Unit 2 followed in December, 1980.
North Anna is located in the thickly wooded hills of central Virginia sixty miles northwest of Richmond. The facility was named after the North Anna River, the river dammed to form the huge lake that supplies cooling water for the station.

VULNERABILITY ASSESSMENT HUMAN-CAUSED HAZARDS
FOR OFFICIAL USE ONLY Appendix F: Page 40
Figure AF.15 Emergency Assembly Centers for North Anna Facility
Source: State of Virginia On the low radiological event scale, the radiological analysis determined that within the region, there are a few low level source materials located primarily in medical facilities. The higher energy materials are generally well secured and components of X-Ray, CT and MRI equipment and therefore pose little to no risk of accidental release or loss. Anyone attempting to steal the materials to create an improvised radiological device or “Dirty Bomb” would have to penetrate medical security and have the tools and knowledge to disassemble the equipment to remove the source materials. There are low level medical wastes to include IV tracer fluids, implants, and other consumables, but these materials are not considered a primary source material of use as a weapon. A “Dirty Bomb” used in the region’s geographical area would

VULNERABILITY ASSESSMENT HUMAN-CAUSED HAZARDS
FOR OFFICIAL USE ONLY Appendix F: Page 41
result in limited physical damage (scale of buildings to city blocks), but have potentially significant remediation and long-term monitoring/surveillance costs. An emerging weapon that has the potential to impact the region is the Electromagnetic Pulse (EMP) grenade and artillery shell. These weapons generate an EMP that causes electronic components to become overloaded and short circuit. Depending upon the size of the weapon, distance from the detonation, shielding and type of circuitry and EMP hardening, the impact could be to a single building and equipment, or spread over an area of several city blocks.
Table AF-13 Radiological Sources in the Region
County Jurisdiction Radiological Source
Culpeper Culpeper Culpeper Regional Hospital Culpeper Culpeper Town of Culpeper Power Plant Fauquier Warrenton Fauquier Hospital Louisa Mineral North Anna Power Station Rappahannock Rappahannock Electric Coop.
ENERGY PIPELINE FAILURES As the war in Iraq and Afghanistan has shown, energy pipelines are extremely vulnerable to sabotage and disruption, and the resulting spills can generate large scale environmental damage and require extensive clean-up and remediation. Pipelines can be targeted and attacked with a variety of weapons and tactics; historical and current methods include high-powered rifles, explosives, heavy equipment destroying/disrupting the lines, mechanical and electrical system sabotage. Since many of the pipelines are located above ground or transit waterways or use bridges as transit support in remote areas, pipelines can be considered relatively vulnerable to intentional acts of destruction. The Department of Homeland Security identified the energy sector as one of the 14 primary Critical Infrastructures and pipelines in particular must be evaluated to determine the impact of loss or damage.
Table AF-14 Energy Pipelines in the Region
County Jurisdiction Facility/Equipment Failure Owner
Orange Unionville Gas Pipeline Columbia Gas Company of Virginia
Fauquier Throughout Natural gas pipelines Not provided
Madison Throughout Gas pipeline Columbia Gas Company of Virginia
Orange Throughout Gas pipelines Not provided
Orange Throughout Oil pipelines Not provided

VULNERABILITY ASSESSMENT HUMAN-CAUSED HAZARDS
FOR OFFICIAL USE ONLY Appendix F: Page 42
COMMUNICATION DISRUPTION Communications disruption can be categorized into physical infrastructure, wireless and public safety systems, and cyber attack. An overall communications analysis and response plan should be evaluated in conjunction with the new DHS National Incident Management System (NIMS). Primary concerns with physical infrastructure communication disruption include the impacts of sabotage or destruction of critical infrastructures such as Central Offices, towers, telecommunications vaults, key electrical sub stations, back up generators and transformers. These facilities and equipment are subject to damage by small satchel charges, rocket propelled grenades, and high power rifles. Telecommunications and electrical equipment typically have long lead times for manufacture and are usually low production and storage items, therefore an attack that damages or destroys several key items at one time can seriously degrade the system for an extended period of time. Wireless disruption can be accomplished by sabotage or destruction of base stations and receivers, interruption of transmission lines by use of mirrors or blocking line of sight, frequency jamming, and deception. Cyber hacking can compromise both physical infrastructure and control systems such as SCADA, energy and EMS that control critical mechanical and electrical systems, or attack primary internet enabled applications and platforms such as denial of service attacks, viruses, and worms that destroy hardrives and other equipment. The emerging growth of Voice Over Internet Protocol (VoIP) and Instant Messaging services has the potential to suffer significant communications disruption as converged voice and data is transmitted over digital services.
Interoperability of Radios/Communication Systems
One of the growing concerns in the region is the issue of interoperability of the emergency radio systems in the region. Fauquier County indicated that an area of needed improvement within the region is for emergency management to have interoperable communication systems with their neighbors in the Northern Virginia Region (Loudoun, Prince William, and Fairfax Counties). Fauquier County is nearing completion of an upgrade to an 800 MHZ radio system. Culpeper County has just approved and appropriated funding to upgrade their system to an 800 MHz system. Due to their terrain, Rappahannock County is only using a 150 high band system. Madison County is about to switch to a high band system. Orange County also uses a 150 high band system and does not plan to move up to the 800 MHZ system unless it is mandated. The Northern Virginia Fire Chiefs Association has identified one system for mobile data transmission to share mapping and preplans interjurisdictionally for when crossing single or multiple jurisdictional lines. This system requires typical mobile data terminals in fire rescue units. The system will also support daily response activities, allow law enforcement officers to have direct access to driving and criminal records, reducing the need for 911 dispatchers to relay that information verbally. Information on radio interoperability from the Department of Homeland Security can be found online at: http://www.dhs.gov/dhspublic/display?theme=63&content=3512

VULNERABILITY ASSESSMENT HUMAN-CAUSED HAZARDS
FOR OFFICIAL USE ONLY Appendix F: Page 43
Mitigation options to reduce the impacts of a communications failure include redundant cabling, fiber, transmitting and receiving stations, and monitoring/surveillance of critical infrastructure and key assets.
UTILITY DISRUPTION Utility disruption can occur by a number of methods. Of primary concern is the loss of water, electrical, natural gas, and sewage key infrastructure assets. Much of the key production equipment is long lead-time and often foreign made and very expensive, making a multiple target attack very effective in overall loss of capability and service. Specific to each utility is the ease of introduction of a CBR agent into the water supply, loss of electrical generation capability by destruction of substations and generators, loss of natural gas pipelines, and release of raw sewage. Many of the Nation’s utilities are aligned with existing rights-of-way and converge in a manhole or vault. These are referred to as Single Point Vulnerabilities. Mitigation options include loop and redundant service routes and monitoring/surveillance of critical infrastructure and key assets.
Table AF-15 Critical Utility Infrastructure in the Region
County Location Facility Name Facility Type
Culpeper Brandy Station Mount Dumplin STP Waste Water Treatment Facility
Culpeper Culpeper S W I F T Facility Electric Power Facility
Culpeper Culpeper Culpeper Water Pollution
Control Facility Waste Water Treatment
Facility
Culpeper Culpeper Eheart Subdivision. Waste Water Treatment Facility
Culpeper Culpeper Ferguson STP Waste Water Treatment
Facility
Culpeper Elkwood Elkwood Wastewater Treatment Plant
Waste Water Treatment Facility
Culpeper Jeffersonton River Ridge Utility Company Waste Water Treatment
Facility
Culpeper Jeffersonton South Wales Utility STP Waste Water Treatment Facility
Culpeper Mitchells Coffeewood Correctional
Center Potable Water System
Facilities
Fauquier Warrenton Advanced Wastewater Treatment Plant
Potable Water System Facilities
Fauquier Warrenton Advanced Wastewater
Treatment Plant Waste Water Treatment
Facility

VULNERABILITY ASSESSMENT HUMAN-CAUSED HAZARDS
FOR OFFICIAL USE ONLY Appendix F: Page 44
County Location Facility Name Facility Type
Fauquier Fauquier County Marshall WWT Fauquier
County Waste Water Treatment
Facility
Fauquier Remington Remington Regional Wastewater
Waste Water Treatment Facility
Fauquier Warrenton Fauquier Water Sewer
Authority Waste Water Treatment
Facility
Fauquier Warrenton Vint Hill Farms Station Waste Water Treatment Facility
Madison Madison Madison WTP-Rapidan
Service Authority Potable Water System
Facilities
Madison Madison Rapidan Service Authority Madison
Waste Water Treatment Facility
Orange Gordonsville Gordonsville Energy LP Electric Power Facility
Orange Locust Grove Wilderness Shores STP Waste Water Treatment Facility
Orange Orange Stanley Petroleum Products Oil Pipeline Facility
Orange Orange Town of Orange Water
Treatment Plant Potable Water System
Facilities
Orange Orange Locust Grove Elementary School
Waste Water Treatment Facility
Orange Orange Town of Orange Sewage Waste Water Treatment
Facility
Orange Unionville Transcontinental Gas Pipeline Corporation
Natural Gas Facility
Rappahannock Washington Town of Washington WTP Potable Water System
Facilities

VULNERABILITY ASSESSMENT HUMAN-CAUSED HAZARDS
FOR OFFICIAL USE ONLY Appendix F: Page 45
CIVIL DISRUPTION The potential for civil disruption in the region primarily depends on external factors and forces that may create a “regional emergency.” The Department of Homeland Security defines civil disruption as:
• Mass protests and demonstrations
• Quarantine
• Mass casualty care
• Release of chemical, biological or radiological agent and spontaneous full-scale evacuation
The main concern within the region in regards to human caused hazards involves the possibility of a “regional emergency” as a result of the evacuation of the Washington, D.C. area. A “regional emergency” is defined as events that have disrupted essential services, mobility, public health or safety on a regional scale. Because a major incident in Northern Virginia (Arlington, Stafford, Prince William, Fairfax, Loudoun) will trigger a flow of vehicles to and thru the five counties, Rappahannock-Rapidan Regional Commission officials have expressed interest in participating in a joint planning effort with the Northern Virginia Regional Commission to address some of the concerns raised by the potential for a “regional emergency.” The metropolitan D.C. area’s population is approximately 4.5 million according to the 2000 census. Any type of evacuation out of the metro area would greatly strain the resources of the counties in the Rappahannock-Rapidan Region. Another technique that is gaining momentum across the nation from local emergency management officials is Shelter-in-Place. Shelter-in-Place is the practice of being prepared to remain safely indoors in case of a hazardous materials release. With Sheltering-in-Place, a person is encouraged to find a small room in the interior of a house or building with no or few windows and having enough supplies to remain there for an extended period of time. While there are have been no major incidences of civil disruption reported in the region, this is probably the largest hazard of concern for all emergency management officials in the region. In the event of a WMD attack, the medical care system will likely be overwhelmed and the need for protective services, barricades and law enforcement at medical facilities will be a strain on limited resources.

VULNERABILITY ASSESSMENT HUMAN-CAUSED HAZARDS
FOR OFFICIAL USE ONLY Appendix F: Page 46
CONCLUSIONS ON HUMAN-CAUSED HAZARD RISK Based upon the qualitative approach defined in detail in Section 6 of this Plan, the risk from human-caused hazards in region were weighed criteria was used to assign values to the likelihood of occurrence, spatial extent affected, and potential impact of each hazard. These values combined to form a total rating for each hazard (Table AF.16). The highest possible value is a ten.
Table AF.16 Hazard Risk Ratings
(From Qualitative Assessment)
Hazard Likelihood Spatial Extent Potential Impact Hazard
Rating
Biological Attack Possible (1) Large (3) Critical (3) 7 Nuclear Attack Unlikely (0) Large (3) Catastrophic (4) 7 Communications Disruption Possible (1) Large (3) Critical (3) 7 Explosive Blast Attack Likely (2) Small (1) Critical (3) 6 Hazardous Materials Release Likely (2) Small (1) Critical (3) 6 Chemical Attack Possible (1) Small (1) Critical (3) 5 Radiological Attack Possible (1) Small (1) Critical (3) 5 Radiological Event Possible (1) Small (1) Critical (3) 5 Civil Disruption Possible (1) Moderate (2) Limited (2) 5 Energy Pipeline Failures Possible (1) Small (1) Limited (2) 4 Utility Disruption Possible (1) Moderate (2) Minor (1) 4
The three high-risk hazards identified through this process are the Biological Attack, Nuclear attack and Communications Disruption hazards. The human caused hazards receiving the second highest rating are Explosive Blast and Hazardous Materials Release.
Table AF.17
Estimated Risk Levels for the Rappahannock-Rapidan Region
HIGH RISK HAZARDS Biological Attack Nuclear Attack
Communications Disruption
MODERATE RISK HAZARDS
Explosive Blast Hazardous Materials Release
Chemical Attack Radiological Attack Radiological Event
Civil Disruption
LOW RISK HAZARDS Energy Pipeline Failures Utility Disruption