Floodplain Management and Hazard Mitigation Plan Update
336
Floodplain Management and Hazard Mitigation Plan Update 09051 | PL | 15 November 2020 City of Myrtle Beach
-
Upload
khangminh22 -
Category
Documents
-
view
0 -
download
0
Transcript of Floodplain Management and Hazard Mitigation Plan Update

Floodplain Management and Hazard Mitigation Plan Update
09051 | PL | 15
November 2020
City of Myrtle Beach

09051 | PL | 15 © 2015 Atkins North America, Inc.
www.atkinsglobal.com/northamerica

City of Myrtle Beach Floodplain Management and Hazard Mitigation Plan
November 2020
TABLE OF CONTENTS Introduction ........................................................................ SECTION 1
Planning Process ................................................................. SECTION 2
Community Profile .............................................................. SECTION 3
Hazard Identification and Analysis ...................................... SECTION 4
Vulnerability Assessment .................................................... SECTION 5
Capability Assessment ........................................................ SECTION 6
Mitigation Strategy ............................................................. SECTION 7
Mitigation Action Plan ........................................................ SECTION 8
Plan Maintenance Procedures ............................................ SECTION 9
Plan Adoption ...................................................................APPENDIX A
Planning Tools .................................................................. APPENDIX B
Local Mitigation Plan Review Tool .................................... APPENDIX C
Planning Process Documentation .................................... APPENDIX D

SECTION 1: INTRODUCTION
City of Myrtle Beach Floodplain Management and Hazard Mitigation Plan
November 2020
1:1
SECTION 1 INTRODUCTION
This section provides a general introduction to the City of Myrtle Beach Floodplain Management and Hazard Mitigation Plan. It consists of the following five subsections:
⧫ 1.1 Background
⧫ 1.2 Purpose
⧫ 1.3 Scope
⧫ 1.4 Authority
⧫ 1.5 Summary of Plan Contents
1.1 BACKGROUND Natural hazards, such as hurricanes, floods, and tornadoes, are a part of the world around us. Their occurrence is natural and inevitable, and there is little we can do to control their force and intensity. We must consider these hazards to be legitimate and significant threats to human life, safety, and property. The City of Myrtle Beach is vulnerable to a wide range of natural hazards, including hurricanes and tropical storms, flooding, tornadoes, storm surge, and wildfires. The hazard that has gained the most recent awareness is sea level rise. As a coastal community, the city places a major focus on hazards and events related to flooding. These hazards threaten the life and safety of city residents and have the potential to damage or destroy both public and private property, disrupt the local economy, and impact the overall quality of life of individuals who live, work, and vacation in the community. This vulnerability was highlighted most recently through Hurricane Matthew (2016), Hurricane Irma (2017), Hurricane Florence (2018), and Hurricane Dorian (2019), impacting the city in consecutive years. While the threat from hazardous events may never be fully eliminated, there is much we can do to lessen their potential impact upon our community and our citizens. By minimizing the impact of hazards upon our built environment, we can prevent such events from resulting in disasters. The concept and practice of reducing risks to people and property from known hazards is generally referred to as hazard mitigation.
FEMA Definition of Hazard Mitigation: “Any sustained action taken to reduce or eliminate the long-term risk to human life and property from hazards.”

SECTION 1: INTRODUCTION
City of Myrtle Beach Floodplain Management and Hazard Mitigation Plan
November 2020
1:2
Hazard mitigation techniques include both structural measures (such as strengthening or protecting buildings and infrastructure from the destructive forces of potential hazards) and non-structural measures (such as the adoption of sound land use policies and the creation of public awareness programs). It is widely accepted that the most effective mitigation measures are implemented at the local government level, where decisions on the regulation and control of development are ultimately made. A comprehensive mitigation approach addresses hazard vulnerabilities that exist today and in the foreseeable future. Therefore, it is essential that projected patterns of future development are evaluated and considered in terms of how that growth will increase or decrease a community’s overall hazard vulnerability. As a community formulates a comprehensive approach to hazard mitigation, a key component is to develop, adopt, and update a local hazard mitigation plan as needed. A hazard mitigation plan establishes the broad community vision and guiding principles for reducing hazard risk and, further, proposes specific mitigation actions to eliminate or reduce identified vulnerabilities. The City of Myrtle Beach has developed a Floodplain Management and Hazard Mitigation Plan that has evolved over the course of twenty-plus years. As the city's fourth Hazard Mitigation Plan update, the 2020 Plan documents and represents the city’s sustained efforts to incorporate hazard mitigation principles and practices into the routine government activities and functions of the City of Myrtle Beach. This evolution is described more thoroughly in Section 2: Planning Process. At its core, the Plan recommends specific actions to combat hazard vulnerability and protect residents from losses to those hazards that pose the greatest risk. These mitigation actions go beyond simply recommending structural solutions to reduce existing vulnerability, such as elevation, retrofitting, and acquisition projects. Local policies on community growth and development, incentives for natural resource protection, and public awareness and outreach activities are examples of other actions considered to reduce Myrtle Beach’s future vulnerability to identified hazards. The Plan remains a living document, with implementation and evaluation procedures included to help achieve meaningful objectives and successful outcomes over time.
1.1.1 Disaster Mitigation Act of 2000 and the Flood Insurance Reform Act of 2004
In an effort to reduce the Nation's mounting natural disaster losses, the U.S. Congress passed the Disaster Mitigation Act of 2000 (DMA 2000) in order to amend the Robert T. Stafford Disaster Relief and Emergency Assistance Act. Section 322 of DMA 2000 emphasizes the need for state, local, and Tribal government entities to closely coordinate on mitigation planning activities and makes the development of a hazard mitigation plan a specific eligibility requirement for any local or Tribal government applying for federal mitigation grant funds. In short, if a jurisdiction is not covered by an approved mitigation plan, it will not be eligible for mitigation grant funds. These funds include the Hazard Mitigation Grant Program (HMGP) and the Pre-Disaster Mitigation (PDM) program, both of which are administered by the Federal Emergency Management Agency (FEMA) under the Department of Homeland Security. The Pre-Disaster Mitigation program was later replaced with the new Building Resilient Infrastructure and Communities (BRIC) program. Communities with an adopted and federally approved hazard mitigation plan thereby become pre-positioned and more apt to receive available mitigation funds before and after the next disaster strikes.
SECTION 1: INTRODUCTION
City of Myrtle Beach Floodplain Management and Hazard Mitigation Plan
November 2020
1:3
Additionally, the Flood Insurance Reform Act of 2004 (P.L. 108-264) created two new grant programs, Severe Repetitive Loss (SRL) and Repetitive Flood Claim (RFC), and modified the existing Flood Mitigation Assistance (FMA) program. One of the requirements of this Act is that a FEMA-approved Hazard Mitigation Plan is now required if a community wishes to be eligible for these FEMA mitigation programs. However, as of early 2014, these programs have been folded into a single Flood Mitigation Assistance (FMA) program. This change was brought on by new, major federal flood insurance legislation that was passed in 2012 under the Biggert-Waters Flood Insurance Reform Act (P.L. 112-141) and the subsequent Homeowner Flood Insurance Affordability Act in 2014 which revised Biggert-Waters. These acts made several changes to the way the National Flood Insurance Program is to be run, including raises in rates to reflect true flood risk and changes in how Flood Insurance Rate Map (FIRM) updates impact policyholders. These acts further emphasize Congress’ focus on mitigating vulnerable structures. The Myrtle Beach Floodplain Management and Hazard Mitigation Plan has been prepared in coordination with FEMA Region IV and the South Carolina Emergency Management Division (SCEMD) to ensure that the Plan meets all applicable FEMA and state requirements for hazard mitigation plans. A Local Mitigation Plan Review Tool, found in Appendix C, provides a summary of federal and state minimum standards and notes the location where each requirement is met within the Plan.
1.2 PURPOSE The purpose of the City of Myrtle Beach Floodplain Management and Hazard Mitigation Plan is to:
⧫ Provide a comprehensive update to the City of Myrtle Beach Floodplain Management and Hazard Mitigation Plan, as amended in 2015;
⧫ Protect life, safety, and property by reducing the potential for future damages and economic losses that result from hazards;
⧫ Make the community a safer place to live, work, and play; ⧫ Qualify the City of Myrtle Beach for grant funding in both the pre-disaster and post-disaster
environments; ⧫ Speed recovery and redevelopment following future disaster events;
⧫ Demonstrate a firm local commitment to hazard mitigation principles; ⧫ Maintain compliance with state and federal legislative requirements for local hazard mitigation
plans; and ⧫ Meet the requirements of the Community Rating System (CRS) program.
1.3 SCOPE The focus of the City of Myrtle Beach Floodplain Management and Hazard Mitigation Plan is on those hazards determined to be “high” or “moderate” risks to the city as determined through a detailed hazard risk assessment. Other hazards that pose a “low” or “negligible” risk will continue to be evaluated during future updates to the Plan, but they may not be fully addressed until they are determined to be of high or moderate risk. This enables the city to prioritize mitigation actions based on those hazards which are understood to present the greatest risk to lives and property.

SECTION 1: INTRODUCTION
City of Myrtle Beach Floodplain Management and Hazard Mitigation Plan
November 2020
1:4
The geographic scope (i.e., the planning area) for the Plan includes all areas within the incorporated jurisdiction of Myrtle Beach.
1.4 AUTHORITY The City of Myrtle Beach Floodplain Management and Hazard Mitigation Plan has been developed in accordance with current state and federal rules and regulations governing local hazard mitigation plans and has been adopted by the City of Myrtle Beach in accordance with standard local procedures. A copy of the city’s adoption resolution is provided in Appendix A. The Plan shall be routinely monitored and revised to maintain compliance with the following provisions, rules, and legislation:
⧫ Section 322, Mitigation Planning, of the Robert T. Stafford Disaster Relief and Emergency Assistance Act as enacted by Section 104 of the Disaster Mitigation Act of 2000 (P.L. 106-390);
⧫ FEMA's Final Rule published in the Federal Register at 44 CFR Part 201 (201.6 for local mitigation planning requirements and 201.7 for Tribal planning requirements); and
⧫ Flood Insurance Reform Act of 2004 (P.L. 108-264), Biggert-Waters Flood Insurance Reform Act of 2012 (P.L. 112-141), and the Homeowner Flood Insurance Affordability Act.
1.5 SUMMARY OF PLAN CONTENTS The contents of this Plan are designed and organized to be as reader friendly and functional as possible. While significant background information is included on the processes used and studies completed (i.e., risk assessment, capability assessment), this information is separated from the more meaningful planning outcomes or actions (i.e., mitigation strategy, mitigation action plan). Section 2: Planning Process provides a complete narrative description of the process used to prepare the Plan. This includes the identification of who was involved, who participated on the planning team, and how the public and other stakeholders were involved. It also includes a detailed summary for each of the key meetings held along with any associated outcomes. The Community Profile, located in Section 3, describes the general makeup of Myrtle Beach, including prevalent geographic, demographic, and economic characteristics. In addition, building characteristics and land use patterns are discussed. This baseline information provides a snapshot of the planning area and helps local officials recognize those social, environmental, and economic factors that ultimately play a role in determining community vulnerability to hazards. The Risk Assessment is presented in two sections: Section 4: Hazard Identification and Analysis and Section 5: Vulnerability Assessment. Together, these sections serve to identify, analyze, and assess hazards that pose a threat to the City of Myrtle Beach. The risk assessment also attempts to define any hazard risks that may uniquely or exclusively affect specific areas of Myrtle Beach. The Risk Assessment builds on available historical data from past hazard occurrences, establishes detailed profiles for each hazard, and culminates in a hazard risk ranking based on conclusions about the frequency of occurrence, spatial extent, and potential impact of each hazard. FEMA’s HAZUS®MH loss estimation methodology was also used in evaluating known hazard risks by their relative long-term cost in expected damages. In essence, the information generated through the risk assessment serves a

SECTION 1: INTRODUCTION
City of Myrtle Beach Floodplain Management and Hazard Mitigation Plan
November 2020
1:5
critical function as Myrtle Beach seeks to determine the most appropriate mitigation actions to pursue and implement—enabling it to prioritize and focus its efforts on those hazards of greatest concern and those structures or planning areas facing the greatest risk(s). The Capability Assessment, found in Section 6, provides a comprehensive examination of the City of Myrtle Beach’s capacity to implement meaningful mitigation strategies and identifies opportunities to increase and enhance that capacity. Specific capabilities addressed in this section include planning and regulatory capability, staff and organizational (administrative) capability, technical capability, fiscal capability, and political capability. Information was obtained through the use of detailed survey questionnaires for local officials and an inventory and analysis of existing plans, ordinances, and relevant documents. The purpose of this assessment is to identify any existing gaps, weaknesses, or conflicts in programs or activities that may hinder mitigation efforts and to identify those activities that should be built upon in establishing a successful and sustainable local hazard mitigation program. The Community Profile, Risk Assessment, and Capability Assessment collectively serve as a basis for determining the goals for the Myrtle Beach Floodplain Management and Hazard Mitigation Plan, each contributing to the development, adoption, and implementation of a meaningful and manageable Mitigation Strategy that is based on accurate background information. The Mitigation Strategy, found in Section 7, consists of broad goal statements as well as an analysis of hazard mitigation techniques for Myrtle Beach to consider in reducing hazard vulnerabilities. The strategy provides the foundation for a detailed Mitigation Action Plan, found in Section 8, which links specific mitigation actions for each city department or agency to locally assigned implementation mechanisms and target completion dates. Together, these sections are designed to make the Plan both strategic, through the identification of long-term goals, and functional, through the identification of immediate and short-term actions that will guide day-to-day decision making and project implementation. In addition to the identification and prioritization of possible mitigation projects, emphasis is placed on the use of program and policy alternatives to help make the City of Myrtle Beach less vulnerable to the damaging forces of hazards while improving the economic, social, and environmental health of the community. The concept of multi-objective planning was emphasized throughout the planning process, particularly in identifying ways to link, where possible, hazard mitigation policies and programs with complimentary community goals related to disaster recovery, housing, economic development, recreational opportunities, transportation improvements, environmental quality, land development, and public health and safety. Plan Maintenance Procedures, found in Section 9, includes the measures that the City of Myrtle Beach will take to ensure the Plan’s continuous long-term implementation. The procedures also include the manner in which the Plan will be regularly evaluated and updated to remain a current and meaningful planning document.

SECTION 2: PLANNING PROCESS
City of Myrtle Beach Floodplain Management and Hazard Mitigation Plan
November 2020
2:1
SECTION 2 PLANNING PROCESS
44 CFR Requirement
44 CFR Part 201.6(c)(1): The plan shall include documentation of the planning process used to develop the plan, including how it was prepared, who was involved in the process and how the public was involved.
This section describes the planning process undertaken by the City of Myrtle Beach in the development of its 2020 Floodplain Management and Hazard Mitigation Plan. It consists of the following eight subsections:
2.1 Overview of Hazard Mitigation Planning
2.2 History of Hazard Mitigation Planning in the City of Myrtle Beach
2.3 Preparing the 2020 Plan
2.4 The Floodplain Management and Hazard Mitigation Planning Committee (FMHMPC)
2.5 Community Meetings and Workshops
2.6 Involving the Public
2.7 Involving the Stakeholders
2.8 Documentation of Plan Progress
2.1 OVERVIEW OF HAZARD MITIGATION PLANNING Local hazard mitigation planning is the process of organizing community resources, identifying and assessing hazard risks, and determining how to best minimize or manage those risks. This process results in a hazard mitigation plan that identifies specific mitigation actions, each designed to achieve both short-term planning objectives and a long-term community vision. To ensure the functionality of a hazard mitigation plan, responsibility is assigned for each proposed mitigation action to a specific individual, department, or agency along with a schedule or target completion date for its implementation (see Section 8). Plan maintenance procedures are established for the routine monitoring of implementation progress as well as the evaluation and enhancement of the mitigation plan itself. These plan maintenance procedures ensure that the plan remains a current, dynamic, and effective planning document over time that becomes integrated into the routine local decision-making process. Communities that participate in hazard mitigation planning have the potential to accomplish many benefits, including:

SECTION 2: PLANNING PROCESS
City of Myrtle Beach Floodplain Management and Hazard Mitigation Plan
November 2020
2:2
saving lives and property; saving money; speeding recovery following disasters; reducing future vulnerability through wise development and post-disaster recovery and
reconstruction; expediting the receipt of pre-disaster and post-disaster grant funding; and demonstrating a firm commitment to improving community health and safety.
Typically, mitigation planning is described as having the potential to produce long-term and recurring benefits by breaking the repetitive cycle of disaster loss. A core assumption of hazard mitigation is that the investments made before a hazard event will significantly reduce the demand for post-disaster assistance by lessening the need for emergency response, repair, recovery, and reconstruction. Furthermore, mitigation practices will enable local residents, businesses, and industries to re-establish themselves in the wake of a disaster, getting the community economy back on track sooner and with less interruption. The benefits of mitigation planning go beyond solely reducing hazard vulnerability. Measures such as the acquisition or regulation of land in known hazard areas can help achieve multiple community goals, such as preserving open space, maintaining environmental health, and enhancing recreational opportunities. Thus, it is vitally important that any local mitigation planning process be integrated with other concurrent local planning efforts, and any proposed mitigation strategies must take into account other existing community goals or initiatives that will help complement or hinder their future implementation.
2.2 HISTORY OF HAZARD MITIGATION PLANNING IN THE CITY OF MYRTLE BEACH
Myrtle Beach’s hazard mitigation planning efforts began as early as 1998 when the City created a committee to write a Floodplain Management and Hazard Mitigation Plan. The committee was comprised of City staff, local and state officials, and members of the public. The planning process was part of the larger visioning process for the City’s Comprehensive Plan update. The committee held four working sessions and a public hearing. The process resulted in adoption of the first City of Myrtle Beach Floodplain Management and Hazard Mitigation Plan, which was prepared as a guide to facilitate the implementation of floodplain management as well as provide a guide for reconstruction and redevelopment of flood-prone areas to reduce future damages. The guidelines used for the development of the plan were those recommended by the Federal Emergency Management Agency (FEMA) and the South Carolina Emergency Management Division (SCEMD) for natural hazard mitigation and flood mitigation plans. During preparation of the plan, the lead planner also coordinated with representatives from Horry County, the State, South Carolina Sea Grant, and ISO Commercial Risk Services, Inc. The final plan was adopted by Myrtle Beach on April 28, 1998 and adopted by reference in the City’s 1999 Comprehensive Plan. Following completion of the 1998 plan, FEMA published an Interim Final Rule1 in the Federal Register that specified criteria for the approval of local hazard mitigation plans as required in Section 322 of the Disaster Mitigation Act of 2000 (DMA 2000). This rule required Myrtle Beach to prepare an amendment to the 1998 plan in order to remain eligible for specified FEMA mitigation grants including the HMGP as well as the new Pre-Disaster Mitigation (PDM) program established through DMA 2000.
1 FEMA’s Interim Final Rule for hazard mitigation planning was published February 26, 2002 at 44 CFR Part 201.

SECTION 2: PLANNING PROCESS
City of Myrtle Beach Floodplain Management and Hazard Mitigation Plan
November 2020
2:3
In 2004, the Floodplain Management and Hazard Mitigation Plan was updated to meet the requirements of DMA 2000. The Floodplain Management and Hazard Mitigation Planning Committee reconvened for several meetings during the preparation of the revised plan and a draft of the Plan was presented to the public on September 23, 2004. The plan was submitted to SCEMD and then to FEMA for review and subsequent approval in accordance with state and federal regulations for hazard mitigation plans. The final Plan was adopted by the City Council on October 26, 2004. In 2010, the City of Myrtle Beach contracted PBS&J (now Atkins) to update the current mitigation plan previously developed by the City staff. The contractor redesigned the format of the plan and focused on the Community Rating System components of the plan. Atkins (formerly PBS&J) was contracted to update the plan in 2015 and again in 2020 for the current plan update. A more thorough description and review of the City’s earlier hazard mitigation planning and related efforts is provided in Section 6: Capability Assessment.
2.3 PREPARING THE 2020 PLAN Hazard mitigation plans are required to be updated every five years to remain eligible for Federal mitigation and Public Assistance funding. In preparation of the 2020 Floodplain Management and Hazard Mitigation Plan update, the City of Myrtle Beach hired Atkins as an outside consultant to provide professional mitigation planning services. To meet requirements of the Community Rating System, the City ensured that the planning process was facilitated under the direction of a professional planner. Ryan Wiedenman from Atkins served as a planner for this project and is a member of the American Institute of Certified Planners (AICP). Per the contractual scope of work,2 the consultant team followed the mitigation planning process recommended by FEMA (Publication Series 386) and recommendations provided by SCEMD mitigation planning staff. The Local Mitigation Plan Review Tool, found in Appendix C, provides a detailed summary of FEMA’s current minimum standards of acceptability for compliance with DMA 2000 and notes the location where each requirement or element is met within this Plan. These standards are based upon FEMA’s Interim Final Rule as published in the Federal Register on February 26, 2002 in Part 201 of the Code of Federal Regulations. The planning team used FEMA’s Local Mitigation Planning Handbook (last revised in March 2013) for reference as they updated the plan. The City’s Floodplain Coordinator reconvened the Floodplain Management and Hazard Mitigation Planning Committee along with the consultant. It was determined that the entire plan would be updated to reflect any changes that occurred over the past five years. This was discussed at the first meeting of the FMHMPC on May 27, 2020 that is further described later in this section. The process used to prepare this Plan included twelve (12) major steps that were completed over the course of approximately six months beginning in May 2020. Each of these planning steps (illustrated in Figure 2.1) resulted in critical work products and outcomes that collectively make up the Plan. Specific plan sections are further described in Section 1: Introduction.
2 A copy of the negotiated contractual scope of work between Myrtle Beach and Atkins is available through the City of Myrtle Beach upon request.

SECTION 2: PLANNING PROCESS
City of Myrtle Beach Floodplain Management and Hazard Mitigation Plan
November 2020
2:4
Figure 2.1: City of Myrtle Beach’s Mitigation Planning Process
2.4 THE FLOODPLAIN MANAGEMENT AND HAZARD MITIGATION PLANNING COMMITTEE (FMHMPC)
In order to guide the development of this Plan, the City of Myrtle Beach reconvened its Floodplain Management and Hazard Mitigation Planning Committee (FMHMPC) that was created during past planning efforts, including the latest plan approval in December 2015. The FMHMPC represents a community-based planning team made up of representatives from various City departments and other key stakeholders identified to serve as critical partners in the planning process. In November 2009, the City Council passed a resolution that officially recognized the Floodplain Management and Hazard Mitigation Planning Committee. For this plan update, the FMHMPC was reconvened to guide the process of the plan update. Beginning in May 2020, the City of Myrtle Beach engaged FMHMPC members in regular discussions as well as local meetings and planning workshops to discuss and complete tasks associated with preparing the Plan. The FMHMPC coordinated on all aspects of plan preparation and provided valuable input to the process. In addition to regular meetings, committee members routinely communicated and were kept informed through email correspondence and phone calls.

SECTION 2: PLANNING PROCESS
City of Myrtle Beach Floodplain Management and Hazard Mitigation Plan
November 2020
2:5
Specifically, the tasks assigned to the FMHMPC members included:
participate in FMHMPC meetings and correspondence; provide best available data as required for the risk assessment portion of the Plan; assist in updating the local Capability Assessment Survey and provide copies of any mitigation or
hazard-related documents for review and incorporation into the Plan; support the update of the Mitigation Strategy, including the review and update of community
goal statements; provide an implementation status update for the existing mitigation actions; help design and propose appropriate new mitigation actions for their department/agency for
incorporation into the Mitigation Action Plan; review and provide timely comments on all study findings, data requests, and draft plan
deliverables; and support the adoption of the 2020 Myrtle Beach Floodplain Management and Hazard Mitigation
Plan.
Table 2.1 lists the members of the FMHMPC who were responsible for participating in the development of the Plan. Committee members are listed in alphabetical order by last name.
Table 2.1: Members of the Floodplain Management and Hazard Mitigation Planning Committee
NAME DEPARTMENT / AGENCY
Bruce Arnel City of Myrtle Beach Emergency Management, Manager
Mark Kruea City of Myrtle Beach Fire Department, Public Information Officer
Emily Hardee City of Myrtle Beach Construction Services, Permit Services Supervisor and Floodplain Coordinator
Allison Hardin City of Myrtle Beach Planning, City Planner
Samantha Taylor City of Myrtle Beach Public Works, Stormwater Program Supervisor
Val Rosser City of Myrtle Beach Insurance and Risk Services, Director
Karen Riordan Myrtle Beach Area Chamber of Commerce, President and CEO
Matt Tumbleson Grand Stand Medical Center, HCA, Director of Emergency Preparedness and Security
David J. Victoria Jr. Tungsten Corporation, President; Horry Georgetown Home Builders Association Board of Directors, President
Ashley Weatherly Weatherly Engineering LLC
Rob Wilfong Development Resource Group
Tom Russo Citizen
The FMHMPC had five citizen representatives from the community and local economy who participated in the meetings and provided valuable information and feedback. Additional participation and input from other identified stakeholders and the general public was sought by the City during the planning process through phone calls and the distribution of e-mails, advertisements, and public notices aimed at informing people on the status of the Floodplain Management and Hazard Mitigation Plan (public and stakeholder involvement is further discussed later in this section). Individuals from the following organizations and/or

SECTION 2: PLANNING PROCESS
City of Myrtle Beach Floodplain Management and Hazard Mitigation Plan
November 2020
2:6
departments were given the opportunity to participate and comment on the documentation: City of North Myrtle Beach, Horry County, Georgetown County, City of Surfside, South Carolina Department of Natural Resources, FEMA Region IV, U.S. Army Corps of Engineers, Grand Strand Water and Sewer Authority, Santee Cooper Electric Cooperative, Horry Telephone Cooperative, Horry Electric Cooperative, Town of Briarcliffe, City of Loris, South Carolina Emergency Management Division, and Evergreen Landscaping, The City also posted information on its website (https://myrtlebeachhmp.weebly.com/) related to the plan development process.
Table 2.2 lists the additional stakeholders that participated in the planning process in the form of meeting participation.
Table 2.2: Additional Stakeholders
NAME DEPARTMENT / AGENCY
James P. Clement City of Myrtle Beach Fire Department, Captain
Katie Dennis City of Conway Building Department, Code Enforcement
Tom Gwyer City of Myrtle Beach Fire Department, Fire Chief
John Johnson City of Myrtle Beach Public Works, Engineering Division Superintendent
Diane Moskow-McKenzie City Manager’s Office, Grant Support
Margaret Murray City of Myrtle Beach GIS
Wanda F. Squires Horry County Emergency Management
2.5 COMMUNITY MEETINGS AND WORKSHOPS The preparation of this Plan required a series of meetings and workshops for facilitating discussion, gaining consensus, and initiating data collection efforts with local government staff, community officials, and other identified stakeholders. More importantly, the meetings and workshops prompted continuous input and feedback from relevant participants throughout the drafting stages of the Plan. Due to COVID-19 safety protocols, all meetings and workshops were conducted virtually. The meeting materials including the agendas, sign-in sheets, and minutes are located in Appendix D. The Kick-off Meeting in May began with an overview of mitigation. A presentation was given that outlined the project tasks, schedule, and mitigation planning process. The next FPHMPC meeting in June reviewed the hazard identification, risk assessment, and vulnerability analysis. The third meeting in August focused on the current capabilities of City and the review of the existing mitigation strategy to include the goals. The fourth meeting in September reviewed mitigation activities for consideration, existing mitigation actions, and potential new mitigation actions. The fifth and final meeting in October was held to review the draft plan.3 The committee members were given the opportunity to review the entire draft and provide any feedback, comments, or revisions. In many cases, routine discussions and additional meetings were held by local staff to accomplish planning tasks specific to their department or agency, such as the approval of specific mitigation actions for their department of agency to undertake and include in the Mitigation Action Plan.
3 Copies of the agendas, sign-in sheets, and minutes for all meetings and workshops can be found in Appendix D.

SECTION 2: PLANNING PROCESS
City of Myrtle Beach Floodplain Management and Hazard Mitigation Plan
November 2020
2:7
2.6 INVOLVING THE PUBLIC
44 CFR Requirement
44 CFR Part 201.6(b)(1): The planning process shall include an opportunity for the public to comment on the plan during the drafting stage and prior to plan approval.
An important component of the mitigation planning process involved public participation. Individual citizen and community-based input provides the entire planning team with a greater understanding of local concerns and increases the likelihood of successfully implementing mitigation actions by developing community “buy-in” from those directly affected by the decisions of public officials. As citizens become more involved in decisions that affect their safety, they are more likely to gain a greater appreciation of the hazards present in their community and take the steps necessary to reduce their impact. Public awareness is a key component of any community’s overall mitigation strategy aimed at making a home, neighborhood, school, business, or entire city safer from the potential effects of hazards. Public involvement in the development of the City of Myrtle Beach’s 2020 Floodplain Management and Hazard Mitigation Plan was sought throughout the planning process with the use of the public participation survey that was made available on the City’s website, Facebook page, Twitter page, and LinkedIn page. Public meetings were also held at two distinct periods during the planning process: (1) in beginning of the update process to explain the planning process and project tasks and (2) upon completion of the final draft Plan prior to official plan approval and adoption. These meetings were held virtually, and the meeting recordings were posted on the City’s Facebook page. Public input was sought using three methods: (1) open public meetings; (2) survey instruments; and (3) making the draft Plan deliverables available for public review. The two rounds of open public meetings that were held during the development of this Plan are described below. June 3, 2020 First Public Meeting The first public meeting was held following the first FMHMPC meeting on June 3, 2020. The meeting was advertised through a public hearing notice, a posting on the City’s website, and on the City’s Facebook page. Figure 2.2 shows the public hearing notice that was disseminated.

SECTION 2: PLANNING PROCESS
City of Myrtle Beach Floodplain Management and Hazard Mitigation Plan
November 2020
2:8
Figure 2.2: Notice of First Public Meeting
April 13, 2021 Second Public Meeting The second public meeting took place on April 13, 2021, during the City Council meeting. The public was given an opportunity to provide feedback on the draft Plan before the City Council adopted the plan through resolution. There were no public comments received at either public meeting. However, the four citizens who participated in the FMHMPC meetings provided significant input during the committee meetings and through correspondence to include mitigation action supporting information.
2.6.1 Public Participation Survey Since the public meetings did not result in any public comments, the City of Myrtle Beach utilized the Public Participation Survey to encourage citizens to provide input to the mitigation planning process. The Public Participation Survey was designed to capture data and information from residents of Myrtle Beach that might not be able to view public meetings or participate through other means in the mitigation planning process. An electronic version of the survey was made available online and links to the survey were posted on the City’s website and social media pages. Numerous survey responses were received, which provided valuable input for the FMHMPC to consider in the development of the plan update. A copy of the survey can be found in Appendix B and a detailed summary of the survey results is provided in Appendix D.

SECTION 2: PLANNING PROCESS
City of Myrtle Beach Floodplain Management and Hazard Mitigation Plan
November 2020
2:9
Figure 2.3 shows the website that the City created for the FPMHMP plan update.
Figure 2.3: City’s FPMHMP Website
2.7 INVOLVING THE STAKEHOLDERS
44 CFR Requirement
44 CFR Part 201.6(b)(2): The planning process shall include an opportunity for neighboring communities, local and regional agencies involved in hazard mitigation activities, and agencies that have the authority to regulate development, as well as businesses, academia and other non-profit interests to be involved in the planning process.
In addition to the FMHMPC meetings, the City of Myrtle Beach encouraged more open and widespread participation in the mitigation planning process through the design and posting of public notices and newspaper advertisements that promoted the open public meetings (described earlier in this Section). The City also went above and beyond in its local outreach efforts through the design and distribution of the Public Participation Survey. These media advertisements and survey instruments provided opportunities for local officials, residents, businesses, academia, and other private interests in Myrtle
SECTION 2: PLANNING PROCESS
City of Myrtle Beach Floodplain Management and Hazard Mitigation Plan
November 2020
2:10
Beach to be involved and offer input throughout the local mitigation planning process. Additionally, the draft plan was distributed to local stakeholders and neighboring jurisdictions for review and comment.
2.8 DOCUMENTATION OF PLAN PROGRESS Progress in hazard mitigation planning for the City of Myrtle Beach is documented in this plan update. Since hazard mitigation planning efforts officially began in the city with the development of the initial Hazard Mitigation Plans in the late 1990s and early 2000s, many mitigation actions have been completed and implemented in the city. These actions will help reduce the overall risk to natural hazards for the people and property in the City of Myrtle Beach. The actions that have been completed are documented in the Mitigation Action Plan found in Section 8. In addition, community capability continues to improve with the implementation of new plans, policies, and programs that help to promote hazard mitigation at the local level. The current state of local capabilities for the participating jurisdictions is captured in Section 6: Capability Assessment. The City continues to demonstrate its commitment to hazard mitigation and hazard mitigation planning and has proven this by developing the Floodplain Management and Hazard Mitigation Planning Committee to update the Plan and by continuing to involve the public in the hazard mitigation planning process.

SECTION 3: COMMUNITY PROFILE
City of Myrtle Beach Floodplain Management and Hazard Mitigation Plan
November 2020
3:1
SECTION 3 COMMUNITY PROFILE
This section of the Plan provides a general overview of the City of Myrtle Beach. It consists of the following five subsections:
3.1 Geography and the Environment
3.2 Population and Demographics
3.3 Housing, Infrastructure, and Land Use
3.4 Employment and Industry
3.5 Development Trends
3.1 GEOGRAPHY AND THE ENVIRONMENT The Grand Strand region of South Carolina extends more than 60 miles from the North Carolina border to Pawleys Island in Georgetown County. The City of Myrtle Beach is located in Horry County at the heart of the Grand Strand area, which is visited by over 19 million tourists annually. The city has a land area of 23.59 square miles. An orientation map is provided as Figure 3.1. Development of the beach began around 1900. The Conway and Seashore Railroad was constructed from Conway to Myrtle Beach and connected with the Atlantic Coast Line Railroad in Conway. The rail line provided improved access to the beach for tourists and the resort began to grow. Myrtle Beach was incorporated as a town in 1938 and as a city in 1957. Since the 1950’s, Myrtle Beach has experienced unprecedented growth and change, fueled by its increasing popularity as a vacation destination. Myrtle Beach is South Carolina’s 14th largest municipality and the largest municipality in Horry County. Development in the area has been strong and continues to attract new residents and visitors especially in the Market Common district and on the extreme northern end of the city. Myrtle Beach is bordered to the east by the Atlantic Ocean, to the north by the City of North Myrtle Beach, to the west by the Intracoastal Waterway, and to the south by the Town of Surfside Beach. The average elevation of the city is approximately 26 feet. The climate in Myrtle Beach is considered sub-tropical with generally warm, humid temperatures year-round. The average high temperature is 75ºF and the average low temperature is 53ºF. The average annual precipitation is 48 inches, with higher rainfall amounts in the summer months. The dominant inland surface water resource in Myrtle Beach is the Intracoastal Waterway, which runs north-south near the western boundary of the city. Major rivers near the city include the Pee Dee River and the Waccamaw River, both located south of the city.

SECTION 3: COMMUNITY PROFILE
City of Myrtle Beach Floodplain Management and Hazard Mitigation Plan
October 2020
3:2
Figure 3.1: Myrtle Beach Orientation Map
3.2 POPULATION AND DEMOGRAPHICS Based on data from the US Census Bureau, the resident population of Myrtle Beach increased from 27,109 in 2010 to 31,783 in 2018, resulting in an increase of 17.2 percent. According to the Myrtle Beach Comprehensive Plan, the future population in the city is likely to increase and development in the area has been strong and continues to attract new residents and visitors. While population projections are not available for the City of Myrtle Beach alone, Horry County Planning and Zoning has developed population projections for the Myrtle Beach County Census Division derived from the SC Revenue and Fiscal Affairs Office and found in the Horry County Imagine 2040 Plan. As of 2015, the Myrtle Beach County Census Division had a population of 105,940. In 2040, that population is projected to be 165,000, which represents projected growth of 55.7 percent. Figure 3.2 charts the population growth in the city from 1940 to 2018 with data provided by the US Census Bureau.

SECTION 3: COMMUNITY PROFILE
City of Myrtle Beach Floodplain Management and Hazard Mitigation Plan
October 2020
3:3
Figure 3.2: Myrtle Beach Population Change
According to the 2018 American Community Survey 5-year estimates, the median age for city residents is 44.0 years. It is estimated that 19.9 percent of the city’s population is made up of persons that are 65 years old and older. The population of Myrtle Beach is 77.9 percent White and 14.4 percent Black or African American. An estimated 13.5 percent of the population (of any race) is Hispanic or Latino.
3.3 HOUSING, INFRASTRUCTURE, AND LAND USE
3.3.1 Housing According to the Census Bureau’s 2018 American Community Survey 5-year Estimates, there are 24,853 housing units in Myrtle Beach. Of these structures, 32.2 percent are detached single-units, 64.0 percent are attached single-units and multi-units, and 3.8 percent are mobile homes. The median value of a home is $194,700 (the median home value for South Carolina is $154,800). The age distribution of the county’s housing stock as reported in the 2018 American Community Survey 5-year Estimates is as follows:
1939 or earlier 0.8 percent 1940 to 1949 1.6 percent 1950 to 1959 7.0 percent 1960 to 1969 6.9 percent 1970 to 1979 14.2 percent 1980 to 1989 28.8 percent 1990 to 1999 14.4 percent 2000 to 2009 19.1 percent 2010 to 2013 3.5 percent 2014 or later 3.8 percent

SECTION 3: COMMUNITY PROFILE
City of Myrtle Beach Floodplain Management and Hazard Mitigation Plan
October 2020
3:4
Based on the growth that has been predicted in the Horry County Comprehensive Plan for the year 2040, the entire County to include the City of Myrtle Beach will experience expansive growth. It has been stated that the residential development will be extreme and the demand for housing will not be able to keep the pace.
3.3.2 Infrastructure Transportation There are several major highways that provide access to Myrtle Beach. The US 17 Bypass runs north-south along the western edge of the city. Carolina Bays Parkway (Highway 31) is another major north-south route that runs west of the city. US 501 is the major east-west highway through the city and connects to US Highway 17 Business (Kings Highway) in the heart of Myrtle Beach. The Conway Bypass (Highway 22) connects the US 17 Bypass on the north side of Myrtle Beach to US 501 on the west side of Conway, over twenty miles west of Myrtle Beach. The Coastal Rapid Public Transit Authority provides bus service in the Myrtle Beach area. Shuttle bus services are also offered in the hotel areas during the summer. Myrtle Beach International Airport is located on the south side of the city and is operated by the Horry County Department of Airports. The airport has a single runway of almost 10,000 feet and a terminal complex for both commercial flights and general aviation. Utilities Electric power in Myrtle Beach is provided by Santee Cooper and Horry Electric. The natural gas supplier is South Carolina Electric and Gas. Water, sewer, and solid waste services are provided by the Myrtle Beach Public Works Department. The city gets its potable water from the Intracoastal Waterway where the Waccamaw River provides seven miles of freshwater. The city also maintains several deep wells in the Black Creek aquifer for emergency use. The city’s surface water treatment plant and wastewater plant are located on Mr. Joe White Avenue on the eastern bank of the Intracoastal Waterway. Community Facilities There are a number of public buildings and community facilities located throughout Myrtle Beach. There are six fire stations located in the city limits. The Myrtle Beach Police Department is located in the Law Enforcement Center on Oak Street and Mr. Joe White Avenue. The Chapin Memorial Library was the first city-owned library in the state of South Carolina and is located on 14th Avenue North on the east side of Kings Highway (US 17 Business). The city’s Parks and Recreation system consists of 49 active and passive parks and 143 beach access points. Myrtle Beach State Park is located just south of the city limits. Myrtle Beach is in the Horry County School District, which operates 5 schools within the jurisdiction. Coastal Carolina University, Horry-Georgetown Technical College, and Webster University have satellite campuses in Myrtle Beach.

SECTION 3: COMMUNITY PROFILE
City of Myrtle Beach Floodplain Management and Hazard Mitigation Plan
October 2020
3:5
3.4 EMPLOYMENT AND INDUSTRY Myrtle Beach thrives on its reputation as a tourist destination. Based on the 2018 American Community Survey 5-year Estimates, the arts, entertainment, and recreation, and accommodation and food services industry employed 31.9 percent of Myrtle Beach’s labor force. Educational services, and health care and social assistance employed the second highest percentage of the labor force at 14.3 percent with retail trade close behind at 13.3 percent. According to the Census Bureau’s 2018 American Community Survey 5-year Estimates, the estimated median family income for Myrtle Beach was $54,571, compared to the US average of $73,965 per family and the South Carolina average of $63,437 per family.
3.5 DEVELOPMENT TRENDS Development in Myrtle Beach has historically been concentrated along the oceanfront. Commercial uses have grown along major thoroughfares, and expansion of the roadway system has resulted in additional locations for new commercial development. In recent years, properties along the oceanfront are being redeveloped at greater intensities to accommodate the growing tourist market. The recently created Downtown Development Office has taken the pace of the previous Downtown Redevelopment Corporation. The office’s mission is to facilitate revitalization of the City’s central business district. The Downtown Development Office will move forward with the implementation of the Myrtle Beach Downtown Master Plan, which includes revitalizing the downtown area by introducing an Arts and Innovation District at Nance Plaza. In addition to the Arts District, the plan also focuses on three additional districts: Oceanfront, Kings Highway, and Historic Main Street. Figure 3.3 on the next page shows recent high-density development activity that has occurred in the City.

SECTION 3: COMMUNITY PROFILE
City of Myrtle Beach Floodplain Management and Hazard Mitigation Plan
October 2020
3:6
Figure 3.3: Recent High-Density Development Activity and Future Floodplains

SECTION 4: HAZARD IDENTIFICATION AND ANALYSIS
City of Myrtle Beach Floodplain Management and Hazard Mitigation Plan
November 2020
4:1
SECTION 4 HAZARD IDENTIFICATION AND ANALYSIS
44 CFR Requirement
44 CFR Part 201.6(c)(2)(i): The risk assessment shall include a description of the type, location and extent of all-natural hazards that can affect the jurisdiction. The plan shall include information on previous occurrences of hazard events and on the probability of future hazard events.
4.1 OVERVIEW
The City of Myrtle Beach is vulnerable to an array of natural hazards that threaten life and property. FEMA’s current regulations and interim guidance under the Disaster Mitigation Act of 2000 (DMA 2000) require, at a minimum, an evaluation of a full range of natural hazards. Upon a review of the full range of natural hazards suggested under FEMA planning guidance, the City of Myrtle Beach Floodplain Management and Hazard Mitigation Planning Committee (FMHMPC) identified a number of hazards that are to be addressed in the City’s Floodplain Management and Hazard Mitigation Plan. The City has also decided to include several human-caused hazards in this analysis as well. All of the hazards included were identified through an extensive process that utilized input from FMHMPC members, research of past disaster declarations for the City, review of the City’s previous hazard mitigation plan, and a review of the current South Carolina State Hazard Mitigation Plan. Readily available online information from reputable sources such as federal and state agencies was also evaluated to supplement information from these key sources. This section of the Plan describes the hazards identified by the FMHMPC to pose a risk to people and property in the city. Further, an assessment of risk for each hazard includes background information, location and extent, notable historical occurrences, and the probability of future occurrences. When possible, hazard profiles also include specific items noted by members of the FMHMPC as they relate to unique historical or anecdotal hazard information for Myrtle Beach. The following hazards were identified:
Atmospheric Drought Extreme Heat Hailstorm Ice Storm/Winter Weather/Winter Weather Lightning

SECTION 4: HAZARD IDENTIFICATION AND ANALYSIS
City of Myrtle Beach Floodplain Management and Hazard Mitigation Plan
November 2020
4:2
Nor’easter Tornado/Waterspout Tropical Storm System/Hurricane Wind Events (Thunderstorm/High Wind)
Geologic
Earthquake Tidal Wave/Tsunami
Hydrologic
Erosion Flood Storm Surge Sea Level Rise
Other
Acts of Terror Airplane Crash (commercial/private) Civil Disturbance Hazardous Materials Incident Public Health Emergency Wildfire
For the 2020 update of this plan, the Floodplain Management and Hazard Mitigation Committee determined that, in addition to the hazards identified in the previous plan, Extreme Heat, Civil Disturbance, and Public Health Emergency should be added to the list of hazards addressed. The committee also felt that the relative risk of the Acts of Terror hazard had increased, and the relative risk of the Sea Level Rise hazard had decreased since the 2015 plan update. Some of these hazards are considered to be interrelated or cascading (e.g., hurricanes can cause flooding, storm surge, and tornadoes), but for preliminary hazard identification purposes, these distinct hazards are broken out separately. It should also be noted that some hazards, such as earthquakes or winter storms, may impact a large area yet cause little damage, while other hazards, such as a tornado, may impact a small area yet cause extensive damage. Table 4.1 provides a brief description of the aforementioned hazards.
Table 4.1: Descriptions of Identified Hazards
Hazard Description
ATMOSPHERIC
Drought A Drought occurs when a prolonged period of less than normal precipitation results in a serious hydrologic imbalance. Common effects of drought include crop failure, water supply shortages, and fish and wildlife mortality. High temperatures, high winds, and low humidity can worsen drought conditions and make areas more susceptible to wildfire. Human demands and actions have the ability to hasten or mitigate drought-related impacts on local communities.

SECTION 4: HAZARD IDENTIFICATION AND ANALYSIS
City of Myrtle Beach Floodplain Management and Hazard Mitigation Plan
November 2020
4:3
Hazard Description
Extreme Heat A heat wave may occur when temperatures hover 10 degrees or more above the average high temperature for the region and last for several weeks. Humid or muggy conditions, which add to the discomfort of high temperatures, occur when a “dome” of high atmospheric pressure traps hazy, damp air near the ground. Excessively dry and hot conditions can provoke dust storms and low visibility. A heat wave combined with a drought can be very dangerous and have severe economic consequences on a community.
Hailstorm Hail is formed when updrafts in thunderstorms carry raindrops into parts of the atmosphere where the temperatures are below freezing.
Ice Storm/Winter Weather/Winter Weather
An Ice Storm/Winter Weather is a winter storm characterized by significant amounts of freezing rain. It is often associated with severe winter storms which may include snow, sleet, freezing rain, or a mix of these wintry forms of precipitation. Ice Storm/Winter Weathers occur when moisture falls and freezes immediately upon impact on trees, power lines, communication towers, structures, roads, and other hard surfaces. Winter storms and Ice Storm/Winter Weathers can cause widespread power outages, damage property, and result in fatalities and injuries.
Lightning Lightning is a discharge of electrical energy resulting from the buildup of positive and negative charges within a thunderstorm, creating a “bolt” when the buildup of charges becomes strong enough. This flash of light usually occurs within the clouds or between the clouds and the ground. A bolt of lightning can reach temperatures approaching 50,000 degrees Fahrenheit. Lightning rapidly heats the sky as it flashes, but the surrounding air cools following the bolt. (This rapid heating and cooling of the surrounding air causes thunder.) On average, 73 people are killed each year by lightning strikes in the United States.
Nor’easter The Nor’easter is a particularly devastating type of coastal storm, named for the winds that blow in from the northeast and drive the storm up the U.S. East Coast alongside the Gulf Stream (a band of warm water that lies off the Atlantic coast). They are caused by the interaction of the jet stream with horizontal temperature gradients and generally occur during the fall and winter months when moisture and cold air are plentiful. Coastal storm events are notorious for producing heavy amounts of rain and snow, producing hurricane-force winds, and creating high surf that potentially causes severe beach erosion and coastal flooding.
Tornado/Waterspout A Tornado is a violently rotating column of air that has contact with the ground and is often visible as a funnel cloud. Its vortex rotates cyclonically with wind speeds ranging from as low as 40 mph to as high as 300 mph. Tornadoes are most often generated by thunderstorm activity when cool, dry air intersects and overrides a layer of warm, moist air forcing the warm air to rise rapidly. The destruction caused by tornadoes ranges from light to catastrophic depending on the intensity, size, and duration of the storm.
Tropical Storm System/Hurricane
Hurricanes and tropical storms are classified as cyclones and defined as any closed circulation developing around a low-pressure center in which the winds rotate counterclockwise in the Northern Hemisphere (or clockwise in the Southern Hemisphere) and with a diameter averaging 10 to 30 miles across. When maximum sustained winds reach or exceed 39 miles per hour, the system is designated a tropical storm, given a name, and is closely monitored by the National Hurricane Center. When sustained winds reach or exceed 74 miles per hour the storm is deemed a hurricane. The primary damaging forces associated with these storms are high-level sustained winds, heavy precipitation, and tornadoes. Coastal areas are also vulnerable to the additional forces of storm surge, wind-driven waves, and tidal flooding which can be more destructive than cyclone wind. The majority of hurricanes and tropical storms form in the Atlantic Ocean, Caribbean Sea and Gulf of Mexico during the official Atlantic hurricane season, which extends from June through November.
Wind Events (Thunderstorm/High Wind)
Thunderstorms are caused by air masses of varying temperatures meeting in the atmosphere. Rapidly rising warm moist air fuels, the formation of thunderstorms. Thunderstorms may occur singularly, in lines, or in clusters. They can move through an area very quickly or linger for several hours. Thunderstorms may result in hail, tornadoes, or wind. Windstorms pose a threat to lives, property, and vital utilities primarily due to the effects of flying debris and can down trees and power lines.

SECTION 4: HAZARD IDENTIFICATION AND ANALYSIS
City of Myrtle Beach Floodplain Management and Hazard Mitigation Plan
November 2020
4:4
Hazard Description
GEOLOGIC
Earthquake A sudden, rapid shaking of the Earth caused by the breaking and shifting of rock beneath the surface characterizes an Earthquake. This movement forces the gradual building and accumulation of energy. Eventually, strain becomes so great that the energy is abruptly released, causing the shaking at the earth’s surface which we know as an earthquake. Roughly 90 percent of all earthquakes occur at the boundaries where plates meet, although it is possible for earthquakes to occur entirely within plates. Earthquakes can affect hundreds of thousands of square miles; cause damage to property measured in the tens of billions of dollars; result in loss of life and injury to hundreds of thousands of persons; and disrupt the social and economic functioning of the affected area.
Tidal Wave/Tsunami A Tsunami is a series of waves generated by an undersea disturbance such as an earthquake or moving plate tectonics. The speed of a tsunami traveling away from its source can range from up to 500 miles per hour in deep water to approximately 20 to 30 miles per hour in shallower areas near coastlines. Tsunamis differ from regular ocean waves in that their currents travel from the water surface all the way down to the sea floor. Wave amplitudes in deep water are typically less than one meter; they are often barely detectable to the human eye. However, as they approach shore, they slow in shallower water, basically causing the waves from behind to effectively “pile up,” and wave heights to increase dramatically. As opposed to typical waves which crash at the shoreline, tsunamis bring with them a continuously flowing ‘wall of water’ with the potential to cause devastating damage in coastal areas located immediately along the shore.
HYDROLOGIC
Erosion Erosion is a landward displacement of a shoreline caused by the forces of waves and currents. Coastal erosion is measured as the rate of change in the position or horizontal displacement of a shoreline over a period of time. It is generally associated with episodic events such as hurricanes and tropical storms, nor’easters, storm surge, and coastal flooding but may also be caused by human activities that alter sediment transport. Construction of shoreline protection structures can mitigate the hazard but may also exacerbate it under some circumstances.
Flood The accumulation of water within a water body which results in the overflow of excess water onto adjacent lands, usually floodplains. The floodplain is the land adjoining the channel of a river, stream ocean, lake, or other watercourse or water body that is susceptible to flooding. Most floods fall into the following three categories: riverine flooding, coastal flooding, or shallow flooding (where shallow flooding refers to sheet flow, ponding and urban drainage). Coastal flooding is exacerbated during high tide events.
Storm Surge Storm surge occurs when the water level of a tidally influenced body of water increases above the normal astronomical high tide and are most common in conjunction with coastal storms with massive low-pressure systems with cyclonic flows such as hurricanes, tropical storms, and nor’easters. The low barometric pressure associated with these storms cause the water surface to rise, and storms making landfall during peak tides have surge heights and more extensive flood inundation limits. Storm surges will inundate coastal floodplains by dune overwash, tidal elevation rise in inland bays and harbors, and backwater flooding through coastal river mouths. The duration of a storm is the most influential factor affecting the severity and impact of storm surges.
Sea Level Rise According to NOAA, sea level rise is defined as a mean rise is sea level. As the ocean warms, sea water expands and continental ice sheets melt, thus inundating areas with sea water that were previously above sea level.
OTHER
Acts of Terror Terrorism is defined by FEMA as, “the use of force or violence against persons or property in violation of the criminal laws of the United States for purposes of intimidation, coercion, or ransom.” Terrorist acts may include assassinations, kidnappings, hijackings, bomb scares and bombings, cyber-attacks (computer-based), and the use of chemical, biological, nuclear, and radiological weapons.

SECTION 4: HAZARD IDENTIFICATION AND ANALYSIS
City of Myrtle Beach Floodplain Management and Hazard Mitigation Plan
November 2020
4:5
Hazard Description
Airplane Crash An airplane crash endangers the passengers onboard the craft as well as people and property at the crash site. The extent of an airplane crash risk is based on many factors including the size of the aircraft and location of crash site. For example, a large commuter jet crashing into a heavily populated urban area will likely have far greater damages than a personal aircraft crashing in a rural area.
Hazardous Materials Incident
Hazardous material (HAZMAT) incidents can apply to fixed facilities as well as mobile, transportation-related accidents in the air, by rail, on the nation’s highways, and on the water. HAZMAT incidents consist of solid, liquid, and/or gaseous contaminants that are released from fixed or mobile containers, whether by accident or by design as with an intentional terrorist attack. A HAZMAT incident can last hours to days, while some chemicals can be corrosive or otherwise damaging over longer periods of time. In addition to the primary release, explosions and/or fires can result from a release, and contaminants can be extended beyond the initial area by persons, vehicles, water, wind, and possibly wildlife as well.
Civil Disturbance Public unrest has been evident in society from the earliest recordings of civilization. Most of these disturbances have been related to political or social issues. Insurrection has framed much of history, dictating the governance and progression of society. In recent years, most of the publicized disturbances have been protests and riots. Rioting does not occur very often in the United States; however, marches and protests are common and could subsequently lead to riots.
Public Health Emergency
Public health threats are often defined by an infectious disease that involves a biological agent/disease that may result in mass casualties or an outbreak of symptoms in those affected. Often emerging diseases are the greatest threat because they are new or varied iterations of existing threats and the population may not have built up a collective immunity to the disease.
Wildfire An uncontrolled fire burning in an area of vegetative fuels such as grasslands, brush, or woodlands defines wildfire. Heavier fuels with high continuity, steep slopes, high temperatures, low humidity, low rainfall, and high winds all work to increase risk for people and property located within wildfire hazard areas or along the urban/wildland interface. Wildfires are part of the natural management of forest ecosystems, but most are caused by human factors. Over 80 percent of forest fires are started by negligent human behavior such as smoking in wooded areas or improperly extinguishing campfires. The second most common cause for wildfire is lightning.
4.2 STUDY AREA Figure 4.1 provides a base map for the City of Myrtle Beach hazard risk assessment. The map depicts the Myrtle Beach boundary as of 2020.

SECTION 4: HAZARD IDENTIFICATION AND ANALYSIS
City of Myrtle Beach Floodplain Management and Hazard Mitigation Plan
November 2020
4:6
Figure 4.1: Myrtle Beach Base Map
Atmospheric Hazards
4.3 DROUGHT
4.3.1 Background Drought is a normal part of virtually all climatic regions, including areas with high and low average rainfall. Drought is the consequence of a natural reduction in the amount of precipitation expected over an extended period of time, usually a season or more in length. High temperatures, high winds, and low humidity can exacerbate drought conditions. In addition, human actions and demands for water resources can hasten drought-related impacts. Droughts are typically classified into one of four types: 1) meteorological; 2) hydrologic; 3) agricultural; or 4) socioeconomic. Table 4.2 presents definitions for these types of drought.

SECTION 4: HAZARD IDENTIFICATION AND ANALYSIS
City of Myrtle Beach Floodplain Management and Hazard Mitigation Plan
November 2020
4:7
Table 4.2 Drought Classification Definitions
Meteorological Drought The degree of dryness or departure of actual precipitation from an expected average or normal amount based on monthly, seasonal, or annual time scales.
Hydrologic Drought The effects of precipitation shortfalls on stream flows and reservoir, lake, and groundwater levels.
Agricultural Drought Soil moisture deficiencies relative to water demands of plant life, usually crops.
Socioeconomic Drought The effect of demands for water exceeding the supply as a result of a weather-related supply shortfall.
Source: Multi-Hazard Identification and Risk Assessment: A Cornerstone of the National Mitigation Strategy, FEMA
Droughts are slow-onset hazards, but, over time, can have very damaging affects to crops, municipal water supplies, recreational uses, and wildlife. If drought conditions extend over a number of years, the direct and indirect economic impact can be significant. The Palmer Drought Severity Index (PDSI) is based on observed drought conditions and range from -0.5 (incipient dry spell) to -4.0 (extreme drought). As evident in Figure 4.2, the Palmer Drought Severity Index Summary Map for the United States, drought affects most areas of the United States, but is less severe in the Eastern United States.
Figure 4.2: Palmer Drought Severity Index Summary Map for the United States
Source: National Drought Mitigation Center

SECTION 4: HAZARD IDENTIFICATION AND ANALYSIS
City of Myrtle Beach Floodplain Management and Hazard Mitigation Plan
November 2020
4:8
4.3.2 Location and Spatial Extent Drought typically covers a large area and cannot be confined to any geographic or political boundaries. According to the Palmer Drought Severity Index (Figure 4.2), South Carolina has a relatively low risk for drought hazard. However, local areas may experience much more severe and/or frequent drought events than what is represented on the Palmer Drought Severity Index map. Further, it is assumed that the City of Myrtle Beach would be uniformly exposed to drought, making the spatial extent potentially widespread. It is also notable that drought conditions typically do not cause significant damage to the built environment.
4.3.3 Historical Occurrences Data from the United States Drought Monitor was obtained and used to ascertain historical drought conditions for Horry County. (Data was only available at the county level, so city-level data is not shown separately.) Data was available from January 2000 through June 11, 2020. The Drought Monitor provides weekly updates on drought status by county. Drought conditions are classified on a scale of D0 to D4 as described in Table 4.3:
Table 4.3: U.S. Drought Monitor Drought Classifications Drought Severity
Category Description
D0 Abnormally Dry Going into drought: short-term dryness slowing planting, growth of crops or pastures. Coming out of drought: some lingering water deficits; pastures or crops not fully recovered
D1 Moderate Drought Some damage to crops, pastures; streams, reservoirs, or wells low, some water shortages developing or imminent; voluntary water-use restrictions requested
D2 Severe Drought Crop or pasture losses likely; water shortages common; water restrictions imposed
D3 Extreme Drought Major crop/pasture losses; widespread water shortages or restrictions
D4 Exceptional Drought Exceptional and widespread crop/pasture losses; shortages of water in reservoirs, streams, and wells creating water emergencies
Source: United States Drought Monitor
The greatest magnitude of drought on this scale is reported as D4, exceptional drought. According to the U.S. Drought Monitor, such conditions have not occurred in Horry County since 2000. However, Horry County has experienced at least abnormally dry conditions every year and experienced extreme drought conditions in 2002, 2007, 2008, 2011, and 2012. Table 4.4 shows the most severe drought classification for each year according to Drought Monitor classifications and the associated number of weeks reported at that category. It should be noted that the U.S. Drought Monitor also estimates what percentage of the county is in each classification of drought severity. For example, the most severe classification reported may be exceptional, but a majority of the county may actually be in a less severe condition.

SECTION 4: HAZARD IDENTIFICATION AND ANALYSIS
City of Myrtle Beach Floodplain Management and Hazard Mitigation Plan
November 2020
4:9
Table 4.4: Historical Drought Occurrences in Horry County Year Highest Drought Condition Number of Weeks
2000 MODERATE 3
2001 SEVERE 9
2002 EXTREME 34
2003 ABNORMAL 6
2004 ABNORMAL 11
2005 ABNORMAL 8
2006 ABNORMAL 12
2007 EXTREME 13
2008 EXTREME 8
2009 SEVERE 1
2010 MODERATE 3
2011 EXTREME 3
2012 EXTREME 5
2013 MODERATE 2
2014 ABNORMAL 16
2015 MODERATE 12
2016 ABNORMAL 5
2017 MODERATE 11
2018 MODERATE 8
2019 MODERATE 19
2020 ABNORMAL 2
Source: United States Drought Monitor (January 2000 – June 11, 2020)
Figure 4.3 is also presented as an example of how the data is captured on a county-by-county level across the state.

SECTION 4: HAZARD IDENTIFICATION AND ANALYSIS
City of Myrtle Beach Floodplain Management and Hazard Mitigation Plan
November 2020
4:10
Figure 4.3: County by County Drought Level Example
Source: United States Drought Monitor Data from the National Centers for Environmental Information (NCEI) Storm Events Database (formerly the National Climatic Data Center (NCDC)) was also reviewed to ascertain additional information on historical drought events in Myrtle Beach. According to NCEI, one drought event has affected the City of Myrtle Beach since 1996 as shown in Table 4.5:1
Table 4.5: Historical Drought Impacts
Location Date Deaths/ Injuries
Property Damage
(2020 dollars) Description
COASTAL HORRY (ZONE) 7/1/2011 0/0 $0
Rainfall amounts continued to be below normal, and the cumulative effect put the region in a Severe Drought (D2). Although the stress on crops in the region was evident,
1 These drought events are only inclusive of those reported by the National Centers for Environmental Information (NCEI) from 1996 through February 2020. It is likely that additional drought conditions have affected the City of Myrtle Beach. As additional local data becomes available, this hazard profile will be amended.

SECTION 4: HAZARD IDENTIFICATION AND ANALYSIS
City of Myrtle Beach Floodplain Management and Hazard Mitigation Plan
November 2020
4:11
Location Date Deaths/ Injuries
Property Damage
(2020 dollars) Description
there were no widespread reports of crop damage, nor water rationing.
Source: National Centers for Environmental Information
4.3.4 Probability of Future Occurrences It is assumed that all of the City of Myrtle Beach has a high probability of a future drought event, so future occurrences are considered likely (between 10 and 100 percent annual probability).
4.4 EXTREME HEAT
4.4.1 Background Extreme heat, like drought, poses little risk to property. However, extreme heat can have devastating effects on health. Extreme heat is often referred to as a “heat wave.” According to the National Weather Service, there is no universal definition for a heat wave, but the standard U.S. definition is any event lasting at least three days where temperatures reach ninety degrees Fahrenheit or higher. However, it may also be defined as an event at least three days long where temperatures are ten degrees greater than the normal temperature for the affected area. Heat waves are typically accompanied by humidity but may also be very dry. These conditions can pose serious health threats causing an average of 1,500 deaths each summer in the United States.2 According to the National Oceanic and Atmospheric Administration, heat is the number one weather-related killer among natural hazards, followed by frigid winter temperatures. The National Weather Service devised the Heat Index as a mechanism to better inform the public of heat dangers. The Heat Index Chart, shown in Figure 4.4, uses air temperature and humidity to determine the heat index or apparent temperature. Table 4.6 shows the dangers associated with different heat index temperatures. Some populations, such as the elderly and young, are more susceptible to heat danger than other segments of the population.
2 http://www.noaawatch.gov/themes/heat.php

SECTION 4: HAZARD IDENTIFICATION AND ANALYSIS
City of Myrtle Beach Floodplain Management and Hazard Mitigation Plan
November 2020
4:12
Figure 4.4: Heat Index Chart
Source: National Oceanic and Atmospheric Administration
Table 4.6: Heat Disorders Associated with Heat Index Temperature Heat Index Temperature (Fahrenheit)
Description of Risks
80°- 90° Fatigue possible with prolonged exposure and/or physical activity
90°- 105° Sunstroke, heat cramps, and heat exhaustion possible with prolonged exposure and/or physical activity
105°- 130° Sunstroke, heat cramps, and heat exhaustion likely, and heatstroke possible with prolonged exposure and/or physical activity
130° or higher Heatstroke or sunstroke is highly likely with continued exposure
Source: National Weather Service, National Oceanic and Atmospheric Administration
Urban areas are at greater risk to heat effects. Stagnant atmospheric conditions trap pollutants, thus adding unhealthy air to excessively hot temperatures. In addition, the “urban heat island effect” can produce significantly higher nighttime temperatures because asphalt and concrete (which store heat longer) gradually release heat at night.
4.4.2 Location and Spatial Extent Excessive heat typically impacts a large area and cannot be confined to any geographic or political boundaries. The entire city is susceptible to extreme heat conditions.

SECTION 4: HAZARD IDENTIFICATION AND ANALYSIS
City of Myrtle Beach Floodplain Management and Hazard Mitigation Plan
November 2020
4:13
4.4.3 Historical Occurrences The National Centers for Environmental Information was used to determine historical extreme heat occurrences in the city. These events were reported as impacting the entire Coastal Horry County zone. July 21, 2011 – Heat – Excessive heat advisories and warnings were issued for the region for several days toward the end of July. The heat and humidity combined to push heat indexes near 110 degrees at times during the afternoon. June 29, 2012 – Heat – Northwest flow aloft and southwest flow at the surface produced excessive heat at the end of June. The heat index went over 110 degrees beginning the afternoon of June 29th, continuing through the next day. The highest heat index noted was near 120 degrees. There were no reports of heat related illnesses or fatalities. June 14, 2015 – Heat – A prolonged period of unseasonably high heat indices blanketed most of the southeastern US. Afternoon temperatures mainly between 95 and 100 combined with dewpoints in the mid-70s produced heat index values in the 105 to 110 range. The heat wave finally broke on June 26th with cloud cover and precipitation. In addition, information from the South Carolina State Climatology Office was reviewed to obtain historical temperature records in the county. The recorded maximum for the county can be found below in Table 4.7. It is important to note, however, that Loris is located about 20 miles further inland than Myrtle Beach.
Table 4.7: Highest Record Temperature in Horry County Location Date Temperature (°F) Loris 6/27/1952 107
Source: South Carolina State Climatology Office
The State Climatology Office also reports average maximum temperatures at various stations in the county. Table 4.8 shows the average maximum temperatures from 1981 to 2010 at the Myrtle Beach station.
Table 4.8: Average Maximum Temperature in Myrtle Beach Month Jan Feb Mar Apr May Jun Jul Aug Sept Oct Nov Dec
Avg. Max (°F)
55 58.4 64.4 72.2 79.4 85 87.9 87.1 83.6 75.9 67.9 58.6
Source: South Carolina State Climatology Office
4.4.4 Probability of Future Occurrences Based on historical occurrence information, it is assumed that all of Myrtle Beach has a probability level of likely for future extreme heat events to impact the city (between 10 and 100 percent annual probability).

SECTION 4: HAZARD IDENTIFICATION AND ANALYSIS
City of Myrtle Beach Floodplain Management and Hazard Mitigation Plan
November 2020
4:14
4.5 HAILSTORMS
4.5.1 Background Hailstorms are a potentially damaging outgrowth of severe thunderstorms. Early in the developmental stages of a hailstorm, ice crystals form within a low-pressure front due to the rapid rising of warm air into the upper atmosphere and the subsequent cooling of the air mass. Frozen droplets gradually accumulate on the ice crystals until they develop to a sufficient weight and fall as precipitation. Hail typically takes the form of spheres or irregularly shaped masses greater than 0.75 inches in diameter. The size of hailstones is a direct function of the size and severity of the storm. High velocity updraft winds are required to keep hail in suspension in thunderclouds. The strength of the updraft is a function of the intensity of heating at the Earth’s surface. Higher temperature gradients relative to elevation above the surface result in increased suspension time and hailstone size.
4.5.2 Location and Spatial Extent Hailstorms frequently accompany thunderstorms, so their locations and spatial extents coincide. Thunderstorms are considered frequent occurrences throughout Myrtle Beach and coastal South Carolina. It is assumed that all of Myrtle Beach is uniformly exposed to severe thunderstorms; therefore, all areas of the city are equally exposed to hail which may be produced by such storms.
4.5.3 Historical Occurrences According to NCEI, there have been 320 hail events in Horry County since 1956, 22 of which have affected the City of Myrtle Beach.3 Table 4.9 provides detailed information about these recorded events, which caused over $17,000 (2020 dollars) in reported property damages.4 Hail ranged in size from 0.75 inches to 1.75 inches in diameter during these events. Figure 4.5 illustrates the location and magnitude of historic hailstorms that have occurred in the city. It should be noted that hail is notorious for causing substantial damage to cars, roofs, and other areas of the built environment, so it is likely that damages are greater than the reported value. The planning team especially noted that they felt structural damage reported by NCEI seemed very low and that historic dollar damages were much closer to millions of dollars of historic damage.
Table 4.9: Historical Hailstorm Impacts
Location Date Magnitude (inches)
Deaths/ Injuries
Property Damage (2020
dollars) Description
MYRTLE BEACH 5/29/1996 0.88 0/0 $0 Not Available
3 These hail events are only inclusive of those reported by the National Centers for Environmental Information (NCEI) from
1955 through February 2020. It is likely that additional hail events have affected the City of Myrtle Beach. As additional local
data becomes available, this hazard profile will be amended. 4 Adjusted dollar values were calculated based on the average Consumer Price Index for All Urban Consumers (CPI-U) U.S. city
average series for all items, not seasonally adjusted. This data represents changes in the prices of all goods and services purchased for consumption by urban households. This monthly index value has been calculated every year since 1913. The 2020 dollar values were calculated based on buying power in May 2020.
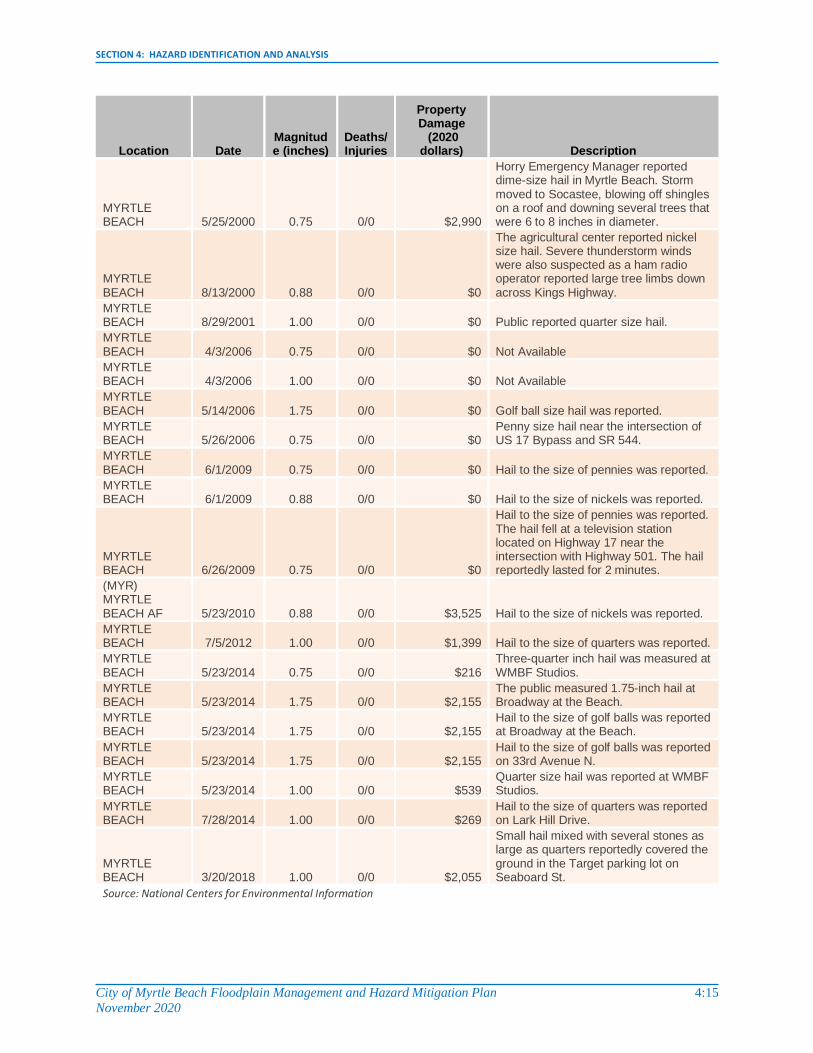
SECTION 4: HAZARD IDENTIFICATION AND ANALYSIS
City of Myrtle Beach Floodplain Management and Hazard Mitigation Plan
November 2020
4:15
Location Date Magnitude (inches)
Deaths/ Injuries
Property Damage (2020
dollars) Description
MYRTLE BEACH 5/25/2000 0.75 0/0 $2,990
Horry Emergency Manager reported dime-size hail in Myrtle Beach. Storm moved to Socastee, blowing off shingles on a roof and downing several trees that were 6 to 8 inches in diameter.
MYRTLE BEACH 8/13/2000 0.88 0/0 $0
The agricultural center reported nickel size hail. Severe thunderstorm winds were also suspected as a ham radio operator reported large tree limbs down across Kings Highway.
MYRTLE BEACH 8/29/2001 1.00 0/0 $0 Public reported quarter size hail.
MYRTLE BEACH 4/3/2006 0.75 0/0 $0 Not Available
MYRTLE BEACH 4/3/2006 1.00 0/0 $0 Not Available
MYRTLE BEACH 5/14/2006 1.75 0/0 $0 Golf ball size hail was reported.
MYRTLE BEACH 5/26/2006 0.75 0/0 $0
Penny size hail near the intersection of US 17 Bypass and SR 544.
MYRTLE BEACH 6/1/2009 0.75 0/0 $0 Hail to the size of pennies was reported.
MYRTLE BEACH 6/1/2009 0.88 0/0 $0 Hail to the size of nickels was reported.
MYRTLE BEACH 6/26/2009 0.75 0/0 $0
Hail to the size of pennies was reported. The hail fell at a television station located on Highway 17 near the intersection with Highway 501. The hail reportedly lasted for 2 minutes.
(MYR) MYRTLE BEACH AF 5/23/2010 0.88 0/0 $3,525 Hail to the size of nickels was reported.
MYRTLE BEACH 7/5/2012 1.00 0/0 $1,399 Hail to the size of quarters was reported.
MYRTLE BEACH 5/23/2014 0.75 0/0 $216
Three-quarter inch hail was measured at WMBF Studios.
MYRTLE BEACH 5/23/2014 1.75 0/0 $2,155
The public measured 1.75-inch hail at Broadway at the Beach.
MYRTLE BEACH 5/23/2014 1.75 0/0 $2,155
Hail to the size of golf balls was reported at Broadway at the Beach.
MYRTLE BEACH 5/23/2014 1.75 0/0 $2,155
Hail to the size of golf balls was reported on 33rd Avenue N.
MYRTLE BEACH 5/23/2014 1.00 0/0 $539
Quarter size hail was reported at WMBF Studios.
MYRTLE BEACH 7/28/2014 1.00 0/0 $269
Hail to the size of quarters was reported on Lark Hill Drive.
MYRTLE BEACH 3/20/2018 1.00 0/0 $2,055
Small hail mixed with several stones as large as quarters reportedly covered the ground in the Target parking lot on Seaboard St.
Source: National Centers for Environmental Information
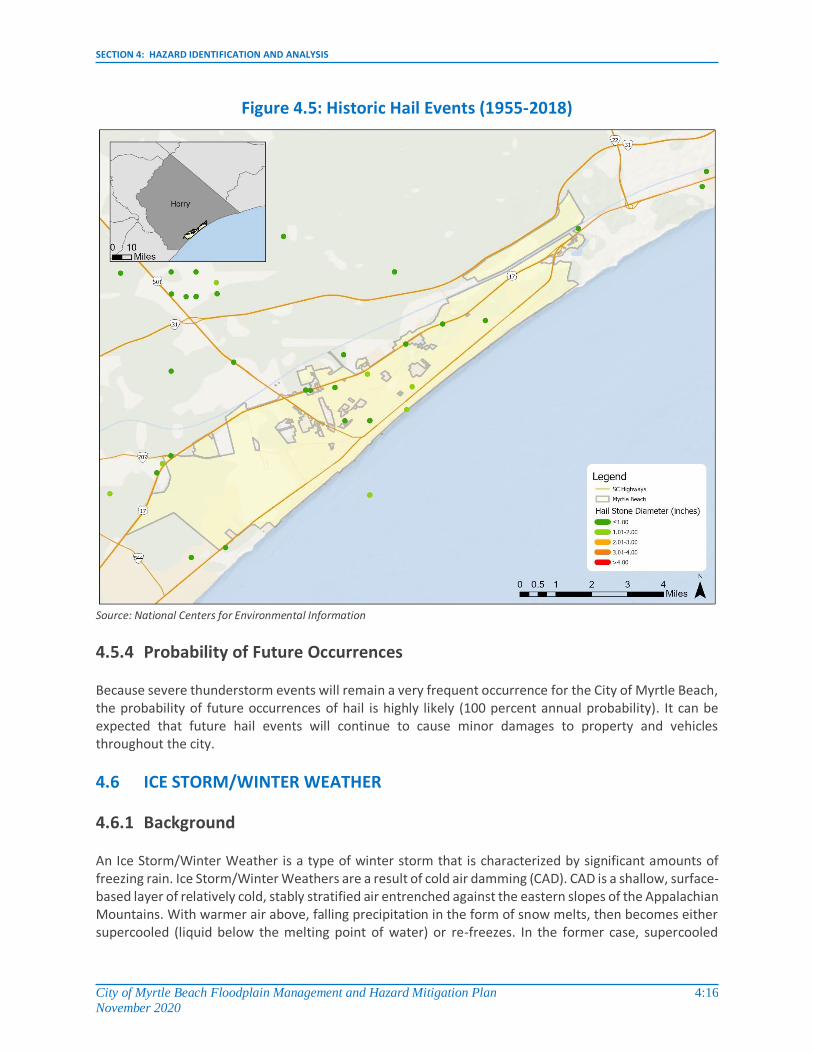
SECTION 4: HAZARD IDENTIFICATION AND ANALYSIS
City of Myrtle Beach Floodplain Management and Hazard Mitigation Plan
November 2020
4:16
Figure 4.5: Historic Hail Events (1955-2018)
Source: National Centers for Environmental Information
4.5.4 Probability of Future Occurrences Because severe thunderstorm events will remain a very frequent occurrence for the City of Myrtle Beach, the probability of future occurrences of hail is highly likely (100 percent annual probability). It can be expected that future hail events will continue to cause minor damages to property and vehicles throughout the city.
4.6 ICE STORM/WINTER WEATHER
4.6.1 Background An Ice Storm/Winter Weather is a type of winter storm that is characterized by significant amounts of freezing rain. Ice Storm/Winter Weathers are a result of cold air damming (CAD). CAD is a shallow, surface-based layer of relatively cold, stably stratified air entrenched against the eastern slopes of the Appalachian Mountains. With warmer air above, falling precipitation in the form of snow melts, then becomes either supercooled (liquid below the melting point of water) or re-freezes. In the former case, supercooled

SECTION 4: HAZARD IDENTIFICATION AND ANALYSIS
City of Myrtle Beach Floodplain Management and Hazard Mitigation Plan
November 2020
4:17
droplets can freeze on impact (freezing rain), while in the latter case, the re-frozen water particles are ice pellets (or sleet). When freezing rain falls onto a surface with a temperature below freezing, it forms a glaze of ice, creating very hazardous conditions. Sleet pellets usually bounce when hitting a surface and do not stick to objects; however, sleet can accumulate like snow. Even small accumulations of ice can cause a significant hazard, especially on roadways, power lines, and trees. An Ice Storm/Winter Weather has an immediate impact on power lines, communication towers, roadways, and other hard surfaces. Communications and power can be disrupted for days as a result of an Ice Storm/Winter Weather event. Winter storms are also discussed in this section because the two hazards are so closely related. A winter storm can range from a moderate snow over a period of a few hours to blizzard conditions with blinding wind-driven snow that lasts for several days. Many winter storms are accompanied by low temperatures and heavy and/or blowing snow, which can severely impair visibility and disrupt commerce and transportation. Occasionally heavy snow might also cause significant property damages, such as roof collapses on older buildings.
4.6.2 Location and Spatial Extent Nearly the entire continental United States is susceptible to ice and winter storms. Some Ice Storm/Winter Weathers and winter storms might be large enough to affect several states, while others might affect only limited, localized areas. The degree of exposure typically depends on the normal expected severity of local winter weather. Myrtle Beach is not accustomed to severe winter weather conditions and rarely receives winter weather. However, the entire city has uniform exposure to the event.
4.6.3 Historical Occurrences According to NCEI, there have been a total of four recorded winter storm events that have impacted Myrtle Beach since 2014 (Table 4.10).5 Additionally, the planning team noted that the largest winter storm event to impact the city was in 1989 when a storm system dropped more than 15 inches of snow.
Table 4.10: Historical Ice Storm/Winter Weather Events
Location Date Type of Event Deaths/ Injuries Description
COASTAL HORRY (ZONE) 1/28/2014 Winter Storm 0/0
Freezing rain began falling the afternoon of Jan 28th, changed over to mostly sleet in the evening and overnight hours, and tapered off to flurries the morning of the 29th. Total ice accumulations ranged from a tenth to a half inch, and sleet accumulations along the coast were also about a half inch. Due to the nature of the precipitation, power outages were isolated, however driving was treacherous. Numerous traffic
5 These ice and winter storm events are only inclusive of those reported by the National Climatic Data Center (NCDC). It is
likely that additional winter storm conditions have affected the City of Myrtle Beach. As additional local data becomes available, this hazard profile will be amended.

SECTION 4: HAZARD IDENTIFICATION AND ANALYSIS
City of Myrtle Beach Floodplain Management and Hazard Mitigation Plan
November 2020
4:18
Location Date Type of Event Deaths/ Injuries Description
accidents were reported as well as injuries due to slips and falls.
COASTAL HORRY (ZONE) 2/11/2014 Winter Storm 0/0
Freezing rain began falling the morning of February 11th. The freezing rain continued intermittently before ending the afternoon of the 12th. Ice accumulations ranged from a tenth to a quarter inch.
COASTAL HORRY (ZONE) 2/24/2015
Winter Weather 0/0
Freezing rain fell across the county, including the coast, with one to two tenths of an inch of ice accumulation reported, mainly on trees and metal surfaces.
COASTAL HORRY (ZONE) 1/3/2018 Winter Storm 0/0
Snow began falling by early afternoon on Jan 3rd. Two inches of snow had fallen by 7 pm, and the totals for the event ranged from a trace to a half inch. A quarter inch of ice fell north of Myrtle Beach. The low pressure responsible for the winter weather bombed off the east coast, dropping 24 millibars in twenty-four hours. Record cold preceded and followed the event, lasting until Jan 8th.
Source: National Centers for Environmental Information
4.6.4 Probability of Future Occurrences Winter storm events will remain a possible occurrence in Myrtle Beach (between 1 and 10 percent annual probability), and the probability of future occurrences is certain though not necessarily annually. The impact of snow and Ice Storm/Winter Weathers may overwhelm city capabilities and cause major disruptions to transportation, commerce, and electrical power. However, large scale property damages and/or threats to human life and safety are not expected.
4.7 LIGHTNING
4.7.1 Background Lightning is a discharge of electrical energy resulting from the buildup of positive and negative charges within a thunderstorm, creating a “bolt” when the buildup of charges becomes strong enough. This flash of light usually occurs within the clouds or between the clouds and the ground. A bolt of lightning can reach temperatures approaching 50,000 degrees Fahrenheit. Lightning rapidly heats the sky as it flashes but the surrounding air cools following the bolt. This rapid heating and cooling of the surrounding air causes the thunder which often accompanies lightning strikes. While most often affiliated with severe thunderstorms, lightning may also strike outside of heavy rain and might occur as far as 10 miles away from any rainfall. According to FEMA, lightning injures an average of 300 people and kills 80 people each year in the United States. Direct lightning strikes also have the ability to cause significant damage to buildings, critical facilities, and infrastructure largely by igniting a fire. Lightning is also responsible for igniting wildfires that can result in widespread damages to property. The City of Myrtle Beach is located in a region of the country that is particularly susceptible to lightning strike. Figure 4.6 shows a lightning flash density map for the years 2008-2017 based upon data provided

SECTION 4: HAZARD IDENTIFICATION AND ANALYSIS
City of Myrtle Beach Floodplain Management and Hazard Mitigation Plan
November 2020
4:19
by Vaisala’s U.S. National Lightning Detection Network (NLDN®). This map demonstrates that Myrtle Beach is located in an area that generally experiences 6 to 20 flashes per square mile per year.
Figure 4.6: Lightning Flash Density in the United States
Source: Vaisala U.S. National Lightning Detection Network
4.7.2 Location and Spatial Extent It is assumed that all of Myrtle Beach is uniformly exposed to lightning. Lightning occurs randomly, therefore it is impossible to predict where and with what frequency it will strike. It is assumed that all of Myrtle Beach is uniformly exposed to lightning which strikes in very small, specific geographic areas.
4.7.3 Historical Occurrences According to NCEI, there have been a total of eight recorded lightning events in the City of Myrtle Beach since 1996.6 These events resulted in almost $421,000 (2020 dollars) in damages as listed in Table 4.11.
Table 4.11: Historical Lightning Impacts
Location Date Deaths/ Injuries
Property Damage
(2020 dollars) Description
MYRTLE BEACH 6/9/1996 0/0 $0 Lightning-caused power outages effected 4,200 Santee Cooper customers for up to an hour.
6 These lightning events are only inclusive of those reported by the National Centers for Environmental Information (NCEI) from
1996 through February 2020. It is certain that additional lightning events have occurred in the City of Myrtle Beach. As additional local data becomes available, this hazard profile will be amended.

SECTION 4: HAZARD IDENTIFICATION AND ANALYSIS
City of Myrtle Beach Floodplain Management and Hazard Mitigation Plan
November 2020
4:20
Location Date Deaths/ Injuries
Property Damage
(2020 dollars) Description
MYRTLE BEACH 6/3/2001 0/0 $28,808
Lightning struck a home on North Ocean Blvd., causing moderate fire and water damage, officials said.
MYRTLE BEACH 6/21/2001 0/0 $288,083
Lightning ignited a fire at an apartment complex. Residents in the building's 14 apartments were forced to relocate after a Horry County code enforcer deemed the building uninhabitable.
MYRTLE BEACH 7/20/2002 0/0 $42,709 Lightning cause a fire at the Chuck Wagon Restaurant on Kings Highway.
MYRTLE BEACH 7/6/2006 0/0 $6,300 Lightning struck an ambulance, disabling it. No injuries were reported.
MYRTLE BEACH 7/15/2006 0/0 $31,498 A barn was heavily damaged due to fire.
MYRTLE BEACH 7/10/2008 0/0 $23,312 Lightning started fires in two homes in Carolina Forest.
MYRTLE BEACH 7/29/2012 0/1 $0
A man was in an open garage on 4091 Coyledom Ct in Myrtle Beach. He was on an aluminum ladder and was struck in the hand by lightning. He was treated and released at a local hospital.
Source: National Centers for Environmental Information
4.7.4 Probability of Future Occurrences According to Vaisala’s National Lightning Detection Network, Myrtle Beach is located in an area of the country that experienced an average of 6 to 20 lightning flashes per square mile per year between 2008 and 2017. Given this regular frequency of occurrence, it can be expected that future lightning events will continue to threaten life and cause property damages throughout the city. Therefore, the probability of occurrence for future lightning events in the City of Myrtle Beach is highly likely (100 percent annual probability).
4.8 NOR’EASTER
4.8.1 Background The Nor’easter is a particularly devastating type of coastal storm, named for the winds that blow in from the northeast and drive the storm up the U.S. East Coast alongside the Gulf Stream (a band of warm water that lies off the Atlantic coast). They are caused by the interaction of the jet stream with horizontal temperature gradients and generally occur during the fall and winter months when moisture and cold air are plentiful. Coastal storm events, such as Nor’easters, are notorious for producing heavy amounts of rain and snow, hurricane-force winds, and high surf that causes severe beach erosion and coastal flooding. The potential damage of a Nor’easter is similar to a hurricane or tropical storm system with the added risk of hail and snow, thereby threatening property and life with severe winds and flooding.

SECTION 4: HAZARD IDENTIFICATION AND ANALYSIS
City of Myrtle Beach Floodplain Management and Hazard Mitigation Plan
November 2020
4:21
4.8.2 Location and Spatial Extent Nor’easters affect the entire east coast of the United States and are thus a threat to the South Carolina coast. Therefore, the City of Myrtle Beach has uniform risk to the Nor’easter hazard.
4.8.3 Historical Occurrences December 1986: This Nor’easter reportedly had winds up to 40 miles per hour and waves 10 feet above sea level. January 1 & 2, 1987 This Nor’easter occurred less than a month after the previous storm and caused $15.5 million in damages (2020 dollars) in Horry County. The National Weather Service reported it as the worst storm in over a decade.
March 1993: This Nor’easter occurred during the annual Can-Am Fest, so it had a definite impact on the local economy. The exact monetary losses were not documented at the time but there has since been a methodology developed that can determine such losses should another event such as this one occur. It should also be noted that many of the repetitive loss properties that have been identified in the Flood section of this plan are considered repetitive loss properties because of flooding caused by recent nor’easter events.
4.8.4 Probability of Future Occurrences Given no recent occurrences, the probability of a Nor’easter occurring in Myrtle Beach is unlikely (less than 1 percent annual probability).
4.9 TORNADO/WATERSPOUT
4.9.1 Background A tornado is a violent windstorm characterized by a twisting, funnel-shaped cloud extending to the ground. Tornadoes are most often generated by thunderstorm activity (but sometimes result from hurricanes and other tropical storms) when cool, dry air intersects and overrides a layer of warm, moist air forcing the warm air to rise rapidly. The damage caused by a tornado is a result of the high wind velocity and wind-blown debris, also accompanied by lightning or large hail. According to the National Weather Service, tornado wind speeds normally range from 40 miles per hour to more than 300 miles per hour. The most violent tornadoes have rotating winds of 250 miles per hour or more and are capable of causing extreme destruction and turning normally harmless objects into deadly missiles. Similar to tornadoes, waterspouts have most of the same characteristics of a tornado except that they occur over water instead of land. Indeed land-based tornadoes can turn into waterspouts as they move out over a water body and vice versa.

SECTION 4: HAZARD IDENTIFICATION AND ANALYSIS
City of Myrtle Beach Floodplain Management and Hazard Mitigation Plan
November 2020
4:22
Each year, an average of over 800 tornadoes are reported nationwide, resulting in an average of 80 deaths and 1,500 injuries.7 According to the NOAA Storm Prediction Center (SPC), the highest concentration of tornadoes in the United States has been in Oklahoma, Texas, Kansas, and Florida respectively. Although the Great Plains region of the Central United States does favor the development of the largest and most dangerous tornadoes (earning the designation of “tornado alley”), Florida experiences the greatest number of tornadoes per square mile of all U.S. states (SPC, 2002). Comparatively, South Carolina ranks twenty-fourth in the nation for frequency. Figure 4.7 shows tornado activity in the United States based on the number of recorded tornadoes per 1,000 square miles.
Figure 4.7: Tornado Activity in the United States
Source: Federal Emergency Management Agency Tornadoes are more likely to occur during the months of March through May and are most likely to form in the late afternoon and early evening. Most tornadoes are a few dozen yards wide and touch down briefly, but even small short-lived tornadoes can inflict tremendous damage. Highly destructive tornadoes may carve out a path over a mile wide and several miles long. The destruction caused by tornadoes ranges from light to inconceivable depending on the intensity, size and duration of the storm. Typically, tornadoes cause the greatest damage to structures of light construction, including residential dwellings (particularly mobile homes). Tornadic magnitude is reported according to the Fujita and Enhanced Fujita Scales. Tornado magnitudes prior to 2005 were determined
7 NOAA, 2007.

SECTION 4: HAZARD IDENTIFICATION AND ANALYSIS
City of Myrtle Beach Floodplain Management and Hazard Mitigation Plan
November 2020
4:23
using the traditional version of the Fujita Scale (Table 4.12). Tornado magnitudes that were determined in 2005 and later were determined using the Enhanced Fujita Scale (Table 4.13).
Table 4.12: The Fujita Scale (Effective Prior to 2005)
F-SCALE NUMBER
INTENSITY WIND SPEED TYPE OF DAMAGE DONE
F0 GALE
TORNADO 40–72 MPH
Some damage to chimneys; breaks branches off trees; pushes over shallow-rooted trees; damages to sign boards.
F1 MODERATE TORNADO
73–112 MPH
The lower limit is the beginning of hurricane wind speed; peels surface off roofs; mobile homes pushed off foundations or overturned; moving autos pushed off the roads; attached garages may be destroyed.
F2 SIGNIFICANT
TORNADO 113–157 MPH
Considerable damage. Roofs torn off frame houses; mobile homes demolished; boxcars pushed over; large trees snapped or uprooted; light object missiles generated.
F3 SEVERE
TORNADO 158–206 MPH
Roof and some walls torn off well-constructed houses; trains overturned; most trees in forest uprooted.
F4 DEVASTATING
TORNADO 207–260 MPH
Well-constructed houses leveled; structures with weak foundations blown off some distance; cars thrown, and large missiles generated.
F5 INCREDIBLE TORNADO
261–318 MPH
Strong frame houses lifted off foundations and carried considerable distances to disintegrate; automobile sized missiles fly through the air in excess of 100 meters; trees debarked; steel re-enforced concrete structures badly damaged.
F6 INCONCEIVABL
E TORNADO 319–379 MPH
These winds are very unlikely. The small area of damage they might produce would probably not be recognizable along with the mess produced by F4 and F5 wind that would surround the F6 winds. Missiles, such as cars and refrigerators would do serious secondary damage that could not be directly identified as F6 damage. If this level is ever achieved, evidence for it might only be found in some manner of ground swirl pattern, for it may never be identifiable through engineering studies.
Source: National Weather Service

SECTION 4: HAZARD IDENTIFICATION AND ANALYSIS
City of Myrtle Beach Floodplain Management and Hazard Mitigation Plan
November 2020
4:24
Table 4.13: The Enhanced Fujita Scale (Effective 2005 and Later)
4.9.2 Location and Spatial Extent Tornadoes occur throughout the state of South Carolina and the state as a whole experienced an average of 26 tornadoes per year in the period from 1990 to 2017.8 Tornadoes typically impact a relatively small area; however, events are completely random and it is not possible to predict specific areas that are more susceptible to tornado strikes over time. Therefore, it is assumed that Myrtle Beach is uniformly exposed to this hazard. Historical evidence shows that all of Myrtle Beach is vulnerable to tornadic activity. This hazard can result from severe thunderstorm activity or may occur during a hurricane or major tropical storm. In fact, historical evidence shows more frequent tornado point locations on the Myrtle Beach coastline. However, it cannot be predicted where a tornado may touch down, so all buildings and facilities are considered to be exposed to this hazard and could potentially be impacted.
4.9.3 Historical Occurrences According to NCEI, there have been a total of 7 recorded tornado/waterspout events in Myrtle Beach since 1996; however, it should be noted that 2 of these events were located far off the coast and did
8 South Carolina Department of Natural Resources, https://www.dnr.sc.gov/climate/sco/ClimateData/cli_table_tornado_stats.php
EF-SCALE NUMBER
INTENSITY PHRASE
3 SECOND GUST (MPH)
TYPE OF DAMAGE DONE
F0 GALE 65–85 Some damage to chimneys; breaks branches off trees; pushes over shallow-rooted trees; damages to sign boards.
F1 MODERATE 86–110
The lower limit is the beginning of hurricane wind speed; peels surface off roofs; mobile homes pushed off foundations or overturned; moving autos pushed off the roads; attached garages may be destroyed.
F2 SIGNIFICANT 111–135 Considerable damage. Roofs torn off frame houses; mobile homes demolished; boxcars pushed over; large trees snapped or uprooted; light object missiles generated.
F3 SEVERE 136–165 Roof and some walls torn off well-constructed houses; trains overturned; most trees in forest uprooted.
F4 DEVASTATING 166–200 Well-constructed houses leveled; structures with weak foundations blown off some distance; cars thrown, and large missiles generated.
F5 INCREDIBLE Over 200
Strong frame houses lifted off foundations and carried considerable distances to disintegrate; automobile sized missiles fly through the air in excess of 100 meters; trees debarked; steel re-enforced concrete structures badly damaged.
Source: National Weather Service

SECTION 4: HAZARD IDENTIFICATION AND ANALYSIS
City of Myrtle Beach Floodplain Management and Hazard Mitigation Plan
November 2020
4:25
not come ashore or cause major damage (Table 4.14).9 Thirty-nine injuries were reported as a result of a tornado event in 2001, and almost $11.6 million in property damages (2020 dollars) were caused by all recorded tornado events. The magnitude of these tornadoes ranged from F0 to F2 in intensity, with approximate touchdown locations for each major event where damage occurred shown in Figure 4.8. It is important to note that only tornadoes that have been reported are factored into this risk assessment. It is possible that a number of occurrences have gone unreported.
Table 4.14: Historical Tornado/Waterspout Impacts
Location Date Magnitude Deaths/ Injuries
Property Damage
(2020 dollars) Description
MYRTLE BEACH 7/23/1996 Waterspout 0/0 $0
Two waterspouts sighted off Myrtle Beach dissipated before coming ashore. No injuries of damage.
MYRTLE BEACH 7/24/1997 Waterspout 0/0 $0
Waterspout reported over the ocean just off Myrtle Beach.
MYRTLE BEACH 7/24/1997
Funnel Cloud 0/0 $0
Funnel cloud reported by Myrtle Beach Police Officer in the restaurant row section. Moving northeast.
MYRTLE BEACH 7/6/2001 F2 0/39 $11,555,786
As a weak cold front moved south into an afternoon sea breeze boundary, slow-moving thunderstorms developed along the Horry county coast. An F0 tornado briefly touched down at 9th Ave N near the Myrtle Beach Pavilion, and soon after a waterspout formed just off the beach near 3rd Ave N. It slightly damaged the 2nd Ave N pier and then moved over the beach as it developed more strongly, causing F2 damage - overturned buses and extensive damage to vehicles and hotels along the beach to about 4nd Ave S. Moving off the beach again, the waterspout continued south about 100 yards from the shore until it came ashore between 28th Ave S and Springmaid Pier causing a 66 knot gust over water at the Springmaid Pier anemometer. As it moved through the Seagate RV park, it did F1 damage - destroyed 10 RVs and damaged 40 more. Weakening further, the tornado crossed US Hwy Business 17 onto Myrtle Beach International Airport, doing F0 damage to trees and structures.
9 These tornado events are only inclusive of those reported by the National Centers for Environmental Information (NCEI) from
1950 through February 2020. It is possible that additional tornadoes have occurred in the City of Myrtle Beach. As additional local data becomes available, this hazard profile will be amended.

SECTION 4: HAZARD IDENTIFICATION AND ANALYSIS
City of Myrtle Beach Floodplain Management and Hazard Mitigation Plan
November 2020
4:26
Location Date Magnitude Deaths/ Injuries
Property Damage
(2020 dollars) Description
MYRTLE BEACH 7/23/2018 EF0 0/0 $509
A waterspout moved onto the beach near the 900 block of North Ocean Blvd. The 15-yard-wide funnel proceeded toward the boardwalk for about 100 yards before dissipating and caused no apparent damage to structures. However, beach chairs and umbrellas were tossed into the air. The tornado was rated an EF-0 by an NWS Storm Survey with wind gusts estimated at no more than 65 mph.
MYRTLE BEACH 9/16/2018 EF0 0/0 $0
Video captured a waterspout that came ashore as a tornado near 21st Ave in Myrtle Beach.
MYRTLE BEACH 9/16/2018 EF0 0/0 $0
The tornado, associated with a line of storms trailing Tropical Cyclone Florence, was shown live on air by a local television station as viewed from their skycam. It caused minor damage to |the tops of pine trees, breaking out numerous small limbs and a few large ones before it crossed Highway 17 moving west. Additional minor tree damage occurred on the west side of Highway 17 before the fast-moving tornado lifted.
Source: National Centers for Environmental Information
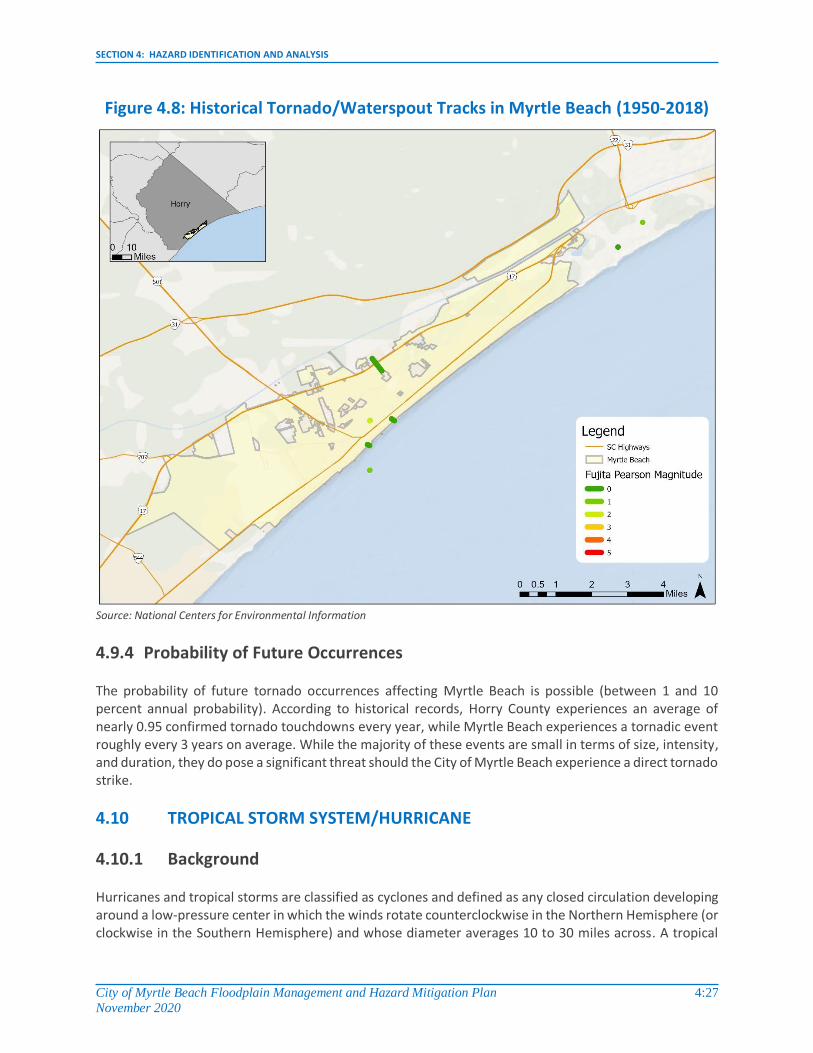
SECTION 4: HAZARD IDENTIFICATION AND ANALYSIS
City of Myrtle Beach Floodplain Management and Hazard Mitigation Plan
November 2020
4:27
Figure 4.8: Historical Tornado/Waterspout Tracks in Myrtle Beach (1950-2018)
Source: National Centers for Environmental Information
4.9.4 Probability of Future Occurrences The probability of future tornado occurrences affecting Myrtle Beach is possible (between 1 and 10 percent annual probability). According to historical records, Horry County experiences an average of nearly 0.95 confirmed tornado touchdowns every year, while Myrtle Beach experiences a tornadic event roughly every 3 years on average. While the majority of these events are small in terms of size, intensity, and duration, they do pose a significant threat should the City of Myrtle Beach experience a direct tornado strike.
4.10 TROPICAL STORM SYSTEM/HURRICANE
4.10.1 Background Hurricanes and tropical storms are classified as cyclones and defined as any closed circulation developing around a low-pressure center in which the winds rotate counterclockwise in the Northern Hemisphere (or clockwise in the Southern Hemisphere) and whose diameter averages 10 to 30 miles across. A tropical

SECTION 4: HAZARD IDENTIFICATION AND ANALYSIS
City of Myrtle Beach Floodplain Management and Hazard Mitigation Plan
November 2020
4:28
cyclone refers to any such circulation that develops over tropical waters. Tropical cyclones act as a “safety-valve,” limiting the continued build-up of heat and energy in tropical regions by maintaining the atmospheric heat and moisture balance between the tropics and the pole-ward latitudes. The primary damaging forces associated with these storms are high-level sustained winds, heavy precipitation, and tornadoes. Coastal areas are also vulnerable to the additional forces of storm surge, wind-driven waves and tidal flooding which can be more destructive than cyclone wind. The key energy source for a tropical cyclone is the release of latent heat from the condensation of warm water. Their formation requires a low-pressure disturbance, warm sea surface temperature, rotational force from the spinning of the earth, and the absence of wind shear in the lowest 50,000 feet of the atmosphere. The majority of hurricanes and tropical storms form in the Atlantic Ocean, Caribbean Sea, and Gulf of Mexico during the official Atlantic hurricane season, which encompasses the months of June through November. The peak of the Atlantic hurricane season is in early to mid-September and the average number of storms that reach hurricane intensity per year in this basin is about six. As an incipient hurricane develops, barometric pressure (measured in millibars or inches) at its center falls and winds increase. If the atmospheric and oceanic conditions are favorable, it can intensify into a tropical depression. When maximum sustained winds reach or exceed 39 miles per hour, the system is designated a tropical storm, given a name, and is closely monitored by the National Hurricane Center in Miami, Florida. When sustained winds reach or exceed 74 miles per hour the storm is deemed a hurricane. Hurricane intensity is further classified by the Saffir-Simpson Scale (Table 4.15), which rates hurricane intensity on a scale of 1 to 5, with 5 being the most intense.
Table 4.15: Saffir-Simpson Scale
Category Maximum Sustained Wind Speed (MPH)
Minimum Surface Pressure (Millibars)
Storm Surge (Feet)
1 74–95 Greater than 980 3–5
2 96–110 979–965 6–8
3 111–130 964–945 9–12
4 131–155 944–920 13–18
5 155 + Less than 920 19+
Source: National Hurricane Center
The Saffir-Simpson Scale categorizes hurricane intensity linearly based upon maximum sustained winds, barometric pressure and storm surge potential, which are combined to estimate potential damage. Categories 3, 4, and 5 are classified as “major” hurricanes, and while hurricanes within this range comprise only 20 percent of total tropical cyclone landfalls, they account for over 70 percent of the damage in the United States. Table 4.16 describes the damage that could be expected for each category of hurricane. Damage during hurricanes may also result from spawned tornadoes, storm surge, and inland flooding associated with heavy rainfall that usually accompanies these storms.

SECTION 4: HAZARD IDENTIFICATION AND ANALYSIS
City of Myrtle Beach Floodplain Management and Hazard Mitigation Plan
November 2020
4:29
Table 4.16: Hurricane Damage Classifications
4.10.2 Location and Spatial Extent Hurricanes and tropical storms threaten the entire Atlantic and Gulf seaboard of the United States, and while coastal areas are most directly exposed to the brunt of landfalling storms, their impact is often felt hundreds of miles inland. The City of Myrtle Beach is located in a region of the country that is susceptible to all of the hazards wrought by hurricanes and tropical storms. All areas throughout the City are susceptible to the accompanying hazard effects of extreme wind, flooding, and tornadoes, and coastal areas are also extremely susceptible to the added effects of storm surge, wave action, coastal erosion, and tidal flooding.10
4.10.3 Historical Occurrences According to NOAA historical storm track records, 140 hurricane or tropical storm tracks have passed within 75 miles of the City of Myrtle Beach since 1851. This includes: 0 Category 5 hurricanes; 4 Category 4 hurricanes; 5 Category 3 hurricanes; 14 Category 2 hurricanes; 35 Category 1 hurricanes; 74 tropical storms; 32 tropical depressions; and 24 extratropical storms. Of the 140 recorded storm events, 4 tropical storms had tracks that traversed directly through Myrtle Beach. Table 4.17 provides the storm name, date range of occurrence, maximum wind speed, minimum pressure, maximum and storm category for each event. Figure 4.9 shows the track of each recorded storm in relation to the City of Myrtle Beach and South Carolina.
10 Distinct hazard area locations for flooding, storm surge, wave action, and coastal erosion are discussed elsewhere in this section.
Storm Category
Damage Level
Description of Damages Photo
Example
1 MINIMAL No real damage to building structures. Damage primarily to unanchored mobile homes, shrubbery, and trees. Also, some coastal flooding and minor pier damage.
2 MODERATE
Some roofing material, door, and window damage. Considerable damage to vegetation, mobile homes, etc. Flooding damages piers and small craft in unprotected moorings may break their moorings.
3 EXTENSIVE
Some structural damage to small residences and utility buildings, with a minor amount of curtainwall failures. Mobile homes are destroyed. Flooding near the coast destroys smaller structures, with larger structures damaged by floating debris. Terrain may be flooded well inland.
4 EXTREME More extensive curtainwall failures with some complete roof structure failure on small residences. Major erosion of beach areas. Terrain may be flooded well inland.
5 CATASTROPHIC
Complete roof failure on many residences and industrial buildings. Some complete building failures with small utility buildings blown over or away. Flooding causes major damage to lower floors of all structures near the shoreline. Massive evacuation of residential areas may be required.
Sources: National Hurricane Center; Federal Emergency Management Agency

SECTION 4: HAZARD IDENTIFICATION AND ANALYSIS
City of Myrtle Beach Floodplain Management and Hazard Mitigation Plan
November 2020
4:30
Table 4.17: Historical Storm Tracks within 75 Miles of Myrtle Beach (1851-2020)

SECTION 4: HAZARD IDENTIFICATION AND ANALYSIS
City of Myrtle Beach Floodplain Management and Hazard Mitigation Plan
November 2020
4:31

SECTION 4: HAZARD IDENTIFICATION AND ANALYSIS
City of Myrtle Beach Floodplain Management and Hazard Mitigation Plan
November 2020
4:32

SECTION 4: HAZARD IDENTIFICATION AND ANALYSIS
City of Myrtle Beach Floodplain Management and Hazard Mitigation Plan
November 2020
4:33
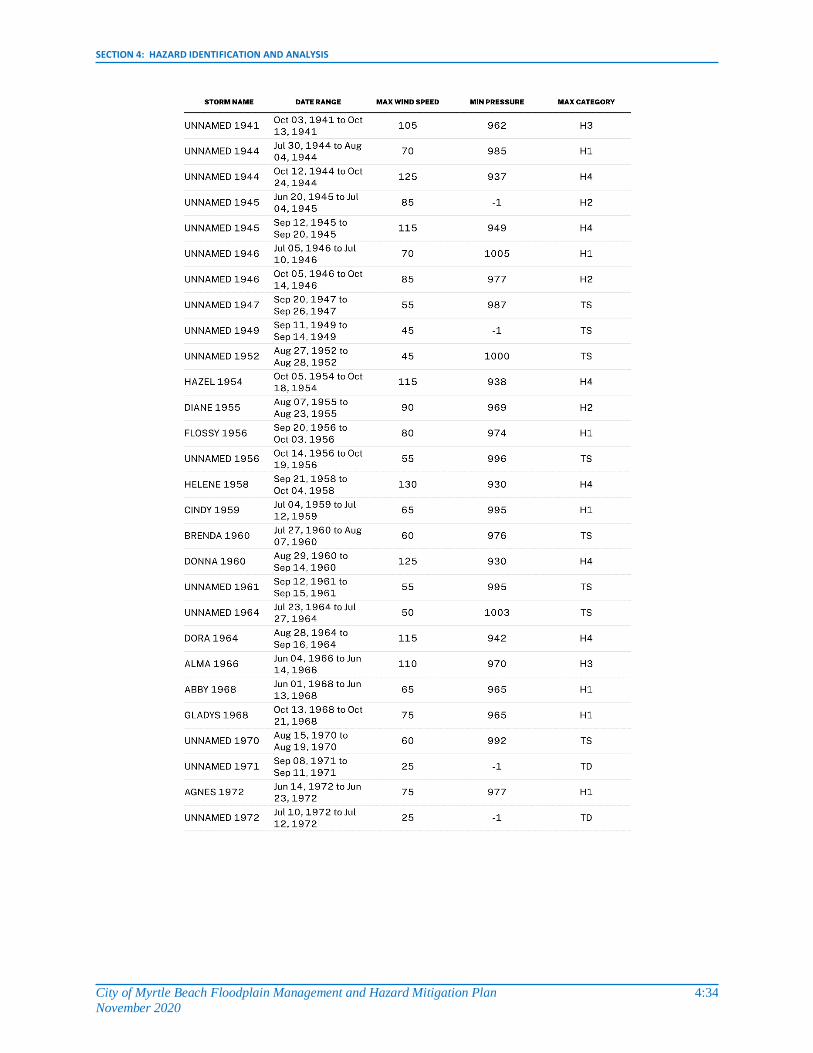
SECTION 4: HAZARD IDENTIFICATION AND ANALYSIS
City of Myrtle Beach Floodplain Management and Hazard Mitigation Plan
November 2020
4:34

SECTION 4: HAZARD IDENTIFICATION AND ANALYSIS
City of Myrtle Beach Floodplain Management and Hazard Mitigation Plan
November 2020
4:35
Source: National Oceanic and Atmospheric Administration

SECTION 4: HAZARD IDENTIFICATION AND ANALYSIS
City of Myrtle Beach Floodplain Management and Hazard Mitigation Plan
November 2020
4:36
Figure 4.9: Historical Hurricane Storm Tracks within 75 Miles of the City of Myrtle Beach
Source: National Oceanic and Atmospheric Administration Some of the more notable historical tropical cyclone events for the City of Myrtle Beach are described below (information from the National Centers for Environmental Information, National Weather Service, and National Hurricane Center): Hurricane Hazel, 1954 According to the National Hurricane Center, Hurricane Hazel, a Category 4 storm, was the last hurricane to directly hit the City of Myrtle Beach. Myrtle Beach, South Carolina reported a peak wind gust of 106 mph, and winds were estimated at 130 to 150 mph along the coast between Myrtle Beach and Cape Fear, North Carolina. The storm hit at the highest lunar tide of the year, resulting in increased storm surge and damage. It downed countless trees along the coast. (In fact, so many trees were downed that Hazel is said to have started Myrtle Beach as a tourist destination, clearing the land for golf course and condominium development.) Further, 80 percent of the buildings along the Myrtle Beach coast were destroyed. Hazel was responsible for 95 deaths and $2.3 billion in damages in the United States and $1.1 billion for the Carolinas. In South Carolina, 19 people were killed and over 200 were injured, in addition to the 15,000 homes being destroyed.

SECTION 4: HAZARD IDENTIFICATION AND ANALYSIS
City of Myrtle Beach Floodplain Management and Hazard Mitigation Plan
November 2020
4:37
Hurricane Hugo, 1989 (indirect hit) Hurricane Hugo, a Category 4 storm, reached Myrtle Beach on September 22, 1989. It caused 57 deaths in the U.S. and over $7 billion in damages (1989 dollars) - $6 million in Myrtle Beach alone. Up to that time, it was the costliest storm in history (later surpassed by Andrew and Katrina). Hurricane Matthew, 2016 Hurricane Matthew moved up the eastern seaboard, bringing very heavy rain and strong winds. Rainfall amounts were high, with over a foot of rain reported in many areas. A peak wind of 74 mph was reported at the Myrtle Beach Airport, with 70 mph measured at the North Myrtle Beach Airport. Wind gusts to hurricane strength and flooded ground caused widespread tree and power line damage. There were numerous reports of trees down across roads, hampering emergency responder's efforts. Structural damage included the loss of siding and shingles to many homes. Major river flooding occurred due to the crests of the Waccamaw and Little Pee Dee rivers. More than 170 roads in the county were closed. Over 1,000 residents of the county required shelter. The Conway-Horry County Airport was flooded. A section of the Pee Dee Highway was washed out. The Waccamaw crest at Conway set a new record, eclipsing the flood of 1928. Large portions of Socastee became submerged. Evacuations were conducted in the Bucksport Community. Flood damage was no less than incredible. There was major beach erosion at Myrtle Beach due to storm surge. Only about 100 feet of the more than 1,000 feet long Springmaid Pier was left standing after the storm. About 50 feet of the Surfside Beach Pier fell into the ocean during the storm. Horry County Emergency Management calculated more than 67 million dollars in damage across the county. Hurricane Michael, 2018 Hurricane Michael made landfall at Mexico Beach in the Florida Panhandle on Oct 10th as a strong Category 4. It weakened to Tropical Storm status as it made its way into the Carolinas. Most of the region received one to two inches of rainfall, with gusts to 50 mph. In Horry County, wind blew down two trees on Cherokee Street. Roof damage was reported at the Calypso Inn in Myrtle Beach. Damage was reported to some siding of an apartment on Palmetto Point Blvd.
4.10.4 Probability of Future Occurrences The probability of future hurricane and tropical storm events for the City of Myrtle Beach is likely (between 10 and 100 percent annual probability). According to NOAA statistical data, the city is located in an area with an annual probability of a named storm between 48 and 54 percent as presented in Figure 4.10. This illustration was created by the National Oceanic and Atmospheric Administration’s Hurricane Research Division using data from 1944 to 1999 and counting hits when a storm or hurricane was within approximately 100 miles (165 km) of each location. As a reference point, the tip of Florida’s outline can be found near the 25N, 80W intersection, and Myrtle Beach is near the 35N, 85W intersection. This empirical probability is fairly consistent with other scientific studies and observed historical data made available through a variety of federal, state, and local sources.

SECTION 4: HAZARD IDENTIFICATION AND ANALYSIS
City of Myrtle Beach Floodplain Management and Hazard Mitigation Plan
November 2020
4:38
Figure 4.10: Empirical Probability of a Named Hurricane or Tropical Storm
Source: National Oceanic and Atmospheric Administration
The probability of storm occurrences will vary significantly based on the return interval for different categories of magnitude. The probability of less intense storms (lower return periods) is higher than more intense storms (higher return periods). Table 4.18 profiles the potential peak gust wind speeds that can be expected in the City of Myrtle Beach during a hurricane event for various return periods according to FEMA’s HAZUS-MH®.
Table 4.18: Potential Peak Gust Wind Speeds per Return Period
10-Year 20-Year 50-Year 100-Year 200-Year 500-Year 1,000-Year
64.4 mph 80.2 mph 100.9 mph 113.0 mph 123.1 mph 135.7 mph 143.1 mph
Source: Federal Emergency Management Agency (Hazus-MH 4.2)
4.11 WIND EVENTS (THUNDERSTORM/HIGH WIND)
4.11.1 Background Severe thunderstorms are common throughout South Carolina and occur throughout most of the year. Thunderstorms can produce a variety of accompanying hazards including wind (discussed here), hail, and lightning.11 Although thunderstorms generally affect a small area, they are very dangerous may cause substantial property damage. Three conditions need to occur for a thunderstorm to form. First, it needs moisture to form clouds and rain. Second, it needs unstable air, such as warm air that can rise rapidly (this often referred to as the
11 Lightning and Hail are discussed in detail as separate hazards in this section.
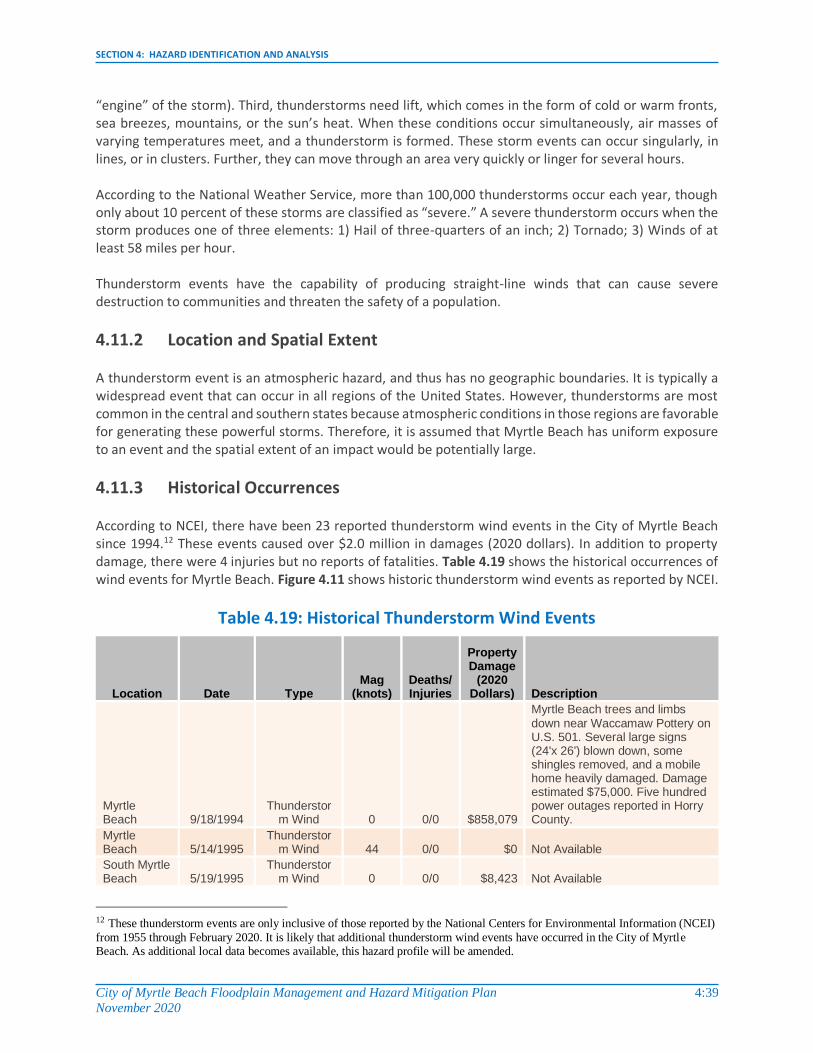
SECTION 4: HAZARD IDENTIFICATION AND ANALYSIS
City of Myrtle Beach Floodplain Management and Hazard Mitigation Plan
November 2020
4:39
“engine” of the storm). Third, thunderstorms need lift, which comes in the form of cold or warm fronts, sea breezes, mountains, or the sun’s heat. When these conditions occur simultaneously, air masses of varying temperatures meet, and a thunderstorm is formed. These storm events can occur singularly, in lines, or in clusters. Further, they can move through an area very quickly or linger for several hours. According to the National Weather Service, more than 100,000 thunderstorms occur each year, though only about 10 percent of these storms are classified as “severe.” A severe thunderstorm occurs when the storm produces one of three elements: 1) Hail of three-quarters of an inch; 2) Tornado; 3) Winds of at least 58 miles per hour. Thunderstorm events have the capability of producing straight-line winds that can cause severe destruction to communities and threaten the safety of a population.
4.11.2 Location and Spatial Extent A thunderstorm event is an atmospheric hazard, and thus has no geographic boundaries. It is typically a widespread event that can occur in all regions of the United States. However, thunderstorms are most common in the central and southern states because atmospheric conditions in those regions are favorable for generating these powerful storms. Therefore, it is assumed that Myrtle Beach has uniform exposure to an event and the spatial extent of an impact would be potentially large.
4.11.3 Historical Occurrences According to NCEI, there have been 23 reported thunderstorm wind events in the City of Myrtle Beach since 1994.12 These events caused over $2.0 million in damages (2020 dollars). In addition to property damage, there were 4 injuries but no reports of fatalities. Table 4.19 shows the historical occurrences of wind events for Myrtle Beach. Figure 4.11 shows historic thunderstorm wind events as reported by NCEI.
Table 4.19: Historical Thunderstorm Wind Events
Location Date Type Mag
(knots) Deaths/ Injuries
Property Damage
(2020 Dollars) Description
Myrtle Beach 9/18/1994
Thunderstorm Wind 0 0/0 $858,079
Myrtle Beach trees and limbs down near Waccamaw Pottery on U.S. 501. Several large signs (24'x 26') blown down, some shingles removed, and a mobile home heavily damaged. Damage estimated $75,000. Five hundred power outages reported in Horry County.
Myrtle Beach 5/14/1995
Thunderstorm Wind 44 0/0 $0 Not Available
South Myrtle Beach 5/19/1995
Thunderstorm Wind 0 0/0 $8,423 Not Available
12 These thunderstorm events are only inclusive of those reported by the National Centers for Environmental Information (NCEI)
from 1955 through February 2020. It is likely that additional thunderstorm wind events have occurred in the City of Myrtle Beach. As additional local data becomes available, this hazard profile will be amended.

SECTION 4: HAZARD IDENTIFICATION AND ANALYSIS
City of Myrtle Beach Floodplain Management and Hazard Mitigation Plan
November 2020
4:40
Location Date Type Mag
(knots) Deaths/ Injuries
Property Damage
(2020 Dollars) Description
South Myrtle Beach 5/19/1995
Thunderstorm Wind 0 0/0 $8,423 Telephone pole down.
Myrtle Beach 7/24/1995
Thunderstorm Wind 0 0/0 $0
Trees down near Bucksport and Lakewood Campground.
MYRTLE BEACH 4/26/1996
Thunderstorm Wind 60 0/0 $0
Vents blown off roof of middle school.
MYRTLE BEACH 9/12/1997
Thunderstorm Wind - 0/2 $795,267
A rain loaded thunderstorm microburst hit the beach berm and hotel area along a 4-block strip (from 26th Ave - 30th Ave). Two people were injured (cuts from flying glass and bruises).
MYRTLE BEACH 11/2/1997
Thunderstorm Wind 55 0/0 $0
Strong winds downed power lines on south side of the city
MYRTLE BEACH 3/9/1998
Thunderstorm Wind 55 0/0 $6,323
Roofs damaged and trees downed on Bush Drive, near Waccamaw Pottery.
MYRTLE BEACH 3/21/1999
Thunderstorm Wind 75 0/2 $271,933
Wind from a severe thunderstorm blew out windows at Wyndham Myrtle Beach Resort and overturned 4 trailers in a Briarcliffe RV park, injuring two people. At a car lot, 29 cars had windows blown out. Hail was marble size. Power outages extended from the Briarcliffe area to North Myrtle Beach.
MYRTLE BEACH 8/9/2000
Thunderstorm Wind 62 0/0 $0
A 62-knot wind gust was measured by an anemometer on Springmaid Pier.
MYRTLE BEACH 8/11/2000
Thunderstorm Wind 55 0/0 $0
Lifeguard stands were reported to be blown over.
MYRTLE BEACH 4/1/2001
Thunderstorm Wind 60 0/0 $21,741
The railing of a canopy was blown off at the cinema in Colonial Mall.
MYRTLE BEACH 4/17/2006
Thunderstorm Wind 65 0/0 $1,272
Power lines down on 13th and 14th Street South.
MYRTLE BEACH 7/11/2007
Thunderstorm Wind 70 0/0 $18,463
Survey concluded straight line winds of around 80 mph caused spotty damage along a path 500 yards long and 60 yards wide in the Emerald Lakes subdivision, just off of US Highway 501. Tops of softwood trees were snapped. Damage to several homes included roofing, windows and siding.
MYRTLE BEACH 7/26/2010
Thunderstorm Wind 52 0/0 $17,641
Power lines were reported down at the intersection of 21st Avenue and Seaboard Street. The time was estimated based on radar data.

SECTION 4: HAZARD IDENTIFICATION AND ANALYSIS
City of Myrtle Beach Floodplain Management and Hazard Mitigation Plan
November 2020
4:41
Location Date Type Mag
(knots) Deaths/ Injuries
Property Damage
(2020 Dollars) Description
MYRTLE BEACH 7/26/2010
Thunderstorm Wind 52 0/0 $23,521
Electric poles and wires were reported down, blocking traffic on 2nd Avenue near Flagg Street. The time was estimated based on radar data.
(MYR) MYRTLE BEACH AF 8/4/2011
Thunderstorm Wind 50 0/0 $1,132
A large tree was reported down along Farrow Parkway. The report was relayed by the media.
MYRTLE BEACH 7/15/2014
Thunderstorm Wind 56 0/0 $1,614
A mature maple tree was uprooted at Highway 17 Bypass and 38th Avenue N. The time was estimated based on radar data.
(MYR) MYRTLE BEACH AF 6/14/2018
Thunderstorm Wind 50 0/0 $509
A tree was blown down in Market Common in Myrtle Beach.
MYRTLE BEACH 5/31/2019
Thunderstorm Wind 52 0/0 $1,001
A large tree was blown down on the southbound lanes of the Hwy 17 bypass at 38th Ave in Myrtle Beach.
MYRTLE BEACH 2/7/2020
Thunderstorm Wind 56 0/0 $0
There was minor structural damage at Robert Grissom Pkwy and 38th and 29th Avenue N.
MYRTLE BEACH 2/7/2020
Thunderstorm Wind 56 0/0 $0
Large palm trees were blown down near Fire Station 2.
Source: National Centers for Environmental Information

SECTION 4: HAZARD IDENTIFICATION AND ANALYSIS
City of Myrtle Beach Floodplain Management and Hazard Mitigation Plan
November 2020
4:42
Figure 4.11: Historic Thunderstorm Wind Events (1955-2018)
Source: National Centers for Environmental Information
4.11.4 Probability of Future Occurrences Given the high number of previous events and favorable atmospheric conditions of the area, it is certain that wind events, including straight-line winds, will occur in the future. Therefore, the probability of future occurrence is considered highly likely (100 percent annual probability).
GEOLOGIC HAZARDS
4.12 EARTHQUAKE
4.12.1 Background An earthquake is movement or trembling of the ground produced by sudden displacement of rock in the Earth's crust. Earthquakes result from crustal strain, volcanism, landslides, or the collapse of caverns. Earthquakes can affect hundreds of thousands of square miles, cause damage to property measured in

SECTION 4: HAZARD IDENTIFICATION AND ANALYSIS
City of Myrtle Beach Floodplain Management and Hazard Mitigation Plan
November 2020
4:43
the tens of billions of dollars, result in loss of life and injury to hundreds of thousands of persons, and disrupt the social and economic functioning of the affected area. Most property damage and earthquake-related deaths are caused by the failure and collapse of structures due to ground shaking. The level of damage depends upon the amplitude and duration of the shaking, which are directly related to the earthquake size, distance from the fault, site, and regional geology. Other damaging earthquake effects include landslides, the down-slope movement of soil and rock (mountain regions and along hillsides), and liquefaction, in which ground soil loses the ability to resist shear and flows much like quicksand. In the case of liquefaction, anything relying on the substrata for support can shift, tilt, rupture, or collapse. Most earthquakes are caused by the release of stresses accumulated as a result of the rupture of rocks along opposing fault planes in the Earth’s outer crust. These fault planes are typically found along borders of the Earth's 10 tectonic plates. The areas of greatest tectonic instability occur at the perimeters of the slowly moving plates, as these locations are subjected to the greatest strains from plates traveling in opposite directions and at different speeds. Deformation along plate boundaries causes strain in the rock and the consequent buildup of stored energy. When the built-up stress exceeds the rocks' strength, a rupture occurs. The rock on both sides of the fracture is snapped, releasing the stored energy and producing seismic waves, generating an earthquake. Earthquakes are measured in terms of their magnitude and intensity. Magnitude is measured using the Richter Scale, an open-ended logarithmic scale that describes the energy release of an earthquake through a measure of shock wave amplitude (Table 4.20). Each unit increase in magnitude on the Richter Scale corresponds to a 10-fold increase in wave amplitude, or a 32-fold increase in energy. Intensity is most commonly measured using the Modified Mercalli Intensity (MMI) Scale based on direct and indirect measurements of seismic effects. The scale levels are typically described using roman numerals, with a I corresponding to imperceptible (instrumental) events, IV corresponding to moderate (felt by people awake), to XII for catastrophic (total destruction). A detailed description of the Modified Mercalli Intensity Scale of earthquake intensity and its correspondence to the Richter Scale is given in Table 4.21.
Table 4.20: Richter Scale
RICHTER MAGNITUDES
EARTHQUAKE EFFECTS
< 3.5 Generally, not felt but recorded.
3.5 - 5.4 Often felt, but rarely causes damage.
5.4 - 6.0 At most slight damage to well-designed buildings. Can cause major damage to poorly constructed buildings over small regions.
6.1 - 6.9 Can be destructive in areas up to about 100 kilometers across where people live.
7.0 - 7.9 Major earthquake. Can cause serious damage over larger areas.
8 or > Great earthquake. Can cause serious damage in areas several hundred kilometers across.
Source: Federal Emergency Management Agency

SECTION 4: HAZARD IDENTIFICATION AND ANALYSIS
City of Myrtle Beach Floodplain Management and Hazard Mitigation Plan
November 2020
4:44
Table 4.21: Modified Mercalli Intensity Scale for Earthquakes
SCALE INTENSITY DESCRIPTION OF EFFECTS CORRESPONDING RICHTER SCALE
MAGNITUDE
I INSTRUMENTAL Detected only on seismographs.
II FEEBLE Some people feel it. < 4.2
III SLIGHT Felt by people resting; like a truck rumbling by.
IV MODERATE Felt by people walking.
V SLIGHTLY STRONG
Sleepers awake; church bells ring. < 4.8
VI STRONG Trees sway; suspended objects swing, objects fall off shelves.
< 5.4
VII VERY STRONG Mild alarm; walls crack; plaster falls. < 6.1
VIII DESTRUCTIVE Moving cars uncontrollable; masonry fractures, poorly constructed buildings damaged.
IX RUINOUS Some houses collapse; ground cracks; pipes break open.
< 6.9
X DISASTROUS Ground cracks profusely; many buildings destroyed; liquefaction and landslides widespread.
< 7.3
XI VERY
DISASTROUS
Most buildings and bridges collapse; roads, railways, pipes and cables destroyed; general triggering of other hazards.
< 8.1
XII CATASTROPHIC Total destruction; trees fall; ground rises and falls in waves.
> 8.1
Source: Federal Emergency Management Agency
4.12.2 Location and Spatial Extent The greatest earthquake threat in the United States is along tectonic plate boundaries and seismic fault lines located in the central and western states; however, the East Coast does face moderate risk to less frequent, less intense earthquake events. Figure 4.12 shows relative seismic risk for the United States and Figure 4.13 shows the fault lines in South Carolina.

SECTION 4: HAZARD IDENTIFICATION AND ANALYSIS
City of Myrtle Beach Floodplain Management and Hazard Mitigation Plan
November 2020
4:45
Figure 4.12: United States Earthquake Hazard Map
Source: United States Geological Survey
Figure 4.13: Fault Lines in South Carolina
Source: http://www.dnr.sc.gov/geology/earthquake.htm13
13 Maybin, A.H., Clendenin, C.W., Jr., Assisted by Daniels, D.L., 1998, Structural features map of South Carolina: South Carolina Geological Survey General Geologic Map Series, 1p.

SECTION 4: HAZARD IDENTIFICATION AND ANALYSIS
City of Myrtle Beach Floodplain Management and Hazard Mitigation Plan
November 2020
4:46
4.12.3 Historical Occurrences According to the National Geophysical Data Center (NGDC), only one significant earthquake has occurred in South Carolina – the Charleston Earthquake of 1886. During this event, Horry County experienced a magnitude of VI (Strong) on the Modified Mercalli Intensity (MMI) Scale. There have also been three notable earthquakes as identified by the NGDC in Table 4.22. Although there have been more than two hundred minimal earthquakes reported in South Carolina since 2001, none of these events caused any significant damage and many were not even strong enough to be felt by people.
Table 4.22 Historical Earthquakes Experienced in Myrtle Beach
Location Date Magnitude (MMI)
Myrtle Beach 3/12/1960 4
Myrtle Beach AFB 2/3/1972 5
Myrtle Beach 11/22/1974 5
Figure 4.14 shows the earthquake epicenters that have occurred around the City of Myrtle Beach starting in 1986 and through 2020.
Figure 4.14: Historic Earthquakes near Myrtle Beach (1986-2020)

SECTION 4: HAZARD IDENTIFICATION AND ANALYSIS
City of Myrtle Beach Floodplain Management and Hazard Mitigation Plan
November 2020
4:47
Source: United States Geological Survey
4.12.4 Probability of Future Occurrences The probability of significant, damaging earthquake events affecting the City of Myrtle Beach is possible (between 1 and 10 percent annual probability). According to the United States Geological Survey (USGS), Myrtle Beach resides in an area with a moderate seismic risk (Figure 4.15). This risk is for earthquakes resulting in light to moderate perceived shaking and damages ranging from very light to moderate. More destructive earthquakes are very rare, low probability events for Myrtle Beach.
Figure 4.15: Seismic Hazard Map for South Carolina
Source: United States Geological Survey
4.13 TIDAL WAVE/TSUNAMI
4.13.1 Background A tsunami is a series of great waves that are created by undersea disturbances such as earthquakes or volcanic eruptions. From the area of disturbance, tsunami waves will travel outward in all directions. Tsunamis can originate hundreds or even thousands of miles away from coastal areas. The time between wave crests may be five to ninety minutes and the open ocean wave speed may average 450 miles per hour. As tsunami waves approach shallow coastal waters, they appear normal in size and the speed decreases until the waves near the shoreline, where it may grow to great height and crash into the shore. Areas at greatest risk are less than 50 feet above sea level and within one mile of the shoreline. Rapid changes in the ocean water level may indicate that a tsunami is approaching. Most deaths during a

SECTION 4: HAZARD IDENTIFICATION AND ANALYSIS
City of Myrtle Beach Floodplain Management and Hazard Mitigation Plan
November 2020
4:48
tsunami are the result of drowning. Associated risks include flooding, polluted water supplies, and damaged gas lines.
4.13.2 Location and Spatial Extent In the United States, tsunamis have historically affected the West Coast, but the threat of tsunami inundation is also possible on the Atlantic Coast. Pacific Ocean tsunamis are classified as local, regional, or Pacific-wide. Regional tsunamis are most common. While Pacific-wide tsunamis are much less common, with the last one being recorded in 1964, they tend to generate larger waves, which can cause significant destruction. Two offshore areas are currently under investigation according to a 2002 National Geophysical Data Center report. One area of interest consists of large cracks northeast of Cape Hatteras that could signal the early stages of an underwater landslide that could result in a tsunami. The other area of interest consists of submarine canyons approximately 150 kilometers from Atlantic City, New Jersey. A significant factor for consideration with regard to these areas is recent discoveries along the East Coast that demonstrate the existence of pressurized hydrates and pressurized water layers in the continental shelf. This has produced speculation among the scientific community on possible triggers that could cause sudden and perhaps violent releases of compressed material that may cause landslides and tsunami waves. Figure 4.16 depicts a scenario presented in the Horry County Emergency Operations Plan that estimates what could happen if an earthquake of 9.0M were to occur in the Puerto Rico Trench. This model was developed by the NOAA Tsunami Warning Center. The areas affected by the tsunami are shown in blue. This includes many highways out to Highway 17/Kings Highway.

SECTION 4: HAZARD IDENTIFICATION AND ANALYSIS
City of Myrtle Beach Floodplain Management and Hazard Mitigation Plan
November 2020
4:49
Figure 4.16: Tsunami Hazard Map for South Carolina
4.13.3 Historical Occurrences There is only one historical tsunami event reported to have directly affected the state of South Carolina. This event occurred in Cooper River, as a result of the 1886 Charleston Earthquake. However, as many as 40 tsunamis and tsunami-like waves have been documented in the Eastern United States since 1600. Tsunami events along the East Coast are not the result of traditional sources of tsunami waves (i.e., subduction zones such as the Cascadia Subduction Zone) but rather are typically the result of slumping or landsliding associated with local earthquakes or with wave action associated with strong storms such as hurricanes. Other possible causes of tsunami-like activity along the East Coast could include explosive decompression of underwater methane deposits, the impact of a heavenly body (i.e., an asteroid, comet, or oceanic meteor splashdown), or a large underwater explosion. One significant contributing factor to tsunami-related damage is the massive amount of moving debris possible during a tsunami event—including manmade debris such as boats and on-shore debris as the tsunami strikes land.

SECTION 4: HAZARD IDENTIFICATION AND ANALYSIS
City of Myrtle Beach Floodplain Management and Hazard Mitigation Plan
November 2020
4:50
To cite one commonly referenced example in terms of Atlantic tsunamis, a severe earthquake registering 7.2 on the Richter Scale on November 18, 1929 in the Grand Banks of Newfoundland generated a tsunami that caused considerable damage and loss of life at Placentia Bay, Newfoundland and is also known to have impacted the New England and mid-east shoreline.
4.13.4 Probability of Future Occurrences It is unlikely that a tidal wave or tsunami will occur in Myrtle Beach based on historic occurrences which have been few (less than 1 percent annual probability). However, some recent research into the potential for future tsunamis has shown that there is some chance of one occurring, albeit as a result of possibly different causes than most Pacific-based tsunamis. As noted by the National Geophysical Data Center, possible causes of Atlantic-based tsunamis include methane/pressurized water deposits and volcanic landslides. Indeed, some recent studies of past tsunamis along the east coast of the United States have revealed that some Atlantic tsunamis may have caused waves of around 3 meters in height.14 With that said, although a tsunami could impact the coastal United States, the relative infrequency of past events seems to indicate that the likelihood of such events is fairly low, especially when compared to other hazards that might impact the jurisdiction.
HYDROLOGIC HAZARDS
4.14 EROSION
4.14.1 Background Erosion is a hydrologic hazard defined as the wearing away of land or loss of beach, shoreline, or dune material. It is measured as the rate of change in the position or horizontal (landward) displacement of a shoreline over a period of time. Short-term erosion typically results from episodic natural events such as hurricanes and storm surge, windstorms, and flooding hazards but may be exacerbated by human activities such as boat wakes, removal of dune and vegetative buffers, shoreline hardening, and dredging. Long-term erosion is a function of multi-year impacts such as wave action, sea level rise, sediment loss, subsidence, and climate change. Climatic trends can change a beach from naturally accreting to eroding due to increased episodic erosion events caused by waves from an above-average number of storms and high tides or the long-term effects of fluctuations in sea level. Natural recovery from erosion can take years to decades. If a beach and dune system does not recover quickly enough naturally, coastal and upland property may be exposed to further damage in subsequent coastal erosion and flooding events. Human actions to supplement natural coastal recovery, such as beach nourishment, dune stabilization, and shoreline protection structures (e.g., sea walls, groins, jetties, etc.), can mitigate the hazard of coastal erosion. Death and injury are not associated with coastal erosion; however, it can cause the destruction of buildings and infrastructure and represents a major threat to the local economies of coastal communities that rely on the financial benefits of recreational beaches.
14 Tsunamis and Tsunami-Like Waves of the Eastern United States (2002), Science of Tsunami Hazards (Patricia A. Lockridge, Lowell S. Whiteside, and James F. Lander)

SECTION 4: HAZARD IDENTIFICATION AND ANALYSIS
City of Myrtle Beach Floodplain Management and Hazard Mitigation Plan
November 2020
4:51
4.14.2 Location and Spatial Extent All of the coastal areas in Myrtle Beach are susceptible to the coastal erosion hazard. These areas are subject to repeated, episodic coastal erosion events that threaten public and private property. However, the City replenishes the sand lost to coastal erosion through renourishment projects. Figure 4.17 shows the shoreline change rankings based on data from the South Carolina Department of Health and Environmental Control (SC DHEC). Most coastal areas are ranked Low Shoreline Change Rate (SCR); however, there are areas near Singleton Swash and Myrtle Beach State Park with Moderate to High SCR rankings.
Figure 4.17: Shoreline Change Rate (SCR) for Myrtle Beach
Source: South Carolina Department of Health and Environmental Control
4.14.3 Historical Occurrences According to the National Centers for Environmental Information, there have been three hurricane and tropical storm events that also had reported coastal erosion impacts in costal Horry County since 2014 as

SECTION 4: HAZARD IDENTIFICATION AND ANALYSIS
City of Myrtle Beach Floodplain Management and Hazard Mitigation Plan
November 2020
4:52
shown in Table 4.23.15 In addition, Hurricane Hazel (1954) reportedly caused 990,000 cubic yards of beach erosion. Because the erosion event was part of other hazard events (i.e., a hurricane), the monetary damage for the erosion alone is unknown.
Table 4.23: Historical Coastal Erosion Impacts
Location Date Deaths/ Injuries Description
COASTAL HORRY (ZONE) 7/3/2014 0/0
Hurricane Arthur moved up the eastern seaboard and became a Category 2 hurricane as it passed 40 miles to the east of Wilmington, North Carolina. Beach erosion was minimal. The storm exited the region in the early morning of July 4th.
COASTAL HORRY (ZONE) 5/9/2015 0/0
Slow moving Tropical Storm Ana produced tropical storm force winds with torrential rain for two days along the coast. The tidal surge was recorded at 2.3 feet at the Springmaid Pier with moderate beach erosion observed.
COASTAL HORRY (ZONE) 10/8/2016 0/0
Hurricane Matthew moved up the eastern seaboard, bringing very heavy rain and strong winds. There was major beach erosion at Myrtle Beach due to storm surge. Only about 100 feet of the more than 1000 feet long Springmaid Pier was left standing after the storm. About 50 feet of the Surfside Beach Pier fell into the ocean during the storm.
Source: National Centers for Environmental Information
The severity of coastal erosion is typically measured through a quantitative assessment of annual shoreline change for a given beach cross-section of profile (feet or meters per year) over a long period of time. Erosion rates vary as a function of shoreline type and are influenced primarily by episodic events but can be used in land use and hazard management to define areas of critical concern. According to a study prepared by the Heinz Center, much of the Grand Strand, including Myrtle Beach, experiences an average of two to three feet of erosion per year.16 However, more recent data from the Department of Health and Environmental Control in 2010 suggests that the erosion rate at all survey monuments in Myrtle Beach (station 5300 to 5505) is -0.59 feet per year.17 Shortly after Hurricane Hugo, the City of Myrtle Beach began large scale beach renourishment projects to mitigate erosion.18 Despite aforementioned rates of erosion, Myrtle Beach has made a commitment to beach renourishment. Sand is mined from offshore to replenish area beaches. It is projected that such projects will be necessary every 8 to 10 years in the City.
4.14.4 Probability of Future Occurrences Coastal erosion remains a natural, dynamic, and continuous process for the City’s coastal areas and its probability of occurrence is highly likely (100 percent annual probability). The damaging impacts of coastal
15 The reported erosion events are only inclusive of those reported by the National Centers for Environmental Information (NCEI). Additional erosion events have affected the City of Myrtle Beach. As additional local data becomes available, this hazard profile will be amended. 16 “Evaluation of Erosion Hazards” prepared by The H. John Heinz III Center for Science, Economics and the Environment, April 2000. www.heinzctr.org/NEW_WEB/PDF/erosnrpt.pdf#pagemode=bookmarks&view=Fit 17 South Carolina Department of Health and Environmental Control, 2010. 18 Schwab, William, et. al. “Coastal Change Along the Shore of Northeastern South Carolina – The South Carolina Coastal Erosion Study.” United State Geological Survey, Circular 1339: 2009. http://pubs.usgs.gov/circ/circ1339/pdf/circular1339.pdf

SECTION 4: HAZARD IDENTIFICATION AND ANALYSIS
City of Myrtle Beach Floodplain Management and Hazard Mitigation Plan
November 2020
4:53
erosion are lessened through continuous beach nourishment and structural shoreline protection measures; however, it is likely that the impacts of coastal erosion will increase in severity due to future episodic storm events as well as the anticipated slow onset, long-term effects of climate change and sea level rise (further discussed in the next section under Flood). Given the City’s long-term commitment to beach nourishment to mitigate erosion, no further analysis is performed in Section 5: Vulnerability Assessment.
4.15 FLOOD
4.15.1 Background Flooding is the most frequent and costly natural hazard in the United States; a hazard that has caused more than 10,000 deaths since 1900. Nearly 90 percent of presidential disaster declarations result from natural events where flooding was a major component. Floods generally result from excessive precipitation and can be classified under two categories: general floods, precipitation over a given river basin for a long period of time along with storm-induced wave, or tidal action; and flash floods, the product of heavy localized precipitation in a short time period over a given location. The severity of a flooding event is typically determined by a combination of several major factors, including stream and river basin topography and physiography; precipitation and weather patterns; recent soil moisture conditions; and the degree of vegetative clearing and impervious surface. General floods are usually long-term events that may last for several days. The primary types of general flooding include riverine, coastal, and urban flooding. Riverine flooding is a function of excessive precipitation levels and water runoff volumes within the watershed of a stream or river. Coastal flooding is typically a result of storm surge, wind-driven waves, and heavy rainfall produced by hurricanes, tropical storms, and other large coastal storms.19 Urban flooding occurs where manmade development has obstructed the natural flow of water and decreased the ability of natural groundcover to absorb and retain surface water runoff. Most flash flooding is caused by slow-moving thunderstorms in a local area or by heavy rains associated with hurricanes and tropical storms. However, flash flooding events may also occur from a dam or levee failure within minutes or hours of heavy amounts of rainfall or from a sudden release of water held by a retention basin or other stormwater control facility. Although flash flooding occurs most often along mountain streams, it is also common in urbanized areas where much of the ground is covered by impervious surfaces. The periodic flooding of lands adjacent to rivers, streams, and shorelines (land known as floodplain) is a natural and inevitable occurrence that can be expected to take place based upon established recurrence intervals. The recurrence interval of a flood is defined as the average time interval, in years, expected between a flood event of a particular magnitude and an equal or larger flood. Flood magnitude increases with increasing recurrence interval. Floodplains are designated by the frequency of the flood that is large enough to cover them. For example, the 10-year floodplain will be covered by the 10-year flood and the 100-year floodplain by the 100-year
19 While briefly mentioned here, coastal flooding is more thoroughly addressed under the “storm surge” hazard.

SECTION 4: HAZARD IDENTIFICATION AND ANALYSIS
City of Myrtle Beach Floodplain Management and Hazard Mitigation Plan
November 2020
4:54
flood. Flood frequencies such as the 100-year flood are determined by plotting a graph of the size of all known floods for an area and determining how often floods of a particular size occur. Another way of expressing the flood frequency is the chance of occurrence in a given year, which is the percentage of the probability of flooding each year. For example, the 100-year flood has a 1 percent chance of occurring in any given year, and the 500-year flood has a 0.2 percent chance of occurring in any given year.
4.15.2 Location and Spatial Extent Many areas of the City of Myrtle Beach are susceptible to flooding, and its coastal areas are also very susceptible to tidal and coastal flooding due to coastal storm events including storm surge, hurricanes, tropical storms, and nor’easters.20 Flooding from rainfall occurs along all six swashes in Myrtle Beach—Midway, Withers, Deep Head, Canepatch, Bear Branch, and Singleton—and in other low-lying areas. Flooding is exacerbated in these areas by high tides. When the discharge points of these drainage systems are blocked by a high tide, then the precipitation that has occurred upstream has nowhere to flow. Instead, the water floods low areas along natural watercourses and within the man-made storm water system. This high tide effect is apparent throughout the city since the discharge points of all drainage systems—the ocean, the swashes, and the Atlantic Intracoastal Waterway—are affected by the tides. Of these discharge points, however, the Intracoastal Waterway near the City is the least affected by the tides. Several other areas of the City have a history of flooding. The relatively flat topography and inadequately sized drainage facilities have combined to create ponding of storm water. Many of the frequently flooded areas that were identified in the last plan update have been mitigated through various stormwater projects. As a result, there are far fewer areas of concern during this update. The primary area of concern identified during the 2015 update of the plan is around the post office on 5th Avenue N. The city is currently working on a plan to mitigate this area and is hoping to mitigate it in the next few years. Flood areas can also be mapped using Geographic Information System (GIS) and FEMA Digital Flood Insurance Rate Maps (DFIRM). Figure 4.18 illustrates the location and extent of currently mapped special flood hazard areas for the City of Myrtle Beach based on best available FEMA Digital Flood Insurance Rate Map (DFIRM) data.21 This includes Zones A/AE (1-percent annual chance floodplain), Zone VE (coastal floodplain associated with wave action 1.5 feet to 3.5 feet) and Zone X500 (0.2-percent annual chance floodplain). According to GIS analysis, of the 23.39 square miles that make up Myrtle Beach, there are 1.74 square miles of land in the 1-percent annual chance floodplain, 0.08 square miles of land in the coastal floodplain, and 1.31 square miles of land in the 0.2-percent annual chance floodplain. It is important to note that while FEMA digital flood data is recognized as best available data for planning purposes, it does not always reflect the most accurate and up-to-date flood risk. Flooding and flood-related losses often do occur outside of delineated special flood hazard areas.
20 Storm surge is addressed separately within this section. 21 The DFIRM data used for the City of Myrtle Beach was last updated in 1999.

SECTION 4: HAZARD IDENTIFICATION AND ANALYSIS
City of Myrtle Beach Floodplain Management and Hazard Mitigation Plan
November 2020
4:55
Figure 4.18: Special Flood Hazard Areas in Myrtle Beach
Source: Federal Emergency Management Agency
Additional locations in the city that are vulnerable to flooding were identified by the FMHMPC at the Kickoff and Hazards Meeting. These locations and flooding issues are described in Table 4.24 below.
Table 4.24: Myrtle Beach Existing and Future Flooding Issues
Location
Past vs Future Flood Risk
Frequency Extent Source Cause Will it Get
Worse? Dam/Levee
Issue? Studies
Available?
Emmens Preserve – Market Commons Area
Past and future
Regular basis
Streets, front yards between houses, and backyards at easement; after 48 hours, area still too muddy to walk on; pool
Doolittle Lake; heavy rain
Lake overflow; drainage problem; used to be federal land with AFB – floodplains will be added in the
New development may have more impacts
No

SECTION 4: HAZARD IDENTIFICATION AND ANALYSIS
City of Myrtle Beach Floodplain Management and Hazard Mitigation Plan
November 2020
4:56
Location
Past vs Future Flood Risk
Frequency Extent Source Cause Will it Get
Worse? Dam/Levee
Issue? Studies
Available?
area flooded; retention ponds flooded
updated FIRMs
2nd Ave N and S Oak St
Past and future
Floods house (has a septic tank)
Heavy rain
Unaware of flood entering houses here
No
3rd Ave N and N Kings Hwy
Past and future
Flood Unaware of issues there; may be roadway flooding
No
4th Ave N and N Kings Hwy
Past and future
Flood Unaware of issues there; may be roadway flooding
No
5th Ave N and N Kings Hwy
Past and future
Flood Unaware of issues there; may be roadway flooding
No
Chestnut St off Kings Rd by Arcadian
Past and future
Flood No
Mallard Lake Dr near Juniper Drive
Past and future
Floods in front of cluster mailboxes
No
48th Ave N Park North
Past and future
Floods across road
Two ponds on 48th N
No
48th Ave N near Pine Lake Dr
Past and future
Flood No
Pinewood Rd near Pine Lake Dr
Past and future
Flood No
68th Ave N and Ocean Blvd to halfway to Porcher Dr (Ellery)
Past and future
Flood No
Graham Ave and King St
Past and future
Flood No

SECTION 4: HAZARD IDENTIFICATION AND ANALYSIS
City of Myrtle Beach Floodplain Management and Hazard Mitigation Plan
November 2020
4:57
Location
Past vs Future Flood Risk
Frequency Extent Source Cause Will it Get
Worse? Dam/Levee
Issue? Studies
Available?
Between 20th Ave S and Sailors Ct
Past and future
Flood No
402 11th Ave S – 4 apartments
Past and future
2015 and 2016
Bottom unit flooded
No
Between 204 and 206 Oak St
Past and future
Concentrated flow
No
Forest Drive
Past and future
Stormwater issue due to age and location; slow flow to private detention pond
Green Bay Trail
Past and future
Large ditch only accessible through private property
Yes
Settlers Drive
Past and future
Low-lying area is carried by open channels and driveway culvert
Ramsey Acres
Past and future
Poor drainage
Yes
Seaboard Street
Past and future
Poor drainage
Yes
32nd Avenue
Past and future
Heavy Rains and drainage
Yes
Cane Patch Swash
Roadway flooding
Poor drainage
Many of the areas described above are at risk to future flooding as a result of floodplain development, watershed development, and climate change/sea level rise. Development within the floodplain and watershed will both reduce the amount of impervious surface area that flood waters typically use for infiltration into the ground. This, in turn, will create conditions wherein additional volumes of water are “trapped” on the surface and cause flooding to people within the City of Myrtle Beach and their property.

SECTION 4: HAZARD IDENTIFICATION AND ANALYSIS
City of Myrtle Beach Floodplain Management and Hazard Mitigation Plan
November 2020
4:58
Climate change and sea level rise will contribute to worsening future flood conditions as these phenomena will effectively raise the water level within the community such that lesser volumes of rainwater from storms will be required to cause similar amounts of flooding that communities have experienced in the past. With a higher baseline water table, impacts to people and property will come with smaller storm events as there will be a reduced volume available for water infiltrate in to and so flooding will begin more quickly in future conditions. These conditions may all contribute to worsening the impacts of flooding on the community’s people, property, and the natural functions of the floodplain. Some of the impacts of flooding on these important assets of the community are described below. Impacts on People During flood events, people are often stranded and may have to be rescued by first responders. Often lives are lost or people are injured. Even when injuries and fatalities are avoided, the impact of flooding on the public can be great, as many people will be forced into shelters or will need to find temporary refuge as they wait for flooding to recede. They may be unable to return to their homes if the damage is great and may find their homes uninhabitable if personal property has become waterlogged and is unusable. Another major impact on people can be the deteriorating health conditions that result from flooding. After floodwaters recede, homes and personal property that were affected by water may begin to become infested with mold which can create serious health risks. Additionally, waterborne diseases can be pervasive in areas impacted by flooded sewer and water systems. Mosquitoes and other carriers of illnesses often thrive in post-flood conditions, increasing the chances of transmitting vector-borne diseases. All of the areas of potential future flooding described in the table above may experience these impacts, though areas that are more residential occupancy will affect people more directly. Areas that are more commercial-centric will have impacts on people as well as these businesses may have to be shut down, thereby hurting the economy and indirectly impacting the entire city. Finally, public confidence is often impacted by flood events, especially when impacted people do not have flood insurance and are not covered by their home insurance policy. This can create conflict between local officials and the public and result in a loss of public confidence. Impacts on Property Many buildings and structures could be impacted by a flood event, but critical infrastructure and facilities within the city are especially important to identify. When these facilities are located in flood-prone areas, there is a substantial risk to important functions such as law enforcement and medical care. This also includes any assets, systems, and networks that are vital to the continued operation of government services such as power generation facilities, transmission infrastructure, and road networks, among others. The incapacitation or destruction of these resources would have a debilitating and costly effect on many aspects of the City’s normal functionality. When flooding occurs, water and wastewater infrastructure are some of the most prominently impacted. Since these types of infrastructure deal directly with water, often they are located in the most flood prone areas and may be severely impacted during flood events. When

SECTION 4: HAZARD IDENTIFICATION AND ANALYSIS
City of Myrtle Beach Floodplain Management and Hazard Mitigation Plan
November 2020
4:59
these facilities or infrastructure are flooded, it complicates recovery and impacts people who are unable to utilize normal water sources for drinking, sanitation, and other everyday uses. In addition, personal property such as homes and businesses have been impacted by past flooding events and are a major concern in future flooding events. Although a great deal of effort has been undertaken to reduce the number of properties at risk through the use of progressively improved risk assessment and mitigation techniques, there are still a significant number of structures in the City that are located in flood zones or which have not been properly mitigated to reduce risk. These properties may sustain millions of dollars of damage during future flood events and are often a major focus of post-disaster recovery efforts. Based on the prediction of the growth in the area and the demand for housing development, this issue will only be exacerbated. Nearly all of the areas identified in the table above are areas that, if impacted, could have a serious effect on the built environment. Homes and businesses are one of the primary concerns throughout most of the City and flood considerations tend to revolve around the impact on the built environment because it also has an impact on people’s lives. Impacts on Natural Floodplain Functions The fluctuation of water levels in a wetland, especially flood waters, supports the biological diversity of low-lying areas by releasing nutrients into the soil and germinating wetland flora. Flooding also offers some control of invasive water weeds. Most features of the environment have come to adapt to the effects of a flood event and adjust quickly to events, although it is possible that some species may not be resilient enough to survive and will experience population loss. Areas that have been modified by human activity tend to suffer more negative consequences from flooding which can result from modifying stream banks or removing vegetation from riverside. When these modifications are present, flooding can cause unnatural erosion of sediment into the waterway and create an imbalance of nutrients in the water which may harm ecosystems and have a negative impact on downstream water quality. Problem statements describing what is going on in those identified areas to cause the flooding were also development by the FMHMPC at the Problems and Risk Assessment Meeting. These problem statements are listed in Table 4.25.
Table 4.25: Myrtle Beach Existing and Future Flooding Issues
Location Problem Statement(s)
Emmens Preserve – Market Commons Area
Previously designed by AFB and what it was utilized for then is different than what it is used for now in some areas. Large amount of development in short amount of time. Frequency flooding in the last several years.
16th Ave S Now connected to the new retention pond at 15th S which should solve any issues in this area
2nd Ave N and S Oak St Oak is a state-owned road. There was a weir wall which has recently been removed from a basin. As well as a basin and pipeline that has been cleaned and is functioning properly
3rd Ave N and N Kings Hwy
4th Ave N and N Kings Hwy 5th Ave N and N Kings Hwy
Chestnut St off Kings Rd by Arcadian Chestnut Street is county owned

SECTION 4: HAZARD IDENTIFICATION AND ANALYSIS
City of Myrtle Beach Floodplain Management and Hazard Mitigation Plan
November 2020
4:60
Location Problem Statement(s)
Mallard Lake Dr near Juniper Drive Temporary ponding. Dual pipes under roadway have recently been replaced in the past year. No calls on this area flooding during Isaias.
Martin St and Stanley Ave Temporary ponding – Could potentially add additional catch basins if deemed feasible.
48th Ave N Park North 48th State owned road. Neighborhood roads are privately owned.
48th Ave N near Pine Lake Dr Pipeline was installed to relieve ponding about 4 or 5ish years ago.
Pinewood Rd near Pine Lake Dr Ponding was relieved with swale enhancement and regrading 68th Ave N and Ocean Blvd to halfway to Porcher Dr (Ellery)
Swash
Graham Ave and King St Typically, due to residents not keeping yard basins clean.
Between 20th Ave S and Sailors Ct
402 11th Ave S – 4 apartments Building is lower than the street and water may be able to be redirected with a simple asphalt berm
Between 204 and 206 Oak St Comments in the previous block on page 1
Cannon Rd State owned
Cane Patch Swash Normally during a storm like a hurricane or tropical storm, issue where the swash will actually come up over Kings Highway and typically when we go to clean out the mouth of that swash it clears right up. City maintains the swash twice a week every week. Don’t know how much more effort could be put into that. Easily clogged. This happens naturally at all of the swash but this one in particular floods at the road. An overpass or bridge could be installed as a possible solution.
Seaboard St There is a lack of drainage in that area and lack of access to the drainage in that area; nuisance ponding. Need to educate residents on what flooding is vs. what ponding is. Street itself does not flood the ditches behind properties is the drainage issue.
Pine Dr Nuisance ponding. Lack of access to drainage pipes and ditches. Fences and such blocking easements. Need to educate residents on what flooding is vs. what ponding is.
Impact statements identifying potential issues from flooding related to life safety, public health, critical facilities, economy and employers, number/type of buildings, and public buildings were developed by FMHMPC at the Problems and Risk Assessment Meeting. These impact statements as well as any solutions are listed in Table 4.26.
Table 4.26: Myrtle Beach Flooding Impact Statements
Category Issue Solutions?
Life Safety
Search and rescue – more first responders, or else people will not be able to get the help they need in time so would be potential deaths/injuries
-Get more people to evacuate. -Vulnerable/disabled/special needs populations registered in system or have notification process in place on how they can be reached. They can notify us and it can be notified in CAD and that note will come up when we respond to that address. -Already have reverse 911. -CodeRED program may be something for the city to look at. Have an agreement with county on file. Have CodeRED at the region, can send out a blast and they sign up for it, can get the city signed into that as well (Matt will connect with Bruce).
Public Health Standing water – becomes issue with mosquitoes, mold
-Have contractors who spray for pests after a storm – city has 1 spray technician who covers the city every 5 days for flies and mosquitoes

SECTION 4: HAZARD IDENTIFICATION AND ANALYSIS
City of Myrtle Beach Floodplain Management and Hazard Mitigation Plan
November 2020
4:61
Category Issue Solutions?
-Education on how to dry out water from buildings/supplies/etc., or stay out of standing water -Public messaging, press releases at the time of the event and leading up to hurricane season
Critical Facilities -Already addressed in Flood Management Annex
Economy and Employers
Tourism industry – significant impact on local economy is possible during June, July, August; largest impact in September/October, fall shoulder season) when large groups come Residential neighborhoods impacted – workers couldn’t get out of neighborhoods to go to work Roadways – flooded roads blocked tourists
-Mitigative measures – a lot of communication, arming all call center and emergency operations centers, what businesses are open/closed, efforts to communicate most up-to-date information as it was changing hourly
Number/Type of Buildings
Varies based on type of event (widespread vs isolated) and the location of specific entities
-Communication and notification are key – access to location and services affected
Public Buildings Varies based on type of event (widespread vs isolated) and the location of specific entities
-Communication and notification are key – access to location and services affected
4.15.3 Historical Occurrences Information from the National Centers for Environmental Information was used to ascertain historical flood occurrence events. Additional events were reported by the City which have also been included. In total, there have been 48 flood events in the City of Myrtle Beach since 1954.22, 23 As shown in Table 4.27, there was over $3.1 million (2020 dollars) in property damage due to flood events throughout the City.24
Table 4.27: Historical Flood Impacts
Location Date Type Deaths/ Injuries
Property Damage
(2020 dollars) Description
Myrtle Beach* 10/15/1954 Flooding 0/0 $0 Hurricane Hazel caused flooding in Myrtle Beach.
Myrtle Beach* 10/2/1989 Flooding 0/0 $0
Kings Highway/ US 17 Bypass and Haskel Circle were closed due to 4 inches of rain in 2 hours.
Myrtle Beach* 8/10/1990 Flooding 0/0 $0
Kings Highway/ US 17 Bypass was closed due to 3.01 inches of rain in 2 hours.
Myrtle Beach* 8/4/1992 Flooding 0/0 $0
Kings Highway/ US 17 Bypass was closed due to 3.1 inches of rain in 2 hours
Myrtle Beach* 10/7/1992 Flooding 0/0 $0
Kings Highway/ US 17 Bypass was closed due to 3.3 inches of rain in 2 hours.
22 These flood events are inclusive of those reported by the National Centers for Environmental Information (NCEI) from 1996 through February 2020. They also include additional local data provided by the City. 23 Some of these events are from a single storm or hurricane event that lasted several days. 24 Adjusted dollar values were calculated based on the average Consumer Price Index for All Urban Consumers (CPI-U) U.S.
city average series for all items, not seasonally adjusted. This data represents changes in the prices of all goods and services purchased for consumption by urban households. This monthly index value has been calculated every year since 1913. The 2020 dollar values were calculated based on buying power in May 2020.

SECTION 4: HAZARD IDENTIFICATION AND ANALYSIS
City of Myrtle Beach Floodplain Management and Hazard Mitigation Plan
November 2020
4:62
Location Date Type Deaths/ Injuries
Property Damage
(2020 dollars) Description
Myrtle Beach* 10/14/1994 Flooding 0/0 $0
Kings Highway/ US 17 Bypass and Haskel Circle were closed due to 4 inches of rain in 2 hours. In addition, backyards flooded.
Myrtle Beach* 12/22/1994
Heavy Rains/
Flooding 2/0 $217,354
Heavy rains caused considerable street flooding in Myrtle Beach. There were many traffic accidents and one apparent hit and run accident in Myrtle Beach caused a fatality. The Forest Acres Apartment Complex right on the beach was evacuated with up to 3 feet of water reported in some coastal homes. Some crop damage reported.
Myrtle Beach* 12/23/1994 Flooding 0/0 $0
Rain began in the early evening and continued through the next dumping 3 inches of rain in 6 hours.
Myrtle Beach* 12/24/1994 Flooding 0/0 $0 A project area was severely flooded due to 2.5 inches of rain in 6 hours.
Myrtle Beach* 10/7/1995 Flooding 0/0 $0 A project area was severely flooded due to 2.5 inches of rain in 6 hours.
Myrtle Beach* 7/11/1996 Flooding 0/0 $0 Hurricane Bertha caused 0.5 inches of rain in 24 hours.
Myrtle Beach* 7/12/1996 Flooding 0/0 $0 Hurricane Bertha caused 0.1 inches of rain in 24 hours.
Myrtle Beach* 9/4/1996 Flooding 0/0 $0 Hurricane Fran caused 0.46 inches of rain in 24 hours.
Myrtle Beach* 9/5/1996 Flooding 0/0 $0 Hurricane Fran caused 0.05 inches of rain in 24 hours.
Myrtle Beach* 9/6/1996 Flooding 0/0 $0 Hurricane Fran caused 0.2inches of rain in 24 hours.
Myrtle Beach* 10/8/1996 Flooding 0/0 $0 2.25 inches of rain in 2 hours caused Kings Highway to close.
Myrtle Beach* 7/30/1997 Flooding 0/0 $0 3.75 inches of rain in 2 hours closed Kings Highways and Haskel Circle.
Myrtle Beach 1/23/1998 Flash Flood 0/0 $0
Heavy rains during the early morning caused some minor flooding on some secondary roads in Horry County. Jordanville Road was closed for a short time.
Myrtle Beach* 2/5/1998 Flooding 0/0 $0 Kings Highway closed as result of 4.5 inches of rain in 2 hours.
Myrtle Beach* 2/17/1998 Flooding 0/0 $0
Nearly 7 inches of rain (including 4.2 inches in two hours) fell on parts of Myrtle Beach resulting in extensive flooding. (this entry was reported from NCDC and the city)
Myrtle Beach 7/31/1998 Flash Flood 0/0 $0
Thunderstorm rains measured 3 to 4 inches, flooding parts of the city. Water approximately 2 feet deep was reported on Kings Hwy between 9th and 11th Avenue.
Myrtle Beach* 8/7/1998 Flooding 0/0 $0 Hurricane Bonnie caused 2.5 inches of rain in two hours.

SECTION 4: HAZARD IDENTIFICATION AND ANALYSIS
City of Myrtle Beach Floodplain Management and Hazard Mitigation Plan
November 2020
4:63
Location Date Type Deaths/ Injuries
Property Damage
(2020 dollars) Description
Myrtle Beach* 9/22/1998 Flooding 0/0 $0 Hurricane Hugo caused flooding throughout Myrtle Beach.
Myrtle Beach 6/15/1999 Flash Flood 0/0 $38,567
A slow-moving thunderstorm dropped about 4 inches of rain on Myrtle Beach during the afternoon. Drainage pipes were unable to accommodate the runoff at the corner of Ocean Blvd and 55 Ave N, where ponding reached a depth of 5 feet, necessitating the evacuation of 140 people. Between 30 and 40 rain-related car accidents occurred in the Myrtle Beach area.
Myrtle Beach 9/5/2000 Flash Flood 0/0 $0
Flash flooding prompted Myrtle Beach city crews to barricade sections of Porcher Drive, parts of Oak Street and side streets along 10th Avenue North.
Myrtle Beach* 9/6/2000 Flooding 0/0 $0 Hurricane Dennis caused 0.13 inches of rain in 24 hours.
Myrtle Beach* 9/7/2000 Flooding 0/0 $0 Hurricane Dennis caused 3.8 inches of rain in Myrtle Beach in 24 hours.
Myrtle Beach* 9/15/1999 Flooding 0/0 $0 Hurricane Floyd caused 2 inches of rain in 24 hours. The city was evacuated.
Myrtle Beach* 9/16/1999 Flooding 0/0 $619,989 Hurricane Floyd caused 14.8 inches of rain in 24 hours. The city was evacuated.
Myrtle Beach* 7/24/2000 Flooding 0/0 $0
3.54 inches of rain in 2 hours caused Kings Highway and Haskel Circle to close. In addition, backyards flooded.
Myrtle Beach 9/5/2000 Flash Flood 0/0 $0
Flash flooding prompted Myrtle Beach city crews to barricade sections of Porcher, parts of Oak Street and side streets along 10th Avenue North.
Myrtle Beach* 9/6/2000 Flooding 0/0 $0
4.52 inches of rain in 2 hours caused Kings Highway and Haskel Circle to close. In addition, backyards flooded.
Myrtle Beach 9/18/2000 Flash Flood 0/0 $14,761
Emergency management reported street flooding on 21st Street, with one home sustaining flood damage. In addition, Kings Highway and Haskel Circle closed and backyards flooded due to 3.55 inches of rain in 2 hours.
Myrtle Beach* 9/19/2000 Flooding 0/0 $0
3.55 inches of rain in 2 hours caused Kings Highways and Haskel Road to close. In addition, backyards flooded.

SECTION 4: HAZARD IDENTIFICATION AND ANALYSIS
City of Myrtle Beach Floodplain Management and Hazard Mitigation Plan
November 2020
4:64
Location Date Type Deaths/ Injuries
Property Damage
(2020 dollars) Description
Myrtle Beach 7/2/2001 Flash Flood 0/0 $0
Horry Skywarn reported rainwater flooding 1 foot deep at Ocean Blvd and 2nd Ave N, which was closed by police. Radar estimated 4-5 inches fell over a 2.5-hour period.
Myrtle Beach* 8/31/2001 Flooding 0/0 $0 3.34 inches of rain in 2 hours caused Kings Highway to close.
Myrtle Beach* 7/18/2004 Heavy Rain 0/0 $0
Heavy rain caused standing water in many areas, stranding cars. A portion of Hwy 17 near Broadway had standing water.
Myrtle Beach* 8/29/2004 Flooding 0/0
$20,179 0.43 inches of rain fell as a result of Hurricane Gaston.
Myrtle Beach* 9/16/2004 Flooding 0/0
$486,820 Flooding throughout Myrtle Beach resulted due to Hurricane Charley.
Myrtle Beach* 9/14/2005 Flooding 0/0 $0
3.55 inches of rain in 2 hours caused Kings Highways and Haskel Circle to close. In addition, backyards flooded.
Myrtle Beach 10/6/2005 Heavy Rain 0/0
$643,559
7.6 inches of rain in 24 hours caused flooding and Kings Highway to close.
Myrtle Beach* 9/1/2006 Flooding 0/0
$0 6.3 inches of rain fell in 24 hours as a result of Hurricane Ernest.
Myrtle Beach* 9/3/2006 Flooding 0/0
$0 Hurricane Fran caused 0.53 inches of rain in 24 hours.
Myrtle Beach 12/2/2009 Heavy Rain 0/0 $0
Heavy rain caused flooding on Palmetto Point Blvd near the Sea Palms Apartments.
Myrtle Beach 7/29/2010 Heavy Rain 0/0 $0
Up to three inches of rainfall from thunderstorms in Myrtle Beach caused street flooding up to waist deep from Ocean Blvd and Main St, south to First Avenue North. Most of the flooding occurred in parking lots.
Myrtle Beach 7/1/2013 Heavy Rain 0/0 $0
A meteorologist at the WMBF studio parking lot reported several inches of standing water.
Myrtle Beach 10/4/2015 Flash Flood 0/0 $10,780
Roadway was reported impassable at the post office on 5th Avenue N. A car was stalled in flood waters on roadway.
Myrtle Beach 10/8/2016 Flash Flood 0/0 $1,060,667
Numerous roads in Myrtle Beach and throughout Horry County were barricaded and closed through the night. Many structures were severely impacted by the flooding. The report was relayed by WMBF News.
*These flood events were reported by the City of Myrtle Beach. Source: National Centers for Environmental Information
4.15.4 Historical Summary of Insured Flood Losses According to FEMA flood insurance claim records as of July 22, 2020, there have been 1,333 flood losses reported in the City through the National Flood Insurance Program (NFIP) since 1978, totaling over $37.6

SECTION 4: HAZARD IDENTIFICATION AND ANALYSIS
City of Myrtle Beach Floodplain Management and Hazard Mitigation Plan
November 2020
4:65
million in claims payments. These losses include both inland (freshwater) and coastal flooding events. It should be emphasized that these numbers include only those losses to structures that were insured through the NFIP policies and for losses in which claims were sought and received. It is likely that many additional instances of flood losses in Myrtle Beach were either uninsured, denied claims payment, or not reported.
4.15.5 Repetitive Loss Properties FEMA defines a repetitive loss property as any insurable building for which two or more claims of more than $1,000 were paid by the NFIP within any rolling 10-year period, since 1978. A repetitive loss property may or may not be currently insured by the NFIP. Currently there are over 122,000 repetitive loss properties nationwide. FEMA’S National Flood Insurance Program designated Myrtle Beach as a repetitive loss community in 1996 with 17 properties. In 2004, Myrtle Beach had 64 repetitive loss properties and in May 2009, there were 21 “non-mitigated” repetitive loss properties located in Myrtle Beach. As of July of 2015, there were 18 unmitigated repetitive loss properties including 13 residential properties and 5 non-residential properties (hotels). These properties have accounted for a total of 43 losses and more than $1.3 million in claims payments under the NFIP. The average claim amount for these properties is $35,491.04. Without mitigation, these properties will likely continue to experience flood losses. In 2018, there were 24 repetitive loss properties with an increase in multi-unit structures/properties from the impacts of the 2015 and 2016 hurricane seasons. The number of total losses increased to 66 with over $2.2 billion in claims payments under the NFIP. The average payment out to these property owners was $32,516.88. As shown on the Repetitive Loss Properties map (Figure 4.19), the repetitive loss properties are generally located along the coast. Although exact locations for these properties cannot be identified in the body of this plan due to privacy concerns, local officials have access to address information for each of these properties.

SECTION 4: HAZARD IDENTIFICATION AND ANALYSIS
City of Myrtle Beach Floodplain Management and Hazard Mitigation Plan
November 2020
4:66
Figure 4.19: Repetitive Loss Areas in Myrtle Beach
Source: City of Myrtle Beach
The oceanfront of Myrtle Beach stretches for the city’s entire length, approximately ten miles. This area is exposed to flooding from storms that come in from the ocean, hurricanes, and waterspouts. Most of the repetitive loss properties in this area are east of Ocean Boulevard, which generally corresponds to the VE zones on the FEMA Federal Insurance Rate Maps. The oceanfront in Myrtle Beach has relatively high elevations compared to the barrier islands along the coast to the north and south. The remaining repetitive loss properties are located further inland. Very few of the repetitive loss properties in Myrtle Beach are located west of Kings Highway (Highway 17). The properties are located in various locations throughout the jurisdiction.
4.15.6 Probability of Future Occurrences Flood events will remain a frequent occurrence in the City of Myrtle Beach, and the probability of future occurrences is highly likely (100 percent annual probability). The probability of future flood events based on magnitude and according to best available data is illustrated in Figure 4.18, which indicates those areas susceptible to the 1-percent annual chance flood (100-year floodplain); the coastal flood zone with wave action; and the 0.2-percent annual chance flood (500-year floodplain). Further, as described in other

SECTION 4: HAZARD IDENTIFICATION AND ANALYSIS
City of Myrtle Beach Floodplain Management and Hazard Mitigation Plan
November 2020
4:67
hazard profiles, it is highly likely that Myrtle Beach will continue to experience inland and coastal flooding associated with large tropical storms, hurricanes, and storm surge events. It should also be noted that anticipated sea level rise will increase the probability and intensity of future tidal flooding events in years to come. Rising sea level over time will shorten the return period (increasing the frequency) of significant flood events. This hazard is discussed elsewhere in this section. For example; sea level rise of 1 foot over a typical project analysis period (50 years) may cause a flood event currently of annual probability 2-percent (50-year flood) to become an event of 10-percent annual probability (10-year flood).
4.16 STORM SURGE
4.16.1 Background Storm surge occurs when the water level of a tidally influenced body of water increases above the normal astronomical high tide and are most common in conjunction with coastal storms with massive low-pressure systems with cyclonic flows such as hurricanes, tropical storms, and nor’easters. The low barometric pressure associated with these storms cause the water surface to rise and storms landfalling during peak tides have surge heights and more extensive flood inundation limits. Storm surges will inundate coastal floodplains by dune overwash, tidal elevation rise in inland bays and harbors, and backwater flooding through coastal river mouths. The duration of a storm is the most influential factor affecting the severity and impact of storm surges. A storm surge is often described as a wave that has outrun its generating source and become a long period swell. It is often recognized as a large dome of water that may be 50 to 100 miles wide and rising anywhere from four to five feet in a Category 1 hurricane up to 20 feet in a Category 5 storm. The storm surge arrives ahead of the storm center’s actual landfall and the more intense the storm is, the sooner the surge arrives. Water rise can be very rapid, posing a serious threat to those who have not yet evacuated flood-prone areas. The surge is always highest in the right-front quadrant of the direction in which the storm is moving. As the storm approaches shore, the greatest storm surge will be to the north of the low-pressure system or hurricane eye. Such a surge of high water topped by waves driven by hurricane force winds can be devastating to coastal regions, causing severe beach erosion and property damage along the immediate shoreline. Storm surge heights and associated waves are dependent on not only the storm’s intensity but also upon the shape of the offshore continental shelf (narrow or wide), the depth of the ocean bottom (bathymetry), and astronomical tides. A narrow shelf, or one that drops steeply from the shoreline and subsequently produces deep water close to the shoreline, tends to produce a lower surge but higher and more powerful storm waves. In addition, a storm surge event occurs during high tide will result in increased flooding and inundation of coastal areas. The storms that generate the largest coastal storm surges can develop year-round, but they are most frequent from late summer to early spring.
4.16.2 Location and Spatial Extent There are many areas in the City of Myrtle Beach that are subject to potential storm surge inundation. Figure 4.20, Figure 4.21, and Figure 4.22 illustrate hurricane storm surge inundation zones with different categories of storms in Myrtle Beach. The illustrations are based on SLOSH (Sea, Lake, and Overland Surge

SECTION 4: HAZARD IDENTIFICATION AND ANALYSIS
City of Myrtle Beach Floodplain Management and Hazard Mitigation Plan
November 2020
4:68
from Hurricanes) modeling of the Maximum of Maximums (MOMs) for a Category 1, Category 3, and Category 5 storm. SLOSH is a modeling tool used to estimate storm surge for coastal areas resulting from historical, hypothetical, or predicted hurricanes considering maximum expected levels for pressure, size, forward speed, track, and winds. Therefore, the SLOSH data is best used for defining the potential maximum surge associated with various storm intensities for any particular location. As shown in the figures, the entire coast of the city is at high risk to storm surge inundation. During a Category 3 or higher storm event, inland areas will also experience substantial flooding.
Figure 4.20: Category 1 Storm Surge (SLOSH MOMs) Inundation
Source: National Oceanic and Atmospheric Administration

SECTION 4: HAZARD IDENTIFICATION AND ANALYSIS
City of Myrtle Beach Floodplain Management and Hazard Mitigation Plan
November 2020
4:69
Figure 4.21: Category 3 Storm Surge (SLOSH MOMs) Inundation
Source: National Oceanic and Atmospheric Administration

SECTION 4: HAZARD IDENTIFICATION AND ANALYSIS
City of Myrtle Beach Floodplain Management and Hazard Mitigation Plan
November 2020
4:70
Figure 4.22: Category 5 Storm Surge (SLOSH MOMs) Inundation
Source: National Oceanic and Atmospheric Administration
4.16.3 Historical Occurrences According to the previous plan, three storm surge events have been reported for Horry County.25 October 15, 1954: Hurricane Hazel Hurricane Hazel struck Myrtle Beach during the highest lunar tide of the year. As a result, storm surge was higher, rising to 15.5 feet during the storm. In addition, the surge downed countless trees along the coast. September 22, 1989: Hurricane Hugo Hurricane Hugo delivered a storm surge of an estimated 13 feet to Myrtle Beach. September 6, 2008: Tropical Storm Hannah Tropical Storm Hannah caused several road closures throughout Horry County as a result of flooding and minor storm surge.
25 There were no storm surge events reported by the National Centers for Environmental Information (NCEI) from 1996 through February 2020 for the City of Myrtle Beach. As more information becomes available, this hazard profile will be amended.

SECTION 4: HAZARD IDENTIFICATION AND ANALYSIS
City of Myrtle Beach Floodplain Management and Hazard Mitigation Plan
November 2020
4:71
4.16.4 Probability of Future Occurrences It is likely that the City of Myrtle Beach will continue to experience storm surge associated with large tropical storms, hurricanes, and squalls combined with high tides (between 10 and 100 percent annual probability). As noted in the preceding section (under Flood), anticipated sea level rise will increase the probability and intensity of future storm surge events in years to come.26 This rise in sea level will not only increase the probability and intensity of tidal flooding events, but it will also contribute to the loss of coastal wetlands and erosion of sand beaches that act as protective buffers against storm surge events.
4.17 SEA LEVEL RISE
4.17.1 Background Sea Level Rise is defined as the mean rise in sea level. It is caused by two factors: 1) as the ocean warms, sea water expands in volume and 2) continental ice shelves melt, increasing the amount of water in the oceans. This leads to a greater area of land being inundated by sea water. Rising sea level contributes to the loss of coastal wetlands (which provide protective buffers from flood events), beach erosion, impacts on population and property in low areas, and disruption of coastal habitats and species. Further, flooding and hurricane events are more severe and affect a greater area. Given that 600 million people live in an area that is less than 10 meters or 33 feet above sea level and the coastal population has doubled in the last 50 years, there is a great vulnerability to sea level rise.
4.17.2 Location and Spatial Extent Sea level rise is occurring at a global scale. However, it does not affect areas uniformly and will be more severe in some places. Figure 4.23 shows a hypothetical situation of sea level rise where the sea rises at 0.6 meters, 1.0 meters, 3 meters, and 6 meters. This research was conducted by the Hazards and Vulnerability Research Institute at the University of South Carolina and provided by the South Carolina Division of Emergency Management. The analysis used mosaicking LIDAR at a 4-meter grid (converted to match NOAA specifications) to determine elevation. Then ArcView GIS methodologies of bathtub/fill and nearest neighbor functionality were used to determine where flooding would occur at each interval. Myrtle Beach is impacted at each level as indicated in the scenarios.
26 The Sea Level Rise hazard is assessed more extensively under Section 4.17.

SECTION 4: HAZARD IDENTIFICATION AND ANALYSIS
City of Myrtle Beach Floodplain Management and Hazard Mitigation Plan
November 2020
4:72
Figure 4.23: Sea Level Rise in Horry County
Source: Emrich, Christopher. University of South Carolina Hazards and Vulnerability Research Institute; South Carolina Emergency Management Division
Additionally, Figure 4.24, Figure 4.25, and Figure 4.26 identify areas in Myrtle Beach that would be inundated by water as a result of one, four, and seven feet in sea level rise as per projections by NOAA. The highest level of sea level rise projected by NOAA is shown in Figure 4.27. This figure shows the inundation areas in the case of ten feet of sea level rise. This demonstrates the additional areas that would be impacted beyond the one, four, and seven feet scenarios.

SECTION 4: HAZARD IDENTIFICATION AND ANALYSIS
City of Myrtle Beach Floodplain Management and Hazard Mitigation Plan
November 2020
4:73
Figure 4.24: One Foot Sea Level Rise in Myrtle Beach
Source: National Oceanic and Atmospheric Administration

SECTION 4: HAZARD IDENTIFICATION AND ANALYSIS
City of Myrtle Beach Floodplain Management and Hazard Mitigation Plan
November 2020
4:74
Figure 4.25: Four Feet Sea Level Rise in Myrtle Beach
Source: National Oceanic and Atmospheric Administration

SECTION 4: HAZARD IDENTIFICATION AND ANALYSIS
City of Myrtle Beach Floodplain Management and Hazard Mitigation Plan
November 2020
4:75
Figure 4.26: Seven Feet Sea Level Rise in Myrtle Beach
Source: National Oceanic and Atmospheric Administration
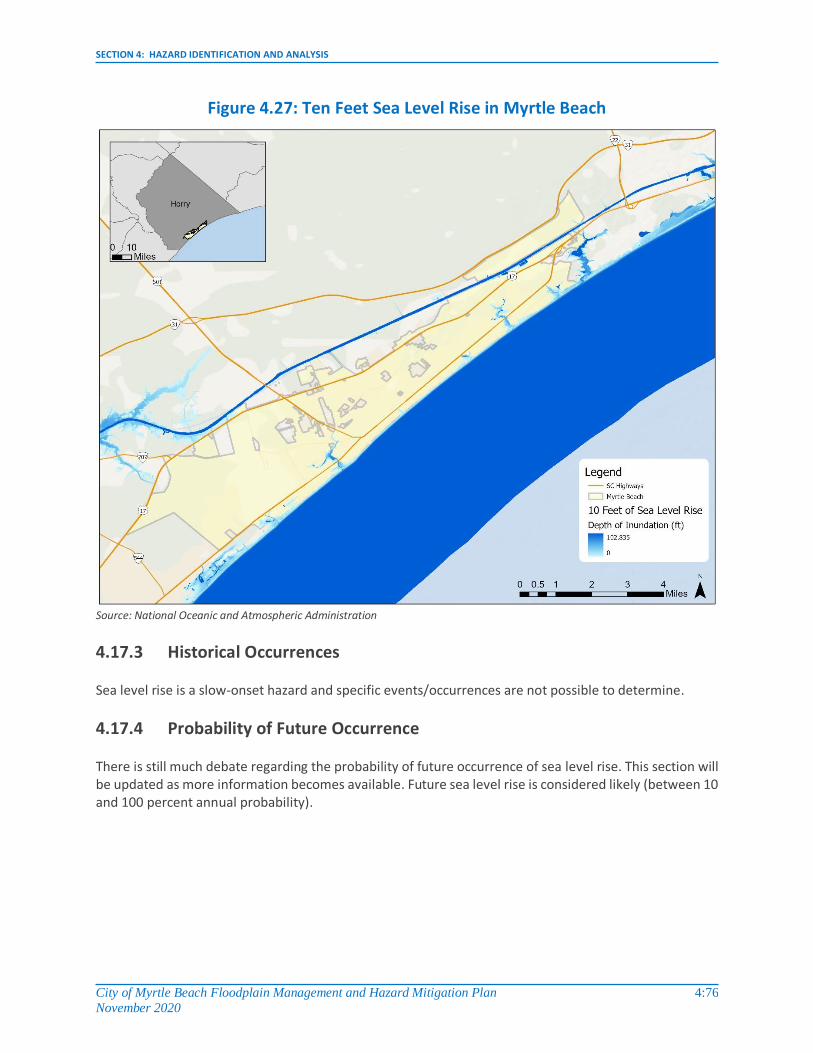
SECTION 4: HAZARD IDENTIFICATION AND ANALYSIS
City of Myrtle Beach Floodplain Management and Hazard Mitigation Plan
November 2020
4:76
Figure 4.27: Ten Feet Sea Level Rise in Myrtle Beach
Source: National Oceanic and Atmospheric Administration
4.17.3 Historical Occurrences Sea level rise is a slow-onset hazard and specific events/occurrences are not possible to determine.
4.17.4 Probability of Future Occurrence There is still much debate regarding the probability of future occurrence of sea level rise. This section will be updated as more information becomes available. Future sea level rise is considered likely (between 10 and 100 percent annual probability).

SECTION 4: HAZARD IDENTIFICATION AND ANALYSIS
City of Myrtle Beach Floodplain Management and Hazard Mitigation Plan
November 2020
4:77
OTHER HAZARDS
4.18 ACTS OF TERROR
4.18.1 Background Terrorism is defined by FEMA as, “the use of force or violence against persons or property in violation of the criminal laws of the United States for purposes of intimidation, coercion, or ransom.” Certain facilities are at greater risk than others to a terrorist attack. A high-risk target is defined by FEMA as military and civilian government facilities, international airports, large cities, and high-profile landmarks. Terrorists may also target large public gatherings, water and food supplies, and utilities. Acts of terror may include assassinations and armed attacks, kidnappings, hijackings, bomb scares and bombings, cyber-attacks (computer-based), and the use of chemical, biological, nuclear, and radiological weapons. Each act of terror is described below:27 Assassinations/Armed Attack: Tactical assault or sniping from a remote location. Kidnapping: Capturing a person or persons against their will and holding them in false imprisonment, often for ransom. Hijacking: Robbing or seizing control or a vehicle by use of force. Bomb Scares and Bombing: A bombing is the result of a detonation of any material that will cause injury, death, or property damage. A bomb scare involves the verbal or written threat to detonate a bomb. Cyber Attack: Refers to the electronic attack using one computer system against another. Chemical Agent: Liquid/aerosol contaminants can be dispersed using sprayers or other aerosol generators, liquids vaporizing from puddles or containers, or munitions. Biological Agent: Liquid or solid toxic contaminants can be dispersed using sprayers/aerosol generators or by point of line sources such as munitions, covert deposits, and moving sprayers. Nuclear Bomb: A nuclear device may be detonated underground, at the surface, in the air or at high altitude.
27 Much of this information comes from the FEMA State and Local Mitigation Planning How-to Guide: Integrating Manmade Hazards.

SECTION 4: HAZARD IDENTIFICATION AND ANALYSIS
City of Myrtle Beach Floodplain Management and Hazard Mitigation Plan
November 2020
4:78
Radiological Agent: Radioactive contaminants can be dispersed using sprayers/aerosol generators or by point of line sources such as munitions, covert deposits, and moving sprayers. The United States Department of Homeland Security posts terror threat levels corresponding to a certain color. This warning system is shown in Table 4.28.
Table 4.28: Homeland Security Advisory System
Threat Level Description Federal Government Agency Response
SEVERE Severe Risk of
Terrorist Attacks
Under a Severe threat level, personnel will be increased or redirected to address emergency needs, specially trained teams will be pre-positioned as needed, transportations systems are to be monitored, redirected, and/or constrained, and public and government facilities may be closed.
HIGH High Risk of
Terrorist Attacks
A High threat level requires coordinating efforts between Federal, State, and local law enforcement agencies, taking additional precautions at public events (including alternate venues and cancellation), restricting threatened facilities to essential personnel only, and preparing to execute contingency procedures if necessary.
ELEVATED Significant Risk of Terrorist
Attacks
In Elevated threat levels, agencies should increase surveillance of critical places, coordinate emergency plans with neighboring jurisdictions, and implementing emergency response plans, where appropriate.
GUARDED General Risk of Terrorist Attacks
This Guarded threat level requires that agencies check communications with designated emergency response and command locations, reviewing and updating emergency response plans, and providing the public with information to better manage a terrorist attack situation.
LOW Low Risk of
Terrorist Attacks
This Low threat level requires “proactive measures” such as making sure as personnel is trained to deal with a terrorist attack, identifying vulnerabilities to a terrorist attack, and mitigating any vulnerabilities.
4.18.2 Location and Spatial Extent While there are few high-risk targets in the City of Myrtle Beach, the city is uniformly at risk to a terrorist attack since such events have no geographic boundaries. However, certain acts of terror, such as a bombing, will affect localized areas while others, such as chemical agents, may affect areas for miles if carried by persons, water, or wind. In addition, terrorists may instill fear in people that prevents travel and thus tourism dollars from entering the local economy. In addition to specific facilities, the planning team also recognized that there are a number of major events that occur in the city throughout the year that draw large crowds and would be susceptible to a potential act of terror. Most of these events occur between March and October and include the Country Music Festival, Myrtle Beach Marathon, holiday weekends, and Bike Week, among others.

SECTION 4: HAZARD IDENTIFICATION AND ANALYSIS
City of Myrtle Beach Floodplain Management and Hazard Mitigation Plan
November 2020
4:79
Finally, the planning team noted that a growing concern when it comes to acts of terror is the threat of cyberterrorism which could be perpetrated from a distance and could cause major issues to the city’s overall security. City officials noted that this is potentially the biggest threat going forward in terms of acts of terror even though there have not been any major historic occurrences.
4.18.3 Historical Occurrences There is no known history of a major act of terror occurring in Myrtle Beach. The planning team did note that there was a fire bomb thrown at City Hall at one point, but it was not considered a large-scale act of terror.
4.18.4 Probability of Future Occurrence The probability of a future terrorist attack in Myrtle Beach is possible (between 1 and 10 percent annual probability). However, a single event could have devastating effects on human lives, the economy, and future way of life.
4.19 AIRPLANE CRASH
4.19.1 Background An airplane crash endangers the passengers onboard the craft as well as people and property at the crash site. The extent of an airplane crash risk is based on many factors including the size of the aircraft and location of crash site. For example, a large commuter jet crashing into a heavily populated urban area will likely have far greater damages than a personal aircraft crashing in a rural area.
4.19.2 Location and Spatial Extent The existence of Myrtle Beach International Airport creates increased air traffic over the city. The airport caters to both commercial and cargo flights. However, the location of an airplane crash cannot be predicted. Therefore, the entire city of Myrtle Beach is at risk.
4.19.3 Historical Occurrences There is no recent history of a major commercial airplane crash occurring in Myrtle Beach. The planning team noted that there have been occasional banner planes that have gone down, but those occur relatively infrequently (maybe every 5 years or so) and do not pose a major threat to safety. Most recently, a small plane went down into the ocean off the shores of Myrtle Beach in November 2018. The pilot was the only person on board and was taken to the hospital in critical condition.
4.19.4 Probability of Future Occurrence The probability of an airplane crash in Myrtle Beach is unlikely (less than 1 percent annual probability). However, as the airport expands and runs more flights, the risk of a crash increases. Further, a single event could have serious consequences on the affected population and tourism.

SECTION 4: HAZARD IDENTIFICATION AND ANALYSIS
City of Myrtle Beach Floodplain Management and Hazard Mitigation Plan
November 2020
4:80
4.20 CIVIL DISTURBANCE
4.20.1 Background Public unrest has been evident in society from the earliest recordings of civilization. Most of these disturbances have been related to political or social issues. Insurrection has framed much of history, dictating the governance and progression of society. In recent years, most of the publicized disturbances have been protests and riots. Rioting does not occur very often in the United States; however, marches and protests are common and could subsequently lead to riots.
4.20.2 Location and Spatial Extent Civil disturbance or unrest can occur in any location in the City but is more likely to take place in or near prominent locations such as government buildings or significant landmarks.
4.20.3 Historical Occurrences In the City of Myrtle Beach, there have not been any major civil disturbances in recent years. While there are occasional marches and protests that take place in the City, they have not had significant threats of violence associated with them. Most recently, in May and June 2020, protests over the death of George Floyd took place in Myrtle Beach. Although the City declared a civil emergency as a precautionary measure and several arrests were made for curfew violation, the protests remained peaceful. While protests are not considered hazards to the community per se, they should be noted as they serve as examples of past points of conflicting ideology among citizens which can sometimes lead to interactions between groups that cause harm or hurt to those involved.
4.20.4 Probability of Future Occurrences Despite some history of civil disturbance in the City of Myrtle Beach, there have been few recent events that caused major violence, injury, or fatalities, so the probability of future occurrences is possible (between 1 and 10 percent annual probability).
4.21 HAZARDOUS MATERIALS INCIDENTS
4.21.1 Background Hazardous materials can be found in many forms and quantities that can potentially cause death, serious injury, long-lasting health effects, and damage to buildings, homes, and other property in varying degrees. Such materials are routinely used and stored in many homes and businesses and are also shipped daily on the nation’s highways, railroads, waterways, and pipelines. This subsection on the hazardous material hazard is intended to provide a general overview of the hazard and the threshold for identifying fixed and mobile sources of hazardous materials is limited to general information on rail, highway, and FEMA-

SECTION 4: HAZARD IDENTIFICATION AND ANALYSIS
City of Myrtle Beach Floodplain Management and Hazard Mitigation Plan
November 2020
4:81
identified fixed HAZMAT sites determined to be of greatest significance as appropriate for the purposes of this plan. Hazardous material (HAZMAT) incidents can apply to fixed facilities as well as mobile, transportation-related accidents in the air, by rail, on the nation’s highways, and on the water. Approximately 6,774 HAZMAT events occur each year, 5,517 of which are highway incidents, 991 are railroad incidents and 266 are due to other causes.28 In essence, HAZMAT incidents consist of solid, liquid, and/or gaseous contaminants that are released from fixed or mobile containers, whether by accident or by design as with an intentional terrorist attack. A HAZMAT incident can last hours to days, while some chemicals can be corrosive or otherwise damaging over longer periods of time. In addition to the primary release, explosions, and/or fires can result from a release, and contaminants can be extended beyond the initial area by persons, vehicles, water, wind, and possibly wildlife as well. HAZMAT incidents can also occur as a result of or in tandem with natural hazard events, such as floods, hurricanes, tornadoes, and earthquakes, which in addition to causing incidents can also hinder response efforts. In the case of Hurricane Floyd in September 1999, communities along the Eastern United States were faced with flooded junkyards, disturbed cemeteries, deceased livestock, floating propane tanks, uncontrolled fertilizer spills, and a variety of other environmental pollutants that caused widespread toxological concern. Hazardous material incidents can include the spilling, leaking, pumping, pouring, emitting, emptying, discharging, injecting, escaping, leaching, dumping, or disposing into the environment of a hazardous material, but exclude: (1) any release which results in exposure to poisons solely within the workplace with respect to claims which such persons may assert against the employer of such persons; (2) emissions from the engine exhaust of a motor vehicle, rolling stock, aircraft, vessel, or pipeline pumping station engine; (3) release of source, byproduct, or special nuclear material from a nuclear incident; and (4) the normal application of fertilizer.
4.21.2 Location and Spatial Extent As a result of the 1986 Emergency Planning and Community Right to Know Act (EPCRA), the Environmental Protection Agency (EPA) provides public information on hazardous materials. One facet of this program is to collect information from industrial facilities on the releases and transfers of certain toxic agents. In addition, a number of other environmental laws (CAA, CWA, RCRA, etc) require facilities to report on the housing of potentially hazardous materials. The information collected through this reporting process is housed in the Facility Registry Service (FRS). FRS sites indicate where hazardous materials or places of environmental interest are located. The City of Myrtle Beach has over 900 sites listed on the FRS. As such, it would be overwhelming to list all of these facilities in the plan or show them all on a single map. Instead, all of these fixed hazardous materials sites are shown in Figure 4.28. Additionally, facilities that use extremely hazardous substances are required to develop a Risk Management Plan (RMP) that must be revised and resubmitted to the EPA every five years. There is one RMP facility in the City of Myrtle Beach.
28 FEMA, 1997.
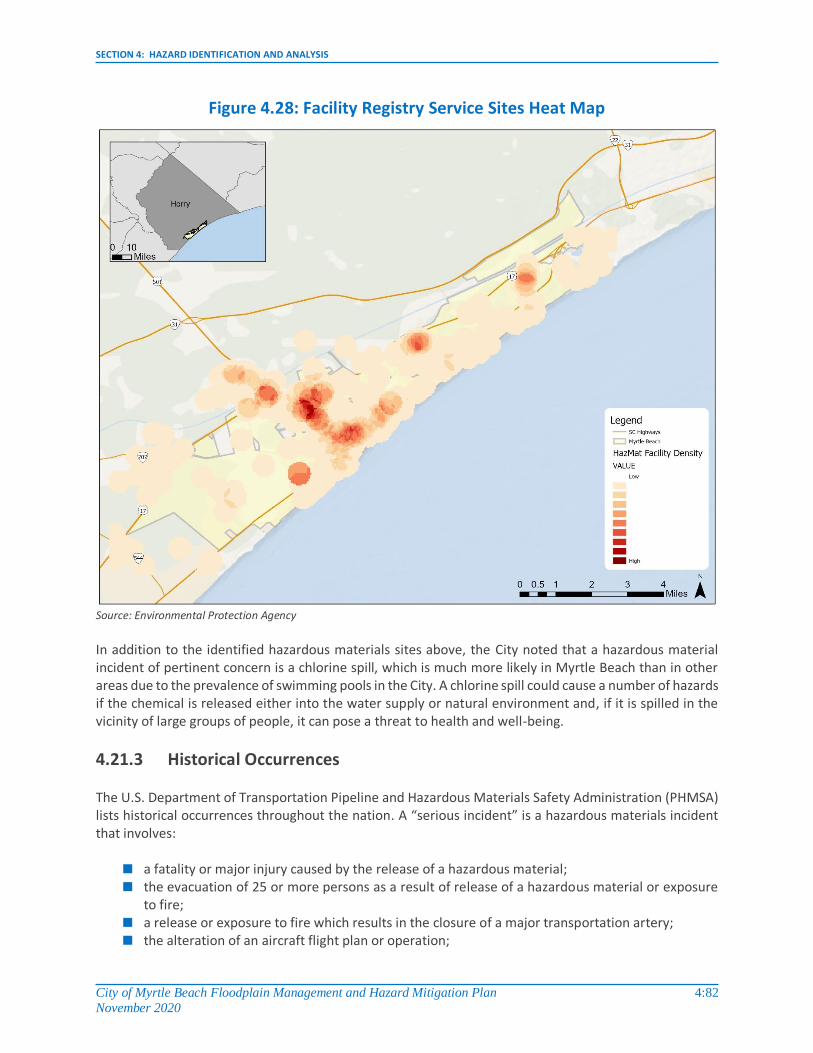
SECTION 4: HAZARD IDENTIFICATION AND ANALYSIS
City of Myrtle Beach Floodplain Management and Hazard Mitigation Plan
November 2020
4:82
Figure 4.28: Facility Registry Service Sites Heat Map
Source: Environmental Protection Agency
In addition to the identified hazardous materials sites above, the City noted that a hazardous material incident of pertinent concern is a chlorine spill, which is much more likely in Myrtle Beach than in other areas due to the prevalence of swimming pools in the City. A chlorine spill could cause a number of hazards if the chemical is released either into the water supply or natural environment and, if it is spilled in the vicinity of large groups of people, it can pose a threat to health and well-being.
4.21.3 Historical Occurrences The U.S. Department of Transportation Pipeline and Hazardous Materials Safety Administration (PHMSA) lists historical occurrences throughout the nation. A “serious incident” is a hazardous materials incident that involves:
a fatality or major injury caused by the release of a hazardous material; the evacuation of 25 or more persons as a result of release of a hazardous material or exposure
to fire; a release or exposure to fire which results in the closure of a major transportation artery; the alteration of an aircraft flight plan or operation;

SECTION 4: HAZARD IDENTIFICATION AND ANALYSIS
City of Myrtle Beach Floodplain Management and Hazard Mitigation Plan
November 2020
4:83
the release of radioactive materials from Type B packaging; the release of over 11.9 gallons or 88.2 pounds of a severe marine pollutant; or the release of a bulk quantity (over 199 gallons or 882 pounds) of a hazardous material.
However, prior to 2002, a hazardous materials “serious incident” was defined as follows:
a fatality or major injury due to a hazardous material; closure of a major transportation artery or facility or evacuation of six or more persons due to the
presence of hazardous material; or a vehicle accident or derailment resulting in the release of a hazardous material.
There has been a total of 37 recorded HAZMAT incidents in Myrtle Beach since 1977.29 These events resulted in about $158,000 (2020 dollars) of property damage but no fatalities.30 Table 4.29 presents detailed information on historical HAZMAT incidents in Myrtle Beach as reported by the U.S. Department of Transportation Pipeline and Hazardous Materials Safety Administration (PHMSA).
Table 4.29: HAZMAT Incidents in Myrtle Beach
Report Number
Date City Mode Serious
Incident? Fatalities
Property Damage
(2020 Dollars)
Quantity Released
I-1977070277 6/3/1977 Myrtle Beach Air No 0 $0 0
I-1979040051 3/20/1979 Myrtle Beach Highway No 0 $0 10 LGA
I-1983090581 8/19/1983 Myrtle Beach Highway No 0 $0 0
I-1983090581 8/19/1983 Myrtle Beach Highway No 0 $0 15 LGA
I-1986010043 12/18/1985 Myrtle Beach Highway No 0 $0 40 LGA
I-1986060050 5/31/1986 Myrtle Beach Highway No 0 $0 50 LGA
I-1988080642 8/8/1988 Myrtle Beach Highway No 0 $0 4 SLB
I-1991030668 3/14/1991 Myrtle Beach Highway No 0 $66 35 LGA
I-1994010489 4/2/1993 Myrtle Beach Highway No 0 $45 0.007813 LGA
I-1994050417 4/1/1994 Myrtle Beach Air No 0 $0 1.056688 LGA
I-1997040395 3/17/1997 Myrtle Beach Highway No 0 $0 0
I-1998010362 12/15/1997 Myrtle Beach Highway No 0 $135 0.125 LGA
I-2001030659 2/1/2001 Myrtle Beach Highway No 0 $12 8 LGA
I-2003010706 12/18/2002 Myrtle Beach Air No 0 $0 0.792516 LGA
I-2004010994 7/4/2003 Myrtle Beach Highway Yes 0 $84 125 LGA
I-2003110413 11/2/2003 Myrtle Beach Highway Yes 0 $150,849 5700 LGA
I-2004081552 8/5/2004 Myrtle Beach Highway No 0 $2,077 20 LGA
I-2004101004 10/16/2004 Myrtle Beach Highway No 0 $3,599 100 LGA
I-2010120284 12/8/2010 Myrtle Beach Highway No 0 $0 1 LGA
I-2014030121 2/28/2014 Myrtle Beach Highway No 0 $0 0.015625 LGA
I-2014090367 8/25/2014 Myrtle Beach Highway No 0 $0 0.023438 LGA
29 These HAZMAT incidents are only inclusive of that reported by the U.S. Department of Transportation Pipeline and Hazardous Materials Safety Administration (PHMSA) from 1971 through June 9, 2020. As additional local data becomes
available, this hazard profile will be amended. 30 Adjusted dollar values were calculated based on the average Consumer Price Index for All Urban Consumers (CPI-U) U.S.
city average series for all items, not seasonally adjusted. This data represents changes in the prices of all goods and services purchased for consumption by urban households. This monthly index value has been calculated every year since 1913. The 2020 dollar values were calculated based on buying power in May 2020.

SECTION 4: HAZARD IDENTIFICATION AND ANALYSIS
City of Myrtle Beach Floodplain Management and Hazard Mitigation Plan
November 2020
4:84
Report Number
Date City Mode Serious
Incident? Fatalities
Property Damage
(2020 Dollars)
Quantity Released
I-2014120158 11/3/2014 Myrtle Beach Highway No 0 $0 0
I-2015030249 2/25/2015 Myrtle Beach Highway No 0 $0 0.03125 LGA
I-2015090185 8/5/2015 Myrtle Beach Highway No 0 $0 0.015625 LGA
X-2016010428 1/15/2016 Myrtle Beach Highway No 0 $0 0.25 LGA
X-2016040138 3/24/2016 Myrtle Beach Highway No 0 $0 0
X-2016050225 5/2/2016 Myrtle Beach Highway No 0 $0 0.007812 LGA
X-2016080066 7/27/2016 Myrtle Beach Highway No 0 $0 0.000007 SLB
X-2017020388 2/13/2017 Myrtle Beach Highway No 0 $0 0.015625 LGA
X-2017110267 11/1/2017 Myrtle Beach Highway No 0 $0 0.007812 LGA
X-2018050258 4/27/2018 Myrtle Beach Highway No 0 $0 0.03125 LGA
X-2019030633 3/1/2019 Myrtle Beach Highway No 0 $0 0.5 LGA
X-2019040605 4/8/2019 Myrtle Beach Highway No 0 $0 1 LGA
X-2019060650 5/31/2019 Myrtle Beach Highway No 0 $0 0.015625 LGA
E-2019110019 9/22/2019 Myrtle Beach Highway No 0 $949 10 LGA
X-2020010200 12/27/2019 Myrtle Beach Highway No 0 $0 0.046875 LGA
X-2020050004 4/17/2020 Myrtle Beach Highway No 0 $0 0.5 LGA
Source: Untied States Department of Transportation Pipeline and Hazardous Materials Safety Administration
4.21.4 Probability of Future Occurrence Given the location of numerous FRS and RMP facilities in Myrtle Beach as well as prior roadway and air incidents, it is likely that a hazardous material incident may occur (between 10 and 100 percent annual probability).
4.22 PUBLIC HEALTH EMERGENCY
4.22.1 Background Communicable, or infectious, diseases are conditions that result in clinically evident illness which are transmissible directly from one person to another or indirectly through vectors such as insects, air, water, blood, or other objects. The impact of communicable disease can range from the mild effects of the common cold to the extreme lethality of pneumonic plague or anthrax. The public health system in the United States was developed in large part as a response to the often urgent need to respond to or prevent outbreaks of communicable diseases. Through public health methods of disease reporting, vaccinations, vector control, and effective treatments, most communicable diseases are well controlled in the United States and the City of Myrtle Beach. However, control systems can fail and when people come together from locations outside of the city, county, state, and the country, outbreaks can occur, even in the most modern of communities. In this section, some of the more significant potential communicable disease concerns are described. The threats discussed in this section usually do not occur on a regular basis, though some are more frequent. The diseases described herein do not originate from intentional exposure (such as through terrorist actions) but do present significant issues and concerns for the public health community. There are numerous infectious diseases that rarely, if ever, occur in the City of Myrtle Beach, such as botulism or bubonic plague. Some highly dangerous diseases which could potentially be used as biological

SECTION 4: HAZARD IDENTIFICATION AND ANALYSIS
City of Myrtle Beach Floodplain Management and Hazard Mitigation Plan
November 2020
4:85
weapons, such as anthrax, pneumonic plague, and smallpox, are safely housed and controlled in laboratory settings such as at the Centers for Disease Control and Prevention (CDC). Other diseases have not (yet) mutated into a form that can infect humans, or otherwise lie dormant in nature. Many of these threats were discussed in the “Bioterrorism” section. Below, several types of threats are described that may face the city. All may be of national and international importance as any emerging disease threat may impact large populations beyond the immediate areas where the threat originated. Viral outbreaks, such as the West Nile Virus, are typically passed to humans or animals by mosquitoes and can often be spread widely as many of those infected experience no symptoms. Those who do may experience fever, fatigue, or, in serious cases, central nervous system inflammation. Another example of a virus that has had impacts on large populations is Severe Acute Respiratory Syndrome (SARS), which is a respiratory syndrome that is transmitted by airborne droplets. This virus was first reported in Asia in the early 2000s and while both of these conditions caused a great deal of public health concern when they were first identified, SARS has all but disappeared, while West Nile Virus occurs with low frequency and causes serious disease in only a very small percentage of cases. Other communicable diseases pose a greater threat to the residents of the City of Myrtle Beach. Some of the infectious diseases of greatest concern include influenza, particularly in a pandemic form, as well as norovirus, and multiple antibiotic-resistant tuberculosis. Even in one of its normal year-to-year variants, influenza (commonly referred to as “flu”) can result in serious illness and even death in young children, the elderly and immune-compromised persons. But there is always the potential risk of the emergence of influenza in one of the pandemic H1N1 forms, such as in the “Spanish Flu” outbreak of 1918-19, which killed over 50 million people worldwide. Every year, the City of Myrtle Beach sees hundreds of cases of influenza, leading to hundreds of hours of lost productivity in businesses due to sick employees. Of note, a vaccine for influenza is produced every year and, according to the CDC, is highly effective in preventing the disease. Norovirus is recognized as the leading cause of foodborne-disease outbreaks in the United States. The virus can cause diarrhea, vomiting, and stomach pain, and is easily spread from person to person through contaminated food or water and by surface to surface contact. Especially vulnerable populations to this virus include those living or staying in nursing homes and assisted living facilities and other healthcare facilities such as hospitals. Norovirus could also be a threat in the event of large public gatherings such as sporting events, concerts, festivals, and so forth. The City of Myrtle Beach and the state of South Carolina experience numerous norovirus outbreaks every year. No vaccine or treatment exists for the Norovirus, making it especially dangerous for the public in the event of an outbreak. Tuberculosis (TB) is a bacterial infection that originates from airborne exposure. Currently there are only a couple of dozen new tuberculosis cases in the City of Myrtle Beach each year. However, multiple drug-resistant strains, and even new extreme drug-resistant strains, are showing up with increasing frequency. Since the City of Myrtle Beach has a large and varied immigrant and refugee population of persons coming from countries with drug-resistant strains, TB is a disease that could become a cause of greater concern in coming years. Public health threats can occur at any time and can have varying impacts. Discussions between public health professionals, planning officials, and first response agencies are essential in order to facilitate safe, effective, and collaborative efforts toward outbreaks.
SECTION 4: HAZARD IDENTIFICATION AND ANALYSIS
City of Myrtle Beach Floodplain Management and Hazard Mitigation Plan
November 2020
4:86
4.22.2 Location and Spatial Extent Due to the nature of a public health/emerging disease event, it would be difficult to predict a precise location where this type of event would occur. Moreover, a large-scale event may have impacts that spread throughout the city and beyond. Therefore, all areas in the City of Myrtle are considered equally susceptible to public health/emerging diseases.
4.22.3 Historical Occurrences As stated previously, influenza, norovirus, and tuberculosis are regularly occurring health issues in the City of Myrtle Beach. With the exception of tuberculosis, these conditions are not legally reportable to county or state public health agencies, so data on disease incidence is not readily available. However, these diseases are monitored through local epidemiological surveillance systems in hospitals and health departments, and any potential outbreaks are investigated promptly. On March 13, 2020, the President declared a nationwide emergency for the Coronavirus Disease 2019 (COVID-19) pandemic for all states, tribes, territories, and the District of Columbia. COVID-19 is caused by the virus severe acute respiratory syndrome coronavirus 2 (SARS-CoV-2), a new virus in humans causing respiratory illness which can be spread from person-to-person.31 A wide range of symptoms for COVID-19 have been reported and include fever or chills, cough, shortness of breath or difficulty breathing, fatigue, headache, nasal congestion or runny nose, muscle or body aches, sore throat, new loss of smell or taste, nausea or vomiting, and diarrhea. However, some people also become infected and do not develop any symptoms or feel unwell. The risk of severe disease increases steadily as people age and those of all ages with underlying medical conditions appear to also be at higher risk. As of September 24, 2020, there have been 10,227 cases of COVID-19 in Horry County according the South Carolina Department of Health and Environmental Control (SC DHEC).32 Of these cases, 9,992 were confirmed positive and 305 are probable. Additionally, there here have been 185 confirmed deaths and 11 probable deaths associated with COVID-19. The senior staff and emergency management team for the City of Myrtle Beach continue to assess the ongoing COVID-19 pandemic and is taking the necessary health precautions to make sure that everyone is safe. A public face mask requirement has been implemented by the City Council and emergency restrictions limiting occupancy and certain services and activities remain in place at this time.33
4.22.4 Probability of Future Occurrences Due to recent public health emergencies that have occurred in Myrtle Beach and across the county, the probability of a major outbreak is considered possible (between 1 and 10 percent annual probability).
31 https://www.cdc.gov/coronavirus/2019-nCoV/index.html 32 https://scdhec.gov/infectious-diseases/viruses/coronavirus-disease-2019-covid-19/sc-testing-data-projections-covid-19 33 https://www.cityofmyrtlebeach.com/coronavirus/

SECTION 4: HAZARD IDENTIFICATION AND ANALYSIS
City of Myrtle Beach Floodplain Management and Hazard Mitigation Plan
November 2020
4:87
4.23 WILDFIRE
4.23.1 Background A wildfire is any outdoor fire (i.e. grassland, forest, brush land) that is not under control, supervised, or prescribed.34 Wildfires are part of the natural management of forest ecosystems, but may also be caused by human factors. Nationally, over 80 percent of forest fires are started by negligent human behavior such as smoking in wooded areas or improperly extinguishing campfires. The second most common cause for wildfire is lightning. In South Carolina, 98 percent of wildfires are human caused. The number one cause is woods arson, followed by debris burning. There are three classes of wildland fires: surface fire, ground fire, and crown fire. A surface fire is the most common of these three classes and burns along the floor of a forest, moving slowly and killing or damaging trees. A ground fire (muck fire) is usually started by lightning or human carelessness and burns on or below the forest floor. Crown fires spread rapidly by wind and move quickly by jumping along the tops of trees. Wildfires are usually signaled by dense smoke that fills the area for miles around. Wildfire probability depends on local weather conditions, outdoor activities such as camping, debris burning, and construction, and the degree of public cooperation with fire prevention measures. Drought conditions and other natural hazards (such as tornadoes, hurricanes, etc.) increase the probability of wildfires by producing fuel in both urban and rural settings. The South Carolina wildfire season runs from late winter to early spring with March being the most severe. Many individual homes and cabins, subdivisions, resorts, recreational areas, organizational camps, businesses, and industries are located within high wildfire hazard areas. Further, the increasing demand for outdoor recreation places more people in wildlands during holidays, weekends, and vacation periods. Unfortunately, wildland residents and visitors are rarely educated or prepared for wildfire events that can sweep through the brush and timber and destroy property within minutes. Wildfires can result in severe economic losses as well. Businesses that depend on timber, such as paper mills and lumber companies, experience losses that are often passed along to consumers through higher prices, and sometimes jobs are lost. The high cost of responding to and recovering from wildfires can deplete state resources and increase insurance rates. The economic impact of wildfires can also be felt in the tourism industry if roads and tourist attractions are closed due to health and safety concerns. State and local governments can impose fire safety regulations on home sites and developments to help curb wildfire. Land treatment measures such as fire access roads, water storage, helipads, safety zones, buffers, firebreaks, fuel breaks, and fuel management can be designed as part of an overall fire defense system to aid in fire control. Fuel management, prescribed burning, and cooperative land management planning can also be encouraged to reduce fire hazards.
34 Prescription burning, or “controlled burn,” undertaken by land management agencies is the process of igniting fires under selected conditions, in accordance with strict parameters.

SECTION 4: HAZARD IDENTIFICATION AND ANALYSIS
City of Myrtle Beach Floodplain Management and Hazard Mitigation Plan
November 2020
4:88
4.23.2 Location and Spatial Extent Myrtle Beach is prone to wildfires. The entire city has uniform risk exposure to a wildfire occurrence. However, drought conditions may make a fire more likely in those locations.
4.23.3 Historical Occurrences Based on data from the South Carolina Forestry Commission from 2009 to 2019, Horry County experienced an average of 47 wildfires annually which burned a combined average of 370 acres per year. The data indicates that some fires in the area can be quite large, averaging over 37 acres per fire. Table 4.30 lists the number of reported wildfire occurrences in the county between the years 2009 and 2019.
Table 4.30: Historical Wildfire Events in Horry County
Year 2009-2010
2010-2011
2011-2012
2012-2013
2013-2014
2014-2015
2015-2016
2016-2017
2017-2018
2018-2019
Number of Fires
46 88 90 36 38 22 28 60 25 34
Number of Acres
401.5 612.3 839.4 1,139.40 95.2 54.2 170.6 216.4 73 99.8
Source: South Carolina Forestry Commission
Figure 4.29 shows Wildfire Ignition Density in Myrtle Beach based on data from the Southern Wildfire Risk Assessment. This data is based on historical fire ignitions and the likelihood of a wildfire igniting in an area. Occurrence is derived by modeling historic wildfire ignition locations to create an average ignition rate map. This is measured in the number of fires per year per 1,000 acres.35
35 Southern Wildfire Risk Assessment, 2014.

SECTION 4: HAZARD IDENTIFICATION AND ANALYSIS
City of Myrtle Beach Floodplain Management and Hazard Mitigation Plan
November 2020
4:89
Figure 4.29: Historical Wildfire Ignition Density in the City of Myrtle Beach
Source: Southern Wildfire Risk Assessment Data
4.23.4 Probability of Future Occurrences There is a highly likely probability of future wildfire events in the City of Myrtle Beach (100 percent annual probability), and it is particularly high during drought cycles and abnormally dry conditions. In addition, certain industrial operations/facilities and transport of flammable materials may also raise the threat of fire.
4.24 CONCLUSIONS ON HAZARD RISK
The hazard profiles presented in this section were developed using best available data and result in what may be considered principally a qualitative assessment as recommended by FEMA in its “How-to” guidance document titled Understanding Your Risks: Identifying Hazards and Estimating Losses (FEMA Publication 386-2). It relies heavily on historical and anecdotal data, stakeholder input, and professional and experienced judgment regarding observed and/or anticipated hazard impacts. It also carefully considers the findings in other relevant plans, studies, and technical reports.

SECTION 4: HAZARD IDENTIFICATION AND ANALYSIS
City of Myrtle Beach Floodplain Management and Hazard Mitigation Plan
November 2020
4:90
4.24.1 Hazard Extent Table 4.31 describes the extent of each natural hazard identified for Myrtle Beach. The extent of a hazard is defined as its severity or magnitude, as it relates to the planning area.
Table 4.31: Extent of Myrtle Beach Hazards
Atmospheric Hazards
Drought Drought extent is defined by the U.S. Drought Monitor classifications (None, Abnormal, Moderate, Severe, Extreme, and Exceptional). Horry County and Myrtle Beach have experienced Extreme levels of drought 5 times since 2000.
Extreme Heat The extent of extreme heat can be defined by the maximum temperature reached. The highest temperature recorded in Horry County is 107 degrees Fahrenheit (reported on June 27, 1952.
Hailstorm
Hail extent can be defined by the size of the hail stone. The largest hail stone reported in Myrtle Beach was 1.75 inches. This size hail has been recorded several times in the history of hail events in Myrtle Beach. It should be noted that future events may exceed this.
Ice Storm/Winter Weather
The extent of winter storms can be measured by the amount of snowfall or ice received (in inches). The greatest 24-hour snowfall reported in the city was around 15 in 1989 inches and ice accumulation has been over 1 inch in many cases. Due to unpredictable variations in snowfall, extent totals will vary and reliable data on snowfall totals is not abundantly available.
Lightning According to the Vaisala flash density map, Myrtle Beach is located in an area that experiences 6 to 20 lightning flashes per square mile per year. It should be noted that future lightning occurrences may exceed these figures.
Nor’easter
The extent of nor’easters can be measured by the amount of snowfall and ice received (in inches). As mentioned above, the greatest 24-hour snowfall reported in the city was over 15 inches and ice accumulation has been over 1 inch. In addition, extent for nor’easters can be defined by wind speed and wave height. In Myrtle Beach, Nor’easters have caused up to 40 mile per hour winds and waves that are 10 feet above sea level.
Tornado/Waterspout
Tornado hazard extent is measured by tornado occurrences in the US provided by FEMA as well as the Fujita/Enhanced Fujita Scale. The greatest magnitude reported in Myrtle Beach was an F2 (reported on July 6, 2001). It should be noted that an F5 tornado is possible.
Tropical Storm System/Hurricane
Hurricane extent is defined by the Saffir-Simpson Scale which classifies hurricanes into Category 1 through Category 5. The greatest classification of hurricanes to traverse directly through Myrtle Beach is a tropical storm (most recently on May 30, 2012). The city is susceptible to many of the coastal impacts of a hurricane or tropical storm including high wind speeds and storm surge (addressed below).
Wind Events (Thunderstorm/High Wind)
Wind event extent is defined by the wind speeds reported. The strongest recorded wind event in Myrtle Beach was reported on March 21, 1999 (approximately 75 knots). It should be noted that future events may exceed these historical occurrences.
Geologic Hazards
Earthquake
Earthquake extent can be measured by the Richter Scale and the Modified Mercalli Intensity (MMI) scale. According to data provided by the National Geophysical Data Center, the greatest MMI to impact the county was V (moderate) with a correlating Richter Scale measurement of between 4 and 5 (reported on February 3, 1972 and November 22, 1974).
Tidal Waves/Tsunami
There is no history of tidal waves or tsunami in the Atlantic basin in recent years, so an accurate extent measure is difficult to predict. However, it is possible that water depths similar to those experienced by storm surge would occur (in the range of 15-25 feet), with potentially even greater depths depending on the severity of the event that triggered the tidal wave/tsunami.

SECTION 4: HAZARD IDENTIFICATION AND ANALYSIS
City of Myrtle Beach Floodplain Management and Hazard Mitigation Plan
November 2020
4:91
Hydrologic Hazards
Erosion
The extent of erosion can be defined by the measurable rate of erosion that occurs or the number of cubic yards eroded. The SC Department of Health and Environmental Control estimates the rate of erosion in Myrtle Beach at around -0.59 feet per year. In addition, during Hurricane Hazel in 1954, almost 1 million cubic yards of sand were eroded in Myrtle Beach.
Flood
Flood extent can be measured by the amount of land and property in the floodplain as well as flood height and velocity. The amount of land in the floodplain accounts for 13.4 percent of the total land area in Myrtle Beach. Flood depth and velocity are recorded via United States Geological Survey stream gages in the city. The greatest peak discharge recorded for the city was reported on April 1, 1983. Water reached a discharge of 7,210 cubic feet per second and the gage height was 18.50 feet. Additional peak discharge readings and gage heights are in the table below.
Location/Jurisdiction Date Peak Discharge (cfs)
Gage Height (ft)
Horry County
Midway Swash at Myrtle Beach, SC
9/15/1999 623 8.74
AIW at Myrtlewood Golf Course at Myrtle Beach, SC
4/1/1983 7,210 18.50
Storm Surge Storm surge can be defined by the depth of inundation which is defined by the category of hurricane/tropical storm. Since Myrtle Beach could be impacted by a Category 5 storm, depth of inundation could be over 20 feet.
Sea Level Rise
Sea level rise is defined by the areas impacted but is more often associated with the amount of sea level rise that is expected to take place. Although it is difficult to predict an exact amount of rise, many projections call for somewhere in the range of 4-6 feet in the next 100 years.
Other Hazards
Acts of Terror
There is no history of terror threats in Myrtle Beach; however; it is possible that one of these events could occur. If this were to take place, the magnitude of the event could range on the scale of critical damage with many fatalities and injuries to the population.
Airplane Crash An airplane crash might cause death or injury to those involved in the accident as well as to bystanders near the site of the incident. The main effects of an airplane crash might be fire or explosions and a shutdown of transportation corridors.
Civil Disturbance
Often, one of the greatest impacts from civil disturbances is collateral damage to people and property. During civil disturbances, property can be destroyed or stolen, and citizens can be injured due to violence that erupts. First responders may also be targeted, and many times are more likely to be injured as a result of civil unrest that the typical citizen.
Hazardous Materials Incident
According to USDOT PHMSA, the largest hazardous materials incident reported in the city was 5,700 LGA released on the highway on November 2, 2003. It should be noted that larger events are possible.
Public Health Emergency
A public health/emerging disease threat could have a large-scale effect throughout the city and may cause illness in many people. Possible impacts from a disease threat depend largely on the impacted population but might include anything from absenteeism and loss of productivity in the workplace to death or serious illness to humans or livestock. A serious disease threat could affect many thousands of people.

SECTION 4: HAZARD IDENTIFICATION AND ANALYSIS
City of Myrtle Beach Floodplain Management and Hazard Mitigation Plan
November 2020
4:92
Wildfire
Wildfire data was provided by the South Carolina Forestry Commission and is reported annually by county from 2009-2019. Analyzing the data indicates the following wildfire hazard extent for the county.
• The greatest number of fires to occur in any year was 90 in 2011-2012.
• The greatest number of acres to burn in a single year occurred in 2012-2013 when 1,139.4 acres were burned.
Although this data lists the extent that has occurred, larger and more frequent wildfires are possible throughout the county.
4.25.2 Priority Risk Index In order to draw some meaningful planning conclusions on hazard risk for Myrtle Beach, the results of the hazard profiling process were used to generate countywide hazard classifications according to a “Priority Risk Index” (PRI). The purpose of the PRI, described further below, is to categorize and prioritize all potential hazards for Myrtle Beach as high, moderate, or low risk. Combined with the asset inventory and quantitative vulnerability assessment provided in the next section, the summary hazard classifications generated through the use of the PRI allows for the prioritization of those high hazard risks for mitigation planning purposes and, more specifically, the identification of hazard mitigation opportunities for Myrtle Beach to consider as part of their proposed mitigation strategy. The prioritization and categorization of identified hazards for Myrtle Beach is based principally on the PRI, a tool used to measure the degree of risk for identified hazards in a particular planning area. The PRI is used to assist the City of Myrtle Beach Floodplain Management and Hazard Mitigation Planning Committee (FMHMPC) in gaining consensus on the determination of those hazards that pose the most significant threat to Myrtle Beach based on a variety of factors. The PRI is not scientifically based but is rather meant to be utilized as an objective planning tool for classifying and prioritizing hazard risks in Myrtle Beach based on standardized criteria. The application of the PRI results in numerical values that allow identified hazards to be ranked against one another (the higher the PRI value, the greater the hazard risk). PRI values are obtained by assigning varying degrees of risk to five categories for each hazard (probability, impact, spatial extent, warning time, and duration). Each degree of risk has been assigned a value (1 to 4) and an agreed upon weighting factor,36 as summarized in Table 4.32. To calculate the PRI value for a given hazard, the assigned risk value for each category is multiplied by the weighting factor. The sum of all five categories equals the final PRI value, as demonstrated in the example equation below:
PRI VALUE = [(PROBABILITY x .30) + (IMPACT x .30) + (SPATIAL EXTENT x .20) + (WARNING TIME x .10) +
(DURATION x .10)] According to the weighting scheme applied for Myrtle Beach, the highest possible PRI value is 3.3 (flood hazard). Prior to being finalized, PRI values for each identified hazard were reviewed and accepted by the members of the FMHMPC.
36 The FMHMPC, based upon any unique concerns or factors for the planning area, may adjust the PRI weighting scheme during future plan updates.

SECTION 4: HAZARD IDENTIFICATION AND ANALYSIS
City of Myrtle Beach Floodplain Management and Hazard Mitigation Plan
November 2020
4:93
Table 4.32: Priority Risk Index for Myrtle Beach
PRI Category
Degree of Risk Assigned Weighting
Factor Level Criteria Index Value
Probability
Unlikely Less than 1% annual probability 1
30% Possible Between 1 and 10% annual probability 2
Likely Between 10 and 100% annual probability 3
Highly Likely 100% annual probability 4
Impact
Minor
Very few injuries, if any. Only minor property damage and minimal disruption on quality of life. Temporary shutdown of critical facilities.
1
30%
Limited
Minor injuries only. More than 10% of property in affected area damaged or destroyed. Complete shutdown of critical facilities for more than one day.
2
Critical
Multiple deaths/injuries possible. More than 25% of property in affected area damaged or destroyed. Complete shutdown of critical facilities for more than one week.
3
Catastrophic
High number of deaths/injuries possible. More than 50% of property in affected area damaged or destroyed. Complete shutdown of critical facilities for 30 days or more.
4
Spatial Extent
Negligible Less than 1% of area affected 1
20% Small Between 1 and 10% of area affected 2
Moderate Between 10 and 50% of area affected 3
Large Between 50 and 100% of area affected 4
Warning Time
More than 24 hours Self explanatory 1
10% 12 to 24 hours Self explanatory 2
6 to 12 hours Self explanatory 3
Less than 6 hours Self explanatory 4
Duration
Less than 6 hours Self explanatory 1
10% Less than 24 hours Self explanatory 2
Less than one week Self explanatory 3
More than one week Self explanatory 4
4.25.3 PRI Results Table 4.33 summarizes the degree of risk assigned to each category for all initially identified hazards based on the application of the PRI. Assigned risk levels were based on the detailed hazard profiles developed

SECTION 4: HAZARD IDENTIFICATION AND ANALYSIS
City of Myrtle Beach Floodplain Management and Hazard Mitigation Plan
November 2020
4:94
for this section, as well as input from the FMHMPC. The results were then used in calculating PRI values and making final determinations for the risk assessment.
Table 4.33: Summary of PRI Results for Myrtle Beach
Hazard
Category/Degree of Risk
Probability Impact Spatial Extent Warning Time Duration PRI
Score
Atmospheric Hazards
Drought Likely Minor Small Less than 6 hours Less than 6 hours 2.1
Extreme Heat Likely Limited Large More than 24 hours Less than 1 week 2.7
Hailstorm Highly Likely Minor Moderate Less than 6 hours Less than 6 hours 2.6
Ice Storm/Winter Weather Possible Limited Large More than 24 hours Less than 1 week 2.4
Lightning Highly Likely Minor Small Less than 6 hours Less than 6 hours 2.4
Nor’easter Unlikely Limited Large More than 24 hours Less than 1 week 2.1
Tornado/Waterspout Possible Critical Small 6 to 12 hours Less than 6 hours 2.3
Tropical Storm System/ Hurricane
Likely Critical Large More than 24 hours Less than 24 hours 2.9
Wind Events (Thunderstorm/ High Wind)
Highly Likely Limited Large Less than 6 hours Less than 6 hours 3.1
Geologic Hazards
Earthquakes Possible Minor Moderate Less than 6 hours Less than 6 hours 2.0
Tidal Waves/Tsunami Unlikely Limited Small Less than 6 hours More than 24 hours 1.7
Hydrologic Hazards
Erosion Highly Likely Minor Small More than 24 hours More than 1 week 2.4
Flood Highly Likely Critical Moderate 6 to 12 hours Less than 1 week 3.3
Storm Surge Likely Critical Large More than 24 hours Less than 24 hours 2.9
Sea Level Rise Likely Minor Small More than 24 hours More than 1 week 2.1
Other Natural Hazards
Acts of Terror Possible Critical Small Less than 6 hours Less than 6 hours 2.4
Airplane Crash Unlikely Critical Small Less than 6 hours Less than 6 hours 2.1
Civil Disturbance Possible Limited Small 12 to 24 hours More than 1 week 2.2
Hazardous Materials Incident Likely Limited Small Less than 6 hours Less than 24 hours 2.5
Public Health Emergency Possible Critical Small Less than 6 hours More than 1 week 2.7
Wildfire Highly Likely Minor Moderate Less than 6 hours Less than 24 hours 2.7
4.22 FINAL DETERMINATIONS The conclusions drawn from the hazard profiling process for Myrtle Beach, including the PRI results and input from the FMHMPC, resulted in the classification of risk for each identified hazard according to three categories: High Risk, Moderate Risk, and Low Risk (Table 4.34). For purposes of these classifications, risk is expressed in relative terms according to the estimated impact that a hazard will have on human life and property throughout all of Myrtle Beach. A more quantitative analysis to estimate potential dollar losses

SECTION 4: HAZARD IDENTIFICATION AND ANALYSIS
City of Myrtle Beach Floodplain Management and Hazard Mitigation Plan
November 2020
4:95
for each hazard has been performed separately and is described in the Vulnerability Assessment section. It should be noted that although some hazards are classified below as posing low risk, their occurrence of varying or unprecedented magnitudes is still possible in some cases and their assigned classification will continue to be evaluated during future plan updates.
Table 4.34: Conclusions on Hazard Risk for Myrtle Beach
HIGH RISK
Flood
Wind Events (Thunderstorm/High Wind)
Tropical Storm System/Hurricane
Storm Surge
Extreme Heat
MODERATE RISK
Public Health Emergency
Wildfire
Hailstorm
Hazardous Materials Incident
Ice Storm/Winter Weather/Winter Weather
Lightning
Erosion
Acts of Terror
Small Aircraft Crash
LOW RISK
Tornado/Waterspout
Civil Disturbance
Drought
Nor’easter
Sea Level Rise
Commercial Airplane Crash
Earthquake
Tidal Wave/Tsunami

SECTION 5: VULNERABILITY ASSESSMENT
City of Myrtle Beach Floodplain Management and Hazard Mitigation Plan
November 2020
5:37
SECTION 5 VULNERABILITY ASSESSMENT
44 CFR Requirement
44 CFR Part 201.6(c)(2)(ii): The risk assessment shall include a description of the jurisdiction's vulnerability to the hazards described in paragraph (c)(2)(i) of this section. The description shall include an overall summary of each hazard and its impact on the community. The plan should describe vulnerability in terms of: (A) The types and numbers of existing and future buildings, infrastructure, and critical facilities located in the identified hazard areas; (B) An estimate of the potential losses to vulnerable structures identified in paragraph (c)(2)(ii)(A) of this section and a description of the methodology used to prepare the estimate; (C) Providing a general description of land uses and development trends within the community so that mitigation options can be considered in future land use decisions.
5.1 OVERVIEW This section builds upon the information provided in Section 4: Hazard Identification and Analysis by identifying and characterizing an inventory of assets in Myrtle Beach and then by assessing the potential impact and amount of damages that can be expected to be caused by each identified hazard event. The primary objective of the vulnerability assessment is to quantify exposure and the potential loss estimates for each hazard. In doing so, Myrtle Beach may better understand its unique risks to identified hazards and be better prepared to evaluate and prioritize specific hazard mitigation actions. This section begins with an explanation of the methodology applied to complete the vulnerability assessment followed by a summary description of the asset inventory as compiled for Myrtle Beach. The remainder of this section focuses on the results of the assessment conducted and is organized by hazard as listed below:
Atmospheric 5.4 Drought 5.5 Extreme Heat 5.6 Hailstorm 5.7 Ice Storm 5.8 Lightning 5.9 Nor’easter 5.10 Tornado/Waterspout 5.11 Tropical Storm System/Hurricane 5.12 Wind Events (Thunderstorm/High Wind)
Geologic
5.13 Earthquake 5.14 Tidal Wave/Tsunami

SECTION 5: VULNERABILITY ASSESSMENT
City of Myrtle Beach Floodplain Management and Hazard Mitigation Plan
November 2020
5:38
Hydrologic 5.15 Erosion 5.16 Flood 5.17 Storm Surge 5.18 Sea Level Rise
Other
5.19 Acts of Terror 5.20 Airplane Crash (Commercial/Small Aircraft) 5.21 Civil Disturbance 5.22 Hazardous Materials Incident 5.23 Public Health Emergency 5.24 Wildfire
5.2 METHODOLOGY This vulnerability assessment was conducted using two distinct methodologies: (1) utilizing a geographic information system (GIS)-based analysis and (2) applying a statistical risk assessment methodology. Each approach provides estimates for the potential impact of hazards by using a common, systematic framework for evaluation, including historical occurrence information provided in the Hazard Identification and Analysis section. The results of the vulnerability assessment for the aforementioned hazards are provided following the information on hazard identification and analysis. A GIS-based analysis was conducted for the following hazards:
Tropical Storm System/Hurricane Earthquake Flood Storm Surge Sea Level Rise Hazardous Materials Incidents Wildfire
A statistical risk assessment approach was used to analyze the remaining hazards:
Drought Extreme Heat Hailstorm Ice Storm Lightning Nor’easter Wind Events (Thunderstorm/High Wind) Tornado/Waterspout Tidal Wave/Tsunami Erosion Acts of Terror Airplane Crash Civil Disturbance

SECTION 5: VULNERABILITY ASSESSMENT
City of Myrtle Beach Floodplain Management and Hazard Mitigation Plan
November 2020
5:39
Public Health Emergency
A brief description of the two different approaches is provided on the following pages.
5.2.1 GIS-Based Analysis For the GIS-based analysis, digital data was collected from local, regional, state, and national sources. ESRI® ArcGIS™ 10.7 was used to assess hazard vulnerability utilizing this digital data, including local tax assessor records for individual parcels and buildings and georeferenced point locations for identified assets (critical facilities and infrastructure, special populations, etc.). Using these data layers, hazard vulnerability can be quantified by estimating the assessed building value for parcels and/or buildings determined to be located in identified hazard areas. FEMA’s Hazus-MH software (further described below) was also used to model hurricane winds, coastal flood, storm surge, and earthquake and estimate potential losses for these hazards. To estimate vulnerable populations in hazard areas, digital Census 2010 data by census block was obtained and census blocks intersecting with hazard areas were used to determine exposed population counts. The objective of the GIS-based analysis was to determine the estimated vulnerability of people, buildings, and critical facilities to the identified hazards for Myrtle Beach jurisdictions using best available geospatial data. Local databases were made available through Myrtle Beach including tax assessor records, parcel records, building footprints, and critical facilities data as well as other regional, state, and federal government data sources were used in combination with digital hazard data as described in the Hazard Identification and Analysis section. The results of the analysis provided an estimate of the number of people, buildings, and critical facilities, as well as the value of buildings, determined to be potentially at risk to those hazards with delineable geographic hazard boundaries. A more specific description of the GIS-based analysis conducted for each particular hazard is provided in the individual hazard sections.
5.2.1 Risk Modeling Software Analysis
Hazus-MH There are several models that exist to model hazards. Hazus-MH was used in this vulnerability assessment to address the aforementioned hazards Hazus-MH is a standardized loss estimation software program developed by FEMA. It is built upon an integrated GIS platform to conduct analysis at a regional level (i.e., not on a structure-by-structure basis). The Hazus-MH risk assessment methodology is parametric, in that distinct hazard and inventory parameters (e.g., wind speed and building types) can be modeled using the software to determine the impact (i.e., damages and losses) on the built environment. This risk assessment for Myrtle Beach applied Hazus-MH to produce hazard profiles and estimate losses for four hazards for the planning area. At the time this analysis

SECTION 5: VULNERABILITY ASSESSMENT
City of Myrtle Beach Floodplain Management and Hazard Mitigation Plan
November 2020
5:40
was completed, Hazus-MH 4.2 (2020) was used to estimate potential losses from hurricane winds, coastal flood, storm surge, and earthquake hazards using Hazus-MH methodology. In generating loss estimates through Hazus-MH, some data normalization was necessary to account for recognized differences between actual assessed building values as provided by Myrtle Beach and estimated replacement building value data as provided within Hazus-MH. In order to account for the difference between modeled and actual values, the ratio of estimated losses produced by Hazus-MH as compared to total Hazus-MH building inventory was used to estimate percent damage. The percent damage ratio was then applied to the local assessed values in order to estimate annualized potential losses and loss ratios in Myrtle Beach for this analysis. Figure 5.1 illustrates the conceptual model of the Hazus-MH methodology as applied to Myrtle Beach.
Figure 5.1: Conceptual Model of Hazus-MH Methodology
5.2.2 Statistical Risk Assessment Methodology The statistical risk assessment methodology was applied to analyze hazards of concern that were outside the scope of HAZUS-MH and the GIS-based risk assessment. This includes hazards that do not have geographically definable boundaries and are therefore excluded from spatial analysis through GIS. Examples include hailstorm, lightning, and tornado. This methodology uses a statistical approach and mathematical modeling of risk to predict a hazard’s frequency of occurrence and estimated impacts

SECTION 5: VULNERABILITY ASSESSMENT
City of Myrtle Beach Floodplain Management and Hazard Mitigation Plan
November 2020
5:41
based on recorded or historic damage information (presented in the Hazard Identification and Analysis section). Historical data for each hazard as described in the Hazard Identification and Analysis section was used and statistical evaluations were performed using manual calculations. The general steps used in the statistical risk assessment methodology are summarized below:
1. Compile data from local, state, and national sources as well as literature;
2. Clean up data, including removal of duplicate records and update losses to account for inflation;
3. Identify patterns in frequency, intensity, vulnerability, and loss
4. Statistically and probabilistically extrapolate the patterns; and
5. Produce meaningful results, including the development of annualized loss estimates.
Figure 5.2 illustrates a conceptual model of the statistical risk assessment methodology as applied to Myrtle Beach.
Figure 5.2: Conceptual Model of the Statistical Risk Assessment Methodology
The vulnerability assessment findings are presented in terms of potential annualized losses whenever possible. In general, presenting results in the annualized form is useful in three ways:
1. This approach accounts for the contribution of potential losses from all future disasters;
2. Annualized results for different hazards are readily comparable, thus easier to rank; and
3. The use of annualized losses is the most objective approach for evaluating mitigation alternatives.
The estimated Annualized Loss (AL) addresses the key idea of risk: the probability of the loss occurring in the study area (largely a function of building construction type and quality). By annualizing estimated losses, the AL factors in historic patterns of frequent smaller events with infrequent but larger events to provide a balanced presentation of the risk. Loss estimates provided in this vulnerability assessment are based on best available data, and the methodologies applied result in an approximation of risk. These estimates should be used to understand relative risk from hazards and potential losses. Uncertainties are inherent in any loss estimation methodology, arising in part from incomplete scientific knowledge concerning natural hazards and their effects on the built environment. Uncertainties also result from approximations and simplifications that

SECTION 5: VULNERABILITY ASSESSMENT
City of Myrtle Beach Floodplain Management and Hazard Mitigation Plan
November 2020
5:42
are necessary for a comprehensive analysis (e.g., incomplete inventories, demographics, or economic parameters). All conclusions are presented in “Conclusions on Hazard Vulnerability” (Section 5.25) at the end of this section. Findings for each hazard are detailed in the hazard-by-hazard vulnerability assessment that follows.
5.3 STUDY AREA DEFINITION
5.3.1 Asset Inventory An inventory of Myrtle Beach’s geo-referenced assets1 was compiled in order to identify and characterize those properties potentially at risk to the identified hazards. By understanding the type and number of assets that exist and where they are located in relation to known hazard areas, the relative risk and vulnerability for such assets can be assessed. Under this assessment, two categories of assets were created and then further assessed through GIS analysis. The two categories of assets consist of:
1. Improved Property: Includes all improved properties in Myrtle Beach according to local parcel
data provided by Myrtle Beach.2 The information has been expressed in terms of the number of parcels and total assessed value of improvements (buildings) that may be exposed to the identified hazards. Due to the way in which local records are maintained, structure-level (building footprint) data has not been included since there are a high number of condos within the city which are counted as one structure but are also recorded based on the number of individual units per condo under parcel records.
2. Critical Facilities: Includes airport, fire stations, medical facilities, police stations, schools, and
other critical facilities located within Myrtle Beach. The following tables provide a detailed listing of the geo-referenced assets that have been identified for inclusion in the vulnerability assessment for Myrtle Beach. While this listing is not all inclusive for assets located in the City, it is anticipated that it will be expanded during future plan updates as more geo-referenced data becomes available for use in GIS analysis.
5.3.2 Improved Property Table 5.1 lists the number of parcels and the total assessed value of improvements for participating areas of Myrtle Beach (study area of vulnerability assessment).3
1 While potentially not all-inclusive for Myrtle Beach, “georeferenced” assets include those assets for which specific location data is readily available for connecting the asset to a specific geographic location for purposes of GIS analysis. Data for this analysis
was obtained from the City of Myrtle Beach and Horry County. 2 Improved properties in non-participating areas are not included in any way in this vulnerability assessment. 3 Total assessed values for improvements is based on tax assessor records as joined to digital parcel data as of April 2020. This data does not include dollar figures for tax-exempt improvements such as publicly owned buildings and facilities.

SECTION 5: VULNERABILITY ASSESSMENT
City of Myrtle Beach Floodplain Management and Hazard Mitigation Plan
November 2020
5:43
Table 5.1: Improved Property in Myrtle Beach
Jurisdiction Number of Parcels with
Improvements Total Assessed Value of
Improvements
Myrtle Beach 33,386 $4,515,364,606
Source: Myrtle Beach/Horry County GIS
5.3.3 Critical Facilities Table 5.2 lists the fire stations, police stations, medical facilities, airport, and other essential facilities in Myrtle Beach. In addition, Figure 5.3 shows the locations of essential facilities in Myrtle Beach. Table 5.55, near the end of this section, shows a complete list of critical facility names and hazard vulnerability.
Table 5.2: Critical Facilities in Myrtle Beach
Location Number
Airports 1
Bridges 6
Emergency Operations Center 1
Fire Stations 6
Government 1
Medical Facility 5
Police Stations 2
Water/Sewer Treatment Facilities 1
Source: City of Myrtle Beach

SECTION 5: VULNERABILITY ASSESSMENT
City of Myrtle Beach Floodplain Management and Hazard Mitigation Plan
November 2020
5:44
Figure 5.3: Critical Facility Inventory for the City of Myrtle Beach
Source: City of Myrtle Beach
5.3.4 Social Vulnerability In addition to identifying those assets potentially at risk to identified hazards, it is important to identify and assess those particular segments of the resident population in Myrtle Beach that are potentially at risk to these hazards. Although the average daily population is estimated at 105,000 people. During peak tourism season, it is not unusual to have 300,000 or more people that visit the area during the summer months. Further information on population can be found in Section 3: Community Profile. Figure 5.4 illustrates the residential population density across the City as it was reported by the U.S. Census Bureau in 2010 at the census block level. The total population in Myrtle Beach according to Census data was 27,109 persons. However, the population can have large influxes based on visitors and short-term residents. As can be seen in the figure, most of the City’s population is located along or near major transportation routes and waterways. More specific information on the estimated number of people living within identified hazard areas is provided for each hazard within this section.

SECTION 5: VULNERABILITY ASSESSMENT
City of Myrtle Beach Floodplain Management and Hazard Mitigation Plan
November 2020
5:45
Figure 5.4: Population Density in Myrtle Beach
Source: U.S. Census Bureau, 2010
Finally, since Myrtle Beach is a beach community that attracts a large tourist population each year, it is important to recognize the large seasonal population that is present in the City, especially during the peak season which generally runs from March through October. During this time, the City’s population swells and there are many more people at risk to the hazards identified below. Indeed, according to the U.S. Census, in 2010, there were 8,505 housing units that were classified as being for seasonal, recreational, or occasional use out of 23,262 total units. By these counts, that means that just over one third of the housing units in the City are occupied only part of the year, likely by tourists during the peak season. If these numbers are applied to roughly gauge the change in population in the City from non-peak to peak season, it would indicate that there is at least a 33 percent increase in the number of people present from non-peak to peak season, and the number is likely higher as many tourists come in larger groups than the average household size. This has significant implications for emergency management and planning for the City because there will be significantly more people to account for when it comes to evacuating populations and providing protection/mitigation to people and property.

SECTION 5: VULNERABILITY ASSESSMENT
City of Myrtle Beach Floodplain Management and Hazard Mitigation Plan
November 2020
5:46
5.3.4 Development Trends and Changes in Vulnerability Since the previous hazard mitigation plan was approved in 2015, Myrtle Beach has experienced some growth and development. Table 5.3 shows the number of building units constructed since 2010 according to the U.S. Census American Community Survey.
Table 5.3: Building Counts for Myrtle Beach
Jurisdiction Total Housing Units (2018)
Units Built 2014 or later
% Building Stock Built Post-2014
Myrtle Beach 24,853 944 3.8
Source: United States Census Bureau
Table 5.4 shows population growth for the City from 2015 to 2018 based on U.S. Census American Community Survey.
Table 5.4: Population Growth for Myrtle Beach
Jurisdiction
Population Estimate
% Change 2015-2018
2015 2016 2017 2018
Myrtle Beach 29,198 30,106 30,760 31,783 8.9%
Source: United States Census Bureau
Based on the data above, there has been a low rate of residential housing development in the City since 2014. However, it should be noted that the City is essentially built out in many areas. Additionally, there has been some significant population growth in the city since 2015. Since the population has increased, there is now a greater number of people exposed to the identified hazards. Therefore, development and population growth have impacted the city’s vulnerability since the previous local hazard mitigation plan was approved and there has been some increase in the overall vulnerability. See Section 3.5 Development Trends for a map of recent high-density development activity and future floodplains. It is also important to note that as development increases in the future, greater populations and more structures and infrastructure will be exposed to potential hazards if development occurs in the floodplains, storm surge zones, sea level rise inundation areas, primary and secondary hazardous materials buffers, or high wildfire risk areas.

SECTION 5: VULNERABILITY ASSESSMENT
City of Myrtle Beach Floodplain Management and Hazard Mitigation Plan
November 2020
5:47
Atmospheric Hazards
5.4 DROUGHT
PRI Value: 2.1 Annualized Loss Estimate: Negligible According to the qualitative assessment performed using the PRI tool, the drought hazard scored a PRI value of 2.1 (from a scale of 0 to 4, with 4 being the highest risk level). Table 5.5 summarizes the risk levels assigned to each PRI category.
Table 5.5: Qualitative Assessment for Drought
Probability Likely
Impact Minor
Spatial Extent Small
Warning Time Less than 6 hours
Duration Less than 6 hours
Because it cannot be predicted where drought may occur, all existing and future buildings, facilities, and populations in Myrtle Beach are considered to be equally exposed to this hazard and could potentially be impacted. These results are shown Tables 5.1-5.4. It is important to note that only reported drought events have been factored into this vulnerability assessment.4 Table 5.6 shows total exposure and potential annualized property losses and percent loss ratios resulting from the drought hazard for Myrtle Beach.
Table 5.6: Total Exposure and Potential Annualized Losses from Drought
Location Estimated
Population At Risk
Number of Parcels with Improvements
Total Assessed Value of
Improvements (Buildings)
Annualized Expected
Property Losses
Myrtle Beach 31,783 33,386 $4,515,364,606 $0
5.4.1 Asset Vulnerability All of the inventoried assets in Myrtle Beach are equally exposed to the drought hazard, and any anticipated future damages or losses are expected to be minimal.
4 It is possible that additional drought events may have occurred since 1996 that were not reported to NCEI and are not accounted for in this analysis.

SECTION 5: VULNERABILITY ASSESSMENT
City of Myrtle Beach Floodplain Management and Hazard Mitigation Plan
November 2020
5:48
5.5 EXTREME HEAT
PRI Value: 2.7 Annualized Loss Estimate: Negligible According to the qualitative assessment performed using the PRI tool, the extreme heat hazard scored a PRI value of 2.7 (from a scale of 0 to 4, with 4 being the highest risk level). Table 5.7 summarizes the risk levels assigned to each PRI category.
Table 5.7: Qualitative Assessment for Extreme Heat
Probability Likely
Impact Limited
Spatial Extent Large
Warning Time More than 24 hours
Duration Less than 1 week
Because it cannot be predicted where extreme heat may occur, all existing and future buildings, facilities, and populations in Myrtle Beach are considered to be equally exposed to this hazard and could potentially be impacted. These results are shown Tables 5.1-5.4. It is important to note that only reported extreme heat events have been factored into this vulnerability assessment.5 Table 5.8 shows total exposure and potential annualized property losses and percent loss ratios resulting from the extreme heat hazard for Myrtle Beach.
Table 5.8: Total Exposure and Potential Annualized Losses from Extreme Heat
Location Estimated
Population At Risk
Number of Parcels with Improvements
Total Assessed Value of
Improvements (Buildings)
Annualized Expected
Property Losses
Myrtle Beach 31,783 33,386 $4,515,364,606 $0
5.5.1 Asset Vulnerability All of the inventoried assets in Myrtle Beach are equally exposed to the extreme heat hazard, and any anticipated future damages or losses are expected to be minimal.
5 It is possible that additional extreme heat events may have occurred since 1996 that were not reported to NCEI and are not accounted for in this analysis.

SECTION 5: VULNERABILITY ASSESSMENT
City of Myrtle Beach Floodplain Management and Hazard Mitigation Plan
November 2020
5:49
5.6 HAILSTORM
PRI Value: 2.6 Annualized Loss Estimate: $727 According to the qualitative assessment performed using the PRI tool, the hail hazard scored a PRI value of 2.6 (from a scale of 0 to 4, with 4 being the highest risk level). Table 5.9 summarizes the risk levels assigned to each PRI category.
Table 5.9: Qualitative Assessment for Hailstorm
Probability Highly Likely
Impact Minor
Spatial Extent Moderate
Warning Time Less than 6 hours
Duration Less than 6 hours
Because it cannot be predicted where hail may fall, all existing and future buildings, facilities, and populations in Myrtle Beach are considered to be equally exposed to this hazard and could potentially be impacted (Tables 5.1-5.4). It is important to note that only reported hail events have been factored into this vulnerability assessment.6 To estimate losses due to hail, NCEI historical hailstorm loss data was used to develop a hailstorm stochastic model. In this model:
Losses were scaled for inflation and
Expected annualized losses were calculated through a non-linear regression of historical data.
Table 5.10 shows total exposure and potential annualized property losses and percent loss ratios resulting from the hailstorm hazard for Myrtle Beach.
Table 5.10: Total Exposure and Potential Annualized Losses from Hailstorm
Location Estimated
Population At Risk
Number of Parcels with Improvements
Total Assessed Value of
Improvements (Buildings)
Annualized Expected
Property Losses
Myrtle Beach 31,783 33,386 $4,515,364,606 $727
5.6.1 Asset Vulnerability While all of the inventoried assets in Myrtle Beach are equally exposed to the hail hazard, any anticipated future damages or losses are expected to be minimal. Specific critical facilities can be found in Table 5.55 near the end of this section.
6 It is possible that additional hail events may have occurred since 1955 that were not reported to NCEI and are not accounted for in this analysis.

SECTION 5: VULNERABILITY ASSESSMENT
City of Myrtle Beach Floodplain Management and Hazard Mitigation Plan
November 2020
5:50
5.7 ICE STORM
PRI Value: 2.4 Annualized Loss Estimate: Negligible According to the qualitative assessment performed using the PRI tool, the ice storm hazard scored a PRI value of 2.4 (from a scale of 0 to 4, with 4 being the highest risk level). Table 5.11 summarizes the risk levels assigned to each PRI category.
Table 5.11: Qualitative Assessment for Ice Storm
Probability Possible
Impact Limited
Spatial Extent Large
Warning Time More than 24 hours
Duration Less than 1 week
Because it cannot be predicted where an ice storm or winter storm (as defined in the Hazard Identification and Analysis section) may occur, all existing and future buildings, facilities, and populations are considered to be exposed to this hazard and could potentially be impacted. These results are shown in Tables 5.1-5.4. It is important to note that only reported ice/winter storm occurrences have been factored into this vulnerability assessment.7 Although NCEI does not report any historical damage, local records show at least $256,000 in past damages to property due to ice/winter storms. Table 5.12 shows total exposure and potential annualized property losses and percent loss ratios resulting from the ice storm hazard for Myrtle Beach.
Table 5.12: Total Exposure and Potential Annualized Losses from Ice Storm
Location Estimated
Population At Risk
Number of Parcels with Improvements
Total Assessed Value of
Improvements (Buildings)
Annualized Expected
Property Losses
Myrtle Beach 31,783 33,386 $4,515,364,606 $0
5.7.1 Asset Vulnerability All of the inventoried assets in Myrtle Beach are exposed to the winter weather hazard (Table 5.55). Specific vulnerabilities for these assets will be greatly dependent on their individual design and the mitigation measures in place where appropriate. Such site-specific vulnerability determinations are outside the scope of this assessment but will be considered during future plan updates.
7 It is possible that additional winter storm and freeze events may have occurred since 1996 that were not reported to NCEI and are not accounted for in this analysis.

SECTION 5: VULNERABILITY ASSESSMENT
City of Myrtle Beach Floodplain Management and Hazard Mitigation Plan
November 2020
5:51
5.8 LIGHTNING
PRI Value: 2.4 Annualized Loss Estimate: $17,530 According to the qualitative assessment performed using the PRI tool, the lightning hazard scored a PRI value of 2.4 (from a scale of 0 to 4, with 4 being the highest risk level). Table 5.13 summarizes the risk levels assigned to each PRI category.
Table 5.13: Qualitative Assessment for Lightning
Probability Highly Likely
Impact Minor
Spatial Extent Small
Warning Time Less than 6 hours
Duration Less than 6 hours
Because it cannot be predicted where lightning may strike, all existing and future buildings, facilities, and populations in Myrtle Beach are considered to be exposed to this hazard and could potentially be impacted. These results are shown in Tables 5.1-5.4. It is important to note that only reported lightning strikes have been factored into this vulnerability assessment.8 To estimate losses due to lightning, NCEI historical lightning loss data was used to develop a lightning stochastic model. In this model:
Losses were scaled for inflation and
Expected annualized losses were calculated through a non-linear regression of historical data.
Table 5.14 shows total exposure and potential annualized property losses and percent loss ratios resulting from the lightning hazard for Myrtle Beach.
Table 5.14: Total Exposure and Potential Annualized Losses from Lightning
Location Estimated
Population At Risk
Number of Parcels with Improvements
Total Assessed Value of
Improvements (Buildings)
Annualized Expected
Property Losses
Myrtle Beach 31,783 33,386 $4,515,364,606 $17,530
5.8.1 Asset Vulnerability While all of the inventoried assets in Myrtle Beach are equally exposed to the lightning hazard, any anticipated future damages or losses are expected to be minimal. Inventoried critical facilities in Myrtle Beach can be found in Table 5.55 near in the end of this section.
8 It is possible that additional lightning strikes may have occurred since 1996 that were not reported to NCEI and are not accounted for in this analysis.

SECTION 5: VULNERABILITY ASSESSMENT
City of Myrtle Beach Floodplain Management and Hazard Mitigation Plan
November 2020
5:52
5.9 NOR’EASTER
PRI Value: 2.1 Annualized Loss Estimate: Negligible According to the qualitative assessment performed using the PRI tool, the nor’easter hazard scored a PRI value of 2.1 (from a scale of 0 to 4, with 4 being the highest risk level). Table 5.15 summarizes the risk levels assigned to each PRI category.
Table 5.15: Qualitative Assessment for a Nor’easter
Probability Unlikely
Impact Limited
Spatial Extent Large
Warning Time More than 24 hours
Duration Less than 1 week
Because it cannot be predicted what areas a nor’easter may affect, all existing and future buildings, facilities, and populations in Myrtle Beach are considered to be exposed to this hazard and could potentially be impacted. These results are shown in Tables 5.1-5.4. Given the lack of historical loss data on significant nor’easter damage occurrences in Myrtle Beach, it is assumed that while one major event could potentially result in significant losses due to nor’easters, annualizing structural losses over a long period of time would most likely yield a very low annualized loss estimate for the city. Although NCEI does not report any historical damage, local records show around $14.8 million in damages to property across Horry County from the 1987 Nor’easter. Table 5.16 shows total exposure and potential annualized property losses and percent loss ratios resulting from the nor’easter hazard for Myrtle Beach.
Table 5.16: Total Exposure and Potential Annualized Losses from Nor’easter
Location Estimated
Population At Risk
Number of Parcels with Improvements
Total Assessed Value of
Improvements (Buildings)
Annualized Expected
Property Losses
Myrtle Beach 31,783 33,386 $4,515,364,606 $0
5.9.1 Asset Vulnerability While all of the inventoried assets in Myrtle Beach are equally exposed to the Nor’easter hazard, any anticipated future damages or losses are expected to be minimal. Inventoried critical facilities for Myrtle Beach can be found in Table 5.55 near the end of this section.

SECTION 5: VULNERABILITY ASSESSMENT
City of Myrtle Beach Floodplain Management and Hazard Mitigation Plan
November 2020
5:53
5.10 TORNADO/WATERSPOUT
PRI Value: 2.3 Annualized Loss Estimate: $481,512 According to the qualitative assessment performed using the PRI tool, the tornado hazard scored a PRI value of 2.3 (from a scale of 0 to 4, with 4 being the highest risk level). Table 5.17 summarizes the risk levels assigned to each PRI category.
Table 5.17: Qualitative Assessment for Tornado/Waterspout
Probability Possible
Impact Critical
Spatial Extent Small
Warning Time 6 to 12 hours
Duration Less than 6 hours
Historical evidence shows that the City is vulnerable to tornadic activity. This hazard can result from severe thunderstorm activity or may occur during a major tropical storm or hurricane. Because it cannot be predicted where a tornado may touch down, all existing and future buildings, facilities, and populations are considered to be exposed to this hazard and could potentially be impacted. These results are shown in Tables 5.1-5.4. It is important to note that only reported tornadoes have been factored into this vulnerability assessment.9 To estimate losses due to tornadoes, NCEI historical tornado loss data for occurrences in Myrtle Beach was used to develop a tornado stochastic model. In this model:
Losses were scaled for inflation and
Expected annualized losses were calculated through a non-linear regression of historical data.
Table 5.18 shows total exposure and potential annualized property losses and percent loss ratios resulting from the tornado hazard for Myrtle Beach.
Table 5.18: Total Exposure and Potential Annualized Losses from Tornado/Waterspout
Location Estimated
Population At Risk
Number of Parcels with Improvements
Total Assessed Value of
Improvements (Buildings)
Annualized Expected
Property Losses
Myrtle Beach 31,783 33,386 $4,515,364,606 $481,512
9 It is possible that additional tornado events may have occurred since 1950 that were not reported to NCEI and are not accounted for in this analysis.

SECTION 5: VULNERABILITY ASSESSMENT
City of Myrtle Beach Floodplain Management and Hazard Mitigation Plan
November 2020
5:54
5.10.1 Asset Vulnerability All of the inventoried assets in Myrtle Beach are exposed to the tornado hazard (Table 5.55). Specific vulnerabilities for these assets will be greatly dependent on their individual design and the mitigation measures in place where appropriate. Such site-specific vulnerability determinations are outside the scope of this assessment but will be considered during future plan updates.
5.11 TROPICAL STORM SYSTEM/HURRICANE
PRI Value: 2.9 Annualized Loss Estimate: $16,252,000 According to the qualitative assessment performed using the PRI tool, the tropical storm system and hurricane hazard scored a PRI value of 2.9 (from a scale of 0 to 4, with 4 being the highest risk level). Table 5.19 summarizes the risk levels assigned to each PRI category.
Table 5.19: Qualitative Assessment for Tropical Storm System/Hurricane
Probability Likely
Impact Critical
Spatial Extent Large
Warning Time More than 24 hours
Duration Less than 24 hours
Because hurricanes and tropical storms often impact large areas and cross jurisdictional boundaries, all existing and future buildings, facilities, and populations are considered to be exposed to this hazard and could potentially be impacted. These results are shown in Tables 5.1-5.4. Hurricanes and tropical storms can cause damage through numerous additional hazards such as flooding, coastal erosion, high winds, and precipitation, thus it is difficult to estimate total potential losses from these cumulative effects. However, the current HAZUS-MH hurricane model only analyzes hurricane winds and is not capable of modeling and estimating cumulative losses from all hazards associated with hurricanes; therefore, only hurricane winds are analyzed in this section. Vulnerability to storm surge resulting from hurricanes is addressed individually in a separate section. It can be assumed that all existing and future buildings and populations are at risk to the hurricane and tropical storm hazard. Hazus-MH 4.2 was used to determine annualized losses for the county as shown below in Table 5.20. In the comparative annualized loss analysis at the end of this section, only losses to buildings are reported in order to best match annualized losses reported for other hazards. Hazus-MH reports losses at the U.S. Census tract level, so determining participating jurisdiction losses was not possible.
Table 5.20: Annualized Loss Estimations for Hurricane Wind Hazard
Location Building Loss Contents
Loss Inventory
Loss Total Annualized
Loss
Horry County $16,252,000 $5,619,000 $57,000 $21,928,000
Source: Hazus-MH 4.2

SECTION 5: VULNERABILITY ASSESSMENT
City of Myrtle Beach Floodplain Management and Hazard Mitigation Plan
November 2020
5:55
A probabilistic scenario was created using HAZUS-MH to assess the vulnerability of Myrtle Beach to hurricane winds. Default HAZUS-MH wind speed data, damage functions, and methodology were used to determine the potential estimated losses for 50-, 100-, 200-, 500-, and 1,000-year frequency events. However, this information on loss estimation was only available at the county level. Table 5.21 shows estimated potential losses to improved properties in Horry County for 50-, 100-, 200-, 500-, and 1,000-year hurricane wind event scenarios.
Table 5.21: Potential Losses to Improved Property from Tropical Storm Systems and Hurricanes by Return Period in Horry County
Return Period Estimated Potential Losses
10-year $3,236,000
20-year $29,962,000
50-year $138,345,000
100-year $355,925,000
200-year $779,869,000
500-year $1,657,461,000
1000-year $2,302,031,000
Source: HAZUS-MH, 4.2
Table 5.22 shows total exposure and potential annualized property losses and percent loss ratios resulting from the tropical storm system and hurricane hazard for Myrtle Beach. As explained above, overall annualized property loss is representative of the county-level estimate.
Table 5.22: Total Exposure and Potential Annualized Losses from Tropical Storm Systems and Hurricanes
Location Estimated
Population At Risk
Number of Parcels with Improvements
Total Assessed Value of
Improvements (Buildings)
Annualized Expected
Property Losses*
Myrtle Beach 31,783 33,386 $4,515,364,606 $16,252,000
*The annualized expected property loss estimate is for all of Horry County.
5.11.1 Asset Vulnerability All of the assets inventoried in Myrtle Beach are exposed to hurricane and coastal storm wind (Table 5.55). Specific vulnerabilities for these assets will be greatly dependent on their individual design and the mitigation measures in place where appropriate. Such site-specific vulnerability determinations are outside the scope of this assessment but will be considered during future plan updates.

SECTION 5: VULNERABILITY ASSESSMENT
City of Myrtle Beach Floodplain Management and Hazard Mitigation Plan
November 2020
5:56
5.12 WIND EVENTS (THUNDERSTORM AND HIGH WIND)
PRI Value: 3.1 Annualized Loss Estimate: $78,282 According to the qualitative assessment performed using the PRI tool, the wind event hazard scored a PRI value of 3.1 (from a scale of 0 to 4, with 4 being the highest risk level). Table 5.23 summarizes the risk levels assigned to each PRI category.
Table 5.23: Qualitative Assessment for Wind Events (Thunderstorm and High
Wind)
Probability Highly Likely
Impact Limited
Spatial Extent Large
Warning Time Less than 6 hours
Duration Less than 6 hours
Historical evidence shows that the City is vulnerable to thunderstorm and severe wind hazards. This is an atmospheric hazard, so all existing and future buildings, facilities, and populations are considered to be exposed to this hazard and could potentially be impacted. These results are shown in Tables 5.1-5.4. It is important to note that only reported thunderstorm wind events have been factored into this vulnerability assessment.10 To estimate losses due to severe thunderstorm wind, NCEI data for occurrences in Myrtle Beach was used to develop a severe thunderstorm stochastic model. In this model:
Losses were scaled for inflation and
Expected annualized losses were calculated through a non-linear regression of historical data.
Table 5.24 shows total exposure and potential annualized property losses and percent loss ratios resulting from the severe thunderstorm wind hazard for Myrtle Beach.
Table 5.24: Total Exposure and Potential Annualized Losses from Wind Events (Thunderstorm and High Wind)
Location Estimated
Population At Risk
Number of Parcels with Improvements
Total Assessed Value of
Improvements (Buildings)
Annualized Expected
Property Losses
Myrtle Beach 31,783 33,386 $4,515,364,606 $78,282
10 It is possible that additional thunderstorm events may have occurred since 1955 that were not reported to NCEI and are not accounted for in this analysis.

SECTION 5: VULNERABILITY ASSESSMENT
City of Myrtle Beach Floodplain Management and Hazard Mitigation Plan
November 2020
5:57
5.12.1 Asset Vulnerability All of the inventoried assets in Myrtle Beach are exposed to the severe thunderstorm wind hazard. Specific vulnerabilities for these assets will be greatly dependent on their individual design and the mitigation measures in place where appropriate. Such site-specific vulnerability determinations are outside the scope of this assessment but will be considered during future plan updates. A complete list of critical facilities at risk can be found in Table 5.55 near the end of this section.
Geologic Hazards
5.13 EARTHQUAKE
PRI Value: 2.0 Annualized Loss Estimate: $79,000 According to the qualitative assessment performed using the PRI tool, the earthquake hazard scored a PRI value of 2.0 (from a scale of 0 to 4, with 4 being the highest risk level). Table 5.25 summarizes the risk levels assigned to each PRI category.
Table 5.25: Qualitative Assessment for Earthquake
Probability Possible
Impact Minor
Spatial Extent Moderate
Warning Time Less than 6 hours
Duration Less than 6 hours
An earthquake has the potential to impact all existing and future buildings, facilities, and populations. These results are shown in Tables 5.1-5.4. For the earthquake hazard vulnerability assessment, a probabilistic scenario was created to estimate the annualized loss for the county. The results of the analysis reported at the U.S. Census tract level do not make it feasible to estimate losses at the jurisdiction level. Since the scenario is annualized, no building counts are provided. Losses reported included losses due to building damage (structural and non-structural), contents, and inventory. However, like the analysis for hurricanes, the comparative annualized loss figures at the end of this section only utilize building losses in order to provide consistency with other hazards. Table 5.26 summarizes the findings.
Table 5.26: Annualized Loss Estimations for Earthquake Hazard
Location Structural
Loss Non-Structural
Loss Contents
Loss Inventory
Loss Total Annualized
Loss
Horry County $79,000 $259,000 $89,000 3,000 $430,000
Source: Hazus-MH 4.2

SECTION 5: VULNERABILITY ASSESSMENT
City of Myrtle Beach Floodplain Management and Hazard Mitigation Plan
November 2020
5:58
Table 5.27 shows total exposure and potential annualized property losses and percent loss ratios resulting from the earthquake hazard for Myrtle Beach. However, the best available information on loss estimation was only available at the county level.
Table 5.27: Total Exposure and Potential Annualized Losses from Earthquake
Location Estimated
Population At Risk
Number of Parcels with Improvements
Total Assessed Value of
Improvements (Buildings)
Annualized Expected
Property Losses*
Myrtle Beach 31,783 33,386 $4,515,364,606 $79,000
*The annualized expected property loss estimate is for all of Horry County.
5.13.1 Asset Vulnerability All of the inventoried assets in Myrtle Beach are exposed to the earthquake hazard (Table 5.55). Specific vulnerabilities for these assets will be greatly dependent on their individual design and the mitigation measures in place where appropriate. Such site-specific vulnerability determinations are outside the scope of this assessment but will be considered during future plan updates.
5.14 TIDAL WAVE/TSUNAMI
PRI Value: 1.7 Annualized Loss Estimate: Negligible According to the qualitative assessment performed using the PRI tool, the tsunami hazard scored a PRI value of 1.7 (from a scale of 0 to 4, with 4 being the highest risk level). Table 5.28 summarizes the risk levels assigned to each PRI category.
Table 5.28: Qualitative Assessment for Tidal Wave/Tsunami
Probability Unlikely
Impact Limited
Spatial Extent Small
Warning Time Less 6 hours
Duration More than 24 hours
Table 5.29 shows total exposure and potential annualized property losses and percent loss ratios resulting from the tidal wave/tsunami hazard for Myrtle Beach.
Table 5.29: Total Exposure and Potential Annualized Losses from Tidal Wave/Tsunami
Location Estimated
Population At Risk
Number of Parcels with Improvements
Total Assessed Value of
Improvements (Buildings)
Annualized Expected
Property Losses
Myrtle Beach 31,783 33,386 $4,515,364,606 $0
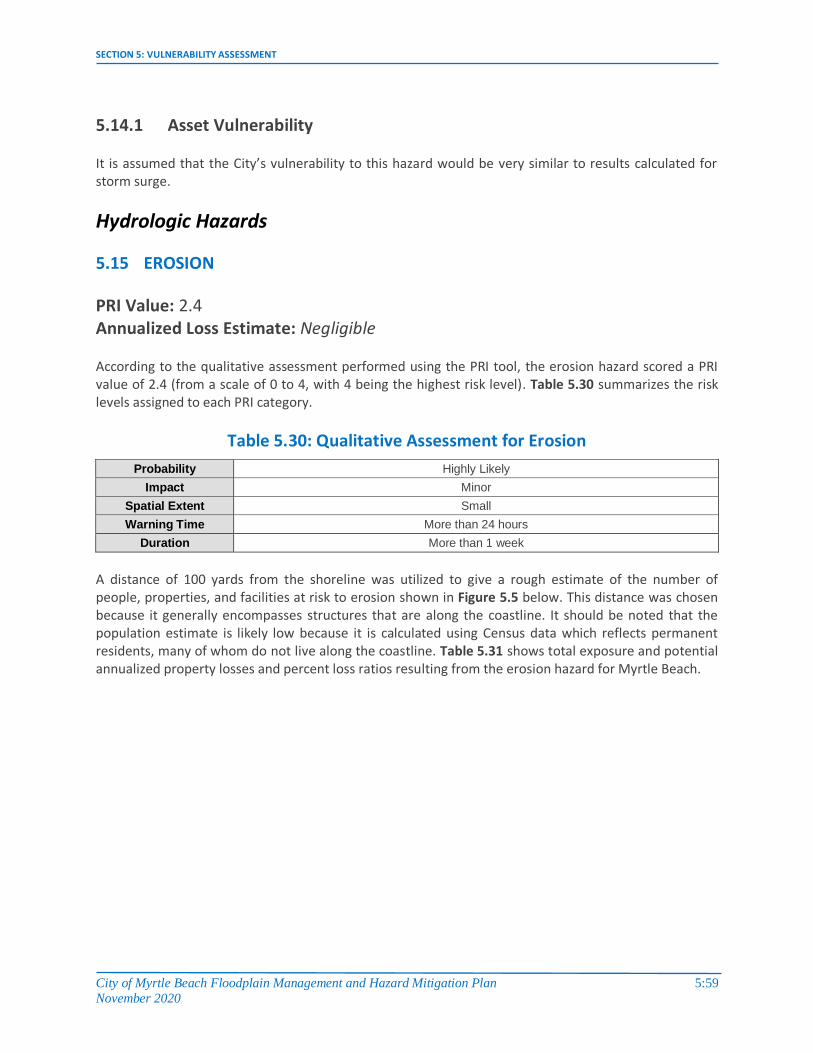
SECTION 5: VULNERABILITY ASSESSMENT
City of Myrtle Beach Floodplain Management and Hazard Mitigation Plan
November 2020
5:59
5.14.1 Asset Vulnerability It is assumed that the City’s vulnerability to this hazard would be very similar to results calculated for storm surge.
Hydrologic Hazards
5.15 EROSION
PRI Value: 2.4 Annualized Loss Estimate: Negligible According to the qualitative assessment performed using the PRI tool, the erosion hazard scored a PRI value of 2.4 (from a scale of 0 to 4, with 4 being the highest risk level). Table 5.30 summarizes the risk levels assigned to each PRI category.
Table 5.30: Qualitative Assessment for Erosion
Probability Highly Likely
Impact Minor
Spatial Extent Small
Warning Time More than 24 hours
Duration More than 1 week
A distance of 100 yards from the shoreline was utilized to give a rough estimate of the number of people, properties, and facilities at risk to erosion shown in Figure 5.5 below. This distance was chosen because it generally encompasses structures that are along the coastline. It should be noted that the population estimate is likely low because it is calculated using Census data which reflects permanent residents, many of whom do not live along the coastline. Table 5.31 shows total exposure and potential annualized property losses and percent loss ratios resulting from the erosion hazard for Myrtle Beach.

SECTION 5: VULNERABILITY ASSESSMENT
City of Myrtle Beach Floodplain Management and Hazard Mitigation Plan
November 2020
5:60
Figure 5.5: Area within 100 yards of the Shoreline
Table 5.31: Total Exposure and Potential Annualized Losses from Erosion
Location Estimated
Population At Risk
Number of Parcels with Improvements
Total Assessed Value of
Improvements (Buildings)
Annualized Expected
Property Losses
Myrtle Beach 1,087 11,699 $1,691,574,714 $0
5.15.1 Asset Vulnerability According to the SC Department of Health and Environmental Control, all of Myrtle Beach is classified as a standard erosion zone which means it is a segment of shoreline not directly influenced by an inlet or associated shoals. Because the annual rate of erosion for all survey monuments is also relatively similar across the City at -0.59, all assets are considered to be at some risk to erosion. However, it should be noted that assets located closer to the ocean and directly along the shoreline are at highest risk to erosion. No critical facilities are located directly adjacent to the shoreline.

SECTION 5: VULNERABILITY ASSESSMENT
City of Myrtle Beach Floodplain Management and Hazard Mitigation Plan
November 2020
5:61
5.16 FLOOD
PRI Value: 3.3 Annualized Loss Estimate: $80,379 According to the qualitative assessment performed using the PRI tool, the flood hazard scored a PRI value of 3.3 (from a scale of 0 to 4, with 4 being the highest risk level). Table 5.32 summarizes the risk levels assigned to each PRI category.
Table 5.32: Qualitative Assessment for Flood
Probability Highly Likely
Impact Critical
Spatial Extent Moderate
Warning Time 6 to 12 hours
Duration Less than 1 week
In order to assess flood risk, a GIS-based analysis was used to estimate exposure to flood events using Digital Flood Insurance Rate Map (DFIRM) data in combination with local tax assessor records. The determination of assessed value at-risk (exposure) was calculated using GIS analysis by summing the total assessed building values for only those improved properties that were confirmed to be located within an identified Zone A/AE (1-percent-annual-chance floodplain), Zone VE (1-percent-annual-chance coastal flood zone with associated wave action), Zone X500 (0.2-percent-annual-chance floodplain), and the floodway if/where applicable. Table 5.33 lists the number of properties determined to be located within each of the special flood hazard areas along with the improved values for structures located on those properties (according to Hazus-MH).
Table 5.33: Total Exposure of Improved Properties to Flood11
Jurisdiction Estimated Number of
Buildings At Risk Estimated Assessed Value of Improved Buildings At Risk
AT-RISK (1-PERCENT-ANNUAL-CHANCE FLOOD)
Myrtle Beach 8,007 $1,147,299,300
AT-RISK (COASTAL VE ZONE)
Myrtle Beach 1,351 $155,647,521
AT-RISK (0.2-PERCENT-ANNUAL-CHANCE FLOOD)
Myrtle Beach 5,912 $727,561,680
Table 5.34 shows total exposure and potential annualized property losses and percent loss ratios resulting from the flood hazard analysis for Myrtle Beach.
11 Since many structures and parcels are located within more than one flood zone, this exposure analysis likely overestimates the total number and dollar value that are located within all areas of flood risk because some structures/parcels are counted within multiple zones.

SECTION 5: VULNERABILITY ASSESSMENT
City of Myrtle Beach Floodplain Management and Hazard Mitigation Plan
November 2020
5:62
Table 5.34: Total Exposure and Potential Annualized Losses from Flood
Location Estimated
Population At Risk
Number of Parcels with Improvements
Total Assessed Value of
Improvements (Buildings)
Annualized Expected
Property Losses
Myrtle Beach 10,928 15,270 $2,030,508,501 $80,379
5.16.1 Asset Vulnerability There are no inventoried assets for Myrtle Beach determined to be vulnerable to the effects of flood. That is to say, none are located specifically in the identified floodplain. However, it is possible that some assets may be vulnerable to flooding from stormwater or from higher magnitude events.
5.17 STORM SURGE
PRI Value: 2.9 Annualized Loss Estimate: Negligible According to the qualitative assessment performed using the PRI tool, the storm surge hazard scored a PRI value of 2.9 (from a scale of 0 to 4, with 4 being the highest risk level). Table 5.35 summarizes the risk levels assigned to each PRI category.
Table 5.35: Qualitative Assessment for Storm Surge
Probability Likely
Impact Critical
Spatial Extent Large
Warning Time More than 24 hours
Duration Less than 24 hours
As discussed in the Hazard Identification and Analysis section, storm surge is a flood hazard which is related to hurricanes but differs from coastal flood events. Only storm surge related to hurricanes is analyzed in this section. The surge hazard was modeled using SLOSH (Sea, Lake, and Overland Surges from Hurricane). SLOSH was developed by the National Hurricane Center, FEMA, and the Army Corp of Engineers. The SLOSH Maximum of the MEOWs (MOM) data was used to determine SLOSH vulnerability.12 MOM is a composite of the Maximum Envelope of Water (MEOW), which is generated by running several hypothetical hurricanes and collecting their associated surge heights. The MOM uses the maximum recorded surge height from the MEOW scenarios for each grid block. The data used for Myrtle Beach was updated as of 2010 and was taken from the SC northern conglomerate SLOSH basin. For the vulnerability assessment, critical facilities were overlaid on the surge areas to determine the height of surge (above mean sea level) for each facility.
12 The SLOSH training manual indicates that SLOSH is accurate within +/- 20 percent.

SECTION 5: VULNERABILITY ASSESSMENT
City of Myrtle Beach Floodplain Management and Hazard Mitigation Plan
November 2020
5:63
Table 5.36 lists the number of properties determined to be located within each of the defined storm surge inundation zones in the City along with the improved values for structures located on those properties. It should be noted that this estimation does not take into account whether structures have been elevated or otherwise protected against storm surge impacts. It simply identifies properties and are located within the inundation zones and which could potentially be impacted.
Table 5.36: Total Exposure of Improved Properties to Storm Surge
Storm Surge Inundation Zone Number of Parcels with
Improvements Total Assessed Value of
Improvements (Buildings)
Category 1 5,809 $755,464,035
Category 3 17,847 $2,439,724,066
Category 5 27,054 $3,884,854,512
Table 5.37 shows total exposure and potential annualized property losses and percent loss ratios resulting from the Category 3 storm surge hazard analysis for Myrtle Beach.
Table 5.37: Total Exposure and Potential Annualized Losses from Category 3
Storm Surge
Location Estimated
Population At Risk
Number of Parcels with Improvements
Total Assessed Value of
Improvements (Buildings)
Annualized Expected Property
Losses
Myrtle Beach 15,999 17,847 $2,439,724,066 $0
5.17.1 Asset Vulnerability There is a total of 16 inventoried assets in Myrtle Beach determined to be vulnerable to the effects of storm surge. A Category Three storm threatens Myrtle Beach Fire Station 2 and two bridges. A Category Five storm threatens 16 of the 23 critical facilities identified in this analysis. All of the assets determined to be at risk to storm surge are listed in Table 5.55 toward the end of this section.
5.18 SEA LEVEL RISE
PRI Value: 2.1 Annualized Loss Estimate: Undetermined According to the qualitative assessment performed using the PRI tool, the sea level rise hazard scored a PRI value of 2.1 (from a scale of 0 to 4, with 4 being the highest risk level). Table 5.38 summarizes the risk levels assigned to each PRI category.

SECTION 5: VULNERABILITY ASSESSMENT
City of Myrtle Beach Floodplain Management and Hazard Mitigation Plan
November 2020
5:64
Table 5.38: Qualitative Assessment for Sea Level Rise
Probability Likely
Impact Minor
Spatial Extent Small
Warning Time More than 24 hours
Duration More than 1 week
Sea Level Rise can cause loss of property, habitat, and valuable tourism dollars. However, measuring its affects can be difficult. For this analysis, data provided by the South Carolina Emergency Management Division was used. This data, highlighted in Section 4: Hazard Identification and Analysis, shows sea level rise scenarios at 0.6 meter, 1.0 meter, 3.0 meters, and 6 meters. In order to determine vulnerability, parcel information was overlaid on the sea level affected areas for each “zone” (1 foot, 4 feet, 7 feet, and 10 feet of sea level rise) using geographic information system (GIS). Structures located within an affected area are considered to be vulnerable. Figure 5.6 shows the affected areas in Myrtle Beach for the 1 foot scenario, Figure 5.7 shows the 4 feet scenario, Figure 5.8 shows the y feet scenario, and Figure 5.9 shows the 10 feet scenario. Table 5.39 shows the complete results of the analysis, including number of structures in a sea level rise zone and the improved value of the vulnerable structures.

SECTION 5: VULNERABILITY ASSESSMENT
City of Myrtle Beach Floodplain Management and Hazard Mitigation Plan
November 2020
5:65
Figure 5.6: Areas Affected by 1 foot of Sea Level Rise
Source: NOAA Office of Coastal Management

SECTION 5: VULNERABILITY ASSESSMENT
City of Myrtle Beach Floodplain Management and Hazard Mitigation Plan
November 2020
5:66
Figure 5.7: Areas Affected by 4 feet of Sea Level Rise
Source: NOAA Office of Coastal Management

SECTION 5: VULNERABILITY ASSESSMENT
City of Myrtle Beach Floodplain Management and Hazard Mitigation Plan
November 2020
5:67
Figure 5.8: Areas Affected by 7 feet of Sea Level Rise
Source: NOAA Office of Coastal Management

SECTION 5: VULNERABILITY ASSESSMENT
City of Myrtle Beach Floodplain Management and Hazard Mitigation Plan
November 2020
5:68
Figure 5.9: Areas Affected by 10 feet of Sea Level Rise
Source: NOAA Office of Coastal Management
Table 5.39: Total Exposure and Potential Annualized Losses from Sea Level Rise Hazard
Sea Level Rise Scenario Estimated Population at
Risk Number of Parcels with
Improvements
Total Assessed Value of Improvements
(Buildings)
1 foot 621 2 $2,626,400
4 feet 1,433 63 $55,411,483
7 feet 3,161 3440 $468,046,048
10 feet 4,243 9098 $1,286,872,500
5.18.1 Asset Vulnerability Two bridges were found to be vulnerable to Sea Level Rise under all four scenarios.

SECTION 5: VULNERABILITY ASSESSMENT
City of Myrtle Beach Floodplain Management and Hazard Mitigation Plan
November 2020
5:69
Other Hazards
5.19 ACTS OF TERROR
PRI Value: 2.4 Annualized Loss Estimate: Negligible According to the qualitative assessment performed using the PRI tool, the acts of terror hazard scored a PRI value of 2.4 (from a scale of 0 to 4, with 4 being the highest risk level). Table 5.40 summarizes the risk levels assigned to each PRI category.
Table 5.40: Qualitative Assessment for Acts of Terror
Probability Possible
Impact Critical
Spatial Extent Small
Warning Time Less than 6 hours
Duration Less than 6 hours
It cannot be predicted where an act of terror may occur, so all existing and future buildings, facilities, and populations in Myrtle Beach are considered to be equally exposed to this hazard and could potentially be impacted. This cumulative vulnerability is shown in Tables 5.1-5.4. Given the lack of historical loss data on terror events in the Myrtle Beach, while it is assumed that one major event could potentially result in significant losses, annualizing structural losses over a long period of time would most likely yield a very low annualized loss estimate for the city. Table 5.41 shows total exposure and potential annualized property losses and percent loss ratios resulting from the acts of terror hazard for Myrtle Beach.
Table 5.41: Total Exposure and Potential Annualized Losses from Acts of Terror
Location Estimated
Population At Risk
Number of Parcels with Improvements
Total Assessed Value of
Improvements (Buildings)
Annualized Expected
Property Losses
Myrtle Beach 31,783 33,386 $4,515,364,606 $0
5.19.1 Asset Vulnerability All of the inventoried assets in Myrtle Beach are exposed to a terrorist attack (Table 5.55).

SECTION 5: VULNERABILITY ASSESSMENT
City of Myrtle Beach Floodplain Management and Hazard Mitigation Plan
November 2020
5:70
5.20 AIRPLANE CRASH
PRI Value: 2.1 Annualized Loss Estimate: Negligible According to the qualitative assessment performed using the PRI tool, the airplane crash hazard scored a PRI value of 2.1 (from a scale of 0 to 4, with 4 being the highest risk level). Table 5.42 summarizes the risk levels assigned to each PRI category.
Table 5.42: Qualitative Assessment for Airplane Crash
Probability Unlikely
Impact Critical
Spatial Extent Small
Warning Time Less than 6 hours
Duration Less than 6 hours
An airplane crash could occur anywhere in the City, so all existing and future buildings, facilities, and populations in Myrtle Beach are considered to be equally exposed to this hazard. These results are shown Tables 5.1-5.4. Table 5.43 shows total exposure and potential annualized property losses and percent loss ratios resulting from the airplane crash hazard for Myrtle Beach.
Table 5.43: Total Exposure and Potential Annualized Losses from Airplane Crash
Location Estimated
Population At Risk
Number of Parcels with Improvements
Total Assessed Value of
Improvements (Buildings)
Annualized Expected
Property Losses
Myrtle Beach 31,783 33,386 $4,515,364,606 $0
5.20.1 Asset Vulnerability All of the inventoried assets in Myrtle Beach are potentially at risk to an airplane crash. These assets are listed in Table 5.55 near the end of this section.
5.21 CIVIL DISTURBANCE
PRI Value: 2.2 Annualized Loss Estimate: Negligible According to the qualitative assessment performed using the PRI tool, the civil disturbance hazard scored a PRI value of 2.2 (from a scale of 0 to 4, with 4 being the highest risk level). Table 5.44 summarizes the risk levels assigned to each PRI category.

SECTION 5: VULNERABILITY ASSESSMENT
City of Myrtle Beach Floodplain Management and Hazard Mitigation Plan
November 2020
5:71
Table 5.44: Qualitative Assessment for Civil Disturbance
Probability Possible
Impact Limited
Spatial Extent Small
Warning Time 12 to 24 hours
Duration More than 1 week
A civil disturbance event could occur anywhere in the City, so all existing and future buildings, facilities, and populations in Myrtle Beach are considered to be equally exposed to this hazard. These results are shown Tables 5.1-5.4. Table 5.45 shows total exposure and potential annualized property losses and percent loss ratios resulting from the civil disturbance hazard for Myrtle Beach.
Table 5.45: Total Exposure and Potential Annualized Losses from Civil
Disturbance
Location Estimated
Population At Risk
Number of Parcels with Improvements
Total Assessed Value of
Improvements (Buildings)
Annualized Expected
Property Losses
Myrtle Beach 31,783 33,386 $4,515,364,606 $0
5.21.1 Asset Vulnerability All of the inventoried assets in Myrtle Beach are potentially at risk to a civil disturbance. These assets are listed in Table 5.55 near the end of this section.
5.22 HAZARDOUS MATERIALS INCIDENTS
PRI Value: 2.5 Annualized Loss Estimate: $157,815 According to the qualitative assessment performed using the PRI tool, the hazardous materials incident hazard scored a PRI value of 2.5 (from a scale of 0 to 4, with 4 being the highest risk level). Table 5.46 summarizes the risk levels assigned to each PRI category.
Table 5.46: Qualitative Assessment for Hazardous Materials Incidents
Probability Likely
Impact Limited
Spatial Extent Small
Warning Time Less than 6 hours
Duration Less than 24 hours

SECTION 5: VULNERABILITY ASSESSMENT
City of Myrtle Beach Floodplain Management and Hazard Mitigation Plan
November 2020
5:72
Hazardous material or toxic releases can have a significant negative impact. Such events can cause multiple deaths, completely shut down facilities for 30 days or more, and cause more than 50 percent of affected properties to be destroyed or suffer major damage. In a hazardous materials incident, solid, liquid, and/or gaseous contaminants may be released from fixed or mobile containers. Weather conditions will directly affect how the hazard develops. Non-compliance with fire and building codes as well as failure to maintain existing fire and containment features can substantially increase the damage from a hazardous materials release. The duration of a hazardous materials incident can range from hours to days. Warning time is minimal to none. In order to conduct the vulnerability assessment for this hazard, GIS intersection analysis was used for fixed and mobile areas and building footprints/parcels.13 For the fixed analysis, a heat map showing the concentration of facilities per square mile was created to identify areas where the density of Facility Registry Service facilities was highest, shown below in Figure 5.10. The heat map was used to determine the number of people and which parcels with improvements and are located in areas where the density of facilities was high. It should be noted that nearly all populations and buildings and are potentially at risk to a fixed site incident due to the prevalence of FRS facilities across the City. For the mobile analysis, a 1.0-mile buffer was mapped around the high-risk transportation corridors which includes the major roads (Interstate highway and U.S. highway) and railroads where hazardous materials are primarily transported that could adversely impact people and buildings. The buffers along the transportation corridors are shown in Figure 5.11. Table 5.47 shows estimated toxic release exposure of people and buildings for fixed sites and Table 5.48 shows the results for mobile site toxic release.
13 This type of analysis will likely yield inflated results (generally higher than what is actually reported after an actual event).

SECTION 5: VULNERABILITY ASSESSMENT
City of Myrtle Beach Floodplain Management and Hazard Mitigation Plan
November 2020
5:73
Figure 5.10: Facility Registry Service Sites Heat Map
Source: Environmental Protection Agency
Table 5.47: Exposure of Persons and Improved Property to Hazardous Materials (Fixed Sites)
Location Estimated Population At
Risk Number of Parcels with
Improvements
Total Assessed Value of Improvements
(Buildings)
Myrtle Beach 27,312 24,050 $3,323,957,809

SECTION 5: VULNERABILITY ASSESSMENT
City of Myrtle Beach Floodplain Management and Hazard Mitigation Plan
November 2020
5:74
Figure 5.11: Mobile Sites with Buffers in Myrtle Beach
Table 5.48: Exposure of Persons and Improved Property to Hazardous Materials (Mobile Sites)
Location Estimated Population At
Risk Number of Parcels with
Improvements
Total Assessed Value of Improvements
(Buildings)
Myrtle Beach 5,482 1,878 $270,351,284
Most hazardous materials incidents that occur in Myrtle Beach are contained and suppressed before destroying any property or threatening lives. It is important to note that only incidents reported by the Department of Transportation PHMSA have been factored into this vulnerability assessment. To estimate losses due to hazardous materials incidents, PHMSA historical incident statistics data was used to develop a hazardous materials incident stochastic model. In this model:
Losses were scaled for inflation and
Expected annualized losses were calculated through a non-linear regression of historical data.

SECTION 5: VULNERABILITY ASSESSMENT
City of Myrtle Beach Floodplain Management and Hazard Mitigation Plan
November 2020
5:75
It is assumed that while one major event could result in significant losses, annualizing structural losses yields a $157,815 annualized loss estimate for Myrtle Beach.
5.22.1 Asset Vulnerability There is a total of 20 inventoried assets in Myrtle Beach determined to be vulnerable to a fixed-site hazardous materials incident. Four of these assets are also vulnerable to a mobile hazardous materials incident in the high-risk corridor buffer areas. All of the assets determined to be at risk to hazardous materials incidents are listed in Table 5.55 toward the end of this section.
5.23 PUBLIC HEALTH EMERGENCY
PRI Value: 2.7 Annualized Loss Estimate: Negligible According to the qualitative assessment performed using the PRI tool, the public health emergency hazard scored a PRI value of 2.7 (from a scale of 0 to 4, with 4 being the highest risk level). Table 5.49 summarizes the risk levels assigned to each PRI category.
Table 5.49: Qualitative Assessment for Public Health Emergency
Probability Possible
Impact Critical
Spatial Extent Small
Warning Time Less than 6 hours
Duration More than 1 week
A public health emergency could occur anywhere in the City, so all existing and future buildings, facilities, and populations in Myrtle Beach are considered to be equally exposed to this hazard. These results are shown Tables 5.1-5.4. Table 5.50 shows total exposure and potential annualized property losses and percent loss ratios resulting from the public health emergency hazard for Myrtle Beach.
Table 5.50: Total Exposure and Potential Annualized Losses from Public Health
Emergency
Location Estimated
Population At Risk
Number of Parcels with Improvements
Total Assessed Value of
Improvements (Buildings)
Annualized Expected
Property Losses
Myrtle Beach 31,783 33,386 $4,515,364,606 $0

SECTION 5: VULNERABILITY ASSESSMENT
City of Myrtle Beach Floodplain Management and Hazard Mitigation Plan
November 2020
5:76
5.23.1 Asset Vulnerability All of the inventoried assets in Myrtle Beach are potentially at risk to a public health emergency. These assets are listed in Table 5.55 near the end of this section.
5.24 WILDFIRE
PRI Value: 2.7 Annualized Loss Estimate: Negligible According to the qualitative assessment performed using the PRI tool, the wildfire hazard scored a PRI value of 2.7 (from a scale of 0 to 4, with 4 being the highest risk level). Table 5.51 summarizes the risk levels assigned to each PRI category.
Table 5.51: Qualitative Assessment for Wildfire
Probability Highly Likely
Impact Minor
Spatial Extent Moderate
Warning Time Less than 6 hours
Duration Less than 24 hours
To estimate exposure to wildfire, the approximate number of parcels and their associated improved value was determined using GIS analysis. For the critical facility analysis, areas of risk were intersected with critical facility locations. Figure 5.12 shows the Wildland Urban Interface Risk Index (WUIRI) data, which is a data layer that shows a rating of the potential impact of a wildfire on people and their homes. The key input, Wildland Urban Interface (WUI), reflects housing density (houses per acre) consistent with Federal Register National standards. The location of people living in the WUI and rural areas is key information for defining potential wildfire impacts to people and homes. Initially provided as raster data, it was converted to a polygon to allow for analysis. The Wildland Urban Interface Risk Index data ranges from 0 to -9 with lower values being most severe (this is only a measure of relative risk). Figure 5.13 shows the areas of analysis where any grid cell is less than -5. Areas with a value below -5 were chosen to be displayed as areas of risk because this showed the upper echelon of the scale and the areas at highest risk.

SECTION 5: VULNERABILITY ASSESSMENT
City of Myrtle Beach Floodplain Management and Hazard Mitigation Plan
November 2020
5:77
Figure 5.12: Wildland Urban Interface Risk Index in Myrtle Beach
Source: Southern Wildfire Risk Assessment

SECTION 5: VULNERABILITY ASSESSMENT
City of Myrtle Beach Floodplain Management and Hazard Mitigation Plan
November 2020
5:78
Figure 5.13: Wildland Urban Interface Risk Index Values Less than -5
Source: Southern Wildfire Risk Assessment To estimate exposure to wildfire, a determination of value for at-risk properties was calculated through GIS analysis by summing the total assessed building values for those improved properties confirmed to be located within areas of high or moderate wildfire risk areas. This information can be found in Table
5.52.
Table 5.52: Qualitative Assessment for Wildfire
Location Estimated Population At
Risk Number of Parcels with
Improvements
Total Assessed Value of Improvements
(Buildings)
Myrtle Beach 22,620 6,258 $871,386,522
5.24.1 Asset Vulnerability There are three assets vulnerable to wildfire based on the Southern Wildfire Risk Assessment data which are two fire stations and a medical facility.

SECTION 5: VULNERABILITY ASSESSMENT
City of Myrtle Beach Floodplain Management and Hazard Mitigation Plan
November 2020
5:79
5.25 CONCLUSIONS ON HAZARD VULNERABILITY The results of this vulnerability assessment are useful in at least three ways:
Improving our understanding of the risk associated with the natural hazards in Myrtle Beach through better understanding of the complexities and dynamics of risk, how levels of risk can be measured and compared, and the myriad of factors that influence risk. An understanding of these relationships is critical in making balanced and informed decisions on managing the risk.
Providing a baseline for policy development and comparison of mitigation alternatives. The data
used for this analysis presents a current picture of risk in Myrtle Beach. Updating this risk “snapshot” with future data will enable comparison of the changes in risk with time. Baselines of this type can support the objective analysis of policy and program options for risk reduction in the region.
Comparing the risk among the natural hazards addressed. The ability to quantify the risk to all
these hazards relative to one another helps in a balanced, multi-hazard approach to risk management at each level of governing authority. This ranking provides a systematic framework to compare and prioritize the very disparate natural hazards that are present in Myrtle Beach. This final step in the risk assessment provides the necessary information for local officials to craft a mitigation strategy to focus resources on only those hazards that pose the most threat to the City.
Exposure to hazards can be an indicator of vulnerability. Economic exposure can be identified through locally assessed values for improvements (buildings), and social exposure can be identified by estimating the population exposed to each hazard. This information is especially important for decisionmakers to use in planning for evacuation or other public safety related needs. Table 5.53 provides a summary of the estimated population counts and improved property values at risk (exposed) to each hazard. Table 5.54 provides a summary of results for the vulnerability assessment conducted for each of Myrtle Beach’s assets (from the inventory listed earlier in this section). The table lists those assets that are determined to be exposed to each of the identified hazards (marked with an “X”).
Table 5.53: Summary of Total Exposure and Potential Annualized Losses to Identified Hazards in Myrtle Beach
Hazard Estimated
Population At Risk
Total Assessed Value of
Improvements At- Risk (Buildings)
Annualized Expected
Property Losses
Atmospheric
Drought 31,783 $4,515,364,606 $0
Extreme Heat 31,783 $4,515,364,606 $0
Hailstorm 31,783 $4,515,364,606 $727
Ice Storm 31,783 $4,515,364,606 $0
Lightning 31,783 $4,515,364,606 $17,530

SECTION 5: VULNERABILITY ASSESSMENT
City of Myrtle Beach Floodplain Management and Hazard Mitigation Plan
November 2020
5:80
Hazard Estimated
Population At Risk
Total Assessed Value of
Improvements At- Risk (Buildings)
Annualized Expected
Property Losses
Nor’easter 31,783 $4,515,364,606 $0
Tornado/Waterspout 31,783 $4,515,364,606 $481,512
Tropical Storm System/Hurricane
31,783 $4,515,364,606 $16,252,000
Wind Events (Thunderstorm/High Wind)
31,783 $4,515,364,606 $78,282
Geologic
Earthquake 31,783 $4,515,364,606 $79,000
Tidal Wave/Tsunami 31,783 $4,515,364,606 $0
Hydrologic
Erosion 11,699 $1691,574,714 $0
Flood 10,928 $2,030,508,501 $80,379
Storm Surge (Cat 3) 17,847 $2,439,724,066 $0
Sea Level Rise (4 ft) 1,433 $55,411,483 Undetermined
Other
Acts of Terror 31,783 $4,515,364,606 $0
Airplane Crash (Commercial/Small Aircraft)
31,783 $4,515,364,606 $0
Civil Disturbance 31,783 $4,515,364,606 $0
Hazardous Materials Incident (Fixed)
27,312 $3,323,957,809 $157,815
Public Health Emergency 31,783 $4,515,364,606 $0
Wildfire 22,620 $871,386,522 $0
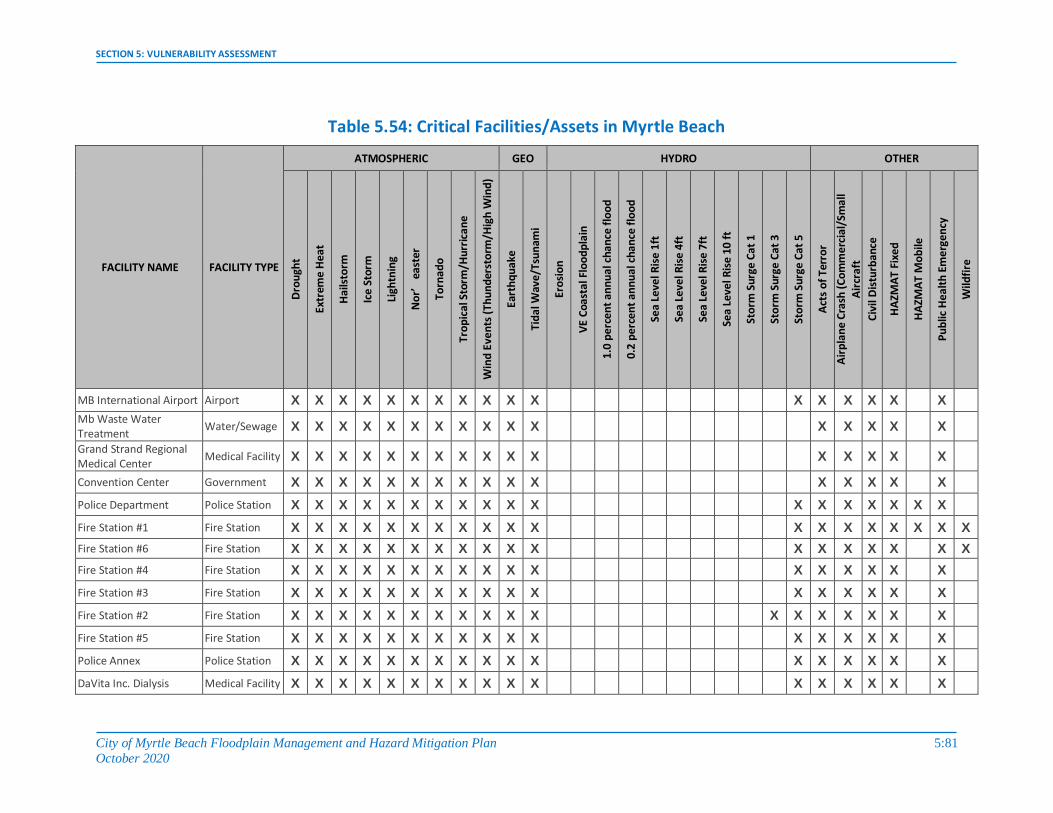
SECTION 5: VULNERABILITY ASSESSMENT
City of Myrtle Beach Floodplain Management and Hazard Mitigation Plan
October 2020
5:81
Table 5.54: Critical Facilities/Assets in Myrtle Beach
FACILITY NAME FACILITY TYPE
ATMOSPHERIC GEO HYDRO OTHER
Dro
ugh
t
Extr
eme
He
at
Hai
lsto
rm
Ice
Stor
m
Ligh
tnin
g
Nor’
easter
Torn
ado
Tro
pic
al S
torm
/Hu
rric
ane
Win
d E
ven
ts (
Thu
nd
erst
orm
/Hig
h W
ind
)
Eart
hq
uak
e
Tid
al W
ave
/Tsu
nam
i
Ero
sio
n
VE
Coa
stal
Flo
od
pla
in
1.0
per
cen
t an
nu
al c
han
ce f
loo
d
0.2
per
cen
t an
nu
al c
han
ce f
loo
d
Sea
Leve
l Ris
e 1f
t
Sea
Leve
l Ris
e 4f
t
Sea
Leve
l Ris
e 7f
t
Sea
Leve
l Ris
e 10
ft
Sto
rm S
urg
e C
at 1
Sto
rm S
urg
e C
at 3
Sto
rm S
urg
e C
at 5
Act
s o
f Te
rro
r
Air
pla
ne
Cra
sh (
Co
mm
erc
ial/
Smal
l A
ircr
aft
Civ
il D
istu
rban
ce
HA
ZMA
T Fi
xed
HA
ZMA
T M
ob
ile
Pu
blic
He
alth
Em
erg
ency
Wild
fire
MB International Airport Airport X X X X X X X X X X X X X X X X X
Mb Waste Water Treatment
Water/Sewage X X X X X X X X X X X X X X X X
Grand Strand Regional Medical Center
Medical Facility X X X X X X X X X X X X X X X X
Convention Center Government X X X X X X X X X X X X X X X X
Police Department Police Station X X X X X X X X X X X X X X X X X X
Fire Station #1 Fire Station X X X X X X X X X X X X X X X X X X X
Fire Station #6 Fire Station X X X X X X X X X X X X X X X X X X
Fire Station #4 Fire Station X X X X X X X X X X X X X X X X X
Fire Station #3 Fire Station X X X X X X X X X X X X X X X X X
Fire Station #2 Fire Station X X X X X X X X X X X X X X X X X X
Fire Station #5 Fire Station X X X X X X X X X X X X X X X X X
Police Annex Police Station X X X X X X X X X X X X X X X X X
DaVita Inc. Dialysis Medical Facility X X X X X X X X X X X X X X X X X

SECTION 5: VULNERABILITY ASSESSMENT
City of Myrtle Beach Floodplain Management and Hazard Mitigation Plan
October 2020
5:82
FACILITY NAME FACILITY TYPE
ATMOSPHERIC GEO HYDRO OTHER
Dro
ugh
t
Extr
eme
He
at
Hai
lsto
rm
Ice
Stor
m
Ligh
tnin
g
Nor’
easter
Torn
ado
Tro
pic
al S
torm
/Hu
rric
ane
Win
d E
ven
ts (
Thu
nd
erst
orm
/Hig
h W
ind
)
Eart
hq
uak
e
Tid
al W
ave
/Tsu
nam
i
Ero
sio
n
VE
Coa
stal
Flo
od
pla
in
1.0
per
cen
t an
nu
al c
han
ce f
loo
d
0.2
per
cen
t an
nu
al c
han
ce f
loo
d
Sea
Leve
l Ris
e 1f
t
Sea
Leve
l Ris
e 4f
t
Sea
Leve
l Ris
e 7f
t
Sea
Leve
l Ris
e 10
ft
Sto
rm S
urg
e C
at 1
Sto
rm S
urg
e C
at 3
Sto
rm S
urg
e C
at 5
Act
s o
f Te
rro
r
Air
pla
ne
Cra
sh (
Co
mm
erc
ial/
Smal
l A
ircr
aft
Civ
il D
istu
rban
ce
HA
ZMA
T Fi
xed
HA
ZMA
T M
ob
ile
Pu
blic
He
alth
Em
erg
ency
Wild
fire
DaVita Market Common Dialysis Center
Medical Facility X X X X X X X X X X X X X X X X X
Dialysis Center Inc. Medical Facility X X X X X X X X X X X X X X X X X
Fresenius Medical Medical Facility X X X X X X X X X X X X X X X X X
EOC EOC X X X X X X X X X X X X X X X X X
Withers Swash Bridge on Broadway St
Bridge X X X X X X X X X X X X X X X X X X X X X X X X
Withers Swash Bridge on Ocean Blvd
Bridge X X X X X X X X X X X X X X X X X X X X X X X X
Highway 501 Bridge Bridge X X X X X X X X X X X X X X X X X X
Robert Grissom Parkway Bridge
Bridge X X X X X X X X X X X X X X X X
Grande Dunes Bridge Bridge X X X X X X X X X X X X X X X X X
Fantasy Harbor Bridge Bridge X X X X X X X X X X X X X X X X

SECTION 5: VULNERABILITY ASSESSMENT
City of Myrtle Beach Floodplain Management and Hazard Mitigation Plan
October 2020
5:83

SECTION 6: CAPABILITY ASSESSMENT
City of Myrtle Beach Floodplain Management and Hazard Mitigation Plan 6:1
November 2020
SECTION 6 CAPABILITY ASSESSMENT
This section of the Plan discusses the capability of the City of Myrtle Beach to implement hazard mitigation activities. It consists of the following four subsections:
6.1 What is a Capability Assessment?
6.2 Conducting the Capability Assessment
6.3 Capability Assessment Findings
6.4 Conclusions on Local Capability
6.1 WHAT IS A CAPABILITY ASSESSMENT? The purpose of conducting a capability assessment is to determine the ability of a local jurisdiction to implement a comprehensive mitigation strategy and to identify potential opportunities for establishing or enhancing specific mitigation policies, programs, or projects.1 As in any planning process, it is important to try to establish which goals, objectives, and/or actions are feasible based on an understanding of the organizational capacity of those agencies or departments tasked with their implementation. A capability assessment helps to determine which mitigation actions are practical and likely to be implemented over time given a local government’s planning and regulatory framework, level of administrative and technical support, amount of fiscal resources, and current political climate. A capability assessment has two primary components: 1) an inventory of a local jurisdiction’s relevant plans, ordinances, or programs already in place and 2) an analysis of its capacity to carry them out. Careful examination of local capabilities will detect any existing gaps, shortfalls, or weaknesses with ongoing government activities that could hinder proposed mitigation activities and possibly exacerbate community hazard vulnerability. A capability assessment also highlights the positive mitigation measures already in place or being implemented at the local government level, which should continue to be supported and enhanced through future mitigation efforts. The capability assessment completed for the City of Myrtle Beach serves as a critical planning step and an integral part of the foundation for designing an effective hazard mitigation strategy. Coupled with the Risk Assessment, the Capability Assessment helps identify and target meaningful mitigation actions for incorporation in the Mitigation Strategy portion of the Floodplain Management and Hazard Mitigation
1 While the Interim Final Rule for implementing the Disaster Mitigation Act of 2000 does not require a local capability
assessment to be completed for local hazard mitigation plans, it is a critical step in developing a mitigation strategy that meets the needs of the City while taking into account their own unique abilities. The Rule does state that a community’s mitigation strategy should be “based on existing authorities, policies, programs and resources, and its ability to expand on and improve these existing tools” (44 CFR, Part 201.6(c)(3)).

SECTION 6: CAPABILITY ASSESSMENT
City of Myrtle Beach Floodplain Management and Hazard Mitigation Plan 6:2
November 2020
Plan. It not only helps establish the goals and objectives for the City to pursue under this Plan but also ensures that those goals and objectives are realistically achievable under given local conditions.
6.2 CONDUCTING THE CAPABILITY ASSESSMENT In order to facilitate the inventory and analysis of local government capabilities for the City of Myrtle Beach, a detailed Capability Assessment Survey2 was distributed to the City Departments. The survey questionnaire requested information on a variety of “capability indicators” such as existing local plans, policies, programs, or ordinances that contribute to and/or hinder the City’s ability to implement hazard mitigation actions. Other indicators included information related to the City’s fiscal, administrative, and technical capabilities, such as access to local budgetary and personnel resources for mitigation purposes. Survey respondents were also asked to comment on the current political climate with respect to hazard mitigation, an important consideration for any local planning or decision-making process. At a minimum, survey results provide an extensive inventory of existing local plans, ordinances, programs, and resources in place or under development in addition to their overall effect on hazard loss reduction. In completing the survey, local officials were also required to conduct a self-assessment of the City’s specific capabilities. The survey instrument thereby not only helps accurately assess the degree of local capability but also serves as a good source of introspection for City departments and agencies that want to improve their capabilities as identified gaps, weaknesses, or conflicts can be recast as opportunities for specific actions to be proposed as part of the hazard mitigation strategy. The information provided in response to the survey questionnaire was incorporated into a database for further analysis. A general scoring methodology3 was then applied to quantify the City’s overall capability. According to the scoring system, each capability indicator was assigned a point value based on its relevance to hazard mitigation. Additional points were added based on the City staff’s self-assessment of their own planning and regulatory capability, administrative and technical capability, fiscal capability, and political capability. Using this scoring methodology, a total score and general capability rating of “High,” “Moderate,” or “Limited” could be determined according to the total number of points received. These classifications are designed to provide nothing more than a general assessment of local government capability. In combination with the narrative responses provided by local officials, the results of this capability assessment lend critical information for developing an effective and meaningful mitigation strategy.
6.3 CAPABILITY ASSESSMENT FINDINGS The findings of the capability assessment are summarized in this Plan to provide insight into the relevant capacity of the City of Myrtle Beach to implement hazard mitigation activities. All information is based upon the input provided by local government officials through the Capability Assessment Survey and during meetings of the Floodplain Management and Hazard Mitigation Planning Committee.
2 The Capability Assessment Survey instrument is available in Appendix B. 3 The scoring methodology used to quantify and rank the City’s capability can be found in Appendix B.

SECTION 6: CAPABILITY ASSESSMENT
City of Myrtle Beach Floodplain Management and Hazard Mitigation Plan 6:3
November 2020
6.3.1 Planning and Regulatory Capability Planning and regulatory capability is based on the implementation of plans, ordinances, and programs that demonstrate a local jurisdiction’s commitment to guiding and managing growth, development, and redevelopment in a responsible manner while maintaining the general welfare of the community. It includes emergency response and mitigation planning, comprehensive land use planning, and transportation planning in addition to the enforcement of zoning or subdivision ordinances and building codes that regulate how land is developed and structures are built as well as protecting environmental, historic, and cultural resources in the community. Although some conflicts can arise, these planning initiatives generally present significant opportunities to integrate hazard mitigation principles and practices into the local decision-making process. This assessment is designed to provide a general overview of the key planning and regulatory tools or programs in place or under development for the City of Myrtle Beach along with their potential effect on loss reduction. This information will help identify opportunities to address existing gaps, weaknesses, or conflicts with other initiatives in addition to integrating the implementation of this Plan with existing planning mechanisms where appropriate. Table 6.1 provides a summary of the relevant local plans, ordinances, and programs already in place or under development for the City of Myrtle Beach. A checkmark (✓) indicates that the given item is currently in place and being implemented or that it is currently being developed for future implementation. Each of these other local plans, ordinances, and programs should be considered available mechanisms for incorporating the requirements of the Floodplain Management and Hazard Mitigation Plan.
Table 6.1: Relevant Plans, Ordinances, and Programs
PLANNING / REGULATORY TOOL IN PLACE/UNDER DEVELOPMENT
DEPARTMENT RESPONSIBLE
EFFECT ON LOSS REDUCTION
Strongly Supports
Helps Facilitate
Hinders
Hazard Mitigation Plan ✓ Construction Services
✓
Comprehensive Land Use Plan ✓
Planning / All *City has master Comprehensive Plan
Floodplain Management Plan ✓ Construction Services
Open Space Management Plan ✓ Construction Services
Stormwater Management Plan ✓ Public Works / Code Enforcement
Flood Response Plan ✓ Construction Services
Emergency Operations Plan ✓ Fire Department

SECTION 6: CAPABILITY ASSESSMENT
City of Myrtle Beach Floodplain Management and Hazard Mitigation Plan 6:4
November 2020
PLANNING / REGULATORY TOOL IN PLACE/UNDER DEVELOPMENT
DEPARTMENT RESPONSIBLE
EFFECT ON LOSS REDUCTION
Strongly Supports
Helps Facilitate
Hinders
Continuity of Operations Plan ✓ Planning, Risk Management, Fire Department
Evacuation Plan ✓ Police Department
Disaster Recovery Plan ✓
Emergency Management, Public Works, Construction Services, Planning/All
✓
Capital Improvements Plan ✓ Budget, Planning, Public Works ✓
Economic Development Plan ✓
Myrtle Beach Economic Development Corp.
Historic Preservation Plan ✓ Horry County
Flood Damage Prevention Ordinance ✓
Construction Services ✓
Zoning Ordinance ✓ Construction Services, Planning
Subdivision Ordinance ✓ Planning ✓
Unified Development Ordinance
Post-disaster Red/Rec. Ordinance ✓ Under Development
Building Code ✓ Construction Services
Fire Code ✓ Fire Department / Construction Services
National Flood Insurance Program ✓ Construction Services
✓
NFIP Community Rating System ✓ Construction Services / Public Works
✓
Other: Beach Management Plan ✓ Planning ✓

SECTION 6: CAPABILITY ASSESSMENT
City of Myrtle Beach Floodplain Management and Hazard Mitigation Plan 6:5
November 2020
A more detailed discussion on the City’s planning and regulatory capability follows along with the incorporation of additional information based on the narrative comments provided by local officials in response to the survey questionnaire.
6.3.2 Emergency Management Hazard mitigation is widely recognized as one of the four primary phases of emergency management. The three other phases include preparedness, response, and recovery. In reality, each phase is interconnected with hazard mitigation as Figure 6.1 suggests. Opportunities to reduce potential losses through mitigation practices are most often implemented before disaster strikes, such as elevation of flood prone structures or through the continuous enforcement of policies that prevent and regulate development that is vulnerable to hazards because of its location, design, or other characteristics. Mitigation opportunities will also be presented during immediate preparedness or response activities (such as installing storm shutters in advance of a hurricane) and certainly during the long-term recovery and redevelopment process following a hazard event.
Figure 6.1: The Four Phases of Emergency Management
Planning for each phase is a critical part of a comprehensive emergency management program and a key to the successful implementation of hazard mitigation actions. As a result, the Capability Assessment Survey asked several questions across a range of emergency management plans in order to assess Myrtle Beach’s willingness to plan and their level of technical planning proficiency. Hazard Mitigation Plan: A hazard mitigation plan represents a community’s blueprint for how it intends to reduce the impact of natural and human-caused hazards on people and the built environment. The essential elements of a hazard mitigation plan include a risk assessment, capability assessment, and mitigation strategy.
The City of Myrtle Beach council adopted the first version of their local hazard mitigation plan in April 28, 1998 and updated the plan in 2004, 2010, and 2015.

SECTION 6: CAPABILITY ASSESSMENT
City of Myrtle Beach Floodplain Management and Hazard Mitigation Plan 6:6
November 2020
Disaster Recovery Plan: A disaster recovery plan serves to guide the physical, social, environmental, and economic recovery and reconstruction process following a disaster. In many instances, hazard mitigation principles and practices are incorporated into local disaster recovery plans with the intent of capitalizing on opportunities to break the cycle of repetitive disaster losses. Disaster recovery plans can also lead to the preparation of disaster redevelopment policies and ordinances to be enacted following a hazard event.
The City of Myrtle Beach Department of Public Works maintains a Hurricane Manual for response and recovery.
The City’s Tourism Committee sponsors an annual Area Business Disaster Recovery Symposium.
The Tourism Element of the City’s Comprehensive Plan addresses the need to continue development of a comprehensive recovery plan for man-made and natural disasters.
Emergency Operations Plan: An emergency operations plan outlines responsibilities and the means by which resources are deployed during and following an emergency or disaster.
The Myrtle Beach Fire Department, with assistance from Risk Management, maintains an Emergency Operations Plan to address the City’s response to a variety of disasters and emergencies.
SARA Title III Emergency Response Plan: A SARA Title III Emergency Response Plan outlines the procedures to be followed in the event of a chemical emergency such as the accidental release of toxic substances. These plans are required by federal law under Title III of the Superfund Amendments and Re-authorization Act (SARA), also known as the Emergency Planning and Community Right-to-Know Act (EPCRA).
The Myrtle Beach Fire Department maintains a Hazardous Materials Response Plan. Continuity of Operation Plan: A continuity of operations plan establishes a chain of command, line of succession, and plans for backup or alternate emergency facilities in case of an extreme emergency or disaster event.
The City has developed a Continuity of Operation Plan in coordination between the Planning, Risk Management, and Fire Departments.
6.3.3 General Planning The implementation of hazard mitigation activities often involves agencies and individuals beyond the emergency management profession. Stakeholders may include local planners, public works officials, economic development specialists, and others. In many instances, concurrent local planning efforts will help to achieve or complement hazard mitigation goals even though they are not designed as such. Therefore, the Capability Assessment Survey also asked questions regarding each of Myrtle Beach’s general planning capabilities and the degree to which hazard mitigation is integrated into other on-going planning efforts.

SECTION 6: CAPABILITY ASSESSMENT
City of Myrtle Beach Floodplain Management and Hazard Mitigation Plan 6:7
November 2020
Comprehensive Land Use Plan: A comprehensive land use plan establishes the overall vision for what a community wants to be and serves as a guide to future governmental decision making. Typically a comprehensive plan contains sections on demographic conditions, land use, transportation elements, and community facilities. Given the broad nature of the plan and its regulatory standing in many communities, the integration of hazard mitigation measures into the comprehensive plan can enhance the likelihood of achieving risk reduction goals, objectives, and actions.
The City of Myrtle Beach adopted its first Comprehensive Plan in 1970 to serve as a long range plan for the City’s services, facilities, development, and growth. The plan has been updated in 1979, 1985, 1999, 2000, 2006, and 2011.
The Natural Resource Element of the Comprehensive Plan emphasizes avoiding environmental hazards and reducing the exposure of people and property to coastal hazards by keeping people and property out of coastal floodplains, high-erosion zones, and inlet hazard areas. Sea level rise, earthquakes, storms, climatic changes, tidal waves, tsunamis, winter storms, drought, and wildfires are also addressed in the element.
The City of Myrtle Beach has a Comprehensive Plan and land use is only one of 11 elements
required in The Local Government Comprehensive Planning Enabling Act of 1994. The areas of population, economic development, tourism, housing, neighborhoods, natural resources, cultural resources, transportation, community facilities, and priority investment are also addressed in the plan.
Capital Improvements Plan: A capital improvements plan guides the scheduling of spending on public improvements. A capital improvements plan can serve as an important mechanism for guiding future development away from identified hazard areas. Limiting public spending in hazardous areas is one of the most effective long-term mitigation actions available to local governments.
The City maintains a Capital Improvements Plan. Projects in the 10-year Priority Investment Element of the Comprehensive Plan include stormwater management strategies that will minimize property damage from flooding and various stormwater drainage projects.
Currently, the City has over 70 planned capital improvement projects to include stormwater and drainage improvements.
Historic Preservation Plan: A historic preservation plan is intended to preserve historic structures or districts within a community. An often-overlooked aspect of the historic preservation plan is the assessment of buildings and sites located in areas subject to natural hazards and the identification of ways to reduce future damages. This may involve retrofitting or relocation techniques that account for the need to protect buildings that do not meet current building standards or are within a historic district that cannot easily be relocated out of harm’s way.
Myrtle Beach does not currently have a historic preservation plan. However, development of a historic preservation plan is included as an objective in the Historic Resources Sub-element of the 2011 Comprehensive Plan Update. Horry County has a Historic Preservation Plan which includes the City.

SECTION 6: CAPABILITY ASSESSMENT
City of Myrtle Beach Floodplain Management and Hazard Mitigation Plan 6:8
November 2020
Mitigation strategies such as applying for federal grant funds (i.e., PDM, FMA, HMGP) to protect identified at-risk historic structures in Myrtle Beach could be considered in any future historic planning efforts.
Zoning Ordinance: Zoning represents the primary means by which land use is controlled by local governments. As part of a community’s police power, zoning is used to protect the public health, safety, and welfare of those in a given jurisdiction that maintains zoning authority. A zoning ordinance is the mechanism through which zoning is typically implemented. Since zoning regulations enable municipal governments to limit the type and density of development, a zoning ordinance can serve as a powerful tool when applied in identified hazard areas.
Myrtle Beach adopted a new zoning ordinance in May 2020, which is included as Appendix A of the City Code of Ordinances, to regulate new development and to guide local decisions for residential, commercial, and industrial growth within the City limits. Unwise development in hazardous areas is prohibited or discouraged through floodplain management regulations and a coastal protection overlay district.
The City also has a landscaping and tree protection ordinances include prevention measures for soil erosion, surface drainage improvement, and flood minimization.
Subdivision Ordinance: A subdivision ordinance is intended to regulate the development of housing, commercial, industrial, or other uses, including associated public infrastructure, as land is subdivided into buildable lots for sale or future development. Subdivision design that accounts for natural hazards can dramatically reduce the exposure of future development.
The City’s Subdivision Ordinance is included as Chapter 20 of the City Code of Ordinances. The Subdivision Ordinance accounts for natural hazards by prohibiting the platting of land subject to flooding for residential uses and requiring Base Flood Elevations for subdivisions of greater than 50 lots or 5 acres.
Building Codes, Permitting, and Inspections: Building Codes regulate construction standards. In many communities, permits, and inspections are required for new construction. Decisions regarding the adoption of building codes (that account for hazard risk), the type of permitting process required both before and after a disaster, and the enforcement of inspection protocols all affect the level of hazard risk faced by a community.
Myrtle Beach has adopted and enforces the 2018 version of the International Building Code. The adoption and enforcement of building codes by local jurisdictions is routinely assessed through the Building Code Effectiveness Grading Schedule (BCEGS) program developed by the Insurance Services Office, Inc. (ISO).4 In South Carolina, the ISO East Region assesses the building codes in effect in a particular community and how the community enforces its building codes, with special emphasis on mitigation of losses from natural hazards. The results of BCEGS assessments are routinely provided to ISO’s member private insurance companies, which in turn may offer ratings credits for new buildings constructed in communities with strong BCEGS classifications. The concept is that communities with
4 Participation in BCEGS is voluntary and may be declined by local governments if they do not wish to have their local building codes evaluated.

SECTION 6: CAPABILITY ASSESSMENT
City of Myrtle Beach Floodplain Management and Hazard Mitigation Plan 6:9
November 2020
well-enforced, up-to-date codes should experience fewer disaster-related losses and, as a result, should have lower insurance rates. In conducting the assessment, ISO collects information related to personnel qualification and continuing education as well as number of inspections performed per day. This type of information combined with local building codes is used to determine a grade for that jurisdiction. The grades range from 1 to 10, with a BCEGS grade of 1 representing exemplary commitment to building code enforcement and a grade of 10 indicating less than minimum recognized protection.
Myrtle Beach has received a BCEGS rating of grade of 3 for its commercial lines and a rating of 3 for its residential lines.
6.3.4 Floodplain Management Flooding represents the greatest natural hazard facing the nation. At the same time, the tools available to reduce the impacts associated with flooding are among the most developed when compared to other hazard-specific mitigation techniques. In addition to approaches that cut across hazards such as education, outreach, and the training of local officials, the National Flood Insurance Program (NFIP) contains specific regulatory measures that enable government officials to determine where and how growth occurs relative to flood hazards. Participation in the NFIP is voluntary for local governments; however, program participation is strongly encouraged by FEMA as a first step for implementing and sustaining an effective hazard mitigation program. It is therefore used as part of this assessment as a key indicator for measuring local capability. In order for a county or municipality to participate in the NFIP, they must adopt a local flood damage prevention ordinance that requires jurisdictions to follow established minimum building standards in the floodplain. These standards require that all new buildings and substantial improvements to existing buildings will be protected from damage by a 100-year flood event and that new development in the floodplain will not exacerbate existing flood problems or increase damage to other properties. A key service provided by the NFIP is the mapping of identified flood hazard areas. Once completed, the Flood Insurance Rate Maps (FIRMs) are used to assess flood hazard risk, regulate construction practices, and set flood insurance rates. FIRMs are an important source of information to educate residents, government officials, and the private sector about the likelihood of flooding in their community.
The City of Myrtle Beach joined the NFIP in 1977. The current effective map date for the City’s FIRMs is August 23, 1999.
As of September 23, 2020, there were 1,373 NFIP policies in force in Myrtle Beach, providing over $532.7 million in flood insurance coverage.5 As of July 22, 2020, there has been approximately $37.6 million paid in insurance claims on 1,333 reported losses.
Community Rating System: An additional indicator of floodplain management capability is the active participation of local jurisdictions in the Community Rating System (CRS). The CRS is an incentive-based program that encourages counties and municipalities to undertake defined flood mitigation activities
5 General NFIP policy data (participation and coverage) is current as provided by the Federal Emergency Management Agency Open FEMA Dataset.

SECTION 6: CAPABILITY ASSESSMENT
City of Myrtle Beach Floodplain Management and Hazard Mitigation Plan 6:10
November 2020
that go beyond the minimum requirements of the NFIP, adding extra local measures to provide protection from flooding. All of the 18 creditable CRS mitigation activities are assigned a range of point values. As points are accumulated and reach identified thresholds, communities can apply for an improved CRS class. Class ratings, which range from 10 to 1, are tied to flood insurance premium reductions as shown in Table 6.2. As class ratings improve (the lower the number the better), the percent reduction in flood insurance premiums for NFIP policyholders in that community increases.
Table 6.2: CRS Premium Discounts, By Class
CRS Class Premium
Reduction
1 45%
2 40%
3 35%
4 30%
5 25%
6 20%
7 15%
8 10%
9 5%
10 0
Source: FEMA
Community participation in the CRS is voluntary. Any community that is in full compliance with the rules and regulations of the NFIP may apply to FEMA for a CRS classification better than Class 10. The CRS application process has been greatly simplified over the past several years based on community comments intended to make the CRS more user friendly and extensive technical assistance available for communities who request it.
The City of Myrtle Beach is currently a CRS Class 5 Community. This means that citizens living in the Special Flood Hazard Area receive a 25% discount on their Flood Insurance premiums.
As part of their participation in the CRS, the City conducts annual outreach to the public through brochures that are mailed to residents living in or near the local flood hazard area. The brochure, entitled A Guide to Regulatory Floodplains and Flood Protection, includes information on the benefits of the floodplain, flood warning systems, required permits in the floodplain, and actions residents can take to reduce their risk of injury from floods. Flood information is also available on the City’s website and Facebook page.
Floodplain Management Plan: A floodplain management plan (or a flood mitigation plan) provides a framework for action regarding corrective and preventative measures to reduce flood-related impacts.
The City of Myrtle Beach Floodplain Management and Hazard Mitigation Plan serves as both the hazard mitigation plan and the floodplain management plan for the City. Floodplain management is also achieved through the local zoning, subdivision, and flood damage prevention ordinances.

SECTION 6: CAPABILITY ASSESSMENT
City of Myrtle Beach Floodplain Management and Hazard Mitigation Plan 6:11
November 2020
Open Space Management Plan: An open space management plan is designed to preserve, protect, and restore largely undeveloped lands in their natural state and to expand or connect areas in the public domain such as parks, greenways, and other outdoor recreation areas. In many instances open space management practices are consistent with the goals of reducing hazard losses, such as the preservation of wetlands or other flood-prone areas in their natural state in perpetuity.
The Recreation Department maintains a Parks and Recreation Master Plan. The consultants of EDAW with Leon Younger and PROS and DDC engineers prepared the plan.
The Natural Resources Element of the Comprehensive Plan also contains a Parks and Recreation Sub-element. The sub-element stresses the magnitude of community and individual benefits. The environmental benefits that come from the increase in trees and other native vegetation helps reduce flooding and erosion.
Stormwater Management Plan: A stormwater management plan is designed to address flooding associated with stormwater runoff. The stormwater management plan is typically focused on design and construction measures that are intended to reduce the impact of more frequently occurring minor urban flooding.
The Public Works Department, with assistance from Code Enforcement, implements the City’s Stormwater Management Plan.
6.3.5 Fire Safety and Prevention The City of Myrtle Beach Fire Department (MBFD) provides emergency response and recovery duties for the city’s residents and visitors. The following is a summary of some of the recent accomplishments of this department:
2016, 2017, 2018, and 2019 State Homeland Security Program Grants: Each year, MBFD received grants to enhance the regional capabilities of the Urban Search and Rescue Team (USAR) with equipment and training. The amounts were $66,864.09, $67,000.00, $67,892.00, and $78,000.00.
2016, 2017, 2018, and 2019 State Homeland Security Program Grants: The MBFD received grants to enhance the response and capabilities of their HAZMAT-WMD team with equipment and training. The amounts were $64,993.18, $68,417.00, $72,892.00, and $77,000.00.
6.3.6 Administrative and Technical Capability The ability of a local government to develop and implement mitigation projects, policies, and programs is directly tied to its ability to direct staff time and resources for that purpose. Administrative capability can be evaluated by determining how mitigation-related activities are assigned to local departments and if there are adequate personnel resources to complete these activities. The degree of intergovernmental coordination among departments will also affect administrative capability for the implementation and success of proposed mitigation activities.

SECTION 6: CAPABILITY ASSESSMENT
City of Myrtle Beach Floodplain Management and Hazard Mitigation Plan 6:12
November 2020
Technical capability can generally be evaluated by assessing the level of knowledge and technical expertise of local government employees, such as personnel skilled in using Geographic Information Systems (GIS) to analyze and assess community hazard vulnerability. The Capability Assessment Survey was used to capture information on administrative and technical capability through the identification of available staff and personnel resources. Table 6.3 provides a summary of the Capability Assessment Survey results for Myrtle Beach with regard to relevant staff and personnel resources. A checkmark (✓) indicates that the given local staff member(s) is maintained through the City’s local government resources.
Table 6.3: Relevant Staff / Personnel Resources
STAFF / PERSONNEL RESOURCES IN PLACE DEPARTMENT COMMENTS
Planners with knowledge of land development and land management practices
✓ Planning
Engineers or professionals trained in construction practices related to buildings and/or infrastructure ✓
Construction Services / Public Works
Planners or engineers with an understanding of natural and/or human-caused hazards
✓
Planning, Construction Services, Public Works, Fire Department, Risk Management
Emergency manager ✓ Fire Department Fire Department and Risk Manager assist Chief
Floodplain manager ✓ Construction Services The City has a total of 7 CFMs on staff
Land surveyors ✓ Public Works
No licensed surveyors but Public Works has several staff members who are capable surveyors.
Scientist familiar with the hazards of the community ✓ Public Works Soil scientist
Staff with education or expertise to assess the community’s vulnerability to hazards
✓
Planning, Fire Department , Public Works, Police Department, Construction Services, Risk Manager
Personnel skilled in Geographic Information Systems (GIS) and/or FEMA's HAZUS program
✓ Planning, Construction Services, Public Works, Finance
Resource development staff or grant writers ✓ All Departments
6.3.7 Fiscal Capability The ability of a local government to take action is often closely associated with the amount of money available to implement policies and projects. This may take the form of outside grant funding awards or locally-based revenue and financing. The costs associated with mitigation policy and project implementation vary widely. In some cases, policies are tied primarily to staff time or administrative

SECTION 6: CAPABILITY ASSESSMENT
City of Myrtle Beach Floodplain Management and Hazard Mitigation Plan 6:13
November 2020
costs associated with the creation and monitoring of a given program. In other cases, direct expenses are linked to an actual project such as the acquisition of flood-prone homes, which can require a substantial commitment from local, state, and federal funding sources. The Capability Assessment Survey was used to capture information on the City’s fiscal capability through the identification of locally available financial resources. Table 6.4 provides a summary of the results for the City of Myrtle Beach with regard to relevant fiscal resources. A checkmark (✓) indicates that the given fiscal resource is locally available for hazard mitigation purposes (including match funds for state and federal mitigation grant funds).
Table 6.4: Relevant Fiscal Resources
FISCAL RESOURCES AVAILABLE DEPARTMENT COMMENTS
Capital Improvement Programming ✓ Budget, Public Works, All 1 EMD grant project is currently under construction for flood relief
Community Development Block Grants (CDBG) ✓
Neighborhood Services Division, Horry County
City Manager’s Office
Special Purpose Taxes (or taxing districts) ✓ Administration, Budget SRF Citywide – beach issues
Gas / Electric Utility Fees
Water / Sewer Fees ✓ Public Works
Stormwater Utility Fees ✓ Public Works Fund supports system maintenance. Capital funds are used for projects.
Development Impact Fees ✓ Finance Water/Sewer services
General Obligation, Revenue and/or Special Tax Bonds
✓ Budget
Partnering arrangements or intergovernmental agreements ✓
Other ✓
Underground Utility Fund (Santee Cooper), Street Tree Inventory (USDA, SC Forestry Commission), SAFER Grant, National Arbor Day Foundation, Alliance for Trees
6.3.8 Political Capability One of the most difficult capabilities to evaluate involves the political will of a jurisdiction to enact meaningful policies and projects designed to reduce the impact of future hazard events. Hazard mitigation may not be a local priority or may conflict with or be seen as an impediment to other goals of the community, such as growth and economic development. Therefore the local political climate must be considered in designing mitigation strategies as it could be the most difficult hurdle to overcome in accomplishing their adoption and implementation.

SECTION 6: CAPABILITY ASSESSMENT
City of Myrtle Beach Floodplain Management and Hazard Mitigation Plan 6:14
November 2020
The Capability Assessment Survey was used to capture information on the City’s political capability. Survey respondents were asked to identify some general examples of local political capability, such as guiding development away from identified hazard areas, restricting public investments or capital improvements within hazard areas, or enforcing local development standards that go beyond minimum state or federal requirements (e.g., building codes, floodplain management, etc.).
Survey responses indicate that there is a strong local commitment to mitigate the effects of
natural hazards in the City of Myrtle Beach. These findings are further confirmed through the City’s past mitigation activities as described in Section 8 under Previously Completed Mitigation Action.
6.3.9 Local Self-Assessment In addition to the inventory and analysis of specific local capabilities, the Capability Assessment Survey required City of Myrtle Beach staff to conduct a self-assessment of their perceived capability to implement hazard mitigation activities. As part of this process, city officials were encouraged to consider the barriers to implementing proposed mitigation strategies in addition to the mechanisms that could enhance or further such strategies. In response to the survey questionnaire, city officials classified each of the aforementioned capabilities as either “limited,” “moderate,” or “high.” Table 6.5 summarizes the results of the self-assessment process for the City of Myrtle Beach.
Table 6.5: Self-Assessment of Capability
Planning and Regulatory Capability High
Administrative and Technical Capability High
Fiscal Capability Moderate
Political Capability High
Overall Capability High
6.4 CONCLUSIONS ON LOCAL CAPABILITY In order to form meaningful conclusions on the assessment of local capability, a quantitative scoring methodology was designed and applied to results of the Capability Assessment Survey. The methodology used to develop the capability score for the City can be found in Appendix B. The rating attempts to assess the overall level of capability for the City of Myrtle Beach to implement hazard mitigation actions.
6.4.1 Capability Score According to the capability assessment, the capability score for the City of Myrtle Beach is 75, which represents 95% of the total number of points achievable through the Atkins capability scoring methodology. This indicates an overall “High” level of local capability. The capability score is based solely on the information provided by local officials in response to the Capability Assessment Survey. The survey instrument was designed to measure local capability based on

SECTION 6: CAPABILITY ASSESSMENT
City of Myrtle Beach Floodplain Management and Hazard Mitigation Plan 6:15
November 2020
those indicators determined to be most relevant for mitigation purposes and referenced in FEMA’s “How-to” series planning guidance.
6.4.2 Linking the Capability Assessment with the Risk Assessment and the Mitigation Strategy
The conclusions of the risk assessment and capability assessment serve as the foundation for the development of a meaningful hazard mitigation strategy. During the process of identifying specific mitigation actions to pursue, City staff considered not only the City’s level of hazard risk but also the existing capability to minimize or eliminate that risk. Figure 6.2 shows a Risk vs. Capability Matrix that is used to illustrate the City’s overall hazard risk in comparison to overall capability.6 Based on the assessments completed for the City of Myrtle Beach, hazard risk was determined to be HIGH while the overall capability is also HIGH. This means that while the City of Myrtle Beach does face some significant potential hazards, it also has significant capacity to implement mitigation measures to eliminate, reduce, or manage those hazards.
Figure 6.2: Risk vs. Capability Matrix
HAZARD RISK
Limited Moderate High
OV
ERA
LL
CA
PA
BIL
ITY
High ✓
Moderate
Limited
6 Overall hazard risk was determined using the results of the risk assessment combined with information on the following factors:
total population, population growth rate, land area, historical disaster declarations, unique hazard risks, NFIP participation and the value of existing Pre-FIRM structures.

SECTION 7: MITIGATION STRATEGY
City of Myrtle Beach Floodplain Management and Hazard Mitigation Plan
November 2020
7:1
SECTION 7 MITIGATION STRATEGY
This section of the Plan provides the blueprint for the City of Myrtle Beach to follow in order to become less vulnerable to its identified hazards. It is based on general consensus of the Floodplain Management and Hazard Mitigation Planning Committee (FMHMPC) and the findings and conclusions of the Capability Assessment and Risk Assessment. It consists of the following five subsections:
7.1 Introduction
7.2 Mitigation Goals
7.3 Identification and Analysis of Mitigation Techniques
7.4 Selection of Mitigation Techniques for Myrtle Beach
7.5 Plan Update Requirement
7.1 INTRODUCTION The intent of the Mitigation Strategy is to provide the City of Myrtle Beach with the goals that will serve as guiding principles for future mitigation policy and project administration along with an analysis of mitigation techniques deemed available to meet those goals and reduce the impact of identified hazards. It is designed to be comprehensive, strategic, and functional in nature:
In being comprehensive, the development of the strategy includes a thorough review of all hazards and identifies extensive mitigation measures intended to not only reduce the future impacts of high-risk hazards but also to help the City achieve compatible economic, environmental, and social goals.
In being strategic, the development of the strategy ensures that all policies and projects
proposed for implementation are consistent with pre-identified, long-term planning goals.
In being functional, each proposed mitigation action is linked to established priorities and assigned to specific departments or individuals responsible for their implementation with target completion deadlines. When necessary, funding sources are identified that can be used to assist in project implementation.
The first step in designing the Mitigation Strategy includes the identification of mitigation goals. Mitigation goals represent broad statements that are achieved through the implementation of more specific mitigation actions. These actions include both hazard mitigation policies (such as the regulation of land in known hazard areas through a local ordinance) and hazard mitigation projects that seek to address specifically targeted hazard risks (such as the acquisition and relocation of a repetitive loss structure).

SECTION 7: MITIGATION STRATEGY
○○○○○○
City of Myrtle Beach Floodplain Management and Hazard Mitigation Plan
October 2020
7:2
The second step involves the identification, consideration, and analysis of available mitigation measures to help achieve the identified mitigation goals. This is a long-term, continuous process sustained through the development and maintenance of this Plan. Alternative mitigation measures will continue to be considered as future mitigation opportunities are identified, as data and technology improve, as mitigation funding becomes available, and as this Plan is maintained over time. The third and last step in designing the Mitigation Strategy is the selection and prioritization of specific mitigation actions for Myrtle Beach (provided separately in Section 8: Mitigation Action Plan). The Mitigation Action Plan, or MAP, represents an unambiguous and functional plan for action and is considered to be the most essential outcome of the mitigation planning process. The MAP includes a prioritized listing of proposed hazard mitigation actions (policies and projects) for the City of Myrtle Beach to carry out with accompanying information, such as those departments or individuals assigned responsibility for their implementation, potential funding sources, and an estimated target date for completion. The MAP provides those departments or individuals responsible for implementing mitigation actions with a clear roadmap that also serves as an important tool for monitoring success or progress over time. The cohesive collection of actions listed in the MAP can also serve as an easily understood menu of mitigation policies and projects for those local decision makers who want to quickly review the recommendations and proposed actions of the Floodplain Management and Hazard Mitigation Plan. In preparing the Mitigation Action Plan for Myrtle Beach, the FMHMPC considered the City’s overall hazard risk and its capability to mitigate the effects of hazards, as recorded through the risk and capability assessment process, in addition to meeting the adopted mitigation goals and unique needs of the community.
7.1.1 Mitigation Action Prioritization Prioritization of the proposed mitigation actions was based on the following six (6) factors:
Effect on overall risk to life and property Ease of implementation Political and community support A general economic cost/benefit review1 Funding availability Continued compliance with the NFIP
The City’s Floodplain Coordinator helped to coordinate the prioritization process by reviewing each action and working with the lead agency/department responsible to determine a priority for each action using the six factors listed above. Using these criteria, actions were classified as high, moderate, or low priority.
1 Only a general economic cost/benefit review was considered by the FMHMPC through the process of selecting and prioritizing mitigation actions. Mitigation actions with “high” priority were determined to be the most cost effective and most compatible with Myrtle Beach’s unique needs. A more detailed cost/benefit analysis will be applied to particular projects prior to the application for or obligation of funding, as appropriate.

SECTION 7: MITIGATION STRATEGY
○○○○○○
City of Myrtle Beach Floodplain Management and Hazard Mitigation Plan
October 2020
7:3
7.2 MITIGATION GOALS
44 CFR Requirement
44 CFR Part 201.6(c)(3)(i): The mitigation strategy shall include a description of mitigation goals to reduce or avoid long-term vulnerabilities to the identified hazards.
The primary goal of all local governments is to promote the public health, safety, and welfare of its citizens. In keeping with this standard, the City of Myrtle Beach has developed seven goal statements for local hazard mitigation planning, presented in Table 7.1. Each goal, purposefully broad in nature, serves to establish parameters that were used in developing mitigation actions. Consistent implementation of objectives and actions over time will ensure that community goals are achieved.
Table 7.1 Mitigation Goals
GOAL 1
Protect life and property from the hazards of wind, rain, flooding, ocean surge, and sea level rise.
GOAL 2
Preserve natural resources including the beaches, wetlands, swashes, and waterways.
GOAL 3
Continue to develop and implement storm water drainage plans.
GOAL 4
Create and foster comprehensive public education and awareness for all hazards in the community.
GOAL 5
Improve and ensure adequate public safety services and essential municipal services under normal, future, and emergency conditions.
GOAL 6
Preserve the existing land use plan, most especially the residential neighborhoods.
GOAL 7
Reduce economic impact from the effects of a hazard event.
As part of the plan update, the FMHMPC revisited the goals from the existing plan. This was done during the August 12, 2020 meeting to ensure that the previously identified goals remain valid. As a result of this review, the FMHMPC recommended that the existing goals remain the same with a few minor word choice modifications. Each of the following goal statements represents a broad target for the City of

SECTION 7: MITIGATION STRATEGY
○○○○○○
City of Myrtle Beach Floodplain Management and Hazard Mitigation Plan
October 2020
7:4
Myrtle Beach to achieve through the implementation of the more detailed Mitigation Action Plan provided in Section 8.
7.3 IDENTIFICATION AND ANALYSIS OF MITIGATION TECHNIQUES
44 CFR Requirement 44 CFR Part 201.6(c)(3)(ii): The mitigation strategy shall include a section that identifies and analyzes a comprehensive range of specific mitigation actions and projects being considered to reduce the effect of each hazard, with particular emphasis on new and existing buildings and infrastructure.
In formulating the Mitigation Strategy for the City of Myrtle Beach, a wide range of activities were considered in order to help achieve the established mitigation goals in addition to addressing any specific hazard concerns. These activities were discussed during FMHMPC meetings. In general, all activities considered by the FMHMPC can be classified under one of the following six (6) broad categories of mitigation techniques: Prevention, Property Protection, Natural Resource Protection, Structural Projects, Emergency Services, and Public Awareness and Education. These are discussed in detail below.
7.3.1 Prevention Preventative activities are intended to keep hazard problems from getting worse and are typically administered through government programs or regulatory actions that influence the way land is developed and buildings are built. They are particularly effective in reducing a community’s future vulnerability, especially in areas where development has not occurred, or capital improvements have not been substantial. Examples of preventative activities include:
Planning and zoning Building codes Open space preservation Floodplain regulations Stormwater management regulations Drainage system maintenance Capital improvements programming Riverine / fault zone setbacks
7.3.2 Property Protection Property protection measures involve the modification of existing buildings and structures to help them better withstand the forces of a hazard or removal of the structures from hazardous locations. Examples include:
Acquisition Relocation Building elevation Critical facilities protection Retrofitting (e.g., windproofing, floodproofing, seismic design techniques, etc.)
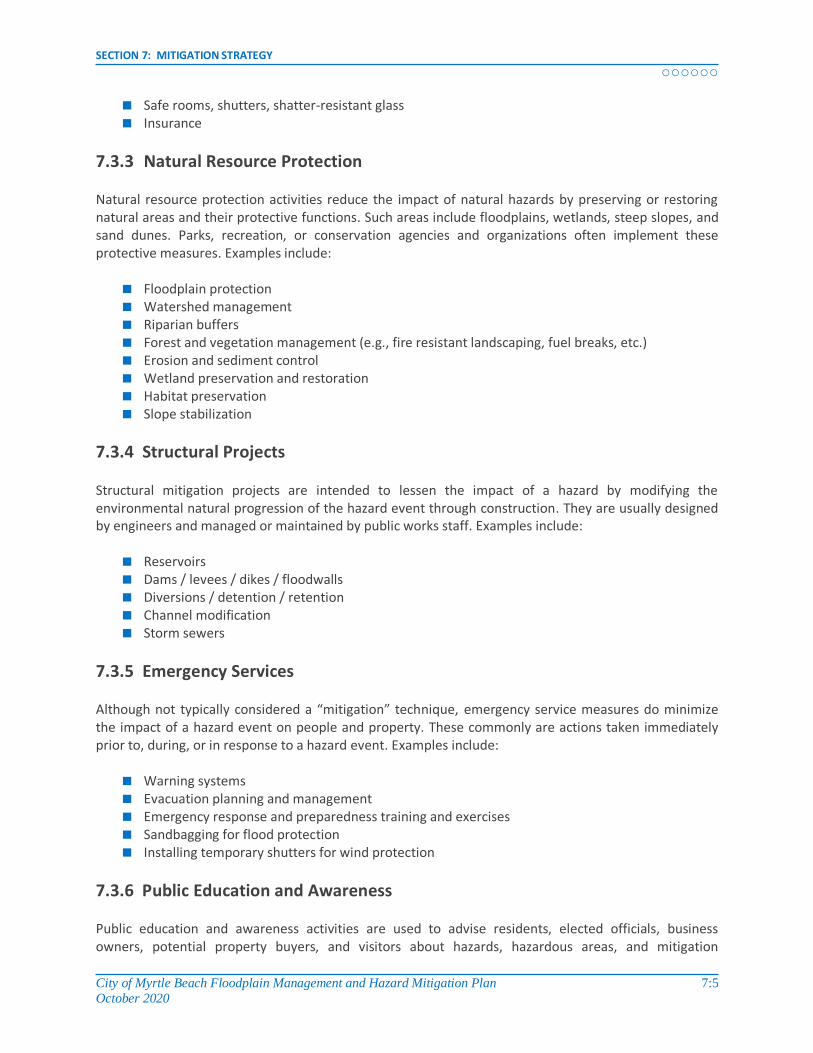
SECTION 7: MITIGATION STRATEGY
○○○○○○
City of Myrtle Beach Floodplain Management and Hazard Mitigation Plan
October 2020
7:5
Safe rooms, shutters, shatter-resistant glass Insurance
7.3.3 Natural Resource Protection Natural resource protection activities reduce the impact of natural hazards by preserving or restoring natural areas and their protective functions. Such areas include floodplains, wetlands, steep slopes, and sand dunes. Parks, recreation, or conservation agencies and organizations often implement these protective measures. Examples include:
Floodplain protection Watershed management Riparian buffers Forest and vegetation management (e.g., fire resistant landscaping, fuel breaks, etc.) Erosion and sediment control Wetland preservation and restoration Habitat preservation Slope stabilization
7.3.4 Structural Projects Structural mitigation projects are intended to lessen the impact of a hazard by modifying the environmental natural progression of the hazard event through construction. They are usually designed by engineers and managed or maintained by public works staff. Examples include:
Reservoirs Dams / levees / dikes / floodwalls Diversions / detention / retention Channel modification Storm sewers
7.3.5 Emergency Services Although not typically considered a “mitigation” technique, emergency service measures do minimize the impact of a hazard event on people and property. These commonly are actions taken immediately prior to, during, or in response to a hazard event. Examples include:
Warning systems Evacuation planning and management Emergency response and preparedness training and exercises Sandbagging for flood protection Installing temporary shutters for wind protection
7.3.6 Public Education and Awareness Public education and awareness activities are used to advise residents, elected officials, business owners, potential property buyers, and visitors about hazards, hazardous areas, and mitigation

SECTION 7: MITIGATION STRATEGY
○○○○○○
City of Myrtle Beach Floodplain Management and Hazard Mitigation Plan
October 2020
7:6
techniques they can use to protect themselves and their property. Examples of measures to educate and inform the public include:
Outreach projects Symposiums Speaker series / demonstration events Hazard map information Real estate disclosure Library materials Social media Websites School children educational programs Hazard expositions
7.4 SELECTION OF MITIGATION TECHNIQUES FOR MYRTLE BEACH In order to determine the most appropriate mitigation techniques for the City of Myrtle Beach, the FMHMPC members thoroughly reviewed and considered the findings of the Capability Assessment and Risk Assessment to determine the best activities for the community. Other considerations included the effect of each mitigation action on overall risk to life and property, its ease of implementation, its degree of political and community support, its general cost-effectiveness, and funding availability (if necessary).
7.5 PLAN UPDATE REQUIREMENT In keeping with FEMA requirements for plan updates, the Mitigation Actions identified in the 2015 plan were evaluated to determine their 2020 implementation status. Updates on the implementation status of each action are provided. The mitigation actions provided in Section 8: Mitigation Action Plan include the mitigation actions from the 2015 plan as well as any new mitigation actions proposed through the 2020 planning process.

SECTION 8: MITIGATION ACTION PLAN
City of Myrtle Beach Floodplain Management and Hazard Mitigation Plan
November 2020
8:1
SECTION 8 MITIGATION ACTION PLAN
This section of the Plan includes the listing of the mitigation actions proposed by the City of Myrtle Beach in the Plan. It consists of the following two subsections:
⧫ 8.1 Overview
⧫ 8.2 Mitigation Action Plan
44 CFR Requirement
44 CFR Part 201.6(c)(3)(iii): The mitigation strategy shall include an action plan describing how the actions identified in paragraph (c)(2)(ii) of this section will be prioritized, implemented, and administered by the local jurisdiction.
8.1 OVERVIEW This section includes the listing of the mitigation actions proposed by the City of Myrtle Beach. It is designed to achieve the mitigation goals established in Section 7: Mitigation Strategy and will be maintained on a regular basis according to the plan maintenance procedures established in Section 9: Plan Maintenance Procedures. Each proposed mitigation action has been identified as an effective measure (policy or project) to reduce hazard risk for the City of Myrtle Beach. Each action is listed in the MAP in conjunction with background information such as hazard(s) addressed, plan goal(s), and relative priority. Other information provided in the MAP includes potential funding sources to implement the action should funding be required (not all proposed actions are contingent upon funding). Most importantly, implementation mechanisms are provided for each action, including the designation of a lead agency or department responsible for carrying the action out as well as a timeframe for its completion. These implementation mechanisms ensure that the City of Myrtle Beach Flood Mitigation and Hazard Mitigation Plan remains a functional document that can be monitored for progress over time. The proposed actions are not listed in priority order; however, each has been assigned a priority level of “high,” “moderate,” or “low” as described below and in Section 7 (page 7.2). The Mitigation Action Plan is organized by mitigation strategy category (Prevention, Property Protection, Natural Resource Protection, Structural Projects, Emergency Services, or Public Education and Awareness). The following are the key elements described in the Mitigation Action Plan:
⧫ Hazard(s) Addressed—Hazard which the action addresses.
⧫ Goal(s) Addressed—Plan goal which the action addresses.

SECTION 8: MITIGATION ACTION PLAN
○○○○○○
City of Myrtle Beach Floodplain Management and Hazard Mitigation Plan
October 2020
8:2
⧫ Relative Priority—High, moderate, or low priority as assigned by the jurisdiction.
⧫ Lead Agency/Department—Department responsible for undertaking the action.
⧫ Potential Funding Sources—Local, State, or Federal sources of funds are noted here, where applicable.
⧫ Implementation Schedule—Date by which the action the action should be completed. More information is provided when possible.
⧫ Implementation Status (2020)—Indication of completion, progress, deferment, or no change since the previous plan. If the action is new, that will be noted here.
8.2 Mitigation Action Plan The mitigation actions proposed by the City are listed in each mitigation technique on the following pages. Table 8.1 shows the location of each technique within the MAP as well as the number of mitigation actions proposed for each technique.
Table 8.1: MAP
Mitigation Category Page Number of Mitigation Actions
Prevention 8:3 19
Property Protection 8:6 4
Natural Resource Protection 8:7 4
Structural Projects 8:8 2
Emergency Services 8:8 9
Public Education and Awareness 8:10 10

SECTION 8: MITIGATION ACTION PLAN
City of Myrtle Beach Floodplain Management and Hazard Mitigation Plan
October 2020
8:3
City of Myrtle Beach Mitigation Actions
Action #
Description Hazard(s) Addressed
Goal Addressed
Relative Priority
Lead Agency/ Department
Potential Funding Sources
Implementation Schedule
Implementation Status (2020)
Prevention
P-1
Submit a request to FEMA for mapping the Market Commons District using their Limited Map Maintenance Program, to map the storm surge potential.
Flood, Storm Surge
1, 6 Moderate Floodplain
Coordinator, Public Works Department
FEMA, Local funds
Completed
The preliminary flood maps have been mapped and are still in the appeals process.
P-2 Revise the zoning ordinance to ensure no net loss of fill within the SFHA.
Flood 1 Low
City Council, Planning
Commission, Zoning Administrator, Chief
Building Official
Operating budget
2021
Deferred The City will review this as part of a group of floodplain ordinance amendments to maintain and improve the CRS rating and protect property ahead of adopting a new FIRM.
P-3 Create a plan to increase Community Rating System (CRS) points.
Flood 1, 7 Moderate Floodplain
Coordinator, FMHMPC
Local funds 2026
Deferred Continuously looking for additional ways to gains points. Working on Stormwater Master Plan, increasing number of CFM’s, identification of evacuation routes on signs, etc. Additional strategy involves working towards the development of an integrated watershed-based planning document that will satisfy CRS watershed master plan requirements. Improve outreach program.

SECTION 8: MITIGATION ACTION PLAN
City of Myrtle Beach Floodplain Management and Hazard Mitigation Plan
October 2020
8:4
Action #
Description Hazard(s) Addressed
Goal Addressed
Relative Priority
Lead Agency/ Department
Potential Funding Sources
Implementation Schedule
Implementation Status (2020)
P-4 Perform routine maintenance on the City’s drainage structures.
Flood 3 High Public Works Department
Local funds 2026
Deferred The Public Works Department continuously looks for opportunities to improve drainage in the City and improve the existing infrastructure.
P-5
Work to increase overall staff expertise in floodplain management through training and certification of additional staff.
Flood 1, 5 High City Manager Local funds 2024
Deferred The City has spoken with FEMA representatives about needing substantial damage assessment training and is assessing better training options. The City will also work with the State to seek SDE training for inspectors.
P-6 Create and maintain a map of all repetitive loss properties.
Hurricane and Tropical
Storm, Flood, Storm Surge
1, 5 High Floodplain
Coordinator Local funds 2026
Deferred The City updates the repetitive loss properties map as properties are mitigation or incur damage from hazards.
P-7 Create a training program on how to fill out an elevation certificate.
Flood 5 Moderate Floodplain
Coordinator Local funds 2024
Deferred The City will contact SCDNR again to try and schedule future training on the latest version of elevation certificates.
P-8
Review the Floodplain Ordinance and other elements of the City’s Floodplain Management program to ensure continued compliance with the NFIP.
Flood 1, 5 High City Council, Zoning
Administrator Local funds 2022
Deferred The City is planning to update the ordinance again once the new FEMA flood maps are released.

SECTION 8: MITIGATION ACTION PLAN
City of Myrtle Beach Floodplain Management and Hazard Mitigation Plan
October 2020
8:5
Action #
Description Hazard(s) Addressed
Goal Addressed
Relative Priority
Lead Agency/ Department
Potential Funding Sources
Implementation Schedule
Implementation Status (2020)
P-9 Post-construction inspections of private stormwater systems.
Flood 3, 5 Moderate Public Works Department
Local funds 2026
Deferred The City will continue to enforce post-construction inspections of stormwater systems.
P-10 Encourage more developers to bury their utility lines to prevent damage from wind and flooding.
High Wind, Ice Storm,
Northeaster, Flood,
Tornado
1 Moderate
Planning Department, Public Works Department,
Construction Services
Local funds 2026
Deferred The City actively tries to engage with developers to encourage building and development practices to safeguard against wind and flood damage.
P-11 Become a Firewise Community. Wildfire 5, 7 Moderate Fire Marshal Local funds 2022
Deferred The City is still determining what requirements need to be met to become a Firewise community.
P-12 Amend zoning code to reflect appropriate Firewise vegetation.
Wildfire 1, 5 Low Planning
Department, Fire Department
Local funds 2026 New
P-13 Adopt Coastal A Zone regulations. Flood 1 Moderate
Planning Department,
Floodplain Coordinator
Local funds 2022
New The city adopts International Building Code as state requires. Coastal A Zone needs to be enforced on the ground and put in a map.
P-14 Add future flood zones to subdivision regulations.
Flood 1, 6 Moderate
Floodplain Coordinator,
Planning Department
Local funds 2023
New Need to add the ability for the Planning Commission to use future flood zone data for review purposes instead of current flood zones.

SECTION 8: MITIGATION ACTION PLAN
City of Myrtle Beach Floodplain Management and Hazard Mitigation Plan
October 2020
8:6
Action #
Description Hazard(s) Addressed
Goal Addressed
Relative Priority
Lead Agency/ Department
Potential Funding Sources
Implementation Schedule
Implementation Status (2020)
P-15 Acquire equipment required for ditch maintenance and continue necessary infrastructure maintenance.
Flood 3 Moderate Public Works Department
Capital Improvements
Plan 2026
New Maintenance is necessary to upkeep ditches and stormwater management infrastructure.
P-16
Perform sewer and stormwater rate study and create an implementation plan to support the findings of the study.
Flood 3 Moderate Public Works Department
Capital Improvements
Plan 2024
New This study can help lead to replacement of older sewer pipes that may be leaking and contributing to high levels of bacteria resulting in a positive impact on water quality.
P-17 Maintain and protect the oceanfront and determine if there are new open space areas.
Flood
2 Moderate Floodplain Manager Local funds 2023
New Open space near AFB was previously a federal property and was not previously mapped.
P-18 Develop a program to incentivize rain gardens.
Flood 3, 6
Low Public Works,
Planning Local funds, Grant funds
2024 New
P-19 Adopt permeable surface requirements for new construction.
Flood
1
Moderate Floodplain
Coordinator, Public Works, Planning
Local funds 2024 New
Property Protection
PP-1 Acquire easements or property to correct localized drainage problems.
Flood 3 Moderate Public Works
Department, City Council
Local funds 2026
Deferred The Public Works Department continually seeks to acquire easements and/or property associated with drainage improvement projects within our community. The City is looking to outsource to professional services to acquire additional easements.

SECTION 8: MITIGATION ACTION PLAN
City of Myrtle Beach Floodplain Management and Hazard Mitigation Plan
October 2020
8:7
Action #
Description Hazard(s) Addressed
Goal Addressed
Relative Priority
Lead Agency/ Department
Potential Funding Sources
Implementation Schedule
Implementation Status (2020)
PP-2 Removal of temporary pool enclosures from hotels in the floodplain.
Flood, Storm Surge, Tidal
Waves / Tsunami
1, 5 High Floodplain
Coordinator, Zoning Administrator
Local funds Completed
Completed
PP-3
Evaluate repetitive loss properties for possible acquisition, retrofitting, elevation, and relocation and provide implementation recommendations.
Flood 1 High
Floodplain Coordinator,
Planning Department
FEMA funds, Local funds
2026
New
PP-4 Add sewer backup protection regulations and develop an ordinance.
Flood 3 Moderate Public Works,
Planning Department
Capital Improvements
Plan 2023
New This will be considered when the ordinance is updated.
Natural Resource Protection
NRP-1
Continue beach renourishment on a 10-year cycle for the next 50 years, based on the availability of funding for the federal government’s share of the cost.
Coastal Erosion, Sea Level Rise,
Storm Surge
2 High City Council, City Manager, Public Works Director
Local funds, USACE, Grants
2026
Deferred Planning has begun with the USACOE to implement another renourishment to be completed in 2018.
NRP-2 Conduct study to investigate the cost of constructing a second line of dunes using sand fencing.
Beach Erosion, Coastal
Flooding, Storm Surge
1, 2 Moderate Public Works
Director Beach protection
grants 2026
Deferred Double sand fencing was put in 2 years ago 1st N to 33rd N as part of Re-nourishment. Additionally, PW is working with the county to discuss extending future re-nourishment plans.
NRP-3 Acquire additional swash and wetland areas.
Flood 2 Moderate Public Works
Department, City Council
Local funds, grants
2023
Deferred The City has submitted a Hazard Mitigation Grant Program (HMGP) application for a drainage project involving Cane Patch Swash that would involve the potential acquisition of additional wetland areas.

SECTION 8: MITIGATION ACTION PLAN
City of Myrtle Beach Floodplain Management and Hazard Mitigation Plan
October 2020
8:8
Action #
Description Hazard(s) Addressed
Goal Addressed
Relative Priority
Lead Agency/ Department
Potential Funding Sources
Implementation Schedule
Implementation Status (2020)
NRP-4
Coordinate with the Planning Department to include a representative for floodplain issues that may arise during the rewriting of the comprehensive plan and produce an updated land use map.
Flood 1, 5 High
Planning Department,
Floodplain Coordinator
Local funds 2026
Deferred Comprehensive Plan is due for update. Land Use Inventory and Future Land Use Plan need to be updated. Do not currently have staff required to complete.
Structural Projects
SP-1
Find funding for three currently developed stormwater projects: the 4th Avenue North Plan; the 24th Avenue North Plan; and the Downtown Redevelopment Corporation (DRC) Plan.
Flood 3 Moderate Public Works Department
TBD 2025
Deferred 4th Ave. completed. Seeking funding for the 24th Ave header pipe- going out for bid in late 2020.
SP-2 Find funding for the development of an integrated watershed master plan.
Flood 1,3, 7 Moderate Public Works Department
TBD 2025
New Development of an integrated watershed-based planning document that will satisfy NPDES MS4, SCDHEC 319, and CRS watershed master plan requirements, provide city-wide stormwater modeling, and yield a series of proposed watershed-based stormwater implementation projects.
Emergency Services
ES-1 Improvement of Emergency Warning System.
All Hazards 1 Moderate Emergency
Management TBD Completed
Completed City purchased a hyper-reach system in 2018.

SECTION 8: MITIGATION ACTION PLAN
City of Myrtle Beach Floodplain Management and Hazard Mitigation Plan
October 2020
8:9
Action #
Description Hazard(s) Addressed
Goal Addressed
Relative Priority
Lead Agency/ Department
Potential Funding Sources
Implementation Schedule
Implementation Status (2020)
ES-2 Evacuation Route Improvement. Hurricane
and Tropical Storm
1 Moderate Emergency
Management, SCDOT
Local funds; Federal grants
2026
Deferred The City is continuously working with the County to improvement evacuation procedures each year as lessons are learned. The City will participate in annual drill with the County to exercise the evacuation process.
ES-3
Maintain the City’s Emergency Management Plan. (Each hazard identified in this plan is included in the Emergency Management Plan.)
All Hazards 1, 5 High Emergency
Management Local funds 2026
Deferred The City does annual updates on its EMP and additional updates are made following an event as needed.
ES-4 Maintain “StormReady Community” Status.
Hailstorm, Lightning,
High Wind, Hurricane, Tornado
1, 5 High Emergency
Management Local funds 2026
Deferred The City works to maintain their StormReady status with required re-evaluations.
ES-5
Apply lessons learned from recent disasters and apply for Tsunami-Ready Status and plan for a Flood Awareness Week.
All 1, 5, 7 Moderate
Emergency Management,
Floodplain Coordinator
Local funds 2023
Deferred The City is using current experiences to apply to their situation and lessons learned through recent hurricanes. The City is currently a Tsunami-Ready community and is planning for a Flood Awareness Week.
ES-6 Devise a flood drill to test the flood warning system.
Flood 1 High
Risk Manager, Emergency Manager, Floodplain
Coordinator
Local funds 2022
Deferred The new radio system should allow for testing and an annual test needs to be scheduled.

SECTION 8: MITIGATION ACTION PLAN
City of Myrtle Beach Floodplain Management and Hazard Mitigation Plan
October 2020
8:10
Action #
Description Hazard(s) Addressed
Goal Addressed
Relative Priority
Lead Agency/ Department
Potential Funding Sources
Implementation Schedule
Implementation Status (2020)
ES-7 Train Urban Search and Rescue Team on building collapse rescue.
All 1, 5 Moderate City Fire
Department Homeland
Security Grants 2022
Deferred The USAR team is trained annually on building collapse rescues.
ES-8 Train Water Rescue Team for the floodplain area and other water rescues.
Flood 1, 5 Moderate City Fire
Department
Local funds, Homeland
Security Grants 2022
Deferred The Water Rescue Team trains for flooding rescues annually.
ES-9
Utilize installed cameras throughout the City to monitor emergency situations to include flooding and surge on the beach access points.
All 1, 5 Moderate Emergency
Management/Public Safety
Local Funds 2026
Deferred The City is using the camera system to monitor the situations upon EOC activation and utilize them for damage assessment as well.
Public Education and Awareness
PEA-1
Create a business task group to establish guidelines for the mitigation of hazard related economic losses to the community.
All 4, 7 Moderate
Planning Director, Planning
Commission, City Manager, City
Council
Local funds, private sector
2026
Deferred The City is working to obtain buy-in from businesses to create appropriate guidelines.
PEA-2 Create a presence on the City’s Web site for flood information.
Flood 1, 4 High Floodplain
Coordinator, Public Information Officer
Local funds 2026
Deferred The City’s website is reviewed monthly to check for any broken links and confirmed that the content is still current and pertinent.
PEA-3
Provide training for elected and appointed officials and board members about the benefits of low-impact stormwater design.
Flood 1, 7 Moderate Planning
Department, Public Works Department
Local funds 2026
Deferred The City works to provide training and awareness to all elected and appointed officials and board members.

SECTION 8: MITIGATION ACTION PLAN
City of Myrtle Beach Floodplain Management and Hazard Mitigation Plan
October 2020
8:11
Action #
Description Hazard(s) Addressed
Goal Addressed
Relative Priority
Lead Agency/ Department
Potential Funding Sources
Implementation Schedule
Implementation Status (2020)
PEA-4 Develop a public information / safety campaign regarding lightning strikes.
Lightning 1, 4 Moderate Fire Marshal, Risk Manager, Public
Information Officer Local funds Completed
Completed A brochure was created and has been posted on the City website along with the City’s Facebook page on more than one instance.
PEA-5
Place floodplain brochures at City Hall and recreation centers to educate the public on floodplain regulations and preparing for emergencies.
Flood 1, 4, 5 High Construction
Services/Floodplain Manager
Local funds 2026
Deferred The brochures are replenished as needed.
PEA-6 Attend community watch meetings and educate the citizens on stormwater and floodplain issues.
Flood 1, 3, 4 High Construction
Services/Floodplain Manager
Local Funds 2026
Deferred The City tries to maintain a connection with the citizen meetings and provide information accordingly.
PEA-7 Create public service announcements for hurricane or emergency preparedness.
All 1, 4 High PIO Local Funds 2026
Deferred The City is working to revitalize its public service announcements for preparedness activities.
PEA-8 Initiate a social media campaign for the City of Myrtle Beach.
All 1, 4 High PIO Local Funds 2026
Deferred The City is talking with Hospitality Association on placing more material in hotels, restaurants, etc.
PEA-9 Plan and hold a disaster awareness day for the City’s citizens.
All 1, 4 High PIO, Emergency
Management Local Funds 2026
Deferred The City will work to plan a disaster awareness day for the primary residents.
PEA-10 Develop a public outreach plan to support all CRS activities.
Flood 4 High Floodplain
Coordinator, PIO Local Funds 2026
New

SECTION 8: MITIGATION ACTION PLAN
City of Myrtle Beach Floodplain Management and Hazard Mitigation Plan
October 2020
8:12
Action #
Description Hazard(s) Addressed
Goal Addressed
Relative Priority
Lead Agency/ Department
Potential Funding Sources
Implementation Schedule
Implementation Status (2020)
Proposed New Mitigation Actions from Annual Reports
NA-1 Update CRS list and map.
Flood 1 High Floodplain
Manager, Planning N/A 2021
New
NA-2 Consider adopting Coastal A zones when on the new flood maps.
Flood
1 Moderate City Council,
FMHMPC N/A 2022
New
NA-3 Evaluate Category 1 evacuation planning and impacts on the city.
Hurricane 1 Moderate Fire
Planning N/A 2017
Completed This was carried out during Hurricane Florence.
NA-4 Publicize OCRM baseline changes. Flooding 4 High Floodplain
Coordinator N/A 2017-2018
Completed
NA-5
Partner with Waccamaw Stormwater Consortium to increase partnerships, getting grants, signage of flood heights.
Flooding 4 Moderate Planning
Floodplain Coordinator
N/A 2022
Deferred The City is working with the consortium to obtain funding to support flooding preparedness.
NA-6 Research flood claims for repetitive loss properties.
Flooding 1 Moderate
Floodplain Coordinator Stormwater
Manager
Grant 2022
Deferred This is done annually to determine what potential mitigation actions can be implemented.
NA-7 Produce a map showing the flooding during recent hurricane flood events.
Flooding 4 Moderate Engineering, GIS N/A 2022
Deferred A map was produced from EPA meeting; however, additional maps from recent hurricanes need to be evaluated.
NA-8 Complete Flood Warning & Response Annex Plan.
Flooding 1 Moderate Emergency Manager
N/A 2019 Completed
NA-9 Hold after action meeting on Hurricane Florence with department heads
Hurricanes 5, 7 High Emergency Manager
N/A 2019 Completed
NA-10 Present to City Council a report on the deployment of city employees to assist with Hurricane Michael in Florida.
Hurricanes 5 High Emergency Manager
N/A 2019 Completed

SECTION 8: MITIGATION ACTION PLAN
City of Myrtle Beach Floodplain Management and Hazard Mitigation Plan
October 2020
8:13
Action #
Description Hazard(s) Addressed
Goal Addressed
Relative Priority
Lead Agency/ Department
Potential Funding Sources
Implementation Schedule
Implementation Status (2020)
NA-11
Include an element in the Comprehensive Plan to address the Disaster Relief and Resilience Act as mandated by Section 6-29-510(D).
All All High Planning
Department Local funds 2023
New
Previously Completed Mitigation Actions
Include the Departmental Disaster Response Plan in the Floodplain Management and Hazard Mitigation Plan by reference.
All Hazards
1, 5 Moderate
City Council, FMHMPC
N/A Completed
Completed The City’s Departmental Disaster Response Plan (DDRP) was included by reference in the Floodplain Management and Hazard Mitigation Plan last year. The DDRP is a comprehensive collection of the specific responsibilities for each department during a disaster. The City is taking the prescribed steps to update the plan annually.
Investigate potential coordination with SC DHEC to create a rainfall alert system.
Flood
5 Moderate
Public Works Department
Local funds Completed
Completed. The Public Works Department has coordinated with SC DHEC and currently receives rain gauge information online. This data is then used to help design stormwater systems that mitigate problems in particular areas.
Implement a non-conversion agreement as a condition of granting permits in Flood Zones.
Flood 1, 5 High Construction
Services, Floodplain Coordinator
Local funds Completed Completed
Coordinate with Planning and Public Works to draft a stormwater plan.
Flood 3 Moderate Planning
Department, Public Works Department
Local Funds Completed Completed
Create a new filing system for elevation certificates in the Floodplain Coordinator’s office.
Flood 5 Low Floodplain
Coordinator Local funds Completed
Completed

SECTION 8: MITIGATION ACTION PLAN
City of Myrtle Beach Floodplain Management and Hazard Mitigation Plan
October 2020
8:14
Action #
Description Hazard(s) Addressed
Goal Addressed
Relative Priority
Lead Agency/ Department
Potential Funding Sources
Implementation Schedule
Implementation Status (2020)
Removal of temporary pool enclosures from hotels in the floodplain.
Flood, Storm Surge, Tidal
Waves / Tsunami
1, 5 High Floodplain
Coordinator, Zoning Administrator
Local funds Completed
Completed
A study for a regional storm water system for the former U.S. Air Force Base has been completed and work on the regional stormwater ponds is progressing.
Flood 3 Moderate
Base Redevelopment Authority, Public
Works Department
Local funds, Staff time
Completed
Completed

SECTION 9: PLAN MAINTENANCE PROCEDURES
City of Myrtle Beach Floodplain Management and Hazard Mitigation Plan
November 2020
9:1
SECTION 9 PLAN MAINTENANCE PROCEDURES
44 CFR Requirement 44 CFR Part201.6(c)(4)(i): The plan shall include a plan maintenance process that includes a section describing the method and schedule of monitoring, evaluating and updating the mitigation plan within a five-year cycle. 44 CFR Part 201.6(c)(4)(ii): The plan maintenance process shall include a process by which local governments incorporate the requirements of the mitigation plan into other planning mechanisms such as comprehensive or capital improvement plans, when appropriate.
This section discusses how the City of Myrtle Beach’s Mitigation Strategy and Mitigation Action Plan will be implemented and how the Floodplain Management and Hazard Mitigation Plan will be evaluated and enhanced over time. This section also discusses how the public will continue to be involved in a sustained hazard mitigation planning process. It consists of the following four subsections:
9.1 Monitoring and Evaluating the Previous Plan 9.2 Implementation and Integration 9.3 Monitoring, Evaluation, and Enhancement 9.4 Continued Public Involvement
9.1 MONITORING AND EVALUATING THE PREVIOUS PLAN Since the previous plan was adopted, the City of Myrtle Beach has worked to ensure that mitigation was integrated into local activities and that the mitigation plan was appropriately implemented. The City outlined a process in the 2015 plan for monitoring and evaluating the Plan throughout the interim period between plan updates. The City of Myrtle Beach was ultimately successful in implementing the monitoring and evaluation process that was outlined in the 2015 plan as annual meetings were held by the FMHMPC to discuss the mitigation plan and the priorities that were outlined within it. Any findings and recommendations of the FMHMPC were reported to the City Council. Although there were some minor revisions made to the Plan during interim update period, there were few major revisions identified during these annual reviews and the FMHMPC generally agreed that the Plan was on course and that the monitoring and evaluating process itself was sufficient to ensure implementation of the Plan.

SECTION 9: PLAN MAINTENANCE PROCEDURES
City of Myrtle Beach Floodplain Management and Hazard Mitigation Plan
October 2020
9:2
9.2 IMPLEMENTATION AND INTEGRATION Each agency, department, or other partner participating under the City of Myrtle Beach Floodplain Management and Hazard Mitigation Plan is responsible for implementing specific mitigation actions as prescribed in the Mitigation Action Plan. Every proposed action listed in the Mitigation Action Plan is assigned to a specific “lead” agency or department in order to assign responsibility and accountability and increase the likelihood of subsequent implementation. In addition to the assignment of a local lead department or agency, an implementation time period or a specific implementation date has been assigned in order to assess whether actions are being implemented in a timely fashion. The City of Myrtle Beach will seek outside funding sources to implement mitigation projects in both the pre-disaster and post-disaster environments. When applicable, potential funding sources have been identified for proposed actions listed in the Mitigation Action Plan. Myrtle Beach will integrate this Floodplain Management and Hazard Mitigation Plan into relevant City government decision-making processes or mechanisms. This includes integrating the requirements of the Floodplain Management and Hazard Mitigation Plan into other local planning documents, processes, or mechanisms, such as comprehensive or capital improvement plans, when appropriate. The members of the Floodplain Management and Hazard Mitigation Planning Committee (FMHMPC) will remain charged with ensuring that the goals and strategies of new and updated local planning documents for their agencies or departments are consistent with, or do not conflict with, the goals and actions of the Floodplain Management and Hazard Mitigation Plan and will not contribute to increased hazard vulnerability in Myrtle Beach. The City actively integrates mitigation into the daily operations of conducting city business. This is currently accomplished through the following methods:
The entire Floodplain Management and Hazard Mitigation Plan is incorporated into the City’s Comprehensive Plan by reference.
The City reviews all of the Mitigation Actions found in this plan as part of the annual reporting requirements of the CRS.
The City incorporated the goals of the Floodplain Management and Hazard Mitigation Plan into the zoning code as part of a recent rewrite of that code.
Some of the Mitigation Actions that were identified in previous versions of the Plan called for changes/revisions to certain City codes or regulation. Many of these activities have taken place and are documented in the Mitigation Action Plan under the discussion of the implementation status for the action.
Opportunities to integrate the requirements of this Plan into other local planning mechanisms shall continue to be identified through future meetings of the FMHMPC and through the annual review process described herein. Although it is recognized that there are many possible benefits to integrating components of this Plan into other local planning mechanisms, the development and maintenance of this stand-alone Floodplain Management and Hazard Mitigation Plan is deemed by the Myrtle Beach FMHMPC to be the most effective and appropriate method to implement local hazard mitigation actions.

SECTION 9: PLAN MAINTENANCE PROCEDURES
City of Myrtle Beach Floodplain Management and Hazard Mitigation Plan
October 2020
9:3
9.3 MONITORING, EVALUATION, AND ENHANCEMENT Periodic revisions and updates of the Floodplain Management and Hazard Mitigation Plan are required to ensure that the goals of the Plan are kept current, taking into account potential changes in hazard vulnerability and mitigation priorities. In addition, revisions may be necessary to ensure that the Plan is in full compliance with applicable federal and state regulations. Periodic evaluation of the Plan will also ensure that specific mitigation actions are being reviewed and carried out according to the Mitigation Action Plan. The Myrtle Beach FMHMPC shall meet in March of every year to evaluate the progress attained and to revise, where needed, the activities set forth in the Plan. The findings and recommendations of the FMHMPC shall be reported to the City Council at their first regularly scheduled meeting in April. The Myrtle Beach FMHMPC will also meet following any disaster events warranting a reexamination of the mitigation actions being implemented or proposed for future implementation. This will ensure that the Plan is continuously updated to reflect changing conditions and needs within Myrtle Beach.
Five (5) Year Plan Review The Plan will be thoroughly reviewed by the FMHMPC every five years to determine whether there have been any significant changes in Myrtle Beach that may, in turn, necessitate changes in the types of mitigation actions proposed. New development in identified hazard areas, an increased exposure to hazards, an increase or decrease in capability to address hazards, and changes to Federal or state legislation are examples of factors that may affect the necessary content of the Plan. The plan review provides Myrtle Beach officials with an opportunity to evaluate those actions that have been successful and to explore the possibility of documenting potential losses avoided due to the implementation of specific mitigation measures. The plan review also provides the opportunity to address mitigation actions that may not have been successfully implemented as assigned. The Myrtle Beach Floodplain Coordinator will be responsible for reconvening the FMHMPC and conducting the five-year review. During the five-year plan review process, the following questions will be considered as criteria for assessing the effectiveness and appropriateness of the Plan:
Do the goals address current and expected conditions? Has the nature or magnitude of risks changed? Are the current resources appropriate for implementing the Plan? Are there implementation problems, such as technical, political, legal, or coordination issues
with other agencies? Have the outcomes occurred as expected? Did City departments participate in the plan implementation process as assigned?
Following the five-year review, any revisions deemed necessary will be summarized and implemented according to the reporting procedures and plan amendment process outlined herein. Upon completion of the review and update/amendment process, the Myrtle Beach Floodplain Management and Hazard Mitigation Plan will be submitted to the State Hazard Mitigation Officer at the South Carolina Emergency Management Division (SCEMD) for final review and approval in coordination with the Federal Emergency Management Agency (FEMA).

SECTION 9: PLAN MAINTENANCE PROCEDURES
City of Myrtle Beach Floodplain Management and Hazard Mitigation Plan
October 2020
9:4
Disaster Declaration Following a disaster declaration, the Myrtle Beach Floodplain Management and Hazard Mitigation Plan will be revised as necessary to reflect lessons learned or to address specific issues and circumstances arising from the event. It will be the responsibility of the Myrtle Beach Floodplain Coordinator to reconvene the FMHMPC and ensure the appropriate stakeholders are invited to participate in the Plan revision and update process following declared disaster events. Reporting Procedures The results of the five-year review will be summarized by the FMHMPC in a report that will include an evaluation of the effectiveness of the Plan and any required or recommended changes or amendments. The report will also include an evaluation of implementation progress for each of the proposed mitigation actions, identifying reasons for delays or obstacles to their completion along with recommended strategies to overcome them. Plan Amendment Process Upon the initiation of the amendment process, the City of Myrtle Beach will forward information on the proposed change(s) to all interested parties including, but not limited to, all directly affected City departments, residents, and businesses. Information will also be forwarded to the South Carolina Emergency Management Division. This information will be disseminated in order to seek input on the proposed amendment(s) for not less than a 45-day review and comment period. At the end of the 45-day review and comment period, the proposed amendment(s) and all comments will be forwarded to the FMHMPC for final consideration. The committee will review the proposed amendment along with the comments received from other parties, and if acceptable, the committee will submit a recommendation for the approval and adoption of changes to the Plan to the Myrtle Beach City Council within 60 days. In determining whether to recommend approval or denial of a Plan amendment request, the following factors will be considered by the FMHMPC:
There are errors, inaccuracies, or omissions made in the identification of issues or needs in the Plan.
New issues or needs have been identified which are not adequately addressed in the Plan. There has been a change in information, data, or assumptions from those on which the Plan is
based. Upon receiving the recommendation from the FMHMPC and prior to adoption of the Plan, the City will hold a public hearing if deemed necessary. The Myrtle Beach City Council will review the recommendation from the FMHMPC (including the factors listed above) and any oral or written comments received at the public hearing. Following that review, the City Council will take one of the following actions:
Adopt the proposed amendments as presented; Adopt the proposed amendments with modifications; Refer the amendments request back to the FMHMPC for further revision; or Defer the amendment request back to the FMHMPC for further consideration and/or additional
hearings.
SECTION 9: PLAN MAINTENANCE PROCEDURES
City of Myrtle Beach Floodplain Management and Hazard Mitigation Plan
October 2020
9:5
9.4 CONTINUED PUBLIC INVOLVEMENT
44 CFR Requirement
44 CFR Part 201.6(c)(4)(iii): The plan maintenance process shall include a discussion on how the community will continue public participation in the plan maintenance process
Public participation is an integral component to the mitigation planning process and will continue to be essential as this Plan evolves over time. As described above, significant changes or amendments to the Plan shall require a public hearing prior to any adoption procedures. Other efforts to involve the public in the maintenance, evaluation, and revision process will be made as necessary. These efforts may include:
Advertising meetings of the FMHMPC in local newspapers, public bulletin boards, and/or City office buildings;
Designating willing and voluntary citizens and private sector representatives as official members of the FMHMPC;
Utilizing local media to update the public on any maintenance and/or periodic review activities taking place;
Utilizing the City website to advertise any maintenance and/or periodic review activities taking place; and
Keeping copies of the Plan in public libraries.

APPENDIX A PLAN ADOPTION
44 CFR Requirement 44 CFR Part 201.6(c)(5): The plan shall include documentation that the plan has been formally adopted by the local governing body of the jurisdiction requesting approval of the plan.
This appendix includes the final approval letter and local adoption resolution passed by the City of Myrtle
Beach.

U. S. Department of Homeland Security
Region IV
3003 Chamblee Tucker Road
Atlanta, GA 30341
www.fema.gov
April 26, 2021
Candice Shealey, SC CEM
State Hazard Mitigation Officer
South Carolina Emergency Management Division
2779 Fish Hatchery Road
West Columbia, SC 29172
Reference: Hazard Mitigation Plan: City of Myrtle Beach
Dear Mrs. Shealey:
We are pleased to inform you that the City of Myrtle Beach Hazard Mitigation Plan is in compliance with
the Federal hazard mitigation planning requirements resulting from the Disaster Mitigation Act of 2000, as
contained in 44 CFR 201.6. The plan is approved for a period of five (5) years, effective April 26, 2021 to
April 25, 2026.
This plan approval extends to the following participating jurisdiction that provided a copy of their resolution
adopting the plan:
• City of Myrtle Beach
The approved participating jurisdiction is hereby an eligible applicant through the State for the following
mitigation grant programs administered by the Federal Emergency Management Agency (FEMA):
• Hazard Mitigation Grant Program (HMGP)
• Flood Mitigation Assistance (FMA)
• Building Resilient Infrastructure and Communities (BRIC)
National Flood Insurance Program (NFIP) participation is required for some programs.
We commend the participants in the City of Myrtle Beach Hazard Mitigation Plan for development of a
solid, workable plan that will guide hazard mitigation activities over the coming years. Please note, all
requests for funding will be evaluated individually according to the specific eligibility and other
requirements of the particular program under which the application is submitted. For example, a specific
mitigation activity or project identified in the plan may not meet the eligibility requirements for FEMA
funding, and even eligible mitigation activities are not automatically approved for FEMA funding under
any of the aforementioned programs.
We strongly encourage each community to perform an annual review and assessment of the effectiveness
of their hazard mitigation plan; however, a formal plan update is required at least every five (5) years. We
also encourage each community to conduct a plan update process within one (1) year of being included
within a Presidential Disaster Declaration or of the adoption of major modifications to their local

2
Comprehensive Land Use Plan or other plans that affect hazard mitigation or land use and development.
When you prepare a comprehensive plan update, it must be resubmitted through the State as a “plan update”
and is subject to a formal review and approval process by our office. If the plan is not updated prior to the
required five (5) year update, please ensure that the Draft update is submitted at least six (6) months prior
to expiration of this plan approval.
The State and the participants in the City of Myrtle Beach Hazard Mitigation Plan should be commended
for their close coordination and communications with our office in the review and subsequent approval of
the plan. If you have any questions or need any additional information, please do not hesitate to contact
Kenya Grant, of the Hazard Mitigation Assistance Branch, at (770) 220-8893 or Jake Grabowsky, of my
staff, at (202) 856-1901.
Sincerely,
Kristen M. Martinenza, P.E., CFM
Branch Chief
Risk Analysis
FEMA Region IV


APPENDIX B PLANNING TOOLS
This appendix includes the following:
1. List of Recommended Stakeholders
2. Blank Public Participation Survey
3. GIS Data Inventory Sheet
4. Blank Capability Assessment Survey
5. Scoring Criteria for the Capability Assessment
6. Blank Mitigation Action Worksheet

Points System for Capability Ranking
0-24 points = Limited overall capability 25-49 points = Moderate overall capability 50-80 points = High overall capability
I. Planning and Regulatory Capability (Up to 43 points) Yes = 3 points Under Development = 1 point No = 0 points
Hazard Mitigation Plan Comprehensive Land Use Plan Floodplain Management Plan Participate in NFIP Participate in CRS Program
Yes = 2 points Under Development = 1 point No = 0 points
Open Space Management / Parks & Rec. Plan Stormwater Management Plan Natural Resource Protection Plan Flood Response Plan Emergency Operations Plan Continuity of Operations Plan Evacuation Plan Disaster Recovery Plan Flood Damage Prevention Ordinance Post-Disaster Redevelopment / Reconstruction Ordinance
Yes = 1 point No = 0 points
Capital Improvements Plan Economic Development Plan Historic Preservation Plan Zoning Ordinance Subdivision Ordinance Unified Development Ordinance Building Code Fire Code

II. Administrative and Technical Capability (Up to 15 points) Yes = 2 points No = 0 points
Planners with knowledge of land development and land management practices Engineers or professionals trained in construction practices related to buildings and/or infrastructure
Planners or engineers with an understanding of natural and/or human-caused hazards
Emergency manager Floodplain manager
Yes = 1 point No = 0 points
Land surveyors Scientist familiar with the hazards of the community Staff with education or expertise to assess the community’s vulnerability to hazards
Personnel skilled in Geographic Information Systems (GIS) and/or HAZUS Resource development staff or grant writers
III. Fiscal Capability (Up to 10 points) Yes = 1 point No = 0 points
Capital Improvement Programming Community Development Block Grants Special Purpose Taxes Gas / Electric Utility Fees Water / Sewer Fees Stormwater Utility Fees Development Impact Fees General Obligation/ Revenue/ Special Tax Bonds Partnering arrangements or intergovernmental agreements Other
IV. Self-Assessment of Overall Capability (Up to 10 points)

High = 2 points Moderate = 1 points Low = 0 points
Technical Capability Fiscal Capability Administrative Capability Political Capability Overall Capability
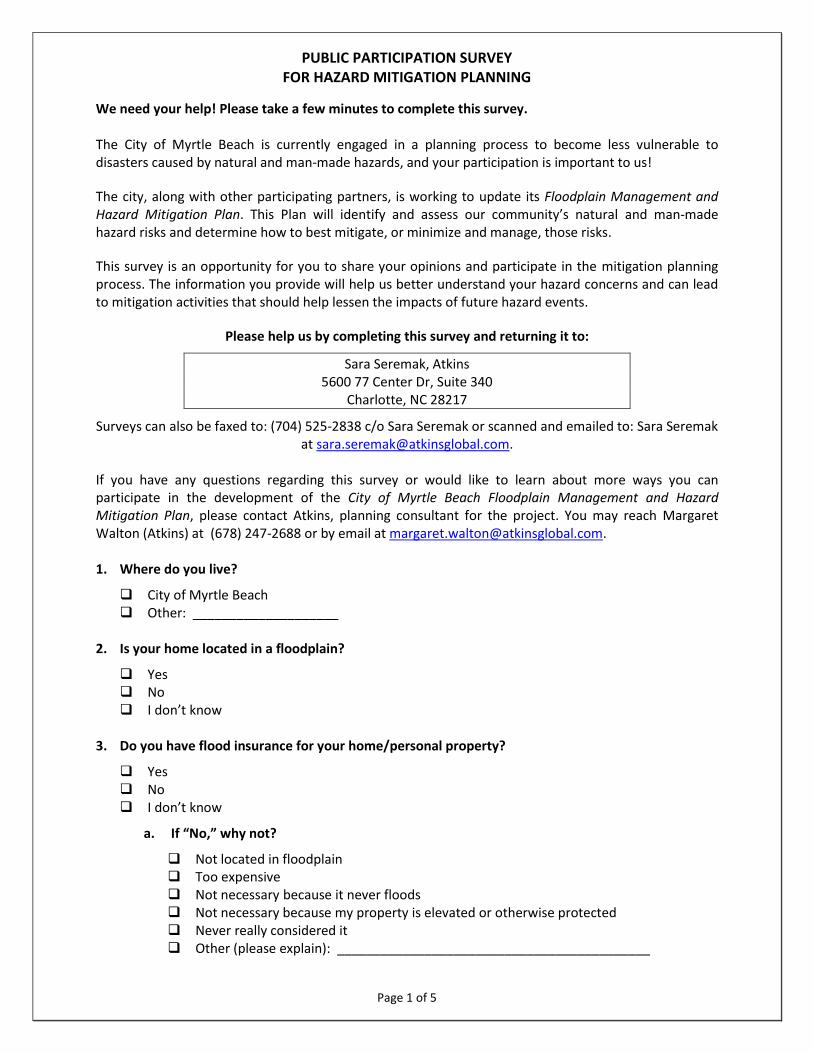
PUBLIC PARTICIPATION SURVEY FOR HAZARD MITIGATION PLANNING
Page 1 of 5
We need your help! Please take a few minutes to complete this survey. The City of Myrtle Beach is currently engaged in a planning process to become less vulnerable to disasters caused by natural and man-made hazards, and your participation is important to us!
The city, along with other participating partners, is working to update its Floodplain Management and Hazard Mitigation Plan. This Plan will identify and assess our community’s natural and man-made hazard risks and determine how to best mitigate, or minimize and manage, those risks.
This survey is an opportunity for you to share your opinions and participate in the mitigation planning process. The information you provide will help us better understand your hazard concerns and can lead to mitigation activities that should help lessen the impacts of future hazard events.
Please help us by completing this survey and returning it to:
Sara Seremak, Atkins 5600 77 Center Dr, Suite 340
Charlotte, NC 28217
Surveys can also be faxed to: (704) 525-2838 c/o Sara Seremak or scanned and emailed to: Sara Seremak at [email protected].
If you have any questions regarding this survey or would like to learn about more ways you can participate in the development of the City of Myrtle Beach Floodplain Management and Hazard Mitigation Plan, please contact Atkins, planning consultant for the project. You may reach Margaret Walton (Atkins) at (678) 247-2688 or by email at [email protected]. 1. Where do you live?
❑ City of Myrtle Beach
❑ Other: ____________________ 2. Is your home located in a floodplain?
❑ Yes ❑ No
❑ I don’t know 3. Do you have flood insurance for your home/personal property?
❑ Yes
❑ No
❑ I don’t know
a. If “No,” why not?
❑ Not located in floodplain ❑ Too expensive ❑ Not necessary because it never floods
❑ Not necessary because my property is elevated or otherwise protected
❑ Never really considered it ❑ Other (please explain): ___________________________________________

Page 2 of 5
4. Have you ever experienced or been impacted by a natural disaster or man-made incident?
❑ Yes
❑ No
a. If “Yes,” please explain:
5. On a scale of 1 to 5, how concerned are you about the possibility of your community being
impacted by a natural disaster or man-made incident?
❑ 1 – Not at all ❑ 2 – Slightly ❑ 3 – Moderately ❑ 4 – Very ❑ 5 – Extremely
6. Please select the three hazards you think pose the greatest concern to your community:
❑ Drought ❑ Hailstorm ❑ Ice Storm ❑ Lightning ❑ Nor’easter ❑ Wind Events ❑ Tornado/Waterspout ❑ Tropical Storm System/Hurricane ❑ Earthquake
❑ Tidal Wave/Tsunami ❑ Erosion ❑ Flood ❑ Storm Surge ❑ Sea Leve Rise ❑ Acts of Terror ❑ Airplane Crash ❑ Hazardous Materials Incident ❑ Wildfire
7. Is there another hazard not listed above that you think is a wide-scale threat to your community?
❑ Yes (please explain): ___________________________________________________ ❑ No

Page 3 of 5
8. On a scale of 1 to 5, how prepared do you feel if a natural disaster or man-made incident were to occur?
❑ 1 – Not at all ❑ 2 – Slightly ❑ 3 – Moderately ❑ 4 – Very ❑ 5 – Extremely
9. Have you taken any actions to make your home, neighborhood, or family safer from hazards?
❑ Yes ❑ No
a. If “Yes,” please explain:
10. Are you interested in making your home, neighborhood, or family safer from hazards?
❑ Yes ❑ No
11. On a scale of 1 to 5, how informed do you feel about the risks and potential impacts of natural
disasters and man-made incidents?
❑ 1 – Not at all
❑ 2 – Slightly ❑ 3 – Moderately ❑ 4 – Very ❑ 5 – Extremely
12. Do you know which government department or agency to contact regarding your risks from
hazards in your area?
❑ Yes ❑ No

Page 4 of 5
13. Please select the way(s) you prefer to receive information about how to make your home, neighborhood, or family safer from hazards:
❑ Newspaper ❑ Television ❑ Radio ❑ Internet ❑ Social media ❑ Email ❑ Mail ❑ Public workshops/meetings ❑ School meetings ❑ Other (please explain): __________________________________________________
14. Please select the way(s) you prefer to receive alerts or warnings about impending hazard events
or dangerous conditions:
❑ Television ❑ Radio ❑ Landline phone ❑ Cell phone ❑ Text message ❑ Facebook ❑ Twitter ❑ Other (please explain): __________________________________________________
15. In your opinion, what are some steps your local government could take to reduce the risk of
future hazard damages in your community?

Page 5 of 5
16. A number of community-wide activities can reduce vulnerability to hazards. In general, these activities fall into one of the following six broad categories. Please tell us how important you think each category is for your community to consider.
Category Very
Important Somewhat Important
Not Important
1. Prevention Administrative or regulatory actions that influence the way land is developed and buildings are built. Examples include planning and zoning, building codes, open space preservation, and floodplain regulations.
❑ ❑ ❑
2. Property Protection Actions that involve modification of existing buildings to protect them from a hazard or removal from the hazard area. Examples include acquisition, relocation, elevation, structural retrofits, and storm shutters.
❑ ❑ ❑
3. Natural Resource Protection Actions that, in addition to minimizing hazard losses, also preserve or restore the functions of natural systems. Examples include floodplain protection, habitat preservation, slope stabilization, riparian buffers, and forest management.
❑ ❑ ❑
4. Structural Projects Actions intended to lessen the impact of a hazard by modifying the natural progression of the hazard. Examples include dams, levees, detention/retention basins, channel modification, retaining walls, and storm sewers.
❑ ❑ ❑
5. Emergency Services Actions that protect people and property during and immediately after a hazard event. Examples include warning systems, evacuation planning, emergency response training, and protection of critical emergency facilities or systems.
❑ ❑ ❑
6. Public Education and Awareness Actions to inform citizens about hazards and the techniques they can use to protect themselves and their property. Examples include outreach projects, school education programs, library materials, and demonstration events.
❑ ❑ ❑
THANK YOU FOR YOUR PARTICIPATION!

GIS Data Request Sheet
City of Myrtle Beach Floodplain Management and Hazard Mitigation Plan
Data requested Available? Received? Potential Sources
Tax Parcel Data Tax Assessor
including replacement value
Building Footprints Tax Assessor/GIS office
Critical Facilities (in GIS or list form with addresses) Tax Assessor/GIS office
examples include:
government buildings
hospitals
senior care
police/fire/EMS/EOC
locally significant buildings
schools
Local hazard studies
public works, natural
resources, planning
examples include:
Flood Studies (HEC-RAS, Risk MAP)
Local Hazard History Articles
Areas of Concern Studies
If you have any questions, please contact:
Ryan Wiedenman
919-431-5295

Local Capability Assessment Survey
Jurisdiction/Agency: Phone:
Point of Contact: E-mail:
Strongly
Supports
Helps
FacilitateHinders
Hazard Mitigation Plan
Comprehensive Land Use Plan (or
General, Master or Growth Mgt. Plan)
Floodplain Management Plan
Open Space Management Plan (or
Parks & Rec./ Greenways Plan)
Stormwater Management Plan /
Ordinance
Natural Resource Protection Plan
Flood Response Plan
Emergency Operations Plan
Continuity of Operations Plan
Evacuation Plan
Other Plans
(please explain under Comments)
1. PLANNING AND REGULATORY CAPABILITY - Please indicate whether the following planning or regulatory tools (plans, ordinances, codes or programs) are
currently in place or under development for your jurisdiction by placing an "X" in the appropriate box. Then, for each particular item in place, identify the
department or agency responsible for its implementation and indicate its estimated or anticipated effect on hazard loss reduction (Strongly Supports, Helps
Facilitate or Hinders) with another "X". Finally, please provide additional comments or explanations in the space provided or with attachments.
CommentsPlanning / Regulatory Tool In Place Under
Development
Department / Agency
Responsible
Effect on Loss Reduction
Page 1 of 6

Local Capability Assessment Survey
Strongly
SupportsFacilitates Hinders
Disaster Recovery Plan
Capital Improvements Plan
Economic Development Plan
Historic Preservation Plan
Floodplain Ordinance (or Flood
Damage Prevention Ordinance)
Zoning Ordinance
Subdivision Ordinance
Unified Development Ordinance
Post-disaster Redevelopment /
Reconstruction Ordinance
Building Code
Fire Code
National Flood Insurance Program
(NFIP)
NFIP Community Rating System
(CRS Program)
In Place Under
Development
Department / Agency
ResponsiblePlanning / Regulatory Tool Comments
Effect on Loss Reduction
Page 2 of 6

Local Capability Assessment Survey
Staff / Personnel Resources Yes No Department / Agency
Planners with knowledge of land
development and land management
practices
Engineers or professionals trained in
construction practices related to
buildings and/or infrastructurePlanners or engineers with an
understanding of natural and/or human-
caused hazards
Emergency manager
Floodplain manager
Land surveyors
Scientist familiar with the hazards of the
community
Staff with education or expertise to
assess the community’s vulnerability to
hazardsPersonnel skilled in Geographic
Information Systems (GIS) and/or
FEMA's HAZUS program
Resource development staff or grant
writers
2. ADMINISTRATIVE AND TECHNICAL CAPABILITY - Please indicate whether your jurisdiction maintains the following staff members within its current
personnel resources by placing an "X" in the appropriate box . Then, if YES, please identify the department or agency they work under and provide any other
comments you may have in the space provided or with attachments.
Comments
Page 3 of 6

Local Capability Assessment Survey
Financial Resources Yes No Department / Agency
Capital Improvement Programming
Community Development Block Grants
(CDBG)
Special Purpose Taxes (or taxing
districts)
Gas / Electric Utility Fees
Water / Sewer Fees
Stormwater Utility Fees
Development Impact Fees
General Obligation, Revenue and/or
Special Tax Bonds
Partnering arrangements or
intergovernmental agreements
Other: _______________________
3. FISCAL CAPABILITY - Please indicate whether your jurisdiction has access to or is eligible to use the following local financial resources for hazard
mitigation purposes (including as match funds for State of Federal mitigation grant funds). Then, identify the primary department or agency responsible for its
administration or allocation and provide any other comments you may have in the space provided or with attachments.
Comments
Page 4 of 6

Local Capability Assessment Survey
4. POLITICAL CAPABILITY - Political capability can be generally measured by the degree to which local political leadership is willing to enact policies and
programs that reduce hazard vulnerabilities in your community, even if met with some opposition. Examples may include guiding development away from
identified hazard areas, restricting public investments or capital improvements within hazard areas, or enforcing local development standards that go beyond minimum State or Federal requirements (e.g., building codes, floodplain management, etc.). Please identify some general examples of these efforts if available and/or reference where more documentation can be found.
Page 5 of 6

Local Capability Assessment Survey
MODERATE
Planning and Regulatory Capability
Administrative and Technical
Capability
Fiscal Capability
Political Capability
OVERALL CAPABILITY
HIGH
5. SELF-ASSESSMENT OF CAPABILITY - Please provide an approximate measure of your jurisdiction's capability to effectively implement hazard mitigation
strategies to reduce hazard vulnerabilities. Using the following table, please place an "X" in the box marking the most appropriate degree of capability (Limited,
Moderate or High) based upon best available information and the responses provided in Sections 1-4 of this survey.
DEGREE OF CAPABILITY
LIMITED
Page 6 of 6

Points System for Capability Ranking
0-24 points = Limited overall capability 25-49 points = Moderate overall capability 50-80 points = High overall capability
I. Planning and Regulatory Capability (Up to 43 points) Yes = 3 points Under Development = 1 point No = 0 points
Hazard Mitigation Plan Comprehensive Land Use Plan Floodplain Management Plan Participate in NFIP Participate in CRS Program
Yes = 2 points Under Development = 1 point No = 0 points
Open Space Management / Parks & Rec. Plan Stormwater Management Plan Natural Resource Protection Plan Flood Response Plan Emergency Operations Plan Continuity of Operations Plan Evacuation Plan Disaster Recovery Plan Flood Damage Prevention Ordinance Post-Disaster Redevelopment / Reconstruction Ordinance
Yes = 1 point No = 0 points
Capital Improvements Plan Economic Development Plan Historic Preservation Plan Zoning Ordinance Subdivision Ordinance Unified Development Ordinance Building Code Fire Code
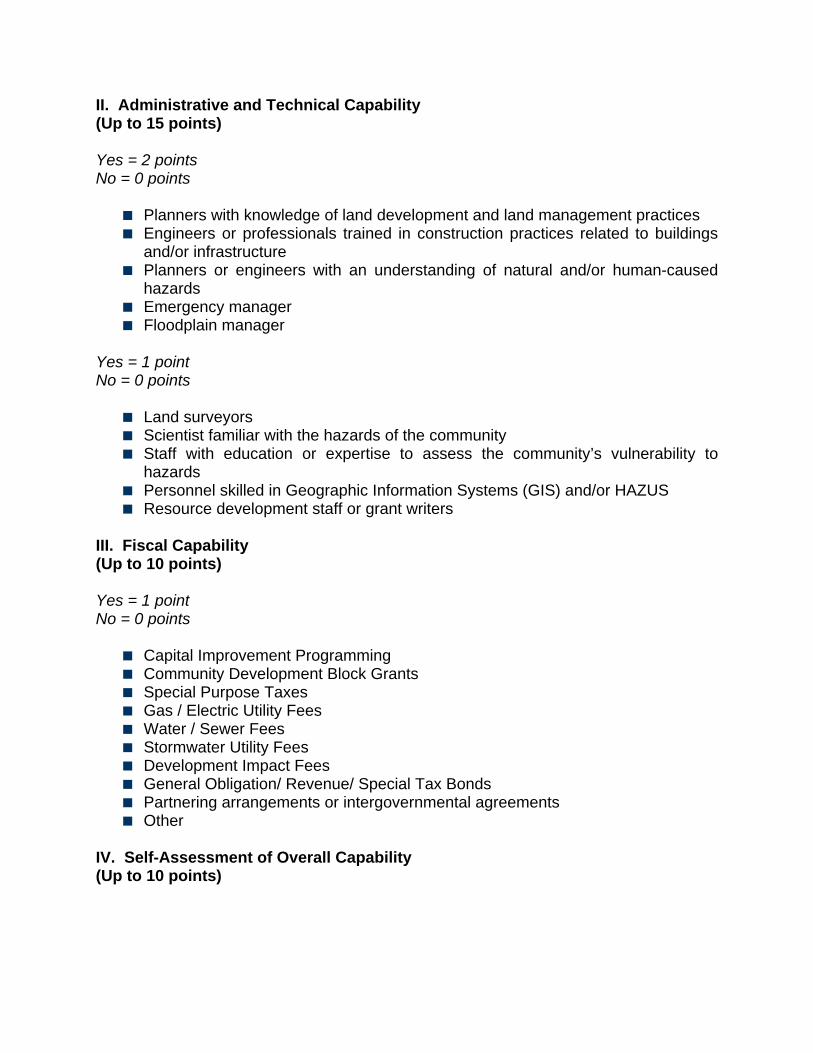
II. Administrative and Technical Capability (Up to 15 points) Yes = 2 points No = 0 points
Planners with knowledge of land development and land management practices Engineers or professionals trained in construction practices related to buildings and/or infrastructure
Planners or engineers with an understanding of natural and/or human-caused hazards
Emergency manager Floodplain manager
Yes = 1 point No = 0 points
Land surveyors Scientist familiar with the hazards of the community Staff with education or expertise to assess the community’s vulnerability to hazards
Personnel skilled in Geographic Information Systems (GIS) and/or HAZUS Resource development staff or grant writers
III. Fiscal Capability (Up to 10 points) Yes = 1 point No = 0 points
Capital Improvement Programming Community Development Block Grants Special Purpose Taxes Gas / Electric Utility Fees Water / Sewer Fees Stormwater Utility Fees Development Impact Fees General Obligation/ Revenue/ Special Tax Bonds Partnering arrangements or intergovernmental agreements Other
IV. Self-Assessment of Overall Capability (Up to 10 points)

High = 2 points Moderate = 1 points Low = 0 points
Technical Capability Fiscal Capability Administrative Capability Political Capability Overall Capability

MITIGATION ACTION WORKSHEETS Mitigation Action Worksheets are used to identify potential hazard mitigation actions that the City of Myrtle Beach will consider to reduce the negative effects of identified hazards. The worksheets provide a simple yet effective method of organizing potential actions in a user-friendly manner that can easily be incorporated into the Hazard Mitigation Plan. The worksheets are to be used as part of a strategic planning process and are designed to be:
a.) completed electronically (worksheets and instructions will be e-mailed to members of the Floodplain Management and Hazard Mitigation Planning Committee following the Mitigation Strategy Workshop);
b.) reviewed with your department/organization for further consideration; and
c.) returned according to the contact information provided below.
Please return all completed worksheets no later than July 31, 2020 to:
Margaret Walton, Project Manager Atkins
Electronic copies may be e-mailed to: [email protected]
Hard copies may be faxed to: 704-525-2838 (Attn: Sara Seremak)
INSTRUCTIONS
Each mitigation action should be considered to be a separate local project, policy or program and each individual action should be entered into a separate worksheet. By identifying the implementation requirements for each action, the worksheets will help lay the framework for engaging in distinct actions that will help reduce the community’s overall vulnerability and risk. Detailed explanations on how to complete the worksheet are provided below. Proposed Action: Identify a specific action that, if accomplished, will reduce vulnerability and risk in the impact area. Actions may be in the form of local policies (i.e., regulatory or incentive-based measures), programs or structural mitigation projects and should be consistent with any pre-identified mitigation goals and objectives. Site and Location: Provide details with regard to the physical location or geographic extent of the proposed action, such as the location of a specific structure to be mitigated, whether a program will be citywide, countywide or regional, etc. History of Damages: Provide a brief history of any known damages as it relates to the proposed action and the hazard(s) being addressed. For example, the proposed elevation of a repetitive loss property should include an overview of the number of times the structure has flooded, total dollar amount of damages if available, etc. Category: Indicate the most appropriate category for the proposed action as discussed during the Mitigation Strategy Workshop (Prevention; Property Protection; Natural Resource Protection; Structural Projects; Emergency Services; Public Education and Awareness). Hazard(s) Addressed: List the hazard(s) the proposed action is designed to mitigate against. Goal(s) Addressed: List the mitigation goal(s) the proposed action supports. Priority: Indicate whether the action is a “high” priority, “moderate” priority or “low” priority based generally on the following criteria:
1. Effect on overall risk to life and property 2. Ease of implementation / technical feasibility 3. Project costs versus benefits 4. Political and community support 5. Funding availability

Potential Funding Sources: If applicable, indicate how the cost to complete the action will be funded. For example, funds may be provided from existing operating budgets or general funds, a previously established contingency fund, a cost-sharing federal or state grant program, etc. Lead Agency/Department Responsible: Identify the local agency, department or organization that is best suited to implement the proposed action. Implementation Schedule: Indicate when the action will begin and when the action is expected to be completed. Remember that some actions will require only a minimal amount of time, while others may require a long-term or continuous effort. Comments: This space is provided for any additional information or details that may not be captured under the previous headings.
MITIGATION ACTION
Proposed Action:
BACKGROUND INFORMATION
Site and Location:
History of Damages:
MITIGATION ACTION DETAILS
Category:
Hazard(s) Addressed:
Goal(s) Addressed:
Priority (High, Moderate, Low):
Potential Funding Sources:
Lead Agency/Department Responsible:
Implementation Schedule:
COMMENTS
APPENDIX C LOCAL MITIGATION PLAN
REVIEW TOOL
This appendix includes a completed Local Mitigation Plan Review Tool.

Local Mitigation Plan Review Tool (FEMA, October 1, 2011) A-1
LOCAL MITIGATION PLAN REVIEW TOOL The Local Mitigation Plan Review Tool demonstrates how the Local Mitigation Plan meets the regulation in 44 CFR §201.6 and offers States and FEMA Mitigation Planners an opportunity to provide feedback to the community.
• The Regulation Checklist provides a summary of FEMA’s evaluation of whether the Plan has addressed all requirements.
• The Plan Assessment identifies the plan’s strengths as well as documents areas for future improvement.
• The Multi-jurisdiction Summary Sheet is an optional worksheet that can be used to document how each jurisdiction met the requirements of the each Element of the Plan (Planning Process; Hazard Identification and Risk Assessment; Mitigation Strategy; Plan Review, Evaluation, and Implementation; and Plan Adoption).
The FEMA Mitigation Planner must reference this Local Mitigation Plan Review Guide when completing the Local Mitigation Plan Review Tool.
Jurisdiction: City of Myrtle Beach, South Carolina
Title of Plan: City of Myrtle Beach Floodplain Management and Hazard Mitigation Plan Update
Date of Plan: October 2020
Local Point of Contact: Emily Hardee
Address: 921 Oak Street PO Drawer 2468 Myrtle Beach, SC 29578-2468
Title: Permits Manager, Floodplain Manager
Agency: City of Myrtle Beach
Phone Number: 843.918.1163
E-Mail: [email protected]
State Reviewer:
Title:
Date:
FEMA Reviewer:
Title:
Date:
Date Received in FEMA Region (insert #)
Plan Not Approved
Plan Approvable Pending Adoption
Plan Approved

A-2 Local Mitigation Plan Review Tool (FEMA, October 1, 2011)
SECTION 1: REGULATION CHECKLIST
INSTRUCTIONS: The Regulation Checklist must be completed by FEMA. The purpose of the Checklist is to identify the location of relevant or applicable content in the Plan by Element/sub-element and to determine if each requirement has been ‘Met’ or ‘Not Met.’ The ‘Required Revisions’ summary at the bottom of each Element must be completed by FEMA to provide a clear explanation of the revisions that are required for plan approval. Required revisions must be explained for each plan sub-element that is ‘Not Met.’ Sub-elements should be referenced in each summary by using the appropriate numbers (A1, B3, etc.), where applicable. Requirements for each Element and sub-element are described in detail in this Plan Review Guide in Section 4, Regulation Checklist.
1. REGULATION CHECKLIST Location in Plan (section and/or page number) Met
Not Met Regulation (44 CFR 201.6 Local Mitigation Plans)
ELEMENT A. PLANNING PROCESS
A1. Does the Plan document the planning process, including how it was prepared and who was involved in the process for each jurisdiction? (Requirement §201.6(c)(1))
Section 2; Appendix D
A2. Does the Plan document an opportunity for neighboring communities, local and regional agencies involved in hazard mitigation activities, agencies that have the authority to regulate development as well as other interests to be involved in the planning process? (Requirement §201.6(b)(2))
Section 2.4-2.7; Appendix D
A3. Does the Plan document how the public was involved in the planning process during the drafting stage? (Requirement §201.6(b)(1))
Section 2.6-2.7; Appendix B; Appendix D
A4. Does the Plan describe the review and incorporation of existing plans, studies, reports, and technical information? (Requirement §201.6(b)(3))
Section 6.3
A5. Is there discussion of how the community(ies) will continue public participation in the plan maintenance process? (Requirement §201.6(c)(4)(iii))
Section 9.4
A6. Is there a description of the method and schedule for keeping the plan current (monitoring, evaluating and updating the mitigation plan within a 5-year cycle)? (Requirement §201.6(c)(4)(i))
Section 9.3
ELEMENT A: REQUIRED REVISIONS
ELEMENT B. HAZARD IDENTIFICATION AND RISK ASSESSMENT
B1. Does the Plan include a description of the type, location, and extent of all natural hazards that can affect each jurisdiction(s)? (Requirement §201.6(c)(2)(i))
Section 4

Local Mitigation Plan Review Tool (FEMA, October 1, 2011) A-3
1. REGULATION CHECKLIST Location in Plan (section and/or page number) Met
Not Met Regulation (44 CFR 201.6 Local Mitigation Plans)
B2. Does the Plan include information on previous occurrences of hazard events and on the probability of future hazard events for each jurisdiction? (Requirement §201.6(c)(2)(i))
Section 4
B3. Is there a description of each identified hazard’s impact on the community as well as an overall summary of the community’s vulnerability for each jurisdiction? (Requirement §201.6(c)(2)(ii))
Section 4; Section 5
B4. Does the Plan address NFIP insured structures within the jurisdiction that have been repetitively damaged by floods? (Requirement §201.6(c)(2)(ii))
Section 4.15.5
ELEMENT B: REQUIRED REVISIONS
ELEMENT C. MITIGATION STRATEGY
C1. Does the plan document each jurisdiction’s existing authorities, policies, programs and resources and its ability to expand on and improve these existing policies and programs? (Requirement §201.6(c)(3))
Section 6
C2. Does the Plan address each jurisdiction’s participation in the NFIP and continued compliance with NFIP requirements, as appropriate? (Requirement §201.6(c)(3)(ii))
Section 4.15.4; Section 6.3.4
C3. Does the Plan include goals to reduce/avoid long-term vulnerabilities to the identified hazards? (Requirement §201.6(c)(3)(i))
Section 7.2
C4. Does the Plan identify and analyze a comprehensive range of specific mitigation actions and projects for each jurisdiction being considered to reduce the effects of hazards, with emphasis on new and existing buildings and infrastructure? (Requirement §201.6(c)(3)(ii))
Section 7.3-7.4; Section 8.2
C5. Does the Plan contain an action plan that describes how the actions identified will be prioritized (including cost benefit review), implemented, and administered by each jurisdiction? (Requirement §201.6(c)(3)(iv)); (Requirement §201.6(c)(3)(iii))
Section 7.1.1; Section 8.2
C6. Does the Plan describe a process by which local governments will integrate the requirements of the mitigation plan into other planning mechanisms, such as comprehensive or capital improvement plans, when appropriate? (Requirement §201.6(c)(4)(ii))
Section 6.3.1 (Table 6.1); Section 9.1-9.2
ELEMENT C: REQUIRED REVISIONS
ELEMENT D. PLAN REVIEW, EVALUATION, AND IMPLEMENTATION (applicable to plan
updates only)
D1. Was the plan revised to reflect changes in development? (Requirement §201.6(d)(3))
Section 3.5; Section 5.3.4
D2. Was the plan revised to reflect progress in local mitigation efforts? (Requirement §201.6(d)(3))
Section 2.9; Section 7.5; Section 8.2

A-4 Local Mitigation Plan Review Tool (FEMA, October 1, 2011)
1. REGULATION CHECKLIST Location in Plan (section and/or page number) Met
Not Met Regulation (44 CFR 201.6 Local Mitigation Plans)
D3. Was the plan revised to reflect changes in priorities? (Requirement §201.6(d)(3))
Section 4.22 (Table 4.34); Section 8.2
ELEMENT D: REQUIRED REVISIONS
ELEMENT E. PLAN ADOPTION
E1. Does the Plan include documentation that the plan has been formally adopted by the governing body of the jurisdiction requesting approval? (Requirement §201.6(c)(5))
Appendix A
E2. For multi-jurisdictional plans, has each jurisdiction requesting approval of the plan documented formal plan adoption? (Requirement §201.6(c)(5))
N/A
ELEMENT E: REQUIRED REVISIONS
ELEMENT F. ADDITIONAL STATE REQUIREMENTS (OPTIONAL FOR STATE REVIEWERS ONLY; NOT TO BE COMPLETED BY FEMA)
F1.
F2.
ELEMENT F: REQUIRED REVISIONS

Local Mitigation Plan Review Tool (FEMA, October 1, 2011) A-5
SECTION 2: PLAN ASSESSMENT
INSTRUCTIONS: The purpose of the Plan Assessment is to offer the local community more comprehensive feedback to the community on the quality and utility of the plan in a narrative format. The audience for the Plan Assessment is not only the plan developer/local community planner, but also elected officials, local departments and agencies, and others involved in implementing the Local Mitigation Plan. The Plan Assessment must be completed by FEMA. The Assessment is an opportunity for FEMA to provide feedback and information to the community on: 1) suggested improvements to the Plan; 2) specific sections in the Plan where the community has gone above and beyond minimum requirements; 3) recommendations for plan implementation; and 4) ongoing partnership(s) and information on other FEMA programs, specifically RiskMAP and Hazard Mitigation Assistance programs. The Plan Assessment is divided into two sections: 1. Plan Strengths and Opportunities for Improvement 2. Resources for Implementing Your Approved Plan Plan Strengths and Opportunities for Improvement is organized according to the plan Elements listed in the Regulation Checklist. Each Element includes a series of italicized bulleted items that are suggested topics for consideration while evaluating plans, but it is not intended to be a comprehensive list. FEMA Mitigation Planners are not required to answer each bullet item, and should use them as a guide to paraphrase their own written assessment (2-3 sentences) of each Element. The Plan Assessment must not reiterate the required revisions from the Regulation Checklist or be regulatory in nature, and should be open-ended and to provide the community with suggestions for improvements or recommended revisions. The recommended revisions are suggestions for improvement and are not required to be made for the Plan to meet Federal regulatory requirements. The italicized text should be deleted once FEMA has added comments regarding strengths of the plan and potential improvements for future plan revisions. It is recommended that the Plan Assessment be a short synopsis of the overall strengths and weaknesses of the Plan (no longer than two pages), rather than a complete recap section by section. Resources for Implementing Your Approved Plan provides a place for FEMA to offer information, data sources and general suggestions on the overall plan implementation and maintenance process. Information on other possible sources of assistance including, but not limited to, existing publications, grant funding or training opportunities, can be provided. States may add state and local resources, if available.

A-6 Local Mitigation Plan Review Tool (FEMA, October 1, 2011)
A. Plan Strengths and Opportunities for Improvement This section provides a discussion of the strengths of the plan document and identifies areas where these could be improved beyond minimum requirements. Element A: Planning Process
How does the Plan go above and beyond minimum requirements to document the planning process with respect to:
Involvement of stakeholders (elected officials/decision makers, plan implementers, business owners, academic institutions, utility companies, water/sanitation districts, etc.);
Involvement of Planning, Emergency Management, Public Works Departments or other planning agencies (i.e., regional planning councils);
Diverse methods of participation (meetings, surveys, online, etc.); and
Reflective of an open and inclusive public involvement process.
Element B: Hazard Identification and Risk Assessment
In addition to the requirements listed in the Regulation Checklist, 44 CFR 201.6 Local Mitigation Plans identifies additional elements that should be included as part of a plan’s risk assessment. The plan should describe vulnerability in terms of: 1) A general description of land uses and future development trends within the community so
that mitigation options can be considered in future land use decisions; 2) The types and numbers of existing and future buildings, infrastructure, and critical facilities
located in the identified hazard areas; and 3) A description of potential dollar losses to vulnerable structures, and a description of the
methodology used to prepare the estimate. How does the Plan go above and beyond minimum requirements to document the Hazard Identification and Risk Assessment with respect to:
Use of best available data (flood maps, HAZUS, flood studies) to describe significant hazards;
Communication of risk on people, property, and infrastructure to the public (through tables, charts, maps, photos, etc.);
Incorporation of techniques and methodologies to estimate dollar losses to vulnerable structures;
Incorporation of Risk MAP products (i.e., depth grids, Flood Risk Report, Changes Since Last FIRM, Areas of Mitigation Interest, etc.); and
Identification of any data gaps that can be filled as new data became available.

Local Mitigation Plan Review Tool (FEMA, October 1, 2011) A-7
Element C: Mitigation Strategy
How does the Plan go above and beyond minimum requirements to document the Mitigation Strategy with respect to:
Key problems identified in, and linkages to, the vulnerability assessment;
Serving as a blueprint for reducing potential losses identified in the Hazard Identification and Risk Assessment;
Plan content flow from the risk assessment (problem identification) to goal setting to mitigation action development;
An understanding of mitigation principles (diversity of actions that include structural projects, preventative measures, outreach activities, property protection measures, post-disaster actions, etc);
Specific mitigation actions for each participating jurisdictions that reflects their unique risks and capabilities;
Integration of mitigation actions with existing local authorities, policies, programs, and resources; and
Discussion of existing programs (including the NFIP), plans, and policies that could be used to implement mitigation, as well as document past projects.
Element D: Plan Update, Evaluation, and Implementation (Plan Updates Only)
How does the Plan go above and beyond minimum requirements to document the 5-year Evaluation and Implementation measures with respect to:
Status of previously recommended mitigation actions;
Identification of barriers or obstacles to successful implementation or completion of mitigation actions, along with possible solutions for overcoming risk;
Documentation of annual reviews and committee involvement;
Identification of a lead person to take ownership of, and champion the Plan;
Reducing risks from natural hazards and serving as a guide for decisions makers as they commit resources to reducing the effects of natural hazards;
An approach to evaluating future conditions (i.e. socio-economic, environmental, demographic, change in built environment etc.);
Discussion of how changing conditions and opportunities could impact community resilience in the long term; and
Discussion of how the mitigation goals and actions support the long-term community vision for increased resilience.

A-8 Local Mitigation Plan Review Tool (FEMA, October 1, 2011)
B. Resources for Implementing Your Approved Plan
Ideas may be offered on moving the mitigation plan forward and continuing the relationship with key mitigation stakeholders such as the following:
What FEMA assistance (funding) programs are available (for example, Hazard Mitigation Assistance (HMA)) to the jurisdiction(s) to assist with implementing the mitigation actions?
What other Federal programs (National Flood Insurance Program (NFIP), Community Rating System (CRS), Risk MAP, etc.) may provide assistance for mitigation activities?
What publications, technical guidance or other resources are available to the jurisdiction(s) relevant to the identified mitigation actions?
Are there upcoming trainings/workshops (Benefit-Cost Analysis (BCA), HMA, etc.) to assist the jurisdictions(s)?
What mitigation actions can be funded by other Federal agencies (for example, U.S. Forest Service, National Oceanic and Atmospheric Administration (NOAA), Environmental Protection Agency (EPA) Smart Growth, Housing and Urban Development (HUD) Sustainable Communities, etc.) and/or state and local agencies?

APPENDIX D PLANNING PROCESS
DOCUMENTATION
This appendix includes:
1. Meeting Agendas
2. Meeting Minutes
3. Meeting Sign-in Sheets
4. Public Notifications and Outreach Documentation
5. Public Participation Survey Results

City of Myrtle Beach Floodplain Management and Hazard Mitigation Five Year Plan Update Meeting
2:00 p.m., Wednesday, May 27, 2020 Conference Call
ANYONE WHO REQUIRES AN AUXILIARY AID OR SERVICE FOR EFFECTIVE
COMMUNICATION OR PARTICIPATION SHOULD CONTACT 843-918-1111 AS SOON AS POSSIBLE, BUT NO LATER THAN 48 HOURS BEFORE THE SCHEDULED EVENT.
A. Introduction B. Overview of Mitigation Planning C. Project Overview
1. Planning Process 2. Hazard Mitigation Planning Committee 3. Project Schedule 4. Data Request
a. Hazard Risk Information b. Related Plans, Studies and Reports
D. Discussion
1. Identify Existing and Future Hazards a. Include Flood-Related Hazards b. Sources and Causes of Flooding c. Location of Flooding d. Frequency of Flooding
E. Roles and Responsibilities F. Next Steps G. Questions and Concerns H. Adjourn

City of Myrtle Beach Floodplain Management and Hazard Mitigation Five Year Plan Update Meeting
1:00 p.m., Wednesday, June 3, 2020 Conference Call
ANYONE WHO REQUIRES AN AUXILIARY AID OR SERVICE FOR EFFECTIVE
COMMUNICATION OR PARTICIPATION SHOULD CONTACT 843-918-1111 AS SOON AS POSSIBLE, BUT NO LATER THAN 48 HOURS BEFORE THE SCHEDULED EVENT.
A. Introduction B. Overview of Mitigation Planning C. Project Overview
1. Planning Process 2. Hazard Mitigation Planning Committee 3. Project Schedule
D. Next Steps E. Questions and Concerns G. Adjourn

City of Myrtle Beach Floodplain Management and Hazard Mitigation Five Year Plan Update Meeting
2:00 p.m., Thursday, June 25, 2020 Conference Call
ANYONE WHO REQUIRES AN AUXILIARY AID OR SERVICE FOR EFFECTIVE
COMMUNICATION OR PARTICIPATION SHOULD CONTACT 843-918-1111 AS SOON AS POSSIBLE, BUT NO LATER THAN 48 HOURS BEFORE THE SCHEDULED EVENT.
A. Introductions B. Overview of the Project So Far C. Risk Assessment Findings
1. Hazard Profiles 2. Critical Facilities 3. Vulnerability of People and Property
D. Impacts from Flooding
1. Life Safety/Need for Warning and Evacuation 2. Public Health 3. Critical Facilities 4. Economy and Employers 5. Number and Type of Buildings 6. Public Buildings Owned by Community
E. Problem Statements
1. Activity: Develop Problem Statements. What are the Major Flood Problems Facing Community?
F. Areas in Floodplain that Provide Natural Function G. Next Steps H. Questions and Concerns I. Adjourn

City of Myrtle Beach Floodplain Management and Hazard Mitigation Five Year Plan Update Meeting
10:00 a.m., Wednesday, August 12, 2020 Conference Call
ANYONE WHO REQUIRES AN AUXILIARY AID OR SERVICE FOR EFFECTIVE
COMMUNICATION OR PARTICIPATION SHOULD CONTACT 843-918-1111 AS SOON AS POSSIBLE, BUT NO LATER THAN 48 HOURS BEFORE THE SCHEDULED EVENT.
A. Introduction B. Overview of Project C. Discussion of Overall Community Vision D. Other Community and Planning Goals
E. Defining Goals for HMP 1. Address Problem Statements F. Committee Activity
1. Develop Actions for Mitigation Categories a. Preventative Measure b. Property Protection c. Natural Resource Protection d. Emergency Services e. Structural Flood Control Projects f. Public Education and Awareness
G. Next Steps H. Questions/Concerns

City of Myrtle Beach Floodplain Management and Hazard Mitigation Five Year Plan Update Meeting
10:00 a.m., Wednesday, September 30, 2020 Conference Call
ANYONE WHO REQUIRES AN AUXILIARY AID OR SERVICE FOR EFFECTIVE
COMMUNICATION OR PARTICIPATION SHOULD CONTACT 843-918-1111 AS SOON AS POSSIBLE, BUT NO LATER THAN 48 HOURS BEFORE THE SCHEDULED EVENT.
A. Introduction B. Overview of Project C. Public Survey Results D. Review of Activities
Highest Priority Activities Update Existing Actions
E. Develop New Actions
Prioritize Actions Additional Considerations
F. Next Steps G. Questions/Concerns

City of Myrtle Beach Floodplain Management and Hazard Mitigation Five Year Plan Update Meeting
10:00 a.m., Wednesday, October 21, 2020 Conference Call
ANYONE WHO REQUIRES AN AUXILIARY AID OR SERVICE FOR EFFECTIVE
COMMUNICATION OR PARTICIPATION SHOULD CONTACT 843-918-1111 AS SOON AS POSSIBLE, BUT NO LATER THAN 48 HOURS BEFORE THE SCHEDULED EVENT.
A. Introduction B. Project Overview C. Plan Highlights
Planning Process Risk Assessment Mitigation Strategy
D. Next Steps E. Questions/Concerns

City of Myrtle Beach Floodplain Management and Hazard Mitigation Plan 2020 Update
Meeting Minutes
Hazard Mitigation Committee Meeting #1: Kickoff and Hazards
May 27, 2:00PM to 4:00PM
Virtual WebEx
Emily Hardee, Floodplain Manager for the City of Myrtle Beach welcomed everyone and then turned the
meeting over to the project consultant, Atkins. Two members of the Atkins’ team, Margaret Walton and
Ryan Wiedenman, were leading the WebEx meeting.
Margaret Walton, Project Manager from Atkins, shared the agenda and addressed the two documents
of the public participation survey and capability assessment that were sent out prior to the meeting. She
then introduced herself and colleague and reacquainted with members of the Floodplain Management
and Hazard Mitigation Planning Committee that had worked together previously.
Ms. Walton then began providing a mitigation overview on exactly what the word mitigation means and
what funding resources are available with the Disaster Mitigation Act of 2000. She also provided a few
examples of mitigation and explained how Federal legislation requires local governments to have a
hazard mitigation plan in place to remain eligible for federal mitigation grants such as the Pre-Disaster
Mitigation Grant Program, Hazard Mitigation Grant Program, and Flood Mitigation Assistance Program
so there is funding to implement some of the actions that this plan may identify. Ms. Walton then laid
out all of the major steps of the mitigation plan update, including the planning process, the risk
assessment, the capability assessment, and the mitigation strategy. She further explained at a high-level
what tasks would be carried out to complete each major step.
Ms. Walton then discussed the key objectives of the project of updating the plan, maintaining mitigation
funding and grant eligibility, identifying potential projects, increasing public education and awareness,
maintaining state and federal requirements along with maintaining the City’s current CRS status. She
also shared the listing of the members of the Floodplain Management and Hazard Mitigation Planning
Committee. Following that, Ms. Walton took the time to explain the Community Rating System (CRS)
and how it benefits the City. She discussed how this plan merges the mitigation strategy and floodplain
management and continued to where the potential opportunities are for the City to gain more points
within the CRS program. The meeting schedule was also shared.
Ms. Walton then described each part of the process and what it entailed. The planning process is
intended to convene the Planning Committee, assist in data collection and analysis, foster public
participation and outreach and prepare the plan for submission.
The discussion on the risk assessment was opened with outline of the components of the risk
assessment and a reminder of the hazards that are addressed in the current version of the City’s hazard
mitigation plan. Attendees were asked to review the list of existing hazards and ensure that all of the
hazards were still applicable and to be sure that none had been missed that should be included in the
current update of the plan. Ms. Walton noted that pandemic or infectious disease might be included in
the man-made hazards but was not required. Generally, all committee members agreed that given the
current global situation that it should be included. Committee Member, Matt Tumbleson of Grand

Strand Regional Hospital, stated that he had a regional hazard vulnerability assessment that he could
share with the project team. Mass casualty and large gatherings were also noted as potential hazards. A
member of the committee, Allison Hardin, also pointed out that the hazard of nor’easter might be less
of a risk now given that there have not been any recent occurrences.
Next on the list of project tasks was the capability assessment which Ms. Walton described and
explained. She then moved into an activity to review the current capability assessment collectively with
the Committee and gain any updates. It was determined that the City now has a Flood Response Plan as
well as Continuity of Operations Plan (COOP). It was also noted that the City has been evaluating the
process of developing a Threat and Hazards Identification Risk Assessment (THIRA). Another committee
member mentioned that the City received a grant to work on a recovery planning effort as well for the
City to flesh out the Recovery Support Functions (RSF).
Ms. Walton moved onto the mitigation strategy portion of the project and outlined the mitigation
categories and share some of the mitigation actions in the current version of the plan. She continued by
discussed the requirements of plan maintenance and documentation.
Ms. Walton then explained how public comment and participation are a required part of this process. A
public survey was developed that the City has placed on the City’s website, LinkedIn, Twitter, Facebook,
and Next Door. It will also be posted hazard mitigation plan update 2020 website. The link can be shared
electronically, and the attendees were asked to post the link and encourage participation.
Ms. Walton then turned the meeting over to Mr. Wiedenman to guide the committee through an
activity which involved identifying locations of existing and future flooding. Attendees were asked to
examine a City map that was presented and provide information on the locations where flooding has
been an issue or may become an issue in the future. Various questions were shared on the presentation
for the Committee members to think through while identifying the locations:
Has the area experienced past flooding or is it an area of future risk or is it both?
How often does it flood?
How severe is the flooding?
What is the source?
What is the cause?
Is it an area where flooding is likely to get worse due to floodplain development, watershed development, or sea level rise?
Are there dams/levees in the community that would cause flooding if they failed?
Are there existing studies or other information available on these problem areas?
The Public Works Department committee member, John Johnson, then shared that their department
had already identified some specific locations and were working on the mitigation of them. Two other
committee members shared that the City had gone through an Environmental Protection Agency (EPA)
Assessment in 2017 of which they did a mapping effort of flooding locations as well as public
engagement and outreach to gain valuable input on the mapping and identification of the flooding sites.
Ms. Allison Hardin from the Planning Department stated that she had all the materials from that
assessment and would make them available to the project team.

Finally, Mr. Wiedenman discussed the roles and responsibilities of all the parties involved as well as the
next steps for the process. He identified the date of the next meeting which was the public meeting to
be held virtually on June 3 and asked the attendees to push out information on public involvement to
the public.
Mr. Wiedenman then adjourned the meeting.

City of Myrtle Beach Floodplain Management and Hazard Mitigation Plan 2020 Update
Meeting Minutes
Public Meeting #1
June 3, 2020, 2:00PM to 4:00PM
Pre-recorded Facebook Posting
Margaret Walton, Project Manager for the consultant, Atkins opened up the session with the agenda
and provided an introduction for the company and herself. The agenda consisted of the following items:
Overview of Mitigation
Project Overview
o Project Schedule
o Planning Process
o Risk Assessment
o Mitigation Strategy
Next Steps
Questions/Concerns
Ms. Walton explained the governance behind mitigation and the Disaster Mitigation Act that
implemented it and the associated funding sources. She also provided examples of mitigation and then
outlined the key objectives for the project:
• Update the Floodplain Management and Hazard Mitigation Plan for Myrtle Beach
• Maintain mitigation funding and grant eligibility
• Identify potential projects
• Increase public awareness and education
• Maintain compliance with State and Federal requirements
• Maintain current Community Rating System (CRS) status
A brief description on the benefits of the Community Rating System was given regarding the discounts
for the flood insurance premiums for policy holders. This was followed by the project tasks of the
planning process, risk assessment, capability assessment, mitigation strategy, plan maintenance, and
associated documentation of the entire project. The meeting schedule was shared, and another public
meeting was said to be expected in October following the draft plan dissemination for review.
Ms. Walton discussed the components of the planning process and moved into the risk assessment by
noting the hazards currently in the plan. She then asked listeners/watchers to think about the problems
in the community of Myrtle Beach and the hazards associated with them as well as potential solutions
that could be implemented. Ms. Walton described the capability assessment and how it would build
upon the risk assessment for the City to develop the mitigation strategy for the community that could
potentially be categorized in one of the six mitigation categories.

Following, the overview of the mitigation categories, Ms. Walton discussed the preferred public
involvement and how individuals could learn more through the project website and how they could take
a public participation survey. Participants were asked to sign in and participate in future meetings that
would be posted on the website. Ms. Walton’s contact information was shared for individuals with
questions or concerns.

City of Myrtle Beach Floodplain Management and Hazard Mitigation Plan 2020 Update
Meeting Minutes
Committee Meeting #2: Problems and Risk Assessment Meeting
June 25, 2020, 2:00PM to 4:00PM
WebEx Meeting
Margaret Walton, Project Manager for the consultant, Atkins kicked off the meeting and began with
introductions of the committee and any new members and discussed the agenda.
Ms. Walton began the meeting by providing a recap of the project thus far for the entire committee
stating that the committee reviewed the mitigation planning process, addressed the existing hazards in
the plan, collectively reviewed the capability assessment, and spent some time examining the locations
of flood risk in the City. She also asked that the committee push out the public participation survey more
if possible.
Ms. Walton then began the risk assessment findings by mentioning the hazards that were discussed for
addition to the hazard list. She explained that given the current situation in our world that we should
look to add pandemic/infectious disease, mass casualty with large gatherings, and extreme heat as
potential hazards to the existing list. Nor’easter was discussed as a lower risk as well as the potential
process of developing a THIRA. At that time, Bruce Arnel, shared that he has received a grant for the
THIRA and has also completed other annexes to support this effort such a COOP, extreme heat, and
severe weather.
Ms. Walton then reviewed the current Hazard Profiles for the following hazards:
Drought
Hailstorm
Ice Storm
Lightning
Nor’easter
Wind Events
Tornado/Waterspout
Tropical Storm System/Hurricane
Earthquake
Tidal Wave/Tsunami
Erosion
Flood
Storm Surge
Sea Level Rise
Acts of Terror
Airplane Crash
Hazardous Materials Incident
Wildfire

She explained the categories of the PRI and the level and criteria associated with each category.
Following that explanation, Ms. Walton outlined the historical data and probability of each hazard and
portrayed the associated hazard maps. Finally, she displayed the hazard ranking table with the scores of
each hazard. The hazards were then presented in the tiers of high, moderate, and low risk. Discussion
followed on the movement of Acts of Terror should be moved to moderate risk instead of low. The
justification was that there were several events in the area that would have the potential to spur that
type of hazard. The Committee also felt as if Sea Level Rise did not lend itself to a real action items so it
could be moved to low risk.
Next, the committee discussed the current critical facilities and potentially reviewing the list collectively.
Emily Hardee planned to send Bruce Arnel the list in discussion. The vulnerability of people and property
was also discussed.
The next activity focused on the flooding sources that were discussed in the last committee meeting.
Some edits were made to the flood sources table that was utilized in the last meeting. Discussed the fact
that the EPA areas that were previously identified by the public may not be true problem areas and that
the watershed study may be more accurate. Specific locations examined were Seaboard Street and Pine
Drive.
The Committee then discussed the Impacts from those flooding sources and specified problem
statements surrounding the potential impacts. The activities for the group collectively were focused on
floodplain management and ensure that the planning efforts maximize CRS points. The Committee also
conversed over the natural floodplain functions in the City and 4 swash areas were notes but only one
has been piped so only three have to been maintained as natural floodplains.
Ms. Walton then outlined the next steps for completing the sign in online, continuing to assist with data
collection and flood source problematic areas. She asked for the Committee to continue to push out the
public participation survey as well and shared the plan website. No questions or comments were raised
by any of the Committee members. Ms. Walton then stated that the next meeting is planned for August.

City of Myrtle Beach Floodplain Management and Hazard Mitigation Plan 2020 Update
Meeting Minutes
Committee Meeting #3: Goals Meeting
August 12, 2020, 10:00AM to 12:00PM
WebEx Meeting
Margaret Walton, project manager with Atkins, opened the meeting by introducing herself and the topic
of the meeting for the day. She asked if there were any first-time participants and Katie Dennis from the
City of Conway, Mitch Combs from the Town of Surfside, and Ricky Loweder from Horry Electric. Ms.
Walton then provided a recap of the last meeting by touching on the overall hazard list and the hazard
profiles and the risks to the City, along with the impacts from flooding on life, safety, and public health.
Lastly, she reviewed the problem statements that were related to flood-prone areas that were
developed from the last meeting. Ms. Walton also gave an update on the public survey and reminded
the City that it would close on August 31, 2020.
Ms. Walton then reviewed some population and housing unit construction information that had been
collected from the U.S. Census and American Community Survey to look at trends in growth in the
communities that should be considered when thinking about hazard risk, especially flooding. During the
discussion, it was noted that the growth has been steady but slower growth than the City has seen in
past decades. New construction has slowed down but there are some developments that are expected.
Allison Hardin from the Committee stated she would craft a list of areas and/or subdivisions that are
developing or will be created in the near and long-term future. She stated that most of the
developments are expected within 5 years or less and that most untouched land is outside of the
jurisdiction of the City or is commercial property. The areas that were noted are as follows:
82nd west of intracoastal bypass – development plans approved by planning
commission stop just shy of 79th but there is more developable land in there with
development rights
On the north end there are a couple of tracks on Kings Highway and ocean/swash that
have had development interest
o Marina Parkway is in city limits that is going through development
o 1300 apartments are planned in that area
Petition for subdivision for 290 single family and town home lots off of Granddaddy Drive which is currently a wooded area that has existing lakes and there is opportunity to provide open space.
Development tracks in middle of the City that have no development but may see development in the future are outside of the city limits at this time
o Larger track off of Pine Island and has localized flooding
Proposed flood maps showed a lot of flood zones on former Air Force Base and is under development or planned for development
Finishing parts of Clemson Track development – under review for commercial shopping center

Arbor Glenn Planned Unit Development – planning commission required 570 units in development be brought up to future flood standards and used future flood map for property because has 100-foot wide drainage ditch through the middle and another 75-foot ditch as well
Area zoned for industrial development but there is no date for that development
Next, Ms. Walton moved to discuss future flooding conditions and the impacts of sea level rise and how
the goals should be formulated on the existing hazards. The goals were stated as needing to be broad
and provide a roadmap for the overall plan. The actions and projects should be based on trying to
accomplish the goals and every action should be directly linked back to at least one goal. She then
examined the goals in other City plans such as the Comprehensive Plan and asked if there were other
plans that should be evaluated. It was stated that there is currently a task in place to have Sea Level Rise
(SLR) goals reflected in the Comprehensive Plan and could that element be moved into the Floodplain
Management and Hazard Mitigation Plan. Upon, this Ms. Walton outlined all of the current goals in the
plan and a discussion followed of how to include SLR in the goals. It was decided that SLR would be
included in the hazards listed in Goal 1. The following edits were made to the existing goals:
Edit Goal 1 – add “sea level rise” to the end of listed hazards
Edit Goal 2 – change to “Preserve natural resources including…”
Edit Goal 4 – change to “a comprehensive public education and awareness”
Edit Goal 5 – under normal, future, and emergency conditions
Next the Committee, reviewed the problem statements to ensure that the goals were overarching and
could encompass the problems and suggest viable solutions. The group worked through this activity
collectively and were able to determine how the City was going to combat some of the current issues
surrounding flooding in the community. This also helped the group to begin thinking about potential
new mitigation actions.
Following this activity, Ms. Walton began a discussion of the hazard mitigation techniques and asked the
Committee members to engage in an open discussion of where they felt potential mitigation dollars
would best be spent. This flowed directly to examine the existing mitigation actions and a focus was
made on drainage projects and their importance for property protection. Ms. Walton shared that she
felt public education and awareness could easily be capitalized with minimal or no cost. Looking at the
existing mitigation actions, it was decided that any actions related to zoning ordinance or to gain CRS
points should be kept and expanded upon if possible. Emily Hardee, the City POC for the project, also
asked the Committee to review the existing mitigation actions.
Finally, the next steps were discussed, and all the attendees were asked to sign in online to the meeting.
Ms. Walton then adjourned the meeting.

City of Myrtle Beach Floodplain Management and Hazard Mitigation Plan 2020 Update
Meeting Minutes
Committee Meeting #4: Actions Meeting
September 30, 2020, 10:00AM to 12:00PM
WebEx Meeting
Margaret Walton, project manager with Atkins, welcomed the group and shared the agenda of the
meeting. She explained that we would go over the public survey results, review categories of possible
activities, and work collectively on new actions for the mitigation strategy portion of the plan.
Ms. Walton went over what discussion transpired during the third committee meeting focused on goals.
Specific growth and the projected development for the City was discussed. City plans that are already in
place were discussed for integration into this planning process. The overall plan goals were evaluated
and updated for finalization and lastly, the committee examined where to prioritize the different
categories of mitigation for the City.
Following the recap, Ms. Walton shared the final results of the public survey that was conducted. Three
hundred, thirty surveys were completed and returned from dissemination on FaceBook, LinkedIn,
Twitter, and a news site. The survey indicated that the bulk of the City’s population is either moderately
to extremely concerned about the possibility of being impacted by disaster. The hazards that were of
greatest concern were a tropical storm/hurricane, flood, and a wind event. Most of the individuals
surveyed felt as if they were moderately prepared in some form and that they were informed.
Additional highlights from the survey are below:
• 93% of respondents are interested in making their homes safer from hazards
• 66% have already taken action to make their homes safer from hazards
• 46% do not know who to contact regarding risks from hazards
The mitigation categories that were of highest importance were prevention, natural resource
protection, and emergency services.
Ms. Walton then took the time to review all of the mitigation action categories and possible actions and
activities that could be taken within each. She highlighted the categories that the committee choose as
their highest priority during the last meeting which were public education and awareness, prevention,
and natural resource protection. Next the committee engaged in an exercise to examine the pros and
cons of potential activities and if the activity was appropriate for implementation in the City. Ms. Walton
briefly explained some examples as well as the STAPLEE method that assessing each action’s feasibility
socially, technically, administratively, politically, legally, economically, and environmentally.
The next exercised that the committee worked through was the update of the existing actions for the
City. Ms. Walton explained exactly what type of progress needed to be noted for each activity along
with a corresponding implementation status. The committee discussed some of the outstanding updates
that needed to be corrected on the mitigation action table. Once the existing actions were updated, the

group moved to discuss the development of new mitigation actions. Ms. Walton looped the group back
to their initial priorities and reminded them to consider those when crafting new actions. The new
actions that were deliberated were a rain garden, permeable surface requirements, a public outreach
plan, and updating the flood ordinance. Understanding that the City is examining their redevelopment
and recovery for any major hazards, an open conversation was led to discuss how those pieces of
emergency management could easily be woven into this plan.
Finally, Ms. Walton discussed the next steps and outlined the action items for updates and development
of mitigation actions as well as the date for the next meeting. All the attendees were asked to sign in
online to the meeting. Ms. Walton then adjourned the meeting.

City of Myrtle Beach Floodplain Management and Hazard Mitigation Plan 2020 Update
Meeting Minutes
Committee Meeting #5: Draft Plan Meeting
October 21, 2020, 10:00AM to 12:00PM
WebEx Meeting
Margaret Walton, project manager from Atkins, opened up the meeting with a roll call to ensure that we
captured all of the attendees and reminded everyone to ensure they signed in for the committee
meetings they participated in previously.
Ms. Walton shared the project tasks that had taken place to develop the draft plan for review. She
highlighted the key objectives below and especially the one to maintain the City’s CRS status.
• Update the Hazard Mitigation Plan for Myrtle Beach
• Maintain mitigation funding and grant eligibility
• Identify potential projects
• Increase public awareness and education
• Maintain compliance with State and Federal requirements
• Maintain current CRS status
She also reminded the committee that another public outreach meeting would take place virtually
closer to the FEMA approval of the plan and final adoption by the City. The plan is slated to expire in
February so the FEMA approval pending adoption is expected in January as this draft plan will be sent in
early November.
In order to ensure that all of the major components of the plan are reviewed, Ms. Walton outlined the
hazard risk tiers and a lengthy discussion ensued. She noted that the bulk of the plan is the risk
assessment which consists of the hazard identification and analysis and the vulnerability assessment.
From this discussion, it was decided that the following changes would be implemented in the plan:
• Hailstorm would be moved to lower risk based on the lack of events in the last five years. • The airplane crash hazard would be separated into commercial airplane crashes at low risk and
small aircraft crashes into moderate risk. This was based on the information that private, smaller planes frequently fly over the ocean and crash on an annual basis; whereas, commercial jets flying into the Myrtle Beach airport are much less likely.
• Lightning was discussed and determined to be a moderate risk and as a separate hazard instead of grouping it with thunderstorms.
• The hazard of high wind was discussed and whether it should be included with thunderstorm; however, since it was ranked as high it was kept the same.
• The hazard of ice storm was changed to have the addition of winter weather and be moved to low risk as snow has only occurred twice in 20 years.

• Extreme heat was warranted as high risk and should be moved up from moderate due to the number of days the City experiences at high temperatures. The hospital representative agreed with that assessment based on the number of victims the hospital has based on extreme heat.
• The County representative noted that these hazard rankings were in alignment with the County’s rankings in their mitigation plan.
Ms. Walton also brought up the repetitive loss claims information within the plan. Previously, we have
included it within the flood profile as well as a map. She asked if the committee was comfortable with
continuing to include this information as long as individual property address were not included. It was
decided that this is beneficial and supports the City’s CRS program. It was also determined that knowing
where the repetitive loss issues occurs helps to focus on mitigating the problems. At this time, it was
also mentioned that if another change occurs in the City with doubling density in certain zones, then the
current land use plan would need to be amended thereby changing goal 6.
The committee continued to have a discussion on the general growth overall in the County and the
expectations for the City of Myrtle Beach. It was asked that this information from the County be
included in the plan and Ms. Walton suggested that it be included in the community profile section and
the flood profile in the hazard identification and analysis section of the plan. Committee member,
Allison Hardin, sent the information to the project POC, Emily Hardee, and Ms. Walton. It was noted that
the land use plans for the City would not be updated with this information until next year due to the lack
of staffing.
The dialogue then moved to the update of the mitigation actions with updating of the land use plan as
part of an existing action. It was decided that it could be included with action NRP-4 to indicate areas
that should not be developed for residential use.
The next action of discussion was the need for a resiliency element to be part of an action to meet the
requirements of the comprehensive plan under the new state Disaster Relief and Resilience Act 163 that
was signed into law in September.
Other newly proposed mitigation actions are from the annual report which are participating in the
annual update of the evacuation plan and drill that exercises the plan and updating GIS mapping based
on the recent hurricane seasons. It was noted that the County would be going through the next
Hurricane Evacuation Study in 2021 which will focus on areas of evacuation clearance times, evacuation
zone updates, and housing infrastructure.
The committee continued to walk through all of the existing items and provide updates to Ms. Walton
and Sara Seremak of Atkins. The changes were conducted in the mitigation action table concurrently. It
was stated that Atkins would clean up the actions and other sections of the plan and post them on a
google drive for review and comment by the committee during a two-week period.
Finally, Ms. Walton mentioned again that the second public meeting would be virtual and closer to 2
weeks near the actual plan approval date. The committee members were asked for any additional
feedback and hearing none the meeting concluded.

City of Myrtle Beach FMHMPC Meeting #1 Sign In
May 27, 2020
2:00 PM
Name Department/Organization
If you are a designee, which FMHMPC committee
member are you repsenting?
Are you a member
of the public? Phone number Email Address Comments/Questions
Matt Tumbleson
Grand Stand Medical Center – HCA,
Director of Emergency Preparedness &
Security Designee Yes 843-877-4877 [email protected] None
David J Victoria Jr
Tungsten Corporation, President; Horry
Georgetown Home Builders Association
Board of Directors, President Architect Yes 843-458-2265 [email protected]
Diane Moskow-McKenzie City Manager’s Office, Grant Support Not a committee member. An observer this time. No [email protected]
Margaret Murray City of Myrtle Beach GIS No 843-918-1201 [email protected] GIS/IT
Allison Hardin City of Myrtle Beach Planning, City Planner No 843-918-1059 [email protected] The "dept/org" field requires an email format - can y'all change that? :)
John Johnson
City of Myrtle Beach Public Works,
Engineering Division Superintendent No 843-918-2016 [email protected] Public Works Department
Emily Hardee
City of Myrlte Beach Construction Services,
Permit Services Supervisor and Floodplain
Coordinator Floodplain Coordinator No 843-918-1163 [email protected]
Karen Riordan
Myrtle Beach Area Chamber of Commerce,
President and CEO Yes 843-916-7241 [email protected] none at this time
Wanda F. Squires
Horry County Emergency
Management/Horry County Government n/a No 843-915-6926 [email protected]

City of Myrtle Beach FMHMPC Meeting #2 Sign In
June 25, 2020
2:00 PM
Name Department/Organization
If you are a designee, which FMHMPC committee
member are you repsenting?
Are you a member
of the public? Phone number Email Address Comments/Questions
Rob Wilfong Development Resource Group, LLC none Yes 843-839-3350 [email protected]
Wanda Squires Horry County Emergency Management No 843-915-6926 [email protected]
Bruce Arnel City of Myrtle Beach Emergency Mgt. No 843-385-2763 [email protected]
Katie Dennis City of Conway No 843-488-7852 [email protected]
Ashleigh Weatherly Weatherly Engineering LLC City of Myrtle Beach Yes 843-448-3428 [email protected]
Margaret Murray COMB No 843-918-1201 [email protected]
Matt Tumbleson Grand Strand Yes 843-692-4990 [email protected]
Wanda F. Squires Horry County Government No 843-915-6926 [email protected]
Karen M Riordan Myrtle Beach Area Chamber Yes 843-916-7241 [email protected]
Ashleigh Weatherly Weatherly Engineering LLC No 843-448-3428 [email protected]
Robert Wilfong Development REsource Group, LLC No Yes 843-839-3350 [email protected]
Valerie Rosser Insurance and Risk No 843-918-1007 [email protected]
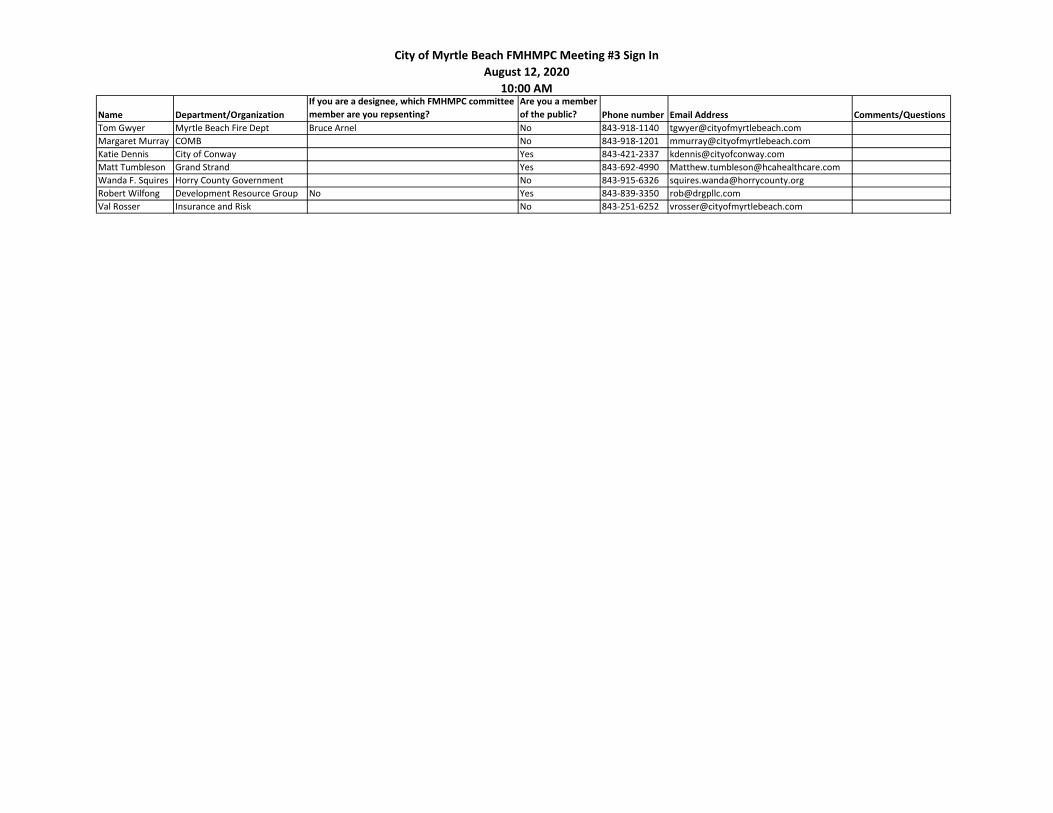
City of Myrtle Beach FMHMPC Meeting #3 Sign In
August 12, 2020
10:00 AM
Name Department/Organization
If you are a designee, which FMHMPC committee
member are you repsenting?
Are you a member
of the public? Phone number Email Address Comments/Questions
Tom Gwyer Myrtle Beach Fire Dept Bruce Arnel No 843-918-1140 [email protected]
Margaret Murray COMB No 843-918-1201 [email protected]
Katie Dennis City of Conway Yes 843-421-2337 [email protected]
Matt Tumbleson Grand Strand Yes 843-692-4990 [email protected]
Wanda F. Squires Horry County Government No 843-915-6326 [email protected]
Robert Wilfong Development Resource Group No Yes 843-839-3350 [email protected]
Val Rosser Insurance and Risk No 843-251-6252 [email protected]

City of Myrtle Beach FMHMPC Meeting #4 Sign In
September 30, 2020
10:00 AM
Name Department/Organization
If you are a designee, which FMHMPC committee
member are you repsenting?
Are you a member
of the public? Phone number Email Address Comments/Questions
Karen Riordan Myrtle Beach Area Chamber No 843-916-7241 [email protected]
Val Rosser City of Myrtle Beach No 843-464-1042 [email protected]
Ashleigh Weatherly, P.E. Weatherly Engineering, LLC No 843-448-3428 [email protected]
Emily Hardee City of Myrtle Beach Floodplain Coordinator No 843-455-1888 [email protected]
Thom Van Demark Myrtle Beach Fire Department/Acting EMD Rep No 843-918-1105 [email protected]
James P Clement Myrtle Beach Fire Department Tom Gwyer Yes 843-918-1109 [email protected]
Margaret Murray COMB No 843-918-1201 [email protected]
Matt Tumbleson Grad Strand Yes 843-692-4990 [email protected]
Rob Wilfong Development Resource Group, LLC No Yes 843-839-3350 [email protected]

City of Myrtle Beach FMHMPC Meeting #5 Sign In
October 21, 2020
10:00 AM
Name Department/Organization
If you are a designee, which FMHMPC committee
member are you repsenting?
Are you a member
of the public? Phone number Email Address Comments/Questions
Allison Hardin Planning No 843-918-1059 [email protected] thank you!
Val Rosser Insurance and Risk No 843-918-1007 [email protected]
James Clement / Fire Marshal Myrtle Beach Fire Department Tom Gwyer No 843-918-1109 [email protected] Thank you
Emily Hardee City of Myrtle Beach City of Myrtle Beach No 843-918-1163 [email protected]
Wanda F. Squires Horry County Emergency Management No 843-915-6926 [email protected]

Floodplain Management and Hazard Mitigation Plan - Public Meeting
Federal regulations require the City of Myrtle Beach to develop an updated, approvable Hazard Mitigation Plan at least every five years. The production of this Plan will not only enable the City of Myrtle Beach to be better prepared in the event of a disaster but will also permit us to retain the eligibility to apply for federal grant and disaster funding. This plan provides guidance for the City of Myrtle Beach’s jurisdictional development and construction in regard to flood prone areas and reducing risks to people and property from known hazards. It is important that the community be part of this process and provide valuable input on natural hazards, problems and possible solutions. If you have questions, please contact Emily Hardee, CFM, floodplain coordinator with the City of Myrtle Beach at 843-918-1163 or [email protected]. A copy of the current Floodplain Management and Hazard Mitigation Plan is located on the City’s website.
The City of Myrtle Beach Floodplain Management and Hazard Mitigation Committee will hold a
Public Hearing
Wednesday, June 3, 2020 1:00pm
Facebook live meeting

CONTACT:
Mark Kruea Office: (843) 918-1014 Mobile: (843) 450-1695 [email protected] www.cityofmyrtlebeach.com www.facebook.com/myrtlebeachcitygovernment
Media Advisory For a printable .pdf, visit https://www.cityofmyrtlebeach.com/government/docs/FridayFax.pdf.
To: Myrtle Beach Media
From: Public Information Department
Date: May 29, 2020
Re: Meeting Schedule and Agendas
1. Next week’s meeting schedule is attached.
2. Need information about the coronavirus emergency? You’ll find timely updates and
general information on our Coronavirus Advisory webpage.
3. Do you have city-related coronavirus questions? Call 843-918-1000. The telephone line
is available 24 hours a day, seven days a week.
4. A new Myrtle Beach Point of View blog post is now available. The post discusses the
Myrtle Beach Police Department’s plan of action to further enhance public safety. To read
the post, see https://myrtlebeachpointofview.wordpress.com/.
5. The Myrtle Beach Police Department reminds everyone that if you see something, say
something! Report suspicious activity year-round by calling the Myrtle Beach Police
Department’s non-emergency line at 843-918-1382. Callers can remain anonymous. Or,
send an email to [email protected]. In cases of emergency, call 911.
6. As part of the city’s underground utility conversion project, anticipate a road closure along a portion of Crabtree Lane on Monday, June 1. Detours signage will be posted.
7. Many Myrtle Beach city parks and facilities are now open. Social distancing signage
reminds visitors to maintain at least six feet of space. Below is the tentative reopening

schedule for the remaining facilities. The majority these facilities and activities are under the
effects of Governor McMaster’s orders. This list is subject to change.
Open Facilities
• All Parks
• City Hall
• Matt Hughes Skate Park
• Midway Park (Basketball activities are not permitted per the governor’s orders.)
• Municipal Court
• Myrtle Beach Tennis Center
• Myrtle’s Market
• Outdoor Pickleball Courts
• Outdoor Tennis Courts
• Public Works Administration Building
• Ted C. Collins Law Enforcement Center
Monday, June 1, 2020
• Ashley Booth Field (Public Enjoyment Only)
• Cabana Section Outdoor Exercise Equipment
• City Services Building (Pending Installation of Lobby Modifications)
• Doug Shaw Memorial Stadium (Public Enjoyment Only)
• Chapin Memorial Library (Revised Hours, Protocols)
• Grand Park Lake Outdoor Exercise Equipment
• Myrtle Beach Convention Center
• Myrtle Beach Sports Center
• Ned Donkle Field Complex
• Playgrounds and Picnic Shelters
Monday, June 15, 2020
• Crabtree Memorial Gymnasium (Members Only – Revised Hours, Protocols)
• Mary C. Canty Recreation Center (Members Only – Revised Hours, Protocols)
• Pepper Geddings Recreation Center (Members Only – Revised Hours, Protocols)
• Sports Tourism Baseball/Softball Activities (Practice is allowed per the governor’s orders beginning May 30.)
Awaiting Clarification/TBD
• All Indoor/Outdoor Basketball Activities
• General Robert H. Reed Recreation Center
• Grand Park Soccer Field and Hockey Rink
• Midway Park Outdoor Basketball Courts
• Pepper Geddings Recreation Center Outdoor Courts
• Myrtle Beach Train Depot (Closed to Rentals)
8. Chapin Memorial Library will reopen with revised service hours on Monday, June 1,
2020. The library’s zero contact pickup service will be available and encouraged. Virtual
programs will continue through the Chapin Memorial Library YouTube channel. City

personnel will maintain reduced capacity limits. Questions? Call 843-918-1275. New
facility hours are, as follows:
Monday through Thursday – 9:30 a.m. to 6:00 p.m.
Friday – 9:30 a.m. to 5:00 p.m.
Saturday – 9:30 a.m. to 1:00 p.m.
Sunday – Closed
9. Everyone’s invited to attend a ribbon cutting ceremony to celebrate the A10 Mountain
Bike Trail at 9:00 a.m., Saturday, June 6. The ceremony takes place at the trailhead next
to Barc Parc South, 676 Mallard Lake Drive. As part of a revitalization project, city team
members built five new bridges, widened the 1.2 mile trail and added directional signage.
For more information, contact Troy Marron at [email protected].
10. Looking ahead to June 15, Crabtree Memorial Gymnasium, Mary C. Canty Recreation
Center and Pepper Geddings Recreation Center will reopen to members with revised
hours. The reopening applies to the facilities’ weight rooms, cardio rooms and indoor
track. Members are limited to 30-minute workouts. Basketball courts remain closed. City
personnel will maintain reduced capacity limits. Showers will not be available for use, and
pools will remain closed. Exercise classes will not yet resume; however, virtual classes will
continue through the City of Myrtle Beach – Parks, Recreation and Sports Tourism YouTube
channel. Recreation membership dues have been suspended until mid-August. New facility
hours are, as follows:
Monday through Friday – 5:30 a.m. to 7:00 a.m., 5:00 p.m. to 7:00 p.m. Saturday and Sunday – 8:30 a.m. to 1:00 p.m.
11. Myrtle Beach needs your feedback! The city is engaged in a planning process to become
less vulnerable to disasters caused by natural and man-made hazards. Participation in the
Hazard Mitigation Plan Five Year Update survey is an important part of that process. The
survey deadline is June 30, 2020. For more information, contact Emily Hardee at
12. The 2020 Water Quality Report is now available. Myrtle Beach’s drinking water meets or
exceeds all state and federal water quality standards. To view or download the annual report,
visit https://www.cityofmyrtlebeach.com/waterqualityreport.pdf.
13. Would you like to serve on a volunteer board, commission or committee for the City of
Myrtle Beach? To be considered for one of these volunteer positions, submit a letter of
interest and a brief biography or résumé to the City Clerk, P.O. Box 2468, Myrtle Beach, SC
29578. Or, send an email to [email protected]. If you'd like to deliver it in-
person, bring all materials to City Hall, 937 Broadway Street, Myrtle Beach, SC 29577. The
following boards, commissions and committees have vacancies....
• Cemetery Committee (4 seats)
• Cultural Resources Committee (1 seat)
• Employee Recognition Committee (1 seat)
• Myrtle Beach Air Force Base Redevelopment Authority (2 seats)

• Myrtle Beach Convention Center Hotel Board (2 seats)
• Recreation Advisory Committee (7 seats)
• Standard Code Board of Adjustments and Appeals (5 seats)
• Tourism Committee (5 seats)
14. The online E-Resources webpage is available on the city’s website. City buildings are
closed to the public, but we are working to provide online content for all ages. On the
webpage, you’ll find creative and educational options for you and your family to enjoy!
15. Most activities for the next few weeks have been rescheduled, but we still maintain a
comprehensive list on our Events webpage. This file of city-related festivals, programs and more is updated weekly.
16. One of Myrtle Beach’s pocket neighborhood parks features a Keep America Beautiful
monument from 1989, and that’s the subject of our Photos of the Week. Ocean Forest
Memorial Park at the intersection of Porcher Drive and Haskell Circle was built in the mid-
1980s. Later that decade, the city was involved in the Keep America Beautiful campaign,
and a monument with local supporters’ names was installed. Here are photos of this pretty
park and its historic marker, which features a Who’s Who of prominent Myrtle Beach
families from 40 years ago.
17. Did you know... That Myrtle Beach’s Ocean Forest Hotel, built in 1929 and demolished in
1974, was known as the “million dollar hotel” and drew famous guests and performers from
around the country? The 10-story hotel, with five-story side wings, was a landmark on North
Ocean Boulevard, across from the cabana section. Built by the Woodside family, the hotel’s
grand opening occurred in February 1930, four months after the stock market crash of
October 1929. It changed hands several times through the decades and eventually was razed,
instead of being remodeled, in 1974.
For more information, contact:
Mark Kruea, Public Information Officer, City of Myrtle Beach (843) 918-1014 voice (843) 450-1695 mobile https://www.cityofmyrtlebeach.com https://www.facebook.com/myrtlebeachcitygovernment https://twitter.com/MyrtleBeachGov https://www.instagram.com/myrtlebeachgov/

CITY OF MYRTLE BEACH MEETING SCHEDULE
June 1-7, 2020
MONDAY, JUNE 1
• 8:30 a.m. – Staff Meeting, Myrtle Beach Train Depot, 851 Broadway Street
TUESDAY, JUNE 2
• 8:30 a.m. – Bicycle and Pedestrian Committee, Myrtle Beach Train Depot, 851
Broadway Street
• 10:00 a.m. – Community Appearance Board Staff Plan Review, Conference Room, City Services Building, 921 North Oak Street
• 1:30 p.m. – Planning Commission, Myrtle Beach Train Depot, 851 Broadway Street
WEDNESDAY, JUNE 3
• 9:00 a.m. to 3:00 p.m. – Myrtle’s Market, 605 Mr. Joe White Avenue
• 1:00 p.m. – Floodplain Management and Hazard Mitigation Five Year Review Meeting and Public Hearing, Conference Call (Streamed on Myrtle Beach City Government Facebook Page)
THURSDAY, JUNE 4
• 9:00 a.m. – City Council Workshop and Mini Budget Retreat, Council Chamber, Ted C. Collins Law Enforcement Center, 1101 North Oak Street
• 1:30 p.m. – Community Appearance Board, Conference Room, Conference Call
(Streamed on Neighborhood Services Department Facebook Page)
FRIDAY, JUNE 5
• 9:00 a.m. to 3:00 p.m. – Myrtle’s Market, 605 Mr. Joe White Avenue
SATURDAY, JUNE 6
• 9:00 a.m. to 3:00 p.m. – Myrtle’s Market, 605 Mr. Joe White Avenue
• 9:00 a.m. – A10 Mountain Bike Trail Ribbon Cutting Ceremony, A10 Trailhead at Barc Parc South, 676 Mallard Lake Drive
SUNDAY, JUNE 7
• No Meetings Scheduled

City of Myrtle Beach Bicycle and Pedestrian Committee 8:30 a.m., Tuesday, June 2, 2020
Myrtle Beach Train Depot
851 Broadway Street, Myrtle Beach, SC 29577
IN KEEPING WITH COVID-19 GUIDELINES, CHAIRS IN THE MYRTLE BEACH TRAIN DEPOT WILL BE PLACED 6 FEET APART. PLEASE RESPECT DISTANCING GUIDELINES
AND DO NOT MOVE THE CHAIRS.
ANYONE WHO REQUIRES AN AUXILIARY AID OR SERVICE FOR EFFECTIVE COMMUNICATION OR PARTICIPATION SHOULD CONTACT 843-918-1050 AS SOON AS
POSSIBLE, BUT NO LATER THAN 48 HOURS BEFORE THE SCHEDULED EVENT.
A. Call to Order – Chairman Snow
B. Matters of Order
1. Approval of Minutes – March 3, 2020
C. Implementation Items
1. New Directions Report – Becky Billingsley 2. 2020 J1 Program Report – Tim Rollings 3. Bike Rack Placement – Chairman Snow
D. New Business
1. Perrin's Path Improvements – Nick Peters 2. Sidewalk Education – Chairman Snow
3. Where the Sidewalk Ends Project – Bill Pritchard, Planning Commission Chairman 4. A10 Mountain Bike Trail Ribbon Cutting Ceremony – Troy Marron
E. Non Agenda Items
F. Important Dates
1. A10 Mountain Bike Trail Ribbon Cutting Ceremony – 9:00 a.m., Saturday, June 6, 2020 2. Bicycle and Pedestrian Committee Meeting – 8:30 a.m., Tuesday, July 7, 2020
G. Adjourn

City of Myrtle Beach Community Appearance Board Staff Plan Review
10:00 a.m., Tuesday, June 2, 2020 Conference Room, City Services Building
921 North Oak Street, Myrtle Beach, SC 29577
ANYONE WHO REQUIRES AN AUXILIARY AID OR SERVICE FOR EFFECTIVE COMMUNICATION OR PARTICIPATION SHOULD CONTACT 843-918-1111 AS SOON AS
POSSIBLE, BUT NO LATER THAN 48 HOURS BEFORE THE SCHEDULED EVENT.
A. Roll Call
B. Approval of Minutes: May 19, 2020, Meeting
C. Old Business
D. New Business:
Sign, Lighting and Building Permit Applications
1. Charlotte Painting Co., Inc., D/B/A Pro-Tec Weatherproofing – 900 Highway 501, Unit B: Requests approval of (1) 8’w x 4’h flat vinyl sign on a metal panel mounted to building and (1) 4’2”w x 3’h flat acrylic panel sign mounted on freestanding sign. In addition, requests a conceptual/final review for the repainting of the building. (Owner)
2. Homewood Suites – 302 Seaboard Street: Requests approval of (9) Santee Cooper pole mounted LED lights installed in the parking lot, (7) pole mounted lights around the pool deck and (29) building mounted lights. (Dargan Construction/United Electric/Santee Cooper)
3. Myrtle Beach Treatment Specialists – 1637 Plaza Place: Requests approval of (5) Santee Cooper pole mounted parking lot lights and (13) building mounted lights. In addition, requests a conceptual/final review for a 4,845 square foot out-patient clinic building, dumpster enclosure, parking and landscape plan. (e3 Studio/Santee Cooper)
Building Permit Applications
1. Pinewood Estates – 405 72nd Avenue North: Requests a final review for an apartment building with (8) dwelling units (2-baths and 2-beds each) dumpster enclosure, parking and landscape plan. (Previously heard on 05/21/2020.)(Nick Nye, AIA/Rowe Professional Services Company)
2. Grande Cayman Resort – 7200 North Ocean Boulevard: Requests a conceptual/final
review for a 4’h bronze aluminum fence. (Action Fence Company)
3. Seabreeze – 2402 Seabreeze Place: Requests a conceptual/final review for a 6’h white vinyl privacy fence. (The Fence Co.)
4. 2nd Avenue Beach House – 201 North Ocean Boulevard: Requests a conceptual/final review for new roof shingles and a 4’h white aluminum picket fence.
(Owner)

5. Tidal Creek Brewery – 3421 Knoles Street: Requests a conceptual/final review for additional fencing, new pergola and landscape plan. (trudesign studio)
6. Latitude at the Commons – 2222 Crow Lane: Requests a conceptual/final review for
an addition to the fitness room and additional fencing. (Ayres & Associates Architects, Inc.)
7. North Industrial Lot 55 (Stone Corp. Warehouse) – 1583 American Way: Requests a conceptual/final review for a 7,825 square foot office-warehouse, dumpster enclosure, parking and landscape plan. (B Design)
8. The Fun Plex Myrtle Beach – 1405 North Ocean Boulevard: Requests a conceptual/final review for an amusement project consisting of a main food and drink structure, (4) maintenance/storage structures, (2) ticket booths, black aluminum picket fence, black chain-link fence, parking and landscape plan. (IDeA Insight Design Architects/DRG, LLC, Development Resource Group)
9. Grissom Tract Multifamily – Marina Parkway: Requests a conceptual review for (9) apartment buildings, (2) carriage buildings, (3) garage buildings, clubhouse, trash compactor enclosure, pool, pool fence, parking and landscape plan. (Dynamic Design/Thomas & Hutton Engineering Co.)
E. Non-Agenda Items from Staff
F. Adjournment

City of Myrtle Beach Planning Commission
1:30 p.m., Tuesday, June 2, 2020 Myrtle Beach Train Depot
851 Broadway Street, Myrtle Beach, SC 29577
IN KEEPING WITH COVID-19 GUIDELINES, CHAIRS IN THE MYRTLE BEACH TRAIN DEPOT WILL BE PLACED 6 FEET APART. PLEASE RESPECT DISTANCING GUIDELINES AND DO NOT MOVE THE CHAIRS. ALL AUDIENCE MEMBERS ARE REQUIRED TO SIGN
IN, PROVIDE A CELL PHONE NUMBER AND INDICATE THEIR AGENDA ITEM OF INTEREST. THEY WILL THEN BE ASKED TO RETURN TO THEIR CARS, WHERE THEY
WILL BE NOTIFIED WHEN THEIR AGENDA ITEM IS COMING UP FOR DISCUSSION AND THEY MAY ENTER THE DEPOT.
ANYONE WHO REQUIRES AN AUXILIARY AID OR SERVICE FOR EFFECTIVE COMMUNICATION OR PARTICIPATION SHOULD CONTACT 843-918-1050 AS SOON AS
POSSIBLE, BUT NO LATER THAN 48 HOURS BEFORE THE SCHEDULED EVENT.
A. Call Meeting to Order
B. Matters of Order:
1. Approval of Minutes – May 19, 2020
C. Matters of Business:
1. **PUBLIC HEARING** TEXT 20-06 Restaurant, Office in LM: Proposal by Carolina
Coastal Investors, LLC, owners of 1229 Shine Avenue, to add restaurant and administrative offices to the list of permitted uses in the LM (Light Manufacturing) zoning district.
2. **PUBLIC HEARING** TEXT 20-07 Warehouse/Indoor Storage in Centre Pointe: Proposal by Thomas & Hutton to amend the Centre Pointe Planned Unit
Development (PUD), Appendix D (Uses), to add the conditional use “indoor storage” in the MU-2 development tract.
3. PRE-FIN 20-10 Firehouse Roundabout: Proposal by Thomas & Hutton (Walter Warren, agent) to subdivide four parcels totaling approximately 116 acres on Coventry Boulevard and Hwy 17 (PIN #447-00-00-0007, #447-00-00-0008, #447-03-04-0078 and #447-06-01-0039) to extend Kingfisher Drive, and to create separate parcels for the roundabout and the Fire Station site.
4. **PUBLIC HEARING** STN 20-07 Kingfisher Drive: Proposal by Thomas & Hutton to
name a new extension of Kingfisher Drive in Belle Harbor.
5. **PUBLIC HEARING** STN 20-04 Pine Lakes Preserve: Proposal by Thomas & Hutton to name six new streets in Pine Lakes Preserve with the following names: “Bristlecone Place, Canary Island Court, Whitebark Drive, Shortleaf Path, Lacebark Trail and Knobcone Loop.”
6. PRE-FIN 20-06 Summit at Meridian, Phase 2: Proposal by Earthworks Group to divide
13.8 acres off Emory Road (PIN #442-00-00-0033) into 51 single family residential lots and the extension of Orion Loop. This is a re-certification of a subdivision action

approved by the Planning Commission on 08/21/18. Planning Commission approval expired on 08/21/19.
7. **PUBLIC HEARING** Z 20-02 Hwy 15 Townhomes: Proposal by Earthworks Group to rezone approximately 0.51 acres on Swann Curve (PIN #443-06-01-0016) from RMM (Multifamily Medium Density) to MUM (Mixed Use Medium Density) to combine with the adjacent MUM parcel in order to build townhomes.
8. **PUBLIC HEARING** STN 20-06 Tip Top Lane: Proposal by Earthworks Group to name a private drive at Highway 15 Townhomes “Tip Top Lane.”
9. **PUBLIC HEARING** STN 20-05 Lively at Grande Dunes: Proposal by Orange Capital Advisors to name two private drives in The Lively at Grande Dunes with the following names: “Bombay Lane and Braggs Way.”
10. **PUBLIC HEARING** ENC 20-02 The Cape: Proposal by Cape Dutch, LLC, to encroach into city-owned Pond P5 (PIN 1650001426) with portions of landscape beds, walls and a concrete sidewalk in order to beautify a city property.
D. Presentations
E. Communications from the Planning Commission
F. Reports and Information Presentation from City Staff
G. Executive Session – The commission may take action on items discussed during Executive Session, once the Executive Session ends and the Public Session resumes.
H. Meeting Adjournment

City of Myrtle Beach Floodplain Management and Hazard Mitigation Five Year Plan Review and Public Hearing
1:00 p.m., Wednesday, June 3, 2020 Conference Call
NOTE: Federal regulations require the City of Myrtle Beach to develop an updated, approvable Hazard Mitigation Plan every five years. The production of this plan will not only enable the City of Myrtle Beach to be better prepared in the event of a disaster, but it also permits us to retain eligibility to apply for federal grant and disaster funding. This plan provides guidance for the City of Myrtle Beach’s jurisdictional development and construction in regards to flood prone
areas and reduces the risks to people and property from known hazards. It is important that the community be part of this process and provides valuable input on natural hazards, problems and possible solutions. If you have questions or wish to provide public input, contact Emily
Hardee at 843-918-1163 or [email protected]. A copy of the current Floodplain Management and Hazard Mitigation Plan is located on the city’s website. The conference call and public hearing will be streamed live on the Myrtle Beach City Government Facebook page.
ANYONE WHO REQUIRES AN AUXILIARY AID OR SERVICE FOR EFFECTIVE COMMUNICATION OR PARTICIPATION SHOULD CONTACT 843-918-1111 AS SOON AS
POSSIBLE, BUT NO LATER THAN 48 HOURS BEFORE THE SCHEDULED EVENT.
A. Introduction
B. Overview of Mitigation Planning
C. Project Overview
1. Planning Process 2. Hazard Mitigation Planning Committee
3. Project Schedule
D. Next Steps
E. Questions and Concerns
F. Adjourn

MYRTLE BEACH CITY COUNCIL WORKSHOP 9:00 A.M., THURSDAY, JUNE 4, 2020
COUNCIL CHAMBER, TED C. COLLINS LAW ENFORCEMENT CENTER 1101 NORTH OAK STREET, MYRTLE BEACH, SC 29577
NOTE: CITIZENS ARE INVITED TO ATTEND AND PARTICIPATE IN THE MEETINGS.
CITIZENS WHO WISH TO ADDRESS COUNCIL ON NON-AGENDA ISSUES ARE ASKED TO SIGN IN PRIOR TO THE START OF THE MEETING AND STATE THEIR NAMES PRIOR TO
SPEAKING. A TOTAL OF 30 MINUTES WILL BE PROVIDED AT THE END OF THE MEETING.
ANYONE WHO REQUIRES AN AUXILIARY AID OR SERVICE FOR EFFECTIVE COMMUNICATION OR PARTICIPATION SHOULD CONTACT THE CITY CLERK’S OFFICE AT (843) 918-1004 AS SOON AS POSSIBLE, BUT NO LATER THAN 48 HOURS BEFORE
THE SCHEDULED EVENT.
A. Mayor and Council Welcome and Statement of the Meeting’s Purpose
B. Reports from City Staff
1. Mini Budget Retreat
a. Opening Remarks – City Manager
b. Background Information – Chief Financial Officer c. Fiscal Year 2019-20 – Weathering the Pandemic
• Flexibility
• Strategies Used and Strategies Avoided
• Rate, Fees and Property Tax Increase Proposals
• Service Implications – Limited New Services
• Solid Waste Cost Reallocations d. Fiscal Year 2021-25 – Capital Improvements Program (CIP)
• Overall CIP Theme
• CIP Review
• Stormwater Update
• Transfer Station Update
2. Public Safety Update
3. COVID-19 Update
C. City Council Discussion Items
1. Drainage Issue – Corner of Woodside Avenue and Calhoun Road
2. Improvement Progress – 9/11 Memorial
D. Public Input (three-minute limit per speaker; maximum of 30 minutes)
E. Executive Session*
F. Adjournment

*NOTE: South Carolina law requires that Council’s business is conducted in public with limited exceptions, known as “Executive Sessions.” Subjects eligible for Executive Session include:
• Personnel matters.
• Negotiations concerning proposed contractual arrangements and proposed sale or purchase of property.
• The receipt of legal advice relating to:
– A pending, threatened, or potential claim. – Other matters covered by the attorney-client privilege. – Settlement of legal claims, or the position of the city in other adversary situations.
• Discussions regarding development of security personnel or devices.
• Investigative proceedings regarding allegations of criminal misconduct.
• Matters relating to the proposed location, expansion, or provision of services encouraging location or expansion of industries or other businesses.
Motions to go into Executive Session must be made in public and specify one or more of the reasons above. Council takes no votes or action in Executive Session. Council may take action on matters discussed in Executive Session which are deemed to be “emergency” concerns upon reconvening in open session.

City of Myrtle Beach Community Appearance Board
1:30 p.m., Thursday, June 4, 2020 Conference Call
NOTE: CITIZENS ARE INVITED TO WATCH THE CONFERENCE MEETING LIVE
ON THE NEIGHBORHOOD SERVICES DEPARTMENT’S FACEBOOK PAGE, https://www.facebook.com/combneighborhoodservices/.
ANYONE WHO REQUIRES AN AUXILIARY AID OR SERVICE FOR EFFECTIVE COMMUNICATION OR PARTICIPATION SHOULD CONTACT 843-918-1111 AS SOON AS
POSSIBLE, BUT NO LATER THAN 48 HOURS BEFORE THE SCHEDULED EVENT.
A. Roll Call
B. Approval of Minutes: May 21, 2020, Meeting
C. Old Business
D. New Business:
Sign Permit Applications
1. Portside at Grande Dunes Phase II – 901 Portside Drive: Requests approval of (3) 4’w x 5’1”h freestanding directional signs. (Tyson Sign Company)
2. Forest Dunes – 5511 North Ocean Boulevard: Requests approval of (1) 6’w x 5’7”h externally lit monument sign to replace existing freestanding sign. (Seaboard Signs)
3. Metro by T-Mobile – 1011 Highway 501: Requests approval of (1) 5’1”w x 2’2”h internally lit channel letters on a raceway mounted to building and (1) 6’w x 2’h sign face in existing multi-tenant freestanding sign. (ASL Sign Services)
4. Circle K – 3305 North Kings Highway: Requests approval of the rebranding of the existing Circle K signage to include (1) 3’6”w x 2’6” sign face, (1) 3’6”w x 2’6”h fuel price sign face on the existing freestanding sign that will be lowered to 14’ overall height, (2) 2’11”w x 3’6”h canopy signs, rebranding of the fuel pump canopy and (3) fuel pumps. (Skyline Signs)
5. Nikki Cole’s Hair Design – 3401 North Kings Highway, Unit C: Requests approval of
(1) 7’w x 7’h vinyl lettering applied to a newly replaced awning on building façade. New awning was replaced to match the original color and material. (Atlantic Custom Designz)
6. Shoreline Parking Solutions – 703 North Ocean Boulevard: Requests approval of
(1) 3’w x 5’h flat aluminum sign with vinyl graphics applied to kiosk. (Owner)
Sign, Lighting and Building Permit Applications
1. Charlotte Painting Co., Inc., D/B/A Pro-Tec Weatherproofing – 900 Highway 501, Unit B: Requests approval of (1) 8’w x 4’h flat vinyl sign on a metal panel mounted to building and (1) 4’2”w x 3’h flat acrylic panel sign mounted on freestanding sign. In addition, requests a conceptual/final review for the repainting of the building. (Owner)

2. Homewood Suites – 302 Seaboard Street: Requests approval of (9) Santee Cooper pole mounted LED lights installed in the parking lot, (7) pole mounted lights around the pool deck and (29) building mounted lights. (Dargan Construction/United Electric/Santee Cooper)
3. Myrtle Beach Treatment Specialists – 1637 Plaza Place: Requests approval of (5) Santee Cooper pole mounted parking lot lights and (13) building mounted lights. In addition, requests a conceptual/final review for a 4,845 square foot out-patient clinic building, dumpster enclosure, parking and landscape plan. (e3 Studio/Santee Cooper)
Building Permit Applications
1. Pinewood Estates – 405 72nd Avenue North: Requests a final review for an apartment building with (8) dwelling units (2-baths and 2-beds each) dumpster enclosure, parking and landscape plan. (Previously heard on 05/21/2020.)(Nick Nye, AIA/Rowe Professional Services Company)
2. Grande Cayman Resort – 7200 North Ocean Boulevard: Requests a conceptual/final review for a 4’h bronze aluminum fence. (Action Fence Company)
3. Seabreeze – 2402 Seabreeze Place: Requests a conceptual/final review for a 6’h white vinyl privacy fence. (The Fence Co.)
4. 2nd Avenue Beach House – 201 North Ocean Boulevard: Requests a conceptual/final review for new roof shingles and a 4’h white aluminum picket fence. (Owner)
5. Tidal Creek Brewery – 3421 Knoles Street: Requests a conceptual/final review for additional fencing, new pergola and landscape plan. (trudesign studio)
6. Latitude at the Commons – 2222 Crow Lane: Requests a conceptual/final review for an addition to the fitness room and additional fencing. (Ayres & Associates Architects, Inc.)
7. North Industrial Lot 55 (Stone Corp. Warehouse) – 1583 American Way: Requests a conceptual/final review for a 7,825 square foot office-warehouse, dumpster enclosure, parking and landscape plan. (B Design)
8. The Fun Plex Myrtle Beach – 1405 North Ocean Boulevard: Requests a conceptual/final review for an amusement project consisting of a main food and drink structure, (4) maintenance/storage structures, (2) ticket booths, black aluminum picket fence, black chain-link fence, parking and landscape plan. (IDeA Insight Design Architects/DRG, LLC, Development Resource Group)
9. Grissom Tract Multifamily – Marina Parkway: Requests a conceptual review for (9) apartment buildings, (2) carriage buildings, (3) garage buildings, clubhouse, trash compactor enclosure, pool, pool fence, parking and landscape plan. (Dynamic Design/Thomas & Hutton Engineering Co.)
E. Non-Agenda Items from Staff
F. Non-Agenda Items from Board Members

G. Executive Session: The board may take action on items discussed during Executive Session, once the Executive Session ends and the Public Session resumes.
H. Adjournment


Virtual Public Meeting #1 Facebook Posting

Public Survey Twitter Posting

Public Survey Facebook Posting

Public Survey LinkedIn Posting

CITY OF MYRTLE BEACH MEETING SCHEDULE
June 22-29, 2020
MONDAY, JUNE 22
8:30 a.m. – Staff Meeting, Myrtle Beach Train Depot, 851 Broadway Street TUESDAY, JUNE 23
9:00 a.m. – City Council Workshop, Council Chamber, Ted C. Collins Law Enforcement
Center, 1101 North Oak Street
10:00 a.m. – City Council Meeting, Council Chamber, Ted C. Collins Law Enforcement
Center, 1101 North Oak Street WEDNESDAY, JUNE 24
9:00 a.m. to 3:00 p.m. – Myrtle’s Market, 605 Mr. Joe White Avenue
10:00 a.m. – Special Events Technical Review, Myrtle Beach Train Depot, 851
Broadway Street
2:00 p.m. – Beach Advisory Committee, Conference Call (Streamed on Myrtle Beach
City Government Facebook Page) THURSDAY, JUNE 25
9:00 a.m. to 12:00 p.m. – Technology Advisory Group hosts Free Angel Investing
Session, Virtual Event
2:00 p.m. – Floodplain Management and Hazard Mitigation Five Year Plan Update
Meeting, Conference Call (Streamed on Myrtle Beach City Government Facebook Page) FRIDAY, JUNE 26
9:00 a.m. to 3:00 p.m. – Myrtle’s Market, 605 Mr. Joe White Avenue
SATURDAY, JUNE 27
9:00 a.m. to 3:00 p.m. – Myrtle’s Market, 605 Mr. Joe White Avenue SUNDAY, JUNE 28
6:00 p.m. – Neighborhood Services Department hosts Beachside Chats: Discussion on Race and Healing, Chapin Park, 1410 North Kings Highway


1
Seremak, Sara R
From: Emily Hardee <[email protected]>
Sent: Wednesday, August 12, 2020 8:28 AM
To: Walton, Margaret M
Subject: FW: Friday Fax
Follow Up Flag: Follow up
Flag Status: Flagged

2
CITY OF MYRTLE BEACH
MEETING SCHEDULE August 10-16, 2020
MONDAY, AUGUST 10
8:30 a.m. – Staff Meeting, Conference Call TUESDAY, AUGUST 11
9:00 a.m. – City Council Workshop, Council Chamber, Ted C. Collins Law Enforcement Center, 1101 North Oak Street
10:00 a.m. – City Council Meeting, Council Chamber, Ted C. Collins Law Enforcement Center, 1101 North Oak Street
WEDNESDAY, AUGUST 12
9:00 a.m. to 3:00 p.m. – Myrtle’s Market, 605 Mr. Joe White Avenue
10:00 a.m.- Floodplain Management and Hazard Mitigation Plan update committee Webex meeting.
THURSDAY, AUGUST 13
1:30 p.m. – Board of Zoning Appeals, Conference Call (Streamed on the Myrtle Beach City Government Facebook Page)
FRIDAY, AUGUST 14
9:00 a.m. to 3:00 p.m. – Myrtle’s Market, 605 Mr. Joe White Avenue
SATURDAY, AUGUST 15
9:00 a.m. to 3:00 p.m. – Myrtle’s Market, 605 Mr. Joe White Avenue SUNDAY, AUGUST 16
No Meetings Scheduled

3
MYRTLE BEACH CITY COUNCIL MEETING
TUESDAY, AUGUST 11, 2020 9:00 A.M. – WORKSHOP – TED C. COLLINS LAW ENFORCEMENT CENTER 10:00 A.M. – MEETING – TED C. COLLINS LAW ENFORCEMENT CENTER
1101 NORTH OAK STREET, MYRTLE BEACH, SC 29577
NOTE: CITIZENS ARE INVITED TO ATTEND AND PARTICIPATE IN THE MEETINGS. CITIZENS WHO WISH TO ADDRESS COUNCIL ON NON-AGENDA ISSUES ARE ASKED TO SIGN IN PRIOR TO THE START OF THE MEETING AND STATE THEIR NAMES PRIOR TO SPEAKING. A TOTAL OF 30 MINUTES WILL BE PROVIDED AT THE END OF
THE MEETING.
ANYONE WHO REQUIRES AN AUXILIARY AID OR SERVICE FOR EFFECTIVE COMMUNICATION OR PARTICIPATION SHOULD CONTACT THE CITY CLERK’S OFFICE AT (843) 918-1004 AS SOON AS POSSIBLE, BUT
NO LATER THAN 48 HOURS BEFORE THE SCHEDULED EVENT. CALL TO ORDER INVOCATION PLEDGE OF ALLEGIANCE APPROVAL OF AGENDA APPROVAL OF MINUTES… July 28, 2020 PUBLIC REQUESTS, PRESENTATIONS, AWARDS, MEMORIALS:
1. Gold Cap Ambassador Program Introduction – Brian Schmitt 2. Carolina Country Music Festival Update – Amie Lee and Bob Durkin 3. Public Information Update – PIO Staff
CONSENT AGENDA – The Consent Agenda covers items anticipated to be routine in nature. Any Councilmember may ask that an item be moved from the Consent Agenda to the Regular Agenda for lengthier discussion, or a member of the public may request that such an item be moved. Items remaining on the Consent Agenda will be briefly described by staff and may be passed as a group with the approval of the agenda. Note: City laws are known as ordinances. Before a city ordinance can be enacted, it must be introduced (1st Reading) and then approved (2nd Reading). Resolutions are actions through which City Council reinforces or makes policy not rising to the level of law. Motions are related to direction from City Council to city staff to take certain actions.
NO ITEMS LISTED ON THE CONSENT AGENDA. REGULAR AGENDA
1st Reading Ordinance 2020-037 providing for: the issuance and sale of not exceeding $5,500,000 General Obligation Bonds, Series 2020A, of the City of Myrtle Beach, South Carolina; fixing the form and details of the bonds; authorizing the City Manager to determine certain matters relating to the bonds; providing for the payment of the bonds and the disposition of the proceeds thereof; and, other matters relating thereto. These general obligation bonds will be issued to finance the construction and equipment needed for a new solid waste transfer station. The current transfer station includes a mechanical compactor that frequently malfunctions. The new station will be a top-loading station that does not include a compactor. At times, repairs to the station have resulted in limiting the city’s ability to accept waste materials, and having to stockpile certain materials on-site. The new site will also include a composting area as well as a convenience center. Construction of this facility is anticipated to begin in December.
1st Reading Ordinance 2020-038 providing for: the issuance and sale of not exceeding $14,500,000 General Obligation Refunding Bonds, Series 2020B, of the City of Myrtle Beach, South Carolina; fixing the form and details of the bonds; authorizing the city manager to determine certain matters relating to the bonds;

4
providing for the payment of the bonds and the disposition of the proceeds thereof; and, other matters relating thereto. This ordinance authorizes the current refunding of Series 2011B GO Refunding Bonds and Series 2015A Refunding Bonds (2001 Referendum Bonds). The amortization schedule for the refunding bonds does not extend beyond the current maturity dates of the refunded bonds. This ordinance is one of three refunding issues proposed to reduce debt service costs. Total debt service savings for these three issues are expected to be about $100,000/year, or about $685,000 (8.5%) net present value savings. 1st Reading Ordinance 2020-039 providing for: the issuance and sale of not exceeding $7,200,000 General Obligation Refunding Bonds, Series 2020C, of the City of Myrtle Beach, South Carolina; fixing the form and details of the bonds; authorizing the city manager to determine certain matters relating to the bonds; providing for the payment of the bonds and the disposition of the proceeds thereof; and, other matters relating thereto.
This ordinance authorizes the current refunding of Series 2015C GO Refunding Bonds, which refunded the Series 2008A bonds (under 8% debt limit). The amortization schedule for the refunding bonds does not extend beyond the current maturity dates of the refunded bonds. This ordinance is one of three refunding issues proposed to reduce debt service costs. Total debt service savings for these three issues are expected to be about $100,000/year, or about $685,000 (8.5%) net present value savings. 1st Reading Ordinance 2020-040 providing for: the issuance and sale of not exceeding $6,100,000 General Obligation Refunding Bonds (federally taxable), Series 2020D, of the City of Myrtle Beach, South Carolina; fixing the form and details of the bonds; authorizing the city manager to determine certain matters relating to the bonds; providing for the payment of the bonds and the disposition of the proceeds thereof; and, other matters relating thereto. This ordinance approves an advance refunding of Series 2012B to finance HVAC improvements to the Convention Center (original issue was taxable and issued under 8% debt limit). The amortization schedule for the refunding bonds does not extend beyond the current maturity dates of the refunded bonds. This ordinance is one of three refunding issues proposed to reduce debt service costs. Total debt service savings for these three issues are expected to be about $100,000/year, or about $685,000 (8.5%) net present value savings.
Resolution R2020-034 stating the policy of the City Council concerning the issue of workforce housing, and to support certain actions in furtherance of this policy. The term “Workforce Housing” is generally understood to mean affordable housing for households with insufficient income to secure quality housing in reasonable proximity to the workplace. The need for workforce housing in this community is particularly acute for workers in the hospitality and service industries (Group 1) and for most public employees, teachers, and other middle income workers (Group 2). As a result of the shortage of such housing, these workers are commuting into the city, which degrades their quality of life, increases traffic congestion and negatively impacts efforts of city businesses to resume normal operations following a major disruption such as a significant storm. Per this resolution, Council supports using the Workforce Housing Fund for strategies to increase the stock of workforce housing options for both groups and creation of a non-profit corporation to:
Coordinate with other agencies to expand workforce housing. Create affordable rental and home ownership programs. Create a community land trust to assemble property to develop and perpetuate additional workforce housing. Seek additional private development and financial partners. Conduct market and financial feasibility studies as needed. Actively seek federal and state funding opportunities. Conduct community engagement meetings. Continue to study best workforce housing practices.
Motion M2020-092 to approve a Special Events Permit to NS Promotions for the Myrtle Beach Mini Marathon and Coastal 5K, October 17-18, 2020, from 6:00 a.m. to 11:00 a.m. on Saturday, and 6:00 a.m. to 12:00 p.m. on Sunday. The City Manager is authorized to make changes to these plans as he deems necessary in keeping with the nature of the event and as circumstances dictate.

5
This is the 11th year for this event and with an expected 500 participants. Rolling road closures will occur on each day as indicated on the route maps. The applicant is aware that they must pay for any services provided by the City of Myrtle Beach. Special COVID-19 precautions will be in place. Motion M2020-093 to authorize the City Manager or his designee to enter into a Memorandum of Agreement (MOA) with the City of Myrtle Beach and the South Carolina Department of Juvenile Justice for Fiscal Year 2020-2021. This motion renews an existing agreement with the Department of Juvenile Justice. The services cover all interactions with the department including mental health evaluations, interventions, overnight stays and/or any other needed assessment for active case investigations.
Motion M2020-094 to appoint/reappoint five members to the Standard Code Board of Adjustments and Appeals. The terms of Joel Carter (city resident), David Raynor (city resident), Robert McElveen (non-city resident), Allan Hay (city resident) and Jeff Hunter (non-city resident) expired on April 26, 2020. Mr. Raynor, Mr. McElveen and Mr. Hunter all wish to be reappointed. Mr. Carter was appointed to the Charlie’s Place Advisory Board and his seat is to be filled by an architect or engineer. A licensed contractor must fill Mr. Hay’s seat. No resumes are currently on file to fill these two seats.
Motion M2020-095 to appoint/reappoint one member to the Employee Recognition Committee. Ms. Millen wishes to fill the seat of Mr. Springs due to his resignation. Ms. Millen meets the requirements of being a city resident and not a city employee. Motion M2020-096 authorizing the City Manager or his designee to apply for a grant of $35,374 from the Edward Byrne Memorial Justice Assistance Grant (JAG) Program for the purpose of: purchasing portable vehicle mitigation barriers and a barrier drop trailer designed to help with public safety during special events; acknowledge receipt of the application for the purpose of Governing Body Review that will be filed in the Office of the City Clerk where it will be available for a 30-day period; record the appropriation of such grant funds in the amount that may be approved; and, execute and deliver the grant agreement and such related documents as may be required to put the grant into effect. There is no match requirement. This motion begins the 30-day review period required for JAG grants and contains assurances that the governing body notification and public comment requirements of the program are satisfied. This motion documents that the JAG application was made available for review by Council for at least 30 days, and that an opportunity to comment on this application was provided. A subsequent motion will be placed on Council’s agenda on September 22, 2020, stating that the Governing Body Review requirements have been met. The system sought is the Archer 1200 vehicle mitigation barrier and the Archer 8 barrier drop trailer to tow the barriers and is the second and final phase of this project. The barriers would add an extra layer of protection to existing traffic control devices (cones, jersey barricades and metal fencing). Motion M2020-097 authorizing the City Manager or his designee to apply for a grant of $18,277.67 from Firehouse Subs Public Safety Foundation for the purpose of: purchasing two digital nozzles, two rescue manikins and a HAZMAT placard kit to educate and provide an engaging fire service experience for the community; record the appropriation of such grant funds in the amount that may be approved; and, execute and deliver the grant agreement and such related documents as may be required to put the grant into effect. No match is required. The fire prevention education tools are designed for public education in order to prevent disasters in the home and community.
Motion M2020-098 to declare certain vehicles abandoned or derelict pursuant to the authority of Article 41 of Title 56 South Carolina Code of Laws 2001. This declaration is an effort to improve the appearance of both commercial and residential neighborhoods. The report includes vehicles that staff has tagged as abandoned or derelict. Council’s approval allows these vehicles to be towed from their private property locations to a tow yard where they may be reclaimed by the current owner upon

6
payment of the applicable towing and storage fees. If the vehicles are not claimed by the owner within 30 days of the required notice, then the tow company may sell the vehicle and keep the proceeds as compensation.
NON-AGENDA ITEMS FROM THE PUBLIC COMMUNICATIONS FROM CITY BOARDS/COMMISSION MEMBERS COMMUNICATIONS FROM CITY COUNCIL AND CITY MANAGER
1. Council Communications 2. Chief Financial Officer (CFO) Update 3. City Manager/Assistant City Manager (CM/ACM) Update
REPORTS AND INFORMATION PRESENTATIONS FROM CITY STAFF EXECUTIVE SESSION – Council may take action on matters discussed in Executive Session which are deemed to be “emergency” concerns. Note: South Carolina law requires that Council’s business is conducted in public with limited exceptions, known as “Executive Sessions.” Subjects eligible for Executive Session include:
Personnel matters. Negotiations concerning proposed contractual arrangements and proposed sale or purchase of property. The receipt of legal advice relating to:
A pending, threatened, or potential claim. Other matters covered by the attorney-client privilege. Settlement of legal claims, or the position of the city in
other adversary situations. Discussions regarding development of security personnel or devices. Investigative proceedings regarding allegations of criminal misconduct. Matters relating to the proposed location, expansion, or provision of services encouraging location or
expansion of industries or other businesses. Motions to go into Executive Session must be made in public and specify one or more reason above. Council can take no vote or action in Executive Session. ADJOURNMENT

7
City of Myrtle Beach
Board of Zoning Appeals 1:30 p.m., Thursday, August 13, 2020
Conference Call
NOTE: CITIZENS ARE INVITED TO WATCH THE CONFERENCE MEETING LIVE ON THE CITY’S FACEBOOK PAGE, https://www.facebook.com/myrtlebeachcitygovernment/. TO ACCOMMODATE PUBLIC INPUT, WHEN
APPROPRIATE, SEND AN EMAIL TO [email protected]. WHEN SENDING AN EMAIL DURING THE MEETING, INCLUDE YOUR NAME AND ADDRESS.
ANYONE WHO REQUIRES AN AUXILIARY AID OR SERVICE FOR EFFECTIVE COMMUNICATION OR
PARTICIPATION SHOULD CONTACT 843-918-1111 AS SOON AS POSSIBLE, BUT NO LATER THAN 48 HOURS BEFORE THE SCHEDULED EVENT.
A. Call to Order B. Minutes:
1. Approval/Correction of Minutes – July 9, 2020 C. Old Business D. New Business:
1. Request 20-08 Benjamin R. Gooding, Attorney: The applicant is requesting an appeal from a decision of the zoning administrator pertaining to permitted uses within the City of Myrtle Beach per Section 1407 of The City of Myrtle Beach Zoning Ordinance. The property is located at 1325 Celebrity Circle, Unit S5C, and is identified by TMS #1730004087.
E. Communications from Board F. Communications from Staff G. Adjourn
The employees
of the City of Myrtle Beach are a diverse
group of individuals who
blend their unique talents to create the
most effective, elite team of
Kaycey Vrettos
Public Information Specialist
p: 8439181017 m: e: [email protected]
PO Drawer 2468 Myrtle Beach, SC 295782468
www.cityofmyrtlebeach.com

8
public servants in South Carolina.
*** WARNING *** All email correspondence to and from this address may be subject to public disclosure under the South Carolina Freedom of Information Act(FOIA). 2007
The employees
of the City of Myrtle Beach are a diverse
group of individuals who
blend their unique talents to create the
most effective, elite team of
public servants in South Carolina.
Emily Hardee
Permit Services Supervisor
p: 8439181163 m: e: [email protected]
PO Drawer 2468 Myrtle Beach, SC 295782468
www.cityofmyrtlebeach.com
*** WARNING *** All email correspondence to and from this address may be subject to public disclosure under the South Carolina Freedom of Information Act(FOIA). 2007

1
Seremak, Sara R
Subject: FW: Floodplain Mitigation Plan & Hazard Mitigation Plan Committee update meeting.
Start: Wed 9/30/2020 10:00 AM
End: Wed 9/30/2020 12:00 PM
Show Time As: Tentative
Recurrence: (none)
Meeting Status: Not yet responded
Organizer: Emily Hardee
-----Original Appointment----- From: Emily Hardee <[email protected]> Sent: Thursday, November 19, 2020 9:14 AM To: Emily Hardee; Walton, Margaret M Subject: FW: Floodplain Mitigation Plan & Hazard Mitigation Plan Committee update meeting. When: Wednesday, September 30, 2020 10:00 AM-12:00 PM (UTC-05:00) Eastern Time (US & Canada). Where:
To help protect you r priv acy, Microsoft Office prevented automatic download of this picture from the Internet.photograph
The employees
of the City of Myrtle Beach are a diverse
group of individuals who
blend their unique talents to create the
most effective, elite team of
public servants in South Carolina.
Emily Hardee
Permit Services Supervisor
p: 843-918-1163 m: e: [email protected]
PO Drawer 2468 Myrtle Beach, SC 29578-2468
www.cityofmyrtlebeach.com
To help pr
otect yo
To help pr
otect yo
To help pr
ot
*** WARNING *** All e-mail correspondence to and from this address may be subject to public disclosure under the South Carolina Freedom of Information Act(FOIA). 2007

2
-----Original Appointment----- From: Emily Hardee Sent: Friday, September 25, 2020 10:05 AM To: Emily Hardee; Allison Hardin; Ashley Weatherly ([email protected]); Bruce Arnel; David Victoria; Eric Norris; Horry Electric ([email protected]); John C. Johnson; Karen Riordan; Kevin Jordan ([email protected]); Kim Johnson; Margaret Murray; Mark Kruea; Marty Brown; [email protected]; [email protected]; Samantha Taylor; Squires, Wanda; Tom Gwyer; Val Rosser CIC, LUTCF, CPIW, CCRM; Walton, Margaret M Cc: Seremak, Sara R; Kaycey Vrettos; Chasity Pendergrass; Katie Dennis Subject: Floodplain Mitigation Plan & Hazard Mitigation Plan Committee update meeting. When: Wednesday, September 30, 2020 10:00 AM-12:00 PM (UTC-05:00) Eastern Time (US & Canada). Where: Please join us for the next Floodplain Management and Hazard Mitigation Plan meeting regarding the actions for the plan. A separate invite will go out once the Webex is set up with the existing actions to review prior to the meeting. Thanks again for your participation. Emily Hardee

1
Seremak, Sara R
Subject: FW: Floodplain Management and Hazard Mitigation Planning committee update final
meeting
Location: Webex
Start: Wed 10/21/2020 10:00 AM
End: Wed 10/21/2020 12:00 PM
Show Time As: Tentative
Recurrence: (none)
Meeting Status: Not yet responded
Organizer: Emily Hardee
-----Original Appointment----- From: Emily Hardee <[email protected]> Sent: Thursday, November 19, 2020 9:14 AM To: Emily Hardee; Walton, Margaret M Subject: FW: Floodplain Management and Hazard Mitigation Planning committee update final meeting When: Wednesday, October 21, 2020 10:00 AM-12:00 PM (UTC-05:00) Eastern Time (US & Canada). Where: Webex
To help protect you r priv acy, Microsoft Office prevented automatic download of this picture from the Internet.photograph
The employees
of the City of Myrtle Beach are a diverse
group of individuals who
blend their unique talents to create the
most effective, elite team of
public servants in South Carolina.
Emily Hardee
Permit Services Supervisor
p: 843-918-1163 m: e: [email protected]
PO Drawer 2468 Myrtle Beach, SC 29578-2468
www.cityofmyrtlebeach.com
To help pr
otect yo
To help pr
otect yo
To help pr
ot
*** WARNING *** All e-mail correspondence to and from this address may be subject to public disclosure under the South Carolina Freedom of Information Act(FOIA). 2007

2
-----Original Appointment----- From: Emily Hardee Sent: Friday, September 25, 2020 10:18 AM To: Emily Hardee; Allison Hardin; Ashley Weatherly ([email protected]); Bruce Arnel; David Victoria; Eric Norris; Horry Electric ([email protected]); John C. Johnson; Karen Riordan; Kevin Jordan ([email protected]); Kim Johnson; Margaret Murray; Mark Kruea; Marty Brown; [email protected]; [email protected]; Samantha Taylor; Squires, Wanda; Tom Gwyer; Val Rosser CIC, LUTCF, CPIW, CCRM Cc: Kaycey Vrettos; Chasity Pendergrass Subject: Floodplain Management and Hazard Mitigation Planning committee update final meeting When: Wednesday, October 21, 2020 10:00 AM-12:00 PM (UTC-05:00) Eastern Time (US & Canada). Where: Webex

Floodplain Management and Hazard Mitigation Plan Update
Request for Input
including studies, plans or any other information pertinent to flooding or other
natural hazards.
Federal regulations require the City of Myrtle Beach to develop an updated, approvable Hazard Mitigation Plan at least every five years. The production of this Plan will not only enable the City of Myrtle Beach to be better prepared in the event of a disaster but will also permit us to retain the eligibility to apply for federal grant and disaster funding. This plan provides guidance for the City of Myrtle Beach’s jurisdictional development and construction in regards to flood prone areas and reducing risks to people and property from known hazards. It is important that the community be part of this process and provide valuable input on natural hazards, problems and possible solutions.
The City of Myrtle Beach is requesting the following information from coordinating agencies and organizations:
Studies, plans, or any data regarding flooding or other natural hazards. Anything that might affect flooding or properties in flood prone areas.
We would like to offer your organization an invite to be involved in our planning efforts. Please contact Emily Hardee, CFM, floodplain coordinator with the City of Myrtle Beach at 843-918-1163 or [email protected]. A copy of the current Floodplain Management and Hazard Mitigation Plan is located on the city website: https://www.cityofmyrtlebeach.com/services/forms_and_applications.php#revize_document_center_rz768
Webex meeting will be held:
Thursday, June 25, 2020 at 2:00pm
Please respond if you have any information or would like to attend the virtual meeting.
CC: City of North Myrtle Beach Horry County Georgetown County City of Surfside South Carolina Department of Natural Resources FEMA Region IV Army Corps of Engineers Grand Strand Water & Sewer Authority Santee Cooper Horry Telephone Cooperative Horry Electric Cooperative Town of Briarcliffe
City of Loris

1
Seremak, Sara R
From: Walton, Margaret M
Sent: Tuesday, November 10, 2020 4:01 PM
To: Seremak, Sara R
Subject: FW: Floodplain Management and Hazard Mitigation Plan REVIEW
Importance: High
Sara: Can you add this into the Myrtle Beach notifications and outreach to neighboring jurisdictions? Thanks! mmw
Margaret M. Walton, CFM Senior Planner II, Land Planning ATKINS Find out more about what we do and how we do it - www.atkinsglobal.com Savannah, GA Office Address: 1616 East Millbrook Road, Suite 160, Raleigh, NC 27609 | Fax: +1 (919) 876 6848 | Cell: +1 (803) 622 4142 Email: [email protected] | Web: www.atkinsglobal.com | Careers: www.atkinsglobal.com/careers
From: Emily Hardee <[email protected]> Sent: Tuesday, November 10, 2020 2:35 PM To: [email protected]; BRANDON <[email protected]>; Carroll, Ashley <[email protected]>; FEMA Region IV Info ([email protected]) <[email protected]>; Horry Electric Energy Advisors ([email protected]) <[email protected]>; HTC ([email protected]) <[email protected]>; Jim Grant ([email protected]) <[email protected]>; Mandy Todd ([email protected]) <[email protected]>; Mitch Combs <[email protected]>; R Cooper ([email protected]) <[email protected]>; Santee Cooper ([email protected]) <[email protected]>; Steven Carter ([email protected]) <[email protected]>; T Mazzo ([email protected]) <[email protected]>; Tanitra Marshall ([email protected]) <[email protected]>; Webster, Randy <[email protected]>; Allison Hardin <[email protected]>; Ashley Weatherly ([email protected]) <[email protected]>; Bruce Arnel <[email protected]>; David Victoria <[email protected]>; Emily Hardee <[email protected]>; Eric Norris <[email protected]>; Horry Electric ([email protected]) <[email protected]>; John C. Johnson <[email protected]>; Karen Riordan <[email protected]>; Kevin Jordan ([email protected]) <[email protected]>; Kim Johnson <[email protected]>; Margaret Murray <[email protected]>; Mark Kruea <[email protected]>; Marty Brown <[email protected]>; [email protected]; [email protected]; Samantha Taylor <[email protected]>; Squires, Wanda <[email protected]>; Tom Gwyer <[email protected]>; Val Rosser CIC, LUTCF, CPIW, CCRM <[email protected]>

2
Cc: Walton, Margaret M <[email protected]> Subject: RE: Floodplain Management and Hazard Mitigation Plan REVIEW Importance: High Please see the link below to view the draft plan update of the City of Myrtle Beach Floodplain Management and Hazard Mitigation Plan. We are asking for any input from your agency/jurisdiction. Please send any recommendations that you have back as soon as possible. Thanks for your support and participation in updating our plan! Click or copy and paste link: https://drive.google.com/drive/folders/1aQ6Y89cFmx2EfttnEs0DvzkeTiPH6d9O?usp=sharing
The employees
of the City of Myrtle Beach are a diverse
group of individuals who
blend their unique talents to create the
most effective, elite team of
public servants in South Carolina.
Emily Hardee
Permit Services Supervisor
p: 843-918-1163 m: e: [email protected]
PO Drawer 2468 Myrtle Beach, SC 29578-2468
www.cityofmyrtlebeach.com
*** WARNING *** All e-mail correspondence to and from this address may be subject to public disclosure under the South Carolina Freedom of Information Act(FOIA). 2007
From: Walton, Margaret M <[email protected]> Sent: Wednesday, November 4, 2020 10:33 AM To: Emily Hardee <[email protected]>; Seremak, Sara R <[email protected]>; Allison Hardin <[email protected]>; Ashley Weatherly ([email protected]) <[email protected]>; David Victoria <[email protected]>; Eric Norris <[email protected]>; Horry Electric ([email protected]) <[email protected]>; John C. Johnson <[email protected]>; Karen Riordan <[email protected]>; Kevin

3
Jordan ([email protected]) <[email protected]>; Kim Johnson <[email protected]>; Margaret Murray <[email protected]>; Mark Kruea <[email protected]>; Marty Brown <[email protected]>; [email protected]; [email protected]; Samantha Taylor <[email protected]>; Squires, Wanda <[email protected]>; Tom Gwyer <[email protected]>; Val Rosser CIC, LUTCF, CPIW, CCRM <[email protected]>; Russo, Thomas <[email protected]> Cc: Walton, Margaret M <[email protected]> Subject: [External]RE: Floodplain Management and Hazard Mitigation Plan REVIEW Importance: High
CAUTION: This email originated from outside your organization. Exercise caution when opening unsolicited attachments or clicking links. Please forward suspicious mail to [email protected] for review.
------------- Good morning, All! I just wanted to remind everyone that we would like to receive all comments on the DRAFT Floodplain Management and Hazard Mitigation Plan by COB tomorrow, Thursday, November 5. It is imperative that we maintain our timeline to allow for state and FEMA review prior to the plan’s expiration. As always, please let me know if you have any questions. The google drive link is with all of the plan sections is below: https://drive.google.com/drive/folders/1aQ6Y89cFmx2EfttnEs0DvzkeTiPH6d9O?usp=sharing Thank you! Margaret
Margaret M. Walton, CFM Senior Planner II, Land Planning ATKINS Find out more about what we do and how we do it - www.atkinsglobal.com Savannah, GA Office Address: 1616 East Millbrook Road, Suite 160, Raleigh, NC 27609 | Fax: +1 (919) 876 6848 | Cell: +1 (803) 622 4142 Email: [email protected] | Web: www.atkinsglobal.com | Careers: www.atkinsglobal.com/careers
| Careers: www.atkinsglobal.com/careers

City of Myrtle Beach
Hazard Mitigation Plan
Public Participation Survey Results
1

Public Participation Survey
• Provides an opportunity for the public
to share opinions and participate in
the planning process
• Link to survey posted on Facebook,
LinkedIn, Twitter, and News 13 site
• 330 completed surveys received
2

Public Participation Survey Highlights
• 93% of respondents are interested in
making their homes safer from
hazards
• 66% have already taken action to
make their homes safer from hazards
• 46% do not know who to contact
regarding risks from hazards
3

1. Where do you live?
4
201
2814 10 8 8 5 3
35
0
50
100
150
200
250
# of responses
City of Myrtle Beach
Horry County
Socastee
Murrell's Inlet
Conway
Carolina Forest
Forestbrook
North Myrtle Beach
Other

2. Is your home in a floodplain?
21%
64%
15%
Yes
No
I don't know
5

3. Do you have flood insurance?
53%45%
2%
Yes
No
I don't know
6

3a. Why no flood insurance?
45%
16%
10%
15%
7%7% Not located in floodplain
Too expensive
Not necessary: it never floods
Not necessary: elevated or otherwiseprotected
Never really considered it
Other
7

4. Have you experienced a disaster?
68%
32%
Yes
No
8

4a. Examples of disasters experienced
35%
55%
4% 3% 3%
Flood
Hurricane/Tropical Storm
Tornado
Winter Storm/Ice
Pandemic
9

5. How concerned about possibility of
being impacted by disaster?0%
8%
34%
29%
29% 1 - Not at all
2 - Slightly
3 - Moderately
4 - Very
5 - Extremely
10

6. Hazards of greatest concern?
11
81472820
10786
286
41823
190
106
424117824
0
50
100
150
200
250
300
350
# of responses
Drought
Hailstorm
Ice Storm
Lightning
Nor'easter
Wind Events
Tornado/Waterspout
Tropical Storm System/Hurricane
Earthquake
Tidal Wave/Tsunami
Erosion
Flood
Storm Surge
Sea Level Rise
Acts of Terror
Airplane Crash
Hazardous Materials Incident
Wildfire

7. Other hazards not listed?
• Pandemic
• Mass gatherings
• Civil unrest
• Active shooter
• Bioterrorism
• Deforestation
• Heat wave
• Global warming
• Water quality/pollution
12

8. How prepared if disaster occurs?
5%
14%
54%
24%
3%
1 - Not at all
2 - Slightly
3 - Moderately
4 - Very
5 - Extremely
13

9. Taken action to be safer from
hazards?
66%
34%
Yes
No
14

9a. Examples of actions taken
17%
27%56%
Debris/Tree Removal
House Retrofit/Repair/Protection
Preparedness/Emergency Planning
15

10. Interested in being safer from
hazards?
93%
7%
Yes
No
16

11.How informed about risks and
impacts of disasters?4%
13%
38%
34%
11%
1 - Not at all
2 - Slightly
3 - Moderately
4 - Very
5 - Extremely
17
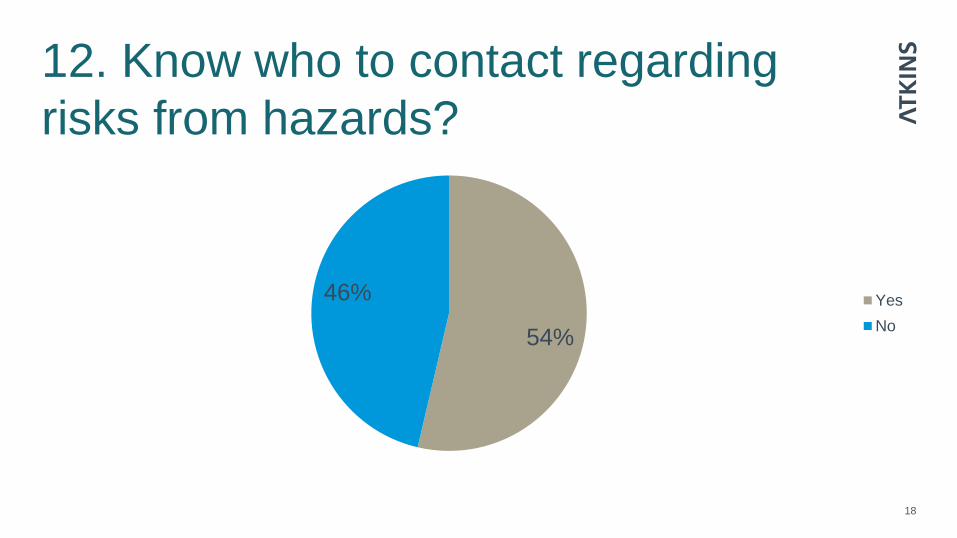
12. Know who to contact regarding
risks from hazards?
54%
46% Yes
No
18

13. Preferred way to receive info.
about being safer from hazards?4%
14%
6%
19%
15%
21%
10%
8%
1% 2%
Newspaper
Television
Radio
Internet
Social media
Public workshops/meetings
School meetings
Other
19

13. Other ways to receive information
• Text messages
• Phone
• Church
• Meetings
• Employer
20

14. Preferred way to receive
alerts/warnings about hazard events?
21%
9%
3%
26%
28%
11%
2% 0%
Television
Radio
Landline phone
Cell phone
Text message
Other
21

14. Other ways to receive
alerts/warnings• Email
• News station reporting
22

15. Steps local gov’t could take to
reduce risk4% 1% 3%
13%
27%
14%
8%
8%
7%
4% 11%
Alert/Warning System
Improve Communication/Coordination
Emergency/Storm Shelters/Safe Rooms
Debris/Tree Removal
Improve/Maintain Drainage/Flood Protection
Improve/Maintain/Retrofit Infrastructure
Response/Recovery
Preparedness/Emergency Planning
Monitoring/Enforcement/Inspections
Planning/Requirements
Public Education/Awareness
23

16. Mitigation Actions: Prevention
91%
8%
1%
Very important
Somewhat important
Not important
24

16. Mitigation Actions: Property
Protection
65%
32%
3%
Very important
Somewhat important
Not important
25

16. Mitigation Actions: Natural
Resource Protection
88%
11%
1%
Very important
Somewhat important
Not important
26

16. Mitigation Actions: Structural
Projects
76%
20%
4%
Very important
Somewhat important
Not important
27

16. Mitigation Actions: Emergency
Services
88%
12%
0%
Very important
Somewhat important
Not important
28

16. Mitigation Actions: Public
Education and Awareness
67%
29%
4%
Very important
Somewhat important
Not important
29

16. Types of Mitigation Actions
Highest importance
• Prevention
• Natural Resource Protection
• Emergency Services
Moderate importance
• Structural Projects
Lower importance
• Public Education and Awareness
• Property Protection
30
Highest importance
• Public Education and Awareness
• Prevention
• Natural Resource Protection
Moderate importance
• Property Protection
• Emergency Services
Lower importance
• Structural Projects
Committee Results