Pressure transient response of stochastically heterogeneous fractured reservoirs
Upload
khangminh22Category
view
2download
0
Fisheries Enhancement of Small Reservoirsand Floodplain Lakes in India
Edited by
V. V. Sugunan & M. Sinha. '
CENTRAL INLAND CAPTURE FISHERIES RESEARCH INSTITUTE(Indian Council of Agricultural Research)
BARRACKPORE-743101 : WEST BENGAL : INDIA
,Ii
,',
i1

Fisheries Enhancement ofSmall Reservoirs and
Floodplain Lakes in India
Edited by
v. V. Sugunan & M. Sinha
Bull. No. 75 Sept. 1997
Central Inland Capture Fisheries Research Institute(INDIAN COUNCIL OF AGRICULTURAL RESEARCH)
Barrackpore 743101 West Bengal

Fisheries Enhancement of Small Reservoirs andFloodplain Lakes in India
V. V. Sugunan&M. Sinha
ISSN 0970-616 X
c1997Material contained in this Bulletin may not be reproducedin any form without permission of the publisher
Published by: The Director CIFRI Barrackpore
Printed at: Calcutta Laser Graphics Pvt. Ltd.71, Hari Ghosh StreetCalcutta 700 006

Contents
Inland fisheries resources of India and their 1utilization- an overview M. Sinha
\
Floodplain wetlands, small water bodies, culture-based fisheries 13and enhancement- conceptual framework and definitionsV.V.Sugunan
Floodplain wetlands- an important inland fisheries 23resource ofIndia K. K. Vass
Soil quality parameters and their significance in the 31fisheries management of small water bodies K. Chandra
Microbial indices for assessing aquatic productivity R. K. Das 37
Abiotic habitat variables in the reservoir and beel 43ecosystems and their role in the productionprocesses V. Pathak
Community metabolism (energy dynamics) in the context 55/
of fisheries management of small reservoirs and beels.V. Pathak
Methods of evaluating primary productivity in small 65water bodies D. Nath
Relevance of biological monitoring of environmentalquality in inland water bodies with special referenceto floodplain lakes and small reservoirs
K. K. Vass .
75
Biotic communities and their relevance in the productionprocesses of reservoir ecosystem with special emphasison plankton and benthos Dhirendra Kumar
83
Role of plankton, benthos and periphyton in the production 95cycle in the floodplain wetland ecosystem P. K. Chakrabarti
Macrophytes and the weed-associated fauna- a major link in 103the food chain of floodplain lakes Krishna Mitra
Fish species diversity in the floodplain lakes and the 109.need for their conservation P. K. Chakrabarti )Fish fauna oflndian reservoirs and the importance 121of species management in the reservoir fisheriesM. Ramakrishniah
Yield optimization in small reservoirs -a case study 127in Aliyar reservoir C. Selvaraj
Yield optimization in small reservoirs -a case study 133Thirumoorthy reservoir V. K. Murugesan
Fisheries of small reservoi~~in India- an overview 141M. A. Khan
Yield optimization in small reservoirs -a case study 151of Bachhra reservoir M. A. Khan
I
Design of cages and pens suitable for inland water bodies 159 ,/
A. B. Mukherjee
Salient ecological features ofthe mauns and chaurs 167of Bihar and their fisheries B. C. Jha
Fisheries of Muktapur lake- a case study B. C. Jha 175
Beels, the prime inland fishery resource of Assam 179M. M. Goswami .{
Ecology of the beels in West Bengal 187M. K. Mukhopadhyaya
11 ,••
Present status of fish production in the beelsof West Bengal with suggestions for fish yieldoptimization M. K. Mukhopadhyaya
193
Role of fish stock assessment techniques in themanagement of small water bodies S. K. MandaI
199
Guidelines for ecosystem-oriented fishery managementapplicable to the beels of West Bengal G. K. Vinci
205
Pen culture, an effective tool for yield optimizationin the floodplain lakes of West Bengal and AssamG. K; Vinci & K. Mitra
211
Fisheries of small reservoirs in India-general guidelinesfor management V. V. Sugunan
217
Fish diseases and their control in inalnd open watersM. K. Das
231
Infrastructural and policy support measures for inland fisheriesS. Paul
237
Socio-economic constraints in open water fisheries withspecial reference to reservoirs and floodplain lakes S. Paul
241
Role of participatory management approach inreservoir and beel fisheries U. Bhaumik
245
********
III

Summer School' on Fisheries Enhancementin Small Reservoirs and Floodplain LakesCIFRI Barrackpore 14 July to 12 August 1997
Inland fisheries resources of India and their utilization
M. SinhaCentral Inland Capture Fisheries Research Institute
Barrackpor~-743101 West Bengal
In'troduction
India is endowed with a vast expanse of open inland waters in the form of rivers,canals, estuaries, lagoons, reservoirs and lakes. The river systems of the country comprise14 major rivers each draining a catchment of 20,000 km/, 44 medium rivers having anaverage catchment between 2,000 and 20,000 km2 and the innumerable small rivers anddesert streams that have a drainage of less than 2,000 km'. Indian rivers carry a surfacerunoff of 167.23 million ha metres (mhm) which is 5.6% of thetotal runoff flowing in allthe rivers of the world, Dotted with floodplains, oxbow lakes, quiescent backwaters andinterspersed deep pools, the rivers possess a mosaic of varying biotopes ranging from loticto lentic habitats. A large number of river valley projects have been commissioned sinceindependence as a-part of our developmental activities, resulting in a chain of suchartificial impoundments, India has more than 19,000 small reservoirs with a total watersurface area of 1,485,557 ha and about 180 medium and 56 large reservoirs of 527,541' and1,140,268 ha respectively (Sugunan, 1995). Extensive areas under floodplain wetlands inthe form oi mauns, beels, chaurs.fheels available in eastern U. P., northern Bihar, WestBengal, Assam, Tripura, Manipur, Arunachal Pradesh and Meghalaya. They together forman area of more than 200,000 ha, offering ample scope for culture-based fisheries. Theseare shallow nutrient rich water bodies formed due to the change in river course, Theestuarine capture fisheries form an important component of fishery resources of thecountry, The extent of the estuarine waters oflndia is estimated to be 2.6 m ha offeringgreat scope for developing capture fisheries offer great scope for further development.
The inland fish production in the country has registered a phenomenal increaseduring the last about four decades. As against 0.2 million t produced in 1951, the presentproduction of inland fish in the country is estimated at 2.2 million t. The projected--domestic requirement offish in the country by 2000 AD is 12 million t, a half of which hasto come from the inland sector. To achieve this national goal, a scientific understanding
of all the water bodies supporting capture fisheries is imperative to back up their optimumexploitation. However, there exists as many opportunities to augment the fish yield just asthere are constraints which operate against them.
Riverine fisheries
The Ganga river system, with its main tributaries like Yamuna, Ganga, Ramganga,Ghagra, Gomti, Kosi, Gandak, Chambal, Sone, etc. is the original habitat of the threemajor fish species of the sub-continent viz. catla, rohu, and mrigal, better known as Indianmajor carps. Major part of the river Ganga and its tributaries pass through the plainsmaking it the most important river from the fisheries point of view. Ganga is also the majorsource of the riverine spawn which still meets some of the fish seed requirement. Asubstantial part ofthe Brahmaputra and the peninsular rivers pass through rocky steep bedsand the fisheries activities in these rivers are restricted to the limited stretches that passthrough hospitable terrains. The fishing intensity along river courses varies from stretchto stretch depending upon a variety of factors like current velocity, terrain of the river bed,accessibility and the general productivity of the water.
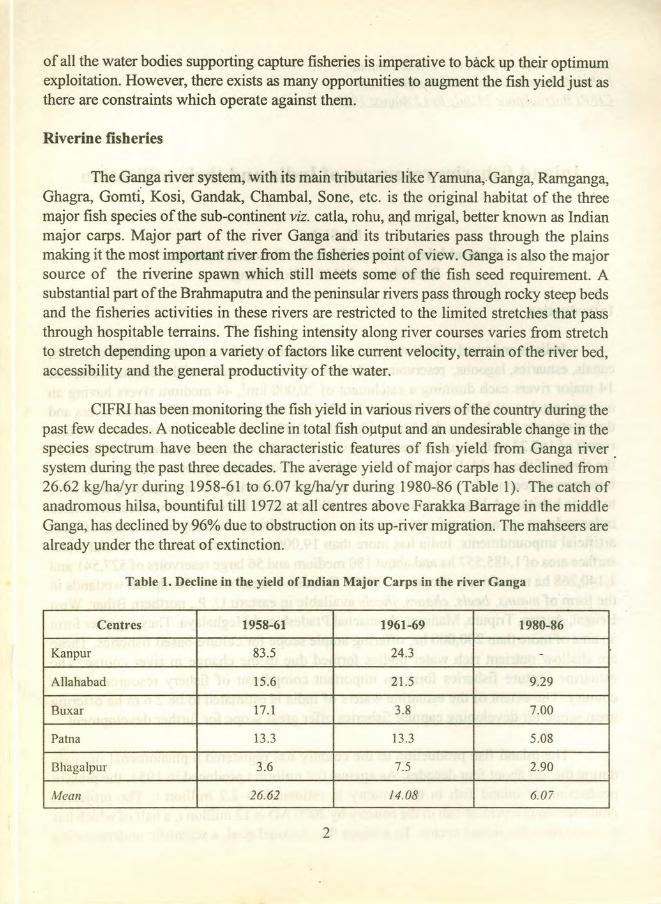
CIFRI has been monitoring the fish yield in various rivers ofthe country during thepast few decades. A noticeable decline in total fish output and an undesirable change in thespecies spectrum. have been the characteristic features of fish yield from Ganga riversystem during the past three decades. The average yield of major carps has declined from26.62 kg/halyr during 1958-61 to 6.07 kglhalyr during 1980-86 (Table 1). The catch ofanadromous hilsa, bountiful till 1972 at all centres above Farakka Barrage in the middleGanga, has declined by 96% due to obstruction on its up-river migration. The mahseers arealready under the threat of extinction.
Table 1. Decline in the yield of Indian Major Carps in the river Ganga
Centres 1958-61 1961-69 1980-86
Kanpur 83.5 24.3 -
Allahabad 15.6 21.5 9.29
Buxar 17.1 3.8 7.00
Patna l3.3 l3.3 5.08
BhagaJpur 3.6 7.5 2.90
Mean 26.62 14.08 6.07
2

Factors influencing fish yield
It is evident from the studies that the biology and ecology of the river fishcommunities make them extremely sensitive to changes in flood regime because of theirdependence on the seasonal floods to inundate the grounds needed for feeding andreproduction. Any change in the form and dimension of the flood curve in the rivers resultsin Changes in community structure. A characteristic- feature of any river system is thenature ofthe input governing the productivity pattern. In the rhithron stretch of the rivers,such inputs are mainly allochthonous but in the potamon, covering the floodplains, themajor inputs are silt and dissolved nutrients. There is a lack of knowledge on therelationship between these inputs and energy flow and productivity trends in these systems.
The intensity of fishing, nature of exploitation and species orientation. in thecharacteristic artisanal fisheries of Indian rivers are governed by: (i) seasonality of riverinefishing activity; (ii) unstable catch composition; (iii) conflicting multiple use of riverwater; (iv) cultural stresses leading to nutrient loading and pollution; (v) lack ofunderstanding of the fluvial system and infirm data base; (vi) fragmentary and outmodedconservation measures lacking enforcement machinery; vii) inadequacy of infrastructureand supporting services; (viii) defective marketing and distribution systems; (ix) demanddirected by availability; affordability, and palatability, and (ix) socio-economic and socio-cultural determinants (Jhingran, 1984).
A successful management strategy has to take into consideration the keyparameters of hydrology, fish stocks and the dynamics of their population together withregulatory measures for fishing. Observance of closed seasons and setting up of fishsanctuaries have proved their efficacy in fostering recovery of impaired fisheries.Experience has indicated that gear control measures are liable to fail in yielding resultsuntil the artisanal level of fisheries exploitation is significantly changed (Welcomme,1979).
Prediction of catch
For prediction of future catches, Welcomme (1979) has summed up a number ofmethods based on statistical correlations between some environmental parameters and thecatch, assuming that the dynamics of fish populations as well as the catch in large riversare close positive correlates of hydrological regime. These methods have been found togive fairly accurate results. A basic Indian model needs to be developed for studying theproduction potential of Indian rivers. A strong database is the most essential prerequisite
3
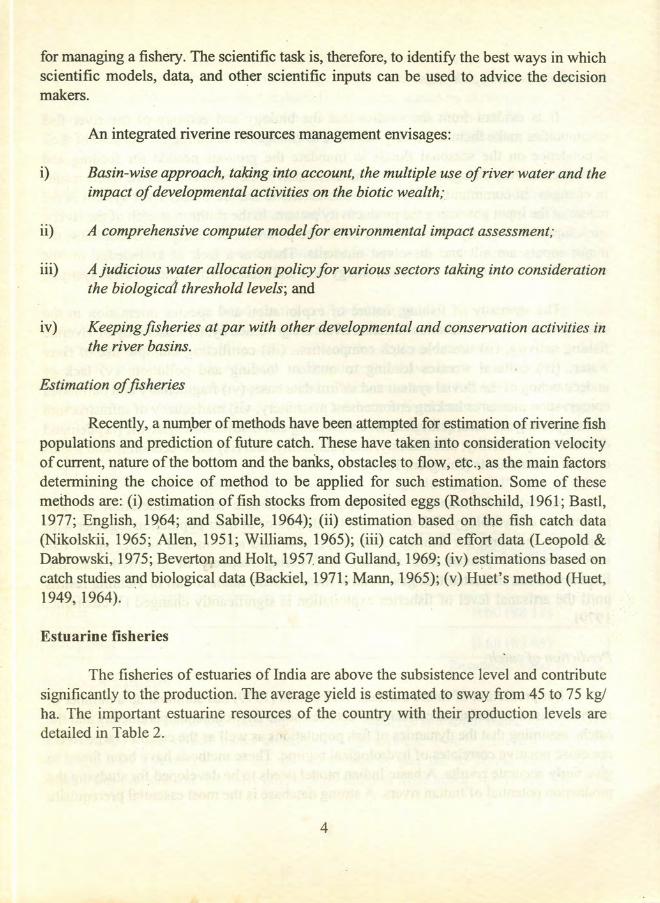
for managing a fishery. The scientific task is, therefore, to identify the best ways in whichscientific models, data, and other scientific inputs can be used to advice the decisionmakers.
An integrated riverine resources management envisages:
i) Basin-wise approach, taking into account, the multiple use of river water and theimpact of developmental activities on the biotic wealth;
ii) A comprehensive computer model for environmental impact assessment;
iii) A judicious water allocation policy for various sectors taking into considerationthe biological threshold levels; and
iv) Keeping fisheries at par with other developmental and conservation activities inthe river basins.
Estimation of fisheries
Recently, a number of methods have been attempted for estimation of riverine fishpopulations and prediction of future catch. These have taken into consideration velocityof current, nature ofthe bottom and the banks, obstacles to flow, etc., as the main factorsdetermining the choice of method to be applied for such estimation. Some of thesemethods are: (i) estimation of fish stocks from deposited eggs (Rothschild, 1961; Bastl,1977; English, 19,64; and Sabille, 1964); (ii) estimation based on the fish catch data(Nikolskii, 1965; Allen, 1951; Williams, 1965); (iii) catch and effort data (Leopold &Dabrowski, 1975; Beverton and Holt, 1957. and Gull and , 1969; (iv) estimations based encatch studies and biological data (Backiel, 1971; Mann, 1965); (v) Huet's method (Huet,1949, 1964).
Estuarine fisheries
The fisheries of estuaries ofIndia are above the subsistence level and contributesignificantly to the production. The average yield is estimated to sway from 45 to 75 kg/ha. The important estuarine resources of the country with their production levels aredetailed in Table 2.
4
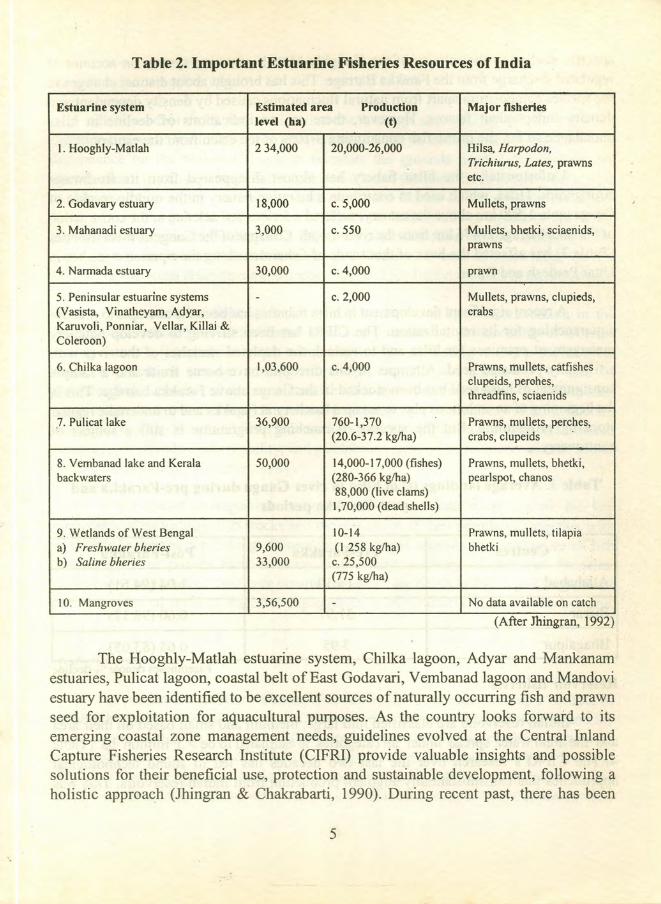
Table 2. Important Estuarine Fisheries Resources of India
Estuarine system Estimated area Production Major fisherieslevel (ha) (t)
I. Hooghly-Matlah 234,000 20,000-26,000 Hilsa. Harpodon,Trichiurus, Lates, prawnsetc.
2. Godavary estuary 18,000 c.5,000 Mullets, prawns
3. Mahanadi estuary 3,000 c.550 Mullets, bhetki, sciaenids,prawns
4. Narmada estuary 30,000 c.4,000 prawn
5. Peninsular estuarine systems - c.2,000 Mullets, prawns, c1upieds,(Vasista, Vinatheyam, Adyar, crabsKaruvoli, Ponniar, Vellar, Killai &Coleroon)
6. Chilka lagoon 1,03,600 c.4,000 Prawns, mullets, catfishesc1upeids, perohes,threadfins, sciaenids
.7. Pulicat lake 36,900 760-1,370 Prawns, mullets, perches,(20.6-37.2 kglha) crabs, c1upeids
8. Vembanad lake and Kerala 50,000 14,000-17,000 (fishes) Prawns, mullets, bhetki,backwaters (280-366 kglha) pearlspot, chanos
88,000 (live clams)1,70,000 (dead shells)
9. Wetlands of West Bengal 10-14 Prawns, mullets, tilapiaa) Freshwater bheries 9,600 (I 258 kg/ha) bhetkib) Saline bheries 33,000 c.25,500
(775 kglha)
10. Mangroves 3,56,500 - No data available on catch
(After Jhingran, 1992)
The Hooghly-Matlah estuarine system, Chilka lagoon, Adyar and Mankanamestuaries, Pulicat lagoon, coastal belt of East Godavari, Vembanad lagoon and Mandoviestuary have been identified to be excellent sources of naturally occurring fish and prawnseed for exploitation for aquacultural purposes. As the country looks forward to itsemerging coastal zone management needs, guidelines evolved at the Central InlandCapture Fisheries Research Institute (CIFRI) provide valuable insights and possiblesolutions for their beneficial use, protection and sustainable development, following aholistic approach (Jhingran &. Chakrabarti, 1990). During recent past, there has been
5'.

specific decline in the salinity of the Hooghly-Matlah estuarine system on account ofregulated discharge from the Farakka Barrage. This has brought about distinct changes inthe species composition apart from natural fluctuations caused by density dependent anddensity independent factors. However, there are no indications of decline in hilsaabundance so far, the prime fish constituting 8-10% ofthe catch from the estuary .
.Unfortunately, the hilsa fishery has almost disappeared from its freshwaterstrongholds. Hilsa, which used to contribute a lucrative fishery in the middle reaches ofGanga up to 1,500 km above the estuary, suffered a serious setback due to the constructionofFarakka barrage at476 km from the river mouth. Collapse of the Gangetic hilsa fisheries(Table 3) has affected the lives of thousands of fishermen along the riparian stretches inUttar Pradesh and Bihar.
A recent significant development inhilsa fisheries has been the attempts to practiseaquaranching for its revitalization. The CIFRI has been striving to develop hatcherymanagement practices for hilsa and to restock the depleted stretches of the river withartificially produced seed. Attempts in this direction have borne fruits and a sampleconsignment of hils a seed has been stocked in the Ganga above Farakka barrage. This isthe beginning of an ambitious plan to set up a hatchery at Farakka and to undertake regularstocking programme. But the success of ranching programme is still a subject ofcontroversy.
Table 3. Average landings (t) of hilsa in river Ganga during pre-Farakka andpost-Farakka periods
Centres Pre- Farakka Post-Farakka
Allahabad 19.30 1.04 (94.61)
Buxar 31.97 0.60 (98.12)
Bhagalpur 3.95 0.68 (83.05)Parentheses denote % declme
Reservoir fisheries
Indian reservoirs are classified into large, medium and small based on their areaand the toral water spread under all categories is estimated to be > 3 million ha (Table4).The CIFRI's research over the last two decades has led to sound technologicalapproaches that can substantially augment production from Indian reservoirs. This was
6
i
I

amply demonstrated in the past when a production of 100 kg ha' was achieved in Gulariareservoir near Allahabad in the late 1970s. Later, a newly created 140 ha impoundment,the Bachhra reservoir, in the Meja Tehsil of Allahabad was studied and developmentmeasures were formulated for its fisheries. During 1986-87, the package of stocking andharvesting developed by the Institute resulted in a yield of 139 kg/ha from the reservoir.Encouraged by the increased production rate in the above
Table 4. Reservoir fishery resources of India
Category Number Area
Small < 1000 ha 19134 1,485,557
Medium 1000-5000 ha 180 527,541
Large < 5000 ha 56 1,140,268
Total 19,370 3,153,366(Sugunan, 1995a)
reservoirs, the U. P. Government leased out the Baghla reservoir to the CIrRI for scientificmanagement. In recent years, similar remunerative results have been achieved from Aliyarand Thirumoorthy reservoirs in Tamil Nadu where a yield up to 190 kg/ha and 182 kg/hahave been achieved. Table 5 shows the production rates demonstrated by CIrRI indifferent reservoirs of the country. Reservoir management for fisheries is capable ofgenerating additional national income of the order of 100 crores per year and providingemployment to lakhs of rural poor through fishing, transport, marketing and ancillaryindustries (Srivastava, 1984). Small reservoirs also offer opportunities for integratingagriculture and livestock farming with fisheries and establishing self-sustaining villages.
Large dams are increasingly becoming a characteristic component of river basins.In Rihand and Gandhisagar reservoirs, fish YIeld reached its initial peaks in the fourth yearof impoundment (Jhingran, 1982; Dubey and Chatterjee, 1977). However, this highproduction is not sustained for long. After a period ranging from one to several years, itdeclines to much lower level, partly due to diminution of bottom leaching as volume ofimpounded water increases and partly as nutrients are used up by aquatic vegetation when
•. it becomes established in greater quantity. The productivity ultimately gets stabilizedsomewhere near half the magnitude of initial phase (Bhukaswan, 1980), getting adjustedto the basic productivity levels of the basin and allochthonous nutrients from the inflowsand watershed runoff.
7
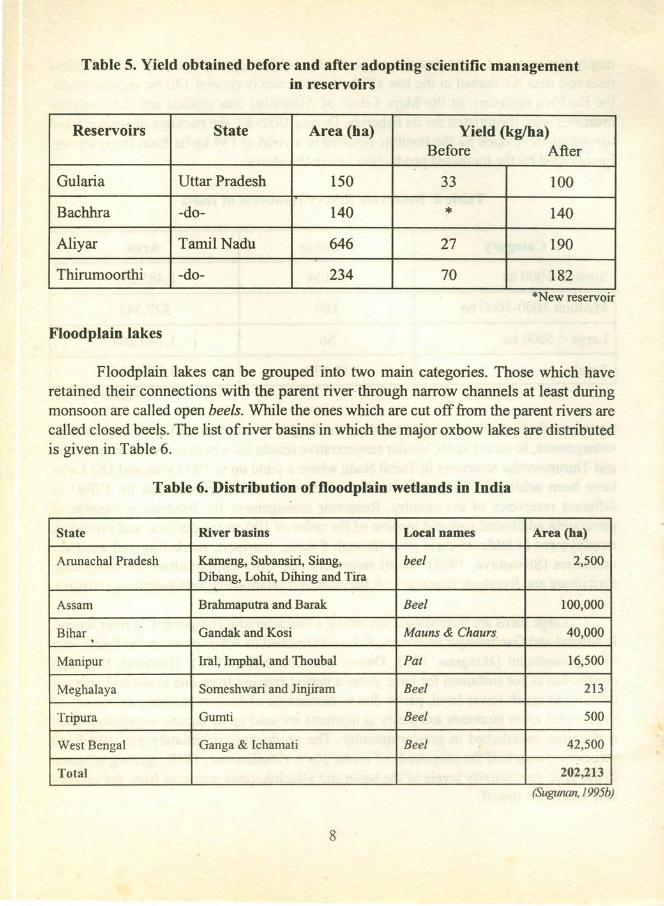
Table 5. Yield obtained before and after adopting scientific managementin reservoirs
Reservoirs State Area (ba) Yield (kglha)Before After
Gularia Uttar Pradesh 150 33 100Bachhra -do- 140 * 140Aliyar Tamil Nadu 646 27 190Thirumoorthi -do- 234 70 182
/
*New reservoir
Floodplain lakes
Floodplain lakes can be grouped into two main categories. Those which haveretained their connections with the parent river through narrow channels at least duringmonsoon are called open beels. While the ones which are cut off from the parent rivers arecalled closed beels. The list of river basins in which the major oxbow lakes are distributedis given in Table 6.
Table 6. Distribution of floodplain wetlands in India
State River basins Local names Area (ha)
Arunachal Pradesh Kameng, Subansiri, Siang, beel 2,500Dibang, Lohit, Dihing and Tira
Assam Brahmaputra and Barak Beel 100,000
Bihar Gandak and Kosi Mauns & Chaurs 40,000,
Manipur Iral, Imphal, and Thoubal Pat 16,500
Meghalaya Someshwari and Jinjiram Beel 213
Tripura Gumti Beel 500
West Bengal Ganga & Ichamati Beel 42,500
Total 202,213
(Sugunan, /995b)
8
Ecological status
Nutrient-wise, these bodies are extremely rich as reflected by their soil quality andbottom sediments. In terms of potential, beels are capable of giving an annual fish crop of1000 to 1500 kg/ha. Their ecologically degraded condition and lack of proper managementmeasures have resulted in a rather paltry yield (120-320 kg! ha) from most of the beels,leaving a significantly wide gap between the actual yield and their harvest potential.
Environmental stress
In most of the beels, marginal areas are utilised for agricultural purposes. Thesewater bodies are subjected to a variety of environmental stresses especially from pesticidesand other agricultural runoff, municipal wastes and siltation. DDT, endosulfan, methylparathion, HCH, ethyl parathion quinalphos, carbaryl and dimethoate phosphamidon arethe most commonly used pesticides. The fish food organisms are very sensitive to thesechemicals. The siltation can adversely affect the reproduction of fish by the accumulationof sediments in the marginal areas of the beels which form the breeding grounds for thefish. Siltation can adversely affect the benthic community by covering the lake bottom.
CONCLUSION
Inland Fisheries resources of India are rich and varied. They also hold enormousproduction potential to meet all the inland fishery requirements of the country. However,irrational norms of exploitation can endanger the delicate balance of these ecosystemsleading to poor yields. Open water fisheries are managed on the basis of exploitation ofnatural stocks. Therefore sound environmental protection norms are to be set and followedto develop the inland fishery resources in a sustainable manner. CIFRI is providingresearch back up to combine the environmental norms and sustainable development of theresources in order to meet the requirement of the country.
REFERENCES
Allen, K. R., 1951. The Horokiwi stream: A study of a trout population. Fish. Bull.,No.2, 10: 231 p.
Backiel, T., 1971. Production and food consumption of predatory fish in the Vistula River.J Fish. Bioi., 3: 369-405.
9
Beverton, R. J. H. and S. J. Holt, 1957. On the dynamics of exploited fish populations.Fish. Invest., Ministry Agri. Fish Food. G. B. (2 Sea Fish), London, Ser. 2, (19):533 p.
Bhukaswan, T., 1980. Management of Asian reservoir fisheries. FAO Tech. Paper, Rome, .207,69 p.
Dubey, G. P. and S. N. Chatterjee, 1977. Case study of Gandhisagar reservoir, M. P., IndiaProc. IPFC, 17(3): 232-246.
English, T. S., 1964. A theoretical model for estimating the abundance of planktonic fisheggs. Rapp. r..v. Reun. CIEM, 155: 164-170.
Gulland,1. A., 1969. Manual of methods for fish stock assessment, Part 1.Fish populationanalysis. FAO Man. Fish. Sci., 4: 154 p.
Huet, M., 1964. The evaluation of the fish productivity in freshwaters. The coefficient ofproductivity. Verh. Int. Var. Theor. Limnol., 15: .524-528.
Jhingran, A. G., 1984. Development of riverine fishery resources - some policy issues. In(Eds. Srivastava, U. K. And S. Vathsala) Strategy for development of inland fisheryresources in India - Key issues inproduction and marketing, Concept PublishingCompany, New Delhi: 326-345.
•Jhingran, A. G., 1992. Inland fisheries- management in India development potential and
constraints. In: Balayut, EA (ed.) FAD Fisheries Report No. 458 suppl. FAORome, 281 p.
Jhingran, A. G. and P. K. Chakraborti, 1990. An approach to coastal zone managementand planning in West Bengal. Inland Fisheries Society ofIndia, CIFRI,Barrackpore, 53 p.
Jhingran, V. G., 1982. Fish andfisheries of India. Hindustan Publishing Corp.,New Delhi, 666 p.
Leopold, M. and B. Dabrowski, 1975. General premises and selected elements of a methodof estimating fish stocks and populations in Polish lakes. ElF AC Tech. Paper, 23(Suppl. 1) Vol. 2: 722-727.
10
lJ

Nikolskii, G. V., 1969. Theory offish population dynamics as the biological backgroundfor rational exploitation and management offishery resources. Oliver and Boyd,Edinburgh, 323 p.
Rothschild, B. J., 1961. Production and survival of eggs of American smelt, Osmerusmordax (Mitchill) in Maine. Trans. Am. Fish. Soc., 90(1): 42-48.
Sabille, A., 1964. Estimation of the abundance of a fish stock from egg and larval surveys.Rapp. P.-V Reun. CIEM, 155: 174-180.
Srivastava, U. K. et al, 1984. Inlandfish marketing in India. Reservoir Fisheries. IIM,Ahmedabad, Study Series, 4(a). Concept Publishing Co., New Delhi, 403 p.
Sugunan, V. V., 1995a. Reservoir fisheries of India. FAD Fisheries Technical Paper No.345, Food and Agriculture Organisation, Rome, 423 p.
.-, ~-;
Sugunan, V. V., 1995b. Floodplain wetlands - a fisheries perspective.Howes, J. R. (ed.).Conservation and Sustainable Use of Floodplain Wetlands. Asian WetlandBureau, Kuala Lumpur, AWB Publication No. 113: 13-15.
Welcomme, R. L., 1979. Thefisheries ecology offloodplain rivers. Longman PubLCo.,London, 317 p.
Williams, W. P., 1965. The population density of four species of freshwater fish, roach[Rutilus rutilus (L)]., bleak [Alburnus alburnus (2)], dace [Leuciscus leuciscus(L.)] and perch [Percafluviatilis (L.)] in the river Thames at Reading. J Anim.Ecol., 34: 173-185.
***********
11
Summer School on Fisheries Enhancementin Small Reservoirs and Floodplain LakesCIFRI Barrackoore 14 Julv to 12 August 1997
Floodplain wetlands, small water bodies, culture-basedfisheries and enhancement- conceptual framework
and definitions
V. V.SugunanCentral Inland Capture Fisheries Research Institute
Barrackpore - 743101 , West Bengal
Introduction
In the recent years, there has been a spurt in aquaculture activities throughout theworld. This renewed interest in aquaculture emanates chiefly from the stagnation in growthrate of marine capture fisheries and the growing uncertainties about their sustainability.The scarcity of fossil fuel, the most crucial input for marine capture fisheries, and the fastdepleting marine fish stocks have also resulted in this shift towards aquaculture. In manydeveloping countries, aquaculture has been given high priority to improve the availabilityof protective food for their under-nourished peoples and also to cater to the overseas trade.However, the rapid growth of aquaculture seems to have bred more problems than itsought to solve. Irrational growth of aquaculture ventures impervious to environmentalnorms can open a floodgate of new concerns as evident from the recent Asian experienceof prawn culture boom. Apart from the environmental degradation, the rich biodiversityof the wetlands and other ecosystems are under threat. There is also a human side of theproblem in the form of social disruptions. Traditional inland fishers, especially the localcommunities surrounding the open water bodies are hit hard by the new developments.They suffer on many counts. Various developmental activities have already resulted in theloss or degradation of many ecosystems, taking a heavy toll on their faunistic wealth.Often, there were no avenues for alternative employment for the marginal fishers renderingthem vulnerable. Now they are totally marginalised by the shift in accent towards intensivefanning with excessive dependence on monetised inputs.
13
There is an increasing trend of dichotomy between intensive aquaculture and moreeco- friendly options such as fishery enhancement. While the protagonists of intensiveaquaculture advocate for high input culture systems to produce maximum biomass froma unit area of water, there is an equally strong view point in favour of settling forenvironment-friendly, sustainable system of production, even if it means a lower yieldrate. This debate throws open the whole gamut of options available in managing ouraquatic ecosystems.
Capture and culture fisheries
One of the useful criteria for demarcating the culture and capture fisheries is theextent of human intervention in the management process. In a typical capture fishery, thewild untended stock of organisms is harvested with little human intervention on eitherhabitat variables or the biotic communities. On the other hand, in a culture fishery, thewhole operation is based on captive stocks with a high degree of effective human controlover the physico-chemical water quality and other habitat variables. The marine fisheriesis the example of capture fisheries and the intensive aquaculture of fish and prawn in smallponds is the typical culture fishery.
Fishery management purely on capture fishery lines, as understood in case ofmarine fisheries seldom operates in the inland waters of India, with the possible exceptionof rivers and estuaries. Catches from rivers are actually falling drastically in the worldover, due to the negative impact of human activities on the aquatic environment. Most ofthe open waters which contribute substantially to fish production such as reservoirs, beels,boars, chaurs, etc are managed on the basis of culture-based fisheries or various forms ofenhancement, which are intermediate to culture and capture fishery norms. However, thesenorms lack conceptual clarity due to the absence of clearcut definitioni Since semanticconfusion regarding definition of water bodies and management norms is very muchevident in the literature, an attempt is made here to define and explain some of them.
Resources
Floodplains, wetlands and floodplain wetlands
Floodplains: Floodplains are the flat land bordering rivers that is subject toflooding which tend to be most expansive along the lower reaches of rivers (Matlby, 1991).In many cases, floodplains are associated with coastal lowlands and often end in estuariesand deltas. They can also spread out into large deltas at a considerable distance from thecoast. The floodplains are either permanent or temporary water bodies associated with
14

rivers that constantly shift their beds especially in the p<?tamon regimes. The frequencywith which a river changes its course depends on a number of variables like flow velocity,sediment transportation rate, slope, channel pattern, water and sediment yield, amount andduration of precipitation over the catchment area, texture and lithology of soil, tectonicstatus, and so on. According to Leopold et al. (1964), a typical floodplain will include thefollowing:
i) The river channel
ii) Ox-bows or ox-bow lakes: These represent the cut-off portion of meander bendsof a river, usually serpentine or horse-shoe shaped.
iii) Point bars: These are loci of deposition on the convex side of curves in the riverchannel.
iv) Meander scrolls: Depressions and rises on the convex side of bends formed as thechannel migrates laterally down-valley by the erosion of the concave bend.
v) Slough: Areas of dead water formed in the meander scroll depressions and alongthe valley walls as flood flows move directly down valley scouring adjacent to thevalley walls.
vi) Natural levees: Raised berns or crests above the floodplain surface adjacent to thechannel, usually containing coarser materials deposited as floods flow over the topof the channel banks. These are most frequently found at the concave bank and aresubmerged annually. They are most frequently found at the concave bank and aresubmerged annually. They may be absent or imperceptible where most of the siltload in transit is fine grained.
vii) Backswamp deposits: Overbank deposits of finer sediments deposited in slackwater ponded between the natural levees and the wall or terrace riser. These aresubmerged for long periods of the year.
viii) Sand splays: Deposits of flood debris usually coarser sand particles in the form of_splays or scattered debris:
15
According to flow of water, the floodplains can be divided into two groups:
a) The plain (lotic component): Includes the river channel (s), the levee region whichmore or less follows the river channel course and the flats (extending from thelevees to the terrace or plateau delimiting the plain. While the main channel (s) ofthe river usually retains waters (not necessarily flowing water) throughout the year,the levee regions and the flats are seasonally inundated but remains dry for at leastsome parts of the year.
b) The standing water (lentic component): Receding floods leaves permanent or semi-permanent standing waters in the form of sloughs, meander scroll depression,backswamps or the residual channel (ox-bow lakes). These water bodies expandor contract in area according to annual flood cycle and tend to merge into acontinuous sheet or water covering the whole plain during the highest floods.
From fisheries point of view, the division of floodplains intofringingfloodplains,internal deltas, and coastal deltaic floodplains is also important (Welcomme, 1979).
Wetlands: Wetlands continue to be a nebulous concept, evading a universallyacceptable definition. Ramsar Convention defined wetlands as areas of marsh, fen,peatland or water, whether natural of artificial, permanent or temporary, with water thatis static or flowing, fresh, brackish or salt, including areas of marine water, the depth ofwhich at low tide does not exceed six metres, not a precise definition indeed. However,it is generally understood that wetlands occupy the transitional zone between permanentlywet and generally dry environments. They share characteristics of both the environments,yet cannot be classified exclusively as either aquatic or terrestrial (Maltby, 1991).Wetlands playa pivotal role in supporting plant and animal life, maintaining the qualityof the environment on earth. There is an important link between wetlands and the welfareof people in terms of health, safety, food security, navigation, agriculture, post-harvestactivities, fishing and a host of other activities. This relationship is particularly relevant in.case of developing world, where many communities depend on wetlands for themaintenance of traditional subsistence activities, including livestock herding, hunting,fishing and farming. This dependence is much less in the economically developedcountries where the problems related to higher population density and poverty are fewer.Conversely, in the resource poor developing countries, the wetlands are regarded as asource for a number of life supporting economic activities. Therefore, conservationmeasures need to be tailor-made to suit the local requirements, lest it may be harsh on anumber of local communities whose lives are linked to the wetlands. Moreover, there isa traditional wisdom in conserving the natural resources which are followed through
l6
generations to keep the developmental activities sustainable and eco-friendly. Thuswetlands embraces a board category of water bodies which includes riverine floodplains,swamps, marshes, estuaries, backwaters, lagoons, and so on.
Floodplain wetlands: As the wetlands ofIndia are mostly situated on floodplainsof major rivers which form a rich and varied inland fishery resource, they are betterdesignated as floodplain wetlands or floodplain lakes. India has extensive floodplainwetlands (mauns, chaurs, beels,jheels and pats, as locally called), especially in the statesof Assam, Bihar and West Bengal. They can be typical oxbow lakes ii.e., cutoff portionof meander bends), sloughs, meander scroll depressions, backswamps, residual channelsor tectonic depressions (Sugunan, 1995a), though it is very often difficult to establish theiridentity due to natural and man-made modifications to the environment. Bheries are theestuarine wetlands associated with the lower reaches of the river Hooghly and Matlahrivers receiving tidal waters. Irrespective of their origin, these lakes are considered asbiologically sensitive areas as they have a vital bearing on the recruitment of populationsof fishes in the riverine ecosystem and provide nursery grounds for numerous fish species,besides a host of other fauna and flora. They also regulate the water regime and nutrientexchange and act as natural filters. A combination of the processes of river bed evolutionand the effects of extensive flood control and irrigation works have reduced the productionlevels of many of these lakes through siltation, habitat destruction, heavy weed infestationand isolation from the seasonal floods and natural sources of fish stock.
Tanks, reservoirs and lakes
Reservoirs are man-made impoundments, which are created by obstructing thesurface flow by dams, anicuts barrages etc., compared to lakes which are natural waterbodies. Reservoirs have been classified as small « 1000 ha), medium (1000 to 5000ha)and large (> 5000 ha) for the purpose of fishery management. India has 1,485,000 ha ofsmall, 527,000 ha of medium and 1,140,000 ha oflarge reservoirs (Sugunan, 1995b) whichconstitute the single largest inland fishery resource both in terms of resource size and theproductive potential.
Enumeration of the medium and large reservoirs is relatively easy, as they are lessin number and the details are readily available with the irrigation, power and public worksauthorities. However, compilation of data on small reservoirs is a tedious task as they areubiquitous and too numerous to count. The problem is further confounded by ambiguitiesin the nomenclature adapted by some of the states. The word tank is often loosely definedand used in common parlance to describe some of the small irrigation reservoirs. Thus, alarge number of small man-made lakes are designated as tanks, thereby precluding them
17
I _

from the estimates of reservoirs. There is no uniform definition for a tank. In the easternstates of Orissa and West Bengal, pond and tank are interchangeable expression, while inAndhra Pradesh, Karnataka and Tamil Nadu, tanks refer to a section of irrigationreservoirs, including small and medium sized water bodies.
David et al. (1974) defined the peninsular tanks as water bodies created by damsbuilt of rubble, earth, stone and masonry work across "seasonal streams, as againstreservoirs, formed by dams built with precise engineering skill across perennial or longseasonal rivers or streams, using concrete masonry or stone for power supply, large-scaleirrigation or flood control purposes, which is obviously tedious and inadequate.Irrespective of the purpose for which the lake is created and the level of engineering skillinvolved in dam construction, both the categories fall under the broad purview ofreservoirs, i.e., man-made lakes created by artificial impoundment of surface flow. Fromlimnological and fisheries points of view, the distinction between small reservoirs andtanks seems to be irrelevant. Moreover, numerous small reservoirs fitting exactly into thedescription of the south Indian tanks are already enlisted as reservoirs in the rest of thecountry. Therefore, the large tanks need to be treated at par with reservoirs.
Small water bodies
Small water bodies (SWB) is a loosely defined concept, embracing in it, an arrayof natural and artificial water bodies, such as small reservoirs, lakes, ponds, floodplainlakes and small river stretches. Although a precise and universally acceptable definitionis yet to be made, Anderson (1987) included the following water bodies under SWB:
Small reservoirs and lakes less than 10 km' in area,small ponds,canals including irrigation canals,small, ,seasonal, inland floodplains and swamps, andsmall rivers and streams less than 100 km in length,
Excluding:
Mangroves,Large coastal and inland floodplain,coastal lagoons with intensive, well-established fisheries, andfish ponds specifically constructed for intensive aquaculture.
18
-"
Culture-based fisheries and Enhancement
Culture-based fishery : When the fish harvest in an open water system depends solely ormainly on artificial recruitment (stocking) it is referred to as a culture-basedfishery. Manyof the small reservoirs closed beels, and a number of community water bodies in India fallunder this system. The main focus of management here is stocking and recapture. The sizeat stocking, growout period and the size at capture are the important criteria in culture-based fishery management.
Enhancement: Fisheries enhancement is the process by which qualitative and quantitativeimprovement is achieved from water bodies through exercising specific managementoptions. This can be in the form of improving the stock, changing the exploitation norms,changing craft and gear, introducing new forms of access and so on. Apart from improvingthe production of absolute biomass from the water bodies, it can also be in the form ofinterventions on access to the fishery or improvements in their monetary and aestheticvalue. The common norms of enhancement which are relevant to inland water bodies ofIndia are:
i) Stock enhancement,ii) Species enhancement,iii) Environmental enhancement,iv) Management enhancement, andv) Enhancement through new culture systems
/
Stock enhancement (increasing the stock): Augmenting the stock offish has beenthe most common management measure that is followed in the reservoirs in most countriesof the world. Augmentation of the stock is necessary to prevent unwanted fish to utilizethe available food niches and flourish at the cost of economically important species.Stocking of reservoirs with fingerlings of economically important fast-growing species tocolonize all the diverse niches of the biotope is one of the necessary pre-requisites inreservoir fishery management. The main aspects of stock enhancement are selection ofspecies of stocking, determination of stocking rate and the size at stocking.
Species enhancement is planting of economically important, fast-growing fish fromoutside with a view to colonizing all the diverse niches of the biotope for harvestingmaximum sustainable crop from them. It can be just stocking of a new species orintroductions. Introduction means one time or repeated stocking of a species accidentallyor deliberately with the objective of establishing its naturalised populations (Welcomme,
19

1988). This widespread management practice has more relevance to larger water bodies,where stocking and recapture on a sustainable basis is not feasible. Introduction of exoticspecies is a subject of hot debate due to its possible impact on the biodiversity of ouraquatic ecosystems.
Environmental enhancement is improvement of the nutrient status of water by theselective input of fertilizers. Although this is a common management option adopted inintensive aquaculture, a careful consideration of the possible impact on the environmentis needed before this option is resorted to in reservoirs.
There are other forms of enhancement such as management enhancement whennew management options are exercised. For example a water body can be thrown open forsport fishing to attract fishers or a community management approach can be adopted. Thenew culture systems such as cage and pen culture can be resorted to augment yield andincrease revenue.
Conclusion
India is one of the richest countries in the world in terms of small water bodies.With more than 1.5 million ha of small reservoirs, 200,000 ha of floodplain wetlands and40,000 ha of estuarine wetlands (bheries) there is ample scope for developing culture-based fisheries and various forms of enhancements. Considering the possibleenvironmental impact and the socio-economic scenario of the country, it is perhaps notfeasible to develop intensive aquaculture in the inland sub-sector, beyond certain limit.Enhancements and culture-based fisheries, therefore hold the key for future efforts towardsyield optimization.
References:
Anderson, A., 1989. The development and management of fisheries in small water bodies.In Giasson, M and Gaudet, J. L. (Eds.) Summary of Proceedings and selectedpapers.Bymposium on the developemnt and management of fisheries in smallwater bodies. Accra, Ghana, 7-8 December 1987. FAO Report No. 425: 15 - 19.
Leopold, L. B., M. B. Walman and 1. P. Miller, 1964. Fluvial processes ingeomorphology. San Francisco, WiH. Freeman, 522 pp.
Maltby, E., 1991. Wetlands and their values. In Wetlands Facts on file, Oxford,New York. 223 pp.
20

Sugunan, V. V., 1995a. Reservoir fisheries ofIndia, FAD Technical Paper No. 345. Foodand Agriculture Organization, Rome. pp. 423.
Sugunan, V. V., 1995b. Floodplain lakes- a fisheries perspective. In (ed.) Howes, J. R.Conservation and sustainable use of floodplain wetlands. Asian Wetland Bureau,Kuala Lumpur. 123pp.
We1comme, R. L., 1988. International introductions of inland aquatic species. FADTechnical Paper, 294. Food and Agriculture Organization Rome. pp. 318.
We1comme, R. L., 1979. Fisheries ecology of floodplain rivers. Longman. London andNew York. 317 pp.
*************
21

Summer School on Fisheries Enhancementin Small Reservoirs and Floodplain LakesCIFRI Barrackpore 14 Julv to 12 August 1997
Floodplain wetlands-an important inland fishery resource of India
K. K. VassCentral Inland Capture Fisheries Research Institute,
Barrackpore- 743 101, West Bengal
Introduction
Fisheries sector has made great strides during the last five decades with theproduction levels increasing from mere 0.75 million t offish and shellfish in 1950-51 toover 4.9 million t in 1995-96.The fish production has increased by 6.6% on an average perannum since the beginning of Seventh Five Year Plan. Out of the total yield of 4.8million t during 1994-95, the marine and inland sectors have yielded 2.8 and 2.04 milliontonnes respectively. In the inland sector, it is reported that about 70% of the production ismet through aquaculture and the rest from open water fisheries.
In spite of this impressive performance, there is a wide gap between the demandof fish from the rapidly increasing population and its availability due to steady decline infish yield from open waters especially rivers, estuaries, and other such water bodies. It issuggested that this gap will be bridged by aquaculture production but it seems unlikelybecause intensive aquaculture will require high investment which is a big constraint.Therefore, to meet the targeted production of 6.36 million t at the end of IX Five YearPlan, apart from promoting aquaculture, we will have to focus our attention to achieveoptimum sustainable yield from the floodplain wetlands, reservoirs and other smallimpoundments, which can be subjected to ecological management and fisheryenhancement strategies.
23

Inland Resources
Rivers, the lifeline of our country, are the vast repository of unmatched biologicalwealth. The, 14 large, 44 medium and innumerable minor rivers are characterised by theirhighly diverse fish fauna. While the 14 large systems form 83 percent oftotal drainage areaof the country, the next group of 44 rivers constitute another 7 percent ofthe total area.The area under different resources is reported at 1.64 lakh km of rivers and canals, 31.50lakh ha of reservoirs, 22.54 lakh ha of ponds and tanks. The floodplain lakes are acontinuum of the river and this resource constitutes an area of about 2 lakh ha in the Gangaand the Brahmaputra basins. These ecosystems are important as they have a vital bearingon the fisheries and ecology of the river system.
Wetland types in India's geographical zones
• Reservoirs, and other water bodies of the Deccan peninsula
• Backwaters and estuaries of the west coast of the peninsula
• The vast saline expanses of Rajasthan and Gujarat (mainly Rann of Kachh)
• Freshwater lakes and reservoirs from Gujarat eastwards through Rajasthan andMadhya Pradesh.
• Deltaic wetlands (including mangroves), lagoons, and salt swamps ofIndia's eastcoast
• Marshes,jheeis, terai swamps, and chaur lands of the Indo-Gangetic plain
• Floodplain ofthe Brahmaputra and the marshes and swamps in the hills of north-eastern India
• Lakes and rivers of the montane (primarily Palaearctic) region of Kashmir andLadakh
• Wetlands (primarily mangroves associations and coral reefs) ofIndia's island arcs
24
,./
I\

·Floodplain wetland resources
The eastern states viz., West Bengal, Bihar and Assam are dominated by thefloodplains of the Ganges and Brahmaputra and many smaller rivers. They also supportsome of the densest human populations in the sub-continent. Thus, the wetland resourcesin this region are of enormous importance to the economic and social development of thesethree states but are also under ever increasing pressure of over-exploitation, conversion toother land uses through drainage or reclamation projects and pollution and degradation oftheir catchment. The resources in these states and adjoining areas are tabulated inTable 1.
Table 1. Floodplain wetland resources oflndia
State Area (ha)
Bihar 40,000
West Bengal 42,500
Assam 1,00,000
Other NE States 19,213
.Total 2,02,213
Definition of Wetland
The term wetlands is used for such diverse habitats in different climatic zones ofthe earth that it is indeed difficult to define it in simple terms. Accordingly, wetlands havebeen defined variously in the past two decades. The definitions range from simple workingdefinitions to highly technical ones.
The IUCN defined wetlands broadly for the purpose of the Ramsar Convention onWetlands oflnternational Importance (IUCN 1971) as areas of marsh, fen, peatland orwater, whether natural or artificial, permanent or temporary, with water that is static orflowing, fresh, brackish orsalt '. including areas of marine water the depth of which atlow tide does not exceed six metres. Cowardin et al. (1979), on the other hand, useddetailed scientific criteria to define wetlands and according to them: Wetlands are landstransitional between terrestrial and aquatic systems where the water table is usually at ornear the surface or the land is covered by shallow water and wetlands must have one ormore of the following three attributes (1) at least periodically , the land supports
25;i

p:edominan,tly.hydrophytes ,(2), the substrate is predominantly hydric soil, and (3) thesubstrate is non-soil and is saturated with water or covered by shallow water at some timeduring the growing season of each year.
In India, there is no single word equivalent to wetland. The marshes are known aschaurs, mauns and pats in Bihar, and' beels, boar, j heel jn West Bengal, Assam and theNortheast. Large shallow lakes are called tals in Uttar Pradesh and Madhya Pradesh andthey. are called Sar and Dal in Jammu & Kashmir. But wetlands have to be identified anddistinguished from other ecosystems by their ecological characteristics alone for their
, proper management, However, the Ministry of Environment and Forests, Government ofIndia, has adopted the IUCN definition which is used. by the Ramsar Convention for thepurpose of its wetland conservation programme. ~
Flo~dplain formation and its importance
..It-is. important to remember that floodplains and their unique wetlands have
evolved over many millennia through the natural processes of flooding and river bedmovement caused by extreme climatic and geological events. Iii tropics and sub tropics,these events (particularly the monsoon rains) "areeven more extreme. Floodplain wetlands'therefore play an extremely important role in the maintenance of stability in 'lowland'ecosystems, providing effective floodwater retention and release as wen. as absorption andcycling. It is therefore not surprising that due to physical modification of floodplains tosuit human needs, many ofthese functions have been lost or reduced. This, in turn, has ledto more catastrophic events as extreme flooding and loss of human lives .. .
These wetlands provide abundant drinking and irrigation water, protein and othernutrient requirements for human survival (plants, fish, birds etc.) building materials(reeds and timber), transport and communication routes, effective sewage treatmentsystems, fertile soils for agriculture and buffer against flooding, erosion and nutrient loss.In addition, floodplain wetlands are areas of high biodiversity. They often support largenumbers of resident waterbirds and provide 'essential (and often internationally important)r~-fuelling and over-wintering sites for huge numbers of migratory waterfowl and waders.
Benefits from Floodplains
Apart from other benefits that accrue from these resources, the fisheries is one ofthe most important activity which is directly linked with rural economy. The ecological.data generated in many ecosystems indicate that floodplains in the Indo-Gangetic belt areeither eutrophic or in the process of attaining higher trophic levels. These nutrient-rich and
. .26
•../<
I,

biologically diverse ecosystems generally possess high potential for in situ fish productionand in some cases the topography of the system is such that all the fish from its catchmentget collected in the wetland. The average annual productionfrom such water bodies is ,estimated in range of 100 - 300 kg/ha/yr depending upon the level of management.
In floodplains which have retained their connection with the parent river, adult andjuveniles of Indian major carps undertake migration 'during monsoonto breeding andfeeding pastures in the freshly inundated floodplains. In the closed lakes (those which havelost connection with main river), the fishery comprises catfish and small sized species.Devoid of auto-recruitment of major carps, the fish yield in these closed systems is low,which can be increased by species enhancement carried out through stocking.
Typical Ecological Status of a Wetland
Wetlands usually are at higher trophic levels having enriched water and sedimentquality. This helps in maintaining sustained high primary productivity both in terms ofphytoplankton and macrophytes, and at times basin is overgrown with macrovegetation.This high detrital and nutrient loading from the catchment is' favourable for raising goodfish crop, provided proper management strategies are followed. Some of the ecological. .
features in a beel in West Bengal are tabulated in Table 2.
Fish & Fisheries in Indo-Gangetic floodplains
Composition & Recruitment
In the Indo-Gangetic wetlands, fisheries is the most important activity. The fisheryis dominated by miscellaneous species followed by major carps, catfish and live fish. The 'contribution of detritus feeders is generally poor. The main species encountered are Callacatla, Cirrhinus mrigala, ,Cyprinus carpio, Hypophthalmichthys molitrix,Ctenopharyngodon idella, and Labeo. calbasu among Indian and exotic carps. Catfish arerepresented by Wallago=auu and Mystus aor. Other groups present are murrels,featherbacks, air-breathing catfish and climbing perch. The variations encountered in fisgcomposition and different varieties of predatory and weed fish are tabulated in Table 3.
In live floodplain lakes, the migratory habits of certain fish, especially commercialgroups, is of special significance. Adults andjuveniles ofIndian major carps exhibit suchmigrations during monsoon to breeding and feeding sites in freshly inundated floodplains.In closed lakes, the fauna comprises catfish and small-sized species. Devoid of carps, theproductivity of such lakes is low. The situation in live lakes is typical in that the recruits
27

come from the river, majority of them entering the fishable stock during their very firstyear of life, on an average when they are only 6-8 months old. Although the populationof such species is caught regularly, the stock is supplemented through fresh recruitmentevery year. Decreasin mesh sizes of nets used in the fishery and shallow water throughoutthe fishing season can, however, cause complete annual removal ofthe fish stock. Further,all fish small and big, are utilised for human consumption with none discarded at anystage.
Table 2. Ecological features of a floodplain lake in. West Bengal
Parameter Values (range)
pH 7.6-8.0
Dissolved oxygen (mg/l) 5.6-7.78
Alkalinity 9.6-167
Conductivity (umhos/cm) 252-650
Dissolved organic matter (mg/l) 1.0-2.4
Phosphate-P (mg/l) 0.03-0.06.Nitrate-N(mg/l) 0.12-0.25
Plankton density (units/I) • 315
Zooplankton density (units/I) 174
Macrophyte biomass (g/ m2/dry wt.) 760
Benthic biomass (g/ m2/dry wt.) 2.52
Detritus (g/m2/dry weight) .. 3fi7
Fish yield range (kg/ ha/yr) 150-450
Algal photosynthesis (Call m2/y x 10-8) 29-48.2
Fish yield (Ca:lI m2/y) "" 48,080-58,200
Transfer efficiency % (primary to fish production) 0.156-0.390
In live fl odplain lakes, the migratory habits of certain fish, especially commercialgroups, is of special significance. Adults and juveniles of Indian major carps exhibit suchmigrations during monsoon to breeding and feeding sites in freshly inundated floodplains.In closed lakes, the fauna comprises catfish and small-sized species. Devoid of carps, the
28

productivity of such lakes is low. The situation in live lakes is typical in that the recruitscorne from the river, majority of them entering the fishable stock during their very firstyear of life, on an average when they are only 6-8 months old. Although the populationof such species is caught regularly, the stock is supplemented through fresh recruitmentevery year. Decreasin mesh sizes of nets used in the fishery and shallow water throughoutthe fishing season can, however, cause complete annual removal ofthe fish stock. Further,all fish small and big, are utilised for human consumption with none discarded at anystage.
Table 3 : Percentage composition of fishes in Indo-Gangetic wetlands
Fishery Bihar West Bengal Assam
Carp 3-22 20-65 12-21
Catfishes 10-62 NtI-9 7-10
Murre1s - Nil-15 -
Featherbacks - Nil-25 3-5
Air breathing catfishes I - 10-25 6-24
Hilsa - - 0.01-0.59
Shrimps 3-11.4 - -
Misceilaneous 19-61 15-43 48-60*
* Including prawn
Craft & Gear
Usually dinghy, catamaran and other country boats are used by fishermen to catchfish from the wetlands. The length of these boats ranges from 4.8 to 18.3 m. Also a richassortment of traditional fishing gear are used by these fishermen. Active gear like drag,gill, cast and scoop nets are used mainly during the post-monsoon period. Certainimprovised fishing methods, viz., Katal fishing is also used during some part of the year.However, in weed-infested areas, the retrieval of fish is beset with many problems.
Productive potential
Floodplain lakes by virtue of their higher trophic level are capable of giving highfish production to the tune of about 0.2 million t yr. It has been reported that a productionrate up to. 1000 kg/ha/yr can be achieved through scientific management. Fish yield can
29

•be further enhanced by adopting pen and cage culture in selected water bodies whereproduction level up to 4 t/ha has been demonstrated. The investigations on energytransfer conducted insome of the West Bepgal beels have shown that, on an average,efficiency of 0.246% is achieved. This was increased to 0.5% by stocking a biomassequivalent of 10980 cal/mvyr and harvesting 53520 cal/rrr' /yr as fish biomass in a pilotscale experiment conducted in a beel in West Bengal. Further, attempt ~as made todevelop stocking norms on energy input- output relationship.
Conclusion
The wetlands are a valuable national resource and fishery ( aquaculture) is anacceptable use for economic development. However unchecked growth of this activity.especially the intensive aquaculture involving heavy organic and chemical inputs shouldnot- be permitted without prior knowledge about the ecological status of a particularwetland; There is no serious ecological impact in allowing fishery based on sound'management principles in wetlands. A wise use policy for wetlands is essential.
'*************
30
\,;I
Summer School an Fisheries Enhancementi;, Small Reservoirs and Floodplain LakesCIFRI Barrackpore 14 July to 12August 1997
Soil quality parameters and their significance in the fisheriesmanagement of small water bodies
K. ChandraCentral Inland Capture Fisheries Research Institute
Barrackpore - 743 101, West Bengal
Creation of reservoirs, large or small, by impounding the river run off, forirrigational, hydroelectric, water supply, navigational and flood control purposes bringsabout radical changes in the riverine ecosystem. Organic suspensoids, brought in by the'running water, settle down, disintegrating and releasing nutrients in to the water phase.These changes in the existing bottotn sediments and water quality provide a favourableenvironment for settling ofthe various aquatic life. Such biomass rarely attains the degreeof stability as in natural lakes; on account of the frequent changes in hydrologicalconditions but get only partially adjusted. Productive potential of reservoirs, however,increases with ageing, as they change from oligotrophic to eutrophic condition.
These suspended particles and dissolved salts undergo sedimentation andprecipitation under altered physico-chemical conditions with the result that theproductivity of the reservoir or pond is influenced by the basin soil only for the first twoor three years. After this period, the period of trophic depression starts and finally theequilibrium condition of the fertility is reached. In the case of many reservoirs however,complete static eqilibrium is not possible due to withdrawal of water and of the riverinflow into the reservoir.
The chemical properties of water in reservoirs and ponds are more or less areflection of the properties of the bottom soil. Often acid waters result from acid soils 'andcalcareous bottom soils give rise to alkaline waters. However, because of the complexitiesinvolved in the production of soluble nutrients in the soil, a direct correlation between soil-water-nutrient relationship is not possible. The underwater soil acts as a laboratory to
31
release the nutrients required for water productivity from the raw materials which consistof organic matter and mineral constituents of clay fraction of the soil by chemical and bio-chemical means.
Reservoir productivity is very much influenced by the quality ofthe basin soil andthe water column standingover it. Water quality of reservoirs vary widely from one partto the other. It is known that water with high alkalinity and dissolved salts are moreproductive than those with low values of these parameters. The major chemical factors ofimportance are pH, total nitrogen, organic carbon, elN ratio, available nitrogen, availablephosphorus, exchangeable calcium and free calcium carbonate which play vital role inpond productivity. .
The soil formation under water in ponds and reservoirs differs from that of the landsoil in many respects. Firstly, they are formed as a result of the mixture of different soilprofiles and being permanently water logged, gas phase is usually absent. Secondly,reservoirs and ponds receive dissolved and sedimentary particles imported by the riversand from its catchment area carried by precipitated~ain water.
The soil substrate generally consists of two biologically significant layers. Theupper layer is loose, well aerated and consists of colloidal organic matter and the lowerlayer is the anaerobic zone containing mineral matter in varying composition. Theproportion of these two layers play an important role in directing the physical, chemicaland biological processes like I) release of minerals ii) absorption of ions as colloidal layersand iii) decomposition of organic matter by micro-organisms. Mechanically, the bottomsoil should not be so adsorptive as to impoverish the water off all its nutrients and at thesame time it must not be so inactive to permit excess loss of nutrients. The superficial soillayers should have well aerated structure facilitating the oxidative decay of organic matter.
pH of the soil, like water, is dependent on various factors. In an ill aerated mudlayer, when the oxygen supply falls short, the decomposition areas are mainly reduced orpartially oxidise compounds and short chain fatty acids. These acids makes the soilstrongly acidic. It is naturally buffered; with low rate of bacterial action, ultimately leadingto less productivity. pH of the soil also influences translocation of soluble phosphates tounavailable forms and controls the adsorption and release of essential nutrients at soilwater interface. Both for soil and water, a slightly alkaline pH (7.5) has been consideredoptimal for fish production. Productive soils range mostly between slightly alkaline toslightly acidic (6.5-7.5) in reaction, highly acid soil (below pH 4.5) and highly alkaline soil(PH above 8.5) are generally unproductive and in these soils, available phosphorus is verypoor. An acidic reaction favours the precipitation of soluble phosphate into insoluble form
32
.>

rendering it unavailable to phytoplankton. An acidic reaction may also result in inadequatesupply of calcium. Under usual photosynthetic activities, the pH of pond water increases
r and reaches alkaline range during day time. This helps to maintain the pH of water slightly(alkaline, which is conducive for a long period even during the night time. ~\neutral to" i
slightly alkaline reaction is favourable for the growth and activity of the microorganismswhich carry out the process of mineralisation of the organic matter already present in themud or the organic manure added toit resulting in the release of nutrients particularlynitrogen present in available form.
It is well recognised that phosphorus is as an assimilator of nitrogen into cellularmatter. Due to its reactive nature, phosphorus ions form insoluble compounds with ironand aluminium in soil under acid condition and with calcium under alkaline conditionrendering them unavailable to water. A considerable amount of phosphate ions also remainadsorbed on colloidal complexes. Thus, it is not the total phosphorus but its different formsand conditions controlling their release to water which are important. Except under highacid conditions most of the inorganic phosphorus in soil is bound up as insoluble calciumphosphorus and adsorbed phosphates on colloids. Both these forms are rendered solubleunder acidic and reducing condition. In addition, phosphorus is also present in organicform in soil which is mineralised to soluble inorganic phosphate by bacteria, a processmuch imbedded under acid condition soils with available phosphorus. The organic formof phosphorus unless it is mineralised to the inorganic form, is of no use to phytoplankton.Such transformation from the organic to inorganic form is primarily carried out by someaerobic group of micro organisms. But in the environment prevailing in the bottom mud,which is mostly anaerobic, the population and activity of the above group ofmicroorganisms is at low level and hence the contribution of the organic form ofphosphorus present in the mud is of little consequence in maintaining a good phosphorusstatus in the pond. Under prevailing anaerobic environment in the bottom mud somechemical changes take place resulting in the solubilization of insoluble in-organicphosphate which include I) reduction of molecule ferric phosphate to more soluble ferrousphosphate ii) dissolution of insoluble tricalcium phosphate to more soluble mono calciumphosphate by the dissolved oxygen, weak carbonic acid-organic acid formed as a result ofdecomposition of organic matter. Phosphorus below 3.0 mg/IOO g soil is said to be poor,3-6 average and above 6 mg/l 00 g is high productive.
Nitrogen is present in the mud mostly in organically combined complex form.Unless it is transformed into inorganic form viz., NH+ and NO] through a chain ofbiochemical reactions, the element can not be taken up by phytoplankton. Suchtransformations from organic to inorganic form which is known as mineralisation is carriedout by various groups of micro- organisms. In the absence of sufficient oxygen in the
~3
/'
bottom mud, obligate and facultative anaerobic micro organisms participate in the process:the end product ,of the process being ammonical nitrogen (NH4) which when diffuses intooverlying water and comes in contact with oxygen, gets nitrified to nitrate by nitrifyingbacteria. The nitrate ion being highly diffusible, diffuses in an aerobic zone of the bottommud due to the development of concentration ingredient and it gets denitrified there. Dlie-to the occurrence of the nitrification and denitrification process in the mud water system;there is a considerable loss of nitrogen, both native and applied from water. Further duringthe noon time when the pH of the water rises to the alkaline range due to vigorousphotosynthetic activity ofthe chlorophyll bearing organisms present in water, considerableamount of ammonical nitrogen (NH4+) formed as a result of mineralisation is lost throughvolatilization as NH3 gas.
Nitrogen a basic and primary constituent of protein, is no less important thanphosphorus. Nitrogen in soil is present mostly in inorganic form, the fraction present inor~anic form being amino acids, peptides and easily decomposable proteins. Availablenitrogen below 25 mgll,OOg soil gives poor production, in the range 25-75 mgl1 00 g soilproduction may be high. Organic compounds are more varied and complex as compared
, ,
to mineral constituents of the soil. Organic carbon less than 0.5% can be considered lowfor pond soil, the range 0.5~1.5% is average while 1.5 to 2.5% is considered to be optimalfor productivity. The study of elN ratio is considered as important as the carbon contentitself. CIN ratio below 5.0 indicates' poor productivity while 5-10 shows averageproduction.
Specific conductance of the pond bottom mud is an index of the water soluble saltswhich is usually higher than that of.the soil of an adjacent agricultural field. Total olublesalts in the bottom mud of a fish pond gradually increases with the time it remainscontinuously under water. Changes in specific conductance are associated with release ordepletion of soluble ions in the mud water system and they are likely to have all indirectrole to play in the productivity of pond water.Specific conductance of soil is commonlyused as an indicator of total concentration of the cations (or anions) in the soil and it isclosely related to the total d,issolved solids.
../'
Potassium ranks as a major nutrient element with nitrogen and phosphorus.Exchange of potassium between soil and water is less dependent on carbon cycle. It doesnot form insoluble compounds and its passing off from soil to water is favourable byhydration of soil colloids with the result that potassium compounds deficiency inimpounded water is rarely met with.
34
I(

r 'Bottom mud is usually rich in clay and humus and hence exhibits high cation
exchange capacity. This helps in keeping applied potassium in the mud in exchangeableform where from it can be easily released to overlying water. The NH/ Of Fe2+ ions whichare formed in the mud due to reductive process can displace K'T' from the exchangecomplex of the mud resulting in its release to the water to be available to thephytoplankton. There ale sometypes of clay minerals viz . .illite, which have the capacityto fix or bound K+ ions within their lattice. Such lattice bound K+ remains strongly heldand is released very slowly to the exchangeable form and then to the water soluble form.Hence, ifbottom mud contains predominantly such type of clay minerals, then much of theadded potassium is reduced and remained temporarily unavailable due to the latticefixation mechanisms. Similarly, the ponds which are situated in the lateritic soil zone havepredominantly kaolinite types of clay minerals in their mud, which have very low cationexchange capacity. Further, humus content in the muds of such ponds is alsocomparatively low. Accordingly, the total cation exchange capacity of the mud is alsolow. Hence in such cases, there is possibility of much losses of added K+through leaching.It is, therefore, essential to know the nature and properties of bottom mud particularly thetype of dominant clay mineral while formulating an efficient potassium managementprogramme. Calcium is generally present in the soil as carbonate. The amount ofexchangeable phosphate in bottom mud is inversely related to the marl-organic matterratio, so that phosphate in highly organic soil with low calcium soluble phosphate,remains absorbed in an exchangeable form. Where sediments are very low and inorganicmatter is very high in marl, phosphorus probably remains fixed in insoluble precipitation.
Among the trace elements, probably manganese has been more extensively studied.Manganese in soluble form inbottom soil contributes to the soluble managenese in waterwhich play an important role in plankton productivity. The role of soil manganese as, amineralising agent for organic matter has also been studied and found to compare well withlime and phosphorus. .
********1<**

Summer School on Fisheries Enhancementin Small Reservoirs and Floodplain LakesCIFRJ Barrackpore 14July to 12August 1997
Microbial indices for assessing aquatic productivity
R. K. DasCentral Inland Capture Fisheries Research Institute
Barrackpore- 743 101, West Bengal
tI
It is well know that the concentration of dissolved oxygen (DO) plays a major rolein aquatic production in any water body but its concentration- does not remain fixed at onepoint ofthe sunlight with the advance ofthe day and gradually decreases after sunset andfinally becomes minimum before dawn and once again the cycle is repeated. On a cloudyday, DO increas€s very slowly and decline irt DO becomes more conspicuous after dusk.Under high planktonic bloom, particularly, when the secchi disc transparency at noon isbelow 15 em, the depletion of DO after sunset becomes very fast and fish suffer at nightdue to low DO in the ambient water. Therefore, it is essential for a farmer to know the DO •position at night before hand and take proper measure in advance so that DO value doesnot fall below 3.0 ppm at night or before dawn (Boyd, 1982) as the DO value below 5.0ppm for more than 8 hours is harmful for growth and reproduction of fish.
From our diurnal studies in different water bodies, we have seen that the positionof DO at night can be understood by estimating the microbial consumption of DO per hourby Winkler's method. In this method two black bottles filled with ambient water are to besuspended in water one with one drop of formaldehyde (A) and another (B) withoutformaldehyde for four hours from 10.0 AM to 2.0 PM, after estimating the initial DO inppm in another white bottle (I). Now DO values in the two black bottles are also to beestimated after 4 hours of suspension in water. From the above three DO values themicrobial consumption of DO per hour (K) in ppm can be calculated as follows:
K= I (A-B)/4 in ppm per hour.
J7

It has been seen that when K is less than 0.5 ppm/hr, DO does not act as the stressfactor for fish and prawn in any water body but when K is' above 0.5 ppm/hr or near 1.0ppm/hr, DO at night or before dawn becomes severe stress factor for fish and prawn andheavy loss in production occurs in such cases either due to mortality or due to out breakof diseases. Thus, by measuring microbial consumption of DO per hour in the day time wecan take requisite measures to any loss in production in due course. .
Measurement of productivity by direct count of bacteria and plankton of a waterbody
Fish often occupies the tertiary position in the food chain of a water body.Consequently, it has to depend on the primary and secondary organisms for the supply offood materials. The direct microscopic count of the bacterio-plankton 'gives a quantitativeestimation of the productivity of the water body. This method gives the number of all thecells of microorganisms present in a given sample of water (Razumov, 1947; Kuznetsov,1959).
Microbial population in a water body is counted on the membrane filters afterfilteration of a definite volume of water sample. The pore size ofthe membrane should notexceed (0.3 mm). The working surface of the filters must be smooth and free fromcontamination.
The filtration is done through a glass millipore type glass funnel, diameter of theworking surface of which is carefully measured. Membrane filters are numbered with apencil. The volume of water to be filtered depends on the productivity level ofthe waterbody. About 10-25 ml is required for low productive water, 5-10 ml is required' foreutrophic waters C\11d0.5 to 1.0 ml is required for heavily contaminated waters. 2-3 ml ofpreviously filtered distilled water is to be added during filteration so as to get a uniformdistribution ofthe microorganisms. The filters are then stained. On a petri dish two to threepieces of ordinary filter papers, moistened ",ith 3% erythrocin solution in 5% phenol areplaced. Now millipore membrane filter paper having small square grids is placed on theerythrocin moistened filter paper overnight and then dried in a desiccator for 20 minutes.
The stained membrane filter is decolourised by placing it on the surface filter papermoistened with distilled water. Membrane filters now look weakly pink in colour. Formicroscopic examination the filters are placed on a drop of immersion. oil placed on thesurface of a glass slide. Onto the surface ofthe membrane of the membrane filter a furtherdrop of the oil is put. By this, the filter becomes' quite transparent showing the colouredmicroorganisms. The filter is covered with a covet' glass and put under-the microscope for
38
f
counting. The number of micro organisms in a small square of the filter is counted. Tensuch squares on each stained membrane are counted and then average is made per eachsmall square: Ten squares of10 such membranes are to be counted for each water sampleand then average is toile-made. Now knowing the volume of water filtered, averagenumber of microorganisms per small square of the membrane filter, diameter of theworking surface of the membrane filter and of the small squate, the number of microorganisms perml. of water can be found out and can becompared with the values of otherproductive water bodies.
N= N x S. cells/ml.a v
N = no. of microorganisms per ml.n = no of microorganism per small squarea = area of the small squares = area of the filtering surfacev = volume of water filtered.
Boyd (1973) reported a mean rate of carbon fixation by photosynthesis of2.55 g/nr'of carbon per day during the growing season. Assuming that dry phytoplankton is 48%carbon (Boyd and Lawrence, 1966), 5.32 g/m' of dry matter were produced daily byphotosynthesis. Assuming, that half of the total production takes place 10.00 hr to 14.00hr, 2.66 g/m? of dry matter were'p;oduced daily by photosynthesis.
Estimation of productivity from the consumption of phosphate-phosphorus
Primary production of a water body has been found to be a function of watersoluble inorganic phosphorus when the concentration of other essential nutrients are intheir optimum range (Das and Dehadrai, 1986). Rodhe (1965) indicated that for a fixationof500 mg of C'm' an absorption of 10 mg of Pzrrr' is essential. This provides the basis forcalculation of carbon fixation from the estimation of microbial consumption of phosphate-phosphorus. Thus for each mg consumption of phosphate-phosphorus 50 mg of carbonfixation will occur. So by estimating initial and final concentration of phosphate fromphosphorus within a period of four hour of incubation between 10.00 hr and 14.00 hr,primary productivity or carbon fixation rate of a water body can be calculated and this canbe compared with the values obtained other water bodies.
39

Average gross primary productivity estimated between 10.00 hr to 14.00 hr hasbeen found to be 1.76 mgll of carbon per hour in fertilized ponds and 0.18 mg/l of C perhour in unfertilized ponds (Boyd, 1973). Hall et al., (1970) reported that primaryproductivity was 10-15 times greater in fertilized ponds than in control ponds. Therefore,by determining initial phosphate-phosphorus concentration and the same after 4 hours ofincubation under ambient condition between 10.00 hr to 14.00 hr, it is quite easy tocalculate the carbon fixation rate and consequently, the productivity of the water body.
Measuring productivity through estimation of bacterial load
Bacterial load of a water body is measured in nutrient agar medium at atemperature of 35°C, gives a good indication of its productivity and quality of water, asthe bacterial load is directly proportional to its nutrient availability and consequently tothe availability of fish food organisms. When this load exceeds critical concentration(l Ovml of'water), bacteria invade various organs offish and reach its muscle (Buras, etal., 1985) and consequently the manifestation of bacterial disease takes place. It has beenobserved that productive waters are having a bacterial load of 102-103 Iml of water or littlemore than this and polluted waters having bacterial load of 104/ml and above. Bacterialload below 10/ml is indicative of low productivity.
References
Boyd, C. E., 1973. Summer algal communities and primary productivity in fish ponds,Hydrobiologia, 41: 357-390.
Boyd, C. E., 1982. Water quality management for pond fish culture. Elsevier ScientificPublishing Company, 318 pp.
Boyd, C. E. And Lowrence, J. M., 1966. The mineral composition of several fresh wateralgae. Proc. Annual Conf., 20: 413-424.
~Burs, N. L., et al., 1985. Reaction of fish to microorganisms in waste water. Applied
Environ, Microbiol. 50 (4): 989-995.
Das, R. K. And Dehadrai, P. V. 1986. Soil water interaction and nutrient turn over in aweed infested swamp. J Inland Fish Soc. India, 18 (2): 13-19.
40
fi

Hall, D. J. et at. 1970. An experimental approach to the production dynamics and structureof freshwater animal communities. Limnol Oceanogr., 15: 839-928.
Kuznetsov S. 1. 1959. Die Rolle der Microorganismen im Stoffkreislaug der seen.VEBDeutscher Verlag der Wissenschaftern, Berlin.
Razumov, A. S. 1947. Methods of microbial studies of water, Moscow, VODGEO.
Rodhe, W. 1965. Sulla productione di fitoplankton in laghi transparenti di alta montagmaMem. 1st Ital Idrobiol, 15: 21-28.
***********
41

Summer School on Fisheries Enhancementin small Reservoirs and Floodplain Lakes,CIFRI. Barrackpore. 14July to 12Au~st 1997
Abiotic habitat variables in the reservoirs and beels and theirrole in the production processes
v. PathakCentral Inland Capture Fisheries Research Institute
24, Pannalal Road, Allahabad
Introduction
Impounding the surface runoff for irrigation, power generation, flood controlnavigation, etc. resulted in the creation of a number of man-made ecosystems. More than3 million ha of water area are available in the country in the form oflarge, medium andsmall reservoirs while more than 2 lakh hectares in the form of both open and closed beelsmainly in eastern U. P., .north Bihar, West Bengal, Assam and other Northeastern States.Reservoirs are characterised by release of deep waters, existence of both lotic and lenticcomponents and wide seasonal fluctuation in water level although in small reservoirs someof these characters do not exist. Beels, on the other hand, are comparatively shallow innature and rich in soil status with penetration of light at the bottom resulting in infestationof aquatic macrophytes with varying magnitudes. Several workers have studied theecology and production dynamics of lakes, reservoirs and beels and have suggestedmanagement norms for the development of these water bodies (Rawson 1952, Northcoteand Larkin, 1956, Ryder et al., 1974, Sreenivasan 1971, Ganapati 1970, Natarajan andPathak 1987, Pathak 1979, Pathak 1989). A few small reservoirs have also been describedas case studies (Khan et al., 1990). Although these water bodies provide immense potentialresource for fisheries development, the actual fish production trend is not encouraging(about 10 kg/ha in large reservoirs and around 100 kg/ha in case of beels). It is thusessential to have a critical examination of the ecosystem itself and the various factorsresponsible for its production process. The abiotic habitat variables, dynamics of chemicalconstitutents and effective circulation of nutrients examined in the present communication,are some of the basic processes which have great bearing on the production of theecosystems. In addition to beels and small reservoirs, some large reservoirs have also beenconsidered for better understanding of role of these parameters in the production process.
43
Indices of productivity
The biological productivity of any water body is influenced by climatic, edaphicand morphometric features. The climatic factors like air temperature, wind velocity andrainfall have great bearing on reserovir productivity. The wide seasonal variation in airtemperature with low volues during winter and high during summer have great influenceon the thermal features of the subtropical reservoirs although in southern peninsular Indiathe seasonal differences are narrow. The incident solar radiation on the water surface alsoshows considerable variation with the location (latitude).
, The fertility of both reservoirs and beels is very much influenced by the quality ofthe basin soil as well as that ofthe catchment area. The status of soil in beels was generallyrich with high values of organic carbon, available nitrogen and available phosphorus(Table 1). But reservoirs have shown wide variations in their soil characteristics. Baringa few the soil status was comparatively poor in reservoir under examination (Table 1). Itis interesting to note that though the soil quality was relatively poor in reservoirs, this wasnot reflected in the water quality which appeared to be related more to the soil conditionsofthe catchment area than to those of the basin alone. Similarly, in case of beels the richnutrient status of soil was not reflected in the water phase probably because ofaccumulation of large amount of nutrients by the macrophytes and effective removal fromcirculation.
The morphometric factors like water levels, depth, water discharge (both in andout), shore development, volume development, etc. also have great bearing on thecirculation of nutrients and energy in the reservoir biotopes. Both water level and depthhave shown wide fluctuations from reservoir to reservoirs. As the climatic and edaphicfactors provide essential source of energy and nutrients they may be considered to be thefirst in order of importance. Morphometric factors which serve as modifying factors thatdetermine heat and nutrient characteristics are second in order of importance. Rawson(1952) obtained an inverse relation between mean depth and productivity based on the factthat shallower water bodies provide better circulation of nutrients. Northcote and Larkin(1956) found that waters with high dissolved solids (TDS) are more productive than those'with low values and reported a direct relation between TDS (an edaphic character) andproductivity. The two ideas were combined by Ryder et al. In Morphoedaphic Index(ME!) which is the ratio of an edaphic character (dissolved solids) and mean depth, amorphometric character, and he used this as an index of productivity. Although this indexgives correct indication of productivity in natural lakes when applied in reservoirs, withfluctuating morphometric characters and the edaphic characters being more influenced bycatchment this index does not always yield accurate results. For example many shallow
44
//
"reservoirs with high values of morphoedaphic indices are low productive while many deepreservoirs are highly productive as illustrated in Table 2 where total alkalinity (a correlateof total dissolved solids) has been used for index calculation. Thus one has to be verycautious in using this index for productivity evaluations. This is more true in case of smallreservoir where depth is generally less with more dominant edaphic characters.
\Productivity trends from hydrological parameters
Reservoirs and beels both vary widely in respect oftheir water quality parameters.It has been observed that water with high alkalinity, conductance and dissolved salts aremore productive than those with lower values ofthese parameters (Northcote and Larkin,1956). In general water with moderate alkaline pH, alkalinity above 50 mg/l, conductanceabove 200 micromhos hasrdness abaove 25 mg/l, organic carbon around 1 mg/l, or above,nitrate above 0.5 mg/l are considered to be productive.
The water quality parameters of some reservoirs and beels have been presented inTable 3. Water was alkaline in all the reservoirswith pH values ranging between 7.7 to 8.8.Except Rihand the water quality parameters in all the reservoirs were in moderate toproductive range. But the nutrient status in respect of both nitrate and phosphate were poor.Assam waters have shown distinctly different water quality than Bengal. In the beels ofWest Bengal (Kulia and Media) water was alkaline in reaction (pH 7.5 to 7.8) withcomparatively high values of alkalinity, conductance, hardness and dissolved salts whereasthe Assam beels showed acidic to near neutral pH with low alkalinity, conductance,dissolved salts etc. except Bilmukh which had comparatively much higher values. Thenutrient status in the water phase was generally poor in all beels, despite the very highvalues in the soil phase. As most of the nutrients are used and locked by the infestedmacrophytes and removed from circulation, water always showed nutrient deficiency.
Dynamics of chemical constituents and evaluation of productivity trends
From the point of view of biological productivity the water in an aquatic systemconsists of two fundamentally different regions one below the other, in which opposingprocesses take place. These are the regions of photosynthetic production (the trophogeniczone) over the regions of break down (tropholytic zone). In photosynthetic zone carbondioxide is taken up by the photosynthetic organisms, resulting in decrease in bicarbonateand increase in carbonate and pH (2HC03 = CO2 + C03 + H20). Oxygen is liberated andincrease in concentration (6C02 + 6H20 = CJfJ206 + 602). In the tropholytic zone oxygenis consumed, carbondioxide is liberated, carbonate is converted to bicarbonate (C6H1206+ 606 = 6C02 + 6H 20; CO 2+ CO 3 + H 20 = 2HC03) and pH decreases with increase in
45
. ~,~,
hydrogen ion concentration increases (C02 + H20 = H2C03 = H++ HCO- ~. At night whenthere is no photosynthesis, the reactions at trophogenic and tropholytic zones are the same.If the rates of reactions in the two phases are high the water body will show sharpvariations in the chemical parameters either with the progress of the day (diel variations)or in depth profile during stagnation period. In deep waters the two zones are separate (incase ofresrvoirs) but in shallow waters variations in the chemical parameters reflect theintensity of reactions in both the zones. As the rate of above reactions are directly relatedto the production (P) and consumption (C) processes the relative productivity of the waterbody can be evaluated from the magnitude of their variations.
In impounded waters the dynamics of chemical constituents is reflected by thephenomenon of chemical stratifications (Ruttner, 1964). Depth wise distribution ofchemical constituents in four reservoirs are presented in Table 5. Sharp changes inchemical parameters like oxygen, carbondioxide, pH and bicarbonate were noted inBhavanisagar, Govindsagar and Nagarjunasagar from surface to bottom during summerstagnation period. High photosynthetic production in the trophogenic zone cause theklinograde oxygen distribution. Hence the oxygen curve gives important clue fordetermining the degree of productivity in reservoirs. The klinograde oxygen distributionin Bhavanisagar, Govindsagar and Nagarjunasagar reflect high productivity of thesereservoirs. The reservoirs showing orthograde oxygen distribution are relatively lessproductive (Rihand).
The decomposition of bottom organic sediments and subsequent decline in oxygenis always accompanied by accumulation of carbondioxide. The enriched carbondioxideleads to an increase in hydrogen ions (H10 + CO2 = H~03 =H++ HCO- ~ and thus lowersthe pH of bottom layers. The bottom accumulation of CO2, fall in pH and increase inbicarbonate due to dissolution of carbonate deposits by accumulated carbondioxide alongwith decline of oxygen from surface to bottom all reflect high productivity in a reservoir.In low productive reservoirs such changes are not marked.
In shallow waters where the two different zones are not marked the diel changesin chemical parameters reflect better productivity trends. The diel variation in chemicalparameters in three beels have been shown in Table 4. A sharp variation in dissolvedoxygen pH, carbondioxide, carbonate and bicarbonate was recorded in all the beels withconsiderable variations in their magnitude .. The intensity was maximum in Kulia beel andminimum in Muktapur. The most important among the chemical changes is the diel cycleof oxygen which is directly linked with both production and respiratory consumptionprocess of both phytoplankton and macrophytes. Dissolved oxygen which was quite lowin the morning (0600hrs) in all the beels, registered a phenomenal increase to 13.6 mg/l
46
./
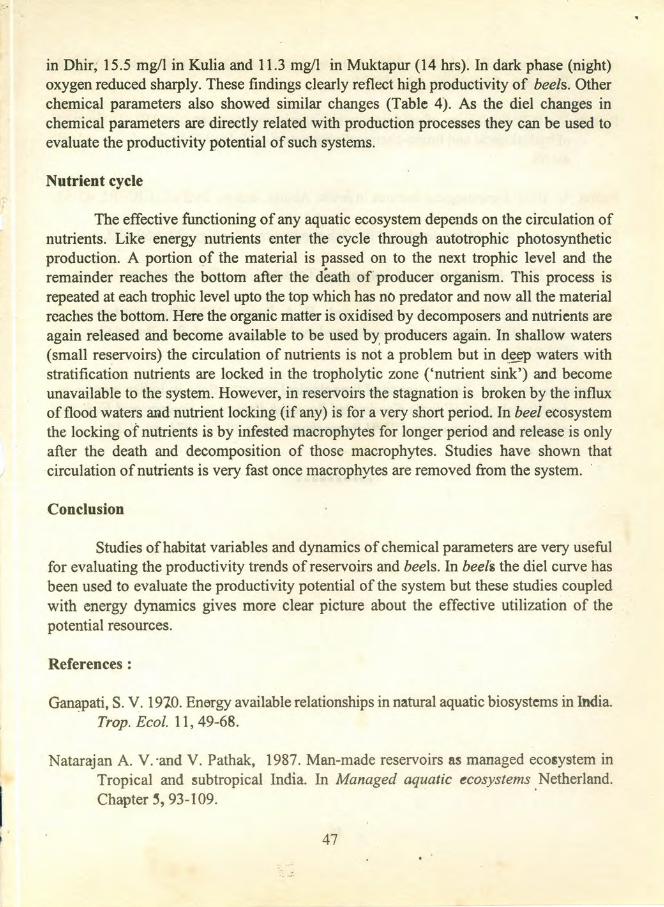
in Dhir, 15.5 mg/l in Kulia and 11.3 mg/l in Muktapur (14 hrs). In dark phase (night)oxygen reduced sharply. These findings clearly reflect high productivity of beels. Otherchemical parameters also showed similar changes (Table 4). As the diel changes inchemical parameters are directly related with production processes they can be used toevaluate the productivity potential of such systems.
Nutrient cycle
The effective functioning of any aquatic ecosystem depends on the circulation ofnutrients. Like energy nutrients enter the cycle through autotrophic photosyntheticproduction. A portion of the material is passed on to the next trophic level and theremainder reaches the bottom after the death of producer organism. This process isrepeated at each trophic level upto the top which has no predator and now all the materialreaches the bottom. Here the organic matter is oxidised by decomposers and nutrients areagain released and become available to be used by producers again. In shallow waters(small reservoirs) the circulation of nutrients is not a problem but in d.~p waters withstratification nutrients are locked in the tropholytic zone ('nutrient sink') and becomeunavailable to the system. However, in reservoirs the stagnation is broken by the influxoffload waters and nutrient locking (if any) is for a very short period. In beel ecosystemthe locking of nutrients is by infested macrophytes for longer period and release is onlyafter the death and decomposition of those macrophytes. Studies have shown thatcirculation of nutrients is very fast once macrophytes are removed from the system.
Conclusion
Studies of habitat variables and dynamics of chemical parameters are very usefulfor evaluating the productivity trends of reservoirs and beels. In beels the diel curve hasbeen used to evaluate the productivity potential of the system but these studies coupledwith energy dynamics gives more clear picture about the effective utilization of thepotential resources.
References:
Ganapati, S. V. 19l.0. Energy available relationships in natural aquatic biosystems in India.Trap. Ecol. 11, 49-68.
Natarajan A. V. ·and V. Pathak, 1987. Man-made reservoirs as managed ecosystem inTropical and subtropical India. In Managed aquatic ecosystems. Netherland.Chapter S, 93-109.
47
Northcote T. G.and P. A. Larkin, 1956. Indices of productivity in British Columbia lakes, .Fish. Res. Board Can. 13, 515-540.
Pathak, V. 1979. Evaluation of productivity in Nagarjunasagar reservoir (AP) as a functionof hydrological and limno-chemical parameters. J Inland Fish Soc. India, 11(2):49':68.
Pathak, V. 1989. Limnological features in beels- Abiotic factors. Bull 63, CICFRI, 43-53.
Rawson, D. S. 1952. Mean depth and the fish production, Ecology, 32,669-672.
Ruttner, F. 1964. Fundamentals of Limnology. Toronto Univ. Press, Toronto, 242 pp.
Ryder, R. A., S.R. Kerr, K. H. Loptus, and H. A. Regier, 1974. The morphoedaphicindex, a fish yield estimator, review and evaluations. J Fish Res. Board Can., 31:663.;688.
Sreenivasan, A. 1971. Recent trends of limnological investigations in Indian reservoirs.1st Workshop of All India Coodinated Research Project on Ecology and Fisheriesoffreshwater reservoirs. CIFRI Barrackpore. Aug 30-31 1971, pp. 1-16.
**********
48
i
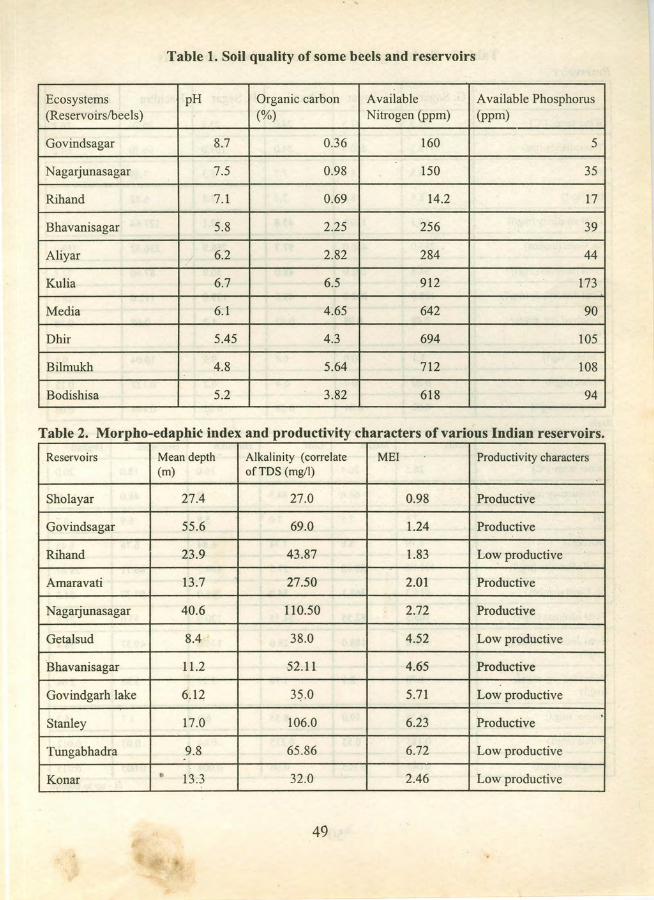
Table 1. Soil quality of some beels and reservoirs
Ecosystems pH Organic carbon Available Available Phosphorus(Reservoirslbeels) (%) Nitrogen (ppm) (ppm)
Govindsagar 8.7 0.36 160 5
Nagarjunasagar 7.5 0.98 150 35
Rihand 7.1 0.69 14.2 17
Bhavanisagar 5.8 2.25 256 39
Aliyar 6.2 2.82 284 44
Kulia 6.7 6.5 912 173
Media 6.1 4.65 642 90
Dhir 5.45 4.3 694 105
Bilmukh 4.8 5.64 712 108
Bodishisa 5.2 3.82 618 94
Table 2. Morpho-edaphic index and productivity characters of various Indian reservoirs.
Reservoirs Mean depth Alkalinity (correlate MEI Productivity characters(m) ofTDS (mg/I)
Sholayar 27.4 27.0 0.98 Productive
Govindsagar 55.6 69.0 1.24 Productive
Rihand 23.9 43.87 1.83 Low productive
Amaravati 13.7 27.50 2.01 Productive
Nagarjunasagar 40.6 110.50 2.72 Productive
Getalsud 8.4 38.0 4.52 Low productive
Bhavanisagar 11.2 52.11 4.65 Productive
Govindgarh lake 6.12 35.0 5.71 Low productive
Stanley 17.0 106.0 6.23 Productive.
Tungabhadra 9.8 65.86 6.72 Low productive
Konar e 13.3 32.0 2.46 Low productive
.. /'
49
!i

Table 3. Hydrological features of reservoirs and beelsReservoirs
G. Sagar N. Sagar Rihand B. Sagar Bachhra Aliyar
Water temp. (OC) 22.5 27.5 24.0 25.8 26.70 26.2
Transparency (ern) 112.1 260.0 54.0 107.0 66.70 64.2
pH 8.8 8.3 7.7 8.3 7.89 8.2
DO(mg/l) 8.8 8.0 7.7 7.5 6.82 7.54
Total alkalinity (mgll) 69.3 110.0 43.8 52.1 127.64 60.2
Sp. Cond (umhos) 215.0 450.0 97.7 268.9 236.52 259.4
Total hardness (mg/I) 54.8 102.0 48.0 50.9 87.60 72.8
Total diss. solids (mg/I) 108.0 232.0 49.2 139.0 112.0 128.0
Dissolved org. matter Q.48 0.98 0.42 1.2 0.68 0.88(mg/l)
Silicate (mg/I) 1.1 30.0 6.4 9.9 10.04 9.5
Nitrate (mg/I) 0.20 0.7 0.4 0.2 0.127 0.28
Phosphate (mg/l) 0.02 0.01 0.08 0.02 0.144 0.06
Beefs
Kulia Media Dhir Bilmukh Bedishisa Dighali
Water temp. (0C) 26.5 26.4 25.0 16.0 18.0 20.0
Transparency (ern) 66.6 84.5 B 48.0 B
pH 7.8 7.5 ' 7.0 5.8 6.9 6.7
DO(mg/1) 7.19 5.6 7.74 6.84 6.76 6.43
Total alkalinity (rng/l) 131.86 89.18 27.5 154.7 46.71 28.67
Sp. Cond (mmhos) 615.3 368.1 54.0 266.0 97.77 54.3
Total hardness (mg/l) \05.5 82.55 24.75 120.0 55.0 27.2
Total dissolved solids 308.0 188.0 28.0 134.0 49.37 38.4(mg/I)
!
Dissolved org. matter 1.70 2.1 3.78 3.27 3.88 2.04(mg/l)
Silicate (mg.l) 10.35 19.0 8.55 6.0 1.7 5.2
Nitrate (mg/I) 0.185 0.53 0.225 0.04 0.Q3 0.012
Phosphate (mg/I) 0.045 0.105 0.06 0.004 0.005 0.015
B - up to bottom
so
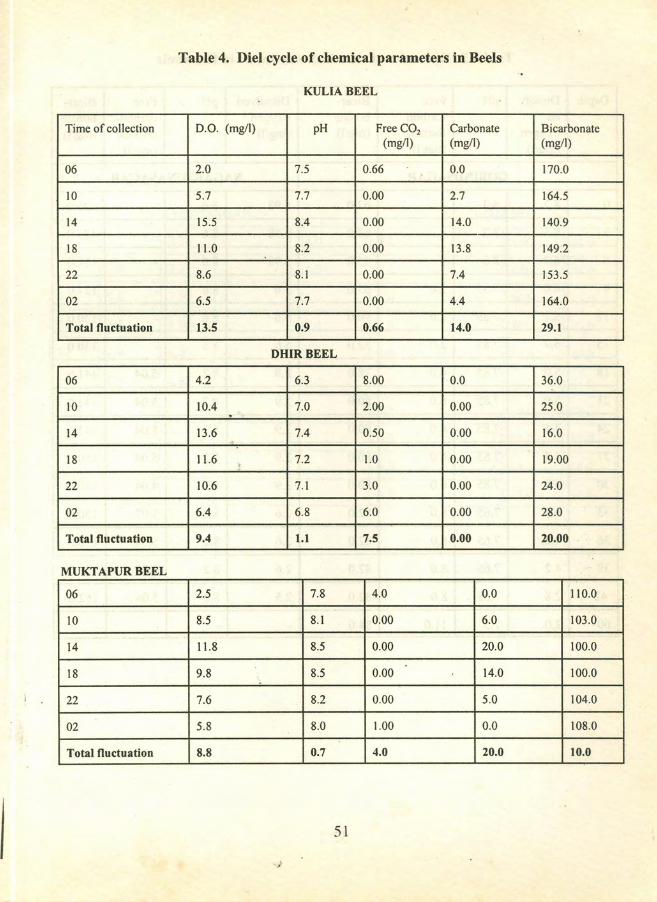
Table 4. Diel cycle of chemical parameters in Beels
KULIABEEL
Time of collection D.O. (mg/l) pH Free CO2 Carbonate Bicarbonate(mg/l) (mg/l) (mg/l)
06 2.0 7.5 0.66 0.0 170.0
10 5.7 7.7 0.00 2.7 164.5
14 15.5 8.4 0.00 14.0 140.9
18 11.0 8.2 0.00 13.8 149.2
22 8.6 8.1 0.00 7.4 153.5
02 6.5 7.7 0.00 4.4 164.0
Total fluctuation 13.5 0.9 0.66 14.0 29.1
DHIRBEEL
06 4.2 6.3 8.00 0.0 36.0
10 10.4 7.0 2.00 0.00 25.0.14 13.6 7.4 0.50 0.00 16.0~18 11.6 , 7.2 1.0 0.00 19.00
22 10.6 7.1 3.0 0.00 24.0
02 6.4 6.8 6.0 0.00 28.0
Total fluctuation 9.4 1.1 7.5 0.00 20.00
MUKT APUR BEEL
06 2.5 7.8 4.0 0.0 110.0
10 8.5 8.1 0.00 6.0 103.0
14 11.8 8.5 0.00 20.0 100.0
18 9.8 8.5 0.00 14.0 100.0
22 7.6 8.2 0.00 5.0 104.0
02 5.8 8.0 1.00 0.0 108.0
Total fluctuation 8.8 0.7 4.0 20.0 10.0
I 51
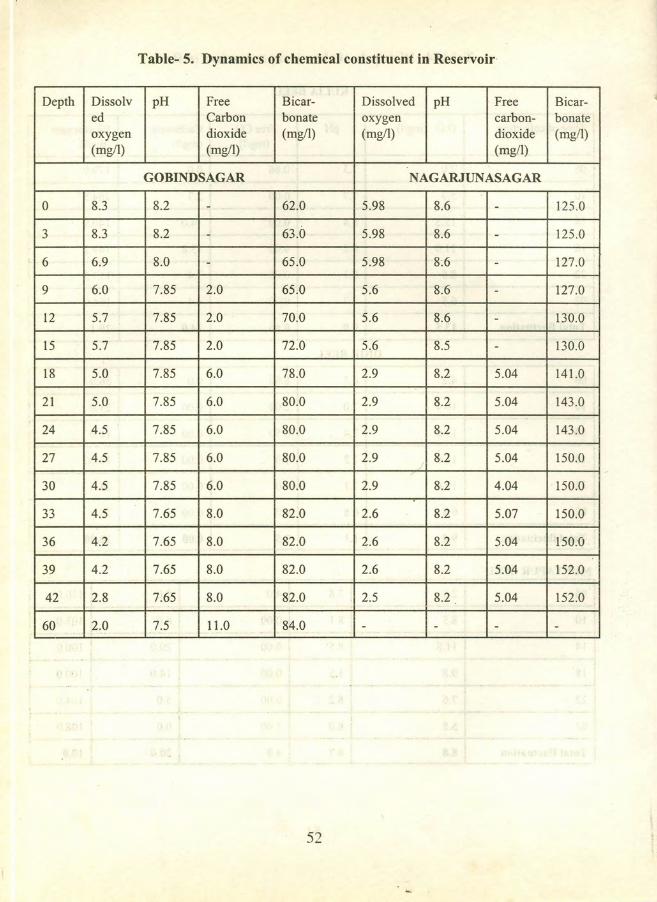
Table- 5. Dynamics of chemical constituent in Reservoir
Depth Dissolv pH Free Bicar- Dissolved pH Free Bicar-ed Carbon bonate oxygen carbon- bonateoxygen dioxide (mg/l) (mg/l) dioxide (mg/l)(mg/l) (mg/l) (rng/l)
GOBINDSAGAR NAGARJUNASAGAR
0 8.3 8.2 - 62.0 5.98 8.6 - 125.0
3 8.3 8.2 - 63.0 5.98 8.6 - 125.0
6 6.9 8.0 - 65.0 5.98 8:6 - 127.0
9 6.0 7.85 2.0 65.0 5.6 8.6 - 127.0
12 5.7 7.85 2.0 70.0 5.6 8.6 - 130.0
15 5.7 7.85 2.0 72.0 5.6 8.5 - 130.0
18 5.0 7.85 6.0 78.0 2.9 8.2 5.04 141.0
21 5.0 7.85 6.0 80.0 2.9 8.2 5.04 143.0
24 4.5 7.85 6.0 80.0 2.9 8.2 5.04 143.0
27 4.5 7.85 6.0 80.0 2.9 8.2 5.04 150.0
30 4.5 7.85 6.0 80.0 2.9 8.2 4.04 150.0
33 4.5 7.65 8.0 82.0 2.6 8.2 5.07 150.0
36 4.2 7.65 8.0 82.0 2.6 8.2 5.04 150.0
39 4.2 7.65 8.0 82.0 2.6 8.2 5.04. 152.0
42 2.8 7.65 8.0 82.0 2.5 8.2 5.04 152.0
60 .2.0 7.5 11.0 84.0 - - - -
52

Table 5 contd .
BHA VANISAGAR RIHAND
0 7.9 8.35 - 34.0 8.2 8.0 8.0 44.0
3 7.5 8.35 - 34.0 8.2 8.0 8.0 44.0
6 5.0 7.30 4.5 44.0 8.0 8.0 10.0 44.0
9 3.5 6.90 6.0 48.0 7.0 7.9 10.0 40.0
12 2.0 6.80 9.0 51.0 7.0 7.9 10.0 40.0
15 1.0 6.80 11.0 56.0 6.5 7.9 10.0 38.0
18 - - - - 6.5 7.9 12.0 38.021 - - - - 6.5 7.9 12.0 36.024 - - - - 6.5 7.8 13.0 36.042 - - - - 6.3 7.7 13.0 34.0
53

Summer School on Fisheries Enhancementin Small Reservoirs and Floodplain LakesCIFRI Barrackvore 14July to 12August 1997
Community metabolism (energy dynamics) in the context offisheries management of small reservoirs and heels
v. PathakCentral Inland Capture Fisheries Research Institute
24, Pannalal Road, Allahabad
Introduction
Biotic communties in an aquatic ecosystem can be divided into various-componentson the basis of their trophic functions such as primary producers, herbivores, detritivores,carnivores and decomposers. The units which are transferred among these components areenergy-rich organic compounds and the system may, thus, be modelled in terms of eitherenergy or material. Energy enters the biological system by fixation of solar energy throughphotosynthesis and get degraded as it passes from one trophic level to the other accordingto the laws of thermodynamics. -
In order to study the energy dynamics of a water body from solar radiation to thedesirable end product (fish), three types of studies are essential.
(i) Qantitative assessment of synthesis of organic matter i.e. transformation of solarenergy into chemical energy by producers
(ii) the pathways of energy transformation that lead to the end product i.e. flow ofenergy from producers to consumers and
(iii) Efficiency of energy transformation at different trophic levels.
55

Many workers have studied the flow of energy in different aquatic system (Juday1940; Lindeman 1952; Teal 1957; Odum 1975; Ganapati 1970; Natarajan and Pathak1980, 1983. Pathak et al., 1985, Pathak, 1990 etc.). However, more critical examinationsof these systems are essential to fomulate management norms for the better utilisation ofthe available energy resources. The energy dynamics of different aquatic ecosystems havebeen discussed in the paper based on the observations made in some big and smallreservoirs and beels.
Energy transformation through primary production
The energy source for all living organisms on the earth is sun which releases energyby nuclear transmutation from Hydrogen to Helium in the form of electromagnetic wavesin a wider range of wavelengths 1AOto 1,35,00 AO.Only a small fraction of energy in thewavelength of 4000 AOto 8000 fi.. is transformed to chemical energy by chlorophyllbearing organisms. Measurement of rate of conversion of solar energy to chemical energygives a dependable parameter to assess the productivity potential of an aquatic system. Theredox process of energy transformation is represented by basic equation:
709 Cal of C6H1206 + 602
Solar energy
Or nC02 + n (H doner) Solar (CH20)n + n (oxidised doner)Solar energy
This process is endergonic in nature and consequently plants can store large amountof energy in the form of energy rich organic compound. The efficiency of energytransformation, known as photosynthetic efficiency, is equal to-
Energy fixed by producers
x 100Solar energy available in water surface
From the above equation the energy required to liberate one milligram of oxygenthrough photosynthesis is approximately 3.68 calories and hence the amount of oxygenliberated gives a measure of solar energy traped as chemical energy by producers. In thewater bodies like reservoirs the energy transformation is mainly by phytoplankton whilein beels aquatic macrophytes are the main primary producers.
56
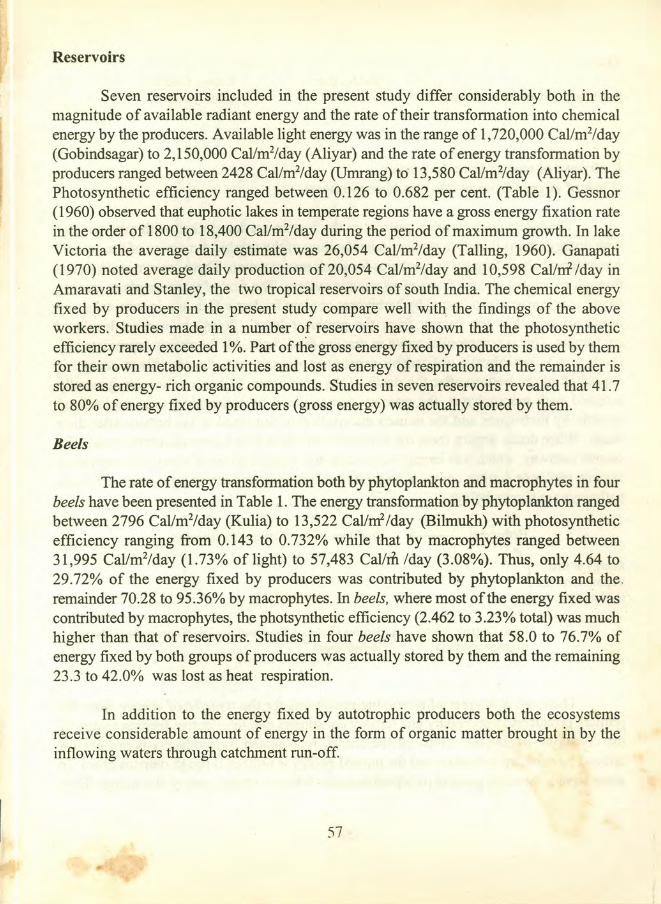
Reservoirs
Seven reservoirs included in the present study differ considerably both in themagnitude of available radiant energy and the rate of their transformation into chemicalenergy by the producers. Available light energy was in the range of 1,720,000 Cal/mvday(Gobindsagar) to 2,150,000 Cal/mvday (Aliyar) and the rate of energy transformation byproducers ranged between 2428 Cal/mvday (Umrang) to 13,580 Cal/rrr/day (Aliyar). ThePhotosynthetic efficiency ranged between 0.126 to 0.682 per cent. (Table 1). Gessnor(1960) observed that euphotic lakes in temperate regions have a gross energy fixation ratein the order of 1800 to 18,400 Cal/mi/day during the period of maximum growth. In lakeVictoria the average daily estimate was 26,054 Cal/rrr/day (TaIling, 1960). Ganapati(1970) noted average daily production of 20,054 Cal/mvday and 10,598 Cal/rrr /day inAmaravati and Stanley, the two tropical reservoirs of south India. The chemical energyfixed by producers in the present study compare well with. the findings of the aboveworkers. Studies made in a number of reservoirs have shown that the photosyntheticefficiency rarely exceeded 1%. Part ofthe gross energy fixed by producers is used by themfor their own metabolic activities and lost as energy of respiration and the remainder isstored as energy- rich organic compounds. Studies in seven reservoirs revealed that 41.7to 80% of energy fixed by producers (gross energy) was actually stored by them.
Beels
The rate of energy transformation both by phytoplankton and macrophytes in fourbeels have been presented in Table 1. The energy transformation by phytoplankton rangedbetween 2796 Cal/mi/day (Kulia) to 13,522 Cal/nr'/day (Bilmukh) with photosyntheticefficiency ranging from 0.143 to 0.732% while that by macrophytes ranged between31,995 Cal/mi/day (1.73% oflight) to 57,483 Cal/rn /day (3.08%). Thus, only 4.64 to29.72% of the energy fixed by producers was contributed by phytoplankton and the,remainder 70.28 to 95.36% by macrophytes. In beels, where most ofthe energy fixed wascontributed by macrophytes, the photsynthetic efficiency (2.462 to 3.23% total) was muchhigher than that of reservoirs. Studies in four beels have shown that 58.0 to 76.7% ofenergy fixed by both groups of producers was actually stored by them and the remaining23.3 to 42.0% was lost as heat respiration.
In addition to the energy fixed by autotrophic producers both the ecosystemsreceive considerable amount of energy in the form of organic matter brought in by theinflowing waters through catchment run-off.
57

Thus:
Total energy available in the system =
Energy importfrom allochtho- +nous source
Energy fixed byphotosyntheticorganisms
Pathways of energy transformation(Flow of energy from producers to consumers)
The biotic communities present in the system are interlinked with one anotherwith energy chains therefore proper understanding of the trophic dynamics of the aquaticecosystems help in formulating policies for stock manipulation. There are two main routesthrough which the energy flows in an aquatic system. The first of these involves grazingof green organisms (producers) by herbivores or plant feeders which are, in turn, taken bypredators and thus the energy from the producer level flows to various levels ofconsumers. This is commonly known as grazing food chain. All the energy represented byproducers is not always utili sed by consumers directly and the unutilised energy isdeposited at the bottom after the death of the organisms. In beels which are generallyinfested with macrophytes, the primary energy fixed by macrophytes is not utiliseddirectly by herbivores and the unused materials gets deposited at the bottom after theirdeath. When decay occurs, these macrophytes contribute to rich organic detritus pool. Thesecond pathway, which was largely been neglected, involves flow of energy through deadorganic matter or detritus complex and the path is known as detritus food chain. The twopathways are shown below.
Herbivores ~ Predators ~ Grazing food chain
Energy at first (trophic level (or .producer level)
,Dead Organic matter ---? detritus feeders 1Predators ~ (Detritus food chain)(organic detritus) (detritivores) .
. There are a number of restricting conditions for the transfer of energy from theprimary producers to secondary_and tertiary consumers due to selective feeding nature of
. ~"" ,
the consumer organisms. Thus', all the energy represented by producers is not alwaysutilized by consumers directly and the unused energy is utilized through detritus chain. Insome aquatic systems, grazing path predominates while in others most ofthe energy flows
58
../'

through detritus chain. Functionally the distinction between grazing and detritus chain isof importance as there is a time lag between direct consumption ofliving plants and theultimate utilization of dead organic matter.
The pattern of energy utilization in some reservoirs and beels has been presentedin Table 2. Among the three large reservoirs only Govindsagar, where 70% of the energyharvested as fish was contributed by primary consumers (mainly grazing herbivores) hasshown better utilization of energy while in other two reservoirs either the available energywas not fully utilized or utilized mainly by secondary and tertiary consumers. Theconversion efficiencies from primary to fish or light to fish were much better inGovindsagar (0.20% or 0.0013%) than both Nagarjunasagar (0.055% or 0.00016%) andRihand (0.934% or 0.00007%). The energy utilization in three small reservoirs was mainlythrough detritus chain as 60 to 80% of the energy harvest from them was contributed byprimary consumers (mainly detritivores). These reservoirs have shown better conversionefficiencies ranging between 0.132 to 0.355% (Table 2). The four beels have also shownvery interesting pictures. In Dhir and Media beels the flow of energy was mainly throughgrazing chain as 72.0 to 78% of energy harvested from them was contributed by primaryconsumers (mainly herbivores) whereas in Kulia beeI73.4% ofthe energy harvested wascontributed by detritivores. In Bilmukh, herbivores and detritivores together contributed51.3% while 40.5% of the total was contributed by tertiary consumers. The energyconversion efficiencies in the four beels ranged between 0.131 to 0.417% (Table 2). It isimportant to mention here that beels are very rich in detritus energy (16.4 to 37.44 x 10⁴K cal/ha) and to increase the energy harvest from such systems the vast energy resourcein the form of detritus must be fully utilized.
Nikolsky (1963) stated 'the nearer the useful end product (fish) stands to the firstlink in the food chain the higher the yield from the water mass as the loss of energy willbe much higher, if the chain is longer'. Accordingly, if the water body has the dominanceof primary consumers (either herbivores or detritivores) the efficiency of conversion andthe energy harvest will be higher. Odum (1975) and Mann (1969) applied the energy flowapproach for calculating fish productivity potential of aquatic ecosystems keeping in viewthat in passing from one trophic level to the next almost 90% of the energy is lost. Odum,(1960 and 1962) felt that large water bodies, which have wide range of fish populationbelonging to various trophic levels, the productivity potential can be taken as 1% of grossor 0.5% of the energy fixed at producer level. Natarajan and Pathak (1983 & 1985)calculated the productivity potential of a number of Indian reservoirs by taking energy atfish level as 0.5% ofthe energy fixed by producers. The energy dynamics of an ecosystemdo take into account the various trophic levels but this approach has disadvantage thatmany animals are omnivorous and thus can not be assigned to a particular level. Moreover
59
/.
i
i
the feeding habits ofthe animal do change with the availability of the food. Thus, one hasto be very cautious while grouping the consumers at different trophic levels. It has beenestablished by many workers that the most important single channel of energy flow leadingto fish production is organic detritus complex.
References:
Ganapati, S. v., 1970. Energy available relationships in natural aquatic biosystems in India. Trop. Ecol. 11:49-68.
Gessner, F., 1960. Diephotosynthese desphytoplanktonln: N. Ruhland (Ed.) Handbuchderpjlanzenphysiologie, 5: 521-567.
Juday, c., 1940. The annual energy budget of an Inland Lake, Ecology, 21: 438-450.
Lindemann, R. L., 1942. The trophic dynamic aspects of ecology. Ecology, 23: 398-418.
Mann. K. H., 1969. The dynamics of aquatic ecosystems Ad Ecol Res., 6: 1-81.
Natarajan, A. V. and V. Pathak, 1980. Bioenergetic approach to the productivity of man madelakes.1. Inland Fish Soc. India 12: 1-13.
Natarajan, A. V.and V. Pathak, 1983. Patterns of energy flow in fresh water trophic and subtropicalimpoundments Bull. No. 36 Cent Inland Fish. Res. Inst., Barrackpore.
Natarajan, A. V.and V. Pathak, 1985. Trophic structure and energy flow in different aquatic ecosystems,Proc. Nat. Symp. Pure & applied limnology Bull. Bot. Soc. Sagar, 32: 164-176.
Nikolsky, G. V., 1963. The ecology of fishes. Academic Press New York, pp.362.
Odum, H. T., 1960. The role of tidal marshes in estuarine production: N. Y. St. Consorv., 60: 1-4.
Odum H. T. 1962. Relationships between structure and function in the ecosystem. Jap. 1. Ecol., 12: 108-118.
Odum, E. P., 1975. Ecology, Oxford and IBP Publishing Company. pp. 244.
Pathak, V., S. B. Saha and M.J. Bhagat, 1985. Patterns of energy utilization and productivity in beelecosystem. 1. Hydrobiol, 1(2): 47-52.
Pathak, V., 1990. A comparative study of energy dynamics of open and closed beels in Ganga andBrahrriaputra basins. 1. Inland Fish. Soc. India, 22 (1&2): 26-30.
TaIling, J. F., 1961. Photosynthesis under natural conditions. Ann. Rev. Plant. Physiol., 12: 133-154.
Teal, J. M., 1957. Community metabolism in temperate cold springs. Ecol Monogr., 27: 283-302 .. "
60
"'.

L.,.
Table 1. Energy transformation through primary production in Reservoirs and beels
0\>-'.
Ecosystem Producer Solar Energy Photosyn- Net energy Energy lost as Ratio ofgroup Energy fixed by thetic assimilated respiration
Cal/mvday producers efficiency Call m2/day Cal/rnvday Energy assirni- Energy lostCal/mvday (%) lated to gross as respira-
(%) tion to gross(%)
Large
G'sagar Phytoplankton 1720000 11696 0.682 7626 4070 65.0 35.0N'sagar -do- 2050000 5959 0.290 3450 2509 57.8 42.2Riband -do- 1883750 3802 0.202 1586 2216 41.7 58.3Small
Aliyar -do- 2150000 13580 0.580 8370 5210 61.6 38.4B'sagar -do- 2130000 8781 0.412 4610 4171 52.5 47.5Bachhra -do- 1867000 9547 0.512 7669 1878 80.0 20.0
'\

0\N
Ecosystem Producer Solar Energy Photosyn- Net energy Energy lost as Ratio ofgroup Energy fixed by thetic assimilated respiration
Call m2/day producers efficiency Cal/ mvday Cal/rnvday Energy assimi- Energy lostCall mvday (%) lated to gross as respira-
(%) tion to gross(%)
Table 1contd .•••.••
56.4 43.6Umrang -do- 1913000 2428 0.126 1578 850Kulia Phytoplankton 1960000 2796 0.143 1622 1174 58.0 42.0
Macrophytes 1960000 57483 3.08 35065 22418 61.0 39.0Media Phytoplankton 1965000 11242 0.57 7307 3939 65.0 35.0
Macrophytes 1965000 52358 2.18 30368 21990 58.0 42.0Dhir Phytoplankton 1855000 10311 0.55 7424 2887 72.0 28.0
. Macrophytes 1855000 43408 2.34 24308 19100 56.0 44.0Bilmukh Phytoplankton 1850000 13533 0.732 .,. 10385 3148 76.7 23.3
Macrophytes 1850000 31995 1.730 , 21977 10018 68.7 31.3
\

Table 2. Patterns of Energy utilization in Reservoirs and Beel
0\w
-Ecosystems visible Autotrophic Contribution of fishes at Major Major tertiary Total energy Conversion of
radiant energy Energy different trophic levels secondary consumers harvest as energyenergy fixed by I Major primary consumers Kcal/ hal yr fishKcal/halyr producers consumers (Kcal/halyr) (Kcall hal yr) Kcall halyr Photosyn- Light tox 106 Kcal/ hal yr to fish fish
x 104 Herbivore Detritivore (%) (0/0)
Large
Govindsagar 6278 4270 49080 9840 24840 170 85680 0.20 0.00\3NagaTjunasagar 7480 2175 1545 645 4125 4725 12000 0.55 0.00016Rihand 6875 \390 4320 - 480 - 4800. 0.034 0.00007Small
Aliyar 7847 4937 4344 48528 9912 2592 65376 0.\32 0.00083Bhawanisagar 7775 3204 24860 40200 6480 20640 95000 0.29 0.001Bachhra 6825 3485 29520 43560 \3800 36960 123840 0.355 0.00182Beels
Media 7154 21780 140772 IQ9488 - 30144 284400 0.\31 0.0040Dhir 6770 19580 206736 78312 14381 96571 396000 0.202 0.0102Bilmukh 6753 16607 161568 193692 566448 280320 692028 0.417
....
\

Summer School on Fisheries Enhancementin small Reservoirs and Floodplain Lakes,CIFRI. Barrackpore. 14 July to 12 August 1997
Methods of evaluating primary productivity in smallwater bodies
D. NathCentral Inland Capture Fisheries Research Institute
Barrackpore-743101, West Bengal
Introduction
Primary productivity is defined as the rate at which inorganic carbon is convertedto an organic form. Chlorophyll bearing microscopic organisms such as phytoplankton,periphyton, algae and also macrophytes serve as primary producers in the aquatic foodchain. Photosynthesis results in the formation of a wide range of organic compounds,release of oxygen and depletion of carbon dioxide in the surrounding waters. Rates ofphytosynthesis in small water bodies are related to phytoplankton abundance and lightintensity. Assuming equal light intensities, the photosynthetic production of dissolvedoxygen will increase as function of phytoplankton abundance. In fish ponds phytoplanktonis the major source of turbidity, so light penetration is generally related to phytoplanktonabundance. Hence phytoplankters are limited to shallower depths as their abundanceincreases and there is a strong vertical stratification of photosynthetic rates and dissolvedoxygen concentrations. In intensely manured fish ponds, primary productivity increasesin upper layers of water, where favourable light conditions exists, but decreases in lowerlayers where overshading by the plankton reduces light penetration (Hepher, 1962).
On dear days, photosynthesis rates increase rapidly after sunrise and remain highup to afternoon, although the afternoon rates may be somewhat less than morning rates.Cloudy skies always cause a decrease in phtosynthetic rates.
The primary productivity in oxbow lakes may be quite different to that of pondecosystem. The beel ecosystem generally contains large amount of submerged aquaticweeds, so greater photosynthetic rates and oxygen concentrations were noted in the weedbeds of the beels.
65
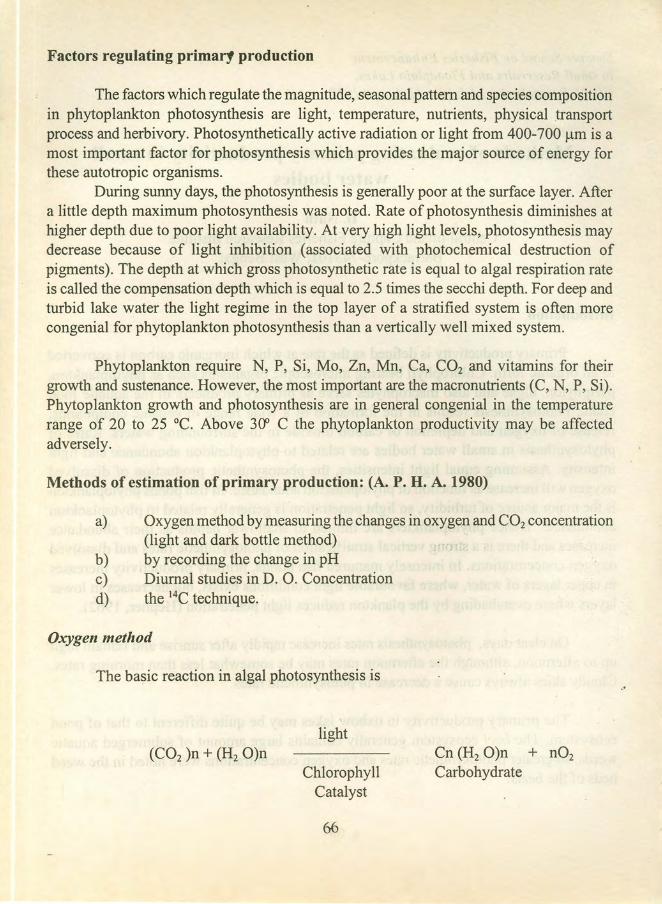
Factors regulating prlmarj production
The factors which regulate the magnitude, seasonal pattern and species compositionin phytoplankton photosynthesis are light, temperature, nutrients, physical transportprocess and herbivory. Photosynthetically active radiation or light from 400-700 prn is amost important factor for photosynthesis which provides the major source of energy forthese autotropic organisms.
During sunny days, the photosynthesis is generally poor at the surface layer. Aftera little depth maximum photosynthesis was noted. Rate of photosynthesis diminishes athigher depth due to poor light availability. At very high light levels, photosynthesis maydecrease because of light inhibition (associated with photochemical destruction ofpigments). The depth at which gross photosynthetic rate is equal to algal respiration rateis called the compensation depth which is equal to 2.5 times the secchi depth. For deep andturbid lake water the light regime in the top layer of a stratified system is often morecongenial for phytoplankton photosynthesis than a vertically well mixed system.
Phytoplankton require N, P, Si, Mo, Zn, Mn, Ca, CO2 and vitamins for theirgrowth and sustenance. However, the most important are the macronutrients (C, N, P, Si).Phytoplankton growth and photosynthesis are in general congenial in the temperaturerange of 20 to 25°C. Above 3(1) C the phytoplankton productivity may be affectedadversely.
Methods of estimation of primary production: (A. P. H. A. 1980)
a) Oxygen method by measuring the changes in oxygen and CO2concentration(light and dark bottle method)by recording the change in pHDiurnal studies in D. O. Concentrationthe 14Ctechnique.
, .~ .
b)c)d)
Oxygen method
The basic reaction in algal photosynthesis is
light(C02 )n + (H2 O)n Cn (H2 O)n + n02
CarbohydrateChlorophyllCatalyst
66
'.
Thus, during photosynthesis, the phytoplankton and other aquatic plants absorbcarbon dioxide and liberate' oxygen, In oxygen method, clear (light) and darkened (dark)bottles are filled with water samples and suspended at regular depth intervals for anincubation period of 3-5 hours or the samples may be incubated under controlledconditions under artificial illumination in environmental growth chambers in thelaboratory .
The advantage of oxygen method is that it provides estimates of gross and netproductivity and respiration which can be performed with inexpensive laboratoryequipment and common reagents; The DO concentration is estimated at the beginning andend of incubation period. Productivity is calculated on the assumption that one atom ofcarbon is assimilated for each molecule of oxygen released.
Procedure
1) Estimate the solar radiation with a pyrheliometer.
2) Determine depth of euphotic zone (the region that receives 1% or more of surfaceillumination) with a submarine photometer. Select depth interval for bottleplacement.
3) Introduce samples taken from each pre-selected depth into duplicate light bottle,dark bottle and initial analysis bottle, use water from the same grab sample to filla set (i.e.,one light, one dark and one initialbottle).
4) Determine the DO of the initial bottle by Winkler method with Manganoussulphate, alkaline iodide, sulphuric acid and standard sodium thiosulphate usingstarch as indicator. DO may also be determined with an oxygen probe.
.>'
5) Suspend the light and dark bottle at the depth from which the samples were takenand incubate for 3-5 hours.
6) At the end of the exposure period, estimate the DO of both light and dark bottlesby Winklers method or by an oxygen probe.
67
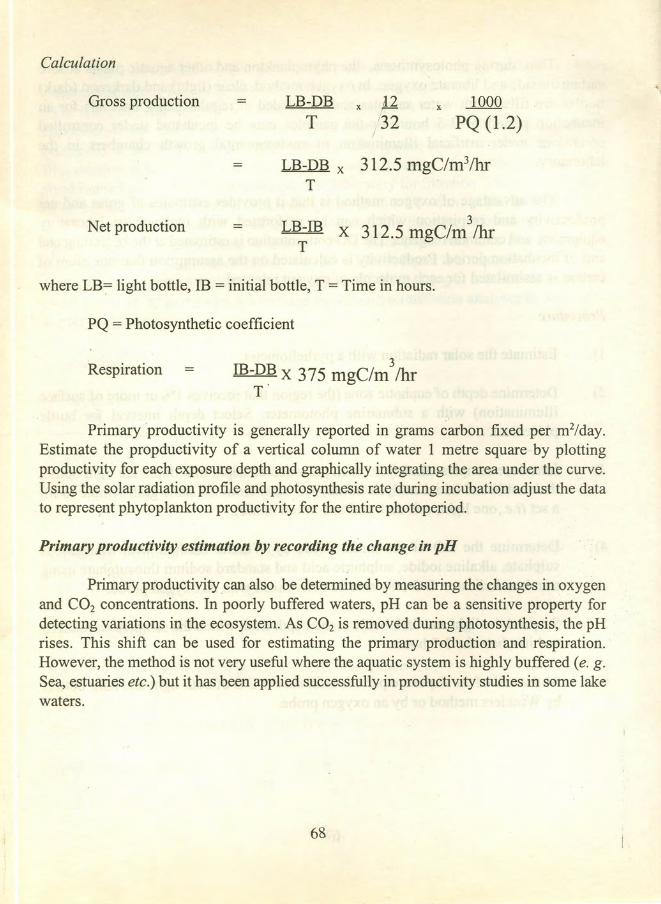
Calculation
Gross production LB-DB x~
x 1000T 32 PQ (1.2)
/
LB-DB x 312.5 mgC/m3/hrT
= LB-IB 3X 312.5 mgC/m /hr
TNet production
where LB~ light bottle, IB = initial bottle, T = Time in hours.
PQ = Photosynthetic coefficient
Respiration 3IB-D~ X 375 mgC/m !hr
T
Primary productivity is generally reported in grams carbon fixed per m2/day.Estimate the propductivity of a vertical column of water 1 metre square by plottingproductivity for each exposure depth and graphically integrating the area under the curve.Using the solar radiation profile and photosynthesis rate during incubation adjust the datato represent phytoplankton productivity for the entire photoperiod.
Primary productivity estimation by recording the change in pH
Primary productivity can also be determined by measuring the changes in oxygenand CO2 concentrations. In poorly buffered waters, pH can be a sensitive property fordetecting variations in the ecosystem. As CO2 is removed during photosynthesis, the pHrises. This shift can be used for estimating the primary production and respiration.However, the method is not very useful where the aquatic system is highly buffered (e. g.Sea, estuaries etc.) but it has been applied successfully in productivity studies in some lakewaters.
68

Primary productivity estimation from diel changes of Dissolved oxygen
The dissolved oxygen content in a water body continually changes over a 24 hourperiod because of the effects of respiration and photosynthesis and due to slow rates ofdiffusion. The DO content is minimum during early morning, increases during day timeand reaches its peak during the afternoon before declining again during night time. Thehighest content of DO is found in ponds with the greatest abundance of phytoplankton.However, water of these ponds also has high rates of respiration, hence they have theminimum content of DO in the early morning.
The oxygen method (light and dark bottle techniques) is widely used fordetermination of primary production. However, 14Ctechnique is more precise and can beused in cases where the productivity is very low. Moreover, certain bacteria such as greensulpher bacteria, purple sulpher bacteria etc. absorbs CO2 and produce carbohydrate inpresence of light, but in this photosynthesis oxygen is not evolved.
The overall reaction is as follows:
light
709 K.Cal(Purple sulpherbacteria)
Similarly, light
709 K.Cal(green sulpherbacteria)
Determination ofprimary productivity by 14C technique
This is a method of measuring carbon fixation by using the radioactive isotope 14Cas a tracer. Samples of water are collected from different depths and pH, total alkalinityand free CO2 content in each are measured.
69
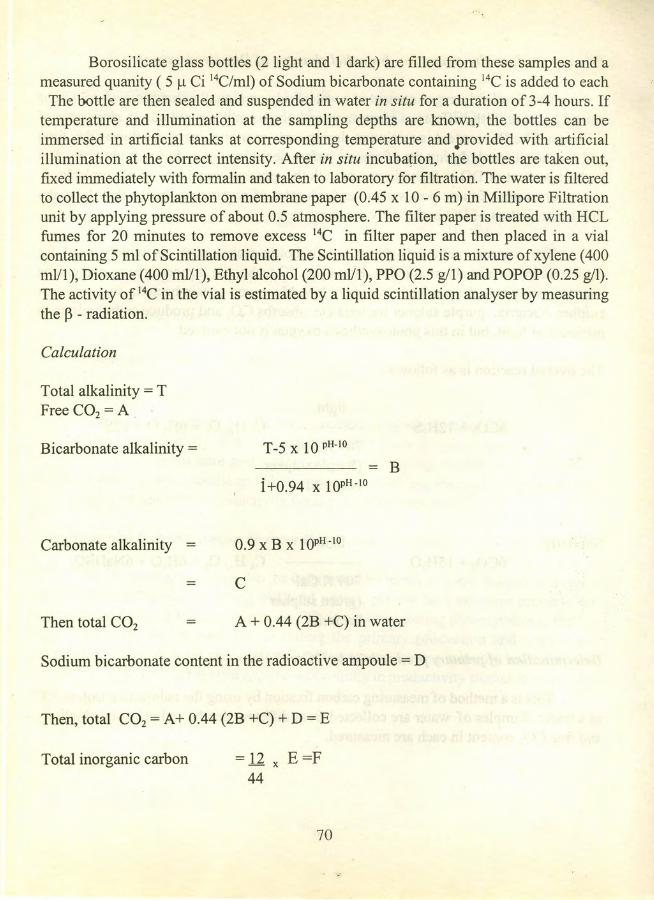
Borosilicate glass bottles (2 light and 1 dark) are filled from these samples and ameasured quanity ( 5 IJ. Ci 14C/ml) of Sodium bicarbonate containing 14Cis added to each
The bottle are then sealed and suspended in water in situ for a duration of 3-4 hours. Iftemperature and illumination at the sampling depths are known, the bottles can beimmersed in artificial tanks at corresponding temperature and provided with artificialillumination at the correct intensity. After in situ incubation, the bottles are taken out,fixed immediately with formalin and taken to laboratory for filtration. The water is filteredto collect the phytoplankton on membrane paper (0.45 x 10 - 6 m) in Millipore Filtrationunit by applying pressure of about 0.5 atmosphere. The filter paper is treated with HCLfumes for 20 minutes to remove excess 14C in filter paper and then placed in a vialcontaining 5 ml of Scintillation liquid. The Scintillation liquid is a mixture of xylene (400mlll), Dioxane (400 mlll), Ethyl alcohol (200 mlll), PPO (2.5 g/I) and POPOP (0.25 gll).The activity of 14Cin the vial is estimated by a liquid scintillation analyser by measuringthe ~ - radiation.
Calculation
Total alkalinity = TFree CO2 = A.
Bicarbonate alkalinity = T-5 x 10 pH-10
Bi+0.94 x 1OPH -10
Carbonate alkalinity = 0.9 x B x 10PH-10
C
Then total CO2 A + 0.44 (2B +C) in water=
Sodium bicarbonate content in the radioactive ampoule = D
Then, total CO2 = A+ 0.44 (2B +C) + D = E
Total inorganic carbon =]2 x E=F44
70

Now if the light bottle count = X,Dark bottle count = X2
Total volume of bottle = X3, Volume filtered = X4,
Time of incubation = Xs, Total activity added to each bottle = X6,
Efficiency of the counter X7= appx. 40%.
Then, Net primary production =
(X, -X2) x X3 x 1.064 x 100 x FX4
l;
Here 1.064 is a corection factor for isotope effect.
Primary productivity for the entire depth of euphotic zone may be integrated and expressedas gram carbon fixed per square meter per day. Using the solar radiation records andphotosynthesis rates during incubation, phytoplankton productivity for the entirephotoperiod may be estimated.
Since, oxygen is not evolved, the oxygen method can not give reliable information aboutthe bacterial photosynthesis. Thus, the 14C technique is the best method for productivitystudies of inland waters where different organisms contribute towards the primaryproduction without releasing oxygen in the systems. The primary production of 20 fishponds, located in 4 districts of West Bengal was studie (Nath, 1986, Nath et al., 1994).Highest primary production was recorded during November-December and during March-May. Maximum production was observed just below the surface. The compensation depthin different centres ranged between 66.5 em and 128.5 em. Gross primary production ofthe ponds ranged from 2.4 to 9.14 gC/m3/day.
Primary production of Hooghly-Matlah estuary was studied during 1982-1993(Nath et al., 1996). Maximum primary production was recorded at Canning in Matlah .estuary, which was free from aquatic pollution. In Hooghly estuary, maximum productionwas noted at Frazerganj in marine zone. Among freshwater centres Nabadwip had highergross production, but Medgachi had higher net production. Minimum primary productionwas recorded at Nawabganj centre, presumably due to industrial pollution. The Hooghlyestuary showed higher gross production during 1986, 1988 and 1992, while higher netproduction was observed during 1986, 1988 and 1990. The net primary production of
71
i~'

different centres of Hooghly Matlah estuary ranged between 0.241 and 0.523 gC/m3/dayand its average net production was 0.380 gC/m3/day. The gross production of differentcentres ranged between 0.44 and 0.794 gC/m3/day, while the average gross production was0.629 gC/m3/day. The flood plain lakes of Ganga and Brahmaputra basins had moderatelyrich primary production which was contributed both by phytoplankton and macrophytes,the contribution of phytoplankton being comparatively lower than that of macrophytes. Inmacrophyte dominated beels, the photosynthetic carbon production was 6.138 gC/m3/day(Pathak et al. 1989).
Indian reservoirs vary widely in productivity depending on nutrient availability andother factors. Thus, poorly productive Bhatghar reservoir (Maharashtra) had low primaryproductivity (gross 20.8-145.8 mgC/m3/daY,.net 1004-83.3 mgC/m /day). However,Gangapati (1972) and Sreenivasan (1972) ha-ve reported some reservoirs having higherproductivity where GPP values ranged from 1.6 to 3.228 gC/m3/day and NPP ranged from1.36 to 1.64 gC/m2/day ..
References
APHA, AWW A, WPCF, 1980. Standard methods for the examination of water andwastewater. APHA, Washington. 1134 p.
Ganapati, S. V., 1972. Organic production in seven types of aquatic ecosystems in India.In Golley P. M. and Golley F. B. (Eds). Tropical ecology with emphasis on organicproduction, Univ. of Georgia. Athens: 312-350.
Hepther, B., 1962. Primary production in fish ponds and its application to fertilizationexperiments. Limnol. Oceanogr., 7: 131-135
Nath, D., 1986. Hydrology offish ponds and physicochemical characterisation of somesemi-intensive fish culture ponds in relation to fish production. Doctoral Thesis.BCKV West Bengal, 145 p.
Nath, D., M. M. Bagchi and R. K. Banerjee, 1996. Changing trends in primary productionand water quality and their bearing on fish yields in Hooghly Matlah estuary. Paperpresented at XIth Annual International Conference at Calcutta on sustainabledevelopment and environment organised by National Environmental ScienceAcademy on March 15-17, 1996.
72

Nath, D., L. N. MandaI, S. D. Tripathi and H. C.Kannakar, 1994. Correlation between fishproduction and physicochemical parameters of water and soil in semi intensive carpculture ponds of West Bengal, India. J Inland Fish. Soc. India, 26 (1), 1994:20-27.
Pathak V., M. J. Bhagat and K. Mitra, 1989. Fisheries potential and management of ox-bow lakes of Ganga and Brahmaputra Basins. (Eds.) Arun G. Jhingran and V.V.Sugunan. III Conservation and management of Inland Capture Fisheries ResourcesofIndia. Inland Fisheries Society ofIndia, Barrackpore : 143-147.
Sreenivasan, A., 1972. Energy transformation through primary productivity and fishproduction in some tropical freshwater impoundments. In Kajak, Z. and HillbrightIllkowska, A. (Eds.). Productivity problems infreshwater. PWN. Warsaw:505-574.
************
73

Summer School on Fisheries Enhancementin small Reservoirs and Floodplain Lakes,CIFRI. Barrackvore. 14Julv to 12August 1997
Relevance of biological monitoring of environmental qualityin inland water bodies with special reference to
floodplain lakes and small reservoirs
K. K. VassCentral Inland Capture Fisheries Research Institute
Barrackpore- 743 101, West Bengal
Introduction
Functioning of all ecosystems depends on the availability, conservation andrecycling of natural resources such as water, land minerals and energy sources. Anyperturbations in the broad framework of the inter-relationships among living organismsand their environments may influence the availability of resources to human societies.Rapid population growth has placed enormous stress on our life support systems of land,water, flora and fauna and the atmosphere. Therefore, sustainable development implieseconomic activities where both the local environment and the biosphere as a whole areprotected.
Eco-degradation
The decline in environmental quality has however, underlined the need forharmonising the needs of economics with those of ecology. It is reported that globally 15%oftotal earth surface has undergone man- induced soil degradation, about 24% of humansoccupy territory of the earth that is degraded by anthropogenic factors and about 1 millionha of prime land is lost to urbanisation alone annually. Further, there is a gradual diversionof forest lands for a variety of other uses resulting in the loss of habitats rich in bi..~logicaldiversity. All these changes have had adverse impact on aquatic ecosystems located in theircatchment. Further, discharge of sewage and industrial effluents has also contributed to thisdecline in ecosystem health.
75
.>

Therefore, it is not only important to accelerate effective in-situ and ex-situconservation of genetic resources but the concerned organisations should also payadequate attention to evaluation, classification, and monitoring, of ecosystems. In thisconnection, apart from standard procedure of chemical monitoring, greater emphasis isbeing given on biomonitoring which reflects true impact of stress on an ecosystem.
History of blomonitoring
The biological surveillance of fresh waters started with the development of theSoprobian system at the turn of the twentieth century (Kolkwitz and Marsson, 1902, 1908,1909). But early attempts to use biological information to detect pollution utilising boththe flora and fauna were made by Butcher (1928, 1946) in U. K. But gradually among allflora and fauna it was macro-invertebrates which assumed increased importance (Hawkes,1956, Hynes, 1959). It was, however, the publication of the Trent Biotic Index(Woodiwiss, 1964), a method based entirely upon macro-invertebrates, establishing itsutility for routine biological surveillance of pollution. Subsequently, the Trent Biotic Index(TBI) has been modified in many European countries for their local use. In U.K., theappearance ofTBI was followed by a proliferation of score and index systems based onmacro-invertebrates. Many of these were developed for limited geographic areas butrecent one, Biological Monitoring Working Party (BMWP) score, was devised by acommittee of freshwater biologists for national use (Cheste~s, 1980; Armitage et al., 1983).
Despite a variety of indices and the often vigorous debate on their relative merits,the principle underlying all of them is effectively the same. Each individual taxon can beattributed a score, value or category that is indicative of its tolerance to environmentalstress, normally in the form of organic enrichment. An integration of the scores of all taxapresent at a site provides a measure (index) of the extent to which the site is, or has been,stressed (organically polluted) .
. Why biomonitoring? Its relevance
Biomonitoring is vital. Firstly, it enables us to assess aspects of water quality fromthe presence/absence of certain organisms, where more expensive chemical analyticalinstrumentation is unavailable. Secondly, biota often persist even where other evidence ofa pollutant (textile mill effluent; sediment discharge) has been reduced to undetectablelimits by dilution or dispersion. The longer the series of monitoring observations thegreater the likelihood of distinguishing between inter-annual and seasonal differences dueto variation in the weather, well mixed or stratified conditions, and changes due to 'real'pollution or other perturbations by man.
76
Biological monitoring enhances knowledge on wetland structure (biodiversity) andfunctioning (trophic interactions) and it identifies threats to the systems. This is facilitatedby the continuing need to measure physical and chemical parameters, in order to extendthe inventory of indicator species; for example, even where a dense population of anorganic enrichment indicator species appears (oligochaete worms) more knowledge isrequired to establish the main cause of change. The multi-disciplinary requirement ofmonitoring thus also enhances understanding about problems due to eutrophication(pisciculture, agriculture, urbanisation), deforestation (sedimentation), afforestation(nutrient enrichment and acidification) and the burning of fossil fuels (acidification).
It generally follows from the above, that biomonitoring can strengthen our abilityto manage wetlands. Prevention, rather than cure, of wetland degradation, also increasesthe revenue-raising potential of such water bodies.
Methods used in Biomonitoring
Many approaches could be used to understand the ecosystem changes at speciescommunity and physiological level, to understand the gravity ofthe impact so that suitablemitigation plan could be formulated. Some of the approaches are indicated below.
A. Eco-toxonomical Methods
Indicator speciesScore systemAlgal indexTrent biotic index
Community structureSpecies diversity indexDominance IndexEvenness IndexSimilarity Index.
B. Physio-biochemical Methods
Biological function analysisATPPrimary ProductivityChlolorphyll
77

Toxicity TestingShort term acuteLong termAvoidance studies.
What to monitor
Biomonitoring can not yet completely replace chemical monitoring programmeswhere detailed inventories of pollutants are required. Nevertheless, the shifts in the speciescomposition and abundance of biotic assemblages may indicate pollution where thechemical cause such as a brief discharge or spill of material, has passed undetected. Theorganisms, species, populations and assemblages that can be used for biomonitoring aremany and varied (from attached and planktonic micro-algae to macrophytic vegetation;from Protozoa to fish). Many argue that while the condition of a river or lake is reflectedmost noticeably in the appearance of the water (algal blooms; turbidity), organismsassociated with sediments and other surfaces may provide the earlier indication of changein quality.
By definition, the ecology of best indicators of ecosystem quality or health is well-established (planktonic Anabaena (eutrophic) and Asterionella (mesotrophic-eutrohic);benthic invertebrates from Plecoptera (many species indicating pristine' water), toChironomidae, Oligochaeta and larval Diptera (organic pollution); acid indicatingdiatoms). Some of the best indicator organisms are also reasonably abundant and relativelyeasy to detect. In this connection, communities of organisms such as benthic invertebrateswhich are attached to, or loosely associated with surfaces, are perhaps more convenientthan planktonic species (blue-green algae and diatoms on sandy and stony stream bottomsand lake shores).
Changes in organism morphology (algal size due to grazing pressure, fish caudalray deformities due to acidification), in addition to shifts in the abundance of a speciesitself, can be used as indicators of change. Care must be exercised at all times ininterpreting the indicator potential of a change in a population or assemblage.
~- -'--
Where to monitor
All zones of wetlands harbour biota that are, or have the potential to be, indicatorsof water quality (open water plankton; littoral zone; epipelic diatoms (on mud surfaces),epipsammic forms (on sand grains), epiphytic species (on submerged plant leaves) andfilamentous green algae (periphyton) loosely attached to submerged plants. Habitats andcommunities must be assessed (e.g. by stratified random sampling; transects or quadrats)
78
.I

to ensure repeatability and comparability of data that may be collected by differentoperators and/or at different times; otherwise the significance of a change or lack of.changecan not be assessed.
When to monitor
In addition to focussing on major pollution events (industrial discharges; stormrunoff of sediment), sampling schedules must take account ofthe life cycles and generation.times of the organisms of interest (daily sampling e.g. phytoplankton, Protozoa andRotifera; weekly for crustacean zooplankton; seasonal for macrophytic vegetation andbenthic invertebrates; and possibly yearly or even less frequently for certain fishpopulations). Schedules may well need to be altered in order to chart events such as therecovery of a fish population following a kill due to pollution or disease.
Advantages of macro-invertebrates:
Several advantages of using freshwater macro-invertebrates for pollutionassessment have been cited (Hellawell1977; Hellenthal, 1982).
i) The wide diversity and abundance of species in almost all freshwater habitats.
ii) Their relatively sedentary habit which allows the presence of most taxa to berelated directly to environmental conditions at their place of capture.
iii) The length of life-cycle of many species which provides a perspective of conditionswhich pertain to at a site over several months.
iv) The ability of invertebrate communities to integrate and to respond to a range ofenvironmental stresses simultaneously.
v}. Many species are important accumulators and concentrators of toxic substances.
vi) Qualitative sampling is easy and inexpensive.
RIVPACS - A multivariate approach
One of the most advanced, yet simplest and most successful programmes forassessing water quality from the invertebrate assemblages, is the UK's River Predictionand Classification System (RIVPACS). One of its main strengths is its ability to assess
79

whether a species/assemblage is absent due to pollution or simply a lack of availablehabitat. Under this programme, analysis of the data has a two stage process. Firstly, sitesare classified according to the taxa present. Criteria here is that the resulting classficationsshould be ecologically interpretable and that new sites could be easily attributed to aclassfication group without recourse to detailed further analysis. The next stage is to usethe environmental data to interpret the biological information. An essential pre-requisitehere is that the method should provide a procedure for predicting the likely occurrence of.macro-invertebrates from the knowledge of chemical and physical features of sites. Theclassification of sites is achieved by TWINSP AN, the two way indicator species anlaysis,(Whittaker, 1981). TWINSPAN is used to successively divide a set of entities (sites)according to their attributes (presence of macro-invertebrates) and the resultantclassification is commonly presented as a dendrogram .. Similar approaches developed onriver systems are being adopted for the littoral benthos of standing water (lakes andreservoirs) .
Some shortcomings and gaps in knowledge
Biomonitoring can fail for a number of reasons. One of these can arise due tostatutory authorities' reluctance or inability to respond rapidly enough to reports on theappearance of pollution if plankton, especially algae, are taken as indicator species. Ifbiomonitoring establishes the presence of a nuisance organism or an increase in itsnumbers to 'undesirable' levels, the ecosystem is already in decline. Secondly, inadequatetemporal andlor spatial sampling can lead to false interpretations as to the state of a waterbody. Dense, but patchy aggregations of surface-blooming blue-green algae which arevery noticeable, may be perceived as 'serious' even though such populations are likely tobe very moderate if expressed on a lake-wise basis. An extremely dense and well mixeddiatom populations can pass relatively unnoticed since they simply impart agenetalcloudiness to a water. Dense populations of organic pollution indicators are restricted tothe immediate vicinity of a spill. The third shortcoming of biomonitoring stems from thelack of knowledge about the potential indicator value of many organisms (numerouschrysophycean species; the colonial green alga Botryococcus braunii can produce verystriking orange blooms; red Euglena bloom). Fourthly, there is the problem over the veryidentity of organisms recorded, and fifthly, among very small (Pico) forms, some arelikely to be completely overlooked even when present in enormous numbers, e.g.,Synechococcus (cyanobacterium).
80
.1!I
I,

· ..~.~
References
Armitage, P. H., D. Moss, 1. F. Wright and M. T. Furse, 1983. The performance of a new biological waterquality score system based on macroinvertebrates over a wide range of unpolluted running-watersites. Water Res., 17 : 333-347.
Butcher, R. W., 1928. Biological changes brought about by sewage effluents in small streams. Proceedingsof the Annual Meeting of the Association of Managers of Sewage Disposal Works, London.
22nd, Nov., 20 pp.
Butcher, R.W.,1946. The biological detection of pollution. 1. Inst. Sew. Purif., 2: 92-102.
Chesters, R. K., 1980. Biological Monitoring Working Party. The 1978 national resting exercise. Departmentof the Environment, Water Data Unit, Technical Memorandum, 19,: 1-37.
I
Hawkes, H.A., 1956. The biological assessment of pollution in Birmingham streams. 1. Instn. Munic.Engrs., 82: 452-469.
Hellawell,1. , 1977. Biological surveillance and water quality monitoring, 69-88. In: Alabaster, 1.S. (Ed.).Biological Monitoring of Inland Fisheries. Applied Science Publishers, London.
Hellenthal, R.A., 1982. Using aquatic insects for the evaluation of freshwater communities, InArmantrout, N.B.(Ed.). Acquisition and Utilization of Aquatic Habitat Inventory Information.Proceedings ofa Symposium, October 28-30,1981, Portland, Oregon. Publishing Co., Billings,Montana, 347-354.
Hynes, H.B.N., 1959. The use of invertebrates as indicators of river pollution. Proc. Linn. Soc. Lond. 2:165-169.
Kolkwitz, R. and M. Marsson, 1902. Grundsatze for die biologische Beurteilung des Wassers nachseinerFlora and Fauna. Mitt. Prufungsant. Wasserversorg. Abwasserbeseit. 1:33-72.
-Kolkwitz, R. and M. Marsson, 1908. Okologie der pflanzlichen Saprobien. Ber. Dt. Bot. Ges., 26A :
505-519.
Kolkwitz, R. and M. Marsson, 1909. Okologie der tierischen Saprobien.lnt. Revue ges. Hydrobiol., 2:.126-152.
Whittaker, R.G., 1981. Diversity, biotic and similarity indices. A review with special relevance to aquaticecosystems. Water Res., 18: 653-694.
Woodiwiss, F.S., 1964. The biological system of stream classification used by the Trent River Board.Chern. Ind., 14: 443-447.
**********
81

/
Summer School on Fisheries Enhancementin small Reservoirs and Floodplain Lakes,CIFRl. Barrackpore. 14July to 12August 1997
Biotic communities and their relevance in the productionprocesses of reservoir ecosystem with special emphasis on
plankton and benthos
Dhirendra Kumar,Central Inland Capture Fisheries Research Institute
Barrackpore- 743 101, West Bengal
Introduction
Biotic communities specially plankton and benthos play an important role inproduction processes of reservoirs as fishes are mostly dependent on these bioticcommunities for their food. Biological activity of a reservoir is influenced by its climatic,edaphic and morphometric features. The geographical location affects the metabolism ofa reservoir through food supply, shape of basin and the efficiency with which the climaticfactors are able to act in the dynamic exchange. The measurement of planktonproductivity, both at primary and secondary levels, is essential for proper management ofreservoirs. Many workers have suggested that an understanding of the production processof invertebrates would facilitate management of fish stocks of reservoirs. Hanson &Leggett (1982) showed that fish yield is related to the mean standing biomass 'ofmacrobenthos in a lake, and thus a general relationship probably exists between secondaryproductivity and fish production. The importance of secondary producers to the study offish dynamics is underscored by their trophic intermediacy between fish populations andenergy sources.
The success of an organism and its productivity in reservoir ecosystem aredetermined in part by the suitability of the environment. Among the most obvious aspectsof the environment that affect animal production are temperature, concentration ofdissolved oxygen, the ability ofthe ecosystem to produce sufficient fish food organismsand the character of the substrate. Effect of these factors in the production processes ofreservoir are being dealt under following heads.
83
",,:!
~<

Temperature
Temperature influences the rates of activity from a molecular to an organismalscale. Many ecologists have found that rates of secondary production increased withtemperature. However, production (P) / mean biomass (B) is believed to rise withincreased temperature on a linear or curvilinear scale. The general positive effect oftemperature on secondary production is a result of the reproductive biology of planktonand benthos. Many workers suggested that with increase in temperature growth rate andfeeding rate increased, and the eggs development time decreased . These factors tend toincrease productivity of biotic communities in reservoirs at high temperature. But Aston(1973) suggested that egg production by oligochaetes declined at high temperature.Pidgaiko et al., (1972) concluded that temperature variation could have either a positiveor negative effect on the productivity of biotic communities depending upon geographiclocation and basin morphometry of reservoir. The temperature regimes of reservoirs innorth India are lower than that of the south. Variation of temperature from surface tobottom has been recorded only 3-4 °C for peninsular reservoirs (Nagarjunasagar) whereasthe same for north India has been registered as 10°C. (Konar). This can be attributed toless-marked seasonal differences in temperature as one progress towards lower latitudes.
Reservoirs in temperate region often develop thermocline with the formation ofepilimnion, metalimnion and hypolimnion. But in tropical reservoirs no such thermalstratification occurs although some ill-defined thermal gradient, (Table 1) has beenreported by Sreenivasan (1969) in few south Indian reservoirs and Patil (1989) in aWaghyanala reservoir from central India.
Table - 1. Thermal Features of SomeReservoirs
Thermal South India Cent. Indiafeatures Pykara Sandy- Amara- Krish- Sath- Aliyar Bhavani Stan- Waghyanala
nulla vathy nagiri anur sagar ley
Surface O°CMax. 22.4 22.6 28.8 31.4 30.4 32.8 31.0 32.0 33.0Min. 19.0 16.4 24.0 23.5 25.0 26.0 23.8 24.2 21.0
Bottom O°CMax. 20.2 20.0 27.0 28.0 28.5 31.0 30.2 30.0 31.0Min. 18.0 15.1 21.5 23.0 24.0 24.2 22.2 24.0 20.0
Thermal Nil Rare Nil Very rare Nil Very rare Very rare Rare RareStratifi- (iII- . (ill- (unsta- (unst (unstable)cation defined) defined) ble) able)
(Modified from Sreenivasan, 1969)
84

Production of fish food organisms in the reservoir ecosystem
A community of heterotrophs can fix no more energy than the amount madeavailable to them by primary producers, specially phytoplankton. The rates of productionof benthos and zooplankton are positively related to food availability in reservoirecosystem fixed through autotrophs. Thus, production of zooplankton and benthos isdirectly related to rates of primary production. Winbergt l S'Zl b) has been more specificwhile hypothesizing that secondary production (Ps) is about 10 % of primary production(Pp), on the average. This suggests that Ps = a + b Pp, where a = 0 and b = 0.1. ButBrylinsky (1980) indicated that phytoplankton primary production is a better predictor ofzooplankton production than phytoplankton biomass, but the relationship may not belinear. Thus, this equation probably overestimates zooplankton production at lowphytoplankton production and makes underestimates at high phytoplankton production.The relationship between phytoplankton production and secondary production is probablyresponsible for apparent relationships among secondary production, nutrient conditionsand alkalinity. It should also be remembered that quality of fish food organisms isimportant in determining the secondary production of both zooplankton and benthos.
Chemical factors influencing the productivity
Values of certain important chemical parameters of reservoir water and soilsuggesting high biological productivity are depicted in Table 2.
Table 2. Chemical parameters of reservoir water and soil suggesting highbiological productivity.
.>
.Parameters in mg/l except pH Water Parameters Soil
pH >6.5 pH 7.5
Alkalinity (bound CO2 as > 50.0 Avail able Phosphorus (mg/IOO >6.0carbonate) g)
Total alkalinity >90.0 Available N (mg/IOO g) > 75
Dissolved N >0.2 Organic carbon (%) > 1.5
Dissolved P > 0.1
Calcium >25.0
Total hardness >25.0
Sp. conductivity (umhos/cm) > 200
85
The oxygen curve is an important chemical parameter to indicate the biologicalproductivity of a reservoir. Oxygen deficit at the bottom is a characteristic feature ofproductive reservoirs. Photosynthesis at the surface and tropholytic activity at the bottomcause klinograde oxygen distribution as recorded in Bhavanisagar, Amaravathi,Nagarjunasagar, Gobindsagar and a number of other reservoirs in India. In unproductivereservoirs, the oxygen curves parallel the temperature curve since it is temperature-dependent (Sreenivasan 1971). In Konar, Tilaya, Rihand and Tungabhadra reservoirs, suchorthograde oxygen distribution was observed along with low productivity.
In reservoirs with klinograde oxygen distribution, the carbondioxide and carbonateconcentration show a general inverse relationship to the oxygen i.e., concentration ofcarbondioxide and bicarbonate increases slightly with depth. On the other hand, orthogradeoxygen distribution is usually accompanied by only slight increase if ap.y, incarbondioxide.
In a number of south Indian reservoirs, Sreenivasan (1965,1968 and 1970) recordeda range of 4.1-10 mg/l dissolved oxygen concentrations strikingly similar to central Indianresefvoirs. The availability of oxygen is thought to be critical, specially to the benthosbecause they often live in areas that are oxygen-poor. Brylinsky (19,80), however, hasfound that zooplankton production in a wide range of reservoirs is also influenced byoxygen concentration in the epilimnion. Jonasson (1978) suggests that sufficient oxygenis important to benthos production because food cannot be metabolised efficiently at low
.oxygen level. Aston (1973) suggests that egg production in freshwater oligochaetes isconstant with decreasing oxygen concentration until some critical low level is reached.
Influence of miscellaneous environmental factors and reservoir morphometry
Many workers suggest that secondary production decreases with increasing waterflow rate. Selin & Hakkari (1982) have suggested a positive relationship with intensity ofsolar radiation. Burgis (1971) and Paterson & Walker (1974) reported that highzooplankton and benthos production rates should be found in the moststable ecosystems.
Mean depth, defined as the volume of the reservoir divided by area, is consideredthe most important morphometric parameter. It is indicative of the extent of euphotic-littoral zone i.e., the depth zone which permits the light penetration for growth ofplanktonic algae and also provides shallower shore areas for attachment of sessile algaeand macrophytes. It is an inverse correlate of shore development, a direct correlate of area(Hayes,1957) and an exact correlate of volume when area is held constant. Thus, meandepth portrays many morphometric features of a reservoir which contribute to the
86

potential productivity of biotic communities in ecosystem. Rowson (1955) has observeddistinct inflection in the mean depth curves at 18m (10 m in some Indian reservoirs). Thissuggests that water mass below this depth serves as a nutrient sink as the' nutrients fromtrophogenic zone in the form of settling seston and phytoplankton are shifted to tropholyticzone.
Shallower reservoirs generally support higher rate of secondary production(Johnson, 1974 & Brylinsky, 1980). Johnson also suggest that the surface area of areservoir might be important, since in larger reservoirs the profundal zone was lessenriched by the littoral zone or allochthonous materials to secondary production. Possiblydue to high primary production in the littoral zone, it is generally believed that secondary .production in near-shore areas and macrophyte beds is greater than all other areas (Kajaket.al.,1980).
Status of biotic communities in Indian reservoirs:
Plankton
Generally two plankton pulses are recorded in Indian reservoirs, one in February-June and the other in October-December. The dominance of various groups of
. phytoplankton over zooplankton, vary from year to year. By and large, the predominantgroup is blue-greens (mostly Microcystis) a group not noted for passing their highproductive capability directly to the higher trophic levels. Bacillariophyceae are mainlyconstituted by Synedra, Navicula, Fragilaria, Melosira and Gyrosigma; Chlorophyceaeinclude Oedogonium, Spirogyra, Pediastrum, Botryococcus, Pandorina and Eudorina asdominant forms.
.>'
Zooplankton is predominately represented by copepods comprising Diaptomus andCyclops while rotifers are represented by Keratella, Brachionus, Polyrathra and Filinia.The general trends of abundance were found to change due to rainfall and nutrient fromrunoff. Maximum numbers are recorded from April-June and minimum during July-August in most of Indian reservoirs. Since as zooplankton is the main food constituentof major carp species as well weed fishes, these playa major role in the productionprocess of reservoirs.
87

Periphyton (Aufwuchs)
Aufwuchs or periphyton forms the food source of browsing fishes and takes theform of a brown or green layer at the surface of submerged objects in reservoirs. Thisgroup is represented mainly by diatoms, green algae and blue-greens. Periphyton colonisesbest in littoral areas of the reservoir.
Macrobenthic invertebrates
The high shoreline development, varying slopes and rich macrovegetation, producea large number of possible benthic habitats in reservoirs. The maximum concentration ofbenthic animals has been observed in the depth range of 4-10 m in Indian reservoirs(Tungabhadra, Konar, Tilaiya and Loni). Below the drawdown limit, redeposition ofsediments reduce their number significantly. Krishnamurthy (J966) observed thatgastropodes ( Viviparus, Melanoides, Gyrulus) were predominant in Tungabhadra reserviorfrom April- November, bivalves (Lamellidens, Corbicula, Parreysia) in May and Octoberand oligochaetes (Tubifex) in October. Mayfly nymphs (Pentagenia) were abundant insummer months influenced by sandy and silty bed of the lotic zone where food wasavailable in the form of bottom ooze containing disintegrated phyto and zooplankton. Thediatoms and desmids present at the bottom provided the food. Chironomidae appeared todominate in humic soils.
Importance of bottom biota as fish food is well established. Many of bottomfeeding riverine species have adopted themselves to lacustrine conditions. They arePuntius dubius, P. hexagonolepis, P. kolus, Labeo calbasu, L. dero, Cirrhinus cirrhosa,C. mrigala and Pangasius pangasius. Thus, the benthos represents an important link inthe production process of the reservoir ecosystem.
Energy sources and energy transformation in reservoirs
Reservoirs get energy from both autotrophic energy fixation and allochthonoussources. The energy fixed by the producers was in the range of3,803 to 11,696 cal/mvdayin Rihand, Gobindsagar, Bhavanisagar and Nagarjunasagar (Natarajan,1976). The twotropical reservoirs, Bhavanisagar and Nagarjunasagar received almost similar amount ofsolar energy but the efficiency of energy transformation from primary producers to fishor light to fish in Bhavanisagar was much more compared to Nagarjunasagar (Table 3).Among the two sub-tropical reservoirs, Gobindsagar has shown better conversionefficiency from photosynthetic energy to fish or light to fish than Rihand. Energytransformation through primary productivity of few Indian reservoirs is given in Table 4.
R8

Table 3. Photosynthetic energy fixation and energy conversionin four reservoirs.
B. Sagar N. Sagar Rihand G.< Sagar
1. Location llo5'N 16°34'N 240N 31°25'N
2. (a) Total visible radiation 2,130 2,050 1,884 1,720KcaVm2/day
(b) Total radiant energy 7,775 7,483 6,877 6,278cal/rrrvyr x 105
3. Photosynthetic production \
(a) g02/m2 Iday 2.380 1,620 1,003 3,178(b)g02 1m2 Iyr 870.890 590.93 377.04 1159.97(c) Energy cal/nr'vyr x 106 3.205 2.175 1.387 4.269
4. Efficiency of energy transfor-mation from light to chemical (%) 0.412 0.290 0.202 0.682
,
5. Fish Production(a) kg /halyr 79.200 10.0 4.0 71.4(b) g Im2/yr 7.920 1.00 0.40 7.14(c) Energy cal/m'vyr 9.500 1.200 480 8.568
6. Conversion of energy(a) Fish/photosynthesis 0.290 0.055 0.034 0.20
5(c) - 3(c)(b) Fish/light 5(c) - 2(b) 0.001 0~00016 0.00007 0.0013
7. Fish production 5(b) - 3(b) 0.900 0.17 0.105 0.618. (a) Photosynthesis (gC 1m2!yr) 326.580 221.6 141.39 435.0
(b) Fish yield as (gC Im2!yr) 0.792 0.100 0.04 0.714(c) % conversion 0.240 0.045 0.028 0.164
(Jhingran, 1991)
89
../"
.--,'
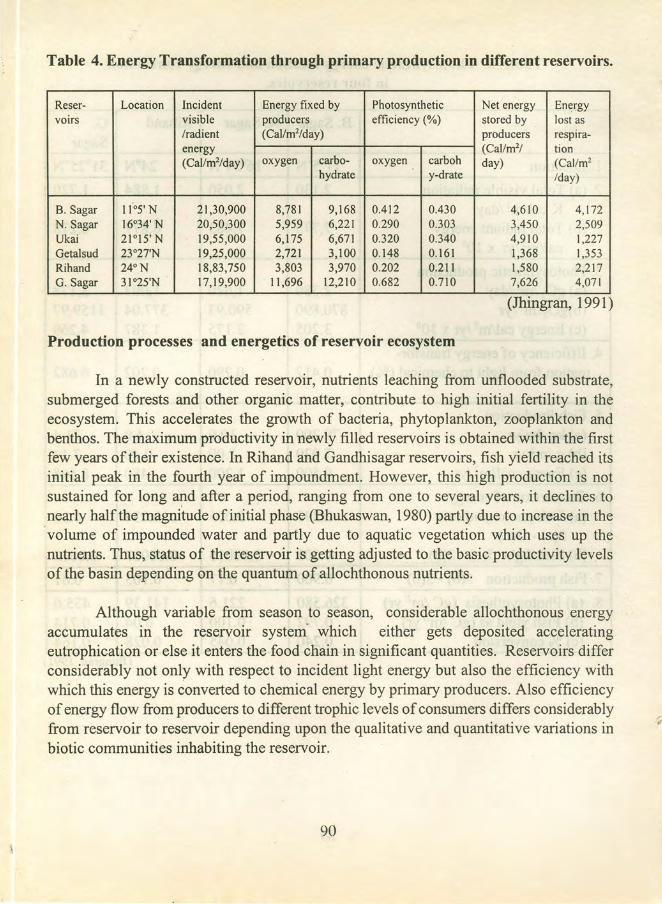
Table 4. Energy Transformation through primary production in different reservoirs.
Reser- Location Incident Energy fixed by Photosynthetic Net energy Energyvoirs visible producers efficiency (%) stored by lost as
Iradient (Cal/mvday) producers respira-energy (Cal/mv tion(Cal/mvday) oxygen carbo- oxygen carboh day) (Cal/rrf
hydrate y-drate Iday)
B. Sagar 1(°5' N 21,30,900 8,781 9,168 0.412 0.430 4,610 4,172N. Sagar 16°34' N 20,50,300 5,959 6,221 0.290 0.303 3,450 2,509Ukai 21°15' N 19,55,000 6,175 6,671 0.320 0.340 4,910 1,227Getalsud 23°27'N 19,25,000 2,721 3,100 0.148 0.161 1,368 1,353Rihand 24°N 18,83,750 3,803 3,970 0.202 0.211 1,580 2,217G. Sagar 31°25'N 17,19,900 11,696 12,210 0.682 0.710 7,626 4,071
(Jhingran, 1991)
Production processes and energetics of reservoir ecosystem
In a newly constructed reservoir, nutrients leaching from unflooded substrate,submerged forests and other organic matter, contribute to high initial fertility in theecosystem. This accelerates the growth of bacteria, phytoplankton, zooplankton andbenthos. The maximum productivity in newly filled reservoirs is obtained within the firstfew years oftheir existence. In Rihand and Gandhisagar reservoirs, fish yield reached itsinitial peak in the fourth year of impoundment. However, this high production is notsustained for long and after a period, ranging from one to several years, it declines tonearly half the magnitude of initial phase (Bhukaswan, 1980) partly due to increase in the.volume of impounded water and partly due to aquatic vegetation which uses up thenutrients. Thus, status of the reservoir is getting adjusted to the basic productivity levelsof the basin depending on the quantum of allochthonous nutrients.
Although variable from season to season, considerable allochthonous energyaccumulates in the reservoir system' which either gets deposited acceleratingeutrophication or else it enters the food chain in significant quantities. Reservoirs differconsiderably not only with respect to incident light energy but also the efficiency withwhich this energy is converted to chemical energy by primary producers. Also efficiencyof energy flow from producers to different trophic levels of consumers differs considerablyfrom reservoir to reservoir depending upon the qualitative and quantitative variations inbiotic communities inhabiting the reservoir.
90
For trophic dynamics concept of ecology, Lindeman (1942) suggested that if onecould reduce the interactions among components of a community to a ~ommoncurrency(e.g., energy), then-one could quantify the interactions and learn topredict changes suchas succession within ecosystems. Lindeman also introduced the major concept that anorganism's success in an environment might be a function of its ability to fix and retainenergy. Thus, the role of important biotic communities like plankton and benthos may beexpressed according to Edmondson (1974) that secondary production cannot be thoughtof as a distinct process by itself. Rather it is part of a larger scheme of the movement ofmaterial through the ecosystem, and this is based on the activities of individuals andpopulations of animals. Precisely, the trophic-dynamic goal of production ecology ofreservoir is a formidable one. But productivity potential of reservoirs can be assessedthrough chemical parameters, rates of primary and secondary production, energyassimilation efficiencies at different trophic levels, morpho-edaphic and morpho-drainageindices etc. Accordingly, appropriate management practices may be applied foraugmenting fish ¥ie14·trQm reservoirs. v; _,
References
Aston, R. J., 1973. Field and experimental studies on the effects of a power stationeffluent on Tubificidae(Olegochaeta, Annelida).Hydrobioloia,42 :225-242.
Burgis, M. J., 1971. The ecology and production of copepods in the tropical lake George,Uganda. Freshw. Biol., 1 : 169-192.
Brylinsky, M., 1980. Estimating the productivity oflakes and reservoirs. In E. D. LeCren& R. H. Lowe - Me. Connel (eds.). The Functioning of Freshwater Ecosystems.IBP 22. Cambridge: Cambridge University Press. .
Bhukaswan, T., 1980. Management of Asian reservoir fisheries. FAD Fish. Tech. Paper, .(207) : Food and Agriculture Organization of the United nations,Rome, 69p.
Edmondson, W. T., 1974. Secondary production. Mitt. Int. Ver. Theor. Angew. Limnol.,20 : 229-272.
Hayes, F. R., 1957. On the variation in bottom fauna and fish yield in relation to trophiclevel and lake dimensions. J Fish Res. Bd., Canada, 14: 1-32.
Hanson, J. M., & W. C. Legget., 1982. Empirical prediction of fish biomass and yield.Can. J Fish. Aquat. Sci., 39: 257-263.
91

Jhingran, V.G., 1991. Fish and Fisheries of India , Hindustan Publishing Co., Delhi,pp.727.
Johnson, M. G., 1974. Production and productivity. In R. O. Brinkhurst (ed.), TheBenthos of Lakes. London: Macmillan Press.
Jonasson, P. M., 1978. Zoobenthos oflakes. Verh. Int. Verein. Limnol., 20 : 13-37.
Krishnamurthy, K. N., 1966. Preliminary studies on the bottom macrofauna ofTungabhadra reservoir. Proc. Indian Acad. Sci. LXIII, 2 (B) : 96-103.
Kajak, Z., G. Bretschko, F. Schiemer & C. Leveque, 1980. Secondary production:Zoobenthos. In E. D. LeCren & R. H. Lowe-McConnell (eds.). The Functioningof Freshwater Ecosystems. IBP 22. Cambridge: Cambridge University Press.
Lindeman, R. L., 1942. The trophic - dynamic aspect of ecology. Ecology, 23 : 399-418.
Natarajan, A. V., 1976. Ecology and the state of fishery development in some of manmade reservoirs in India. In :Symp. on the Development and Utilization ofInlandFishery Resources, Colombo, Srilanka(27-29 Octoberjlndo-Pacific FisheriesCouncil, 17th session: IPFC /76/ SYM / 26/ June 1976.
Pidgaiko, M. L., V. G. Grin, L. A. Kititsina, L. G. Lenchina, M. F. Polivannaya, O. A.Segeva and T. A. Vinogradshaya, 1972. Biological productivity of Kurakhov'spower station cooling reservoir. In Z. Kajak & A. Hillbricht - Ilkowska (eds.),Productivity Problems in Freshwaters. Proceedings of the IBP-UNES~OSymposium on productivity in Freshwaters. Krakow : Polish ScientificPublishers.
Paterson, C. G. & K. F. Walker, 1974. Seasonal dynamics and productivity of Tanytarsusbarbitarsis Freeman (Dipetra : Chironomidae) in the benthos of a shallow, salinelake. Aus. J. mar. Freshwat. Res., 25 : 151- 165.
Patil, M., 19.89. Hydrological studies of a deep discharge reservoir Waghyanala(Chhindwara, M. P., Ph. D. thesis, Dr. H. S. Gaur Vishwavidyalaya, Sagar ,;'
Rawson, D. S., 1955. Morphometry as a dominant factor in the productivity of largerlakes. Verh. Limnology: 164-175.
92

Sreenivasan, A., 1965. Limnology of tropical impoundments. III Limnology andproductivity of Amaravathy Reservoir(Madras State) India. Hydrobiologia,26:501-516.
______ , 1968. Limnology of tropical impounments. V, Studies on two uplandlakes ofNilgiris. Phykos. 7 : 144-160.
______ , 1969. Limnology of tropical impoundments: a comparative study ofmajor reservoirs in Madras State (India). In : Seminar on the Ecology andFisheries of Freshwater Reservoir. Sponsored by ICAR at CIFRI, Barrackpore,November 27-29.
1970. Energy transformation through primary productivity and fishproduction in some tropical freshwater impoundment and ponds pp. 504-514 : InKajak, A. Hillbright- Ilkowska - Ed., Productivity problems of freshwaters.Warsowa.
Selin, P. & L. Hakkari, 1982. The diversity, biomass and production of zooplankton in lakeInarijarvi .Hydrobiologia., 86 : 55-59.
Winberg, G. G., 1971 b. Some results of studies on lake productivity in the Soviet Unionconducted as part of the International Biological Programme. Hydrobiol. J., 7(1) : 1-12.
***********
93

Summer School on Fisheries Enhancementin Small Reservoirs and Floodplain Lakes,CIFRl, Barrackpore, 14July to 12August 1997
Role of plankton, benthos and periphyton in the productioncycle in the floodplain wetland ecosystem
P. K. ChakrabartiCentral Inland Capture Fisheries Research Institute
Barrackpore-743 101, West Bengal
Introduction
Floodplain wetlands show great promise in increasing fish production throughappropriate management measures, Recently, even in some beels, by adopting pen culturepractices, raising of Macrobrachium rosenbergii in place of carps was made possible. Inthe context of such an advancement, studies on the role of ambient ecosystem on theaquatic production cycle assumes significance for better adoption of managementmeasures. Aquatic ecosystem can be divided into two broad aspects, the abiotic featuresdealing with physico-chemical parameters and the biotic features dealing with variousbiotic communities. At the basic level, temperature, water current, transparency, availablenutrients, dissolved oxygen, alkalinity, organic loads, carbondioxide, light intensity forphotosynthesis, load of pollutants, etc. are controlling the production of various biotic.communities which, in turn, contribute directly or indirectly to the fish yield in an aquaticecosystem.
Biotic communities
The biotic communities in different categories of beels exhibit high level ofdiversity in qualitative and quantitative terms. Moreover, different types of bioticcommunities exert their influence in different ways on the fish production process. Thesebiotic communities are grouped as :-Plankton: comprises the world of drifting or weakly swimming aquatic beings that aremostly minute in size and at the mercy of water movements.
95

Benthos: The members of this community are animals and microplants that are attachedto, crawl over or burrow into the bottom soil, sand, silt or mud.
Neuston: The community that floats on the surface ofthe water, either under or above thesurface film and composed of partly aquatic weeds, partly aquatic insects and partlyplankters.
Aufwuch: This community is formed by the attachment of some unicellular andfilamentous algae to some submerged substrate where protozoans, bryozoans, rotifers,annelids, insect larvae, crustaceans, etc. usually remain lodged. Sometimes, only thephyto- forms of this community are called periphyton for convenience. However, manyauthors consider all phyto- and zoo- forms attached to the submerged substrata asperiphyton or heptobenthos.
Aquatic macrophytes: These are plants which draw their nutrients either from the ambientwater or from the bottom soil substrate or the bank soil and are present in the aquaticsystem as marginal, floating, bottom rooted (submerged and emergent) forms. .
Nekton: These are free swimming organisms that can negotiate with the normal watercurrent and that include fishes, shrimps, etc.
Epiphyte and epizoons: These communities remain attached to nekton, aquatic weeds ormacrobenthos populations as parasite, symbiots or commensals. Epiphytes includebacteria, algae, fungi, etc. and epizoons include protozoans, coelenterates, copepods,isopods, helminths, leeches, etc.
Bacteria and viruses are found to be present everywhere, being associated with alltypes of these biotic communities as well as in the soil and ambient water.
Interdependence and food-chain
When intra-community dynamics and the food chain of aquatic biota (Fig. 1) areanalysed, it is generally observed that the primary producers i.e., phytoplankton,phytobenthos, periphyton and epiphytes along with aquatic weeds are at the lowest levelof the food-chain pyramid where various communities show their interrelationship andproportionate abundance after food conversion into biomass at every stage. However, thefood conversion rate is always < 1. So, the secondary producers are much less in theirabundances and are dependent on the primary producers for their subsistence. At the topof the food chain, however, the principal consumers, nekton appear just after the
96
."

macrobenthos population which act as either food augmentors or as competitors inconsuming primary and secondary producers. The roles of saprophytes and detritivores inthe food-web of floodplain wetlands are shown in Fig. 2.
Since most ofthe floodplain wetlands receive monsoon run-off from the catchmentareas, especially where man-made small reservoirs are created by erecting dykes across theflow line of the water, the aquatic food-web is greatly influenced by the ecologicalconditions of the surrounding territory of those water bodies. On account of the effect ofdrainage into the floodplain wetlands, colour, transparency, nutrient levels, pollutionalloads, etc. of the water undergo changes, influencing photos~thetic activities ofholophytes. This, in turn, affects the entire food web. Likewise, the nature of the bottomsubstrate of a floodplain wetland also indirectly regulates the variations and abundancesof different members of the food-web. Fig. 3 shows how the terrestrial ecosystem of thecatchment area and the bottom substrate of the floodplain wetland exert influences onvarious biotic communities.
Characters of floodplain wetlands
The deeper floodplain wetlands become shallower and shallower as the organicdeposits, detritus and silts continue to accumulate at the bottom through growth and decayof densely populated weeds, dumping processes of catchment run-off and severing oflinkages with the connecting river due to gradual elevation of drainage beds, etc. Newlyformed floodplain lakes are generally deeper. Initially they possess oligotrophicconditions with low plankton densities. In course oftime, they turn into eutrophic waterbodies with enough bulk of plankton. Deeper floodplain wetlands with longerevolutionary history, however, have heavier growth of planktonic diatoms. Altitude andlatitude may alter temperature and photoperiod of floodplain wetlands and provide changesin the production cycle. Floodplain wetlands in desert region are usually alkaline, but theyare somewhat neutral in high rain-fed areas while swampy and boggy wetlands are quiteacidic. Their biotic communities vary greatly, bringing in changes in the productive cycle.In other words, floodplain wetland ecosystems are characterised by two things viz., (I)variation of living conditions and (ii) temporary existence of such conditions. Epilimnionin such water bodies provide high DO, good illumination, and conditions both favourableand uniform for high plankton density whereas hypolimnion with not much temperaturevariations in a warm country like India shows low level of DO, stagnancy and pollutionto some extent, allowing protozoans, worms, molluscs to be more.
97

Variations in biotic communities and production cycle
It is well known that ifthe production at the lower trophic level increases, the yieldof nekton is proportionately improved. Phytoplankters and nannoplankters hold theprime position among the biotic communities in the aquatic system. Among net plankton,though most of the members belong to the microplankton population, the abundance ofmacroplankters in monsoon months are also not very uncommon.
Quite a good number of lecithotrophic and nannoplanktivorous macroplankton,basically belonging to meroplankters enter into the floodplain wetlands with the floodwater along with fish spawn and prawn larvae. Initially such plankters occupy the sameniche with other members of infraneuston viz., snails, flatworms, dipteran larvae, etc. andimpede proliferation of phytoplankton through predation and competition for space in theeuphotic zone as also offered by the supraneuston. Unlike Azalia sp., Lemna sp. and othersupraneuston, the hemipterans never contribute towards-the productivity of nekton in apositive manner.
The plankton maxima in floodplain wetlands are usually encountered during springand autumn seasons and minima in winter and summer months. Local variations andeffect oflatitude, temperature, water current, nutrient level, photoperiod, etc. on planktonabundance are well known. Deleterious effect of strong sunlight on surface planktonbarring Microcystis sp., Anabaena sp., etc. is always noticed. So, the density at the sub-surface layer is the highest as seen in Fig. 4.
Water bodies with faster water current have obviously less plankton. Amongplankton community, the drifting neuston such as dinoflagellates and blue green algae aremore affected by.the wind action. Littoral region i.e., the shallow shore area in floodplainwetlands are mostly weed infested and if not, usually have thick coverage of benthicalgae. So, natural development of plankton is much hindered for nutrient diversion,competition for space in the shallow euphotic zone. In such a situation, planktonic growthis generally overshadowed by the growth of attached forms like periphyton and epiphytes.In floodplain wetlands, if the incoming water is mainly from the catchment area, then theconcentration of plankton in the littoral zone is further diluted. But, where flooding is dueto river in spate, the concentration oflittoral plankton greatly depends on the concentrationof rheoplankton rather than limnoplankton. In such environment haliplankter is absent.However, due to the effect of domestic sewage effluents in some floodplain wetlands, theoccurrence of a few hypalmyroplankter cannot be ruled out.
98
Towards the centrally located deeper regions i.e., in lirnnetic or pelagic open waterareas, more extensive occurrence of plankton is seen where quite a few dominating formsexist. Most of these euplankters are holoplankters. At places with greater depths, theplankton community is distinctly divisible into epiplankton of the upper layers of watercolumn and hypo or bathyplankton of the lower layer and that too irrespective of presenceor absence of any aphotic zone in the ecosystem. Wherever, disphotic condition exists,the mesoplankton production is boosted up. If shallow littoral region is affected byturbulence of any sort, the benthic, periphytic and other forins come in suspension towardsthe surface and constitute the pseudoplankton community which are obviously membersoftychoplankton. Such tychoplankters, along with filamentous algae and diatoms, formthe bulk of the littoral plankton in the floodplain wetlands. Further, if there is anystagnancy, the prevalence of blue green algae and desmids, like Closterium sp.,Cosmarium sp., etc. are noticed. When such water bodies are polluted, they usuallyencourage growth of Microcystis sp., Euglena sp., Phacus sp., Pediastrum sp., Coelestrumsp., Amphora sp., Cladophora sp., Pithophora sp., etc.
It is well known that in such water bodies zooplankton constitutes hardly 15-30%of the total plankton. In spite ofzooplankters feeding mainly on phytoplankton, the latteris not the sole limiting factor for the abundance of the former. Usually zooplankters aremore when diatoms are in low density and also quite high in their abundance in theplankton of the upper layer of epilimnion where they exhibit direct relationship with thebulk ofnannoplankters and detritus. The growth of zooplankton community always lagsbehind the phytoplankters. Further, even profusely available zooplankters may disappearor become very scanty. The decline in the zooplankton community is also linked with thegrazing of organisms of higher trophic level. or interferences of various biotic and abioticfeatures or due to differential growth and changes in the period of reproductive cycle orperhaps for animal exclusion through algal barrier. There are many species which cannotbree~ within the system but can thrive only through exogenous replenishment.
Like the blooms of algae appearing through sprouting of dormant spore, the restingeggs of many zooplankters also hatch out during inundation of dry, exposed marginalareas or elevated patches of the bottom. Sometimes dispersal of dormant algal spores andresting eggs of zooplankters by the feet and feathers of birds has also been reportedcausing sudden blooms in the ecosystem. Similarly, pseudodominances occur asHelosira sp. exhibits pulses against non-pulsating type (Daphnia sp). Such pulses varyfrom place to place, year to year and from species to species without maintaining anyspecific sequence.
99

Zooplankters generally exhibit diurnal migration between water surfaces andbottoms due to certain factors which may be tropistic reaction or phototropism (positiveor negative), geotropism (positive or negative), temperature variation, feeding andphysiological rhythm. The exact cause is not readily detectable. During such migration,certain species originally belonging to the littoral zone, move deeper and deeper throughthe bank slopes to rise again to the surface much away from the shore area. In this manner,they ultimately reach the lirnnetic zone located centrally to join uferflucht community thatalways avoids shore areas and prefer to remain in the epilimnion of the deeper areas.Thus, in most of the floodplain wetlands, the zooplankton is more in limnetic zones thanthe littoral zones. Further, towards the surface, nauplii migrate more than the adultcrustaceans. Even certain zooplankters exhibit morphological variation with thegeographical and seasonal changes. Keratella sp., often becomes smaller in size to migrateupwards through summer water oflesser density, but in case of Daphnia sp. and Ceratiumsp., the case is just the reverse. The anterior end expands in Daphnia sp. and the forthspine appears in Ceratium sp., to expand the body surface for facilitating floatation. Againrotifers and protozoans feeding on settled and sedimented organisms prefer to remain asmeso- and hypoplankton and stay in the littoral zone. Similarly, some dipteran larvae andcopepods also prefer to remain among the hypoplankton community. Littoral region of afloodplain wetland usually encourages the presence of large cladocerans (Daphnia sp.)along with copepods, ostracods and rotifers.
Though plankton density in the littoral region is quite low, the periphyton(aufwuch) community generally flourishes, taking advantage of leaves, twigs or stems ofthe submerged weeds for attachment and ultimately plays key role in the production cycle.This community encourages the growth of browsers in the higher trophic level. In thefloodplain wetlands of the hilly terrain with submerged boulders and rocky banks, thepopulations of periphyton in most cases settle densely on hard substrates more or less' ina permanent manner and show much complexity.
Conclusions
The contribution of periphyton, detritus and benthos is more for the productivecycle ofthe littoral zone, whereas phytoplankton followed by zooplankton, neuston, etc.are the main contributors for the nekton production in the lirnnetic zone, if the water areais not choked with obnoxious weeds in a floodplain wetland. Generally, benthicpopulations are less in the lirnnetic ZOHeand areas quite close to the shoreline respectivelydue to low depth and susceptibility to drying on exposure when water recedes. So,slightly deeper area that never dries completely shows usually denser populations of
100
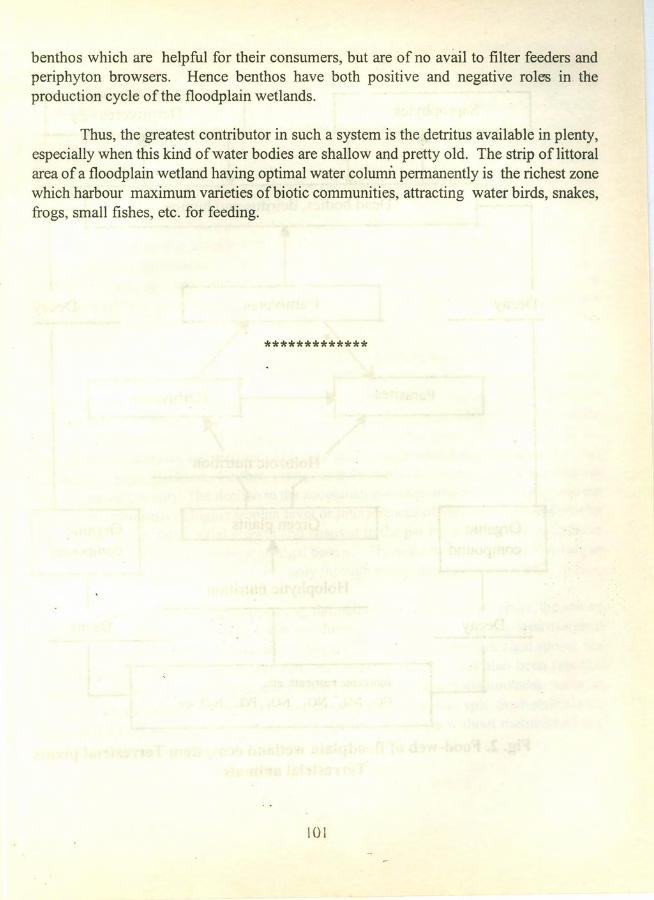
benthos which are helpful for their consumers, but are of no avail to filter feeders andperiphyton browsers. Hence benthos have both positive and negative roles in. theproduction cycle of the floodplain wetlands.
Thus, the greatest contributor in such a system is the detritus available in plenty,especially when this kind of water bodies are shallow and pretty old. The strip oflittoralarea of a floodplain wetland having optimal water column permanently is the richest zonewhich harbour maximum varieties of biotic communities, attracting water birds, snakes,frogs, small fishes, etc. for feeding.
*************
101
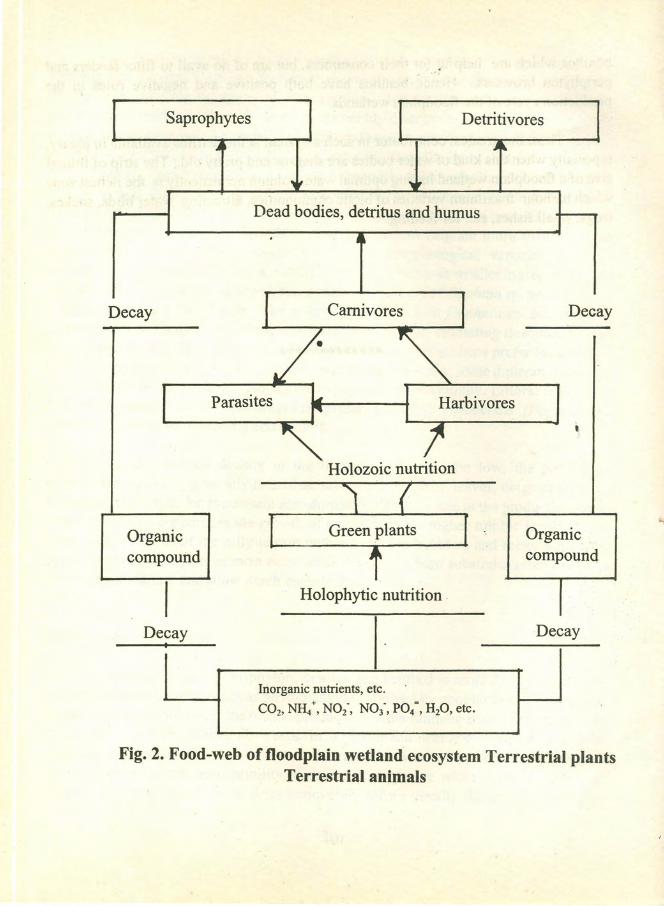
.'
Saprophytes Detritivores
•• J~
,~ ,rDead bodies, detritus and humus
41'
Decay I Carnivores I Dec
/ ~-
Parasites ~ I Harbivores~ I
~ J,
ay
Holozoic nutrition
Organiccompound
Organic.compound
Holophytic nutrition.
DecayDecayI
Inorganic nutrients, etc.CO2, NH/, N02-, N03-, P04=, H20, etc.
Fig. 2. Food-web of floodplain wetland ecosystem Terrestrial plantsTerrestrial animals

Nekton
Macrobenthos, etc
Zooplankton
Phytoplankton, phytobenthos, etc.
Nutrients •
Fig. 1. Food pyramid of floodplain wetland ecosystem
.>
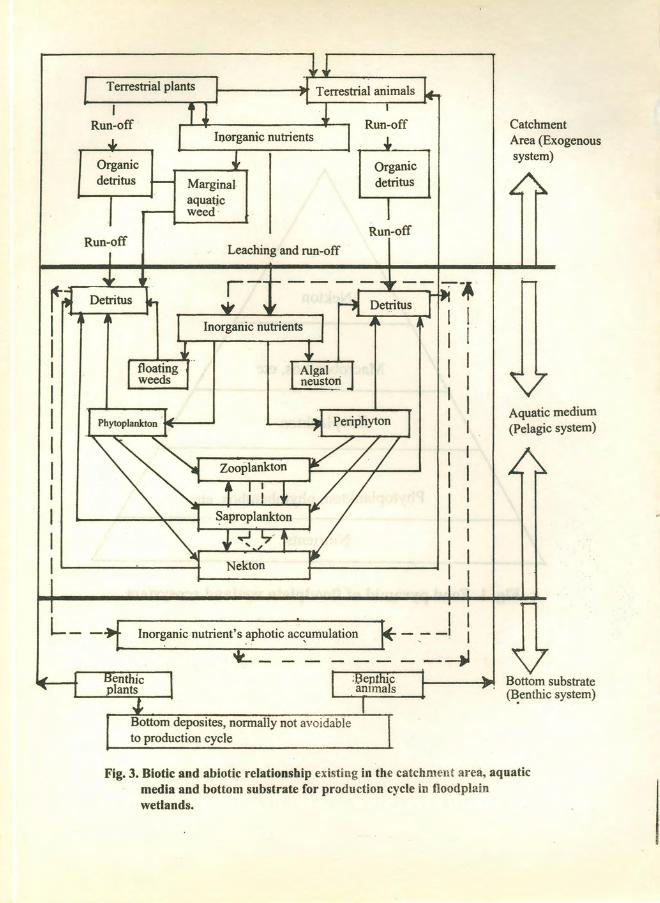
IRun-off
Organicdetritus
Run-offRun-off
Leaching and run-off
L-- I I---I I
---.IInor~anic nutrient's aphotic accumulation
't... _
Bottom deposites, normally not avoidableto production cycle
CatchmentArea (Exogenoussystem)
Aquatic medium(Pelagic system)
~Bottom substrate(E!enthic system)
Fig. 3. Biotic and abiotic relationship existing in the catchment area, aquaticmedia and bottom substrate for production cycle in floodplainwetlands.

Surface
Sub-surface
Bottomplankton (units/l) 11----------------1
Fig. 4. Plankton density pattern at different layers of water column
Summer School on Fisheries Enhancementin Small Reservoirs and Floodplain LakesCIFRI Barrackpore 14July to 12August 1997
Macrophyte and the associated fauna - a major link in thefood chain of floodplain lakes
Krishna MitraCentral Inland Capture Fisheries Research Institute
Barrackpore-743 101, West Bengal
Introduction
A water body is considered as live when it harbours organisms, both plants andanimals, and promotes recycling of their life processes within the system. Floodplain lakesare one of such dynamic and important ecosystems. These are usually wide and shallow,rich in nutrient status, and thus support a dense growth of flora and fauna. Despite the richdiversity and population density of these organisms, they survive in the system in acoherent manner.
As a group, macrophytes constitute a bulk of the biomass produced in suchwetland ecosystems. Obviously, their dominance is also reflected in the multifarious role-they play in the aquatic productivity process. They synthesize basic organic elements' likeprotein, fat and carbohydrate and ultimately contribute to the detritus pool of the bottomsoil when they die. They act as substrates for periphytic growth, provide shelter (0
different aquatic fauna and also serve as breeding ground for the associate fauna.Macrophytes and their associates thus constitute a major link in the food chain of suchwater bodies.
Macrophyte diversity
Floodplain lakes receive maximum precipitation and floodwater from rivers duringmonsoon. Along with water, they also receive silt, organic and inorganic nutrients as wellas seeds, and propagules of many free floating aquatic weeds. Being shallow in natureand resultant good penetration oflight, beels form one of the most favourable habitats for
103
the growth of innumerable species of hydrophytes, occupying different niches of theecosystem. Depending upon their zonation pattern in the habitat, macrophytes are usuallyclassified into the following major groups.
i) Emergent macrophytes
These grow along the margin and are either erect orprostate-floating in habit. Thecommon erect ones are Cyperus procerus, C. exallatus, Eleocharis dulcis, E. spiralis,Scirpus grossus, S. airticulatus, Typha angustata, Monochoria hastata, Polygonumbarbatum, P. hydropiper, Aeschenomene indica, A. aspera, etc. The prostrate floatingones are Ludwigia adscendens, Ipomea aquatica, Alternanthera philoxeroides, Commelinalongifolia, Paspalum paspaloides, Hygrorhiza aristata, Leersia hexandria, etc.
ii) Floating macrophytes
They may be either rooted with leaves and flowers above the water surface or freefloating. The common rooted ones are Nymphaea pubescens, N. nouchali. Nelumbonucifera, Nymphoides cristatum, N. indicum, Myriophyllum tetrandrum, M tuberculatum,, Limnophila indica, Potamogeton nodosus, Aponogetan natans etc. These plants grow incontinuous water zone within the depth range of about 0.25 to 3 m. The free floating onesare Eichhornia crassipes, Pistia stratiotis, Spirodella polyrrhiza, Lemna perpusilla,Azolia pinnata, Utricularia steliaris, U aurea etc. They remain spread all over the waterarea or get drifted towards the bank by wind action. In shallow waters, some of themmay anchor their extensive root system and develop into land forms.
iii) Submerged macrophytes ..",'
These plants grow in submerged soil up to a water depth of about 10 m. Thecommon forms are Hydrilla verticillata, Vallisneria spiralis, Nechamendra alternifolia,Blyxa octandra, Ottelia alismoides, Ceratophyllum demersum, Potamogeton crispus,Najas indica, Chara sp., Nitella sp., etc.
Macrophyte associated fauna
Aquatic macrophytes support a dense growth of macro-invertebrate fauna byproviding them food, shelter, breeding ground and rearing area for their progenies. Bulkof this fauna comprises the ubiquitous molluscs, followed by nymphs, larvae and adultsof insects, annelids, ostracods, decapods, arachnids, etc.
104

Molluscs
The molluscs are mainly represented by gastropods and a few bivalves. Thegastropods feed primarily on organic matter (mostly decaying weeds and occasionallysome dead animals) that constantly accumulate at the bottom of these water bodies.Bivalves, on the other hand, are generally filter feeders (microphytic organisms) and needmacrophyte as the main substrate for their movement. Submerged macrophytes like Najas,Ceratophyllum, Vallisneria, etc. are some of the important species mostly favoured bygastropods for food shelter and other activities.
The common gastropods are Gyraulus convexiusculus, Gabia orcula, Bellamyabengalensis, B. varietus, Indoplanorbis exustus, Lymnaea acuminata, Thiara tuberculata,Pi/a globosa, Digoniostoma cerameopoma, Segmentina sp., etc. The bivalves areLamellidens marginalis, Parreysia corrugata, Piscidium sp., Corbicula sp., etc.
Insects
Aquatic insects are more prevalent in shallow water mainly because of their partial.adaptation to the aquatic life. There are seven or eight groups of insects which dependheavily on macrophytes for their food and breeding activities. Some feed directly on theplant material (Coleoptera, Lepidoptera) while others graze on it. Some lay their eggsinside the tissue of the plants (Hemiptera) while others use plants as a substrate forbreeding purposes. There are others which construct dwelling for .rearing their larvaewith the help of small pieces of twigs and leaves (Trichoptera, Lepidoptera, etc.). Theinsects commonly found in the beels of West Bengal are Diplonychus annulatum,Ranatra filiformes, Relongata, Lethocerusindicus, Gerris nitida, G. spinolae,Micronecta proba, M merope, Plea sp., Anisops sp., Canthydrus morsbachi, C .laetabilis,Hydrocoptus subvittulus, Hydrovatus confertus, H. bonovouloiri, Regimbertia attenuata,Berosus indicus, Helochares sp., Sympertum sp., Libellula sp., Erythemis sp., Pachidiplax
. sp., Chironomus sp., Tendipes sp., Stratiomys sp., Culex sp., Ceratopogon glabra, Tabanussp., Caenis sp., Beatis sp., Nymphula sp. and Leptocera sp., etc.
Ostracods
Commonly known as seed shrimps, these animals belong to the genera Cypris,Heterocypris, Stenocypris, etc. They are mostly free living and omnivorous feeding onalgae, periphytic organisms and fine detritus. They are found in the beels of West Bengalthroughout the year and occasionally met with in plenty as a constituent of the weedassociated fauna.
105

Decapods
Represented by prawns, shrimps, and crabs, they also use the macrophytes for theirfood and shelter and themselves serve as the food for carnivorous fishes.
Annelids
The annelids are relatively fewer in number and are mostly represented byoligochaetes (aquatic earthworms) polychaetes and a few parasitic leeches belonging to thegenera Placobdella, Helobdella and Hirudo. The common oligochaetes belong to generaNais, Dero, Aelosoma, Branchiura, Chaetogaster, etc. Some of them feed on periphytonoccurring on macrophytes while others (aquatic earthworms) devour algae or algal matsthat remain entangled with macrophytes.
Besides, other organisms like ticks, mites, water spiders (belonging to Arachnids)are also met with as constituents of the macrophyte associated fauna.
Aquatic food chains
The two important food chains in the aquatic environments are macrophytic andmicrophytic. The macrophyte food chain is comparatively shorter and has the aquaticmacrophytes as the primary synthesizer of carbon. On the other hand, microphytic foodchain is a longer one, involving phytoplankton as the primary producer and a number ofprimary, secondary and tertiary consumers. The macrophyte associated fauna is animportant link in the food web of the floodplain wetland ecosystem, playing a vital rolein the fish production from these water bodies.
Macrophytic food chain
In this food chain system, macrophytes which are the primary producers, aredirectly or indirectly consumed by the animals of higher strata like herbivorous fishes.Besides being directly consumed, their decaying vegetable remains contribute to theorganic detritus stored.at the bottom soil, which form an important food item for manyof the bottom feeding fishes, molluscs, insects, and so on. Aquatic macrophytes in thisway promote the growth of all other communities in the aquatic ecosystem.
106

Role of macrophyte associated fauna in the beel ecosystem
The constitution ofthe fauna associated with aquatic macrophytes varies greatlydepending upon the types of macrophytes and physico-chemical properties of the habitat.Available information on macrophyte associated fauna of the beels of West Bengal revealsthat the climatic conditions, hydrobiology and the macrophytic flora of these beels aremost conducive for colonization and growth of molluscan fauna mainly composed ofgastropods (Gabia, Gyraulus, Bellamya, Lymnaea, etc.) Next to molluscs, insects ofdifferent sub-groups are found in good numbers in these habitats. Though decapods,ostracods, annelids and arachnids are also met within these habitat their populationfluctuates, greatly.
The above mentioned species of the macrophyte associated fauna in their differentstages of development constitute in general natural food items of many fishes. This foodchain system may not appear very significant if evaluated in isolation but the importanceof the role played by the macrophyte associated fauna in the beel ecosystem can not beoverlooked.
**********
107
Summer School on Fisheries Enhancementin Small Reservoirs and Floodplain Lakes,CIFRI. Barrackpore. 14Julv to 12August 1997
Fish species diversity in the floodplain lakes andthe need for its conservation
P.K. ChakrabartiCentral Inland Capture Fisheries Research Institute
Barrackpore-743 101, West Bengal
Introduction
Nature of fish fauna in an aquatic system is highly dependent on its ecologicalconditions. Under a stressed situation, fish species which are well adapted to theadversities thrive and the more sensitive ones perish, leading to a fall in species diversity.Where no such barrier or species selection prevails, the number of fish species availablenaturally goes up considerably. Ecological features of various floodplain lakes are quitedifferent, so the fish faunal diversity in them are also not identical. The characters of suchwater bodies are bound to change with the passage of time, the fish species diversity alsohas to change. Hence, floodplain lakes always demand appropriate conservation measuresto protect the fish species diversity. On categorising all such water bodies either into.oligotrophic and eutrophic or deep and shallow or fluviatile and stagnent or perennialand seasonal or some other types, changes in species diversity among ichthyofauna canbe observed.
Region-wise variations of floodplain lake fishes
It is well established that the biodiversity is dependent on the geoclimaticconditions of a region. Thus, the floodplain lakes situated in different parts ofthe countryexhibit a rich fish faunistic diversity. Usually available fishes of floodplain lakes indifferent regions are as given in Table 1 to 4.
109
i.

Table 1. Common fishes of the Deccan floodplain lakes
Family: CyprinidaeCatla catla *Labeo rohita *L.bogaLcalbasu,L. fimbriatusL.kontiusL.pocellusL.potailL.pangL. arizaL.boggutL.bataCirrhinus mrigala *CrebaCfulungeeCcirrhosaCyprinus carpio v. communis *Ccarpio var.specularis *Ctenopharyngodon idella *Hypophthalmichthys molitrix *Puntius dub iusP. carnaticusP.cholaP.dobsoniiP.dorsalisPjilamentosusP.mahecolaP.saranaP.tictoP.punctatusP.melanampyxP.stigmaPcconchoniusP.puckelliP.amphibiusP.auriliusP.ambassisP.pulchellusP.kolusP.sophoreP.bovianicus /Tor khudree malabaricusT.putitora
T.torSalmostoma phulo phuloS.chela untrachiGonoproklopterus curmucaAmblypharyngodon melettinusA.molaBarilius gatensisB.bendelisisB.barilaB.barnaDanio rerioD.aequipinnatusPerluciosoma daniconiusEsomus danricaE.barbatusRasbora daniconiusR.buchananiChela laubucaCutparRohtee ogilbiiOxygaster clupeoidesOiargenteaOsteobrama vigorsiiOicotioOreichthys cosuatusAspidoparia morarGarra lamtaG.mcclellandiAcrossocheilus hexagonolepis
.>
Family: CichlidaeOreochromis mossambicus *Etroplus suratensis *E.canarensisE.maculatus
Family :NotopteridaeNotopterus notopterus
Family: AnguillidaeAnguilla nebulosaA.bengalensis bengalensis I
I110

l)ble 1 contd .
Family: ChanidaeChanos chanos *
Family: GobiidaeGlossogobius giuris
Family: NandidaeNandus nandusPristolepsis(Malabaricus Marginata)
Family: BagridaeMystus malabaricusMystus vittatusM.punctatusM.cavasiusAorichthys aorA.seenghala
Family: SiluridaeOmpokpabo0.bimaculatus0.malabaricusWallago attu
Family: OphiocephalidaeChanna maruliusCstriatusCleucopunctataCgachua
Family: MastacembelidaeMacrognathus guntheriM.aculeatusMastacembelus armatusM.pancalus
Family: BelonidaeXenentodon cancila
Family: ClaridaeClarias batrachusCidussumieri
Family SaccobranchidaeHeteropneustes fossilisGlyptothorax housei
Family: CobatidaeNoemacheilus denisoniiN.scaturigenaN. rupicolaLepidocephalus gun teaL.thermalis
Family: AmbassidaeAmbassis baculisChanda rangaCnamaParambassis thomasi
Family: CyprirrodontidaeAplocheilus(=Panchax) lineatusOryzius melanostigma
Family: PoecilidaeGambusia affinis *Poecilia reticulala
Family: SisoridaeGagata itchkeeaGlyptothorax housei
Family: MugilidaeRhinomugil corsula
Family: OsphronemidaeMacropodus cupenusOsphronemus gourami
Family SchilbeidaePseudeutropius taakreePangasius pangasiusSil~nia silondiaS.childreni
* Introduced
iiI

Table 2. Common floodplain lake fishes of Central and Western India
Family: CyprinidaeCatla catla *Labeo rohitaLfimbriatusL.calbasuL.calbasuL.boggutL.bataL.goniusCirrhinus mrigala *CrebaHypophthalmichthys molitrix *Cyprinus carpio var.communis *Puntius saranaP.dobsoniP.kolusP.sophoreP.tictoTor torTkhudreeChela fulangeeCbacailaBarilius barn aB.bendelisisOsteobrama cotio
Family: SiluridaeOmpakpabda0.bimaculatusWallago attu
Family: SisoridaeBagarius bagarius
Family: BagridaeAorichthys aorA.seenghalaMystus cavasiusM.bleekeri
,',:
Family: ScbilbeidaeSiolonia silondiaClupisoma garuaEutropiichthys vacha
Family: GobiidaeGlossogobius giuris
Family: CobatidaeLepidocephalus guntea
Family: AmbassidaeChanda namaCranga
Family: OpbiocepbalidaeChanna striatusCmaruliusCpunctata
Family: MastacembelidaeMastacembelus armatus
Family: AnguillidaeAnguilla bengalensis
Family: BelonidaeXenentodon cancila
Family: NotopteridaeNotopterus chitalaN.notopterus
Family: SaccobrancbidaeHeteropneustes fossilis
Family: ClaridaeClarias batrachus
* Introduced
112

Table 3. Common floodplain lake fishes of the northern and eastern India
NORTHERN INDIAFamily: CyprinidaeCatla catlaLabeo rohitaL.deroL.dyocheilusL.calbasuL.bataL.diplostomaL.goniusCirrhinus mrigalaC.rebaH. molitrix *Cyprinus carpio specularis *Puntius saranaChela bacailaTor putitoraSchizothorax plagiostomusS.richardsoniiGarra gotylaCrossocheilus latiusFamily: SalmonidaeSalmo trutta fario *Family: ClupeldaeGadusia chapraFamily: OphiocephalidaeChanna maruliusFamily: NotopteridaeNotopterus chitalaN.notopterusFamily: BagridaeAorichthys aorA.seenghalaMystus bleekeriFamily:' SchilbeidaeSilonia silondiaClupisoma garuaCmontanaFamily: SisoridaeBagarius bagarius
Family: MastacembelidaeMastacembelus armatus
..'"
EASTERN INDIAFamily: CyprinidaeCatla catlaLabeo rohitaL.bataLdyocheilusL.boggutL.calbasuL.deroL.gon iusLfimbriatusCirrhinus mrigalaC.rebaH. molitrix *Cyprinus carpio communis *Puntius saran aP.tictoP.sophoreP.cholaP.conchoniusTormosalT.mahanadicusBarilius bolaB.barnaAmblypharyngodon molaOxygaster bacailaO'clupeoidesEsomus danricaOsteobrama cotioCrassocheilus latiusGara gotylaG.mul/yaAspidoparia morarRasbora daniconius. Rohtee cotio
Family: AmbassidaeChanda rangaC.namaFamily: GobiidaeGlossogobius giurisFamily: CyprinodontidaeAplocheilus punchax
Il3
Family: NotopteridaeNotopterus chitalaN.notopterusFamily: SiluridaeOmpokpabda0.bimaculatusWallago attuFamily: MastacembelidaeMacrognathus aculiatusMastacembelus armatusM.pancalusFamily: SchilbeidaeEutropiichthys vachaAilia coilaSilonia silondiaPangasius pangasiusFamily: MugiJidaeRhinomugil corsulaFamily: BagridaeAorichthys aorA.seenghalaMystus tengraM.cavasiusRita cryseaFamily: SisoridaeBagarius bagariusFamily: SaccobranchidaeHeteropneustes fossilisFamily: ClariidaeClarias batrachusFamily: OphiocephaJidaeChanna gachuaCstriatusCpunctataFamily: NandidaeNandus nandusFamily: ClupeidaeGadusia chapra
* Introduced
.'
.. /'

Table 4. Common floodplain lake fishes of North-East India
Family: CyprinidaeCatla catlaLabeo rohitaL.goniusCirrhinus mrigalaHypophthalmichthys molitrix*Ctenopharyngodon idella *Cyprinus carpio v.specularis*Puntius stigmaPisophoreP.tictoP.saranaTor torT'putitoraAmblypharyngodon molaAcrossocheilus hexagonolepisDanio rarioD.aequipinnatusD.dangila
Family: CyprinodontidaeAplocheilus panch axFamily: CobatidaeNoemacheilus multifaciatus
Family: BelonidaeXenentodon cancila
Family: AmbassidaeChanda ranga
Family: SiluridaeWallago attu Family: Saeeobranchldae
Heteropneustes fossilisFamily: BagridaeAorichthys aor Family: Claridae
Clarias batrachusFamily: OphiocephalidaeChanna punctataC.marulius
Family: NotopteridaeNotopterus notopterus
Family: MastacembelidaeMastacembelus puncalusM.guentheri * Introduced
A number of Gangetic and exotic carps are present in the floodplain wetlands asshown in the foregoing tables which are the results of introductions. The maximumspecies diversity is recorded from the floodplain lakes of the Deccan region followed bythose of eastern India. Central, western and northern regions ofthe country show moderatediversity of ichthyofauna and the least diversity is observed in case of floodplain lakes ofthe northeastern India.
Pooling the fish species diversity of the floodplain lakes of the country as a whole,the following species can be listed as typical ichthyofauna of such water bodies.
Major carps Catla catla, Labeo rohita, Lfimbriatus, L.calbasu, Cirrhinusmrigala
Minor carps &:other carps
Labeo kontius, L.bata, Cirrhinus cirrhosa, C.reba, Puntius sarana,P.dubius, P.carnaticus, P.kolus, P.dobsoni, Pichagunio,Thynnichthys sandkhol, Osteobrama vigorsii
114I

Snowtrout Schizothorax plagiostomus, Schizothoraichthys niger, Sesocinus,S carvifrons
Mahseer Tor tor, Tkhudree, Tputitora, Acrossocheilus hexagonolepis
Featherback Notopterus notopterus, Nichitala
Murrels Channa marulius, Cstriatus, Cpunctata, C.gachua
Large catfishes: Aorichthys aor, A.seenghala, Wallago attu, Pangasius pangasius,Silonia silondia, Schildrenii
Airbreathingcatfishes
Heteropneustes fossilis, Clarias batrachus
Weed fishes Chanda nama, Aspidoparia morar, .Amblypharyngodon mola,Barilius barila, B.bola, ·Esomus danrica, Gadusia chapra, Laubucalaubaca, Oxygaster bacaila, Osteobrama cotio, Puntius ticto,P.sophore.
Exotic fishes Cyprinus carpio var.communis, Ccarpio var.specularis,Ctenopharyngodon idella, Hypophthalmichthys molitrix, Gambusiaaffinis, Oreochromis mossambicus
When predominance of Labeo bata, L.dero, Puntius sarana, P.chagunio, Torputitora, Cirrhinus reba and Schizothorax spp. are noted in the floodplain lakes andwetlands of north India, the significant occurrence of Labeo kontius, Lfimbriatus,Cirrhinus cirrhosa, C.reba, Puntius dubius, P.sarana, P.carnaticus, P.kolus, P.dobsoni,Tor tor, Thynichthys sandkhol and Osteobrama vigorsii are recorded from south India.
Fluctuation in the diversity
Because of the gradual changes of the floodplain lakes from oligotrophic toeutrophic and finally to boggy conditions, the fish species diversity goes on changing.The decline in the number of fish species is more than the addition of new species in suchwater bodies. It is quite distinct that Labeo dero and L.dyocheilus in Himalayan ranges;Lfimbriatus, L.calbasu, Puntius sarana, Rhinomugil corsula, Tor tor, Tmahanadicus, andTmosal in Orissa; Labeo kontius, Cirrhinus cirrhosa, Puntius dobsoni, P.dubius,
115
I1
P.carnaticus, Tor putitora and Acrossocheilus hexagonolepis in Tamil Nadu; Labeofimbriatus, L.calbasu, L.pungusia, Puntius kolus, P.dubius, P.sarana, P.porcellus, Torputitora and Schizothorax plagiostomus inJammu and Kashmir; and Labeo dero, Puntiuschola, P.conchonicus, Crosscheilus latius, Garra mullya, G.gotyla, Macrognathusaculiatus, Oxygaster c/upoides and Aspidoparia morar in eastern India are graduallydeclining as far as floodplain lakes are concerned.
Decline in species diversity has also been aggravated by the introduction of exoticspecies which are damaging the indigenous carps through competition for food and spacein the floodplain lakes. Therefore, further introduction of other exotic carps like bighead(Aristichthys nobilis), mud carp (Cirrhinus molitorella) and snail carp (Mylopharyngodonpiceus) which feed on zooplankton, detritus and molluscs respectively, cannot beconsidered for the floodplain lakes. Moreover, already introduced mirror carp (C.carpiovar.specularis) and indigenous snowtrout (Osteobrama belangeri) are becoming unsuitablefor floodplain lake ecosystem for their low fecundity and stream breeding habits.
Floodplain lakes need not always cause damage to the ichthyofauna of the parentstreams which gave rise to such water bodies. Fish species such as Salmostoma phulophulo. Osteobrama vigorsii, Pangasius pangasius, Barilius bola, Mystus kistnensis,Pseudeutropius taakree, Thymichthys sandkhol, Tor khudree, T.mussullah, Aorichthysseenghala and Tor putitora are in the rise in such waterbodies. It is worth noting that thecatadromous fish like P.pangasius has become endemic species whithin the floodplainlakes.
Food web dependancy of floodplain lakes
Ichthyofaunal dependancy to the food web ofthe floodplain lakes has always beenregulating the species diversity. Owing to the existence of sufficient molluscs, weeds andMicrocystis sp. in the floodplain lakes, the respective consumer fish species such asPangasius pangasius, Puntius pulchellus and Thynnichthys sandkhol are performing wellin such water bodies. Weed consumer Ctenopharyngodon idella also could have done wellin such lakes provided their breeding would have taken place' within the floodplain lakeitself and had not damaged the indigenous populations of carps. Having gathered theknowledge about the food items available within the floodplain lakes, suitable fish speciesfor such ecosystem can be determined especially when the preferred food of severalwell suited fishes are analysed (Table 5). It is seen that Gangetic major carps in manyfloodplain lakes have managed to occupy the ecosystem at the cost of many local species.So, the impact of species interaction may deplete or encourage the fish species diversityin a floodplain lake. Presently, the floodplain lakes gradually loose their ichthyofaunal
116
\ diversity, especially the quality fishes for selective exploitation and some non-commercialfishes too through over influence of introduced or well adapted fishes. Thus, dominanceof minnows and catfishes are observed before the final collapse of the fisheries.
Problems of ichthyofaunal diversities in floodplain lakes
General ecological conditions of water and soil play the key roll for the fish speciesdiversity, but there are other factors too to reduce such diversity drastically. For instance,pollutional load, ingress of runoff from the catchment area, siltation, the process ofeutrophication, introduction of exotic fish species etc. can change the complexion of thefish species diversity in the floodplain lakes. Restricted breeding and multiple breedingof various species may favour some fish, placing others into disadvantage. Similarly,recruitment success and failure also play great roll in regulating the species diversity, andso does the random or selective fishing. Thus, management of fisheries by way ofstocking, harvesting, simulating conditions for fish breeding, rearing and ranching, andalso introducing new species, affect the species diversity although, leading to higher fishproduction. Depending on the altitude and location ofthe floodplain lake, the fish speciesdiversity varies greatly. Similarly, shore development, extent of weed infestation, gradientof the bank, species interaction, etc. are other sources of modulation that can bring changesin the fish species diversity in such water bodies.
A rational approach towards fisheries management, stocking, species introduction,species elemination, orienting water and land use patterns, etc. is needed to conserve thebiodiversity of the floodplain lake fishes which contribute considerably towards the totalstrength of more than 2000 fish species of the country. Keeping in view, the constanttransformation of floodplain lakes and their strides towards boggy condition and ultimatedeath, the available fish species are required to be conserved against their extin
117

Table 5. Preferred food for floodplain lake fishes
00
Floodplain lake Blue detr- decayed zoopla- diatom green other serni- insect mollusc ostracods & trash weedfishes green itus organic nkton algae algae digested other misc. fish
algae matter org. matter organisms
C catla • # - # - - - • - - - - -L. rohita # • + - - - + - - - - - -L.calbasu # • + - # + + - - - - - -L.fimbriatus - • + + # - + • - - - - -C mrigala + • + - + + - - - - - - -Creba - - • - + + + # - - - - -C carpio + + - + + + • - - - - - -Puntius saran a - - + - - - - # + • + - -P.aurilus - - # + - - + • - - - - -P.dobsoni - - - - - - - - - • - - #P.kolus - # - + + + - - - • - - -P.sophore - * - - # + # - - - - - -Torkhudree - • - - - - - - - # - - +T.putitora - - - # - - - - - - - •0. vigorsii - • - - + - - - + # - - -S. phulo phulo + • - + + + - • - - - - -0. cotio - • - # + - + - - - - - -Rohtee ogilbii - # - • - - - - + - - - -Chela atpar + • - - - + + # + - - - -

.Table 5 contd ••••••••••••
Floodplain lake Blue detr- decayed zoopla- diatom green other- semi- insect mollusc ostracods & trash weedfishes green itus organic nkton algae algae digested other misc. fish
algae matter org. matter Organisms
Barilius spp. - • - - + # - - - - - - -D. aequipinnatus - • - - - - - - - - - - -G. itchkeea - - + - - - - .•. - - - - -Oimelanostigma + .•. - - # - - - - - - - -N. notopterus - - + - - - - # .•. - - + -Wallago attu - - + - - - - - + - - .•. -0.bimaculatus - - - - - - - - • - - - -M. cavasius - - # + - - - + - • - - -Aorichthys aor - + - - - - - - + # - ••• -A.seenghala - - - - - - - # + - - • -S. childrenii - - - - - - + # - - >II -P. pangasius - - - - - - - # - ••• - - -P. taakrce - - - - - - - - • + - # -G. giuris - - - + - + - - # - - ••• -0.mossambicus - - - - + - • - - + - ~ -R. corsula - • - + # + - - + - - - -C. marulius - - - - - - - + - - - ••• -Chanda nama - - - + - - - # # - - - -Cbbculta - # - • - - - - # - - - -
1.0
Food preference: * Preference 1, # Preference 2, + Preference 3, - Insignificant

Summer School on Fisheries Enhancementin Small Water Bodies and Floodplain Lakes,CIFRI BarrackDore 14 July to 12August 1997
Fish fauna of Indian reservoirs and the importance of speciesmanagement for increasing productivity
M. RamakrishniahCentral Inland Capture Fisheries Research Institute
Rajajinagar IV Block, Bangalore-560 010
Several reservoirs have been constructed on all major and minor river systems ofIndia for multipurpose use. Each river system has its own distinct fish fauna which isreflected in the reservoirs formed on its basin. Some species flourish in the congenialenvironment created by reservoir formation and some remain at low level or evendisappear unable to withstand the changes in the biotope. The fish productivity of areservoir depends on the quality offish derived from the parent river, its basic productivityin terms of morphometric, hydrological and ecological features and the extent of humaninterference in the management of fish stocks. Many of the reservoirs, however, are poorlymanaged and the fish productivity in vast majority is based on wild populations. With theresult, the fish yields remained at low levels with the national average of about 15 to 20kg/ha, .
Ichthyofauna of Indian Reservoirs
The fish fauna ofIndian reservoirs could be categorised broadly into the followinggroups:
Major carps: The Gangetic major carps, Catla cat/a, Labeo rohita and Cirrhinusmrigala occur naturally in the reservoirs of north India, especially those of the Ganga riversystem. However, these carps have been transplanted repeatedly into peninsular Indianrivers where they appear to have established themselves, Labeo calbasu and Labeojimbriatus are the major carps of peninsular Indian rivers.
12-1
Minor carps: This group includes species like Labeo bata, L. kontius. Cirrhinus cirrhosa,C. reba. Punt/us dubius, P. kolus, P. jerdoni, P. carnaticus, P. curmuca, P. sarana,Thynnichthys sandkhol etc. Minor carps predominate south Indian reservoirs. Some of theimportant commercial forms which dominated the reservoirs of the region at some timeor the other are - P. kolus (Tungabhadra, Linganamakki), P. dubtus (Krishnarajasagar,Stanley) C. cirrhosa (Stanley) T sandkhol (Nizamsagar) and P. curmuca (Malampuzha).Mahseers: These are well known game fishes occurring in all the major river systems andreservoirs generally confining to upper reaches (head waters). The species include Tor tor,T putitora. T khudree and Acrossocheilus hexagonolepis. T khudree is the peninsularspecies forming a fishery in Krishna and Cauvery basin reservoirs. T putitora formsflourishing fishery in Pong and Gobindsagar reservoirs (Indus system), while T toroccurr in Vallabhasagar (Tapti) and Ravis'iankarsagar (Mahanadi) reservoirs.
Catfishes: Next to carps, catfishes enjoy wider distribution. These include larger specieslike Mystus seenghala, M aor, M. krishnensis, W. attu, Bagarius bagarius, Siloniasilondia, S. childreni and Pangasius pangasius. Smaller sized catfishes include M.cavasius, Clarias batrachus, Heteropneustes fossilis, Pseudeutropius taakree etc. Inunmanaged reservoirs, carps generally dominate in early stages of reservoir formationwhich soon give way to the dominance of catfishes. The catfishes which dominate somereservoirs are M seenghala (Nagarjunasagar, Matatila, Hirakud) M aor (Tungabhadra,Bhavanisagar, Nagarjunasagar, Hirakud) S. childreni (Nagarjunasagar, Stanley), S. silondia(Hirakud, Rihand) W. attu (Bhavanisagar) and P. pangasius (Nagarjunasagar). Mcavasius. H fossilis and C. batrachus are observed in small reservoirs. Large catfishes aregenerally absent in small impoundments constructed on minor-tributaries.
Featherbacks: The two species of Notopterus, N. notopterus and N. chitala are includedin this group, N. notopterus is distributed throughout the country while N. chitala isconfined to north ofVindhyas. Abundance of N. notopterus was recorded in Tilaiya, Konar(DVC reservoirs) and Markonahalli (Cauvery system). Weed infested reservoirs offerfavourable conditions for featherbacks.
Murrels: Common species in this group are Channa marulius, C. striatus and C.punctatus. Though these species enjoy wide distribution, their contribution to reservoirfisheries is negligible.
Weed fishes: 'These occur in large numbers in all the water bodies, especially inunmanaged reservoirs. Some of the ubiquitous species are Salmostoma bacailu, S. phulo,S. clupeoides, Ambassis nama, A. ranga, Amblypharyngodon mola, Osteobrama cotio,Puntius sophore, Gadusia chapra etc. Salmostoma spp. Ambassis spp. form significant
fishery in Tungabhadra, Nagarjunasagar, Bhatgar (Krishna system) and Getalsud(Subamarekha) and G. chapra in Ravishankarsagar and Hirakud reservoirs (Mahanadi).Weed fishes are known to withstand greater fishing pressure and flourish in unman agedand over-exploited reservoirs such as Tungabhadra, Bhatgar and Getalsud.
Exotic fishes: Besides indigenous fishes, a number of exotic species have been introducedin various reservoirs as a means to improve productivity. These are the tilapia(Oreochromis mossambicus) the common carp (Cyprinus carpio var. communis &specularis), the silver carp (Hypophthalmichthys molitrix) and the grass carp(CtenophQlyngodon idella).
Tilapia and common carp have established themselves in many reservoirs. TamilNadu is the first State to introduce tilapia in reservoirs (Amaravathy, Uppar, Pambar,Vaigaij.i Now, it occurs in several reservoirs of Karnataka (Kabini, Manchanabele,
I
Nelligudda) and Kerala (Chulliar, Meenkara, Peechi) as well. C. carpio forms a goodfishery in Gobindsagar (Indus system), Krishnarajasagar (Cauvery) and Vanivilassagar(Krishna). Silver carp and grass carp were introduced in selected reservoirs of peninsularIndia and Getalsud in Bihar, but they have not made any impact on the fishery. However,in Gobindsagar the accidental entry of silver carp has changed the complexion of thefisheries of the reservoir. It hascompletly dominated the fishery reducing other specieswhich flourished in the past .
Importance of species management in reservoirs
The objective of species management in reservosirs is two- fold, to increase the fishproductivity and to preserve the biodiversity. In small water bodies, 'especially inpeninsular India, these two objectives work at cross purpose. To get good returns fromreservoirs it is imperative to stock species which are fast growing and also command goodmarket for which Gangetic major carps are ideally suited. Peninsular carps, in general, areslow growing and have low market value. Hence, propagation of major carps is inevitablein peninsular reservoirs. However, there are apprehensions that these species may affectlocal carps and the biodiversity of the system adversely. Small reservoirs built ontributaries should be exempted from the purview of preservation of biodiversity anddeveloped as carp reservoirs to enhance productivity. However, large reservoirs on themainstream of major rivers may be earmarked for preservation of biodiversity. There it.;anurgent need to breed some of the important peninsular carps such as P. jerdoni (P.pulchellus), P. dubius, L. fimbriatus etc. for stocking the mainstream reservoirs ofpeninsular India.
123
.~

Stocking
Stocking is an important management strategy to enhance productivity. Stocking.programme should take into consideration the basic productivity of the impoundment andabundance of various fish food resources. To determine the basic productivity, severalindices-morphometric and ecological- are being used independently or in combination.Some important morphometric indices are reservoir size, mean depth, extent of catchmentto reservoir area and shore development index. Important ecological parameters arealkalinity, pH, specific conductivity, P04-P, NOrN, organic matter, primary productivity,plankton and benthos. Studies made in Indian reservoirs have shown that chemicalparameters are not dependable indicators to assess the productivity. This is due to the factthat allochthonous inputs from the catchment, especially the organic matter (coarse andparticulate), playa major role in the productivity of impoundments. It is widely believed,at least in the Asian context, that morphometric parameters are better indicators ofreservoir productivity. As productivity is largely governed by allochthonous inputs, theextent of catchment in relation to lake size could be a good index of allochthonous inputs .
. The amount of inflow of water in relation to the reservoir capacity also have a bearing onthe productivity.
Species for stocking
Catla (Catla catla) rohu (Labeo rohita) and mrigal (Cirrhinus mrigala) are thepreferred species in reservoir stocking programme. But their individual performance indifferent reservoirs is not uniform. By and large, the performance of catla has been goodboth in oligotrophic and mesotrophic reservoirs. However, rohu fared poorly inoligotrophic reservoirs and exceedingly well in mesotrophic ones, especially in thosewhich have submerged aquatic weeds. Common carp recorded impressive growth inreservoirs rich in bottom deposits. The food habits of Labeo calbasu and common carpappear to be overlapping and only one species appear to thrive to the exclusion of thepther. Common carp being a sluggish species seems to form an easy prey resulting in poorsurvival in catfish dominated reservoirs.
In some peninsular Indian resevoirs, tilapia (Oreochromis mossambicus) has beenstocked after considering its capacity to sustain its populations in lentic environment. Atsome time or the other, it dominated the fishery of Amaravathy, Vaigai, Uppar (TamilNadu) and Malampuzha (Kerala) reservoirs. However, a sustained stocking of major carpshas inhibited tilapia abundance as in case of Amaravathy. Oreochromis niloticus, thoughintroduced in India clandestinely has not yet entered reservoirs. This species has some
124
f
positive features over 0. mossambicus, such as better growth rate and capacity to utilizeMyxophyceae. This could be a useful species for reservoir management at least forculturing in enclosures such as cages, though not in open waters.
It is desirable to widen the species spectrum covering all the food niches formaximising yields from reservoirs. It is also essential to introduce new systems of culturesuch as cage and pen with suitable species to culture. Such an approach could lift the levelsof maximum yield of 150-200 kg/ha hitherto obtained in some small reservoirs.
Size of stocking
There appears to be a direct relationship between initial stocking size and survivalrate. In Chinese reservoirs it has been demonstrated that 13 em was the ideal stocking size.In India, the All India Co-ordinated Project on Reservoir Fisheries, during early 1980s,suggested a minimum stocking size of 10 em. This could be implemented only in Aliyarand Thirumoorthy reservoirs by the Reservoir Division of CIFRI, resulting in spectacularincrease in fish yield. Even with this stocking size, recapture rate of the stocked fishes hasbeen about 20 to 25% in Aliyar, where the predatory pressure was minimum. In reservoirsof Madhya Pradesh, it has been reported that stocking of fry/early fingerlings has resultedin realisation of about 5% of the stock. In the light of these results, there is a need toreorient our thinking in matters of stocking which has been highly empirical.
In conclusion, it may be mentioned that species management- quality, quantity andsize-hold the key for higher yields especially in small impoundments.
*********
125
!
i
Summer School on Fisheries Enhancementill Small Water Bodies and Floodplain Lakes,CIFRI Barrackpore 14July to 12August 1997
Yield optimization in small reservoirs- a case study in Aliyar reservoir
C. SelvarajCentral Inland Capture Fisheries Research Institute
Rajajinagar IV Block, Bangalore-Sou 010
Introduction
Of the total of 2,365 reservoirs available in India, about 2,153 fall under thecatgegory of small reservoirs of less than 1,000 ha (excluding the peninsular tanks). Thesmall reservoirs are reported to yield high production rates in China and Sri Lanka.However, the per hectare yield from the small reservoirs in India is very unimpressive.Recent studies have.revealed a wide gap between the great production potentiality and theactual yield being obtained from these reservoirs. This Poor yield is mainly due to the lackof adoption of suitable scientific management techniques. Though there is not much scopefor the alteration or improvement of the existing ecological conditions in the smallreservoirs because of sharp changes in the inflow and outflow pattern in them, as the wateris drawn constantly for irrigation and drinking water purposes, their inherent productionpotentiality can be harnessed through the adoption of judicious management techniquesof stocking and exploitation. In order to evaluate the production potentiality of these smallreservoirs, CIFRI undertook detailed ecology-based investigations in Aliyar during 1983-92. The studies have established tremendous scope for the optimization of fish yield fromsuch small reservoirs in India.
Aliyar reservoir
Aliyar reservoir with an average area of 324 ha (maximum 640 ha) and meandepth of 18.2 m is a tail-end reservoir ofthe chain of reservoirs under the Parambikulam-Aliyar project (PAP) in the Western Ghat region of Tamil Nadu. It receives its main supplyof water from Parambikulam reservoir through a contour canal. Though major carps had
127
.f
•. ",,<
been transplanted into the reservoir immediately after its formation in 1962, none of themcould be established in the reservoir. Hence, the fishery of the reservoir was sustainedthrough stocking offish seed every year.
Stocking and yield during 1962-85
During the initial stages, the reservoir was stocked heavily (1,272/ha), consistingpredominantly of uneconomic species of medium and minor carps, tilapia, murrels, etc.(Selvaraj and Murugesan, 1990a ; 1990b and Selvaraj el al., 1990). Though the reservoirwas stocked with some major carps from 1964-65 onwards, the size of the seed stockedwas so small that they fell an easy prey to the predatory fish populations. The rate andratio of different species stocked did not have any relevance to the ecological conditions,the biogenic production potentiality of the reservoir, the food spectrum, the growth rate ofdifferent fish species, etc. All the stocking was done during a short period between Augustand October every year, resulting in stiff competition among the seed of the same agegroup for food and space. The exploitation of the fishes was so indiscriminate that eventhe major carps of less than 1 kg were regularly harvested as there was no restriction onthe mesh size ofthe gillnets operated. It was almost an annual cropping pattern of stockingand harvesting during the same year. The cumulative impact was that the reservoir wasyielding a low annual production ranging from 2.67 kg/ha to 54.53 kglha, with an averageof 26.21 kg/ha. Thus, the reservoir was considered to be oligotrophic with low fishproduction potential.
Scientific management during 1985-86
Fish production in a reservoir is influenced by the morphological, edaphic andclimatological parameters. Hence, detailed investigations on the physico-chemical qualityof water and soil, plankton, macrobenthos, primary productivity, existing fish populationsincluding the predatory fishes, food and feeding habits of fishes, maturation and breeding
\
of the major carps stocked, the growth rate of different species, etc. were undertakenduring 1983-85.
Stocking
The major carps stocked in the reservoir failed and to breed to attain propermaturation in the reservoir due to the unsuitable chemical quality of reservoir water(Joseph et al., 1990; Selvaraj et al., 1990). Hence, the fisheries of the reservoir had todepend solely on the seed stocked every year. Detailed studies were carried out to assessthe growth rate of the different species through fin-clipping and tagging experiments
128'.
(Murugesan and Selvaraj, 1990; Murugesan et aI., 1990). Based on the results of thesestudies, drastic changes were brought about in respect of stocking and exploitation policiesfor obtaining a sustained yield of 150 kglhalyr as indicated by the studies on the primaryproductivity ofthe reservoir. As a result, there was a substantial improvement in the annualfish yield ranging from 75 to 193.58 kglha, with an average yield of 132.67 kg/ha during1985-92.
The usual practice of stocking the reservoir with all kinds of miscellaneousuneconomic species of fishes was discontinued. As the reservoir was harbouring thepredatory catfishes like Ompok bimaculatus and 0. malabaricus, the early fry of the majorcarps were reared in the fish farm located adjacent to the reservoir and only advancedfingerlings of more than 100 mm were segregated and stocked in the reservoir. As againstthe traditional method of stocking the whole quantity of the seed within a short period, theadvanced fingerlings were stocked throughout the year, in small instalments at shortintervals (Fig. 1). This helped to reduce mortality of the seed due to stress duringtransportation. As stocking was phased out over different months, the pressure onpopulation density and the competition for food and space could be minimised. Thestocking density was reduced substantially ranging from 176 to 637 Iha during differentyears, with an average of 3161ha, consisting of catla (39.1%), rohu (19.0%), mrigal(19.3%), common carp (20.2%), silver carp (2.1%) and grass carp (0.3%). The studies onthe food and feeding habits ofthe fishes, the available food niches and the growth rate ofdifferent species formed the basis for determining the stocking density and the ratio of thespecies stocked.
Fish yield
As a result of stocking of advanced fingerlings of good quality, there was asubstantial improvement in the fish yield (Fig. 2). The annual yield improved from 77.75kglha in 1985-86 to 193.58 kg/ha in 1989-90, with an average of 132.67 kg/ha during theperiod from 1985 to 1992 .. There was a marked change in the contribution by the majorcarps, ranging from 87.0% to 99.1% (average 95.0%) during the period. Interestingly, withthe new stocking strategy, the medium and minor carps and other miscellaneousuneconomic species have almost disappeared (Fig. 3) from the reservoir.
A strict vigil was maintained to avoid exploitation of fishes ofless than 1 kg in sizeand the fishermen were allowed to operate gillnets of more than 50 mm mesh bar only. Asa result, the revenue from the reservoir improved considerably (675%) during 1985-92through the sale of major carps (95%) of more than 1 kg in weight, against the poorrevenue obtained during 1964-85. As only advanced fingerlings of more than 100 mm
129I,

were stocked in instalments, their survival rate has also improved significantly (catla-14.1%, rohu-25.1 %, mrigal- 31.2%, common carp - 22.2%, silver carp- 11.2%, and grasscarp - 0.2%), with an average of 21.1 %. Along with the increase in yield, the catch perunit effort has also improved, resulting in enhanced earnings for the fishermen (300%).
Conclusions
The investigations on the ecology-based fisheries management carried out in Aliyarreservoir during 1985-92 have given a new dimension to the concept of scientificmanagement of small reservoirs in the countryrSelvaraj et al., 1997). The 'fish yield fromthese water bodies is not a function ofthe quantity of the seed stocked, but there is a directcorrelation with the quality of the seed, their size, composition and the .phasing ofstocking. It has been established that the stocking density can be drastically reduced withthe increase in the size of the seed stocked. The fish yield remained low during 1962-65in spite of heavy stocking and it improved afterwards considerably even at a lowerstocking density (Fig 2). The contribution by the major carps of more than 1 kg in sizeimproved substantially, resulting in enhanced revenue for the department as well as thefishermen's earnings. The studies have further indicated that the fish yield can beenhanced several-fold irrespective of the age of the reservoir.
The results obtained from Aliyar reservoir have conclusively established that therewas a tremendous scope for augmenting the fish yield from all such small reservoirs. This 0
has been substantiated by obtaining a record fish yield of 182 kg/ha/yr from Thirumoorthyreservoir during 1995-96, with an average yield of 136.54 kg/ha/yr during 1991-96 throughthe adoption of the management techniques developed at Aliyar reservoir (Selvaraj et aI.,1997). The small reservoirs can contribute substantially to the total freshwater fishproduction in the country, even if a modest yield of 100 kg/ha/yr is achieved through theadoption of these scientific management techniques.
References
Joseph, K. 0., C. Selvaraj, V. K. Murugesan and P. K. Aravindakshan, 1990. Observationson the effect of low electrolyte reservoir water on carp eggs hatching and survivalrate. In: (Eds.) Jhingran, Arun, G., V.K. Unnithan and Amitabha Ghosh.Contribution to the fisheries of inland open water systems in India, Part I, 141-146.
Murugesan, V. K. and C. Selvaraj, 1990. Observation on fin-clipping of carps cultivatedin reservoirs. In : The second Indian Fisheries Forum Proceedings, Mangalore,India, 153-155.
138
.:"

Murugesan.V. K., C. Selvaraj and P. K. Aravindakshan, 1990. Growth of major carps inAliyar reservoir based on the recovery of marked fish. In: (Eds.) Jhingran, A. G.,V. K. India, Part I, 115-121.
Selvaraj, c., M. Kaliyamurthy and K. O. Joseph, 1990. Gonadal maturation in major carpswith particular reference to hydrological features of Aliyar reservoir. J Nat. Acad.Sci. India 59: (B) (II): 147-154.
Selvaraj, C., and V. K. Murugesan, 1990 a. Management techniques adopted for achievinga record fish yield from Aliyar reservoir. In: (Eds.) Jhingran, A. G., Unnithan, V.K. and Amitabh Ghosh. Reservoir Fisheries in India, 86-98.
Selvaraj, C. and V. K. Murugesan, 1990 b. Effect of intensive stocking of advanced majorcarps fingerlings on the fishery of Aliyar reservoir. In: The Second IndianFisheries Forum Proceedings, Mangalore, India, 157-159.
Selvaraj, C., V. K. Murugesan and P. K. Aravindakshan, 1990. Impact of stocking ofadvanced fingerlings on the fish yield from Aliyar reservoir. In: (Eds.) Jhingran,A. G., V. K. Unnithan and Amitabh Ghosh. Contributions to the fisheries of inlandopen water Systems in India, Part I, 109-114.
Selvaraj, c., V. K. Murugesan and S. Manoharan, 1997. Record fish yield fromThirumoorthy reservoir under scientific management. In: National Seminar onchanging perspectives on inland fisheries, Barrackpore, March, 1997 (Abstracts).
Selvaraj, C., V. K. Murugesan and V. K. Unnithan, 1997. Ecology-based fisheriesmanagement in Aliyar reservoir. CIFRI Bulletin No. 72, 30 p.
*********
.' \

20Vi 18.00 160~ 14~ 120z 10C> 8-z~ 6o 40I- 2(/)
O.cr: >- Z ----lo, <{ :J :J<{ ~ -, -, o a, I- > o Z CD
:J W o 0 ui <{ w-c (J) 0 Z 0 -, u,
~~~~ki~~J
Fig 1. Average monthly distribution of stocking of fingerlings (nos. in thousands) inAliyar Reservoir during 19S5-92.
14-()O•• 12()O...::-0 1 ()()O-S
B()O"-"::z: 6()O52U 4-()O00t-
2()O1(,1)I
0V'> u» r-.. Q:) 0) c::=- oc- ~ C"Iex;) ex;) ex;) ex;) oo C» C» 0( 0)0
I . cD ~ cO I I o.h~ V'> CT, c::=- ~u» ex;) ex;) ex» oo co C» 0) a::.CT..I 0":)0 (J) (J) 0)- ~ C» 0) 0)0..--- oc- ..,-
0--;:;oE 50C)~ 100c:::I...J
150L.I..Is:200
• Major carp
mOthers
.. /'
Fig 2. Impact of stocking of advanced fingerlings on the yield from Aliyar Reservoir.

......
....
iJ->
.('I
)co
...,
ex>
oC
J1('I
)I
::lco
_N
0)
......
...co0(
'1)
-O
00
"3
;;0-
0-
0
~~
::l0
0)::
lco
0('I
)...
..,
3("
')('I)
0
a3
,3 ('I
) Q. 0)" cc w ~ (Jj :T £ -o :T » -<' 0) ..., ;;0 ('I)
(Jj
('I) < Q, ..., 0-
('I) 0- CD .•...
..•.• ->. co 0> .J:>.
I ex>
CJ1
•....•..• 0) ::l C.
0) ;::::I!
('I) ...,
~N
w~
~m
~ro
w0
00
00
00
00
00
0
1964
-65
~~~~
~~~~
~~~~
~~~~
1965
-66._D
~~~~
~~~~
~~~
1966
-67.D
~~~~
~~~~
~~~~
1967
-68
_---
-~~~
~~~~
~~19
68-6
9D~
~~~~
~~.
1969
-70
•'1
970-
71s:: ~,
1971
-72
Q @19
72-7
3-a fll
1973
-74
s:: (ii"19
74-7
5s gr
1975
-76
•••
~~~~
~~~~
~~~~
~~m
I
;g19
76-7
7••
•••
~~~~
~~~~
~~~~
~Icn
,.I
1977
-78
_••
0_
o19
78-7
9•
E~~
~~~~
~~Q
l s19
79-8
0•
~~~~
~~.
:l ;19
80-8
1••
••••
••••
••~~
~_<
'~
1981
-82
•__
sr CD
1982
-83
~19
83-841
3I~
I198
4-85
-
L~J19
85-8
6
I~
.~
~~ ~ ~
~
1986
-87
•_
I19
87-8
8•
~•
1988
-89
•~
1989
-90
••
~
i19
90-9
1
1991
-92
~~~~
~~~~
~~~~
~~~~

Summer School all Fisheries Enhancementill Small Reservoirs and Floodplain Lakes,CIFR1. Barrackvore. 14July to 12August 1997
Yield optimization in small reservoirs - a case study inThirumoorthy reservoir
v. K. MurugesanCentral Inland Capture Fisheries Research Institute
Tatabad, Coimbatore-641 012 Tamil Nadu
Among the vast reservoir resources of India (19,370 nos. having 3,153,366- hawater area), small reservoirs including major irrigation tanks (l 0-1000 ha each) accountfor 98.78% by number and 47.11% by area (Sugunan, 1995). By virtue of easymanoeuvarability, small reservoirs are amenable for culture based capture fisheries orextensive aquaculture. Stock manipulation with appropriate density and right speciescombination to utilize the food available in the ecosystem and recapture of stocked speciesefficiently lead to fish yield optimization. A case study made at Thirumoorthy reservoirin Tamil Nadu in this direction is dealt in this communication.
Description of Thirumoorthy reservoir
The reservoir was created in 1967 as a result of construction of a 2,627.9 m longearth dam across Palar river in Bharathapuzha basin during 1962-67. It is a tail endreservoir under Parambikulam-Aliyar Project (PAP). With a water area of 388 ha at FRLand 79.88 ha at DSL, the estimated average area of the reservoir is 234 ha. Apart from acatchment area of 8,029 ha, the reservoir receives water supply from Parambikulamreservoir through a contour canal of 50 km length. Located at 10° 28' Nand Tf E, thereservoir irrigates an ayacut area of 80,826.8 ha in Udumalpet and Palladam taluks inCoimbatore District through two canals.
133

Ecology of the reservoir
Depth: Though the reservoir has the capacity to hold water to a maximum depthof29.3 m, the mean depth during the study period (1992-97) was only 11.6 m, falling intothe category of medium depth reservoirs.
Rainfall: Located in the rain shadow region of the Western Ghats, the reservoirreceives an average annaul rainfall of701.12 mm as against the national average of 1,050mm.
Soil quality: The basin soil with a pH range of 6.4 - 7.5 (average 7.1) andavailable nitrogen of 41.0 - 47.3 (average 44.4) mg/l00 g indicates medium productivity.While poor available phosphorus content (0.17-0.51 mg/l00 g) reveals low productivityof the reservoir, although the rich organic carbon (1.5 - 4.2%) may mislead to highproductivity.
Water quality: While high mean water temperature (25.8 °C) normally encounteredin a tropical country gives an impression of high productivity, the pH of the watersuggests medium productivity. The low total alkalinity (18.0 ppm), total dissolved solids(15.03 ppm) and specific conductivity (31.1 umhos/cm) reveal a low productionpotentiality of the reservoir.
Plankton position: The volume of the plankton during the study period variedfrom 2.0 - 6.0 ml/m" (average 4.5). The plankton population was mainly contributed byphytoplankton (95.4%) with dominance of Chlorophyceae (53.0%) followed byBacillariophyceae (34.2%) and Myxophyceae (5.5%). Rotifers (1.3%), c1adocerans (1.7%)and copepods (1.5%) formed the meagre zooplankton population.
Macrobenthos: The average number of macrofauna per square meter area of thereservoir bottom was 1,378 consisting of 493 chirortomids, 446 Chaoborus sp. and 439oligochaetes.
Primary productivity= The mean primary productivity of the reservoir was 894.1mgC/m3/day and the energy fixed by primary producers was 0.49%.
Fish fauna: Though, a total of 16 endemic species viz., Puntius carnaticus, P.sarana, P. filamentosus, P, mahecola, Mystus malabaricus, M. vittatus, Ompokbimaculatus, 0. malabaricus, Channa striatus, .Clarias batrachus, Mastacembelus
134
Ii

armatus, Anguilla bengalensis, Glossogobius giuris, Garra sp., Amblypharyngodon sp.,Rhinomugil corsula and Tor khudree were recorded from the reservoir, none of themformed a fishery worth mentioning.
Fishery management during 1966 to 91
After completion of the dam and impoundment of water, the State FisheriesDepartment took up the reservoir for fisheries development in the year 1966-67 andstocked it with available fish seed belonging to major, medium and minor carps, predatoryfish like murrels, exotic fishes like common carp, tilapia and silver carp and euryhaline fishlike Chanos chanos. By stocking at an annual average of 1,009 fish (53.8% major carpsand 46.2% miscellaneous fish) per ha, an annual average production of 15.1 t (64.7 kg/ha)consisting of 16.1% major carps and 83.9% other fishes was obtained from the reservoirduring 1968-69 to 1976-77.
The Tamil Nadu Fisheries Development Corporation took over the reservoir onlease to develop its fishery on commercial lines in the year 1977. The Corporationincreased the stocking rate to 1,515 seed per ha, giving importance to major carps (83.2%)in the species mix. However, the average annual production declined to 14.6 t during 1977-91 with an improvement in the contribution of major carps (57.2%).
Fishery management by CIFRI during 1991-97
In the absence of natural recruitment of major or medium carps in Thirumoorthyreservoir, it became imperative to stock the reservoir with quality fish seed fromextraneous sources. Indian and exotic major carps are quick growing herbivores with shortfood chain and better conversion of primary production to fish flesh. Fingerlings thesecarps of in size of> 100 mm, obtained from the Government fish farm located in thevicinity ofthe reservoir, were stocked in small quantities at periodical intervals throughoutthe year, maintaining certain species combination and density (Table 1). In order to assessthe growth of individual species a few thousand fingerlings (all species) out of thestocking material were subjected to group marking technique in which one of the pelvicfins was removed along with the bone articulation. The injury caused to the fish in theprocess of marking was cleansed with hydrogen peroxide solution and treated with furacincream. The marked fish was directly released into. the reservoir. The fishermen wereinstructed to operate gill nets of appropriate mesh size so that major carps less than 1 kgweight were spared.
135
The fish production increased steadily right from the first year and reached an alltime record of 49.9 t (213.4 kglha) in 1996-97 (Table 2). The stocked species formed themajor fishery (88.5 to 96.4%) in the reservoir. Recapture of marked fish indicated that thegrowth rate was the highest in C. catla, followed by C. carpio, C. mrigala and L. rohita.Higher stocking rate followed in C. catla (29.5%) and C. carpio (28.2%) resulted in highercontribution by these two species in the total fish landings. High yield coupled with higherprice fetched by major carps of more than 1kg in weight gave better revenue to the State.The catch per unit effort (CPUE) which w~ low (5.65 kg) in 1991-92 increased (7.0-12.5)in the subsequent years, improving the earnings and the standard of living of thefishermen. Although, the ecological investigations indicated low to medium productionpotentiality ofthe reservoir, the fish yield could be substantially increased through betterfishery management. Thus, the study confirmed that judicious stocking with right speciesand density and efficient exploitation can lead to fish yield optimization in smallreservoirs.
Reference
Sugunan, V. V. 1995. Reservoir Fisheries ofIndia, FAG Fisheries Food Technical paperNo. 345. Food and Agriculture Organization of the United Nations, Rome, 423 p.
136
ii

Table 1. Fingerlings stocked in Thirumoorthy reservoir
V.I-..l
Year C. catla L. rohlta c. mrigala C. carpio H. molitrix . Total Stockingrate
Nos. % Nos. % Nos. % Nos. % Nos. % Nos. Nos./ha
1991-92 17302 34.4 21783 43.3 46 0.1 11163 2.2 - - 50294 2151992-93 14422 19.6 20957 28.3 22958 31.3 11858 16.2 3183 4.3 73378 3141993-94 20327 22.6 21360 23.7 16008 17.7 28792 32.0 3600 4.0 90087 3851994-95 23069 24.9 18733 20.3 19458 21.0 3.1250 33.8 - - 92510 3951995-96 29975 31.6 13522 14.3 5637 5.9 45809 48.2 - - 94943 4051996-97 55386 39.0 34290 24.2 27697 19.5 24530 17.3 - - 141903 606Average 26747 29.5 21774 24.0 15301 16.9 25567 28.2 1131 1.2 90519 387
\

'-H00
Table 2. Fish yield from Thirumoorthy reservoir
Species 1991-92 1992-93 1993-94 1994-95 1995-96 1997-98
Group I C. catla 5142.150 9088.700 12962.700 15416.400 17766.600 20075.700
L. rohita 6517.700 6502.900 3097.150 3108.600 4432.000 7614.400
C. Mrigala 3178.500 5151.800 4660.950 5573.100 5887.300 7140.200
C. carpio 329.800 1067.100 6314.400 7690.70 7905.950 8314.200
H. molitrix 182.600 649.950 205.900 64.900 - -
Group II 1783.250 1469.050 2040.400 2154.800 1442.100 2454.700
Major carps (Spoiled) 941.500 - 1140.400 1074.000 1636.700 1669.500
Total in kg 18075.500 23929.500 30421.500 35082.500 39070.650 47268.700% contribution 88.5 89.9 96.4 91.0 91.7 94.7
Group III 1632.150 1201.150 607.400 1785.200 1540.300 859.500
Group IV 644.700 1255.600 444.800 1640.800 1958.400 1771.000
Special Group 75.500 224.250 69.650 64.000 31.000 34.700
Total (Kg) 2352.350 2681.000 1121.850 3490.000 3529.700 2665.200
12(,
\
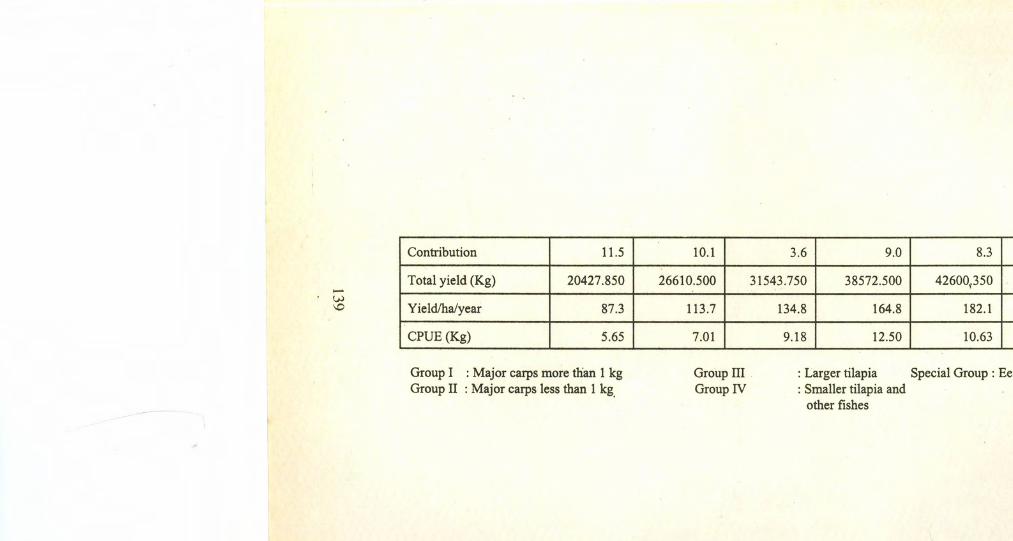
-w\0
Contribution 11.5 10.1 3.6 9.0 8.3 5.3
Total yield (Kg) 20427.850 26610.500 31543.750 38572.500 42600~350 49933.900
Yieldlhalyear 87.3 113.7 134.8 164.8 182.1 213.4
CPUE (Kg) 5.65 7.01 9.18 12.50 10.63 10.27
Group I : Major carps more than 1 kgGroup II : Major carps less than 1 kg.
Group IIIGroup IV
: Larger tilapia Special Group: Eels and Murrels.: Smaller tilapia and
other fishes
\

Summer School on Fisheries Enhancementin Small Reservoirs and Floodplain LakesCIFRI Barrackpore 14Julv to 12August 1997
Fisheries of small reservoirs in India- an overview
M. A. KhanCentral Inland Capture Fisheries Research Institute
Barrackpore-743101, West Bengal
Introduction
Reservoirs or man-made lakes constitute an important inland fishery resource ofIndia. Reservoirs are generally classified as small « 1,000 ha), medium (1,000 to 5,000ha) and large (> 5,000 ha). Small reservoirs differ significantly from the large and mediumones (Table 1). In large reservoirs, fisheries management lays emphasis on establishingrelatively self sustaining populations more or less on capture fishery norms, .while smallreservoirs essentially requires a stocking and recapture policy on an annual basis whichis more akin to extensive aquaculture system.
Aquaculture techniques in small reservoirs
The aquaculture, practised in these impoundments, may be described as extensive,where cultured fingerlings are raised in water bodies with few or no modification of thehabitat. This is in contrast to the intensive culture practised in ponds, raceways etc. whereabiotic and biotic components are under control. The capture and culture fishery principlesgrade into each other in small reservoirs where the fishery depends on stocked fingerlings.
Past and present status of small reservoir fisheries
Fish culture in the small reservoirs, hitherto being practised by the stateGovernments consists of supplementing the natural stocks of economic fishes withstocking on arbitrary basis without any definite levels or ratios based on the biogeniccapacity of the ecosystem. Stocking rates wherever prescribed do not appear to have been
141
.followed strictly. Despite the arbitrary stocking, a few reservoirs, have been reported toshow high fish production with repeated regular stocking. Keetham reservoir (250 ha) inU. P., for example, produced 530 kg/ha in 1959-60 although the yield declined drasticallyin the later years. This emphasises the need to focus attention towards fish culture in suchecosystems based on an understanding of the environmental and biological parameters,basic productivity levels and ecological relationships.
Stocking policy
Stocking of fish in small reservoirs has proved to be a useful tool for developingtheir fisheries potentia1. Stocking of economically important, fast growing fishes fromoutside is aimed at colonizing all the diverse niches of the biotope for harvesting maximumsustainable crop from them.
This widespread management practise has been proved to be highly remunerativein such small water bodies where almost complete annual harvesting is possible. This hasamply been demonstrated in a number of reservoirs in U. P., Tamil Nadu, Kerala andRajasthan (Table 3). Stocking is not merely a simple matter of releasing appropriatespecies into an ecosystem, but an important management option which needs evaluationof an array of factors viz., biogenic capacity of the environment, the growth rate of thedesired species and the population density as regulated by predatory and competitivepressure
During summer months, small reservoirs either dry up completely or else the waterlevel in them gets so drastically reduced that through over-fishing no brood stock is leftover to contribute to the succeeding year's fishery through natural recuritment.Consequently, the entire catch from these water bodies depend on the fishes stocked fromoutside to offset this loss. There is, thus, established a direct correlation between thestocking rate and catch per unit effort in such heavily fished waters (Jhingran et al., 1981, .Khan et al., 1990). Stocking is, therfore, a useful tool for the management of smallreservoirs where stocks can be maintained at levels higher than the natural carryingcapacity of the environment through supplemental fertilization. The number offish to bestocked per unit area to be determined on the basis of natural productivity of the system,growth rate of fishes, natural mortality rate and escapement through the irrigation canaland spillway.
•./<
142
Ii

Formulation of stocking policy
A number of methods are in vogue for assessing the potential fish yield from lakesand reservoirs (Jhingran, 1986). Most common approach towards formulation of stockingpolicy is to assess the potential of the reservoir by any of the methods (MEI, GullandModel, Trophodynamic model) and adjustment of stocking rate to approach the potentialyield. In the Indian context, trophodynamic model is found to be more suitable than ME!approach (Jhingran, 1986, Khan et al., 1990).
Case studies of some small reservoirs
To establish a baseline for evolving suitable management measures towards fisherydevelopment in small reservoirs, the Central Inland Fisheries Research Institute (CIFRI)initiated investigations on many small reservoirs viz., Loni, Kulgarhi, Govindgarh,Naktara, Gulariya, Bachhra Baghla, in Aliyar, Nongmahir, and Kyrdemkulai.Investigations on hydrology, primary productivity, plankton, macrobenthos,macro vegetation, soil characteristics, experimental fishing and biology of commercialfishes have been conducted. Range of certain abiotic and biotic parameters in some smallres-ervoirs ofIndia are summerised in Table 2. A critical evaluation of these parametersindicates that they can support moderate to high fish production.
Biotic communities
Plankton: Plankton population density ranged from 58 units/l to a high of 40,000units/l in Baghla reservoir. Thy high population was due to Melosira and low planktonpopulation was observed in monsoon due to increased inorganic turbidity. Dominance ofMyxophyceae was observed in these reservoirs followed by Bacillariophyceae andChlorophyceae. Myxophyceae was chiefly represented by Microcystis aeruginosa,Bacillariphyceae by Synedra ulna. Fragilaria spp. and Melosira granulota, andChlorophyceae consisted Pediastrum duplex, Spirogyra sp. Oedogonium sp. andPandorina I sp. as dominant forms. Copepods and rotifers were the main constituents ofzooplankton, 'mainly represented by Diaptomus, Cyclops, Brachionus, Keratella, Filiniaand Polyarthra. Maximum abundance was observed in summer and minimum in monsoon.
Macrobenthos communities: Bottom fauna was generally rich and ranged from95 unit/m? (Gulariya reservoir) to a high of 4,620 (Bachhra reservoir). In these waterbodies, insects dominated the others. The fauna was represented by chironomids,phylopotamus (Insecta), Pisidium, Corbicula, Lymnaea (Mollusca) and Brahchiurasowerbyi (Annelida).
143

Fish fauna:- Fish fauna of small reservoirs is well diversified belonging mainly tocarps, cat fishes, featherbacks, murrels and c1upeids. Only in Kyrdemkulai reservoir,mahseers like Tor putitora, Tor tor and Acrossocheilus hexagonolepis were observedbesides small hill-stream fishes. Recommendations for development ofKyrdemkulai andNongmahir reservoirs have been submitted to the Northeastern Council forimplementation by the State of Meghalaya.
Planning criteria
A systematic and integrated approach towards scientific studies and planningcriteria for undertaking fish culture in small reservoirs should have an understanding ofthefollowing factors.
1. The reservoir morphometry and water resident time2. The physico-chemical characteristics of water and soil3. The animal and plant inhabitants4. The relation between the inhabitants and the physico-chemical aspects of the
environment in terms of population and community dynamics.
In tune with the need for rapid assessment of the country's small reservoirresources, the following planning criteria are suggested for the resource assessment.
1. Preparation of an inventory of such small ecosystems along with their estimatedpotential yields. This can be further divided into:-
a)b)
Reservoirs which are best developed as capture fisheriesReservoirs mostly of local interest having significant potential for fishcultureReservoirs intermediate in size and potential yield.c)
2) Since the breeding of the major carps has been repeatedly observed to take placeabove the spillway, resulting in heavy escapement of the brood, this poses a seriousproblem for building up stocks of desirable fishers in small reservoirs. The situation isfurther worsened by heavy escapement of fingerlings and adults through irrig~tion canals.Development of fisheries in such water bodies, therefore requires suitable screening of thespillway and the canal mouth. Such protective measures have already been installed inLoni, Bachhra, Baghla and Gulariya reservoirs and have paid rich dividends in enhancingthe fish yield from these reservoirs. In some of the reservoirs fishes have also beenobserved to move up the spillways into the reservoir whereas in others the spillwaysprovide an insurmountable barrier to fish moving up the dam. To minimize losses by way
L44
"'-\
of escapement of fish through spillway and canal, it would be an economic propositionto have an annual cropping policy so that the reserovir is stocked in August-September andharvested by June end.
3) Vegetation should not be planted in the reservoir, since the wrong kinds can chokeup the reservoir and the canal.
4) Methods for predator control and checking of weed fishes are already available inliterature.
5) Aquaculture in small reservoirs can also play an important role in integrated ruraldevelopment since it can be profitably combined with duckery and piggery.
Summing up, it may be stated that small reservoirs occupy a unique position inlimnology analogous to field plots used in agriculture science i. e., a means of assessingeffects of environmental modifications on the ecosystem on a reduced scale.
References
Jhingran, Arun G., 1986. Reservoir fisheries management in India. Bulletin No. 45,CIFRI, 65 p.
Jhingran, Arun G., R. K Dwivedi, K P. Srivastava & D. N. Singh, 1981. An ecologicalapproachtowards stocking policy formulation in Gulariya-. a small irrigationimpoundment. Silver Jubilee Symp., Tropical Ecology, Bhopal, India, 5-10,October, 1981. Abstract No. 88 : 98.
Jhingran, V. G., 1965. Report on inland fisheries research and management and fish culturein the USSR. Misc. Contr. Cent. Inl, Fish. Res. Inst., Barrackpore (5): 27p.
Khan, M. A., R. K Dwivedi, S. N. Mehrotra, K P. Srivastava, R. K Tyagi and P. K:Katiha, 1990. Stocking as a management tool in optimising fish yield from a smallreservoir (Bachhra) in Ganga basin. Contribution to the to the management offisheries in inland open water system of India, (Eds) Jhingran, Arun G., V.KUnnithan and Amitabh Ghosh, Inland Fisheries Society of India, Barrackpore,71-76.
145
Khan, M. A., K. P. Srivastava, R. K. Dwivedi, D. N. Singh,R. K. Tyagi and S. N.Mehrotra, 1990. Significance of ecological parameters in fisheries management ofa newly impounded reservoir, Bachhra reservoir. In: Contribution to the fisheriesof inland open water systems in India, part I. (Eds. Arun G. Jhingran, V. K.Unnithan and Amitabh Ghosh, Inland Fisheries Society of India, Barrackpore,100-108.
Sugunan, V. V., 1995. Reservoir Fisheries ofIndia, FAD, Fisheries Tech. Paper No. 345,FAO, Rome, 423 p.
***********
146
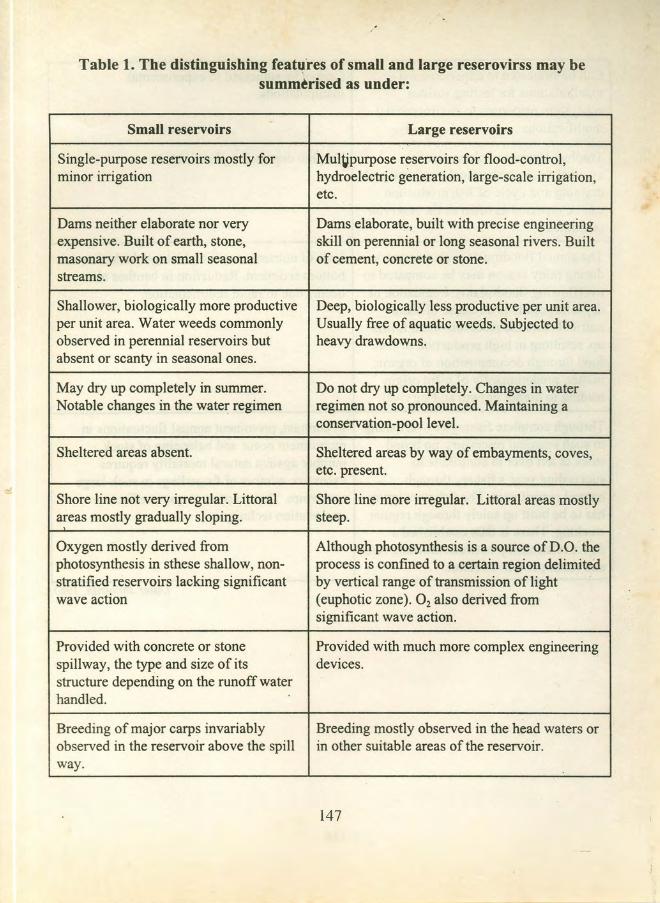
Table 1. The distinguishing features of small and large reserovirss may besummerised as under:
Small reservoirs Large reservoirs
Single-purpose reservoirs mostly for Mul~purpose reservoirs for flood-control,minor irrigation hydroelectric generation, large-scale irrigation,
etc.
Dams neither elaborate nor very Dams elaborate, built with precise engineeringexpensive. Built of earth, stone, skill on perennial or long seasonal rivers. Builtmasonary work on small seasonal of cement, concrete or stone.streams.
Shallower, biologically more productive Deep, biologically less productive per unit area.per unit area. Water weeds commonly Usually free of aquatic weeds. Subjected toobserved in perennial reservoirs but heavy drawdowns.absent or scanty in seasonal ones.
May dry up completely in summer. Do not dry up completely. Changes in waterNotable changes in the water regimen regimen not so pronounced. Maintaining a
conservation-pool level.
Sheltered areas absent. Sheltered areas by way of embayments; coves,etc. present.
Shore line not very irregular. Littoral Shore line more irregular. Littoral areas mostlyareas mostly gradually sloping. steep.
Oxygen mostly derived from Although photosynthesis is a source of D.O. thephotosynthesis in sthese shallow, non- process is confined to a certain region delimitedstratified reservoirs lacking significant by vertical range of transmission of lightwave action (euphotic zone). O2 also derived from
significant wave action.
Provided with concrete or stone Provided with much more complex engineeringspillway, the type and size of its devices.structure depending on the runoff waterhandled.
Breeding of major carps invariably Breeding mostly observed in the head waters orobserved in the reservoir above the spill in other suitable areas of the reservoir.way.
147
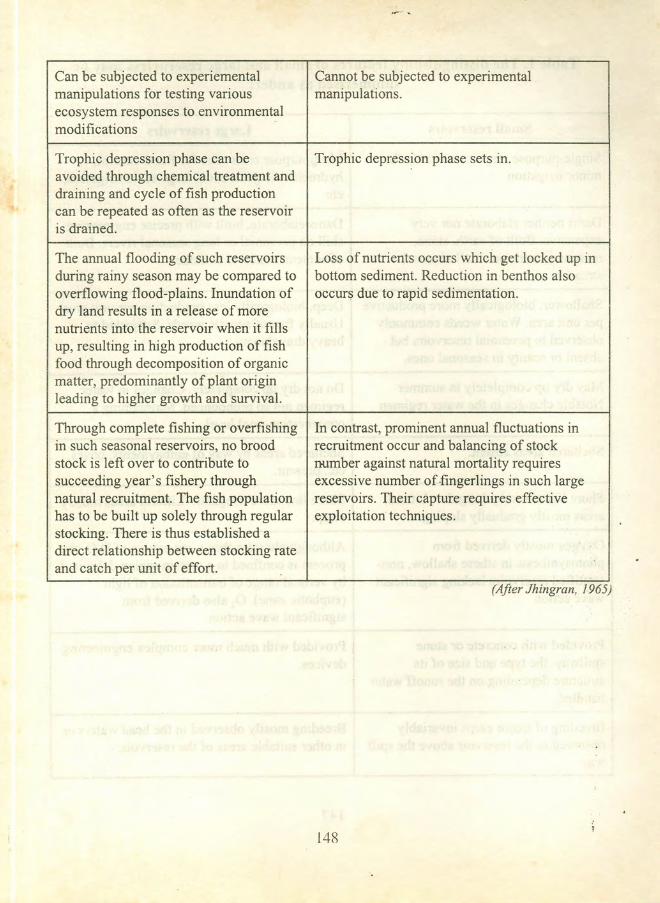
Can be subjected to experiemental Cannot be subjected to experimentalmanipulations for testing various manipulations.ecosystem responses to environmentalmodifications
Trophic depression phase can be Trophic depression phase sets in.avoided through chemical treatment anddraining and cycle of fish productioncan be repeated as often as the reservoiris drained.
The annual flooding of such reservoirs Loss of nutrients occurs which get locked up induring rainy season may be compared to bottom sediment. Reduction in benthos alsooverflowing flood-plains. Inundation of occurs due to rapid sedimentation.dry land results in a release of morenutrients into the reservoir when it fillsup, resulting in high production of fishfood through decomposition of organicmatter, predominantly of plant originleading to higher growth and survival.
Through complete fishing or overfishing In contrast, prominent annual fluctuations inin such seasonal reservoirs, no brood recruitment occur and balancing of stockstock is left over to contribute to number against natural mortality requiressucceeding year's fishery through excessive number of .fingerlings in such largenatural recruitment. The fish population reservoirs. Their capture requires effectivehas to be built up solely through regular exploitation techniques.stocking. There is thus established adirect relationship between stocking rateand catch per unit of effort.
148
(After Jhingran, 1965)
I.

Table 2. Higb yields obtained in small reservoirs due to management based onstocking
Reservoirs State Area (ha.) Stocking rate Yield Kg/hanumberlha
Aliyar Tamil Nadu 650 353 194I
Meenkara Kerala 259 1226 107
Chulliyar Kerala 159 937 316
Gulariya Uttar Pradesh 300 517 150
Bachhra Uttar Pradesh 140 763 140
Baghla Uttar Pradesh 250 570 102
Bundh Beratha Rajasthan - 164 94
Chapparwara Rajasthan .200 300 79
(After Sugunan, 1995)
.•..
149

Table 3. Range of certain physico-chemical and biotic parameters of small reservoirs.
Parameters Reservoirs
Gulariya Bachhra Baghla Aliyar Chappar- Kyrdern-wara kulai
Transparency 11-80.0 17-145 9-204 108-182 - 2.20-2.84(em)
D.O. mg/l 4.9-9.0 2.5-8.60 2.40-12.80 4.2-11.6 6.10-10.0 6.70-7.10
pH 7.2-8.4 6.96-8.30 7.32-8.84 6.6-6.8 8.0-8.40 6.8-7.0
Free CO2 mg/l Nil-4.0 Nil-7.20 Nil-3.0 Nil-1O.0 Nil 2.0-2.60
Alkalinity mg/l 38-80 95-190 42-106 16-72 76-100 22-32
Hardness mg/l 13-34 21-80' - - - 18.56-27.84
Nitrate mg/l 0.08-0.20 0.085- 0.28-0.33 - 0.40-l.l0 0.02-3.610.180
-;
.Phosphate mg/l 0.05-0.13 0.06- 0.28-0.36 Trace-O.4 0.11-0.16 Trace-0.020.250
Silicate mg/l 5.0-14.0 6.80-14 2.4-4.9 Trace-0.2 1.92-8.0 1.0-10.0
Plankton u/l 245-4060 70-8432 58-40000 - 3100- 8420*,20100
Macrobenthos 95-4169 342-4620 976-2132 - 110-947 134*u/rrr'
Macrovegetation . Absent Absent 250-2200 Absent 470-1350 Absent'u/rrr'
,(* indicates average value)
150
'.

Summer School on Fisheries Enhancementin Small Reservoirs and Floodplain LakesCIFRI Barrackpore 14July to 12August 1997
Yield optimization in small reservoirs-a case study of Bachhra reservoir
M. A. KhanCentral Inland Capture Fisheries Research Institute
Barrackpore- 743101, West Bengal
Introduction
Small reservoirs are being created at a rapid pace in order to meet the demand foragricultural activities and for controlling flood menace. According to an estimate there areabout 19,134 small reservoirs « 1000 ha) covering a water area of 1,485,557 ha(Sugunan, 1995). Past studies conducted by the Central Inland Fisheries Research Institutein Uttar Pradesh and Madhya Pradesh revealed that small reservoirs offer immense scopefor fish production (100 to 250 kg/ha) if managed scientifically. Prior to initiation oftheseresearch projects, the average production recorded in various states was low (less than 50kg/ha). These studies further contradicted Ellis (1942) theory that reservoirs are biologicaldeserts. Small reservoirs, being shallow, are biologically more productive per unit areabecause substantial portions of the reservoir bed are exposed to sunlight during summerand subsequently inundated during rair.y season, resulting in release of more nutrientsinto the reservoir.
For evolving suitable management technique in small reservoirs, Bachhra, a smallirrigation impoundment was selected. Limnological parameters and trophic status weremonitored for a number of years (1982-87) based on which potential fish yield of thereservoir was estimated and stocking of desired fish species was so adjusted as to achievethe potential fish yield.
l51

Description of the reservoir
Bachhra reservoir was created in 1980-81 by damming the Bachhra stream. It issituated in Mejha Tehsil at a distance of about 55 km from Allahabad. The waterspreadarea at full storage level of 111.00 m above MSL is 140 h, the gross storage capacity being7.42 mcm and dead storage capacity 0.03 mcm. The average depth of the reservoir hasbeen estimated at 5.22 m. The reservoir dries up substantially in summer leaving behindonly 4 ha of water area. The catchment area consists of rocky terrain and thin forest around jit. Catchment receives on an average 900 mm of rainfall per annum. The basin of thereservoir is undulating and strewn with stone boulders.
Physico-chemical parameters of water
The values of physico-chemical parameters of the water for the period 1982-87are depicted in Table 1. On the basis of physico-chemical parameters such as alkalinity,calcium, oxygen and nutrients the reservoir can be classified as moderately productive.
Primary production
Two peaks in primary production viz., one in February-March and another inSeptember-October were observed but low values were observed in monsoon months. Norelationship between primary production and net phytoplankton production could beestablished because more than 75% of the total primary production was attributed tonannoplankton. On the basis of carbon production, reservoir falls under eutrophiccategory.
Plankton and Periphyton
Planktonic population varied between 70 units/l in 1986 to 8,428 unitsll in 1984(Table 2), In the initial years of filling of the reservoir, rheophilic algae (Chlorophyceae)formed the bulk of plankton but with the passage of time, Myxophyceae replaced them.Same was found true for Bacillariophyceae. The important components of phytoplanktonwere: Microcystis aeruginosa, Aphanocapsa sp. and Anabaena sp. (Myxophyceae)Scenedesmus sp., Oedogonium spp and Spirogyra sp. (Chlorophyceae) and flora likeMelosira granulata, Navicula spp., Fragilaria spp.and Synedra ulna representedBacillariophyceae. The bulk of zooplankton was formed by copepods (Cyclops sp.,Diaptomus sp.) followed by rotifers (Brachionus sp. Keratella sp., Filinia sp. and Lecanesp.,), Cladocera (Ceriodaphnia sp., Diaphanosoma sp.) and Protozoa (Arcella sp.,Actinophrys sp.).
152
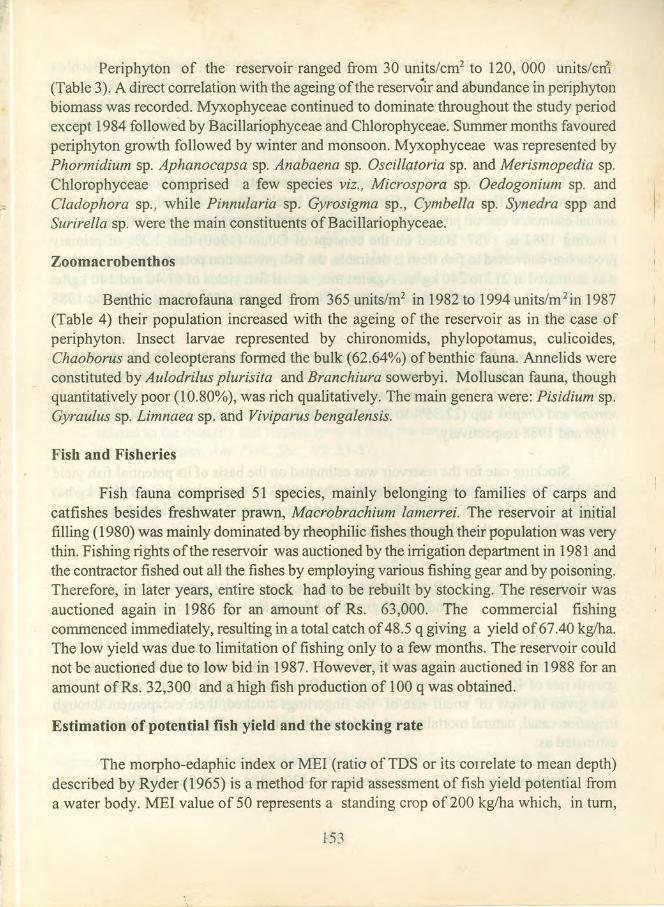
Periphyton of the reservoir ranged from 30 units/em? to 120, 000 units/em(Table 3). A direct correlation with the ageing of the reservoir and abundance in periphytonbiomass was recorded. Myxophyceae continued to dominate throughout the study periodexcept 1984 followed by Bacillariophyceae and Chlorophyceae. Summer months favouredperiphyton growth followed by winter and monsoon. Myxophyceae was represented byPhormidium sp. Aphanocapsa sp. Anabaena sp. Oscillatoria sp. and Merismopedia sp.Chlorophyceae comprised a few species viz., Microspora sp. Oedogonium sp. andCladophora sp., while Pinnularia sp. Gyrosigma sp., Cymbella sp. Synedra spp andSurirella sp. were the main constituents of Bacillariophyceae.
Zoomacrobenthos
Benthic macrofauna ranged from 365 units/rrr' in 1982 to 1994 units/m+in 1987(Table 4) their population increased with the ageing of the reservoir as in the case ofperiphyton. Insect larvae represented by chironomids, phylopotamus, culicoides,Chaoborus and coleopterans formed the bulk (62.64%) of benthic fauna. Annelids wereconstituted by Aulodrilus plurisita and Branchiura sowerbyi. Molluscan fauna, thoughquantitatively poor (10.80%), was rich qualitatively. The main genera were: Pisidium sp.Gyraulus sp. Limnaea sp. and Viviparus bengalensis.
Fish and Fisheries
Fish fauna comprised 51 species, mainly belonging to families of carps andcatfishes besides freshwater prawn, Macrobrachium lamerrei. The reservoir at initialfilling (1980) was mainly dominated by rheophilic fishes though their population was verythin. Fishing rights ofthe reservoir was auctioned by the irrigation department in 1981~dthe contractor fished out all the fishes by employing various fishing gear and by poisoning.Therefore, in later years, entire stock had to be rebuilt by stocking. The reservoir wasauctioned again in 1986 for an amount of Rs. 63,000. The commercial fishingcommenced immediately, resulting in a total catch of 48.5 q giving a yield of 67.40 kglha.The low yield was due to limitation of fishing only to a few months. The reservoir couldnot be auctioned due to low bid in 1987. However, it was again auctioned in 1988 for anamount ofRs. 32,300 and a high fish production of 100 q was obtained.
Estimation of potential fish yield and the stocking rate
The morpho-edaphic index or MEI (ratio of TDS or its correlate to mean depth)described by Ryder (1965) is a method for rapid assessment of fish yield potential froma water body. MEI value of 50 represents a standing crop of 200 kg/ha which, in turn,
153

could yield 55 kg/ha when exposed to intensive fishing. The MEI computed for Bachhrareservoir ranged from 2l.46 to 27.07 during the period of study. Thus, it gave anunderestimation of potential yield for the Bachhra reservoir hence not found suitable. Sameconclusion was drawn by Jhingran et al., (1981) while studying fisheries of Gulariyareservoir.
The potential fish yield of the reservoir was estimated using trophodynamic modelbased on energy flow through different trophic levels (Hayes & Anthony 1964). Theannual estimated carbon production for the reservoir fluctuated between 1,250 t and 1,402t during 1982 to 1987. Based on the concept of Odum (1960) that l.2% of primaryproduction converted to fish flesh is desirable, the fish production potential ofthe reservoirwas estimated at 212 to 240 kg/ha. Against this, actual fish yields of 67.40 and 140 kg/hawere achieved at a conversion efficiency of 0.314% and 0.58% during 1986 and 1988respectively.
The main flow of energy was through detritus food chain. The detritophagus(mrigal and calbasu) fishes formed 29.54% to 31.85% of the catch, followed by predatorycatfishes (29.66% to 17.82%) and omnivores represented by Notopterus notopterus, P.sarana and Ompok spp (22.36% to 25.40%) and the rest by miscellaneous fishes during1986 and 1988 respectively.
Stocking rate for the reservoir was estimated on the basis of its potential fish yieldof212 to 240 kglha. Further assuming that about 80% of the potential yield (173 kg/ha)would be harvestable in view of drastic reduction in water level, the stocking rate wascomputed by using the following formula (Huet, 1960):
Stocking rate = Expected fish yield (kg/ha) + lossIndividual growth of fish in kg
Growth rate was estimated based on the recovery of tagged fishes. An averagegrowth rate of 400 g per annum was computed for major carps. A loss allowance of 75%was given in view of small size of the fingerlings stocked, their escapement throughirrigation canal, natural mortality and predation by carnivores. Thus, the stocking rate wasestimated as:
Stocking rate = 173 + Loss = 432 + 324 = 756 fingerlings per ha.0.4
154
.. /'

The total fingerlings required for an area of 72 ha (average) was estimated at54,432, say 55,000. Thus, 55,000 fingerlings of major carps at average size of 55 mm(mriga145%, rohu, 40% and catla 15%) were stocked in 1985, 37,0001h:J986 and 63,000in 1987. The stocking rate was reduced in 1986 in view of the profuse breeding of majorcarps in that year. The low percentage of catla in stocking material was due to nonavailability of its seed, otherwise even higher fish production could have been achieved.
7Finally, it is suggested that a management calendar should be prepared for
enhancing fish yield from small reservoirs. This should be based on ecological approachviz., stocking rate based on potential fish yield and appropriate time of stocking. August-September is the best time for stocking so as to allow 10 to 11 months for fattening ofstocked fishes, followed by complete harvesting ofthe stock. This package may ~ive a fishyield 0{100-200 kg/hadepending on biogenic capacity of the reservoir.
References
Ellis, M. M., 1942. Freshwater impoundments. Trans. Am.Fish Soc., 71(1941): 80-93.
Hayes, P. R. and E. H., Anthony, 1964. Productive capacity of North American lakes asrelated to the quantity and torphic level of fish, the lake dimensions and the waterchemisty. Trans. Am. Fish. Soc., 93: 53-57.
Huet, M., 1960. General principle of pond construction and management. Productivity andstocking. ETAP, FAO lectures at the III International Training Centre, Bogor,Indonesia, 1955, 2.
Jhingran, A. G., R. K. Dwivedi, K. P. Srivastava and D. N. Singh, 1981. An ecologicalapproach towards stocking policy formulation in Gulariya. A small impoundment.Symposium on Tropic~l Ecology, Bhopal (Oct. 5-7), 1981.
Odum, H. T., 1960. The role of tidal marshes in estuarine production. N. Y. St. Conserv.,60: 1-4.
Ryder, R. A., 1965. A method for estimating the fish production of north temperate lakes.Trans. Am.-Fish. Soc., 94: 214-218.
Sugunan, V. V., 1995. Reservoir fisheries of India. FAD Technical Paper No. 345pp 423.
155
•. J'

Table 1. Range and average values of physico-chemical parameters and primary production inBachhra Reservoir.
1982 1983 .1984 1985 1986 1987 AverageRange Range Range Range Range Range (6 years)
Water Temp.(°C) 20-32.5 17-32 20.50-32 18.30-31 18-31 17-31.5 26.66
Transparency 17-101.17 30-119 10-115 41.16-145 41.5-112 40.5-130 66.07(ern)
pH 7.4-6.50 7.60-8.30 7.6-8.4 6.96-8.20 7.2-8.2 7.2-8.2 7.89
Free CO, mg!l Nil-4.60 Nil-3.5 Nil-3.80 Nil-6.73 Nil-6 Nil-7.2 1.32
Alkalinity mg!l 95-162 122 - 160 96-166 67.33-135 72-190 72-180 127.66
Hardness mg!l 30-78 35 - 45 28.5-40 21-39.33 22-42 29.5-80 37.6
Calcium mg/1 19.0-24.5 19 - 24 19.5-23.10 16-22.50 16-23 20-24.5 20.98
Nitrate mg!l 0.0850- 0.11-0.16 0.10-0.13 0.10-0.150 0.12-0.15 0.11-0.15 0.1270.180
Phosphate mg!l 0.06-0.25 0.09-0.150 0.80-0.12 0.08-0.14 0.10-0.14 0.09-0.12 0.144
Conductivity 242-369 250-375 182-300 149-213 150-205 149-334 236.52II mhos!cm
Silicate mg!l 7.30 - 14 7.9-12 6.80-10 8.6-11.73 7.7-11.5 8.4-14 10.04
Dissolved 6 - 8.6 5.80-8.2 5.40-7.90 2.25-8.0 5.0-8.3 5.8-8.2 6.82Oxygen
Gross primary 62.50 - 100 50-112.5 50-112.5 50-100 50-112.5 52-112.5 80.17Prod-uctivitymgC!m'!h
Net primary 50- 87.50 37.50-100 37.5-100 37.50- 37.5-100 39.5-87 65.125Product- ivity 89.50mgC!mJ!h
Respiration 12.5 12.5-25 12.5-25 10.5-25 25-12.5 11.5-33.5 22.99mgC!mlh.
156
./

Table 2. Plankton composition (%) in Bachhra reservoir during 1984-87
1984 1985 1986 1987(Sep. - Dec.)
Copepoda 22.04 13.50 10.70 19.28
Cladocera 3.31 2.90 0.60 4.91
Rotifera 14.49 1\.30 14.65 19.97
Protozoa 0.50 - - 6.87
Total zooplankton 35.99 27.70 25.95 51.03
Myxophyceae 29.29 41.20 35.93 9.99
Chlorophyceae 21.08 10.10 10.23 11.11
Bacillariophyceae 13.76 21.00 25.02 27.87
Misc.plankton - - \.37 -
Phytoplankton 64.01 72.30 72.68 48.97
Range & average plankton units/I 135-8428 804-2107 70-1986 175-1653(4762) (438) (1135) (581)
Table 3. Percentage composition of periphyton in Bachhra reservoir
I
1983 1984 1985 1986 1987 Avg.(Sep. - %Dec.)
Myxophyceae 90 29 68.9 46.10 37.5 54.3
Chlorophyceae 5 23 7.6 11.65 26.10 14.67
Bacillariophyceae 5 48 23.5 42.25 36.40 31.03
Range & average 30-2,500 43-8,850 777-77,777 900-99,999 746-120,000(units/em') (275) (2,376) (20,857) (20,148) (22,105)
157
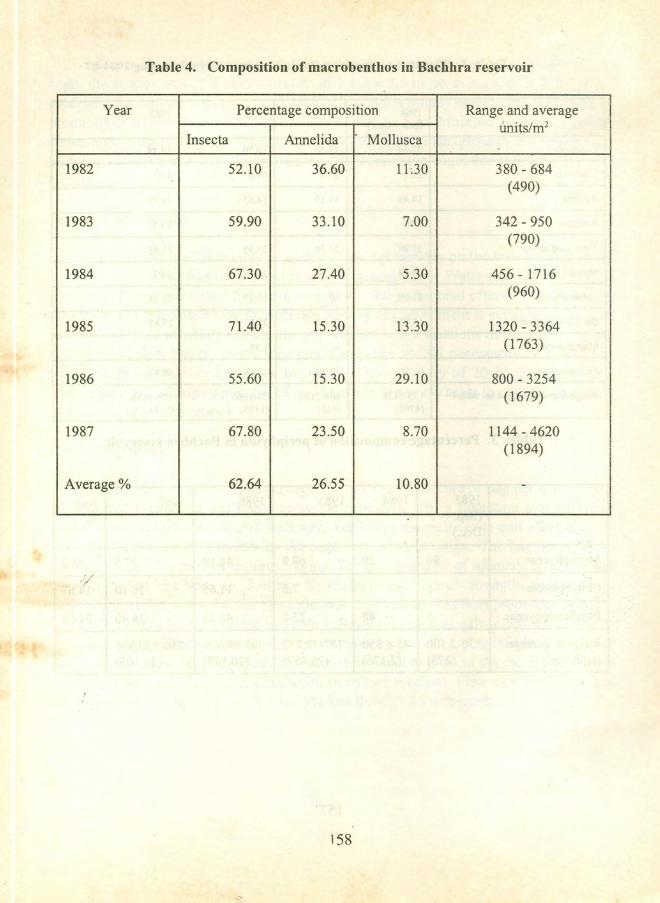
Table 4. Composition of macrobenthos in Bachhra reservoir
Year Percentage composition Range and averageunits/rrr'
Insecta Annelida Mollusca .1982 52.10 36.60 11:30 380 - 684
(490)
1983 59.90 33.10 7.00 342 - 950(790)
1984 67.30 27.40 5.30 456-1716(960)
1985 71.40 15.30 13.30 1320 - 3364(1763)
1986 55.60 15.30 29.10 800 - 3254(1679)
1987 67.80 23.50 8.70 1144 - 4620(1894)
Average % 62.64 26.55 10.80 -
158
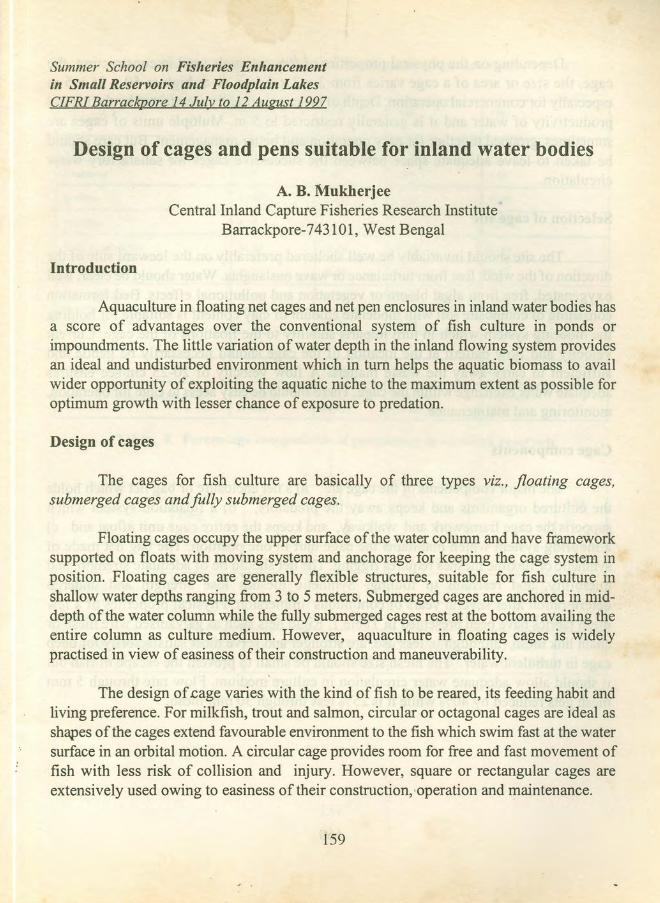
Summer School on Fisheries Enhancementin Small Reservoirs and Floodplain LakesCIFRI Barrackpore 14 July to 12 August 1997
Design of cages and pens suitable for inland water bodies
A. B. MukherjeeCentral Inland Capture Fisheries Research Institute
Barrackpore-743101, West Bengal
Introduction
Aquaculture in floating net cages and net pen enclosures in inland water bodies hasa score of advantages over the conventional system of fish culture in ponds orimpoundments. The little variation of water depth in the inland flowing system providesan ideal and undisturbed environment which in turn helps the aquatic biomass to availwider opportunity of exploiting the aquatic niche to the maximum extent as possible foroptimum growth with lesser chance of exposure to predation.
Design of cages
The cages for fish culture are basically of three types viz., floating cages,submerged cages and fully submerged cages.
Floating cages occupy the upper surface of the water column and have frameworksupported on floats with moving system and anchorage for keeping the cage system inposition. Floating cages are generally flexible structures, suitable for fish culture inshallow water depths ranging from 3 to 5 meters. Submerged cages are anchored in mid-depth ofthe water column while the fully submerged cages rest at the bottom availing theentire column as culture medium. However, aquaculture in floating cages is widelypractised in view of easiness of their construction and maneuverability.
The design of .cage varies with the kind of fish to be reared, its feeding habit andliving preference. For milkfish, trout and salmon, circular or octagonal cages are ideal asshapes ofthe cages extend favourable environment to the fish which swim fast at the watersurface in an orbital motion. A circular cage provides room for free and fast movement offish with less risk of collision and injury. However, square or rectangular cages areextensively used owing to easiness of their construction.operation and maintenance.
159
Depending on the physical properties of the materials used in constructing thecage, the size or area of a cage varies from 3 x 3 x 2.5 m to as high as 50 x 25 x 5 mespecially for commercial operation. Depth ofthe cage is usually ascertained by the naturalproductivity of water and it is generally restricted to 5 m. Multiple units of cages aresometimes grouped together for easy operation and better management. But care shouldbe taken to leave adequate space between the successive cages for satisfactory watercirculation.
Selection of cage site
The site should invariably be well sheltered preferably on the leeward side of thedirection ofthe wind, free from turbulance or wave onslaughts. Water should be clear, welloxygenated, free from algal bloom or vegetation and pollutional effects. Bed formationconsisting of composite soil with moderate amount of clay content is suitable for holdingthe mooring system which in turn imparts stability to the floations of the cage. Currentvelocity and flow pattern at the location of the cage should necessarily be gentle andsufficient to carry away the waste matters. A flow velocity of 20-25 em/see ensuresadequate water exchange within the cage. There should be easy acess to cage for operation,monitoring and maintenance.
Cage components
The major components of the cage are: a) a net enclosure or bag net which holdsthe cultured organisms and keeps away the predators, b) -a floatation system whichsupports the cage framework and walkway, and keeps the entire cage unit afloat and c)a mooring system which maintains the cage unit in one position. The bag net made ofsynthetic or flexible meshes requires rigging. The net should be of adequate strength, and•durability, and resistant to fouling. Synthetic meshes lose strength and undergodeterioration after several years of continuous immersion. Physical properties of a fewmesh fabrics have been presented in Table 1. Rigid nets such as galvanised wire mesh orchain link mesh, although in less use, are stronger and serve most satisfactorily for deepcage in turbulent water. The mesh size should be small to prevent the escape of fish butit should ahow adequate water circulation in culture medium. Flow rate through 5 mmmesh gets reduced by 40% while it is 25% less through 30 mm mesh.
,160
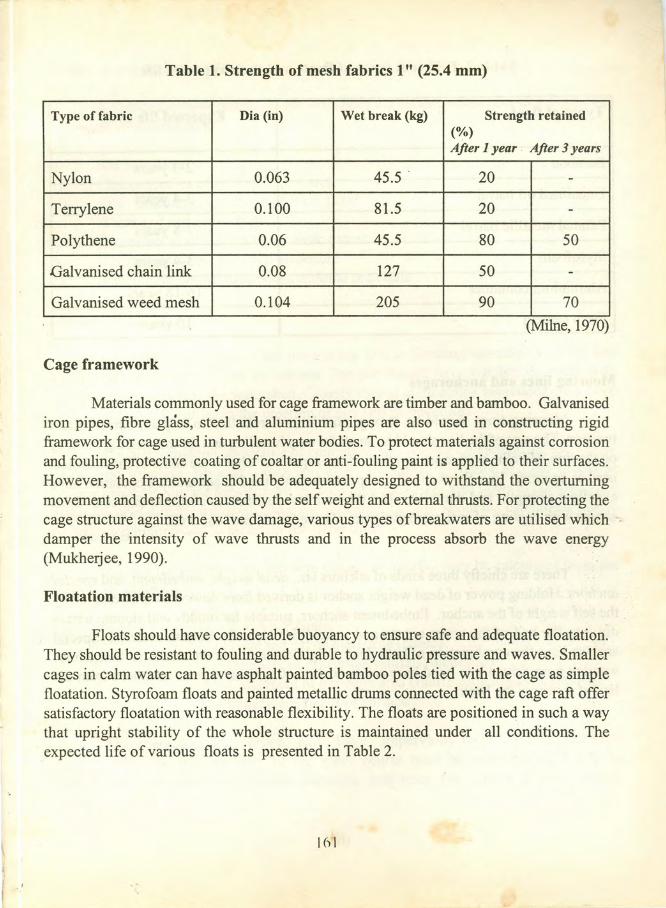
Table 1. Strength of mesh fabrics 1" (25.4 mm)
Type of fabric Dia (in) Wet break (kg) Strength retained(%)After 1 year After 3years
Nylon 0.063 45.5 . 20 -
Terrylene 0.100 81.5 20 -
Polythene 0.06 45.5 80 50
Galvanised chain link 0.08 127 50 -
Galvanised weed mesh 0.104 205 90 70(Milne, 1970)
Cage framework
Materials commonly used for cage framework are timber and bamboo. Galvanisediron pipes, fibre glass, steel and aluminium pipes are also used in constructing rigidframework for cage used in turbulent water bodies. To protect materials against corrosionand fouling, protective coating of coaltar or anti-fouling paint is applied to their surfaces.However, the framework should be adequately designed to withstand the overturningmovement and deflection caused by the self weight and external thrusts. For protecting thecage structure against the wave damage, various types of breakwaters are uti lised whichdamper the intensity of wave thrusts and in the process absorb the wave energy(Mukherjee, 1990).
Floatation materials
Floats should have considerable buoyancy to ensure safe and adequate floatation.They should be resistant to fouling and durable to hydraulic pressure and waves. Smallercages in calm water can have asphalt painted bamboo poles tied with the cage as simplefloatation. Styrofoam floats and painted metallic drums connected with the cage raft offersatisfactory floatation with reasonable flexibility. The floats are positioned in such a waythat upright stability of the whole structure is maintained under all conditions. Theexpected life of various floats is presented in Table 2.
161
.'

Table 2. Different types of floats and their expected life
Types of float Expected life span
Bamboo 2-3 years'
Unpainted oil barrel 3-4 years
Painted metallic barrel 7-8 years
Styrofoam 3-4 years
Aluminium container 16-18 years
Ferro cement 10 years
Mooring lines and anchorages
Mooring lines should be strong, pliable and resistant to impact, abrasion andtwisting. The size ofthe line should be small for easy handling and for minimizing the dragon the line. Metallic wire ropes, synthetic fibre ropes and chains are some ofthe materialsused as. mooring line. Synthetic fibre ropes commonly used in aquaculture operation haveexcellent strength and durability. But they are less resistant to abrasion and cuts. Steelchains with coating of anti corrosive paint also serve the purpose well.
There are chiefly three kinds of anchors viz., dead weight, embedment, and specialanchors. Holding power of dead weight anchor is derived from downward pull exerted bythe self weight ofthe anchor. Embedment anchors, suitable for muddy and sloping terraindig into the bed of the water course and is held firmly in the bottom material. Specialanchors have the combination of both dead weight and embedment anchors. Sometimeswooden pegs driven into hand base act as anchors. Cage can also be anchored from theland if it is near the bank.
162
Design of net pen enclosure
A comprehensive design of net enclosure for inland water course includes thefollowing considerations.
i)ii)iii)iv)v)vi)vii)
Site selectionCharacteristics of the catchment areaRiver discharge, incidence of flash floodWater and soil propertiesComputation of static and dynamic forcesPlanning and design of pen enclosureSelection of appropriate constructional materials
Site selection
Appropriate selection of site plays a key role in deciding economic viability andsuccess of aquaculture in pen enclosures. The site should have a stable shoreline withgentle gradient towards the watershed. Closely spared undulations associated with steepgradients pose difficulties in the erection of pen and its operation.
The bed formation consisting of composite soil is ideal for supporting the weightof the pen structure because such soil offers fractional resistance and has moderatebearing capacity. Surface run-off from the adjoining catchment area flows to the watershedand influences directly the depth and river discharge. Details about the catchment shouldbe collected beforehand to ascertain the flood flow.
Surface run-off from a catchment caused by rainfall may be calculated frorrr thefollowing rational formula:
Where Q = R x A x P cusecQ = Total run off or discharge (cusec)R = Intensity of maximum rainfall (inches/hr)A = Catchment or drainage area contributing to run-off (acres)P = Impervious factor of surface
Absorbent soil and clayey soil have impervious factor of 0.25 and 0.60respectively. The flow velocity of the water course must be non-scouring but quiteconsiderable to carry away waste materials and keep the enclosure safe againstcontamination.
163
Ii

Design forces
The direct loadings and external forces which act on the pen structure are chiefly:
a) self weight of the pen structure nets and operational loadingsb) dynamic forces of the wind, turbulence, waves, etc.,
In addition to these, aquatic vegetation, drift wood, fouling organisms etc., oftenadd to the self weight often. Wind forces acting on the exposed solid parts of the structurecreate overturning movement and tend to lift the structure from its position.
Magnitude of wind force on a solid structure can be determined from the' followingequation (Van Boven, 1968):
F = 0.0965 Ay2 kg
where F = Wind force (kg)A = Projected area (nr')Y = Wind velocity (m/sec)
Planning and design
The planning of pen enclosure varies with the characteristics of the location of theinstallation. For shallow water of 3 to 5 m depth, a flexible type of enclosure closed onthree sides leaving foreshore open, serves the purpose well. Pile supported enclosure withchain link mesh is suitable for water depth of 5 to 12 m. The pen should necessarily bewell defined, either in square, rectangle or oval shape for ccnstructional easiness andmanagement. It should be preferably aligned to the prevailing wind direction for effectiveaeration.
The main components of pen are pen framework, enclosure net and lateral supportsor stays.
Pen enclosure design
Bamboos, timber beams and battens or locally availble timber poles are thecommon materials used for building the pen structure. Bamboos being cheap, strong,durable and abundantly available are extens.ively used for enclosure work. Split baml::oosat intimate spacing driven deep into the r ard base form the main side of horizontal anddiagonal bracings connected with it.
164

The fish retention net, mainly flexible type of synthetic fibres must be ofappropriate mesh size for rearing fish and the mesh opening should permit adequate flowof water through the enclosure. Knotless net mesh is most suitable owing to its resistanceto abrasion and clogging. The net fitted in a perfectly stretched condition cause no injuryto the fish. Sometimes double nets are used in pens, the inner one serving as fish retentionnet and the outer net oflarger mesh preventing the entry of predators and drifting objectsstriking the pen structure.
References
Frevert, Richard K., Glenn O. Schwab, Talcott W. Edminister arid Kenneth K. Barnes,·1962. Soil and Water Conservation Engineering, Wiley, New York.
Milne, P. H. 1970. Fish farming: a guide to the design and construction of net enclosures.Mar. Res., 1 : 31.
Mukherjee, A. B. 1990. Wave dissipating structures for protection of floating net cages.In: Proceedings of the National Workshop on Reservoir Fisheries, CICFRI,Barrackpore, Spl. Publication No.3, Asian Fisheries Society, Indian Branch.
Van Boven, C. J. P. 1968. Design considerations for permanent type offshore structures.Offshore Europe, Scientific surveys (offshore) Ltd. 57-55.
**************
165
Summer School on Fisheries Enhancementin Small Reservoirs and Floodplain LakesCIFRI Barrackpore 14 July to 12 August 1997
Salient ecological features of mans and chaursof north Bihar and their fisheries
B.C.JbaCentral Inland Capture Fisheries Research Institute
Barrackpore-7 43101, West Bengal
Introduction
The northern districts of Bihar (25°18' - 27>37' N and 8g 48' - 88 17' E) areknown for their fertile alluvial plains with a network of rivers and streams. The entireregion is bestowed with a series of natural lakes formed either due to the meandering ofrivers or accumulation of river water in tectonic depressions especially in the Gandak andKosi basins locally known as mans and chaurs. These lakes are very rich in biodiversity.All the economic activities of the region, by and large, centre around these lakes. Theplains of north Bihar have the distinction of receiving recurring floods from the rivers likeKosi, Gandak, Buri Gandak, Bagmati, Kamala, Balan, Mahananda and Kareh during, themonsoon, inundating a large tract of land in the region. The impact of flood is generallyvery forceful as huge mass of water debouch suddenly into the plains from the highlandsof Himalayan ranges of Nepal. A substantial volume ofthis water is being trapped in theoxbow lakes (mans) and tectonic lakes (chaurs). The ingress of silt load brought in thisprocess is also heavy, making the water bodies shallower every year. Till recently, themans and chaurs of north Bihar had the distinction of supporting very high level ofbio-production in general and fish yield in particular. But due to increased anthropogenicactivities in the catchment areas and irrational modifications of river basins, the ecologicalbalance of the lakes has been affected. Excessive proliferation of aquatic macrophytes isthe hallmark of such changes, a factor which has assumed alarming proportions needingcareful mitigating action in order to halt or at least to decelerate the process of theirdegeneration.
167
t "
The natural lakes of the region are being used for dumping waste materials, bothfrom the factories and urban settlements, thereby putting extra pressure on the alreadythreatened ecosystems. The normal grazing chains of these ecosystems have beendisturbed as a result of which the production functions have also gone array. Thefloodplain lakes have high production potentialities due to their shallow nature andextended euphotic zone, but the current level and nature of bio- production are not in theoptimum level which is a matter of serious concern. Thousands of fishermen familieshave been dependent on these resources for their livelihood, since time immemorial andthe lakes provided them lucrative fishery till 1970s. In recent years, however, the fishingactivities have become a secondary occupation as the availabilty of fish per fishermanper day has been reduced to a paltry 300 g and that too of smaller size group, which ishardly sufficient to maintain a family of four or five. It is time that all people concernedshould come forward to conserve these natural water bodies and their preciousbiodiversity while achieving the goal of sustainable development for human welfare. Thiscommunication deals with the salient features of ecology of these water bodies togetherwith their fishery in brief.
Oxbow lake (mall) resources of north Bihar
Estimated area under mans in north Bihar is about 4,735 ha. There are 63perennial lakes of various shapes ranging in size from 8 - 405 ha (Sinha and Jha 1997a).Besides, there are 20,000"ha of incomplete lakes whose formations have been halted dueto the raising of flood protecting embankments. These lakes get inundated duringmonsoon months but reappear after that. The lakes are 'U', 'L' or'S' shaped. Broadly twodistinct categories of mans could be seen viz.,
The lakes which retain their connecting channel with rivers where the ingress ofriver water is a regular phenomenon (live lakes).
The lakes without any connecting channels and therefore, no ingress of river water(closed lakes).
A third category of lakes also exists whose formation has been halted due to theraising of flood protecting embankments. They become part of the rivers during monsoonmonths but get separated as water recedes. These lakes act as a collection sink of riverinefauna and are known for their lucrative capture fishery.
168
Chaur resources of north Bihar
The geomorphological feature of north-eastern part of the area has a large tract oftectonic depressions where accumulation of flood waters is a common phenomenon. Thisis the area where maximum congregation of chaurs (tectonic lakes) is found. This part ofthe region falls under Kosi basin and comprises four distinct chaur areas viz., i) Kabartalarea ii) Kusheshwarsthan area iii) Simari-Baktiyarpur area and iv) Goga beel area. Theshape and size of the chaurs are variable depending on the shape and size of thedepression. In north Bihar, however, the size varies between 0.5 ha and 600 ha and theyare generally saucer shaped. The water spread area of chaurs in the region has beenestimated to be 45,978 ha (Sinha and Jha,1997b).
Ecologial status of mans and chaurs of north Bihar
The mans and chaurs of north Bihar are known for their high production potentialand have remained the life-line of people ofthe region since time immemoriaL However,these ecosystems have been subjected to environmental degradation resulting ineutrophication. The very existence of these ecosystems are under threat. Exces sivegrowth of macrophytes has altered the normal grazing chain with the result the unwantedbiota have occupied the niche to a large extent. The process of swampification hasassumed an accelarated pace resulting in the shrinking of lake areas. Further, conflictsamong various user groups also lead to the deterioration of the lake environment.
Abiotic Features
The soil of these lakes is alkaline (pH 7.7- 8.5) with moderate nutritional status(P04, 0.4 - 1.2 mg/l; NO, 0.07 - 0.15 mg/l) and very high concentration ofdissolved organic matter (0.32 - 2.8 %).
Dissolved oxygen level has high fluctuations (0.05 - 14.00 mg/l) indicating stresscondition specially in lakes receiving effluents. The concentration of DO in thelakes which do not receive effluents, however, fluctuates between 5.00 - 1~:.00mg/L
The alkalinity level is on the increase and found in the range of 110.00 to 61(J.OOmg/l with relatively higher values in lakes receiving effluents.
The nutrients P04 and N03, are generally low in ambient waters compared tc thesoil phase, a typical example of weed choked waters where locking of nutrients isa common phenomenon and thus very little is available in the water phase.
169

The specific conductance values are also on the increase (300 - 950 umhos/cm)with pattern of fluctuations similar to alkalinity. Relatively higher values of thisparameter indicate increased nutrient loading in the system.
Moderate values of primary production in the range of 0.00 - 125 mg CIhr hasbeen recorded from the mans and chaurs of the area.
Biotic Features
The mans and chaurs of the region, generally, harbour poor density of planktonassemblage ( 200 - 3,000 units/I) owing to poor availability of required nutrients,particularly, P04 and NO), a typical feature of weed choked aquatic systems. Instray cases, however, presence of algal blooms has also been reported (Jha, 1989;Sinha and Jha, 1997a), specially those receiving domestic sewage.
.<
The fluctutions of planktonic population normally follow the sequence ofBacillariophyceae > Chlorophyceae> Cyanophyceae> Dinophyceae(phytoplankton) and copepods > cladocerans > rotifers > protozoans(zooplankton). However, of late, the members of Cyanophyceae amongstphytoplankton and protozoans amongst zooplankton tend to increase due toenrichment of systems.
The greater abundance of nannoplankton with high dominance ofbacterioplankton(Thallothrix sp., Thiopedia sp., Chlorobium sp., Sarcina sp. , etc.) in theseecosystems is indicative of stressed ecological regime. It also reflects that theselakes are moving towards ultraoligotrophy owing to excessive utilization ofambient nutrients by thick stands of macrophytes and very little is available tosupport the growth of euplanktonic forms. The incidence is more pronounced inmans on account of the relatively higher macrophytic biomass.
---'
The growth of periphyton is generally high in these systems which are representedmainly by diatoms (>90%). Leaves and stems of submerged vegetation usuallyform excellent substrata for their proliferation.
The mans and chaurs of north Bihar have excessive growth of macrophytes ofvarious types viz., submerged, floating, emergent and marginal covering 50 to 100% of the area. The biomass has been reported in the range of 4.0 - 28.0 kg/m'.
The lakes which receive effluents have more luxuriant growth of weeds which leadto the shrinkage of beel area.
170
The canopy of macrophytes at the water surface is affecting the benthic nicheadversely and almost creating an ecological desert. The strata have largely beenoccupied by molluscan populations which are not contributing much to the grazingchain in the absence of efficient grazers.
Fish and fisheries
The floodplain lakes of north Bihar are known for their lucrative fishery, but inrecent years, the production and productivity ofthese biolgically sensitive ecosystems havegone array in the face of increased human interference. Till the raising of flood protectingembankments along the river courses, the mans and chaurs of the region were consideredas a renewable source of harvestable energy. These water bodies were the excellentnursery, grazing and shelter grounds for incoming juvenile as well as adult fish speciesfrom rivers and as such were the repository of rich biodiversity. However, utter neglect inthe past and irrational exploitation in the present have done considerable damage to thesystems and as a result the process of ecological imbalance has set in. Enrichment ofnutrients both from internal and external sources together with continuous deposition ofsilt load has paved way for the colonization of various aquatic flora, which occupied asubstantial part of the niche. Overgrowth of macrophytes, in these ecosystems, has donetremendous harm to fish and fisheries by promoting species ofless economic values at thecost of prized ones. Shift in population structure is the resultant effects of broken grazingchain. Pattern of energy transfer from one trophic level to another has changed to longerchains from autotrophs to smaller forage fishes and to carnivores. Multiple breeding offorage fishes has thus helped to establish the carnivores at the cost of carp population.The present status of fishery of mans and chaurs could be surnmerised as under:
. The ingress of riverine fish seed has been affected adversely due to theconstruction of flood control embankments resulting in the dismemberment of lakeswhich had connection with the parent rivers. In case of closed lakes, no stockingschedule is followed.
The share of major carps in the fish production has been estimated to ameagre 3-5 % or even less at times. The catch is dominated by catfishes (60 - 80%)in terms of biomass where forage fishes dominate. In those lakes where ingress ofcarp seed is taking place or some stocking is done, its percentage in the total catchhas been found to be relatively better (26 - 28 %).
The average catch per fisherman per day ranges between 300 and 500 g ofmixed. species which is not enough for subsistence and thus the.fishery in these lakeshas become a subsidiary occupation.
171

The lake area of entire north Bihar is becoming a bone of contention amongvarious users regarding the usefulness of these water bodies as they have conflictinginterests. Reclamation of lake area either for agriculture or for urban development ison the increase. Evidently, this has done considerable damage to these ecosystemsand in the bargain the biodiversity and fishery are the worst casualities
The short term leasing policy of Fisheries Department of Bihar is anotherimportant factor affecting the fishery adversely. The lessees are not very keen toinvest money for the development of fishery in these lakes. On the contrary, they tryto catch the entire fish stock irrespective of size and quality, resulting in furtherdepletion of fish population. At no point oftime, the fishery ofthese lakes is allowedto build up.
The gears used in the region are generally of primitive types and of smallermesh bar which itself is an indicator that the lakes are dominated by smaller varietyoffish species. The most disturbing trend is the use of chatti jal, a drag net made ofmosquito net clothing. This amounts to converting these fragile ecosystems intofishery deserts by netting out all the fishes without any discrimination of sex, sizeor quality.
The shell fishery is also common in this lake area and at times the output ofsmaller variety of prawn is quite substantial in the total catch (7.0 - 10.0 %). Handpicking of gastropods, during post monsoon months, is a common site in north Biharspecially in the chaurs.
Transfer of energy and 'productivity potential .,;,'
The normal grazing chain, which starts with plankton and culminates at fish, hasbecome irrelevant in the face of fast changing ecological scenario of these lakes .Conversely, continuous increase of detrital pool at the bottom is highly significant dueto over growth of macrophytes in the system. The productivity of these lakes in terms offish yield is due to the fact that the transfer of energy, from primary level to fish is onlypartial, as bulk of the energy remains unutilised in the form of detritus at the lake bottom. Moreover, poor or no management of these ecosystems coupled with excessive man-induced habitat changes has made the situation all the more difficult for smooth passageof energy from one trophic level to another. The photosynthetic efficiency of theseecosystems depends on two counts, first the level of their management and second thelevel of waste input in them. It has been observed that the photosynthetic efficiency rangesbetween 3.26 % (stressed lakes) to 4.86% (non stressed and partially managed lakes).Based on the level of primary production at various trophic strata, the mans and chaurs of
172
.. ~.,+

north Bihar have the potential for producing 1,000 - 1,800 kg fish! ha/year against the. current yield of30 to 300 kg fish! ha/year. Evidently, there is enough scope for fish yieldenhancement in the area, provided the lakes are managed on scientific lines and in tunewith the norms of enviornmental and biodiversity conservation.
References
Jha, B. c., 1989. Beel fisheries resources in Bihar and eastern Uttar Pradesh. Training inmanagement of beel (oxbow lake) fisheries; Bulletin No. 63, CIFRI, Barrackpore,West Bengal.
Sinha, M. and B. C. Jha, 1997a. Ecology ana fisheries of oxbow lakes of north Bihar - athreatened enviornment (MS)
Sinha, M. and B. C. Jha, 1997b. Uttar Bihar ke matsyaki jal sansadhan - vartamanavastha evem bhavi sambhownayen. Bulletin No. 70, CIFRI, Barrackpore, W.B.
*********
173
Summer School on Fisheries Enhancementin Small Reservoirs and Floodplain LakesCIFRI Barrackpore 14Julv to 12August 1997
Fisheries of Muktapur oxbow lake (man) - a case study
B. C. JhaCentral Inland Capture Fisheries Research Institute
Barrackpore-743 101, West Bengal
Introduction
Muktapur is a typical 'U' shaped oxbow lake, located 5 Ian North of the districtheadquarters of Samastipur. This 100 years old perennial meander of river Burhi Gandakhas an area of 40 ha . Its water is used for irrigation, drinking water, industrial use andfisheries. The fisheries right is vested with the State Department of Fisheries. Muktapurlake is an open type oxbow lake as it has retained its connecting channel with river.Colonization of aquatic macrophytes isofvery high degree and these plants have assumedthe status of weeds. Sluice gates have been provided at the mouth of the channel toregulate ingress and egress of water: However, in recent years, the sluice gate device hasbecome almost defunct and the channel has been considerably silted up. Another reasonfor the poor ingress of riverine waters is the rising of the lake bed level. The fish ,andfishery, for the present, has been restricted to relatively less economic species in the faceof excessive growth of macrophytes and poor recruitment of quality fish seed from themain river. Excessive withdrawal of lake water for irrigation and jute factory together withreclamation of marginal areas has accelerated the pace of eutrophication and furthercolonization of macrophytes.
An effort has been made here to highlight the status of fish and fishery ofMuktapurlake, based on the studies made during 1988 to 1993.
Salient ecological features
The soil quality ofMuktapur lake has been found to be productive as indicated byhigh values of pH and organic carbon together with fairly rich contents of plant nutrients( Table 1) while the water quality indicated a mixed trend of trophic status. The dissolved
175

oxygen, total alkalinity and specific conductance were in the productive range. However,availability of nutrients reflected the characteristics of typical weed choked aquatic regimewith poor values ( Table 2).
Table 1. Soil quality of Muktapur lake
Parameters Values (range) Average
pH 7.6 - 8:5 8.05
Total nitrogen (%) 0.67 - 1.1 0.89
Total phosphate (%) 0.40 - 1.0 0.70
Organic carbon (%) 0.41 - 1.9 1.16
Table 2. Water quality of Muktapur lake
Factors Values Average
Transparancy (em) 52.0-102.0 77.0
pH 7.1-8.2 7.65
DO (mg/l) 5.4-10.6 8.0
Total alkalinity (mg/I) 92.0-155.0 123.0
P04 (mg/l) Tr.-0.Op9 0.004
N03 (mg/l) 0.12-0.45 0.285
Sp. Conductance 392-498 445(umhos/cm)
Primary production
The rate of primary production in Muktapur lake was low to moderate range of27- 131 mgCzm' and a significant 71 % of this production was through nannoplnktonicchain. The macro- or net phytoplankton production was overshadowed by themacrophytic growth.
176

Biotic communities
In Muktapur lake macrophytes have been the most dominant biotic community,regulating the whole biotic regime of the lake. Availability of net plankton was poor(345-650 units/l) and the nannoplankton which dominated by bacterioplankton 'wasrelatively higher (5,010-1,800 units/l), Colonisation of periphyton was better (850-5,300units/l) due to the presence of submerged leaves andstems ofhydrophytes. The wetweight 'of macrophytic biomass was significantly high (7.0-13.8 kg m2 ) and theproduction of benthic fauna of molluscan dominance was reasonably good . Thecomposition of biotic communities was indicative of a stressed aquatic environment and
.an incoherent biotic association, with the result, the transfer of energy from one trophiclevel to another has been deviated from its normal path. The two dominant biotic groups,in terms of biomass, the macrophytes and the molluscs have failed to enter the grazingchain leading to fish production in the absense of efficient grazers.
Bottom energy
The average annual detrital load in Muktapur lake has been estimated at 14.3x 10⁵ K Cal /ha. But this large energy reserve at thebottom is not reflected in fishproduction. It has been estimated that 2,06,800 K Cal was the total energy that was'harvested annually in the form of fish, out of which 53.25 % ( 1,10,112 K Cal) camethrough smaller fish, 24.84 % from carnivores and 13.12 % from plankton feeders. Only8.79 % was contributed by the detritivores. Evidentlly, a large reserve of bottom energyremained unutilized or wasted (Sinha and Jha, 1997).
Fish and Fisheries
Fish fauna
Out of the 42 species of fishes recorded from Muktapur, only 15 were ofeconomic value. Besides the Indian major carp, larger catfishes, featherbacks, air-breathing fishes and Channa spp. there were miscellaneous fishes which had good marketacceptability such as Setipinna phasa , Puntius sar.ana, Labeo bata, Mystus vittatus, Ailiacoila, Nandus nandus, Mastacembelus armatus, M. puncalus etc. (Jha, 1995).
Production
The rate of fish production increased from 60 kg/ha/yr in 1989 to 163 kglha/yr in1992 to the natural and artificial recruitment of prized fishes. In 1988, though theconnecting channels of River Burhi Gandakwere silted up, the strong flood water could
177
,

bring in fish seed to the lake leading to the natural recruitment of fish. Because of thepartial management of the lake fishery encouraging results were discernible. Compositionof major carps in the fishery increased from 9.03 % in 1989 to 21.00 % in 1992 togetherwith a substantial decline in the abundance of catfish (from 24.67 to 14.99 %) and foragefish (60.08 to 53.77 %).
Production potential
The production potential of Muktapur lake has been estimated at 1,200 kg/ha/yrbased on the energy reserve and therefore, ample scope exists to enhance its fish yieldthrough effective management. The fish yield rate of the lake can be increased to 600kg/ha/yr even if 50% of the actual potential is realised. However, to achieve this targetscientific management of the lake is a prerequisite.
Feasibility of fish husbandry
Pen culture experiments conducted in Muktapur lake were very encouraging asyield of 3.5 to 4.0 't could be achieved in a rearing period of six to eight months. Thismode of aquafarming comes handy for augmenting the yield from such of wetlandecosystems. It generates not only additional revenue and gainful employment but alsohelps in the effective utilization of marginal areas of the lakes without disturbing the mainwater body.
Reference
Jha, B. c., 1995. Floodplain fishery of the Gandak basin Bihar. In: Howes J. R., (Ed.) ,1995, Conservation and sustainable use of floodplain wetlands, Asian WetlandBureau, Kuala Lumpur, A WB publication, No. 113 : 89-97 .
.Sinha, M. and B. C. Jha, 1997a. UttarBihar ke matsyaki jal sansadhan - vartman
awastha evem bhavisambhawnayae. Bulletin No. 70 , CIFRI, Barrackpore .
______ 1997b. Ecology and fisheries of ox - bow lake ecosystem - a threatenedenviornment. Bulletin No. 74, CIFRI, Barrackpore.
*************
178
I
Slimmer School on Fisheries Enhancementill Small Reservoirs and Floodplain LakesCIFRI Burrackpore 14 July to 12 August 1997
Reels, the prime inland fishery resource of Assam
M. M. GoswamiDepartment of Zoology
Guwahati University, Guwahati, Assam
Beels associated with the two major river systems, Brahmaputra and Barak,contribute to the bulk of inland fisheries resource of the State of Assam. These beels arein the transient phases oftheir evolution from the riverine ecosystem. They are ecosystemswith unique, geo-hydrological processes followed by eco-biological successions. The geo-hydrological processes due to fluvial action of both the rivers cause the changinglandscape of the State. Acting as natural filters and by way of regulating the hydrologicregime and nutrient exchanges, these beels preserve the fish germplasm of commerciallyimportant species, by providing excellent spawning and nursery grounds for a11commercial species including the Indian major carps.
There are about 1,392 beels in Assam (Table 1) of which 423 (30.4%) areregistered and 969 (69.6%) unregistered. Among the unregistered beels, 52.1 % are underthe control of the state government and 47.9% fall under the public sector. However,according to the present government records, there are 430 registered and 766 unregisteredbeels while the remote sensing data show more than 3,000 beels in Assam. These beelsconstitute about 72.45% ofthe totallentic water area (1,380,17 ha) of the State excludingtwo newly constructed reservoirs (10,730 ha). The rich riverine fisheries of Assam derivemainly from the potamonic stretches of 4,820 km (2,05,000 ha) of the Brahmaputra with42 tributaries and the Barak with 13 tributaries, which mainly harbour rich fish fauna.
179
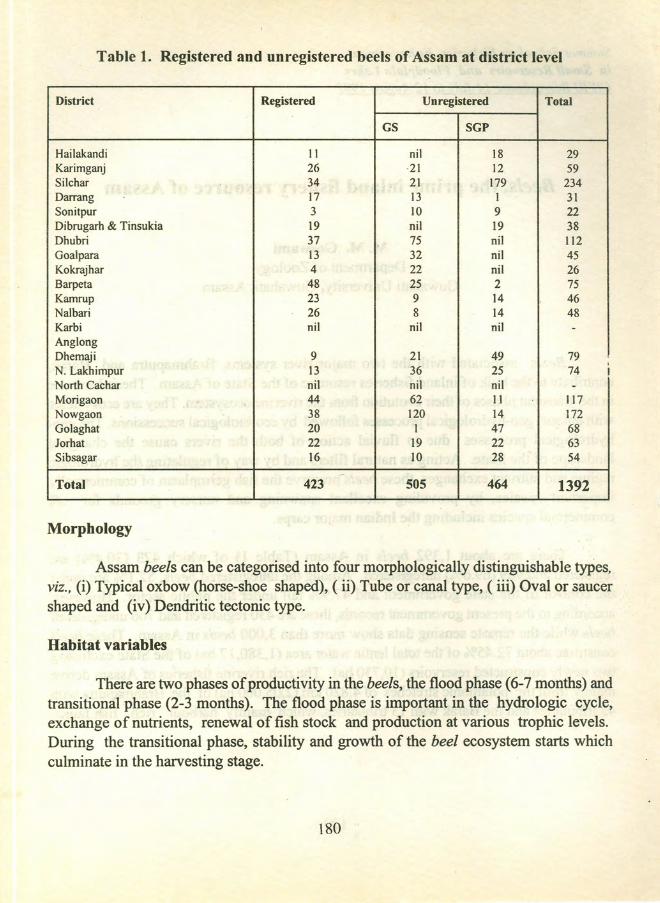
Table 1. Registered and unregistered beels of Assam at district level
District Registered Unregistered Total
GS SGP
Hailakandi II nil 18 29Karimganj 26 ·21 12 59Silchar 34 21 179 234Darrang 17 13 1 31Sonitpur 3 10 9 22Dibrugarh & Tinsukia 19 nil 19 38Dhubri 37 75 nil 112Goalpara 13 32 nil 45Kokrajhar 4 22 nil 26Barpeta 48 25 2 75Kamrup 23 9 14 46Nalbari 26 8 14 48Karbi nil nil nil -AnglongDhemaji 9 21 49 79N. Lakhimpur 13 36
,25 74 I
North Cachar nil nil nil -Morigaon 44 62 II 117Nowgaon 38 120 14 172Golaghat 20 1 47 68Jorhat 22 19 22 63Sibsagar 16 10 28 54
-Total 423 505 464 1392
Morphology
Assam beels can be categorised into four morphologically distinguishable types,viz., (i) Typical oxbow (horse-shoe shaped), ( ii) Tube or canal type, ( iii) Oval or saucershaped and (iv) Dendritic tectonic type.
Habitat variables
There are two phases of productivity in the beels, the flood phase (6-7 months) andtransitional phase (2-3 months). The flood phase is important in the hydrologic cycle,exchange of nutrients, renewal of fish stock and production at various trophic levels.During the transitional phase, stability and growth of the beel ecosystem starts whichculminate in the harvesting stage.
180

Physico-chemical features of water
Some of the physico-chemical features, viz., water temperature, pH, dissolvedoxygen, free carbondioxide, total alkalinity, total hardness, total phosphate, total nitrogen,calcium and magnesium are related to the fish productivity (Table 2).
Table 2. Ranges of water parameters showing productive and unproductivetrend in the beels
Parameters Present Productive/unpro- % of bee Is Inferencerange ductive ranges
Water temperaturerC 19.0-34.0 - 100.0 Productive
pH 5.6-9.1 <6.0 28.6 Unproductive6.0-9.0 71.4 Productive
Dissolved oxygen 1.9-9.0 1.0-5.0 26.7 Unproductive(mg/I) 5.0-9.0 73.3 Productive
CO2 0.0-23.0 0.0-5.0 35.7 Productive>5.0-20.0 64.3 Unproductive
Total alkalinity (mg/I) 14.0-125.0 <25.0 68.4 Unproductive25.0-125.0 31.6 Productive
Total hardness (mg/I) 2.0-140.0 <15.0 53.3 Unproductive25.0-100.0 26.7 Productive
>100.0 20.0 Less productive
Total P04 (mg/I) 1.4-3.9 <2.0 12.5 Unproductive>2.0 87.5 Productive
Total Kjl-N 0.7-7.3 <5.0 57.1 Productive>5.0 42.9 Unproductive
Ca'" (mg/I) 4.0-15.0 <25.0 83.3 Unproductive>25.0 16.7 Productive
Mg'" (mg/l) 2.0-60.0 <25.0 81.8 Unproductive>25.0 18.2 Productive
Prajna, Guwahati University
181

PI:u) kron
Plankton diversity of beels is generally high suggesting a eutrophic condition butplankton volume is generally 10\>,; (0.7:; - 2.0 mill 00 1 ) except during bloom formation(6.0 - :.0 mill 00 1). Chlorophyceae, Myxophyceae and Bacillariophyceae are the mostdominant phytoplankton group and among the zooplankton, the most common groups areProtozoa, Rotifera and Crustacea (Cladocera > Copepoda).
Macrophytes
Most of the energy produced in the beels are wasted in the luxuriant growth ofn-acrophytic biomass (3.0 - 7.0 kg/rrr') excluding the mat swamps. High macrophytic.growth indicates a rapid eutrophication process.
Fisheries potential
Fish species
Altogether, 66 fish species of riverine origin are known to occur in the beels andtheir present status has been determined· after random sampling in 50 beels (Table 3).Over the years, there has been a change in species composition; major group giving wayto minor groups (Table 4).
\~2
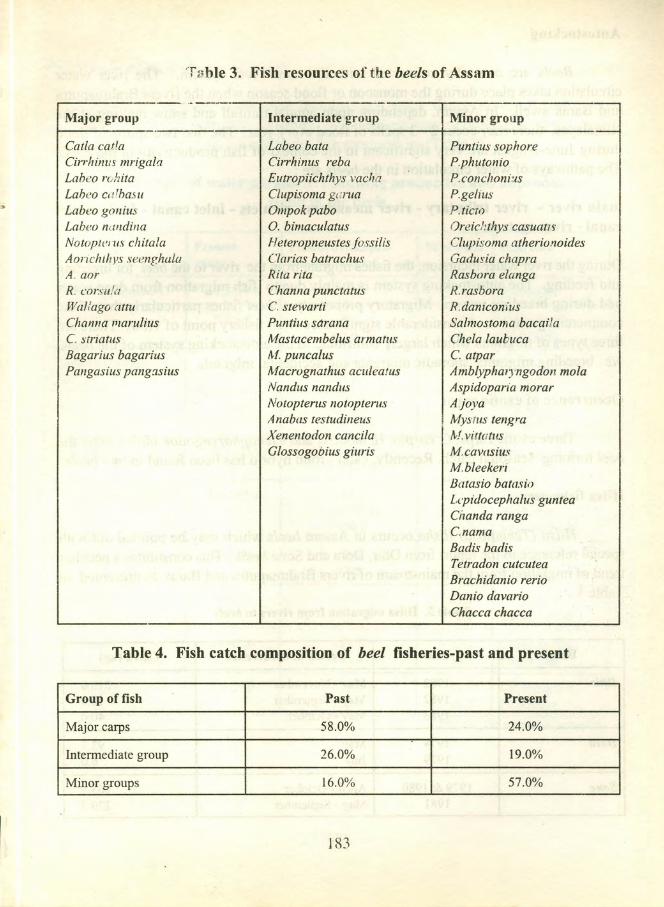
'T*.•ble 3. Fish resources of the beels of Assam
.-----Major group Intermediate group Minor group
Catla eatla Labeo bata Puntius sophoreCirrhinus mrigala Cirrhinus reba PphutonioLaheo rohita Eutropiichthys vacha P.conchoniusLabeo culbasu Clupisoma garua P.geliusLabeo gonius Ompok pabo PitictoLabeo nandina 0. bimaculatus Oreichthys casuattsNotopteius ehitala Heteropneustes fossilis Clupisoma atherionoidesAorichthvs seenghula Clarias batrachus Gadusia chapraA. aor Rita rita Rasbora elangaR. corsu!a Channa punetatus R.rasboraWaflago attu C. stewarti R. daniconiusChanna marulius Puntius sarana Salmostoma bacailaC striatus Mastacembelus armatus Chela laubucaBagarius bagarius M. puncalus C. atparPangasius pangttsius Macrognathus aculeatus Amblypharyngodon mola
Nandus nandus Aspidoparia morarNotopterus notopterus AjoyaAnabas testudineus Mystus tengraXenentodon eancila I M.vittatusGlossogobius giuris M.cavasius
M.bleekeriBatasio batasioLcpidocephalus gun teaChanda rangaC.namaBadis badisTetradon cuteuteaBraehidanio rerioDanio davarioChacca ehacca
Table 4. Fish catch composition of beel fisheries-past and present
Group of fish Past Present
Major carps 58.0% 24.0%
Intermediate group 26.0% 19.0%
Minor groups 16.0% 57.0%
183

Autostocking
Beels are normally connected with the main river system. The river watercirculation takes place during the monsoon or flood season when the rivers Brahmaputraand Barak swell. In Assam, depending upon annual rainfall and snow melting at theHimalayas, there may occur 2 - 3 spells of flood every year. The first two spurts of floodduring June-August are very significant in the context of fish productivity in the beels.The pathways of water circulation in the beels are:
main river - river tributary - river meanders - rivulets - inlet canal - heel - outletcanal - river system.
During the river water incursion, the fishes migrate from the river to the beel for breedingand feeding. The autostocking system is mainly due to fish migration from deep waterbed during breeding season. Migratory propensity of beel fishes particularly that of thecommercial groups is of considerable significance from fishery point of view. There arethree types of migrants which largely contribute to the autostocking system of the beels,viz., breeding migrants, sporadic migrants and accidental migrants.
Occurrence of exotic carps
Three exotic carps, C. carpio, H molitrix and Ctenopharyngodon idella enter thebeel forming seasonal catch. Recently, catla - rohu hybrid has been found in two beels.
Hilsa fisheries
Hi/sa (Tenualosa) ilisha occurs in Assam beels which may be pointed out withspecial reference to the report from Dhir, Dora and Sone beels. This constitutes a peculiartrend of migration from the mainstream of rivers Brahmaputra and Barak as presented inTable 5.
Table 5. Hilsa migration from rivers to beels
Beels Year Period of occurrence Catch (kg)
Dhir 1982 May - November 715.01982 May - September 10.01983 May - October 40.0
Dora 1978 May 93.71979 July 6.0
SOlle 1979 & 1980 April- October 163.51981 May - September 220.7
184
ti
_.

Fish yield
In spite of several constraints, beels contribute c 12.5% to the total annual fishproduction of the State which has been estimated at c 1.51 lakh t, against the annualdemand of 2.5 lakh t. Although the estimated total beel area is 1 lakh ha, no records areavailable on total fish yield from individual beels. Data collected during 1994-95 from anumber of randomly selected beels from five sectors of Assam clearly indicate an averagefish production rate of 190.0 kg/ha (Table 6).
Table 6. Fish production from selected Assam beels
1 Production rate kglhaZones
1. Upper Assam 120.0 - 207.0 (Av. 163.0)2. Northern Assam 150.0 - 350.0 (Av.24::'.0)3. Southern Assam 102.0 - 419.0 (Av. 17; .0)4. Central Assam 150.0 - 300.0 (Av.22:.0)5. Lower Assam 100.0 - 380.0 (Av. 173.0)
The catch per person per gear per hour (CPGH) in kg recorded with differentnets is shown in Table 7.
Table 7. CPGH (in kg) with different gear
DolijalFashijalKhewalijalPaonajal·MusharijalBetjalGhaijal
0.135 - 0.6310.110 - 0.1720.040 - 0.2400.240 - 004000.600 - 0.7200.215 - 0.3550.720 - 1.030
Beels constitute the prime inland fishery resource of Assam. Conservation of theseecosystems is very essential to develop them on a sustainable basis, especially due to thefact that these water bodies depend on river systems for recruitment of fish and nutrients.Beels are a continuum of riverine ecosystem and a holistic approach in the managementof the two types of resources is very essential.
185
Summer School 01; Fisheries Enhancementin Small Reservoirs and Floodplain LakesCIFRI Barrackpor<! 14July to 12August 1997
Ecology of beels in WestBengal
M. K. MukhopadhyayCentral Inland Capture Fisheries Research Institute
Barrackpore-743 101, West Bengal
Floodplain wetlands of West Bengal, locally known as beels and jheels, playa. major role in the lives of the rural people and economy of this densely populated State.More than 42,500 ha of water area is under beels spread throughout the State except fewdistricts like Purulia and Midnapore. Though ranks second after the state of Assam inrespect of surface area, the State gets much less fish from the beels than their potentialIndiscriminate exploitation is one ofthe reasons for the low yield rates. Many of the waterbodies are in the state of unproductive, derelict or semiderelict condition. The fishproduction can be rejuvenated if appropriate measures for conservation and managementofthese resources are adopted on scientific lines. Knowledge of ecological processes andan integrated approach in biological productivity management are imperative -forenhancing yield from the beels. Along with yield optimisation, measures for conservingthe biodiversity richness of these natural water resources are also required.
Ecology of beels
Condition of majority of the beels have deteriorated considerably due to excessivesiltation within the beels as well as in the channels connecting them with rivers ortributaries. Over-growth of macrophytes and siltation have further hastened the processesof swampification in the system. These processes have resulted in conversion of manybeels into marshy lands.
187
Ii
Morphometry and hydrodynamics
Morphometrical heterogeneity is conspicuous in the beels. The morphometricfeatures are dependent on resource contc ur and geomorphometry of the locations.Jn WestBengal, the beels ale mostly cutoff meat ders ( fthe river Gaiga and its tributaries.Someof them are oval,d imbell shaped or riv -rine in appearance.
The hydrodynamics of beels is determined by the effects of water inflov andoutflow from the system. The open bee.s, linked permanently with rivers retain riv erinelevel all along. When the riverine linkage is seasonal, only dur ing monsoon flood, the beellevel reaches river level, which later recedes due to water loss through evaporation.
The closed heels are significantly -lifferent from open ones as they are severed romriver and exclusively dependent on catchment runoff for water rechan :ing.Hydrodynamically t le closed beels are not very stable due to the erratic water renewalthrough rainfall. Mejority of the beels in West Bengal are vulnerable to high water levelfluctuations. Low r..infall causes serious water balance problems for the closed b iels.Unusual drought caus es complete exposure and subsequent bicdiversity losses in shall owand closed water bodies.
Nutrient dynamics
Water and so I form the princip. J media for all the biological activities in anaquatic system. Thu, the physico-chemical qualities of water ~ndsoil have direct bearing0'1 productivity potentialities of the beels. Water is considered productive when rich inoxygen and nutrients and suitably warm for promoting physiological activities oforganisms. The beels of West Bengal renain moderately warm under the geo-climaticsituations of the region. However, the thermal amplitude varies with the water depth. Thedeep water beels are thermally stratified during summer months. Thermal gradiert of4-6 °c between surface and bottom is very often recorded in beels retaining more than10 m of water column. Beels with less than 10 m of water depth are mostly homotherrnic.The clinothermic beels are also charactensed by the chemical stratification in respect ofoxygen, CO2, .alkalinity and pH. Bhandardaha and Gopalpur beels are the examples ofthermally stratified water bodies. Occasionally, clinothermic conditions are also recordedin beels less than 10m in depth and such conditions prevail temporarily during summermonths only.
188
- .

'.'he beels are naturally rich in nut rents due to the allochthonous supply of organicmatter \hrough the catchment runoff and autochthonous sources of macrophyticdecompc sition besides the death and decay of other aquatic organisms. These two sourcesof nutrii nt supply are highly variable. The generation and supply of organic materialsfrom the catchment depend on the characteristics and the extent of catchment area feedingthe aquatic system. On the other hand, the macrophytic source of nutrients vary with theplace and time. Shallow water areas are the most ideal habitats for the growth andproliferation of macrophytes. Seasonal fluctuation in vegetati-ve growth is a naturalphenornen 'm which is applicable for all the habitats.
Nutrient cycle in aquatic system is a complex process involving soil, water andtheir interphase. The process involves storing, releasing and utilisation of the nutrientseither in organic or inorganic form. The undesirable. piling of organic matter complicatesthe nutrient cycle further in beel ecosystem. The high nitrogen level interferes with therelease and subsequent availability of phosphorus for the primary producers. Suchinteraction ~s pronounced in the shallow marshy water bodies where nitrogen getsgradually accumulated as undecomposed, semidecomposed and decomposed organicmatters' in the bottom sediments. Excessive organic deposition creates unconduciveenvironment Cormany of the beneficial and mineralising microbes and produces eutrophiccondition in the habitat. In deep water bodies which are less infested with macrophytes andwith compare tively lesser accumulation of organic materials, an optimum balance indissolved inorganic nitrogen and dissolved inorganic phosphorus is maintained which isideal for optimum availability and utilisation ofN and P for primary productivity.
Structure and functions of biotic communities
In an aquatic system the community structure is affected by the habitat alternation.The biotic communities consist of primary producers which synthesise food from thenutrients and the consumers of primary, secondary and tertiary trophic levels. Amongprimary producers, the role of macrophytes and phytoplanktonic organisms are wellknown, while the role of organisms < 10 urn in size are not well recognised, though theyare extremely important in the production process and nutrient recycle in surface water.These organisms are identified as photosynthetic cyanobacteria.
Beels provide ideal habitats for plant organisms like macrophytes andphytoplankton. Macrophytes dominate marshy water bodies while the plankton prevailsin deep water ecosystems. The cycle of planktonic biomass is well associated withfluctuation in solar radiation and the nutrient availability. The beels in West Bengal, byvirtue of their liig,h nut.ient storage, exhibit two to three plankton pulses in a year. The
planktonic peaks are mainly due to the blooms of filamentous algae like Oseillatoria,Anabaena, Phormidium or Microcystis and occasionally Ceratium, The zooplanktonsometimes outnumbers the phytoplankton in some deep water bodies which harbourhigher densities of planktonic population compared to the shallow ones. The weed infestedbeels are different in planktonic structure. Apart from having lower plankton densitiescompared to the deep water bodies, they are dominated by zooplankton (Cyclops sp.,Diaptomus sp., Daphnia sp. Bosmina sp. ete.). ,
Besides the macrophytes and planktonic organisms, ' a third group of communityviz. the associated fauna is an important linkin the food chain of beel ecosystems. Themacrophytes provide support for these organisms in the form of food, shelter and breedingspace. Marshy and weed infested beels are rich in macrophyte associated fauna. Weedassociated fauna tend to be host specific. Soft and leafy vegetables arealways preferredby the dominating population of gastropods. The bottom soil is occupied by various groupsof benthic organisms. These organisms form an important link in the food chain, utilisingthe energy at the sediment phase. Dominance of benthic fauna in organically rich bottomsis, thus very common. The shallow, weed infested beels are always rich in benthic faunaboth qualitatively and quantitatively. Molluscs mainly represented by the gastropods(Gabia sp, Gyraulus sp. Lymnaea sp. Bellamya sp.ete.) dominate over the other benthiccommunities (annelids, insects, decapods etc.) in the beel systems of West Bengal. By andlarge, these organisms are in their peak abundance during winter season when the habitatis favourable for their propagation and growth.
Beels are well known for their fish faunistic diversity. Besides harbouring a widevariety of endemic fish fauna, these water bodies are providing food and shelter for anumber of non-resident species. The fish fauna in beel system varies with ecological statusmainly food spectrum. Low depth, dense weed infestation and low planktonic growthrestrict inhabitation of major carp species in shallow beels. The fish fauna in shallow beelscomprises minnows (Amblypharyngodon mola, Puntius spp., Gadusia chapra, Chela sp.Ambasis nama, A. ranga, Colisa sp.) and carnivorous species (Glossogobius giuris,Heteropneustes fossilis, Anabas testudineus, Notopterus notopterus). Management ofbeels takes into account, the pathways of energy transformation in beels i.e., plankton-based and detritus-based systems.
Anthropogenic pressure
Growing population in the rural areas where there is high level of dependence onthe beels for various activities is the main reason of increasing anthropogenic pressure onthe beel ecosystem. The pressure due to water abstraction for agricultural purposes is on
l~O

the increase. Agricultural post-harvest activities such as retting of jute is very common inbeels of West Bengal. The process ofretting jute stems in water, besides generating hugeamount of organic deposit, introduces different types of harmful chemicals to the systems.Cumulative effect of these human activities is deleterious to the ecosystem functions.Catchment alteration is another serious anthorpogenic irterference. Change in land usepattern poses serious threats to the very existence of the beel as a resource.
***********
191

Summer School on Fisheries Enhancementt1l Small Reservoirs ana Floodplain Lakes(YFIU Barracknore j 4 Jul)!.. to 12 AiJgust 199i'
Present status of fish production in thebeels of VIast Bengalwith suggestion for fish yield optlmlsatlon
M. K. MukhopadbyayCentral Inland Capture Fisheries Research Institute
Barrackpore-743] 01, West Bengal
Although West Bengal tops the list of inland fish producing states in India, ona .count of high percentage of fish eating population, there is a big gap between therequirement and availability of fish in the Sta:e. In order to increase fish production, alle cisting water resources, natural or man-made, are being utilized for fisheriesdevelopment. Beefs, being a major component of the freshwater resource of the state,receive special attention. However, increasing pressure on these water bodies causese cological imbalances. There is an urgent need to develop fisheries development normswhich are environmentally sound.
Lesource characteristics
Beefs have diverse morphometric and hydrographical characteristics. Based on theLydrographical features, these water bodies are distinguished as open and closed types.Open beefs are linked with rivers and get water regularly while closed ones arecompletely severed from the river connection. These categorisation is important forassessment or differentiation of recruitment potentialities. However, for ecologicaldistinction and also for formulation of effective fisheries management practices, the beels"an also be classified on the basis of depth variations.
193
Deep water beels
Water bodies more than 10 J11 in depth are chemically stratified with a euphoticzone limited to 2-3 m. Low dissolved oxygen and temperature, coupled with unfavourablechemical conditions create anaerobic conditions at the bottom layer. Energy flows mainlythrough the planktonic food chain and partially _through the food chain ofmacrovegetation. Mono- or bimodal seasonal peaks of plankton are often recorded in thesebeels.
Medium deep beels
The medium deep beels are either silted up deep water beels or they are originallyso due to geomorphometric features of their locations. These systems are ecologicallybalanced, highly productive and maintain equilibrium in macrophytic and planktonic foodchains.
Shallow beels
These beels are less than 3 m in depth with-highly fluctuating water balance.Extreme draw down in summer causes drying up of many of the beels which are veryshallow in nature. Problems of dehydration and subsequent biodiversity loss are severein case of unusual drought and high rate of water abstraction for agricultural purposes.Adverse effects of stresses in environment on the life processes are more pronounced inshallow beels during summer season. Thick growth ofhydrophytes is common in shallowbeels often spreading up to 90 to 95% of the water area in winter months. Dominance ofmacrophytes hinders microphytic growth. Besides, decomposition of macrophytescontributes continuously to the organic storage and hastens the process of eutrophication.
Fish spectrum
A total of 94 fish species have so far been reported from West Bengal beels. Inaddition, some riverine species migrate to beel habitats for breeding and nourishing theyoung ones. Fish fauna varies with food spectrum of the aquatic system. The deep waterbeels by virtue of dominant planktonic food chain harbour combination of planktonfeeding fishes like Amblypharyngodon mola, Gadusia chapra, Puntius spp., GambusiaajJinis, Colisa fasciatus, Chela bacaila, Osteobrama cotio, Esomus danrica, Ambasisnama and A. ranga. Big sized carnivorous fishes viz., Wallago attu, Mystus sp. Channamarulius and the major carps like Labeo rohita, Catla catla, Cirrhinus mrigala and Labeocalbasu are also found . Fish spectrum is conspicuously different in shallow water
t94
.--
.-"

ecosystems. Despite the high organic deposition, the fish fauna includes very few ofthe detritivores due to the unfavourable habitat. Fishes in these system mainly belong tosmall planktivores and carnivorous species such as Channa punctatus, C. marulius, C.gachua, C. striatus, Nandus nandus, Glossogobius giuris, Xenentodon cancila,Notopterus notopterus and air-breathing fishes like Anabas testudineus, Heteropneustesfossilis and Clarias batrachus. Medium deep beels have rich species diversity.
Fish yield pattern
Fish yield in beels fluctuates widely depending on the fish fauna and foodspectrum, recruitment potentialities and overall habitat. These factors vary from onesystem to the other resulting in variation of the yield pattern. The average annual yieldfrom shallow beels ranges between 150 and 350 kg/ha. This low fish production isattributable to the fish spectrum dominated by the small sized planktivores and carnivores.In deep water beels, the annual fish yield fluctuates between 250 and 475 kglha. Thespecies contributing to the fish production are planktivores, detritivores and omnivores.Medium deep beels yield fish at high rates of500 to 1,000 kglha/yr.
Stocking of fast growing major carps influences the production depending on thespecies selection, productivity and stock manipulation. In general, carps perform betterin medium deep beels. The growth rate of Labeo rohita, Catla catla and Cirrhinusmrigala in Bansdaha beel in Burdwan and Haripur beel in Malda ranged between 0.85 kgand 1.00 kg, 1.25 kg and 2.5 kg, and 0.45 kg and 0.60 kg respectively during 1993-94.Annual production from these medium deep beels were 1,000 kg/ha (Bansdaha) and 850kg/ha (Haripur) during the year.
Fishing methods
The fishing methods practised in beels are traditionaL Gill nets, scoop nets, seinenets, encircling nets and lifting nets are deployed depending on the requirements andsuitability of their operation. Hooks and lines are also used for catching large sizedcarnivores. Besides, various types of traps are also used. Gill and lift nets are intenselyoperated in deep and medium deep beels while traps and scoop nets are the principal gearin shallow, weed choked beels.
195-

Management practices
The beel resources of the State are under the control of Revenue Department andare leased out to the fisheries cooperative societies on tenurial basis. Lack of funds andtechnical knowledge are the major constraints in management of beel fisheries of theState. However, efforts made by some cooperative societies for weed control and stockimprovement by introduction of major carp fingerlings, though inadequate andunscientific, ~e helping in increasing production from these systems.
Development strategies
The beel resource of the State is enormous and diverse in ecological characteristics.For proper management, they need to be classified on the basis of ecological andproduction characteristics. Some efforts in this direction have been made by the scientistsof CIFRI which resulted in development of classification criteria and also developmentof management technologies for fish yield optimisation from the beels. However, there isan urgent need to conserve these water bodies and protect them from environmentaldegradation due to anthropogenic activities. Reopening or excavation of the river linkageswherever possible is one of the prime needs. Embankment and sluice construction in theperipheries, besides preventing encroachment for agriculture and urbanisation, wouldrestrain unwanted introduction of silt and organics from the catchment areas.
Water management
Water is amongst the essential prerequisites for agriculture, power generation,urbanisation, industrialisation and many other human activities. Since beel water is usedfor multiple purposes, a holistic management strategy needs to be developed to take careof various water needs.
Resource reclamation
The derelict beels need to be reclaimed gradually although the task is expensiveand time consuming. This effort, besides rejuvenating the ecosystems, will enhance thesurface storing capacity and subsequent recharging of the ground water. Further, thehumus-rich top soil of marshy areas, if spread on agricultural fields, would enhance soilfertility.
196
Weed management
When in excess, the macrophtytes are a menace in beel ecosystems. Besidescontributing to eutrophication, overgrowth of macrophytes competes with planktonicorganisms for nutrition and fishes for space and shelters. Methods of weed control are ofdifferent types like manual, mechanical, chemical and. biological. However, chemicalmethods of weed control is unsafe for large water bodies. The non-biodegradableelements of weedicides get accumulated in biotic components ofthe system. Biologicalmethods like stocking herbivorous species, Ctenopharyngodon idella, are most effectivein controlling submerged (Hydrilla, Najas, Vallisneria, Ceratophyllum, Myriophyllum) andfloating (Lemna, Wolfia, Azol, Pistia) weeds.
Bio-conservation
Fish fauna contributing to the production needs be conserved and reintroducedfrom external sources for rehabilitation of the lost or endangered species. Research onreproductive biology of the endangered species needs to be emphasized. The species likeGadusia chapra, Amblypharyngodon mola are threatened with extinction and need specialcare for conservation.
Stock management
The nutrient storage and recycling through grazing chain of macrophytes,plankton chain, and the detritus chain need to be effectly used for yield optimisation.Moreover, optimum utilisation of food chains would help maintaining an ecologicalbalance in the system. By and large, the detritus food chain remains under-utilised. Thispotential source of energy can be best utilised through stocking of detritivores like C.mrigala, L. calbasu, L. rohita, etc.
In medium deep beel systems, the technique of culture-cum-capture fisherieswould be advisable. Deep beels can be managed for conservation of the fish germplasmby adopting measures like declaration of closed fishing season, selective fishing andenvironmental protection.
Shallow, weed-choked beels are not suitable habitats for multi species capture andculture practices. Taking advantage of their shallow and evenly sloped contour, thesewater resources can be utilised for culture-based fisheries of prawn and fishes. Thispractice, besides utili sing the natural nutrients and food resources, would help ingenerating fund for reclamation of the dwindling beel resources of the State.
197
Summer School on Fisheries Enhancementin small Reservoirs and Floodplain Lakes,CIFRl. Barrackpore. 14July to 12August 1997
Role of fish stock assessment techniques in the managementof small water bodies
S. K. MandaiCentral Inland Capture Fisheries Research Institute
Barrackpore-743101, West Bengal
Primary objective of fish stock assessment
The basic purpose of fish stock assessment is to provide advice on the optimumexploitation of aquatic living resources such as fish and shrimp. Living resources arelimited but renewable, and fish stock assessment may be described as the search for theexploitation level which in the long run gives the maximum yield in weight from thefishery.
Fig 1 illustrates this basic objective of fish stock assessment. On the horizontalaxis is the fishing effort measured, for example, in number of boat days fished. On theother axis is the yield, i.e.the landing in weight. (If the landings consist of different groupsof animals, for example shrimp and finfish, it may be more appropriate to express the yieldin terms of value). It shows that up to a certain level we gain by increasing the fishingeffort, but after that level the renewal of the resource ( the reproduction and the bodygrowth) cannot keep pace with removal caused by fishery, and a further increase inexploitation level leads to a reduction in yield. The fishing effort level which in the longterm gives the highest yield is indicated by F(msy) and the corresponding yield is indicatedby MSY, which stands for Maximum Sustainable Yield. The phrase in the long term isused because one may achieve a high yield in one year by suddenly increasing the effort,but then meagre years will follow, because the resource has been fished down. Normally,we are not aiming at such single years with maximum yield, but a fishing strategy whichgives the highest steady yield year after year.
199

In reservoir fishery, multispecies are exploited by multigears and its assessmentbecomes difficult. Generally, the fish stock assessment is done for each speciesseparately. The results are subsequently pooled into an assessment of a multispeciesfishery. The fish stock assessment includes estimation of population parameters namelygrowth parameters and mortality parameters. The former gives the body size of a fishwhen it reaches certain age and the latter reflects the death created by fishing, calledfishing mortality, and other causes, called natural mortality.
Models
A description of a fishery consists of three basic elements:
(1) the input (the fishing effort, e.g. the number of fishing days)(2) the output (the fish landed)(3) the processes which link input and output (the biological processes and the
fishing operations)
Fish stock assessment aims at these processes, the link between input and outputand the tools used for that are called models. A model is a simplified description of thelinks between input data and output data. It consists of a series of instructions on how toperform calculations and it is constructed on the basis of what we can observe or measure,such as for example fishing effort and landing.
The actual processes which lead from a certain number of days fishing with acertain number of boats to a certain number of fish being landed are extremelycomplicated. However, the basic principles are usually well understood, so that byprocessing the input data by aid of models we can predict the output. .
INPUT -------------> PROCESSES -------------> OUTPUTobservation model observation
A model isa good one if it can predict the output with a reasonable precision.However, since it is a simplification of reality it will rarely be exact.
200
•..
I
"
General procedure of fish stock assessment
INPUT FISHERIES DATA (+ ASSUMPTIONS)I
I
PROCESS: Analysis of historical data
OUTPUT: ESTIMA TED POPULATION PARAMETERS
I" INPUT ESTIMATION OF POPULATION PARAMETERSI
PROCESS: Prediction of yield for a range of alternative exploitation levels ,
IOUTPUT OPTIMUM FISHING LEVEL
MAXIMUM SUSTAINABLE YIELD
There are two groups of fish stock models : holistic models and analytical models.The simple holistic models use fewer population parameters than the analytical models.They consider a fish stock as a homogeneous biomass and do not take into account, forexample, the length or age structure of the stock. The analytical models are based on amore detailed description of the stock and they are more demanding in terms of quality andquantity of the input data. On the other hand, as a compensation, they are also believedto give more reliable predictions.
The type of model to be used depends on the quality and quantity of input data. Ifdata are available for an advanced analytical model, then such model should be used,whilethe simple models should be reserved for situation when data are limited.
Analytical models
The basic idea behind the analytical models may be expressed as follows:
(1) Ifthere are "too few old fish" the stock is overfished and the fishing pressure on thestock should be reduced.
(2) If there are "very many old fish" the stock is underfished and more fish should be caughtin order to maximise the yield.
The analytical models are age structured models working with concepts such asmortality rates and individual body growth rates.
201
",.-'
I\
The basic concept in age structured models is that of a cohort. To put it simply, acohort of fish is a group of fish all of the same age belonging to the same stock. Forexample, a cohort of Catla catla could be all the fish of that species that hatched from Julyto August in 1996 in Rihand reservoir in UP. Suppose there were one million specimensin that cohort. After August 1996 the original one million fish would gradually decreasein number because of deaths to either natural causes or fishing. However, while the numberof survivors of the cohort decreases with time, the average individual body length andbody weight increase.
Fig 2 shows an (hypothetical) example ofthe dynamics of a cohort, in the form ofplots against age of the number of survivors (A), body length (B), body weight (C) andtotal biomass. Curve A shows the decay in the number of survivors as a function of the ageof cohort. Curve B shows how the average body length increases as the cohort grows older.Curve C shows the corresponding body weight, while curve D is a plot of the totalbiomass of the cohort, i.e. the number of survivofs times the average body weight againstthe age of the cohort.
It may be noted that the curve D has a maximum at age AI. Thus, to get the(hypothetical) maximum yield in weight from that cohort, all fish should be caught exactlywhen the cohort has reached age AI. This, of course, is not possible in practice. However,we may say that the goal of fish stock assessment is to manage fisheries in such a way thatthe catches come as close as possible to this theoretical maximum.
The implication is that the fish should neither be caught too young nor too old. Ifthe fish are caught too young there is growth overfishing of the stock.
There are two major elements in describing the dynamics of a cohort;
(1) The average body growth in length and weight(2) The death process
Holistic models
In situations where data are limited, simple holistic models are used. One suchmodel is surplus production model. The model use catch per unit effort as input. The datausually represent a time series of years and usually stem from sampling the commercialfishery. The models are based on the assumption that the biomass of fish in a water bodyis proportional to the catch per unit effort as shown in Fig 3. An estimate is derived fromthe biomass.
202

Role of stock assessment in management of small reservoirs
The problems faced by the management in small water bodies are:
(1) What should be the fishing pressure for reaping maximum harvest, if it is autostocked.
(2) What should be the stocking number, if the water body is not autostocked or requiresstocking.
The above problems may by solved with the help of the models described above.In stock manipulation, the number to be stocked is a function of growth: of fish andmortality.
The number of fish at a point oftime is dependent on age and mortality. IfNI is thenumber of fish at time t and No is the number at time t=O i.e., at birth
N, = N,» -Zt, where Z is the total annual mortality rate.
From the equation it can be derived
N2 = NI e -Z(t2-\ ), where N2 is the number at age t2 (at the time of harvest) and NIis the number at age t\ ( at the time of stocking). .
The total production may be calculated as P = N2xW2 ,W2being the average weight at aget2•
The total number N 1 at age tl which is to be stocked to harvest N2 number at aget2may be put as: NI = (PIW2) x e Z(12-\)
The primary criteria in stocking management in reservoir is to work qut themaximum potentiality of the water body, average weight of the fish to be harvested, theage of fish and total annual mortality rate.
Suggested Readings
Gulland,lA. 1983. Fish Stock Assessment.A Manual of Basic Methods, Vol- 1 - FAOIWILEY Series onFood and Agriculture - John Wiley & Sons.
Sparre, P., E. Ursin and S. C. Venema, 1989. Introduction to tropical fish stock assessment, Part-l - Manual-FAO Fisheries Technical Paper 306/1
203
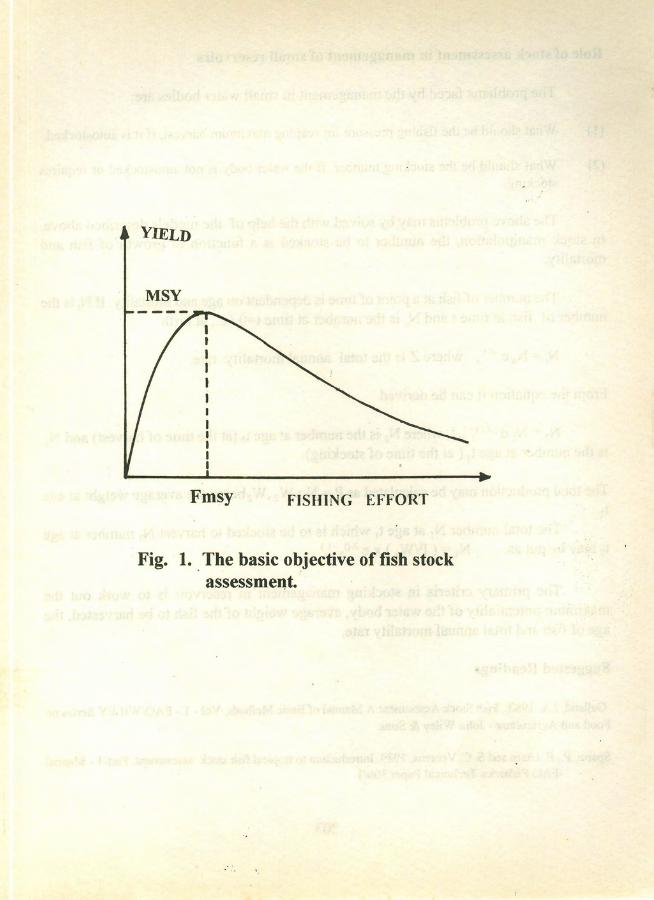
YIELD
MSY
Fmsy FISHING EFFORT
Fig. 1. The basic objective of fish stockassessment,
I
1

~_. ~ ~ ~ =-.•.
~>
Q..
o••
~tJ
!j
=--
=0
a~
-.•••
r') rIJ
(j
Q0
~~
==
0••
r')~
Q =-~
Q :l•
biom
ass
(tonn
es)
body
wei
ght-(
kg)
boby
leng
thn.
ww
=qe
(em
)L
.4:) ••
":' ••
o.~~
t~
o
•••.•-,»
,:~
..'f':;
.
:.'.::\\:'
.:-::..
,9.'
••-•
.'.
:::''::0"
:.:....•
....
....'
..'.~
:::.::\::~;
~.:,:.~
,..:"=
~:';:..\';::'\
~'.'::'
:~~.
'::'
..':
\
num
ber
ofsu
rviv
ors
(thou
sand
s)N
.
l>
c\l
:~.
"-, \
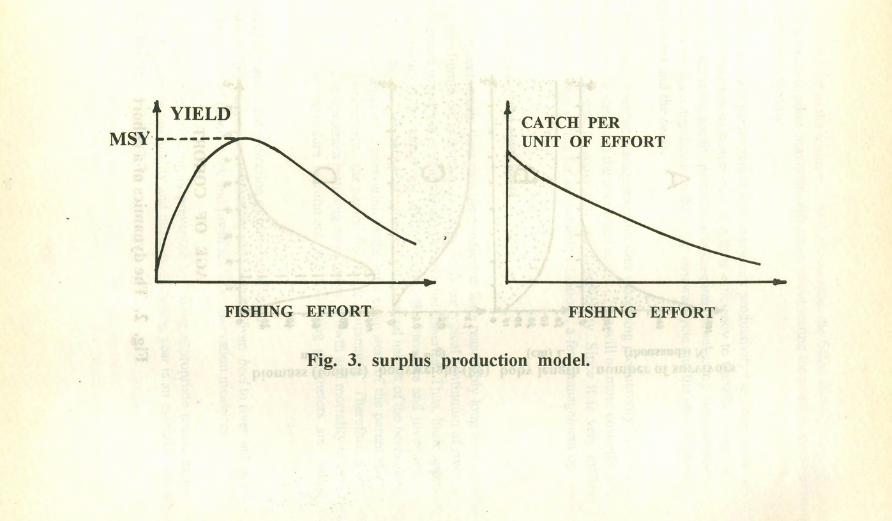
'''~' ••..•...
YIELD CATCH PERUNIT OF EFFORTMSY'
FISHING EFFORT FISHING EFFORT.
Fig. 3. surplus production model.
\
r
Summer School on Fisheries Enhancementill small Reservoirs and Floodplain Lakes,CIFRl, Barrackpore. 14 July to 12 August 1997
Guidelines for ecosystem-oriented fishery managementapplicable to the beels of West Bengal
G. K. VinciCentral Inland Capture Fisheries Research Institute
Barrackpore- 743101, West Bengal
Introduction
Beefs are the natural lakes associated with the lower stretches and coastal plains ofthe Ganga and Brahmaputra. They are biologically sensitive ecosystems playing a vitalrole in the inland fish production of the eastern and northeastern regions of the country.Beefs are a heterogenous group of wetlands which are diverse in origin, water renewalpattern, water and soil quality and fauna and flora. Beels can be typical oxbow lakes,residual flood waters trapped in the floodplains or tectonic depressions. Irrespective oftheir origin, it is the basic habitat variables and biotic communities that determine thesuitability of various management options. Since management options to be adopted forobtaining higher yields depend upon a number of abiotic and biotic parameters it is wellneigh impossible to develop a uniform set of guidelines for beefs.
Criteria for ecosystem-oriented management
Biological productivity of a water body depends primarily on the capacity of thesystem to trap solar energy and store them in the form of chemical energy. The energyconversion efficiency at trophic levels of consumers differs considerably from one waterbody to another, depending on the qualitative and quantitative variations in the bioticcommunities. Any conversion rate above 1% can be considered as good. In an idealsituation, the commercial species share the ecological niches in such a way that trophic
205
resources are utilized to the optimum. At the same time, the fishes should belong to shortfood chain in order to allow maximum efficiency in converting the primary food resourcesinto harvestable materials.
Thus, the basic parameters that abet primary productivity (soil and water quality)and affect composition of community and their efficiency to transfer energy from onetrophic level to the other are the primary considerations in selecting management option.These factors are again dependent on the water renewal cycle and the species spectrum ofthe parent rivers and the beels.
Ecosystem-oriented management implies increasing productivity by utilizing thenatural ecosystem processes to the maximum extent. This will be more cost effective andto do minimum damage to ecosystem and biodiversity. Since it is very difficult toprescribe management norms for all possible situations, a few management options aredescribed below:
Capture fisheries of the open beels
Some beels retain their riverine connection for a reasonably long time which arerelatively free from weed infestations. These beels are typical continuum of rivers wherethe management strategy is essentially akin to riverine fisheries. Thus, basic approach isto allow recruitment by conserving and protecting the brooders and juveniles. Thesemeasures have the dual advantage of conserving the natural habitat of the beels along withextending the benefits of conservation to the lotic ecosystem of the parent stream. Incapture fishery management, the natural fish stock is managed. Therefore, a thoroughinsight of population dynamics including recruitment, growth and mortality is very muchessential. In order to ensure recruitment, the following parameters are taken Intoconsideration.
i) Identification and protection of breeding groundsii) Allow free migration of brooders and juveniles from beel to river and vice versa.iii) Protection of brood stock and juveniles by conservation measures.
The growth overfishing is prevented by taking approppate measures for gearselection. Adjustments in quality and quantity of fishing gear is an essential componentof capture fishery management.
206

Common strategies followed are summarised as are:
i) Increase the minimum mesh size.ii) Increase or decrease the fishing effort.iii) Observe closed season to protect the brooders.iv) Strict adherence of the restrictions on the minimum size at capture.v) Diversity of the gear if required.vi) Selective augmentation of stock,'only if unavoidable.
Culture-based fisheries of the closed beels.'
Management of completely closed beels or those with a very brief period ofconnection with the river is more like small reservoirs. The basic strategy here will bestocking and recapture. Beels are the ideal water bodies for practising culture-basedfisheries for many reasons. Firstly, they are very rich in nutrients and fish food organismswhich enable the stocked fishes to grow faster to support a fishery. Thus, the growth isachieved at a faster rate compared to reservoirs. Secondly, the beels allow higher stockingdensity by virtue oftheir better growth performance and the per hectare yield is quite high.Thirdly, there are no irrigation canals and spillways as in the case of small reservoirs whichcause the stock loss and the lack of effective river connection prevents entry of unwantedstock. The beels also allow stocking of detritivores as the energy transfer takes placethrough the detritus chain.
In a culture-based fishery, the growth is dependent on stocking density and survivalis dependent on size of the stocked fish. The growth varies from one water body to anotherdepending on the water.quality and food availability. The right species stocked in rightnumber, in right size and their recapture at right size are the determining factors. Thesehave to be decided as a part of ecosystem-oriented management. The basic managementstrategies can be summarised as
'..i)ii)iii)iv)v)
. vi)vii)
Size at stockingStocking densityFishing effortSize at captureSpecies managementSelection of speciesSelection of fishing gear
207
I,

Culture and capture systems
There are systems which combine the norms of capture and culture fisheries. Themarginal areas of bee Is are cordoned off for culture systems either as ponds or as pens andthe central portion is left for capture fisheries (Fig. 1). This has been tried in some beelsof Manipur with certain degree of success.
Community metabolism
Community metabolism or the transfer of energy from one trophic level to the othercan be the major criterion for selecting management options especially the speciesselection in culture-based fisheries.
In an ecosystem, the biological output or the production of harvest able organismscan be at various trophic levels. Under a grazing chain, a phytoplankton > zooplankton> minnows> catfishes system or a phytoplankton> zooplankton> fish system prevails.Since no grazing chain of macrophytes> fish exists in beels, macrophytes are invariablychannelled through detritus chain. There are different detritus chains such as macrophytes> detritus > detritivore system, phytoplankton > detritus > benthos > bottom feederssystem and macrophytes > associatedfauna > air breathing fish system.
Two typical systems generally found in the closed and open beels of West Bengalare depicted in Fig 2 and 3. In both the cases, the birds are at the apex of the food chain.In Bandardaha, most of the energy are transferred through phytoplankton> zooplankton> planktophagous >predatory fish chain. This is more or less the case with most of theopen beels. In sharp contrast, Beloon beel has a macrophyte based food chain withdominance of fish feeding on weed associated fauna or detritus. The management normsin both cases should aim at correcting the fish species spectrum with the above food chainm VIew.
Fishery options
i) Fishery based on Indian major carps
The beels, especially the closed ones can be developed as big ponds as their fishery.solely depends on stocking with IMe. Although not done in a scientific way the beels arebeing stocked regularly. In the absence of natural recruitment, stocking witheconomically important species form the best management option.
208
ii) Fishery based on indigenous fishes
In many ofthe beels the indigenous fish form a substantial share ofthe catch whichfetch good price also in the local market. It is not necessary to develop all beels as carp-based fisheries. Amblypharyngodon mola, Puntius sophore, Gadusia chapra, and anumber of air breathing fishes etc. can also sustain economic fishery. Low yield rates canbe compensated with the high price those fishes fetch. This practice will prevent thecompartmentalization of beels and their conversion into ponds.
iii) Fishery based on pen and cage culture
Many of the beels are not productive and it is not practical to fertilize the wholeopen water area. Therefore a manageable part of the water body can be cordoned off tostock choice species. Pen and cage culture practices are the perfect management optionsfor the weed-choked and the unproductive beels. This solves the problems created by gearrestrictions and catchability.
Conclusion
Beels also can be part of an integrated system including navigation, bird sanctuary,post harvest, aquaculture and open water fisheries. A proposed scheme for Beloon beel inMurshidabad district, West Bengal has been shown as an example (Fig .4). This plan isa part of holistic development ofthe wetland which can benefit the local people and helpretaining the biodiversity of the beel and its environment. It is proposed that the deepnorthern part of the lake can be retained in its natural state to conserve aquaticcommunities and fish populations. This will act as a reservoir for irrigation, and capturefisheries. The periphery of the swampy southern sector of the beel could be converted intoaquaculture ponds/pens leaving the middle portion ofthis sector as bird sanctuary.
***********
209
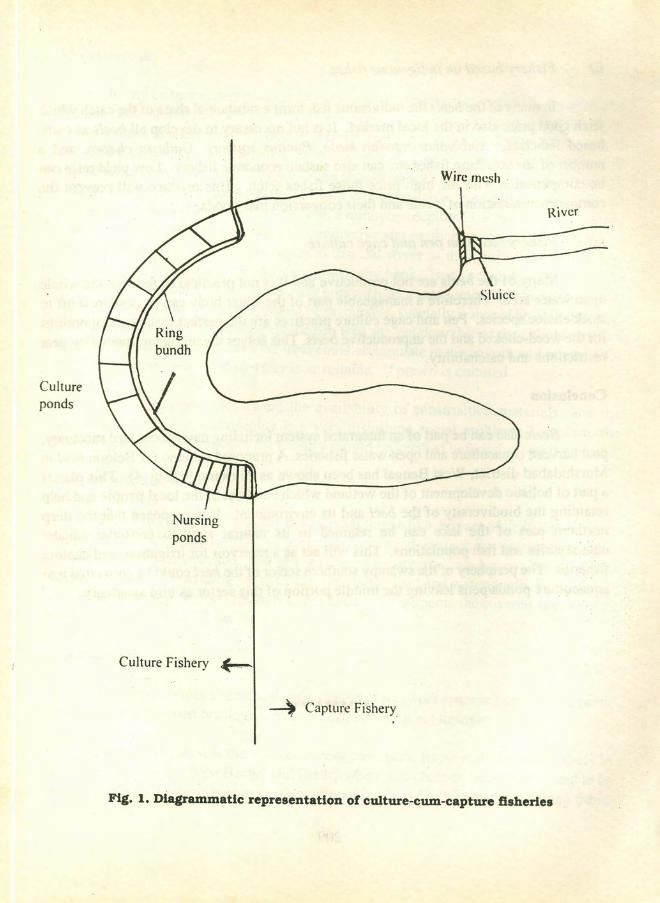
Cultureponds
Wire mesh
River
Nursingponds
4 Capture Fishery
Culture Fishery .f--.
Fig. 1. Diagrammatic representation of culture-cum-capture fisheries
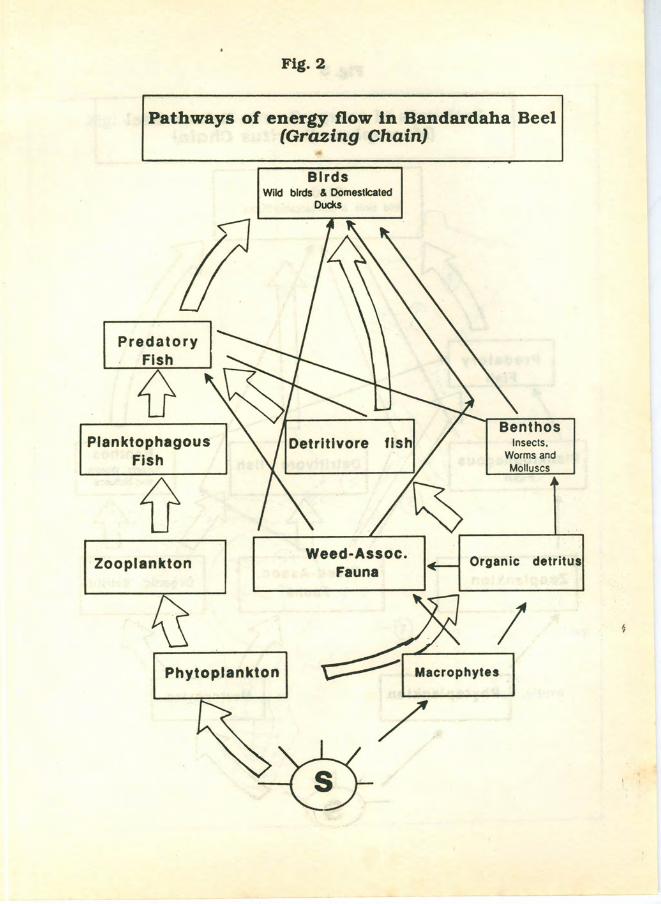
Fig. 2
Pathways of energy flow in Bandardaha Beel(Grazing Chain)
BirdsWild birds & Domesticated
Ducks
PredatoryFish
PlanktophagousFish
Insects,Worms andMolluscs
Weed-Assoc.Fauna
Organic detrltusZooplankton
IPhytoplankton
/
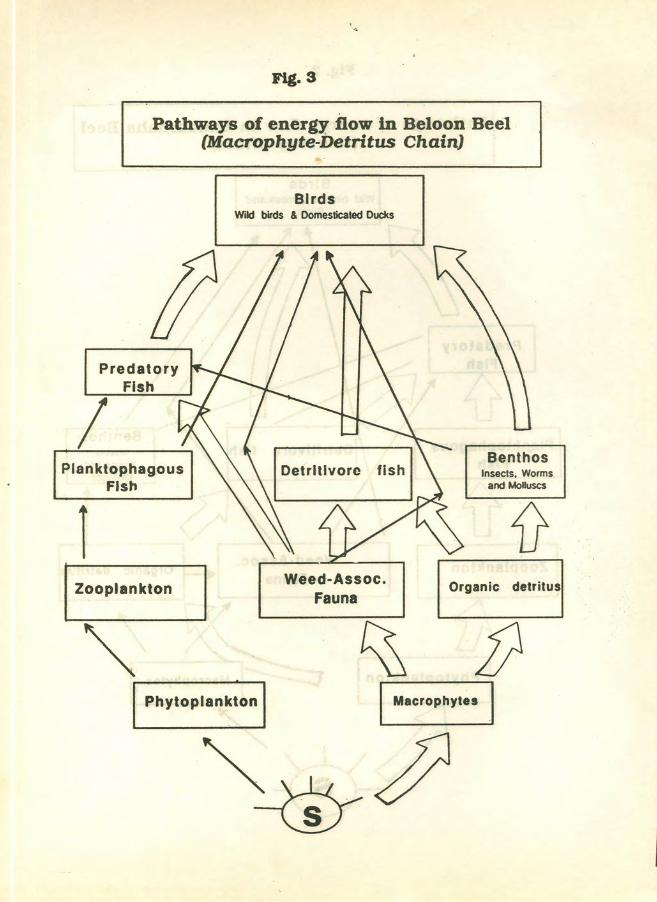
Fig. 3
Pathways of energy flow in Beloon Beel(Macrophyte-Detritus Chain) .
BirdsWild birds & Domesticated Ducks
/Benthos
Insects. Wormsand Molluscs
PlanktophagousFish
1Zooplankton
Weed-Assoc.Fauna
Organic detritus
Phytoplankton
j)Macrophytes

1. Aquaculture
® 2. BirdsI3. Capture Fishery
I 4. Birds5. Dyke
CD 6. Sluice7. Agriculture .-
Fig. 4 Integrated development of Beloon beel
_._---_._------------------'
N
t
../'

Summer School on Fisheries Enhancementin small Reservoirs and Floodplain Lakes,CIFRI. Barrackpore. 14Julv to 12August 1997
Pen culture, an effective tool for yield optimisation in thefloodplain lakes of West Bengal and Assam
G. K. Vinci and Krishna MitraCentral Inland Capture Fisheries Research Institute
Barrackpore- 743101 , West Bengal
Introduction
Throughout the world, floodplains and the wetlands associated with them are asource ofliving for humans. India has more than 200,000 ha of riverine wetlands locallyknown as mauns, chaurs, beels, jheels and pats along the Ganga and Brahmaputra riverbasins. Extensive flood control measures and irrigation works have reduced the fishproduction levels of many of these wetlands through siltation, habitat destruction andheavy weed infestation. The present level of yield from floodplain wetlands is very low(100-200 kg/ha/yr) but studies on these ecosystems point to a production potential rangingfrom 1,000 to 2,000 kg/ha/yr, They also provide ideal habitat for pen and cage cultureoperations ..
As a management measure, especially in the weed choked beels, culture of fishesand prawns in pen enclosures has drawn much attention in the recent past. Pen cultureoffers scope for utilizing all available water resources, optimal utilization of fish foodorganisms for growth and complete harvest ofthe stock. Pen structures may be of varyingshapes and sizes. Since these artificial enclosures are to be kept undisturbed during theculture period, their protection against external forces must be taken care at the time ofinstallation. The following aspects are to be taken into consideration before penconstruction:
211

Site selection
In any culture experiment, site selection is an important aspect. Ideal environmentis an essential prerequisite for pen culture which decide the economic viability and successof the venture to a large extent. Before constructing a pen, a detailed engineering surveyshould be undertaken with special emphasis on the kind of terrain and the nature ofsurrounding catchment area. The shoreline should be with a gentle gradient. For prawnculture, sandy-loamy or sandy-clayey bottom is more suitable than clayey soils. The sitefor pen installation should be shallow with a minimum depth of 1.0 to 2.0 m. Low depthhelps in keeping the pen area hygienic, productive and easily manageable. However, toolow a depth, say less than 1 m, leads to thermal stress to the stocked animals duringsummer months. The site should be towards the bank. This not only cut~ down theconstruction cost but also allows an easy approach for management and harvesting. The I
water stead and shore characters should be favourable, specially it should be pollution free. ~A large number of trees overhanging the pen area are not desirable as they could obstructlight and the leaves falling from the trees could accumulate in the bottom and release CO2
through decomposing. Turbid water is unsuitable, if prawn is cultured.
Other important factors are the availability of construction materials and theaccessibility to the site. Poaching is a very disturbing social problem. Therefore, theprevailing social atmosphere of the locality should be verified before the site is selected.
Pen size and design
Direct loadings (self weight) and external forces like impact of drift logs, aquaticvegetation, fouling organisms, mud accumulation, wind, surface waves: turbulence etc.can destroy the pen structure. The pen may be of square, rectangular, oval or elongated'horseshoe shaped depending on the nature of shore, land and water depth. Pen height>2 m needs special protection measures. For better management, the covered area shouldvary between 0.1 and 0.2 ha.
Pen materials
The pen structure consists of main support, framework spanning over the supports,horizontal and inclined bracings, stays and fish retaining net linings.
Frame: Bamboo is the most commonly available frame material particularly inthe states like Assam, West Bengal and Bihar, where it is cheaper. Bamboo is found to bemost suitable for beels, mauns or shallow impoundments. The bamboo for making frame
212

should be of 6" to 8" in diameter and 30' or more in length. Depending on availability, logscan be used as a replacement of bamboo poles. Galvanised iron pipe frame also can beused with iron net, for durability and rigidity of the structure. However, the costeffectiveness of these materials is to be worked out before selecting them for penconstruction.
Screen: Pen screens may be of varying sizes according to the requirements. Splitbamboo or canes with smooth surface with sufficient length are preferred as screenmaterials. Iron mesh also can be used, though very costly. Considering their durability,synthetic nets are the most suitable pen materials if the chances of damage by variousbiotic agents and logs could be controlled. They are very popular in countries like thePhilippines, Thailand, Indonesia, etc. Coir ropes or synthetic threads are the best weavingmaterials. The mesh size ofthe screen is decided on the basis of initial size of the stockingmaterials.
Net lining: Provision oflining the frame with net is necessary to protect unwantedentry and exist of organisms. Nylon nets are used for this purpose. The nets should becleaned periodically for facilitating water exchange and aeration inside the pen area.
Pen preparation
Most of the wetlands are thickly infested with macrovegetation and unwantedfauna. The pen area must be cleaned before stocking.
Deweeding: Besides consuming the nutrients from the water body, excessive growth ofaquatic vegetation poses serious problems like upsetting the oxygen balance, creatingobstruction for light penetration, movement of stocked animals and in netting operations.The aquatic weed control could be done in four different ways, viz. (a) manual, (b)mechanical, c) chemical and (d) biological. Among these, manual method isrecommended in pens as it is cheap, easy and efficient.
.../
Eradication of unwanted fauna: Complete eradication of unwanted organismsfrom the pen before stocking is very important. While weed fishes compete with thecultured species for food, space and oxygen, predators prey upon the stocked young ones.Repeated netting is the best method for eradication of fishes from the pens. This also helpsin removing other unwanted biotic communities like molluscs, insects etc. which couldinterfere with the management processes affecting production. Poisoning the pen area toeradicate the unwanted biotic communities is not advisable in pen culture.
213
I;

Liming: Liming the water hastens mineralisation of organic matter and helps inmaintaining the environment hygienic. Use of quick lime @ 400-500 kg/ha pen area isrecommended with initial dose @ 200-300 kg/ha followed by monthly instalments @ 50-75 kg/ha.
Pen management
Water: The success of pen culture is largely dependent on the productivity andecological suitability of water. The average depth of water in the pen is to be maintainedfor better production. This depends generally on various factors like rainfall and waterabstraction for irrigation. Generally, pen culture period excludes the monsoon season toavoid the problems of flood. Extreme summer is equally bad for pen culture as the waterlevel recedes drastically because of high rate of evaporation and water lifting for irrigationpurposes. During summer, the temperature inside the pen shoots up and the resultantthermal stress is detrimental to the stocked fish/prawn. A water temperature range of 30to 36°C is ideal for faster growth of the cultured animals. Other desirable parameters aredissolved oxygen (4-8 mg/l), CO2 (1-2 mg/l), alkalinity (50-150 rrig/l), pH (7.0-8.0) andmoderate nutrient contents (N-2.0 mg/l and P - 1.5 mg/l).
Soil: The bed soil should be sandy-clayey. The detritus load between 50 and 70g/rrr' and organic matter between.I-Z'zs are ideal for better production. Very high organiccontent of bed soil results in anaerobic condition at the bottom which is detrimental to thebottom dwellers, especially prawns.
Species selection: Species belonging to the groups planktophagous, detritivoresand bottom feeders are the most suitable for pen farming. However, phytophagous speciescan also be introduced to keep weeds under control. In pen culture, the combination ofindigenous and exotic carps with giant freshwater prawn has proved to be successfulHowever, from economic point of view, mono culture of giant freshwater prawn is moreprofitable. The suitable species for mixed culture of carps are catla, silver carp, rohu andmrigal. Under mixed culture of carps and prawn, catla, silver carp, rohu and M.rosenbergii can be considered. In mono culture, the prawns grow faster with a highersurvival rate, compared to their culture along with carps.,
Species ratio: Species ratio is fixed on the basis of available food in theenvironment, depth ofthe water body, seed availability, etc. In exclusive carp culture, thesuggested ratio of fish species is given below:

Surface feeder (Catla catla, 20%)(Silver carp, 15%)
35%
Column feeder (Labeo rohita) 20%
Bottom feeder (Cirrhinus mrigalay 45%
The bottom slot of C. Mrigala can be replaced with prawn in the mixed culture.
Stocking size and rate: It is generally advisable to stock larger fingerlings (100-150 mm) for better survival in carp culture. Stocking size of prawn juveniles is muchsmaller between 65- 70 mm.
Rate of stocking is fixed on the basis of the carrying capacity of the pen. Inmono culture of carps, the recommended density ranges from 4,000 to 5,000 /ha. While inmixed culture, the density of carp and prawn could be 3,000-4,000/ha and 1,000-2,000/harespectively, in mono culture of prawn stocking density could go as high as 30,000-40,000/ha.
Culture frequency: Pen farming could be done round the year, but it is advisableto avoid monsoon months. IThe culture period for prawns is about 4-6 months. Thus, twocrops could be raised per tear per pen. .
I
Supplementary feeding: Since the objective of pen farming is to utilize naturalproductivity ofthe water body, role of supplementary feeding is marginal except for theprawn which needs highly proteinous diet for their growth. The prawn is fed once @2-5%of their body weight during evening hours depending on the availability of natural food.The supplementary feeding may be done with commercially available pelletised feed orlocally made mixture of animal protein with carbohydrate and fat. Cockle flesh and fishmeal are well known sources of animal protein. Feeding in trays saves loss of feed andthereby reduces the cost of production.
Precautions
Although pen culture paves the way for augmenting production and provideseconomic benefits, many potential social and environmental problems can crop up. Rapidgrowth of pen culture, impervious to environmental concerns can lead to disastrousconsequences as happened in the Laguna de Bay in the Philippines. Rapid and haphaz: rddevelopment of fish pens, converted the Laguna lake from a lucrative fishery into a battery
215
of pens reducing the open water fishing area. This also caused unemployment fortraditional fishers. Supplementary feeding of the stocked fish in the pen can lead toeutrophication of the lake very fast. Therefore, pen farming, though considered as verylucrative, should be practised in a balanced way as part of an overall management planfor small water bodies.
Planning criteria
Before lanching any large-scale pen culture drive, it is necessary to conduct asurvey of the resources with a view to selecting suitable sites after taking allenvironmental, social and economic aspects into consideration. It is also necessary toestimate the carrying capacity of each water body selected, so that its maximum pen areacan be determined. This is essential to avoid Laguna de,Bay type debacles. Moreover, thesocio-economic impact of such measures needs to be determined. Conversion of openwater fisheries into pen enclosures can change the pattern of employment generation,distribution of income and an array of other socio-economic parameters which need acareful consideration. If the present crisis in coastal aquaculture is any guide, theenvironmental and socio-economic impact assessment is an essential pre-requisite foradopting pen culture in large scale.
Suggested reading
Jayamaha, D. E. S. 1979. Cage and pen culture in Sri Lanka. In International Workshopon pen and cage culture offish, 11-12 Feb., 1979, Philippines, IDRC and
SEAFDEC,121-113.
Marichamy, R. 1979. Culture of fishes in cages and pens along the coastal waters of India.Ibid: 41-44.
Sunday, J. Ikotun and Olawale Omoloyin, 1979. Aquaculture and prospects of cage andpen culture in Nigeria., Ibid., 97-983.
**************
216
,
I
Summer School on Fisheries Enhancementin small Reservoirs and Floodplain Lakes,CIFRI. Barrackpore. 14July to 12August 1997
Fisheries of small reseroirs in India - General guidelinesfor management
V. v. SugunanCentral Inland Capture Fisheries Research Institute
Barrackpore-743101, West Bengal
Introduction
The small irrigation rservoirs, constructed on small intermittent water courses,serve to capture the surface runoff for its abstraction during seasonal irrigation demands.Built for the primary purposes of irrigation and soil and water conservation, many of themhave multiple uses. Experience has revealed that these water bodies offer immense scopefor various kinds of enhancements leading to higher productivity and income generationfor the local communities. They can undoubtedly contribute significantly to country'sinland fish production, ifmanaged scientifically. Small reservoirs of the country whichspread over nearly 1.5 million ha form one of the most important inland fisheries resourcesof the country on account of the large resource size and the huge untapped productionpotential. They have the advantage of enabling quick hike in production due to their smallsize and easy maneuverabilitty of fish stocks. The available technologies offer possibilitiesfor achieving production levels of 100 to 200 kg/ha although the national yield is about 50kglha. By virtue of their unmistakable role in promoting fisheries development throughmass participation of local communities, the small reservoirs, therefore, assume specialsignificance. For definitions and classification, please refer to Sugunan (1997).
217
Ecology and production Ilrocesses
Unlike the natural impoundments which are formed when water is retained indeperessions, reservoirs. are built by constructing dams across streams of rivers.Embankments of most reservoirs are earthen. Water sources are surface runoff, diversionsfrom streams of rivers, or wells. While natural impoundments typically have no means ofcontrolling inflow or outflow, man-made impoundments generally have a spillway or drainand may have structures for regulating flow such as diversion ditches and standpipes.
Determinants of productivity
The objective of fishery management in small reservoirs is to regulate fishproduction to achieve sustained yields of harvestable size fish. The fish yield in smallreservoirs is partly a function of abiotic and biotic factors influencing the productivity ofthe aquatic system. The degree of management that can be imposed upon these factorsdetermines the intensity of operations.
Abiotic habitat variables
Abiotic factors are independent variables over which the fishery manager has littlecontrol. They relate to the geographical location and micro-climate of the impoundment.'Included are temperature as a function of eleration and latitude, precipitation and waterand soil chemistry. Biological productivity of'a biotope is influenced by climatic, edaphicand morphometric features. The geographic location affects the metabolism of a reservoirthrough temperature regime, nutrition supply, shape of basin and the efficiency with whichthe climatic factors are able to act in the dynamic exchange. They all have varying effectson final productivity.
Area, mean depth and regularity of shoreline are the most significant morphometricmeasurements having a significant bearing on the productivity of a reservoir. The extentof drainage area, its rate of erosion and runoff are important in limiting the supply ofnutrients to the lake.
The chemical comosition of water varies considerably among regions. Severalindices are used as indicators of water chemistry. The complete array of ions in a water·sample is measured as total dissolved solids. In impoundments, alkalinity and pH arelinked through photosynthesis. These parameters affect the amount of carbon dioxideavailable for photosynthesis and subsequent fish production. Relative concentrations ofdissolved carbon dioxide, carbonate, and bicarbonate depend on pH. The pH fluctuates
218

during the day as photosynthesis increases with increasing sunlight. Another importantwater quality variable is dissolved oxygen. Oxygen dissolved in water is used forrespiration by fish and other aquatic organisms. The quantity of oxygen that can dissolvein water is a function of temperature and elevation. Oxygen is more soluble at lowertemperaturs and elevations. Tolerance to low levels of dissolved oxygen is speciesdependent. However, many fish exhibit slow growth when oxygen levels fall below 5 mg/lfor extended periods.
The chemical properties of water in reservoirs are a reflection of the properties ofbottom soil of the lake bottom or the catchment. When oxygen supply falls short in mudlayers which are not well aerated, the decomposition of organic matter becomes slow. Thislow accumulation of products of decomposition and the presence of partially oxidizedcompounds and short chain fatty acids make the soil strongly acidic. The bacterial actionis reduced and productivity lowered. pH also influences transformation of solublephosphates and controls the absorption and release of essential nutrients at soil waterinterface. A slightly alkaline soil (PH 7.5) has been considered optimal for fish production.Productive soils range mostly between slightly alkaline to slightly acidic (7.5-6.5) inreaction. Range of physico-chemical parameters and their significance in productivity areshown in Table 1.
Organic matter in reservoir ecosystem comes from both within (autochthonous) andoutside (allochthonous) sources. Primary production by the photosynthetic phytoplankton,the base of food chain, is the major autochthonous source of organic production. Theallochthonous nutrients, that come along with runofffrom the ~atershed and inflow aremore significannt both qualitatively and quantitatively.
Biotic communities
Biotic factors are frequently dependent variables which can be manged for fisheryimprovement. To enhance fish yield.it is important to understand how these factors affectaquatic production. Basic productivity of the reservoir is dependent on the amount of solarenergy available and the efficiency of the system to transform it into chemical energy.Besides, the energy conversion efficiency at trophic levels of consumers differsconsiderably from one reservoir to another, depending on the qualitative and quantitativevariations in the biotic communities. Any conversion rate above 1% can be considered asgood. In an ideal situation, the commercial species share the ecological niches in such away that trophic resources are utilised to the-optimum. At the same time, the fishes shouldbelong to short food chain in order to allow maximum efficiency in converting the primaryfood resources into harvestable materials. But in reservoirs, such conditions seldom
219
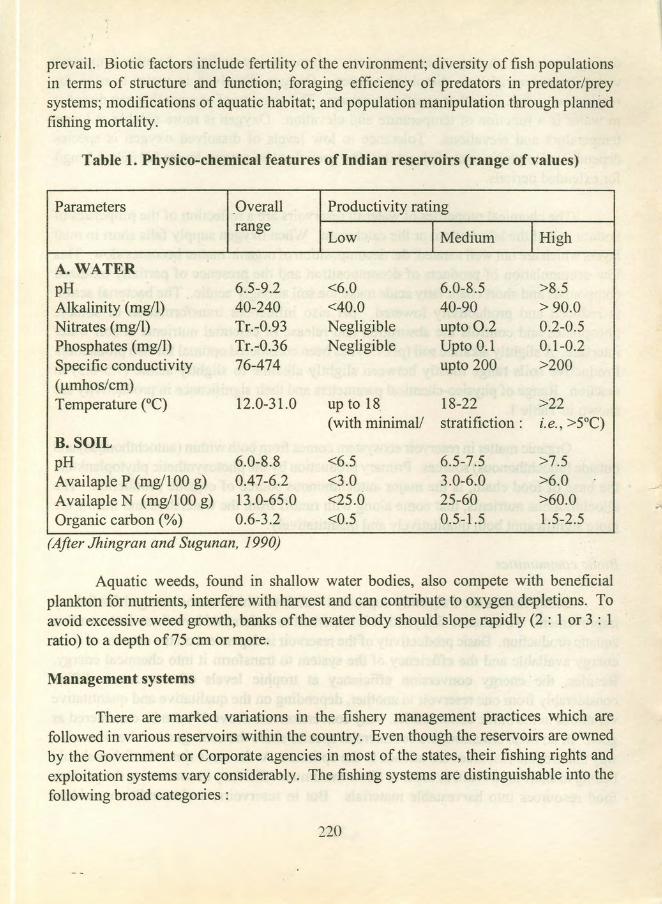
prevail. Biotic factors include fertility of the environment; diversity of fish populationsin terms of structure and function; foraging efficiency of predators in predator/preysystems; modifications of aquatic habitat; and population manipulation through plannedfishing mortality.
Table 1. Physico-chemical features ofIndian reservoirs (range of values)
Parameters Overall Productivity ratingrange
Low I Medium I High
A. WATERpH 6.5-9.2 <6.0 6.0-8.5 >8.5Alkalinity (mg/l) 40-240 <40.0 40-90 >90.0Nitrates (mg/l) Tr.-0.93 Negligible upto 0.2 0.2-0.5Phosphates (mg/l) Tr.-0.36 Negligible Upto 0.1 0.1-0.2Specific conductivity 76-474 upto 200 >200(umhos/cm)Temperature eC) 12.0-31.0 up to 18 18-22 >22
(with minimall strati fiction : i.e., >5°C)B. SOILpH 6.0-8.8 <6.5 6.5-7.5 >7.5Availaple P (mg/100 g) 0.47-6.2 <3.0 3.0-6.0 >6.0Availaple N (mg/100 g) 13.0-65.0 <25.0 25-60 >60.0Organic carbon (%) 0.6-3.2 <0.5 0.5-1.5 1.5-2.5
(After Jhingran and Sugunan, 1990)
Aquatic weeds, found in shallow water bodies, also compete with beneficialplankton for nutrients, interfere with harvest and can contribute to oxygen depletions. Toavoid excessive weed growth, banks of the water body should slope rapidly (2 : 1 or 3 : 1ratio) to a depth of75 em or more.
Management systems
There are marked variations in the fishery management practices which arefollowed in various reservoirs within the country. Even though the reservoirs are ownedby the Government or Corporate agencies in most of the states, their fishing rights andexploitation systems vary considerably. The fishing systems are distinguishable into thefollowing broad categories:
220
....••.

a) Privately owned and managed reservoirs OSrH'}lfI .rbn.!lb) Public water bodiesC} , c t COrmp.J\llUM \\51}~<idf~o,<,t~e,sJm(K)'::JfUO bns 2""ioV1,)201 HSI1f2 erlr Io l(inoLsMd) t,> I rjWl!ts:.li-9.Q<.ij~Sfl1l:a!l.;:g~<tPY1!lWGg,VY11WleJ1tb52BCJ-";IUHu:l or oldsnerrrs (II ~nrreaae
r, '" '1~Ho"IJlvlno beve. ,J':; ')d nso f' ~rf rt'J)ft L '.( I 'tr9.JI.) l-"f~/'lrtw . ,tTAfter a::~~!1!tin)';;gf1tb.er.y~ou~·m@ag~m~n,trpf:a~ti~e§:feHQw@diiIlrth~country, inis
difficult to Jl!i~~<:;t<t9m1jl1QSdl~deIlyjRgsp}.tit_of.the ~9mmon prcperty.porm -Majority ofIndian reservoirs i'!£~i:P}t9HC(pt:.<i>p',erties,w:Q.e,r~~om·~.fi?\~gl1\lmp~rof JjGeI\s~dfishers.make,their living, The exceptions are the small reservoirs in some states like Kamataka andUttar Pradesh, which are auctioned to 'private individuals onnan annual .basis;Technological support in the form of management practices either received low priorityqr it has. been
uQYct?-l{l9Qkedall~g~t!1eJ'i~ (.far as.small [resyrv;~ir 'fish~ri,~cin( India are
concerned. .I l'ht!il tr~~plt«.cJ~in~~pNtfratyistocking l·and_non-adherance: to' .sound, .stock,manageme.q.tngli!J1s le,~giq.g~tQ!QW::..PI.Q!1l;J.§tic\l'ityl~iTt'}:g£IlGat '{15rf211 1ro\n)c~n at 2:..JldWFfl
"~I r <'Il! '10 )01;> rJ2"! 'cnigr-o ern j. t nernqq» errrooed bsrl JI .eouroeer (J'" {~n H
Assessment of-y'jel~.pqteQtial lo nOijJ>Jfl:wrguf .'{1~rlGrlb noqqna j imbiYlu '11 '::B rI () ,r-i." :. ') '1 Fl{ot ~ ". '" )[It '. t, J J 0 rJ2 'f Je1 r- n., , 11c~. (T
Several methods are iIl~o,mt~ tq,as~~s~ithe fishery p"ote~ti~lof.small reservoirs byderi ving ~qu'ltion~dJ.fls~d:9n.~r~il,~~1'~ c<MGhm~n~a;r~~ap.<J,th~ch~micakp'Ci!fatneters,Q~ •
soil, and water I;~~yr;jWPJPjIQ,~edalilhicriJ!q~NkM:eI)·ltas,~x.oJyiStdY.tr~.attemp;t !~;'€om~it}g'the morphometric.as w,~ILascheIJ1i.Y~I(p(lfaqIJ1t~J[s,,~~lat~onspjp~fleD¥~~DM.eI~~d ~.al.ehare assumed characteristic for sets of lakes that possessa certain number of limnologicalconditions. A mgrpl;l,o-~~~p.hjc,'n9~x.e§~:~C[£) d ::l21'51:){I. e' I. .hsrne J"q~_
-Spe'cifi'c1 tonuucti.tViijr farhiWos/cm) .LJ1·)otcn~brr[Jnis net '{lJ:ru 00, jrij 10 2') ibodMEI == 'i" ''1<'- JJM! tn5ffUr','V.),) ~d 1 .'{1I2JJur' :m.dliJOE. •.lpB begsnsm vtersvrrq Jrfj OJ2eo~
l Mearedepth (mh· "f b UO? 2'l:qV1~-~ oilduc or! 10012 or I(i • dI<::[/ cr ~n '3[1.
has been set for African lakes (Henderson and Welcome 1974), Fish yield potential iscalculated from the MEI as : \ ~ , oj
Asian reservoirs are known to -have-a lower yield potential., However, till-an Indianformula is derived, this formula can be applied to obtain a rough indication of theproductivity of any reservoir within the limits between one half and twice the estimate,
22\

Enchancement
Majority of the small reservoirs and other community water bodies in India areessentially amenable to culture-based fisheries and there is a general consensus that anysignificant improvement in yield from them can be achieved only through some sort ofenhancement activities. The common modes of enhancement which are relevant to inlandwater bodies in India are management enhancement, stock enhancement, speciesenhancement and environmental enhancement (more details in Sugunan, 1997).
Stock enhancement
Stocking ofreservoirs with fingerlings of economically important fast-growingspecies to colonize all the diverse niches of the biotope is one of the necessary pre-requisites in reservoir fishery management. Ever since the reservoirs were considered asa fishery resource, it had become apparent that the original fish stock of the parent riverwas insufficient to support a fishery. Augmentation of the stock was also necessary toprevent the unwanted fish to utilize the available food niches and flourish at the cost ofeconomically important species. The policies and guidelines on the subject are oftenerratic and even arbitrary. A proper stocking strategy needs evaluation of an array offactors viz., the biogenic capacity of the environment, the growth rate of the desiredspecies and the population density as regulated by predatory and competitive pressures.
Despite a remarkable increase in carp seed production in India, the open waterbodies of the country remain understocked, as all the seed produced in the private sectorgoes to the privately managed aquaculture industry. The Government hatcheries that havethe responsibility to stock the public reservoirs could never produce fmgerlings in therequired number.
Selection of species for stocking
The basic principles to be followed in selecting a species to be stocked are:
1. The planted species should find the environment suitable for maintenance, growthand reproduction.
2. It should be quick growing and efficient in food conversion.
3. Herbivorous fishes with shorter food chain are more productive and hence energy-effective.
222
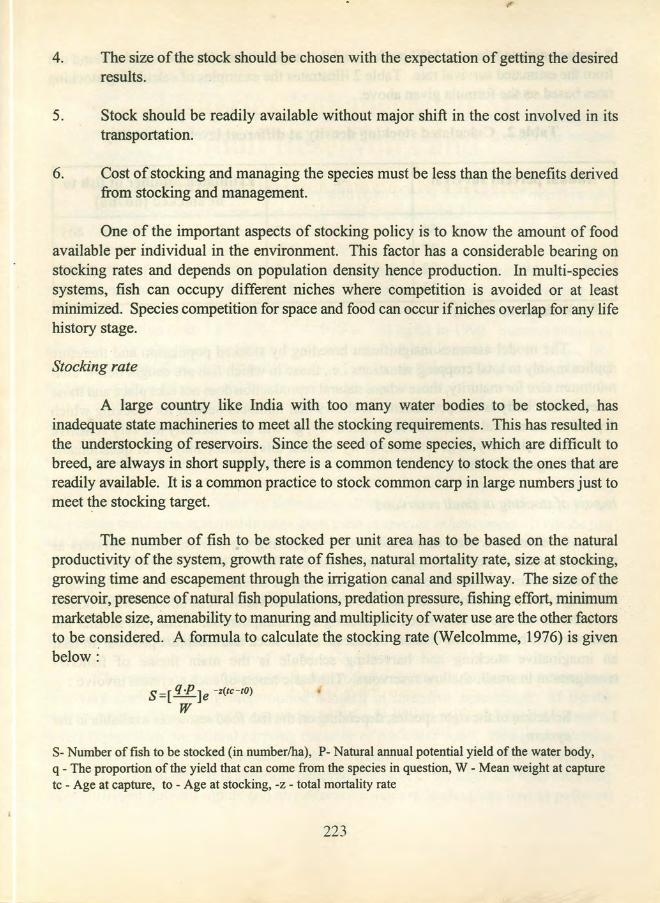
·.
4. The size of the stock should be chosen with the expectation of getting the desiredresults.
5. Stock should be readily available without major shift in the cost involved in itstransportation.
6. Cost of stocking and managing the species must be less than the benefits derivedfrom stocking and management.
One of the important aspects of stocking policy is to know the amount of foodavailable per individual in the environment. This factor has a considerable bearing onstocking rates and depends on population density hence production. In multi-speciessystems, fish can occupy different niches where competition is avoided or at leastminimized. Species competition for space and food can occur if niches overlap for any lifehistory stage.
Stocking rate
A large country like India with too many water bodies to be stocked, hasinadequate state machineries to meet all the stocking requirements. This has resulted inthe understocking of reservoirs. Since the seed of some species, which are difficult tobreed, are always in short supply, there is a common tendency to stock the ones that arereadily available. It is a common practice to stock common carp in large numbers just tomeet the stocking target.
The number of fish to be stocked per unit area has to be based on the naturalproductivity of the system, growth rate of fishes, natural mortality rate, size at stocking,growing time and escapement through the irrigation canal and spillway. The size of thereservoir, presence of natural fish populations, predation pressure, fishing effort, minimummarketable size, amenability to manuring and multiplicity of water use are the other factorsto be considered. A formula to calculate the stocking rate (We1colmme, 1976) is givenbelow:
s=[ q ·p]e -z(tc-tO)
W
s- Number offish to be stocked (in numberlha), P- Natural annual potential yield of the water body,q - The proportion of the yield that can come from the species in question, W - Mean weight at capturetc - Age at capture, to - Age at stocking, -z - total mortality rate
223

I~ g~ be,~sMmat~d "t!u;:ough):MElJT:lethod anchthe.taIilgeJbimortality];ates can: be.found outfrom the estimated survival rate. Table 2 illustrates the examples of calculating stockingrates based on the formula given above.
ari rn 05v[o'mi 1;:.0:)em rr; ftirf2·10lfE ....' nrorinw eldslisvs vlibser ed bluori2)'Jf)j7Table 2. Calculated stocking density at different levelrofimortality,
'00110 IfIliOITI£erlr 'ilonA 0.60; .oiloq aflIA:lola1oO::i7)" 26 msnoqmi orh 'Io ~nl) 405,0 nnirc d eldmebianoo "' 23ff 'f )1J£1 errff JfJ;;;;rent):{il r re erh ni Isubivibni 1:'0 "ji( "'TJ91.,;)i;:3q2-i1ImfI CI .rroiro rbu1Z2c mod '(lianob rro-rs '51 q r.o abneqeb bns:s G~1fr, 2,0002f~ I ,3 10 D,,::bjOI 2 tJl1iBcptu') :;H;}riW 2~li:..i,e~··!:11IiL '(qiJOOO fiB:) fl~rl ~5,500i:
:€.Atft~ ~We1cl@IfzIrne,Bt9:]()91i1iJOOOIIS:) boot ens $)£q2 lot nouueqrnoo G:;)IJ:Jq~.';):gb.J~ ",';2f1
The model assumes insignificant breeding by stocked population and thereforeapplies mainly to total cropping situations i.e., those in which fish are caugfit beIbw'tn~lrminimum size for maturity, those whose natural reproduction does not take place and thosewlierb.::watel' boI:iY'cis~R(Jtqfermanen'r.{1Jl 'shbwsr'~hat flhIfiber~ iileedeC¥%r ~st0ckifig whichd- h ti'...1, '1.""1 !'T' 1'" A"'''J-i ~Xf"'Ii<">..~ti}.lr r,o f"l!8 tr,;Hi:fi ot:4~ n;'''·l'!lhf,TI Co 1~t2. G,t· d'·, ("P!,iepe \ll,:onhili natura ·<00n:\!l>~thj1i:S)1!I ~roa vt-l¥l1!y, 'srdwl ' anl.rrll0Tra ny are very ensrtrveto ~ ODU0 t01 tlre,v~ry<F:ft.g@[ifum~~Fslof!.ftYGne~tiefl!~HhsfJifrC'tiwmlfy$e4~rfquest1dnal1{~valuerindarge.reservoirs! C)fJ!)bff~J TO lIT10' .B ai '315r1t ,([ 1 LIB 110r[2 f!~?'(s ,1£ e 'I'> -,).cj
01121'l. ':15CrnJJf' :::g" I oj '[lEv .:;'11IDC' ~{~ot'l 01 eoiromq rrorrtrrroo B ai 11 .eldsltsvs v ibsetImpact of stocking in small reservoirs .regrsr gnI.il:ooJ2 erir : Of r
Isunsrr Stbo:kl.tnIgJbra~t>~ertl ftfo e:~effettttN(}qff \mpreV'1ffg 9iteIlrifr rnl:sflmn(fre~bhroirsass!lcces-s1deptim"d.gdire-ctl~'0i1 €dptu-ritig tl1b3s dCke'tHr W.' J1i-s'isjlll"snaiVeoHtr~st t~''t1iel:aP,g~)and3medfium~·rese1N'6i'i1§,lw'lter - the~-mm "~llfia}P t cKin] "0 r'retl)e building up'ralrree"dingrtp~latij;)~!¥nlofd€r~t0 maI(.e.~fhelmanagel'n'enGviabl~llfFresmal erWHter~odresh"a.ve£tlr~[adWffitage'iQl1ea~StbCk' ntohlt01'ldgrtand rtiimiif:nHh't'ihh~£rrti1iif, t1I& sfrllill6i1tlieresery~irspt b@uti€ifT<ift9tlitWdlfMflMsr6rsGcces!l' '~&e')~ffi!cR:jaI1(f~plhrerpro'Cess~()rn fact,an imaginative stocking and harvesting schedule is the main theme of fishenes
management in small, shallow reservoirs. The. basic tene~s ~~:s~[~:..,,-~~~~em involve:
'H1. Selection of the right species, depending on the fish food resources available in the
system.,tbod T'l.lBW 5rtt 10 bleiv lsrrnoroq f£1j(HU> !m!ljj;~/j .q lerl\'I~dmlJll 111)b~))b'J,! 50 01 rlGi~10 )d(.) If "
:-mrlqi':) If; trlghw n£~M - N .110it2!>UPni 2:>1:):)'!2 erlr rnoft 5mOJ CIS:)lEd! bhiv. 3rh '10 J,t :t'OQO r1 J 11e- lS11(t ISl10m 1£101~x- ,~Itd:)OJ2 Is 5'1.A . 01 a qr:) lr. •
I
,"T ,
2. 1 Determination of a stocking density on the basis of production potential, growthand mortality rates. J f, '
3. e 'Proper stocking 'and harvesting schedule including staggerred stocking andharvesting, allowing maximum growout period, taking into account the criticalwater levels.. _, ,-' . r ", . -.. (
4. In case of small irrigation reservoirs with open sluices the season of overflow and>, 'the-possibilities.of water level fallingtoo low or completely drying up, are also to
~be taken, into consideration, ~ J 'f'4 !, > to cl ·r>./1 !f,:j I
~ '"j _ ~ ';-" I I ••.• -~ t~' ~ ~,.V! h ,q , J ' H ,! t JI"f 1 ) . ?""' (. ..h h ( 't')d
.'oiAliyar reservoir: in Tamil 'Nadu'js-a' standing testimony to the efficacy -of themanagement-based' on' stocking ,larger fingerlings" staggered stocking and harvesting; anda higher size at harvesting. The result of the above management practice was an increasein fish production from 1,67 kg/ha in 1964-65 to 194 kg/ha in 1990. Success stories ofstocking /have <also been reported from (f~nlimber' of small 'reservoirs; in ..•India, likeMarkonahallirn Karnataka, Meenkaravand Chulliar rin Kerala/Bacfihfa,1 Baghla, ~arfdGulariya inUttar Pradesh, and Bundh Beratha in Rajasthan.' ,l:; ( !
Species enhancement . ~£ I
r ••
Decline.of indigenous fish stocks due to habitat loss, especially that cuased by damconstruction isia universal phenomenon. Planting of economically-important, fast-growingfish from outside with a view to colonizing all the diverse niches: of the biotope for'harvesting maximum sustainable crop from them is species enhancement. It can be juststocking of a new species or introductions. 'Introduction means one time or repeatedstocking of a" speC'ies with tile objective 'of establishing 'its naturalised populations.Introduction'has'lnore relevance to larger water bodies where stocking and recapture on
'f .a sustainable basis ..is-not feasible. I , f ; f;., " r" ' ••. " r- )/ /+ '. •
\'11fJ • "',, :' 'It! ~J>'Y! fI'x ..ci ' fJ)fm~
Environmental enhancement.,." (\'~ r •• "';':'~! fI'Hlii):jjL 'l:'1'rlj rfti If "r ,"J II 'II')" fl ')'/J J' 'I':.)?<"!' "I,' ~ j' ,,;, I r
• or; 'fh~limp'roveIfieht of the mrtrienrstattis'of'water bytthe selective'input'of fertilizersis a very corrimonomanagement option adopted in intensive'taquaculture, if similarenvironmentalenhancement'is' adopted in small reservoirs, stocks can be maintained atlevels higher thanthe 'natural carrying capacity of the water body. PIowever, a carefulconsiderafion of the possible impact-on the environment is needed before this option isresorted to in reservoirs. It is generally believed that most of the lakes and reservoirs mayhave sufficient nutrient inputs and any excessive nutrient loading can lead to pollution
225

problems. However, scientific knowledge to guide the safe application of this type ofenhancement and the methods to reverse the environmental degradation, if any, is stillinadequate. On account of all these, this is not a very common management tool. Chinais known to have used this instrument in a big way to augment production from smallreservoirs. Cuba, taking a cue from China has tried manuring of small reservoirs usingboth organic and inorganic fertilizers. This is also practised selectively in the communitywater bodies of Thailand.
Fertilization of reservoirs as a means to increase water productivity throughabetting plankton growth has not received much attention in India. Multiple use of thewater body and the resultant conflict of interests among the various water users are themain factors that prevent the use ofthis management option. Surprisingly, fertilization hasnot been resorted to even in reservoirs which are not used for drinking water and otherpurposes.
Documentation on fertilization of reservoirs in India is scarce. Sreenivasan andPillai (1979) attempted to improve the plankton productivity of Vidur reservoir by theapplication of super phosphate with highly encouraging results. As soon as the canalsluice was closed, 500 kg super phosphate with P20S content of 16 to 20% was applied inthe reservoir when the waterspread was 50 ha with a mean depth of 1.67 m. As animmediate result of fertilization, phosphate content of water increased from nil to 1.8 mg/land that of soil from 0.242 to 0.328%. Similar improvements in organic carbon andKjeldahl nitrogen have been reported from soil and water phases on account offertilization. Experiments were also conducted with urea in the same reservoir.
Fertilization can playa key role in many small reservoirs oflndia, which requirecorrection of oligotrophic tendencies. A number of reservoirs in Madhya Pradesh, theNortheast and the Western Ghats, receiving drainage from poor catchments show lowproductivity, necessitating artificial fertilization. Chinese experience in fertilizing thesmall reservoirs for increasing productivity has been reassuring (Yang et al., 1990).
Fertilizers are less effective in soft water with total alkalinity less than 20 mg/l.Soft waters have inadequate carbon (usually in the form of carbon dioxide and bicarbonate)for good phytoplankton production. Fertilizer response, hence productivity, can often beenhanced by applying lime to low alkalinity impounded waters. The application of limeequivalent to 2,000 to 6,000 kg/ha calcium carbonate is generally sufficient to maintaintotal alkalinity above 20 mg/1. Application oflime was tried in some upland natural lakesfor amelioration of excessive CO2 and acidity at the bottom (Sreenivasan, 1971).
226
,

Modelling approach in culture-based fisheries
In the culture-based fisheries of small reservoirs, fish yield is dependent on anumber of parameters, such as stocking rate, growth rate, natural mortality and fishingmortality. Recent studies based on modelling approach have opened up new avenues forthe culture-based fisheries of small reservoirs. Notwithstanding the fact that studies on thepopulation dynamics based on modelling approach demand higher levels of inputs in theform of money and trained manpower, an insight into the modelling approach will help themanager in understanding the ecosystem approach. ir
Many of the small water bodies seem to be overstocked. In a culture-based fishery,an undue increase in stocking density can lead to severe loss of production. It is wellknown that at higher stocking densities, the fish grow at a slower rate with attendant higherrate of natural mortality. A moderate overstocking results in suboptimal production dueto this slow growth and high mortality, but fishery can still operate. On further increasein stocking density, the asymptotic length of the population falls below the gear selectionlength (if the mesh is selective) and the fishery fails to remove biomass from thepopulation. If stocking continues, the water body is literally choked with stuntedpopulations without any production.
Available models have clearly confirmed thhat the production is a function offishing mortality and stocking density. If some standard variables on populationparameters, such as the density-dependent growth, size dependent mortality and weight-length relationship are known, the optimum stocking density and the fishing mortality canbe arrived at. The optimum stocking density in a hypothetical situation with a gearselection length of 30 em and mean seed size of 5 em is given in Fig. 1. In the currentexample, reflecting the density-dependent reduction in indivudual growth and theconsequent increase in natural mortality, the maximum biomass harvested is estimated at67.6 kg/ha at a stocking density of 560/ha/yr. Since the maximum yield is attained at astocking rate of 560 ha, any increase in this parameter will amount to overstocking andloss of production. Similarly, any increase in fishing effort above certain limits will becounter productive.
Thus, a desired balance between stocking rate, population density and growth is tobe maintained with enough flexibility so as to swing it to suit the changes in environmentalfactors. Such a plan must determine tentative stocking rates and population thinningaccordingly.
227

It has also been pointed out that the highest production-is achieved if fish areproduced at the minimum marketable size. Thus, it becomes very important to determinethe minimum size at which the fish are preferred for domestic consumption or can bemarketed. The mesh size regulations and the gear selection have, to be guided by thisparameter. The fishing pressure assessed on the basis of size groups in the population isa useful guide in determining the quantum of fishing effort. This-tool has been effectivelyused in many countries to make necessary adjustments in fishing effort. In reservoirs, thepopulations of some species consist of morejhan one age group and jhe older individualsdominate the populations in terms of biomass, clearly indicating low ·fishing pressure.This situation calls for an increase in fishing effort.
Similar. models to suit Indian conditions need to be derived from field data.Adoption of such rational stocking rates, .guided by.models will go _a long way inimproving the fish yield from-the small reservoirs. .> :1.) )!' '''. v
Genera]. considerations
Reservoirs constitute the prime inland fishery resource of India which has a pivotalrole to play in the coming years in increasing the inland fish production of the country. Asubstantial part of the estimated requirement of 6 million tonnes of inland fish during theyear 2000 should come from the culture-based fisheries and enhancement. Thisassessment is based on the environmental and socio-economic constraints associated withthe aquaculture sub-sector. There is ng .room for unlimited growth of intensiveaquaculture, whichin any case is a capital-intensive activity, where the profit is conduitedto a few-investors. On the contrary, reservoir fisheries development is a labour-intensiveand labour-productive activity, where the benefit of improved productivity is shared bymore people, particularly the local communities.. thus ensuring a better distribution ofincome. Moreover, since the local communities are involved in development and directlybenefitted, there is lesser scope for social disruptions. At a modest rate of 100 kg/ha, smallreservoirs in India can.produce 75,OQO t of fish per year which is 37,590 t more than thepresent production, :Raising this.mu~h of,fish through intensive aquaculture would entailenormous investment in terms of capital and infrastructure, apart from arousing manyenvironmental and socio-economic problems. Conversely, increasing fish productionthrough culture-based. fisheries and enhancementin small reservoirs is .economicallyviable, ecologically sensible, socially justifiable.
228

References:
Henderson, H.F. and R.L. We1comme, 1974. Relationship of yield to morpho-edaphicindex and numbers of fishermen in African inland waters, CIFA Occas. Pap.,(1) : 19 p. .
Jhingran, Arun G., and V.V. Sugunan, 1990. General guidelines and planning criteria for. small reservoir fisheries management. In Reservoir fisheries in India. Proc. ofthe National workshop on Reservoir Fisheries, 3-4 Jan., 1990. Eds. Jhingran, A.G.,and V.K. Unnithan, Asian Fisheries Society, Indian Branch, Mangalore : 1-8.
Lorenzen, K., 1995. Population dynamics and management of culture-based fisheries.Fisheries Management and Ecology, 1995,2: 61-73.
Sreenivasan, A. and K. Venkatanarasimha Pillai, 1979. Fertilization of fishery waters - .Experimental fertilization of a small reservoir, Madras J. Fish., 8 : 143-145.
Sreenivasan, A., 1071. Liming of an upland lake. Madras J. Fish., 6 : 9-13.
Sugunan, V.V., 1997. Floodplain wetlands, small water bodies, culture-based fisheries and\ enhancement - conceptual framework and definitions (in this volume).
We1comme, R.L., 1976. Approaches to resource evaluation and management in tropicalinland waters. Proc. of the Indo-pacific Fisheries Council, Food and AgricultureOrganization of the United Nations. Colombo, October, 1976. 500 p.
229

DOs DON'Ts
Estimate the yield potential for determining the stocking Do not stock without a plan.density and fishing effort
In the absence of other criteria, use the recommended Do not overstock the reservoir. Itformula for determining stocking density, system of will lead to stunted population andstaggerred stocking and harvesting will lead to better yield drastic fall in yield.
Carefully study the possible stock loss through inlet and Do not try to provide the wire meshoutlet channels and account while estimating thhe stocking structures without consulting thedensity. dam authorities. It may cause undue.Explore possibilities for providing wire mesh guards to inlet increase in water pressure leading toand outlet channels in order to prevent escap~ of fish. collapse ofhydraufic structures.
Fix the minimum size at capture and restrict the use of mesh Do not catch the fish at too small orsize accordingly. Remember that theoretically, stocking at too large size. Do not grow the fishthe smaller size fish in large numbers and catching them at to higher size thanthe smallest marketable (acceptable) size will give more marketable/acceptable size.yield, compared to larger size. However, survival is sizedependendent and growth is density dependent.
Fix a higher size of stocking at high where the predaor Do not stock higher sized fmgerlingspopulation is very high. Work out an optimum fishing effort if there is no predator pressure.and limit the number of fish units.
Explore possibilities of stocking locally available indigenous Do not stock exotic fish speciesspecies. without clearance from authorities.
Select fish species for stocking carefully taking into Do not stock/overstock fish speciesconsideration the available fish food resources and the only because they are available.catchability.
Explore the possibilities of integrating fisheries with animal Do not practice animal husbandry inhusbandry practices to make the fisheries more profitable. reservoirs used for drinking water
purposes.
Participatory management often works better than punitive Do not fertilise the reservoirs withand deterrant measures to motivate the community to follow organic and inorganic fertilizers,mesh size and fishing effort regulations. ' Therefore, involve unless it is very essential and doesthe community in management. not conflict with other water uses.
230
Summer School on Fisheries Enhancementin small Reservoirs and Floodplain Lakes,CIFRI. Barrackpore. 14 July to 12 August 1997
Fish diseases and their control in inland open water
Manas K. DasCentral Inland Capture Fisheries Research Institute
Barrackpore- 743101, West Bengal
Introduction
Floodplain lakes and small reservoirs in the country are increasingly used forenhancing fish production during the last few years. New methods offish culture viz., cage _culture or pen culture are also being widely used to increase fish yield with the use offertilizers, both inorganic and organic, on a limited scale. All these practices influence theenvironmental and parasitological factors in these culture areas and consequently variousfish disease epizootics are encountered.
Fish diseases encountered in lakes
The common fish diseases recorded in the lakes where enhancement practices likestocking and fertilization are undertaken are discussed below:
1. Ulcerative dropsy
Fish species affected: Catla catla, Labeo rohita and Cirrhina mrigala
Symptoms: There is accumulation of water in the body cavity and scale pockets along withsubcutaneous haemorrhages.
23/

Causative agents: Pathogenic bacteria viz. Aeromonas hydrophila and Pseudomonas sp.A myxozoan parasite, Neothelohanellus catlae is also found infecting the kidney ofaffected C. catla. Affected fishes are normally found stressed due to certain environmentalfactors associated with the disease such as, low dissolved oxygen and large number ofaquatic vegetation.
Treatment:
a) Lime (CaO) application @ 50-100 kg/hab) Bleaching powder application @ 1 mg/l after one weeek.
2. Columnaris disease
Fish species affected: C. cat/a, L. rohita and C. mrigala
Symptoms: Initial stages exhibit greyish patches over the head and dorsal sides of thebody.
Causative agent: Pathogenic bacteria, Flexibacter columnaris. The disease is oftenassociated with high organic load and increased temperature.
Treatment: Same as for ulcerative dropsy disease
3. Trichodiniasis
Fish species affected: C. catla, L. rohita and C. mrigala
Symptoms: Fishes with heavy infestations have pale coloured gills with creamish coating.Surfacing of fish occurs.
Causative agent:- Urceolariid ciliates viz., Trichodina nigra, T. reticulata, Tripartiellabulbosa, T. copiosa and T. obtusa.
Treatment:- No viable treatment methods for open waters.
4. White gill spot
Fish species affected: C. catla and C. mrigala
232 j

Symptoms: The gills of affected fishes are covered with whitish spots of different size.Excessive mucus secretion occurs and fishes surface for gulping air.
Causative agent: Myxozoan viz. Thelohanellus catlae and Myxobolus bengalensis.
Treatment: No feasible method of treatment for open water bodies.
5. Dactylogyrosis
Fish species affected: C. catla, L. rohita and C. mrigala
Symptoms: Excessive secretion of mucus occurs in the infected gills which are affected,often with localized haemorrhage.
Causative agent: Monogenetic trematodes of the genus Dactylogyrus sp.
Treatment: Application of lime @ 100 kg/ha
6. Argulosis
Fish species affected: L. rohita, C. mrigala and C.catla
Symptoms: Infestation is accompanied by excessive mucus secretion, irritability, erraticswimming behaviour and retarded growth. Heavy infestation often leads to circulardepression with haemorrhage and ulceration.
Causative agent: Branchiuran species of the genus, Argulus
Treatment:
i) Gammaxene treatment @ 1 ppm
ii) The eggs of Argulus can be mechanically removed after collecting them on thehanging bamboo mats in water.
7. Epizootic ulcerative syndrome
Fish species. affected: Channa sp., Mastacembelus sp., Puntius sp., Nandus sp., C. catla,L. rohita C. mrigala, C. carpio and G. chapra.
233
Symptoms: The fishes become lethargic and float on the surface of the water, sometimeswith the head projected out of water. Initially, the disease appears as red coloured lesions,haemorrhagic in nature. These red lesions spread and enlarge gradually becoming deeperand assuming the form of ulcers. With further advancement, scales fall off, ulcers becomedeep necrotizing ulcerative lesions. Histopathologically, it is characterized in havingmycotic granuloma in epidermis.
Causative agents: Role of suspected causative agents namely, virus, bacteria and funguscould not be established conclusively. In India, so far 20 species of pathogenic bacteriahave been isolated from affected fishes ofwhichA. hydrophila has been consistently foundalong with fungus Saprolegnia. The latest investigations point out the prime causativeagent to be a fungus called Aphanomyces sp.
Treatments: can be tried only in lakes below 40 ha.
Prophylactic: During post-monsoon period, the desease prone water areas can be treatedwith lime, CaO @ 50 kg/ha followed by application of bleaching powder @ 0.5 ppm afterone week.
Therapeutic: At the initial stage of lesion formation, lime (CaO) is applied @ 100 kg/hafollowed by application of bleaching powder @ 1 ppm after one week.
Fish diseases encountered in reservoirs
The parasite fauna of a reservoir is derived mainly from its parent stream, butsome may be added along with the stocked fishes. Later, rheophilous parasites tend todisappear and the typical lake, pond and sluggish river species tend to become morenumerous. The potentially dangerous parasites and diseases existing in the Indianreserovirs are:
1. Ligulosis
Fish species affected: C. catZa
Symptoms: Abnormal swelling of the abdomen, dark colouration, erratic swimmingbehaviour and emaciation.
Causative agent: Plerocercoid larval stage of the cestode Ligula intestinalis
234

Treatment: Since L. intestinalis is an endoparasite and the infections are more common inlarge water areas, chemical control is not feasible. The permanent hosts of the parasite arethe fish eating birds which can be removed by scaring away or destroyed by shooting. Themethod has been successful in Tilaiya reservoir.
2. Black spot disease
Fish species affected: C. catla and Oxygaster bacaila
Symptoms: Affected fishes have black ovoid patches overlying cysts of metacercarialarvae. Growth retardation occur.
Causative agent: Metacercarial larval forms of the digenetic trematode Diplostomum sp.
Treatment: Removal of the resident molluscan population is one method of control.
3. /soparorchiosis
Fish species affected: Murrels, catfishes and carps
Symptoms: Affected fishes are weak, emaceated with soft and flabby muscles. Infectionis characterised by presence of black nodules in body cavity of fish.
Causative agent; Metacercarial larval stage of the digenetic trematode Isoparorchishypselobagri.
Treatment: Remedial measures are limited to reducing the population of affected fishes.
4. Ergasilosis
Fish species affected: Mostly carps
Symptoms: Infestation occur in the gills, buccal cavity, operculum and fins. Heavyinfestation leads to anaemia, respiratory distress and frequent surfacing.
Treatment: Gammaxene treatment @ 1 ppm
235

Quarantine and fish health certification
Stressing the importance of preventing fish diseases, it must be emphasized that theintroduction and movement.of fishes should be subjected to strict quarantine procedures.In recents years, stocking of phytophagous carps viz. C. idella, H. molitrix arid T.mossambica has become common in India, either intentionally or accidentally in lakes andreservoirs. There is every possibility of dangerous parasites getting established on fishspecies. There are reports that some parasites from exotic fishes viz. Trichodina reticulata,Tripartiella bulbosa, T. copiosa, T. obtusa and Neoergasilus japonicus got established inthe cultured native fishes. To prevent such diseases in future the following steps shouldbe taken.
i) Transfer of eggs rather than fish for stockingii) Chemotherapy of fish if transferrediii) Careful supervision of any introduced fishiv) Enactment of fish control legislation
Suggested reading
Bauer, O. N. and V. P. Stolyarov, 1961. Formation of the parasite fauna and parasiticdiseases offishes in hydro electric reservoirs. In: Parasitology of fishes, Oliver &Boyd. Edinburg & London: 246-254.
Das, Manas K. and R. K. Das, 1993. A review of the fish disease epizootic ulcerativesyndrome in Inda. Environ. & Ecol. 11: 134-148.
Das, Manas K.and R. K. pas. 1995. Fish disease in India - A review. Environ. & Ecol.13(3): 533-541.
Gopalakrishnan, V. 1964. Recent developments in the prevention and control of parasitesof fishes cultured in Indian waters. Proc. Zool. Soc., 17: 95-100.
Haffinan, G. L. and O. N. Bauer, 1971. Fish Parasitology in reservoirs: A review-ReservoirFisheries and Limnology. Amer Fish. Soc. Spl. Publ. 8: 495-511.
Pal, R. N. and V. Gopalakrishnan, 1969. Parasitic diseases of fishes in-Indian reservoirs.Proc. Sem. Ecol. Fish. of Freshw. Resv., 163-167 pp.
**********
236

Summer School on Fisheries Enhancementin small Reservoirs and Floodplain Lakes,CIFRI. Barrackpore. J4 July to J2 August J 997
Infrastructural base and policy support measuresfor inland fisheries
s. PaulCentral Inland Capture Fisheries Research Institute
Barrackpore-743 101, West Bengal
Under-employment or disguised or concealed unemployment is a notable featureof the majority of underdeveloped countries. Such unemployment is not voluntary butinvoluntary. People are prepared to work but they are unable to find work throughout theyear due to lack of complementary factors. This is to be found in agriculture comprisingcrop husbandry, animal husbandry and fisheries where manpower engaged is not fullyoccupied due to low productivity and capital deficiency. Though quantitative measurementof disguised unemployment is difficult, most economists agree that in densely populatedcountries disguised unemployment represents 25-30% of the agricultural labour forcewhich could be withdrawn without affecting farm output
Underdeveloped countries are in the backward state of technology. Theirtechnological backwardness is reflected firstly in high cost of production despite lowwages; j secondly in high labour-output and capital-output ratios. The technologicaldevelopments aim at disturbing decisively the relationship between input and output. Inother words, the production function is altered to the advantage of entrepreneur. Further,it leads to dependence on monetised inputs that, in turn, leads to higher capitalrequirements. The emergence ofhypophysation techniques coupled with feed-fertilizertechnology, is a watershed in the history of aquaculture. The production of fish andshellfish by adoption of scientific techniques did result in higher yield, but average costof production also increased. The relationship between input and output prices determineslevels of profitability in any site-based production system but fish production in naturalwaters such as rivers, streams, large lakes, reservoirs and heels is subject to variousuncertainties and risks. The production function relationship is less precise as comparedto site-based aquaculture.
237
· One ofthe reasons for sluggish growth rates of production in open water fisherieshas been lack of pre-harvest and post-harvest infrastructural support 'in terms of efficientmarketing mechanism, institutional funding arrangement and prevalence of revenue-biasedexploitation policies. Though government and inter-governmental bodies and financial andresearch institutions have beencontributing to the cause of fishery development, existingpolicies have been more in the nature of piecemeal responses to a particular situation. Thefocus has been mainly on aquaculture and sustenance of export boom in respect ofoverheated overseas market for shrimps. This lop-sided approach has resulted in utterneglect of open water systems which are characterised by prevalence of low productivityand consequent low income.
The following techno-economic adjustments are necessary for sustainable fisheries.
Conservation and Fishery Management
Research in capture fisheries generally ends up in the advocacy of stringentconservation measures. Fishery management comprises regulation of fishing mortality,enhancement of natural fish production, and accelerated development of knowledge andtechnology required to convert latent stocks into economically. useful resources, eachcarrying an important research component with it. Probably not many would advocate thatfishery regulation should aim primarily at enhancing the welfare of the fish or atsafeguarding the bureaucratic interests of government officials. The ultimate aim of fisheryregulations is to improve the lot of people and primarily of the people who endure hazardsof fishing or of investment in fish catching.
Income Generation and Productivity
Income being major determinant of living standard a need is keenly felt forimproving returns by raising fish productivity of reservoirs and floodplain lakes as theyare .more amenable to effective human intervention as compared to rivers. Studiesconducted by 11M,Ahmedabad and CIFRI reveal that fish productivity being low, catchingfish from these water bodies hardly affords gainful employment. The income ranging fromRs 2,000 to 4,000 per family keeps fishermen at starvation level. As again~t an averagepotential of 1,000 kg in beels and 100 - 200 kg/ha in reservoirs the current yield rates arestagnating round 15-20 kg/ha respectively. Ifby appropriate stock management and post-harvest technology yield is increased four fold, fishermen may cross poverty line, a limit,criterion for which is fast changing due to steep rise in general price level. Marketinterevention by Corporations and Cooperatives can certainly improve the price,realisations of fishermen, particularly in the wake of stagnating productivity.
238

Input Supply Sub-System
Input supply sub-system has to be streamlined through Cooperatives for ensuingregular supply of fishery requisites to the fishermen. The inventory finance in industrialfisheries of marine origin has been quite adequate, but in the inland fishery sector, onlysite-based pond culture has occupied the attention of funding bodies. Since fishermenbelong to the poorest of the poor class, they may not have the economic resource base totake up heavy investment. Therefore, it calls for policy of selective subsidisation for thepurchase of boats, nets and marketing finance during peak harvest. While leasingreservoirs and beels, itshould be ensured that individual fishermen or Cooperatives willno way impair the overall health of ecosystem to the detriment of other user classes. Infact, licensing should be resorted to with such stipulations like mesh size of nets and closeseasons in auto stocked floodplain waters and reservoirs along with ban on destructive
.methods of fishing.
Remunerative Prices to Fishermen
Besides input subsidy, fishermen may be assured of remunerative pricesparticularly in a situation of localised glut or distribution failure due to transportbottlenecks. Though fish markets have been overheated in recent years, high ruling priceshave neither benefited producers of fish nor the consumers due to imperfections ofmarketing systems. The market intervention by reducing market margins is very essentialso as to offer production incentive to fishermen as also protect the interests of consumers.
Legal Fremework
There is an urgent need to integrate fishery laws with environmental legislation.Although the common heritage of mankind has proven to be a useful concept fordeveloping international regulatory regime, it does not harmonise with legal sovereigntyover natural resoueces including wetlands. It, thus, provides a less compelling conceptualjustification for regulating such internal issues as the conservation of biodiversity or.emission of green house gases. National sovereignty over natural resource has been wellrecognised in international organizations. Access to genetic resources can be regulatedthrough national legislation but Stockholm Declaration 1976 and Rio Declaration of 1992stipulated that no harm will be caused to the interest of other nation states.
239

Will legislative support helps us in arresting deterioration in environment? Oneof the duties of an Indian citizen as enshrined in Article 51(g) is to protect and improve theenvironment including forests, lakes, rivers etc. and to have compassion towards wildlifeand other living creatures.
There is an imperative need to have coprehensive legislation that will provideregulatory mechanism for sustainable use of wetlands. The existing constitutionalprovisions, as enshrined in entry 56 of article 246, entry 17 of State List, 17-A, 17-Bandentry 32 ofthe Concurrent List need to be ammended so as to take care of wetlands. It isalso necessary to provide reconciliation machinery for settlement of inter-state disputes asalso inter-sectoral disputes among multiple end users of wetlands. Though legislativesupport is not a complete answer towards achievement of the objective of conservation andsustainable use of wetlands, some modest beginning has to be made.
*************
240
.>
..

Summer School on Fisheries Enhancementin small Reservoirs and Floodplain Lakes,CIFRI. Barrackpore. 14Julv to 12August 1997
Socio-economic constraints in open water fisheries withspecial reference to reservoirs and floodplain lakes
S. PaulCentral Inland Capture Fisheries Research Institute
Barrackpore- 74310 1, West Bengal
Fish production in the country has increased from 7.52 lakh tonnes in 1950-51 to47.88 lakh tonnes during 1994-95 with inland fisheries contribution going up from 2.18lakh tonnes to 20.971akh tonnes. The annual average growth rate in production during theperiod 1984-1985 (base year of the VIIth Plan) to 1994-95 was 7%. The growth rates inthe marine and inland sectors have been 5.8% and 8.8% per annum respectively during thisperiod.
Taking stock of past trends and techno-economic adjustments coupled withappropriate research back up, the likely fish production by 2020 A. D in inland sector mayregister a two fold increase at a level of 42.30 lakh tonnes as against 20.97 1akh tonnes inbase year i.e., 1994-95. In order to reach this target socio-economic constrains need to bewell identified. The conventional literature on open water fisheries is replete with studieson physico-chemical parameters of water quality, productivity potential estimated on thebasis of ecological investigations and some isolated studies on M. S. Y with the help ofinfirm and inadequate data. Rarely fisheries have been subujected to rigorous economicevaluation as a business activity mainly due to absence of reliable data on resources as alsoon productivity.
241

The succeeding paras deal with some of the problem areas in respect of inlandfisheries.
Riverine Fisheries
Major river systems, particularly the Ganga and Brahmaputra, have been wellresearched in respect of ecological parameters, but economic data with regard toproductivity, production and arrivals have been conspicuous by their absence. In theabsence of specific landing centres in riverine fisheries, fish arrivals are in few isolatedpockets. Directorate of Economics & Statistics, Ministry of Agriculture, do not publishdata on arrivals as is being done in case of other agricultural commodities. Further, in theabsence of time-series data on production and productivity, it is difficult to assessfluctuations and their impact on employment and income. Research in riverine fisheriesdoes not seem to have created the desired impact by way of higher fish productivity andconsequent high income to fishermen as management of common property resource hasits built-in limitations. Multiplicity of users of water like human population, agricultureand industry makes it almost impossible to evolve a national policy for even and rationalutilization of resources.
Reservoir Fisheries
The research in reservoir fisheries has been mainly confined to morphometry,limnology, biology, production potential estimated on the basis of food resources, andstock manipulation. Except a few success stories, there has always been a persistent hiatusbetween projected potential and actual yield rates due to a number of imponderables. Tilltoday, reservoirs are characterised by prevalence oflow fish yield (20 kg/ha/year), revenuebiased unimaginative exploitation policies, disregard for ecological considerations and lowincome of fishermen (ranging from Rs. 1,000 to 4,000/yr). The exploitation systemcomprises open auction, royalty, and preferential lease to fishery cooperatives. However,small reservoirs have shown greater promise mainly due to intense human intervention.
Flood plain Wetlands
Wetlands are transitional environments between terrestrial and fully aquaticecosystems. The Ramsar Convention defines them as "areas of marsh, fen, peatland orwater, whether natural or artificial, permanent or temporary with water that is static orflowing fresh, brackish or salt including areas of marine water, the depth of which at lowtide does not exceed six metres". The true value of wetlands needs to be recognised forsupply of goods and services which are provided free of financial and environmental costs,
242
ifused wisely. Sectoral organization e.g., agriculture, transport, industry, wildlife, forestryetc. is a feature of most societies and Governments. This has usually adverse implicationsfor wetlands because they are potentially impacted by human activities. The existingexploitation of wetlands by multiple users needs to be planned on the basis of scientificdata on various aspects.
Ownership
The public ownership of wetlands in many countries makes them the target forabuse by the local population eager to seize the opportunities for development. Virtuallythroughout Francoplone Africa, there is a concept of "domaine pub lique hydraulique"where permanent inundated land is state owned. This gives birth to conflicts in wetlandwhere precise definition of the limits of permanent inundation is virtually impossible. Forinstance, in Assam and West Bengal, the land ownership of wetlands is of extremelycumbersome nature. Multiple ownership among various departments and privateindividuals makes it almost impossible for adoption of ecologically sound exploitationpolicy.
Fisheries of Floodplain lakes
Floodplain wetlands of Assam, Bihar and West Bengal, have been engaging theattention of fishery experts for some time past and there is a belated realization that lowlying areas known locally as beels and mans serve as habitat for variety of fish. Theaccelerating pace of industrial isation has been contributing to destruction and degradationof wetlands and this is reflected in ever increasing scarcity of wildlife and consequent highprices for wetland products such as fish. Of late, there has been a true recognition of thevalue of wetland goods and services which are made available at less financial andenvironmental costs. Classification ofwetlands is fraught with controversies and problemspartly because of varietal enormity of their highly dynamic character and partly becauseof the lack of any precise definition.
Floodplains are a halfway house between flowing river and pond. The sheervastness of area of floodplains makes it akin to common property resource like rivers andstreams and they are vulnerable to irrational modes of exploitation. Sluggish growth ratesof fish production due to low yield call for planning at pre-harvest stage, lest the hiatusbetween potential and actual fish productivity may widen.
243

In order to sustain commercially profitable fishery of floodplain lakes, there shouldbe enough fish for harvesting, otherwise low production may depress the income offishermen. Therefore, floodplains need to be harnessed so as to augment domesticavailability of fish. As against an average potential of 1,000 kg/ha in floodplain waterbodies the existing yield rates range between 160 kg/ha to 200 kg/ha in the states ofAssam, Bihar and West Bengal. Appropriate stock management and post-harvesttechnology may help in improving the fish yield to a remunerative level so as to make aneffective dent on poverty of fishermen. No country can succeed in improving socio-economic status of fishermen unless frontal attack is made on illiteracy. Glorification ofpoverty has been rooted in the traditional beliefs of many Asian countries.
Outlook
Evaluation of socio-economic milieu under which fishermen operate is a conditionprecedent to any worthwhile development strategy is contemplated for rivers, lakes,estuaries and reservoirs. The environmental degradation and low fish productivity due tonatural and man-made interferences have been resulting in the fall in income levels offishermen. Moreover, hardly any capital formation in terms of inventory building takesplace in the inland sector at pre-harvest level due to high propensity to consume.Therefore, some measure of stability in yield rates needs to be imparted inorder to obviatethe possibility of violent fluctuations in income of fishermen.
************
244
Summer School on Fisheries Enhancementin Small Reservoirs and Floodplain LakesCIFRI Barrackpore 14July to 12August 1997
Role of participatory management approach in reservoirand beel fisheries
Utpal BhaumikCentral Inland Capture Fisheries Research Institute
Barrackpore-743101, West Bengal
India is bestowed with vast expanse of reservoirs and beels. As a result of manybreakthroughs in research, several programmes in the development of fisheries for suchwater bodies have been initiated. The demands made upon transfer of technologies, foraccelarating fish production from reservoirs and beels, are enormous. Therefore, integratedfunctioning of research, education and extension has become the most desirablecomponent for development of fisheries from such waterbodies. It is important to involveall groups of people including administrators, scientists, extension functionaries and fishfarmers/fishermen in the process of formulating and implementing management measuresfor the development process. Fish farmers/fishermen, individually or in group, arerequired to participate in management system for larger benefit. .
Management vis-a- vis appropriate technology
According to Encyclopaedia of Social Sciences (1933) management is defined asthe process by which execution of a given purpose is put into operation and supervised.To our purpose, the word management is used in the specific context of scientificmanagement. Dasgupta (1969) states that Management is the creation and control oftechnological and human environment of an organisation in which skill and capabilitiesof individuals and groups find full scope of their effective use in order to accomplish theobjectives for which an enterprise has been set up. It is involved in the relationships oftheindividual, the group, the organisation and the environment.
245

The processes oftechnological innovation, technical and scientific communication,and technology transfer have been the subject of considerable research in recent years.From a behavioural point of view, technological change and innovation occur as a resultof complex sets of human interactions, information flows and transfers arid risk taking anddecision making capabilities, These factors involve human beings with right kind ofmotivation, perception, attitude, belief, ability, ambition, personality, knowledge andexpenence.
The innovated technologies are sophisticated in nature and high input intensive. Itis interdependent on so many inter-related practices each one of which has to be appliedrationally in time and in the manner recommended by the scientists. A communicatorconcerned with the fisheries of reservoirs or beels, therefore, has to understand thecharacteristics of the resources in order to select appropriate methods and techniques foreffective and rapid communication of appropriate technology to the clientele for their easyadoption.
Appropriate technology may be designated as an approach in which technicalinnovation and adoption go hand in hand with social and cultural integration. It impliesthat the technology to be developed should pay attention to adopting the technology withthe framework of local environment. Development from within a population, requiresworking with people in their existing situation, by utilizing their existing resources andskills.
Extension system and holistic participatory approach
At every step of the management of fisheries in reservoirs or beels, people'sparticipation in all the four extension systems viz., Research System, Extension System;Client System and Support System is more important than the product or process put touse.
Local participation is not the only new criterion by which the management ofreservoir or beel fisheries needs to be judged. It is equally important that the problems beapproached holistically taking into account the full range of human and communitypotentials.
Fisheries management of open waters necessarily involves both individual andgroup action where the need for participatory approach is probably maximum. In fact,participatory approach is indespensable for successful management of such projects.
246

The very purpose of development activity as seen in its broadest socio-political senseIS :
• to enable people to critically understand their situations and problems,• to identify their needs and to prioritize them,• to evolve methods of resolving these needs and problems,• to mobilize local resources,• to implement activity in an organised manner, and• to monitor, evaluate and learn from the effort
Naturally, participation of the people is necessary for such an effort. Sincedevelopment efforts can not stipulate people's participation as an initial condition, suchparticipation should be actively promoted as an integral part of each practice of fisheriesmanagement and should work, within a time frame, towards an ideal (even if it may notbe wholly achievable) condition.
People's participation - a desired phenomenon
Encouraging people's participation in the management of fishery projects is nota new concept. But, the concept of people's participation itself seems to mean many thingsto many people and there has been much confusion and misapplication in itsimplementation. Therefore, there is a need to clearly understand the level of people'sparticipation, that is necessary to achieve the goals of a specific programme on fisheries.To arrive at such an understanding, people's participation should be looked at in terms of:
i)ii)iii)iv)v)
I
quality of participation,types of participation possible,phases of participation,proportion of those potentiallly affected who really participate in such schemes,representativeness and accountability of the leader and the local organisations ofthe potentially affected community, anddegree of people's participation in terms oflabour and money inputsvi)
Participation, with its peculiar dual nature of being a tool and an end to be achievedby the tool, suggests that, no matter how little the participation is to begin with, it is apositive step towards not merely efficient and socially feasible action but towardsdevelopment itself. Development, welfare and problem - solving were, in the past,activities that families, kinfolk and communities talked. But with development and welfare
247

increasingly and unfortunately, often exclusively becoming government responsibilities,or at best, agency functions, the question of who participate in whose activity becomesvery relevant.
Generally speaking, it is the Government / Development agencies who, nowadays,do something for the beneficiaries, whether this involves transferring technology orbuilding infrastructure, or whatever other task.
Organizations in participatory management
Participatory management activity by its very nature means working inmanagement process with groups and communities. The research agency and agents ofchange will have to make the management of the fisheries in reservoir /beel possible bythe people themselves rather than doing it for them. This shift in thinking will have farreaching implications not only to the management process but also to the agency's culture.A shift is required from the developer-developee hierarchy to a situation of partnershipwhere both the research / extension agency and the people see themselves as partners inthe management process. This shift in attitude might be required in the research/extensionagency to hold back on what it believes to be true, scientific and modem, and begin adialogue that, in time, will enable the beneficiary to, on his or her own, come to the samelearning - perhaps to a learning which blends the research/extension agencies learning withindigenous learnings and realities.
There are two essential aspects to the organizational approach - one facilitates day-to-day activity with the community choosing representatives to speak on its behalf orundertake specific talks, and the other involves empowering the community to make surethat it gets its rights and to hold external agencies responsible.
Research/extension agencies by their very nature, work with communities only fora short period of time. If the development activity has to be self-sustaining and self-perpetuating, then the participating people's organisation has to have permanence and theability to sustain the involvement of the community.
An important fact worth considering is that the existence of an organization in acommunity does not ensure people's participation. Frequently, only the wealthy andinfluential members of the community are benefitted by the organizations. It is also groundreality that several socio-cultural traditions tend to be authoritarian. In such communities,the leadership would oppose any form of organization that promotes democratic andegalitarian norms. The research/extension agency would then have to consider whether it
248

should use an existing traditional form of organization in the community or to help it toform a new one. Governments and research/extension agencies relevent to thedevelopment ofthe fisheries in reservoirs/beels are particularly attracted to the cooperativeform of organization. If it functions properly, it can be an ideal organization, ensuring :democratic management and egalitarian distribution of benefits. However, barring a fewisolated successes, the experience in general with fishermen cooperative societies has notbeen always encouraging.
In India,government considers the cooperatives ~s a channel for passing ondevelopment benefits to the community. It views underdevelopment in fisheries as a resultof primitive nature of the traditional technology leading to low productivity. So, itssolution has been to enable fish farmers/fishermen to acquire assets that would help themto obtain better yield.
The role of the organizations involved in parucipatory management isunderstandably very important and almost a necessity. However, it places a heavy burdenon the Government agencies' involved in research and extension which often has tostrengthen themselves and are accountable to the Government for their activities. Thus,they can not be depended upon to display such benevolence for all times. Therefore,participation through organization, in this sense, is much more unpredictable and difficultto plan. It suggests that there is need for the research/extension agency to commit itselffirst to participatory development and to the associated ideologies and attitudes, before itseeks strategies to foster organization among fish farmer/fishermen.
Meaningful participatory approach
Participation grows out of meaningful relationships that enable people to shareand work together. Th ere are several reasons why participation approaches succeed or fail.The reasons mentioned below could be considered as dos and don'ts for the developentalagencies. But it might be wiser to consider the suggestions more as guidance for givingdirection to the activity rather than deterrents to action.
Have a legitimate role : The management of reservoir/beel fisheries is a participatoryproject where a sort of negotiated activity in which people and the research/extension/developmental agencies work together for commonly shared objectives. To be able tonegotiate successfully, fish farmers/fishermen, scientists, extension functionaries anddevelopmental officials have not only to respect each group but also appreciate that thereis a legitimate role for each group to play. The agencies and their members must reallysee a role in the organisational process.
249
I;

Enable 'equalness'.to facilitate negotiation: For negotiations to be conductedmeaningfully, all involved such as the fish farmers, fishermen, scientists, extensionfunctionaries and developmental officials must be reasonably equal. Unfortunately,agencies and the people they negotiate with, are often at different levels not only in terms \of power but also of knowledge and ability. This could lead to the activity to be \implemented being more agency oriented. So, the agencies have the key role and theresponsibility of first creating 'equalness'. This can be achieved through educationalprogrammes that develop communication and negotiation skills as well as power ofanalysis. .
Begin with the needs of the people : For participatory management to be successful, it isnecessary for all the groups involved (mentioned earlier) to know what they want. Theagencies and the people have their own separate mandates. Not only the content, but thepriorities may also vary. But, if successful participation is the aim, a begining has to bemade with what, the people consider, are their needs and which, the agency agrees, areareas of concern.
Learn from and with people : Participation suggests that the people and the agency agreeto do something about the way things are to be moulded. But the agencies might not fullyappreciate the circumstances and predicament of the people unless it is willing to learnfrom them. Only by learning from, and with the people - their social dynamics and theirneeds and priorities, can the right agenda be mutually agreed upon and implemented withwhole-hearted participation of all in the community.
Build confidence as a prelude : People may be dissatisfied, but they must do somethingabout that dissatisfaction. More important, they must have the confidence that they havethe ability to do something about themselves. A whole range of cultural, social andhistorical factors, including past failures, can weaken this confidence. Thus, confidence-building is a task. The agencies may have to set itself before participation can be assured.
Help organisation to emerge : Some form of organization like Fishermen CooperativeSociety, Fish Club, etc., is necessary if participatory management is to succeed becausethere is a need to take decision, take responsibility for particular tasks, allocate tasks, allof which can be done better when a community or group is organised.
No autocratic behaviour: Scientists/extension functionaries/developmental officials oftenfeel that they alone know what needs to be done, Since they are not democratic in theirown functioning and not participative in their decision making, it will be extremely
250

difficult for them to convince communities they work with. In most cases, thecharacteristics and behaviour of the communities can be the most important factorsdetermining the success of participatory management.
Flexible approach : The agencies usually tend to specialise in order to be more efficient.Their managerial cultures also tend to make them more rigid and time-conscious. Inparticipatory management, where others are involved, these characteristics may workagainst the activity. The people's needs may not coincide with the agency's capabilities,the time taken to achieve something real in the field may not fit well with reporting andbudgeting schedules, and mid-course corrections may not be easy to bring in. Agenciesneed to have a far more flexible approach to their work if they wish to promoteparticipation.
No place for unilateral decisions : The participatory approach grows out ofthe exchangeofthe agency's knowledge with that of people and the process blends the modern and thescientific with the traditional and the indigenous. If the agencies really intend to becomeparticipative, the directions, objectives and priorities must evolve out of negotiation andnot out of unilateral decisions.
Need to realise limitations : If the agencies wish to work with and help to develop acommunity, it really has only two choices viz.,
• it can diversify its capabilities or bring in other agencies to be able to address thespecial needs of the people; or
• it can accept its limitations and negotiate for the use of its particular ability, ofcourse, keeping in mind that management in these circumstances would only bepartial
The agencies must be more realistic about the objectives that can be achieved, given theirlimited capabilities.
Getting the people do more : Agencies must do less and help people to do more. Sincethe goal is to get the people to do it at their own, the agencies should design tools withwhich they can get others to do what agencies have the expertise to do. Ifthe communitiesare to participate actively in the management process, the technology and techniques willhave to be demystified, made simpler and more accessible. The agencies will have torelease information freely to the people.
251
!;

Coping with change : Working with communities, empowering them, and enabling themto work with justice and democracy, the agencies will find the community going throughbasic structural changes. The agencies have to face, accept and cope with those changesand their implications.
Conclusion
The experience with people's participation in fisheries-related activities was.initially limited. Significantly, it was the last sector to change from top-down approachto a bottom-up one. However, at present, concerted efforts must be made to prioritiseparticipatory management approach for not only getting better fish production from thereservoirs and beels of the country but also for eradicating poverty from the rural areas.
References
Anon, 1933. Encyclopaedia of Social Sciences. London.
Ahmed, M. 1982. Community participation: The least of health care. In Progress in ruralextension and community development. Ed. by G. E. Jones and M. J. Rolls.New York.
Bhava, N. 1978. People's participation in development administration in India. UppalPublishing House, New Delhi.
Bhasin, K. and B. Malik, 1985. Small farmers of Nepal show the way. Ideas and Action.New York.
Chambers, R. 1983. Rural development: whose knowledge counts? IDS Bulletin, 10 (2),London.
Dasgupta, A. 1969. Indian business and management, University of Delhi Publication.
Kurien, J. 1980 .. Fishermen's cooperatives in Kerala :, A critique, BOBP Bulletin,Madras.
***********
252
.>'
Copyright © 2022 FDOKUMEN