Reduction of the Storage Capacity of two Small Reservoirs in Jordan
21
Journal of Earth Sciences and Geotechnical Engineering, vol. 2, no. 1, 2012, 17-37 ISSN: 1792-9040(print), 1792-9660 (online) International Scientific Press, 2012 Reduction of the Storage Capacity of two Small Reservoirs in Jordan Nadhir A. Al-Ansari 1 and S. Knutsson 1 Abstract Scarcity of water resources in the Middle East represents a prime factor in the stability of the region and its economic development and prosperity. Accordingly, augmenting water is considered very important. Therefore, building of dams is an important mean to achieve such a goal. Despite the fact that number of dams had been built but maintenance operations and reduction of siltation rates are still not up the standards. Two small reservoirs, north West Jordan, were investigated. Sad Wadi Alarab reservoir constructed in 1986 (storage capacity of 20x10 6 m 3 ). The second, Alghadeer Alabyadh, was constructed 1966(storage capacity 7 x10 5 m 3 ). The actual storage capacities of these reservoirs were calculated using echo-sounding traverses. Data obtained were used in special computer software to construct the bathymetric maps and calculate the existing storage volume. The results showed that the reservoir storage capacities were reduced at an average annual rate of 0.3 x10 6 and 1.7 x10 4 m 3 respectively. This implies that Sad Wadi Alarab reservoir will be filled with sediment within 38 years, while Alghadeer Alabyadh reservoir is already filled with sediment now. Bottom sediments of the reservoirs were collected and analyzed. In all the cases, sand, silt and clay were the dominant sediment components. 1 Department of Civil, Environmental and Natural Resources and Engineering, Lulea University of Technology, Sweden, e-mail:[email protected]
Transcript of Reduction of the Storage Capacity of two Small Reservoirs in Jordan

Journal of Earth Sciences and Geotechnical Engineering, vol. 2, no. 1, 2012, 17-37 ISSN: 1792-9040(print), 1792-9660 (online) International Scientific Press, 2012
Reduction of the Storage Capacity of two Small Reservoirs in Jordan
Nadhir A. Al-Ansari1 and S. Knutsson1
Abstract
Scarcity of water resources in the Middle East represents a prime factor in the
stability of the region and its economic development and prosperity. Accordingly,
augmenting water is considered very important. Therefore, building of dams is an
important mean to achieve such a goal. Despite the fact that number of dams had
been built but maintenance operations and reduction of siltation rates are still not
up the standards.
Two small reservoirs, north West Jordan, were investigated. Sad Wadi Alarab
reservoir constructed in 1986 (storage capacity of 20x106 m3). The second,
Alghadeer Alabyadh, was constructed 1966(storage capacity 7 x10⁵ m3).
The actual storage capacities of these reservoirs were calculated using
echo-sounding traverses. Data obtained were used in special computer software to
construct the bathymetric maps and calculate the existing storage volume. The
results showed that the reservoir storage capacities were reduced at an average
annual rate of 0.3 x10⁶ and 1.7 x10⁴ m3 respectively. This implies that Sad Wadi
Alarab reservoir will be filled with sediment within 38 years, while Alghadeer
Alabyadh reservoir is already filled with sediment now.
Bottom sediments of the reservoirs were collected and analyzed. In all the cases,
sand, silt and clay were the dominant sediment components.
1Department of Civil, Environmental and Natural Resources and Engineering, Lulea University of Technology, Sweden, e-mail:[email protected]

18 Reduction of the Storage Capacity…
Keywords: Siltation of Reservoirs, Sad Wadi Alarab, Alghadeer Alabyadh,
Jordan
1 Introduction Jordan among other Arab countries is very poor in its water resources [1,2,3 and
4]. Consequently, water availability is a serious and urgent issue. One of the
means of augmenting water budgets is to control surface flows by building
reservoirs. To maintain long life operation of these reservoirs, it is evident that
siltation problems should be carefully monitored. High rates of sedimentation will
eventually lead to reduction of the storage capacity of the reservoirs. In such a
case, they are no longer economically feasible in river basins where water is
scarce.
Effective use of water requires sustainability of the reservoir. To achieve this goal,
minimizing sedimentation problems and in consequence keeping high storage
capacity is a must. In this investigation Wadi Arab and Alghadeer Alabyadh
reservoirs (Figure 1) have been studied to monitor the amount and nature of
sediment deposited within them. This can help decision-makers to put best
solutions into practice.

Nadhir Al-Ansari and Sven Knutsson
Figure 1: Location map of Wadi Al-Arab and Alghadeer Alabyadh dams
2 Field techniques
2.1 Storage Capacity Echo-sounding traverses were made between known points, to cover the entire
area of the reservoir (see Figure 2a and b). All traverses were perpendicular to the
longest axis of the reservoirs. A Traverse Total Station (Model SOKKIA SET F6)
was used to carry out the land survey while two echo sounding devices
(Models Eagle Ultra III 3D and Sonarlite SL2.0 OHMEX) mounted on an
inflatable boat were used to survey the water depth. All end points of the surveyed
traverses were connected to a well-known Benchmark. A Note pad computer was
connected to the echo sounder so that all survey points could be recorded. The
survey data were fed to Arc View3.1 and WMS5.0 software. The former is
produced by Environmental Systems Research Institute (ESRI), the makers of
ARC/INFO, the leading geographic information system (GIS) software. WMS
version 5.0 (Watershed Modeling System) was developed by the Engineering
Computer Graphics Laboratory of Brigham Young University in cooperation with
the U.S. Army Corps of Engineers Waterways Experiment Station (for more
details see[5]). WMS 5.0 was used to create terrain models from Triangulated
Irregular Networks, or TINs. The TIN was in turn used for delineating the data.
Both software packages have been utilized for the construction of the bathymetric
chart of each reservoir (see Figures 7 and 14).

20 Reduction of the Storage Capacity…
2a 2b
Figure 2: Transverse sections and sampling locations of bottom sediments within
reservoirs of (a) Wadi Al-Arab and (b) Alghadeer Alabyadh dams.
2.2 Bottom Sediment
To study the nature of bottom sediment of the two reservoirs, a van veen grab was
used to collect the samples (Table 1). The exact location of each sample was fixed
using GPS. Samples were collected covering the entire bottom of the reservoir
(see figure 2). The samples were dried and sieved to estimate the sand content.
The fine portions (silt and clay) were determined by pipette analysis. Folk’s [6]
procedure was used for in the evaluation of the statistical parameters of the
sediment samples. This was applicable only for samples having cumulative curves
percentages more than 95% of the total sample
D a m
r ese r v o i r # Sampl i n g
Loca t i o n
T r a n s v e r s e Se c tio n s
a n d
S a mp lin g
L o ca t io ns
wi th in
Wa d i
A l- A r ab
D a m
R e s e r o i r
0. 2 0 0 . 2 0. 4 Ki l ometer s
N
# #
#
# #
#
# #
#
# #
# #
# #
# #
#
# #
#
# #
#
# #
#
# #
# #
# #
#
#
20 96 0 0
20 96 0 0
20 980 0
20 980 0
21 0 0 0 0
21 0 0 0 0
21 0 20 0
21 0 20 0
21 0 40 0
21 0 40 0
21 0 6 0 0
21 0 6 0 0
21 0 80 0
21 0 80 0
21 1 0 0 0
21 1 0 0 0
21 1 20 0
21 1 20 0
211 40 0
211 40 0
211 60 0
211 60 0
21 1 80 0
21 1 80 0 2246 0 0 2246 0 0 22480 0 22480 0 2250 0 0 2250 0 0 22520 0 22520 0 22540 0 22540 0 2256 0 0 22560 0
T r a nsv e r se
secti o ns

Nadhir Al-Ansari and Sven Knutsson
Table 1: Number of bottom sediment samples collected from the two reservoirs.
Reservoir No. of Samples
Wadi Sad Al-Arab dam
Alghadeer Alabyadh
40
27
3 Wadi Sad Al-Arab Dam Wadi Al-Arab dam is a rock fill dam located at the south of Yarmouk River in the
northern parts of Jordan. It drains an area of 267 km2 and has a maximum storage
capacity of 20MCM. Wadi Zaher, trending north north-west toward the south
south-east, is the main area providing water for the main tributary within the
basin. The Catchment area is mostly covered by undifferentiated plateau gravels.
The Upper and Lower Terrace deposits are mainly of Quaternary age. The latter
sediments are mainly composed of sand, silt, clay and debris of chalky marl and
basalt. The basalts are of Quaternary to Neogen in age. Talus deposits are also
present in the catchment area and overlay the Upper and Lower Terrace deposits.
In addition, the Belqa Group is mainly covered by the Lower Terrace deposits and
is consisting of medium to light weathered chalky marl stones ranging in color
from light to dark yellow [7].
The average annual rainfall reaches 400 mm. Rainfall season is normally
extending from October to April, but most of the rain (> 60%) is confined to the
period from December to February. Meteorological records show wide variation
of temperature values between summer and winter. Daily maximum temperature
reaches up to 40oC during summer and drops to lower than 10oC in winter. The
mean monthly temperature however, ranges between 31oC (maximum) and 14oC

22 Reduction of the Storage Capacity…
(minimum). In addition the daily temperature variation is also large, reaching
about 16oC in daily difference. Potential evaporation ranges from 2mm to 6mm
during winter and summer respectively.
Daily sunshine hours in the area may reach 12 hours in summer and drops to 5
hours during winter. In consequence the solar radiation rays vary from
600cal/cm2/day to 220cal/cm2/day for summer and winter periods respectively.
Furthermore, the relative humidity reaches 50% during summer while it goes up to
65% during winter. The average annual monthly wind speed is of the order of
2.4m/sec.
Nippon Koei and Naigai Eng. Companies estimated runoff values in 1978 [8].
They stated that the average annual runoff of Wadi Arab is about 1.05m3/sec. It
was also noted that the past maximum flood was estimated to be of the order
170m3/sec (as observed at a bridge down stream from the dam). Furthermore, they
considered that the estimated probable maximum flood discharge was 900 m3 /s.
3.1 Nature of Bottom Sediment Forty samples were collected covering the entire bottom of the reservoir (see
Figure 2 a). The analysis indicates that the reservoir bed is mainly covered by sand
(81%), silt (14%) and clay (5%). Curves of cumulative percentage versus diameter
were constructed on logarithmic probability paper (Figure 3). The curves were
similar containing two straight segments round 0.0625mm. All the curves showed
relatively gentler slope beyond 0.0625mm. The steepness of the curve is a
reflection of scales. The change of gradient of the curves indicates a bimodality of
the sediment. The inflection occurs at the boundary between sand and silt. Each
straight segment reflects specific process or mode of deposition. In the case of
Wadi Arab sediment it is believed that the sand was transported by saltation while
the silt and clay fractions were transported by suspension in the water.
Sand covers the entire bottom area of the reservoir (Figure 4). There is no major
change in sand percent distribution, but the southern parts of the reservoir have
Nadhir Al-Ansari and Sven Knutsson
relatively higher sand percentages. This may be attributed to agricultural and
human activities on the southern slopes of the reservoir, in addition to the valley’s
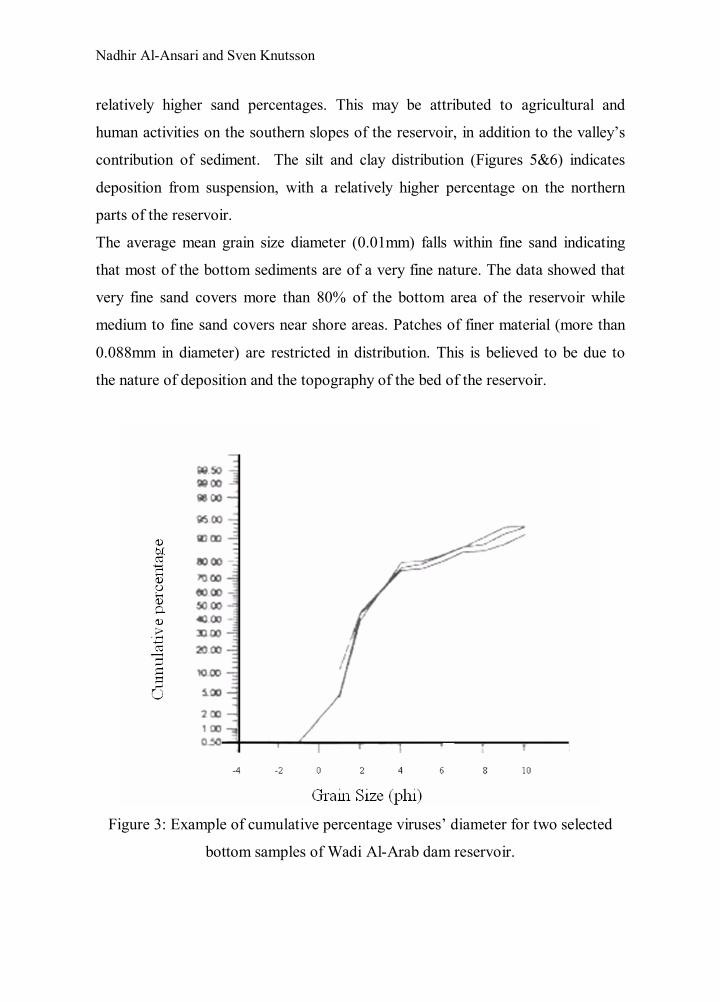
contribution of sediment. The silt and clay distribution (Figures 5&6) indicates
deposition from suspension, with a relatively higher percentage on the northern
parts of the reservoir.
The average mean grain size diameter (0.01mm) falls within fine sand indicating
that most of the bottom sediments are of a very fine nature. The data showed that
very fine sand covers more than 80% of the bottom area of the reservoir while
medium to fine sand covers near shore areas. Patches of finer material (more than
0.088mm in diameter) are restricted in distribution. This is believed to be due to
the nature of deposition and the topography of the bed of the reservoir.
Figure 3: Example of cumulative percentage viruses’ diameter for two selected
bottom samples of Wadi Al-Arab dam reservoir.

24 Reduction of the Storage Capacity…
Figure 4: Sand percentage in Wadi Al-Arab dam reservoir
Figure 5: Silt percentage in Wadi Al-Arab dam reservoir.
Nadhir Al-Ansari and Sven Knutsson
Figure 6: Clay percentage in Wadi Al-Arab dam reservoir.
3.2 Storage Capacity The dam has been designed so that its effective storage capacity is 16.9 x10⁶ m3
while its dead storage is 3.1 x10⁶ m3. This gives a gross storage capacity of 20
x106 m3. The rock fill dam has a crest length of 82.5m at a crest elevation of
101.5m below mean sea level. The dam has a spillway, which is a side overflow
weir with channel. The spillway crest length is 85m with a 193m long chute
ranging in width from 14-20m. The designed discharge of the spillway equals
840m3/sec. The plunge pool length extends 140m [9].
The maximum length of the reservoir is about 1700m extending west-east with a
width ranging between 350 to 500m. Water enters the reservoir from two main
valleys from the east and number of smaller valleys from the north and south. The
northern part of the reservoir is characterized by much steeper slopes than the
southern slopes.
In 1999, Al-Ansari and Al-Alami [5] surveyed the reservoir. They found that the
rate of sedimentation was of the order of 0.446857 x10⁶ m3 per year.
Thirteen echo-sounding traverses were made between known points during the

26 Reduction of the Storage Capacity…
period of November 2006, to cover the entire area of the reservoir (see Figure 2 a).
The water level was 120m below mean sea level. It should be mentioned however
that the traverses used were on the same location executed by Al-Ansari and Al-
Alami in 2003[5] for the purpose of comparison.
The new bathymetric chart (see Figure 7) is more or less similar in shape to the
original topographic maps of the area. The exception is the effect of sedimentation
within the body of the reservoir. As far as the map produced by Al-Ansari and Al-
Alami in 2003 [5], there was almost no differences apart of some small deviations
in the depths of some points. The deepest point recorded was –151.5 meters
below mean sea level. It is evident that the slope of the bed of the reservoir
gradually drops toward the dam.
The deepest area lies directly east of the dam. Both sides (northern and southern)
of the reservoir are characterized by their steep slopes near the dam site. Moving
toward the east, the slopes become relatively gentler. The bed of the reservoir,
however, is more or less gentle in its slope. It seems that sediments were deposited
in the main valley course causing a generally flat bed shape. The results are shown
in figure (7).
This indicates that the maximum storage capacity of Wadi Al-Arab dam reservoir
is 11.996 x10⁶ m3 after the last survey. This figure suggests that the average
annual sediment deposition rate is of the order of 0.313546 x10⁶ m3 per year for
the period 1999 to 2006. This rate is less than that calculated by Al-Ansari and Al-
Alami in 2003 [5] (0.446857 x10⁶ m3 per year). It is believed that the scarcity of
rainfall during after 1999 is responsible for the reduction in the sediment volumes
transported to the reservoir. As a consequence, the long term siltation rate is
0.4002 x10⁶ m3 per year. Using the data obtained from the survey the area-depth
relationship in Wadi Al-Arab dam reservoir was established (Figure 8). In view of
the above, it seems that the life span of the reservoir will be of the range 26 (when
using the rates of siltation calculated by Al-Ansari and Al-Alami [5]) to 38 years
(using present rates of siltation) depending on the rates of sedimentation

Nadhir Al-Ansari and Sven Knutsson
deposition.
Figure 7: Bathymetric chart of Wadi Al-Arab dam reservoir.
Figure 8: Area-depth relationship in Wadi Al-Arab dam reservoir.

28 Reduction of the Storage Capacity…
4 Alghadeer Alabyadh dam Alghadeer Alabyadh dam is a concrete dam located at the north west of Mafraq
city in the northern parts of Jordan. The dam drains a catchment area of about 50
square kilometers. The designed maximum storage capacity is 0.7 x10⁶ m3 [10].
Wadi Alghadeer, trending south-east toward the north-west, is the main tributary
within the basin. The catchment area is mostly covered by soil. The Upper and
Lower Terrace deposits are mainly of Quaternary age. The latter sediments are
mainly composed of sand, silt, clay and debris of chalky marl and basalt. The
basalts are of Quaternary to Neogen in age. In addition the northwestern part of
the catchment area Amman silicified Limestone and Al-Hisa Phosphorite is the
dominant rock units. It consists of alternating beds of micritic limestone with chert
varying thickness in addition to alternating beds of phosphatic chert, phosphatic
limestone with chert and phosphate. The micritic limestone percent is increasing
towards the top. The depositional environment of these beds is marine shelf type
[11]. In Southeast, Wadi es Sir Limestone Formation is the dominant rock unit.
This formation is considered as the top of Ajlun group. It is well exposed in the
south west, west and central parts. Its thickness rang from 90 to 110 m.
The average annual rainfall is less than 100 mm. Rainfall period extends from
October to May, but most of the rain (> 60%) is confined to the period from
December to February. Meteorological records show wide variation of
temperature values between summer and winter. Daily maximum temperature
reaches up to 37.3oC during summer and drops to less than 5oC in winter. The
mean monthly temperature however, ranges between 32oC (maximum) and 6oC
(minimum). In addition, the daily temperature variation is also large, reaching
about 17.5oC in daily difference. Potential evaporation ranges from 3.5mm to
21.7mm during winter and summer respectively. Daily sunshine hours in the area
may reach 12 hours in summer and drops to 5.6 hours during winter. Furthermore,
the relative humidity reaches 41% during summer while it goes up to 71% during
winter. The average annual monthly wind speed is of the order of 200km/day.

Nadhir Al-Ansari and Sven Knutsson
Runoff value is estimated to be around 3.08 % [12].
4.1 Nature of Bottom Sediment Twenty seven samples were collected covering the entire bottom of the reservoir
(see Figure 2b). The analysis indicates that the reservoir bed is mainly covered by
sand (74.8%), gravel (17.3%), silt (4.7%) and clay (3.2%). Curves of cumulative
percentage versus diameter were constructed on logarithmic probability paper
(Figure 9). The curves were similar containing two straight segments round
0.0625mm. All the curves showed relatively gentler slope beyond 0.0625mm. The
steepness of the curve is a reflection of scales. The change of gradient of the
curves indicates a bimodality of the sediment. The inflection occurs at the
boundary between sand and silt. Each straight segment reflects specific process or
mode of deposition. In the case of Alghadeer Alabyadh dam sediment it is
believed that the sand was transported by saltation while the silt and clay fractions
were transported by suspension in the water.
Sand covers the entire bottom area of the reservoir (Figure 10). There is no major
change in sand percent distribution, but within the southern parts and northeastern
parts of the reservoir have relatively a high percent of gravel reaches 23% (see
Figure 11). This may be attributed to agricultural and human activities, in addition
to the valley’s contribution of sediment. The silt and clay distribution (Figures
12&13) indicates deposition from suspension, with a relatively higher percentage
on the middle northern parts of the reservoir.
The average mean grain size diameter distribution shows that fine sand covers
more than 70% of the bottom area of the reservoir while medium to fine sand
covers near shore areas. Patches of finer material (more than 0.09mm in diameter)
are restricted in distribution. This is believed to be due to the nature of deposition
and the topography of the bed reservoir. The above figures and facts reflect the
nature of sediments and their transport mechanism. The sediments within the
source area are of a very fine nature. Furthermore, almost all the sediments are

30 Reduction of the Storage Capacity…
transported by dragging, saltation and suspension. The nature of the sediments and
their distribution mode is similar to many other reservoirs in the world [13] [14].
Figure 9: Example of cumulative percentage viruses diameter for two selected
bottom samples of Alghadeer Alabyadh dam reservoir.
Figure 10: Sand percentage in Alghadeer Alabyadh Dam reservoir’s floor.

Nadhir Al-Ansari and Sven Knutsson
Figure 11: Gravel percentage in Alghadeer Alabyadh Dam reservoir’s floor.
Figure 12: Silt percentage in Alghadeer
Alabyadh Dam reservoir’s floor.
32 Reduction of the Storage Capacity…
4.2 Storage Capacity The dam had been designed so that its effective storage capacity is 0.7 x10⁻⁶ m3.
The concrete dam has a crest length of 100 m at a crest elevation of 665m above
mean sea level. The dam has an outlet, which is a side overflow weir without
channel. The outlet elevation is 663.5 m. The maximum length of the reservoir is about 500m extending west-east with a
mean width of about 400m. Water enters the reservoir from an only main
southeastern valley. The western part of the reservoir is characterized by steeper
slopes compared to the southern part which are relatively flat.
Nine echo-sounding traverses were made between known points during the period
of November 2004, to cover the entire area of the reservoir (see Figure 2b). The
water level was 662 m above mean sea level.
The new bathymetric chart (see Figure 14) shows the huge amount of sediment
accumulation within the reservoir. The deepest point recorded was 661.6meters
above mean sea level. It is evident that the slope of the bed of the reservoir
gradually drops down in elevation from the south toward the north where the
Alghadeer Alabyadh dam is situated.

Nadhir Al-Ansari and Sven Knutsson
Figure 13: Clay percentage in Alghadeer Alabyadh Dam reservoir’s floor.
Figure 14: Bathymetric chart of Alghadeer Alabyadh Dam reservoir

34 Reduction of the Storage Capacity…
The deepest area lies directly south of the dam. Northern parts of the reservoir are
characterized by its steep slopes near the dam site. Moving towards the
southeastern parts of the reservoir the slopes are much gentler. The bed of the
reservoir, however, is more or less gentle in its slope. Comparing the new
bathymetric map with all topographic maps of the area, it is evident that sediment
was deposited all over the reservoir area forming a generally flat bed shape. The
results are shown in figure (14).
The present storage capacity for Alghadeer Alabyadh dam reservoir has been
calculated to be about 0.028965 x10⁶ m3 indicating huge reduction in storage
capacity of the reservoir. The comparison of this value with the designed storage
capacity suggests that 0.671034 x10⁶ m3 of sediments have been deposited during
the life span of the reservoir. Consequently, the average annual sediment
deposition rate is of the order of 0.017206 x10⁶ m3 per year. Walling et al [15]
calculated the rate of erosion within the area using Cs137. The calculations were
based on one point sample and it showed a high sedimentation rate. This might be
due to the fact that sediment composed of fine particles will generally have higher
137Cs content than sediment composed of coarser particles from the same source
(cf. [16]; [17]). According to the calculated rates of deposition the reservoir is
filled with sediments and can not be of any value now.
5 Conclusions Fine sand was the dominant sediment covering the bed of both reservoirs. It seems
that the sediment was mainly transported by suspension and saltation.
The rate of siltation in Wadi Al-Arab dam reservoir was of the order of 0.4002
x10-6 m3 while it was 0.017206 x10⁻⁶ m3 per year in Alghadeer Alabyadh dam
reservoir. This difference reflects the differences in the geology, topography and
meteorology of the two catchments. The catchment of the former is mountainous
with relatively high amount of rain when compared with Alghadeer Alabyadh
Catchment which is a plain area lying on the verge of the desert.

Nadhir Al-Ansari and Sven Knutsson
Wadi Alarab reservoir will be filled with sediment within 38 years maximum, while
Alghadeer Alabyadh reservoir is already filled with sediment now.
References [1] Al-Ansari, N.A. Water resources in the Arab countries: Problems and
possible solutions. UNESCO International conf. (Water: a looming crisis), Paris,
1998, pp367-376.
[2] Baban, S. and Al-Ansari, N.A (Eds.). Living with Water Scarcity, Water
Resources in the Jordanian Badia Region. The Way Forward, Al al-Bayt Univ.
Publications, Jordan. 2001.
[3] Rogers, P. and Lydon, P.(Eds.). Water in the Arab World: Perspectives and
Prognoses, Harvard Univ. Press. 1993.
[4] Marakawi, M. Managing Water for Peace in The Middle East: Alternative
Strategies, UN University Press, N.Y. 1995
[5] Al-Ansari,N.A. and Al-Alalami, H. Reduction of Water Storage Capacity of
the Wadi Arab Dam (Jordan) due to Reservoir Sedimentation, Al Manara Journal
for scientific studies and research, Volume 9, No2, 2003,pp 155-168.
[6] Folk, R.L. Petrology of Sedimentary rocks, Hemphill’s, Austin, Texas.
,1973.
[7] Jordan Valley Authority., Meteorological Investigation of Wadi Alarab
Dam, Internal Report, Amman, Jordan. 1982.

36 Reduction of the Storage Capacity…
[8] NIPPON KOEL and NAIGAI ENG. Co. Detailed Survey and Investigation
Report on Wadi Arab dam and Irrigation Project. 1978.
[9] Ministry of Water and Irrigation.Hydrological and Geological
Investigation of Sad Wadi Alarab Dam, Final Report, Amman, Jordan. 1978.
[10] Agrar and Hydrotecnik . National Water Resources Master Plan of Jordan. 8
Volumes, Essen, Hannover. 1997.
[11]Al-Ansari,N.A. and Salameh, E.,1999, Water Resources in Mafraq
Governorate, Proceeding of the conference on New Horizons for Economic and
Social Development in Jordanian Badia and Countryside, Al al Bayt University,
pp 56-78.
[12] Salameh, E.,AL-Ansari, N.,EI-Naqa, A. Scientific Guide Book To Mafraq
Governorate, Al al-Bayt University, Jordan. 1997.
[13] Al-Ansari, N. A. (Ed.) Hemrin Reservoir: Geological and Hydrological
Investigation, J. Water Resources, Special Pub., No. 2. 1987.
[14] McManus, J. and Duck, R. W. Geomorphology and Sedimentology of
Lakes and Reservoirs, John Wiley and Sons, New York.1993.
[15] Walling, D.E.; He, Q.P. and Al-Ansari, N.A. The Redistribution of Fallout
Cesium 137 in the Catchments of the Jordanian Badia, in: Baban, S. and Al-
Ansari, N.A, (Eds.), Living With Water Scarcity, Water resources in the Jordan
Badia Region, The Way Forward, Chapter 10, Al al-Bayt University Publication,
Jordan. , 2001.

Nadhir Al-Ansari and Sven Knutsson
[16] Walling, D.E and Woodward, J.C. Use of radiometric fingerprinting to derive
information on suspended sediment sources. IAHS Publ. No. 210, 1992,
pp153-164.
[17] Walling, D.E. and He, Q. Models for Converting 137Cs Measurements to
Estimates of Soil Redistribution Rates on Cultivated and Uncultivated Soils
(Including Software for Model Implementation). Report to IAEA, University of
Exeter, UK, 1997.