PETROPHYSICAL DESCRIPTION AND ASSESSMENT OF STORAGE AND FLOW CAPACITY IN THE TRIASSIC KURRACHINE...
16
SPWLA 51 st Annual Logging Symposium, June 19-23, 2010 1 PETROPHYSICAL DESCRIPTION AND ASSESSMENT OF STORAGE AND FLOW CAPACITY IN THE TRIASSIC KURRACHINE DOLOMITE RESERVOIRS OF ASH SHAER FIELD, PALMYRA, SYRIA Jonathan Hall 1 , Peter Gutteridge 2 , Lana Hamdoun 3 , Mike Millar 1 , Iain Stott 4 ( 1 Suncor (formerly Petro-Canada), London U.K., 2 Cambridge Carbonates, U.K., 3 Petro-Canada, Palmyra B.V., Damascas, Syria, 4 Logicom E & P Ltd., U.K. Copyright 2010, held jointly by the Society of Petrophysicists and Well Log Analysts (SPWLA) and the submitting authors. This paper was prepared for presentation at the SPWLA 51 st Annual Logging Symposium held Perth, Australia, June 19-23, 2010. ABSTRACT The use of a multimineral log evaluation model and the availability of cores, borewall image logs, nuclear magnetic resonance logs, dipole sonic logs and well test results helped to reappraise the development strategy for the Ash Shaer gasfield in central Syria. The Triassic Kurrachine Dolomite Formation at the Ash Shaer gasfield, comprises repeated sequences of mudrocks, dolomitised carbonate mudstone and wackestone, peritidal limestones, subaqueous anhydrite and halite. These were deposited in a restricted basin that was intermittently connected to the Neo-Tethys Ocean. Almost all of the observed porosity in the Kurrachine Dolomite is secondary porosity. Early dolomitisation processes occurred at shallow depth by seepage of saline brines associated with evaporite deposition. Burial dolomitisation processes, such as displacive dolomite veining, created euhedral crystal-lined porous and permeable 'zebra structures’ and dolomite breccias. Some of these were partly or completely filled by anhydrite cements. Results of fluid inclusion studies suggested that the timing of reservoir hydrocarbons’ charge was after the late-stage burial dolomitisation and involves high temperature hydrothermal fluids. The original Kurrachine limestones were deposited in low energy subtidal and peritidal conditions, they were very fine grained and often argillaceous. Only limited primary porosity in the peritidal limestones remains and this appears to be where the fenestral pores were not completely cemented. Natural fractures occur mainly within the limestones but their propagation was limited by less competent dolomite and anhydrite rocks. Natural fractures in these carbonates are consistently aligned and appear to be regional layer bound joint sets rather than faults as no significant displacement is observed. Fracture density may also be related to individual bed thicknesses. These fractures offer very low storage capacity but contribute to gas production rates. Repeated depositional successions are highly correlatable such that reservoir connectivity of individual beds is assured, although porosity and permeability may vary laterally. Late stage dolomitisation in the productive Middle Kurrachine Dolomite correlates at a twenty metre-thick reservoir unit across Ash Shaer and neighbouring fields, suggesting that cubic kilometers of this unit were affected. A detailed study of available core provided an accurate description of the reservoir lithologies and cycles revealed a geometrical relationship between flow capacity (permeability) and storage capacity (dynamically effective porosity plus micro-porosity) for each reservoir facies. INTRODUCTION The Ash Shaer Field is located in the NE Palmyrides, Syria (Figure 1). It is a broad domal structure aligned NNE and is approximately 10x20km in size. Fig. 1 Location of the Ash Shaer Field D D
-
Upload
royalholloway -
Category
Documents
-
view
4 -
download
0
Transcript of PETROPHYSICAL DESCRIPTION AND ASSESSMENT OF STORAGE AND FLOW CAPACITY IN THE TRIASSIC KURRACHINE...
SPWLA 51st Annual Logging Symposium, June 19-23, 2010
1
PETROPHYSICAL DESCRIPTION AND ASSESSMENT OF STORAGE AND FLOW CAPACITY IN THE TRIASSIC KURRACHINE DOLOMITE
RESERVOIRS OF ASH SHAER FIELD, PALMYRA, SYRIA Jonathan Hall1, Peter Gutteridge2, Lana Hamdoun3, Mike Millar1, Iain Stott4
(1 Suncor (formerly Petro-Canada), London U.K., 2 Cambridge Carbonates, U.K., 3 Petro-Canada, Palmyra B.V., Damascas, Syria, 4 Logicom E & P Ltd., U.K.
Copyright 2010, held jointly by the Society of Petrophysicists and Well Log Analysts (SPWLA) and the submitting authors.
This paper was prepared for presentation at the SPWLA 51st Annual Logging Symposium held Perth, Australia, June 19-23, 2010. ABSTRACT The use of a multimineral log evaluation model and the availability of cores, borewall image logs, nuclear magnetic resonance logs, dipole sonic logs and well test results helped to reappraise the development strategy for the Ash Shaer gasfield in central Syria. The Triassic Kurrachine Dolomite Formation at the Ash Shaer gasfield, comprises repeated sequences of mudrocks, dolomitised carbonate mudstone and wackestone, peritidal limestones, subaqueous anhydrite and halite. These were deposited in a restricted basin that was intermittently connected to the Neo-Tethys Ocean. Almost all of the observed porosity in the Kurrachine Dolomite is secondary porosity. Early dolomitisation processes occurred at shallow depth by seepage of saline brines associated with evaporite deposition. Burial dolomitisation processes, such as displacive dolomite veining, created euhedral crystal-lined porous and permeable 'zebra structures’ and dolomite breccias. Some of these were partly or completely filled by anhydrite cements. Results of fluid inclusion studies suggested that the timing of reservoir hydrocarbons’ charge was after the late-stage burial dolomitisation and involves high temperature hydrothermal fluids. The original Kurrachine limestones were deposited in low energy subtidal and peritidal conditions, they were very fine grained and often argillaceous. Only limited primary porosity in the peritidal limestones remains and this appears to be where the fenestral pores were not completely cemented. Natural fractures occur mainly within the limestones but their propagation was limited by less competent dolomite and anhydrite rocks. Natural fractures in these carbonates are consistently aligned and appear to be regional layer bound joint sets rather than faults as no
significant displacement is observed. Fracture density may also be related to individual bed thicknesses. These fractures offer very low storage capacity but contribute to gas production rates. Repeated depositional successions are highly correlatable such that reservoir connectivity of individual beds is assured, although porosity and permeability may vary laterally. Late stage dolomitisation in the productive Middle Kurrachine Dolomite correlates at a twenty metre-thick reservoir unit across Ash Shaer and neighbouring fields, suggesting that cubic kilometers of this unit were affected. A detailed study of available core provided an accurate description of the reservoir lithologies and cycles revealed a geometrical relationship between flow capacity (permeability) and storage capacity (dynamically effective porosity plus micro-porosity) for each reservoir facies. INTRODUCTION The Ash Shaer Field is located in the NE Palmyrides, Syria (Figure 1). It is a broad domal structure aligned NNE and is approximately 10x20km in size.
Fig. 1 Location of the Ash Shaer Field
DD

SPWLA 51st Annual Logging Symposium, June 19-23, 2010
2
Fig. 2 Location of the Palmyride oil and gas accumulations within the Kurrachine restricted basin (dated 227Ma). The main reservoir unit is the Kurrachine Dolomite which is a sequence of regionally correlatable Triassic platform carbonates, shales and evaporates. Many Kurrachine Dolomite fields in the Palmyrides are naturally fractured which can aid production (e.g. Abu Rabah situated SW of Ash Shaer). However, other fields show little evidence of fracturing (e.g. Tweinan situated NE of Ash Shaer). The Triassic Kurrachine Dolomite Formation at the Ash Shaer gasfield, comprises repeated sequences of mudrocks, dolomitised carbonate mudstone and wackestone, peritidal limestones, subaqueous anhydrite and halite. These were deposited in a restricted basin that was intermittently connected to the Neo-Tethys Ocean (Figure 2). The overlying Kurrachine Anhydrite section is characterised by anhydrites, halites and claystones with occasional dolomite and variously one or two thick intervals of fine-grained mafic igneous rock, ‘weathered’ with filling anhydrite. These mafic igneous layers are thought to be intrusions as they occur at different stratigraphic levels in the various wells that encounter them. Before development drilling from 2008, the Ash Shaer accumulations were thought to be compartmentalised and that large scale internal faults controlled the distribution of separately pressured
fluid regions. This was, in part, because one early appraisal well exhibited gas saturations on logs below an elevation where oil was tested in the same unit elsewhere on the structure (Figure 3). It was never established if these gas saturations represented free gas.
Fig. 3 Early interpretation of fluids distribution in Ash Shaer. At that time, fractures observed in borehole images were thought to have vertical extent and to enhance both reservoir storage capacity and flow capacity. Invasion of mud filtrate during drilling was and remains considerable and recovered core show induced fractures which appear to be related to mud weight proximity to the formation fracture gradient. Well test data did not yield any understanding of the extent of fractures as a contributor to well production.
DD
SPWLA 51st Annual Logging Symposium, June 19-23, 2010
3
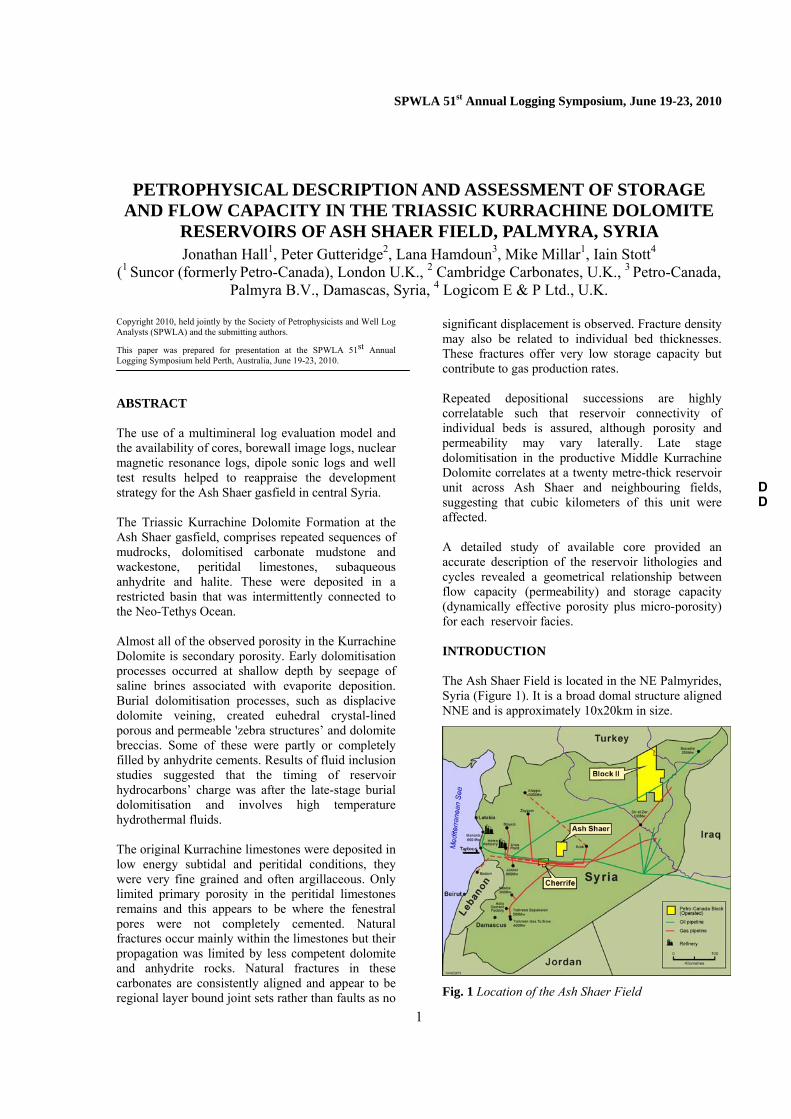
CYCLICITY AND CORRELATION WITHIN THE KURRACHINE DOLOMITE The correlation between wells for individual units within the Upper and Kurrachine is remarkably consistent over 10’s of kilometers and correlate between Cherrife and Ash Shaer (Figure 1). In the Uppermost part of the Upper Kurrachine halite accumulations are more localized within the Ash Shaer field area. For the most part, individual anhydrite layers which represents the last phase of the cycle of sedimentation for most of the Upper Kurrachine also correlate but sometimes layering is thin or absent which may point either to an absence of sedimentation or insufficient protection after the subsequent onset of marine water incursions.
High frequency sequence stratigraphy has aided the identification and characterisation of correlatable productive intervals in the Triassic Upper and Middle Kurrachine of the Ash Shaer Field, Palmyra province. This enhanced our understanding of reservoir connectivity and stacking providing a valuable tool for improved development well planning. Cycles described in core were used to validate the field stratigraphy such that Fischer plot analyses could be extended to uncored logged intervals for each well. The corresponding correlations of cycle number versus net deviation of cycle thickness from average cycle thickness demonstrates the influence and control of high and low order sea level variations on porosity development and preservation (Figure 4).
Fig. 4 Cyclicity in Ash Shaer: Cored well. Trends to the right on the Fischer plot are associated with sub-tidal cycles; trends to the left by peritidal cycles.
DD
SPWLA 51st Annual Logging Symposium, June 19-23, 2010
4
Fischer plots have been used to provide graphic representations of depositional cycles within the Kurrachine Dolomite and the lower part of the Kurrachine Anhydrite. They reveal cumulative departure from average cycle thickness plotted against cycle number. More than 60 cycles have been picked in the Kurrachine Dolomite in Ash Shaer . Boss and Rasmussen, 1995, warn that observed cycle thicknesses in excess of subsidence is often interpreted to represent depositional accommodation
space formed by eustatic sea-level rise, and that this implicitly assumes preserved cycle thickness is a proxy for accommodation. In these studies we used the base of subaqueous anhydrites below major shales to delimit cycles in core logging (Figure 6) and in the corresponding multi-mineral analyses. Multimineral analyses were interpreted for cyclicity and a correlation panel was constructed between wells. Notwithstanding, the different degree of dolomitisation within the system, correlations between the wells using this technique reveal a remarkably constant picture of sedimentation across the structure at the Kurrachine Dolomite level and a good correlation westwards to the Cherrife Field. The following cycle types were defined: • Subtidal cycles: are argillaceous laminated and
bioturbated carbonate mudstone and shales. Cycle boundaries are non-emergent. Maximum flooding events are bioclast-rich shales that may form field-scale correlative layers. These cycles are mainly limestone with little dolomitisation.
• Subtidal cycles with anhydrite: anhydrite beds occur in the subtidal cycles that formed during draw-down events and may form field-scale correlative layers. Dolomitisation is much more prevalent in these cycles than the subtidal cycles.
• Peritidal cycles: are subtidal cycles capped by peritidal facies. Occasional anhydrite beds were deposited in local hypersaline lagoons and are not useful for correlation.
The sequence architecture of the Kurrachine Dolomite reservoir is controlled by the interplay of lower and higher orders of sea level variations. Low order regressions: cause basinward stacking of high order peritidal and subtidal with anhydrite cycles because of reducing accommodation space. They also cause higher order subtidal cycles to back-step towards the basin margin. Low order high stands: cause higher order subtidal cycles to stack progressively basinward.
A late stage hydrothermal event is also recognised and appears to be restricted largely to mainly thicker limestone intervals associated with subtidal cycles. These thicker limestones are more brittle in their response to increased structural load than dolomites and anhydrites. The presence of sub-horizontal late stage filled open and closed vugs points to an episode associated with hydrothermal alteration where horizontal stress magnitude exceeds the vertical stress. The genesis of these is suggested below. Whether dolomitised or not, the thickness of this unit remains constant across much of the basin.
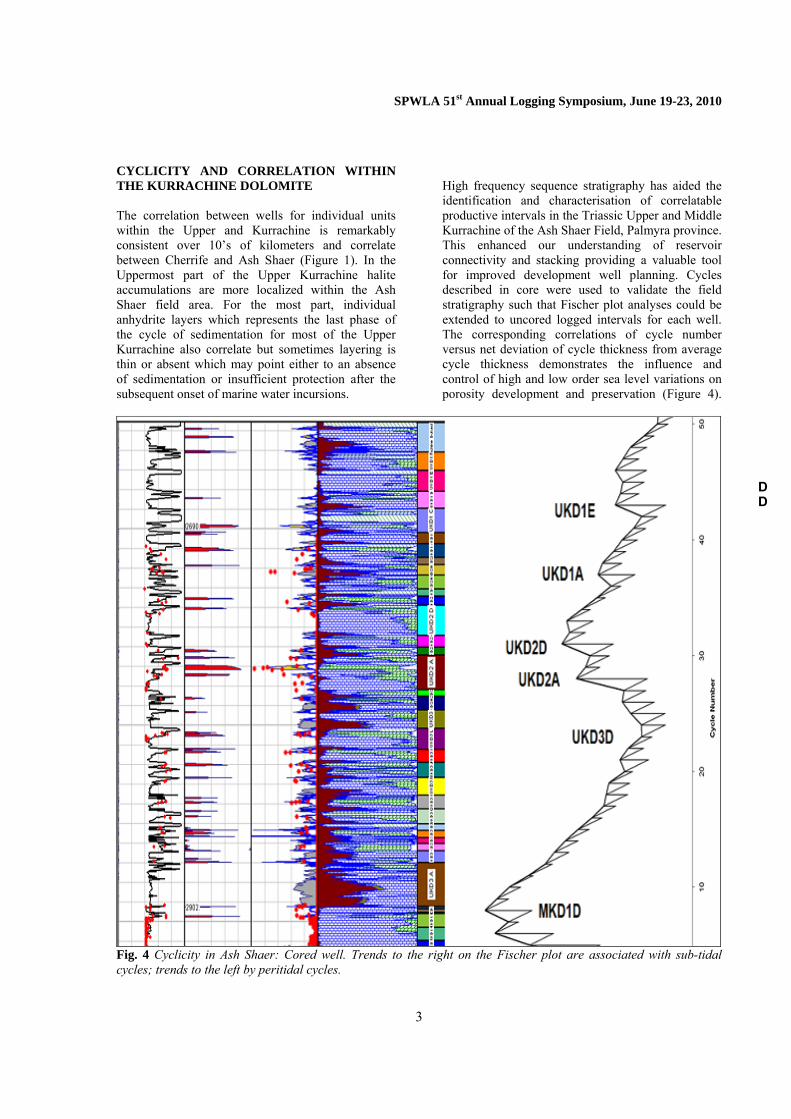
LATE STAGE POROSITY DEVELOPMENT Development of the zebra fabric: Rhythmic sub horizontal dolomitised vuggy reservoir rock encountered within the Middle Kurrachine unit may be zebra fabric and attributable to late stage dolomitisation processes (Merino et al, 2006). These contain large volume of connected high permeability storage capacity (Figures 5 & 7).
Fig. 5 ‘Zebra fabric rhythmites’ in Middle Kurrachine cored interval.
High rates of gas production are associated with these late stage macroporous dolomite. The macropores include pervasive fractures in dolomite breccias and relict porosity in closely spaced parallel fractures referred to as zebra dolomite as vugs. These are formed by the action of aggressive sub-surface fluids.
DD
SPWLA 51st Annual Logging Symposium, June 19-23, 2010
5
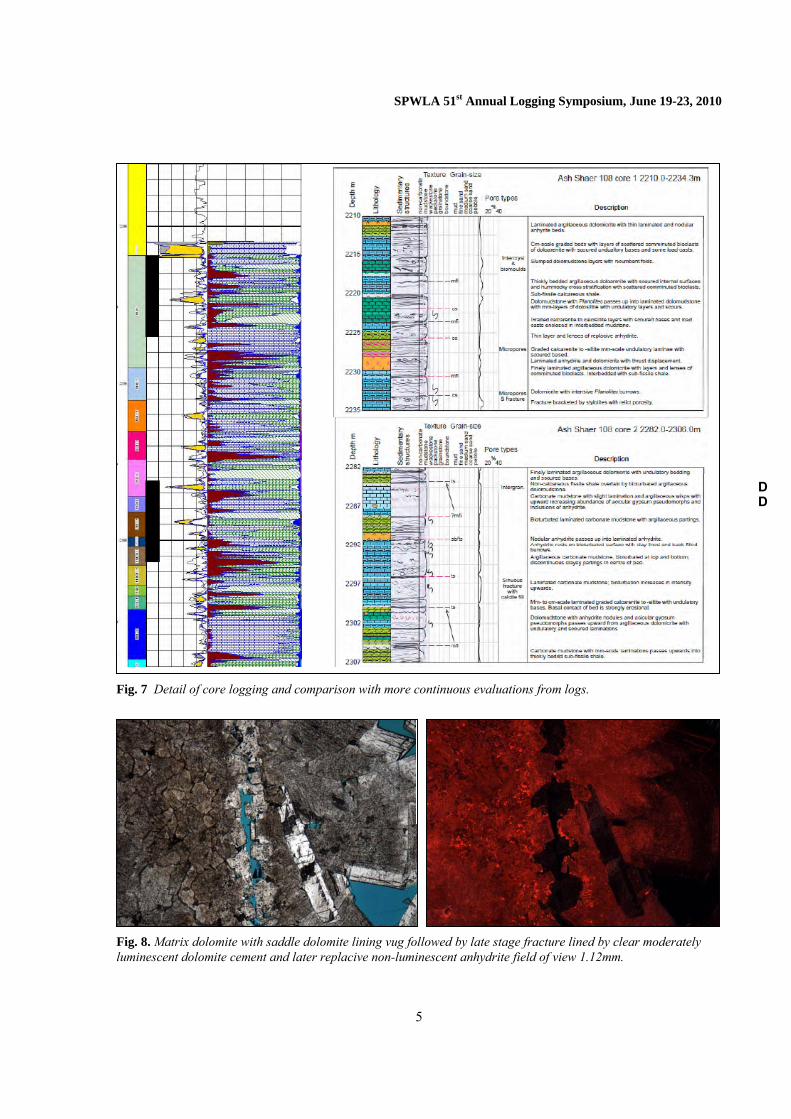
Fig. 7 Detail of core logging and comparison with more continuous evaluations from logs.
Fig. 8. Matrix dolomite with saddle dolomite lining vug followed by late stage fracture lined by clear moderately luminescent dolomite cement and later replacive non-luminescent anhydrite field of view 1.12mm.
DD
SPWLA 51st Annual Logging Symposium, June 19-23, 2010
6
Late stage dolomitisation is observed at this level to a lesser or greater degree in all of the Ash Shaer wells but zebra structure fabric is observed as an overprint in some regions of the field. Merino et al. (2006 and pers. Comm.) has a novel explanation for these fabrics based upon self organising system of chemico-physical reactions;
“The dolomite grows in limestone and exerts a local induced stress. The induced stress then displaces, pressure-dissolves, or fractures the host rock. Each of these consequences modifies differently the induced stress that causes it. Zebra and breccia dolomites consist of displacive veins, not passive cements filling supposed hydrofractures or dessication cracks as in the prevailing view. Replacement (by pressure solution driven by dolomite growth) takes place where the viscosity is too high for displacement. The induced stress self-adjusts so as to equalize the rates of growth of dolomite and pressure-solution of calcite: this coupling explains why replacement always preserves volume.”
Structural location or proximity to hydrothermal sources, or both, may have a control on the extent of this fabric. We encounter similar porosity development in a neighbouring Cherrife field some
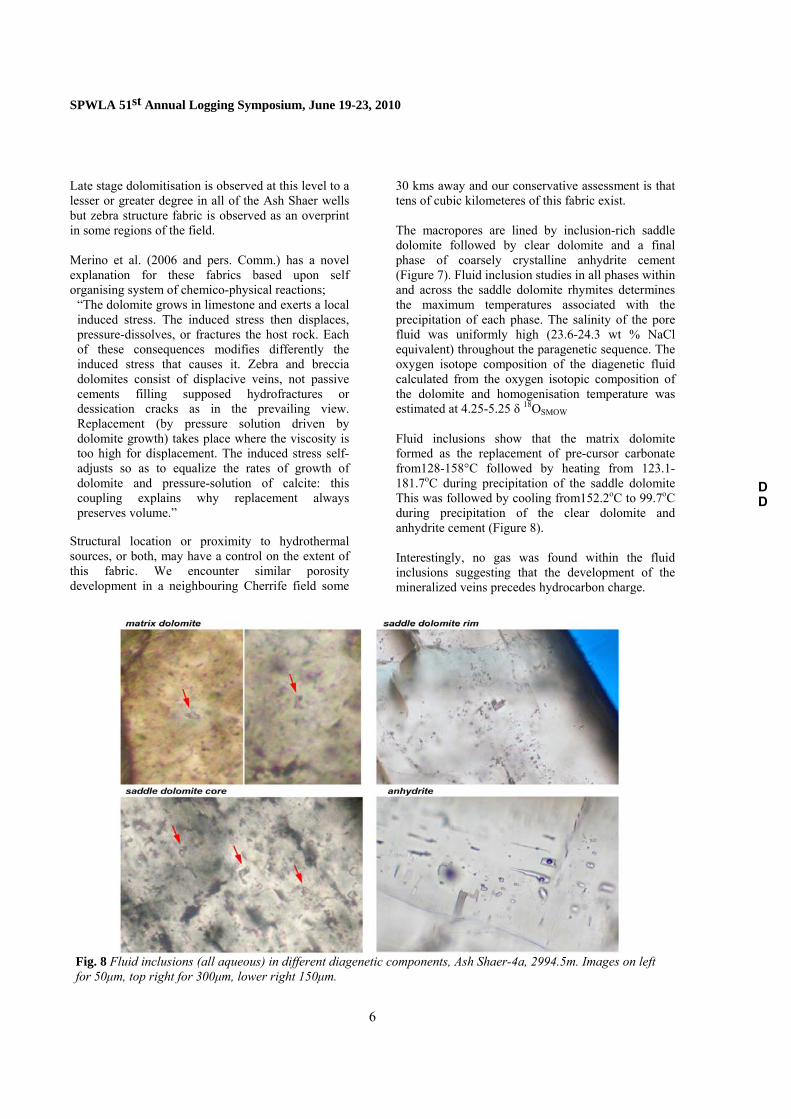
30 kms away and our conservative assessment is that tens of cubic kilometeres of this fabric exist. The macropores are lined by inclusion-rich saddle dolomite followed by clear dolomite and a final phase of coarsely crystalline anhydrite cement (Figure 7). Fluid inclusion studies in all phases within and across the saddle dolomite rhymites determines the maximum temperatures associated with the precipitation of each phase. The salinity of the pore fluid was uniformly high (23.6-24.3 wt % NaCl equivalent) throughout the paragenetic sequence. The oxygen isotope composition of the diagenetic fluid calculated from the oxygen isotopic composition of the dolomite and homogenisation temperature was estimated at 4.25-5.25 δ 18OSMOW Fluid inclusions show that the matrix dolomite formed as the replacement of pre-cursor carbonate from128-158°C followed by heating from 123.1-181.7oC during precipitation of the saddle dolomite This was followed by cooling from152.2oC to 99.7oC during precipitation of the clear dolomite and anhydrite cement (Figure 8). Interestingly, no gas was found within the fluid inclusions suggesting that the development of the mineralized veins precedes hydrocarbon charge.
Fig. 8 Fluid inclusions (all aqueous) in different diagenetic components, Ash Shaer-4a, 2994.5m. Images on left for 50μm, top right for 300μm, lower right 150μm.
DD
SPWLA 51st Annual Logging Symposium, June 19-23, 2010
7
From these analyses we draw the following conclusions about the cyclicity within the Kurrachine Dolomite; • Kurrachine Dolomite in Syria was deposited
during an overall 2nd or 3rd order increase and then a decrease in accommodation space.
• Facies types, reservoir quality and reservoir layering is controlled by the interplay of higher 3rd+ order cycles and the change of lower order accommodation space.
• The lower part of the reservoir consists of anhydrites deposited during an initial low order transgression, whilst the middle part of the reservoir consists mainly of subtidal cycles deposited during low order transgressive to high stand. The upper part of the reservoir contains increasing frequency of anhydrite layers and carbonate cycles are capped by peritidal cycles.
LOG BASED MINERAL MODEL Multi-mineral evaluation using a logic based combination of distinct mineral models was preferred to the multimineral “deterministic” model previously
used. This had proved unstable and masked cyclicity which was the focus of these studies. The new procedure allows the inclusion of both modern and legacy data types available for these studies. Legacy tools run in water-based mud systems include ‘laterolog’ resistivity logs. The modern suites, including nuclear magnetic resonance logging were run in oil-based mud systems. The result was a volumetric analysis flexible enough to incorporate all compatible available data for the whole productive section.
As stated productive intervals within the Kurrachine Dolomite comprise carbonates, originally calcitic carbonate mudstones, with variable early and late stage dolomitisation. Grain density of the productive intervals is not constant and for this reason we choose, initially, a ‘apparent’ density-neutron ‘crossplot’ porosity using a variable grain density and fixed fluid density logic. This is critically compared to the porosity derived from a density-N.M.R. solution in well/intervals where an N.M.R. logging tool has been run. Finally, for multi-mineral analysis of the matrix components, clay fraction previously determined above, density-neutron crossplot porosity
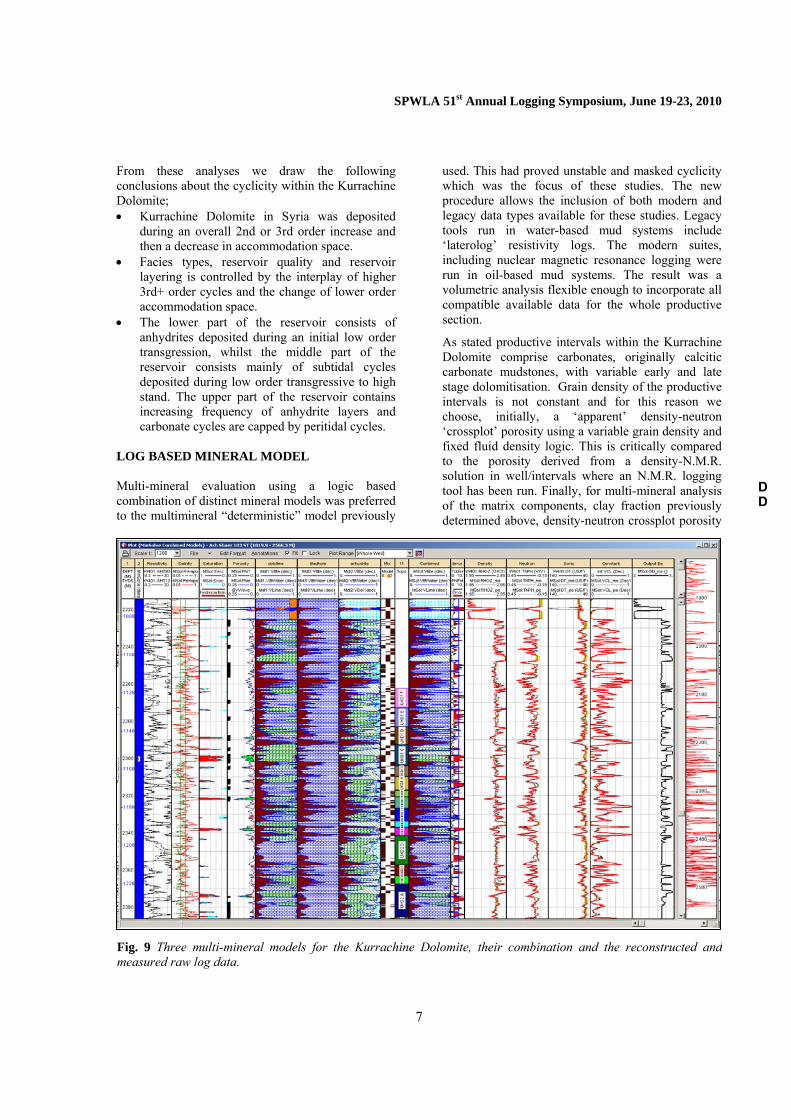
Fig. 9 Three multi-mineral models for the Kurrachine Dolomite, their combination and the reconstructed andmeasured raw log data.
DD

SPWLA 51st Annual Logging Symposium, June 19-23, 2010
8
and N.M.R. total and clay bound porosity fractions, where available, are set as soft constraints to the multi-mineral model. As a further constraint upon the evaluation, especially in the older wells, a first pass clay content and apparent porosity was determined and included as soft constraints on the modeling. In the later wells with nuclear magnetic resonance logs the apparent porosity after gas corrections and the clay-bound water fractions were used as input soft constraints. Three models were chosen for the porosity and mineral evaluation:
1) clay, clay bound water, Dolomite, and Limestone, mud filtrate and hydrocarbon (oil or gas as appropriate),
2) clay, clay bound water, anhydrite and halite (no hydrocarbon or filtrate),
3) badhole model; clay, clay bound water, dolomite and limestone.
The combination logic for the first two models was simple and required only cutoffs in the density tool to identify the non porous light halite and the non-porous heavy anhydrite. Selection of the badhole logic model was based upon identification of washouts. Figure 9 shows the ‘re-construction’ of the input logs using the solution of the combined multi-mineral models for one Ash Shaer well. RELATING POROSITY AND PERMEABILITY The method of Amafuele et al (1993) relates dynamically effective storage capacity and flow capacity within porous media but this assumption may be challenged in the presence of secondary porosity. In carbonate reservoirs, just as with clastic reservoirs, pore throat radius controls many of the petrophysical properties, but pore throat radius in carbonates may not be a function of total porosity. Secondary porosity may be present as dissolution vuggy porosity, micro-porosity or as fractures. These alterations may either, enhance or reduce primary porosity and/or enhance or not permeability. Secondary porosity, if present, may be located within the primary flow path connected porosity, disconnected or as “dead end” capillary connected porosity. Hydraulic theory relates effective storage capacity to flow capacity so it would be logical to remove ineffective storage capacity from the core laboratory helium expansion capacity before undertaking hydraulic unit characterization for reservoir engineering purposes. Notwithstanding, the relative amounts of micro-porosity present is part of the character of a particular reservoir facies and the
disposition of each facies in the cross-plots illustrated below is utilised to partition routine core analysis data into pertinent families of reservoir facies. Because mean hydraulic radius describes pore morphological changes that K and φ alone cannot characterize, it can help to better distinguish and characterize hydraulic units. Traditional plots of permeability versus porosity, in which permeability is plotted against porosity in a semi-log format to reduce the size of scatter, have little mathematical justification (Figure 10). By combining Darcy’s equation and Poiseuille’s equation, Kozeny derived a formalized mathematical relationship between porosity and permeability which can be expressed as follows:
( ) 222
3 11 gvS SF
K⋅⋅
⋅−
=τφ
φ
It is apparent from this equation that permeability and porosity are related by a factor which varies as a function of changes in pore geometry (pore shape, pore roughness, pore system tortuosity);
22
1
gvS SF ⋅⋅τ
Fig. 10 Permeability Porosity plot for all Ash Shaer productive intervals with FZI lines displayed. Further manipulation of this equation (dividing by porosity and taking the square root of each side) (Amaefule et al. 1993) yields:
( ) gvS SFK
⋅⋅⋅
−=
τφφ
φ1
1
DD
SPWLA 51st Annual Logging Symposium, June 19-23, 2010
9
Taking the Kozeny relationship, we can now express permeability in terms of the dynamically effective porosity and a combined parameter unique to a specific Rock Type: the Flow Zone Indicator (FZI).
( ) ( )FZI
SFK
gvS
.)1*0314.0(
11 2
3
222
3
φφ
τφφ
−=
⋅⋅⋅
−=
Core data grouping around a constant FZI value should represent a rock type of similar pore shape, tortuosity, roughness and surface area but scaled to porosity/ permeability trends. We have explored the significance and number of “hydraulic units” present by fitting a multi-exponentional function to the histogram of the logarithm of the FZI values. As a further control and audit of the conventional core analysis data we have adopted a data led clustering technique to the available Flow Zone Indicators (FZI) using a multi-exponential function of the form:
⋅⎟⎟⎟
⎠
⎞
⎜⎜⎜
⎝
⎛= ∑
=
⎥⎥⎦
⎤
⎢⎢⎣
⎡−4
1
2.1
2
logexpRT
LogFZI
RTFZI
RT
y σβ
α
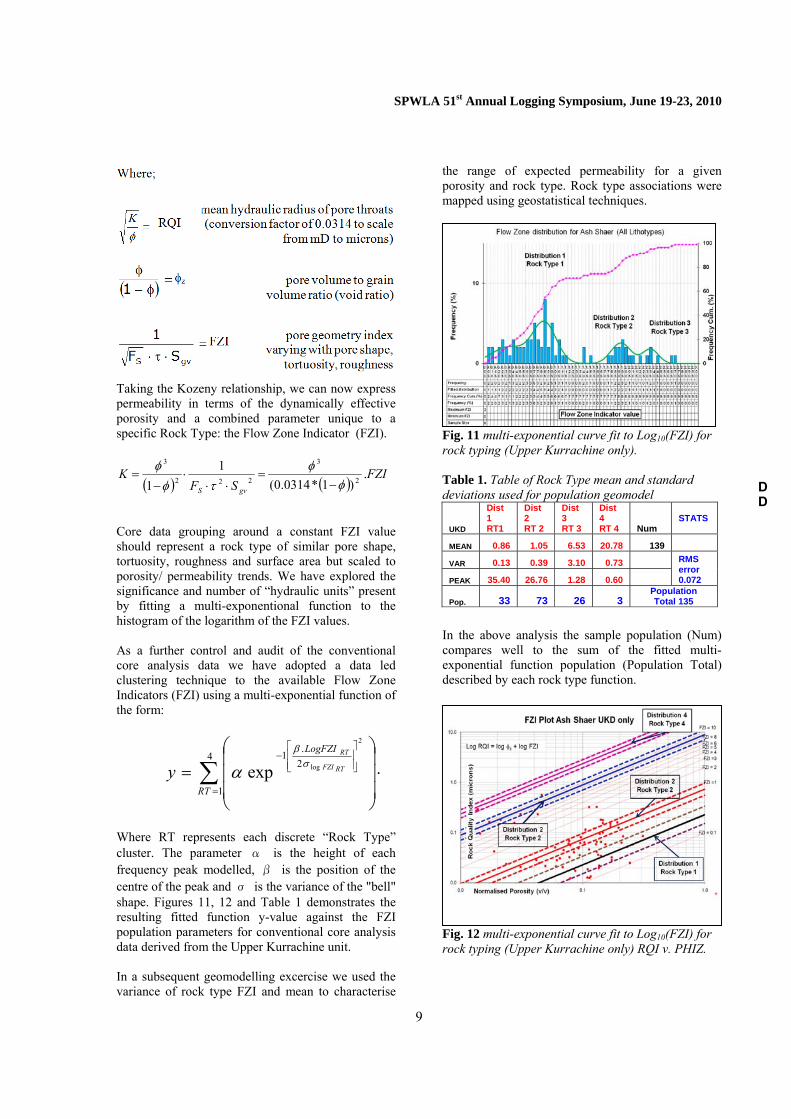
Where RT represents each discrete “Rock Type” cluster. The parameter α is the height of each frequency peak modelled, β is the position of the centre of the peak and σ is the variance of the "bell" shape. Figures 11, 12 and Table 1 demonstrates the resulting fitted function y-value against the FZI population parameters for conventional core analysis data derived from the Upper Kurrachine unit. In a subsequent geomodelling excercise we used the variance of rock type FZI and mean to characterise
the range of expected permeability for a given porosity and rock type. Rock type associations were mapped using geostatistical techniques.
Fig. 11 multi-exponential curve fit to Log10(FZI) for rock typing (Upper Kurrachine only). Table 1. Table of Rock Type mean and standard deviations used for population geomodel
UKD
Dist 1 RT1
Dist 2 RT 2
Dist 3 RT 3
Dist 4 RT 4 Num
STATS
MEAN 0.86 1.05 6.53 20.78 139
VAR 0.13 0.39 3.10 0.73 RMS error 0.072 PEAK 35.40 26.76 1.28 0.60
Pop. 33 73 26 3 PopulationTotal 135
In the above analysis the sample population (Num) compares well to the sum of the fitted multi-exponential function population (Population Total) described by each rock type function.
Fig. 12 multi-exponential curve fit to Log10(FZI) for rock typing (Upper Kurrachine only) RQI v. PHIZ.
DD
SPWLA 51st Annual Logging Symposium, June 19-23, 2010
10
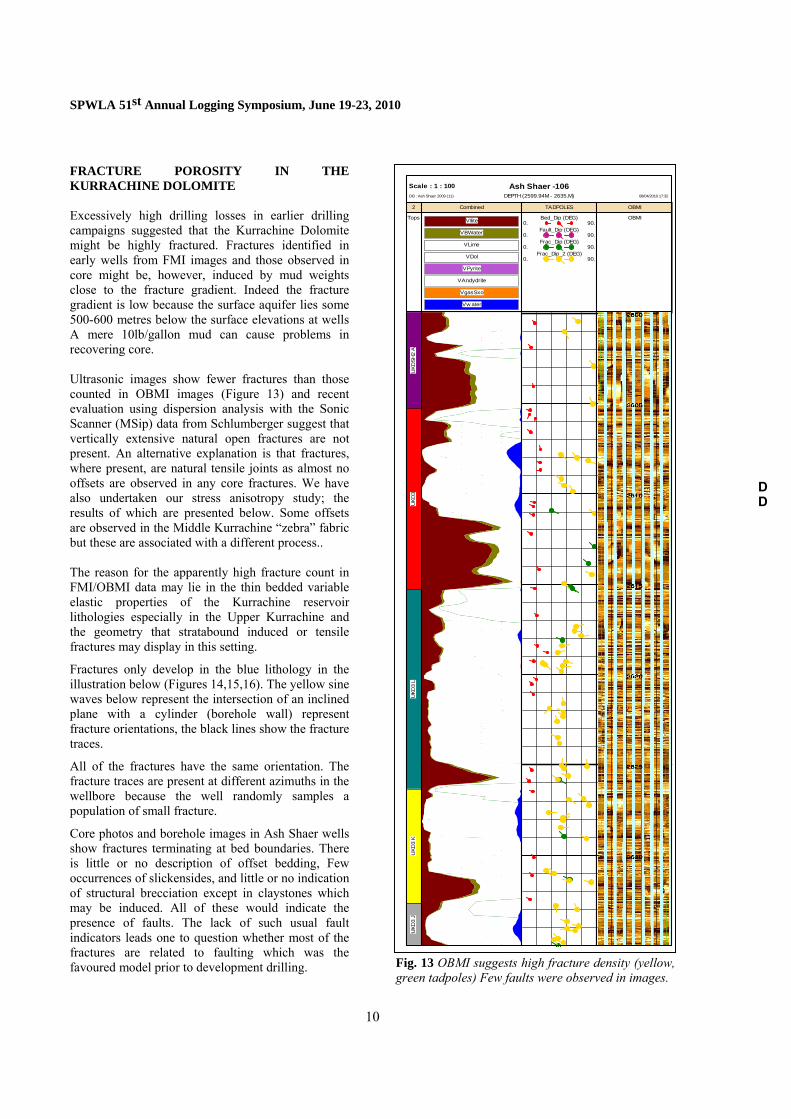
FRACTURE POROSITY IN THE KURRACHINE DOLOMITE Excessively high drilling losses in earlier drilling campaigns suggested that the Kurrachine Dolomite might be highly fractured. Fractures identified in early wells from FMI images and those observed in core might be, however, induced by mud weights close to the fracture gradient. Indeed the fracture gradient is low because the surface aquifer lies some 500-600 metres below the surface elevations at wells A mere 10lb/gallon mud can cause problems in recovering core. Ultrasonic images show fewer fractures than those counted in OBMI images (Figure 13) and recent evaluation using dispersion analysis with the Sonic Scanner (MSip) data from Schlumberger suggest that vertically extensive natural open fractures are not present. An alternative explanation is that fractures, where present, are natural tensile joints as almost no offsets are observed in any core fractures. We have also undertaken our stress anisotropy study; the results of which are presented below. Some offsets are observed in the Middle Kurrachine “zebra” fabric but these are associated with a different process.. The reason for the apparently high fracture count in FMI/OBMI data may lie in the thin bedded variable elastic properties of the Kurrachine reservoir lithologies especially in the Upper Kurrachine and the geometry that stratabound induced or tensile fractures may display in this setting.
Fractures only develop in the blue lithology in the illustration below (Figures 14,15,16). The yellow sine waves below represent the intersection of an inclined plane with a cylinder (borehole wall) represent fracture orientations, the black lines show the fracture traces.
All of the fractures have the same orientation. The fracture traces are present at different azimuths in the wellbore because the well randomly samples a population of small fracture.
Core photos and borehole images in Ash Shaer wells show fractures terminating at bed boundaries. There is little or no description of offset bedding, Few occurrences of slickensides, and little or no indication of structural brecciation except in claystones which may be induced. All of these would indicate the presence of faults. The lack of such usual fault indicators leads one to question whether most of the fractures are related to faulting which was the favoured model prior to development drilling.
Fig. 13 OBMI suggests high fracture density (yellow, green tadpoles) Few faults were observed in images.
Ash Shaer -106Scale : 1 : 100DEPTH (2599.94M - 2635.M) 08/04/2010 17:32DB : Ash Shaer 2009 (11)
2
Tops
Combined
VIlite
VBWater
VLime
VDol
VPyrite
VAndydrite
VgasSxo
Vw ater
TADPOLES
Bed_Dip (DEG)0. 90.
Fault_Dip (DEG)0. 90.
Frac_Dip (DEG)0. 90.
Frac_Dip_2 (DEG)0. 90.
OBMI
OBMI
UKD
SH2
AU
KD3
UKD
3 L
UKD
3 K
UKD
3 J
DD

SPWLA 51st Annual Logging Symposium, June 19-23, 2010
11
Fig. 14 Contained Joints: These fractures have no particular relationship to the breakout orientations because they are natural. (after Lacazette).
Regional joints form as an orthogonal set with the dominant set usually aligned parallel to the maximum horizontal in-situ stress. Joints tend to form in more competent beds, because fractures are more difficult to propagate in unconsolidated or plastic formations. Fracture spacing will depend on bed thickness with wider spacing being found in thick beds and smaller spacing occurring in thin beds.
Fig. 15 Induced tensile fractures (after Lacazette). The stratigraphy, orientation of bedding, and fracture orientations are identical in this figure above and the one above it. However, because these fractures are induced they form at a consistent azimuth in the wellbore.
Fig. 16 Induced contained petal features (after Lacazette). Petal fractures as might be illustrated above (Figure 17) are induced, form in the compressive quadrants, and have a consistent relationship to the breakouts. However, the centreline fracture formed ahead of the bit may wander around all over the image, although on average a well-developed centreline fracture will closely track the centre of the tensile quadrant. Petal fractures are curved so that they cannot be fit by a sine wave (coloured sines). Petal fractures may only develop in one lithology (Figure 17).
Fig. 17 UBI image of fracture or natural joint within limestone with no storage capacity above dolomites with zebra structures with high storage capacity. Drilling induced petal fractures may also be present.
DD

SPWLA 51st Annual Logging Symposium, June 19-23, 2010
12
In the later wells Ultra Sonic Borehole imagers (UBI) were run and these ultimately proved more useful for identification and distinction between natural and induced fractures. The UBI provides a good measure of the presence, magnitude and orientation of features diagnostic of in-situ stress.
In the example UBI image (Figure 17) taken from AS-106 a natural fracture is interpreted and accounts for almost all of the in-flow of gas in the MKD during well test. The adjacent features could be interpreted hangingwall breccias features or induced petal like features.
In Ash Shaer 109 borehole breakout is evenly distributed throughout the well and is consistently orientated WNW-ESE. Vertical to sub-vertical drilling induced fractures can also be commonly seen and have a consistent NNE-SSW orientation throughout the well (Figure 18). The distribution of these stress-related features is consistent with a NNE-SSW oriented maximum stress field.
Figure 19 is illustrates the borehole breakout seen in the interval in Figure 18 showing the UBI acoustic caliper and hole size in blue. The WNW-ESE elongation of the borehole can be clearly seen.
Fig. 18. UBI amplitude image shows borehole breakout (red boxes) and drilling induced fractures.
Fig. 19 Borehole breakout orientation from acoustic calliper at the same depth interval as Figure 19.
Figure 20 displays a frequency plot showing borehole breakout and drilling induced tensile wellbore fracture orientation. The borehole breakout orientation, shown in red, is WNW-ESE (the orientation of the minimum stress orientation) and the drilling induced fracture orientations shown in blue are NNE-SSW (aligned with the maximum stress direction - c. 20 degrees).
Fig. 20 Borehole breakout and drilling induced tensile wellbore fractures, Ash Shaer-109.
FRACTURES: STORAGE CAPACITY AND FLOW CAPACITY Fracture porosity is related to fracture geometry, fracture length and fracture aperture. In Ash Shaer, fracture porosity is below 1% and if strata bound and not connected to matrix porosity (fractures are more frequent in limestone beds adjacent to porous
DD
SPWLA 51st Annual Logging Symposium, June 19-23, 2010
13
dolomites) may represent less than 1% of the storage capacity of the reservoir.
Fracture permeability is related to fracture connectivity which could be low if only single direction sets are present but could be very high for multiple sets. Even with fairly constant fracture/ joint directions it is possible to have significant numbers of intersections.
In-flow performance to the borehole is related to fracture-matrix connectivity, matrix permeability and the number and orientation of the fractures with respect to the borehole.
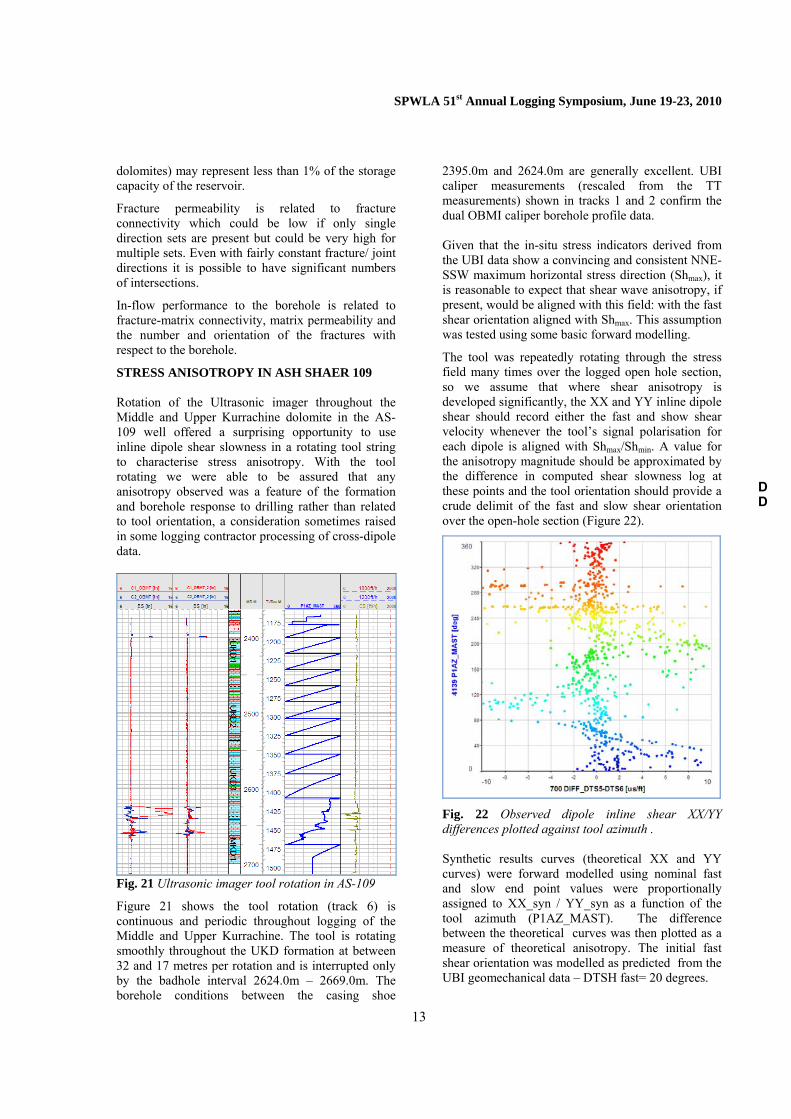
STRESS ANISOTROPY IN ASH SHAER 109 Rotation of the Ultrasonic imager throughout the Middle and Upper Kurrachine dolomite in the AS-109 well offered a surprising opportunity to use inline dipole shear slowness in a rotating tool string to characterise stress anisotropy. With the tool rotating we were able to be assured that any anisotropy observed was a feature of the formation and borehole response to drilling rather than related to tool orientation, a consideration sometimes raised in some logging contractor processing of cross-dipole data.
Fig. 21 Ultrasonic imager tool rotation in AS-109
Figure 21 shows the tool rotation (track 6) is continuous and periodic throughout logging of the Middle and Upper Kurrachine. The tool is rotating smoothly throughout the UKD formation at between 32 and 17 metres per rotation and is interrupted only by the badhole interval 2624.0m – 2669.0m. The borehole conditions between the casing shoe
2395.0m and 2624.0m are generally excellent. UBI caliper measurements (rescaled from the TT measurements) shown in tracks 1 and 2 confirm the dual OBMI caliper borehole profile data. Given that the in-situ stress indicators derived from the UBI data show a convincing and consistent NNE-SSW maximum horizontal stress direction (Shmax), it is reasonable to expect that shear wave anisotropy, if present, would be aligned with this field: with the fast shear orientation aligned with Shmax. This assumption was tested using some basic forward modelling.
The tool was repeatedly rotating through the stress field many times over the logged open hole section, so we assume that where shear anisotropy is developed significantly, the XX and YY inline dipole shear should record either the fast and show shear velocity whenever the tool’s signal polarisation for each dipole is aligned with Shmax/Shmin. A value for the anisotropy magnitude should be approximated by the difference in computed shear slowness log at these points and the tool orientation should provide a crude delimit of the fast and slow shear orientation over the open-hole section (Figure 22).
Fig. 22 Observed dipole inline shear XX/YY differences plotted against tool azimuth . Synthetic results curves (theoretical XX and YY curves) were forward modelled using nominal fast and slow end point values were proportionally assigned to XX_syn / YY_syn as a function of the tool azimuth (P1AZ_MAST). The difference between the theoretical curves was then plotted as a measure of theoretical anisotropy. The initial fast shear orientation was modelled as predicted from the UBI geomechanical data – DTSH fast= 20 degrees.
DD

SPWLA 51st Annual Logging Symposium, June 19-23, 2010
14
The actual XX and YY dipole difference was calculated and compared with the model. The results were found to be offset by about 90 degrees: a best fit was found to coincide with a modelled SHmax of 105 degrees (Figure 23).
Fig. 23 Modelled dipole inline shear XX/YY differences plotted against tool azimuth . The observed anisotropy (DIFF_DTS5_DTS6 track 3 Figure 24) is plotted against the modelled anisotropy (MOD_DIFF) and reaches a maximum in the UKD3 with values of 3-10 us/ft) and generally decreases upwards. Elsewhere in the UKD2 unit this is approximately 1-3 us/ft and in the UKD1 unit some 0.5-2 us/ft.
Fig 24 Inline dipole shear slowness in a rotating tool string.
Figure 25 shows the orientation of XX inline dipole where XX > YY (slow shear orientation): pink shading in Figure 24 is approximately 25° (note that Shmax [Fast shear] orientation from UBI was thought to be/ about. 20°).
Fig 25 XX inline dipole where XX > YY (slow shear orientation) Figure 26 shows the orientation of XX inline dipole where XX < YY (fast shear orientation) – blue shading in Figure 24 is approximately 113° (compared to borehole breakout orientation from UBI of 115° ).
Fig 26 XX inline dipole where XX < YY (fast shear orientation) Shear anisotropy is observed and is believed to associated with the regional stress field of the Palmyra trough. How this will impact upon initial flow rates, in flow performance at individual wells and ultimate field recovery is not understood at this time,
DD
SPWLA 51st Annual Logging Symposium, June 19-23, 2010
15
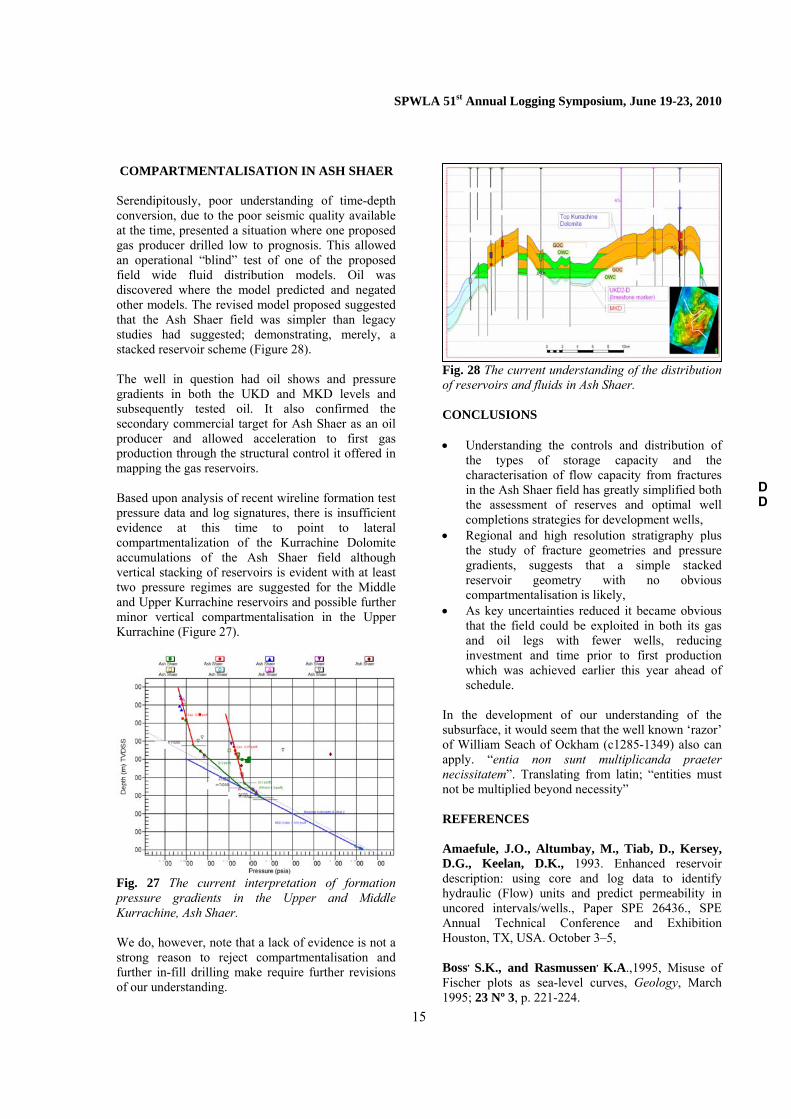
COMPARTMENTALISATION IN ASH SHAER Serendipitously, poor understanding of time-depth conversion, due to the poor seismic quality available at the time, presented a situation where one proposed gas producer drilled low to prognosis. This allowed an operational “blind” test of one of the proposed field wide fluid distribution models. Oil was discovered where the model predicted and negated other models. The revised model proposed suggested that the Ash Shaer field was simpler than legacy studies had suggested; demonstrating, merely, a stacked reservoir scheme (Figure 28). The well in question had oil shows and pressure gradients in both the UKD and MKD levels and subsequently tested oil. It also confirmed the secondary commercial target for Ash Shaer as an oil producer and allowed acceleration to first gas production through the structural control it offered in mapping the gas reservoirs. Based upon analysis of recent wireline formation test pressure data and log signatures, there is insufficient evidence at this time to point to lateral compartmentalization of the Kurrachine Dolomite accumulations of the Ash Shaer field although vertical stacking of reservoirs is evident with at least two pressure regimes are suggested for the Middle and Upper Kurrachine reservoirs and possible further minor vertical compartmentalisation in the Upper Kurrachine (Figure 27).
Fig. 27 The current interpretation of formation pressure gradients in the Upper and Middle Kurrachine, Ash Shaer. We do, however, note that a lack of evidence is not a strong reason to reject compartmentalisation and further in-fill drilling make require further revisions of our understanding.
Fig. 28 The current understanding of the distribution of reservoirs and fluids in Ash Shaer. CONCLUSIONS • Understanding the controls and distribution of
the types of storage capacity and the characterisation of flow capacity from fractures in the Ash Shaer field has greatly simplified both the assessment of reserves and optimal well completions strategies for development wells,
• Regional and high resolution stratigraphy plus the study of fracture geometries and pressure gradients, suggests that a simple stacked reservoir geometry with no obvious compartmentalisation is likely,
• As key uncertainties reduced it became obvious that the field could be exploited in both its gas and oil legs with fewer wells, reducing investment and time prior to first production which was achieved earlier this year ahead of schedule.
In the development of our understanding of the subsurface, it would seem that the well known ‘razor’ of William Seach of Ockham (c1285-1349) also can apply. “entia non sunt multiplicanda praeter necissitatem”. Translating from latin; “entities must not be multiplied beyond necessity” REFERENCES
Amaefule, J.O., Altumbay, M., Tiab, D., Kersey, D.G., Keelan, D.K., 1993. Enhanced reservoir description: using core and log data to identify hydraulic (Flow) units and predict permeability in uncored intervals/wells., Paper SPE 26436., SPE Annual Technical Conference and Exhibition Houston, TX, USA. October 3–5, Boss, S.K., and Rasmussen, K.A.,1995, Misuse of Fischer plots as sea-level curves, Geology, March 1995; 23 Nº 3, p. 221-224.
DD

SPWLA 51st Annual Logging Symposium, June 19-23, 2010
16
Lacazette, A. in Thompson, L.B., editor, 2009, AAPG Discovery Series 13 - Atlas of borehole imagery, 2nd Edition: AAPG Datapages, set of 2 CD-ROMs, ISBN: 158861011X Merino,E., Canals,A., and Fletcher, R.C., 2006, Genesis of self-organised zebra structures in burial dolomites: displacive veins, induced stress and dolomitization, Geologica Acta, 4, Nº3, 2006, p383-393. ACKNOWLEDGEMENTS To SunCor Energy Inc. management (formerly Petro-Canada) in London and Damascus for granting permission to publish. Thanks to the Syrian National Petroleum Company for their continuing support in-country and permission to publish. Thanks to Hugh Dennis for his systematic look at possible reservoir configurations in Ash Shaer and the interesting discussions as each new well was drilled. Thanks also to Dr. Al Lacazette of NaturalFractures.com LLC for permission to use the generic borehole fracture classification schematics. ABOUT THE AUTHORS Jonathan Hall is a petrophysicist working for Suncor Inc (formerly Petro-Canada) in London supporting the Syrian based asset teams of Petro-Canada Palmyra B.V. Jonathan has 25 years experience of petrophysics work in 34 countries. Peter Gutteridge is a carbonate sedimentologist and director of Cambridge Carbonates Ltd with 27 years experience of working on carbonate fields worldwide. Lana Hamdoun is a Geomodeller with specific responsibilities for the Ash Shaer field development working in the Suncor/Petro-Canada offices in Damascus Mike Millar is the senoir staff petrophysicist for Suncor Energy (formerly Petro-Canada) International and Offshore Business Unit, currently working the North Sea, East Coast of Canada, Trinidad and Tobago, and Syria. He has over 29years of industry experience with 25 years as a petrophysicist. Iain Stott is a petrophysicist and interpretation development specialist with 21 years experience working for Logicom E & P Limited.
DD