Estimation of Petrophysical Properties of Ajali Sandstone in ...
24
Estimation of Petrophysical Properties of Ajali Sandstone in Western Anambra Basin Using Granulometric Analysis Edirin Akpofure a, * Ebiegberi Oborie b Department of Geology, Niger Delta University, Wilberforce Island, Bayelsa State, Nigeria. a [email protected] , b [email protected] *Corresponding Author Keywords: Permeability, Porosity, Grain size distribution, Sedimentary structures, Diagenetic Imprints. Abstract: Most sedimentary deposits have complex regional permeability and porosity variations which can be determined through various methods. The petrophysical properties of Ajali Sandstone such as permeability, porosity, and grain mean diameter were estimated using textural characteristics of the sediment from field data, petrography and grain size distribution. Grain-size distributions of sediment samples were determined by mechanical sieving. The porosity and permeability have been affected adversely by the moderate to poor sorting of grains. Whereas, fracture line, diagenetic imprints such as the solution, alteration and corrosion at grain margins and lack of cement have made the grains friable, thereby, increasing porosity. Sedimentary structures such as the reactivation surfaces and mud drapes which interspace the thick cross-bedded beds form seals which impede permeability. The porosity of the sandstone is very high and ranges mainly from 50% - 70%, with a few above 70%. Whereas, the least estimated permeability is 3.74 m/day and the highest is 724.55 m/day. A very complex variation exist in the permeability of the studied sandstone which may be due to the occurrence of the several large planar, trough and herringbone cross stratification, erosion and pebble lagged surfaces prevalent in the Formation. There is a strong correlation between permeability and porosity and the associated regression equation is expressed, with a correlation coefficient R² = 0.6795. Poor correlations exist between permeability and other grain size parameters such as grain mean diameter, d 10 and d 60 . Introduction The Ajali Sandstone is a major clastic lithologic unit in the Anambra Basin which resulted from the tectonics and structure of the Benue Trough during the Santonian event. The earliest and dominant deposits were the proto delta suite which is majorly Cretaceous. The Basin is partly sandwiched between the southern Benue Trough above and the Niger Delta Basin below. The Campanian – Maastrichtian proto delta sediments in the Basin include the Nkporo Group, Mamu Formation, Ajali Formation and the Nsukka Formation. The Ajali Sandstone is sandwiched between the Mamu Formation and the Nsukka Formation - the lower and upper coal measures respectively. Regionally, the Sandstone comprises of thick successions of sandstones with thin beds of mudstone and shales near the base. The Formation is extensively cross-stratified into different types of cross-bedding including: planar, trough and herringbone cross-bedding which occur at different stratigraphic levels. The cross-beds are large scale (over 1 m high in places). Initially, the Formation was called the White False Bedded Sandstone and later changed to Ajali Sandstone (Reyment, 1965). Geoscience and Remote Sensing (2019) Vol. 2: 1-24 Clausius Scientific Press, Canada DOI: 10.23977/geors.2019.21001 ISSN 2523-2592 1
-
Upload
khangminh22 -
Category
Documents
-
view
2 -
download
0
Transcript of Estimation of Petrophysical Properties of Ajali Sandstone in ...
Estimation of Petrophysical Properties of Ajali Sandstone in Western Anambra Basin Using Granulometric Analysis
Edirin Akpofurea, * Ebiegberi Oborieb Department of Geology, Niger Delta University, Wilberforce Island, Bayelsa State, Nigeria.
a [email protected] , b [email protected] *Corresponding Author
Keywords: Permeability, Porosity, Grain size distribution, Sedimentary structures, Diagenetic Imprints.
Abstract: Most sedimentary deposits have complex regional permeability and porosity variations which can be determined through various methods. The petrophysical properties of Ajali Sandstone such as permeability, porosity, and grain mean diameter were estimated using textural characteristics of the sediment from field data, petrography and grain size distribution. Grain-size distributions of sediment samples were determined by mechanical sieving. The porosity and permeability have been affected adversely by the moderate to poor sorting of grains. Whereas, fracture line, diagenetic imprints such as the solution, alteration and corrosion at grain margins and lack of cement have made the grains friable, thereby, increasing porosity. Sedimentary structures such as the reactivation surfaces and mud drapes which interspace the thick cross-bedded beds form seals which impede permeability. The porosity of the sandstone is very high and ranges mainly from 50% - 70%, with a few above 70%. Whereas, the least estimated permeability is 3.74 m/day and the highest is 724.55 m/day. A very complex variation exist in the permeability of the studied sandstone which may be due to the occurrence of the several large planar, trough and herringbone cross stratification, erosion and pebble lagged surfaces prevalent in the Formation. There is a strong correlation between permeability and porosity and the associated regression equation is expressed, with a correlation coefficient R² = 0.6795. Poor correlations exist between permeability and other grain size parameters such as grain mean diameter, d10 and d60.
Introduction
The Ajali Sandstone is a major clastic lithologic unit in the Anambra Basin which resulted from the tectonics and structure of the Benue Trough during the Santonian event. The earliest and dominant deposits were the proto delta suite which is majorly Cretaceous. The Basin is partly sandwiched between the southern Benue Trough above and the Niger Delta Basin below. The Campanian – Maastrichtian proto delta sediments in the Basin include the Nkporo Group, Mamu Formation, Ajali Formation and the Nsukka Formation. The Ajali Sandstone is sandwiched between the Mamu Formation and the Nsukka Formation - the lower and upper coal measures respectively. Regionally, the Sandstone comprises of thick successions of sandstones with thin beds of mudstone and shales near the base. The Formation is extensively cross-stratified into different types of cross-bedding including: planar, trough and herringbone cross-bedding which occur at different stratigraphic levels. The cross-beds are large scale (over 1 m high in places). Initially, the Formation was called the White False Bedded Sandstone and later changed to Ajali Sandstone (Reyment, 1965).
Geoscience and Remote Sensing (2019) Vol. 2: 1-24 Clausius Scientific Press, Canada
DOI: 10.23977/geors.2019.21001 ISSN 2523-2592
1

The Ajali Sandstone is whitish in colour with some few siltstone and clay intercalations, and it is extensively exposed with an average exposed height of about 11 m in the study area. It is already weathered on the surface. The thicknesses of the beds are not uniform but occur as parallel low dipping beds. The beds consist of friable, moderately sorted sands with shape of grains ranging from subangular to subrounded (Reyment, 1965; Kogbe, 1976).
The petrophysical properties of the Ajali sandstone, such as its porosity, permeability and mean grain diameter which equates its surface area are estimated in this study from grain size analysis.
Ayogwiri, Fugar and Orame where the study outcrops occur are situated in Etsako West Local Government Area of Edo State, Nigeria. The area is covered by the Ajali Sandstone. Accessibility to and within the study area is fairly good. There are good network of tarred roads including Auch-Ibillo road, Auchi-Agenebode road among others. The Sandstone exposures in the area are along road cuts and in quarries.
Previous Studies
Simpson (1955) described the Ajali Sandstone as “False Bedded Sandstone”, that consists mainly of fine-grained, friable, sub-angular to sub-rounded Sandstone. Jones and Hockey (1964) classified the Sandstone as part of the Upper Coal Measure, while Kogbe (1976) shows that the Ajali Sandstone in western Nigeria is the lateral equivalent of Ajali Sandstone of eastern Nigeria. Rahaman (1976a) also mapped the area and grouped the Sandstones as part of the False Bedded Sandstone within the coal measure belt.
The unit stratotype of Ajali Sandstone was examined by Reyment (1965), and observed that the Formation lies between two parallic sequence; the underlying Mamu Formation and the overlying Nsukka Formation thus suggesting a continental origin. However Hoque and Ezepue (1977) changed this line of thought by suggesting a fluvial-deltaic environment for the Sandstone in the Anambra Basin.
Amajor (1987) did facies analysis of the Ajali Sandstone in the Okigwe area and subdivided the Formation into two fining upward sequences, with each possessing three sub-facies. He discovered that the Ajali Formation which was formerly regarded as a continental environment contains marginal deposits at the base of the area. As a result, he assigned a fluvial-marine depositional environment.
Ladipo (1988a), found that the sandstone bodies in the south eastern Nigeria had shapes ranging from sheetlike, lobate, lenticular and elongate forms deposited in a wide variety of depositional setting, such as deltas and flood plain channels, shallow marine, shelves, shorelines etc. He further said the process regime of the environment, nature of sediment supply and shoreline behaviour was responsible for the shape of the sand bodies. Ladipo, (1986a, b and 1988b), using process interpretation of sedimentary structures and palaeocurrent analyses from the Ajali Sandstone suggested a tidally influenced regime possibly a tidal shelf characterized by shoreline – parallel sand bodies with intercalations of mud.
Akpofure and Etu-Efeotor (2013a, 2013b)) using data from several sedimentary structures, biostratigraphy and granulometric analysis inferred fluvial and shallow marine (Shoreface) environments with very strong and extensive tidal influences.
Petrographic studies of the Ajali Sandstone by Akpofure and Etu-Efeotor (2013a) show the dominant mineral is quartz which is above 95%, with very minimal feldspar in places. The matrix is made up of smaller quartz grains that may have fractured from the larger grains. They also inferred that the Ajali Sandstone may have been indurated initially and due to severe compaction, dissolution,
2

intense abecome
Akpofacies, mfacies coSandstonto be thOrame (
Materia
Two mesamplinequipmefor colle(1988) afor granoven drishaken bgiven byparametVukovic
alteration anfriable over
ofure and Amade up of onsists mainne in the stu
he uplifted A(Akpofure a
Figure 1
als and Met
ethods werg, field datent such as cecting and band Nwajidenulometric aied and pasby a Ro–Tay Folks anters deducedc and Soro (
nd corrosior time, maki
Akana (2015f thinly lamnly of crossudied area wAbakiliki Aand Akana, 2
: Location m
thods
e employedta and sampcompass clibagging same and Reijeranalysis. Twssed throughap Shaker. d Ward 19d were use(1992) was u
n, especialling it suscep) infer the A
minated, hets-bedded sawas in the N
Anticlinorium2015).
map showin
d: Outcrop ples were tainometers, tamples were rs (1996) wwenty – eigh a set of siGraphical m
957 with thed for calcuused for por
y at grain mptibility to eAjali Sandsterolithic beandstones -.NE directionm. However
ng sample po
sampling aaken from oape for measome of the
were adoptedght (28) samieves with dmethods ade Wentworulating pororosity and K
margin, recrerosion. stone is madeds of the sThe major pn which infr, subordina
oints in Ayo
and laboratoutcrops at
asuring bed e materials d. Samples wmples of uncdiameters ra
dopted for drt scale for osity, perm
Kozeny – Ca
rystallization
de up of twoshoreface enpalaeocurre
fers the sediate direction
ogwiri, Fuga
tory analysiquarries an
thickness, hused. Sampwere furtherconsolidatedanging fromdeducing tex
particle sizmeability and
arman equat
n and repla
o basic facinvironment,ent directioniment proven to the sou
ar and Oram
is. Duringnd road cuthammer andpling methodr prepared ad sandstone
m 0.075mm xtural paramze distributid grain metion for perm
cement, hav
es. The bas, - The uppn of the Ajaenance sourcuth occurs
me.
g the outcrots using fied sample bagds by Tuckand presentee which we
m to 2mm anmeters are aion. Textur
ean diametemeability.
ve
sal er ali ce in
op ld gs
ker ed re nd as ral er.
3

The general mathematical expressions for calculating the geometric mean diameter Dm of
samples is given below:
Dm = Exp [ 1/M ∑mi ln(dig) ] (1)
M = mass of the sample, mi = mass of particular sieve residue E
dig = Square root of di< x di> (2)
di< = smallest and di> largest grain sizes. (Geometric mean of rated size of adjacent sieves)
Porosity ƞ =0.255 (1 + 0.83u) (3) (Vukovic and Soro, 1992).
Porosity derived from the empirical relationship between porosity and the coefficient of grain
uniformity (µ)
µ = Coefficient of uniformity (4)
d60/d10 Here, d60 and d10 are the sieve diameters in (mm) for which 60% and 10% of the sample
will pass respectively.
Permeability/hydraulic conductivity
k = n3 /180(1− ƞ)2 D2m (5) (Kozeny – Carman)
K = Permeability, ƞ = porosity, Dm = geometric mean grain diameter
Results and Interpretation
Lithologic Description of the Sandstone
The Sandstone, outcrops in Ayogwiri at a quarry site in the village at a point with a geo-reference of 07o 7.230’ N and 06o 24.217’E. Eight beds separated by thin beds of mud are observed containing various geological structural imprints (Figure 2). Bed A is made up of near horizontal, thin laminated beds of fine sands and silt with flaser bedding and grayish clay lenses. It is about 37 cm thick. Bed B, 216 cm thick is heterolithic and made up of near horizontal layers of beds striking 340 NW with dip of 6o. Bed B exhibits cyclic sedimentation of fine, brown sands and clay beds at intervals. Bed B is capped by a clay bed of about 6 cm thick. Bed C, 153 cm thick, overlies Bed B.
4
The sanplanar cBed D, varying NNW, wby a muD and Ewhite, fialso whabove b(Akpofu
DepoinclinedAuchi –locationmigratiothickneswith lam
d is white across-beds a
118 cm, ipalaeocurre
with that in ud drape of 6E are made ine to mediu
hite, fine to bed G, it is ure and Akaosition of thed beds of sho– Fugar- Agn, several buon of pointbss of each beminations wi
Figure
and friable, mand clay lenis a compoent directiothe NNW m
6 cm thick. up of whitium grain samedium grabout 130
ana 2015) e Ajali Sandort lateral exgenebode roundles of larbars were oed of the epithin them (
e 2: Stratalo
medium to nses occur. Isite bed w
ons. Three mmost promi Bed E, 68 ish medium
ands with larrain sands bcm thick a
dstone in Fuxtent. The load at a gerge inclinedobserved (F
psilon bundl(Akpofure a
og of Ajali S
coarse grainIt is also caith planar, major curreinent (Akpocm thick w
m to coarse grge planar cbut massiveand it is hig
ugar took pllocation of oeo-referenced cross-beds Figure 3). es ranges fr
and Akana 2
Sandstone in
n, with pebbapped by a m
trough cront direction
ofure and Akas depositedgrain sandscross-beds. Be without crghly lateriti
lace in the fooutcrop logge of 07o 05.
known as eThe bundle
rom 2 cm to2015).
n Ayogwiri
bles at the bmud drape tss-beds, he
ns observedkana 2015).d with large, with pebbBed G overross-beds. Tic and most
form of packging in Fug.448’N andepsilon bedse planes ar 5 cm, with
base and in pthat is abou
erringbone sd are in the . The bed is
e planar crosbles in placelies bed F, tThe weathet part of it
kets or bundgar is along d 006o 30.94s formed frore erosion s
average of
places. Largut 6 cm thicstructure anNE, SE an
s also cappess-beds. Bedes. Bed F hathe grains ared zone lieis ironston
dles of curvea road cut o43’E. At thom the latersurfaces. Thabout 3.4 c
ge k.
nd nd ed ds as re es
ne.
ed on his ral he m
5

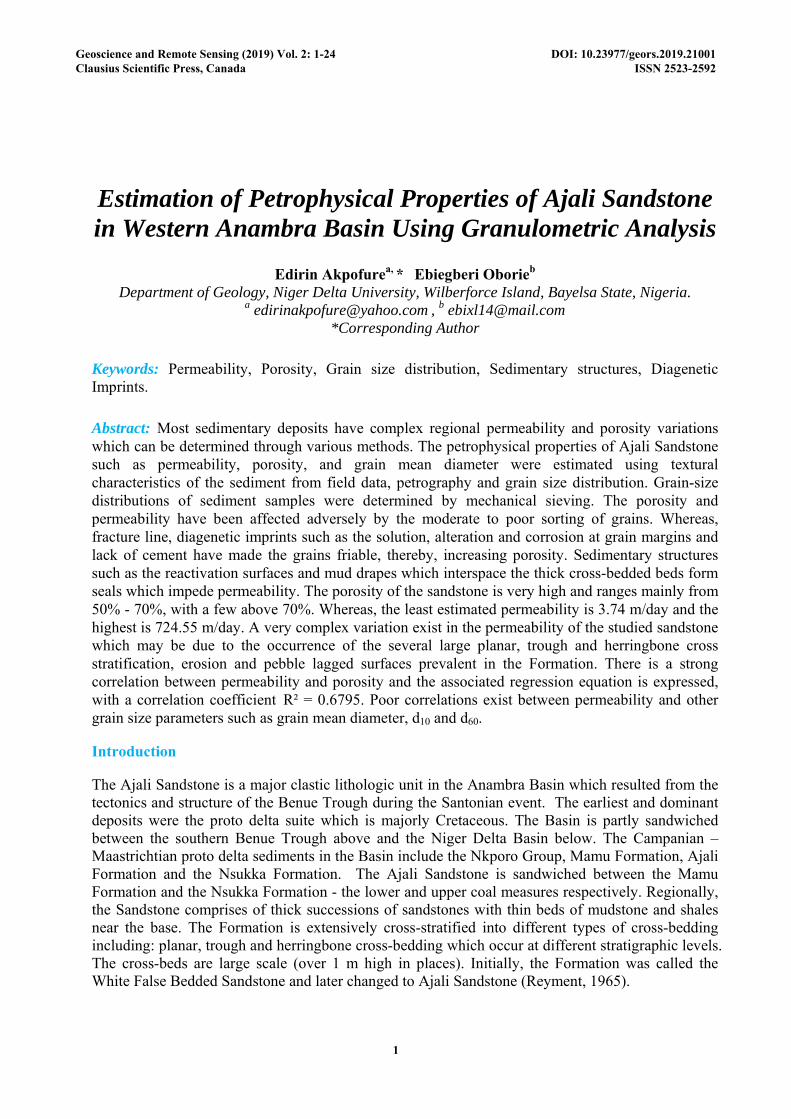
The hseveral pEpsilon epsilon 110cm r
The eis an eroby Bed HBed H; thick.
Ajaliat a poinm. The weather
The fthe depooverlainstructurebrown mhas larglarge pla
height of thpackets of eBeds B anBeds D, E
respectivelyepsilon bedsosion surfacH, 110 cm hit is 150 cm
Sandstone nt with a gebeds occur ed. The heigfirst two bedosition of thn by a thicke-less with medium - coe planar croanar cross-b
Figu
he Sandstonepsilon bedsnd C are 11and F have
y. s are overlace lagged whigh with la
m thick and f
is massivelyeo-reference
as near horght of each ds, A and B
hin sand andk clay bed 2
medium graoarse grainsoss-beds. Bebeds. Bed H
ure 3: Strata
ne at this es. Epsilon B17cm and 1e medium to
ain by Bed Gwith pebblesarge planar cfine to med
y exposed ae of 07o 05.5rizontal crobed is indic
B, are separad clay beds a23 cm thickain sands w. The sandsed G is fine
H has convol
alog of Ajali
xposure is Bed A is 27 170 cm higo coarse gr
G. The surfa. Bed G is rcross-beds aium grain. A
along the ro576’N and 0
oss-beds. Fifcated in the ated by thin and granules
k. The clay bwhile, Bed Ds of both Be
grain, whitlute deform
i Sandstone
12.5 m. Frcm thick. T
gh respectivrain sands a
face separatiripple laminand pebbles Also, Bed J
oad cut in Or06o 32.593’fteen of sucstratalog (Fmud layer es in places. bed is thinlD has convoeds E and F te, with gran
mational fold
at Fugar.
rom the botThe grains a
vely. The saand heights
ing Bed G fnated and 8occurring iis fine to m
rame villag. The sand
ch beds occuigure. 4). each have cThey are bo
ly laminatedolute deformare white m
nules occurrds, white, fin
ttom to 7.2 are fine andands are finof 160 cm,
from the ep0 cm high. in places. Abmedium grai
e along Agebody is as hur with the
yclic sedimoth heterolitd. Bed C is mational folmedium grairing in placene to mediu
m, there ad light browne grain. Th, 130 cm an
silon bundleIt is overlabove Bed I in and 120cm
enibode roahigh as 13.0last severe
mentation withic. Bed B massive an
lds with ligins but Bed es, it also ha
um grain wit
re wn.
he nd
es in is m
ad, 05 ly
th is
nd ht F
as th
6
pebbles.which ar
Photom
At Ayosubangugrains inzones anno etchicoating (Figure
Aja
li S
ands
tone
Cam
pani
an -
Maa
stric
htia
n
Ser
ies
Fo
rm-
atio
n
. Bed I is mre fine grain
micrographs
gwiri, sampular to anguln places. Tnd fracture ing. Most is seen on 5 – 7, Akpo
Lit
p
Legend:
Dep
th
(m
)
Ser
ies
1
2
11
0
3
4
5
6
7
8
9
10
medium to con sands. La
Figu
s of the San
ples taken lar. The bed
The large pelines are noof the quarsome of the
ofure and Et
thology
Sand
G
D
N
M
K
J
Weath zone
oarse grain arge planar c
ure 4: Stratal
ndstone Sam
from Beds ds are heteroebble grainsot common ortz grains ae grains, Thtu-Efeotor 2
Pro
En
A
H
E D
C
F
L
K
I
B
hered 4th
se
quen
ce
2nd s
eque
- n
ce3rd
sequ
ence
1st
sequ
Alternenerg
and light brcross-beds o
log of Ajali
mples from
A and B olithic, withs are subrouon these gra
are monocryhe mineral g2013a)
ocess interp
nergy Fa
Cla
Plabedconfaci
Planbed
Conbed
Ripplheter
qn
ce
q
uence
nating gy
Hig
h E
nerg
y H
igh
Ene
rgy
Alte
rnat
in E
nerg
y
rown in colooccur in Bed
Sandstone i
Ayogwiri
show fine h moderatelyunded andains. The suystalline shoglauconite o
pretation
acies Unit
ay
nar cross- ded, nvoluted beies
nar cross- ded, facies
nvoluted d, facies e laminated
rolithic, facie
- - - -
our. Above ds I and J.
in Orame.
quartz graiy to poorly sd show cleaurface of theowing straioccur and in
Enviroment
Shorefa
Tidal channe
Tidal channe
ed
s
d, es
Bed I, are B
ins which asorted layer
ar grain mare grains areght marginnclusions w
n-
ce
el
el
S
E W
N
Beds J and
are generals with pebbrgins. Stre smooth wis. Iron oxid
were also see
W
K
ly ble ss th de en
7

In between each of the beds are thin silty beds that average about 5 cm in thickness, these are mudrapes. These beds contain fine-grained sands with so much fracture lines, alteration and corrosion of grain margins. Most of the surfaces are etched. Iron oxide coating is very common coat on the quartz grains. (Akpofure and Etu-Efeotor 2013a)
The cross-bedded facies of the Ajali Sandstone in Ayogwiri have grains that are subangular to angular, moderately to poorly sorted beds. They show monocrystalline and polycrystalline quartz grains. Authigenic quartz is seen as quartz overgrowth (Figure 6). Most of the grain margins show alteration and corrossion. Stress zones and shadows were also noticed on the grains (Akpofure and Etu-Efeotor 2013a)
Photomicrographs of the Sandstone Samples from Fugar
Most of the grains of the Sandstone at this location are monocrystalline but polycrystalline quartz also occurs. The sands are moderately to poorly sorted, sub rounded to rounded grains. Most have clear margins, though a few samples are with corroded margins. Inclusions and alterations occur mainly within the grains. Cast of biogenic forms such as Reophax sp, Haplophragmoides sp occur in thin section. Infiltration of hollow molds with quartz mineral was also observed. Authigenic quartz occurs as microcrystalline grains formed in situ (Figures 8 – 10, Akpofure and Etu-Efeotor 2013a)
Photomicrographs of the Sandstone Samples from Orame
Similar features found in previous locations were also recorded in Orame: Inclusions, alteration and corrosion at grain margins, fracture lines, stress shadows, authigenic quartz. Rotation of some grains was observed. Iron oxide is seen coating some of the grains. Fracture lines, though present were not as common. The grains are mainly moderately sorted to poorly sorted. Most have sharp grain margins with corrosion of margins occurring in some. Some sections have sub angular grains while others were subrounded (Figures 11 – 15, Akpofure and Etu-Efeotor 2013).
Petrophysical properties of sediments such as porosity and permeability are usually controlled by textural characteristics of that deposit at deposition. Diagenetic changes such as compaction, cementation, solution, alteration etc after deposition also influence by either increasing or decreasing porosity and permeability.
The Ajali Sandstone is a quartz arenite, quartz constitutes above 95% of framework elements. The matrix is made up finer grains of quartz (figures 8 – 15). The fabric is not cement supported as a result, the Ajali Sandstone is very friable. Most of the grains are subangular to angular which favour high porosity. Permeabilty increases with increase in grain size, while porosity increases with increase sorting. The Sandstone is moderately to poorly sorted. Also the grains record several diagenetic imprints: Authigenic quartz overgrowth is common, which tends to decrease pore space, thereby decreasing porosity, but others such as solution and alteration at grain contacts increase pore spaces and invariably increase porosity. Fracture lines that are prevalent in the grains may also have contributed to increased porosity. Also inferred is the complex variation in permeability caused by the large planar, trough and herringbone cross stratification, erosion and pebble lagged surfaces prevalent in the Formation.
8

Textural Characteristics
The population of the sediments of Ajali Formation is separated slightly and the size frequency distribution departs markedly from the log normality. The composite population is markedly skewed with a secondary modal class in some beds in the coarse sand (-1-0) on the phi scale. The main population of the distribution lies between percentile 30 and 60 with the primary modal class 5-6 grade on the phi scale. According to Visher (1969), the sediments of Ajali Sandstone are attributed to saltation and suspension transports (Figures 16 -22). Graphic mean of samples from Ayogwiri range from 3.2 to 5.03; that is fine sand to coarse silt, but they are predominantly medium to fine grain sands. The mean is 3.80; reflective of the very fine sand fraction for the sandstone. That for the Sandstone at Fugar is 3.65 which is a reflection of very fine sands but sample population range from 2.6 to 4.03. Orame is predominantly very fine sands with an average of 3.78 and a population range of 3.3 to 3.9. The sediments in Ayogwiri range from mesokurtic to very leptokurtic. None is platykurtic and three are mesokurtic. It is predominantly leptokurtic. Fugar and Orame range from leptokurtic to very leptokurtic. None of the sediments showed platykurtic or mesokurtic kurtosis (Akpofure and Etu-Efeotor 2013b).
The average values of the grain size parameters of Ajali Formations in the study area are as follows: Mean 3.80; Sorting 0.92 (moderately sorted); Skewness -0.27 (negatively skewed); Kurtosis 1.41 (leptokurtic); Median 4.03; Coefficient of variation 0.05; Phi deviation 0.83 (Table 1, Akpofure and Etu-Efeotor 2013b).
TABLE 1: AVERAGE VALUES OF GRAIN SIZE PARAMETERS OF AJALI FORMATION (AKPOFURE AND ETU-EFEOTOR 2013 b).
S/N LOCATION MEAN SORTING SKEWNESS KURTOSIS MEDIAN COFF. OF
VARIATION PHI
DEVIATION
AYOGWIRI 3.98 0.86 -0.31 1.26 4.41 0.71 0.82
FUGAR 3.63 0.98 -0.23 1.35 3.81 0.3 0.95
ORAME 3.78 0.91 -0.49 1.58 3.87 -0.87 0.73
AVERAGE 3.80 0.92 -0.27 1.41 4.03 -0.05 0.83
9

P
P
XFc
Photomicrogra
PPL.
XPL Fig. 5: Poorly sortecoating on quartz g
aphs of Ajali Sa
ed, sub rounded gragrain, Glauconite gr
andstone in Ayo
ains. Iron oxide rain (G)
Iron Oxidecoatin
G
G
SC
ALT
SC
ogwiri (Akpofu
Fig. 6: Stresalteration at in polycrys(QO).
e ng
C
T
ALT
ure and Etu-Ef
PPL.
XPL ss zonation (SZ), Ct grain margins (ALstalline grain (SC);
feotor 2013)
Corrosion and LT); Sutured contaQuartz overgrowth
S
Q
S
FQ
EM
PPL
XPL Fig. 7: (Mud
act grains; Iron oh Fractured qua
SZ
QO
SZ
QO
Q
M
L.
L drape): Severely fraoxide coating on quartz (FQ), Etch mar
actured uartz grains, rks (EM).
Iron oxidee
10

P
P
XFQ
Photomicrogra
PPL
XPL Fig. 8: -Biogenic formQuartz overgrowth (Q
aphs of Ajali Sa
m (BF) – HaplophragQO).
andstone in Fug
gmoides sp.
gar (After Akp
PPL
XPFig. 9: Mono and disintegglauconite (G
BF
QO
BF
QO
ALT
I
ALT
I
pofure and Etu-
L
PL ocrystalline qtuatz graration or collapse of
G) Grains are modera
-efeotor 2013)
ains, Alteration (ALTgrain, Inclusions (I),
ately sorted.
G
G
PPL
XPL T) Fig. 10: -Poly
form (BF) –Regrains. -Alterawith corrosion
G
G
crystalline quartz, -Beophax sp. poorly soration of Qtz grain, Ren at margins, Hollow
Biogenetic rted eaction rims cast (HBC).
BF
HBC
ALT
BF
HBC
ALT
C
C
11

P
P
XFq(
FQ
FQ
QO
FQ
FQ
QO
Photomicrogra
PPL
XPL Fig 11: Alteration anquartz grain into sma(RQ)
aphs of Ajali Sa
nd reaction at rims, fraller grains (FQ), Rota
andstone in Ora
ractured ated grain
R
I
R
ame (Akpofure
PPL
XPL Fig 12: SubaAuthigenic q
RQ
I
RQ
I
FL
AQ
FL
AQ
e and Etu-Efeo
angular grains with frquartz (AQ) and Quar
tor 2013)
racture line (FL), rtz overgrowth (QO).
PPL
XPL Fig 13: Angula
. quartz grain. mreactions rims
center.
QO
QO
ALT
ALT
ar grains, moderatelymovement of alteratio
from grain margins t
y sorted, large on (ALT) and towards the
12

P
Fa
PPL
XPL Fig 14: Dissolution, aat margins of fine gra
alteration and recrystain
allization
PP
XPFig 15: Very
PL
L y coarse angular grain
ns, Polycrystalline quuartz (PQ).
PQ
PQ
13

Figure 16: Cummulative weight versus grain-size diameter in phi in Ayogwiri.
Figure 17: Cummulative weight versus grain-size diameter in phi in Ayogwiri.
0
20
40
60
80
100
120
Phi
Ø
-1 to
0
0 –
1
1 –
2
2 –
3
3 –
4
4 –
5
5 –
6 ˃6
Cu
mu
lati
ve w
eigh
t (%
)
Grain size diameter in phi
AY1
AY2
AY3
AY4
AY5
0
20
40
60
80
100
120
-1 to
0
0 –
1
1 –
2
2 –
3
3 –
4
4 –
5
5 –
6 ˃6
Cu
mu
lati
ve w
eigh
t (%
)
Grain size diameter in phi
AY6
AY7
AY8
14

Figure 18: Cummulative weight versus grain-size diameter in phi in Ayogwiri.
Figure 19: Cummulative weight versus grain-size diameter in phi in Fugar.
0
20
40
60
80
100
120
-1 to
0
0 –
1
1 –
2
2 –
3
3 –
4
4 –
5
5 –
6 ˃6
Cu
mu
lati
ve w
eigh
t (%
)
Grain size diameter in phi
AY9
AY10
AY11
0
20
40
60
80
100
120
-1 to
0
0 –
1
1 –
2
2 –
3
3 –
4
4 –
5
5 –
6 ˃6
Cu
mu
lati
ve w
eigh
t (%
)
Grain size diameter in phi
FUG1
FUG2
FUG3
FUG4
FUG5
FUG6
FUG7
15

Figure 20: Cummulative weight versus grain-size diameter in phi in Orame.
Figure 21: Cummulative weight versus grain-size diameter in phi in Orame.
0
20
40
60
80
100
120
1 2 3 4 5 6 7 8 9 10Cu
mu
lati
ve w
eigh
t (%
)
Grain size diameter in phi
ORA1
ORA2
ORA3
0
20
40
60
80
100
120
1 2 3 4 5 6 7 8 9
Cu
mu
lati
ve w
eigh
t (%
)
Grain size diameter in phi
ORA4
ORA5
ORA6
16

Figure 22: Cummulative weight versus grain-size diameter in phi in Orame.
0
20
40
60
80
100
120
-1 0 1 2 3 4 5 6 ˃6
Cu
mu
lati
ve w
eigh
t (%
)
Grain size diameter in phi
ORA7
ORA8
ORA9
ORA10
17

Table 2: PETROPHYSICAL PARAMETERS OF AJALI SANDSTONE IN WESTERN ANAMBRA BASIN.
Location
Samples D10 D60
Coefiient of
uniformity µ =
d60/d10 Porosity ƞ = 0.255(1+0.83µ)
Dig = square root of
di< x di>
Mean grain
diameter Dm
Square of Mean grain
Diameter D2m
Permeability
K=mm/s
Permeability
K=mm/s Permeability
K= m/day
Bed A Ayo 1 1.6 4.8 3.00 0.905 0.387 0.4288 0.1838 0.08386 83 x10-3 724.55
MD b/w AB
Ayo 2 4.6 5.1 1.11 0.495 0.387 0.3870 0.1497 0.0003955 39 x 10-5 3.42
Bed B Ayo 3 2.2 4.6 2.09 0.708 0.387 0.3873 0.1500 0.003468 34 x 10-4 29.96
Bed B Ayo 4 3.7 4.7 1.27 0.53 0.387 0.3884 0.1509 0.0005647 56 x 10-5 4.88
Bed B Ayo 5 4.35 5 1.15 0.504 0.387 0.3870 0.1497 0.0004328 43 x 10-5 3.74
MD b/w BC
Ayo 6 2.3 3.9 1.70 0.622 0.387 0.4639 0.1818 0.001701 17 x 10-4 14.7
Bed C Ayo 7 1.3 3.9 3.00 0.905 0.387 0.3877 0.1503 0.068577 68 x 10-3 592.51
Bed D Ayo 8 1.3 3.6 2.77 0.855 0.387 0.3892 0.1514 0.02500 25 x 10-3 216
Bed E Ayo 9 3.8 5.2 1.37 0.551 0.387 0.3873 0.1500 0.0006916 69 x 10-5 5.98
Bed F Ayo10 2.95 4.6 1.56 0.593 0.387 0.3884 0.1509 0.001055 10 x 10-4 9.12
Bed G Ayo11 3.5 4.8 1.37 0.55 0.357 0.3570 0.1275 0.000581 58 x 10-5 5.02
Total 0.656 0.395
Epsilon Fug 1 3.3 4.2 1.27 0.53 0.387 0.3884 0.1509 0.000563 56 x 10-5 4.86
Epsilon Fug 2 2.7 3.9 1.44 0.567 0.387 0.3873 0.1500 0.0008103 81 x 10-5 7
Epsilon Fug 3 2.4 3.6 1.50 0.58 0.387 0.3877 0.1503 0.00614 61 x 10-4 53.05
18

Epsilon Fug 4 3.3 4.3 1.30 0.536 0.387 0.3884 0.1509 0.003973 39 x 10-4 34.33
Pebble lag b/w Epp and G
Fug 5 2.4 3.9 1.63 0.607
0.387
0.3884 0.1509
0.008044 80 x 10-4
69.5
Bed G Fug 6 2.8 4 1.43 0.564 0.387 0.3873 0.1500 0.0007866 78 x 10-5 6.8
Bed H Fug 7 2.9 4.15 1.43 0.564 0.387 0.3881 0.1506 0.0007897 78 x 10-5 6.82
Total 0.564 0.387
Bed A Ora 1 3.6 4.6 1.28 0.53 0.387 0.39039 0.15240 0.0057032 57 x 10-4 49.28
Bed C Ora 2 2.4 4.2 1.75 0.634 0.387 0.38720 0.149920 0.001584 15 x 10-4 13.69
Bed D Ora 3 3 4.2 1.40 0.558 0.387 0.39842 0.15874 0.000784 78 x 10-5 6.77
Bed E Ora 4 2.2 3.6 1.64 0.609 0.387 0.39031 0.152348 0.001254 12 x 10-4 10.83
Bed F Ora 5 2.3 2.7 1.17 0.509 0.387 0.39123 0.15306 0.0019293 19 x 10-4 16.67
Bed G Ora 6 2.5 3.9 1.56 0.593 0.387 0.38885 0.15120 0.001070 10 x 10-4 9.24
Bed H Ora 7 1.5 4.1 2.73 0.847 0.387 0.38701 0.14972 0.021592 21 x 10-3 186.55
Bed I Ora 8 2.9 3.8 1.31 0.538 0.387 0.38722 0.14994 0.0006077 60 x 10-5 5.25
Bed J Ora 9 2.9 3.8 1.31 0.539 0.387 0.39079 0.1527 0.0006250 62 x 10-5 5.4
Bed L Ora 10 1.9 3.9 2.05 0.699 0.387 0.3938 0.15508 0.0032477 32 x 10-4 28.06
Total 0.605 0.390
19
Petrophysical Parameters
The petrophysical parameters, the mean grain diameter, d10 and d60, (where d60 and d10 are the sieve diameters in (mm) for which 60% and 10% of the sample will pass respectively) of the studied sandstones are presented in Table 2 above.
The coefficient of uniformity is an indicator to the size, shape, distribution, packing and sorting of grains (Chilingar et al., 1963). Equation 4 was used to calculate the coefficient of uniformity. Higher coefficient uniformity indicates a large range of particle size, the lower the value of the coefficient of uniformity, the more uniform the grading of the aquifer material. Granular material with coefficient uniformity (η) less than 10 is regarded as uniformly graded, while granular material with coefficient uniformity (η) more than 10 is regarded as well-graded (Powrie, 2004). The coefficient of uniformity for the sandstone range from 1.11 – 3.00, inferring it is uniformly graded.
Porosity (ƞ) is a dimensionless quantity with a magnitude less than one. It was calculated using equation 3 by Vukovic and Soro, 1992. It could be expressed in percentage (%) or in fraction. Porosity is a significant parameter considered in characterizing an aquifer or a reservoir. Fine-grained sediments exhibit higher porosities (ƞ) than coarse-grained sediments because the number of contacts between fine grains tends to increase, leading to a looser packing, Salem (2001). The porosity values of the sandstone range from 0.504 to 0.903, with an average of 0.608. In natural sedimentary deposits, fine-grained sands tend to be more uniform and exist at higher porosities than coarse grained sands (Kezdi, 1974). Porosity of the sandstone ranges mainly from 0.5 to 0.7 with few sample reading above 0.7, that is between 50% - 70%. Whereas, the least estimated permeability is 3.74 and the highest is 724.55 m/day. Permeability was calculated using Equation 5 by kozeny – Carman. A very complex variation exist in the permeability of the studied sandstone. This may be the resultant effect of the several large planar, trough and herringbone cross stratification, erosion and pebble lagged surfaces prevalent in the Formation. There is a strong correlation between permeability and porosity and the associated regression equation is expressed, with a correlation coefficient R² = 0.6795 (Figure 23).
Permeability was correlated with a number of particle-size parameters. Scatter plots were generated to compare permeability with geometric mean diameters and poor correlation is observed as coefficient of correlation is R² = 0.0061. The average geometric mean diameter for the sample is 0.390 (Figure 24 and 25). Equation 1 was used to calculate the geometric mean diameter, while, equation 2 was for the geometric mean of rated size of adjacent sieves (dig).
Other particle size parameters correlated with permeability are d10 and d60, and poor correlation was observed. The grain size that passed through the 60 percentile is mainly fine sand to coarse silt, while, a range of granules to coarse silt passed through 10 percentile. Figures 26 and 27 are scatter plots of d10 and d60 of the sandstone samples. The d10 diameter in millimeters has a correlation of R² = 0.3156 with permeability, while that of d60 is R² = 0.0015. The porosity values confirm the friability of the sandstone, and the complex variation of permeability results from the various sedimentary structures prevalent in the sandstone and the intermittent mudrapes overlying the cross-beds forming seals.
20

Figure 23: Plot of porosity(ƞ) versus permeability(k).
Figure 24: Plot of permeability(k) versus mean grain diameter(Dm).
y = 1181.4x - 650.78R² = 0.6795
1
10
100
1000
0 0.2 0.4 0.6 0.8 1
Per
mea
bil
ity
(K)
Dar
cy
Porosity (ƞ)
Porosity (ƞ) vs Permeability(K)
Porosity vs HydraulicConductivity
线性 (Porosity vs Hydraulic Conductivity)
y = -0.0184x + 78.42R² = 0.0061
1
10
100
1000
0.3
0.32
0.34
0.36
0.38 0.4
0.42
0.44
0.46
0.48 0.5
Per
mea
bili
ty (
K)
Dar
cy
Mean Diameter (Dm) mm
Permeability(K) vs Mean Grain Diameter (Dm)
Permeability(K) vsMean Diameter (Dm)
线性 (Permeability(K) vs Mean Diameter (Dm))
21

Figure 25: Plot of permeability(k) versus square of mean grain diameter (D2m).
Figure 26: Plot of permeability(k) versus D60 mm.
y = 7754.6x - 1108R² = 0.1928
1
10
100
1000
0.1 0.12 0.14 0.16 0.18 0.2
Per
mea
bili
ty (
K)
Dar
cy
Mean Diameter2 mm
Permeability(K) vs Mean Diameter2
HydraulicConductivity vs MeanDiameter
线性 (Hydraulic Conductivity vs Mean Diameter)
y = 12.145x + 25.087R² = 0.0015
1
10
100
1000
0 2 4 6
Per
mea
bili
ty (
K)
Dar
cy
D60 mm
Permeability(K) vs D60 mm
HydraulicConductivity vs D60
线性 (Hydraulic Conductivity vs D60)
22

Figure 27: Plot of permeability(k) versus D10 mm.
Conclusion
The Campanian – Maastrichtian proto delta sediments in the Anambra Basin include the Nkporo Group, Mamu Formation, Ajali Formation and the Nsukka Formation. The Ajali Sandstone is sandwiched between the Mamu Formation and the Nsukka Formation - the lower and upper coal measures respectively. The sandstone is very friable due to lack of cement and several diagenetic influences, such as alteration, corrosion, dissolution at grain margins and contacts. These, in conjunction with some sedimentary structures, such as, planar, trough cross-beds, erosion surfaces, mud drapes, herringbone cross-stratification and textural characteristics impart the petrophysical properties of the Ajali Sandstone. The Ajali Formations in the study area grain size distribution has an average Mean of 3.80, reflective of the very fine sand fraction for the sandstone and the Sorting is 0.92 which is moderately sorted. The porosity of the sandstone is very high and ranges mainly from 50% - 70%, with a few above 70%. Whereas, the least estimated permeability is 3.74 m/day and the highest is 724.55 m/day. A very complex variation exist in the permeability of the studied sandstone which may be due to the occurrence of the several large planar, trough and herringbone cross stratification, erosion and pebble lagged surfaces prevalent in the Formation. There is a strong correlation between permeability and porosity and the associated regression equation is expressed, with a correlation coefficient R² = 0.6795 The plots of permeability with other grain size parameters such as, grain mean diameter, d10 and d60, show poor correlation.
References
[1] Akpofure, E., Etu-Efeotor, J.O. (2013a) Petrography of Ajali Sandstone in Ayogwiri – Fugar – Orame Area ofWestern Anambra Basin: Implication for diagenetic and depositional history. Journal of Environmental and EarthSciences. Vol 3 No 5, p 104 - 113.[2] Akpofure, E., Etu-Efeotor, J.O. ( 2013b) Influences of depositional environment on the sedimentary structures,
y = -115.15x + 390.87R² = 0.3156
1
10
100
1000
0 1 2 3 4 5
Per
mea
bil
ity
(K)
Dar
cy
D10 mm
Permeability(K) vs D10 mm
HydraulicConductivity vs D10
线性 (Hydraulic Conductivity vs D10)
23

biostratigraphy and textural characteristics of Ajali Sandstone in Ayogwiri – Fugar – Orame Area of Western Anambra Basin. European Journal of Scientific Research, Volume 103, Issue 4. [3] Akpofure, E. Akana, S.T. (2016) Palaeocurrent and Facies Analysis Of Ajali Sandstone In Western Anambra Basin, Nigeria. Journal of Africa Earth Sciences. (Elsevier) 118 (2016) 75 - 86 [4] Amajor, L.C. (1987) Palaeocurrent, petrography and provenance analysis of the Ajali sandstone (Upper Cretaceous). Southeastern Benue Trough, Nigeria. Sedimentary Geology, vol.54 p.47-60. [5] Chilingar G.V., Main R., Sinnokrot A. (1963) Relationship between porosity, permeability and surface areas of sediments. Journal of Sedimentary Petrology, 33: 759–765 [6] Folk, R.L., Ward, W. (1957) Brazos river bar: a study of the significance of grain size parameters. Journal of Sedimentary Petrology, 27, 3-26. [7] Hoque, M. and Ezepue, M.C. (1977) Petrology and palaeogeography of the Ajali Sandstone. Journal Mining Geology. 14, 16-27. [8] Jones, H.A and Hockey, R.D. (1964) The geology of part of South-Western Nigeria. Explanation of 1:250,000 sheets nos.59 and 68. Bulletin Geological Survey Nigeria, 31, 101pp. [9] Kezdi, A. (1974) Soil mechanics, Elsevier Scientific Publishing Company, Vol. 1, P. 49; Elsevier, New York. [10] Kogbe, C.A. (1976) Palaeogeographic history of Nigeria from Albian times. In: Geology of Nigeria (Edited by C.A. Kogbe). Lagos, Nigeria: Elizabethan publishing. [11] Ladipo, K.O. (1986a) Tidal shelf depositional model for Ajali Sandstone, Anambra Basin, Southern Nigeria. Journal of African Earth Sciences, Vol. 5, No 2, pp 177-185, Nio & A van Gelder eds. [12] Ladipo, K.O. (1988a) Paleogeography, Sedimentation and Tectonics of the Upper Cretaceous Anambra basin, Southeastern Nigeria Journal of African Earth Sciences.,v.7, p.815-821. [13] Ladipo, K.O. (1988b) Examples of Tidal current Periodicities from Upper Cretaceous Sandstone (Anambra Basin SE Nigeria). In Boer, P.L., Van, A. and Nio, S.D. (Eds). Tide Influenced Sedimentary Environments and Facies. D. Riedel Publ. Co., Dorgrecht, p,333-340. [14] Nwajide, C.S. and Reijers, T.J.A. (1996) Sequence architecture in outcrops. Example from the Anambra Basin, Nigeria NAPE Bulletin, v.11, no.01, p.23-32. [15] Powrie, W. (2004) Soil Mechanics: Concepts and Applications. 2nd Ed. Taylor & Francis 270 Madison Avenue, New York, NY 10016. [16] Rahaman, M.A. (1976a) Review of the basement geology of South-Western Nigeria. In: C.A. Kogbe (Editor), Geology of Nigeria. Elizabethen Publishing. Lagos, pp. 41-58. [17] Reyment, R.A. (1965) Aspects of Geology of Nigeria. Ibadan University Press, 133 pages, 18pl. [18] Salem, H. S., 2001: Determination of Porosity, Formation Resistivity Factor, Archie Cementation Factor, and Pore Geometry Factor for a Glacial Aquifer, Energy Sources, 23:6, 589-596. http://dx.doi.org/10.1080/00908310152125238 [19] Simpson, A. (1955) The Nigerian coal field. The geology of parts of Onitsha, Owerri and Benue provinces. Geological Survey Of Nigeria Bulletin, no.24, 85p, 5pl. [20] Tucker, M.E. (Ed) (1988) Techniques in Sedimentology. Blackwell Scientific Publications, Oxford, 394 pp. [21] Visher, G.S. (1969) Grain size distributions and depositional processes: Journal of Sedimentary Petrology, v.39, pp. 1074-1106. [22] Vukovic, M., and Soro, A., 1992, Determination of hydraulic conductivity of porous medla from grain-size composition: Water Resources Publications, Littleton, CO, 83 PP
24