Agile Estimation: Beyond the Myths Part 1 Agile Estimation ... - QSM
83
Copyright © 2015 QSM Inc. Slide 1 Agile Estimation: Beyond the Myths Part 1 Agile Estimation: Beyond the Myths Part 1 Andy Berner Quantitative Software Management, Inc.
-
Upload
khangminh22 -
Category
Documents
-
view
0 -
download
0
Transcript of Agile Estimation: Beyond the Myths Part 1 Agile Estimation ... - QSM

Copyright © 2015 QSM Inc. Slide 1
Agile Estimation: Beyond the MythsPart 1
Agile Estimation: Beyond the MythsPart 1
Andy BernerQuantitative Software Management, Inc.
Copyright © 2015 QSM Inc. Slide 2
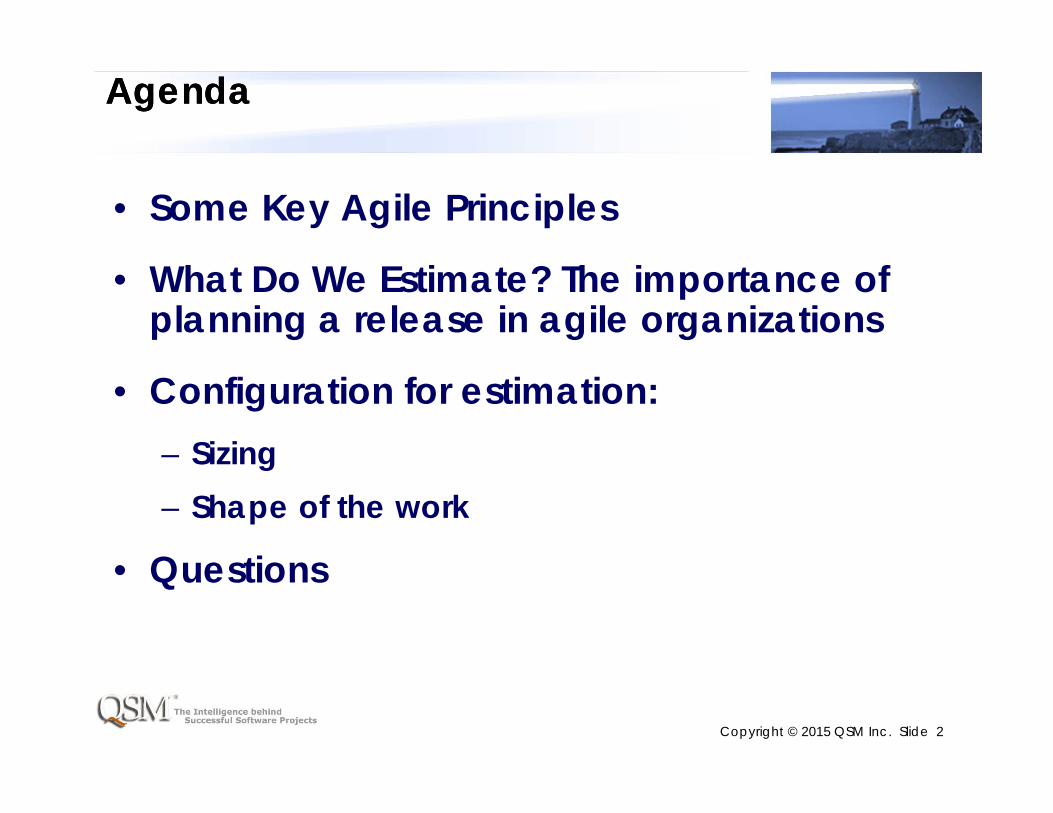
AgendaAgenda
• Some Key Agile Principles
• What Do We Estimate? The importance of planning a release in agile organizations
• Configuration for estimation:– Sizing– Shape of the work
• Questions

Copyright © 2015 QSM Inc. Slide 3
Preview of Agenda for Part 2 Next MonthPreview of Agenda for Part 2 Next Month
• Further configuration for estimation:– Milestones– Productivity and Effort
• Project Control
• Data Collection
• Further Research

Copyright © 2015 QSM Inc. Slide 4
Some Key Agile PrinciplesSome Key Agile Principles
“The fundamental things apply, as time goes by”
By Herman Hupfeld, made famous in “Casablanca”

Copyright © 2015 QSM Inc. Slide 5
Some values, principles, and practicesSome values, principles, and practices
(Paraphrased from multiple sources, including the Agile Manifesto, books, talks, articles, and blogs)
• Focus is on value of delivered software• Develop on cadence (time boxed sprints)• Embrace change• Emergent requirements and design• Working software is the primary measure of
progress• Definition of ready/groom the backlog

Copyright © 2015 QSM Inc. Slide 6
Focus is on value of delivered softwareFocus is on value of delivered software
• From the Agile Manifesto principles:Our highest priority is to satisfy the customer
through early and continuous deliveryof valuable software
• Value is in the eyes of the consumer

Copyright © 2015 QSM Inc. Slide 7
Develop on cadence (time boxes)Develop on cadence (time boxes)
• Project team (or teams, when scaling agile methods) choose an iteration or sprint length and stick to it.
• Time-boxing provides the opportunity for frequent feedback and agile direction setting.
• “Sprint length” is the new “month”!
Copyright © 2015 QSM Inc. Slide 8
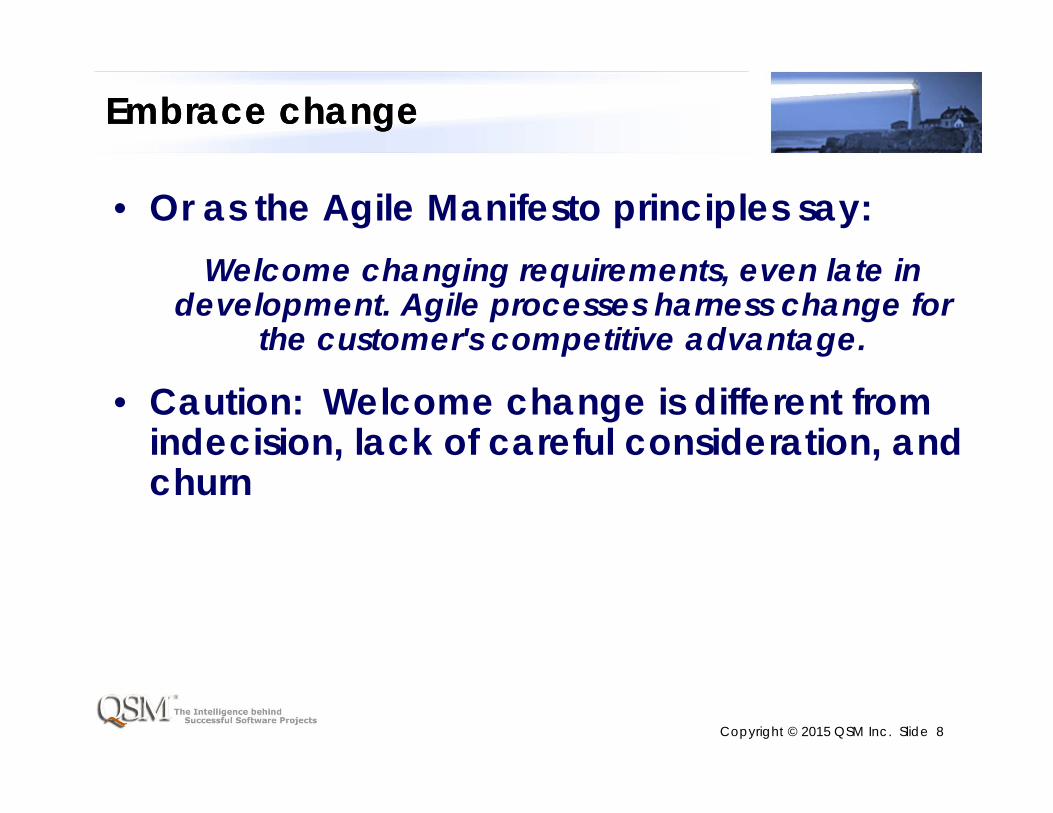
Embrace changeEmbrace change
• Or as the Agile Manifesto principles say:Welcome changing requirements, even late in
development. Agile processes harness change for the customer's competitive advantage.
• Caution: Welcome change is different from indecision, lack of careful consideration, and churn

Copyright © 2015 QSM Inc. Slide 9
Emergent requirements and designEmergent requirements and design
• “Just in time” requirements and design– Details of stories are worked out at the time they
are developed
• Probably the most important practice to get the benefits of agile methods– Enables the team to embrace change

Copyright © 2015 QSM Inc. Slide 10
Emergent requirements and designEmergent requirements and design
• The biggest change from waterfall methods
• No “big upfront requirements phase”
• No “big upfront design phase”
• Requires customer/business owner involvement throughout the development life cycle

Copyright © 2015 QSM Inc. Slide 11
Working software is the primary measure of progressWorking software is the primary measure of progress
• Progress = which stories have been developed, which remain to be developed
• Emphasis on “potentially shippable software” at each iteration– Must be able to review the working software to
get feedback
• Methodology steps like “architecture approved” or “test plan complete” are not primary

Copyright © 2015 QSM Inc. Slide 12
Definition of ready/groom the backlogDefinition of ready/groom the backlog
• The productivity and quality of the development work hinges on having well thought through, carefully understood requirements (albeit, “just in time”).
• The “definition of ready” and the work of getting the stories ready is as important as the “definition of done” and the work to get them developed
• Otherwise, “garbage in, garbage out”

Copyright © 2015 QSM Inc. Slide 13
Some values, principles, and practicesSome values, principles, and practices
(Paraphrased from multiple sources, including the Agile Manifesto, books, talks, articles, and blogs)
• Focus is on value of delivered software• Develop on cadence (time boxed sprints)• Embrace change• Emergent requirements and design• Working software is the primary measure of
progress• Definition of ready/groom the backlog

Copyright © 2015 QSM Inc. Slide 14
What Do We Estimate? The importance of planning a release in agile organizationsWhat Do We Estimate? The importance of planning a release in agile organizations
“Everything’s different, nothing’s changed”
From “Company” by Stephen Sondheim

Copyright © 2015 QSM Inc. Slide 15
What to estimate? NOT the duration of a sprint!What to estimate? NOT the duration of a sprint!
Sometimes there’s a misunderstanding because the same word means two different things:
Led in the race Lead in the race
Copyright © 2015 QSM Inc. Slide 16
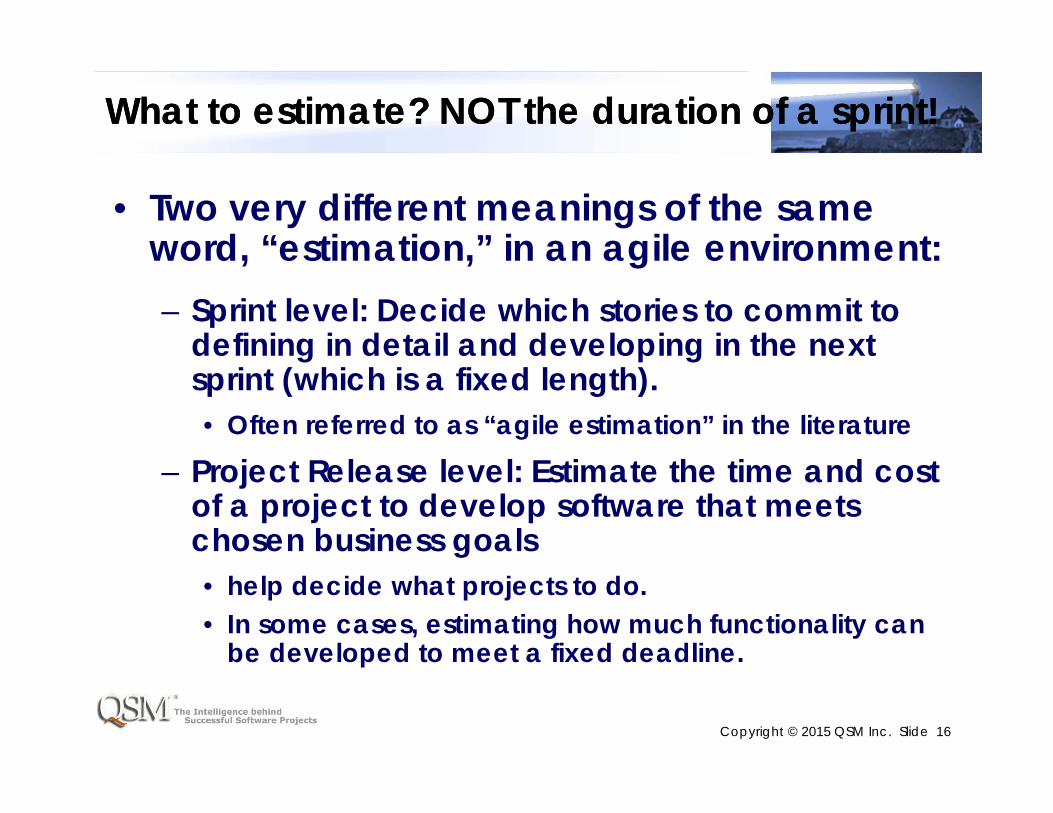
What to estimate? NOT the duration of a sprint!What to estimate? NOT the duration of a sprint!
• Two very different meanings of the same word, “estimation,” in an agile environment:– Sprint level: Decide which stories to commit to
defining in detail and developing in the next sprint (which is a fixed length).• Often referred to as “agile estimation” in the literature
– Project Release level: Estimate the time and cost of a project to develop software that meets chosen business goals• help decide what projects to do. • In some cases, estimating how much functionality can
be developed to meet a fixed deadline.

Copyright © 2015 QSM Inc. Slide 17
Sprint Level: Develop on CadenceSprint Level: Develop on Cadence
• Sprint length is the same for all sprints.
• Sticking to this time-box enables quick feedback and just-in-time decision making
• The length of the sprints is CHOSEN, not estimated.

Copyright © 2015 QSM Inc. Slide 18
Short term questions apply at each sprintShort term questions apply at each sprint
• At each sprint, we have to think about:– What detailed stories should we develop next?– Based on feedback, do we have a better
understanding of the content or priorities?– What did we learn in the last couple of weeks,
and how can we apply it?
…Choose a return flightProvide passenger informationCheck flight arrival Buy extra miles for loyalty accountChange the return flightChoose a seat on a flightCancel a reservation
Next Iteration:

Copyright © 2015 QSM Inc. Slide 19
People’s intuition is good for sprint decisionsPeople’s intuition is good for sprint decisions
• At the sprint level, the team members can decide which stories will fit in the next sprint
• Developers are very good at knowing what can be done in short bursts
• The nonlinearities of software development don’t surface in a short sprint

Copyright © 2015 QSM Inc. Slide 20
Different questions at different levelsDifferent questions at different levels
Question Sprint Level Release LevelWhat stories should we develop next?
What are the details of those stories?
What needs to change based on feedback?
What did we learn this sprint?
How long will it take until we have enough value?
Should we trade off schedule for resources?
Can I expect to reach my goal at a reasonable cost?

Copyright © 2015 QSM Inc. Slide 21
What makes software ready to release?What makes software ready to release?
• New and enhanced function that provides sufficient value:– “Consumable”: has enough functionality and the
necessary functionality so that users can use it for the intended purpose
– “Delivered”: has gone through all the final deployment and other preparation needed to actually be used
Copyright © 2015 QSM Inc. Slide 22
“Release” vs. “Potentially Shippable”“Release” vs. “Potentially Shippable”
• Don’t we have potentially shippable software that provides new or enhanced functionality at the end of each sprint?– We chose the highest priority stories– We made sure all the test cases ran– We got to the “definition of done” for each of the stories
• “Potentially shippable” allows for good review and feedback.– We are heading towards the final goal– It doesn’t have to reach the final goal

Copyright © 2015 QSM Inc. Slide 23
“Release” vs. “Potentially Shippable”“Release” vs. “Potentially Shippable”
• Purpose at each sprint is to get feedback to do course corrections and learn– Stories were broken down into “developer sized bites” that
fit into the sprint. Not all of a higher-level function must be completed
– Not all the functionality needed to consume and use the software is ready at each sprint. “Highest priority that fits” is not enough for production use
• Only over multiple sprints will the functionality be enough to serve a business purpose for the users– You can’t arbitrarily decide on a time box for that!

Copyright © 2015 QSM Inc. Slide 24
“Release” vs. “Potentially Shippable”“Release” vs. “Potentially Shippable”
• If you use the Scaled Agile Framework:
• The Scaled Agile Framework (SAFe) v3 no longer uses the term “Potentially Shippable Increment” to avoid this confusion.
• SAFe v3 also introduced a formal notion of “Release” to distinguish the time-boxed development cadence from when the software is ready to be delivered, consumed, and used.
• Releases do not have to occur on the time boxed development boundaries

Copyright © 2015 QSM Inc. Slide 25
Other activities must coordinate with releaseOther activities must coordinate with release
• Other activities coordinate with a release of the software– Marketing and sales if it’s a software product– Manufacturing if it’s included in hardware– Process changes for internally used software
• The people and groups responsible need to be able to plan all the project activities

Copyright © 2015 QSM Inc. Slide 26
People need help for longer term estimatesPeople need help for longer term estimates
• People try to extrapolate from what they know they can do in a short term to what can be done in a longer term, like a 6 or 8 month release, but that doesn’t work.
• Intuition does not take into account the nonlinearities of software development (software size and duration are not proportional, duration and team size are not inversely proportional, velocity is not constant, etc.)
• People are “wishful thinkers” and don’t learn from history

Copyright © 2015 QSM Inc. Slide 27
People need help for longer term estimatesPeople need help for longer term estimates
• People try to extrapolate from what they know they can do in a short term to what can be done in a longer term, like a 6 or 8 month release, but that doesn’t work.
• Intuition does not take into account the nonlinearities of software development (software size and duration are not proportional, duration and team size are not inversely proportional, velocity is not constant, etc.)
• People are “wishful thinkers” and don’t learn from history
The SLIM Suite of tools uses proven statistical techniques based on the nonlinearities of software development , using your organization’s historical data or industry-wide historical data to offer credible answers to the medium and long term questions.

Copyright © 2015 QSM Inc. Slide 28
Myth: “In agile, we decide on schedule not scope”Myth: “In agile, we decide on schedule not scope”
• No more so in agile projects than any other!– Managers have always asked for schedule
estimates then treated them as hard and fast commitments.
• Agile and lean thinking emphasize short durations (“small batch size”)– Cost of delay– Time to value

Copyright © 2015 QSM Inc. Slide 29
Myth: “In agile, we decide on schedule not scope”Myth: “In agile, we decide on schedule not scope”
• No more so in agile projects than any other!– Managers have always asked for schedule
estimates then treated them as hard and fast commitments.
• Agile and lean thinking do emphasize short durations (“small batch size”)– Cost of delay– Time to value
Whether schedule or scope dominates the choices and tradeoffs depends on business goals• Sometimes there is an absolute deadline• Sometimes there is a mandate on scope
(e.g. regulated content)• Most often, there are tradeoffs to consider• As the project progresses and you get
feedback at each sprint, you may adjust scope, schedule, cost or all three!

Copyright © 2015 QSM Inc. Slide 30
Lean Thinking: Minimal Viable ReleaseLean Thinking: Minimal Viable Release
• Minimal– Cost of delay can offset savings in the cost of development– Quick feedback
• Viable– If it doesn’t contain enough features, users won’t use it:
must be feature rich enough to consume– “Value is in the eye of the beholder”
Copyright © 2015 QSM Inc. Slide 31
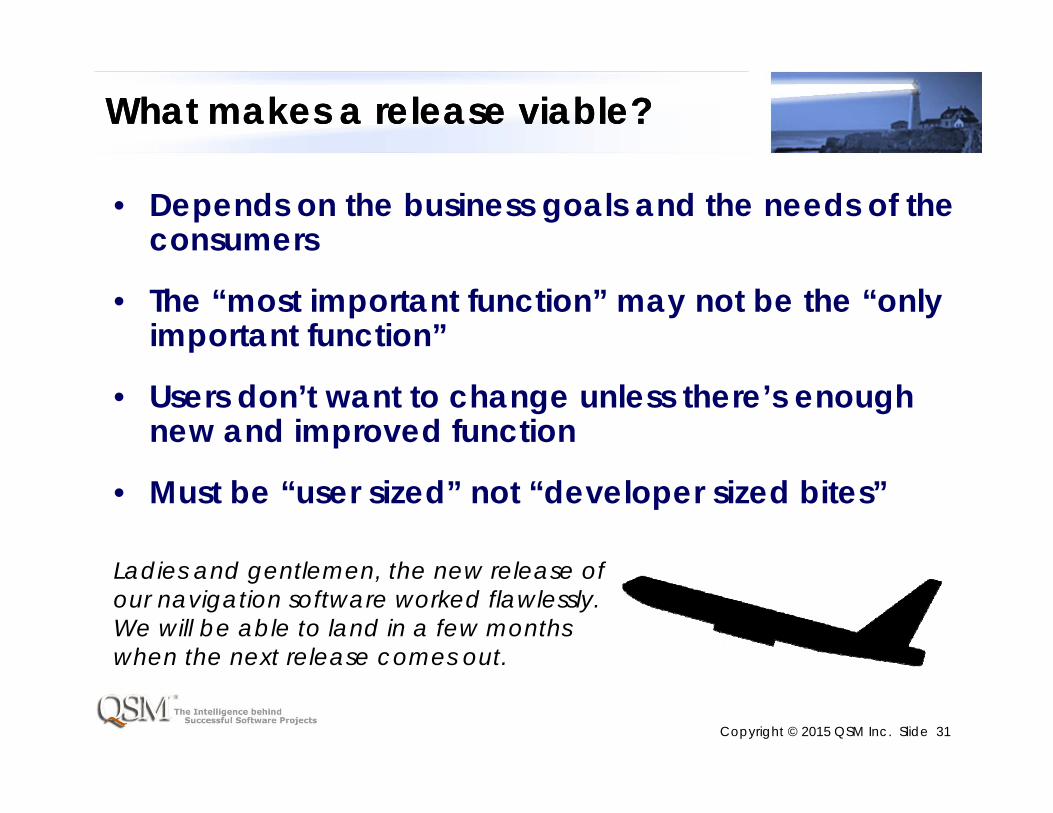
What makes a release viable?What makes a release viable?
• Depends on the business goals and the needs of the consumers
• The “most important function” may not be the “only important function”
• Users don’t want to change unless there’s enough new and improved function
• Must be “user sized” not “developer sized bites”
Ladies and gentlemen, the new release of our navigation software worked flawlessly. We will be able to land in a few months when the next release comes out.
Copyright © 2015 QSM Inc. Slide 32
Estimating a project to develop a releaseEstimating a project to develop a release
• Key inputs– Historical Data– Size of functionality needed for goals– Shape of the work/methodology– Productivity expectations
• Outputs– Tradeoffs between schedule and effort– Risk– Expected dates for key milestones

Copyright © 2015 QSM Inc. Slide 33
Input: Historical DataInput: Historical Data
Each dot represents data from a completed project

Copyright © 2015 QSM Inc. Slide 34
Input: Size of the functionality needed for goalsInput: Size of the functionality needed for goals

Copyright © 2015 QSM Inc. Slide 35
Input: Shape of the work/methodologyInput: Shape of the work/methodology
Groom backlogBuild out backlog
Copyright © 2015 QSM Inc. Slide 36
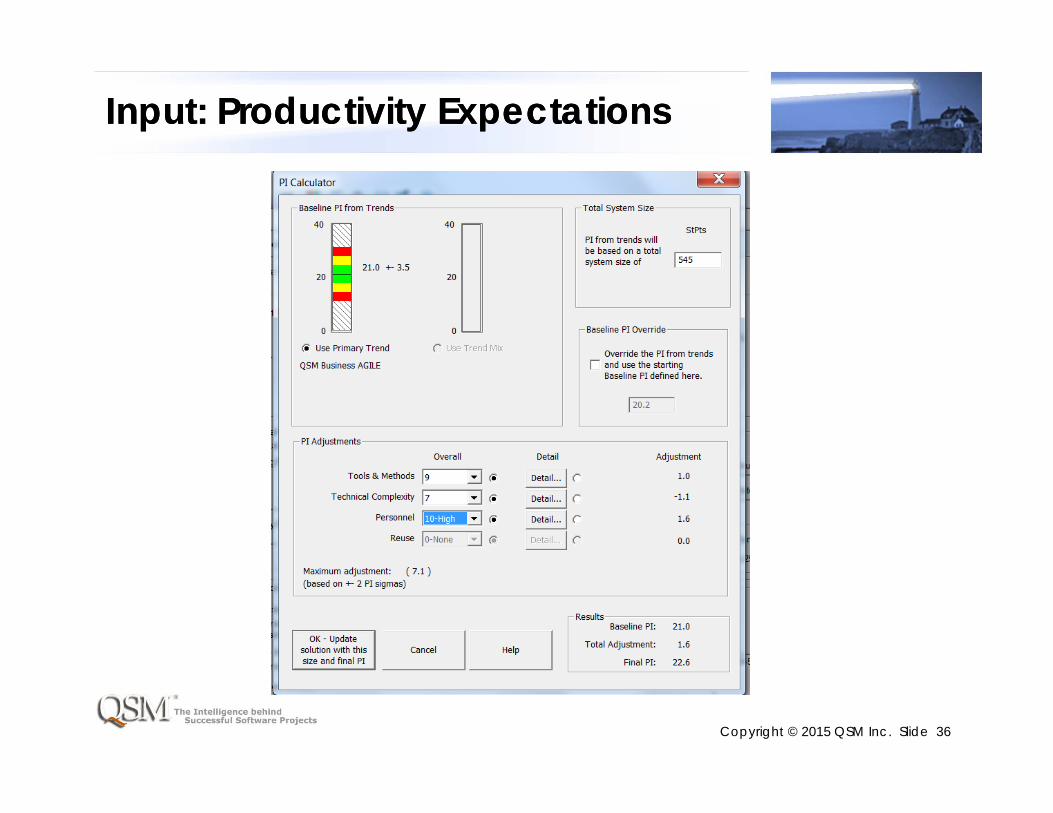
Input: Productivity ExpectationsInput: Productivity Expectations

Copyright © 2015 QSM Inc. Slide 37
Output: Tradeoffs between schedule and effort Output: Tradeoffs between schedule and effort

Copyright © 2015 QSM Inc. Slide 38
Output: RiskOutput: Risk

Copyright © 2015 QSM Inc. Slide 39
Output: Expected Dates for Key MilestonesOutput: Expected Dates for Key Milestones

Copyright © 2015 QSM Inc. Slide 40
In summaryIn summary
• Release must provide consumable value
• Unlike sprints, projects to develop a releases are not always time-boxed.
• Team members should make sprint level decisions, but estimating a release requires tools and methods that take into account:– Overall goals: Balance “minimal” with “viable”
– Top down estimate of the release as a whole rather than extrapolation from small chunks
– Statistical methods that understand the nonlinearities of software development
– Organizational or industry-wide historical data

Copyright © 2015 QSM Inc. Slide 41
SizingSizing
“Is it bigger than a breadbox?”Steve Allen, on “What’s My Line”

Copyright © 2015 QSM Inc. Slide 42
Size is the key to estimationSize is the key to estimation
• QSM educates our customers that software size is the key input to a credible estimates.
• Companies using waterfall methods often tried to “guesstimate” the duration of the various waterfall phases and add them up
• Agile methodologists have recognized that size is the key!
Copyright © 2015 QSM Inc. Slide 43
User Stories are the input to sizeUser Stories are the input to size
• Most agile teams use “user stories” to specify scope.
• “Story” was invented to bypass all the formality that was creeping into requirements management methodologies– If you can’t summarize a piece of functionality on
a 3 x 5 card, you don’t really understand what you want.

Copyright © 2015 QSM Inc. Slide 44
Epics, Stories, and Everything In BetweenEpics, Stories, and Everything In Between
• Look at the following backlog items:
– “Select an available seat for your flight”– “Look up the current departure gate for your
flight”– “Plan a trip”
• Is “Plan a trip” a story?
– Sort of, but it’s a really big, really vague story– It MUST be broken down to be understood, not just
to fit into a sprint– The term “Epic” was introduced to describe this

Copyright © 2015 QSM Inc. Slide 45
Epics, Stories, and Everything In BetweenEpics, Stories, and Everything In Between
• Epics and stories, like any other way to express scope, are hierarchical! Each level breaks down the stories in the level above it.
• It’s a multi-level hierarchy.– How many levels depends on the particular
function– Some stories break down to more levels than
others until you get to “developer sized bites”– User sized bites may be at any level

Copyright © 2015 QSM Inc. Slide 46
Epics, Stories, and Everything In BetweenEpics, Stories, and Everything In Between
• Epics and stories, like any other way to express scope, is hierarchical! Each level breaks down the stories in the level above it.
• There are not just two levels (epic, story). It’s a multi-level hierarchy.– How many levels depends on the particular
function– Some stories break down to more levels than
others until you get to “developer sized bites”– User size bites may be at any level
The developer sized bites selected for a single sprint are closer to the same size than the original stories. But the “user sized bite” of the original story may vary a lot, and development may span sprints.

Copyright © 2015 QSM Inc. Slide 47
Ways of showing the hierarchyWays of showing the hierarchy
• User Story Maps (Jeff Patton)
Steve Rogalski http://winnipegagilist.blogspot.com/2012/03/how-to-create-user-story-map.htm
Copyright © 2015 QSM Inc. Slide 48
Ways of Showing the HierarchyWays of Showing the Hierarchy
• Minimal Marketable Features– Mark Denne and Jane Cleland-Huang– “Software by Numbers”– Prioritize and schedule larger scale features and
their dependencies for overall value
• Traditional requirements hierarchy and trace relationships
Copyright © 2015 QSM Inc. Slide 49
Ways of Showing the HierarchyWays of Showing the Hierarchy
• Minimal Marketable Features– Mark Denne and Jane Cleland-Huang– “Software by Numbers”– Prioritize and schedule larger scale features and
their dependencies for overall value
• Traditional requirements hierarchy and trace relationships
The hierarchy emerges as the project progresses. At any point where you need to measure size for an estimate, some levels will be known but others will be broken out later.
You may only know epics. Some may already be broken down more concretely. The stories will likely be of widely varying sizes, which will be broken out further as the sprints progress.

Copyright © 2015 QSM Inc. Slide 50
Size and duration: a complicated relationshipSize and duration: a complicated relationship
• Size is a key input to an estimate– We will discuss in a few minutes ways of
measuring size appropriate for agile projects
• Seems obvious: The bigger the size, the more there is to get done, so the longer it will take
• But the relationship between size and duration is NOT a simple one.
Copyright © 2015 QSM Inc. Slide 51
Duration is not the only inputDuration is not the only input
• Consider a “bake off”:
• Two teams are asked to build exactly the same system
• Team 1 has 10 of your best programmers
• Team 2 has 5 junior programmers
• Will they take the same amount of time?

Copyright © 2015 QSM Inc. Slide 52
Duration is not the only inputDuration is not the only input
• Duration depends on software size, effort expended, and productivity of the team.
• But the relationship among these is not simple! (the nonlinearities of software development)
• Larry Putnam, Sr., founder of QSM, developed the software production equation to relate these:
Size= Productivity * ( Duration ** 1/3 ) ( Effort ** 4/3 )
We will discuss the issues of effort and productivity in the next webinar in this series.
For now, though, let’s look closer at the relationship between duration and size.

Copyright © 2015 QSM Inc. Slide 53
Size and duration– a nonlinear relationshipSize and duration– a nonlinear relationship
• So another “bakeoff”:
• A single team is asked to build two different systems
• The first is twice the size of the second
• Since the team is the same, will the first take twice as long?

Copyright © 2015 QSM Inc. Slide 54
Size and duration– a nonlinear relationshipSize and duration– a nonlinear relationship
• So another “bakeoff”:
• A single team is asked to build two different systems
• The first is twice the size of the second
• Since the team is the same, will the first take twice as long?

Copyright © 2015 QSM Inc. Slide 55
Size and duration– a nonlinear relationship!Size and duration– a nonlinear relationship!
• The larger system will take longer, but less than twice as long!
• There is an “economy of size”, and the amount produced by the team varies over the duration of the project.
• In terms often used by agile teams:
Copyright © 2015 QSM Inc. Slide 56
An Old Kid’s JokeAn Old Kid’s Joke
• The first kid says to the second kid, “What’s this?”
• The second kid says, “I don’t know”
• The first kid then replies….

Copyright © 2015 QSM Inc. Slide 57
An Old Kid’s JokeAn Old Kid’s Joke
• “I don’t know either, but here come five of them.

Copyright © 2015 QSM Inc. Slide 58
An Old Kid’s JokeAn Old Kid’s Joke
• “I don’t know either, but here come five of them.
Moral of the story: Sometimes we can know how many we have, even if we don’t know what one of them is!

Copyright © 2015 QSM Inc. Slide 59
Function Points and Story PointsFunction Points and Story Points
• Both are used to measure the size of software scope
• We can count how many we have without knowing what “one” is
• They differ in two very significant ways:– Function point counting is standardized by IFPUG– They require different descriptions of the scope

Copyright © 2015 QSM Inc. Slide 60
Using Story PointsUsing Story Points
• CAREFUL: Don’t double count stories that are broken out a multiple levels. But you don’t have to use the same level in the hierarchy for each story
20 pts
5 pts
2 pts
8 pts
5 pts
5 pts
40 pts 13 pts
5+2+8+5+5+13 = 33

Copyright © 2015 QSM Inc. Slide 61
Normalizing Size MeasuresNormalizing Size Measures
• In order to use the size measure for an estimate, we have to be able to compare the size of the system we’re estimating to the size of systems already developed.
• Since “a story point” doesn’t have a definition, how do we know that the rating from one project compares to the rating of another?– This is the same issue that researchers in many fields face,
called “inter-rater reliability”. It’s debated in the agile literature as “normalizing story points”

Copyright © 2015 QSM Inc. Slide 62
Four Levels of Normalization Four Levels of Normalization
• A team working on a project. – At the beginning of each sprint, they rate the stories
currently at the top of the backlog in story points. They are consistent from sprint to sprint.
• A team, across projects– Sometimes a team will stay together from one project to
another. They can consistently rate size of stories across those projects.

Copyright © 2015 QSM Inc. Slide 63
Four Levels of Normalization Four Levels of Normalization
• Within a company– All teams within the company rate stories consistently. Then
as you capture more and more history within your company, you can use this consistent rating to get the size of new projects.
• Across the industry– This would allow us to benchmark your project against
similarly sized projects across the industry.

Copyright © 2015 QSM Inc. Slide 64
Four Levels of Normalization Four Levels of Normalization
• Within a company– All teams within the company rate stories consistently. Then
as you capture more and more history within your company, you can use this consistent rating to get the size of new projects
• Across the industry– This would allow us to benchmark your project against
similarly sized projects across the industry. This is tricky: there’s no single standard for this that’s accepted industry wide. Perhaps someday there will be, but there isn’t right now.
Unlike story points, Function Points are normalized at the industry level. The International Function Point Users Group (IFPUG) standardizes and certifies people in function point counting.

Copyright © 2015 QSM Inc. Slide 65
Three Sizing TechniquesThree Sizing Techniques
• No sizing technique is perfect. Each has its merits and problems.
• Three techniques for agile releases:– Measure using function points– Measure using story points– Count stories

Copyright © 2015 QSM Inc. Slide 66
Measure using function pointsMeasure using function points
• Industry standard– Can compare to other projects in your company using your own
history– Can compare to thousands of projects industry wide
• Have to look at the scope as a whole– You do not count the “function points for each story” and
add them up
• Captures effect of shared code better than other methods
• Emergent design makes it difficult to count function points completed at each iteration

Copyright © 2015 QSM Inc. Slide 67
Measure using function pointsMeasure using function points
• Industry standard– Can compare to other projects in your company using your own
history– Can compare to thousands of projects industry wide
• Have to look at the scope as a whole– You do not count the “function points for each story” and
add them up
• Captures effect of shared code better than other methods
• Emergent design makes it difficult to count function points completed at each iteration
You may be interested in an article, “Counting Function Points for Agile: Iterative Software Development” by Carol Dekkers in the 2014 QSM Software Almanac. Go to www.qsm.com to request a copy.

Copyright © 2015 QSM Inc. Slide 68
Measure using Story PointsMeasure using Story Points
• Fits with what the team will be doing sprint by sprint and agile planning and tracking tools
• Measures the stories on the backlog directly, no additional translation of scope required
• Story points completed and story points remaining (“burndown chart”) can be captured each iteration
• Major issue: Requires the “company” level of normalization to be useful for estimation– Must invest in obtaining inter-rater reliability– Only requires project team level for the sprint decisions

Copyright © 2015 QSM Inc. Slide 69
Count StoriesCount Stories
• Easiest to do
• Does NOT take into account different sized stories– You have to be very lucky for the sizes of the stories to
average out, especially when they haven’t been broken down to similar “developer sized bites”
• Can be counted at the end of each iteration– But hard to compare to the number of developer sized bites
already developed to the larger stories remaining on the backlog.
Copyright © 2015 QSM Inc. Slide 70
SLIM-Estimate Agile TemplateSLIM-Estimate Agile Template
• Trend based on industry wide agile projects
• Size unit and size calculator for estimating size
• Specific agile settings we will describe in this webinar series:– Milestones for project control– Settings for emergent requirements
• Customizable to your specific ways of working

Copyright © 2015 QSM Inc. Slide 71
SLIM Agile AdjusterSLIM Agile Adjuster
• Specific for sprint based methods
• Extension to SLIM-Estimate, available right from the menu
• Choose sprint length– Computes estimated duration in terms of the
chosen sprint length
• Adjusts key parameters based on sprint length and estimated number of sprints

Copyright © 2015 QSM Inc. Slide 72
Shape of the Work
“Everything’s different, nothing’s changed, only maybe slightly rearranged”
From “Company” by Stephen Sondheim

Copyright © 2015 QSM Inc. Slide 73
When is a phase not a phase?When is a phase not a phase?
• Biggest difference in scheduling agile and waterfall projects:– In waterfall projects, different types of work (e.g.
requirements definition, coding, testing) happen largely at different times
– In agile projects, these different types of work happen much more concurrently
• In SLIM-Estimate, the term “phase” refers to different types of work
• “Phase tuning” adjusts the schedule and effort for these different types of work
Copyright © 2015 QSM Inc. Slide 74
Two key types of workTwo key types of work
• Story Writing (well, maybe “Story discussion”)– “Groom the backlog”: Choose and prioritize the stories that
will be developed, refine them into a hierarchy from high level business value to “developer sized bites”
– Hold the conversations needed to flesh out the critical details
– Detail constraints and basic architecture that’s an input to the development work
– Cooperative effort of product manager, development team, and business representatives
• Development/Test– Coding, testing, and other work to get to the definition of
done on the defined stories

Copyright © 2015 QSM Inc. Slide 75
Typical Waterfall Phase TuningTypical Waterfall Phase Tuning
87654321
Req. and DesignBuild and Test
Copyright © 2015 QSM Inc. Slide 76
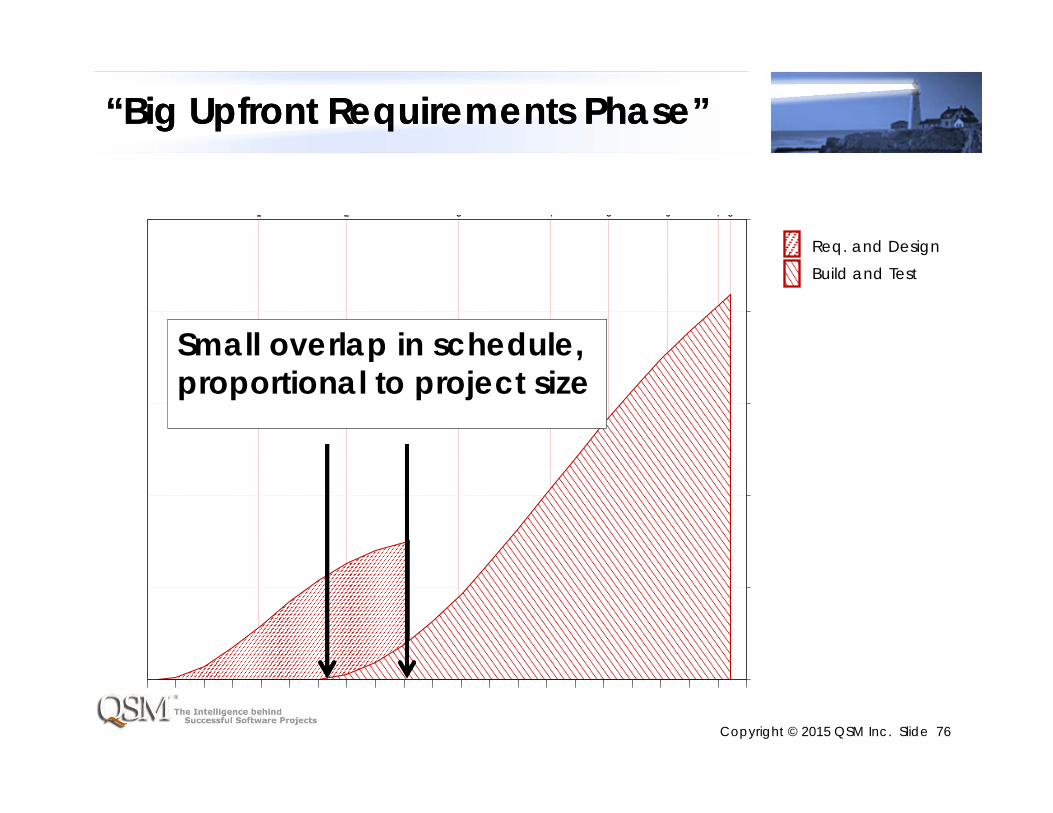
“Big Upfront Requirements Phase”“Big Upfront Requirements Phase”
87654321
Req. and DesignBuild and Test
Small overlap in schedule, proportional to project size

Copyright © 2015 QSM Inc. Slide 77
Typical Agile Phase TuningTypical Agile Phase Tuning
Groom backlogBuild out backlog
Almost entirely overlaps, with differences based on iteration length, not project size
Copyright © 2015 QSM Inc. Slide 78
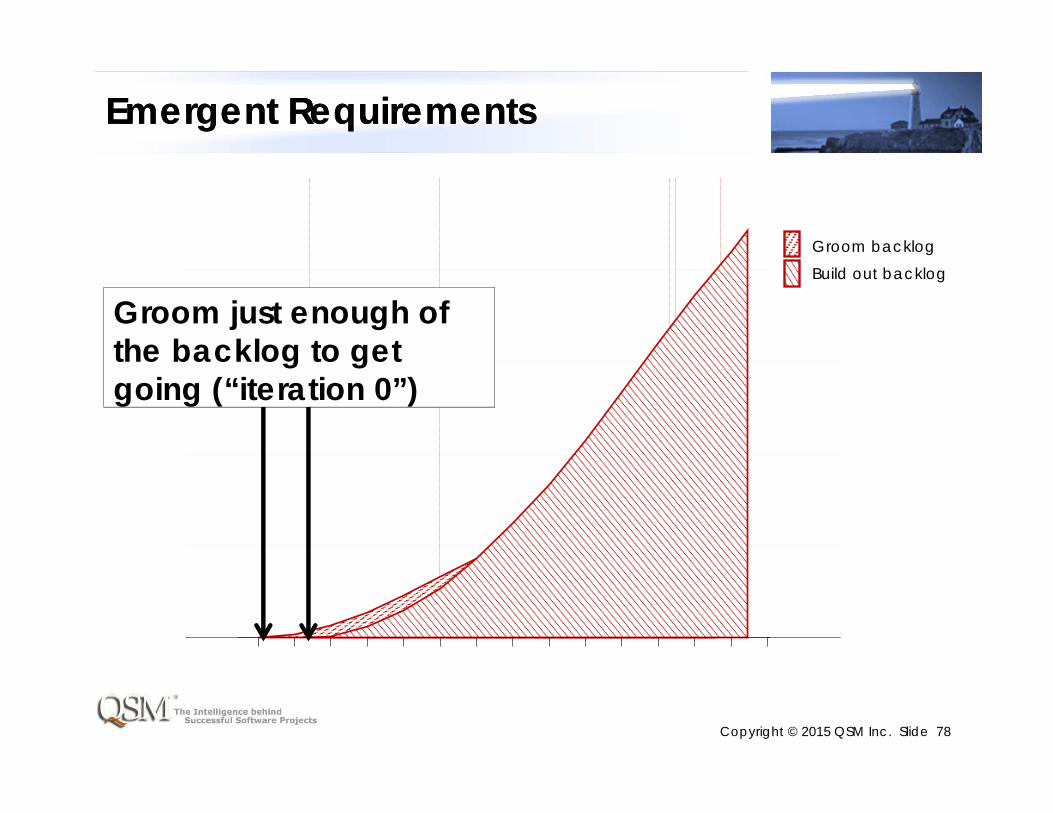
Emergent RequirementsEmergent Requirements
Groom backlogBuild out backlog
Groom just enough of the backlog to get going (“iteration 0”)

Copyright © 2015 QSM Inc. Slide 79
Emergent RequirementsEmergent Requirements
Groom backlogBuild out backlog
Just-in-time backlog grooming and requirements detail discussions concurrent with coding and testing
Copyright © 2015 QSM Inc. Slide 80
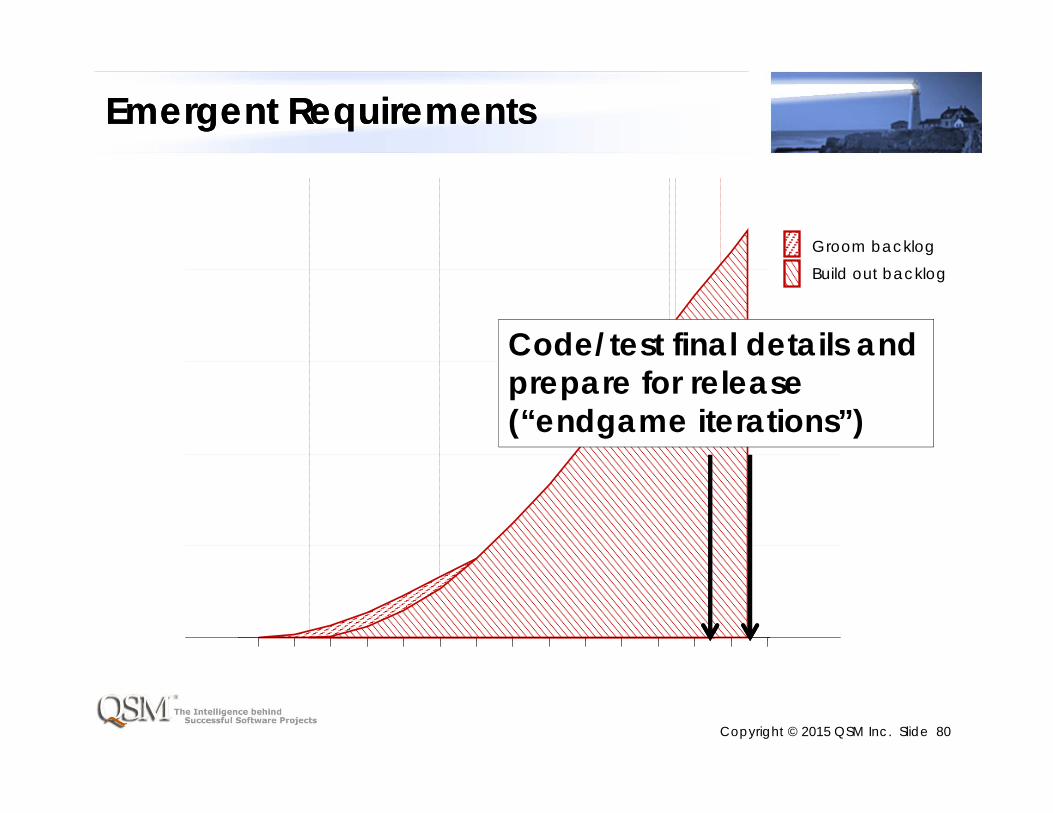
Emergent RequirementsEmergent Requirements
Groom backlogBuild out backlog
Code/test final details and prepare for release (“endgame iterations”)
Copyright © 2015 QSM Inc. Slide 81
Agile phase tuning in SLIM-EstimateAgile phase tuning in SLIM-Estimate
• Agile Adjuster adjusts phase tuning based on estimated number of iterations
• Based on your methodology choices, you pick:– Number of iterations spent grooming the backlog
before coding starts (“iteration 0”)– Number of extra development iterations spent in
final changes and other activities to get ready to release (“endgame”)
Copyright © 2015 QSM Inc. Slide 82
To Earn PDUs for this Webinar:To Earn PDUs for this Webinar:
• Title: Agile Estimation: Beyond the Myths Part 1
• ID: WEB042215
Contact us at [email protected]

Copyright © 2015 QSM Inc. Slide 83
Questions?Questions?
“I never learn anything talking. I only learn when I ask questions.”
Lou Holtz
Contact us at [email protected]