Micromechanics of brittle faulting and cataclastic flow in Berea sandstone
16
Pergamon 0191-8141(95)00076-3 JournalofStructural Geology, Vol. 18, No. l, pp. 1 to 16, 1996 Copyright© 1995 ElsevierScienceLtd Printed in Great Britain. All rights reserved 0191-8141/96 $15.00+0.00 Micromechanics of brittle faulting and cataclastic flow in Berea sandstone BEATRIZ MENt~NDEZ,* WENLU ZHU and TENG-FONG WONG Department of Earth and Space Sciences, State University of New York at Stony Brook, Stony Brook, NY 11794-2100, U.S.A. (Received 10 January 1995; accepted in revisedform 28 June 1995) Abstract--The micromechanics of failure in Berea sandstone were investigated by characterizing quantitatively the evolution of damage under the optical and scanning electron microscopes. Three series of triaxial compression experiments were conducted at the fixed pore pressure of 10 MPa and confining pressures of 20, 50 and 260 MPa, respectively, corresponding to three different failure modes: shear localization with positive dilatancy, shear localization with relatively little dilatancy and distributed cataclastic flow. To distinguish the effect of non-hydrostatic stress from that of hydrostatic pressure, a fourth suite of hydrostatically loaded samples was also studied. Using stereological procedures, we characterized quantitatively the following damage parameters: microcrack density and its anisotropy, pore-size distribution, comminuted volume fraction and mineral damage index. In the brittle regime, shear localization did not develop until the post-failure stage, after the peak stress had been attained. The microcrack density data show that very little intragranular cracking occurred before the peak stress was attained. We infer that dilatancy and acoustic emission activity in the pre- failure stage are primarily due to intergranular cracking, probably related to the shear rupture of lithified and cemented grain contacts. Near the peak stress, intragranular cracking initiates from grain contacts and this type of Hertzian fracture first develops in isolated clusters, and their subsequent coalescence results in shear localization in the post-failure stage. The very high density of intragranular microcracking and pronounced stress-induced anisotropy in the post-failure samples are the consequence of shear localization and compactive processes operative inside the shear band. In contrast, Hertzian fracture was a primary cause for shear-enhanced compaction and strain hardening throughout the cataclastic flow regime. Grain crushing and pore collapse seem to be most intense in weakly cemented regions. Finite element simulations show that the presence of cement at grain contacts alleviates the tensile stress concentration, thus inhibiting the onset of Hertzian fracture and grain crushing. INTRODUCTION The development of faults in high-porosity sandstone has been studied extensively in the field. Previously documented examples include the Entrada and Navajo sandstones of Utah (Aydin 1978, Aydin & Johnson, 1978), the Simpson Group in Oklahoma (Pittman 198l), the Wingate sandstone in Colorado (Jamison & Stearns 1982) and the New Red sandstone in Arran, Scotland (Underhill & Woodcock 1987). These studies have shown that the geometry of a fault system in porous sandstone is very complex and the deformation is com- monly observed to be partitioned among a network of fault zones, deformation bands and granulation seams with lengths ranging from kilometres down to a few centimetres and localized slip ranging from a few milli- metres up to tens of metres. [t has been suggested that the spatial complexity in faulting is related to the tran- sition of failure mode from brittle faulting to cataclastic flow (Antonellini et al., 1994) and that the tectonic deformation was possibly coupled to fluid flow processes (Pittman 1981, Hippler 1993, Antonellini & Aydin 1994). The pressure and temperature conditions in many of the sandstone formations are considered to be relatively low, such that thermally activated deformation mechan- *Present address: Institut de Physique du Globe, 5 rue Rend Descartes, F67084 Strasbourg, France. isms (including intracrystalline plasticity and diffusive mass transfer) probably did not play important roles in the overall deformation and failure processes (Jamison & Stearns 1982). Therefore, the mechanics is described by the low T brittle~tuctile transition (Rutter & Hadiza- deh 1991) which has been investigated extensively in the rock mechanics laboratory. Experimental studies have shown that the transition in failure mode from shear localization to distributed cataclastic flow is promoted by an increase in the effective pressure and porosity (e.g. Handin et al., 1963, Dunn et al., 1973, Wong 1990, Scott & Nielsen 1991). Whereas brittle faulting commonly develops in parallel with dilatancy and strain softening (Gowd & Rummei 1980, Lockner et al., 1992), shear localization is inhibited by compaction and strain hard- ening at relatively high effective pressures (Edmond & Paterson 1972, Jamison & Teufel 1979). Although this failure mode is macroscopically 'ductile', involving dis- tributed cataclastic flow, the microscopic deformation mechanism involves pervasive brittle microcracking, manifested by intensive acoustic emission activity (Gallagher et al., 1974, Zhang et al., 1990a, Wong et al., 1992). Previous laboratory studies on the low T brittle- ductile transition in siliciclastic rocks have focused pri- marily on the phenomenology of deformation and fail- ure. Relatively little research has been performed to elucidate the micromechanics of failure and to charac- terize quantitatively the evolution of damage. On the
Transcript of Micromechanics of brittle faulting and cataclastic flow in Berea sandstone

Pergamon
0191-8141(95)00076-3
JournalofStructural Geology, Vol. 18, No. l, pp. 1 to 16, 1996 Copyright © 1995 Elsevier Science Ltd
Printed in Great Britain. All rights reserved 0191-8141/96 $15.00+0.00
Micromechanics of brittle faulting and cataclastic flow in Berea sandstone
BEATRIZ MENt~NDEZ,* WENLU ZHU and TENG-FONG WONG
Department of Earth and Space Sciences, State University of New York at Stony Brook, Stony Brook, NY 11794-2100, U.S.A.
(Received 10 January 1995; accepted in revised form 28 June 1995)
Abstract--The micromechanics of failure in Berea sandstone were investigated by characterizing quantitatively the evolution of damage under the optical and scanning electron microscopes. Three series of triaxial compression experiments were conducted at the fixed pore pressure of 10 MPa and confining pressures of 20, 50 and 260 MPa, respectively, corresponding to three different failure modes: shear localization with positive dilatancy, shear localization with relatively little dilatancy and distributed cataclastic flow. To distinguish the effect of non-hydrostatic stress from that of hydrostatic pressure, a fourth suite of hydrostatically loaded samples was also studied. Using stereological procedures, we characterized quantitatively the following damage parameters: microcrack density and its anisotropy, pore-size distribution, comminuted volume fraction and mineral damage index. In the brittle regime, shear localization did not develop until the post-failure stage, after the peak stress had been attained. The microcrack density data show that very little intragranular cracking occurred before the peak stress was attained. We infer that dilatancy and acoustic emission activity in the pre- failure stage are primarily due to intergranular cracking, probably related to the shear rupture of lithified and cemented grain contacts. Near the peak stress, intragranular cracking initiates from grain contacts and this type of Hertzian fracture first develops in isolated clusters, and their subsequent coalescence results in shear localization in the post-failure stage. The very high density of intragranular microcracking and pronounced stress-induced anisotropy in the post-failure samples are the consequence of shear localization and compactive processes operative inside the shear band. In contrast, Hertzian fracture was a primary cause for shear-enhanced compaction and strain hardening throughout the cataclastic flow regime. Grain crushing and pore collapse seem to be most intense in weakly cemented regions. Finite element simulations show that the presence of cement at grain contacts alleviates the tensile stress concentration, thus inhibiting the onset of Hertzian fracture and grain crushing.
INTRODUCTION
The development of faults in high-porosity sandstone has been studied extensively in the field. Previously documented examples include the Entrada and Navajo sandstones of Utah (Aydin 1978, Aydin & Johnson, 1978), the Simpson Group in Oklahoma (Pittman 198l), the Wingate sandstone in Colorado (Jamison & Stearns 1982) and the New Red sandstone in Arran, Scotland (Underhill & Woodcock 1987). These studies have shown that the geometry of a fault system in porous sandstone is very complex and the deformation is com- monly observed to be partitioned among a network of fault zones, deformation bands and granulation seams with lengths ranging from kilometres down to a few centimetres and localized slip ranging from a few milli- metres up to tens of metres. [t has been suggested that the spatial complexity in faulting is related to the tran- sition of failure mode from brittle faulting to cataclastic flow (Antonellini et al. , 1994) and that the tectonic deformation was possibly coupled to fluid flow processes (Pittman 1981, Hippler 1993, Antonellini & Aydin 1994).
The pressure and temperature conditions in many of the sandstone formations are considered to be relatively low, such that thermally activated deformation mechan-
*Present address: Institut de Physique du Globe, 5 rue Rend Descartes, F67084 Strasbourg, France.
isms (including intracrystalline plasticity and diffusive mass transfer) probably did not play important roles in the overall deformation and failure processes (Jamison & Stearns 1982). Therefore, the mechanics is described by the low T brittle~tuctile transition (Rutter & Hadiza- deh 1991) which has been investigated extensively in the rock mechanics laboratory. Experimental studies have shown that the transition in failure mode from shear localization to distributed cataclastic flow is promoted by an increase in the effective pressure and porosity (e.g. Handin et al. , 1963, Dunn et al. , 1973, Wong 1990, Scott & Nielsen 1991). Whereas brittle faulting commonly develops in parallel with dilatancy and strain softening (Gowd & Rummei 1980, Lockner et al. , 1992), shear localization is inhibited by compaction and strain hard- ening at relatively high effective pressures (Edmond & Paterson 1972, Jamison & Teufel 1979). Although this failure mode is macroscopically 'ductile', involving dis- tributed cataclastic flow, the microscopic deformation mechanism involves pervasive brittle microcracking, manifested by intensive acoustic emission activity (Gallagher et al. , 1974, Zhang et al. , 1990a, Wong et al. , 1992).
Previous laboratory studies on the low T brittle- ductile transition in siliciclastic rocks have focused pri- marily on the phenomenology of deformation and fail- ure. Relatively little research has been performed to elucidate the micromechanics of failure and to charac- terize quantitatively the evolution of damage. On the
2 B. MENI~NDEZ, W. ZHU and T.-F. WONG
other hand, the naturally deformed microstructures induced by shear localization and cataclasis in the field have been comprehensively studied, in particular by Aydin and co-workers (Aydin 1978, Aydin & Johnson 1978, Antonellini et al., 1994) and recently by Anders & Wiltschko (1994). Relatively detailed information on the evolution of damage (including microcracking and its anisotropy, spatial extent of grain crain crushing and porosity change) in sandstone formations are now avail- able. The deeper understanding of the field data re- quires insights provided by the systematic investigation of damage evolution under controlled condition in the laboratory.
In this study, we characterized quantitatively the evolution of porosity, microcrack density and its aniso- tropy, comminuted volume fraction and pore-size distri- bution in three suites of triaxially compressed Berea sandstone samples. The effective pressure conditions were chosen such that the deformed samples show fundamentally different failure modes: shear localiz- ation with positive dilatancy, shear localization with relatively little dilatancy and distributed cataclastic flow with compaction. Because of its relatively high porosity, Berea sandstone can undergo microcracking and grain crushing at sufficiently high effective pressures (Zhang et al., 1990b). To distinguish damage due to the hydro- static compression from that induced by the non- hydrostatic stresses, we obtained a fourth suite of hydro- statically compacted samples for reference. The de- formed samples were observed using optical and scanning electron microscopes. The damage evolution was characterized quantitatively using techniques which have been proved useful in quantifying microcracking in low-porosity silicate (e.g. Tapponier & Brace 1976, Kranz 1983, Wong 1985, Moore & Lockner 1995) and calcitic (Fredrich et al., 1989) rocks.
EXPERIMENTAL PROCEDURES
Studied samples
Our Berea sandstone samples were cored from a block purchased from Cleveland quarry, Ohio. This block was cut from the most porous and permeable members of the formation, with a porosity of 21% and water permeability of 5 × 1 0 - 1 4 m 2 at an effective pressure of 3 MPa. Cored samples from the same block were previously studied by Zhang et al. (1990b), who reported an average grain size (mean intercept length) of 173 ktm. The Berea sandstone consists primarily of sub-angular, well-sorted quartz grains. Grains of potas- sium feldspar, quartzite rock fragments and kaolinite aggregates are also present, together with various acces- sory minerals (sodium feldspar, apatite, rutile and zir- con). We used the microprobe to conduct the modal analysis, which yielded the following composition: 83% quartz, 7% kaolinite, 7% potassium feldspar, 2% dolo- mite and 1% accessory minerals. The dolomite occurs as cement heterogeneously distributed in the pore space.
The kaolinite primarily occurs as dispersed flakes and its percentage can vary significantly (ranging from <3 to 16%) among different areas of a thin section.
Deformation experiments
Since the seminal study of Handin et al. (1963), the mechanical behaviour of Berea sandstone has been thoroughly investigated for several decades. In particu- lar, Jamison & Teufel (1979) reported detailed measure- ments of the volumetric strain, and Bernabe & Brace (1990) conducted microstructural observations on failed samples. Guided by the previous work, this study fo- cused on the evolution of damage and failure by conduct- ing quantitative microstructural observations on Berea sandstone samples retrieved at different stages of defor- mation. Several pressure conditions were chosen such that the mechanical behaviour would correspond to distinct regimes of deformation mechanism.
We performed hydrostatic compaction and triaxial compression tests on cylindrical samples (of diameter 18.4 mm and height 38.1 mm) saturated with distilled water. The samples were deformed at room temperature under 'drained' conditions at a constant pore pressure of 10 MPa. Kerosene was used as confining pressure me- dium, and the strain rate for all the triaxial experiments were servo-controlled at 5 × 10 -5 s -~. Porosity change was determined from the pore volume change divided by the initial bulk volume of the sample, with an uncer- tainty of 0.1%. The axial strain was calculated using the axial displacement monitored by a transducer (DCDT), and the axial stress was calculated from the measure- ments of an external load cell adjusting for relative change of cross-sectional area of the sample. Details of the experimental procedure were presented previously by Zhang et al. (1990c).
Samples at different stages of deformation were unloaded and retrieved from the pressure vessel for microscope observations and quantitative microstruc- tural characterization. The deformation histories of the samples are summarized in Table 1. The stress-strain curves of Berea sandstone have good reproducibility, and the curves shown in Figs. 1 and 2 are for the samples with the most deformation. The first suite consists of three hydrostatically compacted samples (H1, H2 and H3) with progressive accumulation of damage. The loading history (porosity change as a function of effec- tive pressure) of the H-series is shown by the dashed curve in Fig. 1. Zhang et al. (1990b) have demonstrated that the inflection point P* corresponds to the onset of grain crushing and pore collapse. Therefore, samples H2 and H3 were expected to show microstructures indica- tive of the onset and progressive accumulation of damage induced by grain crushing.
Three suites of triaxially compressed samples were deformed at constant confining pressures (02 = (73 = Pc) of 260 MPa, 50 MPa and 20 MPa respectively. Since the pore pressure Pp was fixed at 10 MPa, the corresponding effective pressures (Pc - Pp) were 250 MPa, 40 MPa and 10 MPa, respectively (Figs. 1 and 2). If the overall

Micromechanics of brittle faulting and cataclastic flow 3
Table 1. Stress history of the H-, D-, T- and B-series samples investigated in this study. All samples were deformed in conventional triaxial compression tests at a fixed pore pressure of Pp = 10 MPa under drained conditions. The stress, strain and porosity change are max imum values
attained before the samples were unloaded and retrieved from the pressure vessel
Principal stress Effective mean Effective Axial Porosity difference (MPa) stress (MPa) pressure (MPa) strain reduction
Sample O1--O" 3 (O1+ 203)]3-P p 03--P p (%) (%) Comment s
BER 0 0 0 0 H1 0 250 250 3.4 H2 0 380 380 5.2 H3 0 540 540 10.8 D1 90 280 250 1.9 3.9 D2 210 320 250 2.8 5.0 D3 585 445 250 26.0 13.3 T1 150 90 40 2.0 1.79 T2 1"65 95 40 2.4 1.82 T3 135 85 40 3.8 1.90 B 1 90 40 10 1.4 0.95 B2 105 45 10 1.8 0.4 B3 60 30 10 2.7 -0 .15
Unstressed
Onset of grain crushing Extensive pore collapse
Onset of shear-enhanced compaction Cataclastic flow without shear localization
Post-failure sample: conjugate shear bands End of the stress drop Half way between C' and peak stress Unloaded just beyond the peak stress End of the stress drop: single shear band
6OO. H,
J i ,
~. hydrostatic, ~
~ C* /
. / ~ : D 1 • D2 300 , Ir laxi~l ~c:2SO [.~P,3
~ ' i ~ B e r e a s a n d s t o n e I ~ r PP = 10 M P a .
iaxial, Pc=50 MPa
I ; • I I I I I I I -2 0 I 2 4 6 8 10 12 14
C' P O R O S I T Y R E D U C T I O N (%)
Fig. 1. Mean effective stress (01 + 2o3)/3 - Pp vs porosity reduction for the four suites of samples, showing the peak stresses attained by the samples before they were unloaded. The dashed curve is for the hydrostatic test and the solid curves are for triaxial compression tests at effective pressures of 10, 40 and 250 MPa. The critical effective pressure for the onset of grain crushing (P*) and the critical effective mean stresses for the onset of shear-enhanced compaction (C*) and for
the onset of shear-induced dilation (C') are indicated.
03 6O0
~ 5O0 =
Z
u. ~ 3O0
~ 200 ~1 Pp = 10 MPa T2 T3 stra in rate 5;=-5 Is
~a. Pc = 2° MPa
0 . . . . . . . . . , . . . . . . . . . . . . . . . . . . . .
5 10 15 20 25 30
A X I A L S T R A I N (%)
Fig. 2. Principal stress difference o I - 03 vs axial strain for the triaxially compressed samples with indication of the peak stresses
attained by the samples.
compaction is solely controlled by the hydrostatic stresses, then porosity changes for triaxial compression tests at three different effective pressures should co- incide with the hydrostat in Fig. 1. Deviations from the hydrostat would imply that the porosity change is de- pendent on both the hydrostatic and deviatoric stresses. At an effective pressure of 250 MPa, the porosity re- duction curve coincided with the hydrostat up to a differential stress of about 205 MPa. When the differen- tial stress was increased beyond this point (marked by C* in Fig. 1), there was an accelerated decrease in porosity in comparison to the hydrostat. This phenom- enon is referred to as 'shear-enhanced compaction' (Curran & Carroll 1979, Wong et al., 1992). The sample D2 was retrieved just after it had been loaded to beyond C*. Even though the last sample D3 of this suite had an axial strain of close to 30% (Fig. 2), no shear localization is evident and therefore the deformation was accomo- dated by distributed cataclastic flow.
In contrast, the porosity change behaviour at an effective pressure of 10 MPa was such that, at a differen- tial stress of about 50 MPa, we began to observe the compaction to decelerate in comparison with the hydro- stat. We will refer to this stress state (marked by the point C' in Fig. 1) as the onset of 'shear-induced dila- tion'. This behaviour is akin to the dilatancy phenom- enon commonly observed in low-porosity crystalline rocks (Brace 1978). Beyond C', the differential stress reached a peak value of 105 MPa, after which there was a gradual stress drop and strain softening, and the sample ultimately failed by shear localization. The pre-failure sample B1 was loaded to about halfway between C' and the peak stress. The post-failure sample B2 was unloaded as soon as the peak stress was attained, before the onset of shear localization. The sample B3 was deformed well into the post-failure stage with a fully developed shear band. Our loading system is sufficiently stiff that the post-failure deformations were stable.
A transitional type of failure was observed at an effective pressure of 40 MPa. Strain softening was ob- served after the differential stress r eacheda peak value of about 175 MPa (Fig. 2). Just before the peak stress was attained, the porosity increased somewhat relative

4 B. MENI~NDEZ, W. Z H U and T.-F. W O N G
to the hydrostat (Fig. 1), but then there was an acceler- ated decrease in porosity during the post-failure stage. Incipient conjugate shear bands were observed in the two post-failure samples T2 and T3. The complexity in porosity change behaviour renders it difficult to unam- biguously pick out C* or C' for this suite of samples.
Optical and scanning electron microscopy
Deformed samples were first impregnated with epoxy and then sawed along a plane parallel to the axial direction into two halves. In samples with shear localiz- ation, care was taken to saw along a plane normal to the plane of localization.
For each deformed sample, a crack section (25.4 mm in diameter and about 100/~m thick) was then prepared following the procedure outlined by Richter & Simmons (1977). The sections were then ion-milled (Brace et al., 1972) and sputter-coated with 0.02 /~m of gold- palladium. Preliminary observations were made using optical microscope, followed by detailed study with a J E O L 5300 scanning electron microscope (SEM) with a voltage of 30 KV. The latter was equipped with a secondary electron detector and a backscattered elec- tron detector. In this paper, we will only show back- scattered electron images. Compositional analysis was also performed using an electron microcrobe C A M E B A X (Cameca).
Quantitative characterization of stress-induced micro- structures
For each sample, six rectangular mosaics (10 × 0.6 mm) of SEM micrographs were obtained using the secondary electron mode at a magnification of 160z. As indicated in Fig. 3, three of the mosaics were aligned in the axial (ol) and the other three in the transverse (03) directions respectively. Using stereological techniques (Underwood 1970), we characterized quantitatively the following microstructural parameters as observed on the photomosaics:
(1) Microcrack density. A test line of length 10 mm was placed along the long direction of the mosaic and the number of intercepts with crack traces were measured. The number of intercepts normalized to the test line length are denoted by I1~ and I~ for test lines aligned with the al and 03 directions respectively. If stress- induced microcracking had developed preferentially along the Ol direction, then I[~ > I t and the difference is a measure of the stress-induced anisotropy in micro- crack density. For axisymmetrically deformed samples, the stereological parameters are related to the micro- crack surface area per unit volume (Wong 1985):
Sv = (x/2)I~ + (2 - x/2)II~ (1)
(2) Pore-size distribution. Whenever the test line encountered the pore space, we differentiated the elongate microcracks from the almost equi-dimensional pores according to the aspect ratio. If the aspect ratio was greater than about 1/10, the void was considered to be a pore. The chord length distribution was obtained by measuring the length of the intersection between pores and test lines in two orthogonal directions.
(3) Porosity reduction and comminuted volume. By point counting, the pore porosity (i.e. the total pore space minus the microcracks) was estimated. Grain crushing was an important deformation mechanism in some of our samples, and since microcracking in the comminuted zone was so intense that it was impossible to characterize quantitatively the crack density, we esti- mated by point counting the volume percentages of the comminuted zones in these samples.
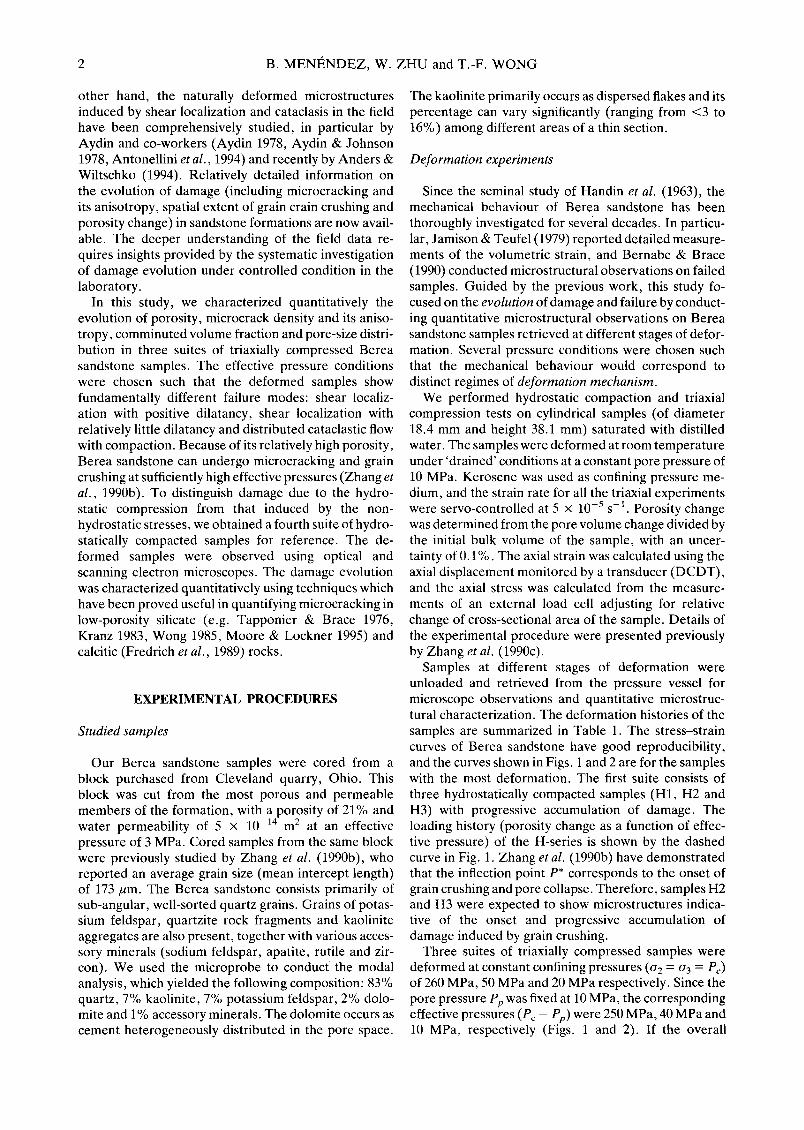
(4) Mineral damage index. To characterize the degree of damage as a function of mineralogy, we developed a damage index. A number of grains were randomly sampled and the damage was assessed according to a scale from 0 to 4 (Fig. 4). A more comprehensive approach would be to characterize the damage by directly measuring the number of fractures in each grain.
observed area rock section
Fig. 3. Schematic diagram of a crack section showing its orientation relative to the axial loading (cq). The dark areas near the center mark
the six rectangular mosaics for the stereological measurements.
Fig. 4. Criteria for the assignment of the damage indices. The index 0 indicates that no microcracking is evident, and index 1 indicates that one or two intragranular cracks are observed. An index of 2 indicates that there are more than three intragranular cracks, but not more than two have cut across the grain diametrically. An index of 3 indicates that, although more than two cracks have propagated across the grain diametrically, the grain is still intact, without signs of grain crushing. If
grain crushing is evident, an index of 4 is assigned.

Micromechanics of brittle faulting and cataclastic flow 5
This alternative procedure would have been very time- consuming and we believe that the semi-quantitative damage index adopted here may be adequate at the present stage of our research.
MICROSCOPIC OBSERVATION
The H-series: hydrostatic compaction
For reference, we show in Fig. 5(a) a micrograph of the undeformed sample BER. Few pre-existing cracks are to be found in the quartz. Short intragranular cracks are often located along cleavages of the potassium feldspar grains. Clay aggregates (kaolinite with a fine texture) and dolomite cement are distributed heteroge- neously in the pore space. The hydrostatically com- pacted sample H1 appears to be relatively undeformed. Only after the effective pressure had exceeded the critical value P* did we observe appreciable accumu- lation of cracking. Grain crushing and pore collapse are pervasive in the sample H3 (Fig. 5b). The spatial distri- bution of damage is quite heterogeneous, with the relatively intact regions associated mostly with grains cemented by carbonates. The grain crushing process was probably triggered by extensile cracking initiated at contact regions where stress concentration had been induced by grains impinging on one another (Gallagher et al., 1974), in a manner analogous to the Hertzian fracture model analyzed by Zhang et al. (1990b). This microfracturing process is highlighted in Fig. 5(c), which is from sample H2 retrieved just after the onset of grain crushing at the critical pressure P*.
The D-series: shear-enhanced compaction and cataclastic flow
of pre-existing microcracks (located within grains or along grain boundaries). Even when observed under high magnifications with the SEM, there was little evi- dence of the propagation of stress-induced intragranular cracks.
Incipient shear bands were observed in conjugate pairs in the post-failure samples T2 and T3 at a relatively high angle of about 40 ° to ol. The conjugate shear bands in T3 are about 1 mm wide, and intensive grain crushing was observed within them (Fig. 6a). The grain crushing seems to have initiated at grain contacts, where the stress concentration induced the development of Hert- zian fractures (Fig. 6b). The microcracking seems to have developed preferentially subparallel to Ol, and cementation again tends to inhibit the microcracking (Fig. 6c). Outside the shear bands, microcracking is relatively undeveloped, similar to what was observed in the pre-failure sample T1.
The B-series: brittle faulting with positive dilatancy
In the pre-failure sample, very little intragranular cracking was observed even though B1 was loaded to well beyond the onset of dilatancy C'. The post-failure sample B2 does not show a throughgoing shear band, but many isolated clusters of Hertzian fractures had initiated from grain contacts (Fig. 6d). Shear localiz- ation was observed in the post-failure samples B3 (Fig. 6e), with a throughgoing fault cutting through the sample at an angle of about 30 ° to ~q. The width of the shear band was about 450 ~tm. Developments of Hertzian fractures and stress-induced anisotropy within the shear band are qualitatively similar to those ob- served in the post-failure T-series samples (Fig. 6f).
Appreciable increase in cracking is evident in samples which were deformed to beyond C*, the stress for the onset of shear-enhanced compaction (Fig. 1). The damage resulted primarily from grain crushing and pore collapse, especially in weakly cemented regions (Fig. 5d). In comparison with the damages in the hydrostati- cally compacted sample (Fig. 5b), there are two import- ant differences. Firstly, the cataclastic flow process was considerably more efficient in compacting the sample, as observed in D3 where nearly all the pore space has been eliminated (Fig. 5e). The deviatoric loading resulted in comminuted particles of a broad range of sizes (Fig. 5f), which collapsed into and filled up the pore space. Sec- ondly, anisotropy is evident in the shear-compacted samples (Fig. 5g), with stress-induced cracking prefer- entially developed sub-parallel to ol, the maximum compression direction. The spatial distribution of such damage is highly heterogeneous.
The T-series: shear localization with little dilatancy
The sample T1 was loaded to near the peak stress. Most of the cracking seems to be related to the widening
QUANTITATIVE MICROSTRUCTURAL DATA
Microcrack density
Under hydrostatic loading, significant increases in microcrack densities are observed in samples compacted to above the critical effective pressure P* (Fig. 7a and Table 2). Measurements ofll~ and 12 in two perpendicu- lar directions show that pressure-induced microcracking is relatively isotropic. In contrast, the non-hydrostatic stresses induce significant anisotropy. For the D-series samples, the critical value C* marks the stress level at which microcracking increases considerably. The data in Fig. 7(b) and Table 2 also show that the cracking evolved in an anisotropic pattern, with 12 > I1~. This reinforces our qualitative observation (Figs. 5d-g) that cataclastic flow involved stress-induced cracks which preferentially propagate in a direction sub-parallel to Ol. The values of Sv were calculated using equation (1) (Table 2). It should be noted that, although the triaxially compressed sample D3 was subjected to a mean effective stress which was 100 MPa lower than the effective pressure of the hydrostatically compacted sample H3, the crack
6 B. M E N I ~ N D E Z , W. Z H U and T.-F. W O N G
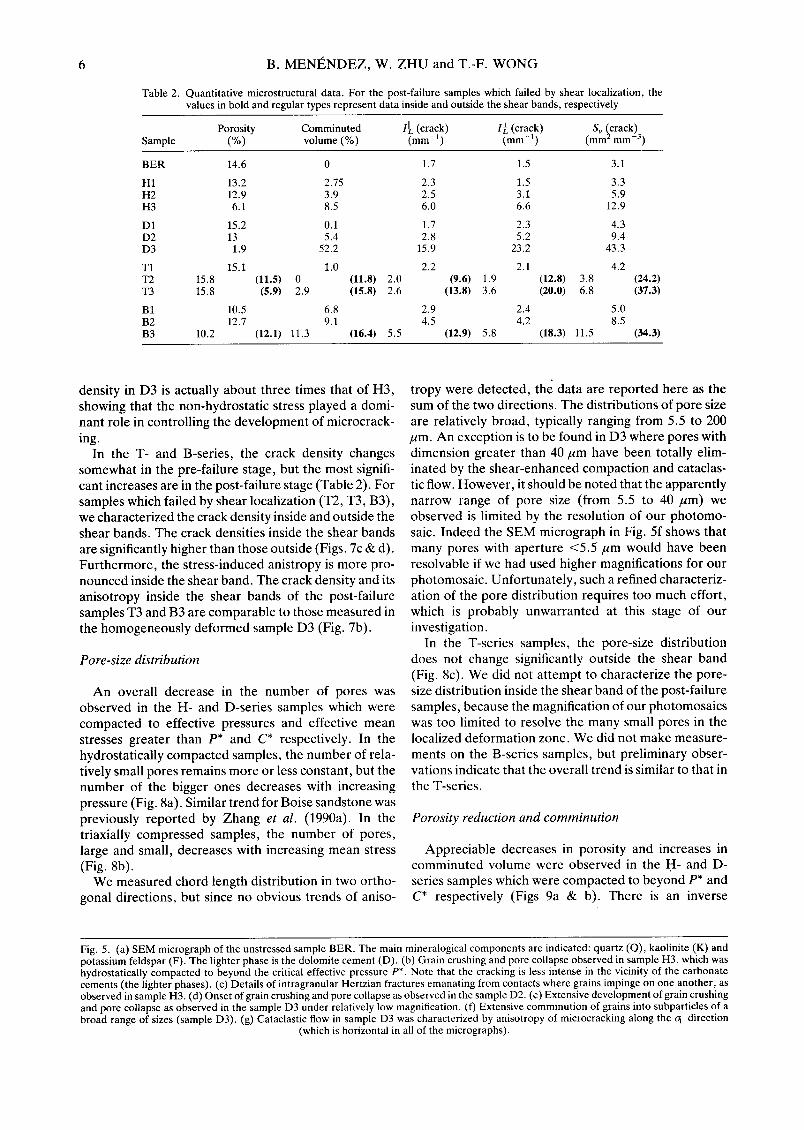
Table 2. Quantitative microstructural data. For the post-failure samples which failed by shear localization, the values in bold and regular types represent data inside and outside the shear bands, respectively
Porosity Comminuted ll~ (crack) I~ (crack) S v (crack) Sample (%) volume (%) (mm -1) (mm -1) (mm ~ mm -3)
BER H1 H2 H3 D1 D2 D3 T1 T2 T3 B1 B2 B3
15.8 15.8
10.2
14.6 0 1.7 1.5 3.1 13.2 2.75 2.3 1.5 3.3 12.9 3.9 2.5 3.1 5.9 6.1 8.5 6.0 6.6 12.9
15.2 0.1 1.7 2.3 4.3 13 5.4 2.8 5.2 9.4 1.9 52.2 15.9 23.2 43.3
15.1 1.0 2.2 2.1 4.2 (11.5) 0 (11.8) 2.0 (9.6) 1.9 (12.8) 3.8 (24.2) (5.9) 2.9 (15.8) 2.6 (13.8) 3.6 (20.0) 6.8 (37.3)
10.5 6.8 2.9 2.4 5.0 12.7 9.1 4.5 4.2 8.5
(12.1) 11.3 (16.4) 5.5 (12.9) 5.8 (18.3) 11.5 (34.3)
density in D3 is actually about three times that of H3, showing that the non-hydros ta t ic stress played a domi- nant role in controll ing the deve lopment of microcrack- ing.
In the T- and B-series, the crack density changes somewhat in the pre-failure stage, but the most signifi- cant increases are in the post-failure stage (Table 2). For samples which failed by shear localization (T2, T3, B3), we character ized the crack density inside and outside the shear bands. The crack densities inside the shear bands are significantly higher than those outside (Figs. 7c & d). Fur the rmore , the stress-induced anistropy is more pro- nounced inside the shear band. The crack density and its anisotropy inside the shear bands of the post-failure samples T3 and B3 are comparable to those measured in the homogeneous ly de fo rmed sample D3 (Fig. 7b).
Pore-size distribution
A n overall decrease in the number of pores was observed in the H- and D-series samples which were compac ted to effective pressures and effective mean stresses greater than P* and C* respectively. In the hydrostatically compac ted samples, the number of rela- tively small pores remains more or less constant , but the number of the bigger ones decreases with increasing pressure (Fig. 8a). Similar t rend for Boise sandstone was previously repor ted by Zhang et al. (1990a). In the triaxially compressed samples, the number of pores, large and small, decreases with increasing mean stress (Fig. 8b).
We measured chord length distribution in two or tho- gonal directions, but since no obvious trends of aniso-
t ropy were detected, the data are repor ted here as the sum of the two directions. The distributions of pore size are relatively broad , typically ranging f rom 5.5 to 200 /~m. A n exception is to be found in D3 where pores with dimension greater than 40/~m have been totally elim- ina ted by the shear -enhanced compac t ion and cataclas- tic flow. However , it should be noted that the apparent ly nar row range of pore size (from 5.5 to 40 /~m) we observed is limited by the resolution of our p h o t o m o - saic. Indeed the SEM micrograph in Fig. 5f shows that many pores with aper ture < 5 . 5 / ~ m would have been resolvable if we had used higher magnifications for our photomosaic . Unfor tunate ly , such a refined characteriz- ation of the pore distribution requires too much effort, which is probably unwar ran ted at this stage of our investigation.
In the T-series samples, the pore-size distribution does not change significantly outside the shear band (Fig. 8c). We did not a t tempt to characterize the pore- size distribution inside the shear band of the post-failure samples, because the magnification of our photomosaics was too limited to resolve the many small pores in the localized deformat ion zone. We did not make measure- ments on the B-series samples, but prel iminary obser- vations indicate that the overall t rend is similar to that in the T-series.
Porosity reduction and comminution
Appreciable decreases in porosi ty and increases in comminu ted volume were observed in the H- and D- series samples which were compac ted to beyond P* and C* respectively (Figs 9a & b). There is an inverse
Fig. 5. (a) SEM micrograph of the unstressed sample BER. The main mineralogical components are indicated: quartz (Q), kaolinite (K) and potassium feldspar (F). The lighter phase is the dolomite cement (D). (b) Grain crushing and pore collapse observed in sample H3, which was hydrostatically compacted to beyond the critical effective pressure P*. Note that the cracking is less intense in the vicinity of the carbonate cements (the lighter phases). (c) Details of intragranular Hertzian fractures emanating from contacts where grains impinge on one another, as observed in sample H3. (d) Onset of grain crushing and pore collapse as observed in the sample D2. (e) Extensive development of grain crushing and pore collapse as observed in the sample D3 under relatively low magnification. (f) Extensive comminution of grains into subparticles of a broad range of sizes (sample D3). (g) Cataclastic flow in sample D3 was characterized by anisotropy of microcracking along the q direction
(which is horizontal in all of the micrographs).

Micromechanics of brittle faulting and cataclastic flow
Fig. 5.
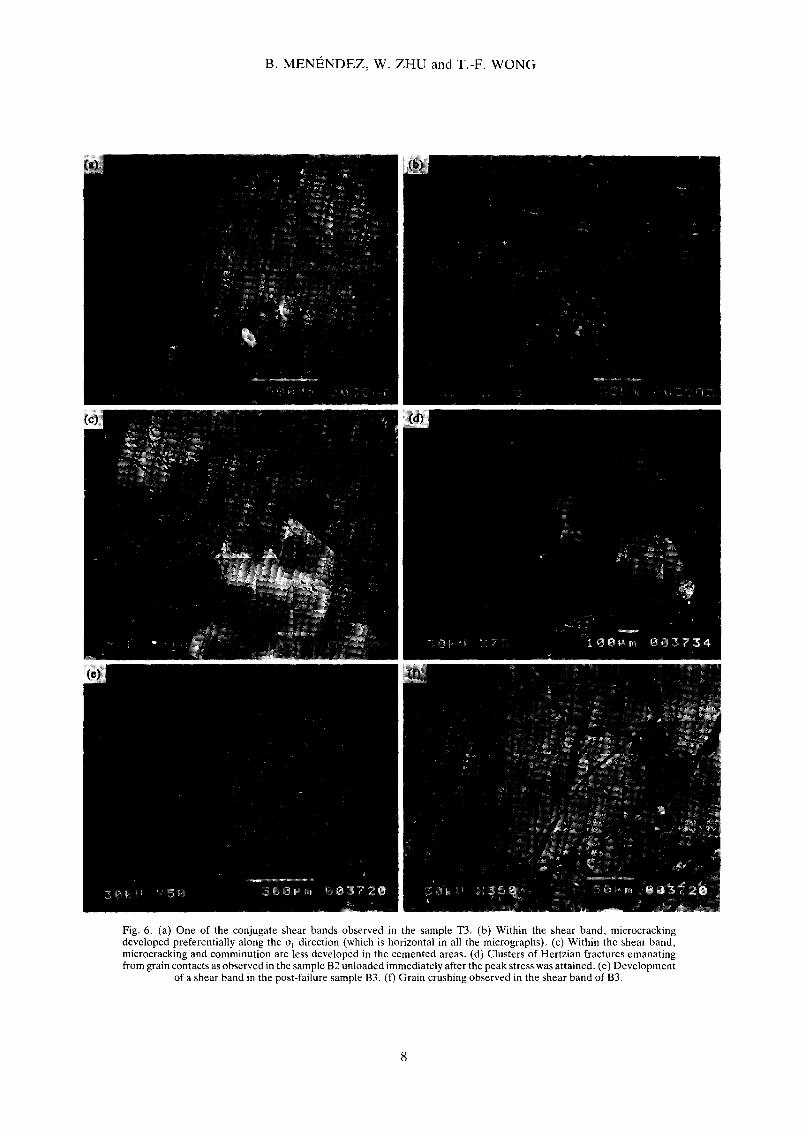
B. M E N I ~ N D E Z , W . Z H U a n d T . - F . W O N G
Fig. 6. (a) One of the conjugate shear bands observed in the sample T3. (b) Within the shear band, microcracking developed preferentially along the o 1 direction (which is horizontal in all the micrographs). (c) Within the shear band, microcracking and comminution are less developed in the cemented areas. (d) Clusters of Hertzian fractures emanating from grain contacts as observed in the sample B2 unloaded immediately after the peak stress was attained. (e) Development
of a shear band in the post-failure sample B3. (f) Grain crushing observed in the shear band of B3.

Micromechanics of brittle faulting and cataclastic flow 9
A
E E
.J
25
20
15
10
5
0
(a) H-series e~oO i ~
p*
1 0 o, 0 . . . . . . .
2 4 6 8 10 12
p o r o s i t y r e d u c t i o n (%)
25 (b)D-series ~ e 20
c- 0 10 [
. J
0 0 5 10 15 20 25 30
axial strain (%)
25
20
~ 1 5
---.10 - J
5
0
(c) T-series
o-£- Io"] inside shear
band 25
peak ~.. s~m E 15
1 - ,,~ 10
~ s
_, . . . . . . . . . o . o . . . . . O , 0 1 2 3 4
axial strain (%)
w
o
(d) B-series i ~ ~ r band
peak
. . . . . T o ; , . . 0 . 1 2 3
axial strain I%1
Fig. 7. Microcrack densities (I t and/t~) measured in directions perpendicular and parallel to the a 1 direction. (a) The data for BER and the H-series are plotted as functions of the porosity reduction. (b) The data for BER and the D-series are plotted as functions of the axial strain. (c) The data for BER and the T-series are plotted as functions of the axial strain. (d)
The data for BER and the B-series are plotted as functions of the axial strain.
correlation between porosity and comminuted volume (Table 2). The inferred porosity values shown in Fig. 9 are expected to be less than the actual porosities, due to the limited resolution in our photomosaics. The commi- nuted volume percentage in the triaxially compressed sample D3 is about five times that in the hydrostatically compacted sample H3, reinforcing our conclusion from qualitative observations (Figs. 5b-g) that the deviatoric stresses were very effective in compacting the samples. Possibly both the anisotropy of stress-induced micro- cracking and the comminution of grains to particles of different sizes were responsible for the considerable collapse of porosity during cataclastic flow.
In the brittle regime, little changes in porosity and comminuted volume were observed in the pre-failure samples (Figs. 9c & d). Inside the shear bands, decreases in porosity and increases in comminuted volume are evident, but these changes are comparatively smaller than those observed in the macroscopically ductile samples.
Mineralogical control over microcracking
We characterized the damage indices in sample H2 which was hydrostatically compacted to just beyond the critical pressure P* and in D2 which was shear com- pacted to just beyond the critical mean stress C*. These data are plotted as functions of three mineral phases (quartz, potassium feldspar and dolomite cement) and comparison is made with the unstressed sample BER (Fig. 10a). In the unstressed sample, the pre-existing microcracks are relatively short, primarily along intra- granular cleavages in the feldpar grains. The application of hydrostatic and non-hydrostatic stresses initiated
Hertzian fractures predominantly in the quartz grains, as reflected by an overall doubling of the damage index (Fig. 10b). Some Hertzian fractures also develop in the feldspars, while the carbonate cements remain relatively intact. Indeed our qualitative observations (Figs 5b & d) show that Hertzian fracture seems to be inhibited not only within the cement itself, but also in the surrounding cemented grains.
DISCUSSION
Micromechanics of brittle faulting
The development of dilatancy (Tapponier & Brace 1976, Kranz 1983) and micromechanics of faulting (Wong 1982, Wong & Biegel 1985, Moore & Lockner 1995) in low-porosity crystalline rocks have been exten- sively investigated. Our observations here for the brittle faulting processes in a porous siliciclastic rock are similar in many respects. Shear localization does not develop until the post-failure stage, after the peak stress has been attained. The post-failure deformation was stabilized by increasing pressure. The shear bands have a thickness covering several grains. Very high density of micro- cracking and pronounced stress-induced anisotropy is observed within the shear bands.
There is, however, an important difference between our observations and those on low-porosity crystalline rocks. Our SEM observations and microcrack density data on the samples which ultimately failed by brittle faulting (Figs. 7c & d) show that very little stress- induced intragranular cracking occurred before the peak stress was attained. Similar microstructural observations

10 B. MENt~NDEZ, W. Z H U and T.-F. W ONG
Number of (a) H - s e r i e s chords
60 0
Length ~ ','e-'- ~ H2 (pm) ~ H3 p*
(b) D-series Number of
0
20
.ength ~ o ~ r ~ D2 'C* (pm) ~ o D3
(c) T - s e r i e s Number of chords ~ 100
T2 Length (pm) ~ = T3 peak
stress
Fig. 8. Pore size distributions for the (a) H-series; (b) D-series; and (c) T-series samples.
on Gosford sandstone deformed in plane strain were reported by Ord et al. (1991). In contrast, Tapponier & Brace (1976)'s data for Westerly granite show a signifi- cant increase of I~ from 4.91 (in an unstressed sample) to 8.85 mm -1 (in a sample loaded to close the peak stress) and 11~ from 4.82 to 5.71 mm -1. Qualitative obser- vations in low-porosity marbles (Olsson & Peng 1976, Fredrich et al., 1989) and sandstones (Hoshino & Koide 1970, Dunn et al., 1973) also show extensive develop- ment of stress-induced cracking subparallel to al.
Motivated by the microstructural observations in low- porosity rocks, a number of micromechanical models (e.g. Horii & Nemat-Nasser 1986, Ashby & Hallam
1986, Kemeny & Cook 1987) have been developed in the past decade to analyse the micromechanics of faulting. Local stress concentrations induce the initiation of a large number of intragranular microcracks which propa- gate stably in directions sub-parallel to al. The density of such 'wing cracks' increases and hence the spacing among them decreases with increasing deviatoric stresses. After the peak stress has been attained, the cracks coalesce, resulting in strain softening and shear localization.
The absence of stress-induced intragranular cracking in our pre-failure Berea sandstone samples suggests that the 'wing crack' type of model is not applicable here. An important question has to be addressed: what micro- mechanical processes are responsible for the develop- ment of dilatancy and shear localization in high-porosity rocks? If the stress concentrations at grain contacts are not sufficient to initiate extensile cracking, what alterna- tive mechanism may operate to result in an overall increase in volume in the brittle field? This is a particu- larly intriguing question in light of recent acoustic emission (AE) studies (Zhang et al., 1990c, Lockner et al., 1992) which recorded very high AE activity in Berea sandstone accompanying dilatancy in the pre-failure stage. A possible explanation is that the AE events occur when the local shear stress concentration at a grain contact is sufficiently high to rupture the lithified grain boundaries. Frictional slip and grain rotation may occur once the grain contacts have lost their cohesion. Unlike intragranular cracking, such deformations are difficult to resolve even under the SEM. Possibly such shear slip instabilities may be elucidated by more refined studies of the focal mechanisms of the AE events.
On the basis of our microstructural observations, we suggest the following scenario for the development of brittle faulting in Berea sandstone (Fig. 11). With the onset of shear-induced dilation at the stress level corre- sponding to C', the local shear stress concentrations are sufficiently high to cause the grains to move relative to one another by rotation and slip. Such relative move- ments result in an overall increase in volume. The scenario is therefore analogous to the stress-dilatancy model postulated in granular materials (Rowe 1962), with the possible difference that the grain contacts in the lithified sandstone need to be ruptured first before the onset of particulate movement along the grains and dilatancy can occur. The rupture processes involve shear stress drops and AE activity, and the grain-scale cohe- sion is possibly related to the Mohr-Coulomb cohesive strength which has been observed to increase with de- creasing porosity in siliciclastic rocks (Vernik et al., 1993). In the close vicinity of the peak stress, Hertzian fractures develop in isolated clusters. It is through the coalescence of these clusters of Hertzian fractures that shear localization develops in the post-failure stage. Subsequently, the accumulation of slip at the shear band results in significant enhancement of tensile stress at grain contacts, which leads to the development of more Hertzian fractures and pervasive comminution within the shear band.

Micromechanics of brittle faulting and cataclastic flow
60 (a) H-series , Porosity ] (b) D-series [ ° o Porosity 0 Comminuted volume~ Comminuted volume
:! i +° +o +o F 0
40 P* 40 ~ C* 30 30 ~ ~
0 2 4 6 8 10 12 0 5 10 15 20 25 30 p o r o s i t y r e d u c t i o n (%) ax ia l s t r a i n (%)
I i
60 (e) T-series [ ° + Poro,~ / i + Poros.y Comminuted volume I 6 0 (d ) B -se r i es / o comm nuted vo ume
50 50 inside shear ~ 4 0 inside °'~ 40 peek ~ n d
~1 stress ~ peak shear band E_ E_3o . ,
20
I
0 1 2 3 4 0 1 2 3 ax ia l s t r a i n (%) ax ia l s t r a i n (%)
Fig. 9. Microstructural observations of the porosity reduction and comminuted volume. (a) The data for the H-series are plotted as functions of porosity reduction. For the stressed samples, the data of the (b) D-series; (c) T-series; and (d) B-
series are plotted as functions of the axial strain.
(a)
X
"O r "
,m
O)
E a
O • BER . . . . . . . . . . . . . . . . . . . .R. . . . . . . . . . . . o H 2
x D2
i i I
Quartz K Feldspar Dolomite
(b)
Z
2oo 'S°l A lOO1
o 1
::.. ......... H2 D2
3 4
Damage index
Fig. 10. (a) Mean damage index for different mineral types measured in the samples BER, H2 and D2. (b) Distribution of damage index in
quartz grains for the three samples.
Micromechanics of shear-enhanced compaction and cataclastic flow
Our observations show that the transition from brittle faulting to cataclastic flow occurs when the mean stress is so high that relative movement among the grains and shear localization are inhibited. Strain hardening is
promoted by grain crushing and pore collapse. The onset of such shear compaction processes can be identi- fied with the stress state (C*) at which Hertzian fracture can initiate from grain contacts (Figs. 5d-f, 8b and 9b). Under hydrostatic loading, there is a critical effective pressure P* for the onset of grain crushing which scales inversely with the porosity and grain size (Zhang et al., 1990b). However , the mean effective stress C* at the onset of shear-enhanced compaction is generally lower than the critical pressure P* for hydrostatic loading (Fig. 1). Fur thermore, the microcracking in the triaxiaily compressed samples is highly anisotropic (Fig. 5e) and the shear-enhanced compaction process is more effec- tive in eliminating the collapsible porosity by filling with comminuted particles of many sizes (Fig. 5e). Our recent data (Wong & David 1992) indicate that the stress state at the onset of shear-enhanced compaction also scales inversely with porosity and grain size. A more detailed analysis of the data will be presented in a future publication.
A synopsis of the micromechanics of shear-enhanced compaction and cataclastic flow in Berea sandstone is given in Fig. 11. It should be noted that there are important similarities and differences between the micromechanics documented here and that of low- porosity crystalline rocks. A common feature is the anisotropy of stress-induced microcracking, which has also been documented as well in low-porosity marble (Fredrich et al., 1989) and halite (Peach 1991) deformed in the cataclastic flow regime. There are, however, two fundamental differences with respect to porosity change and deformation mechanism. In low-porosity rocks, cataclastic flow generally involves positive dilatancy and the transition from shear localization to distributed

A.E.
re
lativ
e gra
in
mov
emen
t clu
sterin
g
stra
in
soft
enin
g
shea
r loc
aliza
tion
I H
ertzi
an
~.~
frac
ture
co
mpa
ctiv
e ca
tacla
stic f
low
Zig.
11.
Syn
opsis
of
the
key
mic
rom
echa
nica
l pr
oces
ses
invo
lved
in t
he d
evel
opm
ent
of (
i) sh
ear-
indu
ced
dila
tanc
y an
d sh
ear
loca
lizat
ion
in t
he b
rittl
e re
gim
e; a
nd
(ii) s
hear
-enh
ance
d co
mpa
ctio
n an
d ca
tacl
astic
flow
in th
e 'd
uctil
e' re
gim
e.
Z ,-n,
Z ,-n
N
N
= D
Z

Micromechanics of brittle faulting and cataclastic flow 13
cataclastic flow occurs when stress-induced cracking is arrested by crystal plasticity processes such as twinning and dislocation activity. Grain crushing and pore col- lapse processes are absent. The onset of such dilatant cataclastic flow can usually be identified with the stress state at which crystal plasticity processes operate to arrest stress-induced microcracking (Fredrich et al., 1989). Hirth & Tullis (1994) reported qualitatively simi- lar observations in quarto-feidspathic rocks deformed into the cataclastic flow regime under elevated tempera- tures.
Influence of cementation on the development of grain crushing and pore collapse
Our microstructural observations (Figs. 5b & d) and damage index measurements (Fig. 10) show that carbon- ate cements act to inhibit the development of micro- cracking emanating from grain contacts. Bernabe et al. (1992) also observed that cementation enhances the overall ductility in their model materials. Dvorkin et al. (1991) modelled the influence of cementation on elastic behaviour by considering the deformation of contacting spherical grains cushioned by a relatively compliant cement layer. Wong & Wu (1995) have adopted this conceptual model and used the finite element method to investigate the influence of cementation on the stress concentration and its influence on grain crushing.
The finite element calculation shows that if identical normal stresses are applied externally to a cemented and uncemented system, the tensile stress concentration in the cemented system is at least an order of magnitude smaller than that in the uncemented system. Conse- quently, the onset of microfracture emanating from grain contact is readily inhibited by cementation. The tensile stress concentration is not sensitive to the cement thickness, but it decreases rapidly with increasing cement width. Under triaxial loading, the cemented system will be loaded by normal and shear stresses. Shear loading on a Hertzian system can induce frictional sliding on the grain contact surface, which can signifi- cantly enhance the tensile stress concentration at the trailing end of the sliding contact region (Hamilton & Goodman 1966). Hence, triaxial loading promotes Hertzian fracture, and it may explain the occurrence of shear-enhanced compaction. In a cemented system sim- ultaneously under shear and normal loadings, the finite element calculations indicate that the influence of cementation is basically the same as in the purely normal loading case in that the tensile stress concentration near the triple junction is alleviated by the 'cushioning' effect of the relatively compliant cement. Hence, one expects cementation also to inhibit the development of grain crushing during cataclastic flow, in agreement with our microstructural observations (Figs. 5b & d and 6c) and damage index measurements (Fig. 10a). It has been suggested that, since the clay minerals are relatively compliant in certain orientations, they may play a simi- lar role as the carbonate cements in inhibiting damage development (Antonellini et al., 1994).
600
500
400
3 0 0
20O
100
C' omet of =heer- ~ induced dlleUan
p e a k =~===
• . C" o ~ at =hem'-
brittle faulting catacLastic flow
0 1 O0 200 300 400 500 600 (c~, + 2(~3 ) /3 - P, (MPa)
Fig. 12. Two different regimes of inelastic deformation and failure mapped out in the (effective mean and differential) stress space. The grey area marks stress states in which shear-induced dilation can occur and the samples ultimately fail by shear localization. The dotted line marks the yield envelope for the onset of shear-enhanced compaction C*, beyond which the sample fails by cataclastic flow. The critical effective pressure P* for onset of grain crushing is also marked. Stress
paths of samples in the H-, D-, T- and B-series are also indicated.
Transition from shear localization to cataclastic flow
From the mechanical data we obtained in a previous study (Wong et al., 1992) and the current work, the failure modes of Berea sandstone can be categorized in the stress space as shown in Fig. 12. The coordinate axes correspond to the effective mean stress (al + 203)/3 - Pp and the differential stress ol - 03 respectively. Under triaxial compression, the sample is first loaded hydro- statically along the horizontal axis, after which the axial load is applied. The application of axial stress simul- taneously increases the effective mean stress and differ- ential stress along a stress path with a slope of three. Our mechanical data map out the brittle faulting regime indicated by the grey region in Fig. 12. The lower boundary marks the stress state C' at the onset of shear- induced dilation, and the upper boundary marks the peak differential stress attained by samples which failed by shear localization, sometimes referred to as the 'Mohr-Coulomb failure envelope'. Hence, the grey re- gion maps out the only stress states in which a sample can dilate.
The region outside the grey area represents the com- pactive regime. At relatively high effective stresses, the stress state may cross the dotted boundary correspond- ing to C*, the critical stresses for the onset of shear- enhanced compaction. The sample strain hardens and, as the deviatoric stresses are increased further, the macroscopically ductile deformation is taken up by com- pactive cataclastic flow, without the development of shear localization. The C* boundary has an approxi- mately elliptical shape and it crosses the horizontal axis at P*, the critical effective pressure for the onset of grain crushing.
The loading paths for our samples are shown in Fig. 12. The D-series samples are representative of the development of compactive cataclastic flow and B-series

14 B. MENI~NDEZ, W. ZHU and T.-F. WONG
samples are representative of the development of shear localization with positive dilatancy. The T-series samples are representative of the transitional regime with development of shear localization in conjugate bands and relatively little shear-induced dilation.
We characterized the microcrack density in all three series of samples, and a somewhat surprising feature of the data is that the crack density and its anisotropy are comparable in samples deformed into the cataclastic regime (Fig. 7b) and within the shear bands in the post- failure samples in the brittle regime (Figs. 7c & d). The micromechanical processes are also very similar in that Hertzian fracture, comminution and pore collapse (Figs. 5 and 6) play a predominant role to compact the macro- scopically ductile sample and the localized shear bands. The similarity in the deformation-induced microstruc- tures has previously resulted in some conflicting in- terpretation of the role of Hertizan fracture and grain crushing in promoting or inhibiting dilatancy and shear localization (Dunn et al., 1973, Gallagher et al., 1974, Bernabe & Brace 1990), since most of the previous studies only considered the microstructures in samples after they had been deformed to high strain, rendering it difficult to interpret the progressive evolution of porosity change, damage and shear localization with strain.
Our study highlights some fundamental differences in the role of grain crushing in the overall failure processes. In the cataclastic flow regime, the high mean stress in conjuction with the deviatoric stresses readily induce the onset of Hertzian fracture at grain contacts. In a high- porosity siliciclastic rock, the grain crushing process leads to the collapse of porosity and the shear-enhanced compaction leads to strain hardening and inhibits the development of shear localization. In the brittle faulting regime, little stress-induced microcracking occurs be- fore the peak stress is attained. Under the relatively low normal stresses, the lithified contacts are easily ruptured by the shear stresses and relative movement of the grains results in dilation, which ultimately leads to shear local- ization. It is only in the close vicinity of the peak stress that Hertzian fracture and comminution occur in paral- lel with the onset of shear localization. Hence, obser- vation of pervasive grain crushing process in the shear bands does not necessarily imply that it is responsible for the development of shear-induced dilation. That shear localization develops in the post-failure stage is in agree- ment with theoretical analysis for axisymmetric loading (Rudnicki & Rice 1975).
A relevant question which has not been addressed before is whether the relative low stresses applied in the brittle regime (Fig. 12) would be sufficient to induce grain crushing. It is possible that a relatively high mean stress develops within the shear band, since recent theoretical analyses (e.g. Casey 1980, Rice 1992) have demonstrated that the stress state within a localized shear band can be significantly different from that re- motely applied to the host rock. Recent experimental results on the shear of simulated gouge layer have shown intensive comminution in porous quartz gouge (e.g. Marone & Scholz 1989), which acts to inhibit the second-
ary development of Riedel shear localization within the shear zone (Gu & Wong 1994).
The deformation mechanism map shown in Fig. 12 is very useful in elucidating the important role of loading path in controlling the failure mode of a porous rock. It should be emphasized that in typical tectonic settings, the pore pressure as well as the overburden and tectonic stresses can vary significantly. Indeed, Byrne et al. (1993) recently argued that a curved loading path cutting through C' and C* might have been experienced by different packages of sediments in accretionary wedges. The fluid flow processes in sandstone formations can therefore result in rather complicated stress paths and, in accordance with Fig. 12, a broad spectrum of defor- mation mechanism and failure modes, as has been documented by field observations (Aydin 1978, Pittman 1981, Jamison & Stearns 1982, Underhill & Woodcock 1987, Antonellini et al., 1994).
In a recent study, Antonellini et al. (1994) differen- tiated between deformation bands without and with cataclasis. They inferred that the former developed under relatively low pressures and they documented microstructures very similar to what we observed in the faulted sample of our B-series (Fig. 6e). Outside the deformation band, the host rock is relatively unde- formed and, within the localized zone, microcracking initiated from contacts where grains had impinged on one another. The width of the band extends over several grains, comparable with what we observed in laboratory samples. Microcrack density as a function of distance from the fault surface was measured by Anders & Wiltschko (1994). Their data for the Navajo and Entrada sandstones (of porosities 24 and 25%) in Arches National Park range show an approximately exponential decay from a maximum of - 9 mm -1 (near the fault surface) to a minimum of - 1 mm -1 (at remote distances). The maximum to minimum ratio is compar- able to the ratios between I L values within the shear band and those outside (Fig. 7d). The magnitudes of our crack density data are higher than the field values, possibly because the Navajo and Entrada sandstones have somewhat high porosities and our measurements on Berea sandstone were obtained at a higher magnifi- cation.
CONCLUSIONS
On the basis of our microstructual observations, we reach the following conclusions on the damage evolution and micromechanics of brittle fracture and cataclastic flow in Berea sandstone:
(1) Under hydrostatic loading, a surge in microcrack- ing and pore collapse occurs when the effective pressure reaches the critical value P*. The accelerated accumu- lation of damage is manifested by significant increases in the crack density and comminuted volume as well as decreases in the mean pore size. Under triaxial compres- sion, the damage in the cataclastic flow regime increases
M i c r o m e c h a n i c s o f b r i t t l e f au l t i ng a n d ca tac las t i c f low 15
s ign i f ican t ly w h e n the m e a n s t ress r e a c h e s t h e cr i t ical v a l u e C*. N o n - h y d r o s t a t i c l o a d i n g has a h i g h e r c o m p a c - t ive e f f i c i ency a n d the s t r e s s - i n d u c e d m i c r o c r a c k i n g s h o w s s igni f icant a n i s o t r o p y .
(2) H e r t z i a n f r a c t u r e is a p r i m a r y cause fo r t he o n s e t o f h y d r o s t a t i c a n d s h e a r - e n h a n c e d c o m p a c t i o n . H i g h in t ens i t y o f g ra in c r u s h i n g a n d p o r e co l l apse is associ- a t e d w i t h w e a k l y c e m e n t e d r eg ions . F i n i t e e l e m e n t s i m u l a t i o n s s h o w tha t t he p r e s e n c e o f c e m e n t at g ra in c o n t a c t s a l l ev i a t e s t he t ens i l e s t ress c o n c e n t r a t i o n , thus i nh ib i t i ng t h e o n s e t o f H e r t z i a n f r a c t u r e and gra in c rush- ing.
(3) In t h e b r i t t l e r e g i m e , s h e a r l o c a l i z a t i o n d o e s n o t d e v e l o p unt i l t h e p o s t - f a i l u r e s t age a f t e r t he p e a k s t ress has b e e n a t t a i n e d . O u r m i c r o c r a c k dens i t y d a t a s h o w tha t v e r y l i t t le i n t r a g r a n u l a r c r a c k i n g o c c u r r e d b e f o r e t he p e a k s t ress was a t t a i n e d . W e in fe r t ha t d i l a t a n c y and acous t i c e m i s s i o n ac t iv i ty in t he p r e - f a i l u r e s tage a re p r i m a r i l y d u e to i n t e r g r a n u l a r c r a c k i n g , p r o b a b l y re- l a t ed to t h e s h e a r r u p t u r e o f i i th i f ied a n d c e m e n t e d g ra in con tac t s . I s o l a t e d c lus te r s o f H e r t z i a n f r a c t u r e s in i t i a te f r o m gra in c o n t a c t s w h e n the s a m p l e is l o a d e d to v e r y n e a r t he p e a k s t ress . C o a l e s c e n c e o f t h e s e c lus te r s o f H e r t z i a n f r a c t u r e s resu l t s in s h e a r l oca l i za t ion . T h e v e r y h igh d e n s i t y o f i n t r a g r a n u l a r m i c r o c r a c k i n g and p ro - n o u n c e d s t r e s s - i n d u c e d a n i s o t r o p y in t h e p o s t - f a i l u r e s a m p l e s a r e p r i m a r i l y t he c o n s e q u e n c e o f s h e a r loca l iz - a t ion .
(4) M i c r o c r a c k dens i t y a n d its a n i s o t r o p y wi th in t he s h e a r b a n d s o f s a m p l e s in t he b r i t t l e r e g i m e a re c o m p a r - ab le wi th t h o s e in h o m o g e n e o u s l y d e f o r m e d s a m p l e s in t h e ca t ac l a s t i c f low r e g i m e . Th i s imp l i e s tha t t he slip d i s c o n t i n u i t y at a s h e a r b a n d m a y resu l t in a h igh ly c o m p a c t i v e s t ress field wi th in the band . O u r c rack d e n - si ty m e a s u r e m e n t s in l a b o r a t o r y d e f o r m e d s a m p l e s are a lso c o m p a r a b l e wi th r e c e n t f ie ld m e a s u r e m e n t s f r o m s a n d s t o n e fau l t zones .
Acknowledgements--We are grateful to Lisa Dell'Angelo and Gunter Siddiqi for ion-milling our crack sections. Greg Rudomcn and Grey Symmes were very helpful with the SEM and microprobe respectively. We have benefited from discussions with Marco Antoncllini, Yves Bernabc, Christian David, Joanne Fredrich and Dave Lockner, as well as comments by the editor Jim Evans and two anonymous reviewers. The first author was supported by a post-doctoral fellowship from the FICYT, Asturias, Spain, during her stay at Stony Brook. This research was partially supported by' the Office of Basic Energy Scienccs, Department of Energy, under grant DEFG0294ER14455 and NATO under grant CRG-910927.
REFERENCES
Anders, M. H. & Wiltschko, D. V. 1994. Microfracturing, paleostress and the growth of faults. J. Struct. Geol. 16,795-815.
Antonellini, M. & Aydin, A. 1994. Effect of faulting on fluid flow in porous sandstones: petrophysical properties. Am. Ass. Petrol. Geol. Bull. 78,355-377.
Antonellini, M., Aydin, A. & Pollard, D. D. 1994. Microstructure of deformation bands in porous sandstones at Arches National Park, Utah. J. Struc. Geol. 16, 941-959.
Ashby, M. F. & Hallam, S. D. 1986. The failure of brittle solids containing small cracks under compressive stress states. Acta metall. 34,497-510.
Aydin, A. 1978. Small faults formed as deformation bands in sand- stones. Pageoph. 116, 913-930.
Aydin, A. & Johnson, A. M. 1978. Development of faults as zones of deformation bands and as slip surfaces in sandstone. PAGEOPH. 116, 931-942.
Bernabe, Y. & Brace W. F. 1990. Deformation and fracture of Berea sandstone. Am. geophys. Un. geophys. Monogr. 56, 91-101.
Bernabe, Y., Bryer, D. T. & Hayes, J. A. 1992. The effect of cement on the strength of granular rocks. Geophys. Res. Let. 19, 1511-1514.
Brace, W. F. 1978. Volume change during fracture and frictional sliding: a review. PAGEOPH. 116, 603~14.
Brace, W. F., Silver, E., Hadley, K. & Goetze, C. 1972. Cracks and Pores: a closer look. Sciences 178, 162-164.
Byrne, T., Bruckmann, W., Owens, W., Lallemant, S. & Maltman, A. 1993. Structural synthesis: correlation of structural fabrics, velocity anisotropy, and magnetic susceptibility data. In: Proceed- ings of the Ocean Drilling Program, Scientific Results (edited by Hill, !. A., Taria, A., Firth, J. V. etal.) 131,365-378.
Casey, M. 1980. Mechanics of shear zones in isotropic dilatant materials. J. Struct. Geol. 2, 143-147.
Curran, J. H. & Carroll, M. M. 1979. Shear stress enhancement of void compaction. J. geophys. Res. 84, 1105-1112.
Dunn, D. E., LaFountain, L. J. & Jackson, R. E. 1973. Porosity dependence and mechanism of brittle fracture in sandstones. J. geophys. Res. 78, 2403-2417.
Dvorkin, J., Mavko, G. & Nut, A. 1991. The effect of cementation on the elastic properties of granular materials. Mech. Mat. 12, 2(/7-217.
Edmond, J. M. & Paterson, M. S. 1972. Volume change during the deformation of rocks at high pressure. Int. J. Rock Mech. & Mining Sci. 9, 161-182.
Fredrich, J. T., Evans, B. & Wong, T.-F. 1989. Micromcchanics of the brittle to plastic transition in Carrara marble. J. geophys. Res. 94, 4129--4145.
Gallagher, J. J., Friedman, M., Handin, J. & Sowers, G. 1974. Experimental studies relating to microfracture in sandstone. Tec- tonophysics 21,203-247.
Gowd, T. N. & Rummel, F. 1980. Effect of confining pressure on the fracture behavior of a porous rock. Int. J. Rock Mech. & Mining Sci. 17,225-229.
Gu, Y. & Wong, T.-F. 1994. Development of shear localization in simulated quartz gouge: effect of cumulative slip and gouge particle size. Pure & Appl. Geophys. 143,387-423.
Hamilton, G. M. & Goodman, L. E. 1966. The stress field created by a circular sliding contact. J. appl. Mech. 33, 371-376.
Handin, J., Hagcr, R. V., Friedman, M. &Feathcr, J. N. 1963. Experimental deformation of sedimentary rock under confining pressure: pore pressure effects. Bull. Am. Ass. Petrol. Geol. 47, 717-755.
Hippler, S. J. 1993. Deformation microstructures and diagcnesis in sandstone adjacent to an extensional fault: implications for the flow and entrapment of hydrocarbons. Am. Ass. Petrol. Geol. Bull. 77, 625~537.
Hirth, G. & Tullis, J. 1989. The effects of pressure and porosity on the micromechanics of the brittle-ductile transition. J. geophys. Res. 94, 17825-17838.
Horii, H. & Nemat-Nasser, S. 1986. Brittle failure in compression: splitting, faulting and brittle-ductile transition. Phil. Trans. R. Soc. Lond. 319,337-374.
Hoshino, K. & Koide, H. 1970. Process of deformation of the sedimentary rocks. Proc. Congr. Int. Soc. Rock Mech. 2(1), 353- 359.
Jamison, W. R. & Stearns, D. W. 1982. Tcctonic deformation of Wingate sandstone, Colorado National Monument. Am. Ass. Petrol. Geol. Bull. 66, 2584-2608.
Jamison, W. R. & Teufel, L. W. 1979. Pore volume changes associated with failure and frictional sliding of a porous sandstone. Proc. U.S. Syrup. Rock Mech. 20, 163-170.
Kemeny, J. M. & Cook, N. G. W. 1987. Crack models for the failure of rock under compression. Proc. 2nd Int. Conf. Const. Laws Engng. Mat. 2,879-887.
Kranz, R. L. 1983. Microcracks in rocks: a review. Tectonophysics 100,449-480.
Lockner, D. A., Byerlee, J. D., Kuksenko, V., Ponomarev, A. & Sidorin, A. 1992. Observations of quasistatic fault growth from acoustic emissions. In: Fault Mechanics and Transport Properties of Rocks (edited by Evans, B. & Wong, T.-F.). Academic Press, San Diego, 1-31.
Marone, C. & Scholz, C. H. 1989. Particle-size distribution and microstructures within simulated fault gouge. J. Struct. Geol. 11, 799-914.
Moore, D. E. & Lockner, D. A. 1995. The role of microcracking in shear-fracture propagation in granite. J. Struct. Geol. 17, 95-114.
16 B . M E N I ~ N D E Z , W . Z H U a n d T . - F . W O N G
Olsson, W. A. & Peng, S. S. 1976. Microcrack nucleation in marble. Int. J. Rock Mech. & Mining Sci. 13, 53-59.
Ord, A., Vardoulakis, A. & Kajewski, R. 1991. Shear band formation in Gosford sandstone. Int. J. Rock Mech. & Mining Sci. & Geo- mech. Abstr. 28, 397--409.
Peach, C. J. 1991. Influence o f Deformation on the Fluid Transport Properties o f Salt Rocks. Ph.D. Thesis, Rijksuniversiteit Utrecht, Netherlands.
Pittman, E. D. 1981. Effect of fault-related granulation on porosity and permeability of quartz sandstones, Simpson Group (Ordovi- cian), Oklahoma. Am. Ass. Petrol. Geol. Bull. 65, 2381-2387.
Rice, J. R. 1992. Fault stress states, pore pressure distributions, and the weakness of the San Andreas Fault. In: Fault Mechanics and Transport Properties o f Rocks (edited by Evans, B. & Wong, T.-F.). Academic Press, San Diego 475-503.
Richter, D. & Simmons, G. 1977. Microcracks in crustal igneous rocks: microscopy. In: The Earth's Crust: its Nature and Physical Properties. AGU, Washington, D. C., 149-180.
Rowe, P. W. 1962. The stress-dilitancy relation for static equilibrium of an assembly of particles in contact. Proc. R. Soc. 269A, 500- 527.
Rudnicki, J. W. & Rice, J. R. 1975. Conditions for the localization of deformation in pressure sensitive dilatant materials. J. Mech. Phys. Solids 23,371-394.
Rutter, E. H. & Hadizadeh, J. 1991. On the influence of porosity on the low-temperature brittle--ductile transition in siliciclastic rocks. J. Struct. Geol. 13,609--614.
Scott, T. E. & Nielsen, K. C. 1991. The effect of porosity on the brittle--ductile transition in sandstones. J. geophys. Res. 96, 405- 414.
Tapponier, P. & Brace, W. F. 1976. Development of stress-induced microcracks in Westerley granite. Int. J. Rock Mech. & Mining Sci. & Geomech. Abstr. 13, 103-112.
Underhill, J. R. & Woodcock, N. H. 1987. Faulting mechanisms in high-porosity sandstones: New Red sandstone, Arran, Scotland. In: Deformation o f Sediments and Sedimentary Rocks (edited by Jones, M. E. & Preston, R. M. F.). Geol. Soc. Lond. Spec. Publ. 29, 91- 105.
Underwood, E. E. 1970. Quantitative Stereology. Addison Wesley, Reading.
Vernik, L., Bruno, M. & Bovberg, C. 1993. Empirical relations between compressive strength and porosity of siliciclastic rocks. Int. J. Rock Mech. & Mining Sci. 30,677-680.
Wong, T.-F. 1982. Micromechanics of faulting in Westerly granite. Int. J. Rock Mech. & Mining Sci. & Geomech. Abstr. 19, 49--64.
Wong, T.-F. 1985. Geometic probability approach to the characteriz- ation and analysis of microcracking in rocks. Mech. Mat. 4,261-276.
Wong, T.-F. 1990. Mechanical compaction and the brittle-ductile transition in porous sandstones, In: Deformation Mechanisms, Rheology and Tectonics (edited by Knipe, R. J. & Rutter, E. H.). Geol. Soc. Spec. Publ. 54,111-122.
Wong, T.-F. & Biegel, R. 1985. Effects of pressure on the microme- chanics of faulting in San Marcos gabbro. J. Struc. Geol. 7,737-749.
Wong, T.-F. & David, C. 1992. Grain crushing and pore collapse as controlling mechanisms for the brittle-ductile transition. EOS Trans. Am. geophys. Un. 73,515.
Wong, T.-F., Szeto, H. & Zhang, J. 1992. Effect of loading path and porosity on the failure mode of porous rocks. In: Micromechanical Modeling o f Quasi-Brittle Material Behavior (edited by Li, V. C.). Am. Soc. Mech. Engng. 45,281-293.
Wong, T.-F. & Wu, L. 1995. Tensile stress concentration and com- pressive failure in cemented granular material. Geophys. Res. Lett. 22, 1649-1652.
Zhang, J., Wong, T.-F. & Davis, D. M. 1990a. High pressure embrittlement and shear-enhanced compaction in Berea sandstone: acoustic emission measurement and microstructural observation, In: Rock Mechanics Contributions and Challenges, Proc. 31st U.S. Syrup Rock Mech. (edited by Hustrulid, W. A. & Johnson, G. A.). A. A. Balkema Rotterham, 653-660.
Zhang, J., Wong, T.-F. & Davis, D. M. 1990b. Micromechanics of pressure-induced grain crushing in porous rocks. J. geophys. Res. 95,341-352.
Zhang, J., Wong, T.-F., Yanagidani, T. & Davis, D. M. 1990c. Pressure-induced microcracking and grain crushing in Berea and Boise sandstones: acoustic emission and quantitative microscopy measurements. Mech. Mat. 9, 1-15.