Berea College Fact Book 2010-2011
132
Berea College Fact Book 2010-2011
-
Upload
khangminh22 -
Category
Documents
-
view
2 -
download
0
Transcript of Berea College Fact Book 2010-2011

Berea College
Fact Book 2010-2011

FACT BOOK INTRODUCTION To Our Readers: We are pleased to present this year’s Berea College Fact Book. Its purpose is to provide current and accurate information pertaining to the College, its students, faculty, programs, facilities, and activities. Most of the information included in the Fact Book is provided by various College offices. The assistance and cooperation we receive from individuals in these offices is very much appreciated. We have included the following new information this year:
New Transfer Students: Applied, Accepted, and Enrolled (All and by Gender) New Transfer Student Enrollment Trends (by Gender and Territory) Fall 2010 Enrollment of Degree-Seeking Students by Ethnic and Racial Breakdowns First-to-Second Year Retention, Six-Year Graduation Rate, and Academic Qualifications at
Entry for Fall Term First-Year Students Teacher Preparation: Number of Students Certified in Education
We hope that you find this year's Fact Book both informative and useful. Please let us know how we can improve it. For more details and other reports, please visit our website at www.berea.edu/ira. Judith Weckman, Director of the Office of Institutional Research and Assessment Clara Labus Chapman, Assistant Director (Labor Team Supervisor) Cheyenne Shupe, Student Coordinator of the Fact Book Berea College Office of Institutional Research and Assessment CPO 2177 Berea, Kentucky 40404 (859) 985-3790

THE BEREA VISION
From its inception, Berea College has been a place where deep commitments have been translated into compassionate action in the service of young women and men, black and white, from many cultures, primarily from the Appalachian region but also far beyond. Berea’s distinctive and multifaceted mission has always been and will remain firmly rooted in inclusive Christian values such as “the triumph of love over hate, human dignity and equality, and peace with justice.”1 Hence, Berea was the first interracial and coeducational college in the pre-Civil War South. Berea’s primary mission is to serve students of “great promise and limited economic means” by providing them with liberal arts and professional educations of the highest quality. Thus, all students receive a substantial cost-of-education scholarship so that no money from student families is required for tuition. Our educational community is predicated on the notion that work of all kinds, mental and physical, provides opportunities for furthering a student’s education and personal development. Therefore, all students work in a campus-based labor department. Just as one of our institutional goals is to serve others, so too we seek to prepare our students to be “service-oriented leaders for Appalachia and beyond” (Being and Becoming: Berea College in the 21st Century, 2006, p. 62). Truly, learning, labor, and service are the three pillars upon which Berea’s educational edifice is built.
Berea’s Beginnings
In 1855, John G. Fee, the founder of Berea College, and those who assisted him—including Matilda Fee, John A. R. Rogers, Elizabeth Rogers, and others—boldly began to translate their abolitionist principles into a church and then a school perched on a ridge between the Bluegrass farms and the Cumberland Mountains. Cassius M. Clay gave Fee ten acres of land on which Fee began the Berea settlement. Fee named the site “Berea” after the Greek town that Paul described as a place where people “received the Word with all eagerness” (Acts 17:11). Berea’s one-room district school founded in 1855 has evolved into the Berea College we know today, their small congregation’s worship center into the stately Union Church, and their settlement village into the town of Berea, Kentucky, which is still vital and growing.
The foundational motto of Berea’s 1866 catalog and today’s Berea College is that “God has made of one blood all peoples of the earth” (Acts 17:26). Fee believed deeply that all people are equally worthy of education, of personal esteem, of mutual respect, and of diverse collaborations. He held that, whether black or white, male or female, Southern or Northern, rich or poor, all of us are God’s children and, as such, are deserving of an education that will make our lives more suitable for service. From the beginning, learning, labor, and service have been the underpinning of a Berea education, whether it be on the elementary, the secondary, or the college level.2
In the early days, those who taught Berea students in the classroom were the same people who supervised their labor and encouraged them to engage in acts of service both locally and in the mountains. Thus learning, labor, and service were originally well integrated at the College. During this period, the image of educating “the head, the heart, and the hands” captured well what it meant to be an educator at Berea.3 However, over the years learning, labor, and service slowly became segmented into different parts of an increasingly complex institution. Although Berea has always encouraged intellectual excellence, it has never narrowed its focus to developing intellectual excellence in liberal arts subjects alone. Therefore, Berea College has taught applied subjects (e.g., education, nursing, and agriculture) throughout all of its history. Berea has striven to educate “the whole person” by encouraging in each student the self-sufficiency found in working with his or her hands and the strong sense that his or her vocation ought to entail service to others. The authors of the 1993 preface to the Great Commitments effectively captured this sense that the realms of thought and action should converge here in Berea when it says, “the Berea experience nurtures intellectual, physical, aesthetic, emotional, and spiritual potentials and with those the power to make meaningful commitments and translate them into action.” In this and many other respects, Berea College and we Bereans have often fallen short of achieving our ideals—but we have never lost our collective determination to pursue them to the very best of our abilities.
1 See preface to the Great Commitments. 2 Berea was a sixteen-year school until 1968, when it discontinued its elementary and secondary education programs. 3 British writer and art critic John Ruskin apparently originated this image and phrase; Berea’s third president, William G. Frost (1892-1920), was the first to apply it when describing Berea’s mission.

The Berea Vision, continued
Learning, Labor, and Service at Berea College
William G. Frost, who became President of the College in 1892, brought craftsmen and women from the mountains to Berea and introduced a variety of new labor positions that provided apprenticeships in crafts. During Frost’s presidency, the labor program began to take on a separate life of its own as Berea tried to employ all of its students in some kind of meaningful labor. Gradually, a distinct labor program developed with its own learning goals for different student jobs. In 1908, Professor Miles E. Marsh began to oversee Berea’s ever more numerous labor positions, and in 1914, he was officially appointed Dean of the Labor Program. By this time, Berea’s students were no longer necessarily mentored in their labor positions by the same people who mentored them in the classroom. Although Berea College has always tried to educate the whole person, as time passed, the academic program (“the head”), the labor program (“the hands”), and the service and spiritual development programs (“the heart”) simultaneously burgeoned and became distinctly separate institutional entities. Today, most labor supervisors have little direct contact with the classroom (except for those members of the College Faculty who supervise students). The spiritual and service dimensions have also been segmented into the Campus Christian Center, the Center for Excellence in Learning Through Service (CELTS), and a variety of other programs. Thus, over the years, learning, labor, and service have become fairly compartmentalized and sometimes isolated aspects of Berea College and of “the Berea experience” for many students and employees. A primary aim of the College’s strategic plan, Being and Becoming: Berea College in the 21st Century (1996), has been to reintegrate these fundamental aspects of our institution and our experience.
Today Berea College depends on College Faculty to provide most of the formal instruction in the classroom, on other employees throughout the institution to provide learning opportunities for students in the labor program, and on yet other employees to guide the spiritual development of students and oversee the service and outreach components of the institution. This realization led the students, faculty, and staff on the Strategic Planning Committee to develop, in consultation with the broader campus community, four pairs of learning goals for all students and workers at the College. These are set forth in Being and Becoming as follows:
1. develop the critical intellectual ability to address complex problems from multiple perspectives and nurture moral growth with a commitment to service;
2. understand the relationship between humans and the natural world and consider both the
benefits and limitations of science and technology; 3. explore our individual roots and our shared American culture and know and respect
cultures from around the world; 4. educate students, faculty, and staff to be creative, independent thinkers and encourage
collaboration and teamwork in learning and working (Being and Becoming, p. ii; see pp. 30-34 for a detailed discussion of each learning goal).
These four sets of learning goals represent an application of the Great commitments within the context of our contemporary world. They are intended to guide the learning and work of all members of the campus community as well as to guide and unify all of the activities of the College, whether academic, extra-curricular, residential, labor, or athletic. The learning goals, then, should be understood as that toward which we all may teach, and work, and learn, whether we are faculty members, groundskeepers, or student members of the residence hall staff.

The Berea Vision, continued
However, the reintegration of the learning, labor, and service dimensions of the College has required more than simply sharing four pairs of learning goals. For several years, all Berea faculty, staff, and students engaged in conversations about how we could more closely link our learning, labor, and service efforts so that students will be treated everywhere as whole persons—not as heads in the classroom, hands in the labor program, and hearts in the service and worship programs of the College. If we are to reintegrate fully the learning, labor, and service components of “the Berea experience,” each one of us at the College must reconceive and reintegrate our own work. Many Bereans from all constituencies of the College are now doing so.
1) Integrating Learning
Increasingly, learning at Berea College involves not only the head, but also the heart and often the hands, even in the formal academic setting of the classroom. By providing students with both theoretical knowledge and opportunities to apply the knowledge they gain, by encouraging students to work on applied projects outside the classroom, and by relating classroom activities to the service and labor activities in which students are engaged, more and more Berea faculty members are bringing those other aspects of students’ lives into the reflective environment of the classroom. As a colleague recently observed, “Learning in this context means that the faculty is sensitive to students’ labor and other activities and encourages their integration in the minds of the students themselves.” While the classroom does and must remain the primary domain of instruction in the traditional disciplines, ideally it is also open to students’ struggles with their faith, their personal development, and their searches for new ways of viewing their vocation or work in the future. Such a learning environment treats students as whole persons, not just as heads.
2) Integrating Labor
Many labor program supervisors are striving to fulfill the four pairs of learning goals listed above with the students whom they supervise. These supervisors are thereby allied in purpose and practice with faculty members who pursue the College-wide learning goals, in addition to their discipline- and course-specific goals, in the classroom. For example, the concept of “guided learning,” which informs the work of employees and students in the residential life area, is based on several of our learning goals and Great Commitments. Also, while the labor program has traditionally challenged students’ hands through various forms of physical labor, the labor program is working to challenge and develop students’ heads and hearts as well by providing ever more intellectually and spiritually rich learning and service opportunities. This is quite different from the primarily physical labor model of Berea’s original labor program. In the spring of 2001, the Labor Review Team (LRT) provided a report that called for the “Re-visioning,” “Re-vitalizing,” and “Re-structuring” of Berea College’s Labor Program. In the fall of 2003, the Strategic Planning Committee sent its proposal to the General Faculty for strengthening the Labor Program that confirms and extends the recommendations of the LRT. The General Faculty passed this SPC revision of the Labor Program on December 11, 2003. These recommendations stress that the Labor Program should enhance opportunities for students to learn, to engage meaningful work tasks, and, thereby, to serve the community.

The Berea Vision, continued
3) Integrating Service
When students engage in service to others, they learn a new way of applying the core values that our Great Commitments and learning goals make central to our community. Berea’s faith that “God has created of one blood all peoples of the earth” fosters deep and active appreciation for the value of loving and serving others, and of the dignity of all people—whatever their origins or cultural traditions. By engaging in and reflecting on service to others, our students and we ourselves learn that the more one places one’s time and talent at the service of others, the more fulfilling one’s own life becomes. This might, at first glance, seem a mere truism. Yet given the communities from which most Berea students come, our students really do come to learn that there are no magic potions to end the grinding poverty they have experienced personally or have seen in their communities. Instead, they learn that to improve such circumstances they must put their heads and their hands at the service of their communities.
Directing one’s life and one’s vocation toward the betterment of one’s community—that is, toward the betterment of the common good—is a deeply rooted Berea College value. Through CELTS, the College is attempting to provide increasing service-learning opportunities for students so that they can absorb this lesson experientially in the midst of an entire community that is dedicated to serving others well. Service programs then can foster students’ learning and labor just as the academic and labor programs can engage students in service to others.
Being and Becoming offers a vision of a place where learning, labor, and service increasingly converge, a place where any given dimension of a student’s (or a worker’s) experience educates the head and hands and heart. An idealistic vision? Yes, certainly—but then, from John Fee’s day to the present, Bereans have always been idealistic. Our 21st-Century challenge and goal is to educate Berea College students for an information-rich, technology-driven global society in which they may bring their “whole selves”—their integrity, their sense of purpose, and the real and varied knowledge and capabilities they acquire here—to bear on the problems facing their communities and the larger world. Helping to develop and strengthen the capacities of the “gifted heads, gifted hands, and gifted hearts” of all Berea students and employees has always been and will remain the core enterprise of the College. Each member of Berea’s College and General Faculties has the great responsibility and the great opportunity to carry forward this historic enterprise. Thank you for joining other employees at Berea College in undertaking this vitally important mission.
Larry D. Shinn President
August 2008

THE GREAT COMMITMENTS OF BEREA COLLEGE Berea College, founded by ardent abolitionists and radical reformers, continues today as an educational institution still firmly rooted in its historic purpose "to promote the cause of Christ." Adherence to the College's scriptural foundation, "God has made of one blood all peoples of the earth," shapes the College's culture and programs so that students and staff alike can work toward both personal goals and a vision of a world shaped by Christian values, such as the power of love over hate, human dignity and equality, and peace with justice. This environment frees persons to be active learners, workers, and servers as members of the academic community and as citizens of the world. The Berea experience nurtures intellectual, physical, aesthetic, emotional, and spiritual potentials and with those the power to make meaningful commitments and translate them into action. To achieve this purpose, Berea College commits itself: • To provide an educational opportunity primarily for students from Appalachia, black and
white, who have great promise and limited economic resources. • To provide an education of high quality with a liberal arts foundation and outlook. • To stimulate understanding of the Christian faith and its many expressions and to
emphasize the Christian ethic and the motive of service to others. • To provide for all students through the labor program experiences for learning and
serving in community, and to demonstrate that labor, mental and manual, has dignity as well as utility.
• To assert the kinship of all people and to provide interracial education with a particular
emphasis on understanding and equality among blacks and whites. • To create a democratic community dedicated to education and equality for women and
men. • To maintain a residential campus and to encourage in all members of the community a
way of life characterized by plain living, pride in labor well done, zest for learning, high personal standards, and concern for the welfare of others.
• To serve the Appalachian region primarily through education but also by other
appropriate services. For more details, please visit: < http://www.berea.edu/about/mission.asp > Originally adopted by the Board of Trustees in 1969; this revised statement adopted by the Board of Trustees of Berea College, Berea, Kentucky, April 24, 1993

ACCREDITATION
Berea College is accredited in its awarding of baccalaureate degrees by the Commission on Colleges of the Southern Association of Colleges and Schools (SACS). The College is also accredited by the Commission on Collegiate Nursing Education for the preparation of nurses and the Nursing program has full approval status from the Kentucky Board of Nursing. In addition, the College is accredited by the National Council for the Accreditation of Teacher Education (NCATE) for the preparation of elementary, middle, and secondary school teachers with the bachelor's degree as the highest degree approved.
INSTITUTIONAL MEMBERSHIPS
Berea College is an institutional member of:
American Academy of Family Physicians (AAFP) American Association of Colleges for Teacher Education (AACTE) American Association of University Women (AAUW) American Chestnut Foundation American College Health Association (ACHA) American Council on Education (ACE) American Forest Foundation/American Tree Farm System Annapolis Group Appalachian College Association (ACA) Association for Higher Education and Disabilities (AHEAD) Association for the Advancement of Sustainability in Higher Education (AASHE) Association of American Colleges and Universities (AAC&U) Association of College and University Printers (ACUP) Association of Collegiate Conference and Events Directors International (ACCED-I) Association of Energy Engineers Association of Governing Boards of Universities (AGB) Association of Heating, Refrigeration, and Air Conditioning Engineers (ASHRAE) Association of Independent Kentucky Colleges and Universities (AIKCU) Association of Physical Plant Administrators (APPA) Berea Chamber of Commerce College and University Mail Services Association (CUMSA) College and University Professional Association for Human Resources (CUPA-HR) Council for Higher Education Accreditation (CHEA) Council for the Advancement and Support of Education (CASE) Council of Independent Colleges (CIC) Craft Organization Development Association CraftNet Association Higher Education Data Sharing (HEDS) Consortium Historical Hotel Association In Plant Printing and Mailing Association (IPMA) International Association of Campus Law Enforcement Administration (IACLEA) Kentucky Academy of Science (KAS) Kentucky Campus Compact Kentucky Chapter – American Academy of Family Physicians (KAFP) Kentucky Crafted Kentucky Guild of Artists and Craftsmen
Source: Berea College Catalog, 2010–2011 < http://www.berea.edu/cataloghandbook/college/accreditation.asp > Office of the President, January 2011

Institutional Memberships, continued
Kentucky Hotel and Lodging Association Kentucky Institute for International Studies (KIIS) Kentucky Intercollegiate Athletic Conference (KIAC) Kentucky Society of Association Executives Kentucky Woodland Owners Association/National Woodland Owners Association Mid-South Conference National Association for College Activities (NACA) National Association for College Employers (NACE) National Association for Intercollegiate Athletics (NAIA) National Association of College and University Business Officers (NACUBO) National Association of College Stores National Association of Educational Procurement (NAEP) National Association of Independent Colleges and Universities (NAICU) National Council for the Accreditation of Teacher Education (NCATE) National Fire Protection Association (NFPA) Natural Intramural Recreation and Sports Administration National Safety Council (NSC) Oak Ridge Associated Universities (ORAU) Rotary Club Smith Travel Research Society of Government Meeting Professionals Southern Association of Colleges and Schools (SACS) Southern Highland Craft Guild Southern University Conference (SUC) Tennessee Motor Coach Association The College Board The Tuition Exchange, Inc. Tuition Exchange Program, CIC United States Green Building Council (USGBC) University Leaders for a Sustainable Future (ULSF) Work Colleges Consortium (WCC)
NOTE: Alumnae are eligible for membership in the American Association of University Women (AAUW). Source: Office of the President, January 2011

ACADEMIC INFORMATION
Programs of Study Berea's curriculum offers the advantage of interdisciplinary general study combined with intensive study within a major field. Berea operates on a two fifteen-week term academic calendar consisting of required Fall and Spring terms. Students normally enroll in four course credits in each of these terms. There are also two optional Summer terms. Summer One Term courses are innovative, high-impact, intensive learning opportunities and may carry 1 or 1.5 course credits per course (limit one course per Summer One Term). Students may take between 1 and 2.25 credits in Summer Two. Berea courses are equivalent to four semester hours (6 quarter hours). Most degree programs require a minimum of 32 earned course credits; the Nursing Program typically requires a minimum of 34 earned course credits. Bachelor of Arts Degree Programs: African and African American Studies Economics Physical Education Applied Science and Mathematics Education Studies Physics Art English Political Science Asian Studies French Psychology Biology German Religion Chemistry History Sociology Child and Family Studies Mathematics Spanish Classical Languages (not currently offered) Music Theatre Communication Philosophy Women’s Studies Computer and Information Science Bachelor of Science Degree Programs: Agriculture and Natural Resources Nursing Business Administration Technology and Industrial Arts Independent majors are also available. These majors are designed by students who wish to pursue a field of study that cannot be met through a standard Berea College major program. Students are free to propose topics. Some examples of previously approved independent majors are: Appalachian Studies, Classical Studies, Peace and Social Justice Studies, and Sustainable Community Development. Teacher Preparation:
Berea College offers certification programs in Elementary Education (primary – grade 5); Interdisciplinary Early Childhood Education (birth to kindergarten) – not accepting new students until further notice; Middle Grades Education programs in Science or Mathematics (grades 5-9); Secondary Education (grades 8-12) programs in Biology, Chemistry, English, Mathematics, Physics, and Social Studies (with majors in History, Political Science, and Sociology); primary through grade 12 programs in Health Studies, Health Teaching, Instrumental Music, Vocal Music, and Physical Education; and grades 5-12 programs in Family and Consumer Sciences (not accepting new students until further notice) and in Technology Education. Minor Programs Offered: African and African American Studies Economics Philosophy Agriculture and Natural Resources French Physics Appalachian Studies German Political Science Art History Health and Health Teaching Religion Asian Studies History Sociology Business Administration Latin Spanish Communication Music Sustainability and Computer Science Peace and Social Justice Environmental Studies Dance Studies Women’s Studies Source: Berea College Catalog, 2010 – 2011. < http://www.berea.edu/cataloghandbook/academics/academicprogram/degrees.asp >

THE STUDENT LABOR PROGRAM
The Student Labor Program originated in its earliest form at Berea College in 1859 and expanded
to become one of the College’s Great Commitments providing economic, educational, social,
personal, and spiritual benefits to students and those served by their work.
The Labor Program is designed to:
Support the total educational program at Berea College through experiences providing the learning of skills, responsibility, habits, attitudes, and processes associated with work;
Provide and encourage opportunities for students to pay costs of board, room, and
related educational expenses;
Provide staff for College operations;
Provide opportunities for service to the community and others through labor; Establish a life-style of doing and thinking, action and reflection, service and learning that
carries on beyond the college years.
The Student Labor Program’s unifying vision is based on an understanding and expectation of
labor as student and learning centered; as service to the College and broader community, and as
providing necessary work (i.e., work that needs to be done) being done well. The Student Labor
Program systematically and consistently employs this vision to address tensions that may
occasionally emerge between student labor as work that needs to be done, as service to the
community and College, as student’s experiential learning, and as contribution to educational
costs, etc. The administration of the program is the responsibility of the Dean of Labor.
Labor assignments function very much like classes. Beginning at basic levels of work, students
are expected to progress to more skilled and responsible levels. Through these experiences, it is
expected that student workers will 1) develop good work habits and attitudes, 2) gain an
understanding of personal interests, skills, and limitations, and 3) exercise creativity, problem-
solving, and responsibility. Students may also learn the qualities of leadership, standard setting,
and effective supervision.
The Labor Program makes it possible for students to know each other as co-workers as well as
classmates. More importantly, linking the Academic and Labor Programs establishes a pattern of
learning through work that continues long after college.
For a complete list of all labor departments in which students work, see pages 99 and 100.
Source: Berea College Catalog, 2010 – 2011. < http://www.berea.edu/cataloghandbook/college/laborprogram/introduction.asp >

THE CONVOCATION SERIES
The Convocation Series is a vital component of Berea’s General Education Program. Through the
Convocation Series, notable speakers, scholars, performers, and programs present on a variety
of subjects to enlarge the intellectual, aesthetic, and religious dimensions of campus life. In
addition, Berea’s student performing ensembles provide convocations addressing similar issues
through music, dance, and theatre. Providing rich experiences for students, faculty, and staff
alike, convocations help build and sustain a sense of curiosity and intellectual challenge so basic
in an academic community. They make available information and insights on important topics
likely to be considered in academic courses.
All students will be enrolled automatically in a 1/4-credit Convocation course (CNV 100) during
each of their regular terms of in-residence enrollment, with the exception of the final term of
enrollment, for a maximum of eight (8) such terms. For each term of enrollment in CNV 100, the
student will earn a grade of CA (which is calculated as an A in the GPA) for receiving at least
seven (7) convocation credits. The grade of CF (which is calculated as an F in the GPA) will be
awarded given if one receives fewer than seven (7) convocation credits. Enrollment in this course
is optional during the final term at Berea (or is prohibited if the student already has enrolled in this
course for eight terms).
Convocation credits only count in the GPA and not in the minimum earned credits required for
graduation.
Source: Berea College Catalog, 2010 – 2011, <http://www.berea.edu/cataloghandbook/academics/academicprogram/convocations.asp>

CLUBS AND ORGANIZATIONS ACADEMIC YEAR 2010 – 2011
African Student Association (ASA) Episcopal Canterbury Fellowship Agricultural Union (AU) E.Y.C.E. (pep club) Alpha Psi Omega Fine, Young, and Hypnotic (FYAH) Dance Team Appalachian Center Fighting Rape Through Education and Asian Student Union (ASU) Encouragement (FREE) Baptist Campus Ministry Gay-Straight Alliance (GSA) Berea College.. German Club Anime and Manga Club Hispanic Student Association (HSA) Association of Student Nurses (BCASN) Intervarsity Billiards League Intramurals Concert Choir Invisible Children Republicans Men Advocating Awareness of Rape and Women’s Chorus Sexual Assault (MARS) Berea Middle Eastern Dance (BMED) Modern Dance Troupe Berea Ultimate Frisbee Mortar Board Honor Society Bereans for Appalachia (BFA) Muslim Student Association (MSA) Black Cultural Center (BCC) Newman Club Black Music Ensemble (BME) Oxfam America at Berea College Black Student Union (BSU) Pagan Coalition Buddhist Student Association (BSA) Phi Kappa Phi Campus Activities Board (CAB) Physical Education Majors (PEM) Club Center for Excellence in Learning Physics Club through Service (CELTS) Pre-Med/Dental Club Adopt-a-Grandparent Psychology Club/Psi Chi Berea Buddies Sigma Tau Delta Bonnor Scholars Student Affiliates of the American First Book-Madison County Chemical Society (SAACS) Habitat for Humanity Student Government Association (SGA) HEAL Freshman Class Hispanic Outreach Program (HOP) Sophomore Class One-on-One Tutoring Junior Class People Who Care Senior Class Service Learning Students for a Free Tibet Teen Mentoring Students in Free Enterprise (S.I.F.E.) Chi Alpha Swing Dance Cosmopolitan Club Technology Club Country Dancers Young Democrats Danish Gymnastics Club Zachary Sieben Association of Primitive Arts and Delta Tau Alpha Technology English Club Source: Berea College Student Organizations Website, as of January 2011 < http://www.berea.edu/campuslife/clubsorgs/list.asp >

BOARD OF TRUSTEES*
Vicki E. Allums Virginia
Donna S. Hall Kentucky
Dennis R. Roop Colorado
Charlotte F. Beason
Kentucky Scott M. Jenkins
Pennsylvania Charles Ward Seabury, II
California
Vance Blade** Kentucky
Shawn C.D. Johnson Massachusetts
David E. Shelton North Carolina
Nancy E. Blair Connecticut
Brenda Todd Larsen South Carolina
Larry D. Shinn*** Kentucky
Joseph John Bridy
New York
Jim Lewis Maryland
Tyler S. Thompson Kentucky
Lynne Blankenship Caldwell Virginia
Eugene Y. Lowe, Jr. Illinois
David O. Welch Kentucky
David H. Chow Connecticut
Elissa May-Plattner Kentucky
Dawneda F. Williams Virginia
M. Elizabeth Culbreth
North Carolina Geraldine F. McManus
New Jersey Eugene A. Woods
Kentucky
Chella S. David Minnesota
Harold L. Moses Tennessee
Drausin F. Wulsin Ohio
John E. Fleming Ohio
Douglas M. Orr North Carolina
Robert T. Yahng California
Glenn R. Fuhrman New York
Thomas W. Phillips Tennessee
Stephanie B. Zeigler Connecticut
Jerry B. Hale Tennessee
William B. Richardson Kentucky
Honorary Trustees
Alberta Wood Allen Maryland
Martin A. Coyle California
Thomas H. Oliver South Carolina
John Alden Auxier
Tennessee Frederic L. Dupree, Jr.
Kentucky Kroger Pettengill
Ohio
James T. Bartlett Massachusetts
Kate Ireland Florida
David S. Swanson Maine
Jack Buchanan
Kentucky Alice R. Manicur
Maryland R. Elton White
Florida
*Current as of February 2011. Changes in Board composition will be recorded on the following web page, <http://www.berea.edu/ira/factbooks.asp>. **On one-year leave of absence ***President of the College
Source: Office of the President.

Source: Office of the President, January 2011
ADMINISTRATIVE ORGANIZATION
President
Vice President for Operations and Sustainability
Oversight of College Businesses and Auxiliaries: Boone Tavern College Book Store Dining Services Student Crafts Program Administrative Operations: People Services College Post Office Conference Services Printing Services
Property and Resource Mgt. Campus Facilities Capital Project Planning And Execution Forest management Commercial and Residential Rentals Business and Property Development
Environmental Health and Safety
Facilities Management
Vice President for Alumni and College Relations
Alumni Relations Development:
Berea Fund Foundations Gift Planning
Public Relations
Vice President for Labor and Student Life
Labor Program: Labor Departments Workplace Development Student Payroll Supervisor Training
Student Life Collegium: Ecovillage Residence Life and Housing Student Leadership Development Student Ombudsman Coalition for Community Building Clubs and Organizations
Health Service Counseling and Disabilities Services Public Safety
Crossroads Complex Services
Black Cultural Center
Campus Life
Wellness Programs: Recreation and Intramurals Seabury Center
Academic Vice
President and
Dean of Enrollment and Academic Services: Academic Services Admissions Student Service Center Financial Aid
Council of Centers Appalachian Center Center for Excellence in Learning Through Service International Center (Black Cultural Center) (Campus Christian Center) Center for Engaged Learning Career Development Internships Learning Center Hutchins Library
Dean of the Faculty
Faculty Hiring and Development Post Tenure Review Sabbatical Review Curriculum Oversight and Operational Support: Academic Departments Field Laboratories: Child Development Laboratories College Farms Interdisciplinary Programs: African and African American Studies Appalachian Studies Asian Studies Peace and Social Justice Studies Sustainability and Environmental Studies Women’s Studies
President
Appalachian Fund
Campus Christian Center
Information Systems and Services: Computer Services Media Services Telephone Services Legal Affairs and Secretary of the Board Internal Audit Risk Management Institutional Research and Assessment (OIRA)
Vice President
for Finance
Oversight of Finance Office and Functions: Controller Financial Planning Estates/Trusts Financial Reports General Accounting Accounts Payable Purchasing Tax Reporting Debt Management Cash Management Endowment and Investment Oversight Annual Budget Preparation Concessions/Vending Insurance Liaison
Chief Sustainability Officer: Energy Management Environmental Health and Safety Sustainability Policies and Strategy Development Establishment of Goals, Assessment and Monitoring Curriculum Collaboration Local governmental, community, and business relations
Dean of Curriculum and Student Learning Advising General Education Convocations Undergraduate Research and Creative Projects
Externally Funded Programs: TRIO and Special Programs GEAR UP
First Year Program
Athletics
Institutional Effectiveness and SACS Representative

CENTRAL ADMINISTRATIVE OFFICERS
Larry D. Shinn President
Stephanie P. Browner Academic Vice President and Dean of the Faculty Jeff Amburgey Vice President for Finance
William A. Laramee Vice President for Alumni and College Relations Steve Karcher Vice President for Operations and Sustainability Gail W. Wolford Vice President for Labor and Student Life Judge B. Wilson II General Counsel and Secretary of the College

ACADEMIC DEPARTMENTAL CHAIRPERSONS ACADEMIC YEAR 2010 - 2011
Department Chairperson Agriculture and Natural Resources Sean Clark Art Lisa Kriner Biology Dawn Anderson Chemistry Jay Baltisberger Child and Family Studies Katrina Rivers Thompson; Janice Blythe** Economics and Business Trish Isaacs Education Studies Bobby Starnes English, Theatre, and Communication Beth Crachiolo Foreign Language Jeanne Hoch History Robert Foster Library Science Anne Chase Mathematics and Computer Science James Blackburn-Lynch Music Kathy Bullock Nursing Carol Kirby Philosophy and Religion Eric Pearson Physical Education and Health Stephanie Woodie Physics Amer Lahamer Political Science John Heyrman; Mike Berheide* Psychology Wayne Messer Sociology Jackie Burnside Technology and Industrial Arts Gary Mahoney *Acting Chairperson for Fall Term 2010 **Acting Chairperson for Spring Term 2011
ACADEMIC PROGRAM / CURRICULA CONTACT PERSONS
Program/Curricula Contact Person
African and African Linda Strong-Leek, Director of African and American Studies African American Studies
Appalachian Studies Chad Berry, Director of Appalachian Studies Asian Studies Jeff Richey, Director of Asian Studies
General Education Steve Gowler, Director of General Education Peace and Social Justice Michelle Tooley, Director of Peace and Social Justice Studies Studies
Sustainability and Richard Olson, Director of Sustainability and Environmental Studies Environmental Studies Women's Studies Peggy Rivage-Seul, Director of Women's Studies Source: Office of the Academic Vice President and Dean of the Faculty, October 2010

CAMPUS GOVERNANCE
The campus governance structure allows for the inclusion and participation at various levels for all employees of the College. Avenues for participation in decision-making include: communication and sharing information, consultation, voice, and vote. All non-student employees are members of the General Faculty and are eligible for committee service. Due to the size of the General Faculty, the General Faculty Assembly, a smaller body of representatives, serves as the voting body. The General Faculty Assembly concerns itself with nonacademic affairs affecting the general welfare of the College and the fulfillment of its purposes. Within its purview are those matters not restricted to the College Faculty Assembly, including the labor program, financial aid, extracurricular activities, student conduct, residence hall life, College calendar, campus environment, some strategic planning initiatives, and the general working circumstances for staff. The College Faculty Assembly acts on both academic program matters and recommendations dealing with College Faculty personnel policies. The Staff Forum, consisting of all non-student employees except those who are members of the College Faculty, provides a formal structure of information-sharing and voice for staff members. It serves in an advisory capacity to administrators and faculty decision-making bodies.
General Faculty Assembly and College Faculty Assembly Memberships
Academic Year 2010-2011
Memberships
General Faculty Assembly 243 members NOTE: The General Faculty Assembly includes all members of the College Faculty Assembly. College Faculty Assembly 124 members Source: Berea College Faculty Manual, August 2009 < http://www.berea.edu/facultymanual/campusgovernance/default.asp > Executive Council, October 2010

FACULTY COUNCIL AND COMMITTEE STRUCTURE The College and General Faculties are organized to conduct their affairs primarily through five program councils and their subordinate committees. Each of these councils is responsible to either the College Faculty Assembly or General Faculty Assembly, and any recommendations for substantive changes in policy are subject to approval by one or the other body. The councils are: Academic Program, Faculty Status, Labor Program, Strategic Planning, and Student Life. Coordinating and overseeing all elements of the structure is an Executive Council. The functions and composition of the Executive Council and the five program councils and their related committees are described below. EXECUTIVE COUNCIL (EC) The Executive Council coordinates the efforts of the various program councils and is generally responsible for the effective functioning of campus governance. Faculty Secretary
The Faculty Secretary is the recorder of official proceedings of the College Faculty Assembly and the General Faculty Assembly meetings. Awards Committee The Awards Committee solicits nominations from the College community for honorary degree and Berea College Service Award candidates. After reviewing the nominations, it recommends candidates for approval by the appropriate bodies.
ACADEMIC PROGRAM COUNCIL (APC) The Academic Program Council has comprehensive responsibility for the academic program, with specific responsibilities for curriculum planning, continual review of current programs, policy development, and general supervision of practices, requirements, and services affecting academic affairs. Athletic Affairs Committee The Athletic Affairs Committee has within its purview both intercollegiate and student activity
clubs involved in athletic competition. Committee on General Education (COGE) The Committee on General Education, guided by the aims of the General Education
curriculum, is charged with acting as the steering committee for the General Education curriculum.
Convocation Committee
The Convocation Committee is primarily concerned with annual program planning. It selects events and presentations that advance the College's educational purpose and enriches the life of the campus and community.
Source: Berea College Faculty Manual, August 2009 < http://www.berea.edu/facultymanual/campusgovernance/fccstructure/default.asp >

Faculty Council and Committee Structure (continued) Learning Commons Committee The Learning Commons Committee facilitates collaboration between various academic support services across campus to deliver effective and integrated service in support of student learning and student academic success.
Student Admissions and Academic Standing Committee (SAAS)
The Student Admissions and Academic Standing Committee monitors current policies and practices with regard to admission, scholarship, probation and suspension, and formulates policy recommendations.
Teacher Education Committee
The Teacher Education Committee engages in curriculum development, selects students for the teacher education program, and provides liaison between that program and the rest of the campus.
FACULTY STATUS COUNCIL (FSC) The Faculty Status Council deals with questions of faculty status. The Council is responsible for policy review and recommendation to the College Faculty Assembly on College Faculty personnel matters. LABOR PROGRAM COUNCIL (LPC) The Labor Program Council has as its principal concern interpreting and applying the vision for the Student Labor Program. STRATEGIC PLANNING COUNCIL (SPC) The Strategic Planning Council conducts continuous planning for institutional change based on the mission of the College, interpreted in light of opportunities and constraints created by changing internal and external circumstances. STUDENT LIFE COUNCIL (SLC) The Student Life Council develops policy with respect to rules for student conduct, and policy for nonacademic aspects of campus life affecting students. ADDITIONAL STANDING COMMITTEES AND OTHER RESPONSIBILITES Administrative Committee
The Administrative Committee is responsible to the Board of Trustees and the President of the College for matters of finance, physical properties, and internal management of the College. All instructional and operating departments of the institution are organized under a member of this committee.
Budget Committee The Budget Committee serves as an advisory body to the President in the preparation of the annual budget. Source: Berea College Faculty Manual, August 2009 < http://www.berea.edu/facultymanual/campusgovernance/fccstructure/default.asp >

Faculty Council and Committee Structure (continued) Campus Conduct Hearing Board (CCHB)
The Hearing Board serves as a pool of persons from which panels are selected to hold formal hearings on matters presented to it. For staff hearings, these matters may include individual complaints of discrimination, sexual harassment, or other employment-related grievances which apply to all employees of the College. For students, the Board hears all suspendable nonacademic cases of student misconduct, including violations of the Student Conduct Regulations and misconduct arising from the student labor program or financial aid programs. Dean’s Advisory Council The council advises the Dean of Faculty on matters related to the future of the tenure-track faculty positions that are vacated. Faculty Advisors to the Student Government Association The Faculty Advisors to the Student Government Association provide guidance in the development of policies, practices, and other procedures that pertain to the student body. Faculty Appeals Committee The Committee hears appeals of tenure and promotion recommendations, cases involving termination for cause of tenured members of the faculty, and cases involving alleged violation of academic freedom. Faculty Liaison to the Board of Trustees The Faculty Liaison to the Board of Trustees attends the meetings of the full Board, participating with voice but not vote. The Faculty Liaison reports on the Board meetings to the College Faculty Assembly and General Faculty Assembly. Enrollment Policies Committee (EPC) The Enrollment Policies Committee is primarily concerned with matters of enrollment management and related procedural matters. It sets goals each year for freshman, transfer, and returning student admissions, monitors retention and graduation rates, rules on student requests for leaves of absence, and coordinates planning among the offices represented on the Committee. This committee also ensures quality of education offered through consortial relationships. Safety Committee The Safety Committee is responsible for coordinating and directing safety efforts on campus.
Source: Berea College Faculty Manual, August 2009 < http://www.berea.edu/facultymanual/campusgovernance/fccstructure/default.asp > Office of the Academic Vice President and Dean of the Faculty, October 2010.

NUMBER OF TEACHING FACULTY BY RANK AND STATUS Academic Year Academic Year 2009 - 2010 2010 - 2011 Tenure Appointments* 121 106 Unfilled Tenure Positions 6 11 Total Allocated Tenure Track Positions 127 117 Full-time Teaching Appointments** 130 119 Professor ( 39 ) ( 33 ) Associate ( 55 ) ( 48 ) Assistant ( 32 ) ( 31 ) Instructor ( 4 ) ( 7 ) Part-Time 32 39 Full-Time Employees Teaching Part-Time 14 15 Full-Time Equated 152 144 *Includes all tenure-track and tenured faculty, including three individuals teaching less than full-time and seven administrators in 2009-2010 and three individuals teaching less than full-time and five administrators in 2010-2011. **Includes only full-time teaching faculty, both tenure- and non tenure-track positions. ----------------------------------------------------------------------------------------------------
FULL-TIME TEACHING FACULTY* LENGTH OF SERVICE AT BEREA BY GENDER
ACADEMIC YEAR 2010 - 2011
Male Female Total 0 to 5 years 18 19 37 6 to 10 years 18 11 29 11 to 20 years 14 13 27 21 to 30 years 13 9 22 Over 30 years 3 1 4 TOTAL 66 53 119 *Includes only full-time faculty whose duties are primarily teaching. Does not include sabbatical replacements. ---------------------------------------------------------------------------------------------------------------
STUDENT/FACULTY RATIO Academic Year Academic Year 2009-2010 2010-2011 Student/Faculty Ratio* (FTE) 10/1 11/1 *Ratio is calculated by dividing the FTE Student Enrollment by the FTE full-time Faculty. Source: Office of the Academic Vice President and Dean of the Faculty, October 2010

Source: Office of the Academic Vice President and Dean of the Faculty, October 2010
FULL-TIME TEACHING FACULTY* BY AGE ACADEMIC YEARS 2001-2002 THROUGH 2010-2011
2001-2002 2002-2003 2003-2004 2004-2005 2005-2006 Age** N % N % N % N % N %
Less than 25 years old 0 (0%) 0 (0%) 0 (0%) 0 (0%) 0 (0%) 25-29 years old 1 (2%) 1 (1%) 3 (2%) 2 (2%) 0 (0%) 30-39 years old 21 (15%) 23 (17%) 23 (18%) 22 (17%) 25 (19%) 40-49 years old 38 (34%) 40 (30%) 37 (28%) 38 (29%) 30 (23%) 50-59 years old 45 (30%) 42 (31%) 43 (33%) 42 (32%) 48 (37%) 60-69 years old 26 (18%) 27 (20%) 23 (18%) 25 (19%) 25 (19%) Greater than 69 years old 0 (0%) 1 (1%) 1 (1%) 2 (2%) 2 (2%)
TOTAL 131 (100%) 134 (100%) 130 (100%) 131 (100%) 130 (100%)
Average: 51 49 50 50 50 ------------------------------------------------------------------------------------------------------------------------------------------------------------------------------------------ 2006-2007 2007-2008 2008-2009 2009-2010 2010-2011 Age** N % N % N % N % N % Less than 25 years old 0 (0%) 0 (0%) 0 (0%) 0 (0%) 0 (0%) 25-29 years old 1 (1%) 1 (1%) 1 (1%) 4 (3%) 2 (2%) 30-39 years old 21 (16%) 21 (16%) 23 (18%) 17 (13%) 19 (16%) 40-49 years old 30 (23%) 35 (27%) 33 (25%) 36 (28%) 32 (27%) 50-59 years old 52 (41%) 51 (40%) 49 (37%) 48 (37%) 49 (41%) 60-69 years old 22 (17%) 18 (14%) 22 (17%) 22 (17%) 17 (14%) Greater than 69 years old 2 (2%) 2 (2%) 3 (2%) 3 (2%) 0 (0%) TOTAL 128 (100%) 128 (100%) 131 (100%) 130 (100%) 119 (100%)
Average: 51 50 51 51 50 *Includes only full-time faculty whose duties are primarily teaching. Does not include sabbatical replacements. **Age as of September 1 of the Academic Year.

FULL-TIME FACULTY* BASE SALARIES BY RANK AND GENDER
ACADEMIC YEAR 2010 - 2011
Male Female Total Rank Number Mean Median Number Mean Median Number Mean Median Professor 16 $79,200 $81,200 17 $75,400 $74,700 33 $77,300 $78,200 Associate Prof. 34 $63,800 $63,300 14 $65,100 $65,500 48 $64,200 $64,200 Assistant Prof. 15 $50,000 $49,000 16 $52,200 $51,000 31 $51,200 $49,000 Instructor** 1 6 7 ALL RANKS 66 $64,100 $62,800 53 $62,200 $64,800 119 $63,300 $65,200
*Includes only full-time faculty whose duties are primarily teaching. Does not include sabbatical replacements. **Because of the small number of "Instructors," salary figures are not provided for this rank to ensure privacy; however, they are included in the "All Ranks" salary averages. Source: Office of the Academic Vice President and Dean of the Faculty, October 2010

CHARACTERISTICS OF FULL-TIME FACULTY* BY DEPARTMENT OR PROGRAM: GENDER, TERMINAL DEGREE, AND TENURE STATUS
Academic Year 2010 - 2011
Terminal Gender Degree Tenured Department/Program M F T N (%) N (%)
African and African American Studies 2 0 2 1 (50%) 1 (50%) Agriculture and Natural Resources 3 0 3 3 (100%) 3 (100%)
Art 2 4 6 6 (100%) 3 (50%)
Biology 3 3 6 5 (83%) 4 (67%)
Chemistry 4 1 5 5 (100%) 3 (60%)
Child and Family Studies 1 3 4 4 (100%) 2 (50%)
Economics and Business 5 3 8 6 (75%) 6 (75%)
Education Studies 1 4 5 4 (80%) 2 (40%)
English, Theatre, and Communication 4 7 11 11 (100%) 7 (64%)
Foreign Languages 3 4 7 7 (100%) 6 (86%)
General Studies 6 2 8 5 (63%) 1 (13%)
History 3 2 5 5 (100%) 3 (60%)
Mathematics and Computer Science 4 4 8 6 (75%) 5 (63%)
Music 3 2 5 4 (80%) 3 (60%)
Nursing 1 4 5 5 (100%) 1 (20%)
Philosophy and Religion 5 1 6 6 (100%) 6 (100%)
Physical Education and Health 3 4 7 5 (71%) 2 (29%)
Physics 2 1 3 3 (100%) 1 (33%)
Political Science 2 0 2 2 (100%) 2 (100%)
Psychology 3 0 3 3 (100%) 3 (100%)
Sociology 0 2 2 2 (100%) 2 (100%)
Sustainability and Environmental Studies 2 0 2 2 (100%) 1 (50%)
Technology and Industrial Arts 4 0 4 4 (100%) 3 (75%)
Women’s Studies 0 2 2 2 (100%) 2 (100%)
TOTAL 66 53 119 106 (89%) 72 (61%) *Includes only full-time faculty whose duties are primarily teaching. Does not include sabbatical replacements, but does include faculty in non-tenure track positions. Joint appointments are listed in only one department. NOTE: Under the Gender column, the following abbreviations are used: M = Male, F = Female, and T = Total of Males and Females. Source: Office of the Academic Vice President and Dean of the Faculty, October 2010

AVERAGE DOLLARS FOR FACULTY DEVELOPMENT PER FULL-TIME FACULTY MEMBER
Fiscal Year Fiscal Year Fiscal Year Fiscal Year Fiscal Year 2005-2006 2006-2007 2007-2008* 2008-2009 2009-2010 Professional Travel, Dues, Seminars and Courses Total Dollars Spent on Faculty Development $329,627 $342,139 $424,374 $247,935 $160,263 Number of Faculty Receiving Funds 130 128 128 131 130 Percent of Total Full-Time Faculty 100% 100% 100% 100% 100% Average Total $ Per Full-Time Faculty $2,951 $2,759 $3,315 $2,017 $1,276 Sabbatical Leave (Includes Full and Two-Thirds Year Leaves) Total Dollars Spent on Faculty Sabbaticals $963,586 $932,464 $528,076 $543,730 $641,737 Number of Faculty on Paid Sabbatical 15 16 9 9 13 Average Total $ Per Faculty on Sabbatical $64,239 $58,279 $58,675 $60,414 $49,364 Percent of Total Full-Time Faculty 11.5% 12.5% 7.0% 6.9% 10.0% Number of Total Full-Time Faculty 130 128 128 131 130 *2007-2008 data have been corrected from prior Fact Books. (The number of faculty has been corrected from 126 to 128) Source: Office of the Academic Vice President and Dean of the Faculty, October 2010

THE SEABURY AWARD FOR EXCELLENCE IN TEACHING
The Seabury Award for Excellence in Teaching has been presented annually to outstanding Berea College faculty since 1961. The Award, which was made possible through the generosity of the Charles Ward Seabury family, is a cash award presented at Commencement each year. The recipient of the award is selected each year by a committee, composed of the last six recipients of the award, the students who will receive the Wood Achievement Award at the same Commencement, and by the Dean of the Faculty. The Seabury Award carries with it great prestige as the highest honor an active faculty member may receive from the College. The Seabury Award Committee annually invites students and faculty to nominate persons to receive this recognition. The nominations take the form of a letter addressing why the nominee would be a worthy recipient. The nominations give attention to the following considerations:
The teacher's enthusiasm for his or her subject and the teacher's capacity to stimulate students' interest in that subject.
The teacher's effectiveness in helping students move toward greater intellectual and personal maturity.
The teacher's engagement in scholarly and creative activities in his or her discipline, or in cross-disciplinary study.
The teacher's willingness to be involved, socially and intellectually, with students outside the classroom and in College activities.
In choosing a person to be honored, the Committee over the years has given relatively little weight to the number of nominations an individual receives in a given year. More important than many nominations is a thoughtful description of a person's accomplishments as a teacher and an explanation why special recognition is deserved. Petitions or letters of nomination signed by more than one person are not considered.
Recipients of the Seabury Award for Excellence in Teaching Names of current Berea College faculty members are italicized.
Dorothy Weeden Tredennick 1962 Jonas Patterson Shugars 1981 Gerrit Levey 1962 Philip Schmidt 1982 Marian Kingman 1963 Larry K. Blair 1983 Robert Gordon Menefee 1963 Richard Barnes 1984 Charlotte P. Ludlum 1964 Marlene Waller 1985 William E. Newbolt 1964 Smith T. Powell 1986 Virginia Ruth Woods 1965 John Wallhausser 1987 George Gilbert Roberts 1965 Stephen C. Bolster 1988 Maureen Faulkner 1966 Robert J. Schneider 1989 Kristjan Sulev Kogerma 1966 Ralph Stinebrickner 1990 Herschel Lester Hull 1967 Jeanne M. Hoch 1991 Frank Junior Wray 1967 Dean Warren Lambert 1992 Jerome William Hughes 1968 Ralph L. Thompson 1993 Thomas Reed Beebe 1968 Eugene T. Chao 1994 Louise Moore Scrivner 1969 John E. Courter 1995 John Douglas Chrisman 1969 Paul David Nelson 1996 Cornelius Gregory Di Teresa 1970 L. Eugene Startzman 1997 Franklin Bryan Gailey 1970 Donald Hudson 1998 Thomas McRoberts Kreider 1971 Dorothy Hopkins Schnare 1999 William John Schafer 1971 Thomas A. Boyd 2000 Robert Jerry Lewis 1972 Richard D. Sears 2001 Stephen Scott Boyce 1972 Laura A. Crawford 2002 Thomas David Strickler 1973 Walter E. Hyleck 2003 Martha Wylie Pride 1974 Andrew Baskin 2004 Glen H. Stassen 1975 Amer Lahamer 2005 John Fletcher White 1976 Dawn Anderson 2006 Mary Louise Pross 1977 Gary Mahoney 2007 Robert Ward Pearson 1978 Ron Rosen 2008 John Seelye Bolin 1979 Janice Blythe 2009 Dennis Michael Rivage-Seul 1980 Barbara Wade 2010
Source: Office of the Academic Vice President and Dean of Faculty, October 2010

THE PAUL C. HAGER EXCELLENCE IN ADVISING AWARD
The Paul C. Hager Excellence in Advising Award is given annually at the May Commencement to a person who is an academic advisor and is also a member of the College or General Faculties. The award is named in honor of Paul C. Hager, emeritus administrator and professor (1962-1997), who supervised the advising process at Berea College during the last part of the twentieth century. The guidelines for the award are published annually in early spring, at which time students and faculty are asked to submit nominations for confidential consideration. The Award Selection Committee consists of the two most recent award winners, with assistance from the Associate Provost for Advising and Academic Success.
Recipients of the Paul C. Hager Excellence in Advising Award Names of current Berea College faculty members are italicized.
James Gage 1993
Oliver Keels 1994
Dorothy Schnare 1995
Carolyn Orr 1996
Paul C. Hager 1997
Martie Kazura 1998
Megan Hoffman 1999
Meighan Sharp 2000
Don Hudson 2001
Barbara Wade 2002
Dawn Anderson 2003
Janice Blythe 2004
Patricia Isaacs 2005
Michael Panciera 2006 David Porter 2007 Ralph Thompson 2008 Katrina Rivers Thompson 2009 Ed McCormack 2009 Fred de Rosset 2010 Source: Office of the Academic Vice President and Dean of the Faculty, October 2010

ADMISSIONS TERRITORY CATEGORIES
Berea College students are characterized by one of three "geographical" categories. They are: • In-Territory: Students who come from much of the Appalachian region and
all of Kentucky within the white area in the map below. In-Territory also includes permanent residents (a non-citizen who has formally established residency in the United States) and refugees who reside in the territory.
• Out-of-Territory: Students who come from outside the In-Territory area,
including U.S. Citizens living in foreign countries. Out-of-Territory also includes permanent residents (a non-citizen who has formally established residency in the U.S.) and refugees who reside out of the territory.
• F-1 International: Students who are not U.S. Citizens, permanent
residents, or refugees.

ADMISSIONS TERRITORY
ALABAMA KENTUCKY KENTUCKY KENTUCKY Blount Bourbon** Jessamine* Scott** Calhoun Boyd Johnson Shelby** Cherokee Boyle* Kenton** Simpson** Cullman Bracken* Knott Spencer** Dekalb Breathitt Knox Taylor* Etowah Breckenridge** Larue** Todd** Jackson Bullitt** Laurel Trigg** Jefferson Butler** Lawrence Trimble** Limestone Caldwell** Lee Union** Madison Calloway** Leslie Warren** Marshall Campbell** Letcher Washington** Morgan Carlisle** Lewis Wayne St. Clair Carroll** Lincoln Webster** Shelby Carter Livingston** Whitley Talladega Casey Logan** Wolfe Christian** Lyon** Woodford** GEORGIA Clark* McCracken** Bartow Clay McCreary NORTH CAROLINA Catoosa Clinton McLean** Alexander Chattooga Crittenden** Madison Alleghany Cherokee Cumberland Magoffin Ashe Dade Daviess** Marion* Avery Dawson Edmonson** Marshall** Buncombe Fannin Elliott Martin Burke Floyd Estill Mason* Caldwell Forsyth Fayette** Meade** Cherokee Gilmer Fleming* Menifee Clay Gordon Floyd Mercer* Graham Habersham Franklin** Metcalfe* Haywood Lumpkin Fulton** Monroe* Henderson Murray Gallatin** Montgomery* Jackson Pickens Garrard Morgan McDowell Rabun Grant** Muhlenburg** Macon Towns Graves** Nelson** Madison Union Grayson** Nicholas* Mitchell Walker Green* Ohio** Polk White Greenup Oldham** Rutherford Whitfield Hancock** Owen** Stokes Hardin** Owsley Surry KENTUCKY Harlan Pendleton** Swain Adair Harrison** Perry Transylvania Allen** Hart** Pike Wautaga Anderson** Henderson** Powell Wilkes Ballard** Henry** Pulaski Yancey Barren** Hickman** Robertson* Bath Hopkins** Rockcastle Bell Jackson Rowan Boone** Jefferson** Russell

Admissions Territory (continued) OHIO TENNESSEE VIRGINIA WEST VIRGINIA Adams** Jackson Lee Monroe Athens** Jefferson Loudon Nicholas Brown** Johnson Montgomery Pendleton Clermont** Knox Nelson Pleasants* Gallia** Loudon Page Pocahontas Hamilton*** McMinn Patrick Preston* Highland** Macon Pulaski Putnam Hocking** Marion Roanoke Raleigh Jackson** Meigs Rockbridge Randolph Lawrence** Monroe Rockingham Ritchie* Meigs** Morgan Russell Roane* Monroe** Overton Scott Summers Morgan** Pickett Shenandoah Taylor* Noble** Polk Smyth Tucker Perry** Putnam Tazewell Tyler* Pike** Rhea Warren Upshur* Ross** Roane Washington Wayne Scioto** Scott Wise Webster Vinton** Sequatchie Wythe Wirt* Washington** Sevier Wood** Smith WEST VIRGINIA Wyoming SOUTH CAROLINA Sullivan Barbour* Cherokee Unicoi Boone** Greenville Union Braxton* TAKEN OUT Oconee VanBuren Cabell* OF TERRITORY Pickens Warren Calhoun* IN 1976 Spartanburg Washington Clay* White Doddridge* TENNESSEE Fayette Alabama Anderson VIRGINIA Gilmer* Clay Bledsoe Alleghany Grant Cleburne Blount Amherst Greenbrier Fayette Bradley Augusta Hampshire Franklin Campbell Bath Hardy Marion Carter Bedford Harrison* Walker Claiborne Bland Jackson* Winston Clay Botetourt Jefferson Cocke Buchanan Kanawha* Cumberland Carroll Lewis* Virginia DeKalb Clarke Lincoln Greene Fentress Craig Logan Madison Grainger Dickenson McDowell Rappahannock Greene Floyd Marion* Grundy Franklin Mason* Hamblen Frederick Mercer Hamilton Giles Mineral Hancock Grayson Mingo Hawkins Highland Monongalia* *Counties added in 1976 **Counties added in 1978 ***County added in 1996 (Hamilton County, Ohio) Source: Admissions Office

FIRST-YEAR STUDENTS: INQUIRIES, APPLIED, ACCEPTED, AND ENROLLED
INQUIRIES* APPLIED ACCEPTED ENROLLED FALL % of % of % of TERM N N Inquiries N Applications N Accepted 2001 15,402 1,871 12% 603 32% 424 70% 2002 15,079 1,974 13 480 24 356 74 2003 15,340 2,119 14 530 25 396 75 2004 15,038 2,107 14 561 27 400 71 2005 13,898 1,908 14 511 27 378 74 2006 not available 1,818 not available 532 29 388 73 2007 not available 2,083 not available 597 29 421 71 2008 not available 2,468 not available 531 22 413 78 2009 not available 2,745 not available 516 19 392 76 2010 not available 3,264 not available 564 17 429 76
NUMBER OF FIRST-YEAR STUDENTS
*It is difficult to maintain an accurate count of “inquiries” as many students gather information about Berea College via the web.
424
356
396 400378 388
421 413392
429
0
50
100
150
200
250
300
350
400
450
2001 2002 2003 2004 2005 2006 2007 2008 2009 2010
Entering Fall Term

FIRST-YEAR STUDENTS: INQUIRIES, APPLIED, ACCEPTED, AND ENROLLED
INQUIRIES* APPLIED ACCEPTED ENROLLED FALL % of % of % of TERM N N Inquiries N Applications N Accepted 2001 15,402 1,871 12% 603 32% 424 70% 2002 15,079 1,974 13 480 24 356 74 2003 15,340 2,119 14 530 25 396 75 2004 15,038 2,107 14 561 27 400 71 2005 13,898 1,908 14 511 27 378 74 2006 not available 1,818 not available 532 29 388 73 2007 not available 2,083 not available 597 29 421 71 2008 not available 2,468 not available 531 22 413 78 2009 not available 2,745 not available 516 19 392 76 2010 not available 3,264 not available 564 17 429 76
NUMBER OF FIRST-YEAR STUDENTS
*It is difficult to maintain an accurate count of “inquiries” as many students gather information about Berea College via the web. Source: Admissions Office, September 2010
424
356
396 400378 388
421 413392
429
0
50
100
150
200
250
300
350
400
450
2001 2002 2003 2004 2005 2006 2007 2008 2009 2010
Entering Fall Term

FIRST-YEAR STUDENTS: APPLIED, ACCEPTED AND ENROLLED
BY GENDER
Males
APPLIED ACCEPTED ENROLLED FALL % of % of
TERM N N Applications N Accepted
2001 843 257 31% 183 71% 2002 879 189 22 150 79 2003 897 217 24 156 72 2004 868 254 29 191 75 2005 861 218 25 159 73 2006 817 222 27 168 76 2007 892 236 27 169 72 2008 1,015 220 22 172 78 2009 1,107 216 20 171 79 2010 1,284 261 20 199 76
Females
APPLIED ACCEPTED ENROLLED FALL % of % of
TERM N N Applications N Accepted
2001 1,028 346 34% 241 70% 2002 1,095 291 27 206 71 2003 1,222 313 26 240 77 2004 1,242 310 25 209 67 2005 1,047 293 28 219 75 2006 1,001 310 31 220 71 2007 1,191 361 30 252 70 2008 1,453 311 21 241 78 2009 1,638 300 18 221 74 2010 1,980 303 15 230 76 NOTE: Inquiries cannot be accurately counted by gender since there is no way to determine gender through many types of inquiries.
Source: Admissions Office, September 2010

FIRST-YEAR STUDENTS: INQUIRIES, APPLIED, ACCEPTED, AND ENROLLED BY TERRITORY
IN-TERRITORY INQUIRIES* APPLIED ACCEPTED ENROLLED FALL % of % of % of TERM N N Inquiries N Applications N Accepted 2001 9,096 930 10% 466 50% 332 71 % 2002 8,983 1,022 11 362 35 274 76 2003 8,467 1,046 12 388 37 287 74 2004 8,098 1,060 13 422 40 298 71 2005 7,937 928 12 390 42 295 76 2006 not available 994 not available 410 41 294 72 2007 not available 1,172 not available 470 40 333 71 2008 not available 1,339 not available 382 29 303 79 2009 not available 1,468 not available 367 25 282 77 2010 not available 1,661 not available 413 25 315 76
OUT-OF-TERRITORY INQUIRIES* APPLIED ACCEPTED ENROLLED FALL % of % of % of TERM N N Inquiries N Applications N Accepted 2001 3,635 250 7% 103 41% 70 68% 2002 3,266 271 8 86 32 58 67 2003 3,996 357 9 106 30 80 75 2004 3,382 425 13 110 26 75 68 2005 2,523 295 12 89 30 63 71 2006 not available 282 not available 87 31 63 72 2007 not available 344 not available 97 28 66 68 2008 not available 490 not available 110 22 84 76 2009 not available 627 not available 112 18 86 77 2010 not available 749 not available 121 16 91 75
F-1 INTERNATIONAL** INQUIRIES* APPLIED ACCEPTED ENROLLED FALL % of % of % of TERM N N Inquiries N Applications N Accepted 2001 2,671 691 26% 34 5% 22 65% 2002 2,830 681 24 32 5 24 75 2003 2,877 716 25 36 5 29 81 2004 3,448 625 18 32 5 27 84 2005 3,438 685 20 32 5 20 63 2006 not available 542 not available 35 6 31 89 2007 not available 567 not available 30 5 22 73 2008 not available 639 not available 39 6 26 68 2009 not available 650 not available 37 6 24 65 2010 not available 854 not available 30 4 23 77 *It is difficult to maintain an accurate count of “inquiries” as many students gather information about Berea College via the web. **The category "F-1 International" does not include all students who come to the College from other countries or with substantial international experience. For example, "permanent residents" who may be asylees or refugees are counted as "In-Territory" or "Out-of-Territory" rather than "F-1 International" depending on residence at the time of application. These students are eligible for federal financial aid that F-1 International students cannot legally receive. In Fall 2010, five (5) first-year students were designated as a “permanent resident.” Source: Admissions Office, September 2010

FIRST-YEAR STUDENTS FROM KENTUCKY FALL TERMS 2001 – 2010
Total First-Year Kentucky First-Year Percent Kentucky Year Students Students First-Year Students of Total 2001 424 144 34.0% 2002 356 124 34.8 2003 396 130 32.8 2004 400 159 39.8 2005 378 146 38.6 2006 388 163 42.0 2007 421 196 46.6 2008 413 169 40.9 2009 392 169 43.1 2010 429 189 44.1
AFRICAN-AMERICAN* FIRST-YEAR STUDENTS
FALL TERMS 2001 – 2010
Percent Total First-Year African-American* African-American* of Total Year Students First-Year Students First-Year Students 2001 424 68 16.0% 2002 356 81 22.8 2003 396 67 16.9 2004 400 85 21.3 2005 378 75 19.8 2006 388 74 19.1 2007 421 75 17.8 2008 413 63 15.0 2009 392 81 20.7 2010 429 71 16.6 *The number of African-American students who identified themselves as “Black or African American” alone or in combination with another race. Source: Admissions Office, annual editions of the First-Year Student’s Class Profile

MEAN ACT COMPOSITE SCORES 2001 - 2010
Berea's First-Year Berea National Kentucky Year Students* Men Women Mean Mean 2001 23.3 22.7 23.8 21.0 20.1 2002 23.2 22.7 23.5 20.8 20.0 2003 23.0 22.8 23.1 20.8 20.2 2004 23.6 23.4 23.8 20.9 20.3 2005 23.0 22.6 23.3 20.9 20.4 2006 23.1 22.7 23.4 21.1 20.6 2007 23.1 22.7 23.3 21.2 20.7 2008 23.2 22.6 23.6 21.1 20.9 2009 23.5 23.0 23.9 21.1 19.4 2010 24.1 23.8 24.4 21.0 19.4 *Approximately 75 - 85% of Berea College first-year students submit ACT scores.
Mean ACT Composite Scores
02468
1012141618202224262830323436
2001 2002 2003 2004 2005 2006 2007 2008 2009 2010
Source: Admissions Office, annual editions of the First-Year Student’s Class Profile
Berea National Kentucky

ACT COMPOSITE SCORES OF ACCEPTED AND ENROLLED FIRST-YEAR STUDENTS
FALL 2010 Number Percent of Percent of Enrolled/ ACT Number Total Number Total Number Interval Accepted* Accepted Enrolled* Enrolled Accepted Less than 19 16 3.5% 11 3.3% 68.8% 19 - 21 100 22.1% 74 22.0% 74.0% 22 - 24 135 29.9% 106 31.5% 78.5% 25 - 26 86 19.0% 64 19.0% 74.4% 27 - 28 63 13.9% 43 12.8% 68.3% 29 and above 52 11.5% 38 11.3% 73.1% TOTAL 452 100.0% 336 100.0% 74.3%
ACT COMPOSITE SCORES ACCEPTED AND ENROLLED FIRST-YEAR STUDENTS
FALL 2010
*Total does not equal the number of first-year students because not all students submitted ACT scores. The total number accepted is 564 and the total number enrolled is 429. Source: Admissions Office, October 2010
0
20
40
60
80
100
120
140
160
Less than 19 19-21 22-24 25-26 27-28 29 and above
Nu
mb
er
of
Stu
de
nts
Composite ACT Score
Accepted
Enrolled

SAT VERBAL SCORES OF ACCEPTED AND ENROLLED FIRST-YEAR STUDENTS
FALL 2010 Number Percent of Percent of Enrolled/ SAT Verbal Number Total Number Total Number Interval Accepted* Accepted Enrolled* Enrolled Accepted Less than 480 21 16.3% 15 16.0% 71.4% 480 - 530 23 17.8% 17 18.1% 73.9% 540 - 590 20 15.5% 14 14.9% 70.0% 600 - 650 36 27.9% 28 29.8% 77.8% 660 - 710 24 18.6% 18 19.1% 75.0% 720 and above 5 3.9% 2 2.1% 40.0% TOTAL 129 100.0% 94 100.0% 72.9%
SAT VERBAL SCORES ACCEPTED AND ENROLLED FIRST-YEAR STUDENTS
FALL 2010
*Total does not equal the number of first-year students because not all students submitted SAT scores. The total number accepted is 564 and the total number enrolled is 429. Source: Admissions Office, October 2010
0
5
10
15
20
25
30
35
40
45
Less than 480 480-530 540-590 600-650 660-710 720 and above
Nu
mb
er
of
Stu
de
nts
SAT Verbal Score
Accepted
Enrolled

SAT MATHEMATICS SCORES OF ACCEPTED AND ENROLLED FIRST-YEAR STUDENTS
FALL 2010 Number Percent of Percent of Enrolled/ SAT Mathematics Number Total Number Total Number Interval Accepted* Accepted Enrolled* Enrolled Accepted Less than 480 25 19.4% 18 19.1% 72.0% 480 - 530 27 20.9% 18 19.1% 66.7% 540 - 590 41 31.8% 33 35.1% 80.5% 600 - 650 26 20.2% 17 18.1% 65.4% 660 - 710 10 7.8% 8 8.5% 80.0% 720 and above 0 0.0% 0 0.0% n/a TOTAL 129 100.0% 94 100.0% 72.9%
SAT MATHEMATICS SCORES ACCEPTED AND ENROLLED FIRST-YEAR STUDENTS
FALL 2010
*Total does not equal the number of first-year students because not all students submitted SAT scores. The total number accepted is 564 and the total number enrolled is 429. Source: Admissions Office, October 2010
0
5
10
15
20
25
30
35
40
45
Less than 480 480-530 540-590 600-650 660-710 720 and above
Nu
mb
er
of
Stu
de
nts
SAT Mathematics Score
Accepted
Enrolled

SAT WRITING SCORES OF ACCEPTED AND ENROLLED FIRST-YEAR STUDENTS
FALL 2010
Number Percent of Percent of Enrolled/ SAT Writing Number Total Number Total Number Interval Accepted* Accepted Enrolled* Enrolled Accepted Less than 480 27 20.9% 21 22.3% 77.8% 480 - 530 31 24.0% 25 26.6% 80.6% 540 - 590 32 24.8% 24 25.5% 75.0% 600 - 650 23 17.8% 16 17.0% 69.6% 660 - 710 13 10.1% 6 6.4% 46.2% 720 and above 3 2.3% 2 2.1% 66.7% TOTAL 129 100.0% 94 100.0% 72.9%
SAT WRITING SCORES ACCEPTED AND ENROLLED FIRST-YEAR STUDENTS
FALL 2010
*Total does not equal the number of first-year students because not all students submitted SAT scores. The total number accepted is 564 and the total number enrolled is 429. Source: Admissions Office, October 2010
0
5
10
15
20
25
30
35
40
45
Less than 480 480-530 540-590 600-650 660-710 720 and above
Nu
mb
er
of
Stu
de
nts
SAT Writing Score
Accepted
Enrolled

FIRST-YEAR STUDENTS RANKED IN THE TOP ONE-FIFTH OF THEIR HIGH SCHOOL CLASS BY GENDER AND COHORT TYPE
2006 - 2010
*Based on students who identified themselves as “Black or African American” alone or in combination with another race. NOTE: Approximately 80 – 85% of first-year students come from high schools where rank in class is reported. International students are not included in the graphs above. Source: Admissions Office, annual editions of First-Year Student’s Class Profile
55% 54% 55% 56% 57%
0%
10%
20%
30%
40%
50%
60%
70%
80%
90%
100%
2006 2007 2008 2009 2010
44%38%
43% 44%48%
63% 65% 63% 64% 65%
0%
10%
20%
30%
40%
50%
60%
70%
80%
90%
100%
2006 2007 2008 2009 2010
Males
Females
46% 46% 50%57%
48%57% 54% 56% 56% 59%
0%10%
20%30%40%
50%60%70%
80%90%
100%
2006 2007 2008 2009 2010
African-Americans*
Other Domestic Students
All First-Year Students By Gender
By Cohort Type

FIRST-YEAR STUDENTS ASSIGNED TO DEVELOPMENTAL MATHEMATICS COURSESFALL TERMS 2001 - 2010
NOTE: The number on the top of the bar indicates the percentage of first-year students needing any developmental mathematics.
Source: Academic Services, October 2010
19.1% 18.5% 19.2% 18.3%25.4%
19.3% 18.5% 17.9% 18.6%13.8%
6.4% 9.6% 7.6%5.0%
7.4%
4.8% 6.4% 5.3% 6.1%
5.4%
5.4% 5.8% 5.9%
6.5%
0%
10%
20%
30%
40%
50%
60%
70%
80%
90%
100%
2001(N=424)
2002(N=356)
2003(N=396)
2004(N=400)
2005(N=378)
2006(N=388)
2007(N=421)
2008(N=413)
2009(N=392)
2010 (N=429)
Year (Number of First-Year Students)
Mathematics 012 Only (Category added in 2006)
Mathematics 010, 011, and 012
Mathematics 011/012 Only
Mathematics 010 Only (generally zero or one student)
25.5%28.1%
23.3%
32.8%28.9%
34.7%
29.1%
In 2005, the cut-off for waiving Developmental Math was raised by one ACT point (from 19 to 20).
26.8% 9.7%
30.6%
25.6%

FINANCIAL NEED OF ENTERING FIRST-YEAR STUDENTS:Federal Pell Grant Recipients
Source: Office of Institutional Research and Assessment, October 2010
82%
86%89%
86% 87% 85%
81%
86%
95%98%
0%
10%
20%
30%
40%
50%
60%
70%
80%
90%
100%
2001 2002 2003 2004 2005 2006 2007 2008 2009 2010
Entering Fall Term
Ten-Year Average: 88%
NOTE: International students are not included in this chart.

FIRST-YEAR STUDENT ENROLLMENT TRENDS
*Includes Permanent Residents (non-citizens, including refugees and asylees who have formally established residency in the U.S.) and U.S. citizens living in foreign countries NOTE: African-American students are based on those students who identified themselves as “Black or African American” alone or in combination with another race. Source: Office of Institutional Research and Assessment, October 2010
43% 45% 42% 43% 42% 43% 40% 42% 44% 46%
57% 55% 58% 57% 58% 57% 60% 58% 56% 54%
0%
10%
20%
30%
40%
50%
60%
70%
80%
90%
100%
2001 2002 2003 2004 2005 2006 2007 2008 2009 2010
First-Year Enrollment by Gender
Males Females
Entering Year
16% 14% 16%23% 20% 19% 18% 15% 21% 17%
78% 80% 79% 70% 75% 73% 77% 75% 73% 78%
5% 5% 5% 7% 5% 8% 5% 5% 6% 5%
0%
10%
20%
30%
40%
50%
60%
70%
80%
90%
100%
2001 2002 2003 2004 2005 2006 2007 2008 2009 2010
First-Year Enrollment by Cohort Type
African-American Students* All Other Students*(Excluding F-1 International)
F-1 International Students
Entering Year

First-Year Student Enrollment Trends, continued
Source: Office of Institutional Research and Assessment, October 2010.
78%80%
77% 77% 78%76%
79%
74%72% 73%
17% 15%16% 16%
17%16%
16%
20% 22% 21%
5% 6% 7% 7% 5%8%
5% 6% 6% 5%
0%
10%
20%
30%
40%
50%
60%
70%
80%
90%
100%
2001 2002 2003 2004 2005 2006 2007 2008 2009 2010
First-Year Student Enrollment by Territory
In-Territory Out-of-Territory F-1 International
Entering Year

NEW TRANSFER STUDENTS: APPLIED, ACCEPTED, AND ENROLLED
APPLIED ACCEPTED ENROLLED FALL % of % of TERM N N Applications N Accepted 2001 267 40 15 % 29 73 % 2002 264 33 13 24 73 2003 297 30 10 22 73 2004 289 32 11 24 75 2005 120 32 27 27 84 2006 154 27 18 21 78 2007 140 30 21 21 70 2008 266 29 11 26 90 2009 364 38 10 28 74 2010 428 92 21 77 84
NUMBER OF NEW TRANSFER STUDENTS
Source: Admissions Office, annual editions of the Transfer Student’s Class Profile
2924 22 24
2721 21
26 28
77
0
10
20
30
40
50
60
70
80
90
100
2001 2002 2003 2004 2005 2006 2007 2008 2009 2010
Entering Fall Term

NEW TRANSFER STUDENTS: APPLIED, ACCEPTED, AND ENROLLED
BY GENDER
Males APPLIED ACCEPTED ENROLLED FALL % of % of TERM N N Applications N Accepted 2001 130 19 15 % 14 74 % 2002 141 15 11 8 53 2003 128 14 11 11 79 2004 141 16 11 12 75 2005 56 17 30 15 88 2006 65 15 23 12 80 2007 65 12 18 8 67 2008 121 12 10 10 83 2009 146 21 14 15 71 2010 165 37 22 33 89
Females
APPLIED ACCEPTED ENROLLED FALL % of % of TERM N N Applications N Accepted 2001 137 21 15 % 15 71 % 2002 123 18 15 16 89 2003 169 16 9 11 69 2004 148 16 11 12 75 2005 64 15 23 12 80 2006 89 12 13 9 75 2007 75 18 24 13 72 2008 145 17 12 16 94 2009 218 17 8 13 76 2010 263 55 21 44 80
Source: Admissions Office, annual editions of the Transfer Student’s Class Profile

FALL TERM NEW TRANSFER STUDENT ENROLLMENT TRENDS
Source: Office of Institutional Research and Assessment, October 2010
New Transfer Student Enrollment by Gender
New Transfer Student Enrollment by Territory
48%
33%
50% 50%56% 57%
38% 38%
54%
43%
52%
67%
50% 50%44% 43%
62% 62%
46%
57%
0%
10%
20%
30%
40%
50%
60%
70%
80%
90%
100%
2001 2002 2003 2004 2005 2006 2007 2008 2009 2010
Male Female
Entering Year
38%29%
50%
38%
26%
38%33% 31%
50%
38%
28% 46%14%
63%
33%
19%24% 27%
18%
18%
21%
25%
36%
33%43% 43% 38%
32%
44%
14%7% 4%
0%
10%
20%
30%
40%
50%
60%
70%
80%
90%
100%
2001 2002 2003 2004 2005 2006 2007 2008 2009 2010
Kentucky In-Territory (not KY) Out-of-Territory F-1 International
Entering Year

FALL 2010 ENROLLMENT CATEGORY HIGHLIGHTS
All Degree-Seeking First-Year Students New Transfer Students N = 1,552 N = 429 N = 77 Gender Male 640 41% 199 46% 33 43% Female 912 59% 230 54% 44 57% Territory In-Territory 1,092 70% 315 74% 43 56% Out-of-Territory 357 23% 91 21% 34 44% F-1 International 103 7% 23 5% 0 0% Students with International Experience 137 9% 28 7% 2 3%
NOTE: There were also eleven (11) F-1 International students enrolled as exchange students (non-degree-seeking) this Fall Term. Ethnic and Racial Breakdowns* Hispanic or Latino or Spanish Origin 26 2% 12 3% 3 4%
Black or African American 266 17% 71 17% 3 4% Other minorities 72 5% 21 5% 3 4% White 1,038 67% 309 72% 59 77% Unknown 176 11% 28 7% 12 16% *As requested by and reported to the Federal Government – IPEDS. Definitions: In-Territory: Students who come from much of the Appalachian region and all of Kentucky. In-Territory also includes permanent residents (a non-citizen who has formally established residency in the United States) and refugees who reside in the territory. Out-of-Territory: Students who come from outside the In-Territory area, including U.S. Citizens living in foreign countries. Out-of-Territory also includes permanent residents (a non-citizen who has formally established residency in the U.S.) and refugees who reside out of the territory. F-1 International: Students who are not U.S. Citizens, permanent residents, or refugees. Students With International Experience: All students who are classified as "F-1 International" and other students who are classified as "permanent residents" (students who may be asylees or refugees). Black or African American: Students (not F-1 International students) who identified themselves as “Black or African American” alone or in combination with another race. Other Minorities: Students (not F-1 International students) who identified themselves as "American Indian or Alaskan Native," "Asian," or “Native Hawaiian or Other Pacific Islander" alone or in combination with each other. Unknown: Students who chose not to identify their race on their admissions application and all F-1 International students because they are not coded on the basis of race/ethnicity.
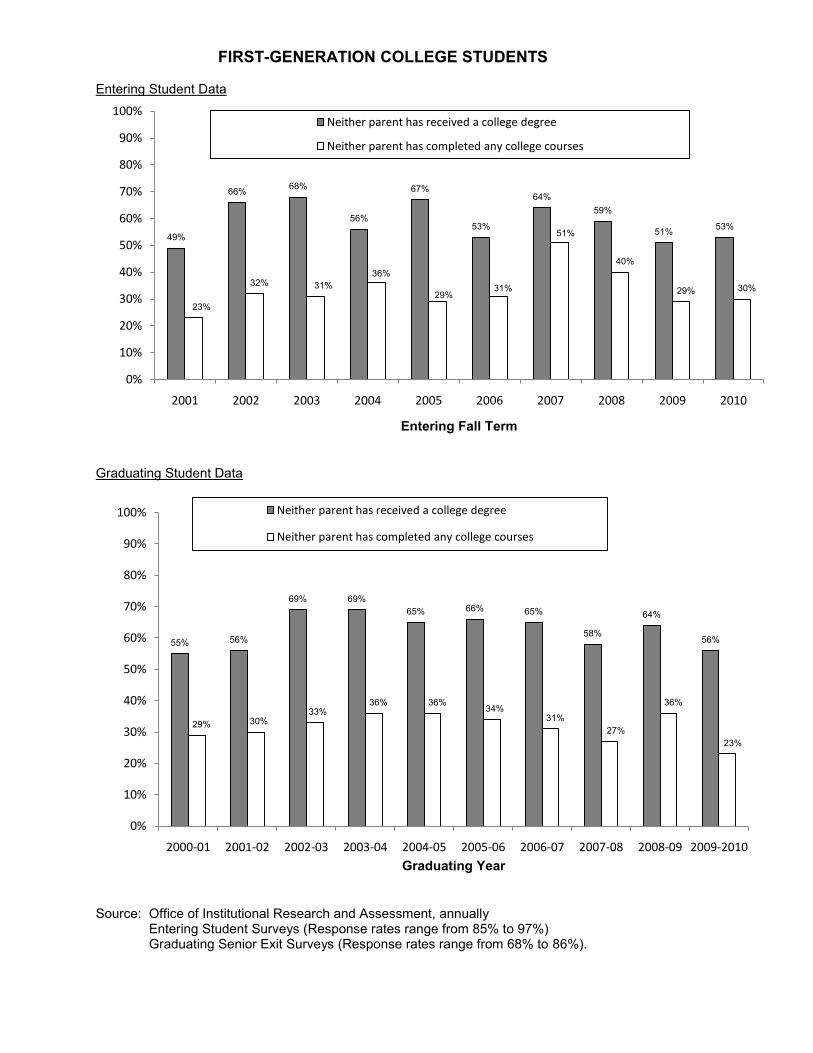
FIRST-GENERATION COLLEGE STUDENTS
Entering Student Data
Graduating Student Data
Source: Office of Institutional Research and Assessment, annually Entering Student Surveys (Response rates range from 85% to 97%) Graduating Senior Exit Surveys (Response rates range from 68% to 86%).
49%
66% 68%
56%
67%
53%
64%59%
51% 53%
23%
32% 31%36%
29%31%
51%
40%
29% 30%
0%
10%
20%
30%
40%
50%
60%
70%
80%
90%
100%
2001 2002 2003 2004 2005 2006 2007 2008 2009 2010
Entering Fall Term
Neither parent has received a college degree
Neither parent has completed any college courses
55% 56%
69% 69%65% 66% 65%
58%
64%
56%
29% 30%33%
36% 36%34%
31%27%
36%
23%
0%
10%
20%
30%
40%
50%
60%
70%
80%
90%
100%
2000-01 2001-02 2002-03 2003-04 2004-05 2005-06 2006-07 2007-08 2008-09 2009-2010
Graduating Year
Neither parent has received a college degree
Neither parent has completed any college courses

FALL HEADCOUNT ENROLLMENT *
*Includes Full and Part-Time Students. Source: Office of Institutional Research and Assessment, October 2010
2001 2002 2003 2004 2005 2006 2007 2008 2009 2010Non-Degree-Seeking 55 54 48 42 72 56 54 58 52 61Degree-Seeking 1618 1524 1511 1514 1523 1520 1528 1491 1496 1552
16181524 1511 1514 1523 1520 1528 1491 1496 1552
55
54 48 42 72 56 5458 52
61
0
100
200
300
400
500
600
700
800
900
1000
1100
1200
1300
1400
1500
1600
1700
1800
Fall Term
1,6131,673
1,578 1,559 1,5561,595 1,576 1,582 1,549 1,548

FALL ENROLLMENTS BY CLASSIFICATION 2006 - 2010
Source: Academic Services, October 2010
2006 2007 2008 2009 2010 Total (Full-Time and Part-Time)* Freshman 472 498 491 458 506 First-Year Students (388) (421) (413) (392) (429) Other** Freshmen (84) (77) (78) (66) (77) Sophomore 334 354 336 356 346 Junior 338 313 339 320 336 Senior 376 363 325 362 364 TOTAL DEGREE-SEEKING STUDENTS 1,520 1,528 1,491 1,496 1,552 Berea Community School 23 25 27 20 23 Madison Southern High School 7 8 4 11 9 College Employee 2 3 4 3 1 Community (Special) 14 13 12 8 16 Post Graduate 0 0 0 0 0 Transient/Exchange 10 5 11 10 11 EKU Exchange n/a n/a n/a n/a 1 TOTAL NON-DEGREE-SEEKING STUDENTS 56 54 58 52 61 TOTAL HEADCOUNT 1,576 1,582 1,549 1,548 1,613 *For a breakdown of full and part-time students, please see the next page. NOTE: For Fall 2010, there were eleven first-year students “officially” classified as sophomores, and two first-year students “officially” classified as juniors. For Fall 2009, there were four first-year students “officially” classified as sophomores. For Fall 2008, there were two first-year students “officially” classified as sophomores. For Fall 2007, there were six first-year students “officially” classified as sophomores and one as a junior. For Fall 2006, there were four first-year students “officially” classified as sophomores and one as a junior. Definitions: Full-time Student - A student who has a 3 to 4 1/2 credits course load. Part-time Student - A student who is registered for less than 3 credits course load. First-Year Students - Students who have enrolled at Berea College for the first time and did not transfer from another institution. **Other Freshmen - Includes continuing (students who were enrolled at Berea during the previous term), returning (students previously enrolled, withdrew, and subsequently accepted for readmission), and transfer students (students who have been enrolled at another post secondary institution) who are classified as freshman. Non-Degree-Seeking Classifications: Berea Community School or Madison Southern High School- Junior and senior high school students who take no more than two courses per term at Berea College upon the recommendation of their Guidance Counselor and concurrence of the Associate Provost. Community (Special) - Non-degree-seeking students who wish to take courses for personal enrichment or for limited educational gain. Transient/Exchange - Transient students are students who take courses at Berea College to transfer back to their home institution. Exchange students are enrolled at Berea full-time under an exchange agreement with another institution. EKU Exchange - Exchange students are enrolled at Berea part-time under an exchange agreement with Eastern Kentucky University (EKU) in Richmond, KY. Post Graduate - A student attending Berea College full-time after earning a baccalaureate degree who is not seeking an additional degree.

FALL ENROLLMENTS BY CLASSIFICATION (Continued)
2006 2007 2008 2009 2010 Full-Time Students Freshman 472 498 491 458 506 First-Year Students (388) (421) (413) (392) (429) Other** Freshmen (84) (77) (78) (66) (77) Sophomore 334 354 336 355 345 Junior*** 338 313 338 320 336 Senior 372 362 323 362 364 TOTAL DEGREE-SEEKING FULL-TIME STUDENTS 1,516 1,527 1,488 1,495 1,551 Berea Community School 0 0 1 0 2 Madison Southern High School 1 0 0 0 0 College Employee 0 0 0 0 0 Community (Special) 1 1 0 0 0 Post Graduate 0 0 0 0 0 Transient/Exchange 9 4 7 6 11 EKU Exchange n/a n/a n/a n/a 0 TOTAL NON-DEGREE-SEEKING FULL-TIME STUDENTS 11 5 8 6 13 TOTAL FULL-TIME STUDENTS 1,527 1,532 1,496 1,501 1,564 --------------------------------------------------------------------------------------------------------------------------------------------- Part-Time Students Freshman 0 0 0 0 0 First-Year Students (0) (0) (0) (0) (0) Other** Freshmen (0) (0) (0) (0) (0) Sophomore 0 0 0 1 1 Junior*** 0 0 1 0 0 Senior 4 1 2 0 0 TOTAL DEGREE-SEEKING PART-TIME STUDENTS 4 1 3 1 1 Berea Community School 23 25 26 20 21 Madison Southern High School 6 8 4 11 9 College Employee 2 3 4 3 1 Community (Special) 13 12 12 8 16 Post Graduate 0 0 0 0 0 Transient/Exchange 1 1 4 4 0 EKU Exchange n/a n/a n/a n/a 1 TOTAL NON-DEGREE-SEEKING PART-TIME STUDENTS 45 49 50 46 48 TOTAL PART-TIME STUDENTS 49 50 53 47 49 FTE ENROLLMENT 1,546 1,553 1,518 1,517 1,585 **Other freshmen includes continuing (students who were enrolled at Berea during the previous term), returning (students previously enrolled, withdrew, and subsequently accepted for readmission), and transfer students (students who have been enrolled at another post secondary institution) who are classified as freshman. NOTE: FTE (Full-Time Equivalent) Enrollment is calculated by equating part-time students to full-time status (enrolled in at least a 3 credit course load). FTE for each part-time student is determined by dividing the total number of courses taken by 3. Our current part-time enrollment of 49 students has a FTE of 20.66. Source: Academic Services, October 2010

DEGREE-SEEKING STUDENTS: F-1 INTERNATIONAL AND THOSE WITH INTERNATIONAL EXPERIENCE* FALL TERMS 2001 – 2010 International Experience* Total F-1 International Students Degree-Seeking Students (Includes F-1 International) Year Students N % of Total N % of Total 2001 1,619 102 6.3 % 127 8.0 % 2002 1,524 101 6.7 126 8.0 2003 1,511 113 7.5 145 10.0 2004 1,514 110 7.3 157 10.0 2005 1,523 109 7.2 149 10.0 2006 1,520 121 8.0 162 11.0 2007 1,528 106 6.9 146 10.0 2008 1,491 111 7.4 146 9.8 2009 1,496 112 7.5 141 9.4 2010 1,552 103 6.6 137 8.8 *Students who are classified as “F-1 international” and other students who are classified as “permanent residents” (students who may be asylees or refugees). In addition, there were 11 F-1 International Students enrolled as exchange students (non-degree-seeking) in Fall 2010.
AFRICAN-AMERICAN** DEGREE-SEEKING STUDENTS FALL TERMS 2000 – 2010
Total Percent Degree-Seeking African-American African-American Year Students Students** Students** of Total 2001 1,619 237 15.0% 2002 1,524 257 17.0 2003 1,511 260 17.0 2004 1,514 283 19.0 2005 1,523 283 19.0 2006 1,520 278 18.0 2007 1,528 273 18.0 2008 1,491 253 17.0 2009 1,496 273 18.2 2010 1,552 266 17.1 **Students who identified themselves as “Black or African American” alone or in combination with another race.
Source: Office of Institutional Research and Assessment, October 2010

FALL 2010 ENROLLMENT BY STATE AND U.S. TERRITORIES
Degree-Seeking Students: Alabama 86 (5%) Missouri 7 (*) Alaska 3 (*) Montana 1 (*) Arizona 1 (*) Nebraska 1 (*) Arkansas 6 (*) Nevada 5 (*) California 7 (*) New Jersey 5 (*) Colorado 4 (*) New Mexico 1 (*) Connecticut 1 (*) New York 10 (1%) Delaware 2 (*) North Carolina 72 (4%) Florida 12 (1%) North Dakota 1 (*) Georgia 51 (3%) Ohio 152 (9%) Guam 1 (*) Oregon 4 (*) Hawaii 2 (*) Pennsylvania 12 (1%) Idaho 2 (*) Rhode Island 1 (*) Illinois 15 (1%) South Carolina 21 (1%) Indiana 19 (1%) South Dakota 1 (*) Iowa 1 (*) Tennessee 133 (8%) Kentucky 640 (40%) Texas 9 (1%) Louisiana 2 (*) Vermont 6 (*) Maine 3 (*) Virginia 55 (3%) Maryland 6 (*) Washington 3 (*) Massachusetts 6 (*) West Virginia 42 (3%) Michigan 20 (1%) Wisconsin 5 (*) Mississippi 3 (*) Sub-Total (44 states, 1 territory) 1,440 (89%) Students Enrolled from Outside the U.S. and/or Its Territories (For more detail, see the following page.) 112 (7%) Total Degree-Seeking Students 1,552 (96%) Non-Degree-Seeking Students: Berea Community School 23 College Employee 1 Community (Special) 16 EKU Exchange 1 Madison Southern High School 9 Transient/Exchange 11 Sub-Total 61 Total Non-Degree-Seeking Students 61 (4%) TOTAL HEADCOUNT ENROLLMENT 1,613 (100%) *Denotes percentages less than 1. NOTE: For the degree-seeking students above, the states and U.S. territories are determined by the address given at the time of acceptance to the College. "Students enrolled from outside the U.S. and/or Its Territories," therefore include more students than those classified as "F-1 International." Source: Office of Institutional Research and Assessment, Geographical Report, October 2010. For more details visit < http://www.berea.edu/ira/georeports.asp >.

FALL 2010 ENROLLMENT BY COUNTRY ORGANIZED BY CONTINENT
Degree-Seeking Students: Africa (16 countries)
Asia, continued
Botswana 1 (1%) Vietnam 4 (4%) Burkina Faso 1 (1%) West Bank 1 (1%) Cameroon 4 (4%) Yemen 2 (2%) Dem. Rep. of the Congo 2 (2%) Asia Total 52 (46%) Eritrea 2 (2%) Ethiopia 1 (1%) Europe (8 countries) Ghana 1 (1%) Kenya 4 (4%) Albania 1 (1%) Liberia 1 (1%) Azerbaijan 1 (1%) Malawi 2 (2%) Georgia 2 (2%) Morocco 1 (1%) Kosovo 1 (1%) Nigeria 5 (4%) Montenegro 1 (1%) Rwanda 2 (2%) Romania 1 (1%) Sudan 1 (1%) Slovak Republic 1 (1%) Uganda 1 (1%) United Kingdom 1 (1%) Zimbabwe 7 (6%) Europe Total 9 (8%)
Africa Total 36 (32%) North America (6 countries)
Asia (24 countries) Dominica 1 (1%) Afghanistan 2 (2%) Guatemala 1 (1%) Bangladesh 2 (2%) Haiti 4 (4%) Burma 7 (6%) Jamaica 1 (1%) China 2 (2%) Mexico 1 (1%) India 3 (3%) Trinidad and Tobago 1 (1%) Indonesia 1 (1%) North America Total 9 (8%) Iraq 2 (2%) Japan 2 (2%) South America (4 countries) Kyrgyzstan 1 (1%) Lebanon 1 (1%) Bolivia 1 (1%) Malaysia 1 (1%) Brazil 2 (2%) Nepal 1 (1%) Columbia 2 (2%) Pakistan 3 (3%) Ecuador 1 (1%) Republic of Korea 1 (1%) South America Total 6 (5%) Russia 1 (1%) Sri Lanka 1 (1%) Taiwan 1 (1%) Tibet, The Former 7 (6%) Turkey 1 (1%) (58 Countries represented) Turkmenistan 3 (3%) Uzbekistan 2 (2%) TOTAL OF ALL COUNTRIES 112 (100%) NOTE: For the degree-seeking students above, the countries are determined by the address given at the time of acceptance to the College. The one-hundred-twelve (112) students above include more students than those classified as "F-1 International" and represent approximately 7% of the total degree-seeking enrollment. Source: Office of Institutional Research and Assessment, Geographical Report, October 2010. For more details visit < http://www.berea.edu/ira/georeports.asp> and <http://www.worldatlas.com/cntycont.htm>.

FALL ENROLLMENTS OF DEGREE-SEEKING STUDENTS BY TERRITORY
2006 - 2010
2006 2007 2008 2009 2010 Berea's Territory* 1,198 1,118 1,082 1,067 1,092 Prior to 1976 expansion 69% 68% 69% 69% 65% Counties Added in 1976 & 1978 29% 29% 29% 29% 32% Hamilton Co, Ohio added in 1996 3% 3% 2% 3% 3% Out-of-Territory* 301 304 298 317 357 F-1 International*** 121 106 111 112 103 TOTAL 1,520 1,528 1,491 1,496 1,552 *For a complete description of Berea's Territory and its changes, please see pages 30 - 32. Berea's Territory also includes permanent residents (a non-citizen who has formally established residency in the United States) and refugees who reside in the territory. **The "Out-of-Territory" classification includes students who come from outside Berea's Territory, including U.S. citizens living in foreign countries. "Out-of-Territory" also includes permanent residents (a non-citizen who has formally established residency in the United States) and refugees who reside out of the territory. ***The category "F-1 International" does not include all students who come to the College from other countries or with substantial international experience. For example, "permanent residents" who may be asylees or refugees are counted as "In-Territory" or "Out-of-Territory" rather than "F-1 International" depending on residence at the time of application. These students are eligible for federal financial aid that F-1 International students cannot legally receive. In Fall 2010, thirty-four (34) Berea College students were designated as "permanent residents." NOTE: This table does not include non-degree-seeking students: community (special) students, employees, transient/exchange, post-graduates, EKU exchange students, Berea Community School students, or Madison Southern High School students.
Source: Office of Institutional Research and Assessment, annual editions of The Geographical Report, <http://www.berea.edu/ira/georeports.asp>
International, 6.6%
In-Territory,70.4%
Out-of-Territory,23.0%

FALL ENROLLMENTS OF DEGREE-SEEKING STUDENTS BY RACE/ETHNICITY* 2006 - 2010
2006 2007 2008 2009 2010* N (%) N (%) N (%) N (%) N (%) Black or African American ** 278 (18%) 273 (18%) 253 (17%) 273 (18%) 266 (17%) Pre-2010 Category: African-American (Non-Hispanic)
American Indian or Alaskan Native 11 (1%) 12 (1%) 18 (1%) 11 (1%) 7 (0.5%) Asian 21 (1%) 24 (2%) 22 (1%) 21 (1%) 16 (1%) Pre-2010 Category: Asian or Pacific Islander Native Hawaiian or Pacific Islander not available not available not available not available 1 (0.06%) Hispanic 24 (2%) 29 (2%) 33 (2%) 39 (3%) (see note below) White 1,037 (68%) 1,051 (69%) 1,016 (68%) 1,010 (68%) 1,038 (67%) Pre-2010 Category: White (Non-Hispanic) Students who chose not to respond/ Race unknown 28 (2%) 33 (2%) 38 (3%) 30 (2%) 73 (5%) Two or more races indicated*** not available not available not available not available 48 (3%) F-1 International Students 121 (8%) 106 (7%) 111 (7%) 112 (7%) 103 (7%) TOTAL 1,520 (100%) 1,528 (100%) 1,491 (100%) 1,496 (100%) 1,552 (100%) NOTES: Twenty-six (26) or 2% of students indicated that they were “Hispanic or Latino or of Spanish origin.” Percentages may not equal 100% due to rounding. *Categories changed as mandated by the Federal Government; students were asked to answer questions about ethnicity (Hispanic or not) and race (choose one or more). Please see page 60 for more details for Fall Term 2010. **Based on the number of students who identified themselves as “Black or African American” alone or in combination with another race. ***Based on students who selected more than one race, but not “Black or African American.” Source: Office of Institutional Research and Assessment, September 2010

Fall 2010 Enrollment of Degree-Seeking Students by Ethnic and Racial Breakdowns
Compiled by the Office of Institutional Research and Assessment, October 2010
Ethnic and Racial Breakdown (as requested by and reported to the federal government – IPEDS)
Ethnicity Breakdown for All Students (N = 1,552) Hispanic or Latino or Spanish Origin 26 1.7% Not Hispanic or Latino or Spanish Origin 1,224 80.2% Chose not to respond (N = 179) and International Students (N = 103) 282 18.2% Racial Breakdown F-1 International (racial breakdown not collected) 103 6.6% Chose not to respond (Race unknown) 73 4.7% American Indian or Alaska Native 7 0.5% Asian 16 1.0% Black or African American 228 14.7% Native Hawaiian or Other Pacific Islander 1 0.1% White 1,038 66.9% Two or more races indicated 86 5.5% American Indian/Alaska Native and Asian and Black/African American and Native Hawaiian/Other Pacific Islander and White (4) American Indian/Alaska Native and Asian and White (3) American Indian/Alaska Native and Black/African American (1) American Indian/Alaska Native and Black/African and Native Hawaiian/Other Pacific Islander and White (2) American Indian/Alaska Native and Black/African American and White (9) American Indian/Alaska Native and White (31) Asian and Black/African American (2) Asian and Black/African American and White (1) Asian and Native Hawaiian/Other Pacific Islander and White (1) Asian and Native Hawaiian/Other Pacific Islander (1) Asian and White (11) Black/African American and Native Hawaiian/Other Pacific Islander and White (1) Black/African American and White (18) Native Hawaiian/Other Pacific Islander and White (1) TOTAL 1,552 100.0% NOTE: The total number of students who identified themselves as “Black or African American” alone or in combination with another race is 266 (17.1%).

FALL ENROLLMENTS OF DEGREE-SEEKING STUDENTS BY AGE* 2006 – 2010
2006 2007 2008 2009 2010 Age* N (%) N (%) N (%) N (%) N (%) Less than 18 years old 37 (2%) 37 (2%) 37 (2%) 16 (1%) 43 (3%) 18 – 19 years old 642 (42%) 662 (43%) 656 (44%) 622 (42%) 662 (43%) 20 – 21 years old 578 (38%) 605 (40%) 565 (38%) 575 (38%) 563 (36%) 22 – 24 years old 172 (11%) 149 (10%) 157 (11%) 201 (13%) 184 (12%) 25 – 29 years old 57 (4%) 43 (3%) 49 (3%) 50 (3%) 63 (4%) 30 – 34 years old 17 (1%) 13 (1%) 13 (1%) 15 (1%) 18 (1%) 35 – 39 years old 2 (**) 4 (**) 4 (**) 6 (**) 7 (**) 40 – 49 years old 10 (1%) 9 (1%) 7 (**) 7 (**) 11 (1%) 50 – 64 years old 5 (**) 6 (**) 3 (**) 4 (**) 1 (**) Greater than 65 years old 0 (0%) 0 (0%) 0 (0%) 0 (0%) 0 (0%) TOTAL 1,520 (100%) 1,528 (100%) 1,491 (100%) 1,496 (100%) 1,552 (100%) *Age is as of the first day of classes in September. **Denotes percentages less than 1. NOTE: Percentages may not equal 100% due to rounding. Source: Office of Institutional Research and Assessment, September 2010

FALL 2010 JUNIOR AND SENIOR ENROLLMENT BY MAJOR AND COHORT TYPE
*Based on students who indentified themselves as “Black or African American” alone or in combination with another race. **Denotes percentages less than 1. Note: These are duplicate headcounts that include double degrees and double majors. The 750 majors represent 702 junior and senior students enrolled in Fall 2010. Compiled by: Office of Institutional Research and Assessment, November 2010.
African-American* All Other Domestic F-1 International Total N (%) N (%) N (%) N (%)
African and African American Studies 4 (3%) 1 (**) 0 (0%) 5 (1%) Agriculture and Natural Resources 0 (0%) 22 (4%) 0 (0%) 22 (3%) Applied Science and Mathematics 2 (2%) 2 (**) 0 (0%) 4 (1%) Art and Art History 2 (2%) 26 (5%) 1 (1%) 29 (4%) Asian Studies 0 (0%) 9 (2%) 0 (0%) 9 (1%) Biology 7 (6%) 33 (6%) 2 (3%) 42 (6%) Business Administration 6 (5%) 36 (6%) 14 (21%) 56 (7%) Chemistry 3 (2%) 13 (2%) 7 (10%) 23 (3%) Child and Family Studies 5 (4%) 33 (6%) 0 (0%) 38 (5%) Communication 8 (6%) 12 (2%) 2 (3%) 22 (3%) Computer and Information Science 3 (2%) 10 (2%) 4 (6%) 17 (2%) Economics 1 (1%) 0 (0%) 5 (7%) 6 (1%) Education Studies – General 2 (2%) 9 (2%) 2 (3%) 13 (2%) Education Studies – Middle Grades 5-9 0 (0%) 3 (1%) 0 (0%) 3 (**) Education Studies – Elementary Education 3 (2%) 31 (6%) 1 (1%) 35 (5%) 3-2 Engineering 0 (0%) 2 (**) 0 (0%) 2 (**) English 5 (4%) 40 (7%) 0 (0%) 45 (6%) Foreign Languages French 1 (1%) 1 (**) 0 (0%) 2 (*) German 0 (0%) 5 (1%) 1 (1%) 6 (1%) Spanish 1 (1%) 11 (2%) 0 (0%) 12 (2%) History 4 (3%) 19 (3%) 0 (0%) 23 (3%) Independent 4 (3%) 15 (3%) 0 (0%) 19 (3%) Mathematics 3 (2%) 14 (3%) 10 (15%) 27 (4%) Music 5 (4%) 14 (3%) 0 (0%) 19 (3%) Nursing 7 (6%) 32 (6%) 5 (7%) 44 (6%) Philosophy 3 (2%) 4 (1%) 0 (0%) 7 (1%) Physical Education 9 (7%) 22 (4%) 1 (1%) 32 (4%) Physics 1 (1%) 2 (**) 4 (6%) 7 (1%) Political Science 3 (2%) 14 (3%) 4 (6%) 21 (3%) Psychology 5 (4%) 25 (4%) 2 (3%) 32 (4%) Religion 2 (2%) 7 (1%) 0 (0%) 9 (1%) Sociology 5 (4%) 12 (2%) 1 (1%) 18 (2%) Technology and Industrial Arts 9 (7%) 31 (6%) 0 (0%) 40 (5%) Theatre 4 (3%) 15 (3%) 1 (1%) 20 (3%) Women’s Studies 2 (2%) 6 (1%) 0 (0%) 8 (1%) Undecided 7 (6%) 26 (5%) 0 (0%) 33 (4%) TOTAL 126 (100%) 557 (100%) 67 (100%) 750 (100%)

FALL ENROLLMENT TRENDS
Source: Office of Institutional Research and Assessment, September 2010
43% 44%41% 39% 41% 40% 40% 40% 41% 41%
57% 56%59% 61% 59% 60% 60% 60% 59% 59%
0%
10%
20%
30%
40%
50%
60%
70%
80%
90%
100%
2001 2002 2003 2004 2005 2006 2007 2008 2009 2010
Fall Enrollment of Degree-Seeking Students* by Gender
Fall Term
Males Females
13% 15% 17% 17% 19% 19% 18% 17% 18% 17%
80%79% 76% 76% 73% 74% 75% 75% 75% 76%
7% 7% 7% 7% 8% 7% 7% 7% 7% 7%
0%
10%
20%
30%
40%
50%
60%
70%
80%
90%
100%
2001 2002 2003 2004 2005 2006 2007 2008 2009 2010
Fall Enrollment of Degree-Seeking Students* by Cohort Type
Fall Term
African-AmericanStudents**
All Other Students**(Excluding F-1 International)
F-1 InternationalStudents
*Includes full and part-time students. **Based on students who identified themselves as “Black or African American” alone or in combination with another race.

Fall Enrollment Trends, continued
74% 75% 75% 74% 73% 72% 73% 73% 71% 70%
19% 18% 18% 19% 19% 20% 20% 20%21% 23%
7% 6% 7% 7% 7% 7% 7% 7% 7% 7%
0%
10%
20%
30%
40%
50%
60%
70%
80%
90%
100%
2001 2002 2003 2004 2005 2006 2007 2008 2009 2010
Fall Enrollment of Degree-Seeking Students* by Territory
In-Territory Out-of-Territory F-1 International
Fall Term
*Includes full and part-time students. Source: Office of Institutional Research and Assessment, September 2010

SPRING ENROLLMENTS BY CLASSIFICATION 2006 - 2010
2006 2007 2008 2009 2010 Total (Full-Time and Part-Time)* Freshman 328 346 363 338 319 First-Year Students (7) (16) (9) (3) (1) Other** Freshmen (321) (330) (354) (335) (318) Sophomore 329 298 312 324 287 Junior 326 332 308 291 322 Senior 431 447 442 400 408 TOTAL DEGREE-SEEKING STUDENTS 1,414 1,423 1,425 1,353 1,336 Berea Community School 19 13 17 27 24 Madison Southern High School 8 6 3 4 10 College Employee 5 3 4 4 3 Community (Special) 12 11 12 12 11 Transient/Exchange 10 9 5 9 9 TOTAL NON-DEGREE-SEEKING STUDENTS 54 42 41 56 57 TOTAL HEADCOUNT 1,468 1,465 1,466 1,409 1,393 *For a breakdown of full and part-time students, please see the next page. Definitions: Full-time Student - A student who has a 3 to 4 1/2 credits course load. Part-time Student - A student who is registered for less than a 3 credits course load. First-Year Students - Students who have enrolled at Berea College for the first time and did not transfer from another institution. **Other Freshmen - Includes continuing (students who were enrolled at Berea during the previous term), returning (students previously enrolled, withdrew, and subsequently accepted for readmission), and transfer students (students who have been enrolled at another post secondary institution) who are classified as freshman. Non-Degree-Seeking Classifications: Berea Community School or Madison Southern High School- Junior and senior high school students who take no more than two courses per term at Berea College upon the recommendation of their Guidance Counselor and concurrence of the Associate Provost. Community (Special) - Non-degree-seeking students who wish to take courses for personal enrichment or for limited educational gain. Transient/Exchange - Transient students are students who take courses at Berea College to transfer back to their home institution. Exchange students are enrolled at Berea full-time under an exchange agreement with another institution. Source: Academic Services, February 2010

Source: Academic Services, February 2010
SPRING ENROLLMENTS BY CLASSIFICATION (Continued) Full-Time Students 2006 2007 2008 2009 2010 Freshman 328 346 363 338 319 First-Year Students (7) (16) (9) (3) (1) Other** Freshmen (321) (330) (354) (335) (318) Sophomore 329 298 312 324 287 Junior 326 332 307 290 322 Senior 425 438 439 398 408 TOTAL DEGREE-SEEKING FULL-TIME STUDENTS 1,408 1,414 1,421 1,350 1,336 Berea Community School 0 1 0 0 0 Madison Southern High School 0 1 0 0 0 College Employee 0 0 0 0 0 Community (Special) 0 0 2 0 0 Transient/Exchange 8 7 4 7 8 TOTAL NON-DEGREE-SEEKING FULL-TIME STUDENTS 8 9 6 7 8 TOTAL FULL-TIME STUDENTS 1,416 1,423 1,427 1,357 1,344 ____________________________________________________________________________ Part-Time Students 2006 2007 2008 2009 2010 Freshman 0 0 0 0 0 First-Year Students (0) (0) (0) (0) (0) Other** Freshmen (0) (0) (0) (0) (0) Sophomore 0 0 0 0 0 Junior 1 0 1 1 0 Senior 6 9 3 2 0 TOTAL DEGREE-SEEKING PART-TIME STUDENT 7 9 4 3 0 Berea Community School 19 12 17 27 24 Madison Southern High School 8 6 3 4 10 College Employee 5 3 4 4 3 Community (Special) 12 11 10 12 11 Transient/Exchange 2 1 1 2 1 TOTAL NON-DEGREE-SEEKING PART-TIME STUDENTS 46 33 35 49 49 TOTAL PART-TIME STUDENTS 52 42 39 52 49 FTE Enrollment 1,447 1,438 1,444 1,379 1,362 **Other Freshmen - Includes continuing (students who were enrolled at Berea during the previous term), returning (students previously enrolled, withdrew, and subsequently accepted for readmission), and transfer students (students who have been enrolled at another post secondary institution) who are classified as freshman. NOTE: FTE (Full-Time Equivalent) Enrollment is calculated by equating part-time students to full time status (enrolled in at least a 3 credits course load). FTE For each part-time student is determined by dividing the total number of courses taken by 3. Our part-time enrollment of 49 students has an FTE of 17.58.

FIRST-TO-SECOND YEAR RETENTION First-Year Students
All First-Year Students
By Gender
Source: Office of Institutional Research and Assessment, September 2010
82.7%79.7% 80.1% 82.3% 81.5% 81.7% 83.0%
77.9%81.8% 78.8%
0%
10%
20%
30%
40%
50%
60%
70%
80%
90%
100%
2000 2001 2002 2003 2004 2005 2006 2007 2008 2009
Year Entered
78% 77% 77%
82%
76%
81%82%
75%77%
70%
86%82% 83% 83%
87%83% 84%
80%
85% 86%
0%
10%
20%
30%
40%
50%
60%
70%
80%
90%
100%
2000 2001 2002 2003 2004 2005 2006 2007 2008 2009Year Entered
Males Females

FIRST-TO-SECOND YEAR RETENTION, continued
By Cohort Type
*Based on students who identified themselves as “Black or African American” alone or in combination with another race. By Territory
Source: Office of Institutional Research and Assessment, September 2010
92%
85%
81%85%
87%
76%
83%
75%
90%
75%80%
77% 78%80%
78%82% 81%
77%79% 78%
100% 100% 100% 100% 100% 100% 100% 100% 100% 100%
0%
10%
20%
30%
40%
50%
60%
70%
80%
90%
100%
2000 2001 2002 2003 2004 2005 2006 2007 2008 2009Year Entered
80% 78%
76%
81% 80% 79% 80%75%
78%76%
90%
80%
93%
83%84%
89%89%
85%89%
84%
100% 100% 100% 100% 100% 100% 100% 100% 100% 100%
0%
10%
20%
30%
40%
50%
60%
70%
80%
90%
100%
2000 2001 2002 2003 2004 2005 2006 2007 2008 2009
Year Entered
African-American* All Other Domestic F-1 International
In-Territory Out-of-Territory F-1 International

FIRST-YEAR STUDENT RETENTION/ATTRITION FALL TERMS 2000 - 2009
Breakdown of Withdrawals Percent Total Number Returned for Number Academic Other Voluntary Year Enrolled Second Year Withdrawn Suspensions Suspensions** Departures 2000 421 82.7 % 73 13 3 57 2001 424 79.7 86 16 2 68 2002 356 80.1 71 18 10 43 2003 396 82.3 70 23 5 42 2004 400 81.5 74 17 6 51 2005 378 81.7 69 26 4 39 2006 388 83.0 66 14 2 50 2007 420* 77.9 93 25 4 64 2008 413 81.8 75 26 3 46 2009 392 78.8 83 18 9 56 NOTE: For all years reported above, the percent retained represents both students who re-enrolled the second year as well as those students granted a "leave of absence." Students who do not return from official leaves are not counted as withdrawn until they fail to re-enroll after their leaves.
PERCENTAGE OF TOTAL WITHDRAWALS ATTRIBUTED TO: ACADEMIC SUSEPENSIONS, OTHER SUSPENSIONS**,
AND VOLUNTARY DEPARTURES
*Denotes cohort numbers that have been adjusted due to the death of a student. In each case, the number in the cohort has been reduced by one. **Includes expulsion, disciplinary, labor, convocation, and administrative dismissals. Source: Office of Institutional Research and Assessment, September 2010
0%
10%
20%
30%
40%
50%
60%
70%
80%
90%
100%
2000 2001 2002 2003 2004 2005 2006 2007 2008 2009Year Entered
Other Suspensions**
Academic Suspensions
Voluntary Departures

MALE FIRST-YEAR STUDENT RETENTION/ATTRITION FALL TERMS 2000 - 2009
Breakdown of Withdrawals Percent Total Number Returned for Number Academic Other Voluntary Year Enrolled Second Year Withdrawn Suspensions Suspensions** Departures 2000 176 78% 39 9 3 27 2001 183 77 43 10 1 32 2002 150 77 35 12 4 19 2003 156 82 28 12 3 13 2004 191 76 46 13 5 28 2005 159 81 31 16 2 13 2006 168 82 31 9 0 22 2007 168* 74 43 10 2 31 2008 172 77 39 15 2 22 2009 170 71 50 12 7 31 NOTE: For all years reported above, the percent retained represents both students who re-enrolled the second year as well as those students granted a "leave of absence." Students who do not return from official leaves are not counted as withdrawn until they fall to re-enroll after their leaves.
PERCENTAGE OF TOTAL MALE WITHDRAWALS ATTRIBUTED TO:
ACADEMIC SUSEPENSIONS, OTHER SUSPENSIONS**, AND VOLUNTARY DEPARTURES
*Denotes cohort numbers that have been adjusted due to the death of a student. In each case, the number in the cohort has been reduced by one. **Includes expulsion, disciplinary, labor, convocation, and administrative dismissals. Source: Office of Institutional Research and Assessment, September 2010
0%
10%
20%
30%
40%
50%
60%
70%
80%
90%
100%
2000 2001 2002 2003 2004 2005 2006 2007 2008 2009
Year Entered
Other Suspensions**
Academic Suspensions
Voluntary Departures

FEMALE FIRST-YEAR STUDENT RETENTION/ATTRITION FALL TERMS 2000 - 2009
Breakdown of Withdrawals Percent Total Number Returned for Number Academic Other Voluntary Year Enrolled Second Year Withdrawn Suspensions Suspensions* Departures 2000 245 86% 34 4 0 30 2001 241 82 43 6 1 36 2002 206 83 36 6 6 24 2003 240 83 42 11 2 29 2004 209 87 28 4 1 23 2005 219 83 38 10 2 26 2006 220 84 35 9 2 28 2007 252 80 50 15 2 33 2008 241 85 36 11 1 24 2009 222 85 33 6 2 25 NOTE: For all years reported above, the percent retained represents both students who re-enrolled the second year as well as those students granted a "leave of absence." Students who do not return from official leaves are not counted as withdrawn until they fail to re-enroll after their leaves.
PERCENTAGE OF TOTAL FEMALE WITHDRAWALS ATTRIBUTED TO: ACADEMIC SUSPENSIONS, OTHER SUSPENSIONS*,
AND VOLUNTARY DEPARTURES
*Includes expulsion, disciplinary, labor, convocation, and administrative dismissals. Source: Office of Institutional Research and Assessment, September 2010
0%10%20%30%40%50%60%70%80%90%
100%
2000 2001 2002 2003 2004 2005 2006 2007 2008 2009
Year Entered
Other Suspensions*
Academic Suspensions
Voluntary Departures

AFRICAN-AMERICAN FIRST-YEAR STUDENT RETENTION/ATTRITION FALL TERMS 2000 - 2009
Breakdown of Withdrawals Percent Total Number Returned for Number Academic Other Voluntary Year Enrolled Second Year Withdrawn Suspensions Suspensions* Departures 2000 61 92 % 5 1 0 4 2001 68 85 10 5 0 5 2002 82 80 16 7 4 5 2003 67 85 10 6 1 3 2004 85 87 11 3 1 7 2005 75 76 18 7 1 10 2006 72 83 12 3 1 8 2007 75 75 19 7 2 10 2008 63 90 6 3 0 3 2009 81 75 20 3 5 12 NOTE: For all years reported above, the percent retained represents both students who re-enrolled the second year as well as those students granted a "leave of absence." Students who do not return from official leaves are not counted as withdrawn until they fail to re-enroll after their leaves.
PERCENTAGE OF TOTAL AFRICAN-AMERICAN WITHDRAWALS
ATTRIBUTED TO: ACADEMIC SUSPENSIONS, OTHER SUSPENSIONS*, AND VOLUNTARY DEPARTURES
NOTE: Based on students who identified themselves as “Black or African American” alone or in combination with another race. These numbers DO NOT include F-1 International students. *Includes expulsion, disciplinary, labor, convocation, and administrative dismissals. Source: Office of Institutional Research and Assessment, September 2010
0%
10%
20%
30%
40%
50%
60%
70%
80%
90%
100%
2000 2001 2002 2003 2004 2005 2006 2007 2008 2009
Year Entered
Other Suspensions*
AcademicSuspensions
Voluntary Departures

First to Second Year Retention, Six-Year Graduation Rates, and Academic Qualifications at Entry for Fall Term First-Year Students
Compiled by the Office of Institutional Research and Assessment, October 2010
1987 (413)
1988 (362)
1989 (378)
1990 (384)
1991 (436)
1992 (397)
1993 (455)
1994 (406)
1995 (418)
1996 (397)
1997 (404)
1998 (414)
1999 (423)
2000 (421)
2001 (424)
2002 (356)
2003 (396)
2004 (400)
2005 (378)
2006 (388)
2007 (420)
2008 (413)
2009 (392)
F-S Retention 72.6% 78.8% 75.4% 80.7% 70.2% 72.5% 68.1% 71.9% 70.0% 64.6% 71.3% 79.0% 76.8% 82.7% 79.7% 80.1% 82.3% 81.5% 81.7% 83.0% 77.9% 82.3% 78.8%Six-Year Graduation Rates 55.0% 55.4% 56.6% 54.7% 51.4% 51.4% 47.4% 50.5% 51.7% 49.7% 49.3% 62.6% 61.9% 60.8% 63.0% 63.8% 64.9% 64.0%Percent in top 1/5 high school class 58.0% 61.0% 60.0% 56.0% 52.0% 54.0% 53.0% 51.0% 47.0% 39.0% 43.0% 60.0% 58.0% 64.0% 53.0% 60.0% 57.0% 56.0% 55.0% 55.0% 54.0% 55.0% 56.0%Percent Needing any Developmental Math 52.5% 46.8% 40.2% 45.2% 47.0% 37.9% 34.9% 32.0% 40.6% 42.5% 46.8% 22.9% 20.1% 23.3% 25.5% 28.1% 26.8% 23.3% 32.8% 28.9% 34.7% 29.1% 30.6%ACT Composite Mean 20.2 21.0 21.3 21.6 21.7 21.7 22.3 22.2 21.7 21.7 21.7 23.0 23.1 23.5 23.3 23.2 23.0 23.6 23.0 23.1 23.1 23.2 23.5
40%
50%
60%
70%
80%
90%
100%
NOTE: In 2005, the cut-off for waiving Developmental Math was raised by on ACT point (from 19 to 20).

GRADUATION RATES* FOR FIRST-YEAR STUDENTS
Source: Office of Institutional Research and Assessment, September 2010.
*Students who withdraw and return are included in their original class. If a student graduates mid-year, the additional fall term is counted as another year.
29.2%
38.9% 39.9%45.0% 44.4%
51.3% 50.3%42.6%
47.4%
0%
10%
20%
30%
40%
50%
60%
70%
80%
90%
100%
1997 1998 1999 2000 2001 2002 2003 2004 2005 2006
Entering Fall Term
6-year
5-year
4-year
38.9%
61.1%
46.8%
60.4% 60.8% 59.6%61.6% 62.4%
64.0%
49.3%
62.6% 61.9% 60.8%63.0%
6-year rates not available
yet5 and 6-
year rates not
available yet
63.9%
63.8% 64.9%
62.3%%

Source: Office of Institutional Research and Assessment, September 2010
GRADUATION RATES* FOR FIRST-YEAR STUDENTS BY GENDER FALL TERMS 1997-2006
Entering Fall Term
Entering Fall Term
*Students who withdraw and return are included in their original class. If a student graduates mid-year, the additional fall term is counted as another year.
21.8%
39.5%30.0% 34.1%
41.0% 40.7%53.2%
44.0% 42.1% 46.4%
0%
10%
20%
30%
40%
50%
60%
70%
80%
90%
100%
1997 1998 1999 2000 2001 2002 2003 2004 2005 2006
6-year
5-year
4-year 6-year rate not
available yet
MALES
5 and 6-year
rates not available
yet
56.0%
58.5%
34.3% 38.4% 39.9% 44.5% 48.1% 47.1% 50.0%56.0%
42.9%48.2%
0%
10%
20%
30%
40%
50%
60%
70%
80%
90%
100%
1997 1998 1999 2000 2001 2002 2003 2004 2005 2006
6-year
5-year
4-year
5 and 6-year
rates not available
yet
6-year rate not
available yet
FEMALES
43.0%
53.2% 53.2% 51.9% 56.7%
64.1%
46.1%
63.3% 54.2%
54.2% 53.0% 58.0%
49.4%
60.8% 67.0% 66.1% 68.9%
66.5% 63.8% 51.5%
62.0%
68.2% 67.2% 70.5% 68.0% 64.6%
68.9%
65.4%%
55.0% 59.9%
71.3%
63.0%

GRADUATION RATES* FOR FIRST-YEAR STUDENTS BY COHORT TYPE ENTERING FALL TERMS 1997 – 2006
*Students who withdraw and return and included in their original class. If a student graduates mid-year, the additional fall term is counted as another year. **Based on those students who identified themselves as “Black or African American alone or in combination with another race. Source: Office of Institutional Research and Assessment, September 2010
F-1 INTERNATIONAL STUDENTS
28.6%42.9%
30.4% 44.3% 50.0% 43.9% 50.7% 49.4%25.3%
43.1%
0%
10%
20%
30%
40%
50%
60%
70%
80%
90%
100%
1997 1998 1999 2000 2001 2002 2003 2004 2005 2006
6-year
5-year
4-year
5 and 6-year rates not
available yet
6-year rate not available
yet
AFRICAN-AMERICAN STUDENTS**
24.9% 35.5% 35.2% 37.4% 42.5% 42.8% 48.0% 48.6% 44.5% 44.9%0%
10%
20%
30%
40%
50%
60%
70%
80%
90%
100%
1997 1998 1999 2000 2001 2002 2003 2004 2005 2006
5 and 6-year rates not
available yet
6-year rate not available
yet
ALL OTHER DOMESTIC STUDENTS
85.2% 78.3% 54.5% 69.6% 68.2% 62.5% 86.2% 70.4% 80.0% 80.6%0%
10%
20%
30%
40%
50%
60%
70%
80%
90%
100%
1997 1998 1999 2000 2001 2002 2003 2004 2005 2006
5 and 6-year rates not
available yet
46.4%
58.9% 58.0% 63.9% 60.3% 63.4% 61.2% 50.0%
64.3% 58.0% 63.9%
61.8% 63.4% 64.2%
65.9%
43.3% 57.9%
59.6% 57.0% 59.3% 59.6% 61.3% 45.6%
59.7% 61.1% 58.5% 60.8% 61.2% 59.7%
58.7% 61.5%
61.7%
96.3% %% 92.6% 100%
86.4% 87.0% 100%
87.5%
96.6%
96.3% 100%
86.4% 87.0%
100% 91.7%
88.9%
100%
90.0%
6-year rate not available
yet
68.2%
52.0%

GRADUATION RATES* FOR FIRST-YEAR STUDENTS BY TERRITORY ENTERING FALL TERMS 1997 – 2006
*Students who withdraw and return and included in their original class. If a student graduates mid-year, the additional fall term is counted as another year. Source: Office of Institutional Research and Assessment, September 2010
F-1 INTERNATIONAL STUDENTS
24.1% 36.5% 33.2% 35.4% 43.7% 41.2% 48.4% 47.7% 38.0% 42.9%0%
10%
20%
30%
40%
50%
60%
70%
80%
90%
100%
1997 1998 1999 2000 2001 2002 2003 2004 2005 2006
6-year
5-year
4-year
5 and 6-year rates not
available yet
6-year rate not available
yet
IN-TERRITORY
29.7% 37.1% 40.0% 54.8% 44.3% 51.7% 48.8% 53.3% 52.4% 52.4%0%
10%
20%
30%
40%
50%
60%
70%
80%
90%
100%
1997 1998 1999 2000 2001 2002 2003 2004 2005 2006
6-year5-year4-year
5 and 6-year rates not
available yet
6-year rate not available
yet
OUT-OF-TERRITORY
85.2% 78.3% 54.5% 69.6% 68.2% 62.5% 86.2% 70.4% 80.0% 80.6%0%
10%20%30%40%50%60%70%80%90%
100%
1997 1998 1999 2000 2001 2002 2003 2004 2005 2006
5 and 6-year rates not
available yet
56.9%
40.9%
58.1% 57.7% 55.4% 59.6% 57.3%
61.1%
43.2%
60.8% 58.9% 56.5%
61.1% 60.6%
59.9% 59.4%
58.8%
71.4%
54.1% 58.1% 67.1%
72.6%
58.6%
75.9% 64.0%
56.8% 58.1%
68.6% 74.2%
60.0% 64.0% 66.3%
67.5%
75.9%
96.3% 92.6% 100%
86.4% 87.0% 100%
87.5%
90.0%
96.3% 100%
86.4% 87.0%
100% 91.7%
100%
96.6%
88.9%
6-year rate not
available yet

GRADUATION RATES* FOR NEW TRANSFER STUDENTS
Source: Office of Institutional Research and Assessment, September 2010.
*Students who withdraw and return are included in their original class. If a student graduates mid-year, the additional fall term is counted as another year.
48.3% 50.0% 54.5% 59.6%58.6%
54.2%
68.2%
58.3%
66.7%
61.9%
0%
10%
20%
30%
40%
50%
60%
70%
80%
90%
100%
1997(N = 58)
1998(N = 34)
1999(N = 55)
2000(N = 47)
2001(N = 29)
2002(N = 24)
2003(N = 22)
2004(N = 24)
2005(N = 27)
2006(N = 21)
Entering Fall Term
6-year
5-year
4-year 77.3%
62.5%
62.5%
55.2% 52.9%
58.2%
68.1%75.9%
58.3%
72.7% 70.4%
56.9%52.9%
61.8%
68.1%
75.9%5 and 6-
year rates not
available yet
58.3%
6-year rate not
available yet

Source: Office of Institutional Research and Assessment, September 2010
GRADUATION RATES* FOR NEW TRANSFER STUDENTS BY GENDER FALL TERMS 1997 – 2006
Entering Fall Term
Entering Fall Term
*Students who withdraw and return are included in their original class. If a student graduates mid-year, the additional fall term is counted as another year.
40.9%46.7%
55.6%66.7% 64.3% 62.5%
72.7%
50.0%
66.7%75.0%
0%
10%
20%
30%
40%
50%
60%
70%
80%
90%
100%
1997(N = 22)
1998(N = 15)
1999(N = 27)
2000(N = 27)
2001(N = 14)
2002(N = 8)
2003(N = 11)
2004(N = 12)
2005(N = 15)
2006(N = 12)
6-year
5-year
4-year
5 and 6-year
rates not available
yet6-year rate not
available yet
MALES
52.8% 52.6% 53.6% 50.0% 53.3% 50.0%
63.6% 66.7% 66.7%
44.4%
0%
10%
20%
30%
40%
50%
60%
70%
80%
90%
100%
1997(N = 36)
1998(N = 19)
1999(N = 28)
2000(N = 20)
2001(N =15)
2002(N = 16)
2003(N = 11)
2004(N = 12)
2005(N = 12)
2006(N = 9)
6-year
5-year
4-year
5 and 6-year
rates not available
yet
6-year rate not
available yet
FEMALES
50.0%
50.0%
63.0%
74.1% 78.6%
54.5% 46.7%
66.7%
74.1% 78.6%
75.0%
58.3% 57.9% 60.0% 73.3%
56.3%
75.0%
58.3% 57.9% 57.1%
60.0%
73.3%
81.8%
62.5%
72.7%
72.7% 75.0%
56.3%
5-yr rate:
66.7%

NUMBER OF GRADUATES, DEGREES, AND MAJORS 1
Academic Years 2005-2006 2006-2007 2007-2008 2008-2009 2009-2010 Total Graduates 271 327 309 267 289 1,463 (unduplicated headcount) Degrees Conferred B.A. 227 239 232 197 225 1,120 B.S. 46 92 80 70 69 357 TOTAL 273 332 312 267 294 1,477 Majors* 292 350 334 279 327 1,582 (includes double degrees and double majors) *See the following pages (81 – 88) for more detail regarding majors. Notes: Totals reflect graduates/degrees conferred/majors from September 1 through July 1 of each year. The 2009-2010 graduates can be broken down by: September 2009 (25), February 2010 (73), and May 2010 (191). Compiled by the Office of Institutional Research and Assessment, September 2010

NUMBER OF MAJORS* AWARDED TO GRADUATES Five-Year History
1
Major Programs 2005-2006 2006-2007 2007-2008 2008-2009 2009-2010 African and African American Studies 1 4 3 2 Agriculture and Natural Resources 7 12 8 9 11 Art 7 10 10 18 9 Asian Studies 1 4 4 Biology 23 21 23 20 21 Business Administration 24 36 41 26 23 Chemistry 13 9 6 4 9 Child and Family Studies 24 26 25 18 19 Computer and Information Science 3 3 9 Economics 6 4 7 4 7 Education Studies - General 7 4 2 6 5 Education – Middle Grades 0 0 2 0 2 Elementary Education 11 7 11 7 12 English 12 19 17 11 14 Foreign Languages 11 21 4 12 10 Classical Languages (0) (2) (0) (0) (0) French (1) (4) (1) (2) (1) German (2) (5) (0) (4) (2) Spanish (8) (10) (3) (6) (7) History 10 10 12 12 9 Independent Major** 16 14 18 17 25 Mathematics 6 9 10 7 11 Music 6 9 9 4 11 Nursing 11 11 19 13 8 Philosophy 3 5 8 3 5 Physical Education 9 6 11 10 9 Physics 1 1 4 2 4 Political Science 10 14 5 8 5 Psychology 18 18 16 11 13 Religion 2 12 4 4 3 Sociology 13 11 15 5 7 Speech Communication 17 15 13 6 15 Technology and Industrial Arts 14 33 17 22 27 Theatre 7 10 7 8 11 Women’s Studies 4 2 2 2 7 TOTALS* 292 350 334 279 327 *These are duplicative headcounts that include double degrees and double majors. Please see page 80 for an unduplicated headcount of graduates. **See page 82 for a more complete description of independent majors. Note: These totals reflect majors from September 1 through July 1 of each year. Compiled by the Office of Institutional Research and Assessment, October 2010
Major available only as an
independent major.
Major available only as an independent major.
Major available only as an independent major.

INDEPENDENT MAJORS* AWARDED TO GRADUATES Academic Years 2005 - 2006 through 2009 - 2010
Independent majors are an option available to students who wish to pursue a field of study that cannot be met through a standard Berea College major program. Students are free to propose majors. The student must secure an independent major adviser. The adviser must be above the rank of instructor and a member of the Teaching Faculty from one of the departments with course work included in the proposed major curriculum. After consultation with the independent major adviser and a College reference librarian regarding available resources, a tentative curriculum plan is developed. Approval of the curriculum plan must be obtained from the chairperson/director of all departments and interdisciplinary programs in which two or more courses in the major are required. Completed proposals are submitted to the Office of Academic Services for review by the Coordinator of Academic Advising, liaison to the Academic Program Council. The Council and/or its liaison may accept, reject, or request that the student modify and resubmit the proposal. 2005 – 2006: 16 majors Appalachian Studies Asian Studies (5) Black Studies (2) Computer Science (2) Computer/Information Science (2) General Studies Japanese Studies Performing Arts Administration Sustainable Development 2006 – 2007: 14 majors Animal Behavior Appalachian Studies Asian Studies (3) Computer and Information Science Computer Science Geoscience Global Health Health Studies Human Development Studies Outdoor Education Sustainable Building Design Theatre Management 2007 – 2008: 18 majors Appalachian Studies (2) Arts Administration Child Education and Promotion Child Health Studies Classical Civilization (2) Classical Studies Community Health Computer and Information Technology Design for Sustainable Development Ecological Design International Studies
2007 – 2008, continued Maternal and Child Health Nutrition and Consumer Sciences Peace and Social Justice Studies (2) Sustainability and Environmental Studies 2008 – 2009: 17 majors Appalachian Studies (2) Child Care Management Classical Civilization Computer and Information Science Creative Expressions in Health Studies Ecological Building Design Gerontology Studies Graphic Design Health Promotion International Studies Middle Grades Ed. With Certification in Science Peace and Social Justice Studies (4) Wilderness Leadership and Emergency Care 2009 – 2010: 25 majors Classical Civilizations (5) Classical Studies (2) Community and Human Services Dance Education Film and Theatre Studies Health Studies (2) Instructional Technology International Relations International Studies (3) Outdoor Recreation Peace and Social Justice Studies (5) Pre-Dietetics and Nutrition Sustainable Agricultural and Industrial
Management
* Includes double degrees and double majors
Notes: These totals reflect majors from September 1 through July 1 of each academic year. The following majors became regular majors and are no longer independent majors: Computer and Information Science; and Asian Studies.
Source: < http://www.berea.edu/cataloghandbook/academics/academicprogram/majorsminors/independentmajor.asp >
Compiled by the Office of Institutional Research and Assessment, September 2010

SUMMARY OF GRADUATES’ MAJORS* WITH CONCENTRATIONS
5 Year Summary: Academic Years 2005–06 through 2009–10
Compiled by: Office of Institutional Research and Assessment, October 2010
African and African American Studies. ...... 10 Foreign Languages, continued Agriculture and Natural Resources ........... 46 German Education 1 General 31 Spanish 30 SENS 2 Spanish Education 3 Sustainable Systems 13 History ................................................. 53 Art ............................................................ 54 General 47 General 1 Education 6 Education 3 Independent** ...................................... 90 History 5 Mathematics ........................................ 43 Studio 45 General 42 Asian Studies ............................................... 9 Education 1 Biology ..................................................... 108 Music ................................................... 39 General 68 General 27 Biomolecular, Cellular, Education 6 and Systems 26 Instrumental 6 Field and Organismal 14 Keyboard Perform. 2 Business Administration .......................... 149 Vocal 2 General 2 Nursing ................................................ 63 Accounting 61 Philosophy ........................................... 24 Economics 2 Physical Education .............................. 45 Finance 50 General 11 Management 39 Education 5 Marketing 35 Exercise Science/ Chemistry ................................................... 41 Sports Medicine 26 Child and Family Studies ......................... 112 Wellness/Health Child Development 43 Promotion 3 Early Childhood Educ. 10 Physics ................................................ 12 Family Cons. Sci. Educ. 2 Political Science .................................. 42 Family Studies 63 Psychology .......................................... 77 Food, Nutrition, and Religion ............................................... 25 Culinary Science 1 General 3 Nutrition 6 Biblical Studies 12
Nutrition/Food Studies 1 Religious Thought Computer and Information Science………15 and Ethics 7 General 12 World Religions 3 Computer Science 3 Sociology………………… ................... 51 Economics ................................................. 29 General 47 Education Studies ...................................... 76 Education 4 General 23 Speech Communication….. ................ 66 Elementary P-5 49 Technology and Industrial Arts .......... 114 Middle Grades 5-9 4 Education 4 English ....................................................... 73 Management 110 Education 7 Theatre ................................................ 43 Literature 31 Women’s Studies ................................ 17 Writing 35 Foreign Languages .................................... 56 GRAND TOTAL MAJORS ............. 1,582 Classical Languages 2 (awarded to 1,463 graduates) French 9 .......................................................... German 11 *This is a duplicative headcount that includes double degrees and double majors. **Please see page 82 for a more complete description of independent majors. Note: These totals reflect majors from September 1 through July 1 of each academic year.
NOTE: In three of the majors with concentrations, there were 58 students who completed more than one concentration within that major. See details above in boxes.
Included in concentration list are 40 additional concentrations
for a total of 189
Included in concentration list are 14 additional concentrations
for a total of 126
Included in concentration list are 4 additional concentrations for a total of 43

TEACHER PREPARATION
Compiled by: Office of Institutional Research and Assessment, October 2010
Berea College considers the preparation of teachers one of its major areas of focus. Many departments at Berea College contribute to the education of teachers. Grounded in seven program goals that are closely tied to the College’s Great Commitments, candidates in Berea’s Teacher Education Program are asked to think deeply about the nature of teaching, learning, and schooling. Berea College offers certification programs in:
Elementary Education (primary-grade 5); Interdisciplinary Early Childhood Education (birth to kindergarten); Middle Grades Education with Teacher Certification in Science or Mathematics (grades 5-9); Secondary Education (grades 8-12) programs in Biology, Chemistry, English, Mathematics,
Physics, and Social Studies (with majors in History, Political Science, and Sociology); Primary through grade 12 programs in Health Studies, Health Teaching, Instrumental Music,
Vocal Music, and Physical Education; and a grades 5-12 program in Family and Consumer Sciences and in Technology Education.
The Child and Family Studies Department’s teacher certification programs in Interdisciplinary Early Childhood Education and in Family and Consumer Sciences are not accepting new students until further notice. The teacher certification programs at Berea College are accredited by the National Council for the Accreditation of Teacher Education (NCATE) and by the Kentucky Education Professional Standards Board. In its most recent filing with the United States Department of Education, as required under Title II of the Higher Education Act of 1998, Berea College reported that 100 percent of its graduates for 2007-2008 obtained satisfactory scores on the Praxis II examinations required for the teaching license. Candidates who successfully complete Berea College’s Teacher Education Program are eligible for certification in Kentucky and in other states.
NUMBER OF STUDENTS CERTIFIED IN EDUCATION 2005-2006 2006-2007 2007-2008 2008-2009 2009-2010 Education Studies - General 7 4 2 6 5 (no certification)
Education – Middle Grades 0 0 2 0 2 Elementary Education 11 7 11 7 12 Teaching Certifications
Art 0 1 0 2 0 Child and Family Studies Early Childhood 2 2 3 2 1 Family Consumer Science 1 1 0 0 0 English 1 3 1 2 0 German 0 0 0 1 0 Spanish 2 0 0 1 0 History 3 2 0 1 0 Mathematics 0 0 0 1 0 Music 3 0 1 1 1 Physical Education 2 0 2 0 1 Sociology 1 1 1 0 1 Technology and Industrial Arts 2 0 1 1 0
TOTAL 35 21 24 25 23

SUMMARY OF MINORS* AWARDED TO GRADUATES 5 Year Summary: Academic Years 2005–06 through 2009–10
Compiled by: Office of Institutional Research and Assessment, October 2010
African and African American Studies/Black Studies 17 (4.8%)
Agriculture and Natural Resources 4 (1.1%)
Appalachian Studies 7 (2.0%)
Asian Studies 10 (2.8%)
Business Administration 73 (20.7%)
Computer Science 7 (2.0%)
Dance 15 (4.2%)
Economics 45 (12.7%)
French 16 (4.5%)
German 14 (4.0%)
Health 21 (5.9%)
Health Teaching Minor 2 (0.6%)
History 17 (4.8%)
Latin 6 (1.7%)
Music 6 (1.7%)
Peace and Social Justice Studies 5 (1.4%)
Philosophy 10 (2.8%)
Political Science 7 (2.0%)
Religion 10 (2.8%)
Sociology 12 (3.4%)
Spanish 20 (5.7%)
Speech Communication 4 (1.1%)
Sustainability and Environmental Studies 9 (2.5%)
Women’s Studies 16 (4.5%)
TOTAL 353 (100.0%)
*This is a duplicative headcount that includes double minors. The 353 minors were awarded to 338 graduates. The 338 graduates who received a minor represent 23% of the 1,463 graduates during this five-year time period. Note: These totals reflect majors from September 1 through July 1 of each year.

MAJORS* AWARDED TO GRADUATES BY GENDER 5 Year Summary: Academic Years 2005 – 2006 through 2009 - 2010
Academic Years 2005 - 2006 through 2009 - 2010 Males Females Total N % N % N % of Grand Total African and African American Studies (first grad: 2006-07) 3 30% 7 70% 10 0.6% Agriculture and Natural Resources 22 48% 24 52% 46 2.9% Art 13 24% 41 76% 54 3.4% Asian Studies (first grad: 2007-08) 6 67% 3 33% 9 0.6% Biology 29 27% 79 73% 108 6.8% Business Administration 75 50% 74 50% 149 9.4% Chemistry 19 46% 22 54% 41 2.6% Child and Family Studies 10 9% 102 91% 112 7.1% Computer and Information Science (first grad: 2007-08) 15 100% 0 0% 15 0.9% Economics 18 62% 11 38% 29 1.8% Education Studies Education Studies: General 7 30% 16 70% 23 1.5% Elementary Education 3 6% 46 94% 49 3.1% Middle Grades Education 2 50% 2 50% 4 0.3% English 21 29% 52 71% 73 4.6% Foreign Languages 13 23% 43 77% 56 3.5% History 27 51% 26 49% 53 3.4% Independent** 41 46% 49 54% 90 5.7% Mathematics 30 70% 13 30% 43 2.7% Music 18 46% 21 54% 39 2.5% Nursing 11 17% 52 83% 63 4.0% Philosophy 16 67% 8 33% 24 1.5% Physical Education 20 44% 25 56% 45 2.8% Physics 10 83% 2 17% 12 0.8% Political Science 20 48% 22 52% 42 2.6% Psychology 23 30% 54 70% 77 4.9% Religion 13 52% 12 48% 25 1.6% Sociology 8 16% 43 84% 51 3.2% Speech Communication 23 35% 43 65% 66 4.2% Technology and Industrial Arts 91 80% 23 20% 114 7.2% Theatre 15 35% 28 65% 43 2.7% Women’s Studies 0 0% 17 100% 17 1.1% GRAND TOTAL* 622 39% 960 61% 1,582 100.0% * These are duplicative headcounts that include double degrees and double majors. The 1,582 majors represent 1,463 graduates during this five-year time period. **Please see page 82 for a more complete description of independent majors. Note: These totals reflect majors from September 1 through July 1 of each year.
Compiled by: Office of Institutional Research and Assessment, September 2010

MAJORS* AWARDED TO GRADUATES BY COHORT TYPE
Note: These totals reflect graduates from September 1 through July 1 of each year. Percentages may not total 100% due to rounding. Compiled by: Office of Institutional Research and Assessment, September 2010.
5 Year Summary: Academic Years 2005 – 2006 through 2009 – 2010 African-American** All Others F-1 International Total N (%) N (%) N (%) N (%) African & African American Studies (first grad: 06-07) 8 (80%) 2 (20%) 0 (0%) 10 (0.6%) Agriculture and Natural Resources 1 (2%) 45 (98%) 0 (0%) 46 (2.9%) Art 2 (4%) 51 (94%) 1 (2%) 54 (3.4%) Asian Studies (first grad: 07-08) 2 (22%) 7 (78%) 0 (0%) 9 (0.6%) Biology 23 (21%) 72 (67%) 13 (12%) 108 (6.8%) Business Administration 29 (19%) 80 (54%) 40 (27%) 149 (9.4%) Chemistry 3 (7%) 29 (71%) 9 (22%) 41 (2.6%) Child and Family Studies 34 (30%) 75 (67%) 3 (3%) 112 (7.1%) Computer and Information Science (first grad: 07-08) 0 (0%) 12 (80%) 3 (20%) 15 (0.9%) Economics 1 (3%) 7 (24%) 21 (72%) 29 (1.8%) Education Studies General 5 (22%) 17 (74%) 1 (4%) 23 (1.5%) Elementary Education Certification 7 (14%) 42 (86%) 0 (0%) 49 (3.1%) Middle Grades Education Certification 0 (0%) 4 (100%) 0 (0%) 4 (0.3%) English 8 (11%) 64 (88%) 1 (1%) 73 (4.6%) Foreign Languages 4 (7%) 43 (77%) 9 (16%) 56 (3.5%) History 8 (15%) 45 (85%) 0 (0%) 53 (3.4%) Independent*** 8 (9%) 75 (83%) 7 (8%) 90 (5.7%) Mathematics 0 (0%) 18 (42%) 25 (58%) 43 (2.7%) Music 6 (15%) 29 (74%) 4 (10%) 39 (2.5%) Nursing 10 (16%) 44 (70%) 9 (14%) 63 (4.0%) Philosophy 2 (8%) 22 (92%) 0 (0%) 24 (1.5%) Physical Education 9 (20%) 35 (78%) 1 (2%) 45 (2.8%) Physics 0 (0%) 7 (58%) 5 (42%) 12 (0.8%) Political Science 8 (19%) 23 (55%) 11 (26%) 42 (2.7%) Psychology 11 (14%) 60 (78%) 6 (8%) 77 (4.9%) Religion 3 (12%) 22 (88%) 0 (0%) 25 (1.6%) Sociology 14 (27%) 36 (71%) 1 (2%) 51 (3.2%) Speech Communication 19 (29%) 46 (70%) 1 (2%) 66 (4.2%) Technology and Industrial Arts 19 (17%) 93 (82%) 2 (2%) 114 (7.2%) Theatre 14 (33%) 28 (65%) 1 (2%) 43 (2.7%) Women’s Studies 4 (24%) 13 (76%) 0 (0%) 17 (1.1%) TOTAL* 262 (17%) 1,146 (72%) 174 (11%) 1,582 (100%) * These are duplicative headcounts that include double degrees and double majors. The 1,582 majors represent 1,463 graduates during this five-year time period. **Includes students who identified themselves as “Black or African American” alone or in combination with another race. ***Please see page 82 for a more complete description of independent majors.

MAJORS* AWARDED TO GRADUATES BY GENDER 5 Year History
Compiled by: Office of Institutional Research and Assessment, September 2010.
Academic Years
2005 – 2006 2006 – 2007 2007 – 2008 2008 – 2009 2009-2010 Major Programs Male Female Total Male Female Total Male Female Total Male Female Total Male Female Total African and African American Studies** 0 1 1 2 2 4 0 3 3 1 1 2 Agriculture and Natural Resources 5 2 7 4 7 11 4 4 8 4 5 9 5 6 11 Art 3 4 7 2 8 10 4 6 10 3 15 18 1 8 9 Asian Studies** 1 0 1 4 0 4 1 3 4 Biology 6 17 23 9 12 21 7 16 23 5 15 20 2 19 21 Business Admin. 13 11 24 17 18 35 21 20 41 13 13 26 11 12 23 Chemistry 4 9 13 5 4 9 3 3 6 2 2 4 5 4 9 Child & Family Studies 2 22 24 3 23 26 1 24 25 2 16 18 2 17 19 Computer and Information Science** 3 0 3 3 0 3 9 0 9 Economics 3 3 6 3 2 5 7 0 7 1 3 4 4 3 7 Education Studies General 1 5 6 1 3 4 0 2 2 3 3 6 2 3 5 Elementary 0 12 12 0 7 7 1 10 11 0 7 7 2 10 12 Middle 0 0 0 0 0 0 1 1 2 0 0 0 1 1 2 English 1 11 12 9 10 19 2 15 17 5 6 11 4 10 14 Foreign Languages 1 10 11 5 14 19 1 3 4 4 8 12 2 8 10 History 7 3 10 2 8 10 7 5 12 8 4 12 3 6 9 Independent*** 13 3 16 6 8 14 5 13 18 6 11 17 11 14 25 Mathematics 4 2 6 5 4 9 10 0 10 4 3 7 7 4 11 Music 2 4 6 5 4 9 4 5 9 2 2 4 5 6 11 Nursing 2 9 11 2 10 12 2 17 19 3 10 13 2 6 8 Philosophy 3 0 3 2 3 5 6 2 8 1 2 3 4 1 5 Physical Education 4 5 9 3 3 6 7 4 11 3 7 10 3 6 9 Physics 1 0 1 0 1 1 3 1 4 2 0 2 4 0 4 Political Science 6 4 10 4 10 14 2 3 5 6 2 8 2 3 5 Psychology 4 14 18 8 11 19 3 13 16 3 8 11 5 8 13 Religion 0 2 2 5 7 12 3 1 4 2 2 4 3 0 3 Sociology 3 10 13 1 10 11 2 13 15 0 5 5 2 5 7 Speech Communication 6 11 17 5 10 15 3 10 13 2 4 6 7 8 15 Technology and Industrial Arts 9 5 14 28 6 34 16 1 17 16 6 22 22 5 27 Theatre 2 5 7 2 8 10 6 1 7 1 7 8 4 7 11 Women’s Studies 0 4 4 0 2 2 0 2 2 0 2 2 0 7 7 TOTAL* 292 350 334 279 327 *These are duplicative headcounts that include double degrees and double majors. Please see page 80 for an unduplicated headcount. ** Some students graduated with these majors as in “Independent” major prior to this year. ***Please see page 82 for a more complete description of independent majors. Note: These totals reflect majors from September 1 through July 1 of each year.
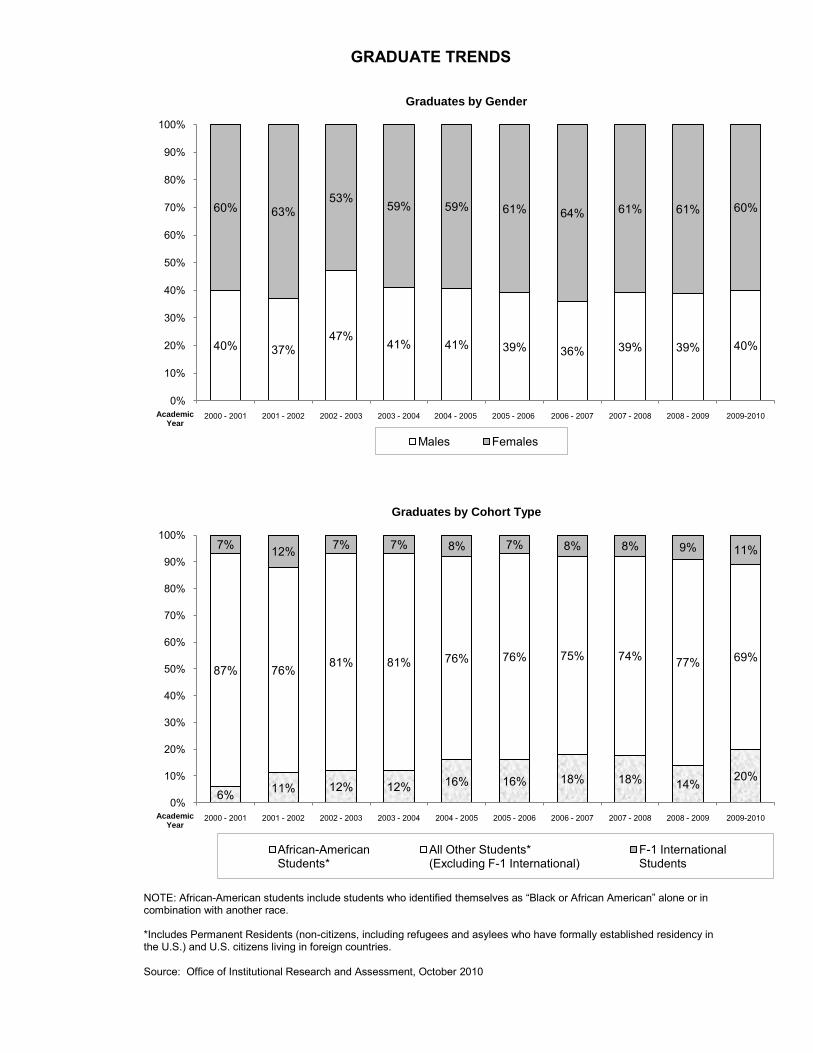
GRADUATE TRENDS
Source: Office of Institutional Research and Assessment, October 2010
NOTE: African-American students include students who identified themselves as “Black or African American” alone or in combination with another race. *Includes Permanent Residents (non-citizens, including refugees and asylees who have formally established residency in the U.S.) and U.S. citizens living in foreign countries.
40% 37%47%
41% 41% 39% 36% 39% 39% 40%
60% 63%53%
59% 59% 61% 64% 61% 61% 60%
0%
10%
20%
30%
40%
50%
60%
70%
80%
90%
100%
2000 - 2001 2001 - 2002 2002 - 2003 2003 - 2004 2004 - 2005 2005 - 2006 2006 - 2007 2007 - 2008 2008 - 2009 2009-2010
Graduates by Gender
Males Females
Academic Year
6% 11% 12% 12% 16% 16% 18% 18% 14%20%
87% 76%81% 81% 76% 76% 75% 74% 77% 69%
7% 12% 7% 7% 8% 7% 8% 8% 9% 11%
0%
10%
20%
30%
40%
50%
60%
70%
80%
90%
100%
2000 - 2001 2001 - 2002 2002 - 2003 2003 - 2004 2004 - 2005 2005 - 2006 2006 - 2007 2007 - 2008 2008 - 2009 2009-2010
Graduates by Cohort Type
African-AmericanStudents*
All Other Students*(Excluding F-1 International)
F-1 InternationalStudents
Academic Year

Graduate Trends, continued
Source: Office of Institutional Research and Assessment, October 2010
76%66%
72% 73% 72% 76% 74% 69% 69% 68%
17%
22%20% 20% 20% 17% 18% 23% 22% 21%
7% 12% 8% 7% 8% 7% 8% 8% 9% 11%
0%
10%
20%
30%
40%
50%
60%
70%
80%
90%
100%
2000-2001 2001-2002 2002-2003 2003-2004 2004-2005 2005-2006 2006-2007 2007-2008 2008-2009 2009-2010
Graduates by Territory
In-Territory Out-of-Territory F-1 International
Academic Year

EDUCATION ABROAD From the Berea College Catalog, 2010-2011: The Francis and Louise Hutchins Center for International Education (CIE) at Berea College fosters understanding of, and respect for, all peoples of the earth. Many of the Eight Great Commitments of Berea College are achieved through international education – an integral part of a strong liberal-arts curriculum. The College prepares students to take an active role in global society by undertaking a variety of initiatives to help its students - tomorrow’s leaders - strengthen their international awareness. International education for Berea students takes place both on campus and abroad in many ways, including: encouraging international perspectives in course work and curriculum across the disciplines; hosting students, faculty, and guest lecturers from around the world; organizing a variety of programs that bring artists, musicians, and speakers from other countries to campus; and encouraging all students to participate in academically rigorous, cross-cultural, education-abroad programs. The Berea College CIE is the campus focal point for international education.
BEREA COLLEGE EDUCATION ABROAD PARTICIPANTS ACADEMIC YEARS 2005 - 2006 THROUGH 2009 - 2010
Number of Participants for Academic Year Length of Time Spent Abroad 2005-2006 2006-2007 2007-2008 2008-2009 2009-2010 Full Year 1 1 2 0 0
Semester 31 31 26 23 18
Short Term 141 95 171 132 72
Summer 87 105 58 63 32
TOTAL 260 232 257 218 122
Percent of Students who Participated*: 24% 22% 25% 22% 12%
* The percentages above are based on the number of participants divided by the average of the Fall and Spring full-time upperclassmen (sophomores, juniors, and seniors) degree-seeking student enrollment. The percentages above differ from prior Fact Books. Source: Berea College Catalog, 2010 – 2011 < http://www.berea.edu/cataloghandbook/college/community/ieht.asp > Center for International Education, November 2010 < http://www.berea.edu/cie/ >

EDUCATION ABROAD PARTICIPANTS BY PROGRAM/SPONSOR AND COUNTRY
Academic Year 2009 – 2010
Source: Center for International Education, November 2010
Number of Number of Participants ParticipantsAcademic Year (0) 0 Semester (18) Berea Term Abroad Australia 3 Ecuador 1 France 1 Greece 2 Japan 2 Jordan 1 Malaysia 1 South Africa 1 United Kingdom 3 Department of Foreign Languages France 1 Germany 1 BMW Hungary 1 Short Term (72) Berea Course Credit Denmark 3 Faculty-Led Berea Courses Argentina 18 Egypt 17 France 19 Independent Study Spain 1 Internships Kyrgyzstan 1 New Zealand 4 Zimbabwe 1 Team-Initiated Studies Costa Rica 8
Summer (32) Internships Brazil 1 Haití 1 Japan 1 Myanmar 2 Senegal 1 Tunisia 1 Kentucky Institute for International Studies (KIIS) Austria 1 Costa Rica 3 Czech Republic 1 France 2 Germany 1 Greece 1 Italy 1 Japan 4 Morocco 3 Spain 1 Ukraine 4 Non Berea Australia 1 Germany 1 Non Credit Georgia 1 Senegal 1 TOTAL 122

ACADEMIC CREDIT INTERNSHIPS The Internship Program is an experiential education program individually designed for those with a special academic interest requiring integration of classroom learning with practical experience. The program, which will include on-campus seminars with academic sponsors as well as non-classroom experience, is open to sophomores, juniors, and seniors. One to three course credits in one 14-week term, one credit in Summer One or Summer Two may be taken in Internships. An Internship may be either a departmental or a General Studies offering. Every departmental-rubric Internship proposal requires the approval of two faculty sponsors and the department assumes the responsibility for determining credit allowance. General Studies Internship proposals require the approval of two faculty sponsors, and the Coordinator of Internships assumes responsibility for determining credit allowance. Final approval for Internship proposals is given by the Coordinator of Internships. Internship placements are located in various states and abroad and are available in many areas of study. Specific internship titles over the last few years have included examples such as the following: USDA Nutrition Research, Arkansas Hope Community Resources, Alaska University of Kentucky Cooperative Extension Service, Kentucky EPG Economic Development, Myanmar Educational Reform, Haiti Shepherd Alliance, Various Locations Community Health Education, Kentucky Refugee and Immigration Services, Virginia Number of Internships
Academic Years 2005 - 2006 through 2009 – 2010
Term 2005 - 2006 2006 - 2007 2007 - 2008 2008 – 2009 2009-2010 Fall 0 3 9 2 0
Short 30 33 29 26 37
Spring 1 3 2 4 1
Summer 67 94 82 100 95
TOTAL 98 133 122 132 133
Percent of Students who Participated*: 9% 9% 12% 13% 13%
NOTE: Many other students participate in internships that do not involve academic credit. *The percentages above are based on the number of participants divided by the average of the Fall and Spring full-time upperclassmen (sophomores, juniors, and seniors) degree-seeking student enrollment. The percentages above differ from prior Fact Books. Source: Berea College Catalog, 2010 – 2011 < http://www.berea.edu/internships/ > Office of Internships, November 2010

SERVICE-LEARNING
Service-learning at Berea College is an educational experience based upon a collaborative partnership between college and community. Learning through service enables students to apply academic knowledge and critical-thinking skills to meet genuine community needs. Through reflection and assessment, students gain deeper understanding of course content and the importance of civic engagement. Center for Excellence in Learning through Service (CELTS) and the Service-Learning Program
Established in 2000, the Center for Excellence in Learning through Service (CELTS) coordinates the College’s student-led, community-service programs and supports service-learning in the academic curriculum. The work of CELTS builds upon Berea’s commitment to promote the Christian ethic of service and to serve the Appalachian region.
Student-Led Service Programs
Through their labor positions, students work in teams to lead service programs and coordinate service activities, including tutoring young children, mentoring at-risk teens, visiting elders at long-term care facilities, helping to build houses for low-income families, organizing the annual community-wide Hunger Hurts food drive, and taking on environmental and social-justice issues.
Service-Learning
CELTS also coordinates and supports service-learning in the academic curriculum. Service-learning is a teaching pedagogy through which students apply academic knowledge to address community needs, while developing their academic skills, sense of civic responsibility, and commitment to the community through critical, reflective thinking.
The three essential components of a service-learning experience are: a collaborative partnership between the College and Community, an opportunity for students to apply academic knowledge and critical thinking skills in a community setting, and structured reflection and assessment. Reflection is often called “the hyphen” in service-learning, as it facilitates deeper learning by helping students to draw connections between the service and learning experiences.
Service-learning courses are taught each term in a variety of disciplines at Berea College. Designated service-learning courses meet the Active Learning Experience (ALE) requirement in the General Education Program.
NUMBER OF SERVICE-LEARNING COURSES AND PROJECTS,
ACADEMIC PROGRAMS, AND COMMUNITY PARTNER ORGANIZATIONS 2005-06 2006-07 2007-08 2008-09 2009-10 Courses and Projects 32 31 29 19 23 Academic Programs Represented 18 24 16 13 16 Community Partner Organizations 49 45 35 25 31 Recent Community Partner Organizations, 2005 - 2010:
Berea Community Food Bank Kentucky Environmental Foundation Berea Community School League of Women Voters of Berea and Madison County Berea Health Care Center Madison County Cooperative Extension Agency Berea Health Ministry Rural Health Clinic Madison County Health Department Berea Senior Citizen Center MACED (Mountain Association for Berea Tourism Commission Big Creek People in Action
Community and Economic Development) New Opportunity School for Women
Clearfork Community Institute PeaceCraft Eastern Kentucky Child Care Coalition Project Read Foley Middle School Youth Service Center South Madison County Family Resource Center Habitat for Humanity of Madison and Clark Counties Sustainable Berea Home Energy Partners Terrace Nursing and Rehabilitation Center Hope’s Wings Domestic Violence Shelter Wallins Creek Elementary School Kentuckians for the Commonwealth
Source: Center for Excellence in Learning through Service (CELTS), October 2010 < http://www.berea.edu/celts/ >

DOMESTIC SHORT TERM EXCHANGE PROGRAM
There are many opportunities to take classes at other institutions during Short Term, and there are two types of such exchanges:
1. Tuition Waiver Exchange—Students pay room and meals at the host institution, but tuition costs are waived. Students should register for EXC 101 if the exchange has been confirmed before Web Registration ends. If the Exchange has not yet been confirmed, the student may register for an on-campus course, then change the registration later. Some Colleges with which we have exchange agreements specify that exchanges must be one-for-one exchanges, i.e., for any Berea College student to do an exchange at the institution, there must be a student from that institution who will do an exchange at Berea.
2. Transient Exchange—Berea College is not able to arrange special Exchanges for students to schools having no Exchange agreement with us. Arrangements to attend such schools must be initiated by the student. Students should register for EXC 102 if the Exchange has been confirmed before Web Registration ends. If the Exchange has not yet been confirmed, the student may register for an on-campus course, then change the registration later.
It is the belief of the faculty at Berea College and at the schools with which we currently have established exchange contracts that this program is of tremendous benefit to many students. Not only do students have available to them courses at a number of schools, but they are able to experience college life in different parts of the United States. Berea College has considerable academic strength in a variety of curriculum areas. With the availability of twenty-four majors in the B. A. degree program and a variety of B. S. degree programs and minors, the Short Term is exciting at Berea. Our experience is that Berea College students find Short Term at our exchange schools to complement well the work that they have accomplished here.
SHORT TERM EXCHANGE PROGRAM PARTICIPANTS
Tuition-Only Transient Student Short Term Exchange Exchange TOTAL 2003 2 0 2
2004 6 0 6
2005 7 0 7
2006 0 0 0
2007 6 0 6
2008 2 0 2
2009 3 0 3
2010 0 0 0
NOTE: Beginning with the 2010-11 Academic Year, Berea is no longer offering a Short Term. Source: Office of Academic Services, September 2010 <http://www.berea.edu/cataloghandbook/enrollmentreg/er/exchangeprograms.asp>

UNDERGRADUATE RESEARCH AND CREATIVE PROJECTS PROGRAM
The Undergraduate Research and Creative Projects Program (URCPP) was developed to provide students in all majors learning opportunities not ordinarily found in courses or other forms of experiential learning. Typically, two or three students and a faculty mentor would engage a project for eight to ten weeks during the summer. The central purpose should be to provide opportunities for students to experience research and creative activity through the structure of an apprentice-mentor relationship. This purpose requires that faculty mentors go beyond supervising student learning to working alongside students in providing active models of how research and creative processes are engaged. The purpose also implies that projects will be chosen very carefully and structured to satisfy two conditions: 1. Projects must be accessible to genuine student involvement. That is, students must be capable of understanding the project’s meaning and significance, and they must be capable of making creative contributions to project work. Absent these conditions, students have no opportunity to actually experience the nature of research and creative activity. 2. Projects must also be at a level that elicits faculty involvement in research and creative
processes. That is, the project itself should be at a level expected of faculty professionals. This allows the faculty mentor to provide a model for engaging research and creative activity. In this regard, proposals should contain adequate background information establishing possible contributions of the faculty/student research to the current body of knowledge in the area of interest.
The goals of the program include:
to enhance student learning by providing opportunities to engage challenging, collaborative and directed projects in an apprentice-mentor relationship with faculty;
to foster student-faculty interaction in creative work; to help students understand the interplay between collaboration and independent thought
and action in a complex, open-ended project; to enhance students’ communication skills; to provide experience that would be helpful to students who wish to pursue subsequent
research and learning opportunities (e.g., off-campus, summer research programs or international learning opportunities);
to allow students to build their self-confidence to pursue careers and further study beyond Berea; and
to supply experience that will help students make informed career and graduate school decisions.
Number of Undergraduate Research and Creative Projects and Participants* Number of Number of Number of Summer Projects Faculty Students*
2006 8 12 16 2007 17 20 39 2008 19 22 39 2009 8 8 19** 2010 14 14 35 *Other students may have participated in the program but were funded by sources other than the URCPP budget. Additional department-approved undergraduate research experiences take place on and off campus, as well. **One project with one faculty member and one student was discontinued mid-summer when the student transferred. Source: Academic Services, December 2010 <http://www.berea.edu/academicservices/studyopportunites.asp>

THE LABOR SUPERVISOR OF THE YEAR AWARD
Source: Labor Program Office, September 2010
Members of the student body are asked to submit recommendations for the Outstanding Labor Supervisor on campus. Because departments vary in the number of students an individual (faculty/staff) may be asked to supervise, more than one award may be appropriate. Therefore, the Labor Program Office has categorized eligibility based on the number of students supervised. Provided there are enough nominations submitted per category, there may be up to three labor supervisors of the year selected. The Award Selection Committee consists of five to seven individuals (faculty/staff) from within the campus community. The award and/or awards will be presented in the form of gift certificates and plaques.
Recipients of the Labor Supervisor of the Year Award
Names of current Berea College faculty and/or staff members are italicized.
Janet Tronc 2005
Deloris Coleman 2006 Linda Reynolds 2006
Loretta Reynolds 2007
Dave Porter 2008 Larky Kim Crawford 2008
Sandy Wells 2009 Leslie Kaylor 2009
Anthony Basham 2010 (Supervising 1-15 students) Larky Kim Crawford 2010 (Supervising 16-30 students) Jeanette Davidson 2010 (Supervising 31+ students)
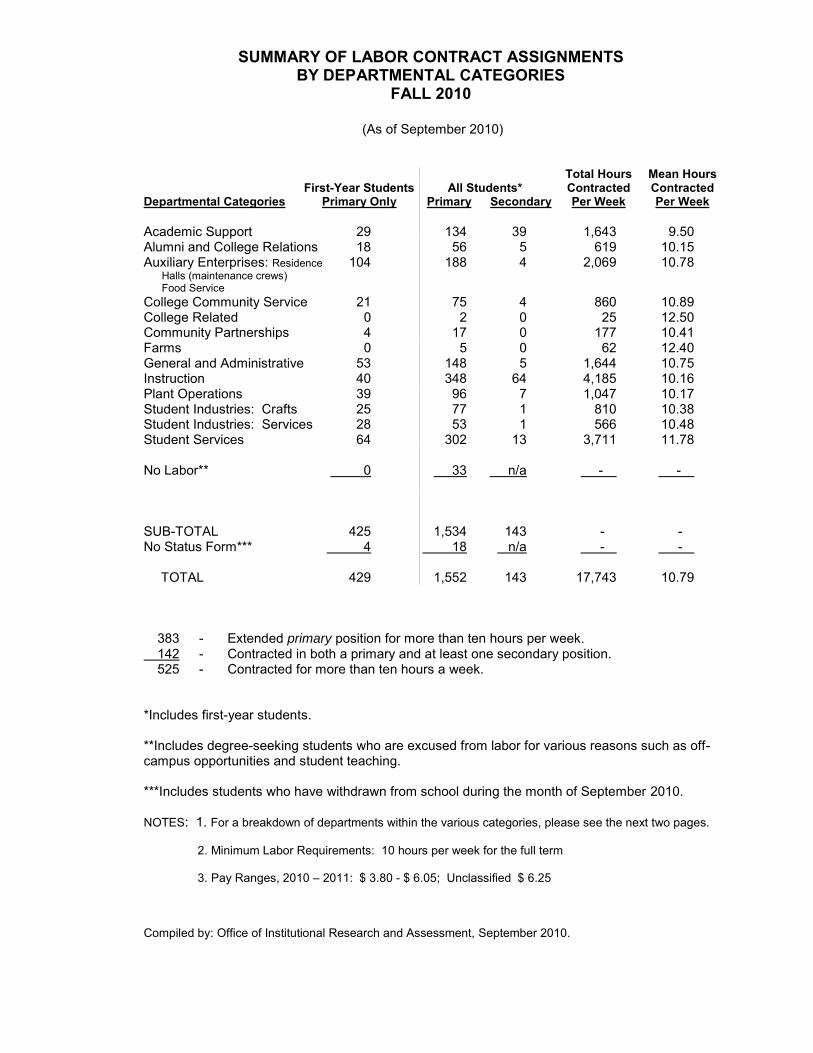
SUMMARY OF LABOR CONTRACT ASSIGNMENTS BY DEPARTMENTAL CATEGORIES
FALL 2010
(As of September 2010)
Total Hours Mean Hours First-Year Students All Students* Contracted Contracted Departmental Categories Primary Only Primary Secondary Per Week Per Week Academic Support 29 134 39 1,643 9.50 Alumni and College Relations 18 56 5 619 10.15 Auxiliary Enterprises: Residence 104 188 4 2,069 10.78 Halls (maintenance crews) Food Service College Community Service 21 75 4 860 10.89 College Related 0 2 0 25 12.50 Community Partnerships 4 17 0 177 10.41 Farms 0 5 0 62 12.40 General and Administrative 53 148 5 1,644 10.75 Instruction 40 348 64 4,185 10.16 Plant Operations 39 96 7 1,047 10.17 Student Industries: Crafts 25 77 1 810 10.38 Student Industries: Services 28 53 1 566 10.48 Student Services 64 302 13 3,711 11.78 No Labor** 0 33 n/a - - SUB-TOTAL 425 1,534 143 - - No Status Form*** 4 18 n/a - - TOTAL 429 1,552 143 17,743 10.79 383 - Extended primary position for more than ten hours per week. 142 - Contracted in both a primary and at least one secondary position. 525 - Contracted for more than ten hours a week. *Includes first-year students. **Includes degree-seeking students who are excused from labor for various reasons such as off-campus opportunities and student teaching. ***Includes students who have withdrawn from school during the month of September 2010. NOTES: 1. For a breakdown of departments within the various categories, please see the next two pages. 2. Minimum Labor Requirements: 10 hours per week for the full term
3. Pay Ranges, 2010 – 2011: $ 3.80 - $ 6.05; Unclassified $ 6.25 Compiled by: Office of Institutional Research and Assessment, September 2010.

LABOR DEPARTMENTS Academic Support Academic Services Environmental Health and Safety Enhancement to Mentoring Grant Internship Office Appalachian Center Hutchins Library Black Culture Center Internship Office Center for International Education Learning Center Convocations Science Library Draper Building Office Services Alumni and College Relations Alumni Relations Public Relations College Relations Auxiliary Enterprises: Residence Halls (Only includes Dorm Maintenance Crews), Food Service Anna Smith Fairchild Bingham James Blue Ridge Kentucky Dana Kettering Danforth Pearsons Ecovillage Seabury Residence Hall Edwards Talcott Elizabeth Rogers Estill Street Residential Complex Food Service College Community Service CELTS (Center for Excellence in Learning through Service) Adopt-a-Grandparent Hispanic Outreach Project (H.O.P) TRIO Programs Berea Buddies Micah 6 Transportation Project Carter G. Woodson Math Berea Teen Mentoring One-on-One Tutoring and Science Institute Bonners Scholars Program People Who Care Upward Bound First Book-Madison County Students for Appalachia (SFA) Educational Talent Habitat for Humanity Summer Tutoring Programs Search HEAL Gear Up Special Programs College Related Brushy Fork Institute Community Partnerships (only includes projects to which students are assigned this academic year) Appalachian College Association (ACA) MACED Baptist Campus Ministry New Opportunity School Berea Community School Peacecraft Berea Credit Union Save the Children Consultwebs Sustainable Berea Farms College Farm General and Administrative Child Development Lab People Services College Post Office President's Office Financial Affairs Printing Services Information Systems and Services Vice President for Operations and Sustainability Institutional Research and Assessment Office

Labor Departments (Continued) Instruction African and African-American Studies Mathematics and Computer Science Agriculture and Natural Resources Music Art Nursing Biology Philosophy and Religion Chemistry Physical Education and Health Child and Family Studies Physics Economics and Business Political Science Ecovillage Ecological Education Program Psychology Education Studies SENS Program English, Theatre, and Communication Sociology Entrepreneurship for Public Good (EPG) Program Technology and Industrial Arts Foreign Languages Theatre Lab General Education Women’s Studies History
Plant Operations Campus Gardeners Maintenance Facilities Management Office Public Buildings Forest Property Management Solid Waste and Recycling Student Industries: Crafts Boone Tavern Gift Shop Student Crafts Distribution Center Broomcraft Student Crafts on the Square Ceramics Weaving Log House Craft Gallery Woodcraft Student Industries: Services Boone Tavern Hotel College Bookstore Student Services Admissions Office College Health Service Athletic Department Labor Program Office (includes Career Campus Christian Center Development) Campus Life/Recreation and Wellness Public Safety Berea Bikes Seabury Center Campus Activities Board (CAB) Student Financial Aid Services Chimes Student Life – Residence Halls/Family Housing Intramurals Student Payroll Office Staff Student Service Center Pinnacle Vice President for Labor and Student Life Student Government Association (SGA)
Complied by the Office of Institutional Research and Assessment, September 2010

AVERAGE HOURS WORKED PER WEEK BY STUDENT CLASSIFICATION
Source: Office of Student Financial Aid Services, October 2010
Fall 2005 Fall 2006 Fall 2007 Fall 2008 Fall 2009Freshmen 11.55 11.71 11.47 11.48 11.17Sophomore 13.45 13.04 13.41 13.13 12.27Junior 13.92 14.10 13.96 14.45 13.02Senior 13.98 14.55 14.53 14.13 13.69
0
2
4
6
8
10
12
14
16
Av
era
ge H
ou
rs W
ork
ed

COST OF EDUCATION AND OTHER STUDENT COSTS
Academic Year Academic Year Academic Year Academic Year Academic Year 2006-2007 2007-2008 2008-2009 2009-2010 2010-2011 Cost Of Education (COE)* $ 22,300 $ 23,400 $ 24,500 $ 25,500 $ 24,100 Registration Costs:
Room 2,794 2,934 3,082 3,082 2,910 Board 2,436 2,558 2,686 2,686 2,664 Accident Fund 20 20 20 20 20 Campus Activities Fee 46 50 50 50 50 Chimes (School Yearbook) 28 28 34 34 34 Health Fee 100 100 100 100 100 Health Insurance 255 270 340 350 384 Pinnacle (School Paper) 12 12 12 12 12 Student Government 10 10 10 10 10 Technology Fee** 300 300 300 300 300
SUBTOTAL $ 6,005 $ 6,282 $ 6,634 $ 6,644 $ 6,484 Average other Costs:
Books and Supplies 750 750 750 750 700 Personal 1,350 1,350 1,376 1,376 1,376 Transportation 400 400 426 426 426
SUBTOTAL $ 2,500 $ 2,500 $ 2,552 $ 2,552 $ 2,502 TOTAL STUDENT COST $ 8,505 $ 8,782 $ 9,186 $ 9,196 $ 8,986 *Cost of Education (COE) is provided by the College (not the student) from the endowment, gifts, scholarships, and grants brought by students. COE covers expenses related to the faculty and staff, library, support services, etc.; it does not include costs of development and alumni programs. **Every student was equipped with a laptop computer provided by the College as part of the Universal Access Project. Students are expected to pay $300 to offset the cost of networking all residence hall rooms, making classrooms usable for laptops, supplying and supporting software, and providing additional training to students. The laptop computer will become the property of the student at graduation. Source: Office of Student Financial Aid Services, February 2010. < http://www.berea.edu/cataloghandbook/admissionsfinaid/fasa/studentexpenses.asp >

TOTAL STUDENT COST
$0$2,000$4,000$6,000$8,000
$10,000$12,000$14,000$16,000$18,000$20,000$22,000$24,000$26,000
2006-2007 2007-2008 2008-2009 2009-2010 2010-2011
Do
llars
Academic Year
Cost of Education
Registration Costs
Average Other Costs
Legend Cost of Education (COE) is provided by the College (not the student) from the endowment, gifts, scholarships and grants brought by students. COE covers expenses related to the faculty and staff, library, support services, etc.; it does not include costs of development and alumni programs. Registration Costs include room, board, accident fund, campus activities fee, Chimes (school yearbook), health fee, Pinnacle (school paper), technology fee, health insurance and student government fees. For more details, please see page 102. Average Other Costs include books and supplies, personal expenses, and transportation costs. For more details, please see page 102. Source: Office of Student Financial Aid Services, February 2010 < http://www.berea.edu/cataloghandbook/admissionsfinaid/fasa/studentexpenses.asp >

ALUMNI ASSOCIATION EXECUTIVE COUNCIL
ACADEMIC YEAR 2010-2011
Executive Committee
President President of Berea College Celeste Patton Armstrong „90 Larry D. Shinn, Honorary „09 Alabama Kentucky President Elect Director of Alumni Relations Larry Woods, „75 Mae Suramek, ‟95 Kentucky Kentucky
Past President VP for Alumni and College Relations James “Bones” Owens, „66 William A. Laramee, Honorary „10 Kentucky Kentucky
Alumni Trustees, including year his/her term ends
2012: Vicki Allums, „79 2015: Lynne Blankenship Caldwell „78 Virginia Virginia 2014: Jim Lewis, ‟70 2016: Jerry Hale „73 Maryland Tennessee
Members-At-Large, including year his/her term ends 2011: Ronald Dockery „70 Lowell Hamilton „61 Kentucky Alabama Bob Miller „58 D. Wesley Poythress „89 Kentucky Indiana 2012: Edward Seay, ‟95 Timothy Jones, „94 Georgia Kentucky Joe Brandenburg, ‟71 Willie Sanders, „69 Georgia Florida 2013: Jason Von Cody, „94 David Cook, „85 Tennessee Kentucky William Churchill, „70 Cara Stewart, „03 Texas Kentucky 2014: Smitha Dharmaraj Day, ‟91 Cheryl Ferguson, „97 Virginia Ohio Michael Murphy, ‟84 Ronnie Nolan, „95 Alabama Kentucky Source: Alumni Office, January 2010 <www.berea.edu/alumni/volunteer/executivecouncil.asp>

YOUNG ALUMNI ADVISORY COUNCIL ACADEMIC YEAR 2010-2011
Amanda Bryant ‘03 Treshani Perera, ‘10 Kentucky Kentucky Dwayne Compton, ’01 Christina Perkins, ‘98 Kentucky Tennessee Amber Davis ‘06 Jeremy Rotty, ‘05 Kentucky Maryland Steve Goodpaster, ’03 Genesis Song, ‘09 Tennessee Kentucky Destiny Harper, ’06 Julie Stewart, ‘04 Kentucky Kentucky
David Harrison, ’01 Rebecca Tucker, ‘09 Kentucky Kentucky Jonathan Johnson, ‘99 Lederrick Wesley, ‘07 Kentucky Kentucky Markesha Flagg McCants, ’04 Tennessee Source: Alumni Office, October 2010 <www.berea.edu/alumni/youngalumniprogram/youngalumniadvisorycouncil.asp>

*Alumni include graduates as well as anyone who received academic credit from Berea College, for whom the Alumni Association has a current address.
**For more detail about other countries, please see page 107.
Source: Alumni Office, October 2010
ALUMNI* BY STATE AND U.S. TERRITORIES As of October 2010
Alabama 456 Alaska 19 Arizona 120 Arkansas 43 California 361 Colorado 101 Connecticut 47 Delaware 22 District of Columbia 30 Florida 603 Georgia 547 Hawaii 23 Idaho 19 Illinois 229 Indiana 393 Iowa 48 Kansas 25 Kentucky 6,495 Louisiana 44 Maine 28 Maryland 242 Massachusetts 86 Michigan 185 Minnesota 65 Mississippi 39 Missouri 113 Montana 23
Nebraska 20 Nevada 26 New Hampshire 19 New Jersey 71 New Mexico 53 New York 174 North Carolina 1,365 North Dakota 3 Ohio 1,181 Oklahoma 33 Oregon 80 Pennsylvania 169 Puerto Rico 2 Rhode Island 10 South Carolina 363 South Dakota 7 Tennessee 1,404 Texas 344 Utah 19 Vermont 22 Virgin Islands 4 Virginia 1,114 Washington 97 West Virginia 557 Wisconsin 49 Wyoming 5 Countries other than the U.S.** 188 Armed Forces—Europe 6 Armed Forces—Pacific 4 TOTAL 17,795

ALUMNI* BY COUNTRIES ORGANIZED BY CONTINENT As Of October 2010
*Alumni Include graduates as well as anyone who received academic credit from Berea College, for whom the Alumni Association has a current address. **For more information about the United States, please see page 106. Source: Alumni Office, October 2010.
Africa (11 countries) Egypt 1 Gambia 1 Ghana 4 Kenya 4 Madagascar 1 Mali 2 Nigeria 6 Senegal 1 South Africa 2 Tanzania 2 Zimbabwe 2 Africa TOTAL 26 Asia (21 countries) Burma 2 Cambodia 1 China 6 Hong Kong 6 India 7 Indonesia 1 Iran 1 Israel 3 Japan 7
Kyrgyzstan 1 Lebanon 1 Macau 1 Malaysia 5 Mongolia 1 Nepal 1 Republic of Korea 5 Russia 1 Singapore 1 Sri Lanka 3 Thailand 5 Turkey 3 Asia TOTAL 62
Oceania (3 countries) Australia 2 Micronesia 1 Palau 1 Oceania TOTAL 4
Europe (20 countries) Austria 2 Belgium 3 Bulgaria 2 Czech Republic 1 Denmark 3 France 2 Georgia 2 Germany 5 Greece 8 Ireland 2 Latvia 1 Lithuania 1 Macedonia 1 Netherlands 4 Slovak Republic 2 Spain 4 Sweden 2 Switzerland 1 Ukraine 1 United Kingdom 10 Europe TOTAL 57
North America (not including U.S.) (7 countries) Canada 24 Cayman Islands 2 Costa Rica 1 Dominica 1 Mexico 2 Nicaragua 1 Trinidad and Tobago 2 North America TOTAL 33 South America (2 countries) Bolivia 1 Ecuador 5 South America TOTAL 6 United States** 17,597 Armed Forces-Europe 6 Armed Forces- Pacific 4 TOTAL 17,795
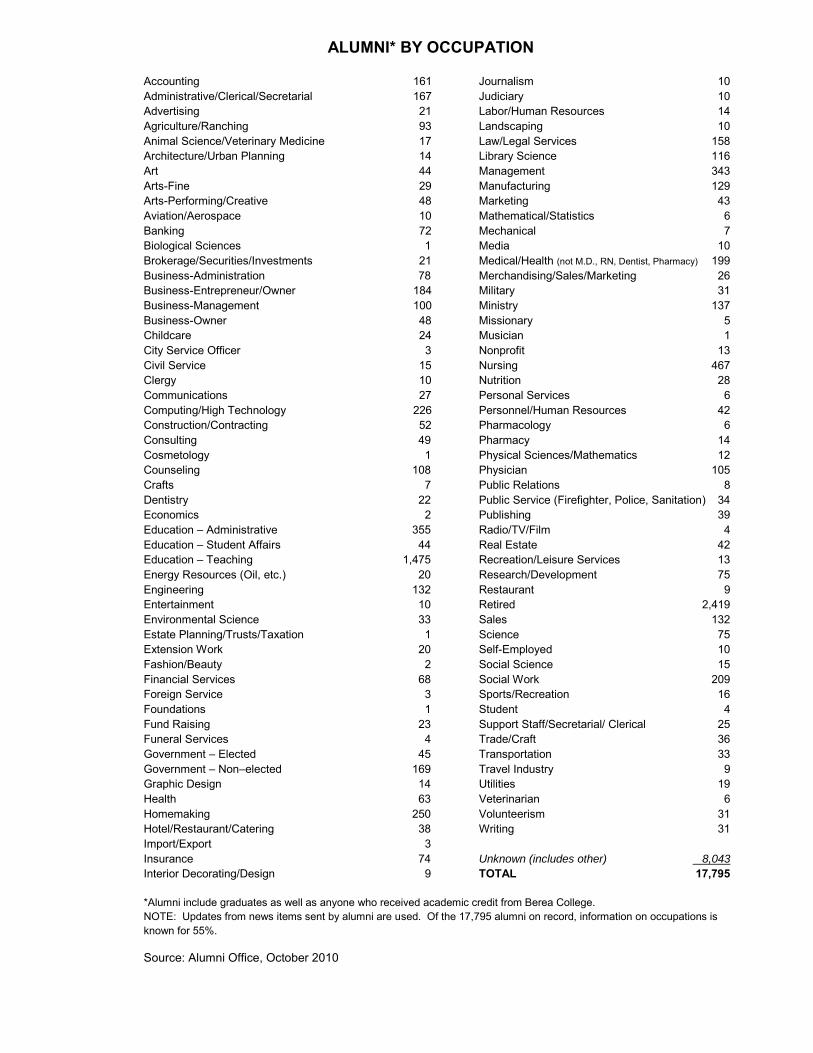
ALUMNI* BY OCCUPATION
Accounting 161 Journalism 10 Administrative/Clerical/Secretarial 167 Judiciary 10 Advertising 21 Labor/Human Resources 14 Agriculture/Ranching 93 Landscaping 10 Animal Science/Veterinary Medicine 17 Law/Legal Services 158 Architecture/Urban Planning 14 Library Science 116 Art 44 Management 343 Arts-Fine 29 Manufacturing 129 Arts-Performing/Creative 48 Marketing 43 Aviation/Aerospace 10 Mathematical/Statistics 6 Banking 72 Mechanical 7 Biological Sciences 1 Media 10 Brokerage/Securities/Investments 21 Medical/Health (not M.D., RN, Dentist, Pharmacy) 199 Business-Administration 78 Merchandising/Sales/Marketing 26 Business-Entrepreneur/Owner 184 Military 31 Business-Management 100 Ministry 137 Business-Owner 48 Missionary 5 Childcare 24 Musician 1 City Service Officer 3 Nonprofit 13 Civil Service 15 Nursing 467 Clergy 10 Nutrition 28 Communications 27 Personal Services 6 Computing/High Technology 226 Personnel/Human Resources 42 Construction/Contracting 52 Pharmacology 6 Consulting 49 Pharmacy 14 Cosmetology 1 Physical Sciences/Mathematics 12 Counseling 108 Physician 105 Crafts 7 Public Relations 8 Dentistry 22 Public Service (Firefighter, Police, Sanitation) 34 Economics 2 Publishing 39 Education – Administrative 355 Radio/TV/Film 4 Education – Student Affairs 44 Real Estate 42 Education – Teaching 1,475 Recreation/Leisure Services 13 Energy Resources (Oil, etc.) 20 Research/Development 75 Engineering 132 Restaurant 9 Entertainment 10 Retired 2,419 Environmental Science 33 Sales 132 Estate Planning/Trusts/Taxation 1 Science 75 Extension Work 20 Self-Employed 10 Fashion/Beauty 2 Social Science 15 Financial Services 68 Social Work 209 Foreign Service 3 Sports/Recreation 16 Foundations 1 Student 4 Fund Raising 23 Support Staff/Secretarial/ Clerical 25 Funeral Services 4 Trade/Craft 36 Government – Elected 45 Transportation 33 Government – Non–elected 169 Travel Industry 9 Graphic Design 14 Utilities 19 Health 63 Veterinarian 6 Homemaking 250 Volunteerism 31 Hotel/Restaurant/Catering 38 Writing 31 Import/Export 3 Insurance 74 Unknown (includes other) 8,043 Interior Decorating/Design 9 TOTAL 17,795 TOTAL 17,795 *Alumni include graduates as well as anyone who received academic credit from Berea College. NOTE: Updates from news items sent by alumni are used. Of the 17,795 alumni on record, information on occupations is known for 55%.
Source: Alumni Office, October 2010

ALUMNI* GIVING SUMMARY Fiscal Year Ended June 30 ________ 2006 2007 2008 2009 2010 Alumni Berea Fund - Goal $ 790,000 $ 801,850 $ 815,000 $ 835,000 $ 1,000,000 Alumni Berea Fund - Received $ 852,796 $ 969,111 $ 985,192 $ 1,049,887 $ 970,432 Other Gifts (includes gift-in-kind) 3,551,288 4,778,929 2,593,792 15,669,649 $ 4,042,331 TOTAL $ 4,404,084 $ 5,748,040 $ 3,578,984 $ 16,719,536 $ 5,012,763 Percent Participation - All Alumni** 30.0% 29.4% 28.0% 28.3% 28.0% Percent Participation - All Graduates** 32.6% 31.2% 30.1% 29.6% 28.9%
*Alumni include graduates as well as anyone who received academic credit from Berea College. **The percentage of alumni donor participation is based on the number of alumni solicited who are celebrating a reunion year, gift club members, the ten most recent classes, and those whose last gift was made sometime during the last ten years. Beginning in fiscal year ended June 30, 2005, the participation rates include alumni/graduates whose only gifts are through donor-advised funds and family foundations. Source: College Relations, October 2010
30.0% 29.4% 28.0% 28.3% 28.0%
0%
10%
20%
30%
40%
50%
60%
70%
80%
90%
100%
2006 2007 2008 2009 2010
Pe
rce
nt
Pa
rtic
ipa
tio
n
Fiscal Year Ended June 30
ALUMNI* PARTICIPATION

BEREA COLLEGE DESIGNATION OF FUNDS
For Fiscal Year Ended June 30, 2010
Current Operations Berea Fund - Unrestricted $ 4,635,080 Student Aid - Restricted 79,407 Other - Restricted 1,466,968 TOTAL CURRENT OPERATIONS $ 6,181,456 Capital Purposes $ 827,946 Student Loan Fund $ 12,150 Endowment from Gifts and Bequests Restricted $ 1,728,014 Unrestricted 13,845,090 TOTAL ENDOWMENT $ 15,573,104 Gift Value of Annuities and Life Income Agreements 402,285 TOTAL GIFTS, BEQUESTS, AND GIFT VALUE OF ANNUITIES AND LIFE INCOME AGREEMENTS $ 22,996,941 Gifts-In-Kind 71,927 GRAND TOTAL $ 23,068,868 Source: College Relations, October 2010

SOURCE OF CONTRIBUTIONS TO BEREA COLLEGE
For Fiscal Year Ended June 30, 2010
Number Percent of Dollar Percent of of Gifts Total Gifts Amount Total Dollars Source of Support General welfare foundations 246 1.44% $ 2,847,795 12.34% Corporations and corporate foundations 451 2.64% 1,276,884 5.54% Organizations, associations, and clubs 80 0.47% 61,805 0.27% Religious groups 16 0.09% 6,100 0.03% Fund-raising consortia 7 0.04% 13,826 0.06% Individuals (other than alumni) 10,287 60.15% 2,407,158 10.43% Alumni 5,609 32.80% 1,148,870 4.98% Bequests - Alumni 53 0.31% 3,006,758 13.03% Bequests - Non-Alumni 262 1.53% 11,825,459 51.26% TOTAL GIFTS AND BEQUESTS 17,011 99.46% $ 22,594,656 97.94% Gift Value of Annuities and Life Income Agreements Alumni 14 0.08% 200,637 0.87% Non-Alumni 18 0.11% 201,648 0.87% TOTAL GIFTS, BEQUESTS, AND GIFT VALUE OF ANNUITIES AND LIFE INCOME AGREEMENTS 17,043 99.65% $ 22,996,941 99.69% Gifts-In-Kind Alumni 19 0.11% 18,268 0.08% Non-Alumni 41 0.24% 53,659 0.23% GRAND TOTAL 17,103 100.00% $ 23,068,868 100.00% Source: College Relations, October, 2010

BEREA COLLEGE ALUMNI AND FRIENDS GIVING* BY STATE, U.S. TERRITORIES AND OTHER COUNTRIES
For Fiscal Year Ended June 30, 2010
Number Dollar Number Dollar of Gifts Amount of Gifts Amount
Alabama 150 $ 139,945 Montana 28 $ 6,741 Alaska 19 6,422 Nebraska 30 1,062 Arizona 256 180,638 Nevada 30 151,873 Arkansas 73 5,682 New Hampshire 69 89,477 Armed Forces 3 300 New Jersey 483 387,294 California 1,275 2,915,613 New Mexico 98 113,563 Colorado 160 591,393 New York 851 1,140,415 Connecticut 270 239,796 North Carolina 891 301,611 D.C. 109 25,918 North Dakota 15 336 Delaware 56 77,353 Ohio 929 714,493 Florida 767 1,112,992 Oklahoma 39 16,213 Georgia 335 225,212 Oregon 122 16,536 Hawaii 42 2,292 Pennsylvania 567 771,207 Idaho 20 4,039 Puerto Rico 3 60 Illinois 561 2,667,095 Rhode Island 40 8,284 Indiana 307 763,560 South Carolina 276 113,053 Iowa 90 8,395 South Dakota 7 9,869 Kansas 62 45,396 Tennessee 542 974,411 Kentucky 3,566 1,688,512 Texas 429 1,005,031 Louisiana 58 26,435 Utah 37 13,236 Maine 73 61,013 Vermont 67 8,632 Maryland 455 77,785 Virgin Islands 12 600 Massachusetts 358 161,264 Virginia 784 326,057 Michigan 516 3,191,813 Washington 210 112,403 Minnesota 223 1,084,256 West Virginia 231 911,495 Mississippi 33 48,065 Wisconsin 235 68,567 Missouri 162 67,943 Wyoming 15 370,101
STATE AND U.S. TERRITORIES TOTALS 17,039 $23,051,746
Other Countries: Belgium 1 $ 500 Hong Kong 1 $ 500 Canada 2 700 Mongolia 4 12 Federated States Sri Lanka 6 60 of Micronesia 1 10 Switzerland 1 250 France 1 8,306 United Kingdom 2 4,000 Germany 13 2,209
OTHER COUNTRY TOTALS 32 $ 16,547 Anonymous 32 576 TOTALS* 17,103 $23,068,868 *Includes gifts-in-kind and bequests. Source: College Relations, October, 2010

BEREA FUND GOALS AND AMOUNTS RECEIVED FISCAL YEARS 2000-2001 THROUGH 2009-2010
2000-2001 2001-2002 2002-2003 2003-2004 2004-2005 Goal $3,900,000 $4,050,000 $4,150,000 $4,000,000 $4,000,000 Received $4,391,390 $4,226,765 $4,091,714 $4,228,691 $4,000,022 2005-2006 2006-2007 2007-2008 2008-2009 2009-2010 Goal $4,060,000 $4,120,000 $4,200,000 $4,245,000 $3,500,000 Received $4,128,644 $4,117,085 $4,377,103 $4,540,941 $4,635,080
Source: College Relations, October 2010
$0.0
$0.5
$1.0
$1.5
$2.0
$2.5
$3.0
$3.5
$4.0
$4.5
$5.0
2000-2001 2001-2002 2002-2003 2003-2004 2004-2005 2005-2006 2006-2007 2007-2008 2008-2009 2009-2010
Dol
lar A
mou
nt
(in M
illio
ns)
Berea Fund: Goals and Amounts Received Fiscal Years 2000-2001 through 2009-2010
Received Goal

DONATIONS Fiscal Years 2000 - 2001 through 2009 - 2010
2000-2001 2001-2002 2002-2003 2003-2004 2004-2005 Number of Gifts* 16,497 17,010 15,894 16,232 16,294 Current Operations $5,095,546 $4,946,234 $4,740,356 $5,037,190 $5,214,232 Endowment $13,929,336 $17,442,009 $16,836,573 $20,087,707 $18,208,656 Other* $1,022,514 $988,607 $2,243,735 $1,652,398 $1,881,797 TOTAL $20,047,396 $23,376,850 $23,820,664 $26,777,295 $25,304,685 ____________________________________________________________________________________________________________________ 2005-2006 2006-2007 2007-2008 2008-2009 2009-2010 Number of Gifts* 15,980 14,725 15,699 16,058 17,043 Current Operations $5,445,938 $4,930,860 $5,084,391 $5,567,606 $6,181,456 Endowment $15,452,553 $19,038,879 $18,716,915 $28,921,896 $15,573,104 Other* $1,357,828 $1,476,928 $2,469,575 $1,294,113 $1,242,381 TOTAL $22,256,319 $25,446,667 $26,270,881 $35,783,615 $22,996,941 *Does not include gifts-in-kind. Source: College Relations, October 2010
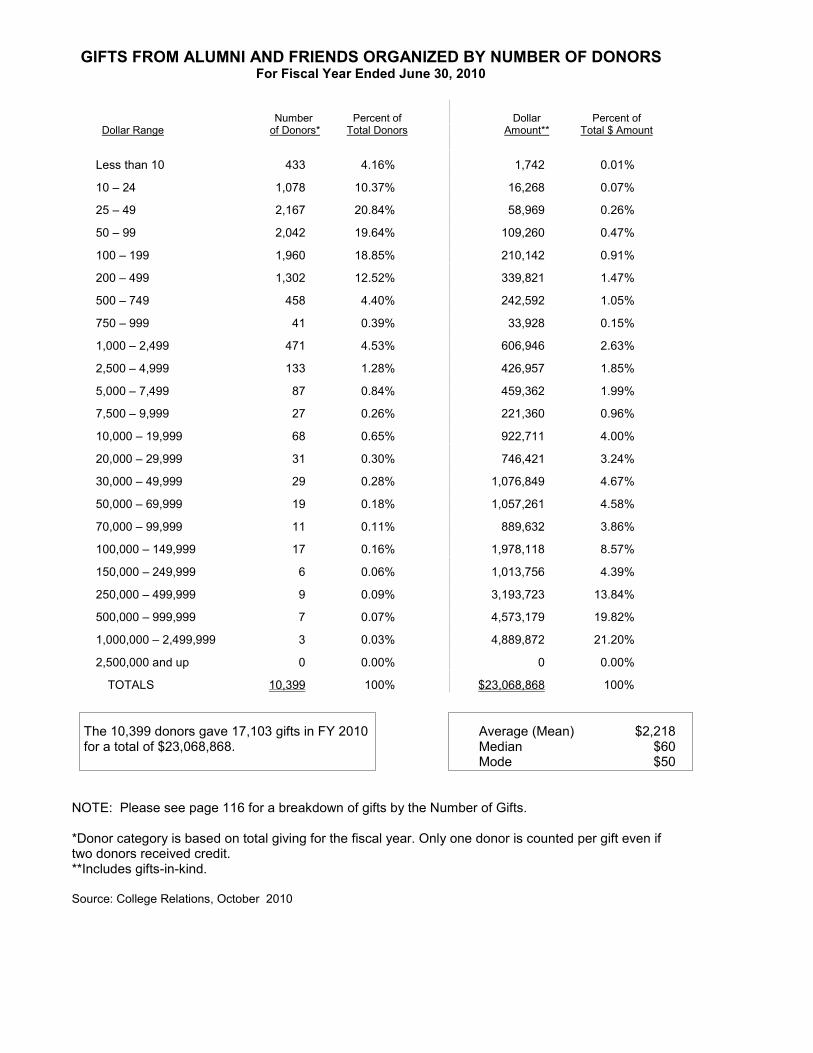
GIFTS FROM ALUMNI AND FRIENDS ORGANIZED BY NUMBER OF DONORS For Fiscal Year Ended June 30, 2010
Number Percent of Dollar Percent of Dollar Range of Donors* Total Donors Amount** Total $ Amount
Less than 10 433 4.16% 1,742 0.01%
10 – 24 1,078 10.37% 16,268 0.07%
25 – 49 2,167 20.84% 58,969 0.26%
50 – 99 2,042 19.64% 109,260 0.47%
100 – 199 1,960 18.85% 210,142 0.91%
200 – 499 1,302 12.52% 339,821 1.47%
500 – 749 458 4.40% 242,592 1.05%
750 – 999 41 0.39% 33,928 0.15%
1,000 – 2,499 471 4.53% 606,946 2.63%
2,500 – 4,999 133 1.28% 426,957 1.85%
5,000 – 7,499 87 0.84% 459,362 1.99%
7,500 – 9,999 27 0.26% 221,360 0.96%
10,000 – 19,999 68 0.65% 922,711 4.00%
20,000 – 29,999 31 0.30% 746,421 3.24%
30,000 – 49,999 29 0.28% 1,076,849 4.67%
50,000 – 69,999 19 0.18% 1,057,261 4.58%
70,000 – 99,999 11 0.11% 889,632 3.86%
100,000 – 149,999 17 0.16% 1,978,118 8.57%
150,000 – 249,999 6 0.06% 1,013,756 4.39%
250,000 – 499,999 9 0.09% 3,193,723 13.84%
500,000 – 999,999 7 0.07% 4,573,179 19.82%
1,000,000 – 2,499,999 3 0.03% 4,889,872 21.20%
2,500,000 and up 0 0.00% 0 0.00%
TOTALS 10,399 100% $23,068,868 100% The 10,399 donors gave 17,103 gifts in FY 2010 Average (Mean) $2,218 for a total of $23,068,868. Median $60 Mode $50 NOTE: Please see page 116 for a breakdown of gifts by the Number of Gifts. *Donor category is based on total giving for the fiscal year. Only one donor is counted per gift even if two donors received credit. **Includes gifts-in-kind. Source: College Relations, October 2010

GIFTS FROM ALUMNI AND FRIENDS ORGANIZED BY NUMBER OF GIFTS For Fiscal Year Ended June 30, 2010
Number Percent of Dollar Percent of Dollar Range of Gifts Total # of Gifts Amount* Total $ Amount
Less than 10 2,038 11.92% 5,933 0.03%
10 – 24 2,819 16.48% 41,179 0.18%
25 – 49 3,913 22.88% 104,953 0.45%
50 – 99 2,769 16.19% 146,167 0.63%
100 – 199 2,639 15.43% 275,678 1.20%
200 – 499 1,321 7.72% 330,977 1.43%
500 – 749 507 2.96% 260,818 1.13%
750 – 999 26 0.15% 21,294 0.09%
1,000 – 2,499 546 3.19% 698,035 3.03%
2,500 – 4,999 159 0.93% 533,397 2.31%
5,000 – 7,499 115 0.67% 630,695 2.73%
7,500 – 9,999 33 0.19% 279,029 1.21%
10,000 – 19,999 85 0.50% 1,135,453 4.92%
20,000 – 29,999 39 0.23% 921,819 4.00%
30,000 – 49,999 23 0.13% 817,321 3.54%
50,000 – 69,999 14 0.08% 737,360 3.20%
70,000 – 99,999 9 0.05% 750,105 3.25%
100,000 – 149,999 21 0.12% 2,367,111 10.26%
150,000 – 249,999 8 0.05% 1,393,990 6.04%
250,000 – 499,999 10 0.06% 3,358,009 14.56%
500,000 – 999,999 6 0.04% 4,375,467 18.97%
1,000,000 – 2,499,999 3 0.02% 3,884,079 16.84%
2,500,000 and up 0 0.00% 0 0.00%
TOTALS 17,103 100% $ 23,068,868 100%
The 10,399 donors gave 17,103 gifts in FY 2010 Average (Mean) $1,349 for a total of $23,068,868. Median $40 Mode $25 NOTE: Please see page 115 for a breakdown of gifts by the Number of Donors. *Includes gifts-in-kind. Source: College Relations, October 2010

FINANCIAL HIGHLIGHTS YEARS ENDED JUNE 30, 2010 AND 2009
2010 2009 OPERATING REVENUE $ 77,512,252 $ 77,972,937 OPERATING EXPENSES $ 70,533,608 $ 69,161,495 OPERATING REVENUE IN EXCESS OF EXPENSES FROM CONTINUING OPERATIONS $ 6,978,644 $ 8,811,442 ADDITIONS TO PROPERTY, PLANT AND EQUIPMENT $ 3,798,358 $ 13,796,859 LONG-TERM INVESTMENTS OF THE ENDOWMENT AND TUITION REPLACEMENT FUNDS Original gift value $ 415,845,028 $ 399,186,430 Investments at market $ 846,776,300 $ 791,209,800 Interest and dividends, net $ 15,037,490 $ 16,126,355 Return 1.9% 1.6% Market price increase (decrease) $ 72,163,789 $ (228,120,519) Return 9.1% -22.4% Total return $ 87,201,279 $ (211,994,164) Percent – time weighted 11.0% -20.8% CASH AND IN-KIND CONTRIBUTIONS Cash Gifts $ 8,164,724 $ 7,501,667 Bequests 14,832,217 28,281,948 Total cash gifts 22,996,941 35,783,615 Gifts-in-kind 71,927 57,410 Total $ 23,068,868 $ 35,841,025
Source: Office of Financial Affairs, September 2010

2010 2009ASSETS
CURRENT ASSETSCash and cash equivalents 40,837,127$ 25,541,383$ Accured interest on investments 1,762,341 1,580,307 Accounts and notes receivable 1,857,552 3,564,530 Inventories 1,297,289 1,434,029 Prepaid expenses and other assets 218,910 114,815 Contributions receivable and bequests in probate 5,962,871 7,678,037 Total current assets 51,936,090 39,913,101
PREPAID EXPENSES AND OTHER ASSETS 1,479,988 2,727,392
CONTRIBUTIONS RECEIVABLE AND BEQUESTS IN PROBATE 3,937,319 2,655,285
LONG-TERM RECEIVABLES 2,275,039 1,312,799
LONG-TERM INVESTMENTSDonor-restricted endowment 474,089,600 445,508,900 Tuition replacement 372,686,700 345,700,900 Annuity and life income 24,440,500 22,790,400 Funds held in trust by others 21,010,200 18,860,900 Total long-term investments 892,227,000 832,861,100
BOND PROCEEDS FOR CAPITAL ADDITIONS 499,756 3,265,911
PROPERTY, PLANT AND EQUIPMENT (net) 147,068,227 149,801,990
Total assets 1,099,423,419$ 1,032,537,578$
LIABILITIES AND NET ASSETS
CURRENT LIABILITIESAccounts payable and accrued expenses 6,197,690$ 4,991,781$ Accrued salaries and wages 3,620,383 2,792,342 Deposits and agency funds 467,373 475,517 Deferred income 141,973 144,722 Current maturities of long-term debt 1,995,177 1,914,982 Total current liabilities 12,422,596 10,319,350
LONG-TERM LIABILITIESActuarial liability for annuities payable and other liabilities 17,079,963 15,530,163 Long-term debt 59,565,390 62,060,567 Total long-term liabilities 76,645,353 77,590,730
Total liabilities 89,067,949 87,910,080
NET ASSETSUnrestricted 661,168,384 615,759,311 Temporarily restricted 91,832,128 81,449,675 Permanently restricted 257,354,958 247,418,512 Total net assets 1,010,355,470 944,627,498
Total liabilities and net assets 1,099,423,419$ 1,032,537,578$
Source: Office of Financial Affairs, October 2009Office of Financial Affairs, September 2010
STATEMENTS OF FINANCIAL POSITIONJune 30, 2010 and 2009

STATEMENT OF ACTIVITIESYEARS ENDED JUNE 30, 2010 AND 2009
2010 2009
OPERATING REVENUE
Spendable return from long-term investments 43,414,336$ 44,950,728$ Gifts and donations 5,155,856 5,351,568Federal grants 7,325,378 7,421,522Cost of education fees paid by federal and state scholarships 3,200,708 2,755,000Fees paid by students 1,374,208 1,508,813Other income 3,079,816 2,462,116Residence halls and food service 7,572,472 7,516,824Student industries and rentals 3,948,026 3,263,481Net assets released from restrictions 5,282,545 5,765,578
Gross operating revenue 80,353,345 80,995,630 Less: Student aid (2,841,093) (3,022,693)
Net operating revenue 77,512,252 77,972,937
OPERATING EXPENSESProgram Services --
Educational and general 46,115,392 44,285,917 Residence halls and food service 6,797,457 7,107,081Student industries and rentals 5,253,934 5,309,036
Total program services 58,166,783 56,702,034
Support services 12,366,825 12,459,461
Total operating expenses 70,533,608 69,161,495
Operating revenue in excess of operating expenses from continuing operations 6,978,644 8,811,442
OTHER CHANGES IN NET ASSETSGain on sale of property, plant, and equipment 54,333 91,849Loss on valuation of interest rate swaps (1,418,500) (2,085,100)Investment return more (less) than amounts designated
for current operations 41,057,202 (267,365,773) Gifts and bequests restricted or designated for long-
term investments 15,545,872 19,817,309Restricted gifts for property, plant and equipment and
other specific purposes 1,934,008 1,180,962Restricted spendable return on endowment investments 4,879,041 5,596,981Reclassification of net assets released from restrictions (5,282,545) (5,765,578)Net adjustment of annuity payment and deferred giving
liability 1,979,917 (4,316,083)
Total change in net assets 65,727,972$ (244,033,991)$
Source: Office of Financial Affairs, September 2010

TEN-YEAR SUMMARY OF MARKET VALUES AND HISTORICAL BOOK VALUES
Fiscal Year-End Market Value Historical Of Long-Term Book June 30, Investments Value* 2001 788,263,200 231,656,539 2002 716,522,800 253,657,334 2003 695,812,000 270,794,617
2004 794,962,600 291,178,337 2005 861,678,500 310,184,731 2006 948,737,700 328,194,014 2007 1,102,272,000 349,235,652
2008 1,023,254,700 368,689,457 2009 791,209,800 399,186,430 2010 846,776,300 415,845,028 *Historical Book Value represents the accumulated value of all additions to long-term investments from inception.
Source: Office of Financial Affairs, September 2010
0
200
400
600
800
1000
1200
2001 2002 2003 2004 2005 2006 2007 2008 2009 2010
Mill
ions
of D
olla
rs
Fiscal Year Ended June 30,
GROWTH IN LONG-TERM INVESTMENT VALUES
Fiscal Year-End Market Value Of Long Term Investments
Historical Book Value

ASSET ALLOCATION OF LONG-TERM INVESTMENTS YEARS ENDED JUNE 30, 2010 AND 2009
2010 2009 Endowment and Tuition Replacement: Pooled Investments - U.S. equities $ 205,822,200 $ 225,920,800 International equities 179,622,600 164,560,000 Corporate notes and bonds 85,026,300 76,710,900 U.S. Government securities 42,751,900 37,327,300 Foreign bonds 692,100 735,400 Structured notes 34,074,000 30,085,700 Private equity – venture capital 5,302,600 8,709,600 Private equity – buy out 26,876,700 20,537,900 Private equity – debt funds 10,623,700 7,318,200 Private equity – fund of funds 39,779,400 41,234,700 Hedge funds 125,520,700 110,087,200 Real estate 19,112,000 895,800 Short-term investments and cash 68,532,500 64,068,900 Total 843,736,700 788,192,400 Non Pooled Investments - U.S. equities 31,200 11,500 Real estate 2,978,500 2,978,500 Short-term investments and cash 29,900 27,400 Total 3,039,600 3,017,400
Total endowment and tuition replacement 846,776,300 791,209,800
Annuity and Life Income:
Pooled Annuity Investments – U.S. equities 5,497,300 5,572,900
International equities 2,898,200 2,918,100 Corporate notes and bonds 1,633,400 1,237,100 U.S. Government securities 1,642,600 1,770,700 Short-term investments and cash 399,100 191,600 Total 12,070,600 11,690,400 Separately Invested Trusts - U.S. equities 4,727,300 4,383,200 International equities 2,532,100 2,341,200 Corporate notes and bonds 2,937,200 2,313,000 U.S. Government securities 1,561,100 1,455,700
Real estate Insurance policies
330,000 67,500
330,000 -
Short-term investments and cash 214,700 276,900 Total 12,369,900 11,100,000 Total annuity and life income 24,440,500 22,790,400 Funds Held in Trust by Others:
Where Berea College receives all or a stipulated percent of income 21,010,200 18,860,900
Total long-term investments $ 892,227,000 $ 832,861,100
Source: Office of Financial Affairs, September 2010

FISCAL YEAR 2010-2011 OPERATING BUDGET HIGHLIGHTS
SOURCES OF REVENUES USED FOR EDUCATIONAL AND GENERAL PURPOSES
Endowment Spendable Return $ 27,649,200 74.4% Gifts for Current Operations $ 4,000,000 10.8% Federal and State Sources $ 4,380,000 11.8% Other Miscellaneous Income $ 1,123,000 3.0% Net Loss from Student Industries $ (22,200) and Rentals 0.0%
$ 37,130,000
Source: Office of Financial Affairs, September 2010

2010-11 2009-2010 Dollar PercentageBudget Budget Change Change
REVENUES
Gross Endowment Income 39,291,400$ 40,715,000$ (1,423,600)$ -3.50%Less: Capital and Plant Fund (4,856,500) (5,174,400) 317,900 -6.14% TCERF (6,785,700) (3,790,300) (2,995,400) 79.03%
Net Endowment Income 27,649,200 31,750,300 (4,101,100) -12.92%
Gifts for Current Operations 4,000,000 3,800,000 200,000 5.26%Cost of Education Fees 3,450,000 3,050,000 400,000 13.11%Federal Work Study Grant 930,000 938,000 (8,000) -0.85%Fees Paid by Students 633,000 633,000 - -Other Income 490,000 490,000 - -
TOTAL 37,152,200 40,661,300 (3,509,100) -8.63%
Student Industries and Rentals 4,750,100 5,039,800 (289,700) -5.75%Residence Halls and Food Service 7,494,000 7,402,000 92,000 1.24%
TOTAL REVENUES 49,396,300 53,103,100 (3,706,800) -6.98%
EXPENDITURES
Educational and General 37,130,000 40,489,100 (3,359,100) -8.30%
Student Industries and Rentals 4,772,300 5,212,000 (439,700) -8.44%
Residence Halls and Food Service 7,494,000 7,402,000 92,000 1.24%
TOTAL EXPENDITURES 49,396,300 53,103,100 (3,706,800) -6.98%
Excess of Revenues over Expenditures $ - $ - $ -
Source: Office of Financial Affairs, September 2010
CURRENT OPERATING BUDGET

2010-11 2009-10 Dollar PercentageBudget Budget Change Change
REVENUES
Gross Endowment Income 39,291,400$ 40,715,000$ (1,423,600)$ -3.50%Less: Capital and Plant Fund (4,856,500) (5,174,400) 317,900 -6.14% TCERF (6,785,700) (3,790,300) (2,995,400) 79.03%
Net Endowment Income 27,649,200 31,750,300 (4,101,100) -12.92%
Gifts for Current Operations 4,000,000 3,800,000 200,000 5.26%Cost of Education Fees 3,450,000 3,050,000 400,000 13.11%Federal Work Study Grant 930,000 938,000 (8,000) -0.85%Fees Paid by Students 633,000 633,000 - -Other Income 490,000 490,000 - -Student Industries and Rentals (22,200) (172,200) 150,000 -87.11%Residence Halls and Food Service - - - -
TOTAL REVENUE 37,130,000 40,489,100 (3,359,100) -8.30%
EXPENDITURES
Salaries and Wages 20,504,700 22,438,750 (1,934,050) -8.62%Salary Churn (300,000) (350,000) 50,000 -14.29%Net Salaries and Wages 20,204,700 22,088,750 (1,884,050) -5.80%
Fringe Benefits 5,229,300 5,759,300 (530,000) -9.20%Student Payroll 2,905,000 2,905,000 - -Net Controllable Expense 8,138,000 8,983,050 (845,050) -9.41%Computer Capital Fund 448,000 448,000 - -Equipment Reserve 102,000 202,000 (100,000) -49.50%Strategic Planning Initiatives 103,000 103,000 - -
TOTAL EXPENDITURES 37,130,000 40,489,100 (3,359,100) -8.30%
Excess of Revenues over Expenditures $ - $ - $ -
Source: Office of Financial Affairs, September 2010
EDUCATIONAL AND GENERAL BUDGET SUMMARY

2005-06 % of 2006-07 % of 2007-08 % of 2008-09 % of 2009-10 % ofClassification by Function Actual Total Actual Total Actual Total Actual Total Actual Total
Instruction 13,431,338$ 34.6% 13,376,736$ 35.3% 14,419,651$ 36.0% 14,573,495$ 36.1% $13,595,840 35.3%Public Service 500,696 1.3% 473,648 1.2% 665,021 1.7% 672,540 1.7% 655,061 1.7%Academic Support 3,915,217 10.1% 3,949,316 10.4% 4,376,280 10.9% 4,327,149 10.7% 4,327,826 11.2%Student Services and Activities 4,487,701 11.6% 4,589,786 12.1% 5,010,511 12.5% 5,011,224 12.4% 5,013,100 13.0%General and Administrative 5,752,119 14.8% 6,264,070 16.5% 6,450,592 16.1% 6,900,806 17.1% 6,644,302 17.2%Development and Alumni 3,209,703 8.3% 3,342,764 8.8% 3,640,952 9.1% 3,500,017 8.7% 3,102,891 8.0%Plant Operations 6,901,271 17.8% 5,301,984 14.0% 4,745,671 11.9% 4,594,491 11.4% 4,459,959 11.6%Capital and Special Projects 644,700 1.7% 641,500 1.7% 731,000 1.8% 753,000 1.9% 753,000 2.0%
TOTAL 38,842,745$ 100.0% 37,939,804$ 100.0% 40,039,678$ 100.0% 40,332,722$ 100.0% 38,551,979$ 100.0%
Source: Office of Financial Affairs, September 2010
CURRENT OPERATING EDUCATIONAL AND GENERAL EXPENDITURES5-Year History

RESIDENCE LIVING Academic Year 2010-2011
The fifteen traditional residence halls comprise an important component of a Berea College education. Varying in architecture, size, room arrangement and traditions, the residential experience is based on a shared sense of common good, something students should learn to value and seek to create throughout their lives. Via student staff and residents, a sense of community is fostered within each hall to provide an environment that is conducive to both academics and friendships. Both first-year and upperclassmen students live in the traditional residence halls. The Ecovillage is an ecologically-sustainable residential and learning complex designed to meet housing needs for student families, childcare for campus children, and provide a living/labor opportunity for students interested in sustainability. The Harrison-McLain Home Management House is utilized for the family resource management practicum and serves as an upper level female residence hall for selected departmental majors.
Traditional Residence Halls* Capacity Anna Smith 80 Bingham 71 Blue Ridge 100 Dana 132 Danforth 146 Edwards 33 Elizabeth Rogers (ER) 89 Estill St. Res. Complex 46 Fairchild 74 James 108 Kentucky 94 Kettering 146 Pearsons 118 Seabury 38 Talcott 88 Subtotal 1,363
Houses Home Management House 11 Family Housing Ecovillage 65 Farm Houses/College Buildings Head House 1 Hunt Acres Farm House 3 Subtotal 4
TOTAL 1,443 Capacity for Women (845) Capacity for Men (589)
Source: Residential Life Services and Collegium, October 2010 <http://www.berea.edu/residentiallifecollegium/>

CAPITAL CONSTRUCTION PROJECTS, 1980 - 2010
New Construction
Date Project 1980 Racquetball Courts 1993 Campus Child Care Program
1980 Ross Jelkyl Drama Building 1994 Seabury Center 1982 Farm Mix Mill and Hog Feeding Floor 1995 Farrowing House – College Farms 1982 Athletic Track 1995 Tennis Courts 1983 Mueller Woodcraft Building Track 1996 Tennis Pavilion 1988 Married Student Housing 2004 Child Development Laboratory at EcoVillag 1990 Hutchins Library Addition 2006 Central Plant Building/Distribution 1990 Computer Center Addition 2009 Fee Glade 1993 Married Student Housing
Renovations Date Project 1980 Elizabeth Rogers Residence Hall 1999 Phelps-Stokes Air Conditioning 1981 Pearsons Hall Fire Escape 1999 Alumni Building Remodel 1981 Kentucky Residence Hall 1999 Appalachian Center/Bruce Building 1981 James Residence Hall 1999 Student House/Jackson Street (Knight House) 1983 Goldthwaite Agriculture Building 1999 Danforth Residence Hall and Addition 2000 Kettering Residence Hall
1983 Science Hall Renovation and Addition 2000 Bruce/Trades (phase one) 1985 President's Home 2000 Draper Carillon 1986 Talcott Residence Hall 2001 Bruce/Trades (phase two)/Connector 1987 Frost Basement - Computer Lab 2001 Blue Ridge Residence Hall 1987 ARC House Renovation 2001 Student Parking Lot Improvements 1987 Pearson Residence Hall 2002 Draper Building 1988 Boone Tavern 2002 Kentucky Residence Hall 1988 Blue Ridge Residence Hall 2002 Art Gallery Addition 1989 Kentucky Annex 2002 Soccer Field Complex 1990 Hutchins Library Renovation 2002 College Bookstore Renovation 1990 Berea College Health Service 2002 Computer Center Renovation 1991 Draper Building - Center for Effective 2003 Talcott/Annex Residence Hall Renovation Communication 2003 Presser Hall Renovation 1991 Lincoln Hall Basement - 2003 Lincoln Hall Renovation Duplicating Services Center 2003 EcoVillage Apartments 1992 Utilities/Laundry 2003 EcoVillage SENS House 1992 Students for Appalachia – Trades 2003 Baseball/Softball Fields Building 2004 James Hall Renovation 1993 Alumni Building 2004 Boone Tavern Garage Renovation for: 1993 Draper Classrooms Public Relations Department 1994 President’s Home Visitors Center at College Square 1994 Alumni Building 2005 Central Plant 1994 Boone Tavern 2006 Campus Building Retro Fits 1996 Edwards 1st & 2nd floors (Administrative Offices) 2006 Resurfacing of the Track 1997 Resurfacing of Track 2006 Sturt Cottage 1997 Systems upgraded in Dana Residence Hall 2007 Haaga House 1997 Phelps Stokes – Seating and Refinishing 2007 Pearsons Residence Hall 1998 Married Student Laundry 2007 Middletown School 1998 Frost Renovation 2008 Appalachian Center Gallery Renovation 1998 Food Service Renovation 2008 Elizabeth Rogers Renovation 1998 Science Laboratories 2008 Edwards 3rd Floor (Residence Hall) Renovation 1998 Computer Center 2008 Seabury Center Gym Floor Replacement 1999 Craft Center 2009 Emery Building 1999 Crossroads Complex 2009 Boone Tavern 1999 Fairchild Residence Hall 2009 Edwards 3rd Floor (Residence Hall) (phase two) 1999 Log House Remodel 2010 Berea Dining (Renovation) Source: Facilities Management, October 2010

HUTCHINS LIBRARY (Fiscal Year 2010)
Total Net Total Number Added During Held at End of Library Collect ions Fiscal Year Fiscal Year Print Collection (books, bound serials and government documents) Volumes (item count) 5,379 386,797 Media Collection (phono records, videos, CDs, DVDs and audio tapes) Volumes (item count) 153 13,426 Electronic Collection E-books and cataloged websites 3,418 75,307 Digitized audio (hours) 488 2,225 Berea Digital (pages/images) 5,637 7,326 Microforms (books, journals and newspapers) Physical units 307 147,987 Serials (journals and serials) Print and microform subscriptions: journals and serials (391) 449 Electronic titles: journals and serials (56) 983 Full-text journals available through databases 6,123 43,277 Manuscripts and Archives (in linear feet) 104 5,044 Dollar Library Expenditures Amount Books – paper and microforms $ 78,106 Periodicals– paper and microforms 60,089 Serials – paper and microforms 18,476 Electronic resources 171,094 Media 10,776 Microform 30,816 Preservation 8,888 TOTAL ACQUISITIONS EXPENDITURES $ 378,245 Acquisitions Expenditures per Student $ 253 Source: Hutchins Library, October 2010 < http://www.berea.edu/hutchinslibrary/>

HUTCHINS LIBRARY, continued (Fiscal Year 2010)
Library Services Main Library hours open per week 94.25 Special Collections hours open per week 26.00 Library Instruction – General Studies Program Sessions GSTR 110 (first year) 27 GSTR 210 (first year) 28 Other General Studies Courses 8 Other Courses 25 Special Collections 13 Outside Groups 4 TOTAL 105 Percentage of GSTR First-Year courses with library sessions GSTR 110 100% GSTR 210 100% Reference and Research Assistance Library Reference Desk Transactions Total 4,385 Research Consultations 24 Special Collections Reading Room Visits Total 727 Special Collections Reference Requests (non-visits) 488 Computer Access Public Access Workstations 12 Public Network Connections 102 Wireless Network Connections Yes Average per Circulation Transactions Number Student FTE Print and media collections – faculty and staff 8,876 Print and media collections – students 33,961 20.9 Print collections – town 1,258 TOTAL 44,095 Reserve materials 12,264 Equipment (computers and media) uses 831 Classrooms and study rooms uses 7,466 Special Collections uses 1,411 Electronic collection searches 216,887 Berea Digital searches 26,178 Interlibrary Loan Number Provided to other libraries 3,345 Received from other libraries 2,448 Source: Hutchins Library, October 2010 <http://www.berea.edu/hutchinslibrary/>

INFORMATION SYSTEMS AND SERVICES
Information Systems and Services (IS&S) supports the campus information and communications infrastructure in support of student success and institutional effectiveness. This includes instructional and media technologies, administrative systems, analytical tools, web/portal applications, wireless, VOIP and much more. IS&S serves the College’s mission by maintaining a robust technology infrastructure designed to address current needs and future growth. Technology Infrastructure:
Campus Network: The campus is connected electronically by a fiber optic network backbone which provides access to resources from every residence hall, administrative, and academic building. Wireless network connectivity is provided in all academic and administrative buildings and residence hall lounges as well as the Quad, Crossroads, and Fee Glade outdoor spaces. The campus network is secured by Microsoft Active Directory account management and by Cisco Clean Access network access control. The network is subdivided into VLAN’s to allow appropriate restrictions to traffic between different areas of the campus. Communications Capabilities: All faculty, staff, and students have e-mail accounts using Microsoft Exchange 2007 Server and Microsoft Outlook, available both on campus and via the Internet. E-mail accounts are also offered to retirees. The e-mail system includes public folders in which announcements or discussion interactions can be posted for all to see. All faculty and staff offices and each residence hall room have telephone extensions set up on the campus PBX system. Network-based VoIP phones are in use in several departments, and over time the Cisco VoIP Call Manager will replace the Nortel Meridian PBX system. AT&T cell phones or PDA phones are provided to staff who need mobile communication for their jobs. Desktop Computers and Software: IS&S supports a large inventory of desktop and laptop computers for use by students, faculty, and staff. Dell computers are the standard system, though some faculty and staff use Apple computers due to the requirements of their discipline. IS&S is qualified as a self- maintainer for both Dell and Apple computers so all computer repairs can be accomplished quickly on site. Software site licenses are provided for Microsoft Office 2007, Filemaker Pro, EndNote, and McAfee Antivirus, making these functions available to all faculty, staff, and students. Concurrent user licenses are available for many software packages used in teaching and for Adobe Creative Suite CS5 graphics and publishing programs and SPSS basic statistics used for both academic and administrative functions. Internet Access: The campus is connected to the Internet via Kentucky’s KPEN statewide contract. The current setup provides 100 Megabits/second bandwidth into and out of the campus. Campus systems are protected from hackers, viruses, and other threats by industry standard firewall, enterprise-wide virus protection and web-filtering devices. Bandwidth is managed by a packet-shaping device to give priority to teaching and learning over recreational use. Network Resources: In addition to e-mail, the network connects users to various servers which provide file storage space or specific applications. Applications include the Moodle course management system, the ID card and access control system, FileMaker database servers, the BANNER administrative database system, the MyBerea web portal, and the Berea.edu website. The Equitrac Express print management system operated by the Printing Services department manages all network-connected laser printers and copiers. All campus copiers are multi-function devices that can also be used as scanners or printers. Technical Support: IS&S operates a Help Desk providing phone support for faculty, staff and students who have computer or phone problems or who need instruction in using computers, phones, or core software. Laptop computer users can also bring their computer to the Computer Center for assistance or for repair service. IS&S student and staff technicians are available to come to faculty and staff offices to troubleshoot and repair computers. Media Services, also located in the Computer Center, provides support for projectors and other audio-visual equipment used in classrooms or for meetings and projects. The Computer Center services are open 8-5 on weekdays. Source: Information Systems and Services, October 2010

INFORMATION SYSTEMS AND SERVICES, continued
Supporting Institutional Effectiveness:
Enterprise Data Systems: The College uses the Banner software from Sungard Higher Education, an integrated administrative system for financial, student records, financial aid, human resources/payroll, and alumni/development functions. The Student, Finance, and Employee self-service modules of Banner allow for access to Banner information and functions through the MyBerea portal. BANNER is supplemented by NOLIJ, a document image management system which stores electronic copies of applications for admission, financial aid statements, purchase orders, invoices, and other documents. MyBerea Portal: The MyBerea portal brings together a wide range of information, functions, and links to make faculty and staff work life easier and more efficient. Faculty can view their class schedules, class lists, advisees’ transcripts and grades, and manage their advisees’ registration process using self-service functions. Faculty and staff can view e-mail as well as personal employment and payroll information. Moodle learning management system and Banner administrative system can be accessed via the portal when applicable. Personal Computers and Phones: All faculty and most staff are provided with a personal laptop or desktop computer for personal productivity and for access to e-mail and other campus network resources and the Internet. Faculty and staff offices are equipped with telephones for communication on and off campus, and cell phones are provided to staff who need mobile communication for their job function. Specialized Applications: Specialized applications support various administrative functions across campus including Chemical Inventory, Electronic Lock Access Management, ID Card production, Printer/Copier control/payment, Health Clinic appointment scheduling and others. IS&S assists departments with selecting software to be sure it will function well on the network and standard computing equipment. IS&S will also establish and refine appropriate operational and support structures as appropriate to support new and emerging technologies. Functional support for specialized software is typically obtained directly from software providers.
Statistics: 2009-10 2010-11
Technology Infrastructure: Internet Connection Speed (megabits/second) 65 100 Network Backbone Speed (megabits/second) 20,000 20,000 Network Ports 7,000 7,000 Campus phone extensions 2,180 2,180 Personal computers 2,664 2,850 Networked printers 126 124 Networked MFD/copiers 52 61 Supporting Student Success: Student laptop computers 1,543 1,700 Computers in Campus labs 0 50 Computers in departmental labs 105 105 Classrooms with 1 port per seat 37 37 Classrooms with Wireless Network 8 117 Classrooms with projectors 72 73 Classrooms with multimedia input 52 53 Other meeting rooms with projectors and multimedia input 20 20 Courses utilizing Learning Management System 371 443 Supporting Institutional Effectiveness: Staff and Faculty Computers 658 722 Campus Phones 705 705 Mobile Phones 60 62
Source: Information Systems and Services, October 2010

INFORMATION SYSTEMS AND SERVICES, continued
Supporting Student Success:
Academic Software: Students have access to a wide range of software applicable to various academic disciplines. Most software will run on the EDGE laptop computers, though some are available only in specialized computer labs. Examples include Maple for mathematics and physics students, Autodesk products for CAD, ChemDraw for chemistry classes, Sibelius for music scoring, and Final Cut Express for video editing. Course Management System: The Moodle Learning Management System (LMS) allows faculty to manage courses online, to post course information and syllabus documents, to communicate with students, to facilitate student discussion and collaboration, to receive paperless assignment documents, and to access some electronic testing features. Students and faculty are able to access their Moodle account from the MyBerea portal via the campus network or over the Internet.
EDGE Laptop Program: The EDGE (Empowering a Dynamic Generation in Education) program provides a laptop computer for each student. The program is primarily funded through a special endowment.The laptop computers are able to run almost all of the software used in teaching, allowing students to gain much more experience with the software than was available in traditional computer labs. Computer labs remain for specialized software that require an Apple computer or that can be run more efficiently or at a lower cost in a lab environment. Faculty Support: Faculty are provided with technology tools for their teaching based on their particular discipline’s best practices and their personal style. Each professor has a laptop computer comparable to those in use by students, allowing him or her to develop electronic activities for students to engage in. Most classrooms are equipped with digital projectors and many also include multi-media systems providing a range of media input options. The Applied Technology Faculty Studio in the Hutchins Library is available to assist faculty with technology usage and to support students whose assignments require specialized software or equipment. The Media Services center is also available to faculty for checkout of audio-visual equipment and for media production services such as audio and video editing, poster and banner printing, media conversions and copying, and lamination. MyBerea Portal: MyBerea, launched in Spring 2008, brings together many information resources and self-service features utilized by students. It provides web-browser-based access to e-mail, the course management system, and many units of information that will be helpful to students navigating college life without requiring them to have special knowledge to find or access the resources. The portal interface to our Banner administrative system allows easy viewing of course schedules, grades, student financial accounts, and payroll information, and provides for self-service course registration and emergency contact updates. MyBerea also offers features to faculty and advisors that allow them to communicate with students and monitor their status. Specialized Equipment Access: Through the Applied Technology Faculty Studio, faculty can utilize technology that is not yet widely available in classrooms or labs. Examples might include high end digital audio and video editing software, smartboards, ipads, and classroom feedback clicker devices. IS&S staff and student technicians are available at the center to assist faculty with projects. Students and faculty can also check out equipment from the Media Services desk located in the Computer Center and use the equipment for projects. Examples of available equipment include portable PA systems, cameras, audio recorders and projectors.
Source, Information Systems and Services, October 2010