Fact Sheet - ENGIE
9
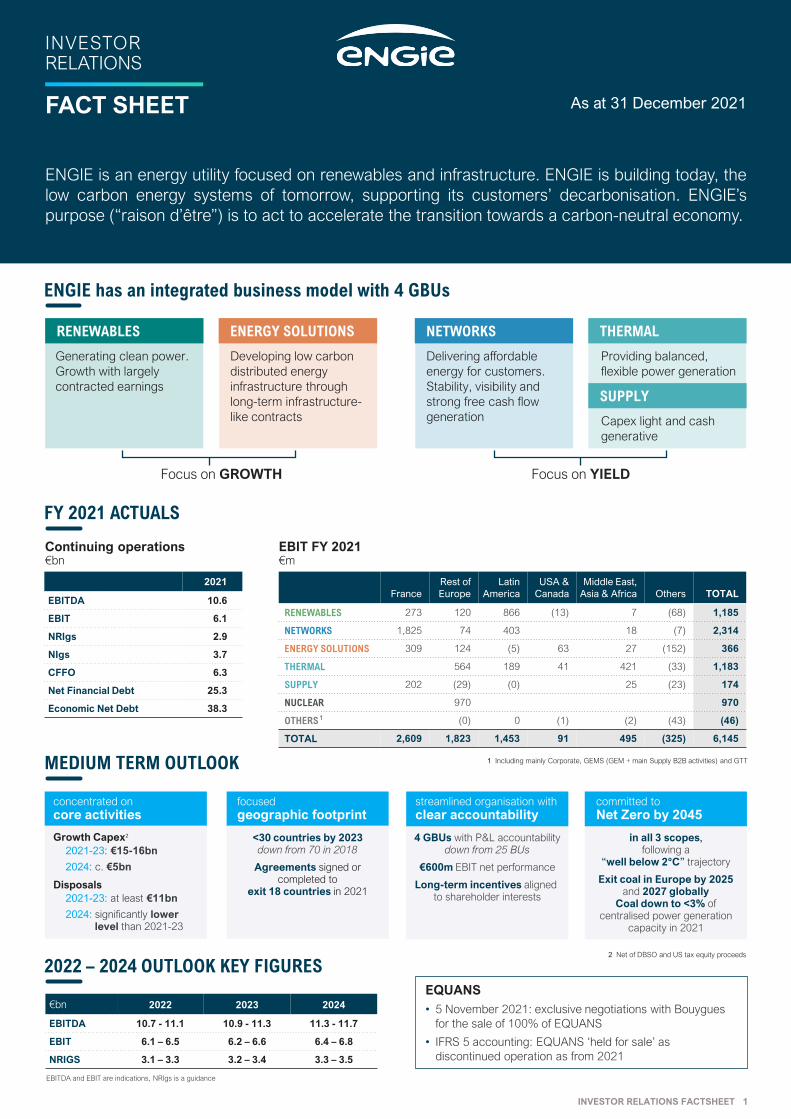
As at 31 December 2021 ENGIE is an energy utility focused on renewables and infrastructure. ENGIE is building today, the low carbon energy systems of tomorrow, supporting its customers’ decarbonisation. ENGIE’s purpose (“raison d’être”) is to act to accelerate the transition towards a carbon-neutral economy. Generating clean power. Growth with largely contracted earnings INVESTOR RELATIONS FACT SHEET RENEWABLES ENERGY SOLUTIONS NETWORKS THERMAL Developing low carbon distributed energy infrastructure through long-term infrastructure- like contracts Delivering affordable energy for customers. Stability, visibility and strong free cash flow generation Providing balanced, flexible power generation Capex light and cash generative SUPPLY Focus on YIELD Focus on GROWTH France Rest of Europe Latin America USA & Canada Middle East, Asia & Africa Others TOTAL RENEWABLES 273 120 866 (13) 7 (68) 1,185 NETWORKS 1,825 74 403 18 (7) 2,314 ENERGY SOLUTIONS 309 124 (5) 63 27 (152) 366 THERMAL 564 189 41 421 (33) 1,183 SUPPLY 202 (29) (0) 25 (23) 174 NUCLEAR 970 970 OTHERS 1 (0) 0 (1) (2) (43) (46) TOTAL 2,609 1,823 1,453 91 495 (325) 6,145 2021 EBITDA 10.6 EBIT 6.1 NRIgs 2.9 NIgs 3.7 CFFO 6.3 Net Financial Debt 25.3 Economic Net Debt 38.3 FY 2021 ACTUALS Continuing operations €bn EBIT FY 2021 €m 1 Including mainly Corporate, GEMS (GEM + main Supply B2B activities) and GTT INVESTOR RELATIONS FACTSHEET 1 MEDIUM TERM OUTLOOK 4 GBUs with P&L accountability down from 25 BUs €600m EBIT net performance Long-term incentives aligned to shareholder interests in all 3 scopes, following a “well below 2°C” trajectory Exit coal in Europe by 2025 and 2027 globally Coal down to <3% of centralised power generation capacity in 2021 concentrated on core activities focused geographic footprint streamlined organisation with clear accountability committed to Net Zero by 2045 <30 countries by 2023 down from 70 in 2018 Agreements signed or completed to exit 18 countries in 2021 2021-23: €15-16bn 2024: c. €5bn 2021-23: at least €11bn 2024: significantly lower level than 2021-23 Growth Capex 2 Disposals 2 Net of DBSO and US tax equity proceeds EBITDA and EBIT are indications, NRIgs is a guidance 2022 – 2024 OUTLOOK KEY FIGURES €bn 2022 2023 2024 EBITDA 10.7 - 11.1 10.9 - 11.3 11.3 - 11.7 EBIT 6.1 – 6.5 6.2 – 6.6 6.4 – 6.8 NRIGS 3.1 – 3.3 3.2 – 3.4 3.3 – 3.5 EQUANS • 5 November 2021: exclusive negotiations with Bouygues for the sale of 100% of EQUANS • IFRS 5 accounting: EQUANS ‘held for sale’ as discontinued operation as from 2021 ENGIE has an integrated business model with 4 GBUs
-
Upload
khangminh22 -
Category
Documents
-
view
0 -
download
0
Transcript of Fact Sheet - ENGIE
As at 31 December 2021
ENGIE is an energy utility focused on renewables and infrastructure. ENGIE is building today, the
low carbon energy systems of tomorrow, supporting its customers’ decarbonisation. ENGIE’s
purpose (“raison d’être”) is to act to accelerate the transition towards a carbon-neutral economy.
Generating clean power.
Growth with largely
contracted earnings
INVESTORRELATIONS
FACT SHEET
RENEWABLES ENERGY SOLUTIONS NETWORKS THERMAL
Developing low carbon
distributed energy
infrastructure through
long-term infrastructure-
like contracts
Delivering affordable
energy for customers.
Stability, visibility and
strong free cash flow
generation
Providing balanced,
flexible power generation
Capex light and cash
generative
SUPPLY
Focus on YIELDFocus on GROWTH
France
Rest of
Europe
Latin
America
USA &
Canada
Middle East,
Asia & Africa Others TOTAL
RENEWABLES 273 120 866 (13) 7 (68) 1,185
NETWORKS 1,825 74 403 18 (7) 2,314
ENERGY SOLUTIONS 309 124 (5) 63 27 (152) 366
THERMAL 564 189 41 421 (33) 1,183
SUPPLY 202 (29) (0) 25 (23) 174
NUCLEAR 970 970
OTHERS1 (0) 0 (1) (2) (43) (46)
TOTAL 2,609 1,823 1,453 91 495 (325) 6,145
2021
EBITDA 10.6
EBIT 6.1
NRIgs 2.9
NIgs 3.7
CFFO 6.3
Net Financial Debt 25.3
Economic Net Debt 38.3
FY 2021 ACTUALS
Continuing operations€bn
EBIT FY 2021€m
1 Including mainly Corporate, GEMS (GEM + main Supply B2B activities) and GTT
INVESTOR RELATIONS FACTSHEET 1
MEDIUM TERM OUTLOOK
4 GBUs with P&L accountabilitydown from 25 BUs
€600m EBIT net performance
Long-term incentives aligned to shareholder interests
in all 3 scopes,following a
“well below 2°C” trajectory
Exit coal in Europe by 2025 and 2027 globally
Coal down to <3% of centralised power generation
capacity in 2021
concentrated on
core activitiesfocused
geographic footprintstreamlined organisation with
clear accountabilitycommitted to
Net Zero by 2045
<30 countries by 2023down from 70 in 2018
Agreements signed or completed to
exit 18 countries in 2021
2021-23: €15-16bn
2024: c. €5bn
2021-23: at least €11bn
2024: significantly lower level than 2021-23
Growth Capex2
Disposals
2 Net of DBSO and US tax equity proceeds
EBITDA and EBIT are indications, NRIgs is a guidance
2022 – 2024 OUTLOOK KEY FIGURES
€bn 2022 2023 2024
EBITDA 10.7 - 11.1 10.9 - 11.3 11.3 - 11.7
EBIT 6.1 – 6.5 6.2 – 6.6 6.4 – 6.8
NRIGS 3.1 – 3.3 3.2 – 3.4 3.3 – 3.5
EQUANS
• 5 November 2021: exclusive negotiations with Bouygues
for the sale of 100% of EQUANS
• IFRS 5 accounting: EQUANS ‘held for sale’ as
discontinued operation as from 2021
ENGIE has an integrated business model with 4 GBUs
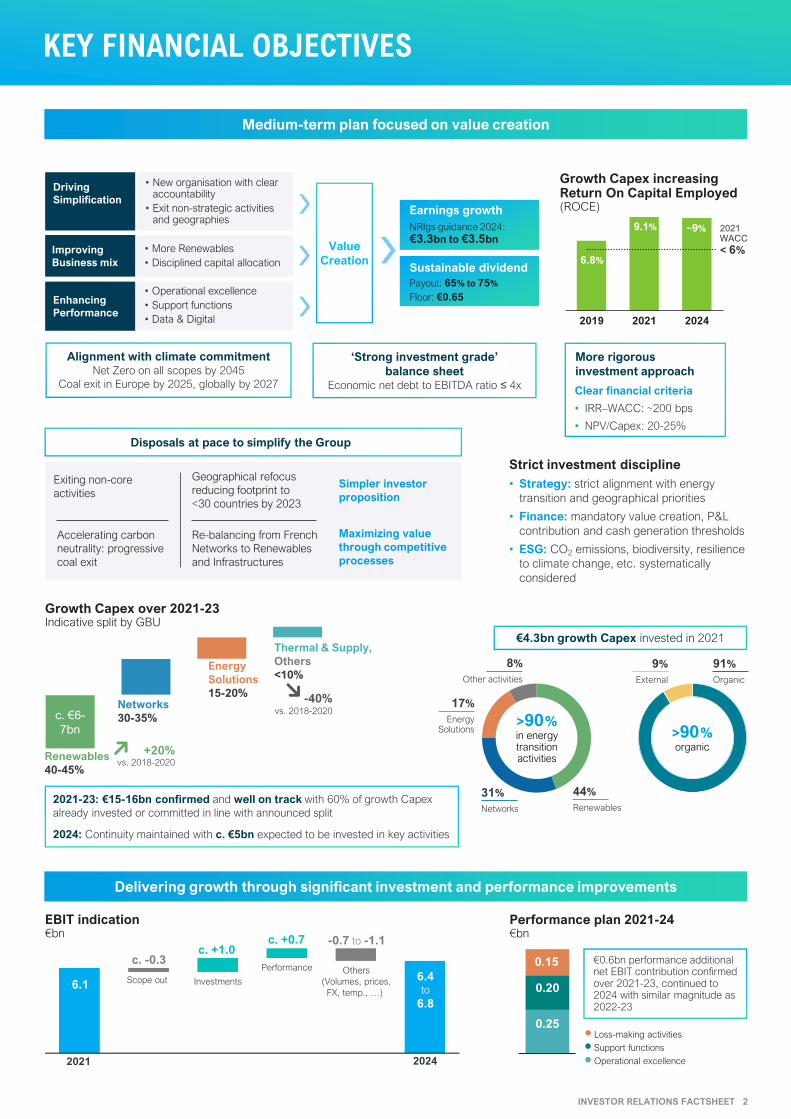
KEY FINANCIAL OBJECTIVES
Driving
Simplification
Improving
Business mix
Enhancing
Performance
• More Renewables
• Disciplined capital allocation
• Operational excellence
• Support functions
• Data & Digital
• New organisation with clear accountability
• Exit non-strategic activities and geographies
‘Strong investment grade’
balance sheetEconomic net debt to EBITDA ratio ≤ 4x
Alignment with climate commitmentNet Zero on all scopes by 2045
Coal exit in Europe by 2025, globally by 2027
Earnings growth
Sustainable dividend
NRIgs guidance 2024:
€3.3bn to €3.5bn
Payout: 65% to 75%
Floor: €0.65
Value
Creation
Re-balancing from French
Networks to Renewables
and Infrastructures
Exiting non-core
activities
Geographical refocus
reducing footprint to
<30 countries by 2023
Accelerating carbon
neutrality: progressive
coal exit
Simpler investor
proposition
Maximizing value
through competitive
processes
Medium-term plan focused on value creation
Growth Capex increasingReturn On Capital Employed(ROCE)
2019 2021 2024
6.8%
9.1% ~9% 2021 WACC
< 6%
Clear financial criteria
• IRR–WACC: ~200 bps
• NPV/Capex: 20-25%
Disposals at pace to simplify the Group
Strict investment discipline
• Strategy: strict alignment with energy
transition and geographical priorities
• Finance: mandatory value creation, P&L
contribution and cash generation thresholds
• ESG: CO2 emissions, biodiversity, resilience
to climate change, etc. systematically
considered
More rigorous
investment approach
Renewables
40-45%
Thermal & Supply,
Others
<10% Energy
Solutions
15-20%Networks
30-35%c. €6-
7bn
+20%vs. 2018-2020
-40%vs. 2018-2020
€4.3bn growth Capex invested in 2021
2021-23: €15-16bn confirmed and well on track with 60% of growth Capex
already invested or committed in line with announced split
2024: Continuity maintained with c. €5bn expected to be invested in key activities
Growth Capex over 2021-23Indicative split by GBU
-0.7 to -1.1
6.4to
6.8
c. +0.7c. +1.0
c. -0.3
6.1 Scope out Investments
Performance Others
(Volumes, prices,
FX, temp., …)
2021 2024
Delivering growth through significant investment and performance improvements
31%
Networks
>90%in energy transitionactivities
>90%organic
91%
Organic
9%
External
44%
Renewables
17%
EnergySolutions
8%
Other activities
EBIT indication€bn
0.25
0.20
0.15
Performance plan 2021-24€bn
Support functions
Operational excellence
Loss-making activities
€0.6bn performance additional net EBIT contribution confirmed over 2021-23, continued to 2024 with similar magnitude as 2022-23
INVESTOR RELATIONS FACTSHEET 2
2019 2020 2021
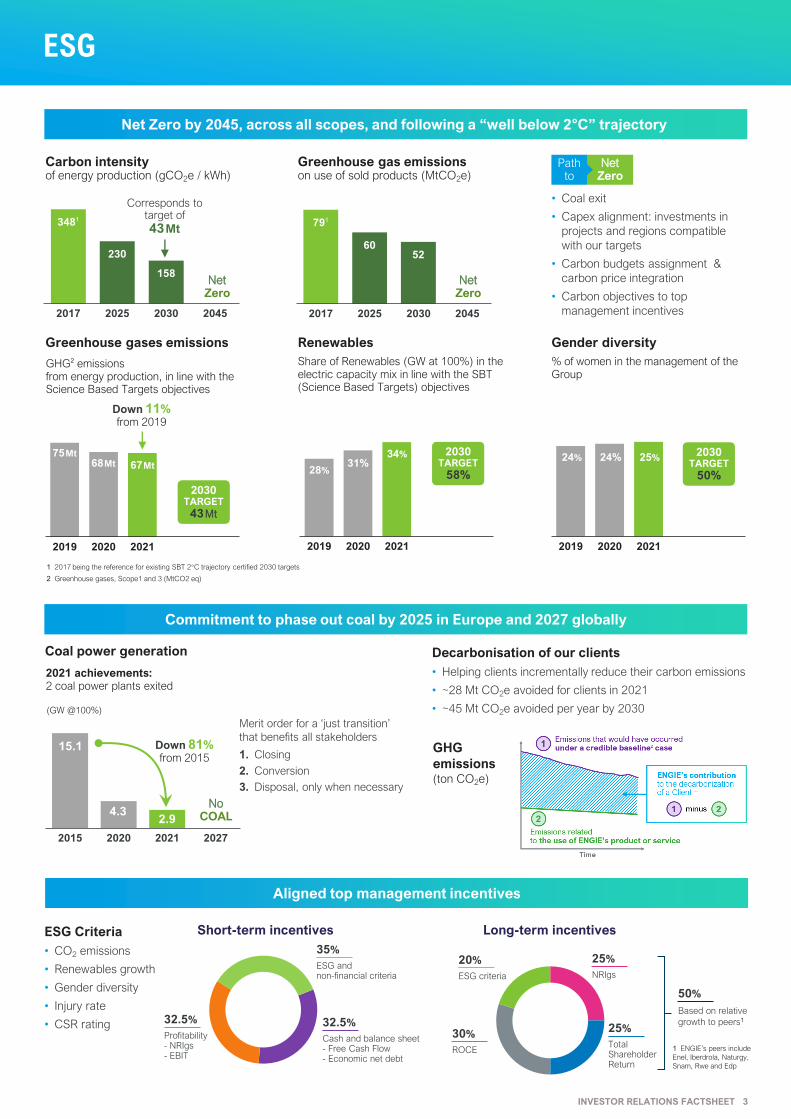
ESG
2019 2020 2021
Carbon intensityof energy production (gCO2e / kWh)
3481
230
158
2017 2025 2030 2045
791
6052
2017 2025 2030 2045
NetZero
Greenhouse gas emissions on use of sold products (MtCO2e)
68Mt 67Mt
75Mt
2019 2020 2021
2030TARGET
43Mt
GHG2 emissions from energy production, in line with the Science Based Targets objectives
Net Zero by 2045, across all scopes, and following a “well below 2°C” trajectory
Path to
• Coal exit
• Capex alignment: investments in
projects and regions compatible
with our targets
• Carbon budgets assignment &
carbon price integration
• Carbon objectives to top
management incentives
NetZero
Pathto
NetZero
Greenhouse gases emissions Renewables
Corresponds totarget of
43Mt
Down 11%from 2019
Share of Renewables (GW at 100%) in the electric capacity mix in line with the SBT(Science Based Targets) objectives
31%34%
28%
2030TARGET
58%
Gender diversity
% of women in the management of the Group
2030TARGET
50%
24% 25%24%
Commitment to phase out coal by 2025 in Europe and 2027 globally
Merit order for a ‘just transition’
that benefits all stakeholders
1. Closing
2. Conversion
3. Disposal, only when necessary
GHG
emissions(ton CO2e)
2015 2020 2021 2027
15.1
4.32.9
(GW @100%)
1 2017 being the reference for existing SBT 2°C trajectory certified 2030 targets
2 Greenhouse gases, Scope1 and 3 (MtCO2 eq)
2021 achievements: 2 coal power plants exited
Coal power generation Decarbonisation of our clients
• Helping clients incrementally reduce their carbon emissions
• ~28 Mt CO2e avoided for clients in 2021
• ~45 Mt CO2e avoided per year by 2030
NoCOAL
Down 81%from 2015
Short-term incentives Long-term incentives
Aligned top management incentives
ESG Criteria
• CO2 emissions
• Renewables growth
• Gender diversity
• Injury rate
• CSR rating 32.5%
Profitability- NRIgs- EBIT
32.5%
Cash and balance sheet- Free Cash Flow- Economic net debt
35%
ESG andnon-financial criteria
1 ENGIE’s peers include
Enel, Iberdrola, Naturgy,
Snam, Rwe and Edp
25%
NRIgs
25%
Total ShareholderReturn
20%
ESG criteria
30%
ROCE
50%
Based on relative
growth to peers1
INVESTOR RELATIONS FACTSHEET 3
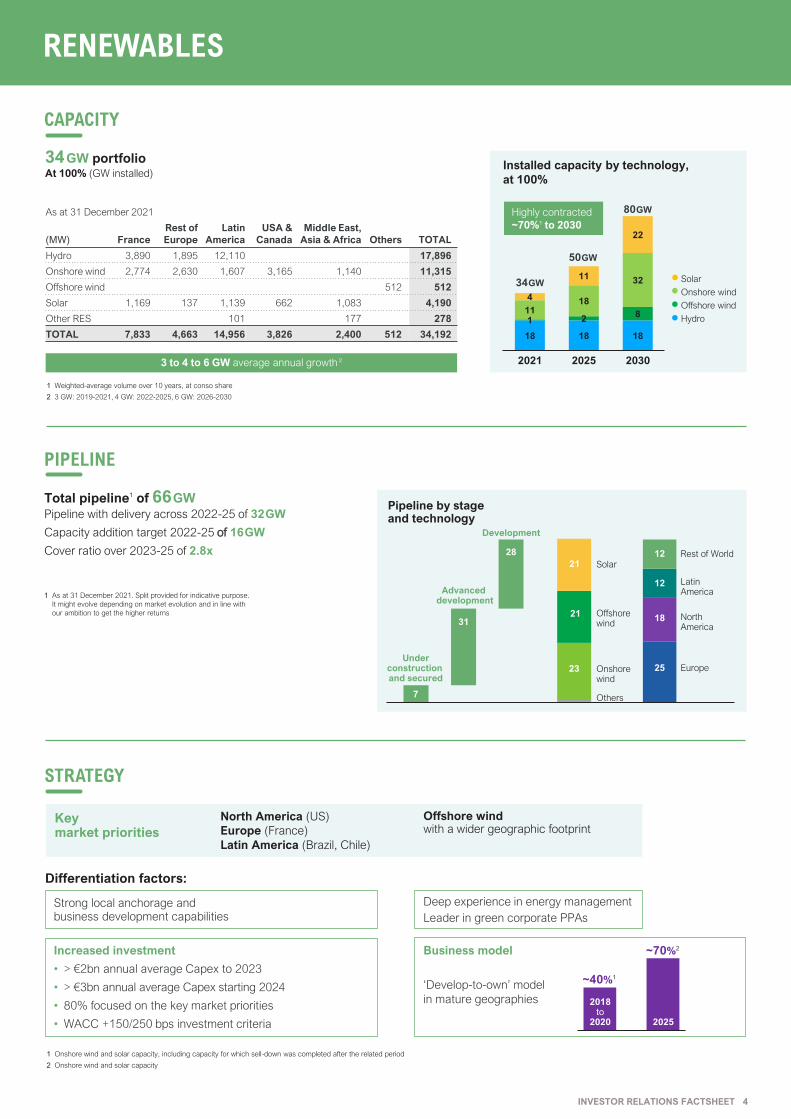
18 18 18
1 2811
18
32
4
11
22
2021 2025 2030
34GW
RENEWABLES
Hydro
Onshore wind
Offshore wind
Solar
Installed capacity by technology,
at 100%
3 to 4 to 6 GW average annual growth 2
34GW portfolioAt 100% (GW installed)
Highly contracted
~70%1 to 2030
As at 31 December 2021
(MW) France
Rest of
Europe
Latin
America
USA &
Canada
Middle East,
Asia & Africa Others TOTAL
Hydro 3,890 1,895 12,110 17,896
Onshore wind 2,774 2,630 1,607 3,165 1,140 11,315
Offshore wind 512 512
Solar 1,169 137 1,139 662 1,083 4,190
Other RES 101 177 278
TOTAL 7,833 4,663 14,956 3,826 2,400 512 34,192
CAPACITY
50GW
80GW
1 Weighted-average volume over 10 years, at conso share
2 3 GW: 2019-2021, 4 GW: 2022-2025, 6 GW: 2026-2030
PIPELINE
7
28
Underconstruction and secured
Advanceddevelopment
Pipeline by stage and technology
31
25
18
12
12
23
21
21
Total pipeline1 of 66GWPipeline with delivery across 2022-25 of 32GW
Capacity addition target 2022-25 of 16GW
Cover ratio over 2023-25 of 2.8x
Others
1 As at 31 December 2021. Split provided for indicative purpose.
It might evolve depending on market evolution and in line with
our ambition to get the higher returns Offshorewind
Onshorewind
Solar
LatinAmerica
Rest of World
Europe
North America
Key market priorities
North America (US)
Europe (France)
Latin America (Brazil, Chile)
Offshore wind with a wider geographic footprint
~40%1
~70%2
Strong local anchorage and business development capabilities
STRATEGY
1 Onshore wind and solar capacity, including capacity for which sell-down was completed after the related period
2 Onshore wind and solar capacity
Development
Differentiation factors:
Deep experience in energy management
Leader in green corporate PPAs
Increased investment
• > €2bn annual average Capex to 2023
• > €3bn annual average Capex starting 2024
• 80% focused on the key market priorities
• WACC +150/250 bps investment criteria
Business model
‘Develop-to-own’ model
in mature geographies
2025
2018to
2020
INVESTOR RELATIONS FACTSHEET 4
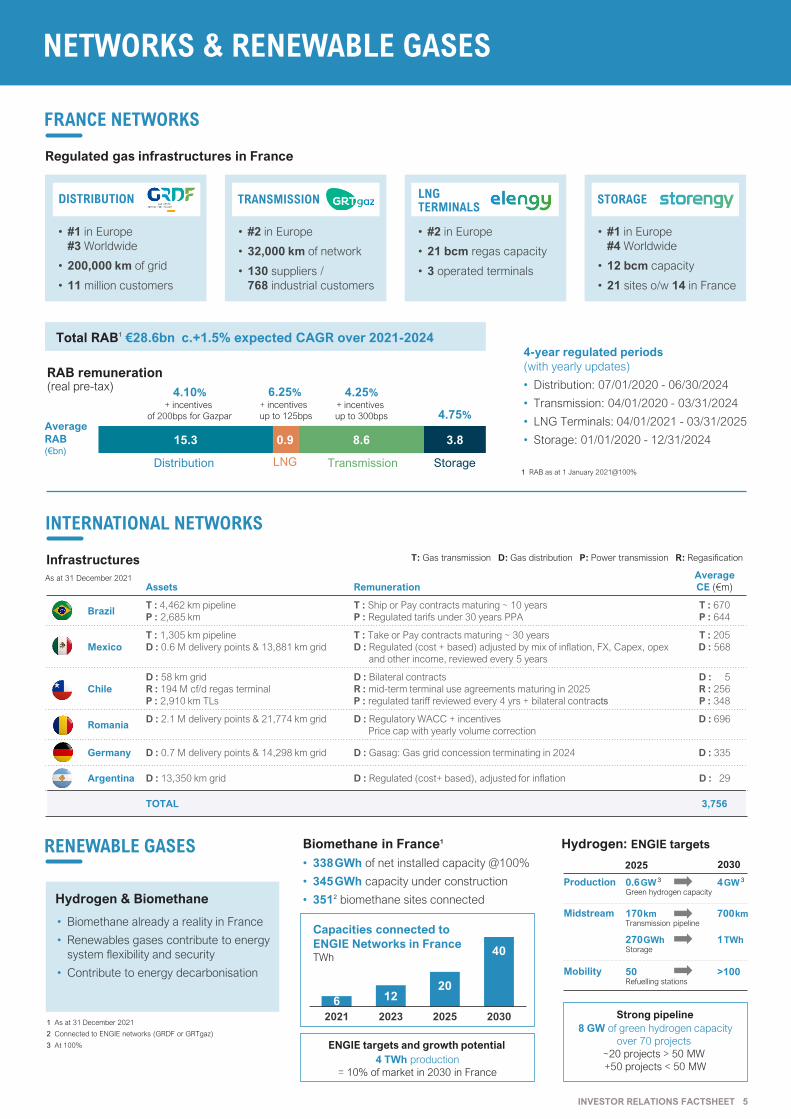
NETWORKS & RENEWABLE GASES
FRANCE NETWORKS
• #1 in Europe
#3 Worldwide
• 200,000 km of grid
• 11 million customers
• #2 in Europe
• 32,000 km of network
• 130 suppliers /
768 industrial customers
• #2 in Europe
• 21 bcm regas capacity
• 3 operated terminals
• #1 in Europe
#4 Worldwide
• 12 bcm capacity
• 21 sites o/w 14 in France
TransmissionDistribution LNG
4.25%+ incentives
up to 300bps
4.10%+ incentives
of 200bps for Gazpar
6.25%+ incentives
up to 125bps
RAB remuneration(real pre-tax)
Average
RAB(€bn)
0.9 8.615.3 3.8
4.75%
Storage
Regulated gas infrastructures in France
DISTRIBUTION TRANSMISSION LNGTERMINALS
STORAGE
4-year regulated periods
(with yearly updates)
• Distribution: 07/01/2020 - 06/30/2024
• Transmission: 04/01/2020 - 03/31/2024
• LNG Terminals: 04/01/2021 - 03/31/2025
• Storage: 01/01/2020 - 12/31/2024
Total RAB1 €28.6bn c.+1.5% expected CAGR over 2021-2024
1 RAB as at 1 January 2021@100%
INTERNATIONAL NETWORKS
Infrastructures
Assets Remuneration
Average
CE (€m)
BrazilT : 4,462 km pipeline
P : 2,685 km
T : Ship or Pay contracts maturing ~ 10 years
P : Regulated tarifs under 30 years PPA
T : 670
P : 644
Mexico
T : 1,305 km pipeline
D : 0.6 M delivery points & 13,881 km grid
T : Take or Pay contracts maturing ~ 30 years
D : Regulated (cost + based) adjusted by mix of inflation, FX, Capex, opex
and other income, reviewed every 5 years
T : 205
D : 568
Chile
D : 58 km grid
R : 194 M cf/d regas terminal
P : 2,910 km TLs
D : Bilateral contracts
R : mid-term terminal use agreements maturing in 2025
P : regulated tariff reviewed every 4 yrs + bilateral contracts
D : 5
R : 256
P : 348
RomaniaD : 2.1 M delivery points & 21,774 km grid D : Regulatory WACC + incentives
Price cap with yearly volume correction
D : 696
Germany D : 0.7 M delivery points & 14,298 km grid D : Gasag: Gas grid concession terminating in 2024 D : 335
Argentina D : 13,350 km grid D : Regulated (cost+ based), adjusted for inflation D : 29
TOTAL 3,756
T: Gas transmission D: Gas distribution P: Power transmission R: Regasification
As at 31 December 2021
6 1220
40
2021 2023 2025 2030
0.6GW 3
Green hydrogen capacityProduction
170kmTransmission pipeline
270GWhStorage
2025 2030
Midstream
Mobility 50Refuelling stations
RENEWABLE GASES
Hydrogen & Biomethane
• Biomethane already a reality in France
• Renewables gases contribute to energy
system flexibility and security
• Contribute to energy decarbonisation
Biomethane in France1
• 338GWh of net installed capacity @100%
• 345GWh capacity under construction
• 3512 biomethane sites connected
1 As at 31 December 2021
2 Connected to ENGIE networks (GRDF or GRTgaz)
3 At 100%
Capacities connected to
ENGIE Networks in FranceTWh
ENGIE targets and growth potential
4 TWh production
= 10% of market in 2030 in France
Hydrogen: ENGIE targets
4GW 3
700km
1TWh
>100
8 GW of green hydrogen capacity
over 70 projects
~20 projects > 50 MW
+50 projects < 50 MW
Strong pipeline
INVESTOR RELATIONS FACTSHEET 5
Installed capacity (GW)
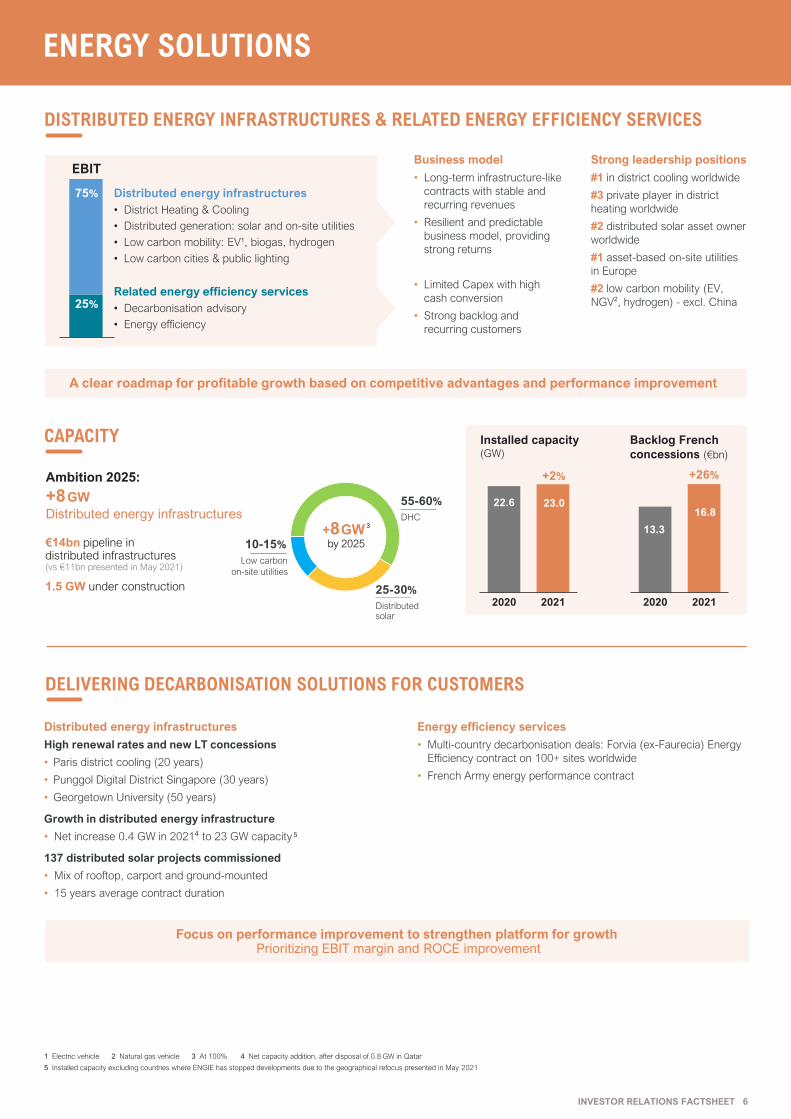
ENERGY SOLUTIONS
DISTRIBUTED ENERGY INFRASTRUCTURES & RELATED ENERGY EFFICIENCY SERVICES
25%
75%
+8GW 3
by 2025€14bn pipeline in distributed infrastructures (vs €11bn presented in May 2021)
1.5 GW under construction
22.6 23.0
2020 2021
+2%
13.3
16.8
2020 2021
+26%
Business model
• Long-term infrastructure-like
contracts with stable and
recurring revenues
• Resilient and predictable
business model, providing
strong returns
• Limited Capex with high
cash conversion
• Strong backlog and
recurring customers
Strong leadership positions
#1 in district cooling worldwide
#3 private player in district
heating worldwide
#2 distributed solar asset owner
worldwide
#1 asset-based on-site utilities
in Europe
#2 low carbon mobility (EV,
NGV2, hydrogen) - excl. China
Distributed energy infrastructures
• District Heating & Cooling
• Distributed generation: solar and on-site utilities
• Low carbon mobility: EV1, biogas, hydrogen
• Low carbon cities & public lighting
Related energy efficiency services
• Decarbonisation advisory
• Energy efficiency
EBIT
A clear roadmap for profitable growth based on competitive advantages and performance improvement
Ambition 2025:
+8GW
Distributed energy infrastructures
CAPACITY
1 Electric vehicle 2 Natural gas vehicle 3 At 100% 4 Net capacity addition, after disposal of 0.8 GW in Qatar
5 Installed capacity excluding countries where ENGIE has stopped developments due to the geographical refocus presented in May 2021
55-60%
DHC
10-15%
Low carbon
on-site utilities
25-30%
Distributed solar
Backlog French
concessions (€bn)
DELIVERING DECARBONISATION SOLUTIONS FOR CUSTOMERS
Distributed energy infrastructures
High renewal rates and new LT concessions
• Paris district cooling (20 years)
• Punggol Digital District Singapore (30 years)
• Georgetown University (50 years)
Growth in distributed energy infrastructure
• Net increase 0.4 GW in 20214 to 23 GW capacity 5
137 distributed solar projects commissioned
• Mix of rooftop, carport and ground-mounted
• 15 years average contract duration
Energy efficiency services
• Multi-country decarbonisation deals: Forvia (ex-Faurecia) Energy
Efficiency contract on 100+ sites worldwide
• French Army energy performance contract
Focus on performance improvement to strengthen platform for growthPrioritizing EBIT margin and ROCE improvement
INVESTOR RELATIONS FACTSHEET 6
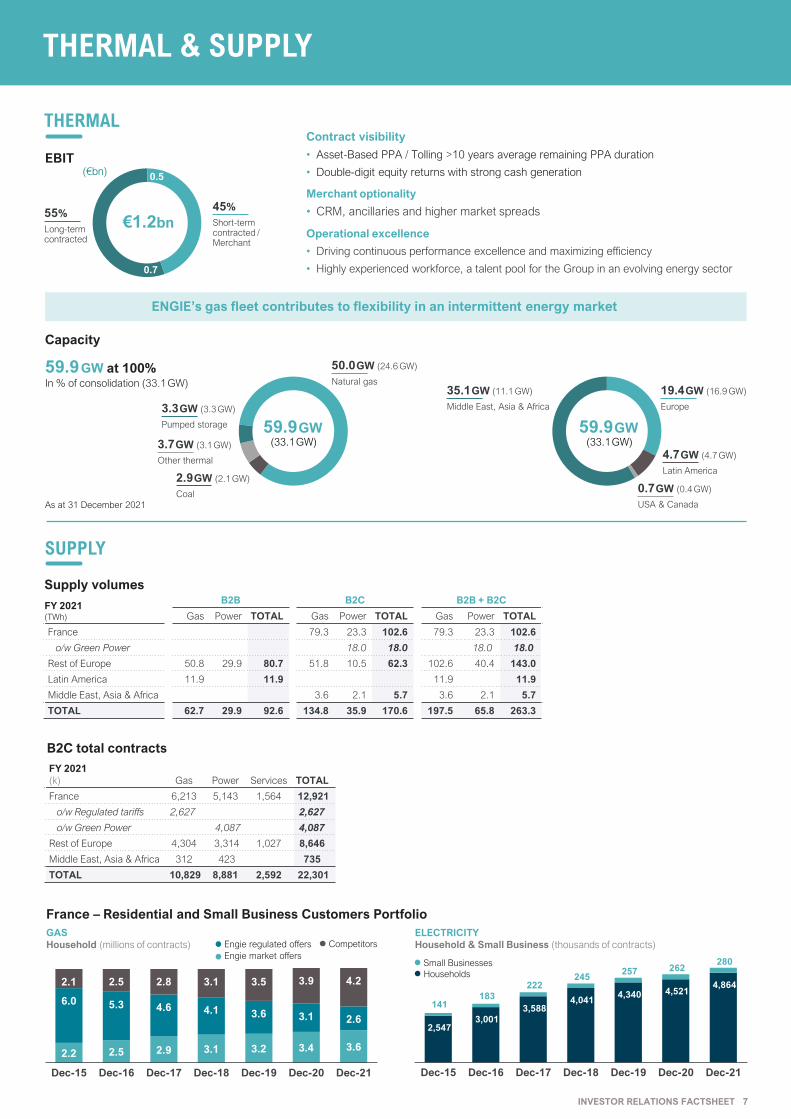
THERMAL & SUPPLY
THERMAL
0.7
0.5
As at 31 December 2021
FY 2021
(k) Gas Power Services TOTAL
France 6,213 5,143 1,564 12,921
o/w Regulated tariffs 2,627 2,627
o/w Green Power 4,087 4,087
Rest of Europe 4,304 3,314 1,027 8,646
Middle East, Asia & Africa 312 423 735
TOTAL 10,829 8,881 2,592 22,301
B2C total contracts
FY 2021 (TWh)
B2B B2C B2B + B2C
Gas Power TOTAL Gas Power TOTAL Gas Power TOTAL
France 79.3 23.3 102.6 79.3 23.3 102.6
o/w Green Power 18.0 18.0 18.0 18.0
Rest of Europe 50.8 29.9 80.7 51.8 10.5 62.3 102.6 40.4 143.0
Latin America 11.9 11.9 11.9 11.9
Middle East, Asia & Africa 3.6 2.1 5.7 3.6 2.1 5.7
TOTAL 62.7 29.9 92.6 134.8 35.9 170.6 197.5 65.8 263.3
Contract visibility
• Asset-Based PPA / Tolling >10 years average remaining PPA duration
• Double-digit equity returns with strong cash generation
Merchant optionality
• CRM, ancillaries and higher market spreads
Operational excellence
• Driving continuous performance excellence and maximizing efficiency
• Highly experienced workforce, a talent pool for the Group in an evolving energy sector
45%
Short-termcontracted / Merchant
55%
Long-termcontracted
€1.2bn
(€bn)
ENGIE’s gas fleet contributes to flexibility in an intermittent energy market
59.9GW at 100%In % of consolidation (33.1GW)
50.0GW (24.6 GW)
Natural gas
59.9GW(33.1GW)
2.9GW (2.1GW)
Coal
3.3GW (3.3GW)
Pumped storage
3.7GW (3.1GW)
Other thermal
59.9GW(33.1GW)
35.1GW (11.1 GW)
Middle East, Asia & Africa
19.4GW (16.9 GW)
Europe
4.7GW (4.7GW)
Latin America
0.7GW (0.4GW)
USA & Canada
SUPPLY
EBIT
Capacity
Supply volumes
2,547 3,001
3,588 4,041
4,340 4,521 4,864
141 183
222 245
257 262 280
Dec-15 Dec-16 Dec-17 Dec-18 Dec-19 Dec-20 Dec-21
2.2 2.5 2.9 3.1 3.2 3.4 3.6
6.0 5.3 4.6 4.1 3.6 3.1 2.6
2.1 2.5 2.8 3.1 3.5 3.9 4.2
Dec-15 Dec-16 Dec-17 Dec-18 Dec-19 Dec-20 Dec-21
GAS
Household (millions of contracts)
France – Residential and Small Business Customers Portfolio
ELECTRICITY
Household & Small Business (thousands of contracts)
Households
Small Businesses
INVESTOR RELATIONS FACTSHEET 7
Competitors
Engie market offers
Engie regulated offers
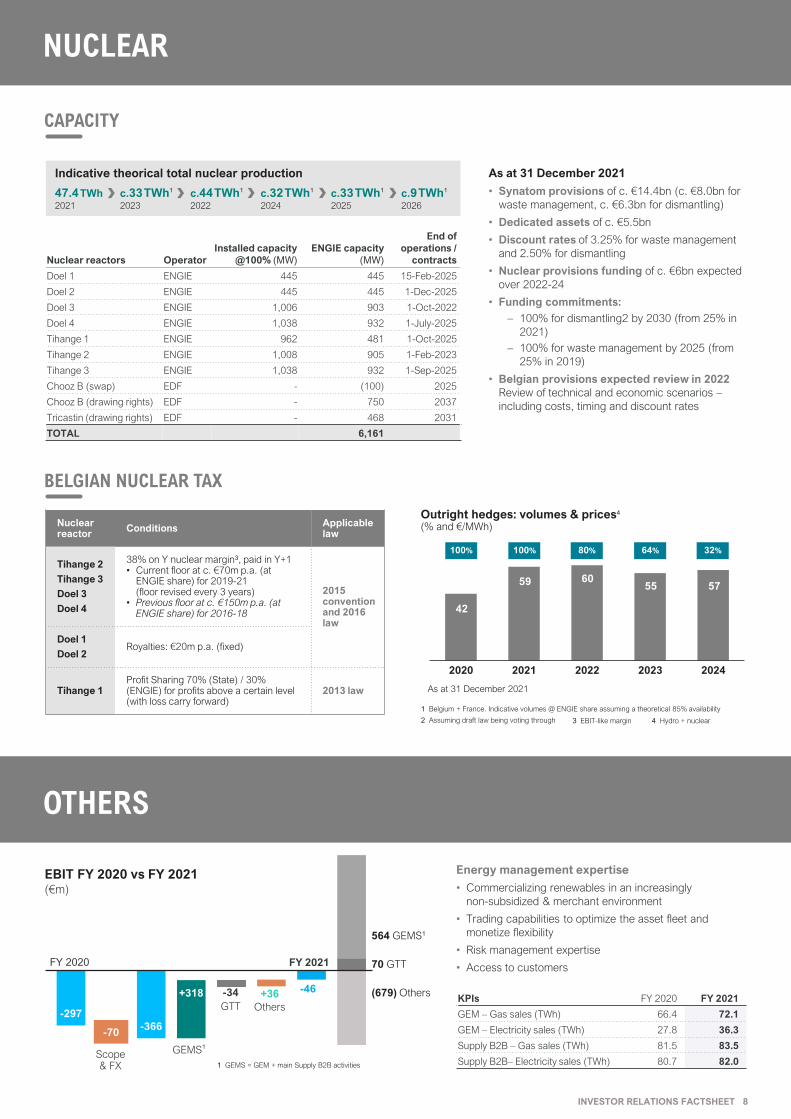
NUCLEAR
CAPACITY
Nuclear reactors Operator
Installed capacity
@100% (MW)
ENGIE capacity
(MW)
End of
operations /
contracts
Doel 1 ENGIE 445 445 15-Feb-2025
Doel 2 ENGIE 445 445 1-Dec-2025
Doel 3 ENGIE 1,006 903 1-Oct-2022
Doel 4 ENGIE 1,038 932 1-July-2025
Tihange 1 ENGIE 962 481 1-Oct-2025
Tihange 2 ENGIE 1,008 905 1-Feb-2023
Tihange 3 ENGIE 1,038 932 1-Sep-2025
Chooz B (swap) EDF - (100) 2025
Chooz B (drawing rights) EDF - 750 2037
Tricastin (drawing rights) EDF - 468 2031
TOTAL 6,161
Nuclear reactor
ConditionsApplicable law
Tihange 2
Tihange 3
Doel 3
Doel 4
38% on Y nuclear margin3, paid in Y+1• Current floor at c. €70m p.a. (at
ENGIE share) for 2019-21(floor revised every 3 years)
• Previous floor at c. €150m p.a. (at ENGIE share) for 2016-18
2015 convention and 2016 law
Doel 1
Doel 2Royalties: €20m p.a. (fixed)
Tihange 1Profit Sharing 70% (State) / 30% (ENGIE) for profits above a certain level (with loss carry forward)
2013 law
47.4TWh2021
Indicative theorical total nuclear production
c.44TWh1
2022
c.33TWh1
2023
c.32TWh1
2024
c.33TWh1
2025
c.9TWh1
2026
As at 31 December 2021
• Synatom provisions of c. €14.4bn (c. €8.0bn for
waste management, c. €6.3bn for dismantling)
• Dedicated assets of c. €5.5bn
• Discount rates of 3.25% for waste management
and 2.50% for dismantling
• Nuclear provisions funding of c. €6bn expected
over 2022-24
• Funding commitments:
– 100% for dismantling2 by 2030 (from 25% in
2021)
– 100% for waste management by 2025 (from
25% in 2019)
• Belgian provisions expected review in 2022
Review of technical and economic scenarios –
including costs, timing and discount rates
BELGIAN NUCLEAR TAX
Outright hedges: volumes & prices4
(% and €/MWh)
2020 2021 2022 2023 2024
100% 100% 80% 64% 32%
42
6059 5755
OTHERS
KPIs FY 2020 FY 2021
GEM – Gas sales (TWh) 66.4 72.1
GEM – Electricity sales (TWh) 27.8 36.3
Supply B2B – Gas sales (TWh) 81.5 83.5
Supply B2B– Electricity sales (TWh) 80.7 82.0
-297
-366-70
+318 -34 +36
GEMS1
GTT Others
(679) Others
564 GEMS1
70 GTT
Scope& FX
FY 2020 FY 2021
-46
Energy management expertise
• Commercializing renewables in an increasingly
non-subsidized & merchant environment
• Trading capabilities to optimize the asset fleet and
monetize flexibility
• Risk management expertise
• Access to customers
EBIT FY 2020 vs FY 2021(€m)
1 GEMS = GEM + main Supply B2B activities
1 Belgium + France. Indicative volumes @ ENGIE share assuming a theoretical 85% availability
2 Assuming draft law being voting through
As at 31 December 2021
3 EBIT-like margin 4 Hydro + nuclear
INVESTOR RELATIONS FACTSHEET 8
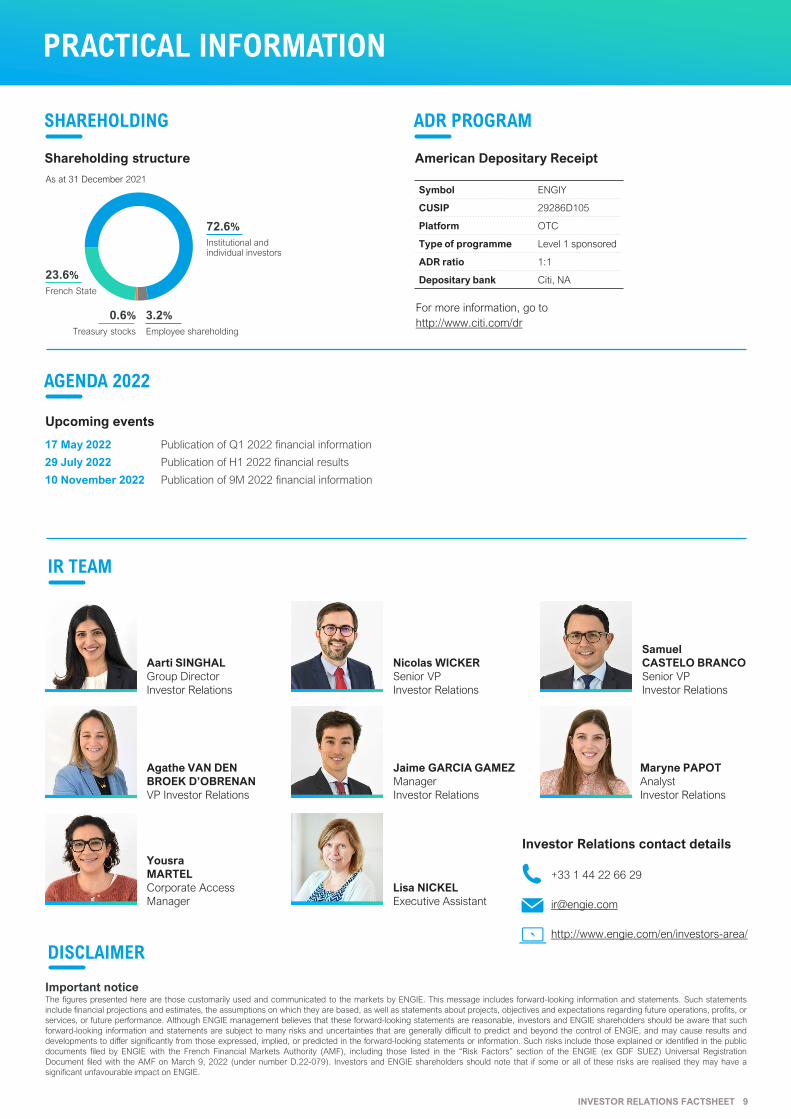
PRACTICAL INFORMATION
+33 1 44 22 66 29
http://www.engie.com/en/investors-area/
Aarti SINGHAL
Group Director
Investor Relations
Important noticeThe figures presented here are those customarily used and communicated to the markets by ENGIE. This message includes forward-looking information and statements. Such statements
include financial projections and estimates, the assumptions on which they are based, as well as statements about projects, objectives and expectations regarding future operations, profits, or
services, or future performance. Although ENGIE management believes that these forward-looking statements are reasonable, investors and ENGIE shareholders should be aware that such
forward-looking information and statements are subject to many risks and uncertainties that are generally difficult to predict and beyond the control of ENGIE, and may cause results and
developments to differ significantly from those expressed, implied, or predicted in the forward-looking statements or information. Such risks include those explained or identified in the public
documents filed by ENGIE with the French Financial Markets Authority (AMF), including those listed in the “Risk Factors” section of the ENGIE (ex GDF SUEZ) Universal Registration
Document filed with the AMF on March 9, 2022 (under number D.22-079). Investors and ENGIE shareholders should note that if some or all of these risks are realised they may have a
significant unfavourable impact on ENGIE.
Symbol ENGIY
CUSIP 29286D105
Platform OTC
Type of programme Level 1 sponsored
ADR ratio 1:1
Depositary bank Citi, NA
For more information, go to
http://www.citi.com/dr
17 May 2022 Publication of Q1 2022 financial information
29 July 2022 Publication of H1 2022 financial results
10 November 2022 Publication of 9M 2022 financial information
Nicolas WICKER
Senior VP
Investor Relations
Samuel
CASTELO BRANCO
Senior VP
Investor Relations
Agathe VAN DEN
BROEK D’OBRENAN
VP Investor Relations
Yousra
MARTEL
Corporate Access
Manager
Lisa NICKEL
Executive Assistant
Jaime GARCIA GAMEZ
Manager
Investor Relations
Maryne PAPOT
Analyst
Investor Relations
SHAREHOLDING ADR PROGRAM
Shareholding structure American Depositary Receipt
72.6%
Institutional and individual investors
23.6%
French State
0.6%
Treasury stocks
3.2%
Employee shareholding
As at 31 December 2021
AGENDA 2022
Upcoming events
IR TEAM
Investor Relations contact details
DISCLAIMER
INVESTOR RELATIONS FACTSHEET 9