Windsor Can Plant Fact Sheet COPF00102
29
Metal Container Corporation-Windsor Can Plant Fact Sheet CO-PF00102 1 Enclosure 2 Metal Container Corporation-Windsor Can Plant Fact Sheet Pretreatment ICIS Number: CO-PF00102 Facility Name and Address: Metal Container Corporation-Windsor Can Plant 1201 Metal Container Court Windsor, CO 80550 Authorized Representative Contact: Maurice Cashman Plant Manager 1201 Metal Container Court Windsor, CO 80550 970-686-1599/[email protected] Facility Contact: Tasha Greene Environmental, Health and Safety Manager 1201 Metal Container Court Windsor, CO 80550 970-686-1516/[email protected] Applicable Pretreatment Regulations: General Pretreatment Regulations, 40 CFR 403 Coil Coating Point Source Category, Subpart D- Canmaking Subcategory, New Source, (Canmaking New Source Date = 02/10/1983, the facility began operations in 1987) Categorical Reference: 40 C.F.R. Part 465 (Pretreatment Standards for New Sources at 40 C.F.R. § 465.45) Receiving POTW/Collection System: Town of Windsor POTW CDPS Permit No. CO-0020320 301 Walnut Street Windsor, CO 80550 POTW Contact: Dennis Markham, WWTF Manager Town of Windsor Windsor, CO 80550 970-686-2144/[email protected] UNITED STATES ENVIRONMENTAL PROTECTION AGENCY REGION 8 1595 Wynkoop Street DENVER, CO 80202 Phone 800-227-8917 http://www.epa.gov/region08
-
Upload
khangminh22 -
Category
Documents
-
view
1 -
download
0
Transcript of Windsor Can Plant Fact Sheet COPF00102
Metal Container Corporation-Windsor Can Plant Fact Sheet
CO-PF00102
1
Enclosure 2
Metal Container Corporation-Windsor Can Plant Fact Sheet
Pretreatment ICIS Number: CO-PF00102
Facility Name and Address: Metal Container Corporation-Windsor Can Plant
1201 Metal Container Court
Windsor, CO 80550
Authorized Representative Contact: Maurice Cashman
Plant Manager
1201 Metal Container Court
Windsor, CO 80550
970-686-1599/[email protected]
Facility Contact: Tasha Greene
Environmental, Health and Safety Manager
1201 Metal Container Court
Windsor, CO 80550
970-686-1516/[email protected]
Applicable Pretreatment Regulations: General Pretreatment Regulations, 40 CFR 403
Coil Coating Point Source Category, Subpart D-
Canmaking Subcategory, New Source, (Canmaking
New Source Date = 02/10/1983, the facility began
operations in 1987)
Categorical Reference: 40 C.F.R. Part 465 (Pretreatment Standards for New
Sources at 40 C.F.R. § 465.45)
Receiving POTW/Collection System: Town of Windsor POTW
CDPS Permit No. CO-0020320
301 Walnut Street
Windsor, CO 80550
POTW Contact: Dennis Markham, WWTF Manager
Town of Windsor
Windsor, CO 80550
970-686-2144/[email protected]
UNITED STATES ENVIRONMENTAL PROTECTION AGENCY
REGION 8
1595 Wynkoop Street
DENVER, CO 80202
Phone 800-227-8917
http://www.epa.gov/region08
Metal Container Corporation-Windsor Can Plant Fact Sheet
CO-PF00102
2
Section 1 Metal Container Corporation-Windsor Can Plant – Process Description
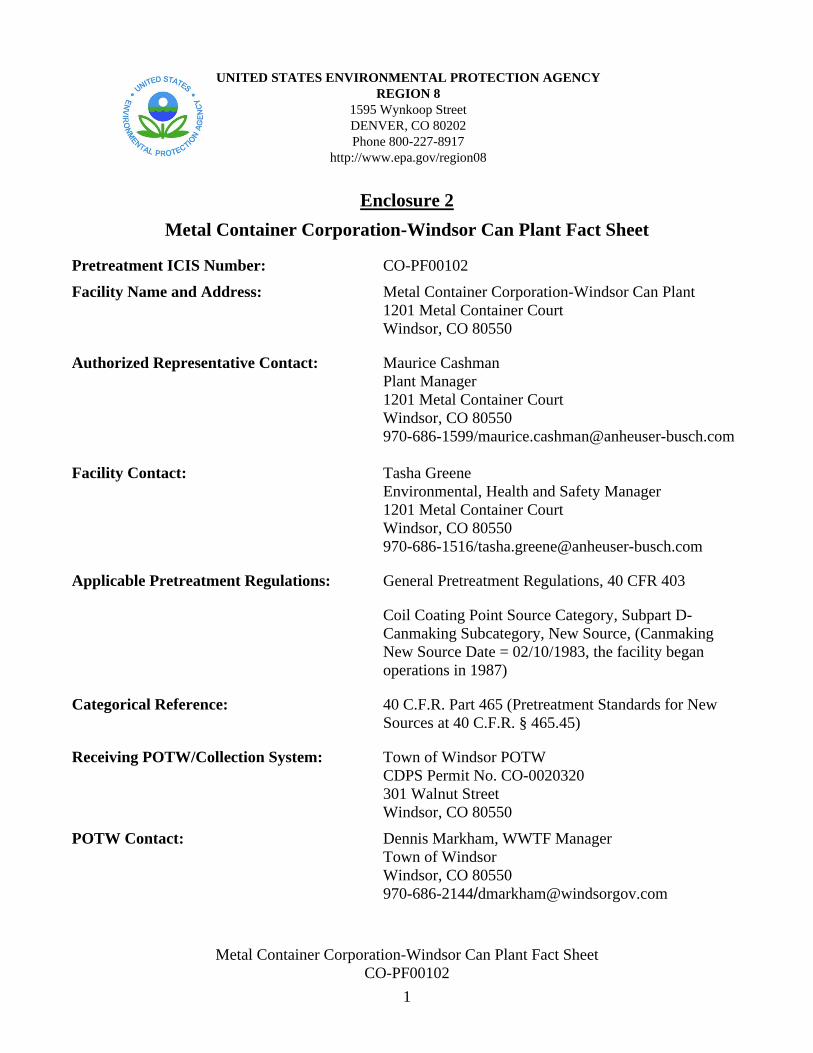
The Metal Container Corporation-Windsor Can Plant (facility) is a manufacturer of aluminum beverage
containers. The facility is located at 1201 Metal Container Court, Windsor, CO 80550. The facility
operates 24 hours a day, seven days/week (112 employees working two 12-hour shifts) and schedules
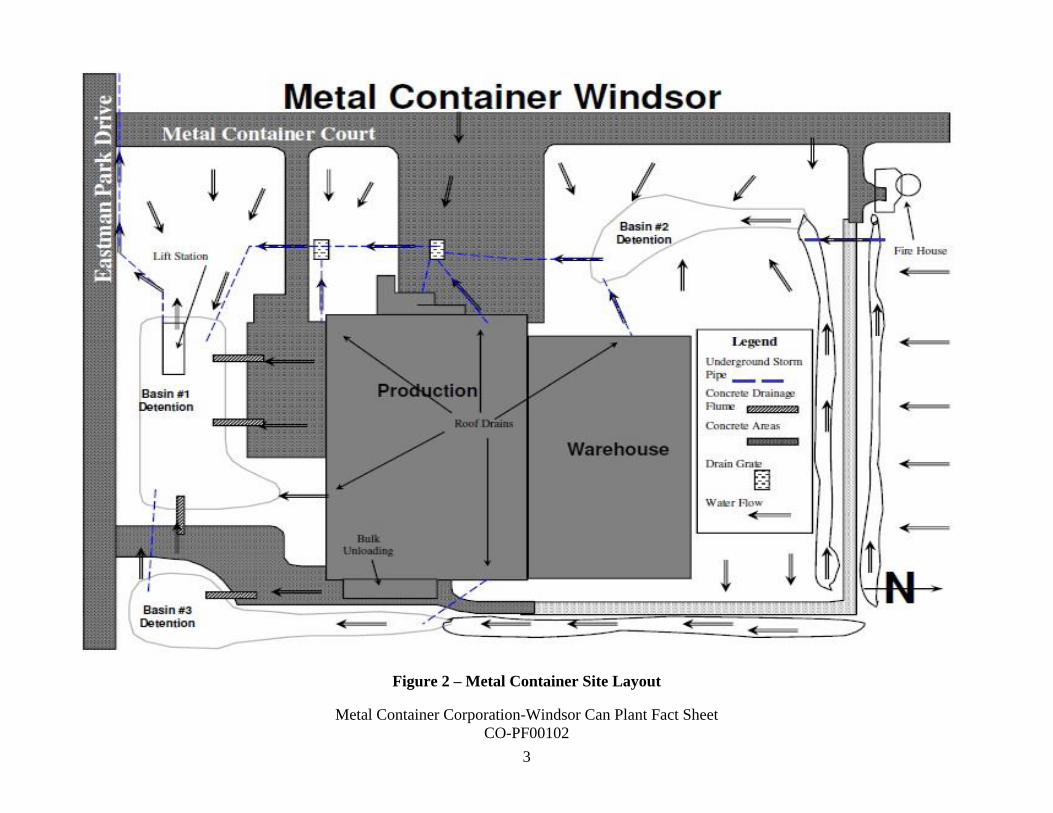
three no-production days/year of annual maintenance and cleaning. Figure 1 provides a Google Earth view
of the facility and Figure 2 provides a site layout of the Metal Container Corporation building.
Figure 1 - Metal Container Corporation-Google Earth View
Metal Container Corporation-Windsor Can Plant Fact Sheet
CO-PF00102
3
Figure 2 – Metal Container Site Layout
Metal Container Corporation-Windsor Can Plant Fact Sheet
CO-PF00102
4
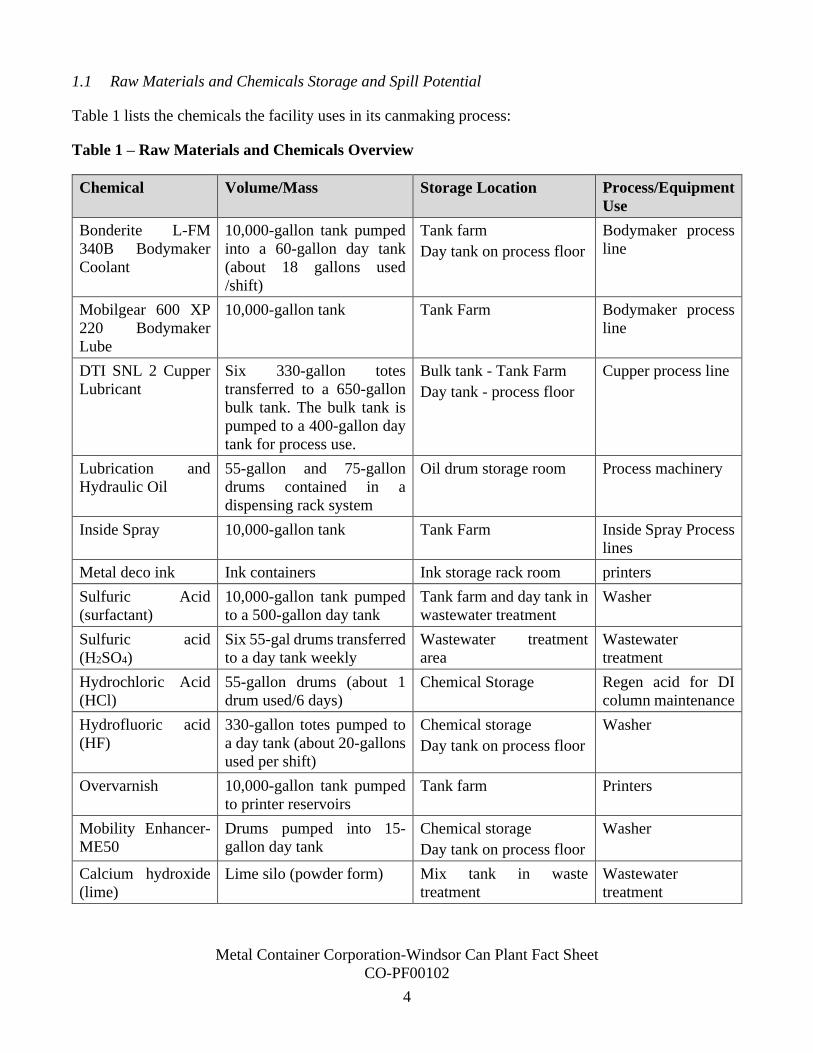
1.1 Raw Materials and Chemicals Storage and Spill Potential
Table 1 lists the chemicals the facility uses in its canmaking process:
Table 1 – Raw Materials and Chemicals Overview
Chemical Volume/Mass Storage Location Process/Equipment
Use
Bonderite L-FM
340B Bodymaker
Coolant
10,000-gallon tank pumped
into a 60-gallon day tank
(about 18 gallons used
/shift)
Tank farm
Day tank on process floor
Bodymaker process
line
Mobilgear 600 XP
220 Bodymaker
Lube
10,000-gallon tank Tank Farm Bodymaker process
line
DTI SNL 2 Cupper
Lubricant
Six 330-gallon totes
transferred to a 650-gallon
bulk tank. The bulk tank is
pumped to a 400-gallon day
tank for process use.
Bulk tank - Tank Farm
Day tank - process floor
Cupper process line
Lubrication and
Hydraulic Oil
55-gallon and 75-gallon
drums contained in a
dispensing rack system
Oil drum storage room Process machinery
Inside Spray 10,000-gallon tank Tank Farm Inside Spray Process
lines
Metal deco ink Ink containers Ink storage rack room printers
Sulfuric Acid
(surfactant)
10,000-gallon tank pumped
to a 500-gallon day tank
Tank farm and day tank in
wastewater treatment
Washer
Sulfuric acid
(H2SO4)
Six 55-gal drums transferred
to a day tank weekly
Wastewater treatment
area
Wastewater
treatment
Hydrochloric Acid
(HCl)
55-gallon drums (about 1
drum used/6 days)
Chemical Storage Regen acid for DI
column maintenance
Hydrofluoric acid
(HF)
330-gallon totes pumped to
a day tank (about 20-gallons
used per shift)
Chemical storage
Day tank on process floor
Washer
Overvarnish 10,000-gallon tank pumped
to printer reservoirs
Tank farm Printers
Mobility Enhancer-
ME50
Drums pumped into 15-
gallon day tank
Chemical storage
Day tank on process floor
Washer
Calcium hydroxide
(lime)
Lime silo (powder form) Mix tank in waste
treatment
Wastewater
treatment
Metal Container Corporation-Windsor Can Plant Fact Sheet
CO-PF00102
5
The bulk chemicals used at the facility are stored in either 10,000-gallon bulk tanks or 330-gallon totes
and are transferred to day tanks of various sizes for daily production use or in the case of coolant or
lubricants, pumped by demand into reservoirs of machinery throughout the facility.
Spills and other non-routine episodic slug discharges, such as inadequately treated/profiled wastewater,
have the potential to pass through the treatment system and reach the Town of Windsor’s sanitary sewer.
The facility has developed a slug discharge control plan (SDCP) that addresses management of potential
spills and slug discharges.
1.2 Water Supply Treatment
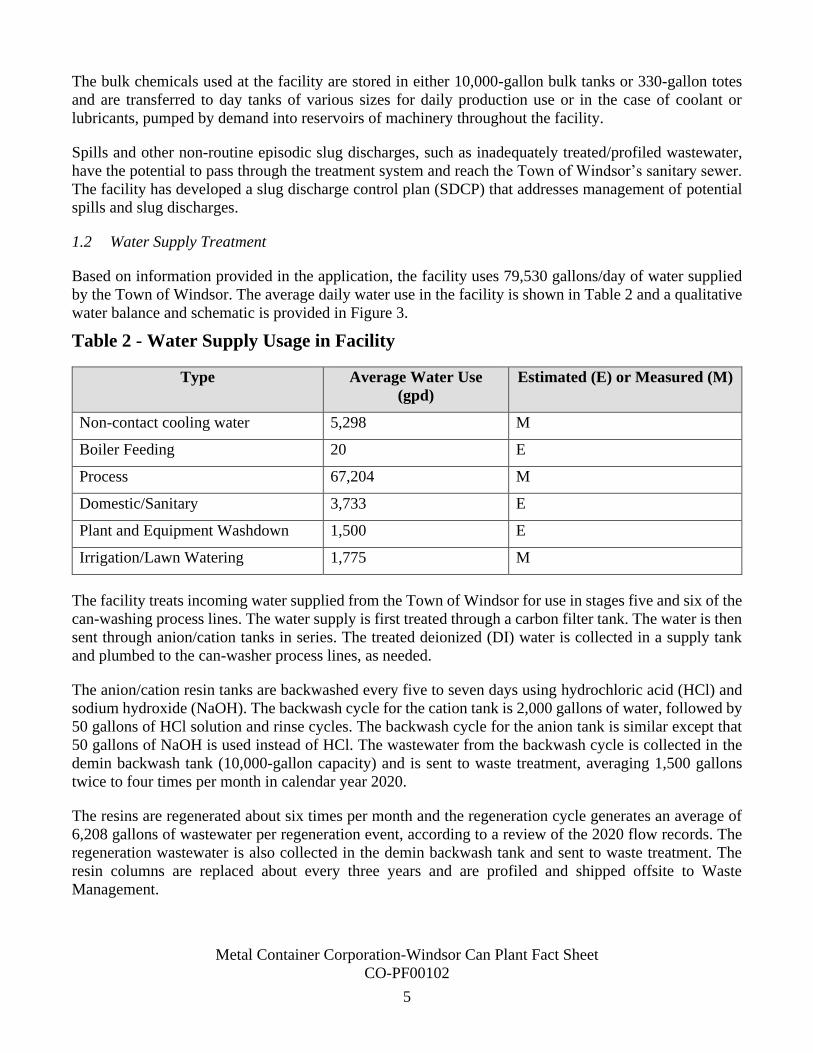
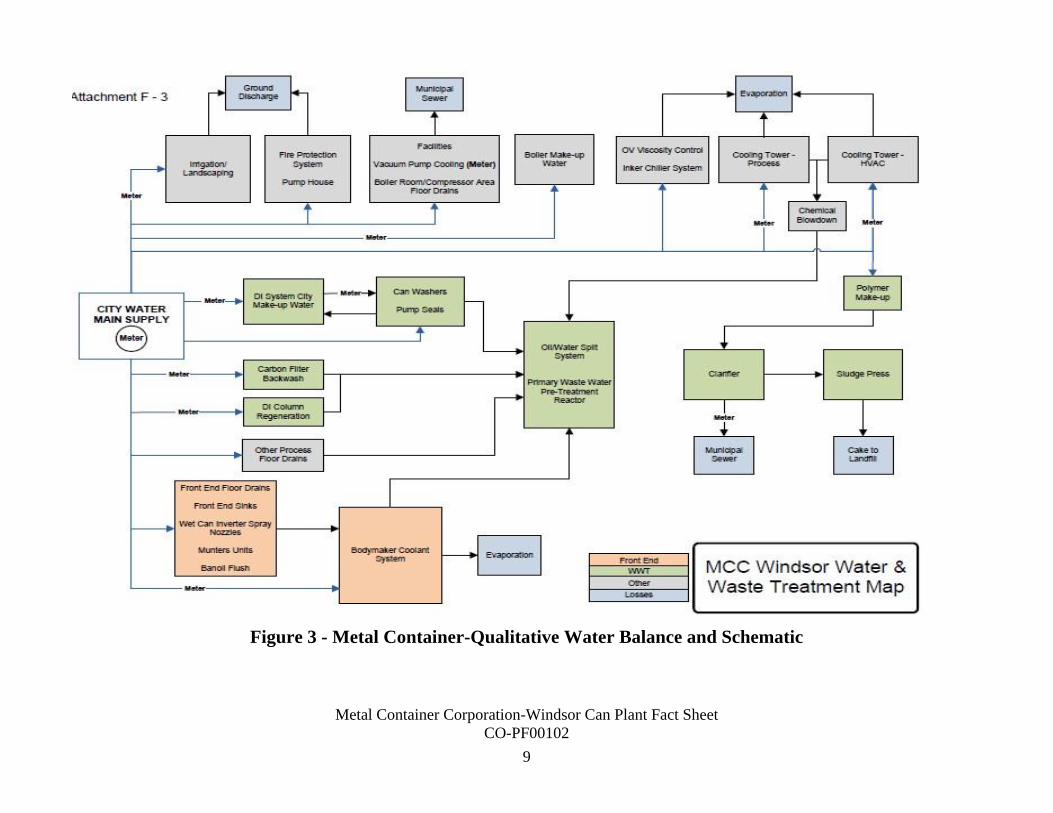
Based on information provided in the application, the facility uses 79,530 gallons/day of water supplied
by the Town of Windsor. The average daily water use in the facility is shown in Table 2 and a qualitative
water balance and schematic is provided in Figure 3.
Table 2 - Water Supply Usage in Facility
Type Average Water Use
(gpd)
Estimated (E) or Measured (M)
Non-contact cooling water 5,298 M
Boiler Feeding 20 E
Process 67,204 M
Domestic/Sanitary 3,733 E
Plant and Equipment Washdown 1,500 E
Irrigation/Lawn Watering 1,775 M
The facility treats incoming water supplied from the Town of Windsor for use in stages five and six of the
can-washing process lines. The water supply is first treated through a carbon filter tank. The water is then
sent through anion/cation tanks in series. The treated deionized (DI) water is collected in a supply tank
and plumbed to the can-washer process lines, as needed.
The anion/cation resin tanks are backwashed every five to seven days using hydrochloric acid (HCl) and
sodium hydroxide (NaOH). The backwash cycle for the cation tank is 2,000 gallons of water, followed by
50 gallons of HCl solution and rinse cycles. The backwash cycle for the anion tank is similar except that
50 gallons of NaOH is used instead of HCl. The wastewater from the backwash cycle is collected in the
demin backwash tank (10,000-gallon capacity) and is sent to waste treatment, averaging 1,500 gallons
twice to four times per month in calendar year 2020.
The resins are regenerated about six times per month and the regeneration cycle generates an average of
6,208 gallons of wastewater per regeneration event, according to a review of the 2020 flow records. The
regeneration wastewater is also collected in the demin backwash tank and sent to waste treatment. The
resin columns are replaced about every three years and are profiled and shipped offsite to Waste
Management.
Metal Container Corporation-Windsor Can Plant Fact Sheet
CO-PF00102
6
1.3 Canmaking Process Overview
The facility makes aluminum beverage cans (70% beer and 30% soda) with an average daily production
rate of 5.6 million cans per day. The facility receives 25,000-lb. coils of aluminum that are stored on
pallets. There are approximately 12 coils in the facility and about four coils in process during an average
production day. The coils are laid on their side and loaded into the uncoiler machine that uncoils the
aluminum and an applicator roll lubricates the straightened aluminum prior to stamping. The facility
maintains a 400-gallon day tank of cupper lubricant that is gravity fed to the uncoiler machine, as needed.
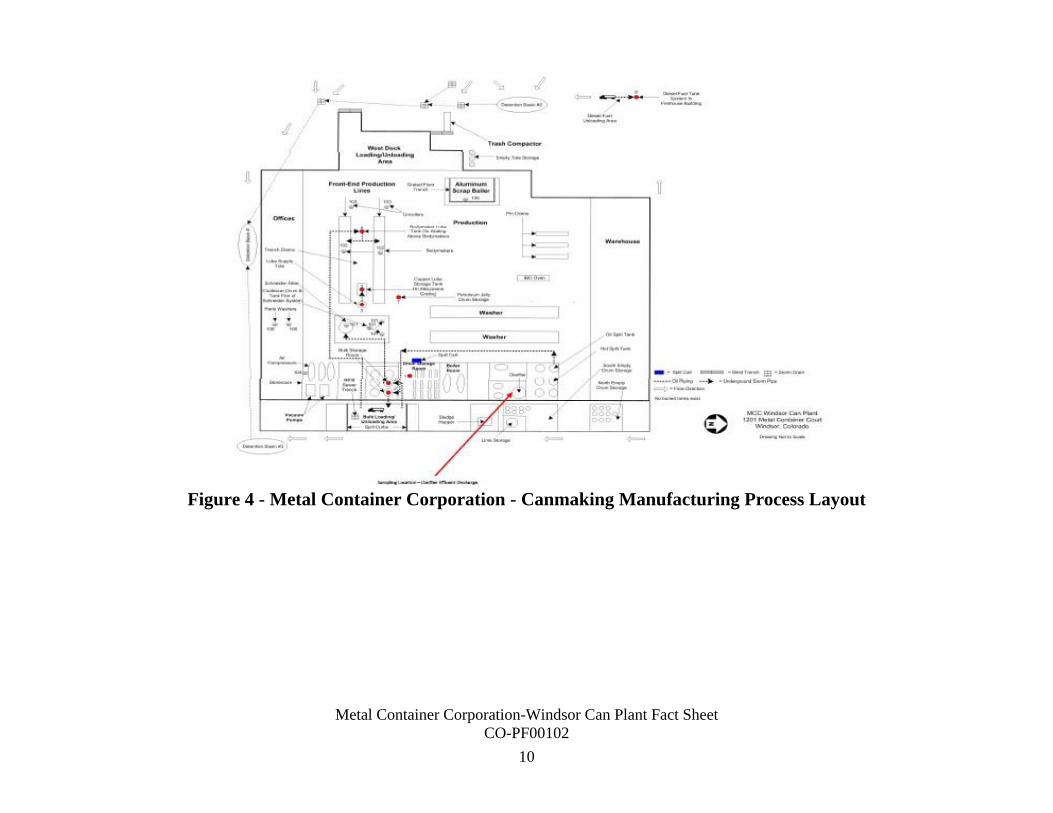
Figure 4 shows a layout of the canmaking manufacturing process.
The facility operates two production lines in parallel, beginning with a hydraulic press that stamps out
blanks from the uncoiled aluminum and a die to form cups out of the blanks. The clean scrap metal from
the cupping process is collected through a vacuum and put through a cyclone to remove excess oils. The
scrap metal is baled into 40-lb. bricks and shipped to the supplier for recycling. The cups are conveyed
overhead to two parallel drawing and ironing process lines, each process lines consists of seven individual
bodymaker machines. The bodymaker machines perform the drawing and ironing (forming straight walls)
on the cups to form a can.
The bodymaker machines are supplied with coolant contained in an 8,000-gallon sump. The coolant is
supplied to the bodymaker machines and returned to the Schneider oil filtration system where it passes
through a series of 12 to 16 paper filters for reclamation prior to entering the 8,000-gallon sump for reuse.
The paper filters from the oil filtration system are changed every five days and disposed in the trash. The
oil sump associated with the Schneider oil filtration system is cleaned annually during production shut
down days. The tramp oil is skimmed from the sump and is sent to waste treatment.
The formed, straight-wall cans from the bodymaker process lines are trimmed to a finished height. The
scrap metal is collected and baled with other scrap metal. The trimmed cans enter a large conveyance
trench that runs underneath both drawing and ironing lines. The trench conveys the cans to the washing
process. The conveyance trench for the cans running underneath the body maker machines also act to
contain any oil leaked from the machines. The trench connects to a pit for collection and treatment.
The cans in the conveyance trench are loaded into the two parallel can spray washing process lines with
identical configurations and tanks. The cans are inverted as they enter the process lines to aid in draining
the solutions and spray rinses in the process lines. The inverted cans are prewashed using a low-pressure
spray and water contained in the trench to provide an initial rinse of oil and coolants. The trench is located
below each can-washing line and collects wastewater from the cleaning process.
The can-washing process lines consist of the following stages, with each stage containing 50 psi spray
nozzles to clean the interior of the cans:
1. H2SO4, pH of 1.8, heated spray, cleaning/etch tank
The H2SO4 solution is contained in a 500-gallon day tank for each line. The day tank supplies
spray nozzles for application; the H2SO4 solution drips back into the day tank following use. Stage
one is a closed loop equipped with a weir and oil skimmer to manage contaminant levels of coolant
and oils. The skimmed waste from the weir and skimmer is directed to the trench. Makeup water
due to evaporation loss is added from stage three of the process line. This process tank is cleaned
every 16 weeks.
Metal Container Corporation-Windsor Can Plant Fact Sheet
CO-PF00102
7
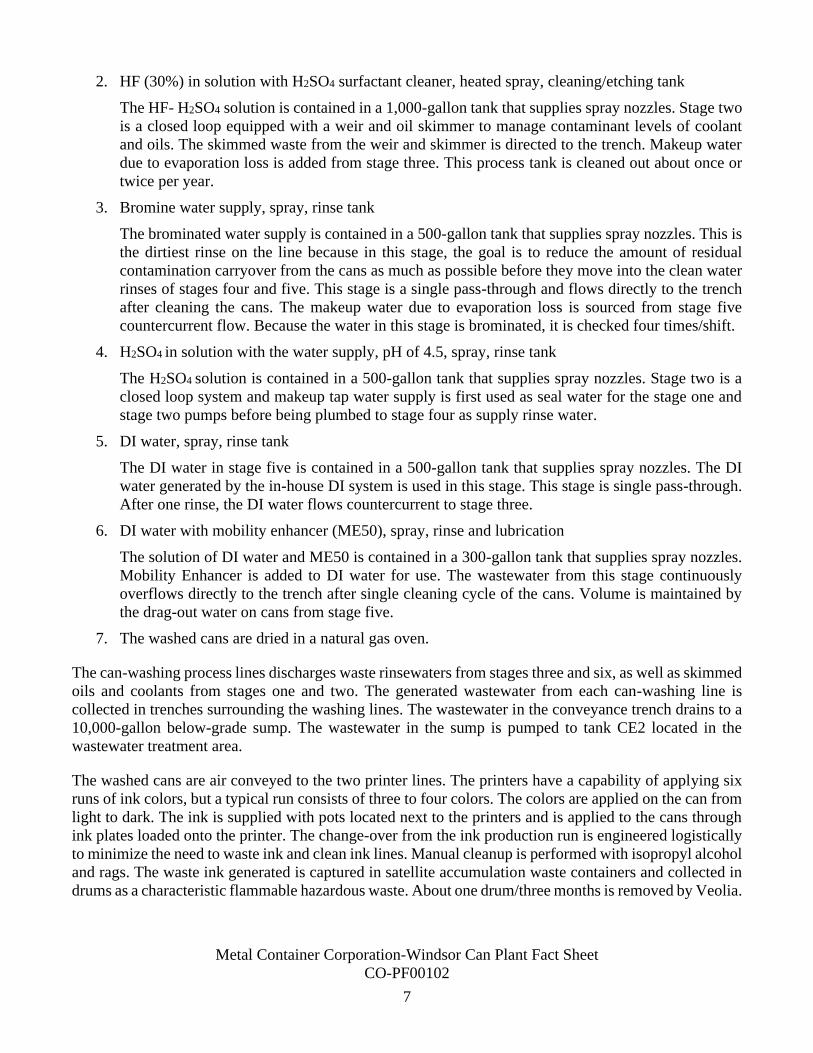
2. HF (30%) in solution with H2SO4 surfactant cleaner, heated spray, cleaning/etching tank
The HF- H2SO4 solution is contained in a 1,000-gallon tank that supplies spray nozzles. Stage two
is a closed loop equipped with a weir and oil skimmer to manage contaminant levels of coolant
and oils. The skimmed waste from the weir and skimmer is directed to the trench. Makeup water
due to evaporation loss is added from stage three. This process tank is cleaned out about once or
twice per year.
3. Bromine water supply, spray, rinse tank
The brominated water supply is contained in a 500-gallon tank that supplies spray nozzles. This is
the dirtiest rinse on the line because in this stage, the goal is to reduce the amount of residual
contamination carryover from the cans as much as possible before they move into the clean water
rinses of stages four and five. This stage is a single pass-through and flows directly to the trench
after cleaning the cans. The makeup water due to evaporation loss is sourced from stage five
countercurrent flow. Because the water in this stage is brominated, it is checked four times/shift.
4. H2SO4 in solution with the water supply, pH of 4.5, spray, rinse tank
The H2SO4 solution is contained in a 500-gallon tank that supplies spray nozzles. Stage two is a
closed loop system and makeup tap water supply is first used as seal water for the stage one and
stage two pumps before being plumbed to stage four as supply rinse water.
5. DI water, spray, rinse tank
The DI water in stage five is contained in a 500-gallon tank that supplies spray nozzles. The DI
water generated by the in-house DI system is used in this stage. This stage is single pass-through.
After one rinse, the DI water flows countercurrent to stage three.
6. DI water with mobility enhancer (ME50), spray, rinse and lubrication
The solution of DI water and ME50 is contained in a 300-gallon tank that supplies spray nozzles.
Mobility Enhancer is added to DI water for use. The wastewater from this stage continuously
overflows directly to the trench after single cleaning cycle of the cans. Volume is maintained by
the drag-out water on cans from stage five.
7. The washed cans are dried in a natural gas oven.
The can-washing process lines discharges waste rinsewaters from stages three and six, as well as skimmed
oils and coolants from stages one and two. The generated wastewater from each can-washing line is
collected in trenches surrounding the washing lines. The wastewater in the conveyance trench drains to a
10,000-gallon below-grade sump. The wastewater in the sump is pumped to tank CE2 located in the
wastewater treatment area.
The washed cans are air conveyed to the two printer lines. The printers have a capability of applying six
runs of ink colors, but a typical run consists of three to four colors. The colors are applied on the can from
light to dark. The ink is supplied with pots located next to the printers and is applied to the cans through
ink plates loaded onto the printer. The change-over from the ink production run is engineered logistically
to minimize the need to waste ink and clean ink lines. Manual cleanup is performed with isopropyl alcohol
and rags. The waste ink generated is captured in satellite accumulation waste containers and collected in
drums as a characteristic flammable hazardous waste. About one drum/three months is removed by Veolia.

Metal Container Corporation-Windsor Can Plant Fact Sheet
CO-PF00102
8
After the printer ink application, an over-varnish is applied to the top and bottom of the cans before the
coatings are cured in an oven. The cured cans are conveyed to the inside spray process to apply an epoxy
spray on the inside of the cans to provide separation from the beverage product and the aluminum. The
facility has thirteen inside spray machines on two lines to provide the inside spray application. For each
machine, two application spray guns at different depths for the cans apply even coverage throughout the
interior of the can. After the inside spray process, the cans are sent to an oven to cure the epoxy spray.
The waste epoxy spray is captured as non-hazardous regulated waste.
A necker wax is applied on the top cut edge of the cans, which are then conveyed to the necker process
line. The necker wax is heated in an 8-gallon tank, that needs to be resupplied every two days. The facility
has two parallel necker process lines that each consists of ten stages to draw out the neck of the can and
about 20,000 cans per minute are run through the necker process lines. The cans are flanged, and the base
is reformed in the inside base profile reformer to add strength during the filling of the can. A date/time
code is applied on the cans.
The quality control/quality assurance process consists of inspection through a light tester to identify
defects in the can and a Mixed Label Detector where cans are checked for label inconsistencies. The cans
that fail these tests are kicked out of the process line and collected as scrap metal. A vision system/Auto
Enamel quality control step is performed to detect imperfections such as creases or dents in the cans.
Sodium peroxide is also used to detect exposed metal in the cans. The finished cans are sent through a
conveyor line to the warehouse for palletizing and storage.
1.4 Non-regulated Wastestreams
The custodial staff cleans and mops the floors five days a week during the first shift. The wastewater from
floor cleaning is discharged to the process wastewater treatment system through the sump located near the
can-washing process lines. The flow contributed by mop water is less than 50 gpd. In addition, hand sinks
are installed in the process floor; the wastewater is discharged to the process wastewater treatment system
with a volume of less than 50 gpd. The cooling tower for the facility contains corrosion inhibitors. The
return on the cooling system throughout the facility is returned to a tank that is blown down based on a
certain level of conductivity; the cooling tower blowdown is discharged to the process wastewater
treatment system. Based on a review of the flow records, the blowdown from the cooling tower occurs at
a rate of about 1,092 gpd from 2019 to 2020 (Figure 5). In 2020, the facility discharged DI backwash
wastewater about two to four times per month with an average volume of 1,500 gallons per event and DI
regeneration wastewater about six times per month with an average volume of 6,208 gallons per event
from the water supply treatment.
Summary of non-regulated wastestreams from the facility:
• Mop Water <50 gpd
• Process Floor Hand Sinks <50 gpd
• Cooling Tower Blowdown 1,092 gpd
• Water Supply Treatment (DI backwash) 2 to 4 times/month, 1,500 gallons per event
• Water Supply Treatment (DI regeneration) 6 times/month, 6,208 gallons per event
Metal Container Corporation-Windsor Can Plant Fact Sheet
CO-PF00102
9
Figure 3 - Metal Container-Qualitative Water Balance and Schematic
Metal Container Corporation-Windsor Can Plant Fact Sheet
CO-PF00102
10
Figure 4 - Metal Container Corporation - Canmaking Manufacturing Process Layout
Metal Container Corporation-Windsor Can Plant Fact Sheet
CO-PF00102
11
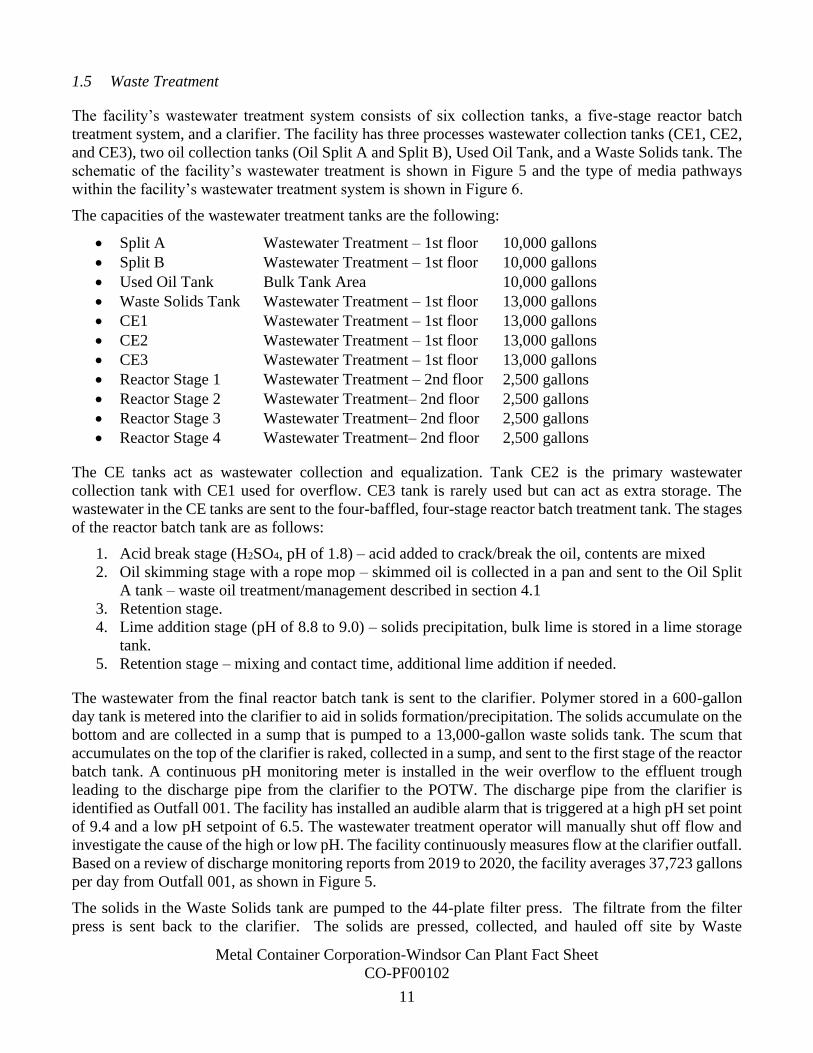
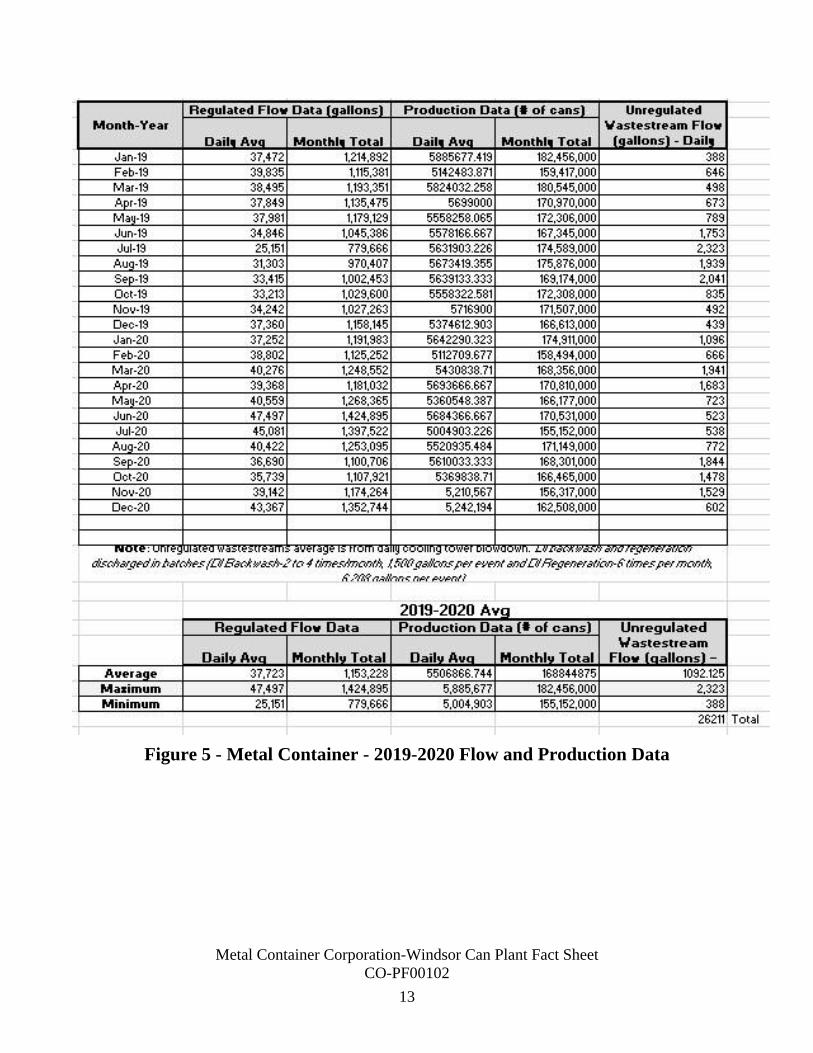
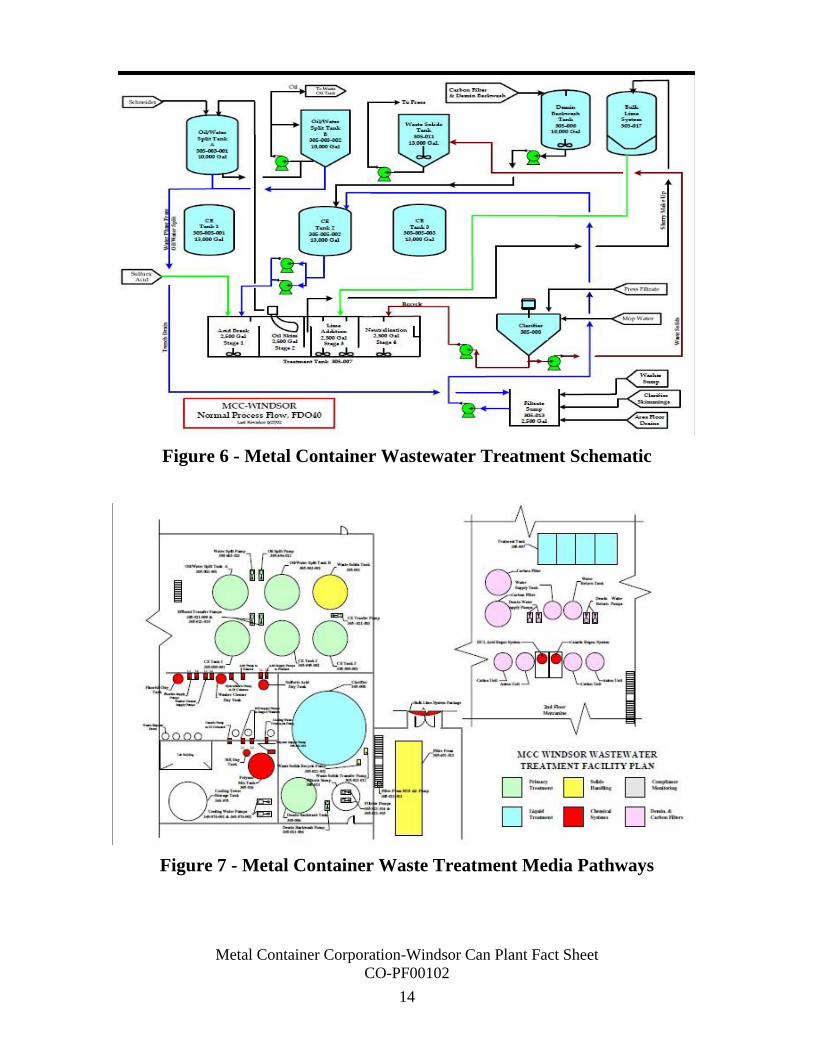
1.5 Waste Treatment
The facility’s wastewater treatment system consists of six collection tanks, a five-stage reactor batch
treatment system, and a clarifier. The facility has three processes wastewater collection tanks (CE1, CE2,
and CE3), two oil collection tanks (Oil Split A and Split B), Used Oil Tank, and a Waste Solids tank. The
schematic of the facility’s wastewater treatment is shown in Figure 5 and the type of media pathways
within the facility’s wastewater treatment system is shown in Figure 6.
The capacities of the wastewater treatment tanks are the following:
• Split A Wastewater Treatment – 1st floor 10,000 gallons
• Split B Wastewater Treatment – 1st floor 10,000 gallons
• Used Oil Tank Bulk Tank Area 10,000 gallons
• Waste Solids Tank Wastewater Treatment – 1st floor 13,000 gallons
• CE1 Wastewater Treatment – 1st floor 13,000 gallons
• CE2 Wastewater Treatment – 1st floor 13,000 gallons
• CE3 Wastewater Treatment – 1st floor 13,000 gallons
• Reactor Stage 1 Wastewater Treatment – 2nd floor 2,500 gallons
• Reactor Stage 2 Wastewater Treatment– 2nd floor 2,500 gallons
• Reactor Stage 3 Wastewater Treatment– 2nd floor 2,500 gallons
• Reactor Stage 4 Wastewater Treatment– 2nd floor 2,500 gallons
The CE tanks act as wastewater collection and equalization. Tank CE2 is the primary wastewater
collection tank with CE1 used for overflow. CE3 tank is rarely used but can act as extra storage. The
wastewater in the CE tanks are sent to the four-baffled, four-stage reactor batch treatment tank. The stages
of the reactor batch tank are as follows:
1. Acid break stage (H2SO4, pH of 1.8) – acid added to crack/break the oil, contents are mixed
2. Oil skimming stage with a rope mop – skimmed oil is collected in a pan and sent to the Oil Split
A tank – waste oil treatment/management described in section 4.1
3. Retention stage.
4. Lime addition stage (pH of 8.8 to 9.0) – solids precipitation, bulk lime is stored in a lime storage
tank.
5. Retention stage – mixing and contact time, additional lime addition if needed.
The wastewater from the final reactor batch tank is sent to the clarifier. Polymer stored in a 600-gallon
day tank is metered into the clarifier to aid in solids formation/precipitation. The solids accumulate on the
bottom and are collected in a sump that is pumped to a 13,000-gallon waste solids tank. The scum that
accumulates on the top of the clarifier is raked, collected in a sump, and sent to the first stage of the reactor
batch tank. A continuous pH monitoring meter is installed in the weir overflow to the effluent trough
leading to the discharge pipe from the clarifier to the POTW. The discharge pipe from the clarifier is
identified as Outfall 001. The facility has installed an audible alarm that is triggered at a high pH set point
of 9.4 and a low pH setpoint of 6.5. The wastewater treatment operator will manually shut off flow and
investigate the cause of the high or low pH. The facility continuously measures flow at the clarifier outfall.
Based on a review of discharge monitoring reports from 2019 to 2020, the facility averages 37,723 gallons
per day from Outfall 001, as shown in Figure 5.
The solids in the Waste Solids tank are pumped to the 44-plate filter press. The filtrate from the filter
press is sent back to the clarifier. The solids are pressed, collected, and hauled off site by Waste
Metal Container Corporation-Windsor Can Plant Fact Sheet
CO-PF00102
12
Management as non-hazardous landfill cover. According to a review of records from a March 5, 2021
Pretreatment inspection, the facility generates about a 20-cubic yard dumpster of sludge per week.
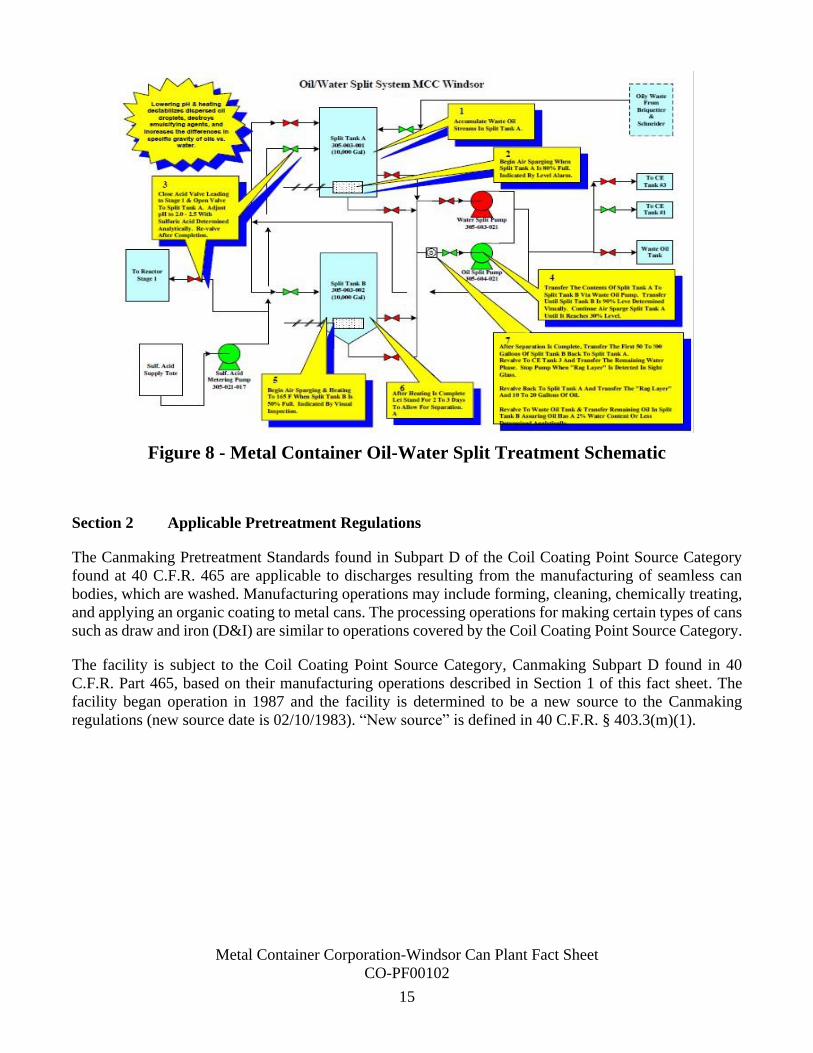
1.6 Waste Oil Treatment/Management
The skimmed oil from the reactor batch tank two and tramp or skimmed oil from the Schneider oil filter
system are collected in Oil Split A tank. H2SO4 is added to the contents of the tank to a pH of 1.8 with an
air sparge to crack the oil. The contents of the Oil Split A tank are allowed to quiesce for three to four
hours to allow for oil separation. The tank is dewatered by using a sight glass to determine the oil/water
fraction. The water fraction is pumped to the CE2 tank and the oily fraction is sent to the Oil Split B tank.
The Oil Split B tank is heated to 140˚F and provides further separation of the oil/water fraction. Oil Split
B tank is dewatered using a similar process for Oil Split A; the water fraction is pumped to the CE2 tank
and the oil fraction is sent to the waste oil tank. A final dewatering occurs in the waste oil tank; however,
the water is sent to Oil Split A tank for reprocessing through the oil separation treatment. The contents of
the waste oil are hauled offsite by Waste Management. The facility’s management of the waste oil in its
waste treatment system is shown in Figure 7.
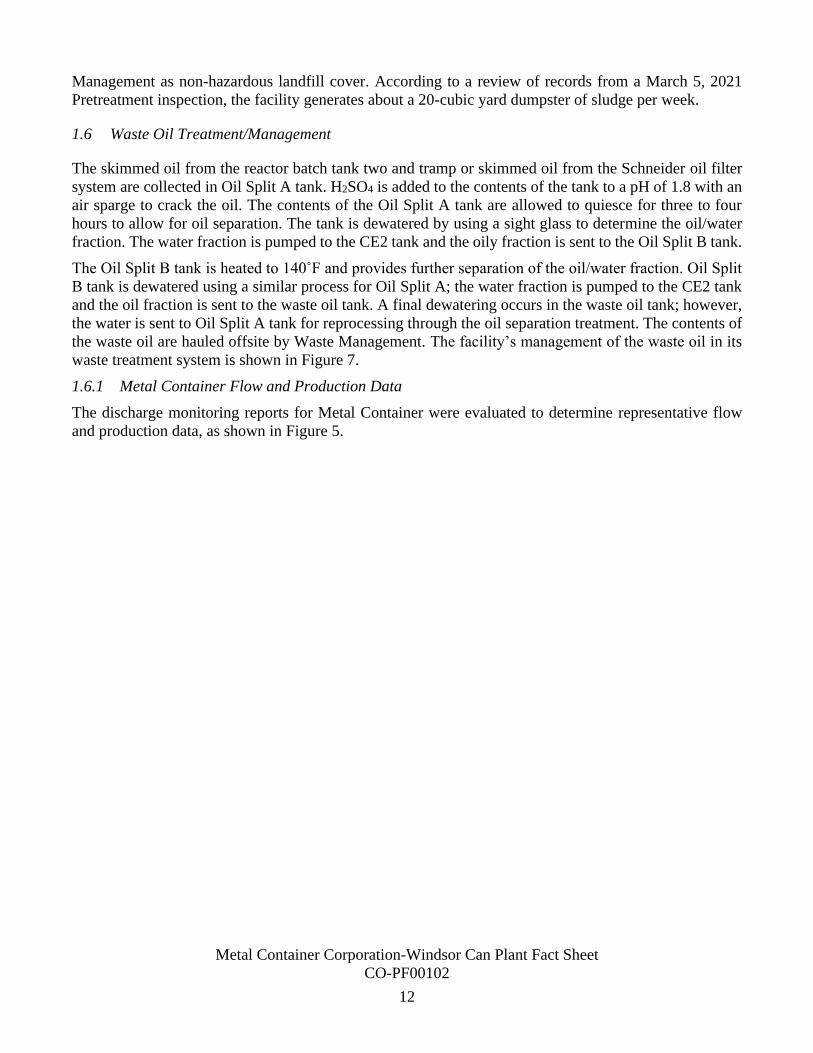
1.6.1 Metal Container Flow and Production Data
The discharge monitoring reports for Metal Container were evaluated to determine representative flow
and production data, as shown in Figure 5.
Metal Container Corporation-Windsor Can Plant Fact Sheet
CO-PF00102
13
Figure 5 - Metal Container - 2019-2020 Flow and Production Data
Metal Container Corporation-Windsor Can Plant Fact Sheet
CO-PF00102
14
Figure 6 - Metal Container Wastewater Treatment Schematic
Figure 7 - Metal Container Waste Treatment Media Pathways
Metal Container Corporation-Windsor Can Plant Fact Sheet
CO-PF00102
15
Figure 8 - Metal Container Oil-Water Split Treatment Schematic
Section 2 Applicable Pretreatment Regulations
The Canmaking Pretreatment Standards found in Subpart D of the Coil Coating Point Source Category
found at 40 C.F.R. 465 are applicable to discharges resulting from the manufacturing of seamless can
bodies, which are washed. Manufacturing operations may include forming, cleaning, chemically treating,
and applying an organic coating to metal cans. The processing operations for making certain types of cans
such as draw and iron (D&I) are similar to operations covered by the Coil Coating Point Source Category.
The facility is subject to the Coil Coating Point Source Category, Canmaking Subpart D found in 40
C.F.R. Part 465, based on their manufacturing operations described in Section 1 of this fact sheet. The
facility began operation in 1987 and the facility is determined to be a new source to the Canmaking
regulations (new source date is 02/10/1983). “New source” is defined in 40 C.F.R. § 403.3(m)(1).
Metal Container Corporation-Windsor Can Plant Fact Sheet
CO-PF00102
16
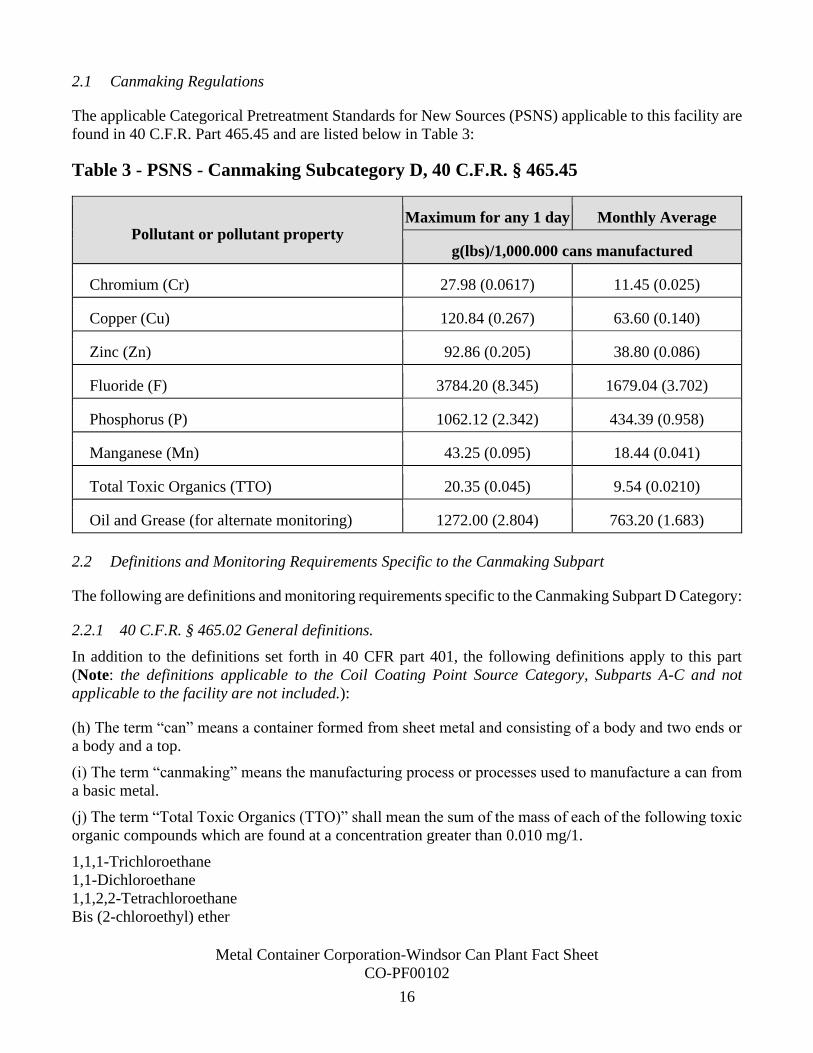
2.1 Canmaking Regulations
The applicable Categorical Pretreatment Standards for New Sources (PSNS) applicable to this facility are
found in 40 C.F.R. Part 465.45 and are listed below in Table 3:
Table 3 - PSNS - Canmaking Subcategory D, 40 C.F.R. § 465.45
Pollutant or pollutant property Maximum for any 1 day Monthly Average
g(lbs)/1,000.000 cans manufactured
Chromium (Cr) 27.98 (0.0617) 11.45 (0.025)
Copper (Cu) 120.84 (0.267) 63.60 (0.140)
Zinc (Zn) 92.86 (0.205) 38.80 (0.086)
Fluoride (F) 3784.20 (8.345) 1679.04 (3.702)
Phosphorus (P) 1062.12 (2.342) 434.39 (0.958)
Manganese (Mn) 43.25 (0.095) 18.44 (0.041)
Total Toxic Organics (TTO) 20.35 (0.045) 9.54 (0.0210)
Oil and Grease (for alternate monitoring) 1272.00 (2.804) 763.20 (1.683)
2.2 Definitions and Monitoring Requirements Specific to the Canmaking Subpart
The following are definitions and monitoring requirements specific to the Canmaking Subpart D Category:
2.2.1 40 C.F.R. § 465.02 General definitions.
In addition to the definitions set forth in 40 CFR part 401, the following definitions apply to this part
(Note: the definitions applicable to the Coil Coating Point Source Category, Subparts A-C and not
applicable to the facility are not included.):
(h) The term “can” means a container formed from sheet metal and consisting of a body and two ends or
a body and a top.
(i) The term “canmaking” means the manufacturing process or processes used to manufacture a can from
a basic metal.
(j) The term “Total Toxic Organics (TTO)” shall mean the sum of the mass of each of the following toxic
organic compounds which are found at a concentration greater than 0.010 mg/1.
1,1,1-Trichloroethane
1,1-Dichloroethane
1,1,2,2-Tetrachloroethane
Bis (2-chloroethyl) ether

Metal Container Corporation-Windsor Can Plant Fact Sheet
CO-PF00102
17
Chloroform
1,1-Dichloroethylene
Methylene chloride (dichloromethane)
Pentachlorophenol
Bis (2-ethylhexyl) phthalate
Butyl benzyl-phthalate
Di-N-butyl phthalate
Phenanthrene
Tetrachloroethylene
Toluene
2.2.2 40 C.F.R. § 465.03 Monitoring and Reporting Requirements
The following special monitoring requirements apply to all facilities controlled by this regulation. (Note:
the special monitoring requirements applicable to the Coil Coating Point Source Category, Subparts A-
C and not applicable to the facility are not included.)
(b) The “monthly average” regulatory values shall be the basis for the monthly average discharge limits
in direct discharge permits and for pretreatment standards. Compliance with the monthly discharge limit
is required regardless of the number of samples analyzed and averaged.
(c) The analytical method required for determination of petroleum hydrocarbons (non-polar material) is
given under the listing for “oil and grease” at 40 C.F.R. 136.3(a), Table IB and must be used after
December 31, 2005.
(d) The owner or operator of any canmaking facility subject to the provisions of this regulation shall advise
the permit issuing authority or POTW authority [in this case, EPA Region 8] and the EPA Office of Water
Regulations and Standards, Washington, DC 20460 whenever it has been decided that the plant will
manufacture cans from an aluminum alloy containing less than 1.0 percent manganese. Such notification
shall be made in writing, not less than 30 days in advance of the scheduled production and shall provide
the chemical analysis of the alloy and the expected period of use.
2.3 pH, standard units
The specific discharge prohibition found at 40 C.F.R. Part 403.5(b)(2) of the Pretreatment Regulations
state the following: “Pollutants which will cause corrosive structural damage to the POTW, but in no case
Discharges with pH lower than 5.0, unless the works is specifically designed to accommodate such
Discharges.”
Section 3 Pretreatment Requirements
The Pretreatment Regulations found in 40 C.F.R. Part 403 impose Pretreatment Requirements on the
facility and its process wastewater discharge to the POTW. These Pretreatment Requirements include
monitoring, reporting, and notification requirements found in 40 C.F.R. Sections 403.12, 403.16, and
403.17 and definitions and monitoring requirements specific to the Coil Coating Point Source Category,
Subpart D-Canmaking found in 40 C.F.R. Part 465. The applicable effluent limits are listed in the
Canmaking pretreatment standards for new sources at 40 C.F.R. 465.45.
The Pretreatment Requirements apply at Outfall 001, described as follows:
Metal Container Corporation-Windsor Can Plant Fact Sheet
CO-PF00102
18
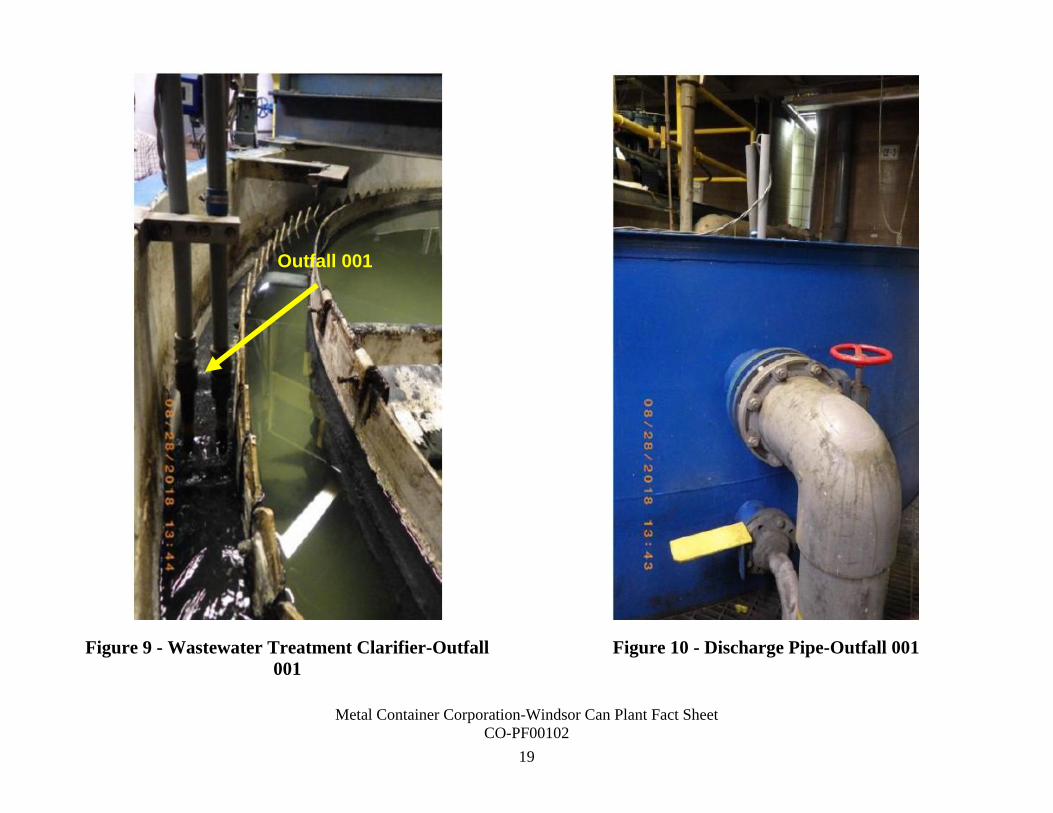
Outfall 001: Discharge from the wastewater treatment clarifier through a discharge pipe that conveys
regulated wastewater to the POTW. The treated wastewater from the clarifier overflows over a weir into
the effluent trough leading to the discharge pipe. A continuous pH monitoring meter is installed in the
effluent trough directly next to the discharge pipe. Figures 9 and 10 show the configuration of Outfall 001
within the wastewater treatment clarifier and the discharge pipe leading from the clarifier.
Metal Container Corporation-Windsor Can Plant Fact Sheet
CO-PF00102
19
Figure 9 - Wastewater Treatment Clarifier-Outfall
001
Figure 10 - Discharge Pipe-Outfall 001
Outfall 001
Metal Container Corporation-Windsor Can Plant Fact Sheet
CO-PF00102
20
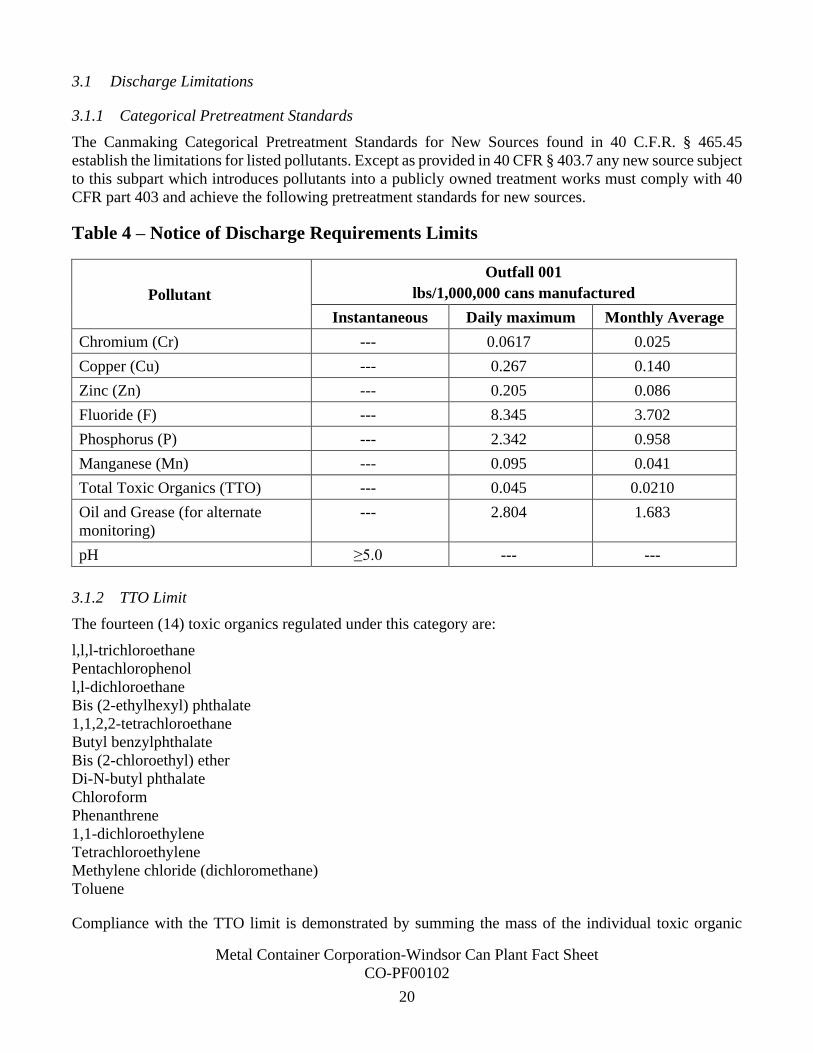
3.1 Discharge Limitations
3.1.1 Categorical Pretreatment Standards
The Canmaking Categorical Pretreatment Standards for New Sources found in 40 C.F.R. § 465.45
establish the limitations for listed pollutants. Except as provided in 40 CFR § 403.7 any new source subject
to this subpart which introduces pollutants into a publicly owned treatment works must comply with 40
CFR part 403 and achieve the following pretreatment standards for new sources.
Table 4 – Notice of Discharge Requirements Limits
Pollutant
Outfall 001
lbs/1,000,000 cans manufactured
Instantaneous Daily maximum Monthly Average
Chromium (Cr) --- 0.0617 0.025
Copper (Cu) --- 0.267 0.140
Zinc (Zn) --- 0.205 0.086
Fluoride (F) --- 8.345 3.702
Phosphorus (P) --- 2.342 0.958
Manganese (Mn) --- 0.095 0.041
Total Toxic Organics (TTO) --- 0.045 0.0210
Oil and Grease (for alternate
monitoring)
--- 2.804 1.683
pH ≥5.0 --- ---
3.1.2 TTO Limit
The fourteen (14) toxic organics regulated under this category are:
l,l,l-trichloroethane
Pentachlorophenol
l,l-dichloroethane
Bis (2-ethylhexyl) phthalate
1,1,2,2-tetrachloroethane
Butyl benzylphthalate
Bis (2-chloroethyl) ether
Di-N-butyl phthalate
Chloroform
Phenanthrene
1,1-dichloroethylene
Tetrachloroethylene
Methylene chloride (dichloromethane)
Toluene
Compliance with the TTO limit is demonstrated by summing the mass of the individual toxic organic
Metal Container Corporation-Windsor Can Plant Fact Sheet
CO-PF00102
21
compounds present in the regulated wastestream in concentrations above 0.01 mg/l. This summation is
then compared with the TTO standard to determine the Industrial User's compliance status. Both a
maximum daily limit and a maximum monthly average identified in Table 4 have been promulgated and
must be met by the facility to achieve compliance.
3.1.3 Alternative to TTO Monitoring
As an alternative to TTO monitoring, the facility may elect to comply with the oil and grease standards
listed in Table 4 above. The facility will not be subject to the TTO standards if it elects to be subject to
the oil and grease standards in Table 4. (Guidance Manual for Implementing TTO Pretreatment Standards-
September 1985, Section 3.5.2)
Pursuant to 40 C.F.R. § 465.03(c), the analytical method required for determination of petroleum
hydrocarbons (non-polar material) is given under the listing for “oil and grease” at 40 C.F.R. 136.3(a),
Table IB and must be used after December 31, 2005. (Note: the use of freon as the extraction solvent was
discontinued and replace with n-hexane.) The oil and grease method listed in Table 1B at 40 C.F.R.
136.3(a) includes the use of n-hexane extraction and gravimetry to analyze hexane extracted materials
(HEM) as total oil and grease and HEM-silica gel treatment and gravimetry as the polar hydrocarbon
component of oil and grease. Both analytical procedures are listed in Table 1B as EPA Method 1664
Revision A and B.
3.1.4 Compliance with the Production-Based Standards
EPA evaluated permit conditions to accurately evaluate compliance with the canmaking production-based
standards found in 40 C.F.R. § 465.45. Equivalent mass or concentration limits established as alternative
limits to the production-based standards in 40 C.F.R. § 465.45 were evaluated. The facility’s production
and flow data were evaluated to determine if the variability of these data were sufficient to establish long-
term production or flow averages for use in calculating equivalent mass or concentration limits.
The Pretreatment Regulations at 40 C.F.R. § 403.12(j) require Industrial Users to promptly notify the
Control Authority (and the POTW if the POTW is not the Control Authority) in advance of any substantial
change in the volume or character of pollutants in their Discharge. EPA is the Control Authority in this
case. The EPA “Guidance Manual for the Use of Production-Based Pretreatment Standards and the
Combined Wastestream Formula” – September 1985 establishes as a general rule, the average flow is
considered to have changed significantly if the change is greater than 20%. The variability of production
and flow changes of greater than 20% was used to determine if it was feasible to calculate long-term
averages used to establish equivalent mass or concentration limits, as an alternative to the production-
based standards.
Based on the evaluation of discharge monitoring report (DMR) data from 2019-2020 in Figure 5, it appears
that the facility’s production numbers are relatively stable and within the 20% criterion identified above.
The average number of cans produced from 2019-2020 is 5,506,866 cans per day with a maximum of
5,885,678 cans per day (6.9% above the average) and a minimum of 5,004,903 cans per day (9.1% below
the average).
However, the daily average flows for regulated process and unregulated wastewaters exceed the 20%
criterion identified above and do not appear stable enough to establish long-term equivalent mass or
concentration limits. The facility’s daily average process flow from 2019 to 2020 is 37,327 gallons per
day (gpd) with a maximum daily average process flow of 47,497 gpd (27.2% above the average) and a
Metal Container Corporation-Windsor Can Plant Fact Sheet
CO-PF00102
22
minimum daily average process flow of 25,151 gpd (32.6% below the average). The facility’s daily
average unregulated flow from 2019 to 2020 is 1,092 gpd with a maximum unregulated daily flow of
2,323 gpd and a minimum unregulated daily flow of 388 gpd. As a result of this flow variability, EPA is
establishing production-based standards as permit limits based on representative and current flow and
production data for each sampling event in order to ensure compliance with the regulations.
3.1.4.1 Unregulated/Dilute Wastestreams
The facility introduces unregulated/dilute wastestreams to its waste treatment system. These unregulated
wastestreams identified in Section 1.4 and quantified in Figure 5 generates a dilution factor that affects
the regulated wastestreams when monitoring for compliance. When the Canmaking production-based
standards were developed, a model flow rate per unit of production was assumed based on appropriate
water consumption levels and flow reduction methods. If the facility's actual regulated process flow rate
is significantly higher than the model rate, the effluent from the facility could contain concentrations of
regulated pollutants below analytical detection levels.
To ensure data is representative of dilution from unregulated wastewaters on the regulated process
wastewaters, the facility will be required to first adjust the concentration of their compliance sample by
the percentage of dilution from unregulated wastewaters discharged for that production day.
3.1.4.2 Example Calculation to Determine Daily and Monthly Dilution Factors
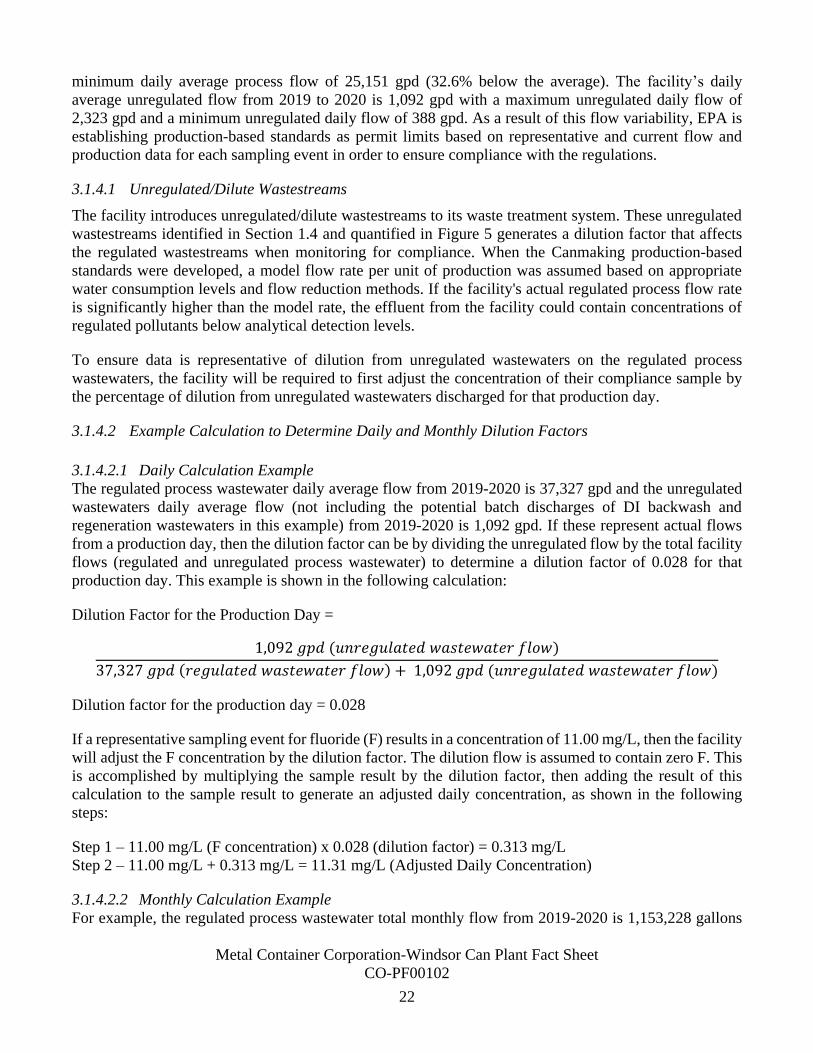
3.1.4.2.1 Daily Calculation Example
The regulated process wastewater daily average flow from 2019-2020 is 37,327 gpd and the unregulated
wastewaters daily average flow (not including the potential batch discharges of DI backwash and
regeneration wastewaters in this example) from 2019-2020 is 1,092 gpd. If these represent actual flows
from a production day, then the dilution factor can be by dividing the unregulated flow by the total facility
flows (regulated and unregulated process wastewater) to determine a dilution factor of 0.028 for that
production day. This example is shown in the following calculation:
Dilution Factor for the Production Day =
1,092 𝑔𝑝𝑑 (𝑢𝑛𝑟𝑒𝑔𝑢𝑙𝑎𝑡𝑒𝑑 𝑤𝑎𝑠𝑡𝑒𝑤𝑎𝑡𝑒𝑟 𝑓𝑙𝑜𝑤)
37,327 𝑔𝑝𝑑 (𝑟𝑒𝑔𝑢𝑙𝑎𝑡𝑒𝑑 𝑤𝑎𝑠𝑡𝑒𝑤𝑎𝑡𝑒𝑟 𝑓𝑙𝑜𝑤) + 1,092 𝑔𝑝𝑑 (𝑢𝑛𝑟𝑒𝑔𝑢𝑙𝑎𝑡𝑒𝑑 𝑤𝑎𝑠𝑡𝑒𝑤𝑎𝑡𝑒𝑟 𝑓𝑙𝑜𝑤)
Dilution factor for the production day = 0.028
If a representative sampling event for fluoride (F) results in a concentration of 11.00 mg/L, then the facility
will adjust the F concentration by the dilution factor. The dilution flow is assumed to contain zero F. This
is accomplished by multiplying the sample result by the dilution factor, then adding the result of this
calculation to the sample result to generate an adjusted daily concentration, as shown in the following
steps:
Step 1 – 11.00 mg/L (F concentration) x 0.028 (dilution factor) = 0.313 mg/L
Step 2 – 11.00 mg/L + 0.313 mg/L = 11.31 mg/L (Adjusted Daily Concentration)
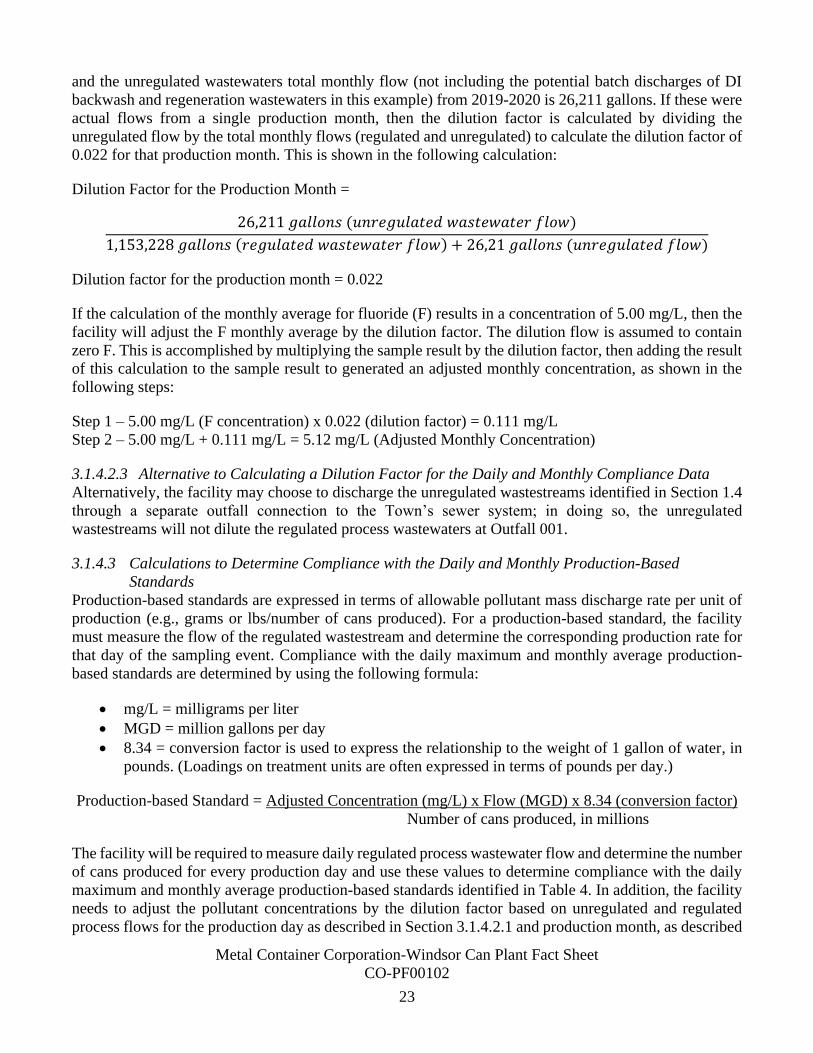
3.1.4.2.2 Monthly Calculation Example
For example, the regulated process wastewater total monthly flow from 2019-2020 is 1,153,228 gallons
Metal Container Corporation-Windsor Can Plant Fact Sheet
CO-PF00102
23
and the unregulated wastewaters total monthly flow (not including the potential batch discharges of DI
backwash and regeneration wastewaters in this example) from 2019-2020 is 26,211 gallons. If these were
actual flows from a single production month, then the dilution factor is calculated by dividing the
unregulated flow by the total monthly flows (regulated and unregulated) to calculate the dilution factor of
0.022 for that production month. This is shown in the following calculation:
Dilution Factor for the Production Month =
26,211 𝑔𝑎𝑙𝑙𝑜𝑛𝑠 (𝑢𝑛𝑟𝑒𝑔𝑢𝑙𝑎𝑡𝑒𝑑 𝑤𝑎𝑠𝑡𝑒𝑤𝑎𝑡𝑒𝑟 𝑓𝑙𝑜𝑤)
1,153,228 𝑔𝑎𝑙𝑙𝑜𝑛𝑠 (𝑟𝑒𝑔𝑢𝑙𝑎𝑡𝑒𝑑 𝑤𝑎𝑠𝑡𝑒𝑤𝑎𝑡𝑒𝑟 𝑓𝑙𝑜𝑤) + 26,21 𝑔𝑎𝑙𝑙𝑜𝑛𝑠 (𝑢𝑛𝑟𝑒𝑔𝑢𝑙𝑎𝑡𝑒𝑑 𝑓𝑙𝑜𝑤)
Dilution factor for the production month = 0.022
If the calculation of the monthly average for fluoride (F) results in a concentration of 5.00 mg/L, then the
facility will adjust the F monthly average by the dilution factor. The dilution flow is assumed to contain
zero F. This is accomplished by multiplying the sample result by the dilution factor, then adding the result
of this calculation to the sample result to generated an adjusted monthly concentration, as shown in the
following steps:
Step 1 – 5.00 mg/L (F concentration) x 0.022 (dilution factor) = 0.111 mg/L
Step 2 – 5.00 mg/L + 0.111 mg/L = 5.12 mg/L (Adjusted Monthly Concentration)
3.1.4.2.3 Alternative to Calculating a Dilution Factor for the Daily and Monthly Compliance Data
Alternatively, the facility may choose to discharge the unregulated wastestreams identified in Section 1.4
through a separate outfall connection to the Town’s sewer system; in doing so, the unregulated
wastestreams will not dilute the regulated process wastewaters at Outfall 001.
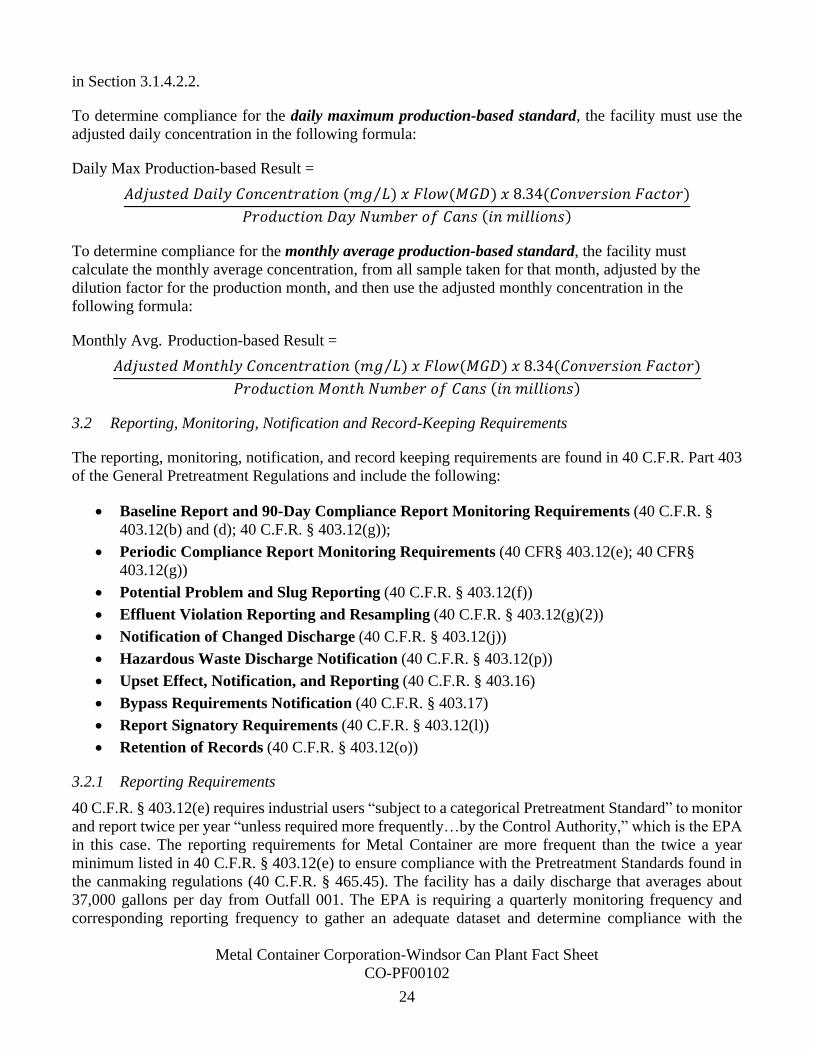
3.1.4.3 Calculations to Determine Compliance with the Daily and Monthly Production-Based
Standards
Production-based standards are expressed in terms of allowable pollutant mass discharge rate per unit of
production (e.g., grams or lbs/number of cans produced). For a production-based standard, the facility
must measure the flow of the regulated wastestream and determine the corresponding production rate for
that day of the sampling event. Compliance with the daily maximum and monthly average production-
based standards are determined by using the following formula:
• mg/L = milligrams per liter
• MGD = million gallons per day
• 8.34 = conversion factor is used to express the relationship to the weight of 1 gallon of water, in
pounds. (Loadings on treatment units are often expressed in terms of pounds per day.)
Production-based Standard = Adjusted Concentration (mg/L) x Flow (MGD) x 8.34 (conversion factor)
Number of cans produced, in millions
The facility will be required to measure daily regulated process wastewater flow and determine the number
of cans produced for every production day and use these values to determine compliance with the daily
maximum and monthly average production-based standards identified in Table 4. In addition, the facility
needs to adjust the pollutant concentrations by the dilution factor based on unregulated and regulated
process flows for the production day as described in Section 3.1.4.2.1 and production month, as described
Metal Container Corporation-Windsor Can Plant Fact Sheet
CO-PF00102
24
in Section 3.1.4.2.2.
To determine compliance for the daily maximum production-based standard, the facility must use the
adjusted daily concentration in the following formula:
Daily Max Production-based Result =
𝐴𝑑𝑗𝑢𝑠𝑡𝑒𝑑 𝐷𝑎𝑖𝑙𝑦 𝐶𝑜𝑛𝑐𝑒𝑛𝑡𝑟𝑎𝑡𝑖𝑜𝑛 (𝑚𝑔 𝐿⁄ ) 𝑥 𝐹𝑙𝑜𝑤(𝑀𝐺𝐷) 𝑥 8.34(𝐶𝑜𝑛𝑣𝑒𝑟𝑠𝑖𝑜𝑛 𝐹𝑎𝑐𝑡𝑜𝑟)
𝑃𝑟𝑜𝑑𝑢𝑐𝑡𝑖𝑜𝑛 𝐷𝑎𝑦 𝑁𝑢𝑚𝑏𝑒𝑟 𝑜𝑓 𝐶𝑎𝑛𝑠 (𝑖𝑛 𝑚𝑖𝑙𝑙𝑖𝑜𝑛𝑠)
To determine compliance for the monthly average production-based standard, the facility must
calculate the monthly average concentration, from all sample taken for that month, adjusted by the
dilution factor for the production month, and then use the adjusted monthly concentration in the
following formula:
Monthly Avg. Production-based Result =
𝐴𝑑𝑗𝑢𝑠𝑡𝑒𝑑 𝑀𝑜𝑛𝑡ℎ𝑙𝑦 𝐶𝑜𝑛𝑐𝑒𝑛𝑡𝑟𝑎𝑡𝑖𝑜𝑛 (𝑚𝑔 𝐿⁄ ) 𝑥 𝐹𝑙𝑜𝑤(𝑀𝐺𝐷) 𝑥 8.34(𝐶𝑜𝑛𝑣𝑒𝑟𝑠𝑖𝑜𝑛 𝐹𝑎𝑐𝑡𝑜𝑟)
𝑃𝑟𝑜𝑑𝑢𝑐𝑡𝑖𝑜𝑛 𝑀𝑜𝑛𝑡ℎ 𝑁𝑢𝑚𝑏𝑒𝑟 𝑜𝑓 𝐶𝑎𝑛𝑠 (𝑖𝑛 𝑚𝑖𝑙𝑙𝑖𝑜𝑛𝑠)
3.2 Reporting, Monitoring, Notification and Record-Keeping Requirements
The reporting, monitoring, notification, and record keeping requirements are found in 40 C.F.R. Part 403
of the General Pretreatment Regulations and include the following:
• Baseline Report and 90-Day Compliance Report Monitoring Requirements (40 C.F.R. §
403.12(b) and (d); 40 C.F.R. § 403.12(g));
• Periodic Compliance Report Monitoring Requirements (40 CFR§ 403.12(e); 40 CFR§
403.12(g))
• Potential Problem and Slug Reporting (40 C.F.R. § 403.12(f))
• Effluent Violation Reporting and Resampling (40 C.F.R. § 403.12(g)(2))
• Notification of Changed Discharge (40 C.F.R. § 403.12(j))
• Hazardous Waste Discharge Notification (40 C.F.R. § 403.12(p))
• Upset Effect, Notification, and Reporting (40 C.F.R. § 403.16)
• Bypass Requirements Notification (40 C.F.R. § 403.17)
• Report Signatory Requirements (40 C.F.R. § 403.12(l))
• Retention of Records (40 C.F.R. § 403.12(o))
3.2.1 Reporting Requirements
40 C.F.R. § 403.12(e) requires industrial users “subject to a categorical Pretreatment Standard” to monitor
and report twice per year “unless required more frequently…by the Control Authority,” which is the EPA
in this case. The reporting requirements for Metal Container are more frequent than the twice a year
minimum listed in 40 C.F.R. § 403.12(e) to ensure compliance with the Pretreatment Standards found in
the canmaking regulations (40 C.F.R. § 465.45). The facility has a daily discharge that averages about
37,000 gallons per day from Outfall 001. The EPA is requiring a quarterly monitoring frequency and
corresponding reporting frequency to gather an adequate dataset and determine compliance with the
Metal Container Corporation-Windsor Can Plant Fact Sheet
CO-PF00102
25
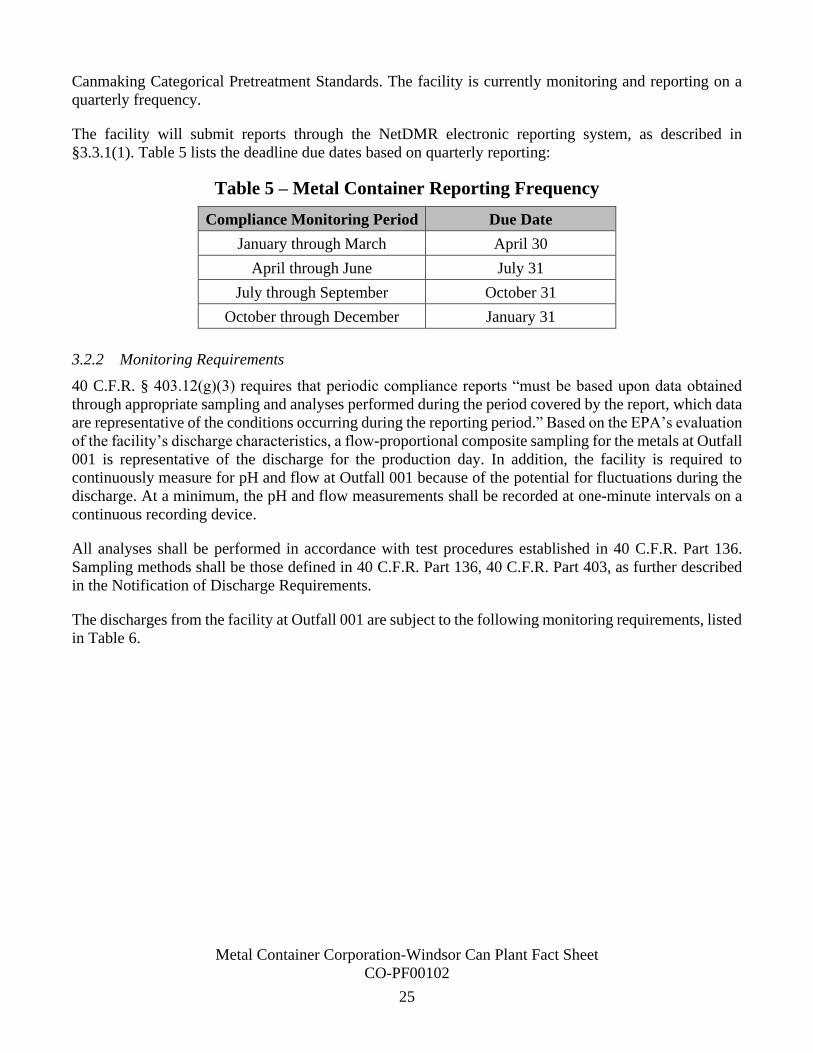
Canmaking Categorical Pretreatment Standards. The facility is currently monitoring and reporting on a
quarterly frequency.
The facility will submit reports through the NetDMR electronic reporting system, as described in
§3.3.1(1). Table 5 lists the deadline due dates based on quarterly reporting:
Table 5 – Metal Container Reporting Frequency
Compliance Monitoring Period Due Date
January through March April 30
April through June July 31
July through September October 31
October through December January 31
3.2.2 Monitoring Requirements
40 C.F.R. § 403.12(g)(3) requires that periodic compliance reports “must be based upon data obtained
through appropriate sampling and analyses performed during the period covered by the report, which data
are representative of the conditions occurring during the reporting period.” Based on the EPA’s evaluation
of the facility’s discharge characteristics, a flow-proportional composite sampling for the metals at Outfall
001 is representative of the discharge for the production day. In addition, the facility is required to
continuously measure for pH and flow at Outfall 001 because of the potential for fluctuations during the
discharge. At a minimum, the pH and flow measurements shall be recorded at one-minute intervals on a
continuous recording device.
All analyses shall be performed in accordance with test procedures established in 40 C.F.R. Part 136.
Sampling methods shall be those defined in 40 C.F.R. Part 136, 40 C.F.R. Part 403, as further described
in the Notification of Discharge Requirements.
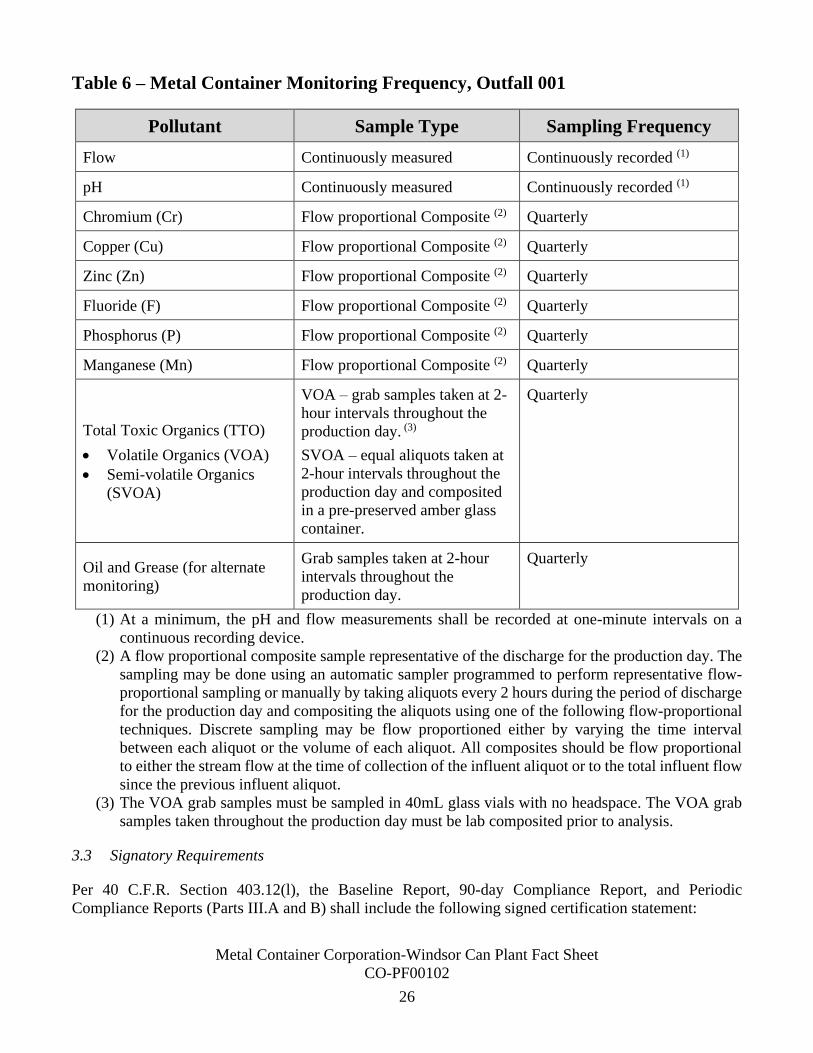
The discharges from the facility at Outfall 001 are subject to the following monitoring requirements, listed
in Table 6.
Metal Container Corporation-Windsor Can Plant Fact Sheet
CO-PF00102
26
Table 6 – Metal Container Monitoring Frequency, Outfall 001
Pollutant Sample Type Sampling Frequency
Flow Continuously measured Continuously recorded (1)
pH Continuously measured Continuously recorded (1)
Chromium (Cr) Flow proportional Composite (2) Quarterly
Copper (Cu) Flow proportional Composite (2) Quarterly
Zinc (Zn) Flow proportional Composite (2) Quarterly
Fluoride (F) Flow proportional Composite (2) Quarterly
Phosphorus (P) Flow proportional Composite (2) Quarterly
Manganese (Mn) Flow proportional Composite (2) Quarterly
Total Toxic Organics (TTO)
• Volatile Organics (VOA)
• Semi-volatile Organics
(SVOA)
VOA – grab samples taken at 2-
hour intervals throughout the
production day. (3)
SVOA – equal aliquots taken at
2-hour intervals throughout the
production day and composited
in a pre-preserved amber glass
container.
Quarterly
Oil and Grease (for alternate
monitoring)
Grab samples taken at 2-hour
intervals throughout the
production day.
Quarterly
(1) At a minimum, the pH and flow measurements shall be recorded at one-minute intervals on a
continuous recording device.
(2) A flow proportional composite sample representative of the discharge for the production day. The
sampling may be done using an automatic sampler programmed to perform representative flow-
proportional sampling or manually by taking aliquots every 2 hours during the period of discharge
for the production day and compositing the aliquots using one of the following flow-proportional
techniques. Discrete sampling may be flow proportioned either by varying the time interval
between each aliquot or the volume of each aliquot. All composites should be flow proportional
to either the stream flow at the time of collection of the influent aliquot or to the total influent flow
since the previous influent aliquot.
(3) The VOA grab samples must be sampled in 40mL glass vials with no headspace. The VOA grab
samples taken throughout the production day must be lab composited prior to analysis.
3.3 Signatory Requirements
Per 40 C.F.R. Section 403.12(l), the Baseline Report, 90-day Compliance Report, and Periodic
Compliance Reports (Parts III.A and B) shall include the following signed certification statement:
Metal Container Corporation-Windsor Can Plant Fact Sheet
CO-PF00102
27
I certify under penalty of law that this document and all attachments were prepared under my
direction or supervision in accordance with a system designed to assure that qualified personnel
properly gather and evaluate the information submitted. Based on my inquiry of the person or
persons who manage the system, or those persons directly responsible for gathering the
information, the information submitted is, to the best of my knowledge and belief, true, accurate,
and complete. I am aware that there are significant penalties for submitting false information,
including the possibility of fine and imprisonment for knowing violations.
The certification statement shall be signed as follows:
1. By a responsible corporate officer, if the Industrial User is a corporation. For the purpose of this
paragraph, a responsible corporate officer means:
a. A president, secretary, treasurer, or vice-president of the corporation in charge of a principal
business function, or any other person who performs similar policy- or decision-making
functions for the corporation, or
b. The manager of one or more manufacturing, production, or operating facilities, provided, the
manager is authorized to make management decisions which govern the operation of the
regulated facility including having the explicit or implicit duty of making major capital
investment recommendations, and initiate and direct other comprehensive measures to assure
long-term environmental compliance with environmental laws and regulations; can ensure that
the necessary systems are established or actions taken to gather complete and accurate
information for control mechanism requirements; and where authority to sign documents has
been assigned or delegated to the manager in accordance with corporate procedures.
2. By a general partner or proprietor if the Industrial User is a partnership, or sole proprietorship
respectively.
3. By a duly authorized representative of the individual designated in (1) or (2) of this section if:
a. The authorization is made in writing by the individual described in paragraph (1) or (2);
b. The authorization specifies either an individual or a position having responsibility for the
overall operation of the facility from which the Industrial Discharge originates, such as the
position of plant manager, operator of a well, or well field superintendent, or a position of
equivalent responsibility, or having overall responsibility for environmental matters for the
company; and
c. The written authorization is submitted to the EPA.
4. If an authorization under (3) of this section is no longer accurate because a different individual or
position has responsibility for the overall operation of the facility, or overall responsibility for
environmental matters for the company, a new authorization satisfying the requirements of (3) of this
section must be submitted to EPA prior to or together with any reports to be signed by an authorized
representative.
3.3.1 Reporting and Notification Contacts
1. On October 22, 2015, the Environmental Protection Agency (EPA) published in the federal
register the NPDES Electronic Reporting rule for all NPDES permit reporting and notification
requirements (40 C.F.R. Part 127). The deadline for the electronic reporting of Periodic
Compliance Reports for CIUs/SIUs in municipalities without an approved Pretreatment (Phase
2 of the Rule) is December 21, 2020 (40 C.F.R. §127.16). A proposal to extend this deadline
Metal Container Corporation-Windsor Can Plant Fact Sheet
CO-PF00102
28
to December 21, 2025 was signed by the EPA on September 23, 2020. Upon the effective date
of the NPDES Electronic Reporting Rule, the facility will be required to:
a. Establish a NetDMR account to electronically submit DMRs and notifications and must
sign and certify all electronic submissions in accordance with the signatory
requirements of the control mechanism. NetDMR is accessed from the internet at
https://netdmr.zendesk.com/home. Additionally, the facility can contact the EPA via
our [email protected] mailbox for any individual assistance or one-on-one training
and support.
b. Effluent monitoring results will be summarized for each month and recorded on a DMR
to be submitted via NetDMR to the EPA on a quarterly basis. If no discharge occurs
during a month, it shall be stated as such on the DMR.
2. Until the effective date of the NPDES Electronic Reporting Rule, the facility may either submit
Periodic Compliance Reports electronically, as described above, or submit hard copies to the
address below. Other written reports and notifications to the EPA shall be submitted at the
following address:
NPDES and Wetlands Enforcement Section (8ENF-W-NW)
US EPA Region 8
1595 Wynkoop Street
Denver, CO 80202
Attention: Pretreatment
3. All written reports and notifications must also be submitted to the POTW at the following
address:
Dennis Markham, WWTF Manager
Town of Windsor
Windsor, CO 80550
970-686-2144/[email protected]
4. Verbal notifications required to be submitted to the EPA shall be made by calling either number
below and asking to speak with NPDES Enforcement, Pretreatment.
303-312-6312 or 800-227-8917
5. Verbal notifications required to be submitted to the POTW shall be made by calling the number
below.
720-466-6109
Public Notice Period and Response to Comments
The proposed fact sheet and discharge requirements for the Metal Container-Windsor Can Plant developed
by Al Garcia, EPA Region 8 Pretreatment Coordinator, 303.312.6382, were public noticed in the Windsor
Metal Container Corporation-Windsor Can Plant Fact Sheet
CO-PF00102
29
Beacon on [Date] for a 30-day public comment period. During the public notice period, EPA received
public comments from the [Commentors] on [Date].
A summary of the [Commentor] comments on the public notice documents include the following:
1.
2.
3.
4.
EPA’s responses to the submitted comments are provided below:
Comments received during Public Notice: