
Online Marketing to Investors - How to Develop Effective Investor Relations (Book)
Upload
khangminh22Category
view
1download
0
2014INVESTOR FACT BOOK
© 2014 McGRAW HILL FInAnCIALwww.mhfi .com
MH
FI
A global leader in credit ratings, benchmarks, and analytics

Douglas L. Peterson, President and Chief Executive Officer, and members of MHFI’s leadership provide greater insight into the new McGraw Hill Financial at its inaugural Investor Day event
Board of Directors Harold McGraw III (E)
Chairman of the Board and former President & CEOMcGraw Hill Financial
Douglas L. PetersonPresident and Chief Executive OfficerMcGraw Hill Financial
Sir Winfried Bischoff (C, E, F)
ChairmanFinancial Reporting Council
William D. Green (C, N)
Retired Executive ChairmanAccenture
Charles E. “Ed” Haldeman, Jr. (A, C)
Chairman of the BoardKCG Holdings, Inc.
Robert P. McGraw (F)
Chairman and Chief Executive OfficerAverdale Holdings, LLC
Hilda Ochoa-Brillembourg (A, F)
Founder, President and Chief Executive OfficerStrategic Investment Group
Sir Michael Rake (A, E, F)
ChairmanBT Group plc
Edward B. Rust, Jr. (A, C, E, N)
Chairman, President and Chief Executive OfficerState Farm Insurance Companies
Kurt L. Schmoke (F, N)
PresidentUniversity of Baltimore
Sidney Taurel (C, E, N)
Chairman EmeritusEli Lilly and Company
Richard E. Thornburgh (A, F)
Vice ChairmanCorsair Capital LLC
LeadershipDouglas L. PetersonPresident and Chief Executive Officer
John L. BerisfordExecutive Vice PresidentHuman Resources
Jack F. Callahan, Jr.Executive Vice President andChief Financial Officer
Kathryn Cassino-McHughPresidentMcGraw Hill Construction
Imogen Dillon HatcherActing PresidentS&P Capital IQ
Lucy FatoExecutive Vice President andGeneral Counsel
Donald R. HowardChief Risk and Compliance Officer
Roopa KudvaManaging Director andChief Executive OfficerCRISIL Limited
Alexander J. MatturriChief Executive OfficerS&P Dow Jones Indices
Lawrence P. NealPresidentPlatts
Finbarr O’NeillPresidentJ.D. Power
Neeraj SahaiPresidentStandard & Poor’s Ratings Services
Paul SheardChief Global Economist and Head of Global Economics & Research
D. Edward SmythExecutive Vice PresidentCorporate Affairs
(A) Audit Committee
(C) Compensation & Leadership Development Committee
(E) Executive Committee
(F) Financial Policy Committee
(N) Nominating & Corporate Governance Committee
2014 Investor Fact Book 1
McGraw Hill Financial
Comparison of Adjusted Information to U.S. GAAP Information: The non-GAAP financial measures contained in the 2014 Investor Fact Book are derived from the Company’s continuing operations. This information is provided in order to allow investors to make meaningful comparisons of the Company’s operating performance between periods and to view the Company’s business from the same perspective as Company management. These non-GAAP measures may be different than similar measures used by other companies. Reconciliations for the differences between non-GAAP measures and comparable financial measures calculated in accordance with U.S. GAAP are provided on page 65. The non-GAAP measures included herein exclude certain items and should be read in conjunction with audited financial statements, including related notes and other financial information contained in the Company’s most recent filings with the U.S. Securities and Exchange Commission.
Overview 2 – 3 Creating Growth and Driving Performance
4 – 5 Free Cash Flow | Net (Cash) Debt to EBITDA | Cash Returned to Shareholders
6 – 7 Adjusted Consolidated Profit & Loss
8 Adjusted Operating Results at a Glance
9 Adjusted Quarterly Results: 2013
Standard & Poor’s Ratings Services
10 – 11 Credit Ratings, Research & Analytics
12 CRISIL Limited
13 Interactive Tools Add Transparency to Ratings Process
14 – 20 Global Debt Markets: U.S. | EMEA | Asia-Pacific
21 Standard & Poor’s Ratings Services’ Track Record: Meeting the Test of Time
22 – 23 Ratings Diversification
S&P Capital IQ 24 – 25 Multi-Asset-Class and Real-Time Data, Research & Analytics
26 Broad and Deep Global Coverage
27 Desktop Solutions
28 Enterprise Solutions
29 S&P Credit Solutions
30 – 31 Markets Intelligence
S&P Dow Jones Indices
32 – 33 Global Resource for Index-Based Innovation, Data & Research
34 – 35 Investable & Benchmark Indices
36 – 37 Index Solutions
Commodities & CommercialMarkets
38 – 39 Data, Analytics & Vertical News for Key Sectors of the Global Economy
40 – 43 Platts
44 – 45 J.D. Power
46 – 47 McGraw Hill Construction
Financial ReviewU.S. GAAP
48 – 49 2013 Financial Highlights
50 – 53 Operating Segment Trends: Revenue | Expenses | Operating Profit & Profit Margin
54 – 56 Foreign Source Revenue
57 Recurring Revenue
58 Earnings Before Interest, Taxes, Depreciation, and Amortization
59 Capital Investments
60 – 61 Acquisitions & Divestitures
62 – 63 Advancing Total Shareholder Value: Share Repurchases | Dividend Record | Stock History | Debt Profile
64 Items Affecting Comparability of Results
65 Reconciliation of Adjusted Information to U.S. GAAP Information

2 McGraw Hill Financial
Overview
In May 2014, the Company completed its first year as McGraw Hill Financial by launching Growth & Performance goals after the successful completion of the Growth and Value Plan.
McGraw Hill Financial’s vision is to be the leading provider of essential intelligence—independent benchmarks, credit ratings, portfolio and enterprise risk solutions, and analytics—to the global capital, commodity, and corporate markets. The Company’s mission is to promote sustainable growth by bringing transparency and independent insights to customers and the global markets they serve.
McGraw Hill Financial is committed to developing products and capabilities that meet evolving customer needs in new markets and deliver global growth in both new and existing markets. Integrating and leveraging key capabilities is critical to improving performance and delivering against strategic priorities.
McGraw Hill Financial strongly adheres to its core values of fairness, integrity, and transparency to help build robust economies, better lives, and stronger communities throughout the world. It is these core beliefs that have enabled the Company to consistently grow, perform, and create value for its shareholders for more than 125 years.
McGraw Hill Financial is a leader in credit ratings, benchmarks, and analytics for the global capital, commodity, and corporate markets
www.mhfi.com
McGraw Hill Financial—Creating Growth and Driving Performance
� The McGraw-Hill Companies (as originally reported)
� McGraw Hill Financial
Accelerated Revenue Growth
‘13‘11 ‘12‘10‘09
-6.3%
3.6%
9.6%
12.5%
2.9%
8.6%
Growth & Performance Goals: 2014–2016
Setting annual growth goals:∫ Mid to high single-digit revenue growth∫ Sustained margin expansion∫ Mid-teens EPS growth∫ ~$1 billion per year free cash flow
Maintaining disciplined capital allocation:∫ Continue to pursue attractive
acquisitions∫ Sustain dividend growth and share
repurchases
Shifting from a holding company to an active management model
Completing portfolio rationalization with evaluation of strategic alternatives for McGraw Hill Construction
Targeting at least $100 million in productivity savings

2014 Investor Fact Book 3
MHFI: An Exceptional Investment Opportunity
Compelling Financial Advantages
Well positioned in growth markets
Strong fundamental recurring revenue through subscriptions
Operating margins high and improving
Minimal reinvestment and working capital requirements
Low asset intensity
Strong free cash flow generation
Secular Trends Position MHFI for Sustained Growth
Developing capital markets in emerging countries
Funding significant maturities and financing requirements as banks deleverage
Increasing sophistication requires real-time data and analytics
Continuing shift to index-related investing
Continuing demand across commodities for daily price assessments
Overview
Leading Brands, Unparalleled Analytics, and Global Presence
Leveraging the Company’s unique portfolio of powerful brands and distinctive opportunities in the financial, commodity, and corporate markets
Leading rating agency
Premier provider of high-quality data, analytical tools, and ratings information
Foremost index provider
Principal provider of commodity price assessments and information
Primary quality benchmark provider with deep auto expertise
Leading Indian rating agency, analytics and knowledge process outsourcing

4 McGraw Hill Financial
McGraw Hill Financial: A Strong Heritage of Creating Shareholder Value
Free Cash Flow
Years ended December 31 MHFI (1, 2, 3)
(dollars in millions) 2003 2004 2005 2006 2007 2008 2009 2010 2011 2012 2013
Cash provided by operating activities $ 1,383 $ 1,064 $ 1,561 $ 1,511 $ 1,721 $ 1,178 $ 1,330 $ 704 $ 924 $ 747 $ 816
Investment in prepublication costs (218) (238) (258) (277) (299) (254) (177) – – – –
Capital expenditures (143) (150) (137) (150) (246) (131) (92) (86) (92) (97) (117)
Dividends and other payments paid to noncontrolling interests – – (1) (2) (4) (9) (9) (34) (23) (24) (75)
Free cash flow $ 1,022 $ 676 $ 1,165 $ 1,082 $ 1,172 $ 784 $ 1,052 $ 584 $ 809 $ 626 $ 624
Net (Cash) Debt to EBITDA
Years ended December 31 MHFI*
(dollars in millions) 2003 2004 2005 2006 2007 2008 2009 2010 2011 2012 2013
Cash and equivalents & short-term investments $ 696 $ 681 $ 749 $ 354 $ 396 $ 405 $ 1,118 $ 1,439 $ 864 $ 761 $ 1,560
Total debt 26 5 3 3 1,197 1,268 1,198 1,198 1,198 1,256 799
Net (cash) debt $ (670) $ (676) $ (746) $ (351) $ 801 $ 863 $ 80 $ (241) $ 334 $ 495 $ (761)
EBITDA $ 1,255 $ 1,302 $ 1,521 $ 1,588 $ 1,838 $ 1,142 $ 1,072 $ 1,134 $ 1,203 $ 1,352 $ 1,542
Net (cash) debt to EBITDA (0.5x) (0.5x) (0.5x) (0.2x) 0.5x 0.8x 0.1x (0.2x) 0.3x 0.4x (0.5x)
* MHFI: McGraw Hill Financial’s results for 2008–2013 reflect McGraw-Hill Education as a discontinued operation
McGraw Hill Financial’s 2013 total shareholder return of 46% outperformed the S&P 500’s return of 32%
(1) The free cash flow presentation for 2010–2013 reflects McGraw-Hill Education as a discontinued operation. Prior years (2003-2009) were not restated
(2) 2012 free cash flow was influenced by costs to enable the separation of McGraw-Hill Education and a pension contribution in Q4 2012
(3) 2013 free cash flow was influenced by a tax payment in Q1 2013 that was extended from Q4 2012, a legal settlement, and a payment related to an early lease termination
-10.0%
10.0%
30.0%
50.0%
� MHFI Total Shareholder Return (4) � MHFI Share Price (5) � S&P 500 TR Index (SPYZ) +45.9% +43.0% +32.4%
Total Shareholder Return
12/31/133/31/1312/31/12 6/30/13 9/30/13
(4) Calculated using dividend-adjusted closing share price(5) Calculated using non-adjusted closing share price
Note: Total Shareholder Return (TSR) represents stock price appreciation plus reinvestment of dividends
Source: S&P Capital IQ

2014 Investor Fact Book 5
41st Consecutive Year of Dividend IncreasesMcGraw Hill Financial is one of fewer than 25 companies in the S&P 500 that has increased its dividend annually for the last 41 years
In January 2014, the Board of Directors approved a 7.1% increase in the regular quarterly cash dividend on the Company’s common stock
Since 1974, the Company’s annual dividend has grown at an average compound rate of 9.5%
The Company has paid a dividend each year since 1937
$1.3 Billion in Dividends and Share Repurchases Returned to Shareholders in 2013The Company’s 2013 total shareholder return of 46% outperformed the 32% return for the S&P 500
Total shareholder return has exceeded the broader market over the last ten-, five- and three-year periods, as of year-end 2013
New 50 Million Share Repurchase Authorized in December 2013In December 2013, the Board of Directors approved a new authorization to repurchase up to 50 million shares, or approximately 18% of the Company’s outstanding shares
During the first half of 2014, approximately 4.4 million shares were repurchased; 45.6 million shares remain available from this authorization
From the start of 2011 through the first half of 2014, the Company returned nearly $5 billion to shareholders through dividends and share buybacks
750
1,500
2,250
$3,000
Cash Returned to Shareholders(dollars in millions)
‘11 ‘12 ‘13‘03 ‘04 ‘05 ‘06 ‘07 ‘08 ‘09� Special dividend – – – – – – – – – $ 697 –� Regular dividend $207 $228 $246 $ 260 $ 278 $281 $281 $292 $ 296 287 $ 308� Share repurchases 216 409 678 1,540 2,213 447 – 256 1,500 295 978 Total MHFI $423 $637 $924 $1,800 $2,491 $728 $281 $548 $1,796 $1,279 $1,286
‘10
Overview
Notes: Shares repurchased are reported on a settlement-date basis 2012 includes a special dividend of $2.50 per share on the Company’s common stock

6 McGraw Hill Financial
McGraw Hill Financial, Inc. (NYSE: MHFI)
Adjusted Consolidated Profit & Loss
(in millions, except per share data) 2010 2011 2012 2013(2)
Total revenue (1) $ 3,639 $ 3,954 $ 4,450 $ 4,875
Total adjusted expenses 2,406 2,637 2,863 3,144
Total adjusted segment operating profit $ 1,233 $ 1,318 $ 1,587 $ 1,731
Adjusted unallocated income/(expense) (188) (198) (202) (129)
Total adjusted operating profit (3) $ 1,045 $ 1,119 $ 1,385 $ 1,602
Adjusted interest (expense), net (83) (77) (81) (59)
Adjusted income from continuing operations before taxes on income $ 962 $ 1,042 $ 1,304 $ 1,543
Adjusted provision for taxes on income 351 389 469 525
Effective tax rate 36.5% 37.3% 36.0% 34.0%
Adjusted income from continuing operations $ 611 $ 653 $ 835 $ 1,018
Less: Adjusted net income attributable to noncontrolling interests (17) (19) (52) (87)
Adjusted net income attributable to McGraw Hill Financial from continuing operations $ 594 $ 634 $ 783 $ 931
Diluted weighted average shares outstanding 312.2 303.6 284.6 279.8
Adjusted diluted earnings per share from continuing operations $ 1.90 $ 2.09 $ 2.75 $ 3.33
Note: Details may not sum to total due to rounding
(1) Total operating revenue includes intersegment revenue elimination of $56 million in 2010, $63 million in 2011, $69 million in 2012, and $76 million in 2013
(2) Beginning on January 1, 2014, all shared operating services are fully allocated to the business units utilizing a methodology that more closely aligns with each business unit’s usage of these services. The Company recasted 2013 information to reflect $75 million of costs that were reallocated to the business units. Prior years were not recasted
(3) Adjusted total operating profit includes adjusted unallocated expense
*MHFI: McGraw Hill Financial’s results for 2008-2013 reflect McGraw-Hill Education as a discontinued operation
Financial Performance Measures
2013 Financial Highlights
Revenue grew 10% to $4.9 billion
Net income from continuing operations increased 20% to $812 million and increased 19% to $931 million on an adjusted basis
Diluted EPS from continuing operations grew 22% to $2.90 and increased 21% to $3.33 on an adjusted basis
Regular quarterly cash dividend increased for the 41st consecutive year
The 2014 Investor Fact Book presents MHFI’s financial results on an adjusted, non-GAAP basis for 2010–2013. Financials are also presented on a U.S. GAAP basis. See the complete Financial Review on pages 48 to 63 and the accompanying notes and reconciliation of non-GAAP measures to U.S. GAAP measures on pages 64 and 65.
The non-GAAP financial measures are derived from the Company’s continuing operations. This information is provided in order to allow investors to make meaningful comparisons of the Company’s operating performance between periods and to view the Company’s business from the same perspective as Company management. These non-GAAP measures may be different than similar measures used by other companies. The non-GAAP measures included herein exclude certain items and should be read in conjunction with audited financial statements, including related notes and other financial information contained in the Company’s most recent filings with the U.S. Securities and Exchange Commission.

2014 Investor Fact Book 7
The results for the new McGraw Hill Financial serve as a baseline for MHFI’s future performance. McGraw Hill Financial’s results for 2008 to 2013 reflect McGraw-Hill Education as a discontinued operation.
250
500
750
$1,000
‘11 ‘12 ‘13‘10
Total $594 $634 $783 $931
Year-Over-Year Change — 7% 24% 19%
Adjusted Net Income Attributable to MHFI from Continuing Operations(dollars in millions)
Adjusted Net Income Attributable to MHFI from Continuing Operations(dollars in millions)
+16%3-year CAGR
1.00
2.00
3.00
$4.00
‘11 ‘12 ‘13‘10
Total $1.90 $2.09 $2.75 $3.33
Year-Over-Year Change — 10% 32% 21%
Adjusted Diluted EPS(in dollars)
Adjusted Diluted EPS(in dollars)
+21%3-year CAGR
450
900
1,350
$1,800
‘11 ‘12 ‘13‘10
Total $1,045 $1,119 $1,385 $1,602
Year-Over-Year Change — 7% 24% 16%
Adjusted Total Operating Profit(dollars in millions)
Adjusted Total Operating Profit(dollars in millions)
+15%3-year CAGR
1,250
2,500
3,750
$5,000
Revenue(dollars in millions)
Revenue(dollars in millions)
‘11 ‘12 ‘13‘10
Total $3,639 $3,954 $4,450 $4,875
Year-Over-Year Change — 9% 13% 10%
+10%3-year CAGR
Overview

8 McGraw Hill Financial
Adjusted Operating Results at a Glance*
Standard & Poor’s Ratings Services (2, 4)
(dollars in millions) 2011 2012 2013
Revenue $ 1,767 $ 2,034 $ 2,274
Adjusted segment operating profit $ 728 $ 865 $ 952
Adjusted segment operating profit margin 41.2% 42.5% 41.9%
S&P Capital IQ (2, 4, 6)
(dollars in millions) 2011 2012 2013
Revenue $ 1,031 $ 1,124 $ 1,170
Adjusted segment operating profit $ 214 $ 228 $ 201
Adjusted segment operating profit margin 20.8% 20.3% 17.2%
S&P Dow Jones Indices (4, 5)
(dollars in millions) 2011 2012 2013
Revenue $ 323 $ 388 $ 493
Adjusted segment operating profit $ 189 $ 234 $ 266
Adjusted segment operating profit margin 58.5% 60.4% 54.0%
Commodities & Commercial Markets (4, 7, 8)
(dollars in millions) 2011 2012 2013
Revenue $ 896 $ 973 $ 1,014
Adjusted segment operating profit $ 186 $ 260 $ 312
Adjusted segment operating profit margin 20.7% 26.8% 30.8%
Revenue by Group
(dollars in millions) 2011 2012 2013
Commodities $ 419 $ 489 $ 550
Commercial Markets $ 477 $ 484 $ 464
Notes for pages 8 and 9:(1) Total operating revenue includes intersegment
revenue elimination of $76 million
(2) Segment revenues do not include intersegment revenue elimination of $63 million in 2011, $69 million in 2012, and $76 million in 2013. Percentages may sum to greater than 100%
(3) Adjusted total operating profit includes unallocated expense of $129 million for 2013
(4) Beginning on January 1, 2014, all shared operating services are fully allocated to the business units utilizing a methodology that more closely aligns with each business unit’s usage of these services. The Company recasted 2013 information to reflect $75 million of costs that were reallocated to the business units. Prior years were not recasted
(5) Includes adjusted operating profit attributable to noncontrolling interests ($73 million in 2013; $36 million in 2012) as part of S&P Dow Jones Indices joint venture launched in June 2012
(6) 2013 results reflect the divestiture of Financial Communications and the shutdown of several small products within the business unit (S&P Capital IQ)
(7) Aviation Week was sold on August 1, 2013. Its results are included through that date
(8) The Broadcasting Group was sold in 2011 and was reclassified as a discontinued operation. It is excluded from results for 2009-2011
* MHFI: McGraw Hill Financial’s results for 2008−2013 reflect McGraw-Hill Education as a discontinued operation
2013 Results by Business Unit
Standard & Poor’s Ratings Services 55%: $952
S&P Capital IQ 12%: $201
Commodities & Commercial Markets 18%: $312
S&P Dow Jones Indices 15%: $266
Adjusted Total Operating Profit: $1.6 billion (3, 4, 5, 6, 7)
(dollars in millions)
Standard & Poor’s Ratings Services 47%: $2,274
S&P Capital IQ 24%: $1,170
Commodities & Commercial Markets 21%: $1,014
S&P Dow Jones Indices 10%: $493
Operating Revenue: $4.9 billion (1, 2, 6, 7)
(dollars in millions)

2014 Investor Fact Book 9
Adjusted Quarterly Results: 2013
Note: Details may not sum to total due to rounding
See footnotes on page 8
2013 (Recasted)
(in thousands, except earnings per share) 1Q 2013 2Q 2013 3Q 2013 4Q 2013 FY 2013
Revenue (1, 2)
Standard & Poor’s Ratings Services $ 561,320 $ 599,192 $ 540,304 $ 573,596 $ 2,274,412
S&P Capital IQ (6) 288,204 286,930 293,293 301,351 1,169,777
S&P Dow Jones Indices 115,214 123,077 124,403 130,352 493,047
Commodities & Commercial Markets (7) 236,148 259,367 254,858 264,020 1,014,393
Intersegment elimination (19,389) (18,877) (18,755) (19,312) (76,333)
Total revenue $ 1,181,497 $ 1,249,689 $ 1,194,103 $ 1,250,006 $ 4,875,296
Adjusted Expense (4)
Standard & Poor’s Ratings Services $ 311,903 $ 331,313 $ 326,052 $ 353,262 $ 1,322,530
S&P Capital IQ (6) 238,470 237,709 238,542 254,114 968,834
S&P Dow Jones Indices 51,199 45,680 47,392 82,660 226,931
Commodities & Commercial Markets (7) 176,313 176,493 168,982 180,544 702,331
Intersegment elimination (19,389) (18,877) (18,755) (19,312) (76,333)
Total adjusted segment expense $ 758,496 $ 772,317 $ 762,213 $ 851,268 $ 3,144,293
Adjusted Operating Profit (4)
Standard & Poor’s Ratings Services $ 249,417 $ 267,879 $ 214,252 $ 220,334 $ 951,882
S&P Capital IQ (6) 49,734 49,221 54,751 47,237 200,943
S&P Dow Jones Indices (5) 64,015 77,398 77,011 47,692 266,116
Commodities & Commercial Markets (7) 59,835 82,875 85,877 83,475 312,062
Total adjusted segment operating profit $ 423,002 $ 477,373 $ 431,890 $ 398,738 $ 1,731,003
Adjusted unallocated expenses 24,047 31,390 35,557 38,266 129,260
Total adjusted operating profit 398,954 445,983 396,333 360,472 1,601,743
Adjusted Interest (expense), net (15,508) (15,524) (14,302) (14,160) (59,494)
Adjusted income before taxes on income 383,446 430,459 382,031 346,312 1,542,249
Adjusted provision for taxes on income 134,206 150,661 133,711 105,787 524,365
Adjusted income from continuing operations 249,240 279,799 248,320 240,525 1,017,884
Less: Net income attributable to noncontrolling interests (21,223) (22,985) (26,168) (16,723) (87,099)
Adjusted net income attributable to McGraw Hill Financial $ 228,017 $ 256,814 $ 222,152 $ 223,802 $ 930,785
Diluted weighted average shares outstanding 284,309 278,298 278,812 277,987 279,819
Adjusted diluted EPS from continuing operations $ 0.80 $ 0.92 $ 0.80 $ 0.81 $ 3.33
Overview

10 McGraw Hill Financial
Standard & Poor’s Ratings ServicesCredit Ratings, Research & Analytics
600
1,200
1,800
$2,400
Revenue: Non-Transaction/Transaction(dollars in millions)
‘13‘11 ‘12� Non-Transaction $1,116 $1,131 $1,239
� Transaction 651 903 1,035
Total Revenue $1,767 $2,034 $2,274
54%
46%44%
56%63%
37%
600
1,200
1,800
$2,400
Revenue: Domestic/International(dollars in millions)
‘12 ‘13‘11� Domestic $ 910 $1,102 $1,214
� International 857 932 1,060
Total Revenue $1,767 $2,034 $2,274
53%
47%
54%
46%
52%
48%
Providing Valued Research and Opinions for Market Participants
Standard & Poor’s Ratings Services rates more than $52 trillion of global debt and has ratings outstanding on more than 1.1 million transactions
As part of the world’s financial infrastructure, Standard & Poor’s Ratings Services plays a vital role in bringing transparency and comparability to the financial markets, helping investors and others measure and mitigate credit risk. Credit ratings foster the development and smooth functioning of capital markets, which help people start and grow businesses, cities and states build highways and hospitals, and manufacturers build factories and create jobs.
Standard & Poor’s Ratings regularly updates and refines its processes to align with new developments in the marketplace. To incorporate the changing needs of investors, issuers, and markets, Standard & Poor’s Ratings has invested in systems, analytics, and training and continually assesses its ratings methodologies, adopting changes as needed.
www.standardandpoors.com
How Standard & Poor’s Ratings Services Generates Revenue
Ratings for new issuance of corporate, government, and structured finance debt instruments; bank loan ratings; and corporate credit estimates (transaction revenue)
Surveillance of a credit rating, annual fees for customer relationship-based pricing programs, and fees for entity credit ratings (non-transaction revenue)

2014 Investor Fact Book 11
Globally, Standard & Poor’s rated more than $3.6 trillion in new debt in 2013
Spanning 25 countries, Standard & Poor’s Ratings Services is a leading provider of credit ratings, research, and analytics. Standard & Poor’s analysts offer a combination of global perspective and local insight.
Standard & Poor’s Standard & Poor’s
affiliate
Standard & Poor’s
Ratings Services
Standard & Poor’s Global Footprint
Standard & Poor’s was recognized in The Asset magazine’s Annual Asian Awards as the “Best Credit Rating Agency: Islamic Finance” for the 4th consecutive year
Standard & Poor’s was named “Best Rating Agency” at The International Takaful Awards 2014
Beth Ann Bovino, Standard & Poor’s U.S. Chief Economist, was recognized as the “Most Accurate U.S. Forecaster” for the 2013 economy according to The Wall Street Journal
Standard & Poor’s opened a new representative office and hub for Central and Eastern Europe in Warsaw, Poland in January 2014
The successful 2013 China Credit Spotlight thought-leadership series included reports on China’s Top 150 Corporates and China’s Top 50 Banks. S&P hosted live webcasts and published a special edition of CreditWeek
Broad and Deep Analytical CoverageStandard & Poor’s Ratings Services’ ratings are tools to evaluate credit risk, expressing opinions about the relative likelihood that debt issued by companies and governments will be repaid on time and in full. Its ratings reflect in-depth analysis of the issuers and their debt obligations.
Corporate Ratings
Financial Institution Ratings
Insurance Company Ratings
Government Security Ratings
Structured Finance Ratings
49,700 59,000 7,200 918,800 90,000IndustrialsUtilitiesProject Finance
BanksBroker/DealersFinance CompaniesOther Financial Institutions
HealthLifeProperty/ CasualtyReinsurance/SpecialtyBond
International Public FinanceU.S. Public FinanceSovereigns
Asset-Backed Commercial PaperAsset-Backed SecuritiesCollateralized Debt ObligationsCommercial Mortgage-Backed SecuritiesResidential Mortgage-Backed SecuritiesServicer Evaluations

12 McGraw Hill Financial
CRISIL values more than $960 billion (USD) of Indian debt securities, comprising 85% of outstanding securities
CRISIL LimitedA Standard & Poor’s Company
CRISIL Limited—India’s Leading Rating AgencyStandard & Poor’s has a 68% majority ownership in CRISIL, a publicly traded global analytical company that is operated separately from Standard & Poor’s Ratings Services, offering ratings, research and analytics, and risk and policy advisory services.
Incorporated in India and listed on the Indian stock exchanges, CRISIL is India’s largest credit rating agency as well as its leading independent research house. CRISIL is also India’s largest provider of high-end research and analytical offshore support to the world’s leading global banks.
Since 1987, CRISIL has rated/assessed more than 77,000 entities across 196 industry sectors in India
CRISIL’s equity research support enables coverage of 2,500 stocks globally, comprising 90% of global trading volumes and 85% of global market capitalization
8 research centers in Argentina, China, India, and Poland serve 15 of the top 20 global investment banks and many corporations, including 37 Fortune 500 companies
Growth Accelerated After Acquisition by MHFI
Notes: MHFI acquired an initial 9.6% interest in CRISIL Limited in 1997
Market capitalization values based on a constant INR / USD exchange rate of 0.16x as of August 14, 2014
www.crisil.com
MHFI IncreasesStake to 58.5%
MHFI IncreasesStake to 68%
CRISIL Limited: Market Capitalization(U.S. dollars in millions)
6/30/14‘13‘11 ‘12‘10‘09‘07 ‘08‘06‘05
$158$237
$675$511
$285
$1,217$995
$1,365
$2,042
$397

2014 Investor Fact Book 13
Standard & Poor’s Ratings Services developed Credit Scenario Builder to provide the marketplace with an interactive tool that provides more transparency into Standard & Poor’s ratings process, methodology, and criteria for corporate credit ratings, bank ratings, and U.S. public finance ratings.
Interactive Tools from Standard & Poor’s Add Transparency to Its Ratings Process
Credit Scenario Builder
Note: Credit Scenario Builder ratings are for illustration purposes only
Standard & Poor’s Ratings Services
Using touchscreen technology, the Credit Scenario Builder app allows users to quickly:
View the specific factors that go into a credit rating analysis and Standard & Poor’s perspective on these rating factors
Compare their own views to Standard & Poor’s
Adjust each rating factor to see the effect each change has on an illustrative rating
Save and compare the various scenarios
Users can access an Excel® version of Credit Scenario Builder via S&P Capital IQ (subscription product) to go deeper into the analysis and specific weightings on different rating factors:
View Standard & Poor’s Ratings’ credit research
Read the analysis on individual credits
Understand the analyst-adjusted data that go into Standard & Poor’s analysis
Access underlying research reports to see specific factors (Business Risk, Financial Risk, Liquidity, Related Criteria and Research) and how Standard & Poor’s evaluated those factors
View scores for a specific entity’s rating factorswww.spratings.com/credit-tools/corporate-credit-scenario-builder
View Credit Scenario Builder Demo Filmed at MHFI’s 2014 Investor Day
investor.mhfi.com
Corporate Credit Ratings Scenario Builder
U.S. Public Finance Ratings Scenario Builder
Bank Credit Scenario Builder

14 McGraw Hill Financial
Global Debt Markets
Approximately $9.5 trillion in rated global corporate debt is coming due between the second half of 2014 and the end of 2019
Standard & Poor’s Ratings Services estimates that nearly $9.5 trillion in global corporate debt is scheduled to mature between the second half of 2014 and year-end 2019 (see table at right). About $1.8 trillion of this amount is due in 2015. Approximately $1.9 trillion is due in both 2016 and 2017. About $1.8 trillion is due in 2018 and $1.5 trillion in 2019.
Entities domiciled in Europe account for about 44% of the $9.5 trillion total. U.S.-based entities account for 40%, entities based in other developed countries (Australia, Canada, Japan, and New Zealand) account for about 11%, and entities based in the emerging markets account for 5%.
500
1,000
1,500
$2,000
Investment Grade $ 583 $ 1,545 $ 1,554 $ 1,446 $ 1,229 $ 971� AAA � AA � A � BBBSpeculative Grade 120 209 332 419 555 546� BB � B � CCC and belowTotal Global $ 704 $ 1,754 $ 1,886 $ 1,865 $ 1,785 $ 1,517
Global Corporate Debt Maturities by Rating (2H 2014–2019)(dollars in billions)
‘18 ‘192H ‘14 ‘15 ‘16 ‘17
Europe 44%: $4,161
Other Developed Markets 11%: $1,086
Emerging Markets 5%: $481
United States 40%: $3,783
Global Corporate Debt Maturing by Region (2H 2014-2019)(dollars in billions)
Total: $9.5 trillion
Notes for pages 14 and 15:Data as of June 30, 2014. Includes bonds, loans, and revolving credit facilities. Estimates are likely biased on the high side because Standard & Poor’s Ratings Services’ tallies do not always take into account amortization schedules and loan paydowns. In addition, revolving credit facilities are usually tallied at full value whether or not they are fully drawn. Foreign currencies are converted to U.S. dollars at the exchange rate as of close of business on June 30, 2014.
Details may not sum to total due to rounding
Source: Standard & Poor’s Global Fixed Income Research
Speculative Grade: 23%$2.2 trillion
Investment Grade: 77%$7.3 trillion
Global Corporate Debt Maturing through 2019: $9.5 trillion

2014 Investor Fact Book 15
Global Corporate Debt Maturities by Year (2H 2014 - 2019)
(dollars in billions) 2H 2014 2015 2016 2017 2018 2019 Total
United States
Financial Investment grade $ 97 $ 232 $ 224 $ 234 $ 186 $ 142 $ 1,116
Speculative grade $ 4 $ 17 $ 15 $ 36 $ 23 $ 27 $ 122
Nonfinancial Investment grade $ 66 $ 207 $ 288 $ 290 $ 307 $ 222 $ 1,380
Speculative grade $ 48 $ 102 $ 165 $ 215 $ 323 $ 311 $ 1,164
Total United States $ 215 $ 559 $ 692 $ 776 $ 840 $ 702 $ 3,783
Europe
Financial Investment grade $ 190 $ 594 $ 493 $ 423 $ 295 $ 226 $ 2,221
Speculative grade $ 23 $ 21 $ 25 $ 18 $ 12 $ 18 $ 117
Nonfinancial Investment grade $ 98 $ 243 $ 281 $ 240 $ 227 $ 202 $ 1,291
Speculative grade $ 34 $ 44 $ 88 $ 98 $ 135 $ 134 $ 532
Total Europe $ 345 $ 902 $ 886 $ 779 $ 670 $ 579 $ 4,161
Other Developed Markets
Financial Investment grade $ 76 $ 139 $ 133 $ 111 $ 78 $ 58 $ 596
Speculative grade $ - $ - $ - $ - $ - $ - $ -
Nonfinancial Investment grade $ 39 $ 72 $ 67 $ 66 $ 63 $ 56 $ 363
Speculative grade $ 6 $ 11 $ 22 $ 20 $ 36 $ 33 $ 127
Total Other Developed Markets $ 121 $ 222 $ 222 $ 197 $ 177 $ 147 $ 1,086
Emerging Markets
Financial Investment grade $ 7 $ 24 $ 25 $ 29 $ 23 $ 19 $ 127
Speculative grade $ 1 $ 2 $ 6 $ 5 $ 5 $ 5 $ 23
Nonfinancial Investment grade $ 11 $ 33 $ 43 $ 51 $ 49 $ 47 $ 235
Speculative grade $ 4 $ 12 $ 12 $ 27 $ 22 $ 18 $ 96
Total Emerging Markets $ 23 $ 71 $ 87 $ 112 $ 98 $ 89 $ 481
Standard & Poor’s Ratings Services
Speculative Grade: 3%$122 billion
Investment Grade: 30%$1,116 billion
Investment Grade: 36%$1,380 billion
Speculative Grade: 31%$1,164 billion
United States: $3,783 billion
Financial
Nonfinancial
Speculative Grade: 3%$117 billion
Investment Grade: 53%$2,221 billion
Investment Grade: 31%$1,291 billion
Speculative Grade: 13%$532 billion
Europe: $4,161 billion
Financial
Nonfinancial
Speculative Grade: 0%$0
Investment Grade: 55%$596 billion
Investment Grade: 33%$363 billion
Speculative Grade: 12%$127 billion
Other Developed Markets: $1,086 billion
Financial
Nonfinancial
Speculative Grade: 5%$23 billion
Investment Grade: 26%$127 billion
Investment Grade: 49%$235 billion
Speculative Grade: 20%$96 billion
Emerging Markets: $481 billion
Financial
Nonfinancial
Note: Details may not sum to total due to rounding

16 McGraw Hill Financial
125
250
375
$500
U.S. Corporates: Financial Services (c)
S&P penetration rate as a % of rated dollar volume
94%
95%99%
91%
� S&P Rated Volume $378 $336 $221 $200 $309 $323 Rated Volume $398 $341 $242 $213 $323 $332 # of Rated Issues 360 358 609 478 554 535
Sources: Thomson Reuters, Standard & Poor’s
‘11 ‘13‘08 ‘09 ‘10 ‘12
96% 97%
500
1,000
1,500
$2,000
Rated U.S. Debt Market (a, b, c, d, e)
S&P penetration rate as a % of rated dollar volume
88%
94% 94%90%
� S&P Rated Volume $1,424 $1,479 $1,275 $1,095 $1,494 $1,529 Rated Volume $1,516 $1,567 $1,423 $1,244 $1,671 $1,735 # of Rated Issues 10,528 11,785 14,418 10,649 12,978 11,138
Sources: Thomson Reuters, Harrison Scott Publications, Standard & Poor's
‘11 ‘13‘08 ‘09 ‘10 ‘12
89% 88%
175
350
525
$700
U.S. Corporates: Industrials (c)
S&P penetration rate as a % of rated dollar volume
98%98%
99%96%
� S&P Rated Volume $362 $507 $443 $463 $612 $644 Rated Volume $368 $514 $460 $472 $617 $654 # of Rated Issues 523 703 704 645 815 799
Sources: Thomson Reuters, Standard & Poor’s
‘11 ‘13‘08 ‘09 ‘10 ‘12
99% 98%
U.S. Debt MarketIn 2013, Standard & Poor’s rated approximately 88% of the $1.7 trillion of addressable debt issued in the U.S. market compared to 89% of the addressable market in 2012. Rated debt issuance by dollar volume in the U.S. rose approximately 4% from 2012 to 2013, while the number of issues decreased by approximately 14%.
The rated debt market is a component of the total debt market and includes only the debt securities issued with a rating. The rated U.S. debt market chart (shown below) is primarily comprised of six new-issue categories: (1) Corporates (Industrials and Financial Services); (2) Municipals; (3) Sovereigns; (4) Mortgage-Backed Securities (Residential and Commercial); (5) Asset-Backed Securities; and (6) Collateralized Debt Obligations.
Municipals $ 338
Corporates: Financial Services $ 332
Corporates: Industrials $ 654
CMBS $ 82
Sovereigns $ 36
CDOs $ 89
ABS $ 172
RMBS $ 30
Total $ 1,735
Rated U.S. Debt Market:2013 Dollar Volume by New Issue Category (a, b, c, d, e)
Notes: Annual figures; dollar volume in billions; data by domicile of issuer/assets Details may not sum to total due to rounding
See footnotes on page 17

2014 Investor Fact Book 17
15
30
45
$60
U.S. Commercial Mortgage-Backed Securities (CMBS) (b)
S&P penetration rate as a % of rated dollar volume
23%93%
44%
� S&P Rated Volume $15 $3 $ 7 $ 7 $11 $32 Rated Volume $16 $7 $18 $32 $47 $82 # of Rated Issues 13 25 41 37 66 107
Sources: Harrison Scott Publications, Standard & Poor’s
‘11 ‘13‘08 ‘09 ‘10 ‘12
25% 39%40%
125
250
375
$500
U.S. Municipals (a)
S&P penetration rate as a % of rated dollar volume
88%
88%91% 89%
� S&P Rated Volume $371 $410 $416 $285 $348 $290 Rated Volume $422 $451 $468 $324 $401 $338 # of Rated Issues 9,059 10,220 12,390 9,022 10,888 9,014
Sources: Thomson Reuters, Standard & Poor’s
‘11‘08 ‘13‘09 ‘10 ‘12
87% 86%
15
30
45
$60
U.S. SovereignsS&P penetration rate as a % of rated dollar volume
94%
90%
95%
94%
� S&P Rated Volume $19 $49 $40 $37 $29 $34 Rated Volume $21 $51 $42 $39 $31 $36 # of Rated Issues 134 134 174 109 108 84
Sources: Thomson Reuters, Standard & Poor’s
‘11 ‘13‘08 ‘09 ‘10 ‘12
95%94%
75
150
225
$300
U.S. Asset-Backed Securities (ABS) (b, e)
S&P penetration rate as a % of rated dollar volume
62%
98%
86%77%
� S&P Rated Volume $220 $124 $100 $ 77 $120 $117 Rated Volume $225 $144 $130 $124 $176 $172 # of Rated Issues 239 186 243 232 307 303
Sources: Harrison Scott Publications, Standard & Poor’s
‘11 ‘13‘08 ‘09 ‘10 ‘12
68% 68%
15
30
45
$60
U.S. Residential Mortgage-Backed Securities (RMBS) (b, d)
S&P penetration rate as a % of rated dollar volume
21%
85%
85%
57%
� S&P Rated Volume $27 $45 $19 $ 3 $11 $18 Rated Volume $32 $53 $33 $15 $22 $30 # of Rated Issues 101 135 130 48 73 90
Sources: Harrison Scott Publications, Standard & Poor’s
‘11 ‘13‘08 ‘09 ‘10 ‘12
49% 61% 20
40
60
$80
U.S. Collateralized Debt Obligations (CDOs) (b)
S&P penetration rate as a % of rated dollar volume
93%97%
63%97%
� S&P Rated Volume $33 $4 $29 $24 $53 $70 Rated Volume $34 $6 $30 $26 $54 $89 # of Rated Issues 99 24 127 78 167 206
Sources: Harrison Scott Publications, Standard & Poor’s
‘11 ‘13‘08 ‘09 ‘10 ‘12
79%
98%
Data as of June 3, 2014
Percentages have been calculated based on unrounded figures
Notes for debt issuance:(a) Excludes municipal student loans and
private placements
(b) Excludes confidential transactions
(c) Includes Rule 144a (private place-ments), MTN takedowns, convertibles, and preferred stocks. Excludes sovereign issuers, private placements (except Rule 144a issues), retail notes, commercial paper, and all agency issues
(d) Excludes agency deals. Includes home equity loans
(e) Excludes asset-backed commercial paper and letters of credit
Standard & Poor’s Ratings Services

18 McGraw Hill Financial
225
450
675
$900
EMEA Corporates: Financial Services (b)
S&P penetration rate as a % of rated dollar volume
‘11 ‘12 ‘13‘08 ‘09 ‘10
86% 81%
88%
90%
87%
� S&P Rated Volume $599 $788 $543 $482 $437 $473Rated Volume $682 $872 $625 $559 $541 $542
# of Rated Issues 1,556 1,312 1,781 1,444 1,562 1,863
Sources: Thomson Reuters, Standard & Poor's
87%
650
1,300
1,950
$2,600
Rated EMEA Debt Market (a, b, c, d)
S&P penetration rate as a % of rated dollar volume
‘11 ‘12 ‘13‘08 ‘09 ‘10
78% 82%84%
89%
84%
� S&P Rated Volume $1,518 $2,046 $1,600 $1,467 $1,511 $1,580Rated Volume $1,804 $2,297 $1,904 $1,887 $1,853 $1,884
# of Rated Issues 3,220 3,135 3,991 3,818 4,167 4,454
Sources: Thomson Reuters, Harrison Scott Publications, Standard & Poor's
84%
160
320
480
$640
EMEA Corporates: Industrials (b)
S&P penetration rate as a % of rated dollar volume
‘11 ‘12 ‘13‘08 ‘09 ‘10
91%
94%
96%
92%
91%
� S&P Rated Volume $276 $570 $277 $267 $464 $431Rated Volume $289 $616 $305 $294 $491 $460
# of Rated Issues 440 685 460 470 726 690
Sources: Thomson Reuters, Standard & Poor's
94%
EMEA (Europe, Middle East, Africa) Region Debt MarketIn 2013, Standard & Poor’s rated approximately 84% of the $1.9 trillion of addressable debt issued in the EMEA region market, which includes Europe, the Middle East, and Africa, compared to 82% in 2012. Rated debt issuance by dollar volume in the region rose approximately 2% from 2012 to 2013, while the number of issues grew by 7%.
The rated debt market is a component of the total debt market and includes only the debt securities issued with a rating. The rated EMEA debt market chart (shown below) is comprised of six new-issue categories: (1) Corporates (Industrials and Financial Services); (2) Sovereigns/International Public Finance (IPF); (3) Mortgage-Backed Securities (Residential and Commercial); (4) Asset-Backed Securities; (5) Collateralized Debt Obligations; and (6) Covered Bonds.
Corporates: Financial Services $ 542
ABS $ 53
RMBS $ 26
Covered Bonds $ 183
CDOs $ 14
CMBS $ 10
Total $ 1,884
Corporates: Industrials $ 460
Rated EMEA Debt Market: 2013 Dollar Volume by New Issue Category (a, b, c, d)
Sovereigns/IPF $ 595
Notes: Annual figures; dollar volume in billions; data by domicile of issuer/assets Details may not sum to total due to rounding
See footnotes on page 19

2014 Investor Fact Book 19
20
40
60
$80
EMEA Asset-Backed Securities (ABS) (a, c)
S&P penetration rate as a % of rated dollar volume
‘11 ‘12 ‘13‘08 ‘09 ‘10
53%52%
� S&P Rated Volume $22 $10 $20 $26 $35 $35Rated Volume $33 $15 $38 $49 $53 $53
# of Rated Issues 106 42 92 93 95 80
Sources: Harrison Scott Publications, Standard & Poor's
68% 63%66% 65%
100
200
300
$400
EMEA Residential Mortgage-Backed Securities (RMBS) (a, d)
S&P penetration rate as a % of rated dollar volume
‘11 ‘12 ‘13‘08 ‘09 ‘10
75%
59%52% 74%
74%
� S&P Rated Volume $32 $ 8 $ 74 $ 89 $35 $13Rated Volume $62 $11 $101 $119 $60 $26
# of Rated Issues 64 7 48 46 53 43
Sources: Harrison Scott Publications, Standard & Poor's
48%10
20
30
$40
EMEA Collateralized Debt Obligations (CDOs) (a)
S&P penetration rate as a % of rated dollar volume
‘11 ‘12 ‘13‘08 ‘09 ‘10
73%
69%
65%
� S&P Rated Volume $25 $1 $6 $3 $5 $12Rated Volume $36 $2 $7 $4 $6 $14
# of Rated Issues 106 9 35 17 25 43
Sources: Harrison Scott Publications, Standard & Poor's
83%83%90%
3
6
9
$12
EMEA Commercial Mortgage-Backed Securities (CMBS) (a)
S&P penetration rate as a % of rated dollar volume
‘11 ‘12 ‘13‘08 ‘09 ‘10
42%74%42%
� S&P Rated Volume $1 $2 $3 $2 $3 $ 4Rated Volume $2 $2 $6 $4 $4 $10
# of Rated Issues 7 6 10 3 6 12
Sources: Harrison Scott Publications, Standard & Poor's
38%70%
72%110
220
330
$440
EMEA Covered Bonds (CB) (a)
S&P penetration rate as a % of rated dollar volume
‘11 ‘12 ‘13‘08 ‘09 ‘10
46%
47%
72%
68%
71%
� S&P Rated Volume $270 $172 $284 $194 $106 $ 81Rated Volume $374 $252 $400 $420 $226 $183
# of Rated Issues 423 328 602 929 532 452
Sources: Harrison Scott Publications, Standard & Poor's
44%
Data as of June 3, 2014
Percentages have been calculated based on unrounded figures
Notes for debt issuance:(a) Excludes confidential and repo
transactions
(b) Also includes Rule 144a (private place-ments), MTN takedowns, convertibles, and preferred stocks. Excludes private placements (except Rule 144a issues), retail notes, and commercial paper
(c) Excludes asset-backed commercial paper and letters of credit
(d) Includes home equity loans
Standard & Poor’s Ratings Services
150
300
450
$600
EMEA Sovereigns/International Public Finance (IPF)S&P penetration rate as a % of rated dollar volume
‘11 ‘12 ‘13‘08 ‘09 ‘10
92% 90%
90%
94%
93%
� S&P Rated Volume $292 $495 $392 $403 $427 $532Rated Volume $326 $526 $422 $438 $473 $595
# of Rated Issues 518 746 963 816 1,168 1,271
Sources: Thomson Reuters, Standard & Poor's
89%

20 McGraw Hill Financial
85
170
255
$340
Asia-Pacific Corporates (Industrials and Financial Services) (b)
S&P penetration rate as a % of rated dollar volume
‘11 ‘12 ‘13‘08 ‘09 ‘10
73%
56%
68%69% 66%
� S&P Rated Volume $116 $182 $161 $144 $225 $247 Rated Volume $205 $267 $235 $219 $309 $326 # of Rated Issues 860 785 775 652 795 800Sources: Thomson Reuters, Standard & Poor's
76%
30
60
90
$120
Asia-Pacific Structured Finance (a, c, d)
S&P penetration rate as a % of rated dollar volume
‘11 ‘12 ‘13‘08 ‘09 ‘10
25%
60% 72%78%
69%
� S&P Rated Volume $45 $43 $49 $63 $ 25 $ 54 Rated Volume $75 $59 $62 $93 $100 $100 # of Rated Issues 342 226 205 241 243 479
Sources: Harrison Scott Publications, Standard & Poor's
54%
Asia-Pacific Region Debt MarketIn 2013, Standard & Poor’s rated approximately 64% of the $501 billion of addressable debt issued in the Asia-Pacific market, including Australia, Japan, and South Korea, compared to 56% in 2012. Rated debt issue volume for corporates in Asia was $326 billion, which is a 6% increase from 2012. Standard & Poor’s 2013 market penetration was 76% for corporates, compared to 73% in 2012. For structured finance, rated issuance was essentially flat compared to 2012, and Standard & Poor’s rated approximately 54% of that volume, up from 25% in 2012.
The rated debt market is a component of the total debt market and includes only the debt securities issued with a rating. The rated Asia-Pacific debt market chart (shown below) is comprised of five new-issue categories: (1) Corporates (Industrials and Financial Services); (2) Sovereigns/International Public Finance (IPF); (3) Mortgage-Backed Securities (Residential and Commercial); (4) Asset-Backed Securities; and (5) Covered Bonds.
Annual figures; dollar volume in billions; data by domicile of issuer/assets
Data as of June 3, 2014
Percentages have been calculated based on unrounded figures
Notes for debt issuance:(a) Excludes confidential and repo transactions
(b) Also includes Rule 144a (private placements), MTN takedowns, convertibles, and preferred stocks. Excludes sovereign issuers, private placements (except Rule 144a issues), retail notes, commercial paper, and all agency issues
(c) Excludes asset-backed commercial paper and letters of credit
(d) Includes home equity loans
(e) Includes Sovereigns
Covered Bonds $ 22
CMBS $ 1
RMBS $ 49
ABS $ 28
Corporates: Financial Services $159
Sovereigns/IPF $ 75
Corporates: Industrials $167
Rated Asia-Pacific Debt Market: 2013 Dollar Volume by New Issue Category (a, b, c, d)
Total $501
150
300
450
$600
Rated Asia-Pacific Debt Market (a, b, c, d, e)
S&P penetration rate as a % of rated dollar volume
‘11 ‘12 ‘13‘08 ‘09 ‘10
56%
53%63% 62% 58%
� S&P Rated Volume $174 $249 $230 $228 $273 $320 Rated Volume $330 $396 $374 $395 $489 $501 # of Rated Issues 1,374 1,214 1,230 1,150 1,304 1,494Sources: Thomson Reuters, Harrison Scott Publications, Standard & Poor's
64%

2014 Investor Fact Book 21
Standard & Poor’s Ratings ServicesStandard & Poor’s Ratings Services’ Track Record: Meeting the Test of Time
What is a Standard & Poor’s credit rating?Credit ratings are opinions about credit risk. Standard & Poor’s ratings express an opinion about the ability and willingness of an issuer to meet its financial obligations in full and on time. Credit ratings can also speak to the credit quality of an individual debt issue and the relative likelihood that the issue may default.
How Standard & Poor’s ratings perform:The tables to the right show the default rates experienced for each rating category.
For example: The 5-year cumulative default rate for corporate bonds rated AAA has been 0.35%, or fewer than four defaults for every 1,000 ratings.
The 5-year cumulative default rate for AAA-rated structured finance issues has been 3.54%.
(a) Average cumulative default rates are derived by calculating “conditional on survival” marginal default rates from experiences of each static pool and time horizon
(b) AAA ratings from the same transaction are treated as a single rating in the calculation of this table
Global Corporate Average Cumulative Default Rates (1981-2013) (%) (a)
Time horizon (years)
Rating 1 2 3 4 5 6 7 8 9 10 11 12 13 14 15
AAA 0.00 0.03 0.13 0.24 0.35 0.47 0.53 0.62 0.68 0.74 0.77 0.81 0.84 0.91 0.99
AA 0.02 0.07 0.13 0.24 0.36 0.47 0.58 0.67 0.75 0.84 0.93 1.00 1.08 1.16 1.24
A 0.07 0.17 0.28 0.43 0.60 0.78 1.00 1.19 1.38 1.59 1.78 1.95 2.11 2.27 2.45
BBB 0.21 0.60 1.02 1.53 2.06 2.56 3.01 3.45 3.89 4.33 4.80 5.18 5.53 5.90 6.27
BB 0.80 2.46 4.41 6.29 8.01 9.64 11.03 12.26 13.40 14.39 15.21 15.92 16.52 17.05 17.64
B 4.11 9.27 13.61 16.99 19.55 21.61 23.29 24.65 25.82 26.97 27.95 28.76 29.48 30.15 30.81
CCC/C 26.87 36.05 41.23 44.27 46.75 47.77 48.85 49.67 50.64 51.35 51.99 52.76 53.67 54.40 54.40
Investment-grade 0.11 0.30 0.52 0.79 1.07 1.35 1.61 1.86 2.10 2.35 2.59 2.79 2.98 3.17 3.37
Speculative-grade 4.02 7.86 11.19 13.86 16.03 17.82 19.33 20.60 21.74 22.78 23.66 24.42 25.09 25.69 26.28
All rated 1.53 3.02 4.33 5.43 6.35 7.14 7.82 8.39 8.92 9.42 9.85 10.21 10.54 10.84 11.14
Source: Standard & Poor’s “Default, Transition, and Recovery: 2013 Annual Global Corporate Default Study and Rating Transitions,” March 19, 2014
Global Structured Finance Cumulative Default Rates Conditional On Survival (1978-2013) (%) (b)
Time horizon (years)
Rating 1 2 3 4 5 6 7 8 9 10
AAA 0.11 0.54 1.26 2.33 3.54 4.46 5.00 5.28 5.39 5.49
AA 0.29 2.71 6.65 10.32 13.52 15.99 17.52 18.30 18.66 18.84
A 0.55 4.20 9.12 13.36 17.10 20.13 22.20 23.52 24.24 24.62
BBB 1.30 7.50 14.79 21.38 27.15 31.72 34.93 37.21 38.71 39.59
BB 2.90 13.19 22.49 31.55 38.86 44.76 49.12 52.38 55.13 56.98
B 6.91 21.76 34.05 46.88 57.31 63.78 68.93 72.82 75.99 77.82
CCC/C 34.42 54.34 68.97 77.62 82.71 84.83 86.34 87.65 88.32 88.66
Investment-grade 0.53 3.36 7.17 10.72 13.89 16.38 18.01 19.01 19.55 19.85
Speculative-grade 19.91 35.53 47.46 56.45 62.68 66.92 70.16 72.63 74.67 75.96
All rated 5.97 12.16 17.87 22.45 26.00 28.62 30.40 31.56 32.28 32.66
Source: Standard & Poor’s “Default Study: Global Structured Finance Default Study, 1978-2013: Credit Deterioration Slows,” March 27, 2014

22 McGraw Hill Financial
Ratings DiversificationCredit Risk Assessment, Pricing & Structuring for Syndicated Loans
Standard & Poor’s Ratings Services’ loan ratings are widely used in the loan market for credit risk assessment, pricing, and structuring of syndicated loans. A loan rating is the issue-specific rating assigned to a borrower’s syndicated loan. These ratings give the market an important recovery assessment that helps to improve the distribution of syndicated loan new-issuance.
Standard & Poor’s Ratings has assigned ratings on syndicated loans since 1996 across different sectors and borrower types, including investment-grade, speculative-grade, infrastructure, and project-finance loans. Standard & Poor’s Ratings currently rates syndicated loans of more than 2,000 borrowers totaling more than $1.2 trillion.
Loan Ratings ProcessIn the loan ratings process, Standard & Poor’s Ratings reviews revolving lines of credit, first-lien term loans, second-lien term loans, and other subordinated debt.
Leveraged loan ratings are accompanied by a full recovery rating analysis based on Standard & Poor’s Ratings Services’ ratings scale and methodology:
Standard & Poor’s loan ratings offer an industry-wide recognized gauge of creditworthiness that facilitates increased liquidity in the secondary loan market
Why Clients Obtain Loan Ratings
Efficient and transparent market pricing
Increased liquidity in the secondary loan market
Investor base broadened to new classes of lenders
Quick assessment of the effect of a loan rating resulting from contemplated changes to a borrower’s capital structure
Improved terms and efficiencies with vendors
Third-party, unbiased recovery assessment in a heightened regulatory and credit risk environment
Recovery Rating
Recovery Description
Nominal Recovery
Issue-Level Rating Notched from Issuer Credit Rating
1+ Highest expectation for full recovery
100% +3 notches
1 Very high recovery
90%-100% +2 notches
2 Substantial recovery
70%-90% +1 notch
3 Meaningful recovery
50%-70% 0 notches
4 Average recovery
30%-50% 0 notches
5 Modest recovery
10%-30% -1 notch
6 Negligible recovery
0%-10% -2 notches
Note: The table above illustrates how a recovery rating is used to adjust the Issuer Credit Rating, the anchor rating, in the loan rating process
Standard & Poor’s Ratings Services’ Loan & Recovery Ratings

2014 Investor Fact Book 23
Standard & Poor’s Ratings Services
250
500
7500
1,000
Global Leveraged Loans: New Loans Rated by Standard & Poor’s Ratings Services(number of ratings)
� Americas 164 496 572 624 732
� EMEA 44 76 109 108 164
� Asia-Pacific 12 22 44 21 34
Ratings 280 594 725 753 930
Source: Standard & Poor’s Ratings Services
‘13‘11 ‘12‘09 ‘10
Growth in leveraged loan volume has translated into an increase in the number of loan ratings performed by Standard & Poor’s Ratings Services.
Fund InflowsCollateralized loan obligations (CLOs) are actively managed investment vehicles that allow investors to participate in the loan asset class at varying levels of risk and return. CLO fund managers use loan ratings as a major portfolio risk management tool.
Mutual funds with strategies to invest in the loan market have also been a driver behind demand. The loan market has seen a significant increase in investments made by mutual funds in the loan asset class.
Loan RatingsA robust inflow of funds into the loan asset class coupled with increased deal issuance has substantially driven the demand for loan ratings since 2009.
200
400
600
$800
Global Leveraged Loans: Total New-Issue Dollar Volume(dollars in billions)
� U.S. $166 $274 $298 $481 $536 $155 $75 $235 $373 $465 $606� EMEA 54 81 147 163 226 81 22 56 61 37 88 Total $219 $356 $445 $644 $762 $236 $97 $291 $434 $502 $694
Source: S&P Capital IQ/Leveraged Commentary & Data
‘08‘07‘06‘05‘04‘03 ‘09 ‘10 ‘11 ‘12 ‘13
45
90
135
$180
Investments by Mutual Funds(dollars in billions: total net asset value of prime funds at month-end)
$76 $79 $86 $91 $103 $117 $129 $146 $157 $166
Sources: Lipper FMI, S&P Capital IQ/Leveraged Commentary & Data
6 7 8 9 10 11 12 5 6 7 8 91 2 3 4 10 11 12
2012 2013
Trends in the Leveraged Lending Market
Note: Details may not sum to total due to rounding
40
80
120
$160
Global CLOs: New-Issue Dollar Volume(dollars in billions)
� U.S. $16 $26 $53 $ 97 $ 89 $14 $1 $1 $12 $54 $83� EMEA 4 7 14 47 44 17 1 2 1 0 10 Total $20 $33 $66 $144 $133 $31 $1 $3 $14 $54 $92
Source: S&P Capital IQ/Leveraged Commentary & Data
‘08‘07‘06‘05‘04‘03 ‘09 ‘10 ‘11 ‘12 ‘13
24 McGraw Hill Financial
S&P Capital IQMulti-Asset-Class and Real-Time Data, Research & Analytics
300
600
900
$1,200
Revenue: Subscription/Non-Subscription(dollars in millions)
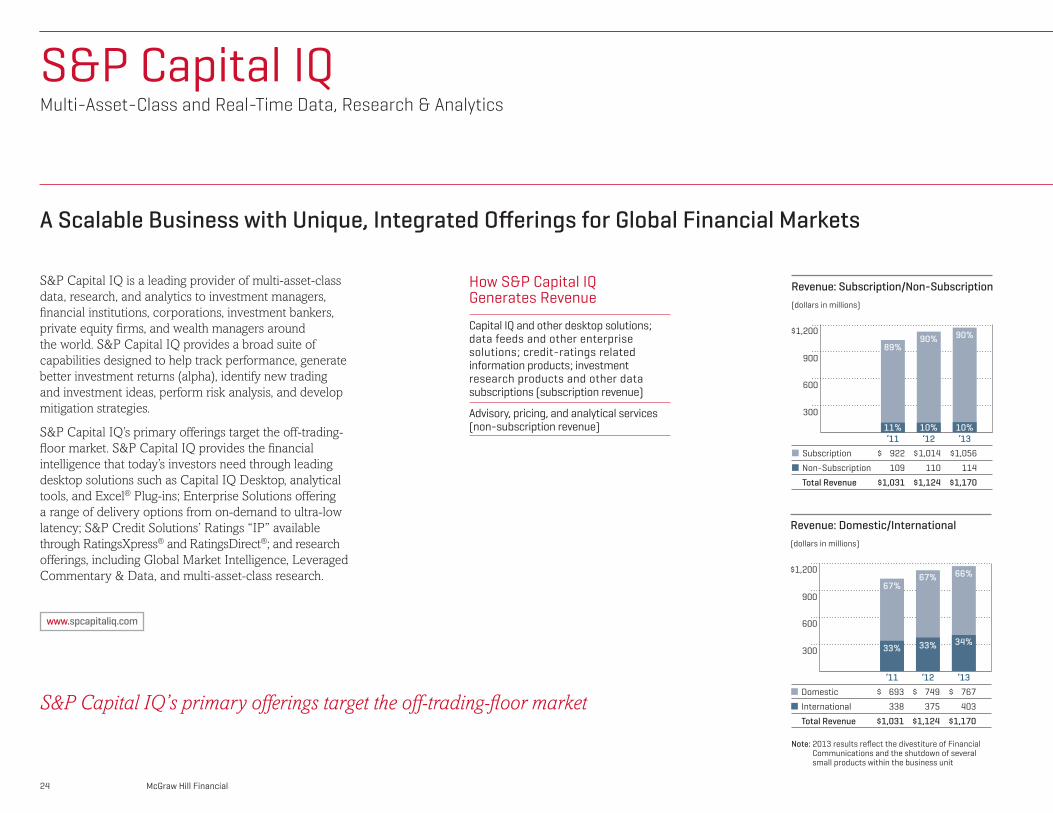
‘13‘11 ‘12� Subscription $ 922 $1,014 $1,056
� Non-Subscription 109 110 114
Total Revenue $1,031 $1,124 $1,170
90%
10%
90%
10%
89%
11%
300
600
900
$1,200
Revenue: Domestic/International(dollars in millions)
‘12 ‘13‘11� Domestic $ 693 $ 749 $ 767
� International 338 375 403
Total Revenue $1,031 $1,124 $1,170
66%
34%
67%
33%
67%
33%
S&P Capital IQ’s primary offerings target the off-trading-floor market
S&P Capital IQ is a leading provider of multi-asset-class data, research, and analytics to investment managers, financial institutions, corporations, investment bankers, private equity firms, and wealth managers around the world. S&P Capital IQ provides a broad suite of capabilities designed to help track performance, generate better investment returns (alpha), identify new trading and investment ideas, perform risk analysis, and develop mitigation strategies.
S&P Capital IQ’s primary offerings target the off-trading-floor market. S&P Capital IQ provides the financial intelligence that today’s investors need through leading desktop solutions such as Capital IQ Desktop, analytical tools, and Excel® Plug-ins; Enterprise Solutions offering a range of delivery options from on-demand to ultra-low latency; S&P Credit Solutions’ Ratings “IP” available through RatingsXpress® and RatingsDirect®; and research offerings, including Global Market Intelligence, Leveraged Commentary & Data, and multi-asset-class research.
How S&P Capital IQ Generates Revenue
Capital IQ and other desktop solutions; data feeds and other enterprise solutions; credit-ratings related information products; investment research products and other data subscriptions (subscription revenue)
Advisory, pricing, and analytical services (non-subscription revenue)
A Scalable Business with Unique, Integrated Offerings for Global Financial Markets
www.spcapitaliq.com
Note: 2013 results reflect the divestiture of Financial Communications and the shutdown of several small products within the business unit

2014 Investor Fact Book 25
By integrating and evolving previously separate but strong and successful business lines into one scaled operation, the S&P Capital IQ business can offer global financial professionals high-value content across all asset classes. That means looking at the business not as a collection of single products but as a portfolio of capabilities—combinations that offer new and innovative solutions to the marketplace and produce organic growth for the Company.
S&P Capital IQ
Vertical Capabilities Combine to Form New Horizontal Capabilities
Markets IntelligenceComprehensive source of market research for financial professionals
S&P Credit SolutionsCommercial arm that distributes Standard & Poor’s Ratings Services’ intellectual property (IP)
Platform and Toolkits
Technology and Data Infrastructure
MULTI-ASSET-CLASS PORTFOLIO RISK & ANALYTICS—Powered by R2
PRODUCTIVITY & WORKFLOW TOOLS—PresCenter, Company Screening, Drill-Down, and Quick Comps
CREDIT ANALYTICS— Credit-scoring models, probability of default, market-derived signals
REAL-TIME SOLUTIONS & CONSOLIDATED FEEDS— Real-time desktop and multi-latency data delivery
FIXED INCOME PRICING & VALUATIONS—Pricing of fixed income instruments globally
CREDIT RATINGS—Ratings and historical default data
GLOBAL MARKET INTELLIGENCE—Multi-asset-class portfolio advisory and market commentary
LEVERAGED COMMENTARY & DATA—Leveraged loan research and data
EQUITY RESEARCH SERVICES—Equity research on global equities universe
CREDIT RATINGS RESEARCH—Global issuers and sovereigns
FUNDAMENTAL COMPANY DATA—Deep history of global public and private fundamental company data
Investment Management
Financial Institutions
Corporates
Investment Banking
Private Equity Firms
Wealth Management
Web Portal
Data Feeds
Real-Time
Ultra-Low Latency
Mobile
Social Media
Distribution Partners
Rich Data FranchisePackaged into Products, Tools, and Solutions
Three Lines of Business Flexible Delivery Meeting Customer Needs
S&P Capital IQ Desktop & Enterprise SolutionsWeb-delivered analytical tools for individual users and integrated bulk data feeds that can be customized

26 McGraw Hill Financial
S&P Capital IQ
S&P Capital IQ content can be delivered by Enterprise Solutions and the Desktop Platform
S&P Capital IQ’s expertise in mining, aggregating, and delivering data and research gives clients unique access to extensive information on public and private companies, capital markets, and people worldwide.
Broad and Deep Global Coverage
Public & Private Company Information
Company Summary
Fundamental Data
Derived Company & Market Metrics
Corporate Actions & Transactions
Estimates
News, Events & Filings
Business Relationships
Ownership
Professionals
Credit Ratings & Indicators
Entity-Level Ratings
Sector-Level Intelligence
Credit Market Indicators
Instrument and Maturity Terms
Credit Research
Research
Proprietary Equity Research
Investment Advisory Services (SPIAS)
Fixed Income Research
Leveraged Commentary & Data
Global Market Intelligence
Third-Party Investment Research
Exchange-Traded Funds
Market Data
Pricing Data
Economic Indicators
Index
Foreign Exchange & Interest Rates
Multi-Asset-Class Valuations
Evaluated/Internally Derived
Market-Derived
Reference & Classifications
Industry Classifications
Reference & Linking Master
Fixed Income Global Terms & Conditions

2014 Investor Fact Book 27
Desktop SolutionsRich Content Coupled with Differentiated Analytics and Productivity & Workflow Solutions
S&P Capital IQ was named Best Analytics Provider (Compustat) for the 5th consecutive year at the Inside Market Data 2014 Awards
S&P Capital IQ brings together integrated data sets, research, and analytic insights in an integrated desktop solution to serve multiple investor segments across the financial community. S&P Capital IQ delivers comprehensive fundamental and quantitative research, analysis, and workflow solutions.
S&P Capital IQ is developing a proprietary application design approach, IQ Language, that slices through “Big Data” using advanced visualization, and hastens speed- to-market through a services-oriented technology platform.
Public & Private Company InformationFundamental dataset includes more than 79,000 active and inactive publicly traded companies globally as well as more than 3,000,000 privately held businesses, with more than 700,000 of the latter with financials in Asia, Europe, and the U.S. Additional datasets include estimates, corporate actions, transactions, ownership, people, and key developments.
ResearchA comprehensive source of differentiated proprietary and third-party multi-asset-class global research, analysis, strategies, and services for institutional investors, all levels of wealth management institutions, and financial advisors.
Market DataNormalized and value-added market data from more than 200 global exchanges, including equities pricing, indices, economic indicators, and foreign exchange and interest rates.
Portfolio Management & Risk AnalyticsS&P Capital IQ’s Portfolio Risk solution offers next-generation risk and scenario analytics tools to traders and portfolio and risk managers so they can make decisions with regard to pricing, hedging, and capital management of multi-asset-class portfolios in real time.
Credit AnalyticsCredit Analytics enables clients to look at credit risk from different angles to improve their perspectives and minimize surprises. The integration of default and recovery tools with scoring models produces even more dynamic risk measures.
Alpha Factor LibraryBuilt from the industry’s first Global Point-in-Time database, the Alpha Factor Library is an advanced Web-based market analysis and research tool. It is updated daily to provide statistical profiles, definitions, and ongoing performance for thousands of quantitative stock-selection signals.
PresCenterS&P Capital IQ’s PresCenter helps save time by streamlining and standardizing the modeling and collateral creation workflow for clients, including invest-ment banks, corporations, and private equity firms. S&P Capital IQ’s PresCenter enhances native Microsoft Office® products with specialized tools that dramatically increase the efficiency of producing models, presentations, and documents in accordance with company guidelines.
Excel® Plug-InS&P Capital IQ’s intuitive Excel Plug-In enables clients to simplify the process of building and updating financial models. Clients can quickly populate and update spreadsheets with financial, market, and company data with an easy-to-use Formula Builder. A dedicated modeling team provides extensive model conversion and data integration services, giving clients a significant competitive advantage.
Analytics Productivity & Workflow Solutions
S&P CAPITAL IQ
Data & Content
S&P Capital IQ

28 McGraw Hill Financial
Enterprise SolutionsFlexible Delivery of Multi-Asset-Class Reference and Market Data
S&P Capital IQ offers a broad array of multi-asset-class reference and market data to assist clients’ heightened analytical, risk management, regulatory, and operations requirements. S&P Capital IQ expands its clients’ view of global markets by providing up-to-date information on entities, sectors, and securities that help support risk-driven analyses. S&P Capital IQ’s Enterprise Solutions assist clients in the front, middle, and back office with pre-trade activities (idea generation) and post-trade activities, including risk and compliance, security master files, and performance monitoring and measurement.
S&P Capital IQ’s real-time data feeds provide access to market data with flexible delivery options, including end-of-day, on demand, and ultra-low latency
Insight for Enterprises
Integrated Global Proprietary and Third-Party Data Assets
Credit Ratings
Risk Management Scores and Signals
Public and Private Fundamentals
Earnings Estimates and Company Guidance
Multi-Asset-Class Valuations
Market Data
Cross-Reference Capabilities
Global Corporate Actions
Global Terms & Conditions
Equity and Credit Research
For Seamless Delivery to the Client / End User
Front Office: Asset Managers, Portfolio Managers, Money Managers
Mid Office: Risk Managers, Quants, Compliance
Back Office: Custodians, Chief Technology Officers, Clearing
Flexible Delivery Options for Customer-Driven Content Selection
Real-time, on demand, intraday, and end-of-day delivery via multiple channels, including:
Enterprise Data Management and Feed Solutions
Web Service/Software Development Kit (SDK)
Excel® Plug-In
On Demand APIs
Also available through the Capital IQ desktop

2014 Investor Fact Book 29
S&P Capital IQS&P Credit SolutionsCommercial Distribution for Standard & Poor’s Ratings Services’ Intellectual Property (IP)
S&P Credit Solutions is dedicated to the commercial distribution of Standard & Poor’s Ratings Services’ credit ratings and related data, analytics, and research. Through its subscription-based flagship offerings, RatingsDirect and RatingsXpress, customers have direct access to Standard & Poor’s Ratings Services’ content, which includes coverage of more than 43,000 active entities within corporates, financial institutions, insurance, governments, and structured finance sectors, and more than 800,000 securities.
RatingsDirect is a desktop solution offering real-time access to Standard & Poor’s Ratings’ broad and in-depth credit information and analysis based on its proprietary and independent ratings methodology, forward-looking opinions, and insightful analytics.
RatingsDirect’s features include:
News and alerts to monitor credit risk
Research, outlooks, and ratings criteria factors to enhance credit risk analysis
Tools to support surveillance, peer comparisons, and the development of credit memos
Thought leadership and insightful analysis at company, sector, sub-sector, market, industry, and macro level
Deep dives at the entity, instrument, deal, and security level
Standard & Poor’s Ratings’ global fixed income research and market-derived signals
Graphs, charts, and tools to assess the latest credit developments, including credit default swap (CDS) spreads
Options to personalize views, integrate third-party feeds, and share information with colleagues
RatingsXpress is a data feed solution providing clients with intraday and real-time access to Standard & Poor’s Ratings’ credit ratings, research, and reference data. With RatingsXpress, users have a customizable, real-time digital feed with ratings coverage of entities and securities in corporates, financial institutions, insurance, governments (sovereigns, U.S. public finance, international public finance), and structured finance sectors.
RatingsXpress’ features include:
Seamless integration with existing data and applications
Decades of history to support benchmarking and risk-modeling exercises
Optional credit research modules with in-depth commentaries and special studies
Standard & Poor’s Ratings’ specialists work with clients to develop, enhance, and validate credit risk assessment processes, and model credit risk. Products and services include:
Probability of Default credit assessment scorecards
Loss Given Default and stress-testing capabilities
Independent model validation
The business line was reorganized and launched under the S&P Credit Solutions name in 2014, bringing together dedicated product, business development, and technical talent to drive focus on product innovation and commercialization of Ratings “IP.”
Available to customers in a desktop offering or via an enterprise data feed, S&P Credit Solutions also partners with many of the largest third-party information providers and other market intermediaries who license its Ratings “IP” for redistribution.
Standard & Poor’s Ratings Services’ firewall separates all commercial activities from its ratings process
RATINGSDIRECT® RATINGSXPRESS® RISK SOLUTIONS & SERVICES

30 McGraw Hill Financial
Markets IntelligenceComprehensive Source of Market Research
S&P Capital IQ’s Global Market Intelligence (GMI) provides analysis, research, and non- discretionary advisory services, including equity and fixed-income strategies supported by proprietary multi-asset-class research.
Thought Leadership
GMI creates proprietary perspectives and innovative ways to leverage credit and risk intelligence through market reports and media presence.
Examples of GMI thought leadership include:
Consensus Earnings Report: Provides detailed consensus global estimates data with more than 40 data measures, including EPS, revenue, net income, EBITDA, and EBT
Lookout Report: A biweekly compendium from S&P Capital IQ and S&P Dow Jones Indices that offers a detailed cross-market view of investment conditions, risks, and opportunities
Market-Derived Signal: Focuses on news events and daily surveillance of the credit default swap market to alert investors to rising or declining perception of risk and the implications for corporates and sovereigns
Market Intellect Report: GMI helps investors better understand cross-market valuations and relationships in complex structured products
In the News: GMI team members regularly share insights on business news channels and are cited in print media
Investment Advisory Services for Asset Managers
GMI’s advisory business, Standard & Poor’s Investment Advisory Services LLC(1) (SPIAS), provides risk-based, non-discretionary equity and fixed-income portfolio strategies, asset allocation, and fund review services to asset managers. GMI builds methodologies with risk-mitigation components at their core to generate superior risk-adjusted returns.
Multi-Asset-Class Research & Coverage
S&P Capital IQ’s multi-asset-class research and analysis is performed by analysts whose research process includes qualitative analyses on stocks, thematic commentary, exchange-traded funds (ETFs), mutual funds, bonds, and options.
GMI also provides:
Industry Surveys: In-depth, industry-specific research with coverage of more than 45 domestic sectors and 10 global sectors
S&P Capital IQ’s Global Market Intelligence currently advises on more than $29.7 billion* in total assets under advisement
(1) Standard & Poor’s Investment Advisory Services LLC is a completely non-discretionary business. GMI does not administrate or custody customer securities, invest, nor engage in securities transactions in any form. GMI is analytically and editorially independent from any other analytical group at McGraw Hill Financial
S&P Capital IQ offers financial professionals multi-asset-class research and analysis, non-discretionary investment advisory services, market commentary, and independent investment analysis.
*Data as of 3/31/2014
GLOBAL MARKET INTELLIGENCE

2014 Investor Fact Book 31
S&P Capital IQ
Unique Insight into the Leveraged Loan Market
S&P Capital IQ’s Leveraged Commentary & Data (LCD) delivers unique insight into the leveraged loan market through a combination of data, analysis, commentary, and real-time news. Its team of experienced analysts and reporters use its proprietary database, along with insights from buy-side and sell-side professionals, to present unique market perspectives on current events.
How financial firms use LCD:
Investment banks use LCD to win mandates and to price and structure loans to clear the market
Buy-side firms use LCD to compare and gauge new-issue deals, identify trading opportunities, and benchmark default and return performance
Leveraged Commentary & Data coverage includes:
Real-time news
Daily and weekly commentary that puts the news into perspective
Weekly U.S. leveraged loan market research and data coverage
Monthly European leveraged loan market coverage
Multiple industry websites, including:
LEVERAGED COMMENTARY & DATA
www.lcdcomps.com
www.LeveragedLoan.com
www.HighYieldBond.com
LCD’s proprietary database is the only industry-wide repository of U.S. and European leveraged loan information

32 McGraw Hill Financial
S&P Dow Jones IndicesGlobal Resource for Index-Based Innovation, Data & Research
S&P Dow Jones Indices has more than 115 years of experience constructing innovative solutions
It is not possible to invest directly in an index. Exposure to an asset class represented by an index is available through investable instruments based on that index. S&P Dow Jones Indices does not sponsor, endorse, sell, promote, or manage any investment fund or other investment vehicle that is offered by any third party and that seeks to provide an investment return based on the performance of any index
How S&P Dow Jones Indices Generates Revenue
ETFs and Mutual Funds: Licensing fees on assets invested in products linked to S&P Dow Jones Indices (non-subscription)
OTC Derivatives & Structured Products: Fixed or variable annual and per-issue fees or blanket fees for OTC derivatives and structured products (non-subscription)
Listed Derivatives: Royalties based on trading volumes of derivatives contracts listed on global exchanges(1)
(non-subscription)
Data & Custom Indices: Customized index solutions and data subscriptions that support index fund management, portfolio analytics, and research (subscription)
125
250
375
$500
Revenue: Subscription/Non-Subscription(dollars in millions)
‘13‘11 ‘12� Subscription $ 71 $ 87 $103
� Non-Subscription 252 301 390
Total Revenue $323 $388 $493
21%
79%22%
78%22%
78%
(1)
(1)
www.spdji.com
As the world’s leading resource for index-based innovation, data, and research, S&P Dow Jones Indices’ mission is to bring independent, transparent, and cost effective solutions to the global investment community. S&P Dow Jones Indices is at the forefront of index change and innovation.
• World’s leading provider of financial market indices
• Calculates more than 1,000,000 indices on a real-time or end-of-day basis covering a range of asset classes
125
250
375
$500
Revenue: Domestic/International(dollars in millions)
‘12 ‘13‘11� Domestic $248 $301 $385
� International 75 87 108
Total Revenue $323 $388 $493
78%
22%
78%
22%
77%
23%
(1)
(1)
Transparent Solutions that Span Asset Classes, Geographies, and Investment Strategies
(1) Ownership of S&P Dow Jones Indices LLC joint venture (launched in June 2012): ∫ McGraw Hill Financial: 73% ∫ CME Group: 27%
(1) See map on page 33 for exchanges with a Listing Agreement

2014 Investor Fact Book 33
S&P Dow Jones Indices is targeting growth through international and asset-class expansion, new product development, enhanced market data offerings, expanded local exchange relationships, and cross-selling opportunities.
CBOEChicago Board Options Exchange
BMVBolsa Mexicana de Valores
EGXEgyptian Stock Exchange
MILAMercado Integrado Latinoamericano
ASXAustralian Securities Exchange
Korea Exchange KRX JPX Japan Exchange Group (Merger of Osaka Securities Exchange and Tokyo Stock Exchange)
HKExHong Kong Exchanges and Clearing Ltd.
CSEColomboStock Exchange
BSENSE
National Stock Exchange of India Ltd.
TMX TMX Group Ltd.CME
BM&FBOVESPA
TWSE Taiwan Stock Exchange
Listing AgreementAn exchange with an agreement to trade derivative products based on S&P Dow Jones Indices
PartnerAn exchange partner in commercializing/producing indices
Joint Venture PartnerAn exchange partner and owner of the S&P Dow Jones Indices
Exchange Relationships Around the World
Enhanced Platform for Growth and InnovationS&P Dow Jones Indices is furthering growth by enhancing and establishing three types of relationships—joint venture partnership, partner exchange, and listing agreement—with various exchanges in order to expand global distribution and linkage to fast-growing emerging markets.
Leveraging Strategic Partnerships
S&P D
ow Jones Indices
Expanded Exchange PartnershipsBolsa Mexicana de Valores (BMV)Agreement with BMV, the second largest exchange in Latin America and the premier destination for international and domestic investors seeking access to the growing Mexican equity market.
S&P Dow Jones Indices will assume marketing and commercial licensing of all BMV indices including their flagship index, IPC (Índice de Precios y Cotizaciones)
All existing BMV indices, as well as new jointly developed indices, will be co-branded S&P
Korea Stock ExchangeAgreement with the Korea Exchange (KRX) to collaborate on global marketing and sales of the KRX indices, including the KOSPI200, the premier benchmark of equity market performance in South Korea.
S&P Dow Jones Indices will license and further promote the KRX indices to international investors
The two partners will build a joint team to effectively develop new indices and share knowledge
Taiwan Stock Exchange Strategic agreement with the Taiwan Stock Exchange (TWSE) for index maintenance, development, distribu-tion, and co-branding.
Launched the S&P/TWSE Taiwan Low Volatility High Dividend Index
Further expanding opportunities for global investors to tap into the Taiwan market
Asia Index Private LimitedA 50-50 partnership between S&P Dow Jones Indices and BSE Ltd., home to the exclusive licensor of the S&P BSE SENSEX, India’s most tracked bellwether index.
Exclusive licensor of S&P BSE data and intellectual property rights
Creating new index-based tools that enable global and domestic investors to participate in South Asia’s economies

34 McGraw Hill Financial
Investable & Benchmark Indices S&P Dow Jones Indices, the world’s leading index provider, maintains a wide variety of investable and benchmark indices to meet an array of investor needs. Its family of indices includes the S&P 500; the Dow Jones Industrial Average; the S&P/Case-Shiller®(1) Home Price Indices, the leading measure of U.S. home prices; the S&P Global BMI, an index tracking 10,000 stocks from 26 developed and 20 emerging markets; the S&P GSCI®, the industry’s leading commodities measure; and the S&P National AMT-Free Municipal Bond Index, the premier investable index for U.S. municipal bonds.(1) Case-Shiller® and Case-Shiller Indexes® are registered trademarks of CoreLogic
The S&P 500 ® is the world’s most-followed stock market index with $7.1 trillion in benchmarked assets and $1.9 trillion* directly indexed to it
Equity
Families of indices for global and local markets, covering approximately 11,000 securities in more than 80 countries with over 20 years of uninterrupted history
U.S.
Global
Developed
Emerging
Frontier
Sector
Style
Environmental, Social & Governance
Property & REIT
Shariah
Fixed Income
Broad market benchmarks measuring exposure to liquid fixed income asset classes as well as less observable segments of the credit market
Global
Regional
Money Market
Inflation Linked
U.S. Treasury
U.S. Municipal
Corporate
Credit Default Swap
Senior Loan
Preferred & Convertible
Commodities
The S&P GSCI was the first major investable commodity index. It is broad-based and production-weighted to represent the global commodity market beta
S&P GSCI
Dow Jones Commodity Index
S&P WCI
Strategic Futures
Equity Based
Risk Control
Real Estate
Leading measure of U.S. residential real estate prices and the investable universe of publicly traded property companies
S&P/Case-Shiller
Property & REIT (Equity)
Specialty
Measures that track changes in specialty indicators including healthcare claims, default rates in consumer credit, and the performance of multi-asset-class portfolios
Healthcare Claims
Consumer Credit Default
Target Date
Target Risk
Strategy
S&P Dow Jones Strategy Indices apply a quantitative framework to an asset class or combination of classes
Factor-Based Strategies (Low Volatility, High Beta, Intrinsic Value)
Dividend Income
Asset Allocation
Quantitative Strategies
Volatility
Leading measures of implied volatility, as well as indices that contain frameworks that attempt to address risk exposure from volatility via weighting or constituent
Risk Control
VIX
Theme-Based
Equity-based exposure to alternative asset classes and popular investment themes
Infrastructure
Natural Resources
Consumer Industries
Clean/Alternative Energy
Custom
More than 6,000 headline custom indices calculated and maintained by S&P Dow Jones Indices for derivative and structured product providers, ETF providers, exchanges, asset managers, and pension plans, including:
BNP Paribas
Credit Suisse
First Trust
Goldman Sachs
Lyxor
Société Générale
S&P Dow Jones Indices Span Asset Classes, Investment Strategies, and Geographic Markets
* Data as of 12/31/2013
View S&P Dow Jones Indices’ SPICE® Demo Filmed at MHFI’s 2014 Investor Day
investor.mhfi.com

2014 Investor Fact Book 35
S&P Dow Jones Indices
Market Leading, Innovative Index Solutions
The S&P 500® Dynamic VEQTOR Index dynamically allocates long-only exposure between the S&P 500, the S&P 500 VIX Short-Term Futures Index, and cash in order to measure broad equity market exposure with an implied volatility hedge. The Index is designed to mitigate risk between equity and volatility and is designed to hedge downside risks in volatile markets.
S&P Healthcare Claims Indices track commercial healthcare cost and utilization trends across four lines of business by various U.S. geographies. The indices are calculated using healthcare claims data obtained from leading health insurance companies representing approxi-mately 60 million covered individuals.
Expansion of Emerging Market Indices
To meet the growing demand of global and local investors for index-based domestic investment strategies and benchmarks, S&P Dow Jones Indices has been rapidly expanding its offerings of emerging markets indices. Newly launched indices include:
African/South Africa Equity Indices: S&P Dow Jones Indices offers the deepest and most extensive suite of African equity indices currently available to investors. The S&P All Africa headline index is a comprehensive benchmark for the African continent.
S&P Pan Asia Bond Index is designed to measure the performance of local-currency-denominated government and corporate bonds from China, Hong Kong, Indonesia, Korea, Malaysia, Philippines, Singapore, Taiwan, Thailand, and India, representing a total market value of $6.3 trillion equivalents as of March 31, 2014.
S&P/Valmer Mexico Government Bond Indices were launched in partnership with Valuación Operativa y Referencias de Mercado, S.A. de C.V. (“Valmer”). The S&P/Valmer Mexico Government Bond Indices are comprised of fixed income securities issued in the Mexican market that are categorized as Mexican government securities.
Growing investor demand for index-based passive investments has boosted the share of exchange-traded funds (ETFs) and index mutual funds, taking share away from actively managed mutual funds. In 2003, indexed ETFs and mutual funds represented 11% of total funds invested. By June 2014, they grew to 25%.
There was strong growth in the global ETF/exchange-traded product (ETP) market. Assets under management increased 23% year-over-year to $2.4 trillion in 2013.
Rising Popularity of Index Investing
“ Best Islamic Index Provider 2014” The Asset magazine’s Triple A Islamic Finance Awards
“ ETF Index Provider of the Year 2013” Asia Asset Management
“ Best Index Website of the Year” ETF.com 2013 Awards
“ Index Provider of the Year” Derivatives Intelligence’s 2013 Global Derivatives Awards
“ Indexing Innovation of the Year” (for S&P 500 Dynamic VEQTOR) 2013 William F. Sharpe Awards
Industry AwardsS&P Dow Jones Indices has been recognized with multiple industry awards in 2013 and 2014, including:
2013 ETP AUM 2003–2013 CAGR
+27%
+37%
+17%
Americas $1,772B
$461B
$168B
EMEA
Asia-Pacific
ETP Growth Across Regions2013 Global Assets Under Management: $2.4 trillion
Source: BlackRock ETP Landscape
Passive Funds Taking Share from Actively Managed Funds(ending AUM; dollars in billions)
Source: Strategic Insight Simfund
12/31/2003: $5,882 billion
89.3%
2.6%
8.1%
75.5%
12.6%
11.9%
6/30/2014: $15,490 billion
� Active Mutual Funds� Index Mutual Funds� Index ETFs

36 McGraw Hill Financial
S&P Dow Jones Indices serves as the basis for ETFs, futures, options, and other investable products around the world. S&P Dow Jones Indices was at the forefront of ETF development when the very first ETF—the S&P 500 SPDR (Standard & Poor’s Depositary Receipts)—launched in 1993. Exchange-traded funds (ETFs)—which represent share ownership of an index fund but trade like shares of stocks—have become some of the most actively traded securities on stock markets around the world.
200
400
600
$800
S&P Dow Jones Index-Based Global ETF Assets (1)
(ending AUM; dollars in billions)
Total Assets $236 $286 $348 $367 $466 $668‘08 ‘09 ‘10 ‘11 ‘12 ‘13
Joint Venture
Exchange-Traded Funds
Notes for pages 36 and 37:(1) Source for S&P Indices: Bloomberg (2008-2013);
Source for Dow Jones Indexes: Bloomberg (2008-2013). Historical figures from S&P Indices and Dow Jones Indexes for 2008-2011 have been combined for illustration purposes only. The joint venture was launched in June 2012
(2) Sources: American Stock Exchange (2003-2008); Bloomberg (2009-2013)(3) Sources: American Stock Exchange (2003-2008); Bloomberg (2009-2013).
Select Sector SPDRs started trading in December 1998(4) Source: Bloomberg(5) Source: Chicago Mercantile Exchange. E-mini 500 contracts started trading
in September 1997(6) Source: Chicago Board Options Exchange(7) Source: Chicago Board Options Exchange. VIX option contracts started trading
in February 2006. Contract volume may be based on preliminary reported volume, rather than cleared volume
Record-Level ETFs Linked to S&P Dow Jones Indices
Index SolutionsBasis for a Range of Investment Vehicles
The SPDR ® S&P 500 (Symbol: SPY) is the world’s largest and most traded ETF with more than $168 billion* in assets * Data as of 6/30/2014
S&P Dow Jones Indices are the basis for ETFs globally. As of June 30, 2014, assets under management in these 620 ETFs grew to $719 billion
Growing and Diversifying ETF Assets Based on S&P Dow Jones Indices (1)
2013: $668 billion2003: $80 billion
72%
28%
41%59%
� ETF AUM based on S&P 500� ETF AUM based on other S&P Dow Jones Indices
Key Milestones
S&P Dow Jones Indices has been a catalyst for some of the last century’s most important financial innovations.
1975First indexed fund: Vanguard 500 Index Fund
1982 First listed index future: S&P 500 index futures on CME
1983First listed index option: S&P 100 and S&P 500 options on CBOE
1993First exchange- traded fund: S&P 500 SPDR
2004First volatility derivative: VIX Options Contracts
2012Creation of S&P Dow Jones Indices

2014 Investor Fact Book 37
45
90
135
$180
SPDR S&P 500 (Symbol: SPY) (2)
(ending AUM; dollars in billions)
Dollars $43.1 $54.8 $59.5 $64.1 $100.1 $93.9 $84.9 $89.9 $95.4 $123.0 $174.8
‘03 ‘04 ‘05 ‘06 ‘07 ‘08 ‘09 ‘10 ‘11 ‘12 ‘13
25
50
75
$100
Select Sector SPDRs (Symbols: XLY, XLP, XLE, XLF, XLV, XLI, XLB, XLK, XLU) (3)
(ending AUM; dollars in billions)
Dollars $6.2 $9.4 $12.8 $17.7 $26.5 $23.1 $31.4 $40.1 $44.0 $60.3 $80
‘03 ‘04 ‘05 ‘06 ‘07 ‘08 ‘09 ‘10 ‘11 ‘12 ‘13
4
8
12
$16
SPDR Dow Jones Industrial Average ETF (Symbol: DIA) (4) (ending AUM; dollars in billions)
Dollars $6.8 $8.0 $7.6 $6.7 $8.6 $9.0 $9.0 $8.7 $10.8 $10.9 $12.6
‘03 ‘04 ‘05 ‘06 ‘07 ‘08 ‘09 ‘10 ‘11 ‘12 ‘13
60
120
180
240
S&P 500 Option Contracts Traded on the CBOE (6)
(contracts in millions)
Options 36.7 49.5 71.8 104.3 158.1 178.6 154.9 175.3 197.1 174.9 209.0
‘03 ‘04 ‘05 ‘06 ‘07 ‘08 ‘09 ‘10 ‘11 ‘12 ‘13
175
350
525
700
S&P 500 Futures and "E-mini 500" Contracts Traded on the CME (5)
(contracts in millions)
‘03 ‘04 ‘05 ‘06 ‘07 ‘08 ‘09 ‘10 ‘11 ‘13‘12� Futures 20.2 16.1 15.4 14.8 15.8 16.8 10.4 7.7 7.3 5.0 4.2� E-mini 161.2 167.2 207.1 257.9 415.3 633.9 556.3 555.3 621.5 473.7 450.9
S&P Dow Jones Indices
SPDR ETFs Listed Derivatives
40
80
120
160
VIX® Option Contracts Traded on the CBOE (7)
(contracts in millions)
‘06 ‘07 ‘08 ‘09 ‘10 ‘11 ‘12 ‘13‘03 ‘04 ‘05Options – – – 5.0 23.0 26.0 33.0 63.0 99.0 111.0 143.4

38 McGraw Hill Financial
Commodities & Commercial MarketsData, Analytics & Vertical News
Commodities & Commercial Markets’ brands—Platts, J.D. Power, and McGraw Hill Construction—are leading sources of high-value information, data, analytical services, and benchmarks that address customers’ needs in the energy and construction markets and the automotive industry. With its emphasis on providing timely, comprehensive, and reliable business information, Commodities & Commercial Markets is strengthening its core products and services, extending capabilities to existing customers, and meeting new customer needs through innovative solutions.
How Commodities & Commercial Markets Generates Revenue
Real-time news, market data and price assessments, along with other print and digital information products, primarily serving the energy and construction markets and the automotive industry (subscription revenue)
Syndicated and proprietary research studies, advertising, consulting engagements, and events (non-subscription revenue)
300
600
900
$1,200
Revenue: Domestic/International(dollars in millions)
‘12 ‘13‘11� Domestic $551 $563 $ 563
� International 345 410 451
Total Revenue $896 $973 $1,014
56%
44%
61%
39%
58%
42%
High-Value Information that Addresses Key Sectors of the Global Economy
300
600
900
$1,200
Revenue: Subscription/Non-Subscription(dollars in millions)
‘13‘11 ‘12� Subscription $564 $614 $ 656
� Non-Subscription 332 359 358
Total Revenue $896 $973 $1,014
65%
35%
63%
37%
63%
37%
In March 2014, McGraw Hill Financial announced plans to pursue strategic alternatives for McGraw Hill Construction
Notes: The Broadcasting Group was sold in 2011 and was reclassified as a discontinued operation. It is excluded from results for 2009-2011
Aviation Week was sold in 2013. Segment results include Aviation Week through August 1, 2013

2014 Investor Fact Book 39
Commodities & Commercial Markets’ data, analytics, and related research are embedded in the decision-making process for customers and companies in key sectors of the global economy. This group is expanding its business model to include additional benchmarks and workflow tools that allow its customers to further improve and grow their businesses.
Platts, J.D. Power, and McGraw Hill Construction provide essential data and benchmark information to the energy and construction markets and the automotive industry
J.D. Power provides essential consumer intelligence to help businesses measure, understand, and improve the key performance metrics that drive growth and profitability
Comm
odities &
Comm
ercial Markets
Platts provides essential price data, analytics, and industry insight that enable commodities markets to perform with greater transparency and efficiency
McGraw Hill Construction provides essential data, news, insights, and intelligence to better inform construction professionals’ decisions and strengthen their companies’ market positions

40 McGraw Hill Financial
PlattsCommodity Pricing, Analytics & Industry Insight
Platts is a leading independent provider of energy, petrochemicals, metals, and agriculture information and a premier source of benchmark price assessments for those commodity markets. With more than a century of business experience, Platts provides market reports, real-time news and price information, and end-of-day market data to more than 10,000 private- and public-sector customers across more than 180 countries.
Platts has benefited from strong fundamental growth and globalization of commodity markets. Physical commodity market drivers include:
Price volatility: Reinforces the need for price discovery
A growing futures market: Platts benefits as more futures contracts are written that use its pricing information
Increasing global energy market: Long-term growth trends as energy consumption increases the overall market
Trading in physical commodities: As trade flows grow, so does the need for more transparency and pricing information
www.platts.com
How Platts Generates Revenue
Subscriptions for proprietary market information, market reports, real-time services, and analytics (subscription revenue)
Licensing fees from exchanges and clearing houses for the right to use Platts’ data and brand name in trading operations for derivative contracts (subscription and non-subscription revenue)
Conferences and events across all commodity markets served by Platts (non-subscription revenue)
Approximately 90% of Platts’ revenue is based on subscription products that have a renewal rate of nearly 95%
Platts is McGraw Hill Financial’s most global business with 60% of its revenue coming from outside the U.S.
Enabling Commodity Markets to Perform with Greater Transparency and Efficiency
150
300
450
$600
Revenue: Commodities (Platts)(dollars in millions)
‘12 ‘13‘11� Commodities $419 $489 $550
+15%2-year CAGR
Recent Acquisitions Advance Platts’ Position in Established and Emerging Commodity Markets
From its beginnings in petroleum, Platts has successively expanded its coverage to include petrochemicals, metals, shipping, and other commodity markets.
North American Natural Gas MarketsBentek (2011)
Bentek Energy offers fundamental data and proprietary analytical products to North America’s natural gas, liquefied natural gas (LNG), oil, and natural gas liquid (NGL) sectors. This acquisition expanded Platts’ expertise in fundamental market analysis.
Steel, Iron Ore & Metals
Steel Business Briefing Group (2011)
The acquisition of the Steel Business Briefing Group and its pricing unit, The Steel Index, established Platts’ leadership in metals. Platts now publishes more than 850 price points for steel and related raw materials.
Sugar & Biofuels Markets
Kingsman (2012)
Kingsman is a global brand for sugar market data and analytics. The acquisition deepened Platts’ capabilities in biofuels and provided a foothold for additional growth opportunities in the global agricultural markets.
European Natural Gas MarketsEclipse Energy Group (2014)
Advancing its strategy of linking price information and market fundamentals, Platts acquired the Eclipse Energy Group, a European- based provider of data and analysis on the European gas, power, and global LNG markets.

2014 Investor Fact Book 41
The strength of Platts’ market information enables customers to identify opportunities to profit from market movements and better manage risk
Platts: Comprehensive Coverage Across Commodity Markets
Commodities
Platts Serves Every Link in the Supply and Demand Chain
Large and complex marketsCrude Oil / Refined ProductsNatural GasElectricity / PowerCoal ShippingPetrochemicals
New areas of focusAgriculture (sugar / ethanol / biofuel)Liquefied Natural GasMetals
Customers who have high exposure to commodities prices or need to procure and/or sell physical commoditiesTrading CompaniesProducers (energy, miners, farmers)Processors (refineries, mills, utilities) Storage & Transportation CompaniesDistributors (industrial suppliers, steel fabricators, food wholesalers)End users (manufacturers, airlines)Financial InstitutionsExchangesBrokers Governments Law and Consulting Firms
Trading workflow functionsProcurementSupplyTradingRisk ManagementSettlement / Accounting
Business decisionsStrategic PlanningBusiness DevelopmentExploration & Production OperationsRegulatory / PolicyLegalMergers & Acquisitions
Customers: Who Uses Platts
Commodity Markets: Platts’ Expanding Coverage
Functions: Workflows Platts Supports
Agriculture Coal Electric Power Metals Natural Gas Oil Petrochemicals Shipping
How Markets Use Platts’ Price AssessmentsAccording to industry estimates, Platts’ price assessments are the basis for billions of dollars of transactions annually in the physical and futures markets:
Buyers, sellers, and traders use them as a basis for pricing spot transactions and term contracts
Risk managers use them to settle contracts and to place a market value on the product(s) they hold
Analysts use them to identify trends and patterns in supply and demand
Governments reference them to formulate royalty payments and retail prices
Exchanges and investors use them to price derivatives contracts

42 McGraw Hill Financial
PlattsFlexible Delivery of Data and Analytics Supports Diverse Client Workflows
Platts’ Price Assessments: Transparent and IndependentTwo key elements that build confidence in the price assessment process are quality market data and appropriate methodologies to analyze that data to yield a representative market value.
Platts Market-On-Close (MOC) is the process Platts’ editors use to assess prices for crude oil, petroleum products, and related swaps. The MOC is a highly transparent process in which bids, offers, and transactions are submitted by participants to Platts’ editors and published in real time throughout the day until the market close. Following the close, Platts’ editors examine the data gathered through the day, conduct their analysis, and develop price assessments that reflect an end-of-day value
Platts eWindow is an online communication tool that allows MOC participants to instantly communicate bids, offers, and other deal information to Platts’ editors and others in the market. It shows market activity in real time, providing a clear view of both buying and selling
View Platts P4D Demo Filmed at MHFI’s 2014 Investor Day
investor.mhfi.com
Platts’ Products & ServicesPlatts leverages technology to offer flexible delivery of data and analytics through online platforms, direct data feeds, and partnerships with real-time vendors.
Real-Time News & Market Alerts: News, market commentary, and price assessments offer up-to-the-minute market insight
Price Assessments & Indices: Platts’ market data packages include thousands of daily prices, forward curves, and third-party data
Market Reports: More than 50 publications cover the energy, petrochemicals, metals, and agriculture markets
Maps & Geospatial: Proprietary global energy infrastructure maps help customers visualize and evaluate capital investment opportunities
Conferences: More than 50 conferences held around the globe help industry executives connect and discuss market trends and industry issues
Delivery PlatformsPlatts Market Center
Platts on the Net
Platts XML Direct
Distribution PartnersThomson Reuters
GlobalView
Morningstar
SunGard
Bloomberg
and others
Platts P4D: A Web-based Analytical Platform for Oil Market Data
Platts P4D is a Web-based analytical platform for oil market data that makes the entire history of Platts eWindow market data available to explore and analyze.
Interactive graphs, charts, and tables allow users to view all the named bids, offers, and trades submitted through Platts eWindow
Transparent and flexible, P4D enables users to drill down into minute-by-minute price action to see what has been traded, by whom, and at what price
The tool is also fully configurable and allows users to display historical patterns of behavior, along with price and activity relationships
View Platts MOC Process
investor.mhfi.com

2014 Investor Fact Book 43
Platts’ Price AssessmentsGrowing Market Use of Reference & Benchmark Prices and Cash-Settled Futures
Commodities
CME Group and IntercontinentalExchange (ICE) list more than 700 Platts-based oil, gas, coal, metals, and freight contracts** Data as of 5/31/2014
Essential Intelligence: From Price Reference to Price “Benchmark” StatusPlatts publishes thousands of daily price assess-ments and is a key source of pricing intelligence. As the world’s diverse energy markets continue to evolve, Platts’ innovations in price discovery and information delivery have provided solutions to pricing challenges and helped build Platts’ reputation as a leading provider of energy price information. Market participants generally utilize one or two benchmarks, with futures settled against one. Platts places an emphasis on supporting its “benchmarks.”
Reference prices: Market participants use Platts’ price assessments to negotiate contracts and analyze price trends
Benchmark prices: Today, many of Platts’ price assessments are considered “benchmarks” and are used to settle contracts. Market participants use Platts’ price assessments in bilateral contracts that use floating prices linked to a benchmark index. This enables buyers and sellers to manage risk of temporary price movements
Cash-settled futures: Exchanges use Platts’ prices to settle futures contracts in lieu of physical deliveries. Cash settlement reduces transaction costs incurred in the physical delivery of a commodity
Oil Benchmarks
Platts’ Dubai price assessment is a leading benchmark for Middle Eastern crude sold in Asia. Platts’ Brent price assessment is estimated to be used as a benchmark to price more than 60% of the world’s total crude oil.
Bulk Commodities
More than 90% of iron ore contracts based on The Steel Index (TSI) are cleared on the Singapore Exchange.
New Assessments and Benchmarks in Freight and AgricultureFreight: Platts recently launched more than 65 daily dry freight price assessments for metals, agricultural, and other commodities
Agriculture: Kingsman sugar indices are the de facto benchmark of the world’s sugar spot market
100
200
300
400
Iron Ore Trading Volumes based on Platts’ The Steel Index 62% Fe Iron Ore Fines(Cleared volume in metric tons; in millions)
‘13 6/30/14‘11 ‘12
� Swaps 48 114 241 173� Options 5 13 36 39� Futures (1) – – 8 61
Total contracts 53 127 285 273
Six months ended
Note: Trading volumes cleared on SGX, CME, LCH.Clearnet, and NOS Clearing
(1) Futures began trading in April 2013
Sources: Singapore Exchange, CME Group, LCH.Clearnet, NOS Clearing
125
350
575
800
Dubai Crude Oil Trading VolumesPlatts Dubai-related trading volumes cleared by ICE and CME(in millions)
2013 5/31/142011 2012
� ICE (Barrels) � CME (Barrels)
2
4
6
8
Oil Trading Volumes Based on Platts’ Price AssessmentsPlatts-based trading volumes cleared by ICE and CME (in billions)
2013 5/31/142011 2012
� ICE Oil (Barrels) � CME Oil (Barrels)
Sources: IntercontinentalExchange, CME Group
Exchange Partners
Platts’ data have been licensed to exchanges and other entities for listing, trading, and clearing purposes, including:
CME Group
IntercontinentalExchange
LCH.Clearnet
NASDAQ OMX
Singapore Exchange
Tokyo Commodity Exchange

44 McGraw Hill Financial
J.D. PowerActionable Data and Insights Based on the Voice of the Customer
J.D. Power captures the opinions and perceptions of millions of consumers annually. Its data and insights are used by companies worldwide to improve quality, satisfaction, and business performance, while its ratings aid consumers in making more informed purchasing decisions.
Through an unrivaled 360-degree view of the customer, J.D. Power identifies the key drivers of the customer experience, measures their importance, and prioritizes recommendations that clients integrate into their future product planning processes.
In emerging markets such as China, Brazil, and India, J.D. Power is expanding its product and service offerings to support the growth of both global and indigenous clients. In fact, J.D. Power has emerged as McGraw Hill Financial’s single-largest business operation in China.
J.D. Power has a solid brand reputation. Its research findings generate high visibility in the media. Clients around the world that rank highest in J.D. Power’s independent, industry-wide syndicated studies often leverage the J.D. Power brand in their marketing and advertising programs. This widespread exposure benefits both J.D. Power’s clients and J.D. Power by creating new business opportunities.
J.D. Power’s Industry SolutionsSyndicated Studies and Brand LicensingIndependent quality and satisfaction studies
Industry benchmarking
Digital experience evaluations
Brand licensing for award recipients
Proprietary StudiesCustomized, company-specific research:
Mystery shopping
Tracking programs
Social media insights and text analytics
Business Data and Analysis ToolsSubscriptions:
Data-driven solutions based on point-of-sale transactions from the Power Information Network® (PIN)
Consulting and TrainingCross-industry, best-practices research
Retail performance improvement
Customer service and support certification programs
Contact center solutions
How J.D. Power Generates RevenueSubscriptions for data-driven solutions
Contracts for research studies, brand licensing, consulting, and training
J.D. Power’s data and insights are used by companies worldwide to improve quality, satisfaction, and business performance
www.jdpower.com
Rest of World 70%
Asia-Pacific 30%
J.D. Power’s Revenue: Approximately 30% is from Asia-Pacific
Recognizing Excellence. Driving Results.

2014 Investor Fact Book 45
Commercial Markets
The Power Information Network® (PIN) from J.D. Power provides real-time automotive information and decision-support tools based on the collection and analysis of daily new- and used-vehicle retail transaction data from thousands of automotive franchises. Details from these transactions are evaluated to create products that focus on key measures, including price, cost, profit, finance, lease, and trade-in values.
Automotive ManufacturersPIN Explorer® is a dynamic reporting tool that enables users to perform competitive analyses, track new-product introductions, conduct market comparisons, and isolate weaknesses and strengths.
PIN Navigator® is a reporting tool designed specifically for the auto finance industry, combining credit scores, new- and used-vehicle sales data, and financial transaction data on a weekly basis by market and by nameplate.
Automotive Dealers in the U.S. and CanadaPIN’s PowerDealer® is a highly accurate online source for analytical tools and decision-support products that enable dealerships to compare their operation to their market region, improve profitability, and help make effective and informed business decisions.
Industry Research Practice AreasAutomotive
Energy
Financial Services
Government
Healthcare
Home Improvement
Insurance
Telecommunications
Travel and Leisure
918 million ad impressions* in 2013
Clients ranked highest in J.D. Power’s syndicated studies can leverage the J.D. Power brand in their marketing and advertising programs* Print ads in consumer magazines, trade magazines, and newspapers
J.D. Power’s Power Information Network: Competitive Real-Time Intelligence for Automotive Manufacturers and Retailers
PowerDealer is a web-based application with specially designed dealer-specific and market comparison reports
View PIN’s PowerDealer Demo Filmed at MHFI’s 2014 Investor Day
investor.mhfi.com

46 McGraw Hill Financial
McGraw Hill ConstructionData, Analytics & Insight for the Design and Construction Industry
www.construction.com
Serving more than one million customers across the global design and construction industry, McGraw Hill Construction provides essential data, news, insights, and intelligence to better inform construction professionals’ decisions.
Its leading brands—Dodge, Sweets, Architectural Record, and Engineering News-Record—enable customers to size market opportunities, prioritize prospects, target and build relationships, and strengthen their market position.
How McGraw Hill Construction Generates Revenue
Global construction data and analytics solutions
U.S. market trends, research, and forecasts
Industry-leading vertical news, events, and benchmarks
Essential Intelligence to Build On
Industry CustomersOwners
Architects
Engineers
Contractors
Subcontractors
Building Product Manufacturers and Distributors
Commercial Real Estate Firms
Financial Services Firms
McGraw Hill Construction is the sole private source of construction project data for the U.S. Census Bureau’s Value of Construction Put-in-Place, a key measure of construction spending used to calculate the U.S. Gross Domestic Product
Non-Subscription 25%
Subscription 75%
McGraw Hill Construction’s Revenue Mix
Approximately 75% of McGraw Hill Construction’s revenue is based on subscriptions to data and analytical products
Global Construction Project Data Underpins the Dodge Analytics SuiteTimely Project Data and Job Leads for ContractorsDodge BidPro™ is a Web-based dashboard that delivers timely project data directly to contractors enabling them to monitor and react to job leads from wherever they are working. The service extracts bidding projects from the proprietary Dodge database and delivers project information that can be screened locally, regionally or nationally, by project type and value, and by contractor’s specialty trade. Mobile app is available for Apple and Android customers.
Forecast Data for Industry ExecutivesDodge MarketShare™ is a Web-based product that enables construction industry executives to forecast more accurately. Powered by the data in Dodge Reports, Dodge MarketShare offers a rich, historical database of project starts as well as forecast data based on relevant market insight and viewpoints from Dodge’s team of economists and research analysts.
Industry Relationship Data for Driving Business GrowthDodge BuildShare® is a Web-based diagnostic platform that identifies key relationships between industry firms and connects them to construction projects, delivering competitive market share analysis and enabling customers to build relationships for growth. Dodge BuildShare’s digital dashboards analyze existing relationships among more than 250,000 active owners, contractors, and design and engineering firms.

2014 Investor Fact Book 47
Commercial Markets
McGraw Hill Construction is generating growth opportunities and deepening customer relationships by investing in its business intelligence platform. Customers are integrating these premium subscription services into their daily workflow for timely access to essential news, research, data, and analytical tools.
Research, Analytics & BenchmarksActionable market intelligence and insight from Construction’s team of leading industry economists help customers better understand their markets, the economy, and key industry trends.
Proprietary, comprehensive research, analysis, and forecasts to assist in business decisions
Web-based analytics dashboards
Dodge Momentum Index
A first-of-its-kind, 12-month leading indicator of construction spending based on first-issued planning reports for non-residential building.
The Index is issued monthly and is based on a 91% correlation between construction planning reports, as reported by Dodge, and the U.S. Commerce Department’s Put-in-Place spending over the past 10 years
Global DataDetailed coverage of local, national, and international construction projects with Dodge reporters in more than 80 major metro areas.
Dodge U.S.: 500,000 projects with 5,500 daily updates and 65,000 digitized plans and specifications
Dodge International: More than 20,000 projects with a valuation of more than $6 trillion
Dodge SuiteDodge Global Network
Dodge MarketShare™
Dodge BuildShare®
Dodge SpecShare®
Dodge BidPro™
Dodge International
Dodge Construction Forecast
Dodge Research
Dodge DocuPro™
Vertical NewsAward-winning editorial plus a strong media portfolio—online, in print, and through events— enable the design and construction industry to stay informed, share, and connect.
Architectural Record
Engineering News-Record (ENR)
ENR Rankings
Sweets® & SNAP
Industry Events
Sweets
Sweets is the design and construction industry’s source for building product information.
Registered users can view and download catalogs, specifications, BIM (Building Information Modeling) and CAD (Computer-Aided Design) models, and installation instructions for more than 20,000 products
More than 240,000 registered users

48 McGraw Hill Financial
Financial ReviewU.S. GAAP
2013 Financial Highlights
2013 marked McGraw Hill Financial’s transformation into a more profitable, more growth-oriented company, as demonstrated by 10% revenue growth and 21% adjusted diluted EPS from continuing operations.
The 2014 Investor Fact Book provides historical, recasted results for MHFI’s four operating segments on an annual basis for five years that serve as a baseline for the Company’s future performance.
Standard & Poor’s Ratings Services (2, 3) Revenue increased by 12% to $2.27 billion
Operating profit increased by 13% to $958 million
Adjusted operating profit increased by 10% to $952 million*
Adjusted operating profit margin was 41.9%*
S&P Capital IQ (2, 3, 5)
Revenue increased by 4% to $1.17 billion
Operating profit decreased by 9% to $189 million
Adjusted operating profit decreased by 12% to $201 million*
Adjusted operating profit margin was 17.2%*
S&P Dow Jones Indices (3, 4)
Revenue increased by 27% to $493 million
Operating profit increased by 25% to $266 million
Adjusted operating profit increased by 14% to $266 million*
Adjusted operating profit margin was 54%*
Commodities & Commercial Markets (3, 6) Revenue increased by 4% to $1.01 billion
Operating profit increased by 26% to $313 million
Adjusted operating profit increased by 20% to $312 million*
Adjusted operating profit margin was 30.8%*
* In certain portions of the 2014 Investor Fact Book, MHFI’s financial results are presented on an adjusted, non-GAAP basis for 2010–2013. The non-GAAP financial measures are derived from MHFI’s continuing operations. This information is provided in order to allow investors to make meaningful comparisons of the Corporation’s operating performance between periods and to view the business from the same perspective as MHFI’s management. These non-GAAP measures may be different than similar measures used by other companies. Reconciliations for the differences between non-GAAP measures and comparable financial measures calculated in accordance with U.S. GAAP are provided on page 65.
Notes for pages 48 and 49:(1) Total operating revenue includes intersegment
revenue elimination of $76 million (Domestic $37 million; Foreign $39 million)
(2) Segment revenues do not include intersegment revenue elimination of $63 million in 2011, $69 million in 2012, and $76 million in 2013. Percentages may sum to greater than 100%
(3) Beginning on January 1, 2014, all shared operating services are fully allocated to the business units utilizing a methodology that more closely aligns with each business unit’s usage of these services. The Company recasted 2013 information to reflect $75 million of costs that were reallocated to the business units. Prior years were not recasted
(4) Includes operating profit attributable to noncontrolling interests ($73 million in 2013; $34 million in 2012) and includes adjusted operating profit attributable to noncontrolling interests ($73 million in 2013; $36 million in 2012) as part of S&P Dow Jones Indices joint venture launched in June 2012
(5) 2013 results reflect the divestiture of Financial Communications and the shutdown of several small products within the business unit (S&P Capital IQ)
(6) Aviation Week was sold on August 1, 2013. Its results are included through that date
* MHFI: McGraw Hill Financial’s results for 2008−2013 reflect McGraw-Hill Education as a discontinued operation

2014 Investor Fact Book 49
Financial Review
Non-Recurring(Non-subscription/Transaction) 39%: $1,897
Recurring(Subscription/Non-transaction) 61%: $2,978
Revenue by Business Model (1)
(dollars in millions)
2013: $4,875
Foreign 41%: $1,983
Domestic 59%: $2,892
Revenue by Region (1)
(dollars in millions)
2013: $4,875
S&P Capital IQ 24%: $1,170
S&P Dow Jones Indices 10%:$493S&P Dow Jones Indices 10%:$493
Commodities 11%: $550
Commercial Markets 10%: $464
Standard & Poor’s Ratings Services 47%: $2,274
Revenue by Segment (1, 2)
(dollars in millions)
2013: $4,875
Revenue Snapshots
At a business unit level, McGraw Hill Financial’s 2013 revenue benefited from multiple long-term secular trends, including the globalization of capital markets, increased global demand for data driven decision-making tools, regulatory change, and increased market volatility and risk.
McGraw Hill Financial is a truly global company with approximately 18,000 employees in 30 countries and 95 global offices. 41% of the Company’s revenues in 2013 came from international operations. Foreign revenue grew 12% as a result of the Company expanding its revenue base in developed and emerging markets.
More than 60% of McGraw Hill Financial’s revenue is tied to subscription-based business. This increasing level of recurring revenue is driven by high retention rates as MHFI’s businesses provide mission-critical data and tools that are deeply embedded in client workflows.
See footnotes on page 48

50 McGraw Hill Financial
Operating Segment Trends*
350
700
1,050
$1,400
Total Revenue(dollars in millions)
‘12‘09 ‘10 ‘11$916 $1,031 $1,124
NA*
–
‘13$1,170
75
150
225
$300
Total Operating Profit(dollars in millions)
‘12‘09 ‘10 ‘11$171 $214 $208 $189
NA*
–
‘13
10
20
30
40%
Operating Profit Margin
‘12‘09 ‘10 ‘1118.7% 20.8% 18.5% 16.1%
NA*
–
‘13
250
500
750
$1,000
Total Revenue(dollars in millions)
‘12‘09 ‘10 ‘11$273 $323 $388 $493
NA*
–
‘13
75
150
225
$300
Total Operating Profit(dollars in millions)
‘12‘09 ‘10 ‘11$144 $189 $212 $266
NA*
–
‘13
20
40
60
80%
Operating Profit Margin
‘12‘09 ‘10 ‘1152.7% 58.5% 54.6% 53.9%
NA*
–
‘13
600
1,200
1,800
$2,400
Total Revenue(dollars in millions)
‘12‘09 ‘10 ‘11$1,537 $1,695 $1,767 $2,034
‘13$2,274
250
500
750
$1,000
Total Operating Profit(dollars in millions)
‘12‘09 ‘10 ‘11$712 $762 $720 $849
‘13$958
15
30
45
60%
Operating Profit Margin
‘12‘09 ‘10 ‘1146.3% 45.0% 40.7% 41.7%
‘1342.1%
350
700
1,050
$1,400
Total Revenue(dollars in millions)
‘12‘09 ‘10 ‘11$344 $419 $489 $550
$464$467 $477 $484$873
––
$811 $896 $973 $1,014
CommoditiesCommercialTotal
‘13
80
160
240
$320
Total Operating Profit(dollars in millions)
‘12‘09 ‘10 ‘11$96 $153 $180 $248
‘13$313
10
20
30
40%
Operating Profit Margin
‘12‘09 ‘10 ‘1111.0% 18.9% 20.1% 25.5%
‘1330.8%
Commodities & Commercial Markets (2, 6, 7)S&P Capital IQ (1, 2, 3, 5)
Standard & Poor’s Ratings Services (1, 2) S&P Dow Jones Indices (2, 3, 4)
See footnotes on page 53
NA* See pages 51-53 for S&P Capital IQ / S&P Indices’ 2009 results
Note for S&P Capital IQ: 2013 results reflect the divestiture of Financial Communications and the shutdown of several small products within the business unit
Note for Commodities & Commercial Markets: Aviation Week was sold in 2013. Segment results include Aviation Week through August 1, 2013
Note for S&P Dow Jones Indices: Includes operating profit attributable to noncontrolling interests ($73 million in 2013; $34 million in 2012) as part of the S&P Dow Jones Indices joint venture launched in June 2012

2014 Investor Fact Book 51
Revenue
(dollars in millions) 2009 2010 2011 2012 2013
Standard & Poor’s Ratings Services (1) $ 1,537 $ 1,695 $ 1,767 $ 2,034 $ 2,274
% increase/(decrease) (3%) 10% 4% 15% 12%
% of total 44% 47% 45% 46% 47%
S&P Capital IQ (1, 2, 3) $ – $ 916 $ 1,031 $ 1,124 $ 1,170
% increase/(decrease) – – 13% 9% 4%
% of total – 25% 26% 25% 24%
S&P Dow Jones Indices (2) $ – $ 273 $ 323 $ 388 $ 493
% increase/(decrease) – – 18% 20% 27%
% of total – 8% 8% 9% 10%
S&P Capital IQ / S&P Indices (1, 2) $ 1,122 $ – $ – $ – $ –
% increase/(decrease) 1% – – – –
% of total 32% – – – –
Commodities $ – $ 344 $ 419 $ 489 $ 550
% increase/(decrease) – – 22% 17% 13%
% of total – 9% 11% 11% 11%
Commercial Markets (4, 5) $ – $ 467 $ 477 $ 484 $ 464
% increase/(decrease) – – 2% 1% (4%)
% of total – 13% 12% 11% 10%
Commodities & Commercial Markets (4, 5) $ 873 $ 811 $ 896 $ 973 $ 1,014
% increase/(decrease) (9%) (7%) 10% 9% 4%
% of total 25% 22% 23% 22% 21%
Intersegment elimination $ (49) $ (56) $ (63) $ (69) $ (76)
Total revenue $ 3,483 $ 3,639 $ 3,954 $ 4,450 $ 4,875
% increase/(decrease) (3%) 4% 9% 13% 10%
* MHFI: McGraw Hill Financial’s results for 2008–2013 reflect McGraw-Hill Education as a discontinued operation
(1) Revenue for Standard & Poor’s Ratings Services and expenses for S&P Capital IQ include an intersegment royalty charged to S&P Capital IQ for the rights to use and distribute content and data developed by Standard & Poor’s Ratings Services
(2) The S&P Dow Jones Indices joint venture was launched on June 29, 2012. The Company began reporting S&P Capital IQ and S&P Dow Jones Indices separately in 4Q 2012 and recasted results for the years 2010, 2011, and 2012
(3) 2013 results reflect the divestiture of Financial Communications and the shutdown of several small products within the business unit (S&P Capital IQ)
(4) Aviation Week was sold on August 1, 2013. Its results are included through that date
(5) The Broadcasting Group was sold in 2011 and was reclassified as a discontinued operation. It is excluded from results for 2009-2011
Financial Review

52 McGraw Hill Financial
Expenses Recasted (2)
(dollars in millions) 2009 2010 2011 2012 2013
Standard & Poor’s Ratings Services (1, 2) $ 825 $ 933 $ 1,047 $ 1,185 $ 1,316
% increase/(decrease) (1%) 13% 12% 13% 11%
S&P Capital IQ (1, 2, 3, 4) $ – $ 745 $ 817 $ 916 $ 982
% increase/(decrease) – – 10% 12% 7%
S&P Dow Jones Indices (2, 3) $ – $ 129 $ 134 $ 176 $ 227
% increase/(decrease) – – 4% 31% 29%
S&P Capital IQ / S&P Indices (1, 3) $ 820 $ – $ – $ – $ –
% increase/(decrease) 4% – – – –
Commodities & Commercial Markets (2, 5, 6) $ 777 $ 658 $ 716 $ 725 $ 701
% increase/(decrease) (12%) (15%) 9% 1% (3%)
Intersegment elimination $ (49) $ (56) $ (63) $ (69) $ (76)
Total expense $ 2,373 $ 2,409 $ 2,651 $ 2,933 $ 3,150
% increase/(decrease) (4%) 2% 10% 11% 7%
Operating Segment Trends* (continued)
* MHFI: McGraw Hill Financial’s results for 2008–2013 reflect McGraw-Hill Education as a discontinued operation
(1) Revenue for Standard & Poor’s Ratings Services and expenses for S&P Capital IQ include an intersegment royalty charged to S&P Capital IQ for the rights to use and distribute content and data developed by Standard & Poor’s Ratings Services
(2) Beginning on January 1, 2014, all shared operating services are fully allocated to the business units utilizing a methodology that more closely aligns with each business unit’s usage of these services. The Company recasted 2013 information to reflect $75 million of costs that were reallocated to the business units. Prior years were not recasted
(3) The S&P Dow Jones Indices joint venture was launched on June 29, 2012. The Company began reporting S&P Capital IQ and S&P Dow Jones Indices separately in 4Q 2012 and recasted results for the years 2010, 2011, and 2012
(4) 2013 results reflect the divestiture of Financial Communications and the shutdown of several small products within the business unit (S&P Capital IQ)
(5) Aviation Week was sold on August 1, 2013. Its results are included through that date
(6) The Broadcasting Group was sold in 2011 and was reclassified as a discontinued operation. It is excluded from results for 2009-2011

2014 Investor Fact Book 53
Financial Review
Operating Profit by Segment Recasted (2)
(dollars in millions) 2009 2010 2011 2012 2013
Standard & Poor’s Ratings Services (1, 2) $ 712 $ 762 $ 720 $ 849 $ 958
% increase/(decrease) (5%) 7% (6%) 18% 13%
% of total 64% 62% 55% 56% 56%
S&P Capital IQ (1, 2, 3, 5) $ – $ 171 $ 214 $ 208 $ 189
% increase/(decrease) – – 25% (3%) (9%)
% of total – 14% 16% 14% 11%
S&P Dow Jones Indices (2, 3, 4) $ – $ 144 $ 189 $ 212 $ 266
% increase/(decrease) – – 31% 12% 25%
% of total – 12% 15% 14% 15%
S&P Capital IQ / S&P Indices (1, 3) $ 302 $ – $ – $ – $ –
% increase/(decrease) (6%) – – – –
% of total 27% – – – –
Commodities & Commercial Markets (2, 6, 7) $ 96 $ 153 $ 180 $ 248 $ 313
% increase/(decrease) 32% 59% 18% 38% 26%
% of total 9% 12% 14% 16% 18%
Total segment operating profit $ 1,110 $ 1,230 $ 1,303 $ 1,517 $ 1,726
% increase/(decrease) (3%) 11% 6% 16% 14%
Operating Profit Margin by Segment
2009 2010 2011 2012 2013
Standard & Poor’s Ratings Services 46.3% 45.0% 40.7% 41.7% 42.1%
S&P Capital IQ – 18.7% 20.8% 18.5% 16.1%
S&P Dow Jones Indices – 52.7% 58.5% 54.6% 53.9%
S&P Capital IQ / S&P Indices 26.9% – – – –
Commodities & Commercial Markets 11.0% 18.9% 20.1% 25.5% 30.8%
Total operating profit margin (8) 31.9% 33.8% 33.0% 34.1% 35.4%
* MHFI: McGraw Hill Financial’s results for 2008–2013 reflect McGraw-Hill Education as a discontinued operation
(1) Revenue for Standard & Poor’s Ratings Services and expenses for S&P Capital IQ include an intersegment royalty charged to S&P Capital IQ for the rights to use and distribute content and data developed by Standard & Poor’s Ratings Services
(2) Beginning on January 1, 2014, all shared operating services are fully allocated to the business units utilizing a methodology that more closely aligns with each business unit’s usage of these services. The Company recasted 2013 information to reflect $75 million of costs that were reallocated to the business units. Prior years were not recasted
(3) The S&P Dow Jones Indices joint venture was launched on June 29, 2012. The Company began reporting S&P Capital IQ and S&P Dow Jones Indices separately in 4Q 2012 and recasted results for the years 2010, 2011, and 2012
(4) Includes operating profit attributable to noncontrolling interests ($73 million in 2013; $34 million in 2012) as part of S&P Dow Jones Indices joint venture launched in June 2012
(5) 2013 results reflect the divestiture of Financial Communications and the shutdown of several small products within the business unit (S&P Capital IQ)
(6) Aviation Week was sold on August 1, 2013. Its results are included through that date
(7) The Broadcasting Group was sold in 2011 and was reclassified as a discontinued operation. It is excluded from results for 2009-2011
(8) Adjusted for intersegment revenue elimination

54 McGraw Hill Financial
Foreign Source Revenue*
In 2013, foreign sources accounted for 41% of MHFI’s total revenue and represented an 8% 5-year compound annual growth rate (CAGR) compared to domestic revenue, which had a 4% 5-year CAGR.
Standard & Poor’s Ratings Services contributed slightly more than half of the foreign revenue.
500
1,000
1,500
$2,000
Geographic Region and Percent of Total Foreign Source Revenue (1, 3)
(dollars in millions)
‘11 ‘12 ‘13‘09� EMEA $ 819 62% $ 839 61% $ 952 60% $1,067 60% $1,227 62%� Asia 329 25% 356 26% 423 27% 454 26% 483 24%� Canada 109 8% 119 9% 132 8% 159 9% 171 9%� Latin America 57 4% 72 5% 74 5% 86 5% 102 5% Total $1,314 100% $1,386 100% $1,581 100% $1,766 100% $1,983 100%
‘10
1.5
3.0
4.5
$6.0
Domestic and Foreign Source Revenue Growth (1, 3)
(dollars in millions)
‘12 ‘13‘08 ‘10
Domestic 5-year CAGR: 4%Foreign 5-year CAGR: 8%
� Domestic $2,393 $2,169 $2,253 $2,373 $2,684 $2,892� Foreign 1,323 1,314 1,386 1,581 1,766 1,983 Total $3,716 $3,483 $3,639 $3,954 $4,450 $4,875
‘11
59%
41%
60%
40%
60%
40%
62%
38%
64%
36%
‘09
62%
38%
Standard & Poor’s Ratings Services $ 1,060
S&P Capital IQ $ 403
Commodities & Commercial Markets $ 451
Intersegment elimination $ (39)
S&P Dow Jones Indices $ 108
2013 Foreign Source Revenue: $1,983 (1, 2)
(dollars in millions)
(1) Foreign source revenue includes international sales by U.S. operations
(2) Individual segment results do not include adjustment for intersegment revenue elimination
(3) Revenue includes intersegment revenue elimination
* MHFI: McGraw Hill Financial’s results for 2008–2013 reflect McGraw-Hill Education as a discontinued operation
Note: Details may not sum to total due to rounding

2014 Investor Fact Book 55
(1) Foreign source revenue includes international sales by U.S. operations
(2) Individual segment results do not include adjustment for intersegment revenue elimination
(3) Total company revenue includes intersegment revenue elimination
NA* The S&P Dow Jones Indices joint venture was launched on June 29, 2012. The Company began reporting S&P Capital IQ and S&P Dow Jones Indices separately in 4Q 2012 and recasted results for the years 2010, 2011, and 2012
300
600
900
$1,200
Standard & Poor’s Ratings Services (1, 2)
(dollars in millions) (percent of total foreign source revenue)
‘13‘09
56%
‘10
56%
‘11
54%
‘12
53%
$1,060$738 $776 $857 $932
54%
125
250
375
$500
S&P Capital IQ (1, 2)
(dollars in millions) (percent of total foreign source revenue)
‘12 ‘13‘09
21%
‘10
21%
‘11$294 $338 $375 $403
21%20%
NA*
–
125
250
375
$500
Commodities & Commercial Markets (1)
(dollars in millions) (percent of total foreign source revenue)
23%
‘12 ‘13
21%
‘09
20%
‘10 ‘11$451$276 $280 $345 $410
23%
22%
45
90
135
$180
S&P Dow Jones Indices (1)
(dollars in millions) (percent of total foreign source revenue)
5%
‘12 ‘13‘09 ‘10 ‘11$66 $75 $87 $108
5%5%
NA*
–
5%
.5
1.0
1.5
$2.0
Total Company Foreign Source Revenue (1, 3)
(dollars in billions)
‘12 ‘13‘09 ‘10 ‘11$2.0$1.3 $1.4 $1.6 $1.8
Foreign source revenue accounted for 41% of total revenue in 2013
Financial Review
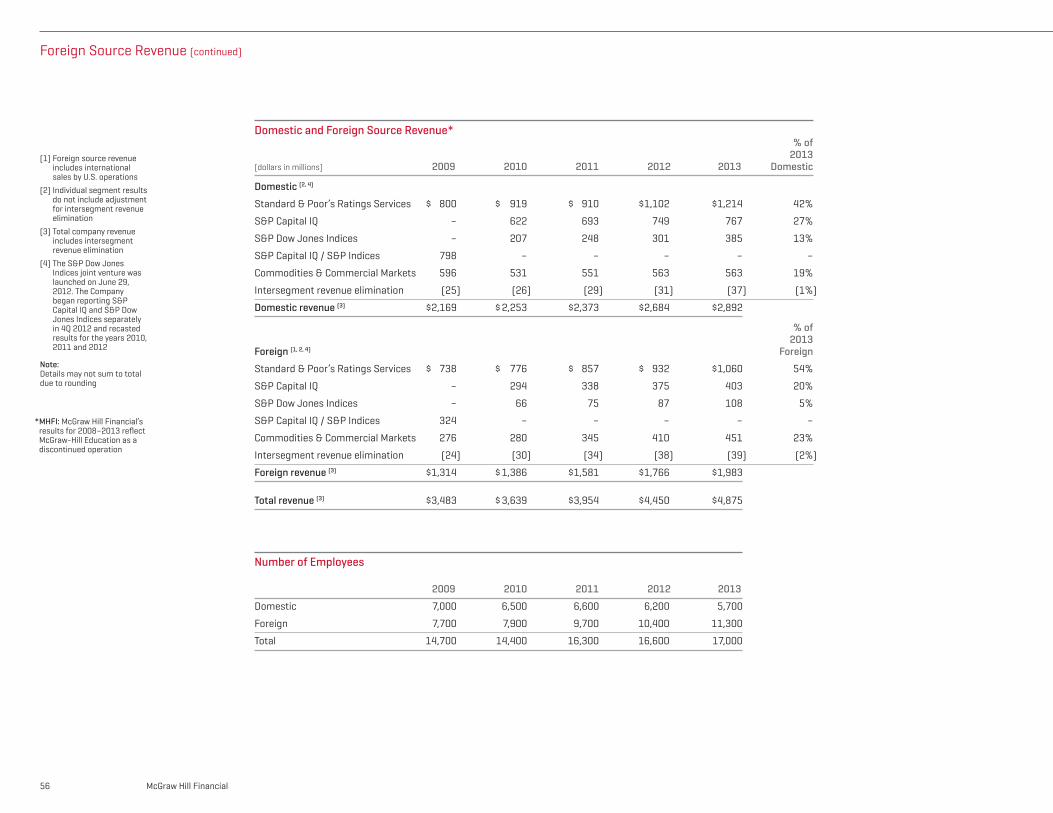
56 McGraw Hill Financial
Domestic and Foreign Source Revenue* % of 2013(dollars in millions) 2009 2010 2011 2012 2013 Domestic
Domestic (2, 4)
Standard & Poor’s Ratings Services $ 800 $ 919 $ 910 $ 1,102 $ 1,214 42%
S&P Capital IQ – 622 693 749 767 27%
S&P Dow Jones Indices – 207 248 301 385 13%
S&P Capital IQ / S&P Indices 798 – – – – –
Commodities & Commercial Markets 596 531 551 563 563 19%
Intersegment revenue elimination (25) (26) (29) (31) (37) (1%)
Domestic revenue (3) $ 2,169 $ 2,253 $ 2,373 $ 2,684 $ 2,892
% of 2013 Foreign (1, 2, 4) Foreign
Standard & Poor’s Ratings Services $ 738 $ 776 $ 857 $ 932 $ 1,060 54%
S&P Capital IQ – 294 338 375 403 20%
S&P Dow Jones Indices – 66 75 87 108 5%
S&P Capital IQ / S&P Indices 324 – – – – –
Commodities & Commercial Markets 276 280 345 410 451 23%
Intersegment revenue elimination (24) (30) (34) (38) (39) (2%)
Foreign revenue (3) $ 1,314 $ 1,386 $ 1,581 $ 1,766 $ 1,983
Total revenue (3) $ 3,483 $ 3,639 $ 3,954 $ 4,450 $ 4,875
(1) Foreign source revenue includes international sales by U.S. operations
(2) Individual segment results do not include adjustment for intersegment revenue elimination
(3) Total company revenue includes intersegment revenue elimination
(4) The S&P Dow Jones Indices joint venture was launched on June 29, 2012. The Company began reporting S&P Capital IQ and S&P Dow Jones Indices separately in 4Q 2012 and recasted results for the years 2010, 2011 and 2012
Note: Details may not sum to total due to rounding
Foreign Source Revenue (continued)
* MHFI: McGraw Hill Financial’s results for 2008–2013 reflect McGraw-Hill Education as a discontinued operation
Number of Employees
2009 2010 2011 2012 2013
Domestic 7,000 6,500 6,600 6,200 5,700
Foreign 7,700 7,900 9,700 10,400 11,300
Total 14,700 14,400 16,300 16,600 17,000

2014 Investor Fact Book 57
Financial Review
300
600
900
$1,200
S&P Capital IQ (2, 6)
(dollars in millions)
‘13‘11 ‘12� Subscription $ 922 $1,014 $1,056
� Non-Subscription 109 110 114
Total Revenue $1,031 $1,124 $1,170
90%
10%
90%
10%
89%
11%
125
250
375
$500
S&P Dow Jones Indices(dollars in millions)
‘13‘11 ‘12� Subscription $ 71 $ 87 $103
� Non-Subscription 252 301 390
Total Revenue $323 $388 $493
21%
79%22%
78%22%
78%
300
600
900
$1,200
Commodities & Commercial Markets (7, 8)
(dollars in millions)
‘13‘11 ‘12� Subscription $564 $614 $ 656
� Non-Subscription 332 359 358
Total Revenue $896 $973 $1,014
65%
35%
63%
37%
63%
37%
600
1,200
1,800
$2,400
Standard & Poor’s Ratings Services (2)
(dollars in millions)
‘13‘11 ‘12� Non-Transaction $1,116 $1,131 $1,239
� Transaction 651 903 1,035
Total Revenue $1,767 $2,034 $2,274
54%
46%44%
56%63%
37%
Recurring Revenue*
1250
2,500
3,750
$5,000
Total Company (1, 6, 7, 8)
(dollars in millions)
‘13‘11 ‘12� Recurring $2,608 $2,777 $2,978
� Non-Recurring 1,346 1,673 1,897
Total Revenue $3,954 $4,450 $4,875
61%
39%38%
62%66%
34%
See footnotes on page 8
Notes: See the following pages for descriptions of each business unit’s recurring revenue (non-transaction / subscription) and non-recurring revenue (transaction / non-subscription):
Page 10: Standard & Poor’s Ratings Services
Page 24: S&P Capital IQ
Page 32: S&P Dow Jones indices
Page 38: Commodities & Commercial Markets
* MHFI: McGraw Hill Financial’s results for 2008–2013 reflect McGraw-Hill Education as a discontinued operation

58 McGraw Hill Financial
Earnings Before Interest, Taxes, Depreciation, and Amortization (EBITDA)*
Earnings Before Interest, Taxes, Depreciation, and Amortization (EBITDA)
(dollars in millions) 2009 2010 2011 2012 2013
Operating profit
Standard & Poor’s Ratings Services $ 712 $ 762 $ 720 $ 849 $ 958
S&P Capital IQ – 171 214 208 189
S&P Dow Jones Indices – 144 189 212 266
S&P Capital IQ / S&P Indices 302 – – – –
Commodities & Commercial Markets 96 153 180 248 313
Total segment operating profit $ 1,110 $ 1,230 $ 1,303 $ 1,517 $ 1,726
Less: Unallocated expenses 156 204 226 306 321
Earnings before interest and taxes (EBIT) $ 954 $ 1,026 $ 1,077 $ 1,211 $ 1,405
Depreciation 92 87 93 93 86
Amortization of intangibles 26 21 33 48 51
EBITDA $ 1,072 $ 1,134 $ 1,203 $ 1,352 $ 1,542
* MHFI: McGraw Hill Financial’s results for 2008–2013 reflect McGraw-Hill Education as a discontinued operation
400
800
1,200
$1,600
Total Company EBITDA(dollars in millions)
‘12 ‘13‘09 ‘10 ‘11$1,542$1,072 $1,134 $1,203 $1,352

2014 Investor Fact Book 59
Financial Review
* MHFI: McGraw Hill Financial’s results for 2008–2013 reflect McGraw-Hill Education as a discontinued operation
Capital Investments*
30
60
90
$120
Capital Expenditures(dollars in millions)
‘12 ‘13‘10 ‘11
� Standard & Poor’s Ratings Services $39 $40 $43 $ 40� S&P Capital IQ 21 21 22 39� S&P Dow Jones Indices 2 2 2 4� Commodities & Commercial Markets 10 14 17 17� Corporate 14 15 13 17
Total $86 $92 $97 $117
15
30
45
$60
Amortization of Intangibles(dollars in millions)
‘12 ‘13‘10 ‘11
� Standard & Poor’s Ratings Services $ 1 $ 3 $ 4 $ 5� S&P Capital IQ 10 20 27 26� S&P Dow Jones Indices – – 5 8� Commodities & Commercial Markets 10 10 12 12
Total $21 $33 $48 $51
30
60
90
$120
Depreciation(dollars in millions)
‘12 ‘13‘10 ‘11
� Standard & Poor’s Ratings Services $36 $37 $39 $40� S&P Capital IQ 18 23 23 23� S&P Dow Jones Indices 3 3 3 2� Commodities & Commercial Markets 12 13 11 10� Corporate 18 17 17 11
Total $87 $93 $93 $86
Note: Depreciation includes amortization of technology projects

60 McGraw Hill Financial
Acquisitions & Divestitures
Acquisitions Divestitures2014as of June 30
$16 millionl RAM Holdings Berhad (11.7% interest after
acquisition of additional interest)✱ Broad Market Indicess Korrelate
$70 millionu East Windsor, NJ Corporate Data Center (payment
received in July 2014)
2013 $273 millionl CRISIL Limited (68% interest after acquisition of
additional 15% interest)l RAM Holdings Berhad (8.2% interest after
acquisition of additional interest)✱ Goldman Sachs Commodity Indicess Minerals Value Service GmbH (25.1% interest)
$51 million ($2.4 billion including MHE)l India Index Services & Products Ltd. (CRISIL sold 49%
equity interest)❖ Financial Communicationss Aviation Weekn McGraw-Hill Education
2012 $177 million ($183 million including MHE)l Coalition Development Ltd.❖ Credit Market Analysis Limited❖ QuantHouse❖ R2 Technologies✱ S&P Dow Jones Indices LLC (73% interest)s Kingsman SAn Key Curriculum
No divestitures
2011 $194 million ($200 million including MHE)l RAM Holdings Berhad (5% interest)l TRIS Corporation Limited (5% interest)s BENTEK Energy LLCs Steel Business Briefing Groupn Bookette Software Companyn Inkling (2% interest)n Unigo (5.5% interest)
$21 million ($238 million including MHE and Broadcasting)❖ DPC Datas LinkedIn Corporation (0.45% interest)s JDPA Estimate s McGraw-Hill Broadcastingn Ebrary (2.4% interest)
2010 $327 million ($364 million including MHE)l Pipal Research Corporation❖ TheMarkets.com LLC❖ Thomson Reuters databases (contingent payment)n Ambow Education Holding Ltd. (1% interest)n Starting Out!™n Tegrity Ltd.
$25 million ($31 million including MHE)l CRISIL National Commodity & Derivatives Exchange Ltd.
(7% of 12% interest)l CRISIL Gas Strategies (remaining 10% interest)❖ Return on investment in The Markets.com LLCn Australian secondary education business
2009 No acquisitions $15 million★ Vista Research, Inc.s BusinessWeek
Acquisition and divestiture amounts for continuing operations reflect those reported on McGraw Hill Financial’s U.S. GAAP cash flow statement and are not indicative of actual purchase/sale prices due to purchase price adjustments and other timing differences in payments/receipts. Divestiture amounts also include proceeds received from the disposition of property and equipment.
Amounts provided in brackets include discontinued operations.
Business Unit Legend:
l Standard & Poor’s Ratings Services (formerly named “Standard & Poor’s” in 2010 and “Financial Services” from 2002 to 2009)
❖ S&P Capital IQ (formerly named “S&P Capital IQ / S&P Indices”) (1)
✱ S&P Dow Jones Indices (formerly named “S&P Capital IQ / S&P Indices”) (1)
★ S&P Capital IQ / S&P Indices (formerly named “McGraw-Hill Financial” in 2010 and “Financial Services” from 2002 to 2009)
s Commodities & Commercial Markets (formerly named “Information & Media” from 2002 to 2010)
n McGraw-Hill Education (MHE)
u Corporate
See footnote on page 61

2014 Investor Fact Book 61
Acquisitions Divestitures2008 $48 million
l Maalot, Ltd.★ Case-Shiller® Home Price Indices (licensing agreement)★ Thomson Reuters databasess Umbria, Inc.s LinkedIn Corporation (0.45% interest)
$0.4 millionl CRISIL Gas Strategies (90% interest)
2007 $87 million★ ClariFI, Inc.★ IMAKE/ABSXn HotChalk, Inc. (6% interest)n Reading Success (reading program)
$62 million★ S&P mutual fund data businessn Benziger
2006 $13 million★ Heale Financial★ TheMarkets.com LLC (6% interest after acquisition of
additional 3% interest)s Automotive Resources Asia, Ltd.s Azteca America affiliate low-powered TV station in
Bakersfield, CA
$12 million★ The Review of Securities Regulation newsletterss E-Sources POWER Magazine
2005 $462 millionl CRISIL Limited (59% interest after acquisition of
additional 49% interest)
l Taiwan Ratings Corporation (51% interest after acquisition of additional 1% interest)
★ ASSIRT Pty Limited★ TheMarkets.com (3% interest)★ Vista Research, Inc.s Azteca America affiliate low-powered TV stations in
Colorado and San Diegos J.D. Power and Associatess USDTVn TurnLeaf Solutions
$131 million★ Corporate Value Consulting★ Standard & Poor’s Securities, Inc.s Healthcare Information Group
2004 $306 million★ Capital IQ, Inc.s Center for Business Intelligence (energy conference
business only)n Grow.net, Inc.n PRCEDU Corporation (9% interest)
$47 million★ J.J. Kenny Drake, Inc.n Landoll, Frank Schaffer, and related juvenile retail
publishing businesses
2003 $4 millions FriedWire, Inc.
$503 million★S&P ComStocku Rock-McGraw, Inc. (45% interest)
Financial Review
(1) The S&P Dow Jones Indices joint venture was launched in June 2012. The Company began reporting S&P Capital IQ and S&P Dow Jones Indices’ results separately in 4Q 2012 and recasted results for 2010–2012

62 McGraw Hill Financial
Share Repurchase Programs (1)
Diluted Weighted Shares Average SharesYear $ in millions Purchased Outstanding
2013 $ 989 16,891,601 279,819,071
2012 295 6,764,583 284,616,238
2011 1,500 34,742,871 303,645,607
2010 256 8,710,445 312,220,085
2009 – – 313,296,491
2008 447 10,900,000 318,687,254
2007 2,213 37,000,000 344,784,866
2006 1,540 28,400,000 366,877,769
2005 672 14,343,900 382,569,750
2004 401 10,000,000 385,823,700
2003 213 6,935,400 384,009,014
2002 196 6,409,200 389,146,638
2001 182 6,203,400 391,745,196
2000 168 6,235,200 392,143,250
1999 174 6,463,400 397,114,618
1998 106 5,348,000 398,208,132
1997 80 5,200,400 399,008,728
1996 63 5,451,600 399,483,608
1987 $ 135 19,960,000
Note: Shares repurchased are reported on a trade-date basis(1) Adjusted for all stock splits
Debt Ratings
Fitch
Long-term debt BBB+
Commercial paper F2
Outlook Negative
Advancing Total Shareholder Value
Summary of Debt Outstanding
(dollars in millions)
5.90% Senior notes, due 2017 $ 400
6.55% Senior notes, due 2037 399
Total debt $ 799
Less: Cash and equivalents & short-term investments $ 1,560
Net debt $ (761)
MHFI Debt Profile (as of December 31, 2013)
Stock Split History, 1953–2005
Record Date Payment Date Distribution
May 6, 2005 May 17, 2005 2-for-1
February 24, 1999 March 8, 1999 2-for-1
March 28, 1996 April 26, 1996 2-for-1
May 9, 1983 June 1, 1983 2-for-1
June 30, 1967 July 17, 1967 2-for-1
March 10, 1961 March 17, 1961 3-for-1
July 25, 1956 August 8, 1956 3-for-1
July 24, 1953 August 3, 1953 2-for-1
25
50
75
100%
‘12‘10 ‘11 ‘13‘03 ‘04 ‘05 ‘06 ‘07 ‘08 ‘09
Dividend Payout (Based on Regular Dividends)(as a percentage of current year’s GAAP earnings)
35 33 66 22Payout (%) 30 30 29 30 27 35 38
1.00
2.00
3.00
$4.00
‘10 ‘11 ‘12 ‘13‘03 ‘04 ‘05 ‘06 ‘07 ‘08 ‘09
Dividends per Share of Common Stock, 2003–2013
Note: 2012 includes a special dividend of $2.50 per share on the Company's common stock
� Special – – – – – – – – – $2.50 –� Regular $0.54 $0.60 $0.66 $0.73 $0.82 $0.88 $0.90 $0.94 $1.00 $1.02 $1.12
McGraw Hill Financial has paid a dividend each year since 1937 and is one of fewer than 25 companies in the S&P 500 that has increased its dividend annually for the last 41 years. The annualized rate of $1.20 per share of common stock includes a 7% increase approved by the Board in January 2014. Reflecting the weighted impact of share repurchases, the Company had approximately 277 million fully diluted shares at the end of the second quarter of 2014.

2014 Investor Fact Book 63
Quarterly Stock Valuation Data
Year Quarter Prices (1) MHFI MHFI - Price to Earnings (2) S&P 500 - Price to Earnings (2) P/E Relative to S&P 500 High Low Close Volume High Low Close High Low Close High Low Close2013 (3) 4 78.810 65.340 78.200 74,097,580 22.91 18.99 22.73 17.23 15.34 17.22 1.33 1.24 1.32 3 66.960 53.450 65.590 74,845,551 20.35 16.25 19.94 16.93 15.70 16.45 1.20 1.03 1.21 2 56.550 50.510 53.190 105,617,973 17.62 15.74 16.57 16.99 15.47 16.18 1.04 1.02 1.02 1 58.620 42.070 52.080 232,511,090 19.61 14.07 17.42 15.97 14.50 15.95 1.23 0.97 1.09
2012 (3) 4 57.440 49.560 54.670 143,260,070 20.44 17.64 19.46 15.19 13.87 14.73 1.35 1.27 1.32 3 55.190 44.190 54.590 119,861,520 20.29 16.25 20.07 15.14 13.61 14.79 1.34 1.19 1.36 2 50.000 42.020 45.000 104,870,779 15.29 12.85 13.76 14.41 12.84 13.80 1.06 1.00 1.00 1 48.600 44.670 48.470 113,189,941 15.83 14.55 15.79 14.46 12.83 14.35 1.09 1.13 1.10
2011 4 45.770 38.680 44.970 123,076,293 15.57 13.16 15.30 13.40 11.14 13.04 1.16 1.18 1.17 3 46.990 34.950 41.000 200,399,637 16.55 12.31 14.44 14.33 11.64 11.96 1.15 1.06 1.21 2 43.500 38.090 41.910 111,965,523 15.43 13.51 14.86 15.08 13.84 14.53 1.02 0.98 1.02 1 40.560 36.200 39.400 103,302,467 14.70 13.12 14.28 15.46 14.37 15.25 0.95 0.91 0.94
2010 4 39.450 32.700 36.410 131,104,512 14.56 12.07 13.44 15.07 13.51 15.01 0.97 0.89 0.89 3 33.800 27.080 33.060 118,300,814 12.71 10.18 12.43 14.65 12.79 14.44 0.87 0.80 0.86 2 36.940 26.950 28.140 221,307,328 14.60 10.65 11.12 16.64 14.04 14.07 0.88 0.76 0.79 1 36.670 32.680 35.650 103,543,330 14.67 13.07 14.26 17.85 15.79 17.68 0.82 0.83 0.81
2009 4 35.240 24.460 33.510 194,468,691 14.87 10.32 14.14 19.88 17.94 19.61 0.75 0.58 0.72 3 34.100 23.550 25.140 243,943,008 14.89 10.28 10.98 27.27 21.95 26.69 0.55 0.47 0.41 2 34.090 22.460 30.110 177,245,398 13.64 8.98 12.04 24.03 19.69 23.10 0.57 0.46 0.52 1 25.890 17.220 22.870 245,097,570 9.84 6.55 8.70 21.95 15.51 18.56 0.45 0.42 0.47
2008 4 33.120 17.150 23.190 200,117,215 12.36 6.40 8.65 18.56 16.48 18.24 0.67 0.39 0.47 3 47.130 22.000 31.610 153,573,747 17.01 7.94 11.41 20.26 17.07 17.99 0.84 0.47 0.63 2 45.610 36.170 40.120 163,545,961 16.00 12.69 14.08 20.65 18.24 18.35 0.77 0.70 0.77 1 44.760 33.910 36.950 184,588,816 15.22 11.53 12.57 19.17 16.37 17.23 0.79 0.70 0.73
2007 4 55.140 43.460 43.810 178,192,844 18.08 14.25 14.36 19.09 17.04 17.79 0.95 0.84 0.81 3 68.810 47.150 50.910 247,126,617 21.98 15.06 16.27 17.42 15.35 17.09 1.26 0.98 0.95 2 72.500 60.160 68.080 123,650,344 24.83 20.60 23.32 16.83 15.47 16.42 1.48 1.33 1.42 1 69.980 61.060 62.880 124,541,820 25.63 23.37 23.03 16.36 15.26 15.90 1.57 1.53 1.45
2006 4 69.250 57.280 68.020 76,636,900 26.95 22.29 26.47 16.32 15.13 16.17 1.65 1.47 1.64 3 58.300 48.400 58.030 92,639,400 22.95 19.06 22.85 15.60 14.25 15.55 1.47 1.34 1.47 2 58.750 47.800 50.230 121,441,400 23.98 19.51 20.50 16.23 14.92 15.54 1.48 1.31 1.32 1 59.570 46.370 57.620 119,198,700 25.35 19.73 24.52 16.55 15.73 16.35 1.53 1.25 1.50
2005 4 53.970 45.600 51.630 78,045,900 23.26 19.66 22.25 16.69 15.28 16.33 1.39 1.29 1.36 3 48.750 43.010 48.040 66,287,000 21.86 19.29 21.54 16.79 15.95 16.56 1.30 1.21 1.30 2 45.675 40.510 44.250 111,714,000 21.91 19.43 21.22 16.88 15.73 16.49 1.30 1.24 1.29 1 47.995 42.810 43.625 106,768,000 24.00 21.41 21.81 17.61 16.67 16.91 1.36 1.28 1.29
2004 4 46.055 39.425 45.770 83,969,000 23.74 20.32 23.59 17.94 16.11 17.91 1.32 1.26 1.32 3 39.885 36.415 39.845 74,212,200 21.50 19.63 21.48 17.66 16.44 17.25 1.22 1.19 1.25 2 40.670 37.825 38.285 85,443,000 23.11 21.49 21.75 18.52 17.32 18.36 1.25 1.24 1.18 1 40.185 34.550 38.070 97,652,000 23.64 20.32 22.39 19.95 18.98 19.39 1.18 1.07 1.15
2003 4 35.000 30.995 34.960 84,799,800 21.21 18.78 21.19 20.34 18.21 20.33 1.04 1.03 1.04 3 32.255 29.300 31.065 97,932,400 20.35 18.49 19.60 20.10 18.57 19.25 1.01 1.00 1.02 2 33.075 27.730 31.000 124,260,600 21.62 18.12 20.26 20.74 17.32 19.91 1.04 1.05 1.02 1 31.290 25.870 27.795 131,153,800 20.79 17.19 18.47 19.62 16.55 17.79 1.06 1.04 1.04
Note: On May 14, 2013, McGraw Hill Financial’s common stock began trading under its new stock symbol “MHFI.” The former symbol was “MHP”
(1) Data adjusted for all stock splits
(2) Based on 12-month moving operating earnings per share, which excludes one-time items
(3) P/E excludes McGraw-Hill Education’s results, which were reclassified into discontinued operations
Source: S&P Capital IQ

64 McGraw Hill Financial
2013 Income from continuing operations before taxes includes:
• Q4—A $36 million non-cash impairment charge related to the pending sale of a data center; a $13 million charge related to terminating various leases as the Company reduced its real estate portfolio; and $28 million in restructuring charges across the segments
• Q3—Costs of $6 million in unallocated expense necessary to enable the separation of McGraw-Hill Education and to reduce the Company’s cost structure. Standard & Poor’s Ratings Services includes a $16 million gain on the sale of an equity investment held by CRISIL; S&P Capital IQ includes a $3 million loss on the sale of Financial Communications; Commodities & Commercial Markets includes an $11 million gain on the sale of Aviation Week; and $8 million in restructuring charges across the segments
• Q2—Costs of $10 million in unallocated expense necessary to enable the separation of McGraw-Hill Education and to reduce the Company’s cost structure
• Q1—Costs of $44 million in unallocated expense necessary to enable the separation of McGraw-Hill Education and to reduce the Company’s cost structure. A pre-tax legal settlement of approximately $77 million
2012 Income from continuing operations before taxes includes:• Q4—Costs of $48 million in unallocated expense necessary
to enable the separation of McGraw-Hill Education and to reduce the Company’s cost structure. A $29 million restructuring charge, which is reflected in operating income as follows: an $8 million charge at the Standard & Poor’s Ratings Services segment, a $5 million charge at the S&P Capital IQ segment, a $6 million charge at the Commodities & Commercial Markets segment, and a $10 million charge in unallocated expense, partially offset by $52 million related to a vacation accrual reversal
• Q3—Costs of $42 million in unallocated expense necessary to enable the separation of McGraw-Hill Education and to reduce the Company’s cost structure. A $39 million restructuring charge, which is reflected in operating income as follows: a $7 million charge at the Standard & Poor’s Ratings Services segment, a $14 million charge at the S&P Capital IQ segment, a $1 million charge at the S&P Dow Jones Indices segment, a $6 million charge at the Commodities & Commercial Markets segment, and an $11 million charge in unallocated expense
• Q2—Costs of $24 million in unallocated expense necessary to enable the separation of McGraw-Hill Education and to reduce the Company’s cost structure. Transaction costs of $15 million for the S&P Dow Jones Indices LLC joint venture
• Q1—Costs of $21 million in unallocated expense necessary to enable the separation of McGraw-Hill Education and to reduce the Company’s cost structure. An $8 million charge related to a reduction in lease commitments
2011 Income from continuing operations before taxes includes:• Q4—A $32 million restructuring charge, which is reflected in
operating income as follows: a $9 million charge at the Standard & Poor’s Ratings Services segment, a $6 million charge at the Commodities & Commercial Markets segment, and a $17 million charge in unallocated expense
• Q4—Costs of $10 million in unallocated expense necessary to enable the separation of McGraw-Hill Education and to reduce the Company’s cost structure
Items Affecting Comparability of Results
Note for page 65: Details may not sum to total due to rounding
(1) Beginning on January 1, 2014, all shared operating services are fully allocated to the business units utilizing a methodology that more closely aligns with each business unit’s usage of these services. The Company recasted 2013 information to reflect $75 million of costs that were reallocated to the business units. Prior years were not recasted
2010 Income from continuing operations before taxes includes:• Q4—An $11 million restructuring charge at the Commodities
& Commercial Markets segment
• Q4—A $16 million charge for subleasing excess space at the Company’s New York facilities
• Q3—A $7 million gain on the sale of certain equity interests at the Standard & Poor’s Ratings Services segment
2009 Income from continuing operations before taxes includes:• Q4—An $11 million gain on the sale of BusinessWeek at the
Commodities & Commercial Markets segment
• Q2—A $14 million loss on the sale of Vista Research, Inc. at the S&P Capital IQ / S&P Indices segment
• Q2—A $4 million net restructuring charge, which is reflected in operating income as follows: a $3 million benefit at the Standard & Poor’s Ratings Services segment, a $3 million charge at the S&P Capital IQ / S&P Indices segment, and a $4 million charge at the Commodities & Commercial Markets segment
Discontinued Operations
• McGraw-Hill Education was sold in 2013. McGraw Hill Financial’s results for 2008-2013 reflect McGraw-Hill Education as a discontinued operation
• The Broadcasting Group was sold in 2011. McGraw Hill Financial’s results for 2009–2011 reflect Broadcasting Group as a discontinued operation (Commodities & Commercial Markets)
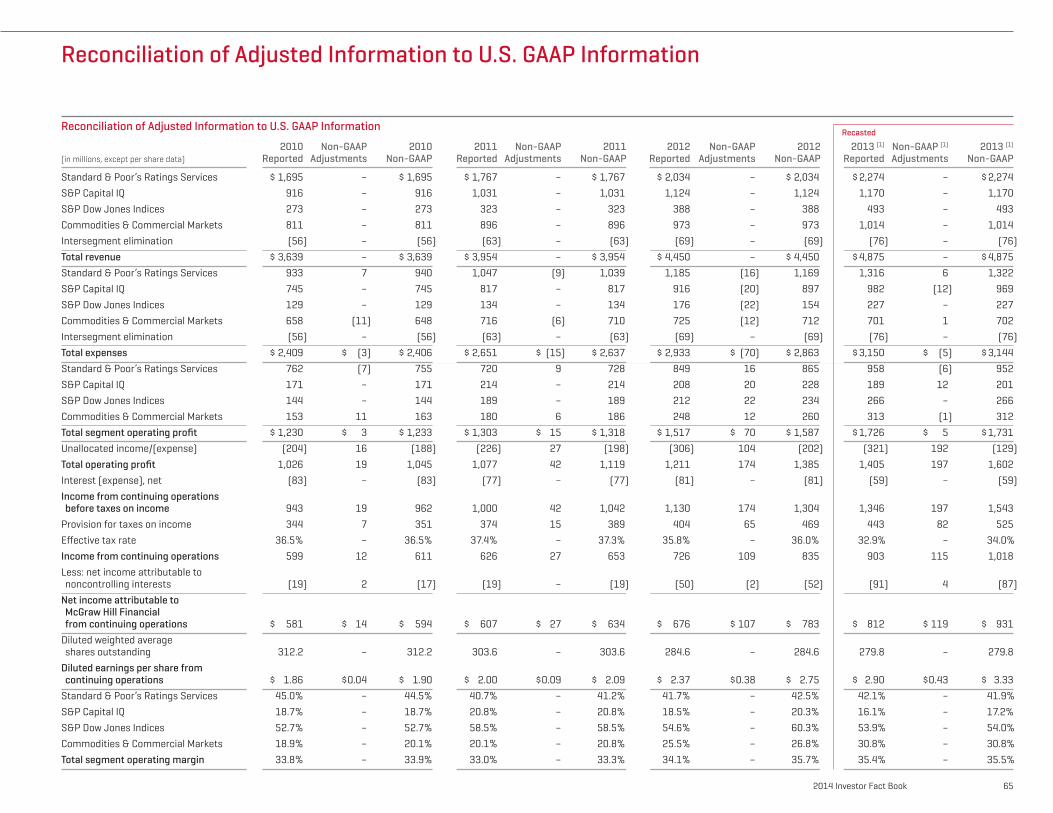
2014 Investor Fact Book 65
Reconciliation of Adjusted Information to U.S. GAAP Information
Reconciliation of Adjusted Information to U.S. GAAP Information Recasted
2010 Non-GAAP 2010 2011 Non-GAAP 2011 2012 Non-GAAP 2012 2013 (1) Non-GAAP (1) 2013 (1) (in millions, except per share data) Reported Adjustments Non-GAAP Reported Adjustments Non-GAAP Reported Adjustments Non-GAAP Reported Adjustments Non-GAAP
Standard & Poor’s Ratings Services $ 1,695 – $ 1,695 $ 1,767 – $ 1,767 $ 2,034 – $ 2,034 $ 2,274 – $ 2,274
S&P Capital IQ 916 – 916 1,031 – 1,031 1,124 – 1,124 1,170 – 1,170
S&P Dow Jones Indices 273 – 273 323 – 323 388 – 388 493 – 493
Commodities & Commercial Markets 811 – 811 896 – 896 973 – 973 1,014 – 1,014
Intersegment elimination (56) – (56) (63) – (63) (69) – (69) (76) – (76)
Total revenue $ 3,639 – $ 3,639 $ 3,954 – $ 3,954 $ 4,450 – $ 4,450 $ 4,875 – $ 4,875
Standard & Poor’s Ratings Services 933 7 940 1,047 (9) 1,039 1,185 (16) 1,169 1,316 6 1,322
S&P Capital IQ 745 – 745 817 – 817 916 (20) 897 982 (12) 969
S&P Dow Jones Indices 129 – 129 134 – 134 176 (22) 154 227 – 227
Commodities & Commercial Markets 658 (11) 648 716 (6) 710 725 (12) 712 701 1 702
Intersegment elimination (56) – (56) (63) – (63) (69) – (69) (76) – (76)
Total expenses $ 2,409 $ (3) $ 2,406 $ 2,651 $ (15) $ 2,637 $ 2,933 $ (70) $ 2,863 $ 3,150 $ (5) $ 3,144
Standard & Poor’s Ratings Services 762 (7) 755 720 9 728 849 16 865 958 (6) 952
S&P Capital IQ 171 – 171 214 – 214 208 20 228 189 12 201
S&P Dow Jones Indices 144 – 144 189 – 189 212 22 234 266 – 266
Commodities & Commercial Markets 153 11 163 180 6 186 248 12 260 313 (1) 312
Total segment operating profit $ 1,230 $ 3 $ 1,233 $ 1,303 $ 15 $ 1,318 $ 1,517 $ 70 $ 1,587 $ 1,726 $ 5 $ 1,731
Unallocated income/(expense) (204) 16 (188) (226) 27 (198) (306) 104 (202) (321) 192 (129)
Total operating profit 1,026 19 1,045 1,077 42 1,119 1,211 174 1,385 1,405 197 1,602
Interest (expense), net (83) – (83) (77) – (77) (81) – (81) (59) – (59)
Income from continuing operations before taxes on income 943 19 962 1,000 42 1,042 1,130 174 1,304 1,346 197 1,543
Provision for taxes on income 344 7 351 374 15 389 404 65 469 443 82 525
Effective tax rate 36.5% – 36.5% 37.4% – 37.3% 35.8% – 36.0% 32.9% – 34.0%
Income from continuing operations 599 12 611 626 27 653 726 109 835 903 115 1,018
Less: net income attributable to noncontrolling interests (19) 2 (17) (19) – (19) (50) (2) (52) (91) 4 (87)
Net income attributable to McGraw Hill Financial from continuing operations $ 581 $ 14 $ 594 $ 607 $ 27 $ 634 $ 676 $ 107 $ 783 $ 812 $ 119 $ 931
Diluted weighted average shares outstanding 312.2 – 312.2 303.6 – 303.6 284.6 – 284.6 279.8 – 279.8
Diluted earnings per share from continuing operations $ 1.86 $ 0.04 $ 1.90 $ 2.00 $ 0.09 $ 2.09 $ 2.37 $ 0.38 $ 2.75 $ 2.90 $ 0.43 $ 3.33
Standard & Poor’s Ratings Services 45.0% – 44.5% 40.7% – 41.2% 41.7% – 42.5% 42.1% – 41.9%
S&P Capital IQ 18.7% – 18.7% 20.8% – 20.8% 18.5% – 20.3% 16.1% – 17.2%
S&P Dow Jones Indices 52.7% – 52.7% 58.5% – 58.5% 54.6% – 60.3% 53.9% – 54.0%
Commodities & Commercial Markets 18.9% – 20.1% 20.1% – 20.8% 25.5% – 26.8% 30.8% – 30.8%
Total segment operating margin 33.8% – 33.9% 33.0% – 33.3% 34.1% – 35.7% 35.4% – 35.5%

66 McGraw Hill Financial
Notes

“Safe Harbor” Statement Under the Private Securities Litigation Reform Act of 1995This document contains forward- looking statements, including without-limitation statements relating to McGraw Hill Financial’s businesses and prospects, new products, sales, expenses, tax rates, cash flows, and operating and capital requirements that are made pursuant to the safe harbor provisions of the Private Securities Litigation Reform Act of 1995. These forward-looking statements are intended to provide management’s current expectations or plans for the Company’s future operating and financial performance and are based on assumptions management believes are reasonable at the time they are made.
Forward-looking statements can be identified by the use of words such as “believe,” “expect,” “plan,” “estimate,” “project,” “target,” “anticipate,” “intend,” “may,” “will,” “continue,” and other words of similar meaning in connection with a discussion of future operating or financial performance. These statements are not guarantees of future performance and involve certain risks, uncertainties, and assumptions that are difficult to predict; therefore, actual outcomes and results could differ materially from what is expected or forecasted. These risks and uncertainties include, among others:• worldwide economic, financial,
political, and regulatory conditions;• currency and foreign exchange
volatility;• the effect of competitive products
and pricing;• the level of success of new product
development and global expansion;• the level of future cash flows;
• the levels of capital investments;• income tax rates;• restructuring charges;• the health of debt and equity markets,
including credit quality and spreads, the level of liquidity, and future debt issuances;
• the level of interest rates and the strength of the capital markets in the U.S. and abroad;
• the demand and market for debt ratings, including collateralized debt obligations, residential and commercial mortgage- and asset-backed securities, and related asset classes;
• the state of the credit markets and their impact on Standard & Poor’s Ratings Services and the economy in general;
• the regulatory environment affecting Standard & Poor’s Ratings Services and the Company’s other businesses;
• the likely outcome and impact of litigation and investigations on the Company’s operations and financial condition;
• the level of merger and acquisition activity in the U.S. and abroad;
• continued investment by the construction, automotive, and computer industries;
• the strength and performance of the domestic and international automotive markets;
• the volatility of the energy marketplace; and
• the contract value of public works, manufacturing, and single-family unit construction.
The Company cautions readers not to place undue reliance on forward-looking statements.
EU Regulation Affecting Investors in Credit Rating AgenciesEuropean Union Regulation 1060/2009 (as amended) applies to credit rating agencies (CRAs) registered in the European Union and therefore to the activities of Standard & Poor’s Credit Market Services Europe Limited, Standard & Poor’s Credit Market Services France SAS, and Standard & Poor’s Credit Market Services Italy Srl (collectively, “Standard & Poor’s”), indirect wholly owned subsidiaries of McGraw Hill Financial, Inc., each of which is registered and regulated as a CRA with the European Securities and Markets Authority (“ESMA”).
Any person obtaining direct or indirect ownership or control of 5% or more or 10% or more of the shares in McGraw Hill Financial, Inc. may (i) impact how Standard & Poor’s can conduct its CRA activities in the European Union and/or (ii) themselves become directly impacted by EU Regulation 1060/2009 (as amended). Persons who have or expect to obtain such shareholdings in McGraw Hill Financial, Inc. should promptly contact Chip Merritt at McGraw Hill Financial’s Investor Relations department ([email protected]) for more information and should also obtain independent legal advice in such respect.
McGraw Hill Financial, Inc.1221 Avenue of the AmericasNew York, NY [email protected]://investor.mhfi.com
Robert (Chip) S. MerrittVice President, Investor [email protected] 512 4321 Tel212 512 3840 Fax
Celeste M. HughesSenior Manager, Communications & Shareholder RelationsInvestor [email protected] 512 2192 Tel
August 2014
Des
ign
by A
lexa
nder
Des
ign
Ass
ocia
tes
Inc.
ww
w.a
lexa
nder
desi
gn.c
om

Investor Relations1221 Avenue of the AmericasNew York, NY 10020-1095212 512 4321 Tel212 512 3840 [email protected]://investor.mhfi.com
United States
Canada
Argentina
Brazil
Russia
ItalyNorway
Spain
Israel
France
Poland
India
China
Australia
South Africa
Germany
Switzerland
Belgium
Mexico
Thailand
Sweden
United Kingdom
Japan
Hong Kong
S. Korea
Singapore
UAEPhilippines
Taiwan
Malaysia
McGraw Hill Financial has approximately 18,000 employees in 30 countries serving the global capital, commodity, and corporate markets
Copyright © 2022 FDOKUMEN