FACT BOOK - 2018 - Institutional Research & Planning
78
FACT BOOK 2018
-
Upload
khangminh22 -
Category
Documents
-
view
0 -
download
0
Transcript of FACT BOOK - 2018 - Institutional Research & Planning

FACT BOOK
2018

Admissions Freshman Admissions by Year and College, Fall Terms ..................................................................................................... 2
Freshman Admissions by Year and Demographic, Fall Terms .......................................................................................... 3
Average SAT Scores for Freshman Cohorts ............................................................................................................................ 4
Average ACT Scores for Freshman Cohorts ........................................................................................................................... 4
Transfer Admissions by Year and College, Fall Terms ........................................................................................................ 5
Transfer Admissions by Year and Demographic, Fall Terms ............................................................................................ 6
Graduate Admissions by Year and College, Fall Terms ....................................................................................................... 7
Graduate Admissions by Year and Demographic, Fall Terms............................................................................................ 8
Enrollment Fall Enrollment by Level, Class, and Gender, Three-Term History ................................................................................. 10
Fall Enrollment by Class and Level ........................................................................................................................................ 11
Fall Undergraduate Enrollment by College and Major ....................................................................................................... 12
Fall Undergraduate Enrollment by College and Major, Ten-Term History ..................................................................... 13
Fall Graduate Enrollment by College and Major ................................................................................................................. 15
Fall Graduate Enrollment by College and Major, Ten-Term History ............................................................................... 16
Graduate Enrollment by Degree Program, Fall Terms ....................................................................................................... 18
Fall Enrollment by Country of Residence ............................................................................................................................. 19
Fall Enrollment by State of Residence ................................................................................................................................... 22
Fall Enrollment by Georgia County of Residence ............................................................................................................... 24
Degrees Conferred
Summary of Degrees Conferred by College and Degree Level, Ten-Year History ....................................................... 28
Bachelor’s Degrees Conferred by College, Ten-Year History ............................................................................................ 29
Master’s Degrees Conferred by College, Ten-Year History ................................................................................................ 31
Ph.D. Degrees Conferred by College, Ten-Year History ...................................................................................................... 34
Degrees Conferred by College, Ethnicity and Gender ....................................................................................................... 36
Degrees Conferred by Country of Residence ....................................................................................................................... 37
Degrees Conferred by State of Residence ............................................................................................................................. 39
Degrees Conferred by Georgia County of Residence ......................................................................................................... 41
Institute Information
Additional Student Information Student Grades by College & Percent ...............................................................................................................................44
Student Semester Credit Hours Earned by College & Division .................................................................................. 45
Retention Rates for Entering Freshmen .......................................................................................................................... 46
Graduation Rates for Entering Freshmen ....................................................................................................................... 47
2018

Additional Student Information (Continued) Alumni ................................................................................................................................................................................... 48
Career Discovery & Development ..................................................................................................................................... 49
Experiential Learning ......................................................................................................................................................... 50
International Programs (Study Abroad) .......................................................................................................................... 50
Facilities Housing .................................................................................................................................................................................. 54
Library .................................................................................................................................................................................... 54
Space ....................................................................................................................................................................................... 54
Finance Tuition and Fees ................................................................................................................................................................... 55
Financial Aid......................................................................................................................................................................... 55
Institute Finances ................................................................................................................................................................ 56
Institute Research Proposals, Awards and Sponsored Programs ............................................................................................................... 57
Enterprise Innovation Institute ........................................................................................................................................60
Faculty Faculty by Gender ................................................................................................................................................................ 61
Faculty by Race/Ethnicity .................................................................................................................................................. 62
Faculty by Tenure/Tenure-Track ...................................................................................................................................... 63
Georgia Tech Organizational Charts Chart A: Office of the President ......................................................................................................................................64
Chart B: Provost and Executive Vice President for Academic Affairs ..................................................................... 65
Chart C: Degree Granting Schools and Departments ................................................................................................. 66
Chart D: Executive Vice President for Administration and Finance ....................................................................... 67
Chart E: Executive Vice President for Research ............................................................................................................ 68
Chart F: Student Life ........................................................................................................................................................... 69
Chart G: Development ........................................................................................................................................................ 70
Chart H: Institute Communications ............................................................................................................................... 71
Chart I: Institute Diversity ................................................................................................................................................ 72
Chart J: Georgia Tech Athletic Association ................................................................................................................... 73
Office of Institutional Research and PlanningGeorgia Institute of Technology
Atlanta, GA 3032-0530404-894-3311
www.irp.gatech.edu

Georgia Institute of TechnologyVision and Mission Statements
AccreditationThe Georgia Institute of Technology is accredited by the Southern Association of Colleges and Schools Commission on Colleges to award baccalaureate, masters, and doctoral degrees. Contact the Southern Association of Colleges and Schools Commission on Colleges at:
Southern Association of Colleges and SchoolsCommission on Colleges1866 Southern LaneDecatur, Georgia 30033-4097
Telephone number: 404-679-4500Website: www.sacscoc.org
for questions about the accreditation of the Georgia Institute of Technology. In addition, many Institute programs are specifically accredited by professional certifying agencies.
Mission
Technological change is fundamental to the advancement of the human condition. The Georgia Tech community—students, staff, faculty, and alumni—will realize our motto of “Progress and Service” through effectiveness and innovation in teaching and learning, our research advances, and entrepreneurship in all sectors of society. We sill be leaders in improving the human condition in Georgia, the United States, and around the globe.
Vision
Georgia Tech will define the technological research university of the twenty-first century. As a result, we will be leaders in influencing major technological, social, and policy decisions that address critical global challenges. “What does Georgia Tech think?” will be a common question in research, business, the media, and government.
College of DesignAmerican Council for Construction EducationNational Architectural Accrediting BoardInternational Facility Management Association (IFMA) Foundation Planning Accreditation BoardNational Association of Schools in Art and Design
College of ComputingComputing Accreditation Commission of ABET
College of EngineeringCommission on Accreditation of Medical Physics Educational ProgramsEngineering Accreditation Commission of ABET
College of SciencesAmerican Chemical SocietyHuman Factors and Ergonomics Society
Scheller College of BusinessAssociation to Advance Collegiate Schools of Business International
Georgia Tech Counseling CenterAmerican Psychology Association (APA)International Association of Counseling Services (IACS)
Georgia Tech Language InstituteCommission on English Language Program Accreditation (CEA)
Georgia Tech Police DepartmentCommission on Accreditation for Law Enforcement Agencies (CALEA)
Professional accreditations:

2018 Fact BookAdmissions
Term CollegeNumberApplied
NumberAccepted
%AppliedAccepted
NumberEnrolled
%AcceptedEnrolled
Fall 2014 College of Computing
College of Design
College of Engineering
College of Sciences
Ivan Allen College
Scheller College of Business
TotalFall 2015 College of Computing
College of Design
College of Engineering
College of Sciences
Ivan Allen College
Scheller College of Business
TotalFall 2016 College of Computing
College of Design
College of Engineering
College of Sciences
Ivan Allen College
Scheller College of Business
TotalFall 2017 College of Computing
College of Design
College of Engineering
College of Sciences
Ivan Allen College
Scheller College of Business
TotalFall 2018 College of Computing
College of Design
College of Engineering
College of Sciences
Ivan Allen College
Scheller College of Business
Total
32.6%
57.2%
40.5%
30.2%
31.3%
42.4%
32.4%
2,811
155
123
306
1,881
61
285
33.3%
26.6%
32.8%
28.6%
35.2%
30.1%
31.2%
8,623
271
304
1,013
6,011
144
880
25,867
1,019
927
3,546
17,077
478
2,820
35.3%
58.4%
46.9%
28.9%
35.0%
39.4%
32.7%
3,091
164
182
303
2,004
67
371
32.1%
25.3%
36.0%
28.2%
33.6%
35.7%
29.7%
8,757
281
388
1,049
5,733
170
1,136
27,264
1,110
1,078
3,723
17,049
476
3,828
36.6%
54.3%
43.6%
34.4%
35.7%
44.2%
33.7%
2,876
171
175
384
1,745
80
321
25.7%
25.7%
29.7%
29.2%
26.4%
30.6%
19.0%
7,859
315
401
1,115
4,894
181
953
30,531
1,224
1,348
3,821
18,543
592
5,003
39.0%
52.9%
43.8%
38.6%
38.6%
46.6%
31.1%
2,862
183
188
479
1,622
111
279
23.3%
27.0%
35.5%
30.0%
22.6%
33.7%
16.2%
7,347
346
429
1,240
4,197
238
897
31,479
1,280
1,207
4,140
18,610
707
5,535
39.0%
44.4%
42.1%
36.7%
39.3%
44.0%
36.7%
3,136
166
192
512
1,740
109
417
22.6%
24.3%
31.9%
27.7%
22.3%
27.8%
16.6%
8,037
374
456
1,394
4,430
248
1,135
35,611
1,541
1,431
5,024
19,878
892
6,845
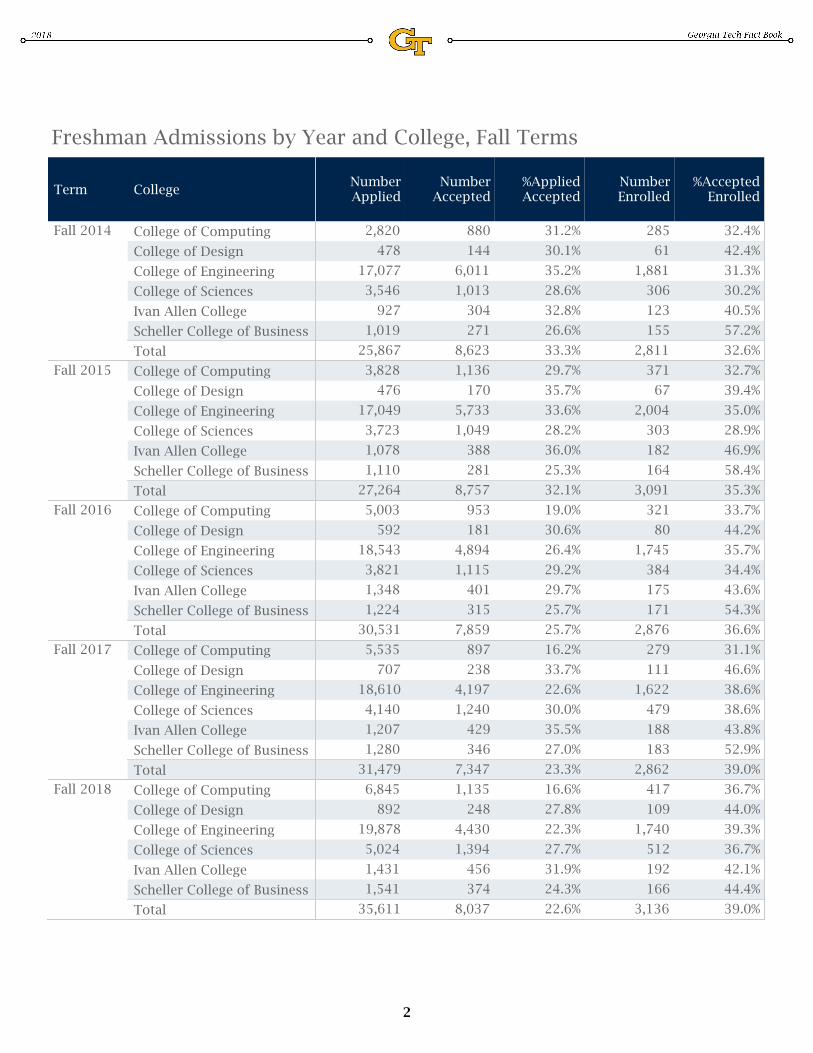
Freshman Admissions by Year and College, Fall Terms
2

Term Demographic
Number Applied
Male Female
NumberAccepted
Male Female
%AppliedAccepted
Male Female
Number Enrolled
Male Female
%AcceptedEnrolled
Male FemaleFall 2014 Asian
Black or African American
Hispanic or Latino
American Indian or Alaska Native
Native Hawaiian or Other Pacific Islander
Two or more
Unknown
White
International
TotalFall 2015 Asian
Black or African American
Hispanic or Latino
American Indian or Alaska Native
Native Hawaiian or Other Pacific Islander
Two or more
Unknown
White
International
TotalFall 2016 Asian
Black or African American
Hispanic or Latino
American Indian or Alaska Native
Native Hawaiian or Other Pacific Islander
Two or more
Unknown
White
International
TotalFall 2017 Asian
Black or African American
Hispanic or Latino
American Indian or Alaska Native
Native Hawaiian or Other Pacific Islander
Two or more
Unknown
White
International
TotalFall 2018 Asian
Black or African American
Hispanic or Latino
American Indian or Alaska Native
Native Hawaiian or Other Pacific Islander
Two or more
Unknown
White
International
Total
7,824
1,509
2,972
257
311
7
5
582
782
1,399
18,043
4,309
6,807
638
575
10
14
1,325
1,168
3,197
3,219
275
1,562
122
141
3
217
185
714
5,404
569
2,475
253
187
4
4
390
252
1,270
41.1%
18.2%
52.6%
47.5%
45.3%
42.9%
37.3%
23.7%
51.0%
30.0%
13.2%
36.4%
39.7%
32.5%
40.0%
28.6%
29.4%
21.6%
39.7%
1,079
61
579
34
48
1
70
60
226
1,732
177
848
56
71
1
115
88
376
33.5%
22.2%
37.1%
27.9%
34.0%
33.3%
32.3%
32.4%
31.7%
32.1%
31.1%
34.3%
22.1%
38.0%
25.0%
29.5%
34.9%
29.6%
8,248
1,653
2,784
546
313
3
9
567
854
1,519
19,016
4,583
6,377
1,219
580
11
18
1,378
1,337
3,513
3,478
325
1,521
261
143
1
2
238
207
780
5,279
500
2,137
413
199
2
1
442
301
1,284
42.2%
19.7%
54.6%
47.8%
45.7%
33.3%
22.2%
42.0%
24.2%
51.3%
27.8%
10.9%
33.5%
33.9%
34.3%
18.2%
5.6%
32.1%
22.5%
36.5%
1,279
82
650
77
45
1
70
85
269
1,812
150
871
103
70
1
122
115
380
36.8%
25.2%
42.7%
29.5%
31.5%
50.0%
29.4%
41.1%
34.5%
34.3%
30.0%
40.8%
24.9%
35.2%
100.0%
27.6%
38.2%
29.6%
9,495
1,712
3,367
553
341
5
13
715
935
1,854
21,036
4,759
7,595
1,178
634
11
20
1,540
1,300
3,999
3,238
263
1,450
226
115
2
241
210
731
4,621
433
2,021
364
169
3
2
358
219
1,052
34.1%
15.4%
43.1%
40.9%
33.7%
15.4%
33.7%
22.5%
39.4%
22.0%
9.1%
26.6%
30.9%
26.7%
27.3%
10.0%
23.2%
16.8%
26.3%
1,189
80
609
52
45
1
77
86
239
1,687
162
816
105
54
106
98
346
36.7%
30.4%
42.0%
23.0%
39.1%
50.0%
32.0%
41.0%
32.7%
36.5%
37.4%
40.4%
28.8%
32.0%
29.6%
44.7%
32.9%
9,618
1,772
3,401
475
372
5
11
763
945
1,874
21,861
5,002
7,751
1,102
723
17
15
1,647
1,385
4,219
3,087
210
1,403
180
128
1
245
254
666
4,260
401
1,862
300
157
2
334
242
962
32.1%
11.9%
41.3%
37.9%
34.4%
9.1%
32.1%
26.9%
35.5%
19.5%
8.0%
24.0%
27.2%
21.7%
11.8%
20.3%
17.5%
22.8%
1,243
59
628
55
49
95
101
256
1,619
102
840
90
62
1
105
100
319
40.3%
28.1%
44.8%
30.6%
38.3%
38.8%
39.8%
38.4%
38.0%
25.4%
45.1%
30.0%
39.5%
50.0%
31.4%
41.3%
33.2%
11,152
1,774
3,968
207
495
9
6
922
1,067
2,704
24,459
5,011
9,048
472
923
7
21
1,952
1,539
5,486
3,281
351
1,358
52
165
1
1
274
249
830
4,756
700
1,906
76
192
4
385
261
1,232
29.4%
19.8%
34.2%
25.1%
33.3%
11.1%
16.7%
29.7%
23.3%
30.7%
19.4%
14.0%
21.1%
16.1%
20.8%
19.0%
19.7%
17.0%
22.5%
1,272
125
582
15
69
97
91
293
1,864
256
846
18
60
1
126
123
434
38.8%
35.6%
42.9%
28.8%
41.8%
35.4%
36.5%
35.3%
39.2%
36.6%
44.4%
23.7%
31.3%
25.0%
32.7%
47.1%
35.2%
Freshman Admissions by Year and Demographic, Fall Terms
3

Cohort SAT Reading SAT Math SAT Composite
Fall 2009
Fall 2010
Fall 2011
Fall 2012
Fall 2013
Fall 2014
Fall 2015
Fall 2016
Fall 2017
Fall 2018 1426
1412
1379
1376
1370
1357
1335
1323
1312
1306
727
720
709
709
706
705
697
687
682
684
699
693
670
667
664
652
638
636
630
622
Average SAT Scores for Freshman Cohorts
Note: Prior year Fact Books reported the average for re-centered SAT scoreswhich included converted ACT scores for those students who opted to take theACT instead of the SAT.
Cohort ACT Reading ACT Math ACT Composite
Fall 2009
Fall 2010
Fall 2011
Fall 2012
Fall 2013
Fall 2014
Fall 2015
Fall 2016
Fall 2017
Fall 2018 32
32
32
31
31
30
30
30
29
29
32
31
31
31
31
31
31
31
30
30
32
32
32
31
31
30
29
29
28
28
Average ACT Scores for Freshman Cohorts
4

Term CollegeNumberApplied
NumberAccepted
%AppliedAccepted
NumberEnrolled
%AcceptedEnrolled
Fall 2014 College of Computing
College of Design
College of Engineering
College of Sciences
Ivan Allen College
Scheller College of Business
TotalFall 2015 College of Computing
College of Design
College of Engineering
College of Sciences
Ivan Allen College
Scheller College of Business
TotalFall 2016 College of Computing
College of Design
College of Engineering
College of Sciences
Ivan Allen College
Scheller College of Business
TotalFall 2017 College of Computing
College of Design
College of Engineering
College of Sciences
Ivan Allen College
Scheller College of Business
TotalFall 2018 College of Computing
College of Design
College of Engineering
College of Sciences
Ivan Allen College
Scheller College of Business
Total
77.5%
94.3%
100.0%
65.3%
77.7%
92.3%
66.1%
499
33
15
32
370
12
37
39.1%
29.7%
27.8%
31.6%
43.7%
30.2%
29.9%
644
35
15
49
476
13
56
1,647
118
54
155
1,090
43
187
81.0%
94.7%
85.7%
61.4%
81.8%
94.4%
80.0%
482
36
18
35
332
17
44
33.0%
34.2%
32.3%
33.9%
34.6%
46.2%
22.4%
595
38
21
57
406
18
55
1,801
111
65
168
1,173
39
245
85.0%
90.9%
91.3%
72.4%
86.7%
95.5%
78.3%
585
30
21
55
411
21
47
36.7%
32.4%
39.0%
43.7%
39.0%
62.9%
20.5%
688
33
23
76
474
22
60
1,876
102
59
174
1,214
35
292
88.0%
95.2%
83.9%
83.7%
87.2%
95.7%
93.0%
635
40
26
72
409
22
66
37.7%
33.6%
42.5%
41.1%
42.6%
39.7%
20.3%
722
42
31
86
469
23
71
1,916
125
73
209
1,102
58
349
88.9%
96.9%
89.2%
86.3%
86.5%
91.4%
97.3%
539
31
66
63
276
32
71
29.3%
26.9%
49.0%
27.1%
30.4%
59.3%
17.4%
606
32
74
73
319
35
73
2,068
119
151
269
1,051
59
419
Transfer Admissions by Year and College, Fall Terms
5

Term Demographic
Number Applied
Male Female
NumberAccepted
Male Female
%AppliedAccepted
Male Female
Number Enrolled
Male Female
%AcceptedEnrolled
Male FemaleFall 2014 Asian
Black or African American
Hispanic or Latino
American Indian or Alaska Native
Two or more
Unknown
White
International
TotalFall 2015 Asian
Black or African American
Hispanic or Latino
American Indian or Alaska Native
Native Hawaiian or Other Pacific Islander
Two or more
Unknown
White
International
TotalFall 2016 Asian
Black or African American
Hispanic or Latino
American Indian or Alaska Native
Native Hawaiian or Other Pacific Islander
Two or more
Unknown
White
International
TotalFall 2017 Asian
Black or African American
Hispanic or Latino
American Indian or Alaska Native
Native Hawaiian or Other Pacific Islander
Two or more
Unknown
White
International
TotalFall 2018 Asian
Black or African American
Hispanic or Latino
American Indian or Alaska Native
Native Hawaiian or Other Pacific Islander
Two or more
Unknown
White
International
Total
404
156
118
9
30
41
50
1,243
390
441
4
37
1
102
105
163
148
44
51
3
17
13
20
496
95
234
1
14
41
45
66
36.6%
28.2%
43.2%
33.3%
56.7%
31.7%
40.0%
39.9%
24.4%
53.1%
25.0%
37.8%
40.2%
42.9%
40.5%
107
31
37
2
13
10
14
392
60
204
11
25
34
58
72.3%
70.5%
72.5%
66.7%
76.5%
76.9%
70.0%
79.0%
63.2%
87.2%
78.6%
61.0%
75.6%
87.9%
477
187
143
1
14
38
46
48
1,324
378
484
3
42
2
1
98
109
207
183
46
69
4
20
25
19
412
80
176
12
36
38
70
38.4%
24.6%
48.3%
28.6%
52.6%
54.3%
39.6%
31.1%
21.2%
36.4%
28.6%
36.7%
34.9%
33.8%
138
32
59
3
12
18
14
344
53
166
11
24
31
59
75.4%
69.6%
85.5%
75.0%
60.0%
72.0%
73.7%
83.5%
66.3%
94.3%
91.7%
66.7%
81.6%
84.3%
490
177
141
2
11
35
51
73
1,386
420
487
3
48
1
2
108
104
213
196
38
79
5
13
23
38
492
55
251
16
1
46
45
78
40.0%
21.5%
56.0%
45.5%
37.1%
45.1%
52.1%
35.5%
13.1%
51.5%
33.3%
50.0%
42.6%
43.3%
36.6%
158
22
67
5
13
17
34
427
38
234
15
36
35
69
80.6%
57.9%
84.8%
100.0%
100.0%
73.9%
89.5%
86.8%
69.1%
93.2%
93.8%
78.3%
77.8%
88.5%
468
136
132
2
18
1
40
43
96
1,448
427
504
6
45
2
2
110
96
256
204
34
71
13
1
16
13
56
518
53
262
1
18
1
1
44
40
98
43.6%
25.0%
53.8%
72.2%
100.0%
40.0%
30.2%
58.3%
35.8%
12.4%
52.0%
16.7%
40.0%
50.0%
50.0%
40.0%
41.7%
38.3%
180
26
68
12
1
14
10
49
455
39
241
1
18
1
1
36
36
82
88.2%
76.5%
95.8%
92.3%
100.0%
87.5%
76.9%
87.5%
87.8%
73.6%
92.0%
100.0%
100.0%
100.0%
100.0%
81.8%
90.0%
83.7%
569
155
178
3
36
43
50
104
1,499
455
479
6
63
3
3
122
90
278
176
8
79
13
18
13
45
430
20
209
2
19
1
39
27
113
30.9%
5.2%
44.4%
36.1%
41.9%
26.0%
43.3%
28.7%
4.4%
43.6%
33.3%
30.2%
33.3%
32.0%
30.0%
40.6%
144
4
65
11
17
7
40
395
17
188
2
18
1
33
25
111
81.8%
50.0%
82.3%
84.6%
94.4%
53.8%
88.9%
91.9%
85.0%
90.0%
100.0%
94.7%
100.0%
84.6%
92.6%
98.2%
Transfer Admissions by Year and Demographic, Fall Terms
6

Term CollegeNumberApplied
NumberAccepted
%AppliedAccepted
NumberEnrolled
%AcceptedEnrolled
Fall 2014 College of Computing
College of Design
College of Engineering
College of Sciences
Ivan Allen College
Scheller College of Business
TotalFall 2015 College of Computing
College of Design
College of Engineering
College of Sciences
Ivan Allen College
Scheller College of Business
TotalFall 2016 College of Computing
College of Design
College of Engineering
College of Sciences
Ivan Allen College
Scheller College of Business
TotalFall 2017 College of Computing
College of Design
College of Engineering
College of Sciences
Ivan Allen College
Scheller College of Business
TotalFall 2018 College of Computing
College of Design
College of Engineering
College of Sciences
Ivan Allen College
Scheller College of Business
Total
55.8%
67.9%
45.0%
45.6%
50.2%
34.6%
73.4%
2,986
290
67
194
1,291
143
1,001
32.3%
38.1%
40.3%
25.9%
31.3%
58.5%
30.3%
5,347
427
149
425
2,570
413
1,363
16,547
1,120
370
1,642
8,212
706
4,497
53.5%
60.6%
44.4%
45.6%
46.0%
39.9%
69.6%
2,952
322
83
202
1,071
185
1,089
31.6%
33.5%
51.8%
26.9%
28.3%
64.4%
31.9%
5,516
531
187
443
2,327
464
1,564
17,457
1,586
361
1,645
8,236
721
4,908
55.6%
58.2%
39.8%
45.8%
47.6%
36.7%
75.3%
3,626
332
84
233
1,308
191
1,478
33.6%
33.7%
54.0%
28.6%
31.5%
57.8%
33.2%
6,520
570
211
509
2,746
520
1,964
19,393
1,691
391
1,780
8,711
900
5,920
60.1%
60.1%
42.0%
48.4%
48.3%
34.0%
79.6%
4,792
327
86
238
1,514
178
2,449
34.8%
29.9%
51.1%
27.3%
30.5%
58.6%
39.9%
7,974
544
205
492
3,132
523
3,078
22,897
1,817
401
1,804
10,272
892
7,711
65.0%
63.9%
44.2%
48.8%
56.3%
37.0%
80.0%
5,770
352
102
207
1,927
187
2,995
37.1%
30.8%
49.0%
23.1%
33.9%
56.0%
42.4%
8,879
551
231
424
3,424
505
3,744
23,910
1,788
471
1,839
10,089
902
8,821
Graduate Admissions by Year and College, Fall Terms
7

Term Demographic
Number Applied
Male Female
NumberAccepted
Male Female
%AppliedAccepted
Male Female
Number Enrolled
Male Female
%AcceptedEnrolled
Male FemaleFall 2014 Asian
Black or African American
Hispanic or Latino
American Indian or Alaska Native
Native Hawaiian or Other Pacific Islander
Two or more
Unknown
White
International
Null
TotalFall 2015 Asian
Black or African American
Hispanic or Latino
American Indian or Alaska Native
Native Hawaiian or Other Pacific Islander
Two or more
Unknown
White
International
TotalFall 2016 Asian
Black or African American
Hispanic or Latino
American Indian or Alaska Native
Native Hawaiian or Other Pacific Islander
Two or more
White
International
TotalFall 2017 Asian
Black or African American
Hispanic or Latino
American Indian or Alaska Native
Native Hawaiian or Other Pacific Islander
Two or more
White
International
TotalFall 2018 Asian
Black or African American
Hispanic or Latino
American Indian or Alaska Native
Native Hawaiian or Other Pacific Islander
Two or more
Unknown
White
International
Total
3,907
2,681
669
52
2
5
114
153
231
10,651
1
7,226
2,139
1
127
6
5
242
252
652
1,298
658
383
23
1
2
55
64
112
3,418
1,485
1,295
67
4
2
117
108
340
33.2%
24.5%
57.2%
44.2%
50.0%
40.0%
48.2%
41.8%
48.5%
32.1%
20.6%
60.5%
52.8%
66.7%
40.0%
48.3%
42.9%
52.1%
633
314
186
11
1
30
39
52
1,948
802
773
41
2
1
77
70
182
48.8%
47.7%
48.6%
47.8%
50.0%
54.5%
60.9%
46.4%
57.0%
54.0%
59.7%
61.2%
50.0%
50.0%
65.8%
64.8%
53.5%
4,313
3,078
690
56
119
151
219
11,046
7,765
2,020
3
127
1
6
240
248
636
1,421
724
423
32
61
59
122
3,354
1,467
1,245
1
75
1
4
124
111
326
32.9%
23.5%
61.3%
57.1%
51.3%
39.1%
55.7%
30.4%
18.9%
61.6%
33.3%
59.1%
100.0%
66.7%
51.7%
44.8%
51.3%
655
319
197
17
30
29
63
1,826
714
729
1
35
1
2
64
82
198
46.1%
44.1%
46.6%
53.1%
49.2%
49.2%
51.6%
54.4%
48.7%
58.6%
100.0%
46.7%
100.0%
50.0%
51.6%
73.9%
60.7%
4,631
3,268
742
66
109
141
305
10,898
7,420
2,094
127
3
2
289
255
708
1,573
796
465
36
58
57
161
3,691
1,576
1,342
80
2
1
164
121
405
34.0%
24.4%
62.7%
54.5%
53.2%
40.4%
52.8%
33.9%
21.2%
64.1%
63.0%
66.7%
50.0%
56.7%
47.5%
57.2%
760
354
241
17
28
38
82
2,050
759
825
53
1
87
88
237
48.3%
44.5%
51.8%
47.2%
48.3%
66.7%
50.9%
55.5%
48.2%
61.5%
66.3%
50.0%
53.0%
72.7%
58.5%
5,103
3,451
838
85
1
130
175
423
12,418
7,831
2,717
174
2
8
417
285
984
1,792
875
512
47
77
68
213
4,336
1,620
1,702
102
2
5
228
132
545
35.1%
25.4%
61.1%
55.3%
59.2%
38.9%
50.4%
34.9%
20.7%
62.6%
58.6%
100.0%
62.5%
54.7%
46.3%
55.4%
833
356
263
16
38
46
114
2,687
864
1,159
64
1
3
160
90
346
46.5%
40.7%
51.4%
34.0%
49.4%
67.6%
53.5%
62.0%
53.3%
68.1%
62.7%
50.0%
60.0%
70.2%
68.2%
63.5%
5,420
3,565
949
26
85
170
198
427
12,732
7,721
2,891
82
201
5
2
433
269
1,128
1,891
813
588
14
54
90
86
246
4,795
1,690
1,848
48
114
3
258
145
689
34.9%
22.8%
62.0%
53.8%
63.5%
52.9%
43.4%
57.6%
37.7%
21.9%
63.9%
58.5%
56.7%
60.0%
59.6%
53.9%
61.1%
1,038
414
320
7
32
52
52
161
3,123
1,014
1,249
24
76
3
181
94
482
54.9%
50.9%
54.4%
50.0%
59.3%
57.8%
60.5%
65.4%
65.1%
60.0%
67.6%
50.0%
66.7%
100.0%
70.2%
64.8%
70.0%
Graduate Admissions by Year and Demographic, Fall Terms
8

2018 Fact BookEnrollment

Level Class
Fall 2016
Male Female Total
Fall 2017
Male Female Total
Fall 2018
Male Female TotalUndergraduateFreshman
Sophomore
Junior
Senior
JEPHS*
Special Undergraduate
TotalGraduate Masters
Ph.D.
Special Graduate
Total
Institute Total
15,489
247
476
5,643
3,579
3,269
2,275
5,662
88
151
1,816
1,261
1,345
1,001
9,827
159
325
3,827
2,318
1,924
1,274
15,573
235
527
5,752
3,699
3,087
2,273
5,914
79
182
1,965
1,372
1,287
1,029
9,659
156
345
3,787
2,327
1,800
1,244
16,047
287
550
6,030
3,657
3,257
2,266
6,116
85
176
2,162
1,389
1,296
1,008
9,931
202
374
3,868
2,268
1,961
1,258
11,350
67
3,414
7,869
2,621
24
911
1,686
8,729
43
2,503
6,183
13,803
68
3,447
10,288
3,164
27
969
2,168
10,639
41
2,478
8,120
16,675
73
3,500
13,102
3,871
21
1,005
2,845
12,804
52
2,495
10,257
26,8398,28318,556 29,3769,07820,298 32,7229,98722,735
Fall Enrollment by Level, Class, and Gender, Three-Term History
*JEPHS: Joint Enrollment Program for High School Students
10

Race-Ethnicity Gender
Undergraduate
Freshman Sophomore Junior Senior JEPHS*Special Undergraduate Total
Graduate
Masters Ph.D.SpecialGraduate Total
Institute Total
Asian Female
Male
TotalBlack or AfricanAmerican
Female
Male
TotalHispanic or Latino Female
Male
TotalInternational Female
Male
TotalTwo or more Female
Male
TotalWhite Female
Male
TotalOther Female
Male
Total
Institute Total
3,590
2,189
1,401
9
7
2
307
203
104
1,373
863
510
809
494
315
714
433
281
378
189
189
2,309
1,721
588
8
3
5
285
198
87
2,016
1,520
496
5,899
3,910
1,989
1,117
652
465
34
20
14
21
14
7
372
229
143
257
146
111
215
120
95
218
123
95
592
398
194
2
2
102
54
48
488
344
144
1,709
1,050
659
1,137
690
447
14
5
9
20
10
10
426
278
148
260
168
92
238
134
104
179
95
84
852
681
171
3
3
133
86
47
716
592
124
1,989
1,371
618
1,519
1,050
469
140
103
37
9
7
2
524
361
163
298
212
86
205
140
65
343
227
116
6,270
4,583
1,687
33
23
10
1,804
1,300
504
4,433
3,260
1,173
7,789
5,633
2,156
623
351
272
8
4
4
19
13
6
240
146
94
128
72
56
142
80
62
86
36
50
370
281
89
2
2
59
40
19
309
239
70
993
632
361
7,541
4,676
2,865
79
61
18
170
125
45
2,865
1,848
1,017
1,763
1,084
679
1,626
983
643
1,038
575
463
6,217
5,086
1,131
25
21
4
1,112
813
299
5,080
4,252
828
13,758
9,762
3,996
520
323
197
3
2
1
4
2
2
230
143
87
142
92
50
117
71
46
24
13
11
65
54
11
5
4
1
60
50
10
585
377
208
16,0472875506,0303,6573,2572,266 16,675733,50013,102 32,722
Fall Enrollment by Class and Level, Fall 2018
*JEPHS: Joint Enrollment Program for High School Students
11

College Major
1
Male FemaleInstituteTotal
College ofComputing
Computational MediaComputer Science
TotalCollege ofDesign
Architecture
Industrial DesignMusic Technology
Pre-ArchitecturePre-Industrial Design
TotalCollege ofEngineering
Aerospace Engineering
Biomedical EngineeringChemical and Biomolec..
Civil EngineeringComputer Engineering
Electrical EngineeringEnvironmental Enginee..
Industrial EngineeringMaterials Science & Engr
Mechanical EngineeringNuclear & Radiological ..
Undeclared Coll of EngrTotal
College ofSciences
Applied PhysicsBiochemistry
BiologyChemistry
Discrete MathematicsEarth & Atmospheric S..
MathematicsNeuroscience
PhysicsPsychology
TotalIvan AllenCollege
Applied Lang/Intercult..
Computational MediaEcon & Int'l Affairs
EconomicsGlobal Econ/Mod Lang
History, Technology, & ..Int'l Affairs & Mod Lang
International AffairsLit., Media, & Communi..
Public PolicyTotal
SchellerCollege of ..
Business AdministrationTotal
College ofRegistrar
Special/Non-DegreeTotal
Institute Total
611
57734
1,784
1,75232
2,395
2,32966
258
2
9136
111
193
1
4381
68
451
21
52217
179
2,982
54
18436
134567
126151
120184
389631
172
5,799
117
811,512
225667
78595
528259
422516
799
8,781
171
991,948
3591,234
204746
648443
8111,147
971
92869
37158
7733
275
302164
11
65922
16747
13818
863
8684
26
1,58791
204205
21551
10138
388248
37
484
53126
6652
3510
2335
7014
303
2638
3115
227
7527
539
787
79164
9767
5717
9862
12323
591
591
614
614
1,205
1,205
262
262
579
579
841
841
6,1169,931 16,047
College Major
Asian
Male Female Total
Black or African American
Male Female Total
Hispanic or Latino
Male Female Total
Two or more
Male Female Total
White
Male Female Total
Other
Male Female Total
International
Male Female TotalCollege ofComputing
Computational MediaComputer Science
TotalCollege of Design Architecture
Industrial DesignMusic Technology
Pre-ArchitecturePre-Industrial Design
TotalCollege ofEngineering
Aerospace Engineering
Biomedical EngineeringChemical and Biomolecular Eng
Civil EngineeringComputer Engineering
Electrical EngineeringEnvironmental Engineering
Industrial EngineeringMaterials Science & Engr
Mechanical EngineeringNuclear & Radiological Engr
Undeclared Coll of EngrTotal
College ofSciences
Applied PhysicsBiochemistry
BiologyChemistry
Discrete MathematicsEarth & Atmospheric Sciences
MathematicsNeuroscience
PhysicsPsychology
TotalIvan Allen CollegeApplied Lang/Intercultural St
Computational MediaEcon & Int'l Affairs
EconomicsGlobal Econ/Mod Lang
History, Technology, & SocietyInt'l Affairs & Mod Lang
International AffairsLit., Media, & Communication
Public PolicyTotal
Scheller Collegeof Business
Business AdministrationTotal
College ofRegistrar
Special/Non-DegreeTotal
Institute Total
840
82713
249
2409
591
5874
143
13310
43
394
100
946
132
12210
38
335
94
895
72
693
23
212
49
481
830
80525
172
16012
658
64513
98
944
19
172
79
772
280
2791
67
67
213
2121
87
346
38
61
234
25
26
112
13
32
311
18
17
5
12
15
36
6
42
512
25
21
16
14
21
46
11
18
39
6
13
8
5
5
31
1
231
21
35116
77
118
2
568
43
113
1
3048
34
10
8
2
8
6
2
2
2
31
315
13
20
19
10
11
26
3
1,673
25
13301
43300
20174
16856
137277
159
576
9
375
15141
1330
3227
67141
23
1,097
16
10226
28159
7144
13629
70136
136
605
16
8124
2153
1271
6440
6481
51
242
4
32
1232
915
1618
4352
9
363
12
892
921
356
4822
2129
42
704
15
7168
2591
1654
4446
6291
85
237
8
34
946
1213
612
3250
15
467
7
7134
1645
441
3834
3041
70
347
9
176
2040
724
2418
3453
41
136
4
25
917
25
97
1528
15
211
5
151
1123
519
1511
1925
26
4,272
93
70995
207535
130301
248231
416520
526
1,412
29
15225
77234
8162
3994
183283
90
2,860
64
55770
130301
49239
209137
233237
436
282
1
67
1448
417
2312
1848
30
101
11
324
24
46
1031
6
181
1
56
1124
213
196
817
24
898
12
217
29167
15105
7740
8077
79
278
34
973
722
1420
3946
14
620
12
183
2094
883
6320
4131
65
34812
2271
385
120
10268
9
20210
348
102
9
7542
3
1462
1923
283
111
2726
6
1058
510
123
12
3520
695
27
61
7
2714
363
33
62
5
86
1018
1213
102
114
2516
646
110
51
6
2411
372
113
51
18
15
788
1110
8
5
258
3
446
49
1
3
173
1
342
71
7
2
85
2
80551
12391
10538
675
178121
17
48438
2477
3927
143
14387
5
32113
9914
6611
532
3534
12
413
56
9
2
96
1
223
4
2
2
82
1
19
52
7
14
1091
264
333
210
149
7
431
33
142
15
85
1
66
231
191
15
64
6
126
718
1310
23
2113
381
82
615
127
11
88
231
44
13
13
12
135
15
80
1023
104
101
63
112
47
614
84
51
12
51
33
49
2
5
51
61
54
19
66
41
84
123
32
16
36
41
11
72
22
3
3
73
51
38
34
66
3
5
74
22
32
44
2
2
32
16
2
22
1
3
42
453
56101
6040
3411
5039
4913
280
3583
3730
227
823
278
173
2118
2310
124
4216
225
20
17
21
3
22
2
14
15
21
1
11
2
6
2
2
11
16
12
11
61
4
7
11
2
3
9
1
11
41
1
200
200
125
125
75
75
96
96
26
26
70
70
70
70
36
36
34
34
42
42
24
24
18
18
699
699
335
335
364
364
62
62
30
30
32
32
36
36
15
15
21
21
316
316
106
106
210
210
56
56
21
21
35
35
34
34
19
19
15
15
28
28
10
10
18
18
251
251
64
64
187
187
7
7
3
3
4
4
149
149
39
39
110
110
3,5901,4012,189 1,117465652 1,137447690 623272351 7,5412,8654,676 520197323 1,5194691,050
Undergraduate Enrollment by College and Major, Fall 2018
12

College Major 2009 2010 2011 2012 2013 2014 2015 2016 2017 2018College ofComputing
Computational Media
Computer Science
TotalCollege ofDesign
Architecture
Building Construction
Industrial Design
Music Technology
Pre-Architecture
Pre-Building Construction
Pre-Industrial Design
TotalCollege ofEngineering
Aerospace Engineering
Biomedical Engineering
Chemical and Biomolecular Eng
Civil Engineering
Civil Engineering - REP
Computer Engineering
Computer Engineering - REP
Electrical Engineering
Electrical Engineering - REP
Environmental Engineering
Industrial Engineering
Materials Science & Engr
Mechanical Engineering
Mechanical Engineering - REP
Nuclear & Radiological Engr
Polymer & Fiber Engr
Undeclared Coll of Engr
TotalCollege ofSciences
Applied Mathematics
Applied Physics
Biochemistry
Biology
Chemistry
Discrete Mathematics
Earth & Atmospheric Sciences
Mathematics
Neuroscience
Physics
Psychology
Undeclared Coll of Sciences
TotalIvan AllenCollege
Applied Lang/Intercultural St
Computational Media
Econ & Int'l Affairs
Economics
Global Econ/Mod Lang
History, Technology, & Society
Int'l Affairs & Mod Lang
International Affairs
Lit., Media, & Communication
Public PolicyScience, Technology, & Culture
2,395
2,329
66
2,199
2,110
89
2,146
2,045
101
1,877
1,768
109
1,549
1,441
108
1,303
1,192
111
1,119
1,037
82
972
838
134
990
840
150
920
777
143
451
2
1
52
217
179
407
10
3
32
208
154
349
53
48
7
142
99
316
38
43
127
6
102
332
43
26
114
24
125
351
30
33
110
45
133
412
39
6
46
111
50
160
508
27
4
95
126
86
170
574
22
5
83
138
116
210
651
33
11
123
129
143
212
8,781
171
99
1,948
359
1,234
204
746
648
443
811
1,147
971
8,896
202
111
2,009
341
1,212
212
792
626
441
896
1,152
902
9,306
57
108
2,157
345
1,399
193
868
598
473
984
1,177
947
9,418
102
119
2,123
343
1,431
191
903
589
473
991
1,261
892
9,253
92
15
119
2,052
315
1,430
183
928
545
488
943
1,276
867
9,278
104
33
141
2,014
266
1,450
189
925
521
527
864
1,369
875
9,069
108
55
171
43
1,884
216
1,391
188
15
925
1
455
15
579
863
1,291
869
8,403
132
106
178
73
1,662
159
1,263
178
33
848
5
424
50
597
789
1,155
751
8,076
174
165
197
62
1,597
131
1,184
141
34
777
9
387
49
648
717
1,041
763
7,902
208
157
187
62
1,508
125
1,176
109
29
786
19
381
55
693
675
965
767
1,587
91
204
205
215
51
10
138
388
248
37
1,413
1
93
185
138
164
41
23
127
376
242
18
5
1,159
8
104
154
46
35
94
358
214
13
133
1,035
22
98
131
41
22
80
309
200
14
118
1,020
16
105
126
30
15
78
343
193
13
101
1,120
10
118
139
45
14
85
395
191
12
111
1,271
12
144
136
39
11
98
453
226
8
144
1,343
32
135
145
44
20
110
460
235
9
153
1,323
38
122
131
55
27
116
470
204
9
151
1,177
26
105
126
44
29
124
437
172
7
107
787
79
164
97
67
57
17
98
62
123
23
679
1
75
136
74
72
42
12
79
49
111
28
583
11
64
92
64
82
28
7
61
52
100
22
583
22
49
89
64
70
45
5
57
52
111
19
562
20
46
46
25
58
77
45
7
51
55
106
26
622
12
92
48
70
86
64
9
50
54
114
23
757
9
103
63
93
112
69
17
49
64
159
19
779
13
132
64
113
117
66
18
47
65
133
11
872
17
147
68
135
134
81
21
55
64
150
936
25
166
71
153
156
80
15
58
69
143
Undergraduate Enrollment by College and Major, Fall Term History
13

College Major 2009 2010 2011 2012 2013 2014 2015 2016 2017 2018Ivan AllenCollege
Public PolicyScience, Technology, & Culture
Undeclared Ivan Allen College
TotalSchellerCollege ofBusiness
Business Administration
Management
TotalCollege ofRegistrar
Special/Non-Degree
Total
Institute Total
787679
1
583
11
583
22
562
20
46
622
12
92
757
9
103
779
13
132
872
17
147
936
25
166
1,205
1,205
1,216
1
1,215
1,222
2
1,220
1,231
59
1,172
1,280
258
1,022
1,301
539
762
1,326
908
418
1,295
1,295
1,325
1,325
1,356
1,356
841
841
763
763
724
724
682
682
686
686
583
583
573
573
648
648
590
590
573
573
16,04715,57315,48915,14214,68214,55814,52713,94813,75013,515
Undergraduate Enrollment by College and Major, Fall Term History
14

College Major Male FemaleInstituteTotal
College ofComputing
Algor, Combntrcs & OptimiztionAnalyticsBioengineeringBioinformaticsComputational Sci & EngrComputer ScienceCybersecurityHuman-Centered ComputingHuman-Computer InteractionInformation SecurityMachine LearningRoboticsTotal
College ofDesign
Architectural TechnologyArchitectureBuilding ConstructionCity & Regional PlanningCity PlanningGeograhic Info Science & TechHuman-Computer InteractionIndustrial DesignMusic TechnologyOccupational Safety and HealthReal Estate DevelopmentUrban DesignTotal
College ofEngineering
Aerospace EngineeringAlgor, Combntrcs & OptimiztionAnalyticsApplied Systems EngineeringBioengineeringBioinformaticsBiomedical EngineeringBiomedical Innovation/DevelopBMED Joint Emory/PKUChemical EngineeringCivil EngineeringComputational Sci & EngrCybersecurityElectrical & Computer EngrEngineering Sci & MechanicsEnvironmental EngineeringHealth SystemsIndustrial EngineeringMachine LearningManufacturing LeadershipMaterials Science & EngrMechanical EngineeringMedical PhysicsNuclear & Radiological EngrNuclear EngineeringOcean Science and EngineeringOperations ResearchQuanta/Computation FinRoboticsStatisticsSupply Chain EngineeringTotal
College of ..Special/Non-DegreeTotal
College ofSciences
Algor, Combntrcs & OptimiztionApplied PhysiologyBioinformaticsBiologyChemistryComputational Sci & EngrEarth & Atmospheric SciencesHuman-Computer InteractionMachine LearningMathematicsOcean Science and EngineeringPhysicsProsthetics & OrthoticsPsychologyQuanta/Computation FinQuantitative BiosciencesStatisticsTotal
Ivan AllenCollege
CybersecurityDigital MediaEconomicsHist & Soc of Tech & ScienceHuman-Computer InteractionInt'l Affairs, Sci, & TechngyInternational AffairsPublic PolicyPublic Policy/Joint ProgrmTotal
SchellerCollege ofBusiness
AnalyticsBusiness AdministrationManagementManagement of TechnologyMBA-Global BusinessQuanta/Computation FinTotal
Institute Total
1,48811
322118
1,37826
182
7,2221494251260
6,9947212227
8,71015104573378
8,3729813309
2478817626165448261964
2857262328231063910531941
5321534403449261183187938105
1,33128109143712
711468114459461
231
20825711166623617309276
4,03441116615973364185851182027843454
8833591911221619103270449476
392
5,36569217529134438425699186313112912915
1,11437927317927351694
10661
1,2568
468
1313
1818
3131
3616101142832517
1524680425445
54161432316
1017692442109728701210
902122443731413312862196616177701241615
130424128121329226
12342712471130208
25385124121924594214
3011340312717416
5813480962532917
882471201275250333
3,87112,804 16,675
College Major
Asian
Male Female Total
Black or African American
Male Female Total
Hispanic or Latino
Male Female Total
Two or more
Male Female Total
White
Male Female Total
Other
Male Female Total
International
Male Female TotalCollege ofComputing
Algor, Combntrcs & OptimiztionAnalyticsBioengineeringBioinformaticsComputational Sci & EngrComputer ScienceCybersecurityHuman-Centered ComputingHuman-Computer InteractionInformation SecurityMachine LearningRoboticsTotal
College ofDesign
Architectural TechnologyArchitectureBuilding ConstructionCity & Regional PlanningCity PlanningGeograhic Info Science & TechHuman-Computer InteractionIndustrial DesignMusic TechnologyOccupational Safety and HealthReal Estate DevelopmentUrban DesignTotal
College ofEngineering
Aerospace EngineeringAlgor, Combntrcs & OptimiztionAnalyticsApplied Systems EngineeringBioengineeringBioinformaticsBiomedical EngineeringBiomedical Innovation/DevelopBMED Joint Emory/PKUChemical EngineeringCivil EngineeringComputational Sci & EngrCybersecurityElectrical & Computer EngrEngineering Sci & MechanicsEnvironmental EngineeringHealth SystemsIndustrial EngineeringMachine LearningManufacturing LeadershipMaterials Science & EngrMechanical EngineeringMedical PhysicsNuclear & Radiological EngrNuclear EngineeringOcean Science and EngineeringOperations ResearchQuanta/Computation FinRoboticsStatisticsSupply Chain EngineeringTotal
College of ..Special/Non-DegreeTotal
College ofSciences
Algor, Combntrcs & OptimiztionApplied PhysiologyBioinformaticsBiologyChemistryComputational Sci & EngrEarth & Atmospheric SciencesHuman-Computer InteractionMachine LearningMathematicsOcean Science and EngineeringPhysicsProsthetics & OrthoticsPsychologyQuanta/Computation FinQuantitative BiosciencesStatisticsTotal
Ivan AllenCollege
CybersecurityDigital MediaEconomicsHist & Soc of Tech & ScienceHuman-Computer InteractionInt'l Affairs, Sci, & TechngyInternational AffairsPublic PolicyPublic Policy/Joint ProgrmTotal
SchellerCollege ofBusiness
AnalyticsBusiness AdministrationManagementManagement of TechnologyMBA-Global BusinessQuanta/Computation FinTotal
Institute Total
1,448
1
723
1,4252
161
317
5
3101
1
1,131
1
223
1,1151
151
2561
443
243
1
59
33250
1
1971
111
193
473
21
4691
50
1
49
423
11
4201
197
1
19311
1
41
1
40
156
15311
1
3,23074318159
3,15014
181
323
791
3012
3
2,9077431168
2,84912
151
43
43
5
5
38
38
3,063751271062
2,84980
1147
69311
1681562323
132
2,37064111247
2,22657
115
251
1241
32137
161
31
21125
9
121
11
12
39
10611
7
8
6
17
521
4
2
3
22
54
1
3
6
3
26161
31
21218
8
1
1
1
5
1816
3
21113
111
2
2
2
2
2
51
1
1
2
6
2
1
1
2
2102173091852581014936
952214211212952619
115
1516773129512317
1
1
1
1
220101
2221199115522446
10641
31112482201130
1146
19107533321316
65121834
4
2822042768
102
314222827
224
246
48
1752
21162
344
23
156
311
7174
10
476
1834
4
711422424
79
29162516
153
172
38
1471
2
2
11554
3
3
22
25
116
5346
11
45
132
2
3
5
3
10
115
1021
2
2
1234
1
17
22
16
5231
11
251416
2
52225551513
3611951221
7482
15
691
1
1022
11
8
12
112
4220
1
182316
1
522153315
2
281183119
3262
14
114
5
3
1
176
12
12
63114
5238
7
26
3
32
1
1
4
318
88
5
1
144
11
11
23114
2130
7
1,84911294292272173057217818317
22017585681273141425772
199
382
18
812
3412871637
24
122102524
1011124
33
1,4671
214211252142644410712
10
1961636466749131314532
166
16
1
2
2
1
1
9
5
1
1
3
11
1
1
1
1
1
6
2,337611825229321
325378119942605
720168184881411273266
2586
188
62925911425
14528
3331311
169
185036979212165232
1,7083692486821
220850116611294
5511501345254181145
1934
156
22
22
11
11
11
11
1010
33
77
1717
77
1010
56
12316
3
43185172
31
314
1
3
15391
25
12
2
2
13
3281
23
1
311
1
2
833
11
21
2
4
2
12
1
1
1
1
431
37
3261812
3
632
23
313151
1
332
14
13
3
2
2
3
19
1141131
2
1111
1
9
1
2
11
1
111
10
121
21
1
1
1
348166461066427
7203823121126
129
3
2451633
5713319532
21913622550124
213249121694
2
11
1
1
1
1
41711123211
5145226381172267928
15763108
6
13
6143341536
3
26059223
454392
24838114325
23
41121563
9
21
123
14
2
12
333
26181113272
1714
112
62
9
41
121
11
3111
311
6
1111
2
5
2
111
7
2
1
31
1
1
6
2
1
3
10642220461714136
5121110259453
55211102181083
1
1
1
1
79312158332141
4616
4512171
33261132117
104320314442
382682191
66114232251
10012626245
44197225
56
1719
20
54
1010
34
15
5
10
39
510
24
21122
151
7
1
6
14112
91
4641156549
3286
148
16165
1083
3161140384
2203
2
1
1
2
1
1
1373163373624
49103
18612
882133193012
2,3095881,721 592194398 852171681 37089281 6,2171,1315,086 651154 6,2701,6874,583
Graduate Enrollment by College and Major, Fall 2018
15

College Major 2009 2010 2011 2012 2013 2014 2015 2016 2017 2018College ofComputing
Algor, Combntrcs & Optimiztion
Analytics
Bioengineering
Bioinformatics
Computational Sci & Engr
Computer Science
Cybersecurity
Human-Centered Computing
Human-Computer Interaction
Information Security
Machine Learning
Robotics
TotalCollege ofDesign
Architectural Technology
Architecture
Building Construction
City & Regional Planning
City Planning
Geograhic Info Science & Tech
Human-Computer Interaction
Industrial Design
Music Technology
Occupational Safety and Health
Real Estate Development
Urban Design
TotalCollege ofEngineering
Aerospace Engineering
Algor, Combntrcs & Optimiztion
Analytics
Applied Systems Engineering
Bioengineering
Bioinformatics
Biomedical Engineering
Biomedical Innovation/Develop
BMED Joint Emory/PKU
Chemical Engineering
Civil Engineering
Computational Sci & Engr
Cybersecurity
Electrical & Computer Engr
Engineering Sci & Mechanics
Environmental Engineering
Health Systems
Industrial Engineering
International Logistics
Machine Learning
Manufacturing Leadership
Materials Science & Engr
Mechanical Engineering
Medical Physics
Nuclear & Radiological EngrNuclear Engineering
8,710
15
10
4
57
33
78
8,372
98
1
3
30
9
6,779
17
5
49
36
68
6,448
122
1
4
20
9
4,791
14
74
58
44
4,474
94
1
22
10
3,609
20
70
54
37
3,310
89
2
14
13
2,034
23
80
55
40
1,734
75
2
1
9
15
671
20
49
47
35
447
55
2
16
711
22
60
46
37
472
59
2
13
692
26
59
45
39
453
51
2
1
16
772
21
69
54
46
520
41
3
1
17
774
13
51
44
40
580
28
4
1
13
532
15
34
40
34
49
26
11
83
18
79
38
105
546
16
14
23
35
54
27
9
84
18
102
74
90
487
11
37
45
22
13
85
22
92
145
15
489
3
31
45
21
11
82
23
109
164
451
3
28
44
13
9
66
19
94
175
450
5
29
51
5
75
21
99
165
463
7
24
44
80
24
105
179
503
4
22
39
83
22
110
223
523
17
39
96
20
118
233
539
17
37
112
132
241
5,365
69
21
75
29
134
4
38
4
25
699
186
31
31
129
12
91
5
1,114
3
79
273
179
27
35
169
4
106
61
1,256
8
468
4,411
89
24
60
24
111
3
37
7
32
711
191
29
134
7
117
3
1,096
71
300
184
28
35
156
3
104
58
301
5
491
4,059
55
21
51
23
1
116
32
16
19
694
176
18
2
142
11
100
3
1,118
88
296
201
34
28
145
2
97
50
32
7
481
3,895
61
15
43
27
3
98
32
31
19
671
165
2
130
11
108
4
1,136
34
261
213
32
31
129
1
87
50
19
5
477
4,102
59
12
33
30
12
86
15
53
30
681
160
11
127
12
126
3
1,326
28
263
189
30
21
127
94
53
13
5
503
3,904
49
8
25
48
19
2
87
60
26
663
153
10
163
9
95
3
1,156
10
276
210
29
10
124
1
100
64
4
500
3,940
52
13
25
52
28
6
69
1
56
25
670
134
16
242
6
99
1
1,104
5
272
217
26
115
2
105
61
6
532
3,932
14
13
24
40
42
5
58
2
52
24
697
118
18
268
8
92
1
1,133
7
264
209
17
85
2
115
47
6
571
3,835
5
15
35
61
5
54
3
43
24
700
109
16
274
12
80
5
1,140
9
246
201
12
83
1
137
23
7
535
3,756
10
14
37
1
63
9
49
5
36
28
649
110
13
299
13
80
4
1,134
3
253
187
3
86
2
135
8
6
519
Graduate Enrollment by College and Major, Fall Term History
16

College Major 2009 2010 2011 2012 2013 2014 2015 2016 2017 2018College ofEngineering
Nuclear & Radiological EngrNuclear Engineering
Ocean Science and Engineering
Operations Research
Paper Science Engineering
Polymer, Textile & Fiber Engr
Polymers
Quanta/Computation Fin
Robotics
Statistics
Supply Chain Engineering
TotalCollege ofSciences
Algor, Combntrcs & Optimiztion
Applied Physiology
Bioinformatics
Biology
Chemistry
Computational Sci & Engr
Earth & Atmospheric Sciences
Human-Computer Interaction
Machine Learning
Mathematics
Ocean Science and Engineering
Paper Science Engineering
Physics
Prosthetics & Orthotics
Psychology
Quanta/Computation Fin
Quantitative Biosciences
Statistics
TotalIvan AllenCollege
Cybersecurity
Digital Media
Economics
Hist & Soc of Tech & Science
Human-Computer Interaction
Int'l Affairs, Sci, & Techngy
International Affairs
Public Policy
Public Policy/Joint Progrm
TotalSchellerCollege ofBusiness
Analytics
Business Administration
Management
Management of Technology
MBA-Global Business
Quanta/Computation Fin
TotalCollege ofRegistrar
Special/Non-Degree
Total
Institute Total
5,365
69
21
75
29
134
4
384
25
699
186
31
31
129
12
91
5
1,114
3
79
273
179
27
35
169
4
106
61
1,256
8
468
4,411
89
24
60
24
111
3
377
32
711
191
29
134
7
117
3
1,096
71
300
184
28
35
156
3
104
58
301
5
491
4,059
55
21
51
23
1
116
3216
19
694
176
18
2
142
11
100
3
1,118
88
296
201
34
28
145
2
97
50
32
7
481
3,895
61
15
43
27
3
98
3231
19
671
165
2
130
11
108
4
1,136
34
261
213
32
31
129
1
87
50
19
5
477
4,102
59
12
33
30
12
86
1553
30
681
160
11
127
12
126
3
1,326
28
263
189
30
21
127
94
53
13
5
503
3,904
49
8
25
48
19
2
87
60
26
663
153
10
163
9
95
3
1,156
10
276
210
29
10
124
1
100
64
4
500
3,940
52
13
25
52
28
6
69
156
25
670
134
16
242
6
99
1
1,104
5
272
217
26
115
2
105
61
6
532
3,932
14
13
24
40
42
5
58
252
24
697
118
18
268
8
92
1
1,133
7
264
209
17
85
2
115
47
6
571
3,835
5
15
35
61
5
54
343
24
700
109
16
274
12
80
5
1,140
9
246
201
12
83
1
137
23
7
535
3,756
10
14
37
1
63
9
49
536
28
649
110
13
299
13
80
4
1,134
3
253
187
3
86
2
135
8
6
519
902
12
24
43
73
14
133
12
86
2
19
66
16
177
70
124
16
15
922
13
16
34
75
28
138
6
83
15
81
17
196
71
116
18
15
885
8
9
37
82
26
131
70
12
90
13
208
70
101
14
14
847
13
39
90
28
138
69
11
84
8
199
65
73
19
11
836
11
36
89
28
125
1
70
11
78
13
223
71
55
19
6
845
8
29
85
25
138
2
65
12
88
13
228
71
50
21
10
828
8
25
80
22
133
6
55
6
83
10
235
84
49
22
10
778
6
28
88
19
112
7
59
6
83
9
199
82
45
21
14
794
2
25
86
19
116
7
58
4
92
8
204
98
39
23
13
790
1
29
80
20
107
7
61
4
94
6
206
98
47
17
13
253
8
51
24
12
19
24
59
42
14
234
11
47
26
14
16
25
50
39
6
243
11
53
36
14
17
25
42
45
226
12
46
28
12
14
26
43
45
219
15
51
35
11
12
25
34
36
255
18
66
48
11
14
25
29
44
286
23
86
49
11
8
25
42
42
306
25
82
50
8
8
32
52
49
311
33
68
58
9
8
24
56
55
289
30
66
59
7
8
22
43
54
882
47
120
127
52
503
33
891
40
131
129
53
510
28
857
30
129
127
51
496
24
805
31
113
126
56
451
28
769
28
99
110
96
422
14
771
32
93
98
218
330
802
34
84
92
428
164
782
38
61
87
596
735
32
76
87
540
628
25
100
84
419
31
31
20
20
28
28
21
21
16
16
17
17
16,67513,80311,3509,8928,4276,9137,0306,9936,9706,776
Graduate Enrollment by College and Major, Fall Term History
17

Term
College ofComputingM.S. Ph.D.
College of DesignM.S. Ph.D.
College ofEngineeringM.S. Ph.D.
College ofSciencesM.S. Ph.D.
Ivan Allen CollegeM.S. Ph.D.
Scheller Collegeof BusinessM.S. Ph.D.
Collegeof Regi..
M.S.
InstituteTotal
2009
2010
2011
2012
2013
2014
2015
2016
2017
2018 334
329
324
316
320
298
298
312
323
321
8,376
6,450
4,467
3,293
1,714
373
413
380
449
453
77
80
86
88
97
94
89
94
95
97
455
466
401
401
354
356
374
409
428
442
2,244
2,167
2,164
2,069
2,134
2,138
2,148
2,057
2,069
2,036
3,121
2,244
1,895
1,826
1,968
1,766
1,792
1,875
1,766
1,720
690
719
686
653
661
681
676
634
642
634
212
203
199
194
175
164
152
144
152
156
103
101
108
107
106
112
121
118
111
104
150
133
135
119
113
143
165
188
200
185
52
51
46
48
52
55
49
57
52
43
830
840
811
757
717
716
753
725
683
585
31
20
28
21
16
17
16,675
13,803
11,350
9,892
8,427
6,913
7,030
6,993
6,970
6,776
Graduate Enrollment by Degree Program*, Fall Terms
* Master's program totals include Special Non-Degree-Seeking graduate students.
18

Country Undergraduate Graduate Institute Total
Albania
Angola
Argentina
Armenia
Aruba
Australia
Austria
Azerbaijan
Bahamas
Bangladesh
Barbados
Belarus
Belgium
Belize
Benin
Bermuda
Bolivia
Bosnia and Herzegovina
Brazil
Bulgaria
Burkina Faso
Burma (Myanmar)
Burundi
Cambodia
Cameroon
Canada
Chile
China
Colombia
Comoros
Congo
Costa Rica
Cote D'Ivoire
Cyprus
Czech Republic
Dem. Republic of the C..
Denmark
Dominica
Dominican Republic
Ecuador
Egypt
El Salvador
Estonia
Ethiopia
Fiji
Finland
FranceGeorgia
7,789
1
2
1
74
43
3
4
51
8
7
5
1
99
16
7
2
39
3
128
6
6
17
2
12
49
13
1
3
77
4
1
5
96
6
41
12
2
6
5
16
15
3
21
95
3
2
69
1
19
11
30
1
15
5
1
81
3
1
1
45
2
2
2
28
1
2
10
510
19
12
18
34
8
43
19
14
99
44
2,073
2
6
45
9
3
1
10
1
30
12
47
2
168
1
1
10
3
10
52
9
11
1
2
4
5
3
6
28
3
1
69
2,480
27
210
8
1
1
7
1
9
106
2
7
1
2
2
4
7
2
36
1
1
4
48
1
1
24
2
3
6,270
1
1
1
51
7
3
1
30
6
4
1
67
10
3
1
23
2
114
4
5
4
1
8
16
12
3
57
4
2
58
5
25
11
4
4
13
10
1
9
84
3
1
45
1
13
6
30
12
4
1
60
2
20
1
19
1
2
6
291
17
11
13
17
5
30
17
7
94
21
1,859
2
4
27
2
2
3
1
26
10
36
1157
9
2
4
45
6
5
1
1
1
3
2
2
15
3
1
49
2,177
23
196
8
1
4
9
46
2
1
1
2
1
2
7
1
29
1
4
43
15
2
1,519
1
23
36
3
21
8
1
1
32
6
4
1
16
1
14
2
1
13
1
4
33
1
1
20
1
3
38
1
16
1
2
2
1
3
5
2
12
11
1
24
6
5
1
3
1
21
1
1
1
25
2
2
1
9
4
219
2
1
5
17
3
13
2
7
5
23
214
2
18
7
1
1
7
4
2
11
111
1
1
1
1
6
7
3
6
1
3
2
1
4
13
20
303
4
14
1
3
1
60
6
1
2
1
7
1
5
1
1
9
2
1
Enrollment by Country of Residence, Fall 2018
19

Country Undergraduate Graduate Institute TotalFranceGeorgia
Germany
Ghana
Greece
Grenada
Guatemala
Guinea
Haiti
Honduras
Hong Kong
Hungary
Iceland
India
Indonesia
Iran
Ireland
Israel
Italy
Jamaica
Japan
Jordan
Kazakhstan
Kenya
Korea, Republic of (Sou..
Kuwait
Kyrgyzstan
Latvia
Lebanon
Lithuania
Luxembourg
Macao
Malaysia
Mali
Martinique
Mauritius
Mexico
Moldova
Mongolia
Morocco
Namibia
Nepal
Netherlands
New Zealand
Nicaragua
Nigeria
Norway
OmanPakistan
7,789
1
2
1
74
43
3
4
51
8
7
5
1
99
16
7
2
39
3
128
6
6
17
2
12
49
13
1
3
77
4
1
5
96
6
41
12
2
6
5
16
15
3
21
95
3
2
69
1
19
11
30
1
15
5
1
81
3
1
1
45
2
2
2
28
1
2
10
510
19
12
18
34
8
43
19
14
99
44
2,073
2
6
45
9
3
1
10
1
30
12
47
2168
1
1
10
3
10
52
9
11
1
2
4
5
3
6
28
3
1
69
2,480
27
210
8
1
1
7
1
9
106
2
7
1
2
2
4
7
2
36
1
1
4
48
1
1
24
2
3
6,270
1
1
1
51
7
3
1
30
6
4
1
67
10
3
1
23
2
114
4
5
4
1
8
16
12
3
57
4
2
58
5
25
11
4
4
13
10
1
9
843
1
45
1
13
6
30
12
4
1
60
2
20
1
19
1
2
6
291
17
11
13
17
5
30
17
7
94
21
1,859
2
4
27
2
2
3
1
26
10
36
1157
9
2
4
45
6
5
1
1
1
3
2
2
15
3
1
49
2,177
23
196
8
1
4
9
46
2
1
1
2
1
2
7
1
29
1
4
43
15
2
1,519
1
23
36
3
21
8
1
1
32
6
4
1
16
1
14
2
1
13
1
4
33
1
1
20
1
3
38
1
16
1
2
2
1
3
5
2
12
11
1
24
6
5
1
3
1
21
1
1
1
25
2
2
1
9
4
219
2
1
5
17
3
13
2
7
5
23
214
2
18
7
1
1
7
4
2
11
111
1
1
1
1
6
7
3
6
1
3
2
1
4
13
20
303
4
14
1
3
1
60
6
1
2
1
7
1
5
1
1
9
2
1
Enrollment by Country of Residence, Fall 2018
20

Country Undergraduate Graduate Institute TotalOmanPakistan
Panama
Paraguay
Peru
Philippines
Poland
Portugal
Qatar
Romania
Russia
Rwanda
Saudi Arabia
Senegal
Serbia
Serbia (Prior to 2001)
Singapore
Slovakia
Somalia
South Africa
Spain
Sri Lanka
Sudan
Sweden
Switzerland
Syria
Taiwan
Tanzania
Thailand
Togo
Trinidad and Tobago
Tunisia
Turkey
Turkmenistan
Uganda
Ukraine
United Arab Emirates
United Kingdom
Uruguay
Uzbekistan
Venezuela
Vietnam
West Bank
Yemen
Zambia
Institute Total 7,789
1
2
1
74
43
3
4
51
8
7
5
1
99
16
7
2
39
3
128
6
6
17
2
12
49
13
1
3
77
4
1
5
96
6
41
12
2
6
5
16
15
3
21
953
2
69
1
19
11
30
1
15
5
1
81
3
1
1
45
2
2
2
28
1
2
10
510
19
12
18
34
8
43
19
14
99
44
2,073
2
6
45
9
3
1
10
1
30
12
47
2
168
1
1
10
3
10
52
9
11
1
2
4
5
3
6
28
3
1
69
2,480
27
210
8
1
1
7
1
9
106
2
7
1
2
2
4
7
2
36
1
1
4
48
1
1
24
2
3
6,270
1
1
1
51
7
3
1
30
6
4
1
67
10
3
1
23
2
114
4
5
4
1
8
16
12
3
57
4
2
58
5
25
11
4
4
13
10
1
9
843
1
45
1
13
6
30
12
4
1
60
2
20
1
19
1
2
6
291
17
11
13
17
5
30
17
7
94
21
1,859
2
4
27
2
2
3
1
26
10
36
1
157
9
2
4
45
6
5
1
1
1
3
2
2
15
3
1
49
2,177
23
196
8
1
4
9
46
2
1
1
2
1
2
7
1
29
1
4
43
15
2
1,519
1
23
36
3
21
8
1
1
32
6
4
1
16
1
14
2
1
13
1
4
33
1
1
20
1
3
38
1
16
1
2
2
1
3
5
2
12
11
1
24
6
5
1
3
1
21
1
1
1
25
2
2
1
9
4
219
2
1
5
17
3
13
2
7
5
23
214
2
18
7
1
1
7
4
2
11
1
11
1
1
1
1
6
7
3
6
1
3
2
1
4
13
20
303
4
14
1
3
1
60
6
1
2
1
7
1
5
1
1
9
2
1
Enrollment by Country of Residence, Fall 2018
21

State/U.S. Territory
Undergraduate
Male Female Total
Graduate
Male Female TotalInstituteTotal
Alabama
Alaska
Arizona
Arkansas
California
Colorado
Connecticut
Delaware
District of Columbia
Florida
Georgia
Hawaii
Idaho
Illinois
Indiana
Iowa
Kansas
Kentucky
Louisiana
Maine
Maryland
Massachusetts
Michigan
Minnesota
Mississippi
Missouri
Montana
Nebraska
Nevada
New Hampshire
New Jersey
New Mexico
New York
North Carolina
North Dakota
Ohio
Oklahoma
OregonPennsylvania
14,528
139
1
26
1
2
42
8
54
277
6
9
274
168
1
114
14
259
17
14
125
2
296
288
10
331
27
11
8
2
50
15
42
35
174
233
12
44
35
16
18
33
174
2
8
9,858
620
11
23
106
71
284
17
44
5
72
5,647
52
11
16
5
20
97
1
2
96
59
40
2
83
4
4
35
105
95
6
111
8
2
4
1
18
5
12
20
50
94
1
23
11
6
7
12
76
2
4,005
236
5
11
22
31
91
5
11
2
32
8,881
87
1
15
1
2
26
3
34
180
5
7
178
109
1
74
12
176
13
10
90
2
191
193
4
220
19
9
4
1
32
10
30
15
124
139
11
21
24
10
11
21
98
2
6
5,853
384
6
12
84
40
193
12
33
3
40
10,405
913
1
39
1
2
87
12
226
397
10
87
617
154
6
146
13
247
104
34
165
2
253
425
57
271
37
21
19
11
85
29
89
151
230
219
21
42
54
36
31
65
227
22
19
2,553
550
52
20
81
126
1,059
27
113
8
139
2,184
240
1
14
18
46
85
5
8
107
19
26
3
47
13
4
21
51
88
8
38
5
5
2
4
7
7
7
26
53
48
4
8
8
9
3
12
33
5
679
112
12
2
20
19
199
3
18
1
31
8,221
673
25
1
2
69
12
180
312
5
79
510
135
6
120
10
200
91
30
144
2
202
337
49
233
32
16
17
7
78
22
82
125
177
171
17
34
46
27
28
53
194
22
14
1,874
438
40
18
61
107
860
24
95
7
108
24,933
1,052
2
65
2
4
129
20
280
674
16
96
891
322
7
260
27
506
121
48
290
4
549
713
67
602
64
32
27
13
135
44
131
186
404
452
33
86
89
52
49
98
401
24
27
12,411
1,170
63
43
187
197
1,343
44
157
13
211
Enrollment by State of Residence*, Fall 2018*Excludes international students
22

State/U.S. Territory
Undergraduate
Male Female Total
Graduate
Male Female TotalInstituteTotalOregon
Pennsylvania
Rhode Island
South Carolina
South Dakota
Tennessee
Texas
Utah
Vermont
Virginia
Washington
West Virginia
Wisconsin
Wyoming
Guam
Puerto Rico
Virgin Islands, U.S.
Unknown
Institute Total 14,528
139
1
26
1
2
42
8
54
277
6
9
274
168
1
114
14
25917
14
125
2
296
288
10
331
27
11
8
2
50
15
42
35
174
233
12
44
35
16
18
33
174
2
8
9,858
620
11
23
106
71
284
17
44
5
72
5,647
52
11
16
5
20
97
1
2
96
59
40
2
834
4
35
105
95
6
111
8
2
4
1
18
5
12
20
50
94
1
23
11
6
7
12
76
2
4,005
236
5
11
22
31
91
5
11
2
32
8,881
87
1
15
1
2
26
3
34
180
5
7
178
109
1
74
12
17613
10
90
2
191
193
4
220
19
9
4
1
32
10
30
15
124
139
11
21
24
10
11
21
98
2
6
5,853
384
6
12
84
40
193
12
33
3
40
10,405
913
1
39
1
2
87
12
226
397
10
87
617
154
6
146
13
247104
34
165
2
253
425
57
271
37
21
19
11
85
29
89
151
230
219
21
42
54
36
31
65
227
22
19
2,553
550
52
20
81
126
1,059
27
113
8
139
2,184
240
1
14
18
46
85
5
8
107
19
26
3
4713
4
21
51
88
8
38
5
5
2
4
7
7
7
26
53
48
4
8
8
9
3
12
33
5
679
112
12
2
20
19
199
3
18
1
31
8,221
673
25
1
2
69
12
180
312
5
79
510
135
6
120
10
20091
30
144
2
202
337
49
233
32
16
17
7
78
22
82
125
177
171
17
34
46
27
28
53
194
22
14
1,874
438
40
18
61
107
860
24
95
7
108
24,933
1,052
2
65
2
4
129
20
280
674
16
96
891
322
7
260
27
506121
48
290
4
549
713
67
602
64
32
27
13
135
44
131
186
404
452
33
86
89
52
49
98
401
24
27
12,411
1,170
63
43
187
197
1,343
44
157
13
211
Enrollment by State of Residence*, Fall 2018*Excludes international students
23

GA County Undergraduate Graduate Institute Total
Appling
Baker
Baldwin
Banks
Barrow
Bartow
Ben Hill
Berrien
Bibb
Bleckley
Brantley
Brooks
Bryan
Bulloch
Burke
Butts
Calhoun
Camden
Carroll
Catoosa
Charlton
Chatham
Chattahoochee
Chattooga
Cherokee
Clarke
Clayton
Cobb
Coffee
Colquitt
Columbia
Cook
Coweta
Crawford
Crisp
Dade
Dawson
Decatur
DeKalb
Dodge
Dougherty
Douglas
Early
EffinghamElbert
20,740
8,289
2
1
2
52
7
10
12
10
56
11
6
9
2
44
6
12
15
28
4
10
3
16
5
1
54
63
6
9
4
3
13
6
6
10
69
1
75
49
105
9
20
1
9
9
5
2
3
4
1
14
57
2
15
32
10
2
11
5
1
2
1
53
5
142
169
4
3
29
6
158
21
2,081
4
6
25
50
7
3,362
7
459
49
333
12
3
3
3
40
1
96
33
4
1,100
19
14
3
2
2
180
3
197
5
16
1,577
80
58
379
9
1
193
1
28
81
23
1
7
3
47
44
2
3
8
82
2
3
45
29
6
14
1
3
10,366
7,665
2
9
1
5
1
1
2
3
2
3
1
8
13
1
1
1
1
1
1
3
19
5
6
14
2
2
1
1
2
3
5
3
6
2
1
4
25
23
1
5
2
23
2
307
1
2
1
3
1
966
1
116
8
42
1
1
1
5
19
6
1
372
8
3
22
33
385
11
19
53
3
1
36
6
6
3
10
7
1
10
5
2
2
4
10,374
624
2
1
43
7
9
12
10
51
10
5
7
2
41
6
10
15
28
4
10
3
13
4
1
46
50
5
8
4
2
12
5
5
7
50
1
70
43
91
7
18
1
8
9
5
1
3
2
1
11
52
2
12
26
8
2
11
5
1
2
49
5
117
146
3
3
24
4
135
19
1,774
3
4
24
47
6
2,396
6
343
41
291
11
2
3
2
35
1
77
27
3
728
11
11
3
2
2
158
3
164
5
16
1,192
69
39
326
6
157
1
22
75
20
1
7
3
37
37
2
3
7
72
2
3
40
27
4
10
1
3
Enrollment by Georgia County of Residence*, Fall 2018*Excludes international students
24

GA County Undergraduate Graduate Institute TotalEffinghamElbert
Emanuel
Evans
Fannin
Fayette
Floyd
Forsyth
Franklin
Fulton
Gilmer
Glynn
Gordon
Grady
Greene
Gwinnett
Habersham
Hall
Haralson
Harris
Hart
Heard
Henry
Houston
Irwin
Jackson
Jasper
Jeff Davis
Jefferson
Jones
Lamar
Lanier
Laurens
Lee
Liberty
Lincoln
Lowndes
Lumpkin
Macon
Madison
McDuffie
McIntosh
Meriwether
Mitchell
MonroeMontgomery
20,740
8,289
2
1
2
52
7
10
12
10
56
11
6
9
2
44
6
12
15
28
4
10
3
16
5
1
54
63
6
9
4
3
13
6
6
10
69
1
75
49
105
9
20
1
9
9
5
2
3
4
1
14
57
2
15
32
10
2
11
5
1
2
1
53
5
142
169
4
3
29
6
158
21
2,081
4
6
25
50
7
3,362
7
459
49
333
12
3
3
340
1
96
33
4
1,100
19
14
3
2
2
180
3
197
5
16
1,577
80
58
379
9
1
193
1
28
81
23
1
7
3
47
44
2
3
8
82
2
3
45
29
6
14
1
3
10,366
7,665
2
9
1
5
1
1
2
3
2
3
1
8
13
1
1
1
1
1
1
3
19
5
6
14
2
2
1
1
2
3
5
3
6
2
1
4
25
23
1
5
2
23
2
307
1
2
1
3
1
966
1
116
8
42
1
1
15
19
6
1
372
8
3
22
33
385
11
19
53
3
1
36
6
6
3
10
7
1
10
5
2
2
4
10,374
624
2
1
43
7
9
12
10
51
10
5
7
2
41
6
10
15
28
4
10
3
13
4
1
46
50
5
8
4
2
12
5
5
7
50
1
70
43
91
7
18
1
8
9
5
1
3
2
1
11
52
2
12
26
8
2
11
5
1
2
49
5
117
146
3
3
24
4
135
19
1,774
3
4
24
47
6
2,396
6
343
41
291
11
2
3
235
1
77
27
3
728
11
11
3
2
2
158
3
164
5
16
1,192
69
39
326
6
157
1
22
75
20
1
7
3
37
37
2
3
7
72
2
3
40
27
4
10
1
3
Enrollment by Georgia County of Residence*, Fall 2018*Excludes international students
25

GA County Undergraduate Graduate Institute TotalMonroeMontgomery
Morgan
Murray
Muscogee
Newton
Oconee
Oglethorpe
Paulding
Peach
Pickens
Pierce
Pike
Polk
Pulaski
Putnam
Rabun
Richmond
Rockdale
Schley
Screven
Spalding
Stephens
Sumter
Tattnall
Thomas
Tift
Toombs
Towns
Troup
Twiggs
Union
Upson
Walker
Walton
Ware
Washington
Wayne
White
Whitfield
Wilkes
Worth
Glascock
Unknown
Institute Total 20,740
8,289
2
1
2
52
7
10
12
10
56
11
6
9
2
44
6
12
15
28
4
10
3
16
5
1
54
63
6
9
4
3
13
6
6
10
69
1
75
49
105
9
20
19
9
5
2
3
4
1
14
57
2
15
32
10
2
11
5
1
2
1
53
5
142
169
4
3
29
6
158
21
2,081
4
6
25
50
7
3,362
7
459
49
333
12
3
3
3
40
1
96
33
4
1,100
19
14
3
2
2
180
3
197
5
16
1,577
80
58
379
9
1
193
1
28
81
23
1
7
3
47
44
2
3
8
82
2
3
45
29
6
14
1
3
10,366
7,665
2
9
1
5
1
1
2
3
2
3
1
8
13
1
1
1
1
1
1
3
19
5
6
14
2
2
1
1
2
3
5
3
6
2
1
4
25
23
1
5
2
23
2
307
1
2
1
3
1
966
1
116
8
42
1
1
1
5
19
6
1
372
8
3
22
33
385
11
19
53
3
1
36
6
6
3
10
7
1
10
5
2
2
4
10,374
624
2
1
43
7
9
12
10
51
10
5
7
2
41
6
10
15
28
4
10
3
13
4
1
46
50
5
8
4
2
12
5
5
7
50
1
70
43
91
7
18
18
9
5
1
3
2
1
11
52
2
12
26
8
2
11
5
1
2
49
5
117
146
3
3
24
4
135
19
1,774
3
4
24
47
6
2,396
6
343
41
291
11
2
3
2
35
1
77
27
3
728
11
11
3
2
2
158
3
164
5
16
1,192
69
39
326
6
157
1
22
75
20
1
7
3
37
37
2
3
7
72
2
3
40
27
4
10
1
3
Enrollment by Georgia County of Residence*, Fall 2018*Excludes international students
26

2018 Fact BookDegrees Awarded

Institute Degree Level 2009 2010 2011 2012 2013 2014 2015 2016 2017 2018
Institute Bachelor's
Master's
Ph.D.
Institute Total
530
3,042
3,516
508
2,524
3,608
531
2,296
3,420
526
1,882
3,275
552
1,987
3,268
487
1,961
3,121
483
1,931
2,873
449
1,889
3,062
416
1,770
2,842
490
1,876
2,695
7,0886,6406,2475,6835,8075,5695,2875,4005,0285,061
College Degree Level 2009 2010 2011 2012 2013 2014 2015 2016 2017 2018
College ofComputing
Bachelor's
Master's
Ph.D.
Total
College ofDesign
Bachelor's
Master's
Ph.D.
Total
College ofEngineering
Bachelor's
Master's
Ph.D.
Total
College ofSciences
Bachelor's
Master's
Ph.D.
Total
Ivan AllenCollege
Bachelor's
Master's
Ph.D.
Total
SchellerCollege ofBusiness
Bachelor's
Master's
Ph.D.
Total
1,713
41
1,048
624
1,218
34
707
477
766
52
326
388
560
53
190
317
537
46
205
286
506
53
208
245
448
47
179
222
538
33
271
234
437
40
218
179
516
31
298
187
305
14
218
73
259
17
173
69
292
15
201
76
273
9
167
97
244
8
136
100
300
9
177
114
354
14
192
148
366
14
191
161
344
10
186
148
330
7
158
165
3,613
345
1,175
2,093
3,784
358
1,083
2,343
3,715
346
1,227
2,142
3,384
358
1,040
1,986
3,459
378
1,103
1,978
3,186
312
1,051
1,823
3,015
309
1,043
1,663
3,027
294
988
1,745
2,855
263
948
1,644
2,909
332
1,034
1,543
512
108
153
251
436
74
143
219
488
91
147
250
487
81
132
274
545
102
129
314
523
90
112
321
471
94
105
272
467
86
111
270
444
82
120
242
471
102
113
256
212
17
68
127
231
21
80
130
243
17
59
167
257
16
47
194
295
13
84
198
302
15
78
209
326
15
92
219
333
14
77
242
331
15
75
241
277
11
83
183
733
5
380
348
712
4
338
370
743
10
336
397
722
9
306
407
727
5
330
392
752
8
335
409
673
4
320
349
669
8
251
410
617
6
223
388
558
7
190
361
Summary of Degrees Conferred by College and Degree Level, Ten-Year History
28

College Major 2009 2010 2011 2012 2013 2014 2015 2016 2017 2018College ofComputing
Computational Media
Computer Science
TotalCollege ofDesign
Architecture
Building Construction
Industrial Design
TotalCollege ofEngineering
Aerospace Engineering
Biomedical Engineering
Chemical and Biomolecular Eng
Civil Engineering
Civil Engineering - REP
Computer Engineering
Computer Engineering - REP
Electrical Engineering
Electrical Engineering - REP
Environmental Engineering
Industrial Engineering
Materials Science & Engr
Mechanical Engineering
Mechanical Engineering - REP
Nuclear & Radiological Engr
Polymer & Fiber Engr
Unknown
TotalCollege ofSciences
Applied Mathematics
Applied Physics
BiochemistryBiology
624
597
27
477
458
19
388
365
23
317
288
29
286
246
40
245
220
25
222
180
42
234
187
47
179
157
22
187
173
14
73
47
26
69
40
29
76
30
9
37
97
30
17
50
100
33
21
46
114
39
19
56
148
40
47
61
161
48
38
75
148
24
56
68
165
38
55
72
2,093
30
499
70
337
39
202
153
127
217
245
174
2,343
21
594
73
404
39
245
131
154
214
257
211
2,142
1
23
510
69
393
39
242
129
130
189
255
162
1,986
14
32
479
41
345
32
239
109
152
172
214
157
1,978
18
55
4
450
48
350
46
3
230
84
152
165
231
142
1,823
24
38
41
362
30
315
32
13
225
1
72
21
170
158
175
146
1,663
26
22
31
365
23
282
36
15
188
1
64
25
179
142
147
117
1,745
29
39
17
394
29
312
14
17
183
3
72
21
183
128
157
147
1,644
20
27
29
358
23
302
15
10
210
8
67
19
174
100
143
139
1,543
18
32
16
331
26
281
6
17
195
3
53
20
201
98
134
112
251
35
31
31
11
4
22
71
45
1
219
20
26
14
9
12
73
40
2
23
250
33
30
14
9
15
77
49
3
20
274
44
34
6
4
19
95
38
34
314
38
28
18
6
25
119
57
3
20
321
35
33
9
5
27
108
65
39
272
31
29
14
8
24
96
35
2
33
270
24
22
15
8
21
103
49
28
242
25
30
10
8
31
92
24
1
21
256
35
36
17
1
29
101
17
1
19
Bachelor's Degrees Conferred by College, Ten-Year History
29

College Major 2009 2010 2011 2012 2013 2014 2015 2016 2017 2018College ofSciences
BiochemistryBiology
Chemistry
Discrete Mathematics
Earth & Atmospheric Sciences
Mathematics
Physics
Psychology
TotalIvan AllenCollege
Applied Lang/Intercultural St
Computational Media
Econ & Int'l Affairs
Economics
Global Econ/Mod Lang
History, Technology, & Society
Int'l Affairs & Mod Lang
International Affairs
Lit., Media, & Communication
Public Policy
Science, Technology, & Culture
TotalSchellerCollege ofBusiness
Business Administration
Management
Total
Institute Total
251
35
31
31
11
4
22
7145
1
219
20
26
14
9
12
7340
2
23
250
33
30
14
9
15
7749
3
20
274
44
34
6
4
19
9538
34
314
38
28
18
6
25
11957
3
20
321
35
33
9
5
27
10865
39
272
31
29
14
8
24
9635
2
33
270
24
22
15
8
21
10349
28
242
25
30
10
8
31
9224
1
21
256
35
36
17
1
29
10117
1
19
127
15
20
21
12
4
1
17
8
18
11
130
12
23
20
8
13
16
4
23
11
167
8
24
34
9
15
1
21
13
24
18
194
26
14
2
26
23
18
7
18
11
28
21
198
33
17
29
13
26
2
25
12
32
9
209
46
18
22
38
15
4
17
18
25
6
219
50
13
45
31
20
7
18
10
21
4
242
36
20
53
24
28
5
24
12
39
1
241
52
14
64
37
14
4
21
9
26
183
33
14
46
28
13
3
15
17
14
348
2
346
370
1
369
397
64
333
407
218
189
392
279
113
409
316
93
349
349
410
410
388
388
361
361
3,5163,6083,4203,2753,2683,1212,8733,0622,8422,695
Bachelor's Degrees Conferred by College, Ten-Year History
30

College Major 2009 2010 2011 2012 2013 2014 2015 2016 2017 2018College ofComputing
Analytics
Bioengineering
Computational Sci & Engr
Computer Science
Cybersecurity
Human-Computer Interaction
Information Security
TotalCollege ofDesign
Architectural Technology
Architecture
Building Construction
City Planning
Geograhic Info Science & Tech
Human-Computer Interaction
Industrial Design
Music Technology
Real Estate Development
Urban Design
TotalCollege ofEngineering
Aerospace Engineering
Analytics
Applied Systems Engineering
Bioengineering
Biomedical Engineering
Biomedical Innovation/Develop
Chemical Engineering
Civil Engineering
Computational Sci & EngrElectrical & Computer Engr
1,048
25
12
941
53
17
707
56
26
583
35
7
326
12
24
249
37
4
190
18
30
125
17
205
20
18
153
14
208
21
19
143
25
179
22
24
123
10
271
31
21
213
6
218
14
19
180
5
298
24
23
249
2
218
11
1
11
15
13
9
42
47
3
66
173
2
16
11
9
8
46
44
31
6
201
2
9
18
10
5
37
48
72
167
6
12
25
2
3
36
35
48
136
4
9
6
37
35
45
177
9
9
9
42
47
61
192
2
13
14
39
62
62
191
4
12
57
47
71
186
5
9
49
69
54
158
4
16
37
36
65
1,175
46
17
15
2
29
5
10
225
13
6
26
3
25
4
354
28
102
35
28
3
10
24
22
143
1,083
27
48
20
13
31
6
2
200
9
2
30
6
30
4
311
37
97
22
30
2
4
22
15
115
1,227
54
10
17
1
24
8
10
11
204
16
9
31
6
37
2
457
16
85
20
21
2
4
28
11
143
1,040
46
8
16
1
19
5
9
10
204
18
9
26
7
29
4
334
8
93
20
10
1
6
32
125
1,103
51
11
34
36
13
11
185
14
15
61
5
29
3
335
2
89
27
2
7
26
147
1,051
46
18
20
26
12
13
213
12
18
83
5
33
4
290
1
77
25
8
15
132
1,043
12
20
22
2
11
11
7
226
15
14
72
7
21
3
343
1
79
13
2
11
8
143
988
18
14
2
32
8
16
188
12
2
100
10
22
3
317
1
87
10
1
7
138
948
12
25
2
1
24
4
17
153
5
32
105
16
20
3
307
74
15
1
5
127
1,034
17
30
1
3
22
7
17
184
11
24
113
11
19
2
341
79
18
4
11
120
Master's Degrees Conferred by College, Ten-Year History
31

College Major 2009 2010 2011 2012 2013 2014 2015 2016 2017 2018College ofEngineering
Computational Sci & EngrElectrical & Computer Engr
Engineering Sci & Mechanics
Environmental Engineering
Health Systems
Industrial Engineering
International Logistics
Manufacturing Leadership
Materials Science & Engr
Mechanical Engineering
Medical Physics
Nuclear & Radiological Engr
Nuclear Engineering
Operations Research
Paper Science Engineering
Polymer, Textile & Fiber Engr
Quanta/Computation Fin
Statistics
Supply Chain Engineering
Sustainable Electrial Energy
TotalCollege ofSciences
Bioinformatics
Biology
Chemistry
Computational Sci & Engr
Earth & Atmospheric Sciences
Human-Computer Interaction
Mathematics
PhysicsProsthetics & Orthotics
1,175
46
17
15
2
29
5
10
225
13
6
26
3
25
4
35428
102
35
28
3
10
24
22
143
1,083
27
48
20
13
31
6
2
200
9
2
30
6
30
4
31137
97
22
30
2
4
22
15
115
1,227
54
10
17
1
24
8
10
11
204
16
9
31
6
37
2
45716
85
20
21
2
4
28
11
143
1,040
46
8
16
1
19
5
9
10
204
18
9
26
7
29
4
3348
93
20
10
1
6
32
125
1,103
51
11
34
36
13
11
185
14
15
61
5
29
3
3352
89
27
2
7
26
147
1,051
46
18
20
26
12
13
213
12
18
83
5
33
4
2901
77
25
8
15
132
1,043
12
20
22
2
11
11
7
226
15
14
72
7
21
3
3431
79
13
2
11
8
143
988
18
14
2
32
8
16
188
12
2
100
10
22
3
3171
87
10
1
7
138
948
12
25
2
1
24
4
17
153
5
32
105
16
20
3
307
74
15
1
5
127
1,034
17
30
1
3
22
7
17
184
11
24
113
11
19
2
341
79
18
4
11
120
153
9
16
10
14
18
8
5
12
10
12
6
33
143
5
21
13
12
19
8
7
11
19
5
23
147
9
17
11
14
19
21
4
7
9
9
7
20
132
6
17
11
14
6
15
6
8
1
21
12
15
129
9
9
10
11
15
9
4
13
2
19
8
20
112
6
14
9
10
16
12
1
9
14
8
13
105
1
16
8
9
10
8
1
12
1
17
12
10
111
12
10
10
11
16
2
11
3
16
10
10
120
1
16
11
10
8
13
2
17
17
9
16
113
2
16
8
10
10
13
13
22
6
13
Master's Degrees Conferred by College, Ten-Year History
32

College Major 2009 2010 2011 2012 2013 2014 2015 2016 2017 2018College ofSciences
PhysicsProsthetics & Orthotics
Psychology
Quanta/Computation Fin
Statistics
TotalIvan AllenCollege
Digital Media
Economics
Hist & Soc of Tech & Science
Human-Computer Interaction
International Affairs
Public Policy
TotalSchellerCollege ofBusiness
Analytics
Business Administration
Management
Management of Technology
MBA-Global Business
Quanta/Computation Fin
Total
Institute Total
153
9
16
10
1418
8
5
12
10
12
6
33
143
5
21
13
1219
8
7
11
19
5
23
147
9
17
11
1419
21
4
7
9
9
7
20
132
6
17
11
146
15
6
8
1
21
12
15
129
9
9
10
1115
9
4
13
2
19
8
20
112
6
14
9
1016
12
1
9
14
8
13
105
1
16
8
910
8
1
12
1
17
12
10
111
12
10
1011
16
2
11
3
16
10
10
120
1
16
11
108
13
2
17
17
9
16
113
2
16
8
1010
13
13
22
6
13
68
12
16
9
4
14
13
80
9
26
7
4
18
16
59
9
12
5
6
16
11
47
11
20
2
4
1
9
84
20
19
7
3
21
14
78
26
16
4
6
19
7
92
17
25
5
6
22
17
77
11
24
2
5
19
16
75
14
25
5
7
12
12
83
8
38
2
8
14
13
380
16
70
63
4
210
17
338
18
57
64
5
180
14
336
13
58
62
13
176
14
306
15
34
54
65
138
330
17
54
46
138
75
335
18
31
47
237
2
320
23
31
40
226
251
7
44
46
154
223
20
52
35
116
190
17
49
34
90
3,0422,5242,2961,8821,9871,9611,9311,8891,7701,876
Master's Degrees Conferred by College, Ten-Year History
33

College Major 2009 2010 2011 2012 2013 2014 2015 2016 2017 2018College ofComputing
Algor, Combntrcs & OptimiztionBioinformaticsComputational Sci & EngrComputer ScienceHuman-Centered ComputingRoboticsTotal
College of Design ArchitectureBuilding ConstructionCity & Regional PlanningMusic TechnologyTotal
College ofEngineering
Aerospace EngineeringAlgor, Combntrcs & OptimiztionBioengineeringBioinformaticsBiomedical EngineeringBMED Joint Emory/PKUChemical EngineeringCivil EngineeringComputational Sci & EngrElectrical & Computer EngrEngineering Sci & MechanicsEnvironmental EngineeringIndustrial EngineeringMaterials Science & EngrMechanical EngineeringNuclear & Radiological EngrNuclear EngineeringOperations ResearchPaper Science EngineeringPolymer, Textile & Fiber Engr
4134239
2
3414242
3
5243402
3
537630415
4621394
5331332113
47
1031213
33
4252
2
40
1361
2
31
326
2
141337
17
5210
15
1410
9
243
8
413
9
6
3
14
1
13
14
14
10
10
7
7
345
5
10653826155
9132435522
13141
358
2
15185319137197
2239715
12146
346
44
9384832105
92
2734119
17
33
358
9
5
64916199
108
3241114
13135
378
68
3
751152115
9912236319223
47
312
10
3153311256
97
352219
19233
309
28
32418205
105
3122
10
23
38
294
13
42615218
72
2541
16
20231
263
61
8299215
75
1630
10
23129
3321
144
13817229
92
934
18127144
Ph.D. Degrees Conferred by College, Ten-Year History
34
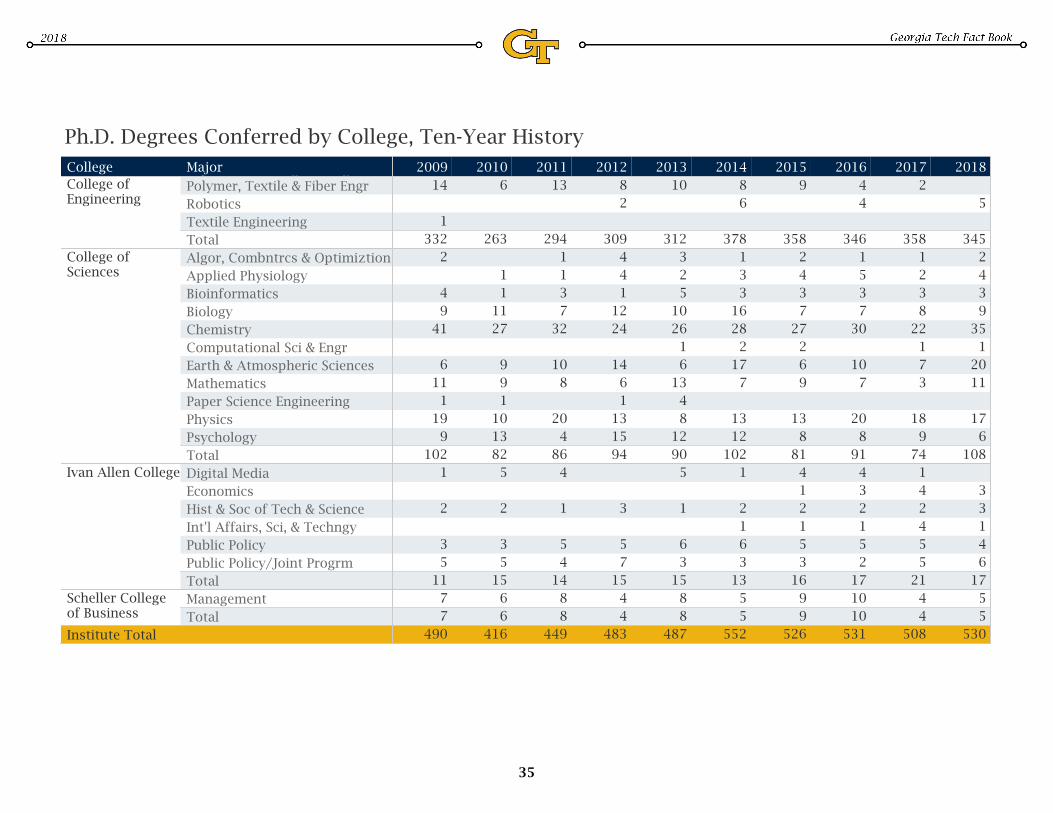
College Major 2009 2010 2011 2012 2013 2014 2015 2016 2017 2018College ofEngineering
Paper Science EngineeringPolymer, Textile & Fiber EngrRoboticsTextile EngineeringTotal
College ofSciences
Algor, Combntrcs & OptimiztionApplied PhysiologyBioinformaticsBiologyChemistryComputational Sci & EngrEarth & Atmospheric SciencesMathematicsPaper Science EngineeringPhysicsPsychologyTotal
Ivan Allen CollegeDigital MediaEconomicsHist & Soc of Tech & ScienceInt'l Affairs, Sci, & TechngyPublic PolicyPublic Policy/Joint ProgrmTotal
Scheller Collegeof Business
ManagementTotal
Institute Total
345
5
10653826155
9132435522
13141
358
2
15185319137197
2239715
12146
346
44
9384832105
92
2734119
17
33
358
9
5
64916199
108
3241114
13135
378
68
3
751152115
9912236319223
47
312
10
3153311256
97
352219
19233
309
28
32418205
105
3122
10
23
38
294
13
42615218
72
2541
16
20231
263
61
8299215
75
1630
10
23129
3321
144
13817229
92
934
18127144
108617
11201359342
74918
371228321
91820
710
307351
81813
962277342
1021213
71722816331
90128413612610523
9415131614
2412144
86420
810
327311
821310199
271111
1029191116
4194
2
1764133
21554241
17251234
16351214
133612
1
1536
1
5
1575
3
1445
1
4
1553
2
5
1153
2
1
55
44
1010
99
55
88
44
88
66
77
530508531526552487483449416490
Ph.D. Degrees Conferred by College, Ten-Year History
35

Degree Le..College Na..
Institute
Male Female
InstituteTotal
Bachelor's College of ..
College of ..
College of ..
College of ..
Ivan Allen ..
Scheller C..
Total
Master's College of ..
College of ..
College of ..
College of ..
Ivan Allen ..
Scheller C..
Total
Ph.D. College of ..
College of ..
College of ..
College of ..
Ivan Allen ..
Scheller C..
Total
Institute Total
1,204
160
75
140
635
52
142
2,312
188
52
111
1,458
21
482
3,516
348
127
251
2,093
73
624
772
99
33
67
292
104
177
2,270
281
35
86
883
114
871
3,042
380
68
153
1,175
218
1,048
124
2
6
33
66
7
10
406
3
11
75
279
7
31
530
5
17
108
345
14
41
2,1004,988 7,088
Degree Le..College Name
Asian
Male Female
Black or AfricanAmerican
Male Female
Hispanic orLatino
Male Female
White
Male Female
Other/Unknown
Male Female
International
Male Female
Bachelor's College of Computing
College of Design
College of Engineering
College of Sciences
Ivan Allen College
Scheller College of Business
Total
Master's College of Computing
College of Design
College of Engineering
College of Sciences
Ivan Allen College
Scheller College of Business
Total
Ph.D. College of Computing
College of Design
College of Engineering
College of Sciences
Ivan Allen College
Scheller College of Business
Total
Institute Total
233
27
7
32
111
12
44
474
30
7
24
274
1
138
75
6
6
9
45
1
8
134
14
2
3
93
2
20
68
6
11
3
42
1
5
132
6
2
8
86
2
28
633
103
46
79
331
29
45
1,174
115
34
67
745
14
199
67
5
3
5
40
4
10
115
14
5
5
61
30
128
13
2
12
66
5
30
283
9
2
4
199
2
67
81
18
1
2
22
4
34
283
31
1
4
90
7
150
37
12
3
3
9
8
2
79
31
1
15
9
23
24
5
2
8
6
3
88
9
1
5
28
6
39
224
47
16
26
71
31
33
930
154
19
40
316
36
365
16
4
3
7
1
1
59
8
1
22
1
27
390
13
13
31
175
54
104
831
48
13
36
412
55
267
17
1
5
9
2
23
1
3
18
1
7
3
2
1
1
4
2
1
1
6
2
4
9
3
4
2
41
2
16
18
1
4
141
8
30
98
5
4
1
2
1
8
1
6
1
49
1
4
6
31
4
3
221
2
3
36
152
6
22
331780 119217 98229 8982,245 87182 5671,335
Degrees Conferred by College, Ethnicity, and Gender, AY 2018
36

Country Bachelor's Master's Ph.D.Institute Total
Australia
Austria
Azerbaijan
Bahamas
Bangladesh
Belarus
Belgium
Benin
Bolivia
Brazil
Brunei
Bulgaria
Burma (Myanmar)
Burundi
Cameroon
Canada
Chile
China
Colombia
Congo
Costa Rica
Cote D'Ivoire
Croatia
Czech Republic
Dem. Republic of the Congo
Dominican Republic
Ecuador
Egypt
El Salvador
Estonia
France
Germany
Ghana
Greece
Guatemala
Honduras
Hong Kong
Hungary
India
Indonesia
Iran
Israel
Italy
Jamaica
Japan
JordanKazakhstan
1,902
11
14
7
1
1
27
4
8
27
2
1
2
6
5
13
2
4
1
3
1
1
3
2
5
24
1
2
18
2
2
2
3
10
1
2
8
1
7
1
1
7
158
4
1
1
9
6
9
5
32
15
534
2
7
1
3
7
3
11
79
1
3
7
6
2
1
3
2
2
4
1
12
645
9
25
1
1
3
3
1
15
2
1
2
1
7
1
1
2
8
270
1
1
1
8
1
11
1
2
1
2
1
1
8
1
1
1
2
30
2
2
17
35
1
5
1
2
1
1
2
1
2
114
2
1
1
2
2
1
1
1,221
4
4
1
14
4
3
15
1
1
3
2
10
1
1
2
1
2
1
2
16
1
1
7
2
1
2
2
10
1
6
5
1
5
43
3
1
1
4
5
4
4
14
7
418
2
5
1
2
11
74
1
2
4
2
2
1
1
8
416
7
22
1
3
5
1
1
2
2
1
2
6
411
6
13
2
1
5
4
1
1
1
1
3
2
1
1
1
1
1
1
2
1
10
1
2
2
2
1
85
1
3
1
3
1
1
8
81
2
3
1
3
1
3
1
2
1
1
2
1
4
115
2
1
2
1
8
1
1
3
1
Degrees Conferred by Country of Residence, AY 2018
37

Country Bachelor's Master's Ph.D.Institute TotalJordanKazakhstan
Kenya
Korea, Republic of (South)
Lebanon
Macao
Madagascar
Malaysia
Mauritius
Mexico
Mongolia
Montenegro (Prior to 2001)
Morocco
Nepal
Netherlands
New Zealand
Nicaragua
Nigeria
Norway
Oman
Pakistan
Panama
Peru
Philippines
Poland
Portugal
Russia
Rwanda
Saudi Arabia
Serbia (Prior to 2001)
Singapore
South Africa
Spain
Sri Lanka
Sweden
Syria
Taiwan
Thailand
Tunisia
Turkey
Ukraine
United Arab Emirates
United Kingdom
Venezuela
Vietnam
Institute Total 1,902
11
14
7
1
1
27
4
8
27
2
1
2
6
5
13
2
4
1
3
1
1
3
2
5
24
1
2
18
2
2
2
3
10
1
2
8
1
7
1
1
7
158
4
11
9
6
9
5
32
15
534
2
7
1
3
7
3
11
79
1
3
7
6
2
1
3
2
2
4
1
12
645
9
25
1
1
3
3
1
15
2
1
2
1
7
1
1
2
8
270
1
1
1
8
1
11
1
2
1
2
1
1
8
1
1
1
2
30
2
2
17
35
1
5
1
2
1
1
2
1
2
114
2
1
1
2
2
1
1
1,221
4
4
1
14
4
3
15
1
1
3
2
10
1
1
2
1
2
1
2
16
1
1
7
2
1
2
2
10
1
6
5
1
5
43
3
11
4
5
4
4
14
7
418
2
5
1
2
11
74
1
2
4
2
2
1
1
8
416
7
22
1
3
5
1
1
2
2
1
2
6
411
6
13
2
1
5
4
1
1
1
1
3
2
1
1
1
1
1
1
2
1
10
1
2
2
2
1
85
1
3
1
3
1
1
8
81
2
3
1
3
1
3
1
2
1
1
2
1
4
115
2
1
2
1
8
1
1
3
1
Degrees Conferred by Country of Residence, AY 2018
38

State/U.S. Territory Bachelor's Master's Ph.D. Institute Total
Alabama
Alaska
Arizona
Arkansas
California
Colorado
Connecticut
Delaware
District of Columbia
Florida
Georgia
Hawaii
Idaho
Illinois
Indiana
Iowa
Kansas
Kentucky
Louisiana
Maine
Maryland
Massachusetts
Michigan
Minnesota
Mississippi
Missouri
Montana
Nebraska
Nevada
New Hampshire
New Jersey
New Mexico
New York
North Carolina
Ohio
Oklahoma
Oregon
Pennsylvania
Rhode IslandSouth Carolina
5,186
175
1
21
4
16
16
1
32
131
8
15
163
66
1
55
3
95
23
2
58
113
129
22
126
13
6
5
3
29
4
17
38
82
81
5
24
27
10
8
14
72
8
4
2,829
251
12
12
39
23
207
6
21
2
58
260
11
2
1
2
6
3
3
14
5
8
10
4
10
8
2
10
1
2
1
1
7
11
9
1
4
2
3
1
2
5
66
17
1
3
17
1
1
5
1,821
119
2
6
9
1
20
57
2
11
83
30
29
2
37
16
1
26
43
74
19
49
6
6
3
3
15
2
9
29
33
27
1
11
15
4
5
8
30
6
3
656
97
10
6
15
17
122
1
12
1
32
3,105
45
1
21
2
8
6
10
68
3
1
66
31
1
18
1
48
7
1
28
60
47
1
67
6
2
12
1
7
2
38
45
3
9
10
3
2
4
37
2
1
2,107
137
2
6
23
3
68
4
8
1
21
Degrees Conferred by State of Residence, AY 2018
39

State/U.S. Territory Bachelor's Master's Ph.D. Institute TotalRhode IslandSouth Carolina
South Dakota
Tennessee
Texas
Utah
Vermont
Virginia
Washington
West Virginia
Wisconsin
Puerto Rico
North Dakota
US Citiz No State (SIRS ..
Wyoming
ZOARESI use only
Institute Total 5,186
175
1
21
4
16
16
1
32
131
8
15
163
66
1
553
95
23
2
58
113
129
22
126
13
6
5
3
29
4
17
38
82
81
5
24
27
10
8
14
72
8
4
2,829
251
12
12
39
23
207
6
21
2
58
260
11
2
1
2
6
3
3
14
5
8
10
4
10
8
2
10
1
2
1
1
7
11
9
1
4
2
3
1
2
5
66
17
1
3
17
1
1
5
1,821
119
2
6
9
1
20
57
2
11
83
30
292
37
16
1
26
43
74
19
49
6
6
3
3
15
2
9
29
33
27
1
11
15
4
5
8
30
6
3
656
97
10
6
15
17
122
1
12
1
32
3,105
45
1
21
2
8
6
10
68
3
1
66
31
1
181
48
7
1
28
60
47
1
67
6
2
12
1
7
2
38
45
3
9
10
3
2
4
37
2
1
2,107
137
2
6
23
3
68
4
8
1
21
Degrees Conferred by State of Residence, AY 2018
40

County Bachelor's Master's Ph.D. Institute Total
Barrow
Bartow
Bibb
Bryan
Bulloch
Camden
Carroll
Catoosa
Chatham
Cherokee
Clarke
Clayton
Cobb
Colquitt
Columbia
Coweta
DeKalb
Dougherty
Douglas
Effingham
Fayette
Floyd
Forsyth
Fulton
Gilmer
Glynn
Gordon
Gwinnett
Habersham
Hall
Harris
Henry
Houston
Jackson
Jones
Lamar
Lee
Liberty
Lowndes
Lumpkin
Morgan
Murray
Muscogee
Newton
Oconee
Paulding
Pickens
RichmondRockdale
5,186
2,324
3
1
3
1
1
1
1
1
1
2
2
1
1
1
2
1
1
1
2
1
3
3
3
2
1
2
3
1
4
6
2
1
3
4
15
3
1
1
11
3
1
16
3
2
1
16
17
1
14
4
7
28
1
2
3
13
1
9
1
2
3
32
39
3
44
6
452
7
12
3
752
107
10
94
10
15
6
282
29
51
1
384
32
10
87
49
10
16
4
10
12
31
11
6
260
195
1
1
1
1
1
1
3
10
20
1
11
1
7
2
1
1
1
1
1,821
1,146
2
1
1
1
2
2
1
2
1
1
5
4
2
1
4
1
1
3
1
1
1
4
4
1
5
1
67
2
246
15
4
18
2
3
89
1
10
123
4
3
12
7
2
4
1
5
3
1
3,105
983
3
1
3
1
1
1
1
1
1
2
1
1
1
2
1
1
1
2
1
2
3
2
2
1
2
2
1
2
4
2
1
3
3
12
2
1
1
11
3
1
14
3
2
1
10
13
1
12
4
6
23
2
2
9
8
1
1
3
28
34
2
36
5
375
5
12
3
486
91
6
76
8
12
6
182
28
40
1
254
28
7
73
41
8
12
3
8
12
25
8
5
Degrees Conferred by Georgia County of Residence, AY 2018
41

County Bachelor's Master's Ph.D. Institute TotalRichmondRockdale
Stephens
Thomas
Tift
Troup
Union
Walker
Walton
Ware
Wayne
White
Whitfield
Baldwin
Ben Hill
Bleckley
Dade
Dawson
Decatur
Dodge
Elbert
Emanuel
Fannin
Franklin
Greene
Haralson
Hart
Jasper
Macon
McIntosh
Meriwether
Peach
Polk
Schley
Telfair
Towns
Upson
Wilkes
Worth
Berrien
Burke
Calhoun
Jeff Davis
Laurens
Monroe
Twiggs
Washington
Not Reported
Institute Total 5,186
2,324
3
1
3
1
1
1
1
1
1
2
2
1
1
1
2
1
1
1
2
1
3
3
3
2
1
2
3
1
4
6
2
1
3
4
15
3
1
1
11
3
1
16
3
2
1
1617
1
14
4
7
28
1
2
3
13
1
9
1
2
3
32
39
3
44
6
452
7
12
3
752
107
10
94
10
15
6
282
29
51
1
384
32
10
87
49
10
16
4
10
12
31
11
6
260
195
1
1
1
1
1
1
3
10
20
1
11
1
7
2
1
1
1
1
1,821
1,146
2
1
1
1
2
2
1
2
1
1
54
2
1
4
1
1
3
1
1
1
4
4
1
5
1
67
2
246
15
4
18
2
3
89
1
10
123
4
3
12
7
2
4
1
5
3
1
3,105
983
3
1
3
1
1
1
1
1
1
2
1
1
1
2
1
1
1
2
1
2
3
2
2
1
2
2
1
2
4
2
1
3
3
12
2
1
1
11
3
1
14
3
2
1
1013
1
12
4
6
23
2
2
9
8
1
1
3
28
34
2
36
5
375
5
12
3
486
91
6
76
8
12
6
182
28
40
1
254
28
7
73
41
8
12
3
8
12
25
8
5
Degrees Conferred by Georgia County of Residence, AY 2018
42

2018 Fact BookInstitute Information

College Level A B C D F S* U* I* W* V*AVG
GradeLower 44.7 22.6 10.0 3.1 2.9 10.7 0.3 0.6 5.0 0.0 3.35
Upper 65.1 21.4 5.3 0.7 0.7 0.0 0.1 0.3 6.3 0.2 3.63
Grad 50.4 18.4 3.0 0.9 1.6 3.4 0.1 0.6 19.1 2.5 3.63
Computing Total 51.9 19.9 4.9 1.4 1.7 4.3 0.1 0.5 13.8 1.6 3.57
Lower 66.0 24.5 3.9 0.6 0.5 2.1 0.0 0.5 1.8 0.0 3.64
Upper 82.8 11.5 2.2 0.3 0.5 0.2 0.1 0.4 2.0 0.1 3.83
Grad 62.8 18.0 2.0 0.1 0.2 8.7 0.2 1.0 2.5 4.6 3.73
Design Total 70.2 17.8 2.6 0.3 0.4 4.1 0.1 0.7 2.1 1.8 3.74
Lower 51.2 26.3 10.2 2.2 1.4 2.6 0.0 0.3 5.5 0.3 3.41
Upper 48.7 29.2 10.8 2.2 1.1 0.9 0.0 0.4 4.2 2.6 3.37
Grad 42.4 16.3 1.9 0.2 0.2 29.7 0.4 0.2 3.3 5.3 3.66
Engineering Total 47.0 24.3 7.7 1.5 0.9 10.8 0.1 0.3 4.1 3.1 3.45
Lower 64.8 21.9 5.3 0.9 0.8 2.3 0.3 0.3 3.2 0.3 3.62
Upper 68.4 19.0 4.0 0.5 0.7 3.0 0.1 0.4 3.5 0.4 3.69
Grad 51.1 10.9 1.2 0.2 0.4 25.2 0.1 0.6 1.4 9.0 3.78
Ivan Allen Total 64.9 20.0 4.5 0.7 0.8 4.4 0.2 0.3 3.1 1.0 3.65
Lower 57.4 24.4 8.4 3.1 1.2 0.6 0.2 0.4 4.3 0.0 3.46
Upper 66.1 24.0 5.4 1.0 0.2 1.0 0.0 0.2 2.0 0.1 3.61
Grad 73.2 17.1 1.5 0.2 0.3 3.5 0.0 0.2 1.9 2.1 3.78
Scheller Total 68.7 20.5 3.8 0.9 0.4 2.2 0.0 0.2 2.2 1.1 3.67
Lower 48.6 29.9 11.4 3.1 1.6 0.6 0.0 0.3 4.3 0.1 3.33
Upper 52.2 25.7 9.2 1.8 1.2 1.3 0.0 0.5 6.9 1.2 3.44
Grad 39.1 10.2 1.6 0.1 0.1 31.2 0.3 0.5 2.4 14.4 3.73
Sciences Total 48.0 26.4 9.6 2.4 1.3 5.0 0.1 0.3 4.5 2.3 3.39
Lower 86.5 2.7 0.7 0.1 0.1 5.7 0.2 0.0 1.8 2.3 3.95
Upper 41.1 4.5 0.6 0.0 0.2 7.8 0.1 0.1 1.9 43.7 3.88
Grad 3.1 0.1 0.1 0.0 0.0 55.9 1.2 0.0 3.4 36.1 3.90
Registrar Total 56.6 2.8 0.6 0.0 0.1 15.5 0.3 0.0 2.1 21.9 3.93
Lower 54.8 24.8 8.9 2.3 1.5 3.0 0.1 0.3 4.1 0.3 3.46
Upper 56.3 24.2 7.8 1.5 0.9 1.4 0.0 0.4 4.3 3.3 3.51
Grad 49.5 16.3 2.2 0.5 0.8 15.6 0.2 0.4 9.2 5.3 3.68
Institute Total 53.5 21.8 6.3 1.4 1.0 6.7 0.1 0.4 5.9 3.0 3.54
*S Satisfactory completion of a course taken under pass/fail, or in which no other letter grade may be assigned
*U Unsatisfactory completion of a course taken under pass/fail, or in which no other letter grade may be assigned
*I Incomplete
*W Withdrew
*V Audit (no academic achievement implied)
Student Grades by College & Percent, Fall Semester 2018
College of Registrar
Institute
College of Computing
College of Design
College of Engineering
Ivan Allen College
Scheller College of Business
College of Sciences
44

2014 2015 2016 2017 2018
Lower Level 22,749 24,429 26,756 27,375 28,656
Upper Level 13,125 16,714 19,561 23,151 25,216
Graduate 20,006 34,331 45,108 56,426 71,636
Computing Total 55,880 75,474 91,425 106,952 125,508
Lower Level 7,533 8,014 7,832 7,924 8,060
Upper Level 9,191 8,308 8,397 8,871 8,625
Graduate 10,403 10,546 11,408 11,920 12,563
Design Total 27,127 26,868 27,637 28,715 29,248
Lower Level 37,188 36,590 36,545 36,338 34,372
Upper Level 93,094 96,608 98,218 97,980 96,581
Graduate 127,844 130,009 126,216 130,832 135,618
Engineering Total 258,126 263,207 260,979 265,150 266,571
Lower Level 44,566 44,907 45,858 42,918 41,829
Upper Level 25,053 24,987 25,286 25,939 26,767
Graduate 6,442 6,158 6,625 6,687 6,441
Ivan Allen Total 76,061 76,052 77,769 75,544 75,037
Lower Level 8,373 7,782 7,410 7,160 7,023
Upper Level 24,049 23,593 23,529 21,126 21,205
Graduate 19,459 19,617 20,754 22,170 22,764
Business Total 51,881 50,992 51,693 50,456 50,992
Lower Level 90,941 87,328 86,077 87,322 88,622
Upper Level 20,183 18,866 18,863 19,903 22,450
Graduate 32,980 32,852 32,181 32,662 33,833
Sciences Total 144,104 139,046 137,121 139,887 144,905
Lower Level 2,760 2,783 3,174 2,868 2,990
Upper Level 444 465 439 432 513
Graduate 716 771 809 811 893
Registrar Total 3,920 4,019 4,422 4,111 4,396
Lower Level 214,110 211,833 213,652 211,905 211,552
Upper Level 185,139 189,541 194,293 197,402 201,357
Graduate 217,850 234,284 243,100 261,508 283,748
Institute Total 617,099 635,658 651,045 670,815 696,657
Institute
Student Semester Credt Hours Earned by College and Division, Fiscal Years 2014-2018
College of Engineering
Ivan Allen College
Scheller College of Business
College of Sciences
College of the Registrar
College of Computing
College of Design
45

Entering Class Retained Retained Retained Retained Retained Retained
Summer/Fall After 1 Year After 2 Years After 3 Years After 4 Years After 5 Years After 6 Years
1997 86% 79% 75% 74% 74% 74%
1998 86% 80% 77% 75% 75% 75%
1999 90% 83% 81% 80% 78% 79%
2000 90% 84% 81% 79% 79% 79%
2001 91% 84% 82% 81% 80% 80%
2002 90% 84% 82% 80% 80% 80%
2003 92% 86% 84% 82% 82% 82%
2004 92% 86% 84% 82% 82% 83%
2005 92% 87% 84% 82% 82% 82%
2006 92% 87% 84% 83% 82% 82%
2007 93% 88% 87% 84% 85% 85%
2008 93% 88% 86% 85% 84% 84%
2009 94% 90% 88% 87% 88% 88%
2010 95% 92% 90% 89% 89% 89%
2011 95% 91% 89% 88% 88% 89%
2012 96% 92% 90% 90% 90% 90%
2013 96% 94% 93% 92% 92%
2014 97% 94% 92% 92%
2015 97% 95% 94%
2016 97% 94%
2017 97%
Retention Rates for Entering Freshmen
46

Entering Class Graduated by Graduated by Graduated by Graduated by Graduated by
Summer/Fall 4th Year 5th Year 6th Year 7th Year 8th Year
1997 24% 60% 69% 72% 73%
1998 26% 62% 72% 74% 75%
1999 29% 67% 76% 78% 78%
2000 34% 69% 77% 79% 79%
2001 33% 69% 78% 79% 80%
2002 31% 70% 77% 79% 79%
2003 31% 71% 79% 81% 82%
2004 33% 72% 80% 81% 82%
2005 31% 72% 79% 81% 81%
2006 34% 72% 79% 81% 82%
2007 41% 76% 82% 84% 84%
2008 37% 75% 82% 83% 84%
2009 40% 78% 85% 87% 87%
2010 41% 80% 86% 88% 89%
2011 39% 80% 85% 87%
2012 40% 82% 87%
2013 46% 85%
2014 46%
Graduation Rates for Entering Freshmen
47

United States of America 143,840
China 1,523
India 1,504
France 1,311
South Korea 773
Germany 423
Canada 290
Taiwan 273
Singapore 249
United Kingdom 189
Georgia 66,216
California 9,422
Florida 9,245
Texas 7,196
North Carolina 5,164
Virginia 4,661
South Carolina 3,828
Tennessee 3,340
Alabama 3,007
New York 2,692
IBM Corporation 1,031
Delta Air Lines, Inc. 985
Southern Company 955
Lockheed Martin 915
AT&T Inc. 897
General Electric Company 700
The Coca-Cola Company 474
Intel Corporation 444
Boeing Company 436
The Home Depot 430
Alumni as of June 2018
Top Countries of Residence
Top States of Residence
Top Employers
48

Bachelor's
$99,000
$61,000
$70,000
$50,000
$65,000
$50,000
1,328
1,441
1,191
352
Year
2015-2016
2016-2017
2014-2015
Applied Predictive
Technologies
SunTrust Bank Pinnacle Art
2,377
* Year is equal to Fall term to Summer term of the following year.
International Education
Georgia Tech Students Abroad by Year
2015-2016 through 2017-2018*
Number
2,111
Business
Sciences
Average Reported Starting Annual Salaries
by College, Academic Year 2017-2018
2,215
College
Computing
Design
Graduate Cooperative Program
Co-op Degrees Earned
Career Discovery & Development
Top Interviewing Companies, FY 2018
Experiential Learning Programs, FY 2017‐2018
Participants, FY 2017-18
Undergraduate Cooperative Program
Professional Internship Program
Microsoft
ExxonMobil
Bloomberg
Capital One
Accenture
Ernst & Young
Engineering
Ivan Allen
49

International Programs ACADEMIC INFORMATION
Georgia Tech strongly believes in the importance of international experience for students. Student interest in international programs has been growing steadily for two decades. Georgia Tech is committed to expanding opportunities for students to participate in academically and culturally valuable international programs.
Georgia Tech Students Abroad by Year 2007-08 through 2017-18*
Year Number
2007-08 1,114
2008-09 1,189
2009-10 1,279
2010-11 1,391
2011-12 1,478
2012-13 1,577
2013-14 1,816
2014-15 1,967
2015-16 2,111
2016-17 2,215
2017-18 2,377 *Year is equal to Fall Semester through Summer Semester of the following year. Totals include Undergraduate and Graduate students.
Top Ten Locations for International Experience
Location Number of Students
France 788
China 581
Germany 293
England 225
Spain 201
Australia 125
New Zealand 112
Japan 108
Ireland 123
Vietnam 54
50

International Programs ACADEMIC INFORMATION
College Comparison of Undergraduate Students
Fall 2017 – Summer 2018
College International Experience*
Design 48
Computing 252
Engineering 1,294
Ivan Allen 127
Business 163
Science 144
Total Undergraduate 2,028 *International Experience includes Study, Internships, or International Academic Project Abroad
Global Internship Program Since 2014, the Global Internship Program (GIP) has been housed in the Office of International Education. GIP facilitates overseas internships for Georgia Tech students in a variety of settings, including corporate, academic, research, non-profit, governmental, and service. Note that global internship participation numbers are included in the overall international experience totals.
Year Number of
global interns
2013-14 138 2014-15 122 2015-16 150 2016-17 188 2017-18 179
2017-18 Global Internship Participation by College
College Number of Participants
Percentage of Participation
College of Design 3 1.7% College of Computing 34 19% College of Engineering 123 69% College of Sciences 8 4.5% Ivan Allen College 8 4.5% Scheller College of Business 3 1.7% Institute Total 179 100%
51

International Programs ACADEMIC INFORMATION
Participants by Level
Year N B.S. %B.S. M.S. %M.S. Ph.D. %Ph.D. 2013-14 138 103 75% 17 12% 18 13% 2014-15 122 91 75% 15 12% 16 13% 2015-16 150 108 72% 21 14% 21 14% 2016-17 188 135 72% 29 15% 24 13% 2017-18 179 118 66% 28 16% 33 18%
Top Global Internship Employers in 2017-18
Company Number of
Global Interns Siemens 16 TU Munich PREP Summer Research Program
10
BMW 6 Amazon 4 Equifax 4 Intel 4 Itau Unibanco 5 NTT 4 Max Planck Institute 3 Microsoft 3 Rakuten 3
Top Global Internship Locations in 2017-18 Global Interns went to 33 countries
Country Number of
Global Interns
Germany 48 France 19 India 17 Japan 15 China 15
52

International Programs ACADEMIC INFORMATION
International Plan The International Plan is a challenging undergraduate academic program that develops a student's global competence within the context of his or her major. It is an optional, degree-long program that integrates overseas experiences, language proficiency, and globally-focused coursework into 27 participating majors (out of 36). It builds on existing undergraduate degree requirements and international opportunities. The IP is intended to be completed within the normal time frame of a four-year undergraduate degree. Completion of the International Plan is recognized by a designation on the student's diploma indicating a commitment to developing global competence as part of the degree, e.g., "B.S. in Electrical Engineering: International Plan."
College
Total IP Participants as of of May 12, 2018
New First-Year Participants Joined IP in AY2017-18
Number of IP Graduates in AY2017-18
Total Number of IP Graduates
Since Inception
Design 25 18 1 20 Computing 88 10 3 28 Engineering 431 120 26 147 Sciences 35 12 1 7 Ivan Allen 94 22 6 70 Scheller 49 8 5 24 Institute Total 722 190 42 296
International Student and Scholar Services International Student and Scholar Services (ISSS), a unit of the Office of International Education, serves as a resource and advocate for the large and diverse population of international students and scholars. ISSS strives to create an environment where international students and scholars are able to make a well-integrated transition to Georgia Tech through diverse cultural, educational and leadership opportunities. In addition to serving enrolled students, ISSS also provides services to graduated students completing training in their field of study using Optional Practical Training (F-1 graduates) or Academic Training (J-1 students). OIE serves a vibrant community of Exchange Visitors who come to Tech to conduct research, teaching or related scholarly activities. Since 2013, the Exchange Visitors include student interns. Welcoming a community that includes students and scholars from around the world reinforces the goal of graduating good global citizens.
Year F/J Student
Visas
Post-Graduation Student Visas
(OPT/AT)
J Student Interns
J Scholars Institute
Total
2013-14 4,301 885 97 781 6,064 2014-15 4,416 989 194 815 6,414 2015-16 4,703 1,188 212 976 7,079 2016-17 4,751 1,346 188 767 7,052 2017-18 4,818 1,498 211 834 7,361
53

Student Housing Capacity Occupancy % Occupied
Single 8,537 8,574 100.43%
Married 222 222 100.00%
Total Student 8,759 8,796 100.42%
Greek Housing Capacity Occupancy % Occupied
Sorority 255 253 93.24%
Fraternity 1,183 1,103 99.22%
Total Greek 1,438 1,356 94.30%
Total All Housing 10,197 10,152 99.56%
1,906,354
29,313
5,544
257,000
1,257,098
215,344
3,466,207
443
1,383,082
Gross Sq. Ft.
5,663,265
478,034
912,093
880,858
1,033,160
2,227,201
3,326,503
734,732
186,267
15,255,846
* Georgia Tech has 254 buildings
Library Attendance
Housing
Housing Capacity & Occupancy, Fall 2018
Number of Titles
Items Circulated
SmartTech Holdings
Library
The Georgia Tech Library Collections & Usage, FY 2018
SmartTech Unique Users
Electronic Books
Electronic Journals
Articles and Books Downloaded (estimated)
Classes taught by Library Faculty & Staff
Space
Square Footage by Functional Area, Fall 2018
Academic Instruction and Research
Academic Support
Institute Total*
GT Research Institute
Parking Decks
Residential
Student Support
Other
Athletic Association
Campus Support
Area
54
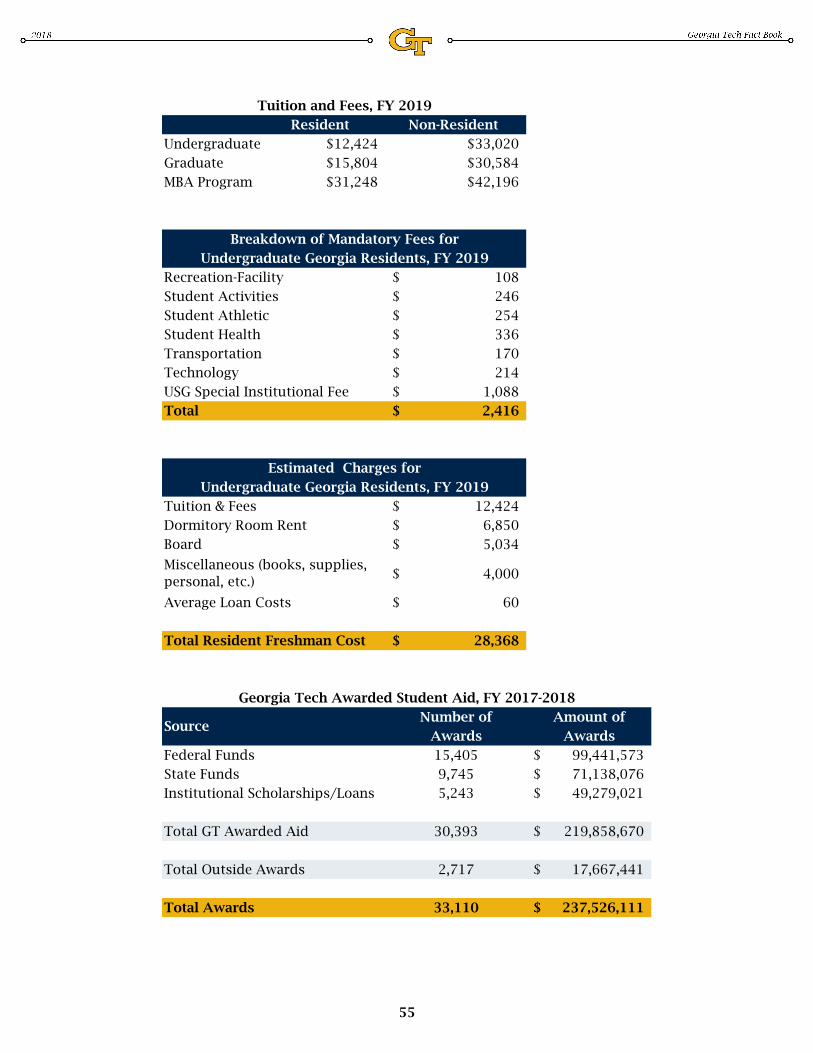
Resident Non-Resident
Undergraduate $12,424 $33,020
Graduate $15,804 $30,584
MBA Program $31,248 $42,196
108$
246$
254$
336$
170$
214$
1,088$
2,416$
12,424$
6,850$
5,034$
4,000$
60$
28,368$
Number of Amount of
Awards Awards
15,405 99,441,573$
9,745 71,138,076$
5,243 49,279,021$
30,393 219,858,670$
2,717 17,667,441$
33,110 237,526,111$
Tuition and Fees, FY 2019
Breakdown of Mandatory Fees for
Undergraduate Georgia Residents, FY 2019
Dormitory Room Rent
Recreation-Facility
Student Activities
Student Athletic
Student Health
Transportation
Technology
Estimated Charges for
Tuition & Fees
Undergraduate Georgia Residents, FY 2019
Source
Georgia Tech Awarded Student Aid, FY 2017-2018
USG Special Institutional Fee
Total
Total Awards
Board
Miscellaneous (books, supplies, personal, etc.)
Average Loan Costs
Total Resident Freshman Cost
Federal Funds
State Funds
Institutional Scholarships/Loans
Total GT Awarded Aid
Total Outside Awards
55

State Appropriations 291,283,120$
Student Tuition and Fees 369,856,163$
Gifts, Grants and Contracts 891,181,803$
Sales, Services & Other 196,083,326$
Total Revenue 1,748,404,412$
Instruction 312,384,484$
Research 786,859,532$
Public Service 71,586,384$
Academic Support 60,564,620$
Student Services 37,504,917$
Institutional Support 108,064,848$
Operation of Plant 171,558,795$
Scholarships and Fellowships 17,994,648$
Auxiliary Enterprises 92,790,935$
Non-Operating Expenses 24,133,749$
Total Expenditures 1,683,442,912$
Revenues - FY 2018 Actual
FY 2018 Actual
Expenditures by Major Program Areas
Note: Financial information for the Institute's affiliated organizations has not been included in the presentation above. The Institute relies upon its affiliates for support of sponsored programs, scholarship funding, capital investments and various Institute programs.
56

Number Amount Number Amount
College of Design 210 17,070,352$ 862 8,548,585$
College of Computing 205 163,505,702$ 163 27,630,568$
College of Engineering 1,734 621,013,116$ 1,249 209,571,701$
Ivan Allen College 49 16,592,146$ 40 4,981,248$
Scheller College of Business 4 807,200$ 4 400,000$
College of Sciences 532 232,012,321$ 352 62,873,412$
Research Centers 265 61,139,064$ 271 40,539,747$
GT Research Institute 559 787,274,321$ 929 497,070,286$
Institute Total 3,558 1,899,414,222$ 3,870 851,615,547$
Awarding Agency Amount % Total
218,530,069$ 25.7%
63,639,676$ 7.5%
57,999,266$ 6.8%
5,412,170$ 0.6%
112,445,836$ 13.2%
12,289,965$ 1.4%
44,719,815$ 5.3%
10,639,475$ 1.2%
73,255,511$ 8.6%
16,038,252$ 1.9%
Total Federal 614,970,035$ 72.2%
39,991,676$ 4.7%
6,381,356$ 0.7%
124,566,721$ 14.6%
49,856,933$ 5.9%
15,848,826$ 1.9%
Grand Total 851,615,547$ 100.0%
Miscellaneous
State and Local Governments
Government Owned-Contractor
Operated Facilities
Industrial
Colleges & Universities
U. S. Department of Energy
U. S. Department of HHS
NASA
Other Federal Agencies
Research Awards by Agency for FY 2018
National Science Foundation
U. S. Army
U. S. Navy
U. S. Department of Commerce
U. S. Department of Defense
Proposals Awards
Research Proposals and Awards for FY 2018
College
U. S. Air Force
57

Unit Number Amount Number Amount
College of Engineering
Aerospace 206 $42,851,118 217 $30,211,659
Biomedical Engineering (BME) 198 100,900,695 128 26,946,570
Civil 185 49,088,367 112 18,357,142
Chemical & Biomolecular Engineering 134 46,578,449 106 19,920,151
Electrical & Computer Engineering (ECE) 319 135,629,310 241 44,605,003
ECE - NEETRAC 84 5,865,441 72 5,405,886
Dean, College of Engineering 3 1,586,592 3 415,713
Industrial & Systems 103 34,491,473 70 11,254,095
Mechanical 393 166,181,607 229 38,557,048
Materials Science 109 37,840,064 71 13,898,434
Total 1,734 $621,013,116 1,249 $209,571,701
College of Design
AMAC 129 $365,286 796 $3,454,638
Dean, College of Design 3 125,987 4 319,983
Building Construction 16 3,562,981 4 175,429
CATEA 7 919,850 4 1,524,881
City and Regional Planning 8 4,217,674 6 281,706
CQGRD 6 681,269 4 175,410
Digital Building Lab 8 280,000 18 391,321
Geographic Information Systems 13 3,588,823 8 252,123
Industrial Design 2 49,984 3 363,256
Music Technology 9 850,491 7 959,878
School of Architecture 5 933,407 6 555,246
School of Music 4 1,494,600 2 94,714
Total 210 $17,070,352 862 $8,548,585
College of Computing
Dean - College of Computing 10 $1,190,358 3 $28,180
Computational Science & Engineering 35 17,476,949 25 4,951,294
Computer Science 81 78,550,411 60 12,080,000
Interactive Computing 79 66,287,984 75 10,571,094
Total 205 $163,505,702 163 $27,630,568
Ivan Allen College 49 $16,592,146 40 $4,981,248
Scheller College of Business 4 $807,200 4 $400,000
College of Sciences
Applied Physiology 2 $2,895,220 1 $25,547
Biology 157 79,220,367 88 18,534,352
CEISMC 28 11,458,489 19 1,300,599
Chemistry 106 51,852,783 75 19,312,768
College of Sciences 6 1,957,782 - -
CRNCH 1 950,000 - -
Proposals Awards
Office of Sponsored Programs - Research Scope
Awards Summary Detail, Fiscal Year 2018
58

Unit Number Amount Number Amount
Proposals Awards
Earth & Atmospheric Sciences 78 16,917,291 72 9,283,187
Mathematics 58 26,530,442 44 7,948,058
Physics 63 24,862,422 40 4,840,617
Psychology 33 15,367,525 13 1,628,284
Total 532 $232,012,321 352 $62,873,412
Research Centers 265 $61,139,064 271 $40,539,747
Georgia Tech Research Institute
ACL - Advanced Concepts Laboratory 51 $98,462,882 81 $44,109,517
ASL - Applied Systems Laboratory 20 25,613,545 34 22,055,427
ATAS - Aerospace, Transportation & Advanced Systems 90 42,023,673 103 50,385,277
CIPHER - Cybersecurity, Infr Protection & Hrdwr Eval Rsrch 74 138,148,212 172 103,023,938
CS - Chief Scientist 2 13,039,136 2 1,969,026
DDO - Deputy Director's Office 1 - - -
ESLYS - Electronic Systems Laboratory 44 140,697,847 135 144,828,894
EOSL - Electro-Optical Systems Laboratory 49 59,724,765 77 18,036,556
ICL - Information & Communications Laboratory 114 104,394,314 80 21,271,931
ICSD - Information & Cyber Sciences Directorate 9 52,747,305 14 19,819,510
ISD - Information Systems Department - - 1 180,000
SEAL - Sensors and Electromagnetic Applications Lab 103 111,992,726 230 71,390,210
SSD - Support Services 1 - - -
VPDIR - Vice President & GTRI Director 1 429,916 - -
Total 559 $787,274,321 929 $497,070,286
Institute Total 3,558 $1,899,414,222 3,870 $851,615,547
Source: Office of Sponsored Programs
59
vroberts7
Stamp

The Enterprise Innovation Institute (EI2)
The Enterprise Innovation Institute (EI2) is the Georgia Institute of Technology’s economic development and business services organization. Georgia Tech was founded to support Georgia’s economic development and EI2’s focus — “Create > Accelerate > Grow” — is the continuance of that core mission. We achieve this through our extensive suite of programs and services led by 150+ extension professionals and by leveraging Georgia Tech’s broad resources and that of our economic development partners. EI2’s programs support commercialization to help bring faculty and student innovations to the market, accelerate entrepreneurship and technology startup creation, and help the growth of existing businesses, manufacturers, and communities in Georgia, and beyond.
EI2’s key programs include the Georgia Manufacturing Extension Partnership (GaMEP), the Advanced Technology Development Center (ATDC), VentureLab, and the Economic Development Lab. See innovate.gatech.edu for a complete listing of programs and services.
Select EI2 impact results in fiscal year 2018:
25+ startups formed from Georgia Tech research 170+ startups in ATDC incubator $468 million in capital activity for ATDC companies $509 million in new sales for assisted manufacturers 10,700+ industry and businesses served across the state 70+ economic development research projects in 16 countries
EI2 manages a network of 11 Georgia Tech Regional Offices around the state to facilitate delivery of economic development services and to provide a local connection to Georgia Tech. To learn more about EI2 or to take advantage of these outreach opportunities please visit: innovate.gatech.edu.
Create Accelerate Grow
60

Faculty by Gender as of Fall 2018College Department Male Female
Other/Not Specified Institute Total
Computational Science & Eng 8 1 9Computing, College of 10 3 13School of Computer Science 24 7 31School of Interactive Computng 19 11 30College of Computing Total 61 22 83CATEA-Rehabilitation Center 1 1College of Design 1 1School of Architecture 28 5 33School of Building Constructio 9 4 13School of City & Regional Plan 14 7 21School of Industrial Design 18 6 24School of Music 8 3 11College of Design Total 78 26 104Aerospace Engineering 37 2 39Aerospace Systems Design Lab 1 1Biomedical Engr, GT/Emory 32 10 42Chemical and Biomolecular Engr 24 10 34Civil & Environmental Engr 39 11 50Electrical & Computer Engr 93 14 107Industrial & Systems Engr 48 14 1 63Materials Science & Engr 23 6 29Mechanical Engineering 87 13 100Renewable Bioproducts Inst-RBI 1 1College of Engineering Total 385 80 1 466Biological Sciences 40 15 55Chemistry & Biochemistry 28 6 34Earth & Atmospheric Sciences 16 10 26Mathematics 50 16 1 67Physics 32 7 39Psychology 20 6 26College of Sciences Total 186 60 1 247Economics 13 6 19IAC-History & Sociology 12 7 19International Affairs 18 11 29Ivan Allen College 1 1Literature,Media & Com 32 40 72Modern Languages 17 34 51Public Policy 23 12 35Total 116 110 226Inst Leadership & Entreprene 3 4 7Scheller College of Business 87 24 111Scheller College of Business Total 90 28 118CEISMC 1 1Center for Academic Success 1 1Ctr for 21st Century Univer 1 1Ctr for Adv Communicat Policy 1 1Digital Building Lab 1 1EI2-Enterprise Innovation Inst 1 1GTPE - Academic Services 6 6GTPE--Language Institute 5 18 23GTPE-PE Programs 2 2GTRI-Adv Concepts 1 1GTRI-CIPHER 1 1GTRI-SISD 1 1Provost & Executive VP for AA 1 1Vice Provost/Grad Ed & Fac Dev 1 1VP for International Initiativ 1 1Other Academic Areas Total 20 23 43
936 349 2 1,287 Institute Total
College of Computing
College of Design
College of Engineering
College of Sciences
Ivan Allen College
Scheller College of Business
Other Academic Areas
61

Faculty by Race/Ethnicity as of Fall 2018Multi-Racial
Male FemaleOther/Not Specified Male Female Male Female Male Male Female
Other/Not Specified Male Female
Computational Science & Eng 7 1 1 9
Computing, College of 1 3 1 5 3 13
School of Computer Science 13 2 1 10 5 31
School of Interactive Computng 4 3 1 14 7 1 30
College of Computing Total 25 6 3 1 1 1 30 15 1 83
CATEA-Rehabilitation Center 1 1
College of Design 1 1
School of Architecture 2 1 26 4 33
School of Building Constructio 2 1 8 2 13
School of City & Regional Plan 1 2 1 11 6 21
School of Industrial Design 2 2 1 16 3 24
School of Music 1 8 2 11
College of Design Total 5 6 2 1 1 1 70 18 104
Aerospace Engineering 8 1 2 26 2 39
Aerospace Systems Design Lab 1 1
Biomedical Engr, GT/Emory 11 1 2 2 17 9 42
Chemical and Biomolecular Engr 6 5 1 2 15 5 34
Civil & Environmental Engr 10 3 2 27 8 50
Electrical & Computer Engr 24 5 5 64 9 107
Industrial & Systems Engr 18 5 3 3 23 9 1 1 63
Materials Science & Engr 11 1 2 12 3 29
Mechanical Engineering 31 3 5 1 1 1 49 9 100
Renewable Bioproducts Inst-RBI 1 1
College of Engineering 'Total 119 23 12 1 17 2 1 235 54 1 1 466
Biological Sciences 6 5 1 1 32 10 55
Chemistry & Biochemistry 4 1 2 3 19 4 1 34
Earth & Atmospheric Sciences 5 1 1 10 9 26
Mathematics 12 9 1 2 36 7 67
Physics 3 1 1 1 26 6 1 39
Psychology 1 19 5 1 26
College of Sciences 'Total 30 17 1 3 8 1 1 142 41 2 1 247
Economics 2 2 1 1 8 4 1 19
IAC-History & Sociology 1 1 1 1 10 5 19
International Affairs 2 2 1 15 9 29
Ivan Allen College 1 1
Literature,Media & Com 4 3 1 2 27 33 2 72
Modern Languages 5 11 1 3 2 8 21 51
Public Policy 1 1 3 2 20 8 35
Ivan Allen College 'Total 15 19 5 6 6 3 89 80 1 2 226
Inst Leadership & Entreprene 3 4 7
Scheller College of Business 31 5 2 1 1 52 18 1 111
Scheller College of Business Total 31 5 2 1 1 55 22 1 118
CEISMC 1 1
Center for Academic Success 1 1
Ctr for 21st Century Univer 1 1
Ctr for Adv Communicat Policy 1 1
Digital Building Lab 1 1
EI2-Enterprise Innovation Inst 1 1
GTPE - Academic Services 6 6
GTPE--Language Institute 2 1 1 4 13 1 1 23
GTPE-PE Programs 2 2
GTRI-Adv Concepts 1 1
GTRI-CIPHER 1 1
GTRI-SISD 1 1
Provost & Executive VP for AA 1 1
Vice Provost/Grad Ed & Fac Dev 1 1
VP for International Initiativ 1 1
Other Academic Areas Total 2 2 1 19 17 1 1 43
225 78 1 27 11 34 9 3 640 247 1 7 4 1,287 Institute Total
College of Computing
College Department
College of Design
College of Engineering
College of Sciences
Ivan Allen College
Scheller College of Business
Other Academic Areas
Institute Total
Asian Black/African American Hispanic White Unknown
62

Faculty by Tenure/Tenure-Track as of Fall 2018
Male Female Male FemaleOther/Not Specified Male Female Male Female
Computational Science & Eng 1 2 1 4 1 9School of Computer Science 1 14 3 2 3 6 1 30School of Interactive Computng 2 7 3 3 4 6 3 28College of Computing Total 4 23 7 9 7 13 4 67CATEA-Rehabilitation Center 1 1College of Design 1 1School of Architecture 7 1 9 1 1 19School of Building Constructio 2 3 5School of City & Regional Plan 2 3 1 1 7School of Industrial Design 3 1 1 1 6School of Music 1 1 1 2 5College of Design Total 14 2 15 3 4 6 44Aerospace Engineering 2 19 1 5 1 7 35Aerospace Systems Design Lab 1 1Biomedical Engr, GT/Emory 2 9 3 4 3 7 3 31Chemical and Biomolecular Engr 2 8 4 8 3 3 3 31Civil & Environmental Engr 20 4 10 3 4 3 44Electrical & Computer Engr 3 59 5 15 7 7 1 97Industrial & Systems Engr 25 8 1 12 1 3 3 53Materials Science & Engr 3 14 2 3 3 2 1 28Mechanical Engineering 4 34 1 23 8 16 4 90College of Engineering Total 17 188 28 1 80 29 49 18 410Biological Sciences 1 18 4 13 2 5 4 47Chemistry & Biochemistry 4 11 2 5 1 5 3 31Earth & Atmospheric Sciences 8 4 4 4 3 23Mathematics 3 24 3 9 3 3 5 50Physics 3 12 2 11 2 5 2 37Psychology 8 2 6 1 4 1 22College of Sciences Total 11 81 17 48 9 26 18 210Economics 3 1 3 3 3 13IAC-History & Sociology 6 2 1 4 5 1 19International Affairs 1 5 2 3 2 3 4 20Literature,Media & Com 7 4 6 5 3 3 28Modern Languages 1 8 8 2 1 20Public Policy 1 3 3 10 4 3 1 25Ivan Allen College Total 1 1 24 13 31 26 19 10 125Inst Leadership & Entreprene 1 1Scheller College of Business 1 1 21 2 22 3 14 9 73Scheller College of Business Total 1 1 21 3 22 3 14 9 74CEISMC 1 1Digital Building Lab 1 1Other Academic Areas Total 1 1 2
34 2 351 71 1 206 77 125 65 932
College of Sciences
Ivan Allen College
Scheller College of Business
Other Academic Areas
Institute Total
Institute Total
College of Computing
College of Design
College Department
College of Engineering
Regents Professor Professor Associate Professor Assistant Professor
63

OFFICE OF THE PRESIDENTPRESIDENT
Dr. G. P. “Bud” Peterson
Executive Vice President,Administration & Finance
Mr. James Fortner(Interim)
AssociateVice President &
Chief of StaffMs. Lynn M. Durham
Executive Vice President,Research
Dr. Chaouki Abdallah
Dean of LibrariesMs. Catherine Murray-Rust
Dean,College of Computing
Dr. Zvi Galil
Dean, Ivan AllenCollege of Liberal Arts
Dr. Jacqueline Jones Royster
Dean, Scheller College of Business
Dr. Maryam Alavi
Interim Senior Vice President,
AdministrationMr. Mark Demyanek
Interim Associate Vice President
Institute Planning &Resource Management
Ms. Jennifer Hubert
Executive DirectorStrategic Consulting
Dr. Sonia Alvarez-Robinson
Interim Senior Vice President& Director, Georgia Tech
Research InstituteDr. Lora Weiss
Vice President &Director,
Enterprise Innovation InstituteMr. Chris Downing
Vice President &General Manager,
Georgia Tech Research Corp.Ms. Jilda Garton
Associate Vice President,Economic Development
Mr. Greg King
InterdisciplinaryResearch Centers
Associate Vice President &Chief Operating Officer
Vacant
Dean,College of EngineeringDr. Steven McLaughlin
Ombuds Program
Vice Provost,International Initiatives
Dr. Yves Berthelot
Interim Dean,College of SciencesDr. David Collard
Board of Regents
Chancellor,University System of Georgia
Associate Provostfor Operations
Dr. Jennifer Herazy
Dean, Professional Education
Dr. Nelson C. Baker
Vice Provost,Enrollment Services
Dr. Paul Kohn
Vice Provost,Undergraduate Education
Dr. Colin Potts
Vice Provost, Graduate Education & Faculty Dev.
Dr. Bonnie Ferri
As of October 2018
Provost & ExecutiveVice President
for Academic AffairsDr. Rafael L. Bras
Dean,College of DesignDr. Steven French
Georgia Institute of TechnologyPresidentChart A
Associate Vice President,Research Faculty Integration
Vacant
Associate Vice President,Research
Dr. Christopher W. Jones
Interim Vice President,Industry Collaboration
Dr. George WhiteAssociate ProvostAcademic Effectiveness
Dr. Loraine Phillips Associate Vice President &CEO, Global Center forMedical Innovation/T3L
Ms. Tiffany Wilson
* Also reports to the Vice Chancellor for Internal Audit, University System of Georgia
Vice President,Student Life &
Dean of StudentsMr. John Stein
Vice President,Development
Mr. Barrett Carson
Director of Athletics,
Mr. Todd Stansbury
Vice President,Government &
Community RelationsMr. Dene Sheheane
Interim Vice PresidentInstitute
Communications Mr. Dene Sheheane
Vice President,Institute DiversityDr. Archie Ervin
Georgia Tech Foundation Mr. Al Trujillo
Georgia Tech Alumni Association
Mr. Joe Irwin
Chief Audit Officer & Director,
Internal Auditing*Mr. Phillip Hurd
Interim Vice President,Ethics, Compliance &
Legal AffairsMs. Aisha Oliver-Staley
Associate Vice Provost, Advocacy & Conflict
ResolutionDr. Benjamin Flowers
Executive DirectorCenter for 21st Century
UniversitiesDr. Richard DeMillo
64

Chart BGeorgia Institute of Technology
Provost and Executive Vice President for Academic Affairs
Office of the President
Provost & ExecutiveVice Presidentfor Academic Affairs
Dr. Rafael L. Bras
PresidentDr. G.P. “Bud” Peterson
Associate Provostfor Operations
Dr. Jennifer Herazy
Executive Vice Presidentfor Research
Dr. Chaouki Abdallah
Dean of Libraries
Ms. Catherine Murray-Rust
Dean,Professional Education
Dr. Nelson Baker
Dean,College of Computing
Dr. Zvi Galil
Dean,College of DesignDr. Steven French
Dean,College of EngineeringDr. Steven McLaughlin
Dean, Ivan Allen College of Liberal Arts
Dr. Jacqueline J. Royster
Dean,Scheller College of Business
Dr. Maryam Alavi
Executive Director,International EducationMs. Amy Bass Henry
Interim Dean,College of SciencesDr. David Collard
Vice Provost,Enrollment Services
Dr. Paul Kohn
Vice Provost, International Initiatives & President, Georgia Tech Lorraine
Dr. Yves Berthelot
Director,Faculty Development
Mr. David Bamburowski
Executive Director,Center for Career Discovery
& DevelopmentDr. Michelle TullierDirector, Undergraduate
AdmissionsMr. Richard Clark, Jr.
Registrar,Ms. Reta Pikowsky
Director, Scholarships& Financial AidMs. Marie Mons
Executive Vice PresidentAdministration & Finance
Mr. James Fortner(Interim)
Director, SpecialScholarship Programs
Mr. Chaffee Viets
Associate Vice President& Chief of Staff
Ms. Lynn M. Durham
Associate Vice Provost, Academic Advocacy &
Conflict ResolutionDr. Benjamin Flowers
As of October 2018
Vice Provost,Undergraduate Education
Dr. Colin Potts
Vice Provost, Graduate Education & Faculty Development
Dr. Bonnie Ferri
Associate Vice President,International Development
Ms. Marta Garcia
Associate Vice Provost,Undergraduate Education
Dr. Steven Girardot
Director, Center forAcademic Enrichment
Dr. Chris Reaves
Associate Vice Provost, Graduate Education &Faculty Development
Dr. Leslie Sharp
Director,International Operations
Ms. Monique Tavares
Director, Center forAcademic Success
Dr. Don Pearl
Director,Honors Program
Dr. Roberta Berry
Director, EnrollmentCommunications
Dr. Matt McLendon
Director, Center forTeaching & Learning
Dr. Joyce Weinsheimer
Executive Director,Center for 21st Century
UniversitiesDr. Richard DeMillo
Director, Postdoctoral Services
Dr. Jana Stone
Director, Graduate Admissions
Ms. Marla Bruner
Associate Provost,Academic Effectiveness
Dr. Loraine Phillips
Director,Serve-Learn-SustainDr. Jennifer Hirsch
Associate Provost,GT ShenzhenDr. Tong Zhou
Director,Georgia Tech Lorraine
Dr. Abdallah Ougazzaden
Ombuds Program
65

Chart CGeorgia Institute of Technology
Provost and Executive Vice President for Academic AffairsDegree Granting Schools and Departments
Office of the President
Provost & ExecutiveVice President for Academic Affairs
Dr. Rafael Bras
PresidentDr. G.P. “Bud” Peterson
Executive Vice PresidentAdministration & Finance
Mr. James Fortner(Interim)
Executive Vice Presidentfor Research
Dr. Chaouki Abdallah
Dean, College of DesignDr. Steven French
Dean,College of Computing
Dr. Zvi Galil
Dean,College of EngineeringDr. Steven McLaughlin
Dean, Ivan Allen College of Liberal Arts
Dr. Jacqueline Jones Royster
Dean, Scheller College of Business Dr. Maryam Alavi
Building ConstructionDr. Daniel Castro
Chair
ArchitectureMr. Scott Marble
Chair
City & RegionalPlanning
Dr. S. GuhathakurtaChair
Industrial DesignMr. Jim Budd
Chair
MusicDr. Jason Freeman
Chair
Computational Sci& Engineering
Dr. David BaderChair
Computer ScienceDr. Lance Fortnow
Chair
Interactive ComputingDr. Ayanna Howard
Chair
Aerospace Engr.Dr. Mark Costello
Chair
Biomedical Engr.Dr. Susan Margulies
Chair
Chemical &Biomolecular Engr.
Dr. David ShollChair
Civil &Environmental Engr.Dr. Donald Webster
Chair
Electrical &Computer Engr.
Dr. Magnus EgerstedtChair
Mechanical Engr.Dr. Samuel Graham
Chair
Industrial &Systems Engr.
Dr. H. Edwin RomeijnChair
Materials Science& Engr.
Dr. Naresh ThadhaniChair
EconomicsDr. Laura Taylor
Chair
History & SociologyDr. Eric Schatzberg
Chair
International AffairsMr. Joseph Bankoff, J.D.
Chair
Literature, Media &CommunicationDr. Richard Utz
Chair
Modern LanguagesDr. Anna Stenport
Chair
Public PolicyDr. Kaye H. Fealing
Chair
Biological SciencesDr. J. Todd Streelman
Chair
Chemistry &BiochemistryDr. M. G.Finn
Chair
Earth & AtmosphericSciences
Dr. Greg HueyChair
MathematicsDr. Rachel Kuske
Chair
PhysicsDr. Pablo Laguna
Chair
PsychologyDr. Mark Wheeler
Chair
Interim Dean,College of SciencesDr. David Collard
Associate Vice President& Chief of Staff
Ms. Lynn M. Durham
As of September 201866

Executive Vice President for Administration and Finance
Office of the President
Executive Vice PresidentAdministration & Finance
Mr. James Fortner(Interim)
Vice PresidentFacilities Management
Mr. Charles Rhode
Interim Vice PresidentCampus Services
Ms. JulieAnne Williamson
Chart D
Provost &Executive Vice President
for Academic AffairsDr. Rafael L. Bras
Georgia Institute of Technology
Executive Vice Presidentfor Research
Dr. Chaouki Abdallah
Security & Police Chief *
Mr. Rob Connolly
As of September 2018* Reporting relationship includes direct access to EVP as required and for the purpose of institutional accountability.
Vice President, Information Technology &Chief Information Officer
Mr. Mark Hoeting
PresidentDr. G.P. “Bud” Peterson
Associate Vice President& Chief of Staff
Ms. Lynn M. Durham
Assistant Vice PresidentInstitutional Research &
Enterprise Data ManagementMs. Sandi Bramblett
Assistant Vice PresidentInstitute Budget
Planning & AdministrationMr. Jim Kirk
Executive DirectorReal Estate Development *
Mr. Tony Zivalich
Executive DirectorFinancial & Business
ServicesVacant
Assistant Vice PresidentCapital Planning &Space Management
Vacant
Executive DirectorStrategic Consulting
Dr. Sonia Alvarez-Robinson
Senior DirectorEnterprise Resource
PlanningMr. Greg Phillips
InterimSenior Vice President
AdministrationMr. Mark Demyanek
Associate Vice PresidentHuman Resources
Dr. Kim Harrington
InterimAssociate Vice President
Institute Planning &Resource Management
Ms. Jennifer Hubert
Senior DirectorInstitute Finance Support
Mr. Robert Foy
Interim DirectorCampus Sustainability
Ms. Anne Rogers
67

Georgia Institute of TechnologyExecutive Vice President for Research
Interim SeniorVice President & Director, Georgia Tech Research Institute (GTRI)
Dr. Lora Weiss
Vice President & Director,Enterprise Innovation
Institute (EI2)Mr. Chris Downing
Vice President &General Manager,
Georgia Tech ResearchCorporation (GTRC)
Ms. Jilda Garton
Associate Vice PresidentResearch
Dr. Christopher Jones
Director, ResearchCommunications*
Mr. John Toon
Associate Vice President & Chief Operating Officer
Vacant
InterdisciplinaryResearch Institutes
As of September 2018
Office of the President
Provost & ExecutiveVice President for Academic AffairsDr. Rafael Bras
PresidentDr. G.P. “Bud” Peterson
ExecutiveVice PresidentAdministration & Finance
Mr. James Fortner(Interim)
Executive Vice President for Research
Dr. Chaouki Abdallah
Associate Vice President/Chief of Staff
Lynn M. Durham
Chart E
Director, Academic &
Research Security*Mr. Al Concord
*Dual report to Vice President of
GT Institute Communications
Interim Vice PresidentIndustry Collaboration
Dr. George White
*Dotted lines to the Georgia Tech President
and the GTRI SVP/Director
Associate Vice PresidentEconomic Development
Mr. Greg King
Associate Vice PresidentGlobal Center for
Medical Innovation(GCMI)/T3L
Ms. Tiffany Wilson
Associate Vice PresidentResearch Faculty
IntegrationVacant
Chief Scientific OfficerPediatric Technology
CenterDr. M.G. Finn
68

PRESIDENTDr. G.P. “Bud” Peterson
Georgia Institute of TechnologyStudent Life
Vice PresidentStudent Life & Dean of Students
Mr. John Stein
Chart F
Director,Office of the Arts
Madison Cario
Director,Leadership Education
& DevelopmentDr. Wes Wynens
Director,Parent & Family Programs
Laci Weeden
Director,Counseling CenterDr. Carla Bradley
As of September 2018
Assistant Dean/Director,Disability Services
Katie Fahn
Assistant Dean/Director,Greek Affairs
Dr. Jameson Keller
Assistant Dean/Director,New Student &
Sophomore ProgramsCynthia Jennings
Int. Assistant Dean/Director,Women’s Resource Center
Melanie DeMaeyer
Director, Leadership &Civic Engagement
Dr. Gerome Stephens
Director,Communications
Sara Warner
Associate Deanof Students
Orientation & TransitionDr. Colleen Riggle
Associate Dean of StudentsInclusion
Ms. Stephanie Ray
Director,Veteran’s Resource Center
Dr. David Ross
Director, LGBTQIAResource CenterDr. Aby Parsons
Director,Research & Assessment
for Student AffairsDr. Brenda Woods
Director,Development &Parent Giving
Emily Takkiedine
Asst Vice PresidentStudent Life/Bus. Operations
Daniel C. Taylor
HR Business PartnerEaster Worden
Director,Student Publications
& MediaMac Pitts
Director,Administration
Ms. Debbie Dorsey
Director,Finance
Ms. Betsey Kidwell
Associate Dean,Student Integrity
Bonnie Taylor
69

Georgia Institute of TechnologyDevelopment
Chart G
Associate Vice Presidentfor Development
(Unit)Mr. Philip D. Spessard
Associate Vice President for Development
Mr. Mattew C. RyanVacant
Vice President for Development
Mr. Barrett H. Carson
PresidentGeorgia Tech
Alumni Association(Annual Giving/Roll Call)
Mr. Joseph P. Irwin
Executive Director ofCorporate Relations
Ms. Caroline G. Wood
Executive Director ofFoundation RelationsMs. Birgit S. Burton
Executive Director of Regional DevelopmentMr. Martina Hubbarth
Director of Reunion Giving
ProgramsMs. Rachel Donnelly
Executive Director of Development
College of EngineeringMs. Molly F. Croft
Directorof Development
College of ComputingMr. Brad Hastings
Director of Development
College of DesignMs. Susan Sanders
Director of Development
College of SciencesMr. Arthur Wasserman
Director of DevelopmentIvan Allen College of
Liberal ArtsKeatley Scroggins
Executive Director ofDevelopment
Scheller Col of BusinessMr. M. Scott Bryant
Executive Directorof Gift Planning
Ms. Amy F. Nash
Director ofCorporate Development
Director of Development
for Parent Giving & Student Affairs
Ms. Emily Takieddine
Associate Vice Presidentfor Development
(Athletics)Mr. James S. Hall
Associate VicePresident for
Development OperationsMs. Loretta P. Buchanan
As of September 2018
Associate Vice President for Development (International)
Ms. Marta H. Garcia
PRESIDENTDr. G.P. “Bud” Peterson
DirectorDevelopmentStewardship
Ms. Elizabeth Gallant
Directorof Development
Information SystemsMr. Mark Sanders
Director of Development
Business OperationsMs. Ann Hawkes
Director of Development
Gift AccountingMs. Pat Barton
DirectorResearch & Prospect
ManagementMs. Susanna Printz
70

Interim Vice President of Institute Communications
Mr. Dene Sheheane
PRESIDENTDr. G.P. “Bud” Peterson
AssistantVice President,
Institute Creative Strategy& Brand Management
(Vacant)
AssistantVice President
Institute News & Campus Communications
Ms. Tracey Reeves
Director,Business Operations
Ms. Julie Bryant
** HR BusinessPartner
Travis Profitt
Senior Director,Institute Creative Strategy & Brand
ManagementMr. Dave Holston
Director, InstituteCampus
Communications & EventsMr. Michael Hagearty
*Director,Institute Research &
Economic Dev. CommMr. John Toon
Director,Institute Leadership
CommunicationsMs. Patti Futrell
Director, Institute Media Relations
& Issues ManagementMr. Lance Wallace
**Dotted-linereport to Office of Human Resources
Georgia Institute of TechnologyInstitute CommunicationsChart H
As of September 2018
*Dual report toExecutive Vice President
for Research
Director, Institute Creative
StrategyVacant
Director, Institute Digital
StrategyMs. Louise Russo
Director, Institute Marketing &
Client RelationsMs. Tionna Carthon
71

Assistant Director,Administrative Operations
Ms. Sandra Duplessis
Executive Director, for Research &
Institute CollaborationsVacant
Associate Vice President,Institute Diversity &
Inclusion (AVP)Dr. Julie Ancis
Center for the Study ofWomen, Science &Technology (WST)
Dr. Carol ColatrellaDr. Mary Frank Fox
Dr. Mary Lynn Realff
Georgia TechADVANCE
Dr. Kim CobbDr. Mary Frank Fox
Dr. Pinar KeskinocakDr. Dana Randall
Dr. Catherine RossDr. Beril Toktay
Director,Hispanic Initiatives
Mr. Jorge Breton
Director, Office ofMinority Education
Development (OMED)Vacant
Executive Director,Staff Diversity, Inclusion,
and EngagementMs. Pearl Alexander
Georgia Institute of TechnologyInstitute DiversityChart I
As of September 2018
Vice President andChief Diversity Officer
Dr. Archie W. Ervin
PRESIDENTDr. G.P. “Bud” Peterson
Executive Director,Student Diversity
and InclusionMr. S. Gordon Moore, Jr.
Director,LGBTQIA
Resource CenterDr. Aby Parsons*
*Dual Report to Division of Student Life
Director,Inclusion and Engagement
Ms. Cheryl Cofield
72

Director of AthleticsMr. Todd Stansbury
PRESIDENTDr. G.P. “Bud” Peterson &
GTAA Board
Associate Athletic Director,
ComplianceMs. Shoshanna Engel
** HR BusinessPartner
Mr. Kevin Cruse
Associate Athletic Director, Annual Giving &
EngagementMr. Jeff Keisler
Head FootballCoach
Mr. Paul Johnson
Head Coach,Golf
Mr. Bruce Heppler
Associate Vice PresidentDevelopmentMr. Jim Hall
Georgia Institute of TechnologyGeorgia Tech Athletic AssociationChart J
As of November 2018
VP Institute Legal Affairs &
Risk Management
VP Institute Development
Associate Athletic Director,
SWA/Student-AthleteDevelopment
Ms. Joeleen Akin
Head BasketballCoach
Mr. Josh Pastner
Head Coach,Softball
Ms. Aileen Morales
Head Coach,Volleyball
Ms. Michelle Collier
Director, Total PersonSports Program &
Sports DieteticsMs. Leah Thomas
Executive Director,Letterwinners
Mr. Lucius Sanford
Assistant AthleticDirector, Student Services
Mr. Chris Breen
Associate Athletic Director,Student Services
Ms. Phyllis LaBaw
Assistant Director,Academic ServicesMs. Amanda Brown
Assistant Director,Academic Services
Ms. Whitney Burton
Assistant Director,Academic Services
Mr. Brandon Pottebaum
Assistant Director,Academic ServicesMs. LaToya Bullard
Head Coach,Cross-Country &
Women’s Track & FieldMr. Alan Drosky
Associate Athletic Director,
Administration & FinanceMr. Marvin Lewis
Head Coach,Men’s Track & FieldMr. Grover Hinsdale
Assistant Athletic Director,Computer OperationsMr. Anthony Bridges
Director,Equipment
Mr. Tom Conner
Assistant Athletic Director,Accounting
Ms. Selinda Biggers
Head Coach,Women’sBasketball
Ms. MaChelle Joseph
Deputy Director ofAthletics
Mr. Mark Rountree
Associate AthleticDirector, Facilities, Operations & Events
Mr. Derek Grice
Assistant AthleticDirector, Sports Video Ops
Mr. Todd McCarthy
Asst. Athletic Director, Video & Broadcast Svcs.
Mr. Andy Blanton
Assistant AthleticDirector, Innovation
Mr. Doug Allvine
Head Coach,Women’s Tennis
Mr. Rodney Harmon
Head Coach,Swimming & DivingMs. Courtney Hart
Head Coach,Men’s Tennis
Mr. Kenny ThorneDirector, Olympic SportsPlayer DevelopmentMr. Scott McDonald
Director,Sports MedicineMr. Carla Gilson
Director, FootballPlayer Development
Mr. John Sisk
Head Coach,Baseball
Mr. Danny Hall
Senior AssociateAthletic Director,
External OperationsMr. Ayo Taylor-Dixon
Asst. Athletic Director, Communications & PR
Mr. Mike Flynn
Director, MarketingPromotions & SpiritMs. Gina Gonzales
Asst. Athletic Director, Brand & IdeationMr. Simit Shah
Faculty AthleticsRepresentative
Dr. Charles Isbell
**Dotted-line report to GT Office of Human Resources
73

Offi ce of Institutional Research and Planning
Georgia Institute of Technology
Atlanta, Georgia 30332-0530
(404) 894-3311
www.irp.gatech.edu
Recyclable
This publication is printed on paper that is produced with recycled material. Georgia Tech is committed to environmental sustainability. Please recycle this publication.
Copyright 2019 • Georgia Institute of Technology