Investor Fact Book - 2010/2011
64
investorfactbook.mcgraw-hill.com Investor Fact Book MHP 2010/2011
-
Upload
khangminh22 -
Category
Documents
-
view
0 -
download
0
Transcript of Investor Fact Book - 2010/2011

investorfactbook.mcgraw-hill.com
Investor Fact Book
MHP2010/2011

“Safe Harbor” Statement Under the Private Securities Litigation Reform Act of 1995
This document includes certain forward-looking statements about our businesses and our prospects, new products, sales, expenses, tax rates, cash flows, prepub-lication investments and operating and capital requirements. Such forward-look-ing statements include, but are not lim-ited to: the strength and sustainability of the U.S. and global economy; the duration and depth of the current recession; Edu-cational Publishing’s level of success in 2010 adoptions and in open territories and enrollment and demographic trends; the level of educational funding; the strength of School Education including the testing market, Higher Education, Professional and International publishing markets and the impact of technology on them; the level of interest rates and the strength of the economy, profit levels and the capital markets in the U.S. and abroad; the level of success of new product development and global expansion and strength of
domestic and international markets; the demand and market for debt ratings, including corporate issuance, CDO’s, residential and commercial mortgage and asset-backed securities and related asset classes; the continued difficulties in the credit markets and their impact on Standard & Poor’s and the economy in general; the regulatory environment affecting Standard & Poor’s; the level of merger and acquisition activity in the U.S. and abroad; the strength of the domestic and international advertising markets; the strength and the performance of the domestic and international automo-tive markets; the volatility of the energy marketplace; the contract value of public works, manufacturing and single-family unit construction; the level of political advertising; and the level of future cash flow, debt levels, manufacturing expens-es, distribution expenses, prepublication, amortization and depreciation expense, income tax rates, capital, technology, restructuring charges and other expendi-tures and prepublication cost investment.
Actual results may differ materially from those in any forward-looking statements because any such statements involve risks and uncertainties and are subject to change based upon various important factors, including, but not limited to, worldwide economic, financial, political and regulatory conditions; currency and foreign exchange volatility; the health of debt and equity markets, including interest rates, credit quality and spreads, the level of liquidity, future debt issuances including, corporate issuance, residential and commercial mortgage-backed securities and CDO’s backed by residential mortgages, related asset classes and other asset-backed securities; the implementation of an expanded regulatory scheme affecting Standard & Poor’s ratings and services; the level of funding in the education market (both domestically and internationally); the pace of recovery in advertising; continued investment by the construction, automotive, computer and aviation industries; the successful marketing of new products, and the effect of competitive products and pricing.
Harold McGraw IIIChairman, President and Chief Executive Officer
CorporateRobert J. BahashExecutive Vice President and Chief Financial Officer
Bruce D. MarcusExecutive Vice President and Chief Information Officer
David L. MurphyExecutive Vice President Human Resources
D. Edward SmythExecutive Vice President, Corporate Affairs and Executive Assistant to the Chairman, President and CEO
Charles L. Teschner, Jr.Executive Vice President Global Strategy
Kenneth M. VittorExecutive Vice President and General Counsel
OperationsPeter C. DavisPresident McGraw-Hill Education
Deven SharmaPresident Financial Services
Glenn S. GoldbergPresident Information & Media
Principal Executives

Financial Overview Committed to Creating Shareholder Value2 Free Cash Flow | Net Debt to EBITDA | Cash Returned to Shareholders
3 How the Business Model Is Changing Market Opportunities and Driving Long-Term Growth
Advancing Total Shareholder Value4 – 5 Dividend Record | Share Repurchase and Stock History6 – 7 Corporate and Operating Segments at a Glance
Expanding Globally8 – 9 International Operations by Region and Segment10 – 11 Eleven-Year Segment Trends: Revenue | Expense | Operating Profit12 Eleven-Year Consolidated Profit and Loss13 – 14 Three-Year Quarterly Results15 Return on Invested Capital, Average Shareholders’ Equity | Debt Profile16 EBITDA, Net of Investment in Prepublication Costs17 Capital Investments18 – 19 Acquisitions and Divestitures20 – 21 Items Impacting Comparability of Results
Positioned for Long-Term Growth22 Trends in MHP’s Key Markets
McGraw-Hill Education23 A Leading Provider of Learning Solutions24 – 25 Federal Funding for Key Education Programs26 – 27 Pre-K–16 Public Education: Funding, Expenditures, Enrollments28 – 29 Growing Enrollments in Key Adoption States | Pre-K–12 Market Sales30 – 31 Elementary and Secondary School Adoption Schedules32 – 33 Center for Digital Innovation34 – 35 Assessment and Reporting Market36 – 37 Higher Education and Online Learning Markets38 – 39 Professional Markets
Financial Services40 – 42 Serving the Global Capital Markets43 S&P Credit Market Services44 – 45 U.S., European, and Asian Debt Markets46 Ratings Diversification47 S&P Investment Services48 Valuation & Risk Strategies49 Capital IQ50 – 51 S&P Indices52 S&P Equity Research Services
Information & Media53 Providing Valuable Insights to Global Markets54 – 55 Energy and Metals56 Construction57 Aerospace and Defense58 J.D. Power and Associates
The McGraw-Hill Companies
2 The McGraw-Hill CompaniesRefer to pages 20 and 21 for summary of financial notes
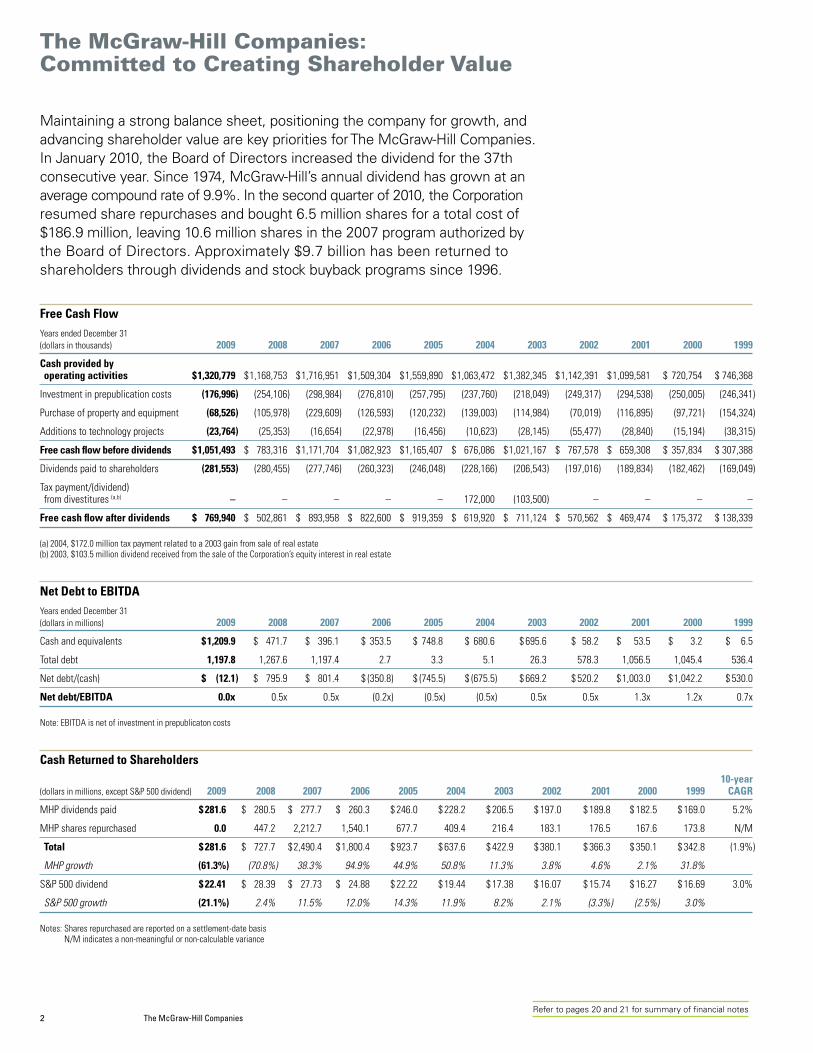
The McGraw-Hill Companies: Committed to Creating Shareholder Value
Free Cash FlowYears ended December 31(dollars in thousands) 2009 2008 2007 2006 2005 2004 2003 2002 2001 2000 1999
Cash provided by operating activities $ 1,320,779 $ 1,168,753 $ 1,716,951 $ 1,509,304 $ 1,559,890 $ 1,063,472 $ 1,382,345 $ 1,142,391 $ 1,099,581 $ 720,754 $ 746,368
Investment in prepublication costs (176,996) (254,106) (298,984) (276,810) (257,795) (237,760) (218,049) (249,317) (294,538) (250,005) (246,341)
Purchase of property and equipment (68,526) (105,978) (229,609) (126,593) (120,232) (139,003) (114,984) (70,019) (116,895) (97,721) (154,324)
Additions to technology projects (23,764) (25,353) (16,654) (22,978) (16,456) (10,623) (28,145) (55,477) (28,840) (15,194) (38,315)
Free cash flow before dividends $ 1,051,493 $ 783,316 $ 1,171,704 $ 1,082,923 $ 1,165,407 $ 676,086 $ 1,021,167 $ 767,578 $ 659,308 $ 357,834 $ 307,388
Dividends paid to shareholders (281,553) (280,455) (277,746) (260,323) (246,048) (228,166) (206,543) (197,016) (189,834) (182,462) (169,049)
Tax payment/(dividend) from divestitures (a,b) – – – – – 172,000 (103,500) – – – –
Free cash flow after dividends $ 769,940 $ 502,861 $ 893,958 $ 822,600 $ 919,359 $ 619,920 $ 711,124 $ 570,562 $ 469,474 $ 175,372 $ 138,339
(a) 2004, $172.0 million tax payment related to a 2003 gain from sale of real estate(b) 2003, $103.5 million dividend received from the sale of the Corporation’s equity interest in real estate
Net Debt to EBITDAYears ended December 31(dollars in millions) 2009 2008 2007 2006 2005 2004 2003 2002 2001 2000 1999
Cash and equivalents $ 1,209.9 $ 471.7 $ 396.1 $ 353.5 $ 748.8 $ 680.6 $ 695.6 $ 58.2 $ 53.5 $ 3.2 $ 6.5
Total debt 1,197.8 1,267.6 1,197.4 2.7 3.3 5.1 26.3 578.3 1,056.5 1,045.4 536.4
Net debt/(cash) $ (12.1) $ 795.9 $ 801.4 $ (350.8) $ (745.5) $ (675.5) $ 669.2 $ 520.2 $ 1,003.0 $ 1,042.2 $ 530.0
Net debt/EBITDA 0.0x 0.5x 0.5x (0.2x) (0.5x) (0.5x) 0.5x 0.5x 1.3x 1.2x 0.7x
Note: EBITDA is net of investment in prepublicaton costs
Cash Returned to Shareholders 10-year (dollars in millions, except S&P 500 dividend) 2009 2008 2007 2006 2005 2004 2003 2002 2001 2000 1999 CAGR
MHP dividends paid $ 281.6 $ 280.5 $ 277.7 $ 260.3 $ 246.0 $ 228.2 $ 206.5 $ 197.0 $ 189.8 $ 182.5 $ 169.0 5.2%
MHP shares repurchased 0.0 447.2 2,212.7 1,540.1 677.7 409.4 216.4 183.1 176.5 167.6 173.8 N/M
Total $ 281.6 $ 727.7 $ 2,490.4 $ 1,800.4 $ 923.7 $ 637.6 $ 422.9 $ 380.1 $ 366.3 $ 350.1 $ 342.8 (1.9%)
MHP growth (61.3%) (70.8%) 38.3% 94.9% 44.9% 50.8% 11.3% 3.8% 4.6% 2.1% 31.8%
S&P 500 dividend $ 22.41 $ 28.39 $ 27.73 $ 24.88 $ 22.22 $ 19.44 $ 17.38 $ 16.07 $ 15.74 $ 16.27 $ 16.69 3.0%
S&P 500 growth (21.1%) 2.4% 11.5% 12.0% 14.3% 11.9% 8.2% 2.1% (3.3%) (2.5%) 3.0%
Notes: Shares repurchased are reported on a settlement-date basis N/M indicates a non-meaningful or non-calculable variance
Maintaining a strong balance sheet, positioning the company for growth, and advancing shareholder value are key priorities for The McGraw-Hill Companies. In January 2010, the Board of Directors increased the dividend for the 37th consecutive year. Since 1974, McGraw-Hill’s annual dividend has grown at an average compound rate of 9.9%. In the second quarter of 2010, the Corporation resumed share repurchases and bought 6.5 million shares for a total cost of $186.9 million, leaving 10.6 million shares in the 2007 program authorized by the Board of Directors. Approximately $9.7 billion has been returned to shareholders through dividends and stock buyback programs since 1996.
2010/2011 MHP Investor Fact Book 3
Overview
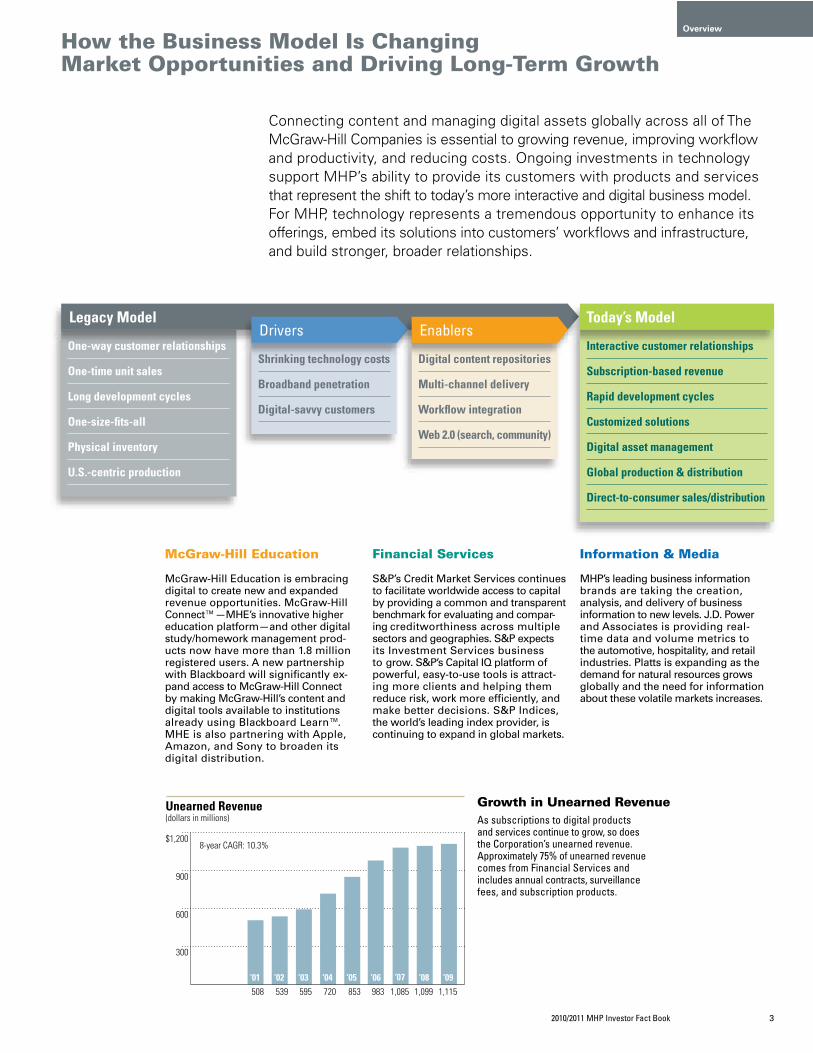
How the Business Model Is Changing Market Opportunities and Driving Long-Term Growth
Connecting content and managing digital assets globally across all of The McGraw-Hill Companies is essential to growing revenue, improving workflow and productivity, and reducing costs. Ongoing investments in technology support MHP’s ability to provide its customers with products and services that represent the shift to today’s more interactive and digital business model. For MHP, technology represents a tremendous opportunity to enhance its offerings, embed its solutions into customers’ workflows and infrastructure, and build stronger, broader relationships.
One-way customer relationships
One-time unit sales
Long development cycles
One-size-fits-all
Physical inventory
U.S.-centric production
Shrinking technology costs
Broadband penetration
Digital-savvy customers
Digital content repositories
Multi-channel delivery
Workflow integration
Web 2.0 (search, community)
Legacy ModelDrivers Enablers
Interactive customer relationships
Subscription-based revenue
Rapid development cycles
Customized solutions
Digital asset management
Global production & distribution
Direct-to-consumer sales/distribution
Today’s Model
300
600
900
$1,200
Unearned Revenue(dollars in millions)
508 539 595 720 853 983 1,085 1,099 1,115‘01 ‘02 ‘03 ‘04 ‘05 ‘06 ‘07 ‘08 ‘09
8-year CAGR: 10.3%
McGraw-Hill Education
McGraw-Hill Education is embracing digital to create new and expanded revenue opportunities. McGraw-Hill Connect™—MHE’s innovative higher education platform—and other digital study/homework management prod-ucts now have more than 1.8 million registered users. A new partnership with Blackboard will significantly ex-pand access to McGraw-Hill Connect by making McGraw-Hill’s content and digital tools available to institutions already using Blackboard Learn™. MHE is also partnering with Apple, Amazon, and Sony to broaden its digital distribution.
Financial Services
S&P’s Credit Market Services continues to facilitate worldwide access to capital by providing a common and transparent benchmark for evaluating and compar-ing creditworthiness across multiple sectors and geographies. S&P expects its Investment Services business to grow. S&P’s Capital IQ platform of powerful, easy-to-use tools is attract-ing more clients and helping them reduce risk, work more efficiently, and make better decisions. S&P Indices, the world’s leading index provider, is continuing to expand in global markets.
Information & Media
MHP’s leading business information brands are taking the creation, analysis, and delivery of business information to new levels. J.D. Power and Associates is providing real- time data and volume metrics to the automotive, hospitality, and retail industries. Platts is expanding as the demand for natural resources grows globally and the need for informa tion about these volatile markets increases.
Growth in Unearned Revenue As subscriptions to digital products and services continue to grow, so does the Corporation’s unearned revenue. Approximately 75% of unearned revenue comes from Financial Services and includes annual contracts, surveillance fees, and subscription products.
4 The McGraw-Hill CompaniesRefer to pages 20 and 21 for summary of financial notes
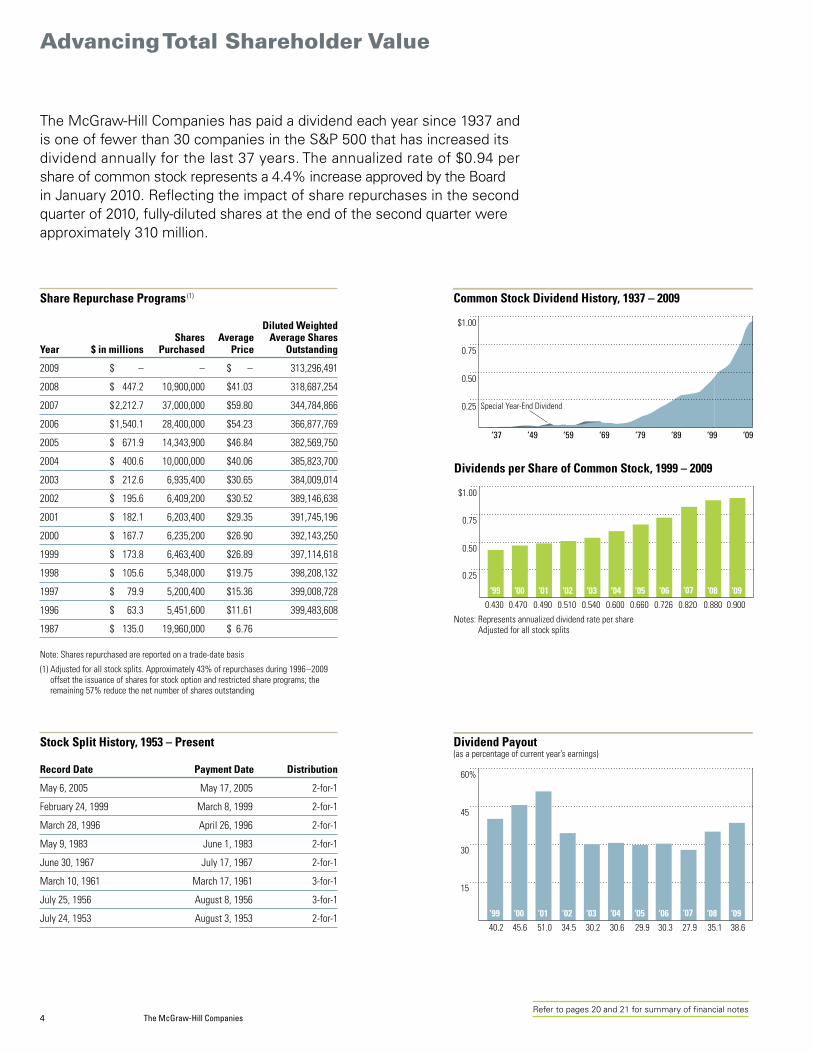
Advancing Total Shareholder Value
0.25
0.50
0.75
$1.00
Common Stock Dividend History, 1937 – 2009
‘37 ‘49 ‘59 ‘69 ‘79 ‘89 ‘99 ‘09
Special Year-End Dividend
0.25
0.50
0.75
$1.00
Dividends per Share of Common Stock, 1999 – 2009
0.430 0.470 0.490 0.510 0.540 0.600 0.660 0.726 0.820 0.880 0.900‘99 ‘00 ‘01 ‘02 ‘03 ‘04 ‘05 ‘06 ‘07 ‘08 ‘09
Notes: Represents annualized dividend rate per share Adjusted for all stock splits
The McGraw-Hill Companies has paid a dividend each year since 1937 and is one of fewer than 30 companies in the S&P 500 that has increased its dividend annually for the last 37 years. The annualized rate of $0.94 per share of common stock represents a 4.4% increase approved by the Board in January 2010. Reflecting the impact of share repurchases in the second quarter of 2010, fully-diluted shares at the end of the second quarter were approximately 310 million.
Share Repurchase Programs (1)
Diluted Weighted Shares Average Average SharesYear $ in millions Purchased Price Outstanding
2009 $ – – $ – 313,296,491
2008 $ 447.2 10,900,000 $ 41.03 318,687,254
2007 $ 2,212.7 37,000,000 $ 59.80 344,784,866
2006 $ 1,540.1 28,400,000 $ 54.23 366,877,769
2005 $ 671.9 14,343,900 $ 46.84 382,569,750
2004 $ 400.6 10,000,000 $ 40.06 385,823,700
2003 $ 212.6 6,935,400 $ 30.65 384,009,014
2002 $ 195.6 6,409,200 $ 30.52 389,146,638
2001 $ 182.1 6,203,400 $ 29.35 391,745,196
2000 $ 167.7 6,235,200 $ 26.90 392,143,250
1999 $ 173.8 6,463,400 $ 26.89 397,114,618
1998 $ 105.6 5,348,000 $ 19.75 398,208,132
1997 $ 79.9 5,200,400 $ 15.36 399,008,728
1996 $ 63.3 5,451,600 $ 11.61 399,483,608
1987 $ 135.0 19,960,000 $ 6.76
Note: Shares repurchased are reported on a trade-date basis(1) Adjusted for all stock splits. Approximately 43% of repurchases during 1996–2009
offset the issuance of shares for stock option and restricted share programs; the remaining 57% reduce the net number of shares outstanding
Stock Split History, 1953 – Present
Record Date Payment Date Distribution
May 6, 2005 May 17, 2005 2-for-1
February 24, 1999 March 8, 1999 2-for-1
March 28, 1996 April 26, 1996 2-for-1
May 9, 1983 June 1, 1983 2-for-1
June 30, 1967 July 17, 1967 2-for-1
March 10, 1961 March 17, 1961 3-for-1
July 25, 1956 August 8, 1956 3-for-1
July 24, 1953 August 3, 1953 2-for-1
15
30
45
60%
Dividend Payout(as a percentage of current year’s earnings)
40.2 45.6 51.0 34.5 30.2 30.6 29.9 30.3 27.9 35.1 38.6‘99 ‘00 ‘01 ‘02 ‘03 ‘04 ‘05 ‘06 ‘07 ‘08 ‘09

2010/2011 MHP Investor Fact Book 5
Overview
Quarterly Stock Valuation Data
Year Quarter Prices* MHP MHP – Price to Earnings** S&P 500 – Price to Earnings P/E Relative to S&P 500
High Low Close Volume High Low Close High Low Close High Low Close
2009 4 35.240 24.460 33.510 194,468,691 14.87 10.32 14.14 19.88 17.94 19.61 0.75 0.58 0.72 3 34.100 23.550 25.140 243,943,008 14.89 10.28 10.98 27.27 21.95 26.69 0.55 0.47 0.41 2 34.090 22.460 30.110 177,245,398 13.64 8.98 12.04 24.03 19.69 23.10 0.57 0.46 0.52 1 25.890 17.220 22.870 245,097,570 9.84 6.55 8.70 21.95 15.51 18.56 0.45 0.42 0.47
2008 4 33.120 17.150 23.190 200,117,215 12.36 6.40 8.65 18.56 16.48 18.24 0.67 0.39 0.47 3 47.130 22.000 31.610 153,573,747 17.01 7.94 11.41 20.26 17.07 17.99 0.84 0.47 0.63 2 45.610 36.170 40.120 163,545,961 16.00 12.69 14.08 20.65 18.24 18.35 0.77 0.70 0.77 1 44.760 33.910 36.950 184,588,816 15.22 11.53 12.57 19.17 16.37 17.23 0.79 0.70 0.73
2007 4 55.140 43.460 43.810 178,192,844 18.08 14.25 14.36 19.09 17.04 17.79 0.95 0.84 0.81 3 68.810 47.150 50.910 247,126,617 21.98 15.06 16.27 17.42 15.35 17.09 1.26 0.98 0.95 2 72.500 60.160 68.080 123,650,344 24.83 20.60 23.32 16.83 15.47 16.42 1.48 1.33 1.42 1 69.980 61.060 62.880 124,541,820 25.63 23.37 23.03 16.36 15.26 15.90 1.57 1.53 1.45
2006 4 69.250 57.280 68.020 76,636,900 26.95 22.29 26.47 16.32 15.13 16.17 1.65 1.47 1.64 3 58.300 48.400 58.030 92,639,400 22.95 19.06 22.85 15.60 14.25 15.55 1.47 1.34 1.47 2 58.750 47.800 50.230 121,441,400 23.98 19.51 20.50 16.23 14.92 15.54 1.48 1.31 1.32 1 59.570 46.370 57.620 119,198,700 25.35 19.73 24.52 16.55 15.73 16.35 1.53 1.25 1.50
2005 4 53.970 45.600 51.630 78,045,900 23.26 19.66 22.25 16.69 15.28 16.33 1.39 1.29 1.36 3 48.750 43.010 48.040 66,287,000 21.86 19.29 21.54 16.79 15.95 16.56 1.30 1.21 1.30 2 45.675 40.510 44.250 111,714,000 21.91 19.43 21.22 16.88 15.73 16.49 1.30 1.24 1.29 1 47.995 42.810 43.625 106,768,000 24.00 21.41 21.81 17.61 16.67 16.91 1.36 1.28 1.29
2004 4 46.055 39.425 45.770 83,969,000 23.74 20.32 23.59 17.94 16.11 17.91 1.32 1.26 1.32 3 39.885 36.415 39.845 74,212,200 21.50 19.63 21.48 17.66 16.44 17.25 1.22 1.19 1.25 2 40.670 37.825 38.285 85,443,000 23.11 21.49 21.75 18.52 17.32 18.36 1.25 1.24 1.18 1 40.185 34.550 38.070 97,652,000 23.64 20.32 22.39 19.95 18.98 19.39 1.18 1.07 1.15
2003 4 35.000 30.995 34.960 84,799,800 21.21 18.78 21.19 20.34 18.21 20.33 1.04 1.03 1.04 3 32.255 29.300 31.065 97,932,400 20.35 18.49 19.60 20.10 18.57 19.25 1.01 1.00 1.02 2 33.075 27.730 31.000 124,260,600 21.62 18.12 20.26 20.74 17.32 19.91 1.04 1.05 1.02 1 31.290 25.870 27.795 131,153,800 20.79 17.19 18.47 19.62 16.55 17.79 1.06 1.04 1.04
2002 4 33.150 27.755 30.220 120,239,200 22.25 18.63 20.28 20.73 16.70 19.11 1.07 1.12 1.06 3 32.990 25.355 30.610 87,467,400 23.15 17.79 21.48 22.58 17.62 18.52 1.03 1.01 1.16 2 34.365 28.150 29.850 78,497,800 25.74 21.09 22.36 27.60 22.92 23.80 0.93 0.92 0.94 1 34.850 29.440 34.125 78,760,600 27.23 23.00 26.66 30.20 27.57 29.44 0.90 0.83 0.91
2001 4 30.900 24.350 30.490 110,203,800 24.92 19.64 24.59 30.21 26.43 29.55 0.82 0.74 0.83 3 33.975 25.275 29.100 77,876,200 27.51 20.47 23.56 29.50 22.48 24.77 0.93 0.91 0.95 2 35.435 28.920 33.075 76,444,200 30.29 24.72 28.27 27.98 23.22 26.03 1.08 1.06 1.09 1 32.370 27.045 29.825 82,145,400 28.27 23.62 26.05 26.16 20.44 21.94 1.08 1.16 1.19
2000 4 33.000 26.000 29.313 75,829,400 27.73 21.85 24.63 25.92 22.34 23.52 1.07 0.98 1.05 3 33.844 27.125 31.781 68,728,000 29.18 23.38 27.40 26.94 25.00 25.30 1.08 0.94 1.08 2 29.938 20.938 27.000 77,756,800 26.49 18.53 23.89 27.47 24.09 26.17 0.96 0.77 0.91 1 30.844 21.750 22.750 87,262,600 28.56 20.14 21.06 28.80 24.57 27.79 0.99 0.82 0.76
1999 4 31.563 24.500 30.813 59,725,800 30.94 24.02 30.21 28.37 23.87 28.43 1.09 1.01 1.06 3 27.063 23.563 24.188 52,501,000 28.04 24.42 25.06 28.76 25.44 25.98 0.98 0.96 0.96 2 30.375 25.219 26.969 66,502,200 33.94 28.18 30.13 29.36 27.28 29.29 1.16 1.03 1.03 1 29.563 24.438 27.250 85,734,200 34.28 28.33 31.59 29.37 26.74 28.54 1.17 1.06 1.11
1998 4 25.828 18.063 25.469 87,647,200 30.30 21.19 29.88 28.12 20.86 27.77 1.08 1.02 1.08 3 21.750 18.516 19.813 82,613,200 26.13 22.24 23.80 27.00 21.32 23.07 0.97 1.04 1.03 2 20.750 18.188 20.375 71,664,398 26.60 23.32 26.12 25.40 24.05 25.38 1.05 0.97 1.03 1 19.500 17.125 19.015 67,188,390 26.09 22.91 25.44 25.09 20.57 24.83 1.04 1.11 1.02
Source: Standard & Poor’s Capital IQ - Compustat * Data adjusted for all stock splits** Based on 12-month moving operating earnings per share, which excludes one-time items

6 The McGraw-Hill CompaniesRefer to pages 20 and 21 for summary of financial notes
Financial Highlights
(dollars in millions, except earnings per share) 2009 2008 2007
Total revenue $ 5,952 $ 6,355 $ 6,772
Segment expenses 4,569 4,871 4,935
Operating profit 1,383 1,484 1,837
General corporate expense (127) (109) (160)
Interest (expense)–net (77) (76) (41)
Income before taxes on income 1,179 1,299 1,636
Provision for taxes on income 429 480 609
Net income 750 819 1,027
Less: net income attributable to noncontrolling interests (19) (20) (13)
Net income attributable to The McGraw-Hill Companies 731 799 1,014
Diluted EPS $ 2.33 $ 2.51 $ 2.94
Corporate and Operating Segments at a Glance
A leading global information provider, The McGraw-Hill Companies is focused on growth opportunities in core markets—education, financial services, and business information. MHP’s three operating segments—Education, Financial Services, and Information & Media—help meet the need for knowledge and education, provide access to the world’s capital markets, and increase information transparency for better decision making.
The McGraw-Hill CompaniesFocused on Growth Opportunities
2,000
4,000
6,000
$8,000
0
10
20
30%
Revenue and Growth(dollars in millions)
! Total Revenue ($) 6,772 6,355 5,952
! Year-Over-Year Change (%) 8.3 (6.2) (6.3)
‘07 ‘08 ‘09
500
1,000
1,500
$2,000
15
30
45
60%
Operating Profit and Operating Profit Margin(dollars in millions)
! Operating Profit ($) 1,837 1,484 1,383
! Operating Profit Margin (%) 27.1 23.3 23.2
‘07 ‘08 ‘09
0.75
1.50
2.25
$3.00
Diluted EPS(in dollars)
‘07 ‘08 ‘09! Diluted EPS 2.94 2.51 2.33
1,250
2,500
3,750
$5,000
Consolidated Segment Expenses(dollars in millions)
‘07 ‘08 ‘09! Consolidated Segment Expenses 4,935 4,871 4,569

2010/2011 MHP Investor Fact Book 7
Overview
Segment Revenue, Operating Profit and Operating Margin
(dollars in millions) 2009 2008 2007
Revenue $ 2,388 $ 2,639 $ 2,706
Operating profit $ 276 $ 321 $ 403
Operating profit margin 11.6% 12.2% 14.9%
McGraw-Hill Education Revenue by Group
(dollars in millions) 2009 2008 2007
School Education Group (SEG) $ 1,112 $ 1,363 $ 1,441
Higher Education, Professional and International Group (HPI) $ 1,276 $ 1,276 $ 1,265
McGraw-Hill Education
SEG 18.7%
HPI 21.4%
20.0%
2009 Revenue$2.4 billion40.1% of total revenue
2009Operating Profit$276.0 million20.0% of total operating profit
Segment Revenue, Operating Profit and Operating Margin
(dollars in millions) 2009 2008 2007
Revenue $ 2,610 $ 2,654 $ 3,046
Operating profit $ 1,014 $ 1,070 $ 1,370
Operating profit margin 38.9% 40.3% 45.0%
Financial Services Revenue by Group
(dollars in millions) 2009 2008 2007
Credit Market Services (CMS) $ 1,748 $ 1,755 $ 2,264
Investment Services (IS) $ 862 $ 899 $ 782
Financial Services
IS 14.5%
CMS 29.4% 73.3%
2009Revenue$2.6 billion43.9% of total revenue
2009Operating Profit$1.0 billion73.3% of total operating profit
Segment Revenue, Operating Profit and Operating Margin
(dollars in millions) 2009 2008 2007
Revenue $ 954 $ 1,062 $ 1,020
Operating profit $ 93 $ 92 $ 63
Operating profit margin 9.7% 8.7% 6.2%
Information & Media Revenue by Group
(dollars in millions) 2009 2008 2007
B2B Group $ 873 $ 955 $ 917
Broadcasting $ 81 $ 107 $ 103
Information & Media
B2B 14.7%
Broadcasting 1.3% 6.7%
2009 Revenue$953.9 million16.0% of total revenue
2009Operating Profit$92.7 million6.7% of total operating profit

8 The McGraw-Hill CompaniesRefer to pages 20 and 21 for summary of financial notes
Expanding Globally
McGraw-Hill Education
McGraw-Hill Education is capitalizing on the global demand for knowledge, particularly in vocational and English-language training and online instruction.
In India, Tata McGraw-Hill, a joint venture between Tata and McGraw-Hill Education, launched a professional-development program for India’s growing retail industry.
In China, McGraw-Hill Education has partnered with Ambow Educa-tion, a market leader in vocational training services, to develop new English-language training programs for Chinese engineers.
In the United Arab Emirates, McGraw-Hill Education has developed custom assessments for English-language proficiency training.
Financial Services
CRISIL, a Standard & Poor’s company, recently launched a new service, Independent Equity Research (IER), providing investors with high-quality research on listed Indian companies. CRISIL is India’s leading provider of ratings, research, and risk and policy advisory services.
Standard & Poor’s launched the ASEAN Regional Rating Scale to facilitate increased regional and global market participation in Southeast Asia.
S&P has forged relationships with leading stock exchanges around the world—including the Australian Securities Exchange, the National Stock Exchange of India, the Toronto Stock Exchange, and the RTS Exchange in Moscow—to calculate and manage local stock indices.
Information & Media
Platts is expanding by bringing information transparency critical to growing markets for national resources around the world.
J.D. Power and Associates continues to deepen its offering and expand its services internationally, including in China, where the automotive market is growing rapidly.
AVIATION WEEK continues to expand in the defense sector as well as in emerging markets, including India, the Middle East, and Asia-Pacific.
Approximately 20% of total 2009 international revenue came from emerging markets—with India as the key driver
500
1,000
1,500
$2,000
Geographic Region and Percent of Total Foreign Source Revenue (dollars in millions)
‘04 ‘05 ‘06 ‘07 ‘08 ‘09
! Europe $ 648.2 57.3% $ 760.0 56.8% $ 883.9 57.8% $1,030.9 58.4% $1,020.5 57.5% $ 963.7 55.9%! Canada 121.0 10.7% 136.3 10.2% 155.8 10.2% 176.3 10.0% 181.4 10.2% 180.9 10.5%! Asia 262.8 23.2% 336.6 25.2% 376.3 24.6% 426.1 24.2% 438.8 24.7% 467.8 27.1%! Latin America 98.4 8.7% 104.9 7.8% 114.1 7.5% 130.5 7.4% 135.0 7.6% 113.0 6.5% Total $1,130.4 100% $1,337.8 100% $1,530.1 100% $1,763.8 100% $1,775.7 100% $1,725.4 100%
Note: Detail may not sum to totals due to rounding
5-year CAGREurope 8.3%
Canada 8.4%
Asia 12.2%
Latin America 2.8%
Total 8.8%
Since 2002, MHP’s year-over-year revenue growth from abroad has outpaced domestic performance. In 2009, foreign sources accounted for 29% of MHP’s total revenue. The rapid rise of developing economies in Asia, including India, are creating significant opportunities for The McGraw-Hill Companies. 1
3
5
$7
Domestic and Foreign Source Revenue Growth, 1999 – 2009*(dollars in billions)
‘99 ‘00 ‘01 ‘02 ‘03 ‘04 ‘05 ‘06 ‘07 ‘08 ‘09
Domestic 10-year CAGR: 2.7%Foreign 10-year CAGR: 8.9%
! Domestic $3.2 $3.5 $3.7 $3.8 $3.9 $4.1 $4.7 $4.7 $5.0 $4.6 $4.2! Foreign 0.7 0.8 0.8 0.9 1.0 1.1 1.3 1.5 1.8 1.8 1.7 Total $4.0 $4.3 $4.5 $4.7 $4.9 $5.3 $6.0 $6.3 $6.8 $6.4 $6.0* Foreign source revenue includes international sales by U.S. operations

2010/2011 MHP Investor Fact Book 9
Overview
Domestic and Foreign Source Revenue by Segment % of 2009 10-year (dollars in millions) 2009 total 2008 2007 2006 2005 2004 2003 2002 2001 2000 1999 CAGR
RevenueDomestic $ 4,226.4 71.0% $ 4,579.4 $ 5,008.5 $ 4,725.0 $ 4,665.8 $ 4,120.1 $ 3,924.9 $ 3,847.7 $ 3,739.0 $ 3,483.0 $ 3,243.5 2.7%Foreign* 1,725.4 29.0% 1,775.7 1,763.8 1,530.1 1,337.8 1,130.4 965.4 860.0 795.0 768.2 736.3 8.9%Total $ 5,951.8 100% $ 6,355.1 $ 6,772.3 $ 6,255.1 $ 6,003.6 $ 5,250.5 $ 4,890.3 $ 4,707.7 $ 4,534.0 $ 4,251.2 $ 3,979.8 5.5%
Revenue by SegmentDomesticMcGraw-Hill Education $ 1,976.2 46.8% $ 2,186.1 $ 2,266.8 $ 2,130.8 $ 2,286.9 $ 2,041.0 $ 2,021.2 $ 2,039.9 $ 2,004.0 $ 1,743.1 $ 1,496.6 2.8%Financial Services 1,572.6 37.2% 1,595.0 1,958.6 1,807.1 1,629.6 1,413.1 1,258.8 1,126.0 1,014.3 868.8 856.7 6.3%Information & Media 677.6 16.0% 798.3 783.1 787.1 749.3 666.0 644.9 681.8 720.7 871.1 890.2 (2.7%)Total $ 4,226.4 100% $ 4,579.4 $ 5,008.5 $ 4,725.0 $ 4,665.8 $ 4,120.1 $ 3,924.9 $ 3,847.7 $ 3,739.0 $ 3,483.0 $ 3,243.5 2.7%
Foreign*McGraw-Hill Education $ 411.6 23.9% $ 452.8 $ 439.1 $ 393.4 $ 384.8 $ 354.5 $ 327.4 $ 302.6 $ 285.6 $ 295.5 $ 289.6 3.6%Financial Services 1,037.5 60.1% 1,059.3 1,087.6 939.3 771.2 642.2 510.3 429.7 384.0 336.2 306.9 13.0%Information & Media 276.3 16.0% 263.6 237.1 197.4 181.8 133.7 127.7 127.7 125.4 136.5 139.8 7.1%Total $ 1,725.4 100% $ 1,775.7 $ 1,763.8 $ 1,530.1 $ 1,337.8 $ 1,130.4 $ 965.4 $ 860.0 $ 795.0 $ 768.2 $ 736.3 8.9%
* Foreign source revenue includes international sales by U.S. operations
Foreign Source Revenue by Segment
125
250
375
$500
McGraw-Hill Education(dollars in millions) (percent of total foreign source revenue)
290 296 286 303 327 355 385 393 439 453 412‘99 ‘00 ‘01 ‘02 ‘03 ‘04 ‘05 ‘06 ‘07 ‘08 ‘09
39.3% 38.5% 35.9%35.2%
33.9%
28.8% 25.7%
24.9% 25.5%
23.9%
31.4%
75
150
225
$300
Information & Media(dollars in millions) (percent of total foreign source revenue)
140 137 125 128 128 134 182 197 237 264 276‘99 ‘00 ‘01 ‘02 ‘03 ‘04 ‘05 ‘06 ‘07 ‘08 ‘09
15.8% 14.8% 13.2%
13.6%12.9%
13.4%
14.8%16.0%
11.8%19.0% 17.8%
300
600
900
$1,200
Financial Services(dollars in millions) (percent of total foreign source revenue)
307 336 384 430 510 642 771 939 1,088 1,059 1,038‘99 ‘00 ‘01 ‘02 ‘03 ‘04 ‘05 ‘06 ‘07 ‘08 ‘09
41.7% 43.8%48.3%
50.0%52.9%
57.6%
61.4%
61.7% 59.7% 60.1%
56.8%
500
1,000
1,500
$2,000
Total Company(dollars in millions)
736 768 795 860 965 1,130 1,338 1,530 1,764 1,776 1,725‘99 ‘00 ‘01 ‘02 ‘03 ‘04 ‘05 ‘06 ‘07 ‘08 ‘09
2009 2008 2007 2006 2005 2004 2003 2002 2001 2000 1999
Number of EmployeesDomestic 11,336 11,986 12,565 12,860 13,486 13,122 12,736 13,180 13,566 13,339 13,032Foreign 9,741 9,663 8,606 7,354 6,114 4,131 3,332 3,325 3,569 3,422 3,344Total 21,077 21,649 21,171 20,214 19,600 17,253 16,068 16,505 17,135 16,761 16,376

10 The McGraw-Hill CompaniesRefer to pages 20 and 21 for summary of financial notes
Revenue by Segment
(dollars in millions) 2009 2008 2007 2006 2005 2004 2003 2002 2001 2000 1999
McGraw-Hill Education $ 2,387.8 $ 2,638.9 $ 2,705.9 $ 2,524.2 $ 2,671.7 $ 2,395.5 $ 2,348.6 $ 2,342.5 $ 2,289.6 $ 2,038.6 $ 1,786.2
% increase/(decrease) (9.5%) (2.5%) 7.2% (5.5%) 11.5% 2.0% 0.3% 2.3% 12.3% 14.1% 7.6%
% of total revenue 40.1% 41.5% 40.0% 40.4% 44.5% 45.6% 48.0% 49.8% 50.5% 48.0% 44.9%
Financial Services $ 2,610.1 $ 2,654.3 $ 3,046.2 $ 2,746.4 $ 2,400.8 $ 2,055.3 $ 1,769.1 $ 1,555.7 $ 1,398.3 $ 1,205.0 $ 1,163.6
% increase/(decrease) (1.7%) (12.9%) 10.9% 14.4% 16.8% 16.2% 13.7% 11.3% 16.0% 3.6% 12.2%
% of total revenue 43.9% 41.8% 45.0% 43.9% 40.0% 39.2% 36.2% 33.0% 30.8% 28.3% 29.2%
Information & Media $ 953.9 $ 1,061.9 $ 1,020.2 $ 984.5 $ 931.1 $ 799.7 $ 772.6 $ 809.5 $ 846.1 $ 1,007.6 $ 1,030.0
% increase/(decrease) (10.2%) 4.1% 3.6% 5.7% 16.4% 3.5% (4.6%) (4.3%) (16.0%) (2.2%) 1.4%
% of total revenue 16.0% 16.7% 15.0% 15.7% 15.5% 15.2% 15.8% 17.2% 18.7% 23.7% 25.9%
Total revenue $ 5,951.8 $ 6,355.1 $ 6,772.3 $ 6,255.1 $ 6,003.6 $ 5,250.5 $ 4,890.3 $ 4,707.7 $ 4,534.0 $ 4,251.2 $ 3,979.8
% increase/(decrease) (6.3%) (6.2%) 8.3% 4.2% 14.3% 7.4% 3.9% 3.8% 6.7% 6.8% 7.2%
Expenses by Segment
(dollars in millions) 2009 2008 2007 2006 2005 2004 2003 2002 2001 2000 1999
McGraw-Hill Education $ 2,111.8 $ 2,317.5 $ 2,302.8 $ 2,192.3 $ 2,259.1 $ 2,053.1 $ 2,024.9 $ 2,007.9 $ 2,014.5 $ 1,729.6 $ 1,511.0
% increase/(decrease) (8.9%) 0.6% 5.0% (3.0%) 10.0% 1.4% 0.8% (0.3%) 16.5% 14.5% 3.6%
% of total 46.2% 47.6% 46.7% 47.0% 50.1% 52.0% 53.4% 54.4% 53.5% 51.7% 47.8%
Financial Services $ 1,596.0 $ 1,583.9 $ 1,676.1 $ 1,538.3 $ 1,379.4 $ 1,215.9 $ 1,101.5 $ 994.9 $ 972.4 $ 822.0 $ 805.4
% increase/(decrease) 0.8% (5.5%) 9.0% 11.5% 13.4% 10.4% 10.7% 2.3% 18.3% 2.1% 15.3%
% of total 34.9% 32.5% 34.0% 33.0% 30.6% 30.8% 29.1% 26.9% 25.8% 24.6% 25.5%
Information & Media $ 861.2 $ 969.9 $ 956.7 $ 934.6 $ 870.5 $ 680.4 $ 662.8 $ 691.4 $ 781.1 $ 794.7 $ 844.5
% increase/(decrease) (11.2%) 1.4% 2.4% 7.4% 27.9% 2.7% (4.1%) (11.5%) (1.7%) (5.9%) (3.6%)
% of total 18.9% 19.9% 19.4% 20.0% 19.3% 17.2% 17.5% 18.7% 20.7% 23.7% 26.7%
Total expenses $ 4,569.0 $ 4,871.3 $ 4,935.6 $ 4,665.2 $ 4,509.0 $ 3,949.4 $ 3,789.2 $ 3,694.2 $ 3,768.0 $ 3,346.3 $ 3,160.9
% increase/(decrease) (6.2%) (1.3%) 5.8% 3.5% 14.2% 4.2% 2.6% (2.0%) 12.6% 5.9% 4.2%
Operating Profit by Segment
(dollars in millions) 2009 2008 2007 2006 2005 2004 2003 2002 2001 2000 1999
McGraw-Hill Education $ 276.0 $ 321.4 $ 403.1 $ 331.9 $ 412.6 $ 342.4 $ 323.7 $ 334.6 $ 275.1 $ 309.0 $ 275.2
% increase/(decrease) (14.1%) (20.3%) 21.4% (19.5%) 20.5% 5.8% (3.2%) 21.6% (11.0%) 12.3% 36.2%
% of total 20.0% 21.7% 21.9% 20.9% 27.6% 26.3% 29.4% 33.0% 35.9% 34.1% 33.6%
Financial Services $ 1,014.1 $ 1,070.4 $ 1,370.1 $ 1,208.1 $ 1,021.4 $ 839.4 $ 667.6 $ 560.8 $ 425.9 $ 383.0 $ 358.2
% increase/(decrease) (5.3%) (21.9%) 13.4% 18.3% 21.7% 25.7% 19.0% 31.7% 11.2% 6.9% 5.8%
% of total 73.3% 72.1% 74.6% 76.0% 68.3% 64.5% 60.6% 55.3% 55.6% 42.3% 43.7%
Information & Media $ 92.7 $ 92.0 $ 63.5 $ 49.9 $ 60.6 $ 119.3 $ 109.8 $ 118.1 $ 65.0 $ 212.9 $ 185.5
% increase/(decrease) 0.7% 45.0% 27.2% (17.6%) (49.2%) 8.6% (7.0%) 81.6% (69.5%) 14.8% 33.1%
% of total 6.7% 6.2% 3.5% 3.1% 4.1% 9.2% 10.0% 11.7% 8.5% 23.6% 22.7%
Total operating profit $ 1,382.8 $ 1,483.8 $ 1,836.7 $ 1,589.9 $ 1,494.6 $ 1,301.1 $ 1,101.1 $ 1,013.5 $ 766.0 $ 904.9 $ 818.9
% increase/(decrease) (6.8%) (19.2%) 15.5% 6.4% 14.9% 18.2% 8.7% 32.3% (15.4%) 10.5% 20.4%
Segment Trends

2010/2011 MHP Investor Fact Book 11
Overview
8
15
23
30%
Percent of Total Revenue
‘99 ‘00 ‘01 ‘02 ‘03 ‘04 ‘05 ‘06 ‘07 ‘08 ‘09
15
30
45
60%
Percent of Total Revenue
‘99 ‘00 ‘01 ‘02 ‘03 ‘04 ‘05 ‘06 ‘07 ‘08 ‘09
McGraw-Hill Education Financial Services Information & Media
13
25
38
50%
Percent of Total Revenue
‘99 ‘00 ‘01 ‘02 ‘03 ‘04 ‘05 ‘06 ‘07 ‘08 ‘09
10
20
30
40%
Percent of Total Operating Profit
‘99 ‘00 ‘01 ‘02 ‘03 ‘04 ‘05 ‘06 ‘07 ‘08 ‘09
8
15
23
30%
Operating Profit Margin
‘99 ‘00 ‘01 ‘02 ‘03 ‘04 ‘05 ‘06 ‘07 ‘08 ‘09
20
40
60
80%
Percent of Total Operating Profit
‘99 ‘00 ‘01 ‘02 ‘03 ‘04 ‘05 ‘06 ‘07 ‘08 ‘09
13
25
38
50%
Operating Profit Margin
‘99 ‘00 ‘01 ‘02 ‘03 ‘04 ‘05 ‘06 ‘07 ‘08 ‘09
8
15
23
30%
Percent of Total Operating Profit
‘99 ‘00 ‘01 ‘02 ‘03 ‘04 ‘05 ‘06 ‘07 ‘08 ‘09
8
15
23
30%
Operating Profit Margin
‘99 ‘00 ‘01 ‘02 ‘03 ‘04 ‘05 ‘06 ‘07 ‘08 ‘09
Operating Profit Margin by Segment
2009 2008 2007 2006 2005 2004 2003 2002 2001 2000 1999
McGraw-Hill Education 11.6% 12.2% 14.9% 13.2% 15.4% 14.3% 13.8% 14.3% 12.0% 15.2% 15.4%
Financial Services 38.9% 40.3% 45.0% 44.0% 42.5% 40.8% 37.7% 36.1% 30.5% 31.8% 30.8%
Information & Media 9.7% 8.7% 6.2% 5.1% 6.5% 14.9% 14.2% 14.6% 7.7% 21.1% 18.0%
Total operating profit margin 23.2% 23.3% 27.1% 25.4% 24.9% 24.8% 22.5% 21.5% 16.9% 21.3% 20.6%

12 The McGraw-Hill CompaniesRefer to pages 20 and 21 for summary of financial notes
Consolidated Profit and Loss
(dollars in millions, except per share data) 2009 2008 2007 2006 2005 2004 2003 2002 2001 2000 1999
Total revenue $ 5,951.8 $ 6,355.1 $ 6,772.3 $ 6,255.1 $ 6,003.6 $ 5,250.5 $ 4,890.3 $ 4,707.7 $ 4,534.0 $ 4,251.2 $ 3,979.8
Total expenses $ 4,569.0 $ 4,871.3 $ 4,935.6 $ 4,665.2 $ 4,509.0 $ 3,949.4 $ 3,789.2 $ 3,694.2 $ 3,768.0 $ 3,346.3 $ 3,160.9
Total operating profit $ 1,382.8 $ 1,483.8 $ 1,836.7 $ 1,589.9 $ 1,494.6 $ 1,301.1 $ 1,101.1 $ 1,013.5 $ 766.0 $ 904.9 $ 818.9
General corporate income/(expense) (127.0) (109.1) (159.7) (162.9) (124.8) (124.1) 38.2 (92.0) (93.1) (91.4) (83.3)
Interest (expense)–net (76.9) (75.6) (40.6) (13.6) (5.2) (5.8) (7.1) (22.5) (55.1) (52.8) (42.0)
Income from continuing operations before taxes on income 1,178.9 1,299.1 1,636.4 1,413.4 1,364.6 1,171.2 1,132.2 899.0 617.8 760.7 693.6
Provision for taxes on income 429.1 479.7 609.0 522.6 515.7 412.5 442.5 325.4 238.4 292.4 269.9
Effective tax rate 36.4% 36.9% 37.2% 37.0% 37.8% 35.2% 39.1% 36.2% 38.6% 38.4% 38.9%
Income from continuing operations before cumulative adjustment 749.8 819.4 1,027.4 890.8 848.9 758.7 689.7 573.6 379.4 468.3 423.7
Discontinued operations
Net earnings/(loss) from discontinued operations – – – – – (0.6) (0.1) 4.8 (0.7) 4.9 3.4
Income before cumulative adjustment 749.8 819.4 1,027.4 890.8 848.9 758.1 689.6 578.4 378.7 473.2 427.1
Cumulative effect on prior years of changes in accounting – – – – – – – – – (68.1) –
Net income $ 749.8 $ 819.4 $ 1,027.4 $ 890.8 $ 848.9 $ 758.1 $ 689.6 $ 578.4 $ 378.7 $ 405.1 $ 427.1
Less: net income attributable to noncontrolling interests $ (19.3) $ (19.9) $ (13.8) $ (8.6) $ (4.6) $ (2.3) $ (1.9) $ (1.6) $ (1.7) $ (1.3) $ (1.5)
Net income attributable to The McGraw-Hill Companies $ 730.5 $ 799.5 $ 1,013.6 $ 882.2 $ 844.3 $ 755.8 $ 687.7 $ 576.8 $ 377.0 $ 403.8 $ 425.6
Diluted earnings per share
Income from continuing operations before extraordinary item and cumulative adjustment $ 2.33 $ 2.51 $ 2.94 $ 2.40 $ 2.21 $ 1.96 $ 1.79 $ 1.47 $ 0.96 $ 1.19 $ 1.06
Discontinued operations – – – – – – – 0.01 – 0.01 0.01
Income before extraordinary item and cumulative adjustment $ 2.33 $ 2.51 $ 2.94 $ 2.40 $ 2.21 $ 1.96 $ 1.79 $ 1.48 $ 0.96 $ 1.20 $ 1.07
Extraordinary item and cumulative adjustment – – – – – – – – – (0.17) –
Net income $ 2.33 $ 2.51 $ 2.94 $ 2.40 $ 2.21 $ 1.96 $ 1.79 $ 1.48 $ 0.96 $ 1.03 $ 1.07
Consolidated Profit and Loss
2,000
4,000
6,000
$8,000
Revenue and Operating Profit(dollars in millions)
‘99 ‘00 ‘01 ‘02 ‘03 ‘04 ‘05 ‘06 ‘07 ‘08 ‘09! Revenue 3,980 4,251 4,534 4,708 4,890 5,251 6,004 6,255 6,772 6,355 5,952
! Operating Profit 819 905 766 1,013 1,101 1,301 1,495 1,590 1,837 1,484 1,383
0.75
1.50
2.25
$3.00
Diluted EPS(in dollars)
1.07 1.03 0.96 1.48 1.79 1.96 2.21 2.40 2.94 2.51 2.33‘99 ‘00 ‘01 ‘02 ‘03 ‘04 ‘05 ‘06 ‘07 ‘08 ‘09

2010/2011 MHP Investor Fact Book 13
Overview
Quarterly Results
(dollars in thousands, except earnings per share) 2008 vs. 2008 vs. 2008 vs. 2008 vs. Total 2008 vs.
% favorable/(unfavorable) 1Q 2007 2Q 2007 3Q 2007 4Q 2007 2008 2007
RevenueMcGraw-Hill Education $ 330,156 (0.5%) $ 670,846 3.6% $ 1,131,352 (3.8%) $ 506,539 (8.0%) $ 2,638,893 (2.5%)Financial Services 644,301 (11.6%) 735,477 (10.4%) 651,458 (14.2%) 623,051 (15.4%) 2,654,287 (12.9%)Information & Media 243,414 3.2% 266,902 6.8% 265,731 5.3% 285,828 1.3% 1,061,875 4.1%Total revenue $ 1,217,871 (6.1%) $ 1,673,225 (2.6%) $ 2,048,541 (6.4%) $ 1,415,418 (9.8%) $ 6,355,055 (6.2%)
Operating ProfitMcGraw-Hill Education $ (90,862) 0.7% $ 70,276 (13.3%) $ 354,718 (14.3%) $ (12,734) N/M $ 321,398 (20.3%)Financial Services 264,052 (24.7%) 303,142 (24.7%) 285,052 (18.6%) 218,111 (18.3%) 1,070,357 (21.9%)Information & Media 11,726 18.6% 24,799 68.2% 22,847 22.6% 32,679 61.7% 92,051 45.0%Total operating profit $ 184,916 (31.3%) $ 398,217 (20.1%) $ 662,617 (15.3%) $ 238,056 (17.0%) $ 1,483,806 (19.2%)General corporate (expense) $ (33,856) 3.4% $ (33,536) 18.4% $ (9,701) 74.3% $ (32,029) 30.4% $ (109,122) 31.7%Interest (expense)–net (17,830) N/M (20,354) (68.2%) (22,002) (42.7%) (15,438) (30.2%) (75,624) (86.4%)Income before taxes on income 133,230 (42.8%) 344,327 (22.6%) 630,914 (13.5%) 190,589 (16.8%) 1,299,060 (20.6%)Provision for taxes on income 48,667 44.2% 127,377 23.4% 234,099 13.7% 69,552 17.6% 479,695 21.2%Net income $ 84,563 (42.0%) $ 216,950 (22.2%) $ 396,815 (13.4%) $ 121,037 (16.3%) $ 819,365 (20.2%)Less: net income attributable to noncontrolling interests (3,453) 82.4% (4,656) 168.2% (6,649) 8.0% (5,116) 27.5% (19,874) 44.0%
Net income attributable to The McGraw-Hill Companies $ 81,110 (43.6%) $ 212,294 (23.4%) $ 390,166 (13.7%) $ 115,921 (17.6%) $ 799,491 (21.1%)
Earnings per common share:Diluted $ 0.25 (37.5%) $ 0.66 (16.5%) $ 1.23 (8.2%) $ 0.37 (14.0%) $ 2.51 (14.6%)
(dollars in thousands, except earnings per share) 2009 vs. 2009 vs. 2009 vs. 2009 vs. Total 2009 vs.
% favorable/(unfavorable) 1Q 2008 2Q 2008 3Q 2008 4Q 2008 2009 2008
RevenueMcGraw-Hill Education $ 312,628 (5.3%) $ 555,189 (17.2%) $ 1,000,015 (11.6%) $ 519,955 2.6% $ 2,387,787 (9.5%)Financial Services 610,154 (5.3%) 673,788 (8.4%) 636,984 (2.2%) 689,197 10.6% 2,610,123 (1.7%)Information & Media 225,425 (7.4%) 236,203 (11.5%) 238,904 (10.1%) 253,340 (11.4%) 953,872 (10.2%)Total revenue $ 1,148,207 (5.7%) $ 1,465,180 (12.4%) $ 1,875,903 (8.4%) $ 1,462,492 3.3% $ 5,951,782 (6.3%)
Operating ProfitMcGraw-Hill Education $ (76,596) 15.7% $ 21,008 (70.1%) $ 298,142 (15.9%) $ 33,465 N/M $ 276,019 (14.1%)Financial Services 231,593 (12.3%) 276,354 (8.8%) 256,183 (10.1%) 249,965 14.6% 1,014,095 (5.3%)Information & Media 2,772 (76.4%) 14,422 (41.8%) 29,540 29.3% 45,934 40.6% 92,668 0.7%Total operating profit $ 157,769 (14.7%) $ 311,784 (21.7%) $ 583,865 (11.9%) $ 329,364 38.4% $ 1,382,782 (6.8%)General corporate (expense) $ (33,428) 1.3% $ (29,306) 12.6% $ (27,900) N/M $ (36,412) (13.7%) $ (127,046) (16.4%)Interest (expense)–net (20,591) (15.5%) (18,499) 9.1% (17,827) 19.0% (19,950) (29.2%) (76,867) (1.6%)Income before taxes on income 103,750 (22.1%) 263,979 (23.3%) 538,138 (14.7%) 273,002 43.2% 1,178,869 (9.3%)Provision for taxes on income 37,765 (22.4%) 96,088 (24.6%) 195,882 (16.3%) 99,373 42.9% 429,108 (10.5%)Net income $ 65,985 (22.0%) $ 167,891 (22.6%) $ 342,256 (13.7%) $ 173,629 43.5% $ 749,761 (8.5%)Less: net income attributable to noncontrolling interests (2,981) (13.7%) (3,798) (18.4%) (6,145) (7.6%) (6,335) 23.8% (19,259) (3.1%)
Net income attributable to The McGraw-Hill Companies $ 63,004 (22.3%) $ 164,093 (22.7%) $ 336,111 (13.9%) $ 167,294 44.3% $ 730,502 (8.6%)
Earnings per common share:Diluted $ 0.20 (20.0%) $ 0.52 (21.2%) $ 1.07 (13.0%) $ 0.53 43.2% $ 2.33 (7.2%)
2009 vs. 2008
2008 vs. 2007

14 The McGraw-Hill CompaniesRefer to pages 20 and 21 for summary of financial notes
2007 vs. 2006(dollars in thousands, except earnings per share) 2007 vs. 2007 vs. 2007 vs. 2007 vs. Total 2007 vs.
% favorable/(unfavorable) 1Q 2006 2Q 2006 3Q 2006 4Q 2006 2007 2006
RevenueMcGraw-Hill Education $ 331,680 5.6% $ 647,324 5.8% $ 1,175,954 9.9% $ 550,873 4.3% $ 2,705,831 7.2%Financial Services 728,882 21.5% 820,993 21.2% 759,614 12.5% 736,740 (7.2%) 3,046,229 10.9%Information & Media 235,856 4.1% 249,862 4.7% 252,428 2.1% 282,075 3.6% 1,020,221 3.6%Total revenue $ 1,296,418 13.7% $ 1,718,179 12.5% $ 2,187,996 9.8% $ 1,569,688 (1.5%) $ 6,772,281 8.3%
Operating ProfitMcGraw-Hill Education $ (91,462) 6.0% $ 81,033 19.3% $ 413,695 16.2% $ (159) (103.0%) $ 403,107 21.4%Financial Services 350,687 38.5% 402,473 27.7% 350,171 17.6% 266,828 (22.0%) 1,370,159 13.4%Information & Media 9,886 N/M 14,740 13.8% 18,629 35.8% 20,212 (6.1%) 63,467 27.2%Total operating profit $ 269,111 70.9% $ 498,246 25.8% $ 782,495 17.3% $ 286,881 (22.3%) $ 1,836,733 15.5%General corporate (expense) $ (35,037) 13.8% $ (41,085) (20.1%) $ (37,686) 20.1% $ (46,013) (12.6%) $ (159,821) 1.9%Interest (expense)–net (1,204) N/M (12,099) N/M (15,423) N/M (11,855) N/M (40,581) N/MIncome before taxes on income 232,870 95.1% 445,062 26.0% 729,386 19.1% 229,013 (30.2%) 1,636,331 15.8%Provision for taxes on income 87,139 98.2% 166,248 27.0% 271,211 19.8% 84,375 (30.4%) 608,973 16.5%Net income $ 145,731 93.3% $ 278,814 25.4% $ 458,175 18.6% $ 144,638 (30.1%) $ 1,027,358 15.3%Less: net income attributable to noncontrolling interests (1,893) 60.3% (1,736) 19.9% (6,157) 55.6% (4,013) 95.5% (13,799) 59.7%
Net income attributable to The McGraw-Hill Companies $ 143,838 93.8% $ 277,078 25.4% $ 452,018 18.2% $ 140,625 (31.3%) $ 1,013,559 14.9%
Earnings per common share:Diluted $ 0.40 100.0% $ 0.79 31.7% $ 1.34 26.4% $ 0.43 (23.2%) $ 2.94 22.5%
Note: N/M indicates a non-meaningful or non-calculable variance
Quarterly Results (continued)
2009 Quarterly Revenue by Segment and Group
Full(dollars in millions) 1Q 2Q 3Q 4Q Year
McGraw-Hill Education School Education Group $ 123 $ 339 $ 501 $ 150 $ 1,112 HPI Group 190 217 499 370 1,276
Financial Services Credit Market Services 391 457 426 473 1,748 Investment Services 219 216 211 216 862
Information & Media B2B Group 207 216 220 230 873 Broadcasting 18 20 19 23 81 Total revenue $ 1,148 $ 1,465 $ 1,876 $ 1,462 $ 5,952
2008 Quarterly Revenue by Segment and Group
Full(dollars in millions) 1Q 2Q 3Q 4Q Year
McGraw-Hill Education School Education Group $ 139 $ 438 $ 624 $ 162 $ 1,363 HPI Group 191 233 508 344 1,276
Financial Services Credit Market Services 427 508 423 396 1,755 Investment Services 217 228 228 227 899
Information & Media B2B Group 220 240 241 254 955 Broadcasting 24 27 25 32 107 Total revenue $ 1,218 $ 1,673 $ 2,049 $ 1,415 $ 6,355
2007 Quarterly Revenue by Segment and Group
Full(dollars in millions) 1Q 2Q 3Q 4Q Year
McGraw-Hill Education School Education Group $ 146 $ 410 $ 686 $ 199 $ 1,441 HPI Group 186 238 490 352 1,265
Financial Services Credit Market Services 545 636 559 525 2,264 Investment Services 184 185 201 212 782
Information & Media B2B Group 212 223 228 254 917 Broadcasting 24 27 24 29 103Total revenue $ 1,296 $ 1,718 $ 2,188 $ 1,570 $ 6,772
Note: Totals may not sum due to rounding
2010/2011 MHP Investor Fact Book 15
Overview
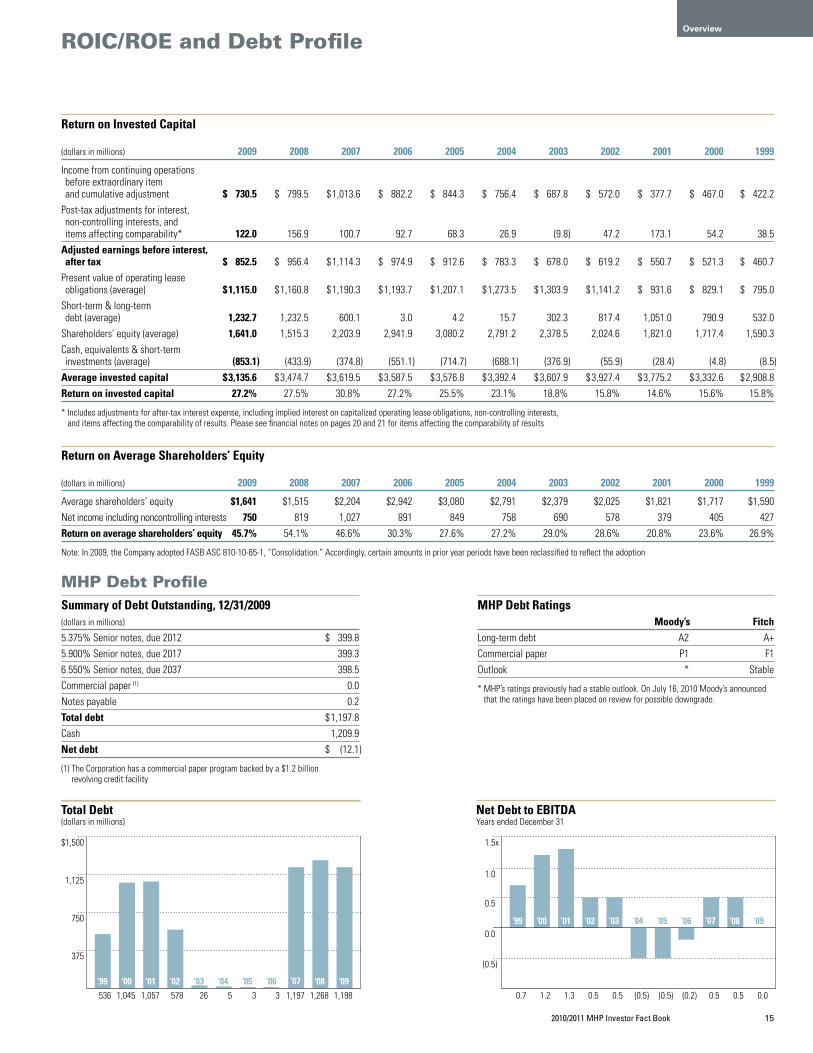
ROIC/ROE and Debt Profile
Return on Invested Capital
(dollars in millions) 2009 2008 2007 2006 2005 2004 2003 2002 2001 2000 1999
Income from continuing operations before extraordinary item and cumulative adjustment $ 730.5 $ 799.5 $ 1,013.6 $ 882.2 $ 844.3 $ 756.4 $ 687.8 $ 572.0 $ 377.7 $ 467.0 $ 422.2
Post-tax adjustments for interest, non-controlling interests, and items affecting comparability* 122.0 156.9 100.7 92.7 68.3 26.9 (9.8) 47.2 173.1 54.2 38.5
Adjusted earnings before interest, after tax $ 852.5 $ 956.4 $ 1,114.3 $ 974.9 $ 912.6 $ 783.3 $ 678.0 $ 619.2 $ 550.7 $ 521.3 $ 460.7
Present value of operating lease obligations (average) $ 1,115.0 $ 1,160.8 $ 1,190.3 $ 1,193.7 $ 1,207.1 $ 1,273.5 $ 1,303.9 $ 1,141.2 $ 931.6 $ 829.1 $ 795.0
Short-term & long-term debt (average) 1,232.7 1,232.5 600.1 3.0 4.2 15.7 302.3 817.4 1,051.0 790.9 532.0
Shareholders’ equity (average) 1,641.0 1,515.3 2,203.9 2,941.9 3,080.2 2,791.2 2,378.5 2,024.6 1,821.0 1,717.4 1,590.3Cash, equivalents & short-term investments (average) (853.1) (433.9) (374.8) (551.1) (714.7) (688.1) (376.9) (55.9) (28.4) (4.8) (8.5)
Average invested capital $ 3,135.6 $ 3,474.7 $ 3,619.5 $ 3,587.5 $ 3,576.8 $ 3,392.4 $ 3,607.9 $ 3,927.4 $ 3,775.2 $ 3,332.6 $ 2,908.8Return on invested capital 27.2% 27.5% 30.8% 27.2% 25.5% 23.1% 18.8% 15.8% 14.6% 15.6% 15.8%
* Includes adjustments for after-tax interest expense, including implied interest on capitalized operating lease obligations, non-controlling interests, and items affecting the comparability of results. Please see financial notes on pages 20 and 21 for items affecting the comparability of results
375
750
1,125
$1,500
Total Debt(dollars in millions)
536 1,045 1,057 578 26 5 3 3 1,197 1,268 1,198‘99 ‘00 ‘01 ‘02 ‘03 ‘04 ‘05 ‘06 ‘07 ‘08 ‘09
(0.5)
0.5
0.0
1.0
1.5x
Net Debt to EBITDAYears ended December 31
0.7 1.2 1.3 0.5 0.5 (0.5) (0.5) (0.2) 0.5 0.5 0.0
‘99 ‘00 ‘01 ‘02 ‘03 ‘04 ‘05 ‘06 ‘07 ‘08 ‘09
MHP Debt ProfileSummary of Debt Outstanding, 12/31/2009(dollars in millions)
5.375% Senior notes, due 2012 $ 399.85.900% Senior notes, due 2017 399.36.550% Senior notes, due 2037 398.5Commercial paper (1) 0.0Notes payable 0.2Total debt $ 1,197.8Cash 1,209.9Net debt $ (12.1)
(1) The Corporation has a commercial paper program backed by a $1.2 billion revolving credit facility
MHP Debt Ratings Moody’s FitchLong-term debt A2 A+Commercial paper P1 F1Outlook * Stable
* MHP’s ratings previously had a stable outlook. On July 16, 2010 Moody’s announced that the ratings have been placed on review for possible downgrade.
Return on Average Shareholders’ Equity
(dollars in millions) 2009 2008 2007 2006 2005 2004 2003 2002 2001 2000 1999
Average shareholders’ equity $1,641 $1,515 $2,204 $2,942 $3,080 $2,791 $2,379 $2,025 $1,821 $1,717 $1,590 Net income including noncontrolling interests 750 819 1,027 891 849 758 690 578 379 405 427 Return on average shareholders’ equity 45.7% 54.1% 46.6% 30.3% 27.6% 27.2% 29.0% 28.6% 20.8% 23.6% 26.9%
Note: In 2009, the Company adopted FASB ASC 810-10-65-1, “Consolidation.” Accordingly, certain amounts in prior year periods have been reclassified to reflect the adoption

16 The McGraw-Hill CompaniesRefer to pages 20 and 21 for summary of financial notes
EBITDA, Net of Investment in Prepublication Costs
EBITDA, Net of Investment in Prepublication Costs
(dollars in thousands) 2009 2008 2007 2006 2005 2004 2003 2002 2001 2000 1999
McGraw-Hill Education $ 276,019 $ 321,398 $ 403,107 $ 331,947 $ 412,593 $ 342,390 $ 323,697 $ 334,561 $ 275,051 $ 308,980 $ 275,158
Financial Services 1,014,095 1,070,357 1,370,159 1,208,105 1,021,468 839,398 667,597 560,845 425,911 383,025 358,155
Information & Media 92,668 92,051 63,467 49,888 60,576 119,313 109,841 118,052 65,003 212,921 185,551
Total operating profit $ 1,382,782 $ 1,483,806 $ 1,836,733 $ 1,589,940 $ 1,494,637 $ 1,301,101 $ 1,101,135 $ 1,013,458 $ 765,965 $ 904,926 $ 818,864
Unusual (loss)/gain $ – $ – $ – $ – $ – $ – $ – $ – $ – $ (68,122) $ –
Corporate (expense)/income (127,046) (109,122) (159,821) (162,848) (124,826) (124,088) 38,185 (91,934) (93,062) (91,380) (83,280)
Net income attributable to non-controlling interests (19,259) (19,874) (13,799) (8,638) (4,647) (2,323) (1,946) (1,612) (1,712) (1,308) (1,491)
Depreciation 112,764 119,849 112,586 113,200 106,750 92,268 82,827 86,818 85,748 84,812 80,348
Amortization of intangibles 52,720 58,497 48,403 48,387 44,235 32,470 32,973 36,270 84,108 63,508 54,366
Amortization of prepublication costs 270,469 270,442 240,182 228,405 234,276 267,743 282,505 277,081 236,620 207,806 170,653
Investment in prepublication costs (176,996) (254,106) (298,984) (276,810) (257,795) (237,760) (213,954) (246,577) (293,002) (249,333) (246,341)
EBITDA $ 1,495,434 $ 1,549,492 $ 1,765,300 $ 1,531,636 $ 1,492,630 $ 1,329,411 $ 1,321,725 $ 1,073,504 $ 784,665 $ 850,909 $ 793,119
125
250
375
$500
McGraw-Hill Education(dollars in millions)
260 336 306 427 448 431 457 356 411 413 444‘99 ‘00 ‘01 ‘02 ‘03 ‘04 ‘05 ‘06 ‘07 ‘08 ‘09
75
150
225
$300
Information & Media(dollars in millions)
218 240 91 140 130 140 91 85 97 123 119‘99 ‘00 ‘01 ‘02 ‘03 ‘04 ‘05 ‘06 ‘07 ‘08 ‘09
375
750
1,125
$1,500
Financial Services(dollars in millions)
396 431 477 594 702 879 1,065 1,251 1,410 1,116 1,053‘99 ‘00 ‘01 ‘02 ‘03 ‘04 ‘05 ‘06 ‘07 ‘08 ‘09
500
1,000
1,500
$2,000
Total Company EBITDA(dollars in millions)
793 851 785 1,074 1,322 1,329 1,493 1,532 1,765 1,549 1,495‘99 ‘00 ‘01 ‘02 ‘03 ‘04 ‘05 ‘06 ‘07 ‘08 ‘09

2010/2011 MHP Investor Fact Book 17
Overview
Capital Investments
150
300
450
$650
Capital Expenditures(dollars in millions)
‘99 ‘00 ‘01 ‘02 ‘03 ‘04 ‘05 ‘06 ‘07 ‘08 ‘09
! Additions to Tech Projects 38 15 29 56 28 11 17 23 17 25 24! Purchases of Prop & Equipment 154 98 117 70 115 139 120 127 230 106 69! Prepublication Spending 246 250 295 249 218 238 258 277 299 254 177 Total 438 363 441 375 361 388 395 427 546 385 270
(dollars in millions) 2009 2008 2007
Additions to Technology ProjectsMcGraw-Hill Education $ 11.4 $ 7.2 $ 5.2Financial Services 11.9 10.9 7.1Information & Media – 7.3 0.7Corporate 0.5 – 3.7Total $ 23.8 $ 25.4 $ 16.7
Amortization of IntangiblesMcGraw-Hill Education $ 24.1 $ 27.5 $ 21.7Financial Services 17.9 18.9 12.8Information & Media 10.7 12.1 13.9Corporate – – – Total $ 52.7 $ 58.5 $ 48.4
(dollars in millions) 2009 2008 2007
Purchase of Property and EquipmentMcGraw-Hill Education $ 26.2 $ 44.6 $ 135.5 Financial Services 31.5 38.8 62.1 Information & Media 8.8 18.4 29.6 Corporate 2.0 4.1 2.4 Total $ 68.5 $ 106.0 $ 229.6
DepreciationMcGraw-Hill Education $ 54.5 $ 53.1 $ 48.4 Financial Services 35.8 41.2 38.1 Information & Media 16.0 19.0 19.3 Corporate 6.5 6.5 6.8 Total $ 112.8 $ 119.8 $ 112.7
Investments, Depreciation, and Amortization by Segment

18 The McGraw-Hill Companies
Acquisitions and Divestitures
Acquisitions Divestitures
2009 $0No acquisitions in 2009
$15,196,000! Vista Research, Inc." BusinessWeek
2008 $48,261,000! Maalot, Ltd.! Case-Shiller® Home Price Indices
(licensing agreement)! Thomson Reuters databases" Umbria, Inc.# LinkedIn Corporation (0.45% interest)
$440,000! CRISIL Gas Strategies
2007 $86,707,000$ Hot Chalk, Inc. (6% interest)$ Reading Success (reading program)! ClariFI, Inc.! IMAKE/ABSX
$62,261,000$ Benziger! S&P mutual fund data business
2006 $13,480,000! Heale Financial! TheMarkets.com (5.51% interest after
acquisition of additional 2.75% interest)" Automotive Resources Asia, Ltd." Azteca America affiliate low-powered TV
station in Bakersfield, CA
$12,381,000! The Review of Securities Regulation
newsletters" E-Source" POWER Magazine
2005 $461,842,000$ TurnLeaf Solutions! ASSIRT Pty Limited! CRISIL Limited (58.5% interest after
acquisition of additional 49.07% interest)! Taiwan Ratings Corporation (51% interest
after acquisition of additional 1% interest)! TheMarkets.com (2.76% interest)! Vista Research, Inc." Azteca America affiliate low-powered TV
stations in Colorado and San Diego" J.D. Power and Associates" USDTV
$131,335,000! Corporate Value Consulting! Standard & Poor’s Securities, Inc." Healthcare Information Group
Acquisition and divestiture amounts for 1999–2009 reflect those reported on McGraw-Hill’s GAAP cash flow statement and are not indicative of actual purchase/sale prices due to purchase price adjustments and other timing differences in payments/receipts. Divestiture amounts also include proceeds received from the disposition of property and equipment.
Operating Segment Legend:$ McGraw-Hill Education ! Financial Services " Information & Media # Corporate

2010/2011 MHP Investor Fact Book 19
Overview
Acquisitions Divestitures
2004 $306,232,000$ Grow.net, Inc.$ PRCEDU Corporation (8.7% interest)! Capital IQ, Inc." Center for Business Intelligence (energy
conference business only)
$46,904,000$ Landoll, Frank Schaffer and related
juvenile retail publishing businesses! J.J. Kenny Drake, Inc.
2003 $3,678,000" FriedWire, Inc.
$502,665,000! S&P ComStock# Rock-McGraw, Inc. (45% interest)
2002 $19,310,000$ Bredex Corporation$ Clear Learning$ Open University Press$ Reality Based Learning! EA Ratings
$24,304,000$ Lifetime Learning! MMS International" CAP
2001 $333,234,000$ Frank Schaffer Publications$ Mayfield Publishing Company$ Uniscore, Inc.$ Visual Education Corporation! Corporate Value Consulting! Charter Research Corporation" BizNet TV, Inc." Financial Times Energy
$17,876,000! Data Resources Inc.! Rational Investors
2000 $703,719,000$ Tribune Education! Canadian Bond Rating Service! Portfolio Management Data, LLC! Thomas Murray Network Management Ltd." BuildPoint Corporation" MPI Interactive–eBuilder, Inc.
$142,418,000" Tower Group International
1999 $67,085,000$ Appleton & Lange, Inc.! Emerging Markets Data Base! IFIS, Inc.! Micropal France! Rational Investors, Inc.! Thesys Information, Ltd.
$67,244,000$ Libri Italia SRL (School titles only)" Petrochemical Publications (Chemical
Engineering, Modern Plastics, Modern Plastics International)

20 The McGraw-Hill Companies
Summary of items affecting comparability of results
2009 Operating profit for the Financial Services segment in the second quarter of 2009 includes a pre-tax loss of $13.8 million ($8.8 million after-tax, or $0.03 per diluted share) on the sale of Vista Research, Inc. Operating profit for the Information & Media segment in the fourth quarter of 2009 includes a pre-tax gain of $10.5 million ($6.7 million after-tax, or $0.02 per diluted share) on the sale of BusinessWeek. Income from operations before taxes in the second quarter of 2009 includes a net pre-tax restructuring charge of $15.2 million ($9.7 million after-tax, or $0.03 per diluted share), which is reflected in segment operating profit as follows:
McGraw-Hill Education: Net pre-tax charge of $11.6 millionFinancial Services: Net pre-tax (benefit) of ($0.4) millionInformation & Media: Net pre-tax charge of $4.0 million
2008 Income from operations before taxes includes pre-tax restructuring charges totaling $73.4 million ($45.9 million after-tax, or $0.14 per diluted share), which are reflected in segment operating profit and Corporate expense as follows:
2008 Restructuring Charges
(dollars in millions, except per share data) 1Q 2Q 3Q 4Q FY
Pre-Tax
McGraw-Hill Education – 8.5 5.4 11.4 25.3
Financial Services – 15.2 4.1 6.6 25.9
Information & Media – – 13.9 5.3 19.2
Corporate – – – 3.0 3.0
Total pre-tax – 23.7 23.4 26.3 73.4
Total after-tax – 14.8 14.6 16.4 45.9
Per diluted share – $ 0.05 $ 0.05 $ 0.05 $ 0.14
2007 Operating profit for the Financial Services segment in the first quarter of 2007 includes a pre-tax gain of $17.3 million ($10.3 million after-tax, or $0.03 per diluted share) on the sale of the Corporation’s mutual fund data business. Income from operations before taxes in the fourth quarter of 2007 includes a pre-tax restructuring charge of $43.7 million ($27.3 million after-tax, or $0.08 per diluted share), which is reflected in segment operating profit and Corporate expense as follows:
McGraw-Hill Education: Pre-tax charge of $16.3 millionFinancial Services: Pre-tax charge of $18.8 millionInformation & Media: Pre-tax charge of $6.7 millionCorporate: Pre-tax charge of $1.9 million
2006 Income from operations before taxes includes pre-tax restructuring charges totaling $31.5 million ($19.8 million after-tax, or $0.06 per diluted share), which are reflected in segment operating profit and Corporate expense as follows:
2006 Restructuring Charges
(dollars in millions, except per share data) 1Q 2Q 3Q 4Q FY
Pre-Tax
McGraw-Hill Education – – 5.6 10.4 16.0
Financial Services – – – – –
Information & Media – – 5.7 3.0 8.7
Corporate – – 4.1 2.7 6.8
Total pre-tax – – 15.4 16.1 31.5
Total after-tax – – 9.7 10.1 19.8
Per diluted share – – $ 0.03 $ 0.03 $ 0.06
In 2006, as a result of a new accounting standard for share-based payments, the Corporation incurred stock-based compensation expense of $136.2 million ($85.5 million after-tax, or $0.23 per diluted share). Included in this expense is a one-time pre-tax charge in the first quarter of 2006 for the elimination of the Corporation’s restoration stock option program of $23.8 million ($14.9 million after-tax, or $0.04 per diluted share), which is reflected in segment operating profit and Corporate expense as follows:
McGraw-Hill Education: Pre-tax charge of $4.2 millionFinancial Services: Pre-tax charge of $2.1 millionInformation & Media: Pre-tax charge of $2.7 millionCorporate: Pre-tax charge of $14.8 million
Revenue and operating profit for the Information & Media seg-ment in the fourth quarter of 2006 reflect deferrals of $23.8 and $21.1 million, respectively, due to the transformation of Sweets from a primarily print product catalog to a bundled print and online service
Items Impacting Comparability of Results

2010/2011 MHP Investor Fact Book 21
Overview
2005 Income from operations before taxes includes a pre-tax restructuring charge of $23.2 million ($14.6 million after-tax, or $0.04 per diluted share), which is reflected in segment operat-ing profit and Corporate expense as follows:
McGraw-Hill Education: Pre-tax charge of $9.0 millionFinancial Services: Pre-tax charge of $1.2 millionInformation & Media: Pre-tax charge of $10.2 millionCorporate: Pre-tax charge of $2.8 million
Operating profit for the Financial Services segment includes a pre-tax gain of $6.8 million ($4.2 million after-tax, or $0.01 per diluted share) on the sale of the Corporate Value Consult-ing business. Operating profit for the Information & Media segment includes a pre-tax loss of $5.5 million ($3.3 million after-tax) on the sale of the Healthcare Information Group. Net income reflects a $10.0 million ($0.03 per diluted share) increase in income taxes on the repatriation of funds
2004 Net income reflects a non-cash benefit of approximately $20.0 million ($0.05 per diluted share) as a result of the Corpora-tion’s completion of various federal, state and local, and foreign tax audit cycles
2003 Corporate expense includes a $131.3 million pre-tax gain ($58.4 million after-tax, or $0.15 per diluted share) on the sale of real estate
Revenue and operating profit of S&P ComStock and the juvenile retail publishing business historically included in the Financial Services and McGraw-Hill Education segments, respectively, were restated as discontinued operations, as follows:
• Discontinued operations in 2004 reflect the net after-tax loss from the operations of the juvenile retail publishing business in January of 2004 before the sale of the business
• Discontinued operations in 2003 include $87.5 million on the divestiture of S&P ComStock ($57.2 million after-tax gain, or $0.15 per diluted share), and an $81.1 million loss on the planned disposition of the juvenile retail publishing business ($57.3 million after-tax loss, or $0.15 per diluted share), which was subsequently sold on January 30, 2004
• Discontinued operations in years 2002–2000 reflect net after-tax earnings/(loss) from the operations of S&P ComStock and the juvenile retail publishing business, and 1999 reflects net after-tax earnings from the operations of S&P ComStock
2002 Operating profit for the Financial Services segment includes a $14.5 million pre-tax loss ($2.0 million after-tax benefit, or $0.01 per diluted share) on the disposition of MMS International
2001 Income from operations before taxes includes a $159.0 million pre-tax charge ($112.0 million after-tax, or $0.29 per diluted share) for restructuring and asset write-down, which is reflected in segment operating profit and Corporate expense as follows:
McGraw-Hill Education: Pre-tax charge of $62.1 millionFinancial Services: Pre-tax charge of $43.1 millionInformation & Media: Pre-tax charge of $34.9 millionCorporate: Pre-tax charge of $18.9 million
Income from operations before taxes also includes a $6.9 million pre-tax gain ($0.01 per diluted share) on the sale of real estate. Operating profit for the Financial Services segment includes an $8.8 million pre-tax gain ($26.3 million after-tax, or $0.07 per diluted share) on the sale of DRI and a $22.8 million pre-tax charge ($21.9 million after-tax, or $0.06 per diluted share) for the write-down of certain assets, the shutdown of Blue List and the contribution of Rational Investors
2000 Operating profit for the Information & Media segment includes a $16.6 million gain ($10.2 million after-tax, or $0.03 per diluted share) on the sale of Tower Group International. Net income includes a cumulative adjustment which reflects the adoption of FASB ASC 605, “Revenue Recognition”
1999 Operating profit for the Information & Media segment includes a $39.7 million gain ($24.2 million after-tax, or $0.06 per diluted share) on the sale of the Petrochemical publications

22 The McGraw-Hill Companies
Positioned for Long-Term Growth
Trends in MHP’s Key Markets
Education
As the U.S. and world economies become increasingly centered on the service sector and technology, education is more than ever the key to growth.
Financial
Global markets remain uncertain as a result of the financial crisis, but raising capital is still the key for corporate growth. Individuals, countries, and corporations will continue to require access to world capital markets, and investors will demand the diversifica-tion they offer.
Information
The economy is increasingly driven by the need for information about markets, technology, and industries. McGraw-Hill delivers critical informa-tion for the construction, aerospace and defense, automotive, and general business markets.
Short-term Federal support has eased the pressure on state and local finances, reducing the cutbacks in K–12 education.
World markets are continuing to recover. The primary risk point has moved to Europe. There was record investment-grade bond issuance in 2009, and 2010 has seen the re-emer-gence of the speculative-grade market. New financial legislation around the world will help improve investor confidence and market stability.
The recent recession has hit construc-tion and automobile industries even harder than usual. These sectors are beginning to stabilize, but recovery will be slow.
Long-term Total enrollments continue to rise about 1% per year. College enrollments are rising more rapidly, as the need for college-educated workers grows. Continuing education is becoming more common, as workers may need to change careers several times over the course of a working lifetime.
The increasing interconnections among the world economies and financial markets increase the need for financial information. The retirement of the baby boomers will also increase the need for financial services as they switch from accumulation to spending their assets.
Information is the main currency of the new industrial age. Global information coverage and the interconnections in global trade and finance demand faster and more accurate information flows.
30
60
90
120
Enrollments are projected to rise...
(students in millions)
Number of U.S. students* 67.0 74.6 81.2
‘98 ‘08 ‘18
* Includes K-12 and degree-granting postsecondary institutions
Source: U.S. Department of Education, National Center for Education Statistics, “Projections of Education Statistics to 2018”
Projected
4
8
12
16%
...the financial sector is expected to expand over the long run, (percent)
Share of U.S. economic activity** 12.8 13.3 13.7
‘98 ‘08 ‘18
** Economic activity, which includes many business-to-business transactions, is a broader measure of the economy than Gross Domestic Product
Source: U.S. Department of Labor, Bureau of Labor Statistics, November 2009 projections
Projected
2
4
6
8%
...and so is the information sector.
(percent)
Share of U.S. economic activity** 4.6 4.4 5.4
‘98 ‘08 ‘18
** Economic activity, which includes many business-to-business transactions, is a broader measure of the economy than Gross Domestic Product
Source: U.S. Department of Labor, Bureau of Labor Statistics, November 2009 projections
Projected
The McGraw-Hill Companies employs technology to innovate, create new revenue streams, and lower operating costs. Connecting content and managing digital assets globally is an essential part of this effort. MHP is building size and scale globally in essential markets by expanding its digital capabilities to serve the enduring needs for knowledge, capital, and business analysis. With the positive shift in the global economy, MHP is well-positioned for new opportunities.

2010/2011 MHP Investor Fact Book 23
McGraw-Hill Education
As a leading provider of learning solutions from early childhood to professional career, McGraw-Hill Education is helping learners worldwide attain the skills they need to succeed.The digital integration of content, technology, and distribution is creating significant new growth opportunities around the globe for McGraw-Hill Education’s products and services.
Full range of digital platforms and products for every level of education
McGraw-Hill Education At-a-GlanceSchool Education Group (SEG)
Key markets:Pre-kindergarten, elementary, secondary, testing, supplemental, vocational, and post-secondary fields in the U.S.
Higher Education, Professional and International Group (HPI)
Key higher education markets:International college, university, and post-graduate fields/markets, and English as a Second Language (ESL).
Key professional markets:Worldwide medicine, healthcare, engineering, science, computer technology, business, and general reference publishing.
Key international markets:Education, business, and profes-sional markets.
A Leading Provider of Learning Solutions
www.mheducation.com
Center for Digital Innovation A first-of-its-kind pre-K–12 digital research and development center with digital offerings that include Project Turtle™, CINCH™ Mathematics, CINCH™ Project, and LEAD21
ConnectED™
A digital platform and resource center for the pre-K–12 market that gives teachers, students, and parents anytime, anywhere access to McGraw-Hill’s content and resources
McGraw-Hill Connect®
An all-digital learning platform for the higher education market. It connects students to their professors and to a range of engaging, interactive content for more effective learning
AccessPhysiotherapy™ The newest of McGraw-Hill’s suite of online medical specialty sites that are generating strong global subscriptions by providing access to McGraw-Hill’s media-rich content and interactive features. AccessPhysiotherapy broadens the addressable market by going beyond medical education into the allied health field
Three out of four parents with school-age children recognize the McGraw-Hill name in education.
In the elementary-high school market, digital compo-nents are integrated into virtually every McGraw-Hill Education program. In fact, it is misleading to speak of el-hi “textbooks” because what is offered are multimedia packages. The mix of components varies by grade and subject, but interactive, online student solutions are part of the future that is already here.
McGraw-Hill Education offers a great majority of its higher education textbooks in eBook form, featuring interactivity, search, and note-taking functionality.
McGraw-Hill Education publishes and distributes more than a 1,000 titles a year for professional markets worldwide.
Harrison’s Principles of Internal Medicine, the best-selling medical reference, is used by healthcare professionals and students around the world.
Segment Highlights
ConnectED

24 The McGraw-Hill Companies
Federal Funding for Key Education Programs
Federal dollars continue to flow into the U.S. education system. No major actions will be taken on the U.S. Department of Education’s FY 2011 budget or reauthorization of the Elementary and Secondary Education Act (ESEA), also known as No Child Left Behind (NCLB), until Congress reconvenes in fall 2010.
The passage of the FY 2011 education budget and reauthorization of ESEA are independent of each other. If reauthorization of the ESEA does not occur in 2010, we expect to see the passage of a FY 2011 budget to fund the programs of the U.S. Department of Education. The budget is likely to include initiatives outlined in the budget proposal submitted to Congress in February 2010. The President’s proposed budget incor-porates funding for several programs first introduced in the American Recovery and Reinvestment Act of 2009 (ARRA). Congress has shown some bipartisan interest in funding these programs, which include Race to the Top and Investing in Innovation. If Congress does not finalize the budget before the beginning of the new fiscal year, starting on October 1, 2010, Congress can maintain funding through a series of continuing resolutions, which has happened in the past.
Title I grants and IDEA grants are the largest sources of federal funding to states
The proposed budget for FY 2011 would continue federal funding for Race to the Top and Investing in Innovation
StandardsIn order to receive Title I funds, states will be required to align their mathematics and English/language arts (ELA) standards with college- and career-ready expectations, either through adoption of the Common Core Standards or through individual state action, with incentives for Common Core.
AssessmentsStates will be required to continue assessments in English/language arts (ELA), math, and science as provided under NCLB. In addition to funding support for these existing state testing programs, the reauthorization blueprint proposes new formula grants for improved assessments and competi-tive grants for Common Core assessments.
AccountabilityStates will be required to make annual accountability determinations for all schools and districts, with transparent, disaggregated reporting. The Annual Yearly Progress (AYP) measure-ments currently prescribed by NCLB will be eliminated; accountability will be based on growth and progress, with the goal of ensuring college- and career-readiness for all students by 2020.
Race to the Top and Investing in InnovationThe proposed budget would continue federal funding for state comprehensive reforms and local innovation.
“Blueprint” for Reauthorizing ESEAOn March 13, 2010, the U.S. Department of Education released the Administration’s “blueprint” for reauthorizing ESEA. The proposed reforms include:
24 The McGraw-Hill Companies
Federal Funding for Key Education Programs
American Recovery and Reinvestment Act of 2009 (1)
FY 2010 Budget Appropriation
President’s Proposed FY 2011 Budget Request
Title I (Disadvantaged Students) $10 billion $14.5 billion $14.5 billionTitle I (School Improvement Grants) $3 billion $546 million $900 millionIDEA—Part B (Special Education) $11.3 billion $11.5 billion $11.8 billionIDEA—Other (Preschool Grants and Grants for Infants and Families) $900 million $1.1 billion $1.1 billionState Fiscal Stabilization Fund (SFSF) $48.6 billion(2) n/a n/a
Competitive Grants Race to the Top $4.35 billion n/a $1.35 billion
Investing in Innovation (i3) $650 million n/a $500 millionTotal Competitive Grants $5 billion n/a $1.85 billion
Source: U.S. Department of Education(1) Title I and IDEA are long established categorically funded programs. The ARRA 2009 economic stimulus bill included
incremental appropriations that were distributed to the states in 2009 for Title I ($13 billion) and IDEA ($12.2 billion) (2) ARRA established a $48.6 billion State Fiscal Stabilization Fund (SFSF) to help states fill gaps in their education budgets.
$37.1 billion was distributed in 2009 and $11.5 billion is being released in 2010
$4 billion for education reform $350 million to create new college- and
career-ready assessments

2010/2011 MHP Investor Fact Book 25
McGraw-Hill Education
2010/2011 MHP Investor Fact Book 25
More than 40 states are expected to adopt Common Core Standards for K–12 math and for reading and language arts by the end of 2010
In June 2010, the National Governors Association Center for Best Practices and the Council of Chief State School Officers released a set of state-led education standards, known as the Common Core State Standards. Designed to establish clear and consistent goals for learning that will help prepare America’s children for success in college and work, the standards are:
Aligned with college and work expectations
Include rigorous content and application of knowledge through high-order skills
Build upon strengths and lessons of current state standards
Informed by other top performing countries, so that all students are prepared to succeed in the global economy and society
Evidence- and research-based
Timeline:
Each state will follow its own proce-dures and processes for adoption of the Common Core State Standards. Applicants that declared their intention to adopt the standards by August 2010 earned extra points in the Race to the Top grant competition.
Later in 2010 the Department of Education will award $350 million to multi-state consortia with winning proposals for developing new assess-ments based on the Common Core Standards. Present indications are that testing development work will begin in late 2010 or perhaps early 2011, and that the Common Assessments will be implemented from 2012 through 2014.
How McGraw-Hill May Benefit
New assessment and instructional materials: The Common Core movement has favorable implications for new assessment and instruc-tional materials. There is an expectation that there will be more new purchasing as states adopt materials that incorporate the new standards
Less need for customization: As states adopt the new Common Core Standards, the demand for customized material may also be reduced, which could translate into cost savings in content development
Common Core State Standards & Assessments
ARRA Competitive Grants
The ARRA economic stimulus bill gave the U.S. Secretary of Education authority to establish two competitive grant programs designed to help states and local schools drive educational results. All winners will be announced and all awards will be distributed by September 30, 2010, the end of fiscal year 2010.
Update on Competition
ARRA Spending Timelines2010 2011 Fall 2012 2013 Winter 2014 Fall 2015
SFSF Phase Two9/30/11
ARRA Title I & IDEA
Statewide Longitudinal Data Systems
Race to the Top within 4 years of award
Teacher Incentive Fund within 5 years of award
School Improvement Grants 12/31/13 if waiver granted
within 3 years of award
Source: Is the Stimulus Meeting its K-12 Goals? www.edweek.org/go/webinar
Race to the Top
Race to the Top (RTTT) is a U.S. Department of Education program designed to promote comprehensive school reform. Of the $4.35 billion in RTTT funds, the Department is awarding $4 billion directly to states that develop the most promising plans to advance education reform. RTTT will also provide $350 million in competitive funding to multi-state consortia to create new college- and career-ready assessments. The Administration has proposed to continue the education reform program by requesting $1.35 billion in the FY 2011 budget.
Phase 1: The Department of Education received 41 state applications. In April 2010, Delaware and Tennessee were chosen as the winners.
Phase 2: 19 applicants have been announced as finalists. The winners will be announced in September 2010.
Investing in Innovation (i3)
Investing in Innovation will make competitive investments in cutting- edge ideas aimed at producing the next generation of school reforms. Applicants could receive funding for scale-up grants, validation grants, and development grants. Grant recipients would be required to match their federal awards with other private dollars, and to demonstrate how they would sustain their activities after the end of the federal award period. ARRA provided $650 million in funding. The Administration has proposed to continue the program by requesting $500 million in the FY 2011 budget.
On August 4, 2010 the Department of Education announced that 49 school districts, nonprofit education organizations, and institutions of higher education were selected from 1,698 applicants for the i3 program. To receive a share of the $650 million in i3 grants, the winning applicants must secure a commit-ment for a 20% private sector match by September 8, 2010.

26 The McGraw-Hill Companies
Pre-K–16 Public Education: Funding, Expenditures, and Enrollments
Growth in Public Education FundingFunding for pre-K–12 education in the United States reached $582.1 billion in the 2007–08 school year. State and local govern-ments contributed 92% of this total and the federal government provided 8%. In any given year, more than two-thirds of state funding comes from sales and income tax. At the local level, property taxes account for approximately 60% to 65% of the local funding total.
Pre-K–16 Public Education: Funding, Expenditures, and Enrollments
3
6
9
$12
Current and Projected Expenditures per Pupil in K–12(in thousands, in constant 2006–2007 dollars)
‘07 ‘08‘03 ‘04 ‘05 ‘06 ‘09 ‘11‘10 ‘12 ‘13 ‘14 ‘16‘15 ‘17 ‘18
9.1 9.3 9.4 9.6 9.8 9.9 9.9 9.9 10.1 10.3 10.5 10.7 11.0 11.2 11.4 11.6Source: U.S. Department of Education, National Center for Education Statistics, "Projections of Education Statistics to 2018"Note: Detail may not sum to totals due to rounding(1) Middle range of projections cited
Projected(1)
Sales & Income Tax 67%
Other 33%
Sources of State Funding*Total State Revenue: $281 billion
State 48%
Local and Intermediate 44%
Federal 8%
The Public Education Dollar: Revenues by Source*Total Revenue: $582.1 billion
Property Taxes 64%
Other 36%
Sources of Local Funding*Total Local Revenue: $254 billion
*Source: U.S. Census Bureau, "Public Education Finances Report: 2008"
Increasing Expenditures for StudentsStates spent an average of $9,400 for each K–12 student in the 2005-06 school year. By 2018, expenditures are projected to increase nearly 24% to $11,600 per student.
Public school systems received $582.1 billion in funding in 2008, up 4.5% from 2007
Other fiscal years:
Apr. 1 – Mar. 31 New York
Sept. 1 – Aug. 31 Texas
Oct. 1 – Sept. 30 Alabama and Michigan
46 states’ fiscal year is July 1 to June 30

2010/2011 MHP Investor Fact Book 27
McGraw-Hill Education
Growing EnrollmentsIn the United States, school enrollments continue to be on the rise across the entire pre-K–16 student population. By 2018, nearly 60 million students will be enrolled in grades pre-K–12, according to the latest projections by the National Center for Education Statistics. Enrollment is holding steady in the public school pre-K programs currently provided by 38 states.
Enrollment in degree-granting higher education institutions is projected to increase 13% to 20.6 million students in 2018.
15
30
45
60
Enrollment in Elementary and Secondary Institutions(enrollment in millions)
‘08 ‘09 ‘10‘05 ‘06 ‘07 ‘11 ‘12 ‘13 ‘14 ‘15 ‘16 ‘17 ‘18
! PK-8 38.9 38.9 38.9 39.2 39.5 39.8 40.2 40.6 41.0 41.4 41.7 42.1 42.5 42.8! 9-12 16.3 16.4 16.5 16.3 16.2 16.1 16.0 16.0 16.0 16.1 16.4 16.6 16.8 17.0! Total 55.2 55.3 55.4 55.5 55.7 55.9 56.2 56.6 57.0 57.5 58.1 58.7 59.3 59.8Source: U.S. Department of Education, National Center for Education Statistics, "Projections of Education Statistics to 2018"
Projected
5
10
15
20
Enrollment in U.S. Higher Education Institutions(enrollment in millions)
‘08 ‘09 ‘10‘05 ‘06 ‘07 ‘11 ‘12 ‘13 ‘14 ‘15 ‘16 ‘17 ‘18
! !24 10.7 10.8 11.3 11.5 11.8 11.9 11.9 12.0 12.1 12.2 12.2 12.2 12.2 12.3! "25 6.8 6.9 7.0 7.2 7.3 7.3 7.3 7.5 7.6 7.8 7.9 8.1 8.2 8.3! Total 17.5 17.7 18.3 18.7 19.1 19.2 19.2 19.5 19.7 20.0 20.1 20.3 20.4 20.6Source: U.S. Department of Education, National Center for Education Statistics, "Projections of Education Statistics to 2018"Note: Detail may not sum to totals due to rounding(1) Middle range of projections cited
Projected(1)! 24 years and younger! 25 years and older
300
600
900
1,200
Public School Pre-Kindergarten Enrollment, 2000–2008(number of students in thousands)
776 865 915 950 990 1,036 1,084 1,081
‘00-’01 ‘01-’02 ‘02-’03 ‘03-’04 ‘04-’05 ‘05-‘06 ‘06-‘07 ‘07-‘08
Source: U.S. Department of Education, National Center for Education Statistics, Common Core of Data
Total public and private elementary and secondary school enrollment reached 65 million in fall 2006, representing a 12% increase since fall 1993

28 The McGraw-Hill Companies
Growing Enrollments in Key Adoption StatesChanging U.S. Pre-K–12 Enrollment by Region and State, 2006–2018
Mapping the Adoption Process
In the adoption process, a state education board selects elementary and secondary textbooks to be placed on an approved list. To use state education funds, local school districts must choose textbooks from the approved list. In adoption states, the state board issues curriculum guidelines and schedules the purchase of new books in each subject area. In the remaining states, known as “open territories,” textbooks are purchased independently by local school districts or individual schools. There are no statewide purchasing schedules or state selected lists of textbooks.
$ Adoption States (20 States) States in which school districts must purchase
educational materials that have been “adopted” at the state level in order to qualify for state funding
$ Open Territories (30 States) States in which schools purchase educational
materials independently
Notes: California: Adopts for grades K–8; grades 9–12 are
open territory Utah and Oregon: Issue state-recommended lists, but
do not tie textbook purchases to funding
WA
OR
CA
NV
ID
MT
WY
COUT
AZ NM
TX
OK
KS
NE
SD
ND
MN
IA
MO
IL
WIMI
INOH
PA
NY
ME
VT
NHMA
NJ
VAWV
NC
SC
FL
GA
TN
KY
ALMS
AR
LA
AK
CTRI
MDDE
West: + 15.0%
Midwest:+ <1.0%
Northeast: – 5.0%
South: + 18.0%
HI
625
1,250
1,875
$2,500
Industry Textbook Sales: Adoption States, Open Territories (Pre-K–12)(dollars in millions)
‘06 ‘07 ‘08
Source: AAP, as reported by 6 publishers. Includes non grade-specific basal and supplemental materials. Excludes non-domestic sales of $80 million, $74 million, and $79 million for 2008, 2007, and 2006, respectively
! Adoption States 2,024 2,136 2,058
! Open Territories 1,947 1,933 1,857
200
400
600
$800
Supplemental Materials Market (Pre-K–12)(dollars in millions)
652 728 666
‘06 ‘07 ‘08
Source: AAP, as reported by 6 publishers. Includes non grade-specific materials
Projected Enrollment Growth in Key Adoption States, 2006–2018Texas 32.1%
Florida 24.0%
North Carolina 22.9%
Virginia 11.5%
California 8.6%
Source: U.S. Department of Education, National Center for Education Statistics, “Projections of Education Statistics to 2018”
Total U.S. Enrollment Growth: 8.0%Between 2006 and 2018 enrollment in public elementary and secondary schools is projected to increase in 34 states as well as the District of Columbia and decline in 16 states, translating into an 8.0% national increase in public school enrollment.
Adoption States, Open Territories, and Supplemental Sales

2010/2011 MHP Investor Fact Book 29
McGraw-Hill Education
Pre-K–12 Market Sales
Pre-K–6 Sales by Subject Category (2)
% of % of % of 2008 2007 2006(dollars in millions) 2008 total 2007 total 2006 total
Reading/Literature $ 693 38.2% $ 652 36.6% $ 689 38.3%Mathematics 652 35.9% 512 28.7% 480 26.7%Science 176 9.7% 233 13.1% 168 9.4%Social Studies 127 7.0% 167 9.4% 191 10.6%Language Arts/English 79 4.3% 86 4.8% 98 5.4%Music 39 2.1% 53 3.0% 51 2.8%Computer/Technology 11 0.6% 11 0.6% 10 0.6%All others 40 2.2% 68 3.8% 110 6.1%Total $ 1,817 100.0% $ 1,783 100.0% $ 1,798 100.0%
Pre-K–6 Net Sales by State (1)
Basal and Supplemental Materials
% of 2008(dollars in thousands) 2008 Total 2007 2006
1 California $ 258,424 14.2% $ 287,598 $ 292,4752 Texas 183,839 10.1% 109,782 134,1613 Florida 137,876 7.6% 96,573 110,506 Top 3 for 2008 $ 580,139 31.9% $ 493,953 $ 537,1424 Illinois 100,553 5.5% 72,297 86,2275 New York 97,619 5.4% 115,705 117,8446 Pennsylvania 76,914 4.2% 70,943 74,0607 Georgia 72,016 4.0% 71,803 47,7078 New Jersey 58,772 3.2% 57,352 64,5169 Ohio 57,361 3.2% 67,592 63,93310 Louisiana 45,697 2.5% 36,318 27,635 Top 10 for 2008 $ 1,089,071 59.9% $ 985,963 $ 1,019,06411 Alabama 43,680 2.4% 24,555 29,23612 Arizona 43,493 2.4% 49,500 47,14313 North Carolina 40,647 2.2% 43,502 61,07314 Indiana 34,000 1.9% 49,594 35,70815 Michigan 32,282 1.8% 32,126 43,507 Top 15 for 2008 $ 1,283,173 70.6% $ 1,185,240 $ 1,235,731 All others $ 533,836 29.4% $ 597,760 $ 562,033 Total domestic U.S. $ 1,817,011 100.0% $ 1,783,004 $ 1,797,762
6–12 Sales by Subject Category (2)
% of % of % of 2008 2007 2006(dollars in millions) 2008 total 2007 total 2006 total
Mathematics $ 321 22.7% $ 386 25.0% $ 261 17.3%Science 253 17.9% 317 20.5% 297 19.7%Reading/Literature 237 16.8% 160 10.4% 176 11.7%Social Studies 231 16.3% 275 17.8% 305 20.3%Foreign Language 114 8.1% 136 8.8% 108 7.2%Business Education 45 3.2% 45 2.9% 50 3.3%Computer/Technology 39 2.8% 35 2.3% 38 2.5%All others 174 12.3% 189 12.3% 270 17.9%Total $ 1,416 100.0% $ 1,544 100.0% $ 1,505 100.0%
6–12 Net Sales by State (1)
Basal and Supplemental Materials % of 2008(dollars in thousands) 2008 Total 2007 2006
1 California $ 225,596 15.9% $ 260,283 $ 248,0942 New York 106,530 7.5% 91,978 81,4283 Georgia 79,021 5.6% 56,339 44,227 Top 3 for 2008 $ 411,147 29.0% $ 408,600 $ 373,7494 Indiana 63,840 4.5% 12,707 24,3445 Illinois 63,049 4.5% 76,533 75,7546 Pennsylvania 52,760 3.7% 57,268 56,6577 North Carolina 50,057 3.5% 18,987 53,2218 Ohio 48,657 3.4% 49,204 48,8479 Texas 46,286 3.3% 188,770 53,15210 New Jersey 45,735 3.2% 44,084 45,627 Top 10 for 2008 $ 781,531 55.2% $ 856,153 $ 731,35111 Tennessee 42,979 3.0% 13,456 41,59812 Florida 41,689 2.9% 88,101 121,95713 Michigan 39,496 2.8% 36,370 40,12114 Missouri 34,850 2.5% 34,766 35,77115 Louisiana 33,490 2.4% 34,258 17,720 Top 15 for 2008 $ 974,035 68.8% $ 1,063,104 $ 988,518 All others $ 441,991 31.2% $ 481,311 $ 516,319 Total domestic U.S. $ 1,416,022 100.0% $ 1,544,413 $ 1,504,835
1,750
3,500
5,250
$7,000
Estimated Total Pre-K–12 Industry Net Sales(dollars in millions)
‘07 ‘08 ‘09‘05 ‘06
Source: AAP. Includes sales of domestic and non-domestic products
6,570 6,189 6,356 6,077 5,238
1,250
2,500
3,750
$5,000
Total Net Elementary/High School SalesBasal, Supplemental, and Online Materials(dollars in millions)
‘06 ‘07 ‘08Source: AAP, as reported by 6 publishers. Includes sales of U.S. products only. Includes sales to foreign subsidiaries and third parties
! Non-specified 79 112 154! Pre-K–6 2,243 2,283 2,257! 6–12 1,727 1,748 1,585 Total 4,050 4,143 3,996
In 2009, sales of textbooks and educational materials for the pre-K–12 school market decreased approximately 14% to $5.2 billion, according to the Association of American Publishers (AAP).
(1) Source: AAP, as reported by 6 publishers. Excludes supplemental and non grade-specific basal materials. State ranking varies each year in accordance with adoption cycle
(2) Source: AAP, as reported by 6 publishers. Excludes supplemental and non grade-specific basal materials, and non-domestic

30 The McGraw-Hill Companies
El-Hi Adoption Opportunities
Adoption states select print and digital instructional materials for one or more core disciplines each bid/purchase year. Adoption cycles vary by state, but most operate on a six- or seven-year cycle. A few are on a shorter cycle (i.e., three-, four-, five years). Elementary and secondary adoption schedules provide visibility into the state new adoption market for several years. The presence or absence of adoption states with large student enrollments—such as California, Florida, and Texas—will influence the size of the market opportunity each year.
Elementary School Adoption ScheduleBid Year 2009 2010 2011 2012 2013 2014 2015Purchase Year 2010 2011 2012 2013 2014 2015 2016Reading 2 New Mexico (Tradtnl/Lit)
Texas (Eng/Span K-5)Arkansas North Carolina
Mississippi 5Virginia (K-5)
Florida (K-5) 5Indiana (1-6)Kentucky Oklahoma (Remedial)Tennessee West Virginia
Alabama 5Idaho Oregon
Georgia Louisiana 5
New Mexico 5Oklahoma 1
Mathematics Florida Indiana (1-6)Oklahoma West Virginia
Alabama 5TennesseeVirginia
Arkansas GeorgiaLouisianaNew Mexico
California 7Mississippi 5
Idaho South Carolina 1,5
Texas (Eng/Span K-5) 5
Florida 5Indiana (1-6)Kentucky (PK-6) 5North Carolina (K-5) 7Oregon West Virginia 5
Social Studies Virginia GeorgiaIdahoMississippi 3New MexicoWest Virginia
Alabama 5California 7FloridaMississippi 4,5
Oregon
OklahomaSouth Carolina 5Texas (Eng/Span) 5
ArkansasKentucky 5Louisiana 5Tennessee
Indiana (1-6)North Carolina 7Oklahoma 5
Virginia 5
Science Mississippi Oregon
FloridaIndiana (1-6)Louisiana
IdahoNew MexicoTexas (Eng/Span) 6Texas (5-6) (Supplemental Science)VirginiaWest Virginia 6
Alabama 5ArkansasCalifornia 7North Carolina 5
GeorgiaOklahomaSouth Carolina 5
Kentucky 5Tennessee
Mississippi 5
Language Arts/ English 2
Tennessee (1-6)Texas (Eng/Span K-1)
ArkansasNorth CarolinaSouth Carolina (K-5) 6Texas (Eng/Span 2-6)
– Florida (K-5) 5Idaho 1Kentucky 1,5
Mississippi 5Oklahoma
Indiana (1-6)OregonWest Virginia
Alabama 5Georgia
Louisiana 5Tennessee (1-6) 5
Health (H) Physical Education (PE)
Alabama (H, PE)Idaho (H, PE)Kentucky (H, PE)
Georgia (H, PE)Indiana (H 1-6)
Louisiana (H, PE)New Mexico (H, PE)West Virginia (H)
Arkansas (H, PE)Mississippi (H, PE) 5South Carolina (H K-5) 5
California (H) 7 Oregon (H, PE)Tennessee (H)
Idaho (H, PE) 5Texas (H, PE) 5
Art (A) Music (M) Drama (D) Speech (S)
Arkansas (A, M)Idaho (A, M) 1
Georgia (A, M, D) Indiana (A, M 1-6)Kentucky (A, M)Louisiana (A, M)Tennessee (A, M)
Alabama (A, M, D) 5New Mexico (A, M)Oregon (A, M)
Florida (A, M, D) 5Mississippi (A, M, D) 5North Carolina (A, M, D) 7South Carolina (A, M) 5
California (A) 7Oklahoma (A, M) 5Texas (A, M) 5West Virginia (A, M)
Arkansas (A, M) 5Idaho (A) 5South Carolina (A, M, D, S) 1,5
Spelling – ArkansasTexas (1-6)
Tennessee (1-6) IdahoKentuckyMississippi 5North Carolina (2-6) 7Oklahoma
Indiana (1-6)West Virginia
Alabama 5Georgia
–
Literature 2 – – – Indiana (Reading 1-6)Kentucky 5
Alabama 5 Louisiana 5 Oklahoma 5
World Languages
Georgia Oregon (Span K-6) – Alabama 5California 7Florida 5
– ArkansasTexas 5VirginiaWest Virginia
GeorgiaSouth Carolina 5
Computer Education
Idaho 1Louisiana
Idaho 1 ArkansasIdaho 1
Idaho 1 Idaho 1 Idaho 1South Carolina 1,5
Idaho 1,5
English as a Second Language (ESL)
North Carolina Tennessee (1-6)
Texas – Oklahoma Oregon Arkansas Tennessee (1-6) 5
Handwriting – ArkansasTexas (1-3)
Louisiana IdahoIndiana (1-3)KentuckyMississippi 5North Carolina (1-5) 7Oklahoma
West Virginia Alabama 5 –
Dictionaries – Arkansas – IdahoMississippi 5Oklahoma
– Alabama 5Georgia
–
Source: AAP School Division/NASTANotes: Elementary adoptions are for grades K– 6, unless otherwise noted Secondary adoptions are for grades 6–12, unless otherwise noted Schedules are subject to change. 2009 and 2010 bid years are in effect. 2011 to
2015 bid years reflect assumptions from various sources including state Web sitesItalics indicate the Spanish-language edition of the program
1 Selected titles2 Some states bid separately on, or some combination of, Reading, English/Language Arts, and Literature programs. These states may be listed under more than one discipline in a bid year until they issue their actual bid calls
3 U.S. History only4 Except U.S. History5 Tentative, pending final decision and/or approval6 Postponed to a later bid/purchase year7 Suspended until further notice

2010/2011 MHP Investor Fact Book 31
McGraw-Hill Education
Secondary School Adoption ScheduleBid Year 2009 2010 2011 2012 2013 2014 2015Purchase Year 2010 2011 2012 2013 2014 2015 2016Mathematics Florida
IndianaNorth CarolinaOklahomaOregon (9-12)South Carolina (9-12) 1West Virginia
Alabama 5Georgia (9-12) 1TennesseeVirginia
ArkansasSouth Carolina (9-12) 1,5
GeorgiaLouisianaNew Mexico
California (6-8) 7Mississippi 5
IdahoSouth Carolina (6-8) 1,5
Florida 5IndianaKentucky 5OregonSouth Carolina (9-12) 5Texas (Eng/Span 6) 5West Virginia 5
Science MississippiOregon
FloridaIndianaLouisiana
IdahoNew MexicoSouth Carolina (9-12) 1,5
Texas 6Texas (Supplemental Science)VirginiaWest Virginia 6
Alabama 5ArkansasCalifornia (6-8) 7North Carolina 5
GeorgiaOklahomaSouth Carolina (6-8) 5
Kentucky 5South Carolina (9-12) 1,5
Tennessee
Mississippi 5
Social Studies Virginia GeorgiaIdahoMississippi 3New MexicoWest Virginia
Alabama 5California (6-8) 7FloridaMississippi 4OregonSouth Carolina (9-12) 1,5
OklahomaSouth Carolina 1,5
Texas 5
ArkansasKentucky 5Louisiana 5Tennessee
IndianaNorth Carolina 7Oklahoma 5
South Carolina (9-12) 1,5
Virginia 5
Literature 2 Georgia (9-12)New Mexico (6-8)Texas (Eng/Span 6)
ArkansasNorth Carolina
Mississippi 5TennesseeVirginia
Indiana (6-8)/Rdg (6-8)Kentucky 5West Virginia
Alabama 5Florida (6-8) 5IndianaOregon
Florida (9-12) 5Georgia (6-8)Louisiana 5New Mexico (9-12) 5
Georgia (9-12)New Mexico (6-8) 5Oklahoma 5
Reading 2 New Mexico (6-8)Texas (Elective 6-8)
Arkansas (6-8)North Carolina (6-8)
Mississippi (6-8) 5 Indiana (6-8)/Lit (6-8)Kentucky (6-8)Oklahoma (Remedial)Tennessee (6-8)West Virginia (6-8)
Alabama (6-8) 5Florida (6-8) 5IdahoOregon (6-8)
Florida (9-12) 5Georgia (6-8)Louisiana 5New Mexico (9-12) 1,5
New Mexico (6-8) 5Oklahoma 1
Language Arts/English 2
Georgia (9-12)Tennessee
ArkansasNorth CarolinaTexas
South Carolina (6-8) 1,5
VirginiaIdaho 1Kentucky 1,5
Mississippi 5Oklahoma
Florida (6-8) 5IndianaOregonWest Virginia
Alabama 5Florida (9-12) 5Georgia (6-8)New Mexico (9-12) 5
Georgia (9-12)Louisiana 5South Carolina (9-12) 5Tennessee 5
WorldLanguages
GeorgiaIdahoNew Mexico (6-8) (Fr/Span)North Carolina 1
Tennessee
Oregon (Fr/Span) KentuckyLouisiana
Alabama 5California (6-8) 7Florida 5
Indiana ArkansasMississippi 5New Mexico (9-12) (Fr/Lat/Span)Texas 5VirginiaWest Virginia
GeorgiaIdaho 5New Mexico (6-8) (Fr/Span) 5South Carolina 5Tennessee 5
BusinessEducation
AlabamaIdaho (9-12) 1 (Interim)KentuckyLouisiana
South Carolina (7-12) 1 GeorgiaIndianaSouth Carolina 1,5
Tennessee
Florida 5South Carolina (9-12) 1,5
Mississippi 1,5
New MexicoNorth Carolina 7Texas 1,5
ArkansasIdahoMississippi 5South Carolina (9-12) 1,5
Florida 5South Carolina 1,5
ComputerEducation
Alabama 1Idaho 1KentuckyLouisiana
Idaho 1 ArkansasIdaho 1South Carolina 1,5
Tennessee
Florida 1,5
Idaho 1South Carolina (7-12) 1,5
Idaho 1North Carolina (7-12) 7Oklahoma
Idaho 1South Carolina 1,5
Idaho 1,5
Health (H)Physical Education (PE)
Alabama (H, PE)Idaho (H, PE)Kentucky (H, PE)
Georgia (H, PE)Indiana (H)
Louisiana (H, PE)New Mexico (H, PE)South Carolina (PE) 5West Virginia (H)
Arkansas (H, PE)Mississippi (H, PE) 5
California (H 6-8) 7 Oregon (H, PE)Tennessee (H)
Idaho (H, PE) 5North Carolina (H) 7Texas (H, PE) 5
Family/ConsumerScience
AlabamaArkansasKentuckyLouisianaWest Virginia (5 yrs)
– Georgia IndianaSouth Carolina 1,5
Mississippi 1,5
North Carolina 7New MexicoSouth Carolina (Occup) 1,5
Texas 5
IdahoSouth Carolina 1,5
TennesseeWest Virginia
Arkansas 5West Virginia 5
Art (A)Music (M)Drama (D)Speech (S)
Arkansas (A, M)Georgia (S 9-12)Idaho (A, M) 1 (D 9-12)Tennessee (S 9-12)
Arkansas (S 9-12)Georgia (A, M, D)Texas (S 6-8)
Indiana (A, M)Kentucky (A, M, D)Louisiana (A, M)Mississippi (D 9-12) 5Tennessee (A, M) (D 9-12)
Alabama (A, M, D) 5Idaho (S)Kentucky (S 9-12)Mississippi (S 9-12) 5New Mexico (A, M) (D 9-12)Oklahoma (S 9-12)Oregon (A, M)Texas (S 9-12) 5
Florida (A, M, D) 5Mississippi (A, M, D) 5North Carolina (A, M, D) 7South Carolina (A, M) 5West Virginia (S 9-12)
Alabama (S 9-12) 5California (A 6-8) 7Florida (S 9-12) 5Oklahoma (A,M) (D 9-12) 5Texas (A, M) 5
West Virginia (A, M, D)
Arkansas (A, M) 5Idaho (A) (M, D 9-12) 5South Carolina (A, M, D, S) 1,5
Tennessee (S 9-12)
Vocational/TechnicalEducation
Alabama 1Arkansas (9-12) 1KentuckyLouisiana
– GeorgiaIndianaSouth Carolina 1,5
TennesseeTexas (9-12) (Engineering) 6
Florida 1,5
North Carolina (7-12) 7New MexicoTexas 5
Arkansas 1Idaho 1Mississippi 1,5
South Carolina 1,5
Alabama 5
Arkansas (9-12) 5Florida 1,5
North Carolina (9-12) 7South Carolina 1,5
Career/WorkforceEducation
AlabamaArkansas (9-12) 5Idaho (9-12) 1 (Interim)KentuckyLouisiana
Louisiana 1 GeorgiaLouisiana 1
Florida 1,5 Florida 1,5
New Mexico (9-12)South Carolina (9-12) 1,5
Texas (9-12) 5
ArkansasIdaho (9-12)Mississippi 5
Alabama 5Arkansas 5Florida 1,5
North Carolina 7South Carolina 1,5
DriverEducation
Idaho (9-12) – Tennessee (9-12) – Alabama (9-12) 5Arkansas (9-12)Mississippi (9-12) 5New Mexico (9-12)
South Carolina (9-12) 5West Virginia (9-12)
Idaho (9-12) 5

32 The McGraw-Hill Companies
Digital Solutions, Better Teaching, Better Learning
Center for Digital InnovationA first-of-its-kind digital research and development center, McGraw-Hill’s Center for Digital Innovation (CDI) is furthering its mission to equip all students with the 21st century skills they need to succeed in school and in today’s competitive global economy. Its new offerings and collaborations leverage students’ deep engagement with the digital world to create resources that meet today’s education and learning challenges in the classroom.
CDI is using a variety of digital tools to improve learning by enabling teachers to deliver personalized instruction adapted to each individual student’s abilities. Approaches include:
• Digital socialization to promote collaborative learning
• Creative multimedia tools to facilitate student work and teacher-designed instruction
• Digital gaming technologies for sustained learning, building problem-solving skills, and growing self-directed learners
• Expanded and refined reporting capacities to analyze assessment data, correlate data with learning needs, and return it as precisely-targeted instruction
McGraw-Hill Education has developed specialized learning centers for the K–12 education market. Experts and scholars partner with educators to focus on improving student learning outcomes and promoting digital innovation in:
Intervention and special needs
Literacy
College and career readiness
STEM (science, technology, engineering, and mathematics)
Writer’s Workspace
Writer’s Workspace is a new, all-digital language arts and writing program for middle and high school students. It engages students in the writing process and allows them to prepare writing assignments online and get feedback from their teacher through-out the entire process.
Writer’s Workspace supports writing and grammar instruction through three steps:
1. Interactive Reading: Before beginning a writing lesson, students read literature in the genre of the writing activity.
2. Reading-Writing Connection: Reading-writing practice activities provide a bridge between reading and writing.
3. Comprehensive Writing: Students write longer compositions. Teachers can comment online at each stage of the writing process.
ConnectED
McGraw-Hill Education is now making its pre-K–12 content and resources available on one digital platform— ConnectED. Students, teachers, and parents have anytime, anywhere access—in the classroom, at home, or wherever there is an Internet connection.
ConnectED enhances the teaching and learning experience. Teachers can search for materials that match their teaching style and meet their students’ unique ways of learning.
http://connected.mcgraw-hill.com
New Programs Developed in Conjunction with the Center for Digital Innovation
Every program on the ConnectED platform features:
An interactive textbook where students can highlight key points and add notes
Digital resources that reinforce the educational topics taught through the printed textbook
Assessments that help teachers target instruction
Supplemental materials for intervention and enrichment
Planning tools help teachers quickly prepare classroom lessons and instruction

2010/2011 MHP Investor Fact Book 33
McGraw-Hill Education
LEAD21
LEAD21 is a new research-based core K–5 literacy program that engages students at all reading levels. LEAD21 helps teachers better manage diverse classes with blended group instruc-tion, built-in acceleration plans, and digital offerings.
LEAD21 is the first education program made available on the Intel®-powered classmate PC and provides:
Students with easy access to digital tools, such as an Online Coach and ePractice activities. Every book in this program is available as an eBook
Teachers with flexible digital tools like Group Manager, which coordinates the placement of students for differentiated reading, and the ePractice Activity Reporting Tool and Assessment Handbook, which helps monitor progress toward proficiencywww.wrightgroup.com/wglead21
McGraw-Hill’s technology collaborations offer school districts the flexibility to choose from a variety of options, including total digital solutions or hybrid print/digital models
www.mhecdi.com
New Technology Partnerships and Products McGraw-Hill Education has established a series of new technology partnerships and products that will enhance its digital K–12 education solutions to drive student achievement and foster the development of 21st century skills.
McGraw-Hill has selected M&A Technology to manufacture and distribute the McGraw-Hill Companion Touch, a full-featured student laptop computer based on the Intel®-powered classmate PC reference design. This laptop combines Intel® Learning Series’ technology with McGraw-Hill’s trusted educational content. McGraw-Hill’s collaboration with these two partners offers school districts the flexibility to choose from a variety of options, including total digital solutions or hybrid models consisting of print and digital components.
Developed in conjunction with McGraw-Hill’s Center for Digital Innovation, the first programs optimized for the McGraw-Hill Companion Touch device include:
• LEAD21, an all-new elementary literacy program designed to reach a new generation of readers
• CINCH Mathematics, a digital K–6 math curriculum that uses the power of interactive whiteboard teaching and versatile online capabilities to fully engage students
CINCH Mathematics
CINCH Mathematics engages teachers and students and supports an active learning style through its rich use of technology. In particular, the program uses the interactive whiteboard for visual learning activities that help build math concepts for multiple learning styles in the same class.
This all-digital program offers:
Extensive and flexible resources to help teach math concepts, including interactive tools
Built-in teaching support and professional development
Individualized instruction for on-target teaching
Engaging math skills practice
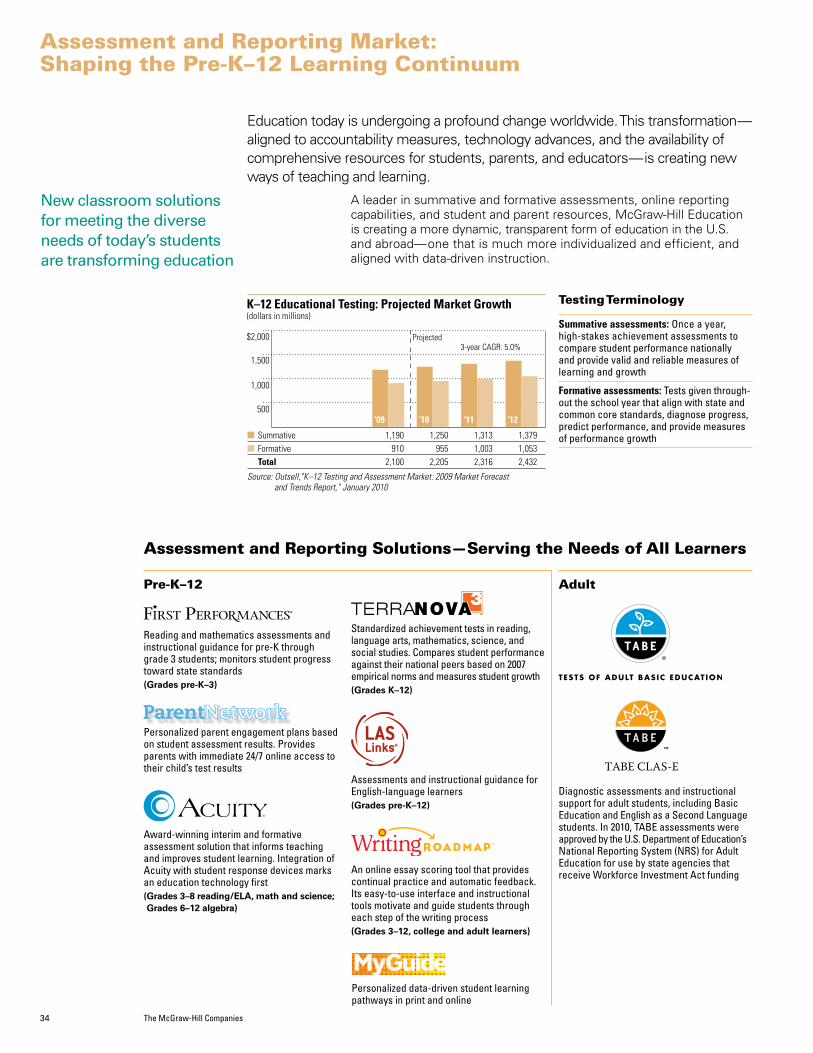
34 The McGraw-Hill Companies
Assessment and Reporting Market: Shaping the Pre-K–12 Learning Continuum
500
1,000
1,500
$2,000
K–12 Educational Testing: Projected Market Growth(dollars in millions)
‘09 ‘10 ‘11 ‘12! Summative 1,190 1,250 1,313 1,379! Formative 910 955 1,003 1,053 Total 2,100 2,205 2,316 2,432Source: Outsell,"K–12 Testing and Assessment Market: 2009 Market Forecast and Trends Report," January 2010
Projected3-year CAGR: 5.0%
Education today is undergoing a profound change worldwide. This transformation—aligned to accountability measures, technology advances, and the availability of comprehensive resources for students, parents, and educators—is creating new ways of teaching and learning.
A leader in summative and formative assessments, online reporting capabilities, and student and parent resources, McGraw-Hill Education is creating a more dynamic, transparent form of education in the U.S. and abroad—one that is much more individualized and efficient, and aligned with data-driven instruction.
Testing Terminology
Summative assessments: Once a year, high-stakes achievement assessments to compare student performance nationally and provide valid and reliable measures of learning and growth
Formative assessments: Tests given through-out the school year that align with state and common core standards, diagnose progress, predict performance, and provide measures of performance growth
Assessment and Reporting Solutions—Serving the Needs of All Learners
Pre-K–12
New classroom solutions for meeting the diverse needs of today’s students are transforming education
Diagnostic assessments and instructional support for adult students, including Basic Education and English as a Second Language students. In 2010, TABE assessments were approved by the U.S. Department of Education’s National Reporting System (NRS) for Adult Education for use by state agencies that receive Workforce Investment Act funding
Reading and mathematics assessments and instructional guidance for pre-K through grade 3 students; monitors student progress toward state standards(Grades pre-K–3)
Adult
Personalized parent engagement plans based on student assessment results. Provides parents with immediate 24/7 online access to their child’s test results
Award-winning interim and formative assessment solution that informs teaching and improves student learning. Integration of Acuity with student response devices marks an education technology first( Grades 3–8 reading/ELA, math and science; Grades 6–12 algebra)
Standardized achievement tests in reading, language arts, mathematics, science, and social studies. Compares student performance against their national peers based on 2007 empirical norms and measures student growth(Grades K–12)
Assessments and instructional guidance for English-language learners(Grades pre-K–12)
An online essay scoring tool that provides continual practice and automatic feedback. Its easy-to-use interface and instructional tools motivate and guide students through each step of the writing process(Grades 3–12, college and adult learners)
Personalized data-driven student learning pathways in print and online
TM
TABE CLAS-E

2010/2011 MHP Investor Fact Book 35
McGraw-Hill Education
Program Summary McGraw-Hill Product Alignment
Title I Title I provides financial assistance to Local Education Agencies (LEAs) and schools with high numbers or high percentages of poor children to help children meet challenging state academic standards.
Acuity TerraNova, Third Edition LAS Links
Writing Roadmap Yearly ProgressPro First Performances
Race to the Top (RTTT)
RTTT asks states to compete for grants to advance reform in four specific areas: standards and assessments, data systems, effective teachers and principals, and turning around low-performing schools.
AcuityTerraNova, Third Edition
Writing RoadmapYearly ProgressPro
RTTT Common Core Assessment Programs
RTTT provides competitive funding to consortia of states to develop assessments that are valid, support and inform instruction, measure the Common Core Standards, and provide accurate information about what students know and can do.
AcuityTerraNova, Third Edition
Customized Assessment Services
Investing in Innovation (i3)
i3 provides competitive grants to applicants with a record of improving student achievement in order to expand the implementation of, and investment in, innovative practices.
Acuity LAS Links
Writing Roadmap Yearly ProgressPro
School Improvement Grants
School Improvement Grants are used to improve student achievement in schools identified for improvement, correc-tive action, or restructuring so as to enable those schools to make Adequate Yearly Progress (AYP) and demonstrate sustained improvement.
Acuity TerraNova, Third Edition
Writing Roadmap Yearly ProgressPro
IDEA IDEA provides grants to states and public educational agencies to provide special education to children with a wide diversity of disabilities.
Acuity TerraNova, Third Edition
Writing Roadmap Yearly ProgressPro First Performances
Acuity®
Acuity, an InFormative Assessment™ solution, is a flexible assessment program that can be administered online, with paper-and-pencil or with handheld response devices. Used by more than 65,000 teachers and 1.5 million students nationwide, Acuity helps teachers gauge student performance and deliver data-driven instruction for every student. Acuity features a suite of diagnostic and predictive formative and interim assessments designed to show student growth toward state standards in reading, English/language arts, math, and science for grades 3–8, and in algebra for grades 6–12. Acuity contains all the elements of a comprehensive assessment system:
Standards-aligned, pre-built assessments for state and Common Core standards
Instructional resources
Actionable reports; indicates if intervention is required early in the academic year
Item banks and item authoring for customized assessments
Federal Funding and AssessmentsIn the U.S., the assessment market is responding to new forces, such as Common Core State Standards, Race to the Top, Investing in Innovation (i3), School Improvement Grants; the National Educational Technology Plan; and proposed Elementary and Secondary Education Act (ESEA) reforms. The table below summarizes the federal grants available for pre-K–12 education and how McGraw-Hill assessment and reporting products align with the requirements for each grant.
Diagnostic and Predictive Benchmark Assessments for the Formative Market
www.AcuityForSchool.com
Industry AwardsSoftware & Information Industry Association (SIIA) CODiE Award winner for “Best Student Assessment Solution” in 2009 and 2010

36 The McGraw-Hill Companies
Higher Education and Online Learning
Nowhere in education is the digital revolution moving faster than in the higher education market. This is giving McGraw-Hill Education the opportunity to personalize and improve learning for students regardless of distance and time. In 2010, McGraw-Hill Education took a major step to improve its connectivity with faculty and students by partnering with Blackboard.
McGraw-Hill Connect®
McGraw-Hill Connect is an assignment and assessment platform that uses the principles of cognitive science to individualize the learning process. The online platform is based on McGraw-Hill’s extensive, ongoing research of professors’ instructional processes and students’ study habits and includes digital learning tools that enable professors to customize courses to improve student learning and mastery of course content.
In June 2010, McGraw-Hill Education partnered with Blackboard Inc. to increase the reach and ease of access to McGraw-Hill’s suite of digital products on college campuses. The integration of McGraw-Hill’s content with Blackboard Learn™, Blackboard’s Web-based teaching and learning platform, is expected to be ready for classroom use in early 2011.
Benefits include:Single Sign-on A single Blackboard log-in for access to McGraw-Hill Connect’s content and tools
Integrated Grade Book Grades for assignments, quizzes, and tests will post directly to the Blackboard grade book, eliminating the need to manage two systems
Seamless Course Management for Instructors Seamless access to McGraw-Hill Connect to manage course content, create assignments, and track student performance
Quizzes and Online Self-Assessment Provide immediate feedback and concise snapshots of individual students’ performance
eBooksCourse-critical content dynamically engages students to improve learning and retention
Multimedia Content A library of audio lectures, videos, animations, and podcasts to help students understand difficult concepts
Searchable Recorded Class LecturesEasily find and replay the exact point in recorded class lectures to review key information
Online Sharing of Lecture NotesShare lecture notes, engage in collabora-tive learning, and get peer feedback at www.GradeGuru.com
Online Tutoring LearnSmart™ assesses what a student has already mastered and how much additional study time is needed
McGraw-Hill Education’s partner-ship with Blackboard increases the reach and ease of access for McGraw-Hill’s suite of digital products on college campuses
Instructor Resource Center
- Assign quizzes and practice exams- Review student/class performance data- Provide feedback to students
Student Study CenterQuizzes and Online Self-AssessmenteBooksMultimedia ContentLecture Notes & Audio ReplayOnline Tutoring
Content
Mobile Applications
Required CourseContent- Textbooks- eBooks- Online
Course Assignments- Reading- Homework- Tests
Student Self-Assessment and Homework
Data and Analyticsfrom online homework and quizzes
Top 3 Reasons Instructors Use McGraw-Hill ConnectTo improve learning and retentionTo easily create and deliver assignments and assessmentsTo engage students in the course outside class
Top Reason Students Use McGraw-Hill ConnectTo improve their grade
iPhone iPad Laptop
Improving Connectivity with Faculty and Students—McGraw-Hill/Blackboard Partnership
http://connect.mcgraw-hill.com

2010/2011 MHP Investor Fact Book 37
McGraw-Hill Education
1,125
2,250
3,375
$4,500
Estimated Higher Education Industry Sales of U.S. PublishersBooks and Materials(dollars in millions)
‘07 ‘08 ‘09‘05 ‘06
Source: AAP. Includes sales of domestic and non-domestic products
3,359 3,453 3,678 3,777 4,265
Technology: An Opportunity, Not a Threat
What we know as an educational publisher:All information is not equal in the education marketplace. Curriculum content must be accurate, authori-tative, and sequenced according to a logical learning progression
Digital does not disintermediate content
Digital delivery allows for added functionality and higher value
Content counts and correlating it to standards is vital
The digital business model expands the addressable market. Changing the workflow changes the opportunity for publishers who know how to tailor their digital offerings to the needs of customers
The Need for Trusted Content Has Not Changed; How Content Is Delivered HasMcGraw-Hill Education’s editors, authors, and digital innovators understand what higher education students need to know, when they need to know it, and the different ways they learn it best. What has changed is how to leverage technology to engage students and improve the teaching and learning experience. McGraw-Hill Education is partnering with a range of technology firms to link technology, content, and distribution and expand the addressable market.
eBooks & Mobile AppsTop-selling higher education titles are available for purchase through the various eBook stores, spanning disciplines, including business, economics, science, math, humanities, foreign languages, and social sciences.
The HPI Group is partnering with makers of devices to provide content to students. Devices include the Entourage eDGe™ and Kakai Kno tablets, as well as other PC-based eBook software providers, including Follett’s Café Scribe, Missouri Book’s xPlana, and Baker and Taylor’s Blio.
The HPI Group is developing applica-tions for the iPad and for selling titles directly through Apple’s iBookStore. The HPI Group has multiple avenues for delivering its content on the iPad, including CourseSmart, Amazon, Barnes & Noble, and Zinio. All partners with Web-available content can be accessed through the Safari browser on the iPad as well.
The majority of McGraw-Hill’s higher education textbooks can be down-loaded from CourseSmart, a common industry eTextbook and digital course materials platform that standardizes delivery for students and instructors.
Online CoursesMcGraw-Hill’s instructional design enables its online courses to be used in an exclusively online program or in a blended learning environment that leverages the best of traditional and innovative online learning solutions.McGraw-Hill’s online courses are aligned to the market-leading textbooks and enhance learning by:• Delivering key course concepts in an
online, interactive format• Supporting different learning styles
through animations, graphics, streaming video, and interactive activities
• Allowing instructors to customize content with a modular topic and objective-based format
LearnSmart—Improving Student Performance and RetentionIn order to succeed in a course, students need to master core concepts to move on to deeper critical thinking. LearnSmart assesses a student’s current level of knowledge and provides a personal learning path in order to master key concepts. Students can access this module using a Web browser or mobile device such as the iPhone or iTouch.
How is LearnSmart built?
Rooted in textbooks
Experienced instructors dissect the contents of textbooks, pulling out main concepts and ideas
Concept maps are built
Concepts distilled from textbooks are entered into a concept mapping software, adding in remediation at the appropriate levels
The LearnSmart “module” is made
The authoring soft-ware uses informa-tion in the concept maps to build a LearnSmart module for each title
Learning Plans are created
As a student works within the system, LearnSmart develops a personal learning path adapted to what the student has learned and retained and recommends how much time to study and the exact resources to improve understanding

38 The McGraw-Hill Companies
Meeting the Information Needs of Global Professional Customers
The McGraw-Hill Higher Education, Professional and International (HPI) Group provides books, services, and tools to medical, business, and technical professionals around the world.
Leveraging Digital Channels to Provide Content When and Where Customers Want It
AccessEngineering’s growing list of global adoptions includes:
Stanford University
University of California
University of Illinois
Rand Water Corporation
Caterpillar Inc
Chinese University of Hong Kong
Bharat Institute of Technology
AccessEngineering
Covers 14 major areas of engineering and supports all levels of scientific and technical research in the corpo-rate, industrial, government, and academic sectors. This subscription service provides:
Content from more than 300 industry-leading engineering titles, together with image banks, learning aides, and PowerPoints
Weekly engineering news articles
A 125,000-term science and engineering dictionary, in a fully searchable database
Personalization tools, including bookmarking and highlighting, allow content to be easily integrated into a user’s workflow
www.accessengineeringlibrary.com
Mobile Applications
More than 100 applications to help high school students, medical students, and physicians achieve their goals
Mobile apps are available for test prep, including AP, SAT, and USMLE exams
eBooks
More than 5,000 eBooks are available on devices such as Amazon’s Kindle, the Sony e-Reader, and the Apple iPad

2010/2011 MHP Investor Fact Book 39
McGraw-Hill Education
AccessPhysiotherapy
Searchable, full-text access to leading McGraw-Hill physical therapy and internal medicine content, including Orthopaedic Examination, Evaluation, and Intervention, Imaging in Rehabilitation, and Pharmacology for the Physical Therapist. In addition, AccessPhysiotherapy provides:
Anatomy & Physiology REVEALED, an online cadaver dissection resource developed by McGraw-Hill Education and the University of Toledo
Over 90 procedural videos demonstrating key concepts and techniques in clinical practice
Integrated drug database with critical information on medi-cation indications, dosages, contraindications, and drug classes, as well as patient handouts in English and Spanish
Custom Curriculum Tool Helps Medical Students and Educators
McGraw-Hill’s Access sites feature the innovative Custom Curriculum, a powerful online tool that educators can use to assign, manage, and track the progress of student assignments.
For program directors, Access represents a significant step forward in curriculum development and design, offering detailed assignment monitoring, student assess-ment tests and tools, and the ability to share assignment designs with colleagues at other programs
Students can view available topics from their program director, as well as their own individual progress by activity
Serving the Professional Community The HPI Group provides timely and authoritative knowledge to global professional customers through the publication of nearly a thousand titles a year.
BusinessA leader in manage-ment, finance, and investing content, McGraw-Hill provides thought leadership books
MedicalA leading medical publisher with storied brands like Harrison’s, McGraw-Hill provides expert solutions to medical students and practitioners through-out their careers
TechnicalMcGraw-Hill’s global author teams provide cutting-edge content to meet the emerging needs of technical professionals every-where
McGraw-Hill’s online medical specialty sites provide researchers, physicians, medical students, professors, and healthcare professionals worldwide with integrated learning portals that feature market-leading texts, anima-tions, illustrations, videos, interactive self-assessments, and curriculum tools.
Digital Subscription Services for Medical Schools and Hospitals
www.accessphysiotherapy.com

40 The McGraw-Hill Companies
For 15 decades and through even more business cycles, Standard & Poor’s has been an important source of financial information, insight, and analysis for millions of investors. S&P has empowered investors and markets through its lasting commit-ment to integrity, transparency, independence and analytical rigor, and its continual search for better and new ways to aid market participants in understand-ing and gaining access to markets and investment opportunities around the world.
After 150 years, S&P is still a learning institution determined to find new ways to serve capital markets more effectively, to maintain a leadership position, and to grow the business. In ratings, for example, strengthening analytics, increasing transparency, and reinforcing the integrity and value of the rating process are important steps that are enabling S&P to enhance the value of its global benchmarks for credit risk to investors.
Standard & Poor’s anniversary Web site:
2010 marks the 150th anniversary of the founding of Standard & Poor’s. Standard & Poor’s traces its origins to the 1860 pub-lication of The History of Railroads and Canals in the United States by Henry Varnum Poor, an early champion of investor rights and pioneer in the then-emerging industry of financial research and reporting, and the 1906 founding of Luther Blake’s Standard Statistics Bureau, which provided previously-unavailable financial information on approximately 100 U.S. companies.
Standard & Poor’s Celebrates 150 Years of Leadership in Serving Capital Markets Worldwide
www.sp-150.com
www.standardandpoors.com

Financial Services
2010/2011 MHP Investor Fact Book 41
Standard & Poor’s serves the global capital markets through S&P Credit Market Services and S&P Investment Services. S&P’s resilient and diverse portfolio positions the Financial Services segment to expand in recovering and growing markets.
Standard & Poor’s Credit Market ServicesA global leader in credit ratings and credit risk analysis, Standard & Poor’s Credit Market Services provides objective and independent opinions on credit risk. Standard & Poor’s public ratings opinions are dissemi-nated broadly and free of charge to recipients all over the world on www.standardandpoors.com. S&P’s worldwide ratings organization builds upon its exten-sive knowledge and deep insight through its focus on sectors, type of debt, and geographic location. Analytical teams assess issuers and debt obligations of corporations, financial institutions, insurance companies, states and municipalities, and sovereign governments, and provide insight into the credit risk associated with securitized instruments.
Standard & Poor’s Investment ServicesStandard & Poor’s Investment Services provides comprehensive, value-added financial data and fixed income research and analysis, market indices, and independent research to facilitate the understanding and management of risk, and enable investment managers, investors, and financial advisors to make informed deci-sions across many asset classes. Standard & Poor’s Investment Services consists of four areas: Valuation & Risk Strategies, Capital IQ, S&P Indices, and Equity Research Services.
McGraw-Hill Financial Services At-a-GlanceCredit Market Services
Key markets:Investors; corporations, gov-ernments, and municipalities; commercial and investment banks; insurance companies; asset managers; and other debt issuers.
Investment Services
Key markets:Asset managers; investment banks; investors; brokers; financial advisors; investment sponsors; and companies’ back-office functions, includ-ing compliance, operations, risk, clearance, and settlement.
2009 Revenue $2.6 billion
Investment Services$862 million
Transaction Revenue$539.2 million
Non-Transaction Revenue$1,209.0 million
International Revenue$832.4 million
Domestic Revenue$915.8 million
Credit Market Services$1.7 billion
Two Views of Credit Market Services Revenue
Serving the Global Capital Markets

42 The McGraw-Hill Companies
Standard & Poor’s
Standard & Poor’s Revenue 1Q 2Q 3Q 4Q % of 2009 2009 vs.(dollars in millions) 2009 2008 2009 2008 2009 2008 2009 2008 2009 Total 2008 2008
Credit Market Services $ 391.4 $ 427.3 $ 457.4 $ 507.9 $ 426.1 $ 423.2 $ 473.4 $ 396.3 $ 1,748.2 67.0% $ 1,754.8 (0.4%)Investment Services 218.8 217.0 216.4 227.6 210.9 228.2 215.8 226.7 861.9 33.0% 899.5 (4.2%)Total revenue $ 610.2 $ 644.3 $ 673.8 $ 735.5 $ 637.0 $ 651.5 $ 689.2 $ 623.1 $ 2,610.1 100.0% $ 2,654.3 (1.7%)
Two Views of Credit Market Services Revenue % of 2009(dollars in millions) 1Q 2009 2Q 2009 3Q 2009 4Q 2009 2009 Total
Transaction (a) $ 111.6 $ 146.8 $ 127.8 $ 153.0 $ 539.2 30.8%Non-Transaction (b ) $ 279.8 $ 310.6 $ 298.3 $ 320.3 $ 1,209.0 69.2%
% of 2009(dollars in millions) 1Q 2009 2Q 2009 3Q 2009 4Q 2009 2009 Total
International $ 177.9 $ 211.5 $ 209.3 $ 233.7 $ 832.4 47.6%Domestic $ 213.5 $ 245.9 $ 216.8 $ 239.7 $ 915.8 52.4%
Note: Totals for each category may not sum due to rounding(a) Transaction: Revenue related to rating new issuance of corporate, public finance, and
structured finance instruments; bank loans; and corporate credit estimates
(b) Non-transaction: Revenue from annual fees for frequent issuer programs, surveillance, and subscriptions
The complexity and growth of ever-evolving capital markets are expected to help boost the demand for S&P products and services. Markets continue to emerge while global economic expansion fuels demand for capital. For example, the increase in capital needs can be correlated to the rise in demand for S&P’s ratings. Global issuance of rated debt has grown from approximately $2.7 trillion in 1999 to $4.4 trillion in 2009. S&P continues to expand interna-tionally and to extend into new markets to capitalize on these trends.
External Factors & Environment
Bank-driven financing
Institutional investing
Equity & bonds
Deep recession
M&A and leveraged buyouts
Junk bonds
Mutual funds & indices
Financial globalization
Crash of ’87
Structured/derivatives growth
Commodities as asset class
Private equity and hedge funds
Emerging markets
Unprecedented expansion
Asian crisis
Hedge funds, venture capital, and sovereign wealth funds as major players
Rapid growth/decline of securitization
Dot-com bubble/bust
Housing bubble/bust
Financial innovation
Interdependent capital markets
Regulatory scrutiny
Return to growth in capital markets
New forms of funding (covered bonds in U.S.)
Securitization returns in simpler form
Continued growth in exchange-traded funds and derivatives
Emerging markets to outpace developed markets
Growing use of multi-asset class solutions
Standard & Poor’s Products and Services
‘Plain vanilla’ debt ratings
S&P 500® Index
Quantitative equity rankings
Ratings: Global, asset-backed securities, collateralized mortgage-backed securities, servicer evaluations
Derivatives on indices
Qualitative equity rankings
Ratings: Bank loans, rating evaluation services, covered bonds, collateralized debt obligations
SPDR exchange-traded funds
Index data platform
Equity research
Pricing & security data
Non-traditional ratings
Ratings: Recovery, LEVELS
Platforms: Capital IQ, MarketScope® Advisor, Global Credit Portal®
Portfolio analytics
Credit risk solutions
Custom, global, and non-equity indices
Customized platforms
New risk benchmarks
Multi-asset class offerings
Portfolio analytics and investment solutions
Wealth management & advisory
Real-time models & tools
Bank-Led FinancingDisintermediation & Global Growth
Global Growth & Securitization Securitization Growth Recovery & Growth
Pre-1980s 1980s 1990s 2000s 2010+
S&P: Growing with the Global Capital Markets

2010/2011 MHP Investor Fact Book 43
Financial Services
S&P Credit Market Services:Expanding World of S&P Ratings
From pre-issuance to post-issuance, financial decision makers are utilizing a growing range of S&P products and services to identify, measure, and manage credit risk. These S&P offer-ings are creating additional growth opportunities.
Globally, S&P rated more than $4 trillion in new debt and published more than 870,000 new and revised ratings in 2009
How Standard & Poor’s Plays a Role in Changing Markets
Benchmarking data, tools, and analysis help issuers and related parties analyze and gauge the ratings impact of strategic decisions
Credit ratings and rationales serve as tools to help investors during the investment process
Products and services for monitoring and modeling creditworthiness and/or transaction performance help market participants make informed decisions and evaluate ongoing risks
Representative S&P Products and Services
Small Business Portfolio Evaluator
Analytics on Demand
Rating Evaluation Service
LEVELS (Loan Evaluation and Estimate of Loss System)
CDO Evaluator
Issue Ratings
Issuer Ratings
Bank Loan and Recovery Ratings
Counterparty Credit Ratings
Market-Derived Signals
S&P ABSX
RatingsDirect® on the Global Credit Portal®
S&P Leveraged Commentary & Data
CreditMatters TV
Post-IssuancePre-Issuance Issuance
www.standardandpoors.com
S&P’s Rating Track Record: Meeting the Test of Time
(a) Average cumulative default rates are derived by calculating “conditional on survival” marginal default rates from experiences of each static pool and time horizon
(b) AAA ratings from the same transaction are treated as a single rating in the calculation of this table
Global Structured Finance Average Cumulative Default Rates 1978-2009 (%) (a, b)
Time horizon (years)Rating 1 2 3 4 5 6 7 8 9 10AAA 0.11 0.46 0.71 0.78 0.81 0.83 0.85 0.86 0.88 0.89AA 0.31 2.68 4.99 5.55 5.75 5.90 6.04 6.12 6.17 6.21A 0.64 4.45 8.48 10.10 10.62 11.05 11.52 11.85 12.03 12.21BBB 1.44 7.77 14.21 18.35 20.50 21.82 22.69 23.38 23.92 24.35BB 3.47 13.51 20.29 25.37 27.43 28.63 29.60 30.26 30.73 31.14B 8.53 21.84 30.02 36.97 41.04 43.04 44.41 45.37 46.03 46.39CCC/C 52.74 64.54 68.62 70.99 72.57 73.50 74.12 74.47 74.79 75.00Investment-grade 0.54 3.33 6.10 7.37 7.90 8.22 8.46 8.61 8.72 8.80Speculative-grade 17.67 28.15 34.57 39.63 42.20 43.57 44.58 45.28 45.77 46.11All rated 3.62 7.59 10.89 12.71 13.52 13.97 14.29 14.49 14.62 14.72
Source: Standard & Poor’s “Global Structured Finance Default Study—1978-2009: Downgrades Accelerate In 2009 Due To Criteria Changes and Credit Performance,” March 22, 2010
Global Corporate Average Cumulative Default Rates (1981-2009) (%) (a)
Time horizon (years)Rating 1 2 3 4 5 6 7 8 9 10 11 12 13 14 15AAA 0.00 0.03 0.14 0.26 0.39 0.51 0.58 0.68 0.74 0.82 0.86 0.90 0.94 1.04 1.14AA 0.02 0.07 0.14 0.24 0.33 0.43 0.52 0.60 0.67 0.74 0.81 0.87 0.93 0.98 1.02A 0.08 0.21 0.35 0.53 0.72 0.95 1.22 1.46 1.70 1.97 2.20 2.39 2.58 2.75 2.99BBB 0.26 0.72 1.23 1.86 2.53 3.20 3.80 4.40 5.00 5.60 6.21 6.72 7.24 7.80 8.36BB 0.97 2.94 5.27 7.49 9.51 11.48 13.19 14.75 16.21 17.45 18.49 19.39 20.18 20.84 21.57B 4.93 10.76 15.65 19.46 22.30 24.57 26.47 28.06 29.44 30.82 32.04 33.04 33.99 34.85 35.74CCC/C 27.98 36.95 42.40 45.57 48.05 49.19 50.26 51.09 52.44 53.41 54.32 55.33 56.38 57.28 57.28Investment-grade 0.13 0.35 0.60 0.91 1.24 1.58 1.90 2.20 2.50 2.80 3.08 3.31 3.55 3.78 4.04Speculative-grade 4.44 8.68 12.42 15.46 17.90 19.96 21.72 23.25 24.67 25.96 27.08 28.02 28.91 29.68 30.45All rated 1.63 3.23 4.67 5.89 6.90 7.79 8.55 9.23 9.86 10.45 10.97 11.40 11.82 12.20 12.60
Source: Standard & Poor’s “2009 Annual Global Corporate Default Study and Rating Transitions,” March 17, 2010
www.standardandpoors.com/ratings/default-studies/en/us
These default rate tables underscore a key point: Over time, the higher the S&P rating, the fewer defaults that have been experienced
What is an S&P credit rating?
It is an opinion about credit risk—the ability and willingness of an issuer to meet a financial obligation in full and on time. Credit ratings also indicate credit quality—the relative likelihood that an issue may default. S&P’s global ratings scale provides a benchmark for evaluating the relative credit risk of issuers and issues worldwide.
How S&P ratings perform:The tables (below) show the default rates experienced for each rating category over 30 years. For example, the 5-year cumulative default rate for corporate bonds rated AAA has been 0.39%, or less than four defaults for every 1,000 ratings. The 5-year cumulative default rate for AAA-rated structured finance issues has been 0.81%.

44 The McGraw-Hill Companies
U.S. Debt Market
875
1,750
2,625
$3,500
Rated U.S. Debt Market (a, b, c, d, e, f)
S&P penetration rate as a % of rated dollar volume
‘04 ‘05 ‘06 ‘07 ‘08 ‘09
94%94%
92% 94%
94% 95%
! S&P Rated Volume $2,197 $2,699 $3,063 $2,897 $1,409 $1,438 Rated Volume $2,332 $2,877 $3,322 $3,090 $1,504 $1,519 # of Rated Issues 15,154 15,873 15,504 14,383 10,267 11,568Source: Thomson Reuters; Harrison Scott Publications/Standard & Poor's
375
750
1,125
$1,500
Corporates (c)
S&P penetration rate as a % of rated dollar volume
‘04 ‘05 ‘06 ‘07 ‘08 ‘09
97% 98%
94%96%
96%99%
! S&P Rated Volume $675 $632 $908 $1,079 $743 $853 Rated Volume $695 $648 $963 $1,122 $776 $859 # of Rated Issues 2,092 1,783 2,075 1,861 883 1,024Source: Thomson Reuters
125
250
375
$500
Municipals (a)
S&P penetration rate as a % of rated dollar volume
‘04 ‘05 ‘06 ‘07 ‘08 ‘09
86%86%
84%83% 88%
91%
! S&P Rated Volume $318 $353 $319 $362 $368 $409 Rated Volume $369 $411 $381 $436 $420 $450 # of Rated Issues 10,782 11,514 10,157 9,946 8,926 10,172Source: Thomson Reuters
375
750
1,125
$1,500
Mortgage-Backed Securities (MBS) (b,d,f)
S&P penetration rate as a % of rated dollar volume
‘04 ‘05 ‘06 ‘07 ‘08 ‘09
94%
93% 90%
93%
88% 80%
! S&P Rated Volume $895 $1,275 $1,252 $855 $42 $48 Rated Volume $951 $1,375 $1,384 $920 $48 $60 # of Rated Issues 1,589 1,821 2,006 1,256 114 160Source: Harrison Scott Publications/Standard & Poor’s
75
150
225
$300
Asset-Backed Securities (ABS) (b,e)
S&P penetration rate as a % of rated dollar volume
‘04 ‘05 ‘06 ‘07 ‘08 ‘09
98%
99% 98% 98%
98%
86%
! S&P Rated Volume $202 $280 $264 $279 $222 $124 Rated Volume $205 $282 $270 $284 $227 $144 # of Rated Issues 338 394 433 393 243 186Source: Harrison Scott Publications/Standard & Poor's
85
170
255
$340
Collateralized Debt Obligations (CDOs) (b)
S&P penetration rate as a % of rated dollar volume
‘04 ‘05 ‘06 ‘07‘08 ‘0997%
98%
98% 98%
97% 64%
! S&P Rated Volume $108 $158 $319 $321 $33 $4 Rated Volume $111 $161 $325 $328 $34 $6 # of Rated Issues 353 361 833 927 101 26Source: Harrison Scott Publications/Standard & Poor's
Notes for debt issuance:(a) Excludes municipal student loans and private placements(b) Excludes confidential transactions(c) Includes industrial and financial services issuers. Also includes Rule 144a (private
placements), MTN takedowns, convertibles, and preferred stocks. Excludes sovereign issuers, private placements (except Rule 144a issues), retail notes, commercial paper, and all agency issues
(d) Excludes agency deals. Includes home equity loans(e) Excludes asset-backed commercial paper and letters of credit(f) Includes commercial mortgage-backed securities and residential mortgage-backed
securities; includes U.S. CRE CDOs
In 2009, Standard & Poor’s rated approximately 95% of the $1.5 trillion of addressable debt issued in the U.S. market compared to 94% of the addressable market in 2008. S&P experienced declines in market penetration in U.S. ABS, CDOs, and MBS primarily due to the revision of key criteria in 2009. The strengthening of criteria to enhance stability, transparency, comparability, and to make criteria more forward-looking may have led to some share declines as investors evaluate the new crite-ria. It will be more difficult for securities in the areas that have performed poorly in the past to achieve the highest ratings. Finally, proactive inter-pretation of proposed regulatory changes affecting the FDIC Safe Harbor Rule for credit card securitizations and the trend toward single ratings also adversely affected penetration for certain asset classes.
(annual figures; dollar volume in billions; data by domicile of issuer/assets)The rated debt market is a component of the total debt market and includes only the debt securities issued with a rating. The rated U.S. debt market chart above is comprised of five new-issue categories:
(1) Corporates(2) Municipals(3) Mortgage-Backed Securities (Residential Mortgage-Backed Securities and Commercial
Mortgage-Backed Securities)(4) Asset-Backed Securities(5) Collateralized Debt Obligations

2010/2011 MHP Investor Fact Book 45
Financial Services
European and Asian Debt Markets
625
1,250
1,875
$2,500
Rated European Debt Market (a, b, c, d, e, f)
S&P penetration rate as a % of rated dollar volume
‘04 ‘05 ‘06 ‘07 ‘08 ‘09
84%81%
82% 80%
81%
90%
! S&P Rated Volume $1,174 $1,352 $1,805 $1,719 $1,088 $1,534 Rated Volume $1,397 $1,673 $2,203 $2,150 $1,343 $1,702 # of Rated Issues 4,040 4,309 5,168 4,419 2,522 2,236Source: Thomson Reuters; Harrison Scott Publications/Standard & Poor's
Notes for debt issuance:(a) Excludes confidential and repo transactions(b) Includes industrial and financial services issuers. Also includes Rule 144a (private
placements), MTN takedowns, convertibles, and preferred stocks. Excludes sovereign issuers, private placements (except Rule 144a issues), retail notes, commercial paper, and all agency issues
(c) Excludes asset-backed commercial paper and letters of credit(d) Includes home equity loans(e) European data includes Middle East and Africa regions(f) Includes commercial mortgage-backed securities and residential mortgage-backed
securities
European Region Debt MarketIn 2009, Standard & Poor’s rated approximately 90% of the $1.7 trillion of addressable debt issued in the European market, which includes the Middle East and Africa. Rated debt issuance in the region grew 27% from 2008 to 2009, while Standard & Poor’s rated approximately 41% more addressable debt in 2009 than it did in 2008.
Asia-Pacific Region Debt MarketIn 2009, rated debt issue volume for corporates in Asia was $268 billion, up 34% from 2008. Standard & Poor’s 2009 market penetration was 88% for corporates, compared to 81% in 2008. For structured finance, even though rated issuance was down 19% from 2008, Standard & Poor’s rated approximately 72% of that volume, up from 62% in 2008.
500
1,000
1,500
$2,000
European Corporates (b,e)
S&P penetration rate as a % of rated dollar volume
‘04 ‘05 ‘06 ‘07 ‘08 ‘09
83% 82%81% 85%
83%
90%
! S&P Rated Volume $ 847 $ 925 $1,177 $1,144 $ 983 $1,480 Rated Volume $1,016 $1,133 $1,448 $1,342 $1,182 $1,638 # of Rated Issues 3,106 3,223 3,746 3,341 2,202 2,134Source: Thomson Reuters
150
300
450
$600
European Mortgage-Backed Securities (MBS) (a,d,e,f)
S&P penetration rate as a % of rated dollar volume
‘04 ‘05 ‘06 ‘07‘08 ‘0984%
79%
86%67%
62% 92%
! S&P Rated Volume $172 $257 $436 $375 $58 $42 Rated Volume $204 $326 $507 $559 $92 $45 # of Rated Issues 196 286 405 317 108 49Source: Harrison Scott Publications/Standard & Poor’s
40
80
120
$160
European Asset-Backed Securities (ABS) (a,c,e)
S&P penetration rate as a % of rated dollar volume
‘04 ‘05 ‘06 ‘07 ‘08‘09
86%85% 81% 79%
68% 67%
! S&P Rated Volume $81 $ 95 $ 98 $ 90 $22 $11 Rated Volume $95 $112 $122 $113 $33 $17 # of Rated Issues 100 140 209 165 106 44Source: Harrison Scott Publications/Standard & Poor's
40
80
120
$160
European Collateralized Debt Obligations (CDOs) (a,e)
S&P penetration rate as a % of rated dollar volume
‘04 ‘05 ‘06 ‘07 ‘08 ‘09
88% 73%75%
81%
69% 65%
! S&P Rated Volume $73 $ 75 $ 94 $110 $25 $1 Rated Volume $83 $102 $126 $137 $36 $2 # of Rated Issues 638 660 808 596 106 9Source: Harrison Scott Publications/Standard & Poor's
75
150
225
$300
Asian Corporates (b)
S&P penetration rate as a % of rated dollar volume
‘04 ‘05 ‘06 ‘07 ‘08 ‘09
90%92%
86%84% 81%
88%
! S&P Rated Volume $118 $142 $177 $149 $161 $236 Rated Volume $131 $154 $205 $177 $200 $268 # of Rated Issues 635 740 842 995 850 794Source: Thomson Reuters
50
100
150
$200
Asian Structured Finance (a,c,b)
S&P penetration rate as a % of rated dollar volume
‘04 ‘05 ‘06 ‘07 ‘08 ‘09
76%71%
83%
80% 62% 72%
! S&P Rated Volume $65 $ 89 $139 $105 $45 $42 Rated Volume $85 $125 $167 $131 $72 $58 # of Rated Issues 351 415 461 497 341 225Source: Harrison Scott Publications/Standard & Poor's
(annual figures; dollar volume in billions; data by domicile of issuer/assets)

46 The McGraw-Hill Companies
Ratings Diversification
80
160
240
320
Counterparty Ratings*Total Outstanding Ratings
Ratings 270 268 283 284 289 295* Total for those organizations whose only rating is a Counterparty Rating
‘07‘06‘05‘04 ‘08 ‘09625
1,250
1,875
2,500
Financial Strength Ratings*Total Outstanding Ratings
Ratings 1,617 1,730 1,924 1,972 2,080 2,093
* Formerly Claims-Paying Ability Ratings
‘07‘06‘05‘04 ‘08 ‘09
750
1,500
2,250
3,000
Global Bank Loan RatingsTotal Outstanding Ratings
! U.S. 1,079 1,079 1,481 1,357 2,105 2,101! Europe 203 217 291 274 385 456! Rest 130 133 182 218 297 416 Total 1,412 1,429 1,954 1,849 2,787 2,973
‘07‘06‘05‘04 ‘08 ‘09
80
160
240
320
Corporate Credit Ratings*Total Outstanding Ratings
Ratings 220 223 228 239 242 231* Total for those organizations whose only rating is a Counterparty RatingSource: Standard & Poor's
‘07‘06‘05‘04 ‘08 ‘09
100
200
300
400
Rating Evaluation ServiceEvaluations
Eval. 231 196 220 270 210 220Source: Standard & Poor's
‘07‘06‘05‘04 ‘08 ‘09125
250
375
500
Servicer EvaluationsEvaluations
Eval. 309 337 379 420 438 386Source: Standard & Poor's
‘07‘06‘05‘04 ‘08 ‘0940
80
120
160
Sovereign RatingsRatings
Ratings 107 109 114 117 123 124Source: Standard & Poor's
‘07‘06‘05‘04 ‘08 ‘09
Standard & Poor’s continues to diversify its business beyond new bond ratings. Product expansion has reduced S&P’s reliance on bond issuance or interest-rate sensitive businesses by expanding offerings in such areas as bank loan and recovery ratings, counterparty ratings, and financial strength ratings. S&P also offers evaluations, including Rating Evaluation Services, which assess how actions may affect creditworthiness, and Servicer Evaluations, which assess a company’s operational capability to service loan and asset portfolios.
Sovereign RatingsStandard & Poor’s is a global leader in providing ratings and credit-related services for sovereign, sovereign-supported entities, and supranational issuers. Public sector coverage extends to local and regional governments, as well as to the healthcare, higher educa-tion, and housing sectors around the world. S&P’s network of offices around the globe enables its regionally-based analysts to gain valu-able local insights into the governments and issuers they rate.
EvaluationsRating Evaluation Service: A confidential, indicative assessment of how potential acquisi-tions, debt issues, stock repurchases, recapitalizations, consolidations, and other actions may impact a company’s creditworthiness and credit rating.Servicer Evaluations: An independent, objective view of a company’s operational capability to service loan and asset portfolios. The Servicer Evaluation rankings serve as consistent, objective benchmarks for assessing operational risk that provide valuable transparency and enable global market participants to make informed decisions.
RatingsFinancial Strength, Counterparty, and Corporate Credit Ratings: An opinion of an entity’s overall creditworthiness and capacity to pay its financial obligations. These ratings do not apply to specific financial obligations.Bank Loan Ratings: An evaluation of a syndicated loan based on the likelihood of ultimate repayment of the loan and on the recovery value in the event of default.Recovery Ratings: A stand-alone, transparent opinion of the likely recovery of a loan in the event of default; expressed on a numerical scale—not linked to or limited by the issuer’s traditional corporate credit rating. S&P’s recovery ratings cover secured and unsecured debt.
300
600
900
1,200
Recovery RatingsDistribution of All Recovery Ratings Total Rated: 5,101
% 0.39 18.19 15.90 23.31 14.92 9.21 18.07Rating 1+ 1 2 3 4 5 6
! Secured Recovery Ratings ! Unsecured and Subordinated Recovery Ratings
Standard & Poor’s Recovery Recovery Rating and Description Expectations*1+ Highest expectation of full recovery 100%**1 Very high recovery 90-100%2 Substantial recovery 70-90%3 Meaningful recovery 50-70%4 Average recovery 30-50%5 Modest recovery 10-30%6 Negligible recovery 0-10%
As of April 7, 2010* Recovery of principal plus accrued but unpaid interest
at the time of default** Very high confidence of full recovery resulting from sig-
nificant overcollateralization or strong structural features

2010/2011 MHP Investor Fact Book 47
Financial Services
S&P Investment Services: Contributing to Transparent, Efficient Financial Markets
Standard & Poor’s Investment Services offers a spectrum of modular and integrated products and services that contribute to transparent, efficient markets and meet the specific needs of the global investment community. From value-added data and information to insightful analysis, research and models, information is delivered via client-integrated workflow platforms, specific applications, and data feeds that clients can customize to meet their specific distribution requirements.
Standard & Poor’s Investment Services consists of four areas:
Valuation & Risk Strategies Capital IQ S&P Indices
Equity Research Services
Description Offers a broad suite of cross-asset risk analytics, market research services and data sets that are used by institutional investors for risk mitigation, cost control and alpha-generation.
Provides high-impact information, fundamental analysis, and workflow solutions to over 4,200 leading financial institu-tions, advisory firms, and corporations.
Offers investment profes-sionals around the world an array of choices, from broad comprehensive benchmarks to liquid, investable indices.
Provides actionable, multi-asset class global research to wealth manage-ment institutions and financial advisors.
Example Products and Services
RatingsDirect® on the Global Credit Portal®
Securities classifications and intrinsic valuations
Market, credit, and risk strategies
Credit risk and structured finance analysis
Capital IQ Platform
Xpressfeed
Compustat®
ClariFI®
Alphaworks
S&P 500®
S&P/Case-Shiller® Home Price Indices*
S&P GSCI® Commodities
S&P Credit Default Swap U.S. Indices
S&P/Experian Consumer Credit Default Indices
S&P Global BMI
S&P Index Data Platform
S&P Custom Indices
MarketScope® Advisor
Stock research and tools
Fund management ratings
Exchange-traded fund research and tools
Mutual fund research and tools
Portfolio tools
Creating a Global Standard Global Industry Classification Standard (GICS®)
GICS® is an enhanced industry classification system that was jointly developed by Standard & Poor’s and MSCI Barra in 1999. Developed in response to the global financial community’s need for one complete, consistent set of global sector and industry defini-tions, GICS® has become a standard that is widely recognized by market participants worldwide. It sets a foundation for the creation of replicable, custom-tailored portfolios and enables meaningful comparisons of sectors and industries globally. More than 40,000 companies worldwide are classified in accordance with GICS®, with each company classi-fied at the sub-industry level.
10 Sectors
24 Industry Groups
68 Industries
154 Sub-Industries
* Case-Shiller® and Case-Shiller Indexes® are registered trademarks of Fiserv, Inc.

48 The McGraw-Hill Companies
Valuation & Risk Strategies
Standard & Poor’s Valuation & Risk Strategies’ products and services serve the global financial markets by providing financial market intelligence and analytic insight for risk-driven investment analysis within the debt, structured finance, derivative, and credit markets.
Global Credit Portal® (GCP)
Dynamic Web-based platform that leverages the latest content and technology to give subscribers real-time access to the integrated credit research, market information, and risk analytics needed to help assess exposure and capitalize on investment opportunities.
Global Data Solutions
High-quality, multi-asset class and market data designed to help investors meet the new analytical, risk management, regulatory, and front- to back-office operations requirements.
Credit Risk Solutions
Helps institutions worldwide manage, measure, and mitigate credit risk, and make informed decisions that can improve risk-adjusted return.
Valuations & Research
A wide range of valuation capabilities ranging from market-based pricing and intrinsic valuations to quantitative assessments of illiquid securities that address investor requirements for risk mitigation, alpha generation, and cost control around the valuation of assets.
Market research and analyses that incorporate multiple aspects of securities pricing to develop new research methodologies. Specifically, the Risk-to-Price methodology captures both credit and market risk components of price resulting in innovative cross-asset risk benchmarks.
CUSIP® Global Services (CGS)
CUSIP is the universally-accepted standard for uniquely classifying financial instruments across institutions and exchanges worldwide. With more than 40 years in the securities identification business, CGS provides a unique common language for over 9.1 million financial instruments.
S&P Leveraged Commentary & Data (LCD)
Unique insight into the leveraged loan market that is delivered through a combination of data, analysis, commentary, and real-time news.
S&P ABSX Provides analytical modeling and data capabilities for performing credit, cash flow, and detailed asset analysis for RMBS, ABS, CMBS and CDO structured finance securities and whole loans in the European markets. Assorted tools support portfolio performance monitoring, risk management, scenario-based valuation, and pricing analysis.
Three core offerings:
RatingsDirect® which provides real-time access to integrated credit research and analysis from Standard & Poor’s Ratings
Proprietary comparative fundamental, market, and credit analytics devel-oped by the GCP team (independent from Ratings) that extend beyond the rated universe globally
Research, commentary, and analytics from Market, Credit and Risk Strategies, an independent group that is charged with helping investors better under-stand cross-market and cross-asset class valuations and relationships across all asset classes
Features include:
Aggregated intelligence at the sector, sub-sector, and industry level
Deep information at the entity, instrument, deal, and security level
Additional perspectives from Standard & Poor’s Market, Credit and Risk Strategies; Global Fixed Income Research; and Market Derived Signals
Graphs, charts, and tools to quickly view and assess the latest credit developments, including credit default swap spreads
Options to personalize views, integrate third-party feeds, and share information
Specialized content/data set offerings include:
Credit Ratings and Credit Research via RatingsXpress: Global credit ratings cover-age of more than 8,700 global issuers; 600 sovereign and U.S. public finance entities; 21,000 structured finance transactions; and nearly a million maturities
Fixed Income Terms & Conditions: Real-time fixed income terms and conditions on more than 2 million global fixed income securities (via S&P Securities DataManager®) and bond notification services for U.S. municipals and U.S. bonds
Identifiers and Cross Referencing: Compre-hensive reference data matching services, including Security to Entity CrossWalk®; Associated Obligor; and ISIDPlus
Structured Finance Data: U.S. RMBS loan-level data feed on nearly 4,000 transactions
S&P’s Valuations & Research provides pricing data for more than 3 million global fixed income securities as well as market-based assumptions used in the price generation of 1.4 million structured finance securities
Global Credit Portal: Efficient credit risk-driven analysis and alpha discovery

2010/2011 MHP Investor Fact Book 49
Financial Services
Capital IQ
Capital IQ delivers comprehensive fundamental and quantitative research and analysis solutions to more than 4,200 investment managers, investment banks, private equity funds, advisory firms, corporations, and universities worldwide. The Capital IQ Platform, Xpressfeed, Compustat, ClariFI, Alpha-works, and Money Market Directories (MMD) products offer a variety of powerful applications for desktop research, screening, real-time market data, backtesting, portfolio management, financial modeling, and quantitative analy-sis. Capital IQ’s product suite empowers clients to reduce risk, become more efficient, and make better decisions.
Capital IQ Platform Robust information for fundamental analysis, screening, and more
Xpressfeed Integrated delivery of the world’s leading data set for quantitative research
Compustat Covering 99% of the world’s market capitalization with data on more than 68,000 global securities, Compustat is the premier global fundamental database for backtesting and other quantitative analysis
ClariFI Advanced alpha research and portfolio management platform for investment managers
Alphaworks Quantitative research to uncover market anomalies and differentiated stock selection strategies
Money Market Directories
Comprehensive information resource tailored specifically for marketing to institutional investors
Capital IQ’s Compustat won the Inside Market Data award for “Best Analytics Provider” in 2010
Capital IQ Platform: Powering the People Who Drive the Financial Markets
Global Company Fundamentals: Research 59,000 public companies, more than 1.9 million private companies, and 16,000 private equity firms
Research Estimates: View detailed estimates and real-time research on more than 19,000 companies
Research Reports: Access more than 10 million documents from 1,000 brokerage and research providers via AfterMarket Research (AMR)
Screening and Targeting: Build lists of companies, stocks, deals, and more with over 4,700 financial and 1,200 qualitative criteria
Fixed Income: Access details on securities, ratings, capital structure, and more on almost 400,000 global fixed income securities
Global Transactions Data: Analyze more than 400,000 M&A and private/public capital market transactions
Capital IQ Real-Time: Get streaming market data and news
ClariFI: Streamline Alpha Generation with Powerful Analytics
Capital IQ’s ClariFI is an advanced alpha research and portfolio management platform. The world’s leading invest-ment management firms, hedge funds, and proprietary trading desks at sell-side firms use ClariFI to quickly and easily research, test, and implement strategies that outperform the market.
Alphaworks: Advanced Online Factor Library
Alphaworks is a Web-based market analysis and research tool, updated daily to provide statistical profiles, definitions, and ongoing performance for hundreds of quantitative stock selection signals. With direct links to ClariFI, this online encyclopedia houses the latest thinking on factor research and multi-factor modeling.
Advanced Data Integration-Data Standardization-ID Mapping-QA
Capital lQ Desktop Applications-Capital IQ-ClariFI-Alphaworks
Client Systems-Client Database-Client Application
Capital IQ Data
Compustat Data
via Xpressfeed
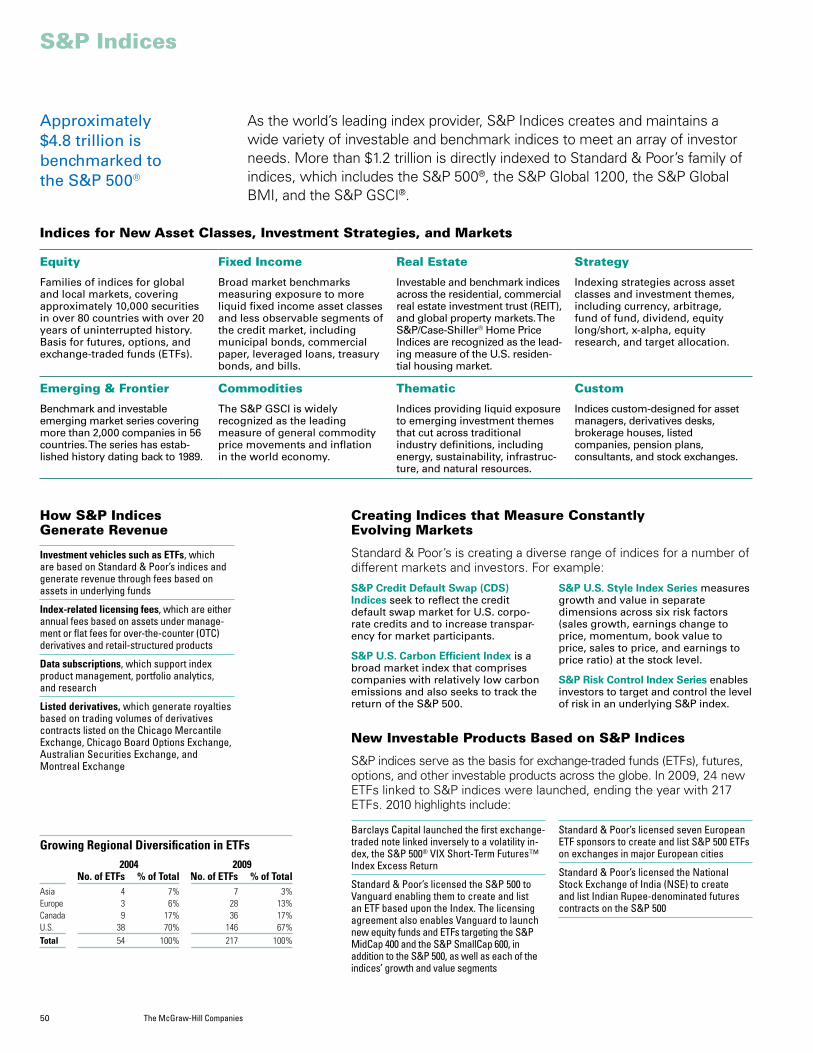
50 The McGraw-Hill Companies
S&P Indices
As the world’s leading index provider, S&P Indices creates and maintains a wide variety of investable and benchmark indices to meet an array of investor needs. More than $1.2 trillion is directly indexed to Standard & Poor’s family of indices, which includes the S&P 500®, the S&P Global 1200, the S&P Global BMI, and the S&P GSCI®.
How S&P Indices Generate Revenue
Investment vehicles such as ETFs, which are based on Standard & Poor’s indices and generate revenue through fees based on assets in underlying funds
Index-related licensing fees, which are either annual fees based on assets under manage-ment or flat fees for over-the-counter (OTC) derivatives and retail-structured products
Data subscriptions, which support index product management, portfolio analytics, and research
Listed derivatives, which generate royalties based on trading volumes of derivatives contracts listed on the Chicago Mercantile Exchange, Chicago Board Options Exchange, Australian Securities Exchange, and Montreal Exchange
Approximately $4.8 trillion is benchmarked to the S&P 500®
Indices for New Asset Classes, Investment Strategies, and Markets
Equity
Families of indices for global and local markets, covering approximately 10,000 securities in over 80 countries with over 20 years of uninterrupted history. Basis for futures, options, and exchange-traded funds (ETFs).
Fixed Income
Broad market benchmarks measuring exposure to more liquid fixed income asset classes and less observable segments of the credit market, including municipal bonds, commercial paper, leveraged loans, treasury bonds, and bills.
Real Estate
Investable and benchmark indices across the residential, commercial real estate investment trust (REIT), and global property markets. The S&P/Case-Shiller® Home Price Indices are recognized as the lead-ing measure of the U.S. residen-tial housing market.
Strategy
Indexing strategies across asset classes and investment themes, including currency, arbitrage, fund of fund, dividend, equity long/short, x-alpha, equity research, and target allocation.
Emerging & Frontier
Benchmark and investable emerging market series covering more than 2,000 companies in 56 countries. The series has estab-lished history dating back to 1989.
Commodities
The S&P GSCI is widely recognized as the leading measure of general commodity price movements and inflation in the world economy.
Thematic
Indices providing liquid exposure to emerging investment themes that cut across traditional industry definitions, including energy, sustainability, infrastruc-ture, and natural resources.
Custom
Indices custom-designed for asset managers, derivatives desks, brokerage houses, listed companies, pension plans, consultants, and stock exchanges.
S&P Credit Default Swap (CDS) Indices seek to reflect the credit default swap market for U.S. corpo-rate credits and to increase transpar-ency for market participants.
S&P U.S. Carbon Efficient Index is a broad market index that comprises companies with relatively low carbon emissions and also seeks to track the return of the S&P 500.
S&P U.S. Style Index Series measures growth and value in separate dimensions across six risk factors (sales growth, earnings change to price, momentum, book value to price, sales to price, and earnings to price ratio) at the stock level.
S&P Risk Control Index Series enables investors to target and control the level of risk in an underlying S&P index.
Creating Indices that Measure Constantly Evolving Markets
Standard & Poor’s is creating a diverse range of indices for a number of different markets and investors. For example:
New Investable Products Based on S&P Indices
S&P indices serve as the basis for exchange-traded funds (ETFs), futures, options, and other investable products across the globe. In 2009, 24 new ETFs linked to S&P indices were launched, ending the year with 217 ETFs. 2010 highlights include:
Barclays Capital launched the first exchange-traded note linked inversely to a volatility in-dex, the S&P 500® VIX Short-Term Futures™ Index Excess Return
Standard & Poor’s licensed the S&P 500 to Vanguard enabling them to create and list an ETF based upon the Index. The licensing agreement also enables Vanguard to launch new equity funds and ETFs targeting the S&P MidCap 400 and the S&P SmallCap 600, in addition to the S&P 500, as well as each of the indices’ growth and value segments
Standard & Poor’s licensed seven European ETF sponsors to create and list S&P 500 ETFs on exchanges in major European cities
Standard & Poor’s licensed the National Stock Exchange of India (NSE) to create and list Indian Rupee-denominated futures contracts on the S&P 500
Growing Regional Diversification in ETFs 2004 2009 No. of ETFs % of Total No. of ETFs % of TotalAsia 4 7% 7 3%Europe 3 6% 28 13%Canada 9 17% 36 17%U.S. 38 70% 146 67%Total 54 100% 217 100%

2010/2011 MHP Investor Fact Book 51
Financial Services
75
150
225
$300
S&P Index-Based Global ETF Assets(dollars in billions)
‘99‘98‘00 ‘01 ‘02 ‘03 ‘04 ‘05 ‘06 ‘07 ‘08 ‘09
Dollars $14.1 $24.7 $38.2 $49.0 $63.2 $79.8 $113.7 $135.1 $161.2 $235.3 $203.6 $247.0
Source: Standard & Poor's: 1998-2005; Bloomberg: 2006-2009
Record-Level ETFs Linked to S&P Indices
Exchange-traded funds (ETFs)—which represent share owner-ship of an index fund but trade like shares of stocks—have become some of the most actively-traded securities on stock markets around the world. Standard & Poor’s has been at the forefront of ETF development since the launch of the S&P 500 SPDR (Standard Poor’s Depositary Receipts) in 1993.
30
60
90
$120
75,000
150,000
225,000
300,000
SPDR Trust Value/Average Daily Trading Volume(dollars in billions) (shares in thousands)
! Dollars $12.2 $19.8 $25.5 $30.4 $39.3 $43.1 $54.8 $59.5 $64.1 $100.1 $93.9 $84.9
! Shares 7,434 7,239 7,671 13,803 33,881 41,121 42,965 61,673 70,105 156,073 301,627 247,061
Source: American Stock Exchange
‘02 ‘03 ‘04 ‘05 ‘06 ‘07 ‘08 ‘09‘99‘98
‘00 ‘01
9
18
27
$36
70,000
140,000
210,000
280,000
Select Sector SPDR Trust Value/Average Daily Trading Volume*(dollars in billions) (shares in thousands)
! Dollars $0.5 $2.6 $2.4 $3.6 $3.3 $6.2 $9.4 $12.8 $17.7 $26.5 $23.1 $31.4
! Shares 0.4 1,380 2,185 2,690 5,200 5,201 9,800 30,460 45,208 91,163 260,952 233,390
Source: American Stock Exchange* Select Sector SPDRs started trading December 22, 1998
‘05 ‘06 ‘07 ‘08 ‘09‘99‘98 ‘02
‘03 ‘04‘00 ‘013
6
9
$12
2,000
4,000
6,000
8,000
MidCap SPDR Trust Value/Average Daily Trading Volume*(dollars in billions) (shares in thousands)
! Dollars $1.5 $2.3 $3.9 $4.8 $5.1 $6.4 $7.8 $8.9 $8.6 $10.3 $6.8 $8.5
! Shares 400 846 843 1,055 1,525 1,037 1,248 1,908 2,598 4,674 7,540 5,392
Source: American Stock Exchange* MidCap SPDRS (MDY) started trading May 4, 1995
‘03 ‘04 ‘05 ‘06 ‘07 ‘08 ‘09‘02‘99 ‘00 ‘01‘98
50
100
150
$200
S&P 500 Option Contracts Traded on the CBOE(contracts in millions)
‘99‘98 ‘00 ‘01 ‘02 ‘03 ‘04 ‘05 ‘06 ‘07 ‘08 ‘09Options 25.7 24.7 23.3 24.3 29.9 36.8 49.5 71.8 104.3 158.1 179.0 154.9
Source: Chicago Board Options Exchange
175
350
525
$700
S&P 500 Futures and "E-mini 500"* Contracts Traded on the CME(contracts in millions)
‘99‘98 ‘00 ‘01‘02
‘03 ‘04‘05
‘06
‘07
‘08‘09
! Futures 31.4 27.0 22.5 22.5 23.7 20.2 16.2 15.4 14.8 15.8 16.7 10.4
! E-mini 4.5 11.0 19.2 39.4 115.7 161.2 167.2 207.1 257.9 415.3 631.6 556.3
Source: Chicago Mercantile Exchange* E-mini 500 contracts started trading on September 9, 1997
35
70
105
$140
Growth in ETF Assets Based on S&P Indices(assets under management, dollars in billions)
‘04 ‘09! ETFs based on S&P 500 $67.5 $121.5
! ETFs based on other S&P indices $48.0 $125.6

52 The McGraw-Hill Companies
S&P Equity Research Services
Standard & Poor’s serves clients across the globe in every segment of the institutional and retail financial sectors through three main areas:
Global Equity Research Standard & Poor’s Equity Research provides a single authoritative source of unbiased independent equity analysis and opinion. A world-wide team of more than 85 equity analysts provides qualitative and quantitative coverage of approximately 14,000 stocks globally. Neither Standard & Poor’s nor its parent company, The McGraw-Hill Companies, conducts any investment banking or securities underwriting activities. The independence allows Standard & Poor’s to render uncompromised equity opinions and recommendations.
Standard & Poor’s provides multi-asset class global research, analysis, strategies, and services to all levels of wealth management institutions as well as financial advisors. S&P leverages its insight into securities with unique holdings-level analysis of investment products, providing more transparency and deeper understanding of performance. S&P covers a range of asset classes including equities, exchange-traded funds, mutual funds, variable annuities, and options.
Fund Management Ratings Provided to the investing public on behalf of asset managers, Standard & Poor’s fund management ratings offer a unique combination of qualitative and quantitative analysis to identify funds that are likely to consistently achieve their objectives. These ratings are based on in-depth interviews with fund management, focusing on investment philosophy, effective-ness of management, and quality of overall investment process.
S&P Investment Advisory Services
Standard & Poor’s leverages its intellectual capital to create model port-folios and customized investment solutions and strategies for leading asset management, mutual fund, and insurance firms, among others. Working with clients’ requirements, S&P performs independent analy-sis and creates custom-tailored recommendations.
Dedicated to providing clients with timely, objective, and actionable investment intelligence, Standard & Poor’s Equity Research Services delivers a broad range of strategies and recommendations which enables clients to navigate and seek success in even the most complex global markets.
MarketScope Advisor (MSA) is a browser-based platform that provides financial professionals with invest-ment intelligence on multiple asset classes and comprehensive portfolio analysis tools. Providing insight and research to U.S.- and European-based wealth managers, MSA enables professionals to stay connected to the market, make investment decisions, and grow their practice.
Professionals have access to:
S&P’s award-winning investment research
Intra-day market commentary, news, and analy-sis, customizable for U.S. and European users
Information on 14,000 stocks and almost 900 U.S.-based exchange-traded funds; qualitative coverage of 2,000 funds and quantitative coverage on more than 21,000 U.S. mutual funds; more than 200,000 bond issues; and more than 55,000 variable annuity sub accounts from over 1,500 policies
Workflow utilities including alerts, securities tracking, and portfolio analysis tools
MarketScope® Advisor
S&P Equity Research had five winners in The Wall Street Journal’s 2010 “Best on the Street” Analysts Survey of top ranking analysts, and was the top-ranked independent research firm

2010/2011 MHP Investor Fact Book 53
The McGraw-Hill Information & Media segment provides industry-leading intelligence, bench-marks, analytics, and solutions that enable business professionals and other consumers to make better decisions. Its market-leading brands have a common focus: generating growth opportunities by integrating into customers’ workflows and infrastructure.
Information & Media
Transactional, one-way customer relationshipsStrong, media-specific brandsTraditional awareness advertising revenue modelsData pushed to customersProduct-focused technologyLong product shelf life
Legacy Model
Value-added customer relationshipsDevelop communities
Brand leadership supports entry into adjacent marketsIncreased quality lead generation Marketing intelligence through mea-surable advertising effectivenessNew ways to monetize audiencesValue-added analytical services integrated with customer applicationsProduce modular content
User-centric platforms
Customized experiences
Today’s Model
Information & MediaAt-a-GlanceBusiness-to-Business Group (B2B)
Key markets:Professionals and corporate executives in automotive, aerospace and defense, construction, and energy. Global business and financial professionals, investors, marketers, advertisers, and consumers worldwide.
Broadcasting Group
ABC affiliates:KMGH-TV (Denver, CO) KGTV (San Diego, CA) KERO-TV (Bakersfield, CA) WRTV (Indianapolis, IN)
Azteca America affiliates (low-powered stations):KZCS-TV (Colorado Springs, CO) KZCO-TV (Denver, CO) KZFC-TV (Fort Collins, CO) KZKC-TV (Bakersfield, CA) KZSD-TV (San Diego, CA)
Key markets:Television audiences in Denver and Colorado Springs, Colorado; Indianapolis, Indiana; San Diego and Bakersfield, California
Information & Media is deeply engaged in social media—Twitter, Facebook, LinkedIn, YouTube, and more—cementing relationships with customers and extending its brands
McGraw-Hill Construction provides project data in a variety of pay-as-you-go options, putting this key data in the reach of small- and medium-sized companies
J.D. Power’s new Acutrend platform allows customers to perform detailed analysis against industry benchmarks and their own proprietary data, receive timely alerts, and identify key strengths and opportunities for improvement
Examples of Today’s Model
Framework for GrowthBy strengthening its technology infrastructure with common capabilities, Information & Media is creating a framework to reshape its business and deliver premium services that transform data into valuable insights.
Develop communities
Produce modular content
User-centric platforms
Providing Valuable Insights to Global Markets

54 The McGraw-Hill Companies
Platts: Meeting the Information Needs of the Global Energy and Metals Markets
Platts is a leading global provider of energy and metals information. Its real-time news, price assessments, market commentary, and conferences enable thousands of traders, risk managers, analysts, and industry leaders in more than 150 countries to make informed and up-to-the-minute trading and invest-ment decisions. An independent provider, Platts has been a respected source for actionable information and global benchmarks for more than a century.
More than half of Platts’ revenue is derived outside the United States
For its size, Platts is The McGraw-Hill Companies’ most global business
Platts is noted for facilitating price discovery and transparency in the commodity markets it covers. Every day, Platts collects details on bids, offers and completed trades from market participants. Platts then uses clearly defined methodologies to assess and publish prices for the markets it serves. More than 8,500 price assessments, references and indexes are produced daily and disseminated to subscribers through Platts’ newsletters and real-time alert services.
OilNatural GasElectricityCoalNuclearPetrochemicalsMetalsFreightRenewablesEmissions
Platts’ Industry Coverage
How the Market Uses a Platts Price Assessment
Platts’ price assessments are the basis for billions of dollars of transactions annually in the physical and futures markets.
Buyers and sellers use them as a basis for pricing spot transactions and term contracts
Risk managers use them to settle contracts and to place a market value on the product they hold
Analysts use them to identify trends and patterns in supply and demand
Governments use them to set royalty payment and retail prices
Exchanges and investors use them to price over-the-counter derivatives contracts
Platts is boosting its presence in the Middle East by expanding its editorial and sales staff, and deepening its penetration in the Chinese market through a distri-bution partnership with a leading local information provider.
Platts continually develops new price assessments to address new market realities and bring greater transparency and efficiency to rapidly changing markets:
• Platts’ new assessments for crude flowing through the Eastern Siberian Pacific Ocean
Expanding Its Presence and Price Assessments to Address Evolving Market Needs
(ESPO) pipeline to Asia reflect the changing dynamics of Rus-sian oil exports.
• New daily price points for Indian oil product exports and imports of liquefied natural gas (LNG) underscore India’s growing role in the global energy markets.
• Platts’ new assessments for coking coal in Asia-Pacific and its well-established prices for iron ore imported into China provide miners and steel mills with key independent references as the market shifts from long-term to spot pricing.

2010/2011 MHP Investor Fact Book 55
Information & Media
Trading Workflow
Develop Trading Strategy Find Trading Partners Execute Trades Settle Trades
Risk Management Workflow
Manage Trading Compliance Manage Price, Asset and Credit Risk
Develop Risk Hedging Strategies Analyze Forward Markets
The strength of Platts’ “benchmarks” has resulted in customers embedding its information directly into their workflows. These price assessments support end-to-end trading and risk management workflows, enabling customers to identify opportunities to profit from market movements and better manage their risks.
Embedded in the Industry’s WorkflowsFor many commodities, Platts’ price assessments are considered “benchmarks”for setting prices and monitoring risk
Platts offers news, pricing information, and market commentary across multiple commodity sectors. Content is delivered online to customers as real-time alerts, end-of-day data feeds, and PDF newsletters.
Delivery options include:
Real-time alerts via Platts on the Net, Platts’ proprietary platform, and multiple third-party market data service vendors, including Thomson Reuters and Bloomberg®
End-of-day prices fed directly into customers’ risk management and accounting systems
Flexible Digital Delivery Options for Platts’ News and Pricing Information
Platts Editorial Window, or eWindow, is an online communications tool used during Platts’ Market-on-Close (MOC) price assessment process in several regional commodity markets. Nearly all MOC participants use it rather than traditional telephone and instant messaging tools.
eWindow enables:
Traders to convey bids, offers, and other deal information directly to the marketplace and to Platts’ editors simultaneously
MOC participants to clearly view all bids and offers, and submit and confirm bids and offers at the click of a mouse
Employing Technology to Improve Processes and Better Serve Customers

56 The McGraw-Hill Companies
Construction: Connecting People, Projects, and Products Worldwide
Serving more than one million customers within the $5.6 trillion global construction community, McGraw-Hill Construction is the leading provider of construction information, intelligence, business data, and media. McGraw-Hill Construction’s vital information helps owners, architects, contractors, subcontractors, building product manufacturers, distribu-tors, dealers, and suppliers Get Smart, Get Found, Find Work, and Do Work using the trusted tools, resources, and services that McGraw-Hill Construction has provided to construction professionals for more than 100 years. Its industry-leading brands—Dodge, Sweets, Architectural Record, Engineering News-Record (ENR), GreenSource, and regional media—provide the information and tools that connect people, projects, and products across the global design and construction industry.
Do WorkCustomers can save money, increase productivity, and reduce risk through digital design and construction tools.
Project Document Manager provides the architecture, engineering, and construction (AEC) community with the ability to digitally manage all of their project documents over the entire lifecycle of a project on a single, secure platform.
BIM (Building Information Modeling) is a key industry trend and McGraw-Hill Construction is providing its customers with access to the latest actionable information through its SmartMarket Reports Series, BIM conferenc-es and webinars, and BIM modeling through Sweets.com.
Produced in conjunction with Standard & Poor’s CRISIL Ltd., The Urban India Construc-tion Reports is the first-ever in-depth analysis of the construction industry in India’s top 10 cities: Ahmedabad, Bengaluru, Chandigarh, Chennai, Hyderabad, Kochi, Kolkata, Mumbai, National Capital Region (including Delhi), and Pune.
Get SmartResearch and market intelligence enables customers to better under-stand their markets, the economy, and key industry trends.
Construction Outlook—the industry’s premier forecast for the year ahead
McGraw-Hill Construction SmartMarket Reports—executive briefs, webinars, and conferences in the areas of Green and BIM (Building Information Modeling)
Far-reaching global coverage, including China and India
Find WorkCustomers can find projects, identify project players, and build their pipeline.
The Dodge database contains more than 500,000 active construction projects and more than 65,000 sets of digitized plans and specifications for contractors, subcontrac-tors, building product manufacturers, and other industry professionals.
Dodge Project Center enables a contractor to quickly identify local projects of interest and then buy Dodge project documents (Dodge reports, plans and specifications) online and in a secure environment.
www.dodgeprojects.construction.com
Get FoundMcGraw-Hill Construction’s media portfolio—in print, online, and through events—enables customer advertisers to connect to the audiences and influencers critical to their success.
Architectural Record readers and Web site users have access to continuing education credits—critical to the architectural profes-sion—industry forums, and photo galleries where users can post their work.Architectural Record is now available on the iPhone and iPad to further meet the needs of the digital-savvy architectural audience.
McGraw-Hill Construction Publications/Web Sites/Services Reach
Print Online
Engineering News-Record (ENR) and ENR.com 60,000 145,000 monthly visitors
Architectural Record and ArchitecturalRecord.com 112,000 176,000 monthly visitors
GreenSource and GreenSourceMag.com 45,000 31,000 monthly visitors
Sweets Network – 300,000 monthly visitors
SNAP (Sweets News and Products) 45,000 architects, including every active architectural firm in the U.S.

2010/2011 MHP Investor Fact Book 57
Information & Media
Providing Essential Business Information Solutions to Global Aerospace and Defense Professionals
AVIATION WEEK is the global leader in providing strategic insight and analysis to the $2 trillion global aviation, aerospace and defense industries. Anchored by its flagship Aviation Week & Space Technology, AVIATION WEEK continues to evolve its portfolio to meet the needs of the industry with even greater global perspective and the latest technology platforms. AviationWeek.com is the leading Web site for aerospace and defense professionals with more than 1.75 million page views per month. The site is a hub for executives, managers, government and military officials, engineers, and other aviation professionals worldwide.
AVIATION WEEK’S audience reach: 1.2 million in 185 countries
PublicationsAviation Week & Space TechnologyBusiness & Commercial AviationDefense Technology InternationalOverhaul & MaintenanceMarket BriefingsShowNews
Analytical Tools and ServicesAviationWeek.comAWIN (Aviation Week Intelligence Network)
EventsMRO Conference SeriesAerospace & Defense ProgramsAerospace & Defense Finance Management Forums Executive RoundtablesWebinars
More Global, More DigitalLaunched new focused content channels on AviationWeek.com: India, Unmanned Vehicles, Tactical AircraftExclusive partnership with China’s official A&D Web site to extend content and drive additional revenueAn official member of the Society of British Aerospace Companies (SBAC)
Thought Leadership through Blogs
Renowned editorial experts provide daily insight on the global aerospace and defense industry. Blogs include:
DefenseCommercialBusiness AviationMaintenance, Repair & Overhaul (MRO)Space
Technology Innovation & Market Leadership AVIATION WEEK provides an industry-leading business advantage to global aerospace and defense companies through the breadth and depth of its media portfolio. From first-to-market information to lead generation tools for marketers, AVIATION WEEK delivers ROI through a strategic focus on helping customers get closer to winning contracts.
Knowledge CenterAVIATION WEEK is empowering users with the ability to contribute and build an effective, cohesive community. Users share industry knowledge, including white papers, case studies, and other content with the global aerospace and defense community.
AWINThe AVIATION WEEK Intelligence Network (AWIN) is a subscription service that provides integrated access to proprietary resources which enable executives to perform comprehensive analysis and develop business leads.
Won the Jesse H. Neal Business Journalism Award for “Best Web Site in 2010”
AWIN’s Commercial Aviation section was enhanced with regional content and data for Europe, Asia-Pacific, Middle East/Africa, and Latin America

58 The McGraw-Hill Companies
J.D. Power and Associates: Turning Information into Action®
Companies in 60 countries turn to J.D. Power and Associates’ quality and cus-tomer satisfaction research for the insight and information they need in a rapidly changing world. Each year, more than 20 million survey-related communications capture the opinions, perceptions, and expectations of consumers and business customers. J.D. Power’s industry performance benchmarks and analytical research are woven into the operations of leading global companies to measure customer satisfaction and drive improved business practices.
• 44% of J.D. Power’s business comes from non-automotive industries• 30% of J.D. Power’s business comes from outside the U.S.
Extensive media coverage has helped build the J.D. Power brand with-out requiring significant advertising or marketing expenditures. In 2009, more than 185,000 television commercials and nearly 7 billion print ad impressions referenced J.D. Power awards.
Digital Delivery of Analysis ToolsThe J.D. Power Business Center is a Web-based application designed to create a single, integrated deliv-ery platform for all J.D. Power prod-ucts. Analysis tools are user-friendly and very powerful—all designed to help clients get the most out of actionable information.
Clients receive:Interactive rank charts
Company summary charts
Gap analysis
Automated search tools to analyze responses to open-ended survey questions
China is one of J.D. Power’s fastest growing markets
J.D. Power’s Industry CoverageAutomotiveElectronicsFinancial ServicesHealthcareInsuranceGovernmentReal EstateTelecomTravelUtilities
J.D. Power and Associates AwardsHere is a sampling of recent awards J.D. Power presented to companies ranking highest in Quality and Customer Satisfaction:
U.S. AwardsFull Service Investment Firms: Edward JonesAutomotive Dealer Service (Luxury): LexusSmartphones: Apple Home Improvement Retailers: Ace HardwareLuxury Hotel Chains: The Ritz-Carlton
International AwardsJapan Digital SLR Cameras: NikonChina Auto Sales Satisfaction: RoeweUK Pre-Pay Mobile Phone Service: Tesco MobileGermany Executive/Luxury Owner Satisfaction: Audi A8India Automobile Insurance: ICICI Lombard
J.D. Power Research: China 2015: The Cost of OpportunityThis special report focuses exclusively on the passenger-vehicle segment in China. It provides a historical view of China’s rapid growth in the automo-tive industry and paints a picture of China’s market and automotive industry by 2015. It also includes interviews with top executives from China’s largest auto companies and features 60 illustrative charts on performance trends and future outlook.
Web Intelligence: Analyzing Social Media J.D. Power and Associates’ Web Intelligence Division analyzes social media that delivers feedback in the form of data and provides insights into the online dialogue that millions of consumers conduct on a daily basis via blogs, message boards, and other forms of online content. J.D. Power uses leading-edge technology and algorithms to transform the unstruc-tured data of the online community into actionable insights by identifying important themes and topics of interest by demographic profile.

2010/2011 MHP Investor Fact Book 59
Notes

60 The McGraw-Hill Companies
Notes

The McGraw-Hill Companies1221 Avenue of the AmericasNew York, NY 10020-1095
[email protected]/investor_relations
July 2010
Donald S. RubinSenior Vice President,Investor Relations
Tel: 212.512.4321Fax: 212.512.3840
Celeste M. HughesSenior Manager, Communicationsand Shareholder Relations
Tel: 212.512.2192
Des
ign
by A
lexa
nder
Des
ign
Ass
ocia
tes
Inc.
ww
w.a
lexa
nder
desi
gn.c
om

Investor Relations1221 Avenue of the AmericasNew York, NY 10020-1095Tel 212 512 4321Fax 212 512 [email protected]/investor_relations
PCW Recycled Fiber