Fact Book - Institutional Effectiveness and Analytics
123
UNIVERSITY OF NEBRASKA–LINCOLN | INSTITUTIONAL RESEARCH AND PLANNING Fact Book 2013–2014
-
Upload
khangminh22 -
Category
Documents
-
view
1 -
download
0
Transcript of Fact Book - Institutional Effectiveness and Analytics

U N I V E R S I T Y O F N E B R A S K A – L I N C O L N | I N S T I T U T I O N A L R E S E A R C H A N D P L A N N I N G
Fact Book2 013 –2 014

University of Nebraska-Lincoln COVER PHOTOS Fact Book 2013-2014
Institutional Research and Planning
Cover Photo Captions and Credits
The following captions correspond to their respective images on the front cover of this publication.
Photos Courtesy of University Communications.
Last Updated: October 8, 2013
As part of their August 23, 2013
welcoming events to UNL, the
incoming freshmen class
participates in their annual “tunnel
walk” onto the Memorial Stadium
field.
Students head for classes during the
first week of the 2013-2014
academic year. With 24,445
students, UNL saw a 1% increase
in total enrollment, and a 12.3%
increase in first-time freshmen.
The first undergraduate
commencement in the new
Pinnacle Bank Arena was held
August 17, 2013. The arena’s first
graduate commencement occurred
the day before.
As part of the Big Red Welcome activities on August 23, 2013, the incoming freshman class forms an “N” on
the Memorial Stadium field. The 2013 freshmen class, one of the largest in UNL’s history, is outlined by the
Cornhusker Marching Band.
The new south gateway to the
campus at 14th and R Streets.
Students meet each other before the
CASNR Luau Welcome for new
freshmen on August 23, 2013.
Six of 24 Doric columns that were
donated to the University after the
1930 demolition of the Omaha
Burlington Railroad Depot. The
columns sat unused until 1935.
Each weighs nine tons and stands
24 feet tall.
1

University of Nebraska-Lincoln INTRODUCTION Fact Book 2013-2014
Institutional Research and Planning
Introduction University of Nebraska-Lincoln Fact Book
The University of Nebraska-Lincoln Fact Book is compiled by the Office of Institutional Research and Planning
(IRP). The Fact Book is designed to provide a convenient source of information on many aspects of UNL. It
provides general answers to questions that frequently arise.
What IRP Does
IRP supports academic, administrative and
physical planning for the institution, and
researches and reports information about the
university and its environment. The office is
responsible for the collection and maintenance of
official institutional databases, internal and
external surveys, and serves as the official
reporting voice for the University of Nebraska-
Lincoln. The Director reports directly to the
Chancellor, and is a member of the Chancellor's
Senior Administrative Team.
Mission Statement
The mission of UNL’s Office of Institutional
Research and Planning is to support university
decision makers with a skilled, proactive team.
Our purpose is to plan for the campus, respond to inquiries, ask and answer the central and strategic questions
about the university’s position, progress, and future. We empower people to seek and find information. We serve
the university community to the best of our ability embracing the highest levels of quality in service,
communication, and professionalism.
Contact Information
Office of Institutional Research and Planning
University of Nebraska-Lincoln
332 Canfield Administration Building
Lincoln, Nebraska 68588-0435
Phone: 402-472-2097
Fax: 402-472-9327
Web: http://irp.unl.edu
The University of Nebraska–Lincoln does not discriminate based on gender, age, disability, race, color, religion,
marital status, veteran’s status, national or ethnic origin, or sexual orientation.
Last Updated: August 19, 2013
Canfield Administration Building Location of IRP
2

University of Nebraska-Lincoln TABLE OF CONTENTS
Fact Book 2013-2014
Institutional Research and Planning
Fact Book Table of Contents
Cover Photo Captions. .................................................................................................................... 1
Introduction ..................................................................................................................................... 2
Table of Contents ............................................................................................................................ 3
General Information
University of Nebraska-Lincoln Core Values (LEADERS)..................................................... 6
The Role of the University of Nebraska-Lincoln .................................................................... 7
The Missions of the University of Nebraska-Lincoln ............................................................. 7
Teaching.. ................................................................................................................................. 8
Research. .................................................................................................................................. 9
Service...................................................................................................................................... 9
Institutional and Professional Accreditations ............................................................................. 10
University of Nebraska-Lincoln Administrative Organization Chart ...................................... 13
Student Credit Hours (SCH)
Total SCH: Fall Semester Since 1979 .................................................................................... 14
Total SCH: Spring Semester Since 1993 .............................................................................. 15
SCH by College and Course Level, Fall and Spring Semester, 5 Year Trend ....................... 16
SCH by College and Course Level, Fall Semester, 5 Year Trend .......................................... 17
SCH by College and Course Level, Spring Semester, 5 Year Trend ..................................... 18
Summer Sessions SCH ........................................................................................................... 19
Total SCH, Summer Sessions, 5 Year Trend. ........................................................................ 20
Degrees
Total Degrees by Type Conferred by UNL Fiscal Year, 10 Year Trend ............................... 21
Type and Number of Degrees Conferred by College, Fiscal Year ......................................... 22
Degrees Conferred by Term and Fiscal Year, 5 Year Trend .................................................. 23
Types of Degrees Currently Offered at UNL ......................................................................... 24
Graduation and Retention
Student Retention Rates: Retention Tracking of First-time, Full-time Freshmen .................. 25
Student Graduation Rates: Graduation of First-time, Full-time, Degree-seeking Freshmen . 26
Academic Majors by College and Degree Level
College of Agricultural Sciences and Natural Resources ....................................................... 27
College of Architecture .......................................................................................................... 28
College of Arts and Sciences .................................................................................................. 29
College of Business Administration ....................................................................................... 31
College of Education and Human Sciences ............................................................................ 32
College of Education and Human Sciences Footnotes. ......................................................... 33
College of Education and Human Sciences Endorsements. ................................................... 34
College of Engineering ........................................................................................................... 35
Hixson-Lied College of Fine and Performing Arts ................................................................ 36
Graduate College (Dean’s Office) .......................................................................................... 37
College of Journalism and Mass Communications ................................................................. 38
College of Law ...................................................................................................................... 39
Student Tuition and Fees
3

University of Nebraska-Lincoln TABLE OF CONTENTS
Fact Book 2013-2014
Institutional Research and Planning
Tuition Rates for Students Enrolled in “In Person/On Campus” Courses Only .................... 40
Tuition Rates for Students Enrolled in Combination of “In Person/On Campus” Courses”
and “Online/Distance Education Courses”.. ....................................................................... 41
Tuition Rates for Students Enrolled in “Online/Distance Education” Courses. .................... 43
Explanation of University Fees .............................................................................................. 44
Tuition and Fees Refund Policy ............................................................................................. 45
Cost Example for the Academic Year.................................................................................... 46
Allocation of Student Fees per Student .................................................................................. 47
Undergraduate Full-time Tuition, Required Fees and Room and Board - 5 Year Trend ....... 48
Student Financial Aid
Student Financial Aid Awards by Type, 3 Year Trend .......................................................... 49
Enrollment - Fall
Total Enrollment Fall Semesters Since 1931-1932 ................................................................ 50
Fall Enrollment by Student Level, Since 1967 ...................................................................... 51
Fall Enrollment Trend by Level, Since 1975 (graph of data from previous page)................. 52
Fall Enrollment by College .................................................................................................... 53
Fall Enrollment by College and Student Level. ..................................................................... 54
Fall First-time Freshmen Enrollment, 5 Year Trend .............................................................. 56
History of First-Time Freshmen (Full- and Part-Time). Since 1975. .................................... 57
Fall First-time Freshmen ACT Scores, 5 Year Trend ............................................................ 58
Fall First-time Undergraduate Transfer Students by College. ............................................... 59
Fall First-time Undergraduate Transfer Students, by Class Standing and Gender, and
Full– or Part-time. ............................................................................................................... 60
First-time Transfer Students (Full– and Part-Time), 15 Year Trend. .................................... 61
Fall Undergraduate Enrollment by Level, College and Ethnicity .......................................... 62
Fall Graduate and Professional Enrollment by College and Ethnicity ................................... 63
Fall Enrollment by Age ......................................................................................................... 64
Fall Enrollment by College and Full- and Part-time Status, 5 Year Trend. ........................... 65
Fall Full-time Equivalent, 5 Year Trend. ............................................................................... 66
Fall Enrollment by Class Standing and Gender ..................................................................... 67
Fall Resident and Non-Resident Student Profile by College, 10 Year Trend ........................ 68
Fall Enrollment by Resident and Non-Resident Status and Level, 10 Year Trend ............... 70
Fall Origin of Students by Country of Origin and Student Level .......................................... 71
Fall Undergraduate Students by State of Origin .................................................................... 75
Fall Origin of Undergraduate Students by Nebraska County ................................................ 76
Enrollment - Spring
Spring Enrollment by College ............................................................................................... 78
Spring Enrollment by College and Student Level .................................................................. 79
Spring Undergraduate Enrollment by Level, College and Ethnicity ...................................... 81
Spring Graduate and Professional Enrollment by College and Ethnicity .............................. 82
Spring Enrollment by Resident and Non-Resident Status and Level, 10 Year Trend............ 83
Enrollment - Summer
Summer Enrollment by College, All Sessions ....................................................................... 84
Summer Enrollment, All Sessions, by Student Level, 20 Year Trend ................................... 85
Summer Enrollment by Each Session, 10 Year Trend ........................................................... 86
4

University of Nebraska-Lincoln TABLE OF CONTENTS
Fact Book 2013-2014
Institutional Research and Planning
Housing
Fall Enrollment by Housing Type, 5 Year Trend ................................................................... 87
Faculty and Staff
General Regular Faculty by Tenure Status and College ......................................................... 88
General Regular Faculty by Rank, 5 Year Trend . ................................................................. 89
General Regular Faculty by Rank and College ...................................................................... 90
General Regular Faculty by Rank and Gender ....................................................................... 91
General Regular Faculty by Age ............................................................................................ 92
Full-time Faculty by Tenure Status, Ethnicity and Gender .................................................... 93
Staffing, 10 Year Trend .......................................................................................................... 94
Full-Time Equivalency (FTE) - Regular Faculty and Regular Staff. ..................................... 95
Staff Profile by Gender, Full– and Part-time Status ............................................................... 96
Budget
General Operating Budget Selected Numbers, 5 Year Trend ................................................. 97
Estimated Revenue by Fund Source ....................................................................................... 98
Budgeted Expenditures by Spending Category ...................................................................... 99
Research Expenditures
Total Research Expenditures (1998-1999 to present) .......................................................... 100
Research Expenditures, Three Year Trend ........................................................................... 101
Facilities
Room Use Summary ............................................................................................................ 102
Land Inventory ..................................................................................................................... 103
Building Gross Square Footage ............................................................................................ 104
Awards Introduction. ......................................................................................................................... 105
University-Wide Awards, University of Nebraska-Lincoln Recipients ............................... 105
University of Nebraska-Lincoln Faculty Awards ................................................................. 106
University of Nebraska-Lincoln Faculty Distinguished Teaching Awards .......................... 109
University of Nebraska-Lincoln Named Chairs and Professorships .................................... 111
University of Nebraska-Lincoln Staff Awards ..................................................................... 113
University of Nebraska-Lincoln Faculty/Staff Awards ........................................................ 115
Glossary........................................................................................................................................ 118
5

University of Nebraska-Lincoln GENERAL INFORMATION
Fact Book 2013-2014
Institutional Research and Planning
University of Nebraska-Lincoln Core Values
LEADERS Learning that prepares students for lifetime success and leadership;
Excellence pursued without compromise;
Achievement supported by a climate that celebrates each person's success;
Diversity of ideas and people;
Engagement with academic, business, and civic communities throughout Nebraska and the
world;
Research and creative activity that inform teaching, foster discovery, and contribute to
economic prosperity and our quality of life;
Stewardship of the human, financial, and physical resources committed to our care.
6

University of Nebraska-Lincoln GENERAL INFORMATION
Fact Book 2013-2014
Institutional Research and Planning
Role and Mission Statement
The Role of the University of Nebraska-Lincoln
The University of Nebraska-Lincoln, chartered by the Legislature in 1869, is that part of the University
of Nebraska system which serves as both the land-grant and the comprehensive public University for the
State of Nebraska. Those responsible for its origins recognized the value of combining the breadth of a
comprehensive University with the professional and outreach orientation of the land-grant University,
thus establishing a campus which has evolved to become the flagship campus of the University of
Nebraska. UNL works cooperatively with the other three campuses and Central Administration to
provide for its student body and all Nebraskans the widest array of disciplines, areas of expertise, and
specialized facilities of any institution within the state,
Through its three primary missions of teaching, research, and service, UNL is the state’s primary
intellectual center providing leadership throughout the state through quality education and the generation
of new knowledge. UNL’s graduates and its faculty and staff are major contributors to the economic
and cultural development of the state. UNL attracts a high percentage of the most academically talented
Nebraskans, and the graduates of the University form a significant portion of the business, cultural, and
professional resources of the State. The quality of primary, secondary, and other post-secondary
educational programs in the state depends in part on the resources of UNL for curricular development,
teacher training, professional advancement, and enrichment activities involving the University’s faculty,
museums, galleries, libraries, and other facilities. UNL provides for the people of the state unique
opportunities to fulfill their highest ambitions and aspirations, thereby helping the state retain its most
talented youth, attract talented young people from elsewhere, and address the educational needs of the
non-traditional learner.
The University of Nebraska-Lincoln has been recognized by the Legislature as the primary research and
doctoral degree granting institution in the state for fields outside the health professions. Through its
service and outreach efforts, the University extends its educational responsibilities directly to the people
of Nebraska on a statewide basis. Many of UNL’s teaching, research, and service activities have an
international dimension in order to provide its students and the state a significant global perspective.
The Missions of the University of Nebraska-Lincoln
The role of the University of Nebraska-Lincoln as the primary intellectual and cultural resource for the
State is fulfilled through the three missions of the University: teaching, research, and service. UNL
pursues its missions through the Colleges of Architecture, Arts and Sciences, Business Administration,
Education and Human Sciences, Engineering, Hixson-Lied College of Fine and Performing Arts,
Journalism and Mass Communications, Law, the University-wide Graduate College, and the Institute of
Agriculture and Natural Resources which includes the College of Agricultural Sciences and Natural
Resources, the Agricultural Research Division, the Cooperative Extension Division, and the
Conservation and Survey Division. Special units with distinct missions include the University Libraries,
Extended Education and Outreach1, International Affairs2, the Lied Center for Performing Arts, the
Bureau of Business Research, Nebraska Educational Telecommunications, the Sheldon Museum of Art
and Sculpture Garden, the University of Nebraska State Museum, the University of Nebraska Press, the
1Extended Education and Outreach is now Online and Distance Education 2International Affairs has become the following programs within the Office of Academic Affairs: Education Abroad; International
Engagement; and International Students and Scholars.
7

University of Nebraska-Lincoln GENERAL INFORMATION
Fact Book 2013-2014
Institutional Research and Planning
Water Center, the Nebraska Forest Service, the Nebraska State-wide Arboretum, and Intercollegiate
Athletics.
To capitalize on the breadth of programs and the multidisciplinary resources available at UNL, a number
of Centers exist to marshal faculty from a variety of disciplines to focus teaching and research on
specific societal issues and to provide technical assistance for business and industry in order to enhance
their ability to compete in world markets. Additionally, interdisciplinary programs promote integration
of new perspectives and insights into the instructional research and service activities.
The University of Nebraska-Lincoln promotes respect for and understanding of cultural diversity in all
aspects of society. It strives for a culturally diverse student body, faculty, and staff reflecting the
multicultural nature of Nebraska and the nation. UNL brings international and multicultural dimensions
to its programs through the involvement of its faculty in international activities, a student body that
includes students from throughout the world, exchange agreements with other universities abroad
involving both students and faculty, and the incorporation of international components in a variety of
courses and curricula
Teaching, research, and service take on a distinctive character at the University of Nebraska-Lincoln
because of its status as a comprehensive land-grant university. These traits permit opportunities for the
integration of multiple disciplines providing students more complete and sophisticated programs of
study. Its land-grant tradition ensures a commitment to the special character of the State and its people.
The faculty is responsible for the curricular content of the various programs, and pursues new
knowledge and truths within a structure that assures academic freedom in its intellectual endeavors. The
curricula are designed to foster critical thinking, the re-examination of accepted truths, a respect for
different perspectives including an appreciation of the multiethnic character of the nation, and a curiosity
that leads to life-long learning. Additionally, an environment exists whereby students can develop
aesthetic values and human relationships including tolerance for differing viewpoints.
Teaching
The people of Nebraska created UNL to provide its citizens with the highest quality of post-secondary
education. Therefore, a fundamental mission of the University of Nebraska-Lincoln is teaching. The
distinctiveness of the teaching mission at the University of Nebraska-Lincoln lies in its range of
undergraduate majors, the character and quality of the faculty, and the extra curricular environment. The
University provides students with a wide choice of courses and career options which often expands the
scope of their dreams and ambitions. The size and diversity of the University permits students to mature
and to develop their own sense of self-confidence and individual responsibility. The course work is
enriched by a faculty that is engaged in active research and creative activity and whose frame of
reference is the national and international community of scholars.
Having created the first graduate college west of the Mississippi River, the University of Nebraska-
Lincoln has historically recognized graduate education to be a central and unique component of its
mission. Thus, UNL has primary responsibility in the State for graduate education, especially at the
doctoral and professional levels. UNL is unique in possessing the scope of programs necessary for
multidisciplinary instruction at the graduate level, a faculty involved in research necessary to support
graduate education, and the libraries, laboratories, computer facilities, museums, galleries, and other
ancillary resources required for graduate instruction.
8

University of Nebraska-Lincoln GENERAL INFORMATION
Fact Book 2013-2014
Institutional Research and Planning
Research
Basic and applied research and creative activity represent a major component of UNL’s mission, a
component that is recognized in Nebraska legislative statutes, and in its status as a land-grant university.
The quest for new knowledge is an essential part of a research university; it helps define and attract the
type of faculty necessary to provide a university education; it distinguishes the quality of the
undergraduate students’ classroom experience; and it is the necessary component of graduate instruction.
As part of its research mission, UNL is dedicated to the pursuit of an active research agenda producing
both direct and indirect benefits to the State. The special importance of agriculture, environment, and
natural resources is addressed in its research priorities. In addition, UNL conducts a high level of
research and creative activities that address in specific ways the issues and problems that confront
Nebraska. Through their research and creative activities, faculty at UNL interact with colleagues around
the world and are part of the network of knowledge and information that so influences our society. As a
consequence, the University serves as the gateway through which Nebraska participates in and shares
the gains from technological and cultural developments.
Service
The land-grant tradition creates for the University of Nebraska-Lincoln a special state-wide
responsibility to serve the needs of Nebraska and its citizens. In addition, many of its service aspects
extend to regional, national, and international clientele. Special units such as Extended Education and
Outreach and the Cooperative Extension Division have specific responsibilities to bring the teaching and
research resources of the University to a wider clientele. Through Cooperative Extension’s partnership
with federal, state, and county agencies, UNL has an outreach program in each county in the state.
Moreover, all units of the University have a service and outreach mission.
To help accomplish this mission, UNL delivers educational services through diverse ways including
telecommunications methods and as a participant in the development of regional educational centers
especially in those areas where it has state-wide responsibilities. The University recognizes its
obligation to extend the resources of the University beyond the campus and throughout the State.
Serving the needs of Nebraska requires more than responding to the felt needs of the time. UNL must
be visionary in its planning and must help the citizens of the state prepare for the future as well as deal
with the present.
Approved by the Board of Regents 05-10-91
College names modified December 2005, November 2011
9

University of Nebraska-Lincoln ACCREDITATIONS
Fact Book 2013-2014
Institutional Research and Planning
College / Program Accrediting Agency Last / Next
University of Nebraska-Lincoln
North Central Association of Colleges and
Schools, 30 North LaSalle Street, Suite
2400; Chicago IL 60602-2504; Phone: 312-
263-0456
2006-07 / 2016-17
Agricultural Education (Joint program with
the College of Education & Human
Sciences) (B,M,D)
Teacher Education Accrediting Council
(TEAC)2009-10 / 2017-18
Nebraska Vet Diagnostic LaboratoryAmerican Association of Veterinary
Laboratory Diagnosticians2012-13 / 2016-17
Professional Program in Veterinary
Medicine
American Veterinary Medical Assoc
Committee on Education (AAVMC COE)2010-11 / 2017-18
PGA Golf Management Professional Golfers' Association (PGA) 2008-09 / 2014-15
Architecture (FP)National Architectural Accrediting Board, Inc
(NAAB)2008-09 / 2014-15
Community & Regional Planning (M)Planning Accreditation Board of the
American Planning Assoc (PAB)2011-12 / 2015-16
Interior Design (B)Council for Interior Design Accreditation
(CIDA)2013-14 / 2020-21
Landscape ArchitectureLandscape Architecture Accreditation Board
(LAAB) 2011-12 / 2017-18
Clinical Psychology (D) American Psychological Association (APA) 2012-13 / 2018-19
Computer Science (B) (Lincoln Campus)Computing Accreditation Commission
(CAC) of ABET2011-12 / 2017-18
All programs (B,M,D)
Association to Advance Collegiate Schools
of Business International (AACSB
International)
2010-11 / 2015-16
Accountancy (B,M)
Association to Advance Collegiate Schools
of Business International (AACSB
International)
2010-11 / 2015-16
Last Updated: April 18, 2014
(A) Associate, (B) Baccalaureate, (M) Masters, (FP) First Professional (D) Doctorate, (S) beyond masters but less than
doctorate
Contact Academic Affairs, or individual colleges and departments, for information on specific programs.
Institutional
Institutional and Professional Accreditations
College of Agricultural Sciences and Natural Resources
College of Architecture
College of Arts and Sciences
College of Business Administration
Source: Office of the Senior Vice Chancellor for Academic Affairs
10

University of Nebraska-Lincoln ACCREDITATIONS
Fact Book 2013-2014
Institutional Research and Planning
College / Program Accrediting Agency Last / Next
All Professional & Educational Programs
(B,M,S,D) Ed Administration; Ed
Psychology; Spec Ed & Comm Disorders;
Teaching, Learning & Teacher Ed
Council for the Accreditation of Educator
Preparation (CAEP).2009-10 / 2017-18
Athletic Training (B)Commission on Accreditation of Athletic
Training Education (CAATE)2008-09 / 2013-14
Counseling Psychology (M,D) American Psychological Association (APA) 2013-14 / 2020-21
Dietetic Intern Program (M,D) American Dietetic Association (ADA) 2008-09 / 2018-19
Didactic Program in Dietetics (B) American Dietetic Association (ADA) 2008-09 / 2018-19
Marriage and Family Therapy (M)Commission on Accreditation for Marriage
& Family Therapy Education (COAMFTE)2010-11 / 2016-17
Nebraska Internship Consortium in
Professional Psychology (D)American Psychological Association (APA) 2008-09 / 2014-15
Ruth Staples Child Development
Laboratory
National Academy of Early Childhood
Program through the National Assoc for
Education of Young Children (NAEYC)
2013-14 / 2018-19
School Psychology (D) American Psychological Association (APA) 2010-11 / 2013-14
School Psychology (D,S)National Association of School
Psychologists (NASP)2011-12 / 2016-17
Special Education-Hearing Impaired
Program (M)Council for Education of the Deaf (CED) 2011-12 / 2017-18
Speech-Language Pathology & Audiology
(M)
Council on Academic Accreditation in
Audiology and Speech-Language
Pathology of ASHA
2009-10 / 2017-18
Teacher Education Programs (B,M,S,D) Nebraska Department of Education (NDE) 2009-10 / 2016-17
Agricultural Engineering (B) Accreditation Board for Engineering &
Technology (ABET)2011-12 / 2017-18
Architectural Engineering (M)Accreditation Board for Engineering &
Technology (ABET)2011-12 / 2017-18
Biological Systems Engineering (B) Accreditation Board for Engineering &
Technology (ABET)2011-12 / 2017-18
Chemical Engineering (B)Accreditation Board for Engineering &
Technology (ABET)2006-07 / 2013-14
Civil Engineering (B)Accreditation Board for Engineering &
Technology (ABET)2006-07 / 2013-14
Computer Engineering (B) (Lincoln
Campus)
Accreditation Board for Engineering &
Technology (ABET)2011-12 / 2017-18
Computer Engineering (B) (Omaha
Campus)
Accreditation Board for Engineering &
Technology (ABET)2006-07 / 2013-14
Last Updated: April 18, 2014
College of Engineering
Institutional and Professional Accreditations continued
(A) Associate, (B) Baccalaureate, (M) Masters, (FP) First Professional (D) Doctorate, (S) beyond masters but less than
doctorate
College of Education and Human Sciences
Contact Academic Affairs, or individual colleges and departments, for information on specific programs.
Source: Office of the Senior Vice Chancellor for Academic Affairs
11

University of Nebraska-Lincoln ACCREDITATIONS
Fact Book 2013-2014
Institutional Research and Planning
College / Program Accrediting Agency Last / Next
Construction Management (B)American Council for Construction
Education (ACCE)2006-07 / 2013-14
Construction Engineering (B)Accreditation Board for Engineering &
Technology (ABET)2006-07 / 2013-14
Electrical Engineering (B)Accreditation Board for Engineering &
Technology (ABET)2011-12 / 2017-18
Electronics Engineering (B)Accreditation Board for Engineering &
Technology (ABET)2006-07 / 2013-14
Industrial Engineering (B)
Engineering Accreditation Commission of
Accreditation Board for Engineering &
Technology (EAC) of ABET
Termination Status:
Accreditation ending
09/30/2015
Mechanical Engineering (B)
Engineering Accreditation Commission of
Accreditation Board for Engineering &
Technology (EAC) of ABET
2011-12 / 2017-18
Art & Art History (B,M)National Assoc of Schools of Art and
Design (NASAD)2002-03 / 2013-14
Dance (B)National Association of Schools of Dance
(NASD)2011-12 / 2016-17
Music (B,M,D)National Association of Schools of Music
(NASM)2008-09 / 2018-19
Music Education (Joint program with the
College of Education & Human Sciences)
(B,M,D)
National Association of Schools of Music
(NASM) & Teacher Education Accrediting
Council (TEAC)
2009-10 / 2018-19
Theatre (B,M)National Association of Schools of Theatre
(NAST)2008-09 / 2017-18
All Programs (B,M)
Accrediting Council on Education in
Journalism & Mass Communication
(ACEJMC)
2009-10 / 2015-16
All Programs (FP) American Bar Assoc (ABA) 2012-13 / 2017-18
University of Nebraska State Museum American Association of Museums 2007-08 / 2017-18
Last Updated: April 18, 2014
(A) Associate, (B) Baccalaureate, (M) Masters, (FP) First Professional (D) Doctorate, (S) beyond masters but less than
doctorate
Contact Academic Affairs, or individual colleges and departments, for information on specific programs.
Institutional and Professional Accreditations continued
Hixson-Lied College of Fine and Performing Arts
College of Journalism and Mass Communications
College of Law
NU State Museum
College of Engineering continued
Source: Office of the Senior Vice Chancellor for Academic Affairs
12

Associate to the Chancellor
Associate Vice Chancellor for Research
Associate Vice Chancellor & Director Campus Recreation
Dean Students
Dean College of Architecture
Dean College of Arts &
Science
Dean College of Agricultural Sciences &
Natural Resources
Dean Nebraska College of Technical Agriculture
Associate Vice Chancellor
University Services
Chief of Police University Police
Executive Director Alumni Association
Director Institutional Animal
Care ProgramResearch Centers
Director University Housing &
Dining Services
Director Greek Affairs
Dean College of Business
Administration
Dean College of Education &
Human Sciences
Dean Agricultural Research
Division
Assistant Vice Chancellor Facilities Management &
Planning
Director Athletics
Director Human Research
Protections Program
Director NE Center for Materials
& Nanoscience
Director University Health Center
Director Career Services
Dean College of Engineering
Dean College of Fine & Performing Arts
Dean Cooperative Extension
DivisionResearch Centers
Assistant Vice Chancellor
Financial Services
Assistant to Chancellor for Community
Relations
Executive Director NUtech Ventures
Director NE Center for Energy Sciences Research
Director Nebraska Unions
Director Services for Students
with Disabilities
Dean College of Journalism & Mass Communications
Dean College of Law
Associate Vice Chancellor
Director Agricultural Research &
Development Center
Assistant Vice Chancellor
Human Resources
Assistant to Chancellor for Equity, Access & Diversity
Programs
Assistant Vice Chancellor for Research
Director Biological Process
Development Facility
Director Student Involvement
Assistant Vice Chancellor
Dean University Libraries
Dean Academic Services &
Enrollment Management
Assistant Vice Chancellor
Finance & Personnel
Director Center for Biological
Chemistry
Chief Information Officer
Manager Proposal Development
Director, Center for Brain, Biology & Behavior (with
Athletics)
Director Academic Support & Intercultural Services
Director Educational Access &
TRIO Programs
Director Academic
Administration
Director Scholarships & Financial Aid
Assistant to the Vice Chancellor
External Relations
Director Center for Grassland
Studies
Director Institutional Research &
Planning
Coordinator Research
Communications
Director Nebraska Educational Telecommunications
University Registrar Director Global Engagement
Director Food Processing
Center
Director Operations Analysis
Assistant Vice Chancellor for Research
Director Nebraska Center for
Virology
Director Public Policy Center
Director Student Information
Systems
Director Nebraska Forest
Service
Director Great Plains Veterinary
Educational Center
Reserve Officers Training Corps
Director Sponsored Programs
Director Redox Biology Center
Director Raikes School
Director Online & Distance
Education
Director Center for Plant
Science Innovation
Director University
Communications
Manager Research Finance
Director Center for
Biotechnology
Director Undergraduate Education
Programs
Director Admissions
Director Lied Center
Manager Research Information
Systems
Associate Vice Chancellor / Dean
Graduate Studies
Associate Vice Chancellor / Senior International Officer
Research and Extension Centers
Director Sheldon Gallery
Director University of Nebraska
State Museum
Associate Vice Chancellor
Associate Vice Chancellor
Director Northeast Research &
Extension Center
Director Confucius Institute
Director University of Nebraska
Press
Assistant Vice Chancellor
Director Panhandle Research &
Extension Center
Director Industry Relations
Director Southeast Research &
Extension Center
Executive Director Nebraska Innovation
Campus
Director West Central Research
& Extension Center
University-Wide Institutes
Daugherty Water for Food Institute
Rural Futures Institute
Institutional Research and PlanningLast Updated: June 2013
Vice Chancellor for Research and Economic Development Senior Vice Chancellor for Academic Affairs Vice Chancellor for Institute of Agriculture and Natural Resources; University of Nebraska Vice PresidentVice Chancellor for Student Affairs Vice Chancellor for Business and Finance
University of Nebraska-LincolnAdministrative Organization Chart
Chancellor
13

University of Nebraska-Lincoln STUDENT CREDIT HOURS
Fact Book 2013-2014
Institutional Research and Planning
1979
282,4601980 1981 1982 1983 1984 1985 1986 1987 1988 1989
286,940 293,755 296,201 290,355 284,000 280,433 277,774 274,013 278,135 279,8761990 1991 1992 1993 1994 1995 1996 1997 1998 1999
286,089 288,766 288,769 286,594 280,590 286,514 284,871 274,424 269,938 266,8272000 2001 2002 2003 2004 2005 2006 2007 2008 2009
270,048 273,617 277,369 275,022 265,084 266,317 271,211 283,575 292,004 298,6102010 2011 2012 2013
303,635 304,265 298,638 303,107
Last Updated: September 13, 2013
Student Credit Hours are total hours for undergraduate, graduate, and professional levels as of the official census date (sixth day of semester).
Fall Semester, Total Student Credit Hours
Total Student Credit Hours
Fall Semester 1979-201328
2,46
028
6,94
0 293,
755
296,
201
290,
355
284,
000
280,
433
277,
774
274,
013
278,
135
279,
876
286,
089
288,
766
288,
769
286,
594
280,
590
286,
514
284,
871
274,
424
269,
938
266,
827
270,
048
273,
617
277,
369
275,
022
265,
084
266,
317
271,
211
283,
575 29
2,00
429
8,61
030
3,63
530
4,26
529
8,63
830
3,10
7
240,000
250,000
260,000
270,000
280,000
290,000
300,000
310,000
320,000
1979
1981
1983
1985
1987
1989
1991
1993
1995
1997
1999
2001
2003
2005
2007
2009
2011
2013
Fall Semester
14

University of Nebraska-Lincoln STUDENT CREDIT HOURS
Fact Book 2013-2014
Institutional Research and Planning
1993 1994 1995 1996 1997 1998 1999
268,471 264,313 258,073 263,253 262,537 252,440 247,265
2000 2001 2002 2003 2004 2005 2006 2007 2008 2009
245,786 249,931 252,826 257,570 251,976 244,866 246,404 253,350 262,723 270,611
2010 2011 2012 2013 2014
278,215 281,685 278,587 274,730 278,115
Last Updated: January 24, 2014
Student Credit Hours are total hours for undergraduate, graduate, and professional levels as of
the official census date (sixth day of semester).
Spring Semester, Total Student Credit Hours
Spring Semester 1993-2014
Total Student Credit Hours
268,4
71
264,3
13
258,0
73
263,2
53
262,5
37
252,4
40
247,2
65
245,7
86
249,9
31
252,8
26
257,5
70
251,9
76
244,8
66
246,4
04
253,3
50 2
62,7
23 270,6
11 278,2
15
281,6
85
278,5
87
274,7
30
278,1
15
240,000
250,000
260,000
270,000
280,000
290,000
300,000
310,000
320,000
199
3
199
4
199
5
199
6
199
7
199
8
199
9
200
0
200
1
200
2
200
3
200
4
200
5
200
6
200
7
200
8
200
9
201
0
201
1
201
2
201
3
201
4
Spring Semester
15

University of Nebraska-Lincoln STUDENT CREDIT HOURS
Fact Book 2013-2014
Institutional Research and Planning
College Course Level 2009-10 2010-11 2011-12 2012-13 2013-14
Undergraduate 42,661 44,848 46,645 48,719 60,089
Graduate 9,168 9,976 9,700 9,421 9,936
Professional 1,935 2,024 1,964 2,069 2,105
Total 53,764 56,848 58,309 60,209 72,130
Undergraduate 9,487 8,156 8,040 7,937 8,896
Graduate 883 1,161 1,144 1,019 863
Professional 1,845 2,481 1,833 1,146 858
Total 12,215 11,798 11,017 10,102 10,617
Undergraduate 250,055 249,914 244,712 237,637 231,032
Graduate 16,949 17,413 17,097 16,772 16,999
Total 267,004 267,327 261,809 254,409 248,031
Undergraduate 55,287 57,770 59,314 63,827 68,273
Graduate 6,602 6,102 5,954 5,383 5,099
Total 61,889 63,872 65,268 69,210 73,372
Undergraduate 54,995 59,360 60,822 57,662 57,274
Graduate 16,137 15,627 17,134 17,176 17,085
Total 71,132 74,987 77,956 74,838 74,359
Undergraduate 31,834 32,402 32,781 31,968 31,696
Graduate 7,464 7,603 7,718 6,591 6,703
Total 39,298 40,005 40,499 38,559 38,399
Undergraduate 34,215 33,194 31,202 29,051 28,889
Graduate 2,610 2,431 2,327 2,893 2,933
Total 36,825 35,625 33,529 31,944 31,822
Undergraduate 13,431 14,309 14,910 15,723 15,194
Graduate 789 663 457 478 504
Total 14,220 14,972 15,367 16,201 15,698
Law Prof (Total) 11,892 12,242 11,465 11,530 11,100
Reserve Officers Training
CorpsUG (Total) 834 833 842 790 747
Other Departments 1 Undergraduate 7,639 6,732 6,754 5,537 4,947
Graduate 113 67 37 3 0
Professional 0 12 0 36 0
Total 7,752 6,811 6,791 5,576 4,947
Undergraduate 500,438 507,518 506,022 498,851 507,037
Graduate 60,715 61,043 61,568 59,736 60,122
Professional 15,672 16,759 15,262 14,781 14,063
Total 576,825 585,320 582,852 573,368 581,222
Last Updated: January 24, 2014
Student Credit Hours by College and Course Level
Journalism and Mass
Communications
Education and Human
Sciences
Engineering
Fall and Spring - 5 Year Trend
Hixson-Lied College of
Fine and Performing Arts
NOTE: Student Credit Hours (SCH) are as of the Census Date (sixth day of the semester).
Architecture
Agricultural Sciences and
Natural Resources
Arts and Sciences
Business Administration
Total UNL
1 Includes: Study Abroad, Graduate College, Libraries, Raikes School of Computer Science and Management, Honors
Program.
16

University of Nebraska-Lincoln STUDENT CREDIT HOURS
Fact Book 2013-2014
Institutional Research and Planning
College Course Level 2009 2010 2011 2012 2013
Undergraduate 22,439 23,915 24,501 25,787 31,656 Graduate 4,695 5,063 5,001 4,816 4,926 Professional 987 1,027 968 994 1,063 Total 28,121 30,005 30,470 31,597 37,645
Undergraduate 4,974 4,423 4,312 4,021 4,673 Graduate 405 651 617 571 497 Professional 994 1,256 979 608 449 Total 6,373 6,330 5,908 5,200 5,619
Undergraduate 132,546 132,423 131,076 127,133 124,741 Graduate 8,740 9,157 8,885 8,691 8,649 Total 141,286 141,580 139,961 135,824 133,390
Undergraduate 28,206 29,520 30,381 31,835 33,861 Graduate 3,478 3,058 3,184 2,915 2,660 Total 31,684 32,578 33,565 34,750 36,521
Undergraduate 26,932 29,549 30,123 28,343 28,273 Graduate 7,871 7,851 8,600 8,843 8,730 Total 34,803 37,400 38,723 37,186 37,003
Undergraduate 16,311 16,263 16,369 15,951 15,759 Graduate 3,697 3,607 3,801 3,317 3,379 Total 20,008 19,870 20,170 19,268 19,138
Undergraduate 18,178 17,630 16,818 16,053 15,581 Graduate 1,336 1,282 1,160 1,451 1,504 Total 19,514 18,912 17,978 17,504 17,085
Undergraduate 6,555 7,099 7,486 7,898 7,934 Graduate 399 348 237 232 246 Total 6,954 7,447 7,723 8,130 8,180
Law Prof (Total) 5,878 6,145 6,106 6,121 5,899
Reserve Officers Training UG (Total) 463 398 462 414 384
Other Departments1 Undergraduate 3,485 2,929 3,175 2,605 2,243 Graduate 41 41 24 3 0 Professional 0 0 0 36 0 Total 3,526 2,970 3,199 2,644 2,243
Undergraduate 260,089 264,149 264,703 260,040 265,105 Graduate 30,662 31,058 31,509 30,839 30,591 Professional 7,859 8,428 8,053 7,759 7,411 Total 298,610 303,635 304,265 298,638 303,107
Last Updated: September 16, 2013
Student Credit Hours by College and Course Level
Fall Semester - 5 Year Trend
Agricultural Sciences and Natural Resources
Architecture
NOTE: Student Credit Hours (SCH) are as of the Census Date (sixth day of the semester).
Total UNL
Arts and Sciences
Business Administration
Education and Human Sciences
Engineering
Hixson-Lied College of Fine and Performing Arts
Journalism and Mass Communications
1Includes: Study Abroad, Graduate College, Libraries, Raikes School of Computer Science and Management, Honors Program.
17

University of Nebraska-Lincoln STUDENT CREDIT HOURS
Fact Book 2013-2014
Institutional Research and Planning
College Course Level 2010 2011 2012 2013 2014
Undergraduate 20,222 20,933 22,144 22,932 28,433
Graduate 4,473 4,913 4,699 4,605 5,010
Professional 948 997 996 1,075 1,042
Total 25,643 26,843 27,839 28,612 34,485
Undergraduate 4,513 3,733 3,728 3,916 4,223
Graduate 478 510 527 448 366
Professional 851 1,225 854 538 409
Total 5,842 5,468 5,109 4,902 4,998
Undergraduate 117,509 117,491 113,636 110,504 106,291
Graduate 8,209 8,256 8,212 8,081 8,350
Total 125,718 125,747 121,848 118,585 114,641
Undergraduate 27,081 28,250 28,933 31,992 34,412
Graduate 3,124 3,044 2,770 2,468 2,439
Total 30,205 31,294 31,703 34,460 36,851
Undergraduate 28,063 29,811 30,699 29,319 29,001
Graduate 8,266 7,776 8,534 8,333 8,355
Total 36,329 37,587 39,233 37,652 37,356
Undergraduate 15,523 16,139 16,412 16,017 15,937
Graduate 3,767 3,996 3,917 3,274 3,324
Total 19,290 20,135 20,329 19,291 19,261
Undergraduate 16,037 15,564 14,384 12,998 13,308
Graduate 1,274 1,149 1,167 1,442 1,429
Total 17,311 16,713 15,551 14,440 14,737
Undergraduate 6,876 7,210 7,424 7,825 7,260
Graduate 390 315 220 246 258
Total 7,266 7,525 7,644 8,071 7,518
Law Prof (Total) 6,014 6,097 5,359 5,409 5,201
Reserve Officers Training
CorpsUG (Total) 371 435 380 376 363
Other Departments 1 Undergraduate 4,154 3,803 3,579 2,932 2,704
Graduate 72 26 13 0 0
Professional 0 12 0 0 0
Total 4,226 3,841 3,592 2,932 2,704
Undergraduate 240,349 243,369 241,319 238,811 241,932
Graduate 30,053 29,985 30,059 28,897 29,531
Professional 7,813 8,331 7,209 7,022 6,652
Total 278,215 281,685 278,587 274,730 278,115
Last Updated: January 24, 2014
Student Credit Hours by College and Course Level
Spring - 5 Year Trend
Agricultural Sciences
and Natural Resources
Architecture
Arts and Sciences
Total UNL
NOTE: Student Credit Hours (SCH) are as of the Census Date (sixth day of the semester).
Business Administration
Education and Human
Sciences
Engineering
Hixson-Lied College of
Fine and Performing Arts
Journalism and Mass
Communications
1 Includes: Study Abroad, Graduate College, Libraries, Raikes School of Computer Science and Management, Honors
Program.
18

University of Nebraska-Lincoln STUDENT CREDIT HOURS
Fact Book 2013-2014
Institutional Research and Planning
Session Undergraduate Graduate Professional Total
3 Week Pre-Session 4,058 2,213 123 6,394
Eight Week 5,868 1,352 27 7,247
1st Five Week 12,841 5,362 160 18,363
2nd Five Week 9,337 3,011 205 12,553
Students in Omaha 429 145 0 574
Total 32,533 12,083 515 45,131
Last Updated: July 22, 2014
Summer Sessions 2014
Note: Omaha has four summer sessions, but they are scheduled differently than UNL. "Students in Omaha"
are total credit hours for all Omaha summer sessions combined. Omaha data is for students enrolled in
classes delivered in Omaha, but administered by Lincoln.
Student Credit Hours
Summer Sessions 2014 Student Credit Hours
0
5,000
10,000
15,000
20,000
3 Week Pre-Session
Eight Week 1st Five Week 2nd FiveWeek
Students inOmaha
Stu
dent
Cre
dit H
ours
Professional
Graduate
Undergraduate
19

University of Nebraska-Lincoln STUDENT CREDIT HOURS
Fact Book 2013-2014
Institutional Research and Planning
Session 2010 2011 2012 2013 2014
3 Week Pre-Session 6,595 6,390 6,453 6,724 6,394
Eight Week 3,564 3,773 4,053 6,584 7,247
1st Five Week 19,455 19,818 18,764 18,087 18,363
2nd Five Week 14,186 12,925 12,801 12,056 12,553
Students in Omaha 619 751 490 582 574
Total 44,419 43,657 42,561 44,033 45,131
Last Updated: July 22, 2014
Total Student Credit Hours
Summer Sessions, Student Credit Hours, 5 Year Trend
Note: Omaha has four summer sessions, but they are scheduled differently than UNL. "Students in Omaha"
is total credit hours for all Omaha summer sessions combined. Omaha data is for students enrolled in classes
delivered in Omaha but administered by Lincoln.
Summer Sessions, 5 Year Trend
The graph above represents the total student credit hours (all sessions combined), for each of the past f ive
summers.
44,419
43,657
42,561
44,033
45,131
40,000
41,000
42,000
43,000
44,000
45,000
46,000
47,000
48,000
49,000
50,000
2010 2011 2012 2013 2014
Tota
lS
tudent
Cre
dit H
ours
Year
20

University of Nebraska-Lincoln DEGREES
Fact Book 2013-2014
Institutional Research and Planning
04-05 05-06 06-07 07-08 08-09 09-10 10-11 11-12 12-13 13-14
4 14 8 12 8 8 6 5 6 5
3,267 3,187 3,217 3,246 3,219 3,312 3,621 3,719 3,716 3,864
768 765 764 774 804 823 825 964 830 833
9 10 11 14 7 12 8 7 5 14
0 0 0 0 0 0 0 0 1 3
26 36 38 28 31 30 49 53 29 19
0 0 4 4 8 6 5 4 8 3
138 128 124 123 133 121 129 130 122 118
Prof - Law (LLM) 0 0 0 0 1 8 5 11 8 8
234 245 270 255 257 282 287 246 325 313
4,446 4,385 4,436 4,456 4,468 4,602 4,935 5,139 5,050 5,180
Last Updated: June 16, 2014
3Post-Masters includes 6-year Graduate Education Certificates and 6-year Graduate Education Specialist
(EDS) degrees.
2Other includes 2-year certificates and associate degrees.
To match the total number of masters degrees reported to IPEDS, the Prof-Arch (Master of Architecture, or
MArch) degrees must be added to the master's category. To match the total number of doctoral degrees
reported to IPEDS, the Prof-EHS (Doctor of Audiology, or Au.D.) must be added to the doctoral degrees.
Prof - EHS
TOTAL
1Fiscal Year is July 1 through June 30, and includes the Summer (August), Fall (December) and Spring
(May) graduations.
Total Degrees Conferred by the University of Nebraska-Lincoln
by Fiscal Year1 - 10 Year Trend (2004-2005 to 2013-2014)
Prof - Law (JD)
Doctoral
Trend of UNL Degrees Conferred by Type
Degree Type
Other2
Bachelors
Masters
Post-Masters3
Prof - ARH
Prof - ANR
4,4
46
4,3
85
4,4
36
4,4
56
4,4
68 4,6
02
4,9
35
5,1
39
5,0
50 5,1
80
4,000
4,200
4,400
4,600
4,800
5,000
5,200
5,400
04-05 05-06 06-07 07-08 08-09 09-10 10-11 11-12 12-13 13-14
21

University of Nebraska-Lincoln DEGREES
Fact Book 2013-2014
Institutional Research and Planning
College Other2Bachelors Masters
Post-
Masters3Professional Doctoral Total
Agricultural Sciences &
Natural Resources495 121 3 51 670
Architecture 74 18 19 111
Arts & Sciences 998 134 110 1,242
Business Administration 772 123 10 905
Education & Human Sciences 709 273 14 3 87 1,086
Engineering 5 487 97 41 630
Fine & Performing Arts 125 43 11 179
Graduate College - Dean's
Office5 3 8
Journalism & Mass
Communications204 19 223
Law4 8 118 126
Total 5 3,864 841 14 143 313 5,180
Percent of Total 0.1% 74.6% 16.2% 0.3% 2.8% 6.0% 100.0%
Last Updated: June 16, 2014
To match the total number of masters degrees reported to IPEDS, the Prof-Arch (Master of Architecture, or
MArch) degrees must be added to the master's category. To match the total number of doctoral degrees
reported to IPEDS, the Prof-EHS (Doctor of Audiology, or Au.D.) must be added to the doctoral degrees.
2Other includes 2-year certificates and associate degrees.
1Fiscal Year is July 1 through June 30, and includes the Summer (August), Fall (December) and Spring (May)
graduations.
4Law includes the JD degree (under "Professional") and the LLM degree (under "Masters").
Degrees Conferred - Fiscal Year1
July 1, 2013 through June 30, 2014
July 1, 2013 through June 30, 2014
Type and Number of Degrees Conferred by College
3Post-Masters includes 6-year Graduate Education Certificates and 6-year Graduate Education Specialist
(EDS) degrees.
Other 0.1%Bachelors 74.6%
Masters 16.2%Post-Masters
0.3%
Doctorate 6.0%
Professional 2.8%
Total Degrees = 5,180
22

University of Nebraska-Lincoln DEGREES
Fact Book 2013-2014
Institutional Research and Planning
5 Year Trend
Semester Year Other2 Bachelors Masters
Post-
Masters3 Doctoral Professional Total
Fiscal
Year Total
Summer 2009 0 369 282 7 107 6 771
Fall 2009 1 1,016 214 4 86 12 1,333
Spring 2010 7 1,927 327 1 89 147 2,498 4,602
Summer 2010 2 344 286 2 97 4 735
Fall 2010 0 1,095 218 5 71 19 1,408
Spring 2011 4 2,182 321 1 119 165 2,792 4,935
Summer 2011 0 371 334 6 89 7 807
Fall 2011 4 1,145 247 1 67 17 1,481
Spring 2012 1 2,203 383 0 90 174 2,851 5,139
Summer 2012 0 403 277 1 104 3 788
Fall 2012 2 1,137 215 2 95 16 1,467
Spring 2013 4 2,176 338 2 126 149 2,795 5,050
Summer 2013 5 399 254 8 111 8 785
Fall 2013 0 1,198 211 3 82 14 1,508
Spring 2014 0 2,267 368 3 120 129 2,887 5,180
30 18,232 4,275 46 1,453 870 24,906
Summer 2014 0 0 0 0 0 0 0
Fall 2014 0 0 0 0 0 0 0
Spring 2015 0 0 0 0 0 0 0 0
2Other includes tw o-year certif icates and associate degrees.
Last Updated: June 16, 2014
3Post-Masters includes six-year Graduate Education Certif icates and six-year Graduate Education Specialist (EDS)
degrees.
1Fiscal Year is July 1 through June 30, and includes the Summer (August), Fall (December), and Spring (May) graduations.
Degrees Conferred by Term and Fiscal Year
In Progress: 2014-2015 Fiscal Year1
Totals
Degrees Conferred by Term and Fiscal Year1
5 Year Trend
23

University of Nebraska-Lincoln DEGREES
Fact Book 2013-2014
Institutional Research and Planning
AS Associate MAE Master of Architectural Engineering
AuD Doctor of Audiology MArch Master of Architecture
BA Bachelor of Arts MAS Master of Applied Science
BFA Bachelor of Fine Arts MAT Master of Arts for Teachers
BJ Bachelor of Journalism MBA Master of Business Administration
BLA Bachelor of Landscape Architecture MCRPMaster of Community and Regional
Planning
BM Bachelor of Music MEd Master of Education
BMEd Bachelor of Music in Education MEng Master of Engineering
BS Bachelor of Science MFA Master of Fine Arts
DMA Doctor of Musical Arts MLS Master of Legal Studies
DPlH Doctor of Plant Health MM Master of Music
DVM Doctor of Veterinary Medicine1 MPA Master of Professional Accountancy
EdD Doctor of Education MS Master of Science
EdS Educational Specialist MScT Master of Science for Teachers
JD Juris Doctor MST Master of Secondary Teaching
JSD Doctor of Juridical Sciences PhD Doctor of Philosophy
LLM Master of Laws SXCTCertificate of Specialization in Educational
Administration and Supervision
MA Master of Arts
Last Updated: June 16, 2014
Types of Degrees Currently Offered at UNL
Other degrees may be awarded than those listed here since some programs are discontinued and current
students in those programs are allowed to finish those degrees.
Contact specific department or college for minors, options, specializations, and supplemental
endorsements.
Types of Degrees
1Joint program with Iowa State University. Students complete first two years at UNL, and final two years at Iowa
State.
24

University of Nebraska-Lincoln GRADUATION AND RETENTION
Fact Book 2013-2014
Institutional Research and Planning
Entering Year 1st Year 2nd Year 3rd Year
1990 76.4% 65.1% 60.5%
1991 76.7% 65.4% 59.1%
1992 75.3% 64.5% 59.5%
1993 71.8% 63.0% 57.5%
1994 75.1% 64.7% 59.4%
1995 74.1% 64.5% 59.5%
1996 74.3% 64.3% 59.5%
1997 79.5% 67.8% 63.7%
1998 79.0% 69.7% 65.7%
1999 80.8% 72.0% 66.7%
2000 78.8% 69.9% 64.5%
2001 80.8% 69.4% 64.9%
2002 80.3% 69.4% 70.9%
2003 82.1% 74.0% 69.9%
2004 84.2% 76.2% 72.4%
2005 84.4% 76.8% 72.2%
2006 82.9% 75.5% 72.5%
2007 83.5% 76.6% 72.7%
2008 83.9% 76.7% 73.3%
2009 84.4% 76.7% 73.1%
2010 83.6% 75.7% 72.7%
2011 84.0% 76.8%
2012 83.6%
Last Updated: September 18, 2013
Student Retention Rates
Retention Tracking of First-time, Full-time Freshmen
76.4
%
76.7
%
75.3
%
71.8
% 75.1
%
74.1
%
74.3
%
79.5
%
79.0
%
80.8
%
78.8
%
80.8
%
80.3
%
82.1
% 84.2
%
84.4
%
82.9
%
83.5
%
83.9
%
84.4
%
83.6
%
84.0
%
83.6
%
65.1
%
65.4
%
64.5
%
63.0
%
64.7
%
64.5
%
64.3
% 67.8
%
69.7
%
72.0
%
69.9
%
69.4
%
69.4
%
74.0
%
76.2
%
76.8
%
75.5
%
76.6
%
76.7
%
76.7
%
75.7
%
76.8
%
60.5
%
59.1
%
59.5
%
57.5
%
59.4
%
59.5
%
59.5
%
63.7
%
65.7
%
66.7
%
64.5
%
64.9
%
70.9
%
69.9
% 72.4
%
72.2
%
72.5
%
72.7
%
73.3
%
73.1
%
72.7
%
50.0%
55.0%
60.0%
65.0%
70.0%
75.0%
80.0%
85.0%
90.0%
199
0
199
1
199
2
199
3
199
4
199
5
199
6
199
7
199
8
199
9
200
0
200
1
200
2
200
3
200
4
200
5
200
6
200
7
200
8
200
9
201
0
201
1
201
2
Re
ten
tio
n R
ate
s
1st Year 2nd Year 3rd Year
25

University of Nebraska-Lincoln GRADUATION AND RETENTION
Fact Book 2013-2014
Institutional Research and Planning
Entering Year 4 Years 5 Years 6 Years
1990 14.2% 39.4% 47.1%
1991 14.2% 39.2% 46.5%
1992 13.0% 38.2% 46.4%
1993 13.8% 39.7% 47.1%
1994 15.2% 41.2% 50.5%
1995 15.9% 44.1% 53.2%
1996 18.0% 47.7% 54.3%
1997 21.2% 52.4% 59.4%
1998 22.0% 53.8% 61.5%
1999 22.1% 54.1% 63.3%
2000 22.4% 54.8% 62.0%
2001 22.6% 55.1% 63.4%
2002 25.4% 56.5% 63.7%
2003 24.8% 55.7% 63.1%
2004 29.3% 58.0% 64.2%
2005 31.6% 60.9% 66.6%
2006 29.4% 58.0% 64.6%
2007 32.3% 61.0% 66.8%
2008 33.1% 60.6%
2009 33.0%
Last Updated: October 27, 2009
Last Updated: September 18, 2013
Student Graduation RatesGraduation of First-time, Full-time, Degree-seeking Freshmen
14.2
%
14.2
%
13.0
%
13.8
%
15.2
%
15.9
%
18.0
%
21.2
%
22.0
%
22.1
%
22.4
%
22.6
%
25.4
%
24.8
% 29.3
%
31.6
%
29.4
%
32.3
%
33.1
%
33.0
%
39.4
%
39.2
%
38.2
%
39.7
%
41.2
%
44.1
%
47.7
% 52.4
%
53.8
%
54.1
%
54.8
%
55.1
%
56.5
%
55.7
%
58.0
%
60.9
%
58.0
%
61.0
%
60.6
%
47.1
%
46.5
%
46.4
%
47.1
%
50.5
%
53.2
%
54.3
% 59.4
%
61.5
%
63.3
%
62.0
%
63.4
%
63.7
%
63.1
%
64.2
%
66.6
%
64.6
%
66.8
%
0.0%
10.0%
20.0%
30.0%
40.0%
50.0%
60.0%
70.0%
80.0%
19
90
19
91
19
92
19
93
19
94
19
95
19
96
19
97
19
98
19
99
20
00
20
01
20
02
20
03
20
04
20
05
20
06
20
07
20
08
20
09
Gra
du
atio
n R
ate
4 Years 5 Years 6 Years
26

University of Nebraska-Lincoln ACADEMIC MAJORS
Fact Book 2013-2014
Institutional Research and Planning
BA BS Other MA MS Other PhD Other
Agribusiness X
Agricultural & Biological Systems Engineering X
Agricultural Economics X X X
Agricultural Education X
Agricultural Journalism X
Agronomy X X
Agronomy & Horticulture X
Animal Science X X X
Applied Climate Science X
Applied Science X MAS
Biochemistry X X X
Biological Engineering X
Entomology X X
Environmental Restoration Science X
Environmental Studies X
Fisheries & Wildlife X
Food Science & Technology X X X
Food Technology for Companion Animals X
Forensic Science X
Grassland Ecology & Management X
Grazing Livestock Systems X
Horticulture X X
Hospitality, Restaurant & Tourism Management X1
X1
Insect Science X
Integrative Biomedical Sciences X
Leadership Education X
Mechanized Systems Management X X
Microbiology X
Natural Resource & Environmental Economics X
Natural Resource Sciences X X
PGA Golf Management X
Plant Biology X
Plant Health (professional degree) DPH
Statistics X X
Turfgrass & Landscape Management X
Veterinary Medicine (combined prof degree) DVM2
Veterinary Science (combined pre-prof program) X X
Veterinary Technology X
Water Science X
2Joint program w ith Iow a State University (ISU). Students complete f irst tw o years at UNL, and f inal tw o years at ISU.
Last Updated: January 6, 2014
More Information: http://casnr.unl.edu/w eb/CASNR/majors
1Ecotourism/Parks & Recreation option only
Programs
Note: Contact specif ic department or college for minors, options, specializations, and supplemental endorsements.
Academic Majors by College and Degree Level
College of Agricultural Sciences and Natural Resources
Bachelors Masters Doctorate
27

University of Nebraska-Lincoln ACADEMIC MAJORS
Fact Book 2013-2014
Institutional Research and Planning
BA BS Other MA MS Other PhD Other
Architectural Studies X
Architecture X
Architecture (professional degree) MArch
Community & Regional Planning MCRP
Interior Design X
Landscape Architecture BLA
Landscape Architectural Studies X
Last Updated: January 6, 2014
Note: Contact specif ic department or college for minors, options, specializations, and supplemental endorsements.
More information: http://architecture.unl.edu/programs/index.shtml
Programs
Academic Majors by College and Degree Level
College of Architecture
Bachelors Masters Doctorate
28

University of Nebraska-Lincoln ACADEMIC MAJORS
Fact Book 2013-2014
Institutional Research and Planning
BA BS Other MA MS Other PhD Other
Actuarial Science X X
Anthropology X X X
Biochemistry X X X
Biological Sciences X X X X
Chemistry X X X X
Classical Languages X
Classics & Religious Studies X X
Communication Studies X X X X
Computer Science X X X X
Dentistry (combined pre-prof program) X X
Earth & Atmospheric Sciences X X
Economics X X
English X X X X
Environmental Studies X X
Ethnic Studies X X
European Studies X X
Film Studies X X
French X X
Geography X X X X
Geology X X
German X X
Global Studies X X
Great Plains Studies Program X X
History X X X X
Individualized Program of Studies X X
Latin American Studies X X
Law (combined pre-prof program) X X
Mathematics X X X XMAT,
MScTX
Medicine (combined pre-prof program) X X
Medieval & Renaissance Studies X X
Meteorology-Climatology X X
Microbiology X
Modern Languages & Literatures X X
Pharmacy (combined pre-prof program) X X
Philosophy X X X X
Last Updated: January 6, 2014
Note: Contact specif ic department or college for minors, options, specializations, and supplemental endorsements.
More information: http://cas.unl.edu/majors.shtml
Programs
Academic Majors by College and Degree Level
College of Arts and Sciences
Bachelors Masters Doctorate
29

University of Nebraska-Lincoln ACADEMIC MAJORS
Fact Book 2013-2014
Institutional Research and Planning
BA BS Other MA MS Other PhD Other
Physics X X
Physics & Astronomy X X
Plant Biology X X
Political Science X X X X
Psychology X X X X
Russian X X
Sociology X X X X
Spanish X X
Speech-Language Pathology & Audiology X X
Statistics X X
Survey Research & Methodolgy X X
University Studies X X
Women's & Gender Studies X X
BA BS Other
Art X
Art History & Criticism X
Dance X
Music X
Theatre1 X
1Option: Performance
Last Updated: January 6, 2014
Note: Contact specif ic department or college for minors, options, specializations, and supplemental endorsements.
Bachelors
More information: http://cas.unl.edu/majors.shtml
Fine and Performing Arts majors that are offered as a SECOND
major in Arts and Sciences
Programs
Academic Majors by College and Degree Level
College of Arts and Sciences (continued)
Bachelors Masters DoctoratePrograms
30

University of Nebraska-Lincoln ACADEMIC MAJORS
Fact Book 2013-2014
Institutional Research and Planning
BA BS Other MA MS Other PhD Other
Accountancy X MPA
Actuarial Science X X
Agribusiness X
Business (interdepartmental) X MBA X
Business Administration X
Economics X X X
Finance X2
International Business X
Management X3
Marketing X
Supply Chain Management X
Survey Research & Methodology X X
Last Updated: January 6, 2014
Note: Contact specif ic department or college for minors, options, specializations, and supplemental endorsements.
More information: http://cba.unl.edu/programs/default.aspx
2Options include: Banking & Fin Inst; CFA-Investments; Risk Mngt/Insurance (Raikes options available)
1Raikes Program options: Accounting; Actuarial Science; Business Administration; Economics; Finance; International Business;
Management; Marketing; Supply Chain Management
3Options include: Entrepren & Innov; Human Res Mngt; Ldrship in Organizations (Raikes options available)
Academic Majors by College and Degree Level
College of Business Administration
Bachelors1 Masters Doctorate
Programs
31
University of Nebraska-Lincoln ACADEMIC MAJORS
Fact Book 2013-2014
Institutional Research and Planning
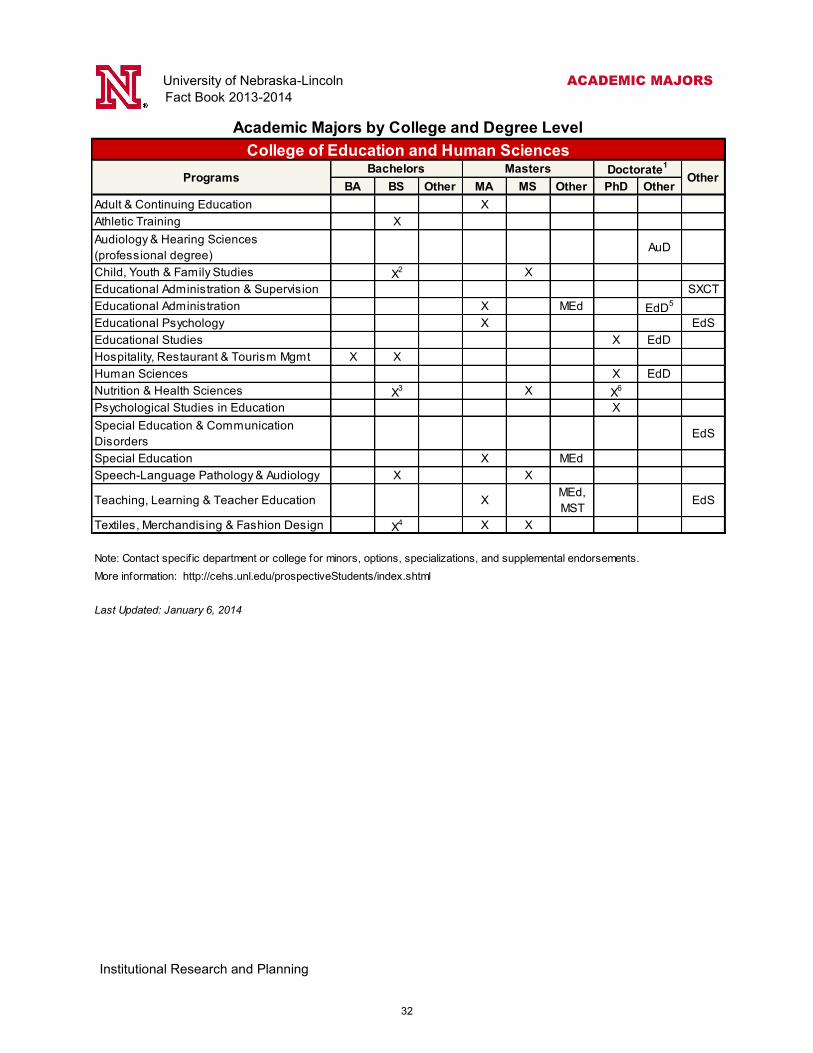
BA BS Other MA MS Other PhD Other
Adult & Continuing Education X
Athletic Training X
Audiology & Hearing Sciences
(professional degree)AuD
Child, Youth & Family Studies X2 X
Educational Administration & Supervision SXCT
Educational Administration X MEd EdD5
Educational Psychology X EdS
Educational Studies X EdD
Hospitality, Restaurant & Tourism Mgmt X X
Human Sciences X EdD
Nutrition & Health Sciences X3 X X
6
Psychological Studies in Education X
Special Education & Communication
DisordersEdS
Special Education X MEd
Speech-Language Pathology & Audiology X X
Teaching, Learning & Teacher Education XMEd,
MSTEdS
Textiles, Merchandising & Fashion Design X4 X X
More information: http://cehs.unl.edu/prospectiveStudents/index.shtml
Last Updated: January 6, 2014
Note: Contact specif ic department or college for minors, options, specializations, and supplemental endorsements.
Academic Majors by College and Degree Level
College of Education and Human SciencesBachelors Masters Doctorate
1
OtherPrograms
32

University of Nebraska-Lincoln ACADEMIC MAJORS
Fact Book 2013-2014
Institutional Research and Planning
Last Updated: January 6, 2014
5The EdD in Educational Administration is a joint program w ith the University of Nebraska at Omaha.
3Options include: Culinary Science; Nutrition & Dietetics; Nutrition, Exercise & Health Sciences; Nutrition Science
6The Department of Nutrition and Health Sciences also participates in the Interdepartmental Nutrition major (MS and PhD)
4Options include: Communications; Fashion Design; Merchandising; Textile Science
2Options include: Child Development/Early Childhood Education; Child, Youth & Family Studies/Journalism; Family & Consumer
Science Education; Family Science; Inclusive Early Childhood Education
College of Education and Human Sciences Footnotes
1College of Education & Human Sciences (CEHS) offers tw o doctoral degrees, both the EdD and the PhD, under three
majors: educational studies, human sciences, and psychological studies in education. In addition, CEHS participates in three
additional doctoral majors (audiology, educational administration, and nutrition).
The Educational Studies major includes six specializations. Instructional Technology; Internet-based Education; and
Teaching, Curriculum & Learning are hosted by the Dept of Teaching, Learning & Teacher Education. Special Education is
sponsored by the Dept of Special Education & Communication Disorders. The Dept of Educational Administration hosts
Educational Leadership & Higher Education and co-hosts Architecture Education w ith Architecture.
The Human Sciences major includes six specializations. Communication Disorders is housed in the Dept of Special
Education & Communication Disorders; Child, Youth and Family Studies and Gerontology are sponsored by the Dept of Child,
Youth and Family Studies; Nutrition & Health Sciences is hosted by the Dept of Nutrition & Health Sciences; Textiles, Clothing
& Design is based in the Dept of Textiles, Clothing & Design; and Leadership Studies is housed in the Dept of Agricultural
Leadership, Education & Communication.
The Psychological Studies in Education major includes four specializations, all hosted by the Dept of Educational
Psychology: Cognition, Learning & Development; Counseling Psychology; Qualitative & Quantitative Psychometric Methods
in Education; and School Psychology.
33

University of Nebraska-Lincoln ACADEMIC MAJORS
Fact Book 2013-2014
Institutional Research and Planning
Biology Education, 7-12 Inclusive Early Childhood Education, Birth-3
Business, Marketing & IT Education, 6-12 Language Arts Education, 7-12
Chemistry Education, 7-12 Latin Education, 7-12
Early Care & Education, Birth-K Mathematics Education, 7-12
Earth & Space Science Education, 7-12 Natural Science Education, 7-12
Elementary Educ & Deaf or Hard of Hearing Educ, K-6 Physics Education, 7-12
Elementary Educ & Mild/Moderate Disabilities, K-6 Russian Education, 7-12
Elementary Education, K-6 & Early Childhood
Education, Birth-KScience Education, 7-12
Elementary Education, K-6 Social Science Education, 7-12
English Education, 7-12 Spanish Education, 7-12
English/Journalism & Mass Comm Education, 7-12 Special Education-Mild/Moderate Disabilities, 7-12
Family & Consumer Science Education, 6-12 Speech & English Education, 7-12
French Education, 7-12 Theatre & English Education 7-12
German Education, 7-12
English as a Second Language, K-12
Last Updated: January 6, 2014
Teaching Endorsements in College of Education and Human Sciences
Supplemental Endorsements in College of Education and Human Sciences
Note: Contact specific department or college for minors, options, specializations, supplemental
endorsements, and graduate-level endorsements.
Coaching, 7-12
Cooperative Education (Diversified Occupations, 9-12)
Skilled & Technical Science Education, 9-12
Information Technology, K-12
34

University of Nebraska-Lincoln ACADEMIC MAJORS
Fact Book 2013-2014
Institutional Research and Planning
BA BS Other MA MS Other PhD Other
Agricultural & Biological Systems Engineering X
Agricultural Engineering X
Architectural Engineering (Omaha) X X MARE X
Biological Engineering X
Biological Systems Engineering X
Chemical Engineering X X
Chemical & Biomolecular Engineering X
Civil Engineering X X X
Civil Engineering (Omaha) X
Computer Engineering X
Computer Engineering (Omaha) X
Construction X
Construction Engineering X
Construction Engineering (Omaha) X
Construction Management X
Construction Management (Omaha) X
Electrical Engineering X X X
Electronics Engineering (Omaha) X
Engineering MEng X1
Environmental Engineering X
Interdisciplinary Studies X
Mechanical Engineering X
Mechanical Engineering and Applied Mechanics X X
Telecommunications Engineering X
http://engineering.unl.edu/graduate-programs/
Last Updated: January 6, 2014
More information: http://engineering.unl.edu/prospective-undergraduate/majors.shtml
Programs
Note: Contact specif ic department or college for minors, options, specializations, and supplemental endorsements.
Academic Majors by College and Degree Level
College of Engineering
Bachelors Masters Doctorate
1Specializations in unif ied Engineering PhD include: Biomedical Engineering; Computer Engineering; Construction; Materials
Engineering
35

University of Nebraska-Lincoln ACADEMIC MAJORS
Fact Book 2013-2014
Institutional Research and Planning
BA BS Other MA Other PhD Other
Art X BFA MFA
Art History X
Art History & Criticism X
Dance X
Interdisciplinary Studies X
Music X BM MM X DMA
Music Education BMEd
Theatre / Theatre Arts X1
BFA2 MFA
1Option: Performance2Options include: Design/Technical Production; Film & New Media
BA BS Other
Anthropology X
Biological Sciences X
Chemistry X
Classics & Religious Studies X
Communication Studies X
Economics X
English X
Environmental Studies X
Film Studies X
French X
Geography X
Geology X
German X
Global Studies X
Great Plains Studies Program X
History X
Interdisciplinary Studies X
Mathematics X
Philosophy X
Political Science X
Psychology X
Sociology X
Spanish X
Speech-Language Pathology & Audiology X
University Studies X
Women's & Gender Studies X
Note: Contact specif ic department or college for minors, options, specializations, and supplemental endorsements.
More information: http://w w w .unl.edu/f inearts/students/degrees/
Academic Majors by College and Degree Level
Hixson-Lied College of Fine and Performing Arts
Bachelors Masters DoctoratePrograms
Arts and Sciences Majors that are offered as a SECOND major
in Fine and Performing Arts
BachelorsPrograms
36

University of Nebraska-Lincoln ACADEMIC MAJORS
Fact Book 2013-2014
Institutional Research and Planning
BA BS Other MA MS Other PhD Other
Legal Studies MLS
Nutrition X X
Note: Contact specif ic department or college for minors, options, specializations, and supplemental endorsements.
Last Updated: January 6, 2014
Academic Majors by College and Degree Level
Graduate Studies (Dean's Office)
Bachelors Masters DoctoratePrograms
37

University of Nebraska-Lincoln ACADEMIC MAJORS
Fact Book 2013-2014
Institutional Research and Planning
BA BS Other MA MS Other PhD Other
Advertising & Public Relations BJ
Broadcasting BJ
Journalism BJ
Journalism & Mass Communications X
Note: Contact specif ic department or college for minors, options, specializations, and supplemental endorsements.
Programs
BA BS Other
Anthropology BJ
Biological Sciences BJ
Chemistry BJ
Classics & Religious Studies BJ
Communication Studies BJ
Computer Science BJ
Economics BJ
English BJ
Ethnic Studies BJ
Film Studies BJ
French BJ
Geography BJ
Geology BJ
German BJ
Global Studies BJ
Great Plains Studies Program BJ
History BJ
Mathematics BJ
Philosophy BJ
Political Science BJ
Psychology BJ
Sociology BJ
Spanish BJ
Speech-Language Pathology & Audiology BJ
Women's & Gender Studies BJ
Last Updated: January 6, 2014
Bachelors
Programs
Arts and Sciences Majors that are offered as a SECOND major
in Journalism and Mass Commmunications
More information: http://journalism.unl.edu/undergraduate, http://journalism.unl.edu/graduate
Academic Majors by College and Degree Level
College of Journalism and Mass Communications
Bachelors Masters Doctorate
38

University of Nebraska-Lincoln ACADEMIC MAJORS
Fact Book 2013-2014
Institutional Research and Planning
BA BS Other MA MS Other PhD Other
Law (professional degree) JD
Legal Studies MLS
Space, Cyber & Telecommunications Law
(professional degree)LLM
Space Law JSD
Last Updated: January 6, 2014
More information: http://law .unl.edu/academics/degree_programs.shtml
Programs
Note: Contact specif ic department or college for minors, options, specializations, and supplemental endorsements.
Academic Majors by College and Degree Level
College of Law
Bachelors Masters Doctorate
39

University of Nebraska-Lincoln STUDENT TUITION AND FEES Fact Book 2013-2014
Institutional Research and Planning
Undergraduate Tuition (Course Numbers 100-499) Resident Non-Resident
UNL College of Business Administration Courses $268.00 $817.25 UNL College of Engineering Courses (includes CSCE, AGEN, BSEN) $309.50 $860.00 UNL College of Architecture Classes $292.00 $844.00 All Other UNL Undergraduate Courses $216.00 $660.25 Criminal Justice, Gerontology, and Public Administration (UNO) $196.75 $598.00
Graduate Tuition (Course Numbers 800-999) Resident Non-Resident
UNL College of Business Administration Courses $352.50 $978.75 UNL College of Engineering Courses (includes CSCE, AGEN, BSEN) $394.00 $1,021.50 UNL College of Architecture Classes $377.75 $1,007.25 All Other UNL Graduate Courses $285.00 $791.75 Criminal Justice, Gerontology, and Public Administration (UNO) $245.25 $665.00
Professional Tuition (Course Numbers 500-799) Resident Non-Resident
Architecture $377.75 $1,007.25Law $339.00 $869.75Law - Space and Telecommunications (flat rate per semester) $12,500.00 $12,500.00Veterinary Medicine (flat rate per semester) $9,576.00 $9,576.00
Source: http://studentaccounts.unl.edu/2013-2014-rates-personon-campus-courses
Last Updated: August 21, 2013
2013-2014 Tuition Rates
Statements concerning tuition and fees in this schedule are by way of announcement only and are not to be regarded as an offer of contract. UNL expressly reserves the right to change any and all fees and/or tuition and other charges at any time without notice in advance of such a change. Shown below are the per
credit hour tuition rates.
For Students Enrolled in "In Person/On Campus" Courses Only
40

University of Nebraska-Lincoln STUDENT TUITION AND FEES Fact Book 2013-2014
Institutional Research and Planning
Undergraduate Tuition (Course Numbers 100-499) Resident Non-Resident
UNL College of Business Administration (CBA) Courses $268.00 $817.25UNL College of Engineering (ENGR) Courses (includes CSCE, AGEN, BSEN) $309.50 $860.00UNL College of Architecture (ARCH) Courses $292.00 $844.00All Other UNL Undergraduate Courses $216.00 $660.25Criminal Justice, Gerontology, and Public Administration (UNO) $196.75 $598.00Distance Education "EF"/Field Courses, CBA $268.00 $268.00Distance Education "EF/Field Courses, All Other $216.00 $216.00Distance Education "ES"/Online Distance Courses, CBA $268.00 $841.00Distance Education "ES"/Online Distance Courses, ENGR $309.50 $885.00Distance Education "ES"/Online Distance Courses, ARCH $292.00 $844.00Distance Education "ES"/Online Distance Courses, All Other $254.25 $679.50Distance Education "ES"/Online Distance Courses (UNO) $250.00 $463.50Distance Education "ES"/Online Distance Courses (UNO Criminal Justice) $250.00 $368.00Distance Education "EX"/Online Class, On-Campus Testing Courses, CBA $268.00 $841.00Distance Education "EX"/Online Class, On-Campus Testing Courses, ENGR $309.50 $885.00Distance Educaton: "EX"/Online Class, On-Campus Testing Courses, ARCH $292.00 $844.00Distance Educaton: "EX"/Online Class, On-Campus Testing Courses, All Other "EX" Courses $254.25 $679.50Distance Education "EX"/Online Class, On-Campus Testing Courses (UNO) $250.00 $463.50
"ES" = Online Distance Course"EX" = Online Class, On-campus Testing Course"EF" = Field Course
Continued on Next Page.
2013-2014 Tuition Rates
Last Updated: August 21, 2013
For Students Enrolled in a Combination of "In Person/On Campus" Courses and
"Online/Distance Education" Courses
Statements concerning tuition and fees in this schedule are by way of announcement only and are not to be regarded as an offer of contract. UNL expressly reserves the right to change any and all fees and/or tuition and other charges at any time without notice in advance of such a change. Shown below are the per
credit hour tuition rates.
Source: http://studentaccounts.unl.edu/2013-2014-rates-students-enrolled-combination-course-types
41

University of Nebraska-Lincoln STUDENT TUITION AND FEES Fact Book 2013-2014
Institutional Research and Planning
Graduate Tuition (Course Numbers 800-999) Resident Non-Resident
UNL College of Business Administration (CBA) Courses $352.50 $978.75UNL College of Engineering (ENGR) Courses (includes CSCE, AGEN, BSEN) $394.00 $1,021.50UNL College of Architecture (ARCH) Courses $377.75 $1,007.25All Other UNL Graduate Courses $285.00 $791.75Criminal Justice, Gerontology, and Public Administration (UNO) $245.25 $665.00Distance Education "EF"/Field Courses, CBA $352.50 $352.50Distance Education "EF"/Field Courses, All Other $285.00 $285.00Distance Education "ES"/Online Distance Courses, CBA $352.50 $990.75Distance Education "ES"/Online Distance Courses, ENGR $394.00 $1,075.75Distance Education "ES"/Online Distance Courses, ARCH $377.75 $1,007.25Distance Education "ES"/Online Distance Courses, CASNR, EDAD, EDPS, JOUR $325.50 $815.00Distance Education "ES"/Online Distance Courses, All Other $321.75 $815.00Distance Education "ES"/Online Distance Courses (UNO) $318.00 $535.50
Professional Tuition (Course Numbers 500-799) Resident Non-Resident
Architecture $377.75 $1,007.25Law $339.00 $869.75Law - Space and Telecommunications (flat rate per semester) $12,500.00 $12,500.00Veterinarian Medicine (flat rate per semester) $9,576.00 $9,576.00Distance Education "ES"/Online Distance Courses, College of Law, L.L.M. $1,541.00 $1,541.00
"ES" = Online Distance Course"EX" = Online Class, On-campus Testing Course"EF" = Field Course
2013-2014 Tuition Rates
For Students Enrolled in a Combination of "In Person/On Campus" Courses and
"Online/Distance Education" Courses
Statements concerning tuition and fees in this schedule are by way of announcement only and are not to be regarded as an offer of contract. UNL expressly reserves the right to change any and all fees and/or tuition and other charges at any time without notice in advance of such a change. Shown below are the per
credit hour tuition rates.
Last Updated: August 21, 2013
(continued)
Source: http://studentaccounts.unl.edu/2013-2014-rates-students-enrolled-combination-course-types
42

University of Nebraska-Lincoln STUDENT TUITION AND FEES Fact Book 2013-2014
Institutional Research and Planning
High School Concurrent Resident Non-Resident
"EH"/High School Courses $100.00 $225.50
Undergraduate Tuition Resident Non-Resident
Distance Education "ES"/Online Distance Courses, CBA $271.25 $851.25Distance Education "ES"/Online Distance Courses, ENGR $313.25 $895.75Distance Education "ES"/Online Distance Courses, ARCH $292.00 $750.00Distance Education "ES"/Online Distance Courses, CEHS $257.25 $473.00Distance Education "ES"/Online Distance Courses, All Others $257.25 $501.25Distance Education "ES"/Online Distance Courses, Gerontology, Public Administration, Social Work (UNO) $250.00 $463.50Distance Education "ES"/Online Distance Class, Criminal Justice (UNO) $250.00 $368.00
Graduate/Professional Tuition Resident Non-Resident
Distance Education "ES"/Online Distance Courses, CBA $356.75 $990.75Distance Education "ES"/Online Distance Courses, ENGR $398.75 $1,075.75Distance Education "ES"/Online Distance Courses, ARCH $377.75 $844.00Distance Education "ES"/Online Distance Courses, CASNR, EDAD, EDPS, JOUR $325.50 $609.00Distance Education "ES"/Online Distance Courses, All Other CEHS Depts $325.50 $507.00Distance Education "ES"/Online Distance Courses, College of Law, L.L.M. $1,541.00 $1,541.00Distance Education "ES"/Online Distance Courses, All Other $325.50 $537.75Distance Education "ES"/Online Distance Class, Criminal Justice, Gerontology, Public Administration, Social Work (UNO) $318.00 $535.50
"ES" = Online Distance Course"EX" = Online Class, On-campus Testing Course"EF" = Field Course
Source: http://studentaccounts.unl.edu/2013-2014-rates-onlinedistance-education-courses
Last Updated: August 21, 2013
2013-2014 Tuition Rates
Statements concerning tuition and fees in this schedule are by way of announcement only and are not to be regarded as an offer of contract. UNL expressly reserves the right to change any and all fees and/or tuition and other charges at any time without notice in advance of such a change. Shown below are the per
credit hour tuition rates.
For Students Enrolled in "Online/Distance Education" Courses
Courses using satellite transmission, video-conferencing, web-based instruction, Lotus Notes or Blackboard software, desktop video-conferencing, and video-streaming technologies are examples of online and/or off-campus distance education offerings at UNL.
43

University of Nebraska-Lincoln STUDENT TUITION AND FEES Fact Book 2013-2014
Institutional Research and Planning
Hours of Enrollment Rate
1 to 6 hours $301.007 or more hours $557.00
Late Payment Fee: A late payment fee of $20 is assessed each month on delinquent accounts by the Office of Student Accounts.
Ncard/Student ID Fee: A charge of $20 is assessed for your original NCard, and each time a replacement card is needed.
Health Insurance: All nonimmigrant international students must have health insurance as a condition of their enrollment and will be automatically billed for health insurance, $678.00 for the fall term and $1,076.00 for the spring term, on their billing statements. Nonimmigrant international students taking less than seven credit hours will also be assessed the Health Center fee, $144.28 each semester, on their billing statement. For those taking seven or more credit hours this fee is already paid as a part of their University Program and Facilities Fee.
Explanation of 2013-2014 University Fees
University Program and Facilities Fees: In addition to tuition, all enrolled students (except students enrolled only in Distance Education "ES"/Online Distance Class, "EF"/Field, and "EX"/Online Class On-campus testing) must pay University Program and Facilities Fees based on their total hours of enrollment each semester. The rates are as listed below:
Technology Fee: A $7.35 per credit hour fee with a $110.25 limit each semester is assessed to provide information technology resources to all UNL students.
Law Library Fee: A Law College library and professional skills fee of $1,050 per semester will be assessed to Law students.
Library Fee: $4 per credit hour.
Last Updated: August 21, 2013
Source: http://studentaccounts.unl.edu/2013-2014-rates-personon-campus-courses
Course Fees: Courses with a special fee are listed in the Schedule of Classes followed by the notation, "Special Fee" and a dollar amount.
Registration Fee: A registration fee of $20 is due each semester a student registers for classes.Late Registration Fee: A $25 fee is due for processing an initial registration during the Late Registration period.
New International Graduate Student Fee: A one-time $150 fee is due the first semester an international graduate student is enrolled.
International Student Fee: A $120 fee is due each semester for international undergraduate students. A $70 fee is due each semester for international graduate students.
44

University of Nebraska-Lincoln STUDENT TUITION AND FEES Fact Book 2013-2014
Institutional Research and Planning
Period of Enrollment* Period of Enrollment* Chargeable
Fall 2013 Spring 2014 Tuition & Fees
August 26 - September 3 January 13 - 21 0%September 4 - 6 January 22 - 24 25%September 7 - 13 January 25 - 31 50%September 14 - 20 February 1 - 7 75%After September 20 After February 7 100%
Semester Due Date
Fall 2013 September 12, 2013Spring 2014 February 12, 2014
Source: http://studentaccounts.unl.edu/2013-2014-rates-personon-campus-courses
2013-2014 Tuition and Fees Refund Policy
Tuition and Fee Due Date
Dates and Percentages of Refunds
Last Updated: August 21, 2013
Fall Semester: Students who withdraw from, or drop, all first semester courses on or before September 3, 2013 will not incur any charges. For courses officially dropped or withdrawals processed after September 3rd, a portion or all of the tuition and fees will be charged, depending on the date of the drop or withdrawal. The following percentages determine the amount of tuition and fees to be charged for dropped courses or withdrawals from the University.
Spring Semester: Students who withdraw from, or drop, all second semester courses on or before January 21, 2014 will not incur any charges. For courses officially dropped or withdrawals processed after January 21st, a portion or all of the tuition and fees will be charged, depending on the date of the drop or withdrawal. The following percentages determine the amount of tuition and fees to be charged for dropped courses or withdrawals from the University.
*The official period of enrollment is the time from the beginning of the semester through the day you drop or withdraw on MyRED, or file your "Drop/Add Form" or "Cancellation/Withdrawal Form" with the Office of the University Registrar, 107 Canfield Administration Building. Only in the case of a timely notification of unexpected hospitalization of the student, the death of a member of the student's immediate family living in the student's household, or a University error may the effective date of the drop or withdrawal be adjusted to the date of the occurrence of the event. Proper documentation will be required to determine the adjusted effective date.
This listing does not include all fees which may be assessed by the University of Nebraska-
Lincoln.
45

University of Nebraska-Lincoln STUDENT TUITION AND FEES Fact Book 2013-2014
Institutional Research and Planning
Rate Semester Annual Rate Semester Annual
Tuition (per credit hour) $216.00 $3,240.00 $6,480.00 $660.25 $9,903.75 $19,807.50Technology Fee (per credit hour) $7.35 $110.25 $220.50 $7.35 $110.25 $220.50Library Fee (per credit hour) $4.00 $60.00 $120.00 4.00 $60.00 $120.00Registration Fee (per semester) $20.00 $20.00 $40.00 $20.00 $20.00 $40.00University Program and Facilities Fees (per semester) $557.00 $557.00 $1,114.00 $557.00 $557.00 $1,114.00Course Fees (estimated per semester) $50.00 $50.00 $100.00 $50.00 $50.00 $100.00Subtotal $4,037.25 $8,074.50 $10,701.00 $21,402.00
*Housing $4,766.00 $4,766.00 $9,532.00 $4,766.00 $4,766.00 $9,532.00Estimated Totals $8,803.25 $17,606.50 $15,467.00 $30,934.00
Rate Semester Annual Rate Semester Annual
Tuition (per credit hour $285.00 $2,565.00 $5,130.00 $791.75 $7,125.75 $14,251.50Technology Fee (per credit hour) $7.35 $66.15 $132.30 $7.35 $66.15 $132.30Library Fee (per credit hour) $4.00 $36.00 $72.00 $4.00 $36.00 $72.00Registration Fee (per semester) $20.00 $20.00 $40.00 $20.00 $20.00 $40.00University Program and Facilities Fees (per semester) $557.00 $557.00 $1,114.00 $557.00 $557.00 $1,114.00Course Fees (estimated per semester) $25.00 $25.00 $50.00 $25.00 $25.00 $50.00
$3,269.15 $6,538.30 $7,829.90 $15,659.80
*Housing $4,766.00 $4,766.00 $9,532.00 $4,766.00 $4,766.00 $9,532.00Estimated Totals $8,035.15 $16,070.30 $12,595.90 $25,191.80
Source: http://studentaccounts.unl.edu/tuitionfee/13-14/example
Last Updated: August 21, 2013
Cost Examples for the 2013-2014 Academic Year
Undergraduate Student
Graduate Student
Subtotal
*Room and Board charges listed are for a traditional double room, 7 day meal plan. NOTE: Cost per semester is not equally split as is shown here. See Housing for a breakdown by specific term.
Below is an example of costs you may be charged at UNL. This is an estimation and may vary by student.
Tuition and Required Fees
Undergraduate: Estimate for enrollment of 15 credit hours per semester at the base in-person rate. Annual costs are based on two semesters of enrollment. Please refer to Tuition and Fees Schedule for other rates, such as CBA, ENGR, ARCH or Dist Ed.
Nonresident
Nonresident
Tuition and Required Fees
Resident
Graduate: Estimation for enrollment of 9 credit hours per semester at the base in-person rate. Annual costs are based on two semesters of enrollment. Please refer to Tuition and Fees Schedule for other rates, such as CBA, ENGR, ARCH or Dist Ed.
Resident
46

University of Nebraska-Lincoln STUDENT TUITION AND FEES Fact Book 2013-2014
Institutional Research and Planning
Per Student
Per Semester
Assessment*
Percent of
Total A/B
Funds
Projected
Annual
Revenue
10.72 1.9% $490,8492.78 0.5% $121,5000.15 0.0% $6,4003.06 0.5% $140,0005.50 1.0% $251,754
22.21 4.0% $1,010,503
132.48 23.8% $6,067,63220.00 3.6% $916,0000.58 0.1% $22,110
111.50 20.0% $4,245,62690.76 16.3% $4,156,9043.49 0.6% $160,000
25.09 4.5% $1,148,912144.28 25.9% $5,800,044
6.61 1.2% $302,883534.79 96.0% $22,820,111
$ 557.00 100.0% $23,830,614
Source: University Program and Facilities Fee, 2013-2014 Academic Year
Last Updated: August 21, 2013
*Based on 7 or more credit hours per semester. Enrollments of 1 to 6 credit hours per semester are assessed fees of $301.00. Note: Students may request a refund of part or all of the Fund A assessments.
ASUN (Student Government)
DailyER Nebraskan
University Program Council - Lied Center DiscountsUniversity Program Council - ProgrammingFund A Total
Campus Recreation - Programs and General Operations
Nebraska Unions - General Operations
Total for Funds A and B
Nebraska Unions - Newspaper ProgramTransit ServicesUniversity Health Center - General OperationsUniversity Health Center - Counseling and Psychological Svs
Daily Nebraskan
Allocation of Student Fees Per Student 2013-2014
Fund B Total
Fund
Fund A (Student Organizations)
Fund B (Institutional Obligations and Student Services Agencies)
Campus Recreation - Repair and Improvement of Facilities
Debt Service on FacilitiesContingency Fund
Allocation of Fees Per Student 2013-2014
0.0%
0.1%
0.5%
0.5%
0.6%
1.0%
1.2%
1.9%
3.6%
4.5%
16.3%
20.0%
23.8%
25.9%
DailyER Nebraskan
Contingency Fund
Daily Nebraskan
Lied Center Discounts
Nebraska Unions - Newspaper Program
University Program Council
University Health Center - Counsel / Psych Services
ASUN (Student Government)
Campus Recreation Programs - Repair / Improve Facilities
Transit Services
Nebraska Unions - General Operations
Debt Services on Facilities
Campus Recreation Programs - Programs / General Ops
University Health Center - General Operations
0% 5% 10% 15% 20% 25% 30%
47

University of Nebraska-Lincoln STUDENT TUITION AND FEES Fact Book 2013-2014
Institutional Research and Planning
2009-10 2010-11 2011-12 2012-13 2013-14
Resident Tuition $5,610.00 $5,947.50 $6,247.50 $6,480.00 $6,480.00Non-Resident Tuition $16,650.00 $17,647.50 $18,532.50 $19,230.00 $19,807.50Required Fees $1,246.70 $1,276.30 $1,314.50 $1,416.50 $1,494.50Room and Board (on campus) $7,260.00 $7,660.00 $8,196.00 $8,648.00 $8,803.25
Resident Tuition $187.00 $198.25 $208.25 $216.00 $216.00Non-Resident Tuition $555.00 $588.25 $617.75 $641.00 $660.25
HEPI $279.30 $281.80 $288.40 $293.20 $297.80
Last Updated: August 21, 2013
HEPI Data Source: http://www.commonfund.org/CommonfundInstitute/HEPI/HEPI%20Documents/HEPI_2013_Table.pdf
More information about HEPI: http://www.commonfund.org/CommonfundInstitute/HEPI/Pages/default.aspx
Undergraduate Full-Time Tuition, Required Fees, Room and Board
5 Year Trend1
1Typical tuition, required fees, and base room and board for a full-time, undergraduate student, for the full academic year, as reported for the Common Data Set.
2Higher Education Price Index (HEPI) measures the average relative level in the prices of a fixed market basket of goods and services purchased by colleges and universities each year through current fund educational and general expenditures excluding expenditures for research. It is a tool enabling schools to determine increases in funding necessary to maintain real purchasing power and investment. HEPI and major component values are reported for fiscal years 1961 through the latest completed fiscal year.
Undergraduate Tuition, Fees, Room and Board
Undergraduate Per Credit Hour Tuition
Higher Education Price Index2
$5,610.00 $5,947.50 $6,247.50 $6,480.00 $6,480.00
$16,650.00$17,647.50
$18,532.50$19,230.00
$19,807.50
0
3,000
6,000
9,000
12,000
15,000
18,000
21,000
24,000
2009-10 2010-11 2011-12 2012-13 2013-14
Resident Tuition Non-Resident Tuition
48

University of Nebraska-Lincoln STUDENT FINANCIAL AID
Fact Book 2013-2014
Institutional Research and Planning
Me
ets
Ne
ed
No
n-N
ee
dM
ee
ts N
ee
dN
on
-Ne
ed
Me
ets
Ne
ed
No
n-N
ee
d
Federa
l$23,1
46,3
90
$886,5
50
$18,1
82,0
79
$138,7
42
$17,5
25,2
13
$89,6
79
Sta
te$3,2
87,2
46
$0
$2,8
03,7
70
$0
$3,0
48,8
75
$0
Institu
tional1
$23,1
12,7
46
$21,6
72,9
69
$21,5
52,8
10
$21,4
41,3
65
$21,0
83,8
52
$23,8
89,1
75
Exte
rnal S
ourc
e S
chola
rship
s
and G
rants
$9,7
18,4
46
$3,1
26,5
36
$10,0
75,2
51
$2,4
84,4
84
$10,1
47,4
39
$2,9
75,7
50
To
tal
Sch
ola
rsh
ips/
Gra
nts
$59,2
64,8
28
$25,6
86,0
55
$52,6
13,9
10
$24,0
64,5
91
$51,8
05,3
79
$26,9
54,6
04
Loans fro
m a
ll S
ourc
es
(exclu
din
g p
are
nt
loans)
$48,9
47,7
45
$24,7
44,9
28
$42,1
48,0
89
$14,9
28,4
52
$40,9
47,4
66
$14,0
74,5
17
Federa
l W
ork
-Stu
dy
$2,9
73,0
27
$0
$2,3
57,2
14
$0
$2,6
34,3
95
$0
To
tal
Se
lf-H
elp
$51,9
20,7
72
$24,7
44,9
28
$44,5
05,3
03
$14,9
28,4
52
$43,5
81,8
61
$14,0
74,5
17
Pare
nt
Loans
$15,7
20,3
08
$16,9
30,8
65
$16,1
13,5
51
$14,5
77,0
64
$15,8
29,0
76
$15,6
66,8
13
Ath
letic A
ward
s$0
$8,9
05,0
59
$0
$8,0
08,6
35
$0
$7,8
38,3
43
To
tal
Oth
er
$15,7
20,3
08
$25,8
35,9
24
$16,1
13,5
51
$22,5
85,6
99
$15,8
29,0
76
$23,5
05,1
56
Su
bto
tal
$126,9
05,9
08
$76,2
66,9
07
$113,2
32,7
64
$61,5
78,7
42
$111,2
16,3
16
$64,5
34,2
77
To
tal
Perc
ent
of gra
duating c
lass w
ho
borr
ow
ed a
t any t
ime t
hro
ugh a
ny
loan p
rogra
m.
Ave
rage c
um
ula
tive
debt
of
gra
duate
s.
$174,8
11,5
06
Th
ree
Ye
ar
Tre
nd
Last U
pdate
d: D
ecem
ber
11, 2013
2011-2
012
To
tals
Stu
de
nt
Fin
an
cia
l A
id A
wa
rds
by
Ty
pe
Sourc
e:
Com
mon D
ata
Set,
Fin
ancia
l A
id H
1,
H4,
H5
2010-2
011
1In
stitu
tional in
clu
des e
ndow
ed s
chola
rship
s,
annual gift
s a
nd t
uitio
n funded g
rants
, aw
ard
ed b
y t
he c
olle
ge,
exclu
din
g a
thle
tic a
id a
nd
tuitio
n w
aiv
ers
.
60%
60%
$21,9
60
$23,2
80
2012-2
013
Sch
ola
rsh
ips
an
d G
ran
ts
Se
lf-H
elp
Oth
er
$203,1
72,8
15
$175,7
50,5
93
59%
$23,9
51
49

University of Nebraska-Lincoln FALL ENROLLMENT Fact Book 2013-2014
Institutional Research and Planning
1931-32 1932-33 1933-34 1934-35 1935-36 1936-37 1937-38 1938-39 1939-40
5,945 5,413 5,093 5,075 6,230 6,552 6,595 5,752 6,7791940-41 1941-42 1942-43 1943-44 1944-45 1945-46 1946-47 1947-48 1948-49 1949-50
6,491 5,823 5,288 3,035 3,265 4,266 9,648 10,153 10,073 9,4161950-51 1951-52 1952-53 1953-54 1954-55 1955-56 1956-57 1957-58 1958-59 1959-60
8,033 6,952 6,684 6,771 7,197 7,899 8,425 8,134 8,356 8,4111960-61 1961-62 1962-63 1963-64 1964-65 1965-66 1966-67 1967-68 1968-69 1969-70
8,711 9,436 10,401 11,466 12,901 15,179 17,051 18,067 19,150 19,6181970-71 1971-72 1972-73 1973-74 1974-75 1975-76 1976-77 1977-78 1978-79 1979-80
20,810 21,541 21,581 21,160 20,892 22,380 22,179 22,256 22,477 23,6611980-81 1981-82 1982-83 1983-84 1984-85 1985-86 1986-87 1987-88 1988-89 1989-90
24,128 24,786 25,075 24,789 24,228 24,020 23,899 23,469 23,985 23,9261990-91 1991-92 1992-93 1993-94 1994-95 1995-96 1996-97 1997-98 1998-99 1999-00
24,453 24,620 24,573 24,491 23,854 24,320 23,887 22,827 22,408 22,1422000-01 2001-02 2002-03 2003-04 2004-05 2005-06 2006-07 2007-08 2008-09 2009-10
22,268 22,764 22,988 22,559 21,792 21,675 22,106 22,973 23,573 24,1002010-11 2011-12 2012-13 2013-14 2014-15 2015-16 2016-17 2017-18 2018-19 2019-20
24,610 24,593 24,207 24,445
Last Updated: September 9, 2013
Total Enrollment
Fall Semesters, 1931-1932 to 2013-2014
UNL Fall Semester Headcount Enrollment
Administrative site enrollments are show n from 1979-80 to present (see Fact Book Glossary for definition of "Administrative Site").
0
5
10
15
20
25
30
1931
-32
1936
-37
1941
-42
1946
-47
1951
-52
1956
-57
1961
-62
1966
-67
1971
-72
1976
-77
1981
-82
1986
-87
1991
-92
1996
-97
2001
-02
2006
-07
2011
-12
Enro
llmen
t (in
thou
sand
s)
Academic Year
50

University of Nebraska-Lincoln FALL ENROLLMENT Fact Book 2013-2014
Institutional Research and Planning
1967 1968 1969
Undergraduate 14,417 16,023Graduate 2,631 * 2,827
Professional 1,019 768Total 18,067 19,150 19,618
1970 1971 1972 1973 1974 1975 1976 1977 1978 1979
Undergraduate 16,884 17,844 17,840 17,936 18,026 18,141 19,703Graduate 3,159 * 3,019 * * 3,624 3,493 3,474 3,571 3,476
Professional 767 718 916 750 756 765 482Total 20,810 21,541 21,581 21,160 20,892 22,380 22,179 22,256 22,477 23,661
1980 1981 1982 1983 1984 1985 1986 1987 1988 1989
Undergraduate 20,127 20,587 20,799 20,471 20,083 19,911 19,720 19,309 19,755 19,791Graduate 3,518 3,714 3,816 3,865 3,706 3,680 3,771 3,763 3,821 3,714
Professional 483 485 460 453 439 429 408 397 409 421Total 24,128 24,786 25,075 24,789 24,228 24,020 23,899 23,469 23,985 23,926
1990 1991 1992 1993 1994 1995 1996 1997 1998 1999
Undergraduate 20,082 19,884 19,746 19,625 18,700 19,186 18,954 18,246 17,980 17,804Graduate 3,931 4,302 4,381 4,421 4,732 4,711 4,546 4,159 3,979 3,893
Professional 440 434 446 445 422 423 387 422 449 445Total 24,453 24,620 24,573 24,491 23,854 24,320 23,887 22,827 22,408 22,142
2000 2001 2002 2003 2004 2005 2006 2007 2008 2009
Undergraduate 17,968 17,985 18,118 17,851 17,137 17,037 17,371 18,053 18,526 18,955Graduate 3,869 4,309 4,380 4,219 4,162 4,150 4,257 4,418 4,500 4,591
Professional 431 470 490 489 493 488 478 502 547 554Total 22,268 22,764 22,988 22,559 21,792 21,675 22,106 22,973 23,573 24,100
2010 2011 2012 2013 2014 2015 2016 2017 2018 2019
Undergraduate 19,383 19,345 19,103 19,376Graduate 4,620 4,679 4,559 4,554
Professional 607 569 545 515Total 24,610 24,593 24,207 24,445
* Breakdow n by level is not available prior to 1967, or for 1968, 1971, 1973 or 1974.
Last Updated September 9, 2013
Fall Enrollment by Student Level1967 to 2013
Graphical representation of the data is on next page.
Administrative site enrollments are show n from 1979-80 to present (see Fact Book Glossary for definition of "Administrative Site" ).
51

University of Nebraska-Lincoln FALL ENROLLMENT Fact Book 2013-2014
Institutional Research and Planning
Data
in tab
le form
at on p
revi
ous p
age.
Last U
pdate
d: S
epte
mb
er
9, 2013
Fa
ll E
nro
llm
en
t T
ren
d b
y S
tud
en
t L
ev
el, 1
97
5-2
01
3
17,840
17,936
18,026
18,141
19,703
20,127
20,587
20,799
20,471
20,083
19,911
19,720
19,309
19,755
19,791
20,082
19,884
19,746
19,625
18,700
19,186
18,954
18,246
17,980
17,804
17,968
17,985
18,118
17,851
17,137
17,037
17,371
18,053
18,526
18,955
19,383
19,345
19,103
19,376
16,0
00
17,0
00
18,0
00
19,0
00
20,0
00
21,0
00
22,0
001975
1976
1977
1978
1979
1980
1981
1982
1983
1984
1985
1986
1987
1988
1989
1990
1991
1992
1993
1994
1995
1996
1997
1998
1999
2000
2001
2002
2003
2004
2005
2006
2007
2008
2009
2010
2011
2012
2013
Un
der
grad
ua
te E
nro
llmen
t
3,624
3,493
3,474
3,571
3,476
3,518
3,714
3,816
3,865
3,706
3,680
3,771
3,763
3,821
3,714
3,931
4,302
4,381
4,421
4,732
4,711
4,546
4,159
3,979
3,893
3,869
4,309
4,380
4,219
4,162
4,150
4,257
4,418
4,500
4,591
4,620
4,679
4,559
4,554
916
750
756
765
482
483
485
460
453
439
429
408
397
409
421
440
434
446
445
422
423
387
422
449
445
431
470
490
489
493
488
478
502
547
554
607
569
545
515
0
1,0
00
2,0
00
3,0
00
4,0
00
5,0
00
6,0
00
1975
1976
1977
1978
1979
1980
1981
1982
1983
1984
1985
1986
1987
1988
1989
1990
1991
1992
1993
1994
1995
1996
1997
1998
1999
2000
2001
2002
2003
2004
2005
2006
2007
2008
2009
2010
2011
2012
2013
Gra
du
ate
En
rollm
en
tP
rofe
ssio
nal
En
roll
me
nt
52

University of Nebraska-Lincoln FALL ENROLLMENT Fact Book 2013-2014
Institutional Research and Planning
CollegeUndergraduate
Students
Graduate
Students
Professional
Students
Total
Students
Agricultural Sci & Natural Resources 2,114 641 64 2,819
Architecture 393 59 45 497
Arts & Sciences 4,586 1,014 0 5,600
Business Administration 3,384 334 0 3,718
Education & Human Sciences 2,950 1,202 18 4,170
Engineering 2,759 478 0 3,237
Fine & Performing Arts 614 162 0 776
Intercollegiate & Non-Degree Programs 0 626 0 626
Journalism & Mass Communications 936 38 0 974
Law 0 0 388 388
Undecided Undergraduates 1,493 0 0 1,493
Other (Intercampus & Visitors) 147 0 0 147
Total 19,376 4,554 515 24,445
Enrollment by College
Fall 2013
Enrollment by College, Fall 2013
Last Updated: September 16, 2013
5,600
4,170
3,718
3,237
2,819
1,493
974
776
626
497
388
147
0 1,000 2,000 3,000 4,000 5,000 6,000
Arts & Sciences
Education & Human Sciences
Business Administration
Engineering
Agricultural Sci & Natural Resources
Undecided Undergraduates
Journalism & Mass Communications
Fine & Performing Arts
Intercollegiate & Non-Degree
Architecture
Law
Other (Intercampus & Visitors)
Total Enrollment 24,445
53

University of Nebraska-Lincoln FALL ENROLLMENT Fact Book 2013-2014
Institutional Research and Planning
CollegeFirst-Time
Freshmen
Other
FreshmenSophomore Junior Senior Unclassified Total
New
Transfers*
Agricultural Sciences & Natural Resources
434 62 359 576 683 0 2,114 139
Architecture 102 16 89 80 106 0 393 19Arts & Sciences 1,058 203 747 1,111 1,467 0 4,586 212Business Administration 648 167 630 917 1,022 0 3,384 168Education & Human Sciences
480 104 547 831 988 0 2,950 141
Engineering 638 105 482 583 951 0 2,759 133Fine & Performing Arts 115 19 114 157 209 0 614 31Journalism & Mass Communications
156 47 190 280 263 0 936 37
Undecided Undergraduates
789 219 279 138 68 0 1,493 115
Other (includes Intercampus & Visitors)
0 9 2 0 3 133 147 0
Total Undergraduate 4,420 951 3,439 4,673 5,760 133 19,376 995
College Total
Agricultural Sciences & Natural Resources
641
Architecture 59Arts & Sciences 1,014Business Administration 334Education & Human Sciences
1,202
Engineering 478Find & Performing Arts 162Journalism & Mass Communications
38
Graduate Studies 626Total Graduate 4,554
Continued on Next Page.
Last Updated: September 17, 2013
3,052
110
1918886
197
00
0 35
11
3
4755
611747
379113
First-Time Graduate,
Degree Seeking
Graduate, Non-
Degree Seeking
Other Graduate,
Degree Seeking
524
40
7
04 822
248
9949
0
125
Enrollment by College and Student Level
Fall 2013
Undergraduate Headcount Enrollment
*New Transfers are a subset of Total enrollment.
880
Graduate Headcount Enrollment
54

University of Nebraska-Lincoln FALL ENROLLMENT Fact Book 2013-2014
Institutional Research and Planning
College
First-Time
Graduate,
Degree Seeking
Other Graduate,
Degree Seeking
First-Time
Professional
Other
ProfessionalTotal
Agricultural Sciences and Natural Resources (Veterinary Medicine)
24 25 49
Agricultural Sciences and Natural Resources (Plant Health)
3 12 15
Architecture 13 32 45Education and Human Sciences (Audiology)
0 18 18
Law 133 255 388Total Professional 3 12 170 330 515
Fall 2011 Fall 2012 Fall 2013
Undergraduate 19,345 19,103 19,376Graduate 4,679 4,559 4,554Professional 569 545 515Total Enrollment 24,593 24,207 24,445
Last Updated: September 17, 2013
Enrollment by College and Student Level (continued)Fall 2013
Total Headcount Enrollment
Professional Headcount Enrollment
55

University of Nebraska-Lincoln FALL ENROLLMENT Fact Book 2013-2014
Institutional Research and Planning
Fall 2009 Fall 2010 Fall 2011 Fall 2012 Fall 2013
Agricultural Sciences & Natural Resources 318 347 345 362 434Architecture 102 114 105 88 102Arts & Sciences 998 1,098 989 1,033 1,058Business Administration 508 465 452 567 648Education & Human Sciences 405 422 484 446 480Engineering 585 557 569 575 638Fine & Performing Arts 120 133 111 99 115Journalism & Mass Communications 148 126 147 148 156Undecided Undergraduates 802 813 891 619 789Total 3,986 4,075 4,093 3,937 4,420
Mean Average ACT Score 25.4 25.3 25.3 25.4 25.3
Last Updated: September 10, 2013
First-Time Freshmen by College, 5 Year Trend
First-Time Freshmen Enrollment, 5 Year TrendCombined Full- and Part-Time
3,986
4,075 4,093
3,937
4,420
3,800
3,900
4,000
4,100
4,200
4,300
4,400
4,500
Fall 2009 Fall 2010 Fall 2011 Fall 2012 Fall 2013
Firs
t-Ti
me
Fre
shm
en
56

University of Nebraska-Lincoln FALL ENROLLMENT Fact Book 2013-2014
Institutional Research and Planning
Year Full-Time Part-Time Total Year Full-Time Part-Time Total
1975 3,883 141 4,024 1995 3,900 84 3,9841976 3,798 105 3,903 1996 3,631 84 3,7151977 3,844 128 3,972 1997 3,200 56 3,2561978 4,070 222 4,292 1998 3,357 59 3,4161979 4,441 261 4,702 1999 3,599 74 3,6731980 4,222 170 4,392 2000 3,605 62 3,6671981 4,314 276 4,590 2001 3,482 50 3,5321982 4,114 206 4,320 2002 3,617 36 3,6531983 3,801 172 3,973 2003 3,641 38 3,6791984 3,703 196 3,899 2004 3,238 28 3,2661985 3,730 171 3,901 2005 3,538 22 3,5601986 3,665 150 3,815 2006 3,831 18 3,8491987 3,661 149 3,810 2007 4,215 20 4,2351988 3,816 153 3,969 2008 4,166 34 4,2001989 3,950 162 4,112 2009 3,965 21 3,9861990 3,651 91 3,742 2010 4,039 36 4,0751991 3,392 93 3,485 2011 4,056 37 4,0931992 3,398 82 3,480 2012 3,918 19 3,9371993 3,329 99 3,428 2013 4,396 24 4,4201994 3,267 90 3,357
Last Updated: September 12, 2013
History of First-Time Freshmen (Full- and Part-Time)
History of First-Time Freshmen (Full- and Part-Time)
Fall 1975 - Fall 2013
4,02
43,
903
3,97
24,
292
4,70
24,
392 4,
590
4,32
03,
973
3,89
93,
901
3,81
53,
810 3,
969 4,
112
3,74
23,
485
3,48
03,
428
3,35
73,
984
3,71
53,
256 3,
416
3,67
33,
667
3,53
2 3,65
33,
679
3,26
63,
560
3,84
94,
235
4,20
03,
986
4,07
54,
093
3,93
74,
420
3,000
3,200
3,400
3,600
3,800
4,000
4,200
4,400
4,600
4,800
5,000
1975
1976
1977
1978
1979
1980
1981
1982
1983
1984
1985
1986
1987
1988
1989
1990
1991
1992
1993
1994
1995
1996
1997
1998
1999
2000
2001
2002
2003
2004
2005
2006
2007
2008
2009
2010
2011
2012
2013
57

University of Nebraska-Lincoln FALL ENROLLMENT Fact Book 2013-2014
Institutional Research and Planning
Composite Score Fall 2009 Fall 2010 Fall 2011 Fall 2012 Fall 2013
Below 6 0 0 0 0 06-11 0 0 0 0 0
12-17 53 57 51 53 6718-23 1,322 1,384 1,408 1,321 1,44424-29 1,685 1,726 1,723 1,600 1,80330-36 716 694 695 728 801Total 3,776 3,861 3,877 3,702 4,115
First-Time Freshmen (FTF) 3,986 4,075 4,093 3,937 4,420% FTF Submitting ACT Scores 94.7% 94.7% 94.7% 94.0% 93.1%
Average ACT Score 25.4 25.3 25.3 25.4 25.3
Last updated: September 9, 2013
First-Time Freshmen (Full- and Part-Time) ACT Scores - 5 Year Trend
Freshmen are required to submit either ACT or SAT scores. Most submit ACT.
First-Time Freshmen (Full- and Part-Time) ACT Scores - 5 Year Trend
716694 695
728
801
1,6851,726 1,723
1,600
1,803
1,322 1,384 1,408 1,3211,444
53 57 51 53 670
500
1,000
1,500
2,000
2,500
3,000
3,500
4,000
4,500
Fall 2009 Fall 2010 Fall 2011 Fall 2012 Fall 2013
30-36
24-29
18-23
12-17
Tota
l Firs
t-Tim
eFr
eshm
en t
hat S
ubm
itted
AC
T S
core
s
58

University of Nebraska-Lincoln FALL ENROLLMENT Fact Book 2013-2014
Institutional Research and Planning
College Number of Students
Agricultural Sciences & Natural Resources 139Architecture 19Arts & Sciences 212Business Administration 168Education & Human Sciences 141Engineering 133Fine & Performing Arts 31Journalism & Mass Communications 37Undecided Undergraduates 115Total 995
*Other includes Intercampus and Visitors Last Updated: September 10, 2013
First-Time Undergraduate Transfer Students by College
Fall 2013
First-Time Undergraduate Transfer Students by College
Fall 2013
212
168
141
139
133
115
37
31
19
0 50 100 150 200 250
Arts & Sciences
BusinessAdministration
Education & HumanSciences
Agricultural Sciences& Natural Resources
Engineering
UndecidedUndergraduates
Journalism & MassCommunications
Fine & PerformingArts
Architecture
Total Transfers 995
59

University of Nebraska-Lincoln FALL ENROLLMENT Fact Book 2013-2014
Institutional Research and Planning
Class Level Credit Hours* Number Percent Number Percent Total
Freshman 0-26 112 58.3 80 41.7 192 Sophomore 27-52 155 47.4 172 52.6 327 Junior 53-88 190 53.2 167 46.8 357 Senior 89 and Over 73 61.3 46 38.7 119 Total 530 53.3 465 46.7 995
*Class standing is determined by the number of student credit hours a student has accumulated.
Male Female Male Female
Total 480 440 50 25 995
Administrative site enrollments are displayed. Last Updated: September 10, 2013
Full-Time Part-T imeT ota l
First-Time Undergraduate Transfer Students
by Class Standing and Gender
by Full- or Part-Time and Gender
Fall 2013
Male Female
by Class Standing
First-Time Undergraduate Transfer Students
First-Time Undergraduate Transfer Students
112 155
190
73
80
172 167
46
-
50
100
150
200
250
300
350
400
Freshman Sophomore Junior Senior
Female
Male
Total Transfers 995
60

University of Nebraska-Lincoln FALL ENROLLMENT Fact Book 2013-2014
Institutional Research and Planning
Year Full-Time Part-Time Total
1999 829 87 9162000 843 109 9522001 828 82 9102002 810 91 9012003 737 66 8032004 783 94 8772005 833 97 9302006 909 62 9712007 791 66 8572008 882 75 9572009 928 80 1,0082010 949 72 1,0212011 946 87 1,0332012 946 84 1,0302013 920 75 995
15 Year Avg 862 82 944
15 Year Total 12,934 1,227 14,161
Last Updated: September 11, 2013
First-Time Transfer Students (Full- and Part-Time)
15 Year Trend
First-Time Transfer Students (Full- and Part-Time)
15 Year Trend
916
952
910 901
803
877
930
971
857
957
1,008
1,021
1,033 1,030
995
700
750
800
850
900
950
1,000
1,050
1,1001
999
20
00
20
01
20
02
20
03
20
04
20
05
20
06
20
07
20
08
20
09
20
10
20
11
20
12
20
13
Num
ber
of T
rans
fer S
tude
nts
61

University of Nebraska-Lincoln FALL ENROLLMENT Fact Book 2013-2014
Institutional Research and Planning
Co
lle
ge
No
n-
resi
de
nt
Ali
en
His
pa
nic
/ L
ati
no
Am
eri
ca
n
Ind
ian
/
Ala
ska
Na
tive
Asi
an
Bla
ck /
Afr
ica
n
Am
eri
ca
n
Na
tive
Ha
wa
iia
n
/ P
acif
ic
Isla
nd
er
Wh
ite
-
No
n
His
pa
nic
Tw
o o
r
Mo
re
Ra
ce
s
Un
kn
ow
nC
oll
eg
e
To
tal
Min
ori
ty
To
tal1
Agr
icul
tura
l Sci
ence
s an
d N
atur
al R
esou
rces
41
70
4 11
18
0
1,88
1 39
50
2,1
14
142
Arc
hite
ctur
e23
22
2
11
7 1
313
11
3 393
54
Arts
and
Sci
ence
s19
6 28
4 15
14
2 14
8 6
3,55
5 15
1 89
4,5
86
746
Bus
ines
s A
dmin
istra
tion
501
136
8 85
63
3
2,47
2 58
58
3,3
84
353
Edu
catio
n an
d H
uman
S
cien
ces
25
122
6 35
67
1
2,58
2 64
48
2,9
50
295
Eng
inee
ring
189
101
3 75
59
0
2,20
3 63
66
2,7
59
301
Hix
son-
Lied
Fi
ne a
nd P
erfo
rmin
g A
rts7
36
2 17
13
0
509
13
17
614
81
Jour
nalis
m a
nd M
ass
Com
mun
icat
ions
16
40
2 12
26
0
800
22
18
936
102
Und
ecid
ed
Und
ergr
adua
tes
162
91
10
43
62
1 1,
056
40
28
1,4
93
247
Inte
rcam
pus
and
Vis
itors
1 2
0 3
2 0
134
0 5
147
7
Un
derg
rad
uate
To
tal
1,1
61
904
52
434
465
12
15,5
05
461
382
19,3
76
2,3
28
Pro
fess
iona
l (La
w, E
HS
, A
NR
and
Arc
h)8
21
3 10
7
0 44
4 4
18
515
45
Gra
duat
e95
7 13
3 15
81
12
1 4
2,94
6 53
24
4 4,5
54
407
Gra
nd
To
tal
2,1
26
1,0
58
70
525
593
16
18,8
95
518
644
24,4
45
2,7
80
Last U
pdate
d: S
epte
mb
er
11, 2013
Un
de
rgra
du
ate
En
rollm
en
t b
y C
olle
ge
an
d E
thn
icit
y, F
all 2
01
3
1 E
xclu
des
Non
-resi
dent
Alie
n, W
hite
, Unk
now
nT
he U
niv
ers
ity
of N
eb
raska-L
incoln
does n
ot dis
cri
min
ate
based o
n g
ender,
age, dis
ab
ility,
race, colo
r, r
eligio
n, m
ari
tal sta
tus, ve
tera
n's
sta
tus, national or
eth
nic
ori
gin
,
or
sexual ori
enta
tion.
62

University of Nebraska-Lincoln FALL ENROLLMENT Fact Book 2013-2014
Institutional Research and Planning
Gra
du
ate
Co
lle
ge
No
n-
resi
de
nt
Ali
en
His
pa
nic
/ L
ati
no
Am
eri
ca
n
Ind
ian
/
Ala
ska
Na
tive
Asi
an
Bla
ck /
Afr
ica
n
Am
eri
ca
n
Na
tive
Ha
wa
iia
n
/ P
acif
ic
Isla
nd
er
Wh
ite
Tw
o o
r
Mo
re
Ra
ce
s
Un
kn
ow
nC
oll
eg
e
To
tal
Min
ori
ty
To
tal1
Agr
icul
tura
l Sci
ence
s an
d N
atur
al R
esou
rces
204
20
2 9
12
0 34
5 8
41
641
51
Arc
hite
ctur
e (G
raduate
Pro
gra
m O
nly
)14
1
0 1
2 0
38
0 3
59
4
Arts
and
Sci
ence
s28
3 43
0
15
22
1 57
7 19
54
1,0
14
100
Bus
ines
s A
dmin
istra
tion
68
2 0
10
5 1
229
1 18
334
19
Edu
catio
n an
d H
uman
S
cien
ces
87
44
11
12
44
2 93
6 14
52
1,2
02
127
Eng
inee
ring
253
6 0
10
7 0
190
4 8
478
27
Hix
son-
Lied
Fi
ne a
nd P
erfo
rmin
g A
rts21
4
0 2
4 0
112
3 16
162
13
Jour
nalis
m a
nd M
ass
Com
mun
icat
ions
1 2
0 0
1 0
32
0 2
38
3
Gra
duat
e S
tudi
es26
11
2
22
24
0 48
7 4
50
626
63
Gra
du
ate
To
tal
957
133
15
81
121
4
2,9
46
53
244
4,5
54
407
Agr
icul
tura
l Sci
ence
s an
d N
atur
al R
esou
rces
1 4
0 0
1 0
52
2 4
64
7
Arc
hite
ctur
e2
1 1
2 1
0 34
0
4 45
5 E
duca
tion
and
Hum
an
Sci
ence
s0
0 0
0 0
0 17
0
1 18
0
Law
5 16
2
8 5
0 34
1 2
9 388
33
Pro
fess
ion
al
To
tal
8
21
3
10
7
0
444
4
18
515
45
Gra
du
ate
an
d
Pro
fess
ion
al
To
tal
965
154
18
91
128
4
3,3
90
57
262
5,0
69
452
Last U
pdate
d: S
epte
mb
er
16, 2013
Gra
du
ate
an
d P
rofe
ss
ion
al E
nro
llm
en
t b
y C
olle
ge
an
d E
thn
icit
y, F
all 2
01
3
1 Exc
lude
s N
on-re
side
nt A
lien,
Whi
te, a
nd U
nkno
wn
cate
gorie
s.T
he U
niv
ers
ity
of N
eb
raska-L
incoln
does n
ot dis
cri
min
ate
based o
n g
ender,
age, dis
ab
ility,
race, colo
r, r
eligio
n, m
ari
tal sta
tus, ve
tera
n's
sta
tus, national or
eth
nic
ori
gin
,
or
sexual ori
enta
tion.
63

University of Nebraska-Lincoln FALL ENROLLMENT Fact Book 2013-2014
Institutional Research and Planning
Age Undergraduate Graduate Professional Total Percent
17 and Under 268 0 0 268 1.1%18 3,791 0 0 3,791 15.5%
19-20 7,267 2 0 7,269 29.7%21-22 5,543 296 79 5,918 24.2%23-24 1,350 733 233 2,316 9.5%25-29 713 1,494 141 2,348 9.6%30-34 229 868 34 1,131 4.6%35-39 84 441 19 544 2.2%40-49 92 464 6 562 2.3%50-64 35 244 3 282 1.2%
65 and Over 4 12 0 16 0.1%Unknown 0 0 0 0 0.0%
Total 19,376 4,554 515 24,445 100.0%
Average AgeAll StudentsAverage Age
Full-Time Students
Last Updated: September 11, 2013
25.127.620.3
Enrollment by Age
Fall 2013
Enrollment by Age, Fall 2013
20.6 31.2 25.4
0
1,000
2,000
3,000
4,000
5,000
6,000
7,000
8,000
17 andUnder
18 19-20 21-22 23-24 25-29 30-34 35-39 40-49 50-64 65 andOver
Professional
Graduate
Undergraduate
Num
ber
of S
tude
nts
Age Range
64

University of Nebraska-Lincoln FALL ENROLLMENT Fact Book 2013-2014
Institutional Research and Planning
Full Part Full Part Full Part Full Part Full Part
Agricultural Sciences & Natural Resources
1,675 83 1,776 106 1,806 132 1,887 122 1,996 118
Architecture 470 21 427 24 377 21 346 30 367 26Arts & Sciences 4,518 283 4,566 283 4,425 314 4,406 289 4,287 299Business Administration 2,846 163 2,776 152 2,869 167 3,004 168 3,195 189Education & Human Sciences 2,766 134 2,979 154 3,043 157 2,917 191 2,808 142Engineering 2,392 188 2,470 178 2,517 175 2,550 190 2,582 177Fine & Performing Arts 630 43 649 45 622 35 564 44 564 50Journalism & Mass Communications
852 32 835 41 817 44 852 42 893 43
Undecided Undergraduates 1,579 73 1,644 89 1,558 79 1,236 71 1,409 84Other (Intercampus & Visitors) 9 198 7 182 5 182 4 190 1 146Undergraduate Total 17,737 1,218 18,129 1,254 18,039 1,306 17,766 1,337 18,102 1,274
Percent 93.6% 6.4% 93.5% 6.5% 93.2% 6.8% 93.0% 7.0% 93.4% 6.6%
Agricultural Sciences & Natural Resources
356 203 367 247 347 248 351 247 359 282
Architecture 34 19 43 22 45 25 35 28 24 35Arts & Sciences 734 304 756 325 754 299 732 301 744 270Business Administration 223 194 183 206 197 200 162 180 146 188Education & Human Sciences 410 629 444 708 477 742 471 747 472 730Engineering 361 148 367 173 381 162 324 163 328 150Fine & Performing Arts 121 24 107 30 105 22 129 32 134 28Journalism & Mass Communications
30 42 25 35 19 37 19 27 12 26
Graduate Studies 153 606 112 470 99 520 95 516 77 549Graduate Total 2,422 2,169 2,404 2,216 2,424 2,255 2,318 2,241 2,296 2,258
Percent 52.8% 47.2% 52.0% 48.0% 51.8% 48.2% 50.8% 49.2% 50.4% 49.6%
Agricultural Sciences & Natural Resources (Veterinary Medicine & Plant Health)
50 0 53 2 51 8 52 6 56 8
Architecture 83 2 84 27 60 26 41 15 36 9Education and Human Sciences (Audiology)
11 6 5 13 11 14 11 16 15 3
Law 399 3 419 4 396 3 392 12 375 13Professional Total 543 11 561 46 518 51 496 49 482 33
Percent 98.0% 2.0% 92.4% 7.6% 91.0% 9.0% 91.0% 9.0% 93.6% 6.4%
Totals by FT and PT 20,702 3,398 21,094 3,516 20,981 3,612 20,580 3,627 20,880 3,565
Percent 85.9% 14.1% 85.7% 14.3% 85.3% 14.7% 85.0% 15.0% 85.4% 14.6%
Total Enrollment
Last Updated: September 16, 2013
Totals
24,445
Fall Enrollment by College, by Full- and Part-Time Status
5 Year Trend
Fall Enrollment by College, by Full- and Part-Time Status, 5 Year Trend
24,100 24,610 24,593
College2011
Graduate Students
Undergraduate Students
Professional Students
20122009 2010
24,207
2013
65

University of Nebraska-Lincoln FALL ENROLLMENT Fact Book 2013-2014
Institutional Research and Planning
2009 2010 2011 2012 2013
Full-Time Equivalent1 21,835 22,266 22,185 21,789 22,068
1 Full-Time Equivalent (FTE) is one-third of the part-time students added to the full-time students.
Last Updated: September 12, 2013
Full-Time Equivalent Enrollment
5 Year Trend
Full-Time Equivalent Enrollment, 5 Year Trend
21,835
22,266
22,185
21,789
22,068
21,500
21,600
21,700
21,800
21,900
22,000
22,100
22,200
22,300
22,400
22,500
2009 2010 2011 2012 2013
Full-
Tim
e E
quiva
lent
Enr
ollm
ent
66

University of Nebraska-Lincoln FALL ENROLLMENT Fact Book 2013-2014
Institutional Research and Planning
Number Percent Number Percent
Freshman 0-26 2,832 52.7% 2,539 47.3% 5,371
Sophomore 27-52 1,791 52.1% 1,648 47.9% 3,439
Junior 53-88 2,509 53.7% 2,164 46.3% 4,673
Senior 89 and over 3,240 56.3% 2,520 43.8% 5,760
Unclassified 66 49.6% 67 50.4% 133
Graduate 2,179 47.8% 2,375 52.2% 4,554
Professional 275 53.4% 240 46.6% 515
Total 12,892 52.7% 11,553 47.3% 24,445
Male Female Male Female
Undergraduate 9,697 8,405 741 533 19,376
Graduate 1,218 1,078 961 1,297 4,554
Professional 256 226 19 14 515
Total 11,171 9,709 1,721 1,844 24,445
Last Updated: September 12, 2013
TotalFull-Time Part-Time
Enrollment by Level, Full- or Part-Time and Gender, Fall 2013
Level
Enrollment by Class Standing and Gender
*Class standing is determined by the number of student credit hours a student has accumulated.
Fall 2013
Male Female
Enrollment by Class Standing and Gender, Fall 2013
TotalCredit Hours*Class Standing
2,832 1,791
2,509 3,240
66
2,179
275
2,539
1,648
2,164
2,520
67
2,375
240 -
1,000
2,000
3,000
4,000
5,000
6,000
7,000
Freshman Sophomore Junior Senior Unclassified Graduate Professional
Female
Male
Total Enrollment 24,445
67

University of Nebraska-Lincoln FALL ENROLLMENT Fact Book 2013-2014
Institutional Research and Planning
CollegeResident
Students
Percent
Resident
Non-Resident
Students
Percent
Non-ResidentTotal
Agricultural Sciences and Natural Resources 1,791 84.7% 323 15.3% 2,114Architecture 309 78.6% 84 21.4% 393Arts and Sciences 3,660 79.8% 926 20.2% 4,586Business Administration 2,377 70.2% 1,007 29.8% 3,384Education and Human Sciences 2,518 85.4% 432 14.6% 2,950Engineering 2,240 81.2% 519 18.8% 2,759Hixson-Lied Fine and Performing Arts 486 79.2% 128 20.8% 614Journalism and Mass Communications 707 75.5% 229 24.5% 936Undecided Undergraduates 1,122 75.2% 371 24.8% 1,493Other (includes Visiting and Intercampus) 133 90.5% 14 9.5% 147Undergraduate Total 15,343 79.2% 4,033 20.8% 19,376
Last Updated: September 13, 2013 Continued on Next Page.
Resident and Non-Resident Students by College
Resident and Non-Resident Students by College, Fall 2013
10 Year Trend (2004-2013)
Undergraduate Students
Residency is based on regulations developed for tuition purposes. Omaha students paying Metropolitan Advantage Program (MAP) tuition have been included in the non-resident category. MAP students are from Iowa counties contiguous to Omaha.
17,1
26
16,9
41
17,1
69
17,8
23
18,0
50
18,3
92
18,5
74
18,5
72
18,0
84
17,7
82
4,66
6
4,73
4
4,93
7
5,15
0
5,52
3
5,70
8
6,03
6
6,02
1
6,12
3
6,66
3
0
5,000
10,000
15,000
20,000
25,000
30,000
2004 2005 2006 2007 2008 2009 2010 2011 2012 2013
Resident Students Non-Resident Students
68

University of Nebraska-Lincoln FALL ENROLLMENT Fact Book 2013-2014
Institutional Research and Planning
CollegeResident
Students
Percent
Resident
Non-Resident
Students
Percent Non-
ResidentTotal
Agricultural Sciences and Natural Resources 206 32.1% 435 67.9% 641Architecture 29 49.2% 30 50.8% 59Arts and Sciences 244 24.1% 770 75.9% 1,014Business Administration 136 40.7% 198 59.3% 334Education and Human Sciences 774 64.4% 428 35.6% 1,202Engineering 185 38.7% 293 61.3% 478Hixson-Lied Fine and Performing Arts 37 22.8% 125 77.2% 162Journalism and Mass Communications 23 60.5% 15 39.5% 38Graduate Studies 432 69.0% 194 31.0% 626Graduate Total 2,066 45.4% 2,488 54.6% 4,554
Law 272 70.1% 116 29.9% 388Agricultural Sciences and Natural Resources (Veterinary Medicine and Plant Health)
56 87.5% 8 12.5% 64
Architecture 38 84.4% 7 15.6% 45Education and Human Sciences (Audiology) 7 38.9% 11 61.1% 18Professional Total 373 72.4% 142 27.6% 515
Total 17,782 72.7% 6,663 27.3% 24,445
Last Updated: September 16, 2013
Residency is based on regulations developed for tuition purposes. Omaha students paying Metropolitan Advantage Program (MAP) tuition have been included in the non-resident category. MAP students are from Iowa counties contiguous to Omaha.
Graduate Students
Professional Students
Totals
Resident and Non-Resident Student Profile by College, Fall 2013 (continued)
69

University of Nebraska-Lincoln FALL ENROLLMENT Fact Book 2013-2014
Institutional Research and Planning
Full Part Full Part Full Part Full Part
Undergraduate 13,267 1,316 2,417 137 Undergraduate 13,227 1,156 2,541 113Professional 396 8 87 2 Professional 400 7 78 3Graduate 762 1,377 1,253 770 Graduate 832 1,319 1,355 644Total 14,425 2,701 3,757 909 Total 14,459 2,482 3,974 760
21,792 21,675
Full Part Full Part Full Part Full Part
Undergraduate 13,399 1,145 2,708 119 Undergraduate 13,842 1,181 2,915 115Professional 381 12 85 0 Professional 413 11 76 2Graduate 870 1,362 1,366 659 Graduate 862 1,514 1,345 697Total 14,650 2,519 4,159 778 Total 15,117 2,706 4,336 814
22,106 22,973
Full Part Full Part Full Part Full Part
Undergraduate 14,175 1,102 3,108 141 Undergraduate 14,536 1,098 3,201 120Professional 426 10 107 4 Professional 444 7 99 4Graduate 854 1,483 1,418 745 Graduate 907 1,400 1,515 769Total 15,455 2,595 4,633 890 Total 15,887 2,505 4,815 893
23,573 24,100
Full Part Full Part Full Part Full Part
Undergraduate 14,765 1,110 3,364 144 Undergraduate 14,669 1,155 3,370 151Professional 447 30 114 16 Professional 415 35 103 16Graduate 844 1,378 1,560 838 Graduate 892 1,406 1,532 849Total 16,056 2,518 5,038 998 Total 15,976 2,596 5,005 1,016
24,610 24,593
Full Part Full Part Full Part Full Part
Undergraduate 14,310 1,208 3,456 129 Undergraduate 14,224 1,119 3,878 155Professional 383 30 113 19 Professional 353 20 129 13Graduate 775 1,378 1,543 863 Graduate 712 1,354 1,584 904Total 15,468 2,616 5,112 1,011 Total 15,289 2,493 5,591 1,072
24,207 24,445
Last Updated: September 13, 2013
Fall Enrollment by Resident and Non-Resident Status and Level, 10 Year Trend
Fall 2004
Resident Non-Resident
Fall 2005
Resident Non-Resident
Total Fall Enrollment Total Fall Enrollment
Resident Non-Resident
Total Fall Enrollment
Fall 2007
Resident Non-Resident
Total Fall Enrollment
Fall 2006
Resident Non-Resident
Total Fall Enrollment
Total Fall Enrollment
Fall 2008 Fall 2009
Resident Non-Resident
Total Fall Enrollment
Fall 2010 Fall 2011
Resident Non-Resident Resident Non-Resident
Fall 2013
Resident Non-Resident
Total Fall Enrollment
Professional: Law , Architecture, Audiology (after 2004), Veterinary Medicine (after 2007), and Plant Health (after 2009).
Fall 2012
Resident Non-Resident
Total Fall Enrollment Total Fall Enrollment
70

University of Nebraska-Lincoln FALL ENROLLMENT Fact Book 2013-2014
Institutional Research and Planning
Country Un
derg
rad
uate
Perc
en
t
Un
derg
rad
uate
Gra
du
ate
Perc
en
t
Gra
du
ate
Pro
fessio
nal
Perc
en
t
Pro
fessio
nal
To
tal
Perc
en
t T
ota
l
Afghanistan 3 0.02% 2 0.04% 0 0.00% 5 0.02%Albania 0 0.00% 2 0.04% 0 0.00% 2 0.01%Algeria 0 0.00% 0 0.00% 0 0.00% 0 0.00%Argentina 1 0.01% 8 0.18% 0 0.00% 9 0.04%Armenia 0 0.00% 2 0.04% 0 0.00% 2 0.01%Australia 7 0.04% 1 0.02% 0 0.00% 8 0.03%Austria 0 0.00% 1 0.02% 0 0.00% 1 0.00%Azerbaijan 1 0.01% 0 0.00% 0 0.00% 1 0.00%Bahamas 7 0.04% 0 0.00% 0 0.00% 7 0.03%Bangladesh 1 0.01% 13 0.29% 0 0.00% 14 0.06%Barbados 1 0.01% 0 0.00% 0 0.00% 1 0.00%Belgium 0 0.00% 1 0.02% 0 0.00% 1 0.00%Belize 0 0.00% 1 0.02% 0 0.00% 1 0.00%Benin 6 0.03% 0 0.00% 0 0.00% 6 0.02%Bhutan 3 0.02% 0 0.00% 0 0.00% 3 0.01%Bolivia 1 0.01% 3 0.07% 0 0.00% 4 0.02%Boznia and Herzegovina 1 0.01% 1 0.02% 0 0.00% 2 0.01%Brazil 34 0.18% 14 0.31% 0 0.00% 48 0.20%Bulgaria 0 0.00% 1 0.02% 1 0.19% 2 0.01%Burkina Faso 3 0.02% 2 0.04% 0 0.00% 5 0.02%Cambodia 0 0.00% 0 0.00% 0 0.00% 0 0.00%Cameroon 3 0.02% 6 0.13% 0 0.00% 9 0.04%Canada 13 0.07% 10 0.22% 4 0.78% 27 0.11%Cayman Islands 1 0.01% 0 0.00% 0 0.00% 1 0.00%Chad 0 0.00% 1 0.02% 0 0.00% 1 0.00%Chile 0 0.00% 2 0.04% 0 0.00% 2 0.01%China 639 3.30% 385 8.45% 1 0.19% 1,025 4.19%Colombia 9 0.05% 29 0.64% 0 0.00% 38 0.16%Congo 1 0.01% 0 0.00% 0 0.00% 1 0.00%Congo, The Dem Rep 6 0.03% 1 0.02% 0 0.00% 7 0.03%Costa Rica 0 0.00% 6 0.13% 0 0.00% 6 0.02%Cote D'Ivoire 3 0.02% 0 0.00% 0 0.00% 3 0.01%Croatia 1 0.01% 0 0.00% 0 0.00% 1 0.00%Cuba 1 0.01% 0 0.00% 0 0.00% 1 0.00%Czech Republic 6 0.03% 0 0.00% 0 0.00% 6 0.02%
Origin of University of Nebraska-Lincoln Students
by Country of Origin and Student Level, Fall 2013 (Page 1 of 4)
71

University of Nebraska-Lincoln FALL ENROLLMENT Fact Book 2013-2014
Institutional Research and Planning
Country Un
derg
rad
uate
Perc
en
t
Un
derg
rad
uate
Gra
du
ate
Perc
en
t
Gra
du
ate
Pro
fessio
nal
Perc
en
t
Pro
fessio
nal
To
tal
Perc
en
t T
ota
l
Dominican Republic 0 0.00% 1 0.02% 0 0.00% 1 0.00%Ecuador 0 0.00% 4 0.09% 0 0.00% 4 0.02%Egypt 2 0.01% 7 0.15% 0 0.00% 9 0.04%El Salvador 5 0.03% 0 0.00% 0 0.00% 5 0.02%Eritrea 1 0.01% 5 0.11% 0 0.00% 6 0.02%Ethiopia 1 0.01% 5 0.11% 1 0.19% 7 0.03%Finland 1 0.01% 0 0.00% 0 0.00% 1 0.00%France 1 0.01% 4 0.09% 0 0.00% 5 0.02%Gabon 1 0.01% 0 0.00% 0 0.00% 1 0.00%Gambia 0 0.00% 1 0.02% 0 0.00% 1 0.00%Georgia 0 0.00% 0 0.00% 0 0.00% 0 0.00%Germany 22 0.11% 12 0.26% 1 0.19% 35 0.14%Ghana 2 0.01% 11 0.24% 0 0.00% 13 0.05%Greece 2 0.01% 3 0.07% 0 0.00% 5 0.02%Guatemala 2 0.01% 3 0.07% 0 0.00% 5 0.02%Guinea-Bissau 1 0.01% 0 0.00% 0 0.00% 1 0.00%Guyana 1 0.01% 1 0.02% 0 0.00% 2 0.01%Haiti 0 0.00% 2 0.04% 0 0.00% 2 0.01%Honduras 3 0.02% 2 0.04% 0 0.00% 5 0.02%Hong Kong 3 0.02% 3 0.07% 0 0.00% 6 0.02%Hungary 2 0.01% 2 0.04% 0 0.00% 4 0.02%India 21 0.11% 115 2.53% 1 0.19% 137 0.56%Indonesia 7 0.04% 6 0.13% 0 0.00% 13 0.05%Iran 4 0.02% 60 1.32% 1 0.19% 65 0.27%Iraq 8 0.04% 4 0.09% 1 0.19% 13 0.05%Israel 0 0.00% 2 0.04% 0 0.00% 2 0.01%Italy 1 0.01% 2 0.04% 0 0.00% 3 0.01%Jamaica 4 0.02% 4 0.09% 0 0.00% 8 0.03%Japan 11 0.06% 13 0.29% 0 0.00% 24 0.10%Jordan 0 0.00% 2 0.04% 0 0.00% 2 0.01%Kazakhstan 1 0.01% 1 0.02% 0 0.00% 2 0.01%Kenya 5 0.03% 7 0.15% 0 0.00% 12 0.05%Kosovo 0 0.00% 2 0.04% 0 0.00% 2 0.01%Kuwait 5 0.03% 4 0.09% 0 0.00% 9 0.04%Kyrgyzstan 0 0.00% 1 0.02% 0 0.00% 1 0.00%
Origin of University of Nebraska-Lincoln Students
by Country of Origin and Student Level, Fall 2013 (Page 2 of 4)
72

University of Nebraska-Lincoln FALL ENROLLMENT Fact Book 2013-2014
Institutional Research and Planning
Country Un
derg
rad
uate
Perc
en
t
Un
derg
rad
uate
Gra
du
ate
Perc
en
t
Gra
du
ate
Pro
fessio
nal
Perc
en
t
Pro
fessio
nal
To
tal
Perc
en
t T
ota
l
Latvia 2 0.01% 2 0.04% 0 0.00% 4 0.02%Lebanon 0 0.00% 1 0.02% 0 0.00% 1 0.00%Liberia 2 0.01% 0 0.00% 0 0.00% 2 0.01%Libya 0 0.00% 2 0.04% 0 0.00% 2 0.01%Macedonia 0 0.00% 2 0.04% 0 0.00% 2 0.01%Malawi 2 0.01% 1 0.02% 0 0.00% 3 0.01%Malaysia 148 0.76% 16 0.35% 0 0.00% 164 0.67%Malta 0 0.00% 0 0.00% 0 0.00% 0 0.00%Mauritius 0 0.00% 1 0.02% 0 0.00% 1 0.00%Mexico 45 0.23% 13 0.29% 1 0.19% 59 0.24%Mongolia 3 0.02% 1 0.02% 0 0.00% 4 0.02%Morocco 0 0.00% 2 0.04% 0 0.00% 2 0.01%Myanmar 3 0.02% 0 0.00% 0 0.00% 3 0.01%Namibia 1 0.01% 0 0.00% 0 0.00% 1 0.00%Nepal 17 0.09% 20 0.44% 0 0.00% 37 0.15%Netherlands 1 0.01% 1 0.02% 0 0.00% 2 0.01%New Zealand 1 0.01% 0 0.00% 0 0.00% 1 0.00%Nicaragua 2 0.01% 2 0.04% 0 0.00% 4 0.02%Niger 0 0.00% 1 0.02% 0 0.00% 1 0.00%Nigeria 7 0.04% 4 0.09% 0 0.00% 11 0.04%Norway 1 0.01% 1 0.02% 0 0.00% 2 0.01%Oman 58 0.30% 0 0.00% 0 0.00% 58 0.24%Pakistan 3 0.02% 9 0.20% 0 0.00% 12 0.05%Palestinian Territory 1 0.01% 2 0.04% 0 0.00% 3 0.01%Panama 0 0.00% 1 0.02% 0 0.00% 1 0.00%Paraguay 0 0.00% 1 0.02% 0 0.00% 1 0.00%Peru 4 0.02% 3 0.07% 0 0.00% 7 0.03%Philippines 0 0.00% 11 0.24% 0 0.00% 11 0.04%Poland 2 0.01% 2 0.04% 0 0.00% 4 0.02%Qatar 4 0.02% 0 0.00% 0 0.00% 4 0.02%Romania 0 0.00% 2 0.04% 0 0.00% 2 0.01%Russia 2 0.01% 11 0.24% 0 0.00% 13 0.05%Rwanda 4 0.02% 1 0.02% 0 0.00% 5 0.02%Saudi Arabia 15 0.08% 12 0.26% 0 0.00% 27 0.11%Senegal 2 0.01% 1 0.02% 0 0.00% 3 0.01%
by Country of Origin and Student Level, Fall 2013 (Page 3 of 4)Origin of University of Nebraska-Lincoln Students
73

University of Nebraska-Lincoln FALL ENROLLMENT Fact Book 2013-2014
Institutional Research and Planning
Country Un
derg
rad
uate
Perc
en
t
Un
derg
rad
uate
Gra
du
ate
Perc
en
t
Gra
du
ate
Pro
fessio
nal
Perc
en
t
Pro
fessio
nal
To
tal
Perc
en
t T
ota
l
Serbia 1 0.01% 3 0.07% 0 0.00% 4 0.02%Sierra Leone 0 0.00% 1 0.02% 0 0.00% 1 0.00%Singapore 3 0.02% 0 0.00% 0 0.00% 3 0.01%Slovakia 2 0.01% 1 0.02% 0 0.00% 3 0.01%Slovenia 1 0.01% 0 0.00% 0 0.00% 1 0.00%South Africa 1 0.01% 3 0.07% 0 0.00% 4 0.02%South Korea 46 0.24% 37 0.81% 0 0.00% 83 0.34%Spain 3 0.02% 12 0.26% 0 0.00% 15 0.06%Sri Lanka 0 0.00% 6 0.13% 0 0.00% 6 0.02%Sudan 7 0.04% 2 0.04% 0 0.00% 9 0.04%Sweden 2 0.01% 2 0.04% 0 0.00% 4 0.02%Switzerland 1 0.01% 1 0.02% 0 0.00% 2 0.01%Syria 5 0.03% 2 0.04% 0 0.00% 7 0.03%Taiwan 8 0.04% 12 0.26% 0 0.00% 20 0.08%Tajikistan 6 0.03% 0 0.00% 0 0.00% 6 0.02%Thailand 1 0.01% 14 0.31% 0 0.00% 15 0.06%Togo 9 0.05% 2 0.04% 0 0.00% 11 0.04%Trinidad and Tobago 0 0.00% 1 0.02% 0 0.00% 1 0.00%Tunisia 0 0.00% 1 0.02% 0 0.00% 1 0.00%Turkey 2 0.01% 9 0.20% 0 0.00% 11 0.04%Turkmenistan 1 0.01% 1 0.02% 0 0.00% 2 0.01%Uganda 2 0.01% 2 0.04% 0 0.00% 4 0.02%Ukraine 4 0.02% 6 0.13% 0 0.00% 10 0.04%United Arab Emirates 4 0.02% 0 0.00% 0 0.00% 4 0.02%United Kingdom 2 0.01% 4 0.09% 0 0.00% 6 0.02%United States 17,979 92.79% 3,499 76.83% 503 97.67% 21,981 89.92%Uruguay 0 0.00% 2 0.04% 0 0.00% 2 0.01%Uzbekistan 1 0.01% 1 0.02% 0 0.00% 2 0.01%Venezuela 0 0.00% 5 0.11% 0 0.00% 5 0.02%Viet Nam 75 0.39% 11 0.24% 0 0.00% 86 0.35%Virgin Islands (British) 1 0.01% 0 0.00% 0 0.00% 1 0.00%Yugoslavia 3 0.02% 1 0.02% 0 0.00% 4 0.02%Zambia 3 0.02% 4 0.09% 0 0.00% 7 0.03%Zimbabwe 4 0.02% 2 0.04% 0 0.00% 6 0.02%Total 19,376 100% 4,554 100% 515 100% 24,445 100%
Note: Administrative site enrollments are displayed.
Last Updated: September 9, 2013
Origin of University of Nebraska-Lincoln Students
by Country of Origin and Student Level, Fall 2013 (Page 4 of 4)
74

University of Nebraska-Lincoln FALL ENROLLMENT Fact Book 2013-2014
Institutional Research and Planning
State Un
derg
rad
uate
Gra
du
ate
Pro
fessio
nal
To
tal
State Un
derg
rad
uate
Gra
du
ate
Pro
fessio
nal
To
tal
Alabama 7 9 0 16 Montana 9 7 0 16Alaska 12 2 0 14 Nebraska 14,689 1,745 336 16,770Arizona 53 10 3 66 Nevada 21 7 1 29Arkansas 15 9 1 25 New Hampshire 4 4 0 8Armed Forces Americas 0 0 0 0 New Jersey 23 19 0 42Armed Forces Europe 1 2 0 3 New Mexico 11 10 0 21Armed Forces Pacific 4 2 0 6 New York 20 41 0 61California 203 88 9 300 North Carolina 21 29 3 53Colorado 240 41 22 303 North Dakota 44 24 3 71Connecticut 8 12 1 21 Ohio 32 43 3 78Delaware 2 2 0 4 Oklahoma 11 10 0 21District of Columbia 2 1 1 4 Oregon 13 14 2 29Florida 31 36 1 68 Pennsylvania 23 33 2 58Georgia 15 15 0 30 Puerto Rico 0 6 0 6Guam 0 0 0 0 Rhode Island 2 2 0 4Hawaii 6 3 0 9 South Carolina 5 9 1 15Idaho 7 12 0 19 South Dakota 399 43 15 457Illinois 335 88 5 428 Tennessee 10 14 1 25Indiana 17 26 1 44 Texas 192 70 4 266Iowa 288 78 16 382 Utah 6 16 8 30Kansas 239 81 6 326 Vermont 3 2 0 5Kentucky 3 11 0 14 Virginia 34 29 1 64Louisiana 7 6 0 13 Washington 23 24 1 48Maine 0 3 0 3 West Virginia 1 8 0 9Maryland 19 26 1 46 Wisconsin 89 46 3 138Massachusetts 11 15 1 27 Wyoming 26 11 0 37Michigan 38 37 3 78 Unknown State 193 480 33 706Minnesota 335 59 7 401 Total USA 17,979 3,499 503 21,981
Mississippi 1 9 1 11 Foreign Students 1,397 1,055 12 2,464Missouri 176 70 7 253 Total Students 19,376 4,554 515 24,445
Note: Administrative site enrollments are displayed. Last Updated: September 10, 2013
Origin of University of Nebraska-Lincoln Students
by State of Origin and Student Level, Fall 2013
75
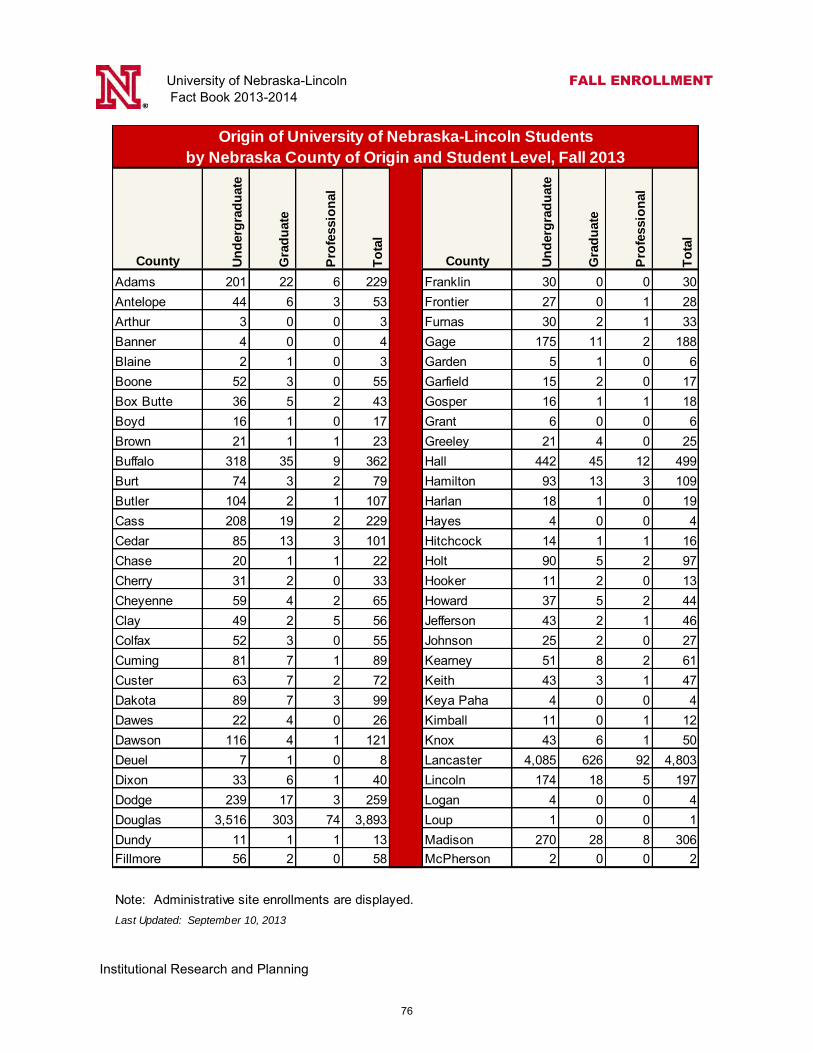
University of Nebraska-Lincoln FALL ENROLLMENT Fact Book 2013-2014
Institutional Research and Planning
County Un
derg
rad
uate
Gra
du
ate
Pro
fessio
nal
To
tal
County Un
derg
rad
uate
Gra
du
ate
Pro
fessio
nal
To
tal
Adams 201 22 6 229 Franklin 30 0 0 30Antelope 44 6 3 53 Frontier 27 0 1 28Arthur 3 0 0 3 Furnas 30 2 1 33Banner 4 0 0 4 Gage 175 11 2 188Blaine 2 1 0 3 Garden 5 1 0 6Boone 52 3 0 55 Garfield 15 2 0 17Box Butte 36 5 2 43 Gosper 16 1 1 18Boyd 16 1 0 17 Grant 6 0 0 6Brown 21 1 1 23 Greeley 21 4 0 25Buffalo 318 35 9 362 Hall 442 45 12 499Burt 74 3 2 79 Hamilton 93 13 3 109Butler 104 2 1 107 Harlan 18 1 0 19Cass 208 19 2 229 Hayes 4 0 0 4Cedar 85 13 3 101 Hitchcock 14 1 1 16Chase 20 1 1 22 Holt 90 5 2 97Cherry 31 2 0 33 Hooker 11 2 0 13Cheyenne 59 4 2 65 Howard 37 5 2 44Clay 49 2 5 56 Jefferson 43 2 1 46Colfax 52 3 0 55 Johnson 25 2 0 27Cuming 81 7 1 89 Kearney 51 8 2 61Custer 63 7 2 72 Keith 43 3 1 47Dakota 89 7 3 99 Keya Paha 4 0 0 4Dawes 22 4 0 26 Kimball 11 0 1 12Dawson 116 4 1 121 Knox 43 6 1 50Deuel 7 1 0 8 Lancaster 4,085 626 92 4,803Dixon 33 6 1 40 Lincoln 174 18 5 197Dodge 239 17 3 259 Logan 4 0 0 4Douglas 3,516 303 74 3,893 Loup 1 0 0 1Dundy 11 1 1 13 Madison 270 28 8 306Fillmore 56 2 0 58 McPherson 2 0 0 2
Note: Administrative site enrollments are displayed. Last Updated: September 10, 2013
Origin of University of Nebraska-Lincoln Students
by Nebraska County of Origin and Student Level, Fall 2013
76

University of Nebraska-Lincoln FALL ENROLLMENT Fact Book 2013-2014
Institutional Research and Planning
County Un
derg
rad
uate
Gra
du
ate
Pro
fessio
nal
To
tal
County Un
derg
rad
uate
Gra
du
ate
Pro
fessio
nal
To
tal
Merrick 43 9 1 53 Seward 184 24 1 209Morrill 14 1 0 15 Sheridan 27 4 1 32Nance 22 4 1 27 Sherman 13 3 0 16Nemaha 47 7 0 54 Sioux 3 0 0 3Nuckolls 30 4 1 35 Stanton 24 0 0 24Otoe 127 14 3 144 Thayer 34 3 1 38Pawnee 13 2 0 15 Thomas 4 0 0 4Perkins 14 1 0 15 Thurston 29 4 0 33Phelps 73 5 3 81 Valley 28 6 1 35Pierce 49 2 1 52 Washington 210 9 6 225Platte 256 26 6 288 Wayne 53 4 1 58Polk 50 5 2 57 Webster 17 3 1 21Red Willow 62 6 4 72 Wheeler 3 0 0 3Richardson 64 5 1 70 York 114 13 5 132Rock 8 0 0 8 Unknown County 44 162 0 206Saline 110 25 5 140 Nebraska Total 14,689 1,745 336 16,770
Sarpy 1,155 91 26 1,272 Other USA 3,290 1,754 167 5,211Saunders 246 24 1 271 Foreign Students 1,397 1,055 12 2,464Scotts Bluff 117 11 5 133 Total 19,376 4,554 515 24,445
Note: Administrative site enrollments are displayed. Last Updated: September 10, 2013
Origin of University of Nebraska-Lincoln Students
by Nebraska County of Origin and Student Level, Fall 2013 (continued)
77

University of Nebraska-Lincoln SPRING ENROLLMENT
Fact Book 2013-2014
Institutional Research and Planning
CollegeUndergraduate
Students
Graduate
Students
Professional
Students
Total
Students
Agricultural Sci & Natural Resources 1,959 628 59 2,646
Architecture 379 54 44 477
Arts & Sciences 4,225 1,008 0 5,233
Business Administration 3,214 332 0 3,546
Education & Human Sciences 2,823 1,189 18 4,030
Engineering 2,541 455 0 2,996
Fine & Performing Arts 586 154 0 740
Intercollegiate & Non-Degree Programs 0 663 0 663
Journalism & Mass Communications 937 38 0 975
Law 0 0 377 377
Undecided Undergraduates 1,117 0 0 1,117
Other (Intercampus & Visitors) 159 0 0 159
Total 17,940 4,521 498 22,959
Enrollment by College
Spring 2014
Enrollment by College, Spring 2014
Last Updated: January 27, 2014
5,233
4,030
3,546
2,996
2,646
1,117
975
740
663
477
377
159
0 1,000 2,000 3,000 4,000 5,000 6,000
Arts & Sciences
Education & Human Sciences
Business Administration
Engineering
Agricultural Sci & Natural Resources
Undecided Undergraduates
Journalism & Mass Communications
Fine & Performing Arts
Intercollegiate & Non-Degree
Architecture
Law
Other (Intercampus & Visitors)
Total Enrollment 22,959
78

University of Nebraska-Lincoln SPRING ENROLLMENT
Fact Book 2013-2014
Institutional Research and Planning
CollegeFirst-Time
Freshmen
Other
FreshmenSophomore Junior Senior Unclassified Total
New
Transfers*
Agricultural Sciences &
Natural Resources3 321 336 552 747 0 1,959 44
Architecture 3 91 77 76 132 0 379 4
Arts & Sciences 28 763 800 1,082 1,552 0 4,225 83
Business Administration 27 568 669 883 1,067 0 3,214 76
Education & Human
Sciences7 422 534 823 1,037 0 2,823 52
Engineering 18 447 476 587 1,013 0 2,541 56
Fine & Performing Arts 2 85 106 160 233 0 586 13
Journalism & Mass
Communications0 170 191 291 285 0 937 8
Undecided
Undergraduates36 612 263 138 68 0 1,117 52
Other (includes
Intercampus & Visitors)0 15 1 3 1 139 159 0
Total Undergraduate 124 3,494 3,453 4,595 6,135 139 17,940 388
College Total
Agricultural Sciences &
Natural Resources628
Architecture 54
Arts & Sciences 1,008
Business Administration 332
Education & Human
Sciences1,189
Engineering 455
Find & Performing Arts 154
Journalism & Mass
Communications38
Graduate Studies 663
Total Graduate 4,521
Continued on Next Page.
Last Updated: January 27, 2014
3,517
48
4
31
51
71
0
0
0 35
11
3
4
237
648
767
430
154
First-Time Graduate,
Degree Seeking
Graduate, Non-
Degree Seeking
Other Graduate,
Degree Seeking
575
50
5
0
4 973
281
25
0
0
110
Enrollment by College and Student Level
Spring 2014
Undergraduate Headcount Enrollment
*New Transfers are a subset of Total enrollment.
1,008
Graduate Headcount Enrollment
79

University of Nebraska-Lincoln SPRING ENROLLMENT
Fact Book 2013-2014
Institutional Research and Planning
College
First-Time
Graduate,
Degree Seeking
Other Graduate,
Degree Seeking
First-Time
Professional
Other
ProfessionalTotal
Agricultural Sciences & Natural
Resources (Veterinary Medicine)0 0 0 49 49
Agricultural Sciences & Natural
Resources (Plant Health)0 0 0 10 10
Architecture 0 0 0 44 44
Education & Human Sciences
(Audiology)0 0 0 18 18
Law 0 0 4 373 377
Total Professional 4 494 498
Spring 2012 Spring 2013 Spring 2014
Undergraduate 17,839 17,734 17,940
Graduate 4,496 4,420 4,521
Professional 552 530 498
Total Enrollment 22,887 22,684 22,959
Last Updated: January 27, 2014
Enrollment by College and Student Level (continued)
Spring 2014
Total Headcount Enrollment
Professional Headcount Enrollment
80

University of Nebraska-Lincoln SPRING ENROLLMENT
Fact Book 2013-2014
Institutional Research and Planning
Co
lle
ge
No
n-
resi
de
nt
Ali
en
His
pa
nic
/ L
ati
no
Am
eri
ca
n
Ind
ian
/
Ala
ska
Na
tive
Asi
an
Bla
ck /
Afr
ica
n
Am
eri
ca
n
Na
tive
Ha
wa
iia
n
/ P
acif
ic
Isla
nd
er
Wh
ite
-
No
n
His
pa
nic
Tw
o o
r
Mo
re
Ra
ce
s
Un
kn
ow
nC
oll
eg
e
To
tal
Min
ori
ty
To
tal1
Agricultura
l S
cie
nces a
nd
Natu
ral R
esourc
es
45
63
5
12
15
0
1,7
34
34
51
1,9
59
129
Arc
hitectu
re28
22
2
9
8
1
294
12
3
379
54
Art
s a
nd S
cie
nces
196
255
10
132
131
7
3,2
67
148
79
4,2
25
683
Busin
ess A
dm
inis
tration
495
131
6
85
61
3
2,3
20
55
58
3,2
14
341
Education a
nd H
um
an
Scie
nces
28
111
3
39
75
1
2,4
68
55
43
2,8
23
284
Engin
eering
205
96
3
68
57
0
1,9
89
60
63
2,5
41
284
Hix
son-L
ied
Fin
e a
nd P
erform
ing A
rts
7
33
1
17
13
0
481
15
19
586
79
Journ
alis
m a
nd M
ass
Com
munic
ations
15
47
2
13
27
0
793
23
17
937
112
Underc
ided
Underg
raduate
s155
63
7
34
44
0
769
28
17
1,1
17
176
Inte
rcam
pus a
nd V
isitors
1
3
1
4
3
0
140
4
3
159
15
Un
derg
rad
uate
To
tal
1,1
75
824
40
413
434
12
14,2
55
434
353
17,9
40
2,1
57
Pro
fessio
nal (L
aw
, E
HS
,
AN
R a
nd A
rch)
7
21
3
9
6
0
432
3
17
498
42
Gra
duate
946
138
13
79
128
5
2,9
40
61
211
4,5
21
424
Gra
nd
To
tal
2,1
28
983
56
501
568
17
17,6
27
498
581
22,9
59
2,6
23
Last U
pdate
d: J
anuary
27, 2014Un
de
rgra
du
ate
En
rollm
en
t b
y L
ev
el, C
olle
ge
an
d E
thn
icit
y, S
pri
ng
20
14
1E
xclu
des N
on-r
esid
ent
Alie
n,
White,
Unknow
n
The U
niv
ers
ity
of N
eb
raska-L
incoln
does n
ot dis
cri
min
ate
based o
n g
ender,
age, dis
ab
ility,
race, colo
r, r
eligio
n, m
ari
tal sta
tus, ve
tera
n's
sta
tus, national or
eth
nic
ori
gin
,
or
sexual ori
enta
tion.
81

University of Nebraska-Lincoln SPRING ENROLLMENT
Fact Book 2013-2014
Institutional Research and Planning
Gra
du
ate
Co
lle
ge
No
n-
resi
de
nt
Ali
en
His
pa
nic
/ L
ati
no
Am
eri
ca
n
Ind
ian
/
Ala
ska
Na
tive
Asi
an
Bla
ck /
Afr
ica
n
Am
eri
ca
n
Na
tive
Ha
wa
iia
n
/ P
acif
ic
Isla
nd
er
Wh
ite
Tw
o o
r
Mo
re
Ra
ce
s
Un
kn
ow
nC
oll
eg
e
To
tal
Min
ori
ty
To
tal1
Agricultura
l S
cie
nces a
nd
Natu
ral R
esourc
es
205
19
2
12
11
0
336
8
35
628
52
Arc
hitectu
re (
Gra
duate
Pro
gra
m O
nly
)12
1
0
2
4
0
33
0
2
54
7
Art
s a
nd S
cie
nces
287
43
0
15
22
1
570
21
49
1,0
08
102
Busin
ess A
dm
inis
tration
67
2
0
7
5
1
227
2
21
332
17
Education a
nd H
um
an
Scie
nces
86
43
7
15
51
1
921
15
50
1,1
89
132
Engin
eering
245
6
0
10
6
0
177
4
7
455
26
Hix
son-L
ied
Fin
e a
nd P
erform
ing A
rts
18
4
0
2
3
0
113
3
11
154
12
Journ
alis
m a
nd M
ass
Com
munic
ations
2
2
0
0
1
0
31
0
2
38
3
Gra
duate
Stu
die
s24
18
4
16
25
2
532
8
34
663
73
Gra
du
ate
To
tal
946
138
13
79
128
5
2,9
40
61
211
4,5
21
424
Agricultura
l S
cie
nces a
nd
Natu
ral R
esourc
es
1
4
0
0
0
0
48
2
4
59
6
Arc
hitectu
re2
1
1
1
1
0
34
0
4
44
4
Education a
nd H
um
an
Scie
nces
0
0
0
0
0
0
17
0
1
18
0
Law
4
16
2
8
5
0
333
1
8
377
32
Pro
fess
ion
al
To
tal
7
21
3
9
6
0
432
3
17
498
42
Gra
du
ate
an
d
Pro
fess
ion
al
To
tal
953
159
16
88
134
5
3,3
72
64
228
5,0
19
466
Last U
pdate
d: J
anuary
27, 2014
Gra
du
ate
an
d P
rofe
ss
ion
al E
nro
llm
en
t b
y C
olle
ge
an
d E
thn
icit
y, S
pri
ng
20
14
1E
xclu
des N
on-r
esid
ent
Alie
n,
White,
and U
nknow
n c
ate
gories.
The U
niv
ers
ity
of N
eb
raska-L
incoln
does n
ot dis
cri
min
ate
based o
n g
ender,
age, dis
ab
ility,
race, colo
r, r
eligio
n, m
ari
tal sta
tus, ve
tera
n's
sta
tus, national or
eth
nic
ori
gin
,
or
sexual ori
enta
tion.
82

University of Nebraska-Lincoln SPRING ENROLLMENT
Fact Book 2013-2014
Institutional Research and Planning
Full Part Full Part Full Part Full Part
Undergraduate 12,061 1,348 2,204 129 Undergraduate 12,017 1,267 2,303 116
Professional 378 18 77 4 Professional 381 14 72 4
Graduate 739 1,400 1,196 732 Graduate 791 1,332 1,322 654
Total 13,178 2,766 3,477 865 Total 13,189 2,613 3,697 774
20,286 20,273
Full Part Full Part Full Part Full Part
Undergraduate 12,206 1,257 2,503 106 Undergraduate 12,661 1,251 2,677 132
Professional 357 26 74 1 Professional 390 19 71 5
Graduate 842 1,398 1,353 698 Graduate 833 1,491 1,305 761
Total 13,405 2,681 3,930 805 Total 13,884 2,761 4,053 898
20,821 21,596
Full Part Full Part Full Part Full Part
Undergraduate 13,020 1,195 2,865 138 Undergraduate 13,410 1,129 2,962 126
Professional 418 13 98 2 Professional 428 16 93 6
Graduate 783 1,473 1,280 809 Graduate 865 1,461 1,455 764
Total 14,221 2,681 4,243 949 Total 14,703 2,606 4,510 896
22,094 22,715
Full Part Full Part Full Part Full Part
Undergraduate 13,479 1,318 3,093 174 Undergraduate 13,318 1,298 3,073 150
Professional 402 64 94 31 Professional 378 57 97 20
Graduate 826 1,396 1,441 867 Graduate 787 1,455 1,439 815
Total 14,707 2,778 4,628 1,072 Total 14,483 2,810 4,609 985
23,185 22,887
Full Part Full Part Full Part Full Part
Undergraduate 12,969 1,321 3,267 177 Undergraduate 12,864 1,287 3,617 172
Professional 366 40 102 22 Professional 313 49 113 23
Graduate 689 1,403 1,445 883 Graduate 642 1,434 1,501 944
Total 14,024 2,764 4,814 1,082 Total 13,819 2,770 5,231 1,139
22,684 22,959
Last Updated: January 27, 2014
Spring 2013
Spring 2005 Spring 2006
Spring 2007 Spring 2008
Spring 2009 Spring 2010
Spring 2012Spring 2011
Total Spring EnrollmentTotal Spring Enrollment
Total Spring EnrollmentTotal Spring Enrollment
Resident Non-ResidentResident
Spring Enrollment by Resident and Non-Resident Status and Level, 10 Year Trend
Resident Non-ResidentResident
Total Spring EnrollmentTotal Spring Enrollment
Resident Non-ResidentResident Non-Resident
Non-Resident
Non-Resident
Spring 2014
Resident
Professional: Law , Architecture, Audiology (after 2004), Veterinary Medicine (after 2007), and Plant Health (after 2009).
Resident Non-Resident
Total Spring Enrollment
Resident Non-Resident
Total Spring Enrollment
Total Spring EnrollmentTotal Spring Enrollment
Non-ResidentResidentNon-Resident
83

University of Nebraska-Lincoln SUMMER ENROLLMENT
Fact Book 2013-2014
Institutional Research and Planning
CollegeUndergraduate
Students
Graduate
Students
Professional
Students
Total
Students
Agricultural Sciences & Natural Resources 701 464 4 1,169
Architecture 204 31 53 288
Arts & Sciences 2,104 768 0 2,872
Business Administration 2,152 190 0 2,342
Education & Human Sciences 1,596 1,155 29 2,780
Engineering 1,083 235 0 1,318
Fine & Performing Arts 248 50 0 298
Graduate Studies 0 917 0 917
Journalism & Mass Communications 551 12 0 563
Law 0 0 143 143
Undecided Undergraduates 271 0 0 271
Other (Intercampus & Visitors) 160 0 0 160
TOTAL 9,070 3,822 229 13,121
Last Updated: July 21, 2014
Enrollment by College, Summer 2014
Enrollment by College, Summer 2014
2,872
2,780
2,342
1,318
1,169
917
563
298
288
271
160
143
0 500 1000 1500 2000 2500 3000 3500
Arts & Sciences
Education & HumanSciences
Business Administration
Engineering
Agricultural Sciences &Natural Resources
Graduate Studies
Journalism & MassCommunications
Fine & Performing Arts
Architecture
Undecided Undergraduates
Other (Intercampus & Other)
Law
Total Summer Enrollment = 13,121
84

University of Nebraska-Lincoln SUMMER ENROLLMENT
Fact Book 2013-2014
Institutional Research and Planning
Student Level 1995 1996 1997 1998 1999 2000 2001 2002 2003 2004
Undergraduate 10,368 9,936 10,039 9,803 9,658 9,274 9,478 9,399 9,095 8,725
Professional 241 193 224 268 261 223 265 214 206 255
Graduate 5,048 4,875 4,278 3,931 4,021 4,083 4,419 4,578 4,371 4,193
TOTAL 15,657 15,004 14,541 14,002 13,940 13,580 14,162 14,191 13,672 13,173
Student Level 2005 2006 2007 2008 2009 2010 2011 2012 2013 2014
Undergraduate 8,606 8,461 8,378 8,211 8,562 8,492 8,317 8,399 8,964 9,070
Professional 244 213 192 215 237 282 276 254 239 229
Graduate 4,192 4,423 4,531 4,366 4,684 3,874 3,888 3,503 3,511 3,822
TOTAL 13,042 13,097 13,101 12,792 13,483 12,648 12,481 12,156 12,714 13,121
Last Updated: July 21, 2014
Summer Enrollment for All Sessions - 20 Year Trend
Summer Enrollment for All Sessions, by Student Level
Notes: "All Sessions" includes a Three-week Pre-session, an Eight-week Session, a First Five-
week Session, and a Second Five-week Session. Also included is the number of students
enrolled in classes delivered in Omaha (for all sessions) but administered from Lincoln. The
foregoing are combined for a "Total Summer Enrollment" with no accounting for duplication in
headcount (i.e. students enrolled in more than one session are counted more than once).
15,6
57
15,0
04
14,5
41
14,0
02
13,9
40
13,5
80
14,1
62
14,1
91
13,6
72
13,1
73
13,0
42
13,0
97
13,1
01
12,7
92 13,4
83
12,6
48
12,4
81
12,1
56
12,7
14
13,1
21
11,000
12,000
13,000
14,000
15,000
16,0001
99
5
199
6
199
7
199
8
199
9
200
0
200
1
200
2
200
3
200
4
200
5
200
6
200
7
200
8
200
9
201
0
201
1
201
2
201
3
201
4
85

University of Nebraska-Lincoln SUMMER ENROLLMENT
Fact Book 2013-2014
Institutional Research and Planning
2005 2006 2007 2008 2009 2010 2011 2012 2013 2014
Pre-Session 2,439 2,249 2,211 2,081 2,298 2,204 2,145 2,167 2,149 2,054
Eight Week 703 794 844 925 975 947 1,058 1,154 1,876 2,031
1st Five Week 5,152 5,330 5,336 5,221 5,398 5,045 5,158 4,873 4,860 5,062
2nd Five Week 4,413 4,417 4,357 4,215 4,452 4,075 3,727 3,631 3,500 3,607
Students in Omaha 335 307 353 350 360 377 393 331 329 367
TOTAL 13,042 13,097 13,101 12,792 13,483 12,648 12,481 12,156 12,714 13,121
Last Updated: July 21, 2014
Note: The number of students for each summer session term is combined for a "Total Summer
Enrollment" with no accounting for duplication in headcount.
Summer Enrollment by Session
Summer Enrollment by Session - 10 Year Trend
0
1,000
2,000
3,000
4,000
5,000
6,00020
05
20
06
20
07
20
08
20
09
20
10
20
11
20
12
20
13
20
14
Pre-session Eight Week First Five Week Second Five Week Students in Omaha
86

University of Nebraska-Lincoln HOUSING
Fact Book 2013-2014
Institutional Research and Planning
Fall 2009 Fall 2010 Fall 2011 Fall 2012 Fall 2013
Residence Halls 5,594 6,110 6,008 5,747 6,160
Student Family Housing 280 274 274 274 274
Fraternities and Sororities 1,388 1,350 1,598 1,620 1,098
Total City Campus 7,262 7,734 7,880 7,641 7,532
Residence Halls 223 202 200 229 205
Student Family Housing 247 247 247 247 247
Fraternities and Sororities 228 212 237 230 208
Total East Campus 698 661 684 706 660
Total Residence Halls 5,817 6,312 6,208 5,976 6,365
Total Student Family Housing 527 521 521 521 521
Total Fraternities and Sororities 1,616 1,562 1,835 1,850 1,306
Total UNL Campus and Greek Houses 7,960 8,395 8,564 8,347 8,192
Percent of Students Living on Campus 33.0% 34.1% 34.8% 34.5% 33.5%
Residence Halls 6,289 6,941 6,980 6,980 7,210
Student Family Housing 527 521 521 521 521
Fraternities and Sororities 2,019 1,466
Fall Semester 24,100 24,610 24,593 24,207 24,445
Source: University Housing and Greek Affairs
Last Updated: October 15, 2013
UNLTotals
Housing Capacities
UNL Enrollment
Enrollment by Housing Type, 5 Year Trend
(2009-2013)
Enrollment by Housing Type, 5 Year Trend
City Campus Totals
East Campus Totals
87

University of Nebraska-Lincoln FACULTY and STAFF
Fact Book 2013-2014
Institutional Research and Planning
College / Unit TenuredTenure
Track
Special
AppointmentTotal
Architecture 16 8 17 41
Arts and Sciences 257 90 167 514
Business Administration 41 22 35 98
Education and Human Sciences 77 29 155 261
Engineering 94 23 24 141
Hixson-Lied Fine and Performing Arts 57 13 33 103
Institute of Agriculture and Natural Resources 198 71 43 312
Journalism and Mass Communications 15 8 49 72
Law 27 7 19 53
Libraries 29 6 2 37
University of Nebraska State Museum 1 0 0 1
Other1 2 0 9 11
Total 814 277 553 1,644
Last Updated: November 4, 2013
General Regular Faculty by Tenure Status and College
Note: Faculty includes both full-time and part-time faculty and chairpersons employed by UNL as of the fall census date (does not
include Nebraska College of Technical Agriculture faculty). "Other faculty," "Equivalent Rank faculty," "Research / Clinical faculty"
and "Health faculty" are excluded. "Special Appointment" faculty are neither tenured nor on a tenure-track.
1Other: Academic Affairs, Center for Plant Science Innovation, Graduate Studies, International Affairs, Nebraska Center for
Materials and Nanoscience, Raikes School of Computer Science and Management, Undergraduate Education Programs.
Fall 2013
88

University of Nebraska-Lincoln FACULTY and STAFF
Fact Book 2013-2014
Institutional Research and Planning
2009 2010 2011 2012 2013 5 Yr Change
Professor 545 554 511 520 521 -4.4%
Associate Professor 335 335 319 332 336 0.3%
Assistant Professor 250 250 236 243 239 -4.4%
Professor of Practice1 45 54 61 80 93 106.7%
Senior Lecturer 24 22 16 15 9 -62.5%
Lecturer 341 365 400 400 433 27.0%
Visiting Faculty 16 17 13 25 13 -18.8%
Total 1,556 1,597 1,556 1,615 1,644 5.7%
Last Updated: November 4, 2013
Note: Faculty includes both full-time and part-time faculty and chairpersons employed by UNL as of
the fall census date (does not include Nebraska College of Technical Agriculture faculty). "Other
faculty," "Equivalent Rank Faculty," "Research / Clinical Faculty," and "Health faculty" are excluded.
1Professors of Practice (Assistant, Associate, and Full Professors) are non-tenure-track faculty on term
contracts. This designation was initiated in 2007.
Total General Regular Faculty, 5 Year Trend
General Regular Faculty by Rank, 5 Year Trend
1,5561,597
1,556
1,615
1,644
1,200
1,300
1,400
1,500
1,600
1,700
1,800
2009 2010 2011 2012 2013
Tota
l G
enera
l Regula
r Faculty
89

University of Nebraska-Lincoln FACULTY and STAFF
Fact Book 2013-2014
Institutional Research and Planning
Pro
fess
or
Ass
ocia
te
Pro
fess
or
Ass
ista
nt
Pro
fess
or
Pro
fess
or
of
Pra
cti
ce
Se
nio
r
Le
ctu
rer
Le
ctu
rer
Vis
itin
g
Fa
cu
lty
To
tal
Arc
hitectu
re9
96
00
16
141
Art
s a
nd S
cie
nces
166
106
76
17
2144
3514
Busin
ess A
dm
inis
tration
24
18
21
10
025
098
Education a
nd H
um
an S
cie
nces
47
36
23
27
1127
0261
Engin
eering
52
48
17
13
19
1141
Hix
son-L
ied F
ine a
nd P
erform
ing A
rts
25
34
11
53
25
0103
Institu
te o
f A
griculture
and N
atu
ral R
esourc
es
149
56
67
20
016
4312
Journ
alis
m a
nd M
ass C
om
munic
ations
810
59
040
072
Law
24
47
00
17
153
Lib
raries
14
15
62
00
037
Univ
ers
ity o
f N
ebra
ska S
tate
Museum
10
00
00
01
Oth
er1
20
02
04
311
To
tal
521
336
239
93
9433
13
1,6
44
Last U
pdate
d: N
ove
mb
er
4, 2013
Note
: F
aculty
inclu
des b
oth
full-
time a
nd p
art
-tim
e f
aculty
(te
nure
d, te
nure
-tra
ck,
and s
pecia
l appoin
tment)
and c
hairpers
ons e
mplo
yed b
y U
NL a
s o
f th
e f
all
census d
ate
(does n
ot in
clu
de N
ebra
ska
Colle
ge o
f Technic
al A
gricultu
re f
aculty
). "O
ther
faculty
," "
Equiv
ale
nt R
ank
faculty
," "R
esearc
h / C
linic
al f
aculty
" and "
Health
faculty
" are
exclu
ded.
Ge
ne
ral R
eg
ula
r F
ac
ult
y b
y R
an
k a
nd
Co
lle
ge
Oth
er1
: A
cadem
ic A
ffairs, C
ente
r fo
r Pla
nt S
cie
nce In
novatio
n, G
raduate
Stu
die
s, In
tern
atio
nal A
ffairs, N
ebra
ska
Cente
r fo
r M
ate
rials
and N
anoscie
nce, R
aik
es S
chool o
f
Com
pute
r S
cie
nce a
nd M
anagem
ent, U
nderg
raduate
Educatio
n P
rogra
ms.
Fa
ll 2
01
3
90

University of Nebraska-Lincoln FACULTY and STAFF
Fact Book 2013-2014
Institutional Research and Planning
M F M F M F M F M F M F M F M F
Amer Indian
/ AK Native1 1 1 3 0 1 0 0 0 0 0 1 0 0 2 6 8 0.5%
Asian 31 2 32 16 23 15 5 3 0 0 2 8 0 0 93 44 137 8.3%
Black /
African
Amer
3 2 6 13 1 4 0 1 0 1 1 3 0 0 11 24 35 2.1%
Hispanic /
Latino11 1 11 4 6 2 3 1 0 0 3 5 0 0 34 13 47 2.9%
Native HI /
Pacific Is0 0 0 0 0 1 0 0 0 0 0 1 0 0 0 2 2 0.1%
Two or More
Races0 0 0 0 0 1 0 0 0 0 1 0 0 0 1 1 2 0.1%
Non-resident
Alien1 0 1 0 19 6 0 2 0 0 5 6 4 2 30 16 46 2.8%
Subtotal 47 6 51 36 49 30 8 7 0 1 12 24 4 2 171 106 277 16.8%
White 365 103 153 96 101 59 35 43 6 2 170 227 6 1 836 531 1,367 83.2%
Total 412 109 204 132 150 89 43 50 6 3 182 251 10 3 1,007 637 1,644 100.0%
Last Updated: November 4, 2013
General Regular Faculty by Rank and Gender, Fall 2013
To
tal
by
Gen
der
Note: Faculty includes both full-time and part-time faculty and chairpersons employed by UNL as of the fall census date (does not include
Nebraska College of Technical Agriculture faculty). "Other faculty," "Equivalent Rank faculty," "Research / Clinical faculty" and "Health
faculty" are excluded.
General Regular Faculty by Rank, Gender and Ethnicity, Fall 2013
Pro
fesso
r
Asso
cia
te
Pro
fesso
r
Assis
tan
t
Pro
fesso
r
Sen
ior
Lectu
rer
Lectu
rer
Vis
itin
g
Facu
lty
Pro
fesso
r
of
Pra
cti
ce
To
tal
Perc
en
t
521
336
239
93
9
433
13
3
412
204
150
43
6
182
10
2
109 132
89
50
3
251
3 1
0
100
200
300
400
500
600P
rofe
ssor
Asso
cia
teP
rofe
ssor
Assis
tant
Pro
fessor
Pro
fessor
of
Pra
ctice
Se
nio
rL
ectu
rer
Lectu
rer
Vis
itin
gF
acu
lty
Oth
er
Total Faculty = 1,644 Total
Male
Female
91

University of Nebraska-Lincoln FACULTY and STAFF
Fact Book 2013-2014
Institutional Research and Planning
Age Male Female Total Percent
25 or Less 1 0 1 0.1%
26-30 27 27 54 3.3%
31-35 85 81 166 10.1%
36-40 116 83 199 12.1%
41-45 116 87 203 12.3%
46-50 109 66 175 10.6%
51-55 124 78 202 12.3%
56-60 147 87 234 14.2%
61-65 145 86 231 14.1%
66-70 81 36 117 7.1%
Over 70 56 6 62 3.8%
Total 1,007 637 1,644 100.0%
Last Updated: November 4, 2013
General Regular Faculty by Age, Fall 2013
Note: Faculty includes both full-time and part-time faculty and chairpersons employed by UNL as of the fall
census date (does not include Nebraska College of Technical Agriculture faculty). "Other faculty," "Equivalent
Rank faculty," "Research / Clinical faculty," and "Health faculty" are excluded.
Faculty by Age
25 or Less0.1%
26-303.3%
31-3510.1%
36-4012.1%
41-4512.3%
46-5010.6%
51-5512.3%
56-6014.2%
61-6514.1%
66-707.1%
Over 703.8%
92

University of Nebraska-Lincoln FACULTY and STAFF
Fact Book 2013-2014
Institutional Research and Planning
Male Female Male Female
American Indian or Alaska Native 2 4 6 0 1 1 7
Asian 56 15 71 30 17 47 118
Black or African American 9 10 19 1 9 10 29
Hispanic / Latino 22 5 27 6 2 8 35
Native Hawaiian / Pacific Islander 0 0 0 0 1 1 1
Two or More Races 0 0 0 0 1 1 1
White 487 189 676 116 66 182 858
Non-Resident Aliens 0 0 0 20 6 26 26
Total 576 223 799 173 103 276 1,075
* Does not include "Special Appointment" Faculty.
Last Updated: November 4, 2013
Full-Time Faculty* by Tenure Status, Ethnicity and Gender
Fall 2013
Tenured Tenure TrackTotal
Tenure
Track
Grand
Total
Total
Tenured
93

University of Nebraska-Lincoln FACULTY and STAFF
Fact Book 2013-2014
Institutional Research and Planning
2004
2005
2006
2007
2008
2009
2010
2011
2012
2013
5 Y
r C
ha
ng
e10 Y
r C
ha
ng
e
Tenure
d F
aculty
833
831
841
849
844
848
857
802
826
814
-4.0
%-2
.3%
Tenure
-Tra
ck F
aculty
210
226
219
233
237
263
269
258
263
277
5.3
%31.9
%
Specia
l A
ppoin
tment
409
425
437
457
436
445
471
496
526
553
24.3
%35.2
%
To
tal
Ge
ne
ral
Re
gu
lar
Fa
cu
lty
1,4
52
1,4
82
1,4
97
1,5
39
1,5
17
1,5
56
1,5
97
1,5
56
1,6
15
1,6
44
5.7
%13.2
%
Researc
h /
Clin
ical F
aculty
103
116
116
100
97
104
115
114
118
119
14.4
%15.5
%
Equiv
ale
nt
Rank F
aculty
179
190
194
181
186
188
193
200
195
194
3.2
%8.4
%
Oth
er
Faculty
179
190
163
162
188
204
221
212
211
182
-10.8
%1.7
%
Health F
aculty
16
17
16
14
16
16
16
18
17
17
6.3
%6.3
%
To
tal
Oth
er
Fa
cu
lty
477
513
489
457
487
512
545
544
541
512
0.0
%7.3
%
Adm
inis
trato
rs151
161
162
166
163
164
168
166
174
182
11.0
%20.5
%
Ath
letics A
dm
inis
trato
rs29
29
27
30
29
30
30
30
31
32
6.7
%10.3
%
Managerial /
Pro
fessio
nal (R
egula
r)1,6
03
1,6
23
1,6
72
1,7
21
1,7
66
1,8
29
1,8
35
1,8
53
1,9
20
1,9
80
8.3
%23.5
%
Offi
ce /
Serv
ice (
Regula
r)1,8
92
1,8
89
1,8
81
1,8
85
1,8
85
1,8
74
1,8
49
1,8
57
1,8
38
1,8
29
-2.4
%-3
.3%
To
tal
Ad
min
istr
ato
rs a
nd
Sta
ff3,6
75
3,7
02
3,7
42
3,8
02
3,8
43
3,8
97
3,8
82
3,9
06
3,9
63
4,0
23
3.2
%9.5
%
To
tal
Fa
cu
lty a
nd
Sta
ff5,6
04
5,6
97
5,7
28
5,7
98
5,8
47
5,9
65
6,0
24
6,0
06
6,1
19
6,1
79
3.6
%10.3
%
Gra
duate
Teachin
g A
ssis
tants
680
688
720
714
757
744
757
764
816
833
12.0
%22.5
%
Gra
duate
Researc
h A
ssis
tants
922
1,0
03
1,0
15
1,0
16
1,0
01
1,0
75
1,1
69
1,1
12
1,1
14
1,0
91
1.5
%18.3
%
Oth
er
Gra
duate
Assis
tants
136
115
126
121
149
148
155
190
218
191
29.1
%40.4
%
To
tal
Gra
du
ate
Ass
ista
nts
1,7
38
1,8
06
1,8
61
1,8
51
1,9
07
1,9
67
2,0
81
2,0
66
2,1
48
2,1
15
7.5
%21.7
%
UN
L T
ota
l17,3
42
7,5
03
7,5
89
7,6
49
7,7
54
7,9
32
8,1
05
8,0
72
8,2
67
8,2
94
4.6
%13.0
%
Stu
dent
Work
ers
3,8
33
3,6
91
3,8
37
4,0
25
4,1
68
4,0
91
4,2
05
4,2
04
3,7
92
4,1
05
0.3
%7.1
%
Last U
pdate
d: N
ove
mb
er
4, 2013
Ad
min
istr
ato
rs a
nd
Sta
ff
Stu
de
nt
Po
siti
on
s
1D
oes n
ot
inclu
de S
tudent-
Work
ers
, Tem
pora
ry O
ffice-S
erv
ice,
Tem
pora
ry M
anagerial-P
rofe
ssio
nal, o
r C
asual W
ork
ers
.
Ge
ne
ral
Re
gu
lar
Fa
cu
lty
Oth
er
Fa
cu
lty
UN
L S
taff
ing
, 1
0 Y
ea
r T
ren
d
94

University of Nebraska-Lincoln FACULTY and STAFF
Fact Book 2013-2014
Institutional Research and Planning
Co
lle
ge
Pro
fess
or
Ass
ocia
te
Pro
fess
or
Ass
ista
nt
Pro
fess
or
Pro
fess
or
of
Pra
cti
ce
Se
nio
r
Le
ctu
rer
Le
ctu
rer
Vis
itin
g
Fa
cu
lty
To
tal
Arc
hitectu
re9.0
09.0
06.0
00.0
00.0
06.3
81.0
031.3
8
Art
s a
nd S
cie
nces
164.1
0106.0
076.0
016.2
51.5
0103.5
41.4
5468.8
4
Busin
ess A
dm
inis
tration
23.5
018.0
021.0
09.6
00.0
09.3
40.0
081.4
4
Education a
nd H
um
an S
cie
nces
46.0
036.0
023.0
027.0
00.5
049.0
60.0
0181.5
6
Engin
eering
50.2
647.0
017.0
01.0
02.6
08.7
60.2
5126.8
7
Hix
son-L
ied F
ine a
nd P
erform
ing A
rts
24.5
534.0
011.0
05.0
02.6
09.7
00.0
086.8
5
Institu
te o
f A
griculture
and N
atu
ral R
esourc
es
148.0
156.0
066.5
018.7
50.0
08.3
33.2
4300.8
3
Journ
alis
m a
nd M
ass C
om
munic
ations
8.0
010.0
05.0
07.3
30.0
018.0
00.0
048.3
3
Law
22.7
54.0
07.0
00.0
00.0
03.4
01.0
038.1
5
Lib
raries
14.0
015.0
06.0
02.0
00.0
00.0
00.0
037.0
0
Univ
ers
ity o
f N
ebra
ska S
tate
Museum
1.0
00.0
00.0
00.0
00.0
00.0
00.0
01.0
0
Oth
er1
2.0
00.0
00.0
02.0
00.0
03.2
52.0
29.2
7
To
tal
513.1
7335.0
0238.5
088.9
37.2
0219.7
68.9
61,4
11.5
2
Em
plo
ye
e C
lass
ific
ati
on
FT
E
Managerial /
Pro
fessio
nal
1,9
49.7
0
Offi
ce /
Serv
ice
1,7
79.1
4
To
tal
3,7
28.8
4
Last U
pdate
d: N
ove
mb
er
15, 2013
1R
egula
r em
plo
yees a
re e
mplo
yed f
or
more
than s
ix m
onth
s a
nd r
eceiv
e b
enefits
. D
oes n
ot in
clu
de s
tudent w
ork
ers
, gra
duate
assis
tants
, on-c
all
or
ancillary
em
plo
yees.
Fu
ll-T
ime
Eq
uiv
ale
nc
y (
FT
E)
Note
: Faculty
inclu
des b
oth
full-
time a
nd p
art
-tim
e f
aculty
(te
nure
d, te
nure
-tra
ck,
and s
pecia
l appoin
tment)
and c
hairpers
ons e
mplo
yed b
y U
NL a
s o
f th
e f
all
census d
ate
(does n
ot in
clu
de N
ebra
ska
Colle
ge o
f Technic
al A
gricultu
re f
aculty
). "O
ther
faculty
," "
Equiv
ale
nt R
ank
faculty
," "R
esearc
h / C
linic
al f
aculty
" and "
Health
faculty
" are
exclu
ded.
FT
E o
f G
en
era
l R
eg
ula
r F
ac
ult
y b
y R
an
k a
nd
Co
lle
ge
, F
all 2
01
3
Oth
er1
: A
cadem
ic A
ffairs, C
ente
r fo
r Pla
nt S
cie
nce In
novatio
n, G
raduate
Stu
die
s, In
tern
atio
nal A
ffairs, N
ebra
ska
Cente
r fo
r M
ate
rials
and N
anoscie
nce, R
aik
es S
chool o
f
Com
pute
r S
cie
nce a
nd M
anagem
ent, U
nderg
raduate
Educatio
n P
rogra
ms.
FT
E o
f R
eg
ula
r S
taff
1, F
all 2
01
3
95

University of Nebraska-Lincoln FACULTY and STAFF
Fact Book 2013-2014
Institutional Research and Planning
M F M F M F M F Total Percentage
American Indian or Alaska Native 1 6 0 0 6 1 0 0 14 0.4%
Asian 18 33 1 0 18 23 1 2 96 2.5%
Black or African American 24 22 1 2 20 18 0 1 88 2.3%
Hispanic / Latino 14 20 0 0 18 33 1 3 89 2.3%
Native Hawaiian / Pacific Islander 1 0 0 0 1 0 0 0 2 0.1%
Two or More Races 0 2 0 0 2 4 0 1 9 0.2%
White 849 874 17 71 726 813 26 104 3,480 91.4%
Non-Resident Alien 13 11 0 0 2 5 0 0 31 0.8%
Total 920 968 19 73 793 897 28 111 3,809 100.0%
Last Updated: November 4, 2013
Fall 2013
Staff Profile by Gender, Full- and Part-Time Status
*Regular Employees are employed for more than six months and receive benefits. Does not include student w orkers, graduate
assistants, on-call or ancillary employees.
(Regular Employees Only*)
Staff Profile by Gender, Full- and Part-Time Status, and Ethnicity
Totals
Managerial /
ProfessionalOffice/Service
Part-TimeFull-TimePart-TimeFull-Time
920
19
793
28
968
73
897
111
0
250
500
750
1,000
1,250
Mgr / Prof Mgr / Prof Office / Service Office / Service
Full-Time Part-Time Full-Time Part-Time
Male Female
96

University of Nebraska-Lincoln BUDGET Fact Book 2013-2014
Institutional Research and Planning
Fund Source 2009-2010 2010-2011 2011-2012 2012-2013 2013-2014
Federal Funds $218,595,961 $246,813,063 $253,271,354 $258,766,556 $259,297,650Revolving Funds $323,285,103 $340,474,516 $350,901,944 $351,614,208 $376,174,684
General Funds (State Appropriations)
$234,319,233 $226,495,925 $227,495,810 $230,901,834 $241,401,417
Trust Funds (Private Support) $96,964,457 $119,547,342 $120,580,398 $129,079,360 $122,794,807Cash Funds (Tuition and Fees) $147,455,203 $158,969,134 $178,823,306 $185,017,388 $189,656,714Total Estimated Funding $1,020,619,957 $1,092,299,980 $1,131,072,812 $1,155,379,346 $1,189,325,272
Spending Category 2009-2010 2010-2011 2011-2012 2012-2013 2013-2014
Instruction $178,077,795 $198,097,150 $211,760,654 $218,962,174 $215,002,301Research $200,629,585 $214,422,785 $224,776,832 $233,151,237 $238,742,127Public Service $86,508,676 $88,239,827 $91,145,280 $78,849,819 $82,489,686Academic Support $61,637,395 $60,925,628 $56,513,667 $57,445,192 $69,577,070Student Services $138,645,756 $145,446,379 $147,885,744 $156,526,079 $168,085,339Administration $51,997,745 $55,301,108 $58,362,663 $60,088,225 $62,056,349Physical Plant Operations $48,489,034 $43,791,583 $45,331,081 $49,153,684 $51,103,003Student Financial Support $142,899,505 $166,234,452 $170,146,510 $175,039,052 $175,112,137Other $111,734,466 $119,841,068 $125,150,381 $126,163,884 $127,157,260Total Budgeted Expenditures $1,020,619,957 $1,092,299,980 $1,131,072,812 $1,155,379,346 $1,189,325,272
Last Updated: September 4, 2013
Budgeted Expenditures by Spending Category
Note: Above amounts exclude Nebraska College of Technical Agriculture (NCTA).
General Operating Budget Selected Numbers
5 Year Trend
Estimated Revenue by Fund Source
97

University of Nebraska-Lincoln BUDGET Fact Book 2013-2014
Institutional Research and Planning
Amount Percent
$259,297,650 21.8%$376,174,684 31.6%$241,401,417 20.3%$122,794,807 10.3%$189,656,714 15.9%
$1,189,325,272 100.0%
Last Updated: September 4, 2013
Trust Funds (Private Support)Cash Funds (Tuition and Fees)Total Budgeted Revenue
University of Nebraska-Lincoln Operating Budget
2013-2014 Estimated Revenue by Fund Source
2013-2014 Estimated Revenue by Fund Source
Federal Funds
General Funds (State Appropriations)Revolving Funds
Federal Funds21.8%
Revolving Funds31.6%
General Funds (State
Appropriations)
20.3%
Trust Funds (Private Support)
10.3%
Cash Funds (Tuition and Fees)
15.9%
98

University of Nebraska-Lincoln BUDGET Fact Book 2013-2014
Institutional Research and Planning
Amount Percent
$215,002,301 18.1%$238,742,127 20.1%$82,489,686 6.9%$69,577,070 5.9%
$168,085,339 14.1%$62,056,349 5.2%$51,103,003 4.3%
$175,112,137 14.7%$127,157,260 10.7%
$1,189,325,272 100.0%
Last Updated: September 4, 2013
University of Nebraska-Lincoln Operating Budget
2013-2014 Budgeted Expenditures by Spending Category
2013-2014 Budgeted Expenditures by Spending Category
ResearchInstruction
Academic SupportPublic Service
OtherTotal Budgeted Expenditures
Student ServicesAdministration
Student Financial SupportPhysical Plant Operations
Instruction18.1%
Research20.1%
Public Service6.9%
Academic Support5.9%
Student Services14.1%
Administration5.2%
Physical Plant Operations
4.3%
Student Financial Support14.7%
Other10.7%
99

University of Nebraska-Lincoln RESEARCH EXPENDITURES Fact Book 2013-2014
Institutional Research and Planning
YearTotal Research
Expenditures
Sponsored Research
Expenditures
1998-1999 $131,046,000 $53,492,000 1999-2000 $136,023,000 $55,584,000 2000-2001 $157,520,000 $56,303,000 2001-2002 $171,431,000 $67,552,000 2002-2003 $200,287,000 $87,827,000 2003-2004 $192,846,000 $80,044,000 2004-2005 $200,287,000 $87,827,000 2005-2006 $228,977,164 $95,954,629 2006-2007 $229,496,755 $97,321,275 2007-2008 $244,869,871 $102,642,111 2008-2009 $251,194,174 $102,098,675 2009-2010 $191,267,272 $115,737,616 2010-2011 $235,296,157 $124,528,5642011-2012 $253,320,561 $123,651,847
Source: Office of Research and Economic DevelopmentLast Updated: October 1, 2013
Total Research Expenditures
Total Research Expenditures
$131 $136
$158 $1
71
$200
$193 $2
00
$229
$229 $2
45 $251
$191
$235 $2
53
$53
$56
$56 $6
8
$88
$80 $8
8 $96
$97 $103
$102 $1
16 $125
$124
$0
$50
$100
$150
$200
$250
$300 1
998-
1999
199
9-20
00
200
0-20
01
200
1-20
02
200
2-20
03
200
3-20
04
200
4-20
05
200
5-20
06
200
6-20
07
200
7-20
08
200
8-20
09
200
9-20
10
201
0-20
11
2011
-201
2
Milli
ons
of D
olla
rs
Total Research Expenditures Sponsored Research Expenditures
100

University of Nebraska-Lincoln RESEARCH EXPENDITURES Fact Book 2013-2014
Institutional Research and Planning
Fiscal Year 2009-2010 2010-2011 2011-2012
U.S. Federal Government $96,068,588 $105,724,032 $104,578,874State and Local Government $5,714,682 $4,538,317 $3,797,249Industry $10,031,115 $10,335,304 $10,459,959Nonprofit Organizations $2,308,329 $2,839,510 $3,326,750Other $1,614,902 $1,091,402 $1,489,015Total Sponsored Research Expenditures $115,737,616 $124,528,564 $123,651,847
Institutional Funds $65,059,209 $105,270,544 $123,917,235NU Foundation $10,470,448 $5,497,048 $5,751,479Total Institutionally Funded Research Expenditures $75,529,656 $110,767,592 $129,668,714
Total Research Expenditures $191,267,272 $235,296,157 $253,320,561
Last Updated: October 1, 2013
Total Research Expenditures
3 Year Trend
*Expenditures as reported to the National Science Foundation's Higher Education Research and Development Survey
Total Research Expenditures*
101

University of Nebraska-Lincoln FACILITIES Fact Book 2013-2014
Institutional Research and Planning
Room Use CategoryCity and East Campus
Net Area (NASF)*
City and East Campus
Net Area Percentage
Residential Facilities 1,387,227 17.8%Support Facilities 1,305,907 16.7%Office Facilities 1,222,913 15.7%Special-Use Facilities 963,064 12.3%General-Use Facilities 711,627 9.1%Research Lab Facilities 616,414 7.9%Under Conversion 559,238 7.2%Study Facilities 397,682 5.1%Class Laboratory Facilities** 321,308 4.1%Classroom Facilities** 292,648 3.8%Health-Care Facilities 22,510 0.3%Total 7,800,538 100.0%
Room Use Summary - June 30, 2013
Source: Facilities Snapshot, June 30, 2013Last Updated: August 30, 2013
**Includes teaching support space
NOTE: Campus space that UNL does not own or use, such as the College of Dentistry, the Wick Alumni Center, the NETC Building, and buildings or space occupied solely by the USDA, is not included in this summary.
Net Assignable Area for UNL City and East Campuses
Greater Nebraska Buildings are not included
*NASF = Net Assignable Square Feet
17.8%
16.7%
15.7%
12.3%
9.1%
7.9%
7.2%
5.1%
4.1%
3.8%
0.3%
Residential Facilities
Support Facilities
Office Facilities
Special-Use Facilities
General-Use Facil ities
Research Lab Facilities
Under Conversion
Study Facilities
Class Laboratory Facilities**
Classroom Facilities**
Health-Care Facilities
102

University of Nebraska-Lincoln FACILITIES Fact Book 2013-2014
Institutional Research and Planning
Campus Location Acres
East Campus Lincoln 342.730City Campus Lincoln 279.279City and East Campuses Total 622.009
Off-Campus in Lincoln Lincoln 12.620Lincoln Total 634.629
Agricultural Research and Development Center Mead 9,487.500West Central Research and Extension Center North Platte 1,798.080South Central Research and Extension Center Clay Center 640.000Panhandle Research and Extension Center Scottsbluff 547.620Northeast Research and Extension Center Concord 479.000Research and Extension Center Total 12,952.200
Other Land2 State-wide 29,194.623UNL Total 42,781.452
Nebraska Innovation Campus Lincoln 233.010
UNL and Nebraska Innovation Campus 43,014.462
1Includes land owned, leased and rented by UNL. Excludes Varner Hall property (3.8 acres).
Source: Property Management Snapshot, June 30, 2013Last Updated: August 30, 2013
UNL Land Inventory - June 30, 2013
2Includes farms, ranches, prairies and other research sites such as Cedar Point, High Plains Ag Lab, and Gudmensen Sandhills Lab throughout the state.
Research and Extension Centers
UNL Land Inventory1
Lincoln
67.87%
30.11%
0.80%
0.65%
0.54%
0.03%
Other
Research and Extension Centers
East Campus
City Campus
Nebraska Innovation Campus
Off Campus Lincoln
103

University of Nebraska-Lincoln FACILITIES Fact Book 2013-2014
Institutional Research and Planning
Campus Square Footage
City Campus 10,756,850East Campus 2,498,861City and East Campuses Total 13,255,711
Leased - Lincoln 257,260Off-Campus in Lincoln 112,693Lincoln Total 13,625,664
Greater Nebraska 1,213,252Leased - Greater Nebraska 39,292Greater Nebraska Total 1,252,544
UNL Total 14,878,208
Nebraska Innovation Campus 403,320
UNL and Nebraska Innovation Campus 15,281,528
Source: Facilities Snapshot, June 30, 2013Last Updated: August 30, 2013
Building Gross Square Footage - June 30, 2013
Building Gross Square Footage
NOTE: Includes all UNL-maintained buildings, including those owned or operated by auxiliaries.
70.4%
16.4%
7.9%
2.6%
1.7%
0.7%
0.3%
City Campus
East Campus
Greater Nebraska
Nebraska Innovation Campus
Leased - Lincoln
Off Campus Lincoln
Leased - Greater Nebraska
104

University of Nebraska-Lincoln AWARDS
Fact Book 2014-2015
Institutional Research and Planning
University of Nebraska Awards, UNL Recipients
Awards included in this section:
University of Nebraska Award for Outstanding Research and Creative Activity (ORCA), UNL Recipients
University of Nebraska Award for Outstanding Teaching and Instructional Creativity (OTICA), UNL Recipients
University of Nebraska Innovation, Development, and Engagement Award (IDEA), UNL Recipients
University-Wide Departmental Teaching Award (UDTA), UNL Recipients
University of Nebraska Award for Outstanding Research and Creative Activity (ORCA) University of Nebraska-Lincoln Recipients
Two ORCA awards are presented each year in honor of outstanding research or creative activity of national/international significance conducted by individual full-time faculty members at NU. The awards are given for a sustained record of excellent accomplishment in research or creative activity, rather than “meritorious service”. A major part of the work on which each nomination is based must have been done while the nominee has served at NU. Each nominee must still be engaged in research or other creative activity at the University to be eligible. Each recipient receives $3,500 and an award medallion and plaque. Nominees are reviewed by a university-wide committee, appointed by the provost, of graduate faculty, who recommend recipients to the provost, who makes the appointment. Year Recipient Department 2014 Susan Sheridan Educational Psychology 2014 Donald Weeks Biochemistry 2013 Kenneth Price University Libraries & English 2012 Carolyn Pope-Edwards Child, Youth & Family Studies 2011 P Stephen Baenziger Agronomy & Horticulture 2010 Jonis Agee English 2010 Xiao Zeng Chemistry
University of Nebraska Award for Outstanding Teaching and Instructional Creativity (OTICA) University of Nebraska-Lincoln Recipients
Awards
Because of space limitations, only award winners from the past five years (2010-2014) are included. For a more complete listing, see the “Award History” PDF located on the IRP web site at http://irp.unl.edu/publication/fact-book. Awards are divided into the following major sections:
University of Nebraska Awards, UNL Recipients
University of Nebraska-Lincoln Faculty Awards
University of Nebraska-Lincoln Distinguished Teaching Awards
University of Nebraska-Lincoln Named Chairs and Professorships
University of Nebraska-Lincoln Staff Awards
University of Nebraska Faculty/Staff Awards
105

University of Nebraska-Lincoln AWARDS
Fact Book 2014-2015
Institutional Research and Planning
Two OTICA awards are presented each year in honor and recognition of meritorious and sustained records of excellence in teaching and creativity related to teaching to full-time faculty members of NU. Both awards may be made to the same campus in a given year. The Provost appoints a five-member university-wide award selection committee to review the nominations from the campuses. The recipients of the OTICA award are each awarded $10,000, an award medallion, and a plaque. Year Recipient Department 2014 Judy Walker Mathematics 2012 Tiffany Heng-Moss Entomology 2010 Laura White English
University of Nebraska Innovation, Development, and Engagement Award (IDEA) University of Nebraska-Lincoln Recipients
The Innovation, Development, and Entrepreneurship Award (IDEA) is a university-wide faculty award recognizing faculty excellence in engagement and outreach. Up to two awards are presented annually. The award honors faculty members who extend their academic expertise beyond traditional boundaries of the university in ways that enrich the broader community. Faculty members are recognized for working with citizens, businesses, government and nonprofit organizations, other educational institutions, communities, or regions to develop new ideas, technologies, programs, or businesses that strengthen the region or community economically, educationally, or governmentally. Recipients receive an award of $3,500, a presidential medallion, and a plaque from NU.
Year UNL Recipient Department 2014 Shane Farritor Mechanical & Materials Engineering 2012 Chris Calkins Animal Science 2011 Stephen Taylor Food Science & Technology
University-Wide Departmental Teaching Award (UDTA) University of Nebraska-Lincoln Recipients
One University-wide Departmental Teaching Award is presented in honor and recognition of a department/unit within NU that has made a unique and significant contribution to the teaching efforts of the University and which has outstanding esprit de corps in its dedication to the education of students at the undergraduate, graduate, or professional levels. Year UNL Recipient 2013 Teaching, Learning and Teacher Education 2010 Department of Psychology
University of Nebraska-Lincoln Faculty Awards
Awards included in this section:
Annis Chaikin Sorensen Award for Distinguished Teaching in the Arts and Humanities
Foundation Builder’s Award for Outstanding Academic Advising
Distinguished Educational Service Award
George Howard-Louis Pound Distinguished Career Award
James A. Lake Academic Freedom Award
Donald R. and Mary Lee Swanson Award for Teaching Excellence
James P. O’Hanlon Academic Leadership Award
106

University of Nebraska-Lincoln AWARDS
Fact Book 2014-2015
Institutional Research and Planning
Annis Chaikin Sorensen Award Distinguished Teaching in the Arts and Humanities
A campus-wide award conferred upon a scholar in one of the following disciplines: art, classics, communication studies, English, history, modern languages and literatures, journalism, libraries, music, philosophy, theatre arts, ROTC, museum, athletic department and all departments in the College of Architecture. It was first conferred in 1981 and commemorates the matriarch of a Nebraska family notable for service in politics, education and business at the state, national and international levels. Annis Sorensen led the movement to put women’s suffrage on the Nebraska ballot. The award recognizes creative activities related to teaching in the humanities focusing on courses, curriculum development and or program development. The recipient receives a $1,500 stipend. Year Recipient Department 2014 Carole Levin History 2013 Diane Barger School of Music 2012 Priscilla Hayden-Roy Modern Languages & Literature 2011 Joy Castro English 2010 Laura White English
Foundation Builder’s Award for Outstanding Academic Advising
This award includes a $1,500 stipend and is presented to individuals who interact with students through successful academic advising and assist students to arrive at academic paths that will lead to satisfying careers. Established in 1987, the award acknowledges faculty members who have demonstrated outstanding academic advising ability, and who by their service to UNL, have made a considerable contribution to the educational enrichment of UNL students. All faculty are eligible for the award and nominations may be made by any UNL student, faculty or staff member, or administrator. Year Recipient Department 2014 Rosalee Swartz Agribusiness Program 2013 Britta Osborne Biochemistry 2012 No recipient 2011 James J. Cotter College of Education & Human Sciences, Student Services Center 2010 Warren Luckner Actuarial Science
Distinguished Educational Service Award
One of the highest honors that UNL bestows upon a faculty member, the Distinguished Educational Service Award recognizes faculty for educational service in areas other than residential instruction. To be eligible, a faculty member must devote at least 25 percent of his or her time to what is considered an extension of educational service. Year Recipient Department 2011 Frederick Baxendale Entomology 2010 John DeFrain Child, Youth & Family Studies
George Howard-Louise Pound Distinguished Career Award
The Howard-Pound Distinguished Career Award was approved by the Academic Senate in 1989 to recognize an individual whose career at UNL has made an exceptional contribution to the university community. This contribution may have been made through teaching, research or administrative service, or a combination of those activities. The award’s namesakes are George Howard, an early
107

University of Nebraska-Lincoln AWARDS
Fact Book 2014-2015
Institutional Research and Planning
alumnus and professor at NU, considered to be one of the university’s founding intellectuals, and Louise Pound, an alumna and prominent faculty member. Year Recipient Department 2014 Jim Walter Teaching, Learning & Teacher Education 2013 John Janovy, Jr. Biological Sciences 2013 Helen A. Moore Sociology 2012 David Forsythe Political Science 2012 David J Sellmyer Physics & Astronomy 2011 Barbara DiBernard English 2010 Douglas Zatechka University Housing James A. Lake Academic Freedom Award
The James A. Lake Academic Freedom Award was established in 1980 to honor an individual who “helps preserve the most basic freedom of all, the freedom to seek and communicate truth”. Supported by a contribution from former Regent Ed Schwartzkopf, the award is given by the UNL Faculty Senate based upon a nomination by the James A. Lake Academic Freedom Award Committee. Year Recipient Department 2013 Laurie Thomas Lee Broadcasting 2011 John Bender News-Editorial Donald R. and Mary Lee Swanson Award for Teaching Excellence
Funded by a gift from Donald R. Swanson, the Donald R. and Mary Lee Swanson Award for Teaching Excellence honors exemplary teaching in the College of Education and Human Sciences (formerly Teachers College) and carries a $12,500 cash gift for the recipient. The award was first given in 1999. The central focus of the award is the positive impact of teaching on students. Winners will have demonstrated a record of teaching in a manner that engages students in higher order thinking; teaching that enables students to become active and continuous learners; a history of holding high standards for student performance and a record of engagement in activities ad research to improve one’s own teaching. Donald Swanson retired in 1987 from Lincoln Telephone and Telegraph Co. after a 40 year career. His late wife, Mary Lee, was a 1940 graduate of Teachers College. Mr. Swanson believes that teachers are the key to turning lives in positive directions. Year Recipient Department 2014 John Maag Special Education & Communication Disorders 2013 E. Charles Healey Special Education & Communication Disorders 2012 Guy Trainin Teaching, Learning & Teacher Education 2011 Michelle I Rupiper Child, Youth & Family Studies 2010 Edmund “Ted” Hamann Teaching, Learning & Teacher Education
James P. O’Hanlon Academic Leadership Award Starting in 2015, UNL will present this award annually to recognize an academic leader whose administrative effectiveness is based on character and integrity and whose actions reflect a genuine respect for the diversity of people and perspectives that form a great university. Year Recipient Department 2014 James P. O’Hanlon College of Journalism and Mass Communication
108

University of Nebraska-Lincoln AWARDS
Fact Book 2014-2015
Institutional Research and Planning
University of Nebraska-Lincoln Distinguished Teaching Awards Awards included in this section (alphabetically by college):
Distinguished Teaching Awards: College of Agricultural Sciences and Natural Resources
Distinguished Teaching Awards: College of Architecture
Distinguished Teaching Awards: College of Arts and Sciences
Distinguished Teaching Awards: College of Business Administration
Distinguished Teaching Awards: College of Education and Human Sciences
Teachers College
College of Human Resources and Family Sciences
Distinguished Teaching Awards: College of Engineering
Distinguished Teaching Awards: Hixson-Lied College of Fine and Performing Arts
Distinguished Teaching Awards: College of Journalism and Mass Communications
Distinguished Teaching Awards: College of Law In 1976, the Nebraska Legislature authorized the presentation of $1,000 stipends to selected faculty members to recognize outstanding teaching. Up to 15 awards are presented each year based on recommendations from the colleges, each of which have differing criteria for selection.
Distinguished Teaching Awards: College of Agricultural Sciences and Natural Resources
Year Recipient Department 2014 Bryan Reiling Animal Science 2013 Lloyd Bell Ag Leadership, Education & Communication 2012 Charles A Francis Agronomy & Horticulture 2011 Susan Cuppett Food Science & Technology 2010 Martha Mamo Agronomy & Horticulture
Distinguished Teaching Award: College of Architecture
Year Recipient Department 2012 Peter Hind Architecture Distinguished Teaching Awards: College of Arts and Sciences Year Recipient Department 2014 Rebecca Lai Chemistry 2014 Mark Brittenham Mathematics 2014 Sergio Wals Political Science & Ethnic Studies 2014 Catherine Johnson Modern Languages & Literature 2014 Shari Stenberg English 2014 Petronela Radu Mathematics 2013 Roland Vegso English 2013 Isabel Maria Velazquez Modern Languages & Literatures 2013 Stephen Ramsay English 2013 Lisa Kort-Butler Sociology 2013 Sarah Gervais Psychology 2012 Michael Dodd Psychology 2012 Rose Holz Women’s & Gender Studies 2012 Christine Kelley Mathematics 2012 Eric Malina Chemistry
109

University of Nebraska-Lincoln AWARDS
Fact Book 2014-2015
Institutional Research and Planning
2012 T. Jack Morris School of Biological Sciences 2012 Seanna Sumalee Oakley English 2011 Tracy D Frank Earth & Atmospheric Sciences 2011 June Griffin English 2011 Ari Kohen Political Science 2011 Kenneth Nickerson Biological Sciences 2011 Lisong Xu Computer Science & Engineering 2010 Stephen Hartke Mathematics 2010 Debra Hope Psychology 2010 Julia Schleck English
Distinguished Teaching Awards: College of Business Administration
Year Recipient Department 2014 Scott Friend Marketing 2013 Geoffrey Friesen Finance 2012 Subrata Chakrabarty Management 2011 Aaron D Crabtree Accountancy 2010 John Geppert Finance Distinguished Teaching Awards: College of Education and Human Sciences Year Recipient Department 2014 Theresa Catalano Teaching, Learning & Teacher Education 2014 Sheree Moser Child, Youth & Family Studies 2014 Malinda Eccarius Special Education & Communication Disorders 2013 Julia Torquati Child, Youth & Family Services 2013 Martha Horvay Textiles, Merchandising & Fashion Design 2013 James Griesen Educational Administration 2012 William Lopez Teaching, Learning & Teacher Education 2012 Loukia K Sarroub Teaching, Learning & Teacher Education 2012 Yan Ruth-Xia Child, Youth & Family Studies 2011 Jenelle Reeves Teaching, Learning & Teacher Education 2011 Allison M J Reisbig Child, Youth & Family Studies 2011 Stephanie D Wessels Teaching, Learning & Teacher Education 2010 Eric Buhs Educational Psychology 2010 Paul Springer Child, Youth & Family Studies 2010 Stephen Swidler Teaching, Learning & Teacher Education
Distinguished Teaching Awards: College of Engineering
Year Recipient Department 2014 Paul Harmon Construction Management 2014 Mehrdad Negahban Mechanical & Materials Engineering 2013 Curtis Weller Biological Systems Engineering and Food Science & Technology 2013 Roger Sash Computer & Electronics Engineering 2012 Leen-Kiat Soh Computer Science & Engineering 2012 Lily Wang Architectural Engineering & Construction 2011 Carl A. Nelson Mechanical Engineering 2011 Kevin E Van Cott Chemical & Biomolecular Engineering 2010 Dennis Alexander Electrical Engineering 2010 Wieslaw Szdlowski Mechanical Engineering
110

University of Nebraska-Lincoln AWARDS
Fact Book 2014-2015
Institutional Research and Planning
Distinguished Teaching Awards: Hixson-Lied College of Fine and Performing Arts
Year Recipient Department 2014 Susan Levine Ourada School of Music 2013 Aaron Holz Art & Art History 2012 Eric Richards School of Music 2011 Alan F. Mattingly School of Music 2010 Rhonda Fuelberth School of Music
Distinguished Teaching Awards: College of Journalism and Mass Communications
Year Recipient Department 2013 Stacy James Advertising & Public Relations 2011 Amy Struthers Advertising & Public Relations
Distinguished Teaching Awards: College of Law
Year Recipient Department 2014 Adam Thimmesch Law 2010 Eric Berger Law
University of Nebraska-Lincoln Named Chairs and Professorships
Awards included in this section:
Charles Bessey and Willa Cather Professorships
Harold and Esther Edgerton Junior Faculty Award
John E. Weaver and Aaron Douglas Professorships in Teaching Excellence
The Academy of Distinguished Teachers
Susan J. Rosowski Associate Professorships
Paula and D.B. Varner University Professorship
George W. Holmes University Professorship
Charles Bessey and Willa Cather Professorships
Charles Bessey and Willa Cather Professorships are awarded to faculty who have demonstrated an exceptional record of distinguished scholarship and creative activity. Their work reflects the highest levels of achievement, quality, and importance. Willa Cather, an NU alumna and winner of the 1923 Pulitzer Prize for her novel One of Ours, is widely recognized as one of America’s premiere authors. Charles Bessey, an NU professor at the turn of the 20th century, was a pioneering botanist and educator. Recognized for his pioneering science, including among other interests the ecology of the prairie, he served as president of the American Association for the Advancement of Science and editor of Science magazine. Cather and Bessey professorships are granted for five-year, renewable appointments. Nominations are made to the University Professorships Committee, which recommends appointment to the Chancellor. These professorships were established in 2002.
Year Recipient College / Unit 2014 Alexei Gruverman Bessey Professor of Physics & Astronomy 2014 Jordan Stump Cather Professor of Modern Languages & Literature 2014 Susan Swearer Cather Professor of Educational Psychology
111

University of Nebraska-Lincoln AWARDS
Fact Book 2014-2015
Institutional Research and Planning
2014 Mark Walker Cather Professor of Mathematics 2013 Hong Jiang Cather Professor of Computer Science & Engineering 2013 Donald Becker Bessey Professor of Biochemistry 2012 Rick Bevins Cather Professor of Psychology 2012 Srikanth Iyengar Cather Professor of Mathematics 2011 Paul N. Black Bessey Professor of Biochemistry 2011 David B. Berkowitz Cather Professor of Chemistry 2011 Helen Holz Raikes Cather Professor of Child, Youth & Family Studies 2011 Janos Zempleni Cather Professor of Nutrition & Health Sciences 2010 James Alfano Bessey Professor of Plant Pathology 2010 Paul Blum Bessey Professor of Biological Sciences 2010 Kimberly Andrews Espy Bessey Professor of Psychology 2010 Andrzej Rajca Bessey Professor of Chemistry 2010 Elizabeth Theiss-Morse Cather Professor of Political Science Harold and Esther Edgerton Junior Faculty Award
Established in 2001, the Harold and Esther Edgerton Junior Faculty Award honors outstanding junior (pre-tenured) faculty in the third year of his or her appointment who has demonstrated creative research, extraordinary teaching abilities and academic promise. The award’s goal is to provide strong incentive to pre-tenure faculty to expand expertise and enhance learning at UNL. This award provides resources for professional development funds and a cash award for two years. It is named in honor of a distinguished alumnus, inventor of the strobe light and instrumental in refining sonar, and his wife. Year Recipient Department 2014 Alexander Sinitskii Chemistry 2013 Daniel Toundykov Mathematics 2012 John B Gates Earth and Atmospheric Sciences 2011 Wei Qiao Electrical Engineering 2010 Christine Kelly Mathematics 2010 Sabrina Russo School of Biological Sciences John E. Weaver or Aaron Douglas Professorships for Teaching Excellence
Established in 2008, these professorships are awarded to faculty holding the full professor rank, who demonstrate sustained and extraordinary levels of teaching excellence and national visibility for instructional activities and/or practice. They are five-year renewable appointments and carry a $5,000 annual stipend. Faculty selected for these professorships will choose either the Weaver or Douglas title. Only the name is different, as the professorships have identical selection criteria.
Year Recipient College/Unit 2014 Laura White John Weaver Professor of English 2012 Judy Walker Aaron Douglas Professor of Mathematics 2010 Stephen Buhler Aaron Douglas Professor of English 2010 Cal Garbin John Weaver Professor of Psychology
Susan J. Rosowski Associate Professorships
This professorship recognizes faculty at the associate professor level who have achieved distinguished records of scholarship or creative activity and who show exceptional promise for future excellence. This professorship is open only to associate professors who have no other named professorship. It is a five-year professorship and carries a $3,000 annual stipend. The Rosowski Professorship is named in honor of the late Susan J. Rosowski (1942-2004), who at the time of her death was the Adele Hall
112

University of Nebraska-Lincoln AWARDS
Fact Book 2014-2015
Institutional Research and Planning
Distinguished Professor of English at UNL. She established the (Willa) Cather Project, and was general editor for the scholarly edition of Cather’s works published by the University of Nebraska Press, a multi-volume project.
Year Recipient College/Unit 2014 Rebecca Lai Chemistry 2013 Jay Storz Biological Sciences 2013 Myra Cohen Computer Science & Engineering 2013 Joy Castro English 2013 Stephen Ramsay English 2012 Jaekwon Lee Biochemistry 2011 Melanie A Simpson Biochemistry 2010 John Gibbons Philosophy 2010 Vinodchandran Variyam Computer Science & Engineering
Paula and D.B. Varner University Professorship The Paula and D.B. Varner University Professorship shall be awarded to a member of the faculty who has earned distinction as a teacher-scholar and who has demonstrated loyalty to the University through an extended period of distinguished service. The professorship was established in 1986 by the University of Nebraska Foundation's Executive Committee to honor the Varners upon Mr. Varner's retirement as chairman of the Foundation. Mr. Varner headed the NU system for seven years before becoming its chief fundraiser. He holds the distinction of being both the chancellor and president of the university. When he arrived in Nebraska from Michigan in 1970 to assume the reins of NU central administration, the CEO position was titled chancellor. Soon, the title was switched to president. He left that position in 1977 and became chairman of the NU Foundation until his official retirement in 1987. Year Recipient Department 2012 Amy Nelson Burnett History George W. Holmes University Professorship George W. Holmes University Professorships are supported by the University of Nebraska Foundation from the estate of George W. Holmes, a prominent Lincoln businessman, civic leader and philanthropist in the 1920s. Holmes was the nephew of one of Lincoln's earliest businessmen, Silas Burnham, president of First National Bank. In 1911, Holmes was the originating secretary/general manager and later president of the First Trust Co., was a director of Beatrice Foods and the Omaha branch of the Federal Reserve Bank of Kansas City. In the 1920s, Holmes' bank guaranteed the loans that allowed the construction of Memorial Stadium. Holmes gave the city a tract of land upon which was built Holmes School, which honored his mother. The family name also lives on in Lincoln's Holmes Park, Holmes Lake and Holmes Golf Course. Year Recipient Department 2013 Evgeny Tsymbal Physics & Astronomy 2012 Edgar Cahoon Biochemistry
University of Nebraska-Lincoln Staff Awards
Awards included in this section:
Floyd S. Oldt Boss of the Year Award
Floyd S. Oldt Silver Pen Award
Floyd S. Oldt Outstanding Staff Award
113
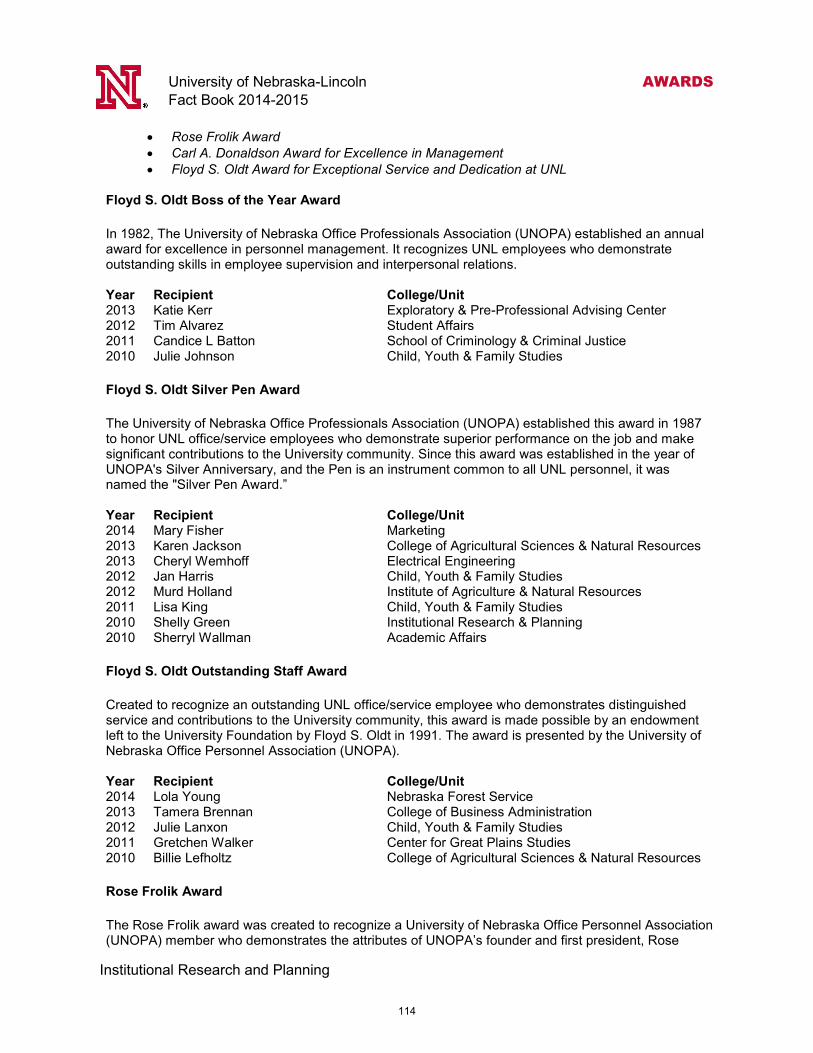
University of Nebraska-Lincoln AWARDS
Fact Book 2014-2015
Institutional Research and Planning
Rose Frolik Award
Carl A. Donaldson Award for Excellence in Management
Floyd S. Oldt Award for Exceptional Service and Dedication at UNL
Floyd S. Oldt Boss of the Year Award
In 1982, The University of Nebraska Office Professionals Association (UNOPA) established an annual award for excellence in personnel management. It recognizes UNL employees who demonstrate outstanding skills in employee supervision and interpersonal relations. Year Recipient College/Unit 2013 Katie Kerr Exploratory & Pre-Professional Advising Center 2012 Tim Alvarez Student Affairs 2011 Candice L Batton School of Criminology & Criminal Justice 2010 Julie Johnson Child, Youth & Family Studies
Floyd S. Oldt Silver Pen Award
The University of Nebraska Office Professionals Association (UNOPA) established this award in 1987 to honor UNL office/service employees who demonstrate superior performance on the job and make significant contributions to the University community. Since this award was established in the year of UNOPA's Silver Anniversary, and the Pen is an instrument common to all UNL personnel, it was named the "Silver Pen Award.” Year Recipient College/Unit 2014 Mary Fisher Marketing 2013 Karen Jackson College of Agricultural Sciences & Natural Resources 2013 Cheryl Wemhoff Electrical Engineering 2012 Jan Harris Child, Youth & Family Studies 2012 Murd Holland Institute of Agriculture & Natural Resources 2011 Lisa King Child, Youth & Family Studies 2010 Shelly Green Institutional Research & Planning 2010 Sherryl Wallman Academic Affairs
Floyd S. Oldt Outstanding Staff Award
Created to recognize an outstanding UNL office/service employee who demonstrates distinguished service and contributions to the University community, this award is made possible by an endowment left to the University Foundation by Floyd S. Oldt in 1991. The award is presented by the University of Nebraska Office Personnel Association (UNOPA). Year Recipient College/Unit 2014 Lola Young Nebraska Forest Service 2013 Tamera Brennan College of Business Administration 2012 Julie Lanxon Child, Youth & Family Studies 2011 Gretchen Walker Center for Great Plains Studies 2010 Billie Lefholtz College of Agricultural Sciences & Natural Resources
Rose Frolik Award
The Rose Frolik award was created to recognize a University of Nebraska Office Personnel Association (UNOPA) member who demonstrates the attributes of UNOPA’s founder and first president, Rose
114

University of Nebraska-Lincoln AWARDS
Fact Book 2014-2015
Institutional Research and Planning
Frolik. The nomination criteria include: leadership characteristics; professional characteristics and quest Carl A. Donaldson Award for Excellence in Management
This award, given annually since 1972, is presented by the University Association for Administrative Development (UAAD). This award promotes the purposes of UAAD, and recognizes UNL employees, in non-faculty positions, who demonstrate outstanding skills in management. Year Recipient College/Unit 2014 Donna Hahn College of Education and Human Sciences 2013 Dodie Eveleth Chemistry 2012 William (Bill) Goa, Jr Campus Recreation 2011 Ricardo (Rik) Barrera Beadle Business Center 2010 Debra Arent Sponsored Programs
Floyd S. Oldt Award for Exceptional Service and Dedication at UNL
This award, given annually since 1992, is presented by the University Association for Administrative Development (UAAD). This award honors UNL employees in a managerial/professional position for exceptional service and dedication to UNL. Year Recipient College/Unit 2014 Steve Booton Office of the Registrar 2013 Amy Lanham Campus Recreation 2012 Lyda Snodgrass Bursar’s Office 2011 Kathe Anderson Hixson-Lied College of Fine & Performing Arts 2010 Linda Arnold Institute of Agriculture & Natural Resources
University of Nebraska-Lincoln Faculty/Staff Awards Awards included in this section:
Doc Elliott Award
Fulfilling the Dream Award
James V. Griesen Exemplary Service to Students Award
Outstanding Contribution to the Gay, Lesbian, Bisexual and Transgender Community
Outstanding Contribution to the Status of Women The following awards can be given to faculty and/or staff members, and, in some cases, can also be awarded to students, departments or campus organizations. Doc Elliott Award
Awarded by the Nebraska Alumni Association, the Doc Elliott Award was established in 1986 to honor a retired UNL faculty or staff member who has exhibited a record of exemplary, extraordinary and sustained service to students and alumni over a period of years, enriching the lives of alumni. Recipients must be former faculty or staff members of UNL who have been retired at least five years. If a recipient is deceased, a representative of the family may accept the award.
115

University of Nebraska-Lincoln AWARDS
Fact Book 2014-2015
Institutional Research and Planning
Year Recipient Department 2014 Earl Ellington Animal Science 2013 Allen Blezek Agricultural Leadership, Education & Communication 2012 Jack Goebel College of Business Administration
2011 Robert Fuller Physics & Astronomy
Fulfilling The Dream Award
The Fulfilling the Dream awards are presented to individuals or groups who have contributed to the UNL community or the wider Lincoln community by their exemplary action in promoting the goals and vision of the Rev. Dr. Martin Luther King, Jr. The award was established in 1997. Year Recipient College/Unit 2014 Jake Kirkland Career Services 2013 Pat Tetreault Student Involvement 2012 African American and African Studies Program Campus Community 2011 Charlene Maxey-Harris Libraries 2011 T J McDowell Lincoln Community 2010 Helen Moore Sociology 2010 Herb Friedman Lincoln Community 2010 Becky Gould Lincoln Community
James V. Griesen Exemplary Service to Students Award
This award recognizes individuals who go beyond the performance of their assigned work, devoting extra time and effort in serving the needs of students. The award acknowledges extraordinary and sustained performance on behalf of students and was first bestowed in 1986. The award includes a $1,500 stipend. Any UNL employee is eligible for the award, and nominations may be made by any UNL student, faculty or staff member, or administrator. The award is named for Griesen, who served 20 years as UNL’s Vice Chancellor for Student Affairs. Year Recipient Department 2014 Michael Goff College of Journalism & Mass Communications 2013 Vicki Highstreet Campus Recreation 2012 Aaron Duncan Director of Forensics 2011 Rosalee Swartz Agricultural Economics 2010 Leslie Marquart Physics & Astronomy
Outstanding Contribution to the Gay, Lesbian, Bisexual and Transgender Community The awards formally recognize efforts to create an inclusive, respectful and safe climate for members of the gay, lesbian, bisexual and transgender community at UNL. The efforts may be by an individual, an organization, or department with the university. The award recipient must demonstrate a sustained and tangible impact on the campus community. Year Recipient College / Unit 2014 Danny Ladely Mary Riepma Ross Media Arts Center 2013 James B. Milliken President, University of Nebraska 2012 Reverend Stephen C. Griffith St. Paul's United Methodist Church, Lincoln 2011 Robin Whisman Campus Recreation 2010 James Cole Psychology
116

University of Nebraska-Lincoln AWARDS
Fact Book 2014-2015
Institutional Research and Planning
Outstanding Contribution to the Status of Women
The award recognizes outstanding faculty, staff and student efforts to create a climate that encourages women to succeed at UNL and demonstrates a sustained and tangible impact on the campus community. Year Recipient College/Unit 2014 Beth Burkstrand-Reid College of Law 2013 Mary Anne Holmes NSF ADVANCE Program 2013 Julia McQuillan NSF ADVANCE Program 2012 Concetta DiRusso Biochemistry 2011 Alexandra Basolo Biological Sciences 2010 Evelyn Jacobson Associate Vice Chancellor, Academic Affairs 2010 Eating Disorder Education & Student Organization Prevention 2010 Sheldon Museum of Art UNL
117

University of Nebraska-Lincoln GLOSSARY
Fact Book 2013-2014
Institutional Research and Planning
Academic Program. Instructional program leading toward an associate's, bachelor's, master's, doctor's, or
first-professional degree, or resulting in credits that can be applied to one of these degrees.
Academic Year. The period of time generally extending from August to May; usually equated to two
semesters (Fall and Spring).
Accreditation. The goal of accreditation is to ensure that education provided by institutions of higher
education meets acceptable levels of quality. UNL is accredited by the Higher Learning Commission of
the North Central Association of Colleges and Schools, one of six regional accrediting agencies. UNL has
been continuously accredited since 1913.
Accrediting Agencies. Private educational associations of regional or national scope, that develop
evaluation criteria and conduct peer evaluations to assess whether or not those criteria are met.
ACT. ACT, previously known as the American College Testing program, measures educational
development and readiness to pursue college-level coursework in English, mathematics, natural science,
and social studies.
Administrative Site. The campus with the ultimate academic, administrative and budgetary authority for
an academic program.
American Indian or Alaska Native. A person having origins in any of the original peoples of North and
South America (including Central America) who maintains cultural identification through tribal affiliation
or community attachment.
Asian. A person having origins in any of the original peoples of the Far East, Southeast Asia, or the Indian
subcontinent, including, for example, Cambodia, China, India, Japan, Korea, Malaysia, Pakistan, the
Philippine Islands, Thailand, and Vietnam.
Associate's Degree. An award that normally requires at least two, but less than four years, of full-time
equivalent college work.
Bachelor's Degree. An award (baccalaureate or equivalent degree, as determined by the Secretary, U.S.
Department of Education) that normally requires at least four but not more than five years of full-time
equivalent college-level work.
Black or African American. A person having origins in any of the black racial groups of Africa.
Career (Student). Undergraduate, Graduate, or Professional
Casual Employees. Persons who are hired to work during peak times such as those that help at
registration time or those that work in the bookstore for a day or two at the start of a session.
Census Date. Sixth day of the fall or spring semester.
Glossary
Listed below are definitions of selected terms used in this Fact Book.
Where appropriate in this publication, additional definitions and/or explanations are included.
118

University of Nebraska-Lincoln GLOSSARY
Fact Book 2013-2014
Institutional Research and Planning
Class Standing. Determined by the number of student credit hours a student has accumulated (Freshmen 0-26;
Sophomore 27-52; Junior 53-88; Senior 89 and over).
Cohort. A specific group of students established for tracking purposes. Frequently, it is a fall term’s first-
time, full-time, freshmen class.
Course Level. Undergraduate (100-400), Graduate (800-900), Professional (500-700).
Degree. An award conferred by a college, university, or other postsecondary educational institution as official
recognition for the successful completion of a program of studies.
Degree-seeking Students. Students enrolled in courses for credit and recognized by the institution as seeking
a degree, certificate, or other formal award. High school students enrolled in postsecondary courses for credit
are not considered degree-seeking.
Delivery Site. The campus on which students physically attend classes to receive instruction from an academic
program.
Doctoral Degree. The highest award a student can earn for graduate study.
Faculty. Includes both full- and part-time faculty and chairs employed by UNL as of the fall census date (does
not include NCTA faculty). Other, Equivalent Rank, Health and Research/Clinical faculty are excluded.
First-time, Full-time, Freshman Student. A full-time student attending any institution for the first time at the
undergraduate level. Includes students enrolled in the fall term who attended college for the first time in the
prior summer term.
First-time Freshman Student. A student attending any institution for the first time at the undergraduate level.
(full- or part-time). Includes students enrolled in the fall term who attended college for the first time in the prior
summer term.
First-time Professional Student. A professional student in their first term of study.
Fiscal Year. For the State of Nebraska (and UNL) the fiscal year begins July 1 and ends June 30. The U.S.
federal government's fiscal year begins October 1 and ends on September 30. Most federal grants are awarded
using the federal fiscal year cycle.
Freshman. A freshman has 0-26 credit hours completed.
First-time Graduate, Degree Seeking. A graduate degree-seeking student who is enrolled in their first
semester of graduate study.
Full-time Equivalent. Is one-third of the part-time students added to the full-time students.
Full-time Instructional Faculty. Those members of the instruction/research staff who are employed full-time
and whose major regular assignment is instruction, including those with released time for research. Also,
includes full-time faculty for whom it is not possible to differentiate between teaching, research and public
service because each of these functions is an integral component of his/her regular assignment.
Full-time Student. Undergraduate and Law students enrolled for 12 or more credit hours. Graduate students
enrolled for nine or more credit hours.
Graduate Assistants/Graduate Research Assistants. Graduate-level students employed on a part-time basis
119

University of Nebraska-Lincoln GLOSSARY
Fact Book 2013-2014
Institutional Research and Planning
for the primary purpose of assisting in classroom or laboratory instruction or in the conduct of research.
Graduate students having titles such as graduate assistant, teaching assistant, teaching associate, teaching
fellow, or research assistant typically hold these positions.
Graduate, Non-degree Seeking. A graduate student who is seeking some type of certification and not a
formal graduate degree.
Graduate Student. A student who holds a bachelor's or first-professional degree, or equivalent, and is taking
courses at the post-baccalaureate level. These students may or may not be enrolled in graduate programs.
Graduation Rate. Percentage of a first-time, full-time, (Fall freshmen) cohort, that graduates from UNL
within six years.
Headcount (Student). The sum of students enrolled for credit with each student counted only once during the
reporting period, regardless of when the student enrolled.
Hispanic/Latino. A person of Cuban, Mexican, Puerto Rican, South or Central American, or other Spanish
culture or origin, regardless of race.
Intercampus Student. A student from one of the other three University of Nebraska campuses (UNK,
UNMC, UNO) who temporarily takes classes at UNL.
Junior. A junior has 53-88 credit hours completed.
Lecturer/Senior Lecturer. Those who hold appointments longer than one semester.
Managerial/Professional Employee. One whose duties are primarily managerial or professional and who is
exempt from the overtime provisions of the Fair Labor Standards Act. An exception to this exemption may be
some technical and/or part-time employees.
Master's Degree. An award that requires the successful completion of a program of study of at least the full-
time equivalent of one but not more than two academic years of work beyond the bachelor's degree.
Native Hawaiian or Other Pacific Islander. A person having origins in any of the original peoples of
Hawaii, Guam, Samoa, or other Pacific Islands.
Non-degree-seeking Student. A student enrolled in courses for credit who is not recognized by the institution
as seeking a degree or formal award.
Non-resident Alien. A person who is not a citizen or national of the United States and who is in this country
on a visa or temporary basis and does not have the right to remain indefinitely.
Non-resident Student. A student who is not a legal resident of the state in which he/she attends school. Non-
resident students are subject to non-resident tuition rates.
Office/Service Employee. One who is paid hourly and who is subject to the state overtime law and the Fair
Labor Standards Act.
Option. Specific fields of study within an academic program.
Other Graduate, Degree Seeking. A degree seeking graduate student who is no longer in their first term of
graduate study.
120

University of Nebraska-Lincoln GLOSSARY
Fact Book 2013-2014
Institutional Research and Planning
Other Freshmen. Freshmen students who are in their second year of studies, but have not yet accumulated the
necessary 27 hours to officially become sophomores.
Other Professional Student. A professional student that is no longer in their first term of study.
Part-time Student. Undergraduate and Law students enrolled for less than 12 credit hours. Graduate students
enrolled for less than 9 credit hours.
Post-master's Certificate. An award that requires completion of an organized program of study equivalent to
24 semester credit hours beyond the master's degree, but does not meet the requirements of academic degrees at
the doctor's level. Includes the six-year Graduate Education Certificate and six-year Graduate Education
Specialist degree.
Professional Student. A student enrolled in Architecture (MARC), Audiology (AuD), Law (JD/LLM), Plant
Health (DPIH), Veterinary Medicine (DVM).
Professors of Practice (Assistant, Associate, Professor). Are non-tenure-track faculty on term contracts. This
designation was initiated in 2007.
Regular Employees (for Staff). Managerial/Professional and Office/Service employees who are employed for
more than six months and receive benefits. Does not include student-workers, graduate assistants, casual
workers, or ancillary employees.
Regular Faculty (or General Regular Faculty). Includes both full- and part-time faculty (tenured, tenure-
track, and special appointment) and chairs, as of the fall census date. Does not include Other Faculty,
Equivalent Rank Faculty, Research/Clinical Faculty, Health Faculty, and Nebraska College of Technical
Agriculture faculty.
Research Expenditures. Funds expended for activities specifically organized to produce research outcomes
and commissioned by an agency either external to the institution or separately budgeted by an organizational
unit within the institution.
Residence. A person's permanent address determined by such evidence as a driver's license or voter
registration. For entering freshmen, residence may be the legal residence of a parent or guardian.
Resident Alien (and other eligible non-citizens). A person who is not a citizen or national of the United States
but who has been admitted as a legal immigrant for the purpose of obtaining permanent resident alien status.
Resident Student. A student who is a resident of the state in which he/she attends school. NU has been
authorized to develop regulations and make determinations regarding Nebraska residency for tuition purposes.
These regulations provide the bases upon which university staff determine whether an individual qualifies as a
Nebraska resident for tuition purposes.
Retention Rate. Percentage of a first-time, full-time, (freshmen) cohort, that returns for the second year at
UNL (i.e. Fall to Fall semesters).
SAT. Previously known as the Scholastic Aptitude Test, this is an examination administered by the
Educational Testing Service and used to predict the facility with which an individual will progress in learning
college-level academic subjects.
Senior. A senior has 89 or more credit hours completed.
Sophomore. A sophomore has 27-52 credit hours completed.
121

University of Nebraska-Lincoln GLOSSARY
Fact Book 2013-2014
Institutional Research and Planning
Special Appointment Faculty. Faculty that are neither tenured nor on a tenure-track (Professors of Practice,
Lecturers, Senior Lecturers, Visiting Faculty).
Specialization (Graduate Areas of Specialization). Are available in some departments. An area of
specialization is a subdivision of a major in which strong graduate-level curriculum is available. Once they are
approved by the Graduate Council, these areas of specialization are indicated after the major on official records
and transcripts.
Student Credit Hours (SCH). Total hours for undergraduate, graduate, and professional levels as of the
official census date (sixth day of classes).
Student Level. Undergraduate, Graduate or Professional.
Summer Session. Any of the following sessions (note that the eight-week session occurs at the same time as
the three-week and first five-week sessions): three-week (pre-) session, eight-week session, first five-week
session, second five week session.
Tenure. Faculty with continuous appointments.
Tenure-track. Faculty with specific-term appointments or faculty with tenure awarded for a future date.
Two or More Races. A person having origins in two or more race categories and not Hispanic/Latino.
Transfer Student. A student entering the reporting institution for the first time but known to have previously
attended a postsecondary institution at the same level (e.g., undergraduate, graduate). The student may transfer
with or without credit.
Tuition and Required Fees. Tuition is the amount of money charged to students for instructional services.
Tuition may be charged per term per course, or per credit. Required fees are those fixed sums charged to
students for items not covered by tuition.
Unclassified Student. A student taking courses creditable toward a degree or other formal award who cannot
be classified by academic level. For example, this could include a transfer student whose earned credits have
not yet been determined.
Undergraduate Student. A student enrolled in a four- or five-year bachelor's degree program, an associate's
degree program, or a vocational or technical program below the baccalaureate.
Unknown Race/Ethnicity. The category used to report students or employees whose race and ethnicity are
not known.
Visiting Faculty. A faculty member from another institution that is temporarily employed by UNL.
Visiting Student. A student from another institution that temporarily takes UNL classes.
White. A person having origins in any of the original peoples of Europe, the Middle East, or North Africa.
Last Updated: February 5, 2014
122