Sonoma County Junior College District - Fact Book
166
www.santarosa.edu/research
-
Upload
khangminh22 -
Category
Documents
-
view
3 -
download
0
Transcript of Sonoma County Junior College District - Fact Book

www.santarosa.edu/research

Building on a Legacy of Excellence
Sonoma County Junior College District
Fact Book 2010
Office of Institutional Research www.santarosa.edu/research

Santa Rosa Junior College
Sonoma County Junior College District Fact Book 2010
Foreword The Sonoma County Junior College Fact Book 2010 is the tenth annual publication presenting data on our community, student demographics and descriptive information, employee demographics, enrollment, institutional effectiveness, students outcomes, and college finance and capital outlay. The Fact Book includes Summer, Fall and Spring information up to 2010, where data were available. Charts and tables go back three to ten years – with some charts and tables projecting forward five to ten years – to facilitate highlighting past and future trends to assist in program planning, decision‐making and facilities planning. SRJC converted to a new Student Information System and the majority of internal reports that were used in previous editions were not available starting Fall 2008. These measures can be viewed in previous Fact Books at www.santarosa.edu/research . Every effort has been made to maintain existing charts and tables, and where data is not available and/or updated frequently, web links to online data have been provided. Compiling a fact book involves the work of many people. We wish to acknowledge those in offices throughout the District who contribute to this publication, particularly Linda Cornell, Kim Hunt (Admissions, Records and Enrollment Services); Linda Close (Business Services); Kerry Campbell Price (Community Education); Christine Nora (Administrative Services); Teresa Tope (Assessment); Catherine Wilson and Barbara King (Career Development Services); Kris Shear (Scholarships / Financial Aid); Susan Quinn (Student Health Services); Diana Ardley (Transfer Center); Gina Waggoner (Human Resources); and Mike Garcia (Public Relations) for the cover design. We hope the information presented here is both interesting and informative and that the Fact Book 2010 will continue to serve as a valuable resource to college staff and others who wish to learn about the Sonoma County Junior College District. Office of Institutional Research Jeanne Fadelli, Research Analyst – [email protected] Janet Chin, Educational Research Specialist – [email protected] Jill Hunter, Research Technician – [email protected] KC Greaney, Director – [email protected] To contact the Office of Institutional Research, call (707) 778‐4190.

Office of Institutional Research Table of Contents i www.santarosa.edu/research
SONOMA COUNTY JUNIOR COLLEGE DISTRICT — Fact Book 2010 i
Table of Contents Introduction
Fact Book 2010 at a Glance .......................................................................................................................... Intro – 1
Vision and Mission Statements ................................................................................................................... Intro – 2
College Initiatives ........................................................................................................................................ Intro – 3
History ......................................................................................................................................................... Intro – 5
Accreditation ............................................................................................................................................... Intro – 5
Board of Trustees ........................................................................................................................................ Intro – 5
Organizational Charts ....................................................................................................................................Intro – 5
State Representatives ................................................................................................................................... Intro – 5
Definitions and Descriptions ........................................................................................................................ Intro – 6
ZIP Code Reference Chart ............................................................................................................................. Intro – 9
Community (Environmental Scan)
Introduction ....................................................................................................................................................... C – 1
Sonoma County Junior College District Map ..................................................................................................... C – 2
Santa Rosa Junior College Locations .................................................................................................................. C – 3
Sonoma County Population by Ethnicity (1970–2008) ....................................................................................... C – 4
Population of Sonoma County Cities (1970–2009 and Projected 2015) ............................................................ C – 6
U.S. Census Quick Facts, Selected Social and Economic Factors ....................................................................... C – 8
Employment in Sonoma County (2000–2020) .................................................................................................... C – 9
High School Graduation and College Going Rates (2005–2009) ...................................................................... C – 11
Top Ten Counties’ Rates of Public and Private High School Graduates (2004–2009) ...................................... C – 13
High School Enrollment Projections for Sonoma County (2011–2021) ............................................................ C – 16
State and Sonoma County Secondary School Dropout Rate ............................................................................ C – 18
Unemployment Rate – Sonoma County ........................................................................................................... C – 19
Student Demographics
Introduction ..................................................................................................................................................... SD – 1
Age of Students ............................................................................................................................................... SD – 2
Gender of Students (2005–06 to 2009–10) ...................................................................................................... SD – 3
Ethnicity of Students (Fall 2000 – Fall 2009) .................................................................................................... SD – 5
Educational Attainment of Students ................................................................................................................ SD – 8
International Students (Fall 2006 – Fall 2010) .................................................................................................. SD – 9
Student Scholarships Awarded and Accepted (2004–05 to 2008–09) ........................................................... SD – 11
Student Financial Aid — Distribution and Source (2004–05 to 2008–09) ...................................................... SD – 13
Student BOGG Fee Waivers Awarded ........................................................................................................... SD – 15

Office of Institutional Research Table of Contents ii www.santarosa.edu/research
SONOMA COUNTY JUNIOR COLLEGE DISTRICT — Fact Book 2010 ii
Employee Demographics
Introduction .................................................................................................................................................... ED – 1
Full‐Time and Part‐Time Employees (Spring 2006 – Spring 2010)................................................................... ED – 2
District Employee Headcount (Fall 2005 – Fall 2009) ...................................................................................... ED – 4
Employees by Age and Classification (Fall 2005 – Fall 2009)........................................................................... ED – 6
Employees by Gender and Ethnicity (Fall 2005 – Fall 2009) ............................................................................ ED – 9
Enrollment
Introduction ....................................................................................................................................................... E – 1
Historical and Projected Enrollment (1927–2019) ............................................................................................. E – 2
SRJC and State Community College Enrollment (2000–2009) ............................................................................ E – 3
Annual Enrollment (1999–2000 to 2009–10) ..................................................................................................... E – 4
Student Credit and Noncredit Headcount by Semester ..................................................................................... E – 6
Full‐Time Credit, Part‐Time Credit and Noncredit Enrollment ........................................................................... E – 7
Credit Enrollment by Gender, Age and Ethnicity (Fall 2005 to Fall 2009) .......................................................... E – 8
Noncredit Enrollment by Gender, Age and Ethnicity (Fall 2005 to Fall 2009) .................................................... E – 9
SRJC and State Credit and Noncredit Enrollment Comparison (Fall 2009 to Spring 2010) .............................. E – 10
Credit and Noncredit Enrollment by Gender and Age (Fall 2005 to Spring 2010) ........................................... E – 12
Credit and Noncredit Enrollment by Ethnicity (Fall 2005 to Spring 2010) ....................................................... E – 13
Student Headcount by Day/Evening Status and Unit Load by Semester ......................................................... E – 15
Student Enrollment by Enrollment Status (2002–03 to 2009–10) .................................................................. E – 16
Unduplicated Credit Headcount, Average and Total Units Enrolled (2000–01 to 2009–10)............................ E – 18
First‐Time Freshmen by Age and Semester ...................................................................................................... E – 20
Enrollment by Location (2000–01 to 2009–10) ................................................................................................ E – 21
Units Enrolled by Location (2000‐01 to 2009‐10) ............................................................................................. E – 24
High School Concurrent Enrollment (2000‐01 to 2009‐10) .............................................................................. E – 27
Student Outcomes
Introduction .................................................................................................................................................... SO – 1
Retention Rates (Summer 2005 – Spring 2010) .............................................................................................. SO – 2
Successful Course Completion ........................................................................................................................ SO – 5
Degrees, Certificates and GEDs Awarded (2005–06 to 2009–10) ................................................................... SO – 6
Degrees Awarded by Program (2005–06 to 2009–10) .................................................................................... SO – 8
Certificates Awarded by Program (2005–06 to 2009–10) ............................................................................. SO – 12
Placements into Chemistry, English, ESL and Math courses (2005–06 to 2009–10) ..................................... SO – 17
SRJC Student Transfers (2005–06 to 2009–10) ............................................................................................. SO – 19
Transfers to UC and CSU by Ethnicity ..................................................................................................... SO – 19
Transfers to the University of California ................................................................................................ SO – 21
SRJC Transfers to the California State University .................................................................................. SO – 23
Office of Institutional Research Table of Contents iii www.santarosa.edu/research
SONOMA COUNTY JUNIOR COLLEGE DISTRICT — Fact Book 2010 iii
CSU Outcomes of SRJC Students (2004–05 to 2008–09) ............................................................................... SO – 25
UC Outcomes of SRJC Students (2003–04 to 2007–08) ................................................................................. SO – 27
CTEA Core Indicators (2010–11) .................................................................................................................... SO – 29
Institutional Effectiveness
Introduction ....................................................................................................................................................... IE – 1
Population of Sonoma County by Gender, Age, and Ethnicity (Fall 2009) ........................................................ IE – 2
Full‐Time Equivalent Student per Full‐Time Equivalent Faculty (2005–06 to 2009–10) by
District ........................................................................................................................................................ IE – 4
Cluster ........................................................................................................................................................ IE – 6
Full‐Time Equivalent Student by Course Status (2000–01 to 2009–10) ......................................................... IE – 13
Selected Student Services Data —
Career and Transfer Center Student Contacts (2005–06 to 2009–10) ..................................................... IE – 15
Categorical Students Services Program (2005–06 to 2009–10) ............................................................... IE – 15
Student Health Services Contacts (2005–06 to 2009–10) ........................................................................ IE – 15
Matriculation ............................................................................................................................................ IE – 17
Average Class Size by Location and Semester (2005–06 to 2009–10) ............................................................ IE – 18
Percentage of Active Section Offerings by Location (2005–06 to 2009–10) ................................................... IE – 23
Accountability Reporting on Community Colleges (2004–05 to 2008–09) ..................................................... IE – 26
Student Right to Know Rates (Fall 2001 to Fall 2006) ..................................................................................... IE – 28
Financial and Capital Outlay
Introduction ....................................................................................................................................................... F – 1
Annual FTES (2000–01 to 2009–10) ................................................................................................................... F – 2
General Fund Balance (2000–01 to 2009–10) .................................................................................................... F – 4
General Fund Revenues and Expenditures (2005–06 to 2009–10) .................................................................... F – 6
Annual Capital Expenditures (2005–06 to 2009–10) .......................................................................................... F – 8
District Assignable Square Footage (1930–39 to 2000–09).............................................................................. F – 10
Parking Ratios on the Santa Rosa Campus (Fall 2001 – Fall 2010) ................................................................... F – 12
Appendix
Summary of Statistics by Location .....................................................................................................................A – 1
Santa Rosa Campus ....................................................................................................................................A – 1
Petaluma Campus ........................................................................................................................................A – 1
Public Training Safety Center ......................................................................................................................A – 2
Santa Rosa Off Campus ...............................................................................................................................A – 2
Brickyard ......................................................................................................................................................A – 3
Healdsburg/North County ......................................................................................................................... A – 4
Sonoma and Sebastopol .............................................................................................................................. A—5
On‐Line and Shone Farm ............................................................................................................................. A—6
Windsor ....................................................................................................................................................... A—7

Office of Institutional Research Introduction 1 www.santarosa.edu
SONOMA COUNTY JUNIOR COLLEGE DISTRICT — Fact Book 2010
Santa Rosa Junior College
Fact Book 2010 at a Glance
Data from Spring 2010 (End of Semester) unless otherwise specified
Name — Sonoma County Junior College District Type — Public two‐year community college Governance — Board of Trustees
Number of Trustees — 8 including 1 student representative
Term — 4 years Elections — Even‐numbered years and staggered
in two‐year increments
Campuses Santa Rosa: 1501 Mendocino Avenue, Santa Rosa, CA 95405 — (707‐527‐4011) Petaluma: 680 Sonoma Mountain Parkway, Petaluma, CA 94954 — (707‐778‐2415)
Other Dedicated Locations Culinary Arts Center (Brickyard): 458 B Street Santa Rosa, CA 95401— (707‐527‐4395 Public Safety Training Ctr: 5743 Skylane Blvd., Windsor, CA 95492 — (707‐836‐2903)
Shone Farm: 6225 Eastside Road Forestville, CA 95436 — (707‐887‐1187)
Southwest Santa Rosa Center: 950 Wright Rd Santa Rosa, CA 95407 Matriculation Student Services Office — (707‐
527‐4229)
The District Approximately 1,600 square miles, encom‐passing Sonoma County, Tomales (Marin), Point Arena and Manchester (Mendocino)
Sonoma County Population .............................. 497,900 (ABAG, estimate 2010)
Enrollment Unduplicated Headcount ............................. 32,969 Credit ............................................................ 25,935 Noncredit (NC) ................................................ 7,034
Day/Evening Enrollment (Duplicated) Day Credit .................................................... 20,119 Day Noncredit ............................................... 11,566 Evening Credit .............................................. 13,910 Evening Noncredit .......................................... 2,889 * (Day courses start before 4:30 p.m. and evening courses start after 4:30 p.m.)
Students Female ................................... 18,289 .......... 55.5% Male ........................................ 14,012 .......... 42.5% Unknown ...................................... 668 .............2.0%
Average Unit Load of All Students ....................... 7.1 (Part‐Time, Full‐Time Credit Students)
Ethnic Composition of Student Population Asian .............................. 1,082 ....................3.3% Black ................................. 730 ....................2.2% Filipino .............................. 258 ....................0.8% Hispanic/Latino ............. 5,347 ................. 16.2% Native American ............... 324 ....................1.0% Pacific Islander .................. 176 ....................0.5% White .......................... 18,077 ................. 54.8% Multiple ............................ 540 ....................2.5% Unknown ....................... 6,135 ................. 18.6%
District Retention Rate .................................... 76.6%
District Successful Completion Rate ............... 71.2% (California Community Colleges Chancellor’s Office)
Degrees and Certificates Awarded (2009–10) Degrees ...................................................... 1,426 Certificates ................................................ 2,882 GEDs ............................................................. N/A Total Awards (not including GEDs) ............ 4,308
SRJC Transfer Students (2009–10) University of California ................................. 215 California State University ........................... 581 In‐State Private (2006–07) ............................ 210 Out of State (2006–07) ................................. 246
Total Scholarships Awarded (2008–09) ........... 5,287
Financial Aid (2008–09) Total students receiving federal aid .......... 3,949 Total students receiving state aid ........... 10,462
General Fund (2009–10) Revenues ...................................... $113,756,042 Expenditures ................................ $111,566,610
Employee Headcount (Spring 2009) Faculty Regular ......................................................... 303 Adjunct ....................................................... 1,246 Adjunct – Community Education .................... 23 Classified Regular ......................................................... 381 Hourly .............................................................. 30 STNC .............................................................. 561 Administrative/Management Academic Administrators ................................ 35 Supervisory/Managerial Admin ...................... 43 Administrative/Confidential ............................ 13 Other Student Workers .......................................... 534 Foundation Employees ...................................... 5

Office of Institutional Research Introduction 2 www.santarosa.edu
SONOMA COUNTY JUNIOR COLLEGE DISTRICT — Fact Book 2010
Vision Statement
To Be the Best to the Community We Serve by Increasing Knowledge ● Improving Skills ● Enhancing Lives
Mission Statement
Sonoma County Junior College District's Mission is to promote student learning throughout our diverse communities by increasing the knowledge, improving the skills, and enhancing the lives of those who participate in our programs and enroll in our courses. This Mission affirms the District's responsibility to provide the following:
• lower division academic education, to support transfer to four‐year institutions • career and technical education, to support economic development and job growth • basic skills, to include English language skills acquisition • student and academic support services, to improve student success and student retention
Supportive Statements In fulfilling our mission we are committed to:
Serving the educational needs of our students and our community through programs and courses that maintain high academic standards and develop a respect for learning in all of our students.
Developing intellectual curiosity and integrity, and recognizing accomplishment in an atmosphere of academic freedom.
Offering courses and programs which reflect academic excellence and integrity and which serve the variety of needs and abilities of our students.
Identifying student learning outcomes for courses, programs, certificates, and degrees; assessing student achievement off those outcomes; and using those assessment results to improve effectiveness.
Responding to economic, demographic, intellectual, and technological changes through educational program development and staff development.
Helping students succeed in meeting their educational goals by providing comprehensive instructional and student support services.
Challenging students to participate fully in the learning process by teaching students to be responsible for their academic success.
Preparing our students for participation as citizens at the local, national and global levels.
Promoting awareness of and maintaining sensitivity to ethnic, cultural, and gender diversity within our student body, faculty, staff, administration, and course offerings.
Promoting open access through actively eliminating barriers to a college education.
Contributing to the cultural life of our community by presenting enrichment opportunities to our students and community members.
Attracting and retaining a faculty and staff who are knowledgeable and current in their fields.
Practicing responsible participatory governance within the institution through processes that are inclusive and respectful of all participants and in which information and decision‐making are shared.
Maintaining the stability of our institution by exercising our public responsibility for sound resource development and use in order to meet our commitments to the citizens of the District.
Promoting and maintaining a safe learning and working environment.
Reviewing our mission statement periodically with participation by students, faculty, staff, and administration. Adopted: April 8, 1985 Revised: June 8, 2010
Office of Institutional Research Introduction 3 www.santarosa.edu
SONOMA COUNTY JUNIOR COLLEGE DISTRICT — Fact Book 2010
Sonoma County Junior College District
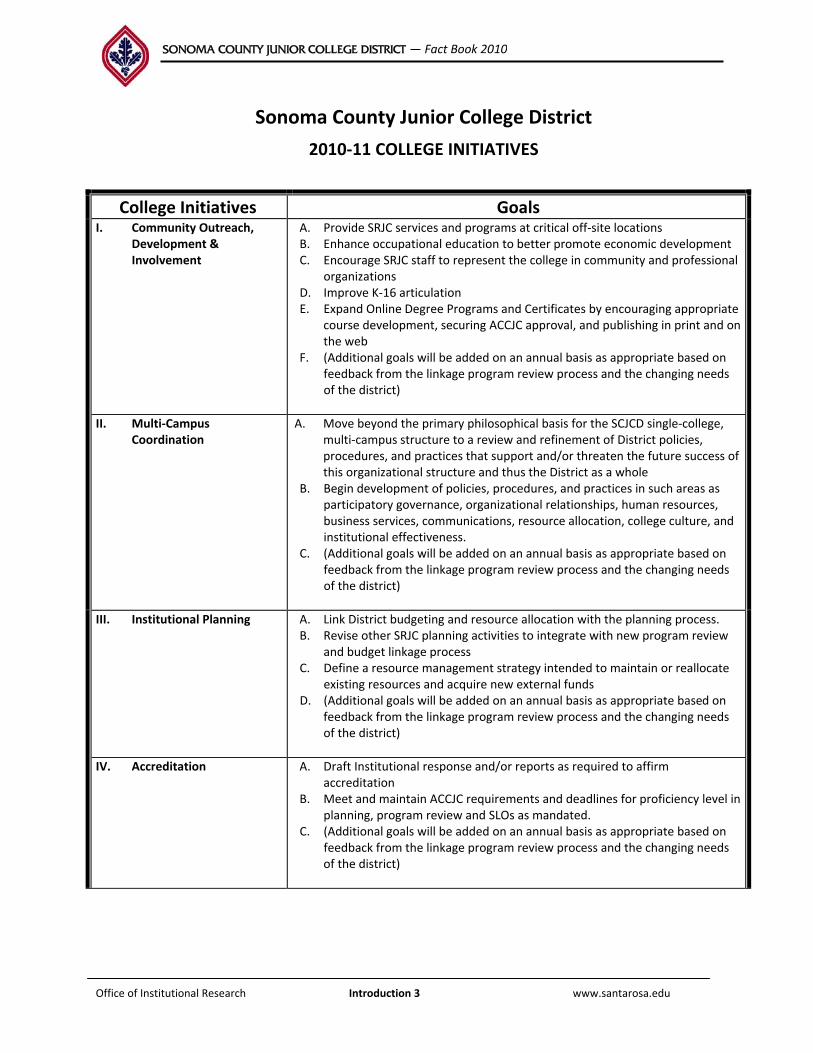
2010‐11 COLLEGE INITIATIVES
College Initiatives GoalsI. Community Outreach,
Development & Involvement
A. Provide SRJC services and programs at critical off‐site locationsB. Enhance occupational education to better promote economic development C. Encourage SRJC staff to represent the college in community and professional
organizations D. Improve K‐16 articulation E. Expand Online Degree Programs and Certificates by encouraging appropriate
course development, securing ACCJC approval, and publishing in print and on the web
F. (Additional goals will be added on an annual basis as appropriate based on feedback from the linkage program review process and the changing needs of the district)
II. Multi‐Campus Coordination
A. Move beyond the primary philosophical basis for the SCJCD single‐college, multi‐campus structure to a review and refinement of District policies, procedures, and practices that support and/or threaten the future success of this organizational structure and thus the District as a whole
B. Begin development of policies, procedures, and practices in such areas as participatory governance, organizational relationships, human resources, business services, communications, resource allocation, college culture, and institutional effectiveness.
C. (Additional goals will be added on an annual basis as appropriate based on feedback from the linkage program review process and the changing needs of the district)
III. Institutional Planning A. Link District budgeting and resource allocation with the planning process.B. Revise other SRJC planning activities to integrate with new program review
and budget linkage process C. Define a resource management strategy intended to maintain or reallocate
existing resources and acquire new external funds D. (Additional goals will be added on an annual basis as appropriate based on
feedback from the linkage program review process and the changing needs of the district)
IV. Accreditation A. Draft Institutional response and/or reports as required to affirm accreditation
B. Meet and maintain ACCJC requirements and deadlines for proficiency level in planning, program review and SLOs as mandated.
C. (Additional goals will be added on an annual basis as appropriate based on feedback from the linkage program review process and the changing needs of the district)

Office of Institutional Research Introduction 4 www.santarosa.edu
SONOMA COUNTY JUNIOR COLLEGE DISTRICT — Fact Book 2010
Sonoma County Junior College District
2010–11 COLLEGE INITIATIVES Continued
V. Student Learning
Outcomes and Assessment In order to achieve the Sustainable Continuous Quality Improvement level of institutional effectiveness on student learning outcomes based on the ACCJC rubric by fall, 2012, the college will: A. Identify SLOs for every course, program, and student service by fall 2012. B. Establish a regular cycle of assessment for all course, program, and
institutional outcomes, and use results of assessment to improve all programs and services by spring, 2012.
C. Maintain high visibility for the Student Learning Outcomes initiative by communicating the vision, goals, and results of Project Learn on a frequent, ongoing basis.
D. Encourage broad‐based participation in the SLO initiative by assuring that faculty and staff have the necessary skills to identify and assess SLOs and that new leadership for SLOs is continuously developed.
E. (Additional goals will be added on an annual basis as appropriate based on feedback from the linkage program review process and the changing needs of the district)
VI. Basic Skills /Immigrant Education
A. Better serve basic skills students through integrated programs and servicesB. Increase basic skills student persistence and success C. (Additional goals will be added on an annual basis as appropriate based on
feedback from the linkage program review process and the changing needs of the district)
VII. Enrollment Management & Retention
A. More effectively target courses and services to our student populationB. Increase student enrollment C. Increase student success D. Assess results of district budget and Doyle Scholarship reductions on
enrollment. E. (Additional goals will be added on an annual basis as appropriate based on
feedback from the linkage program review process and the changing needs of the district)
VIII. Integrated Environmental Planning
A. Link District curriculum, student career and educational development resource allocation, site improvement and facilities use with the institution’s environmental planning process.
B. Revise other SRJC planning activities to integrate environmental activities within the curriculum, student career development as well as facilities design and utilization.
C. (Additional goals will be added on an annual basis as appropriate based on feedback from the linkage program review process and the changing needs of the district)
For more information: SRJC Planning website, www.santarosa.edu/planning

Office of Institutional Research Introduction 5 www.santarosa.edu
SONOMA COUNTY JUNIOR COLLEGE DISTRICT — Fact Book 2010
History
Santa Rosa Junior College is a public, two‐year community college governed by a local Board of Trustees under the laws of the State of California. Established in 1918, SRJC is the tenth oldest of the 110 California Community Colleges. SRJC operated as part of Santa Rosa High School until 1927, when a junior college district was formed. Two years later, Analy Union High School, located in Sebastopol, joined to form a union Junior College District. Between 1962 and 1966, the high schools of Petaluma, Cloverdale, Geyserville, Healdsburg, Sonoma Valley, and parts of Tomales and Point Arena were annexed to form the Sonoma County Junior College District, as we know it today. The District’s name was officially changed on July 1, 1967 to reflect the geographical scope of the service area.
Santa Rosa has had four presidents since its founding in 1918: Floyd P. Bailey (1921–1957), Randolph Newman (1957–1970), Roy Mikalson (1971–1990), and Robert F. Agrella (1990–present).
Source: www.santarosa.edu/about_srjc/history‐and‐highlights/
Accreditation Santa Rosa Junior College is accredited by the Western Association of Schools and Colleges. The Accrediting Commission for Community and Junior Colleges can be reached at (415) 506‐0234, 10 Commercial Blvd, Novato, CA 94949. To view the website: www.accjc.org/
Board of Trustees Expiration of term is indicated in parentheses following each name.
Richard W. Call, President (November 2012) Jeff Kunde, Vice President(November 2014) Onita Pellegrini, Clerk (November 2014)
Don Zumwalt (November 2014) B. Robert Burdo (November 2014) W. Terry Lindley (November 2012)
Don Edgar (November 2012) Taylor Anderson‐Stevenson, Student Trustee (May 2011)
Robert F. Agrella, Superintendent/President
Organizational Charts http://www.santarosa.edu/hr/district‐information/index.shtml#organization
State Representatives
Assembly
Wesley Chesbro – District 01 (Cloverdale, Healdsburg, Windsor, Bodega, Guerneville, Sebastopol) Jared Huffman – District 06 (Petaluma, Sonoma, Dillon Beach) Michael Allen – District 07 (Santa Rosa, Kenwood)
Senate
Noreen Evans – District 02 (North, West and Central Sonoma County) Mark Leno – District 03 (South Sonoma County)
Congress
Mike Thompson – District 01 (Del Norte, Humboldt, Lake, Mendocino, Napa, Sonoma, and Yolo counties) Lynn Woolsey – District 06 (Marin and Sonoma counties)

Office of Institutional Research Introduction 6 www.santarosa.edu
SONOMA COUNTY JUNIOR COLLEGE DISTRICT — Fact Book 2010
Definitions and Descriptions
ABAG — Association of Bay Area Governments. ABAG is the Bay Area regional planning agency and is the source for estimated and projected employee counts by industrial sector. For more information: www.abag.ca.gov
Accreditation — The Accrediting Commission for Community and Junior Colleges, within the Western Association of Schools and Colleges, evaluates and accredits public and private institutions of higher education that offer one or more educational programs of two academic years in length leading to the associate degree and who seek accreditation under ACCJC criteria. For more information: www.accjc.org
ARCC — Accountability Reporting for the Community College. AB1417, passed in 2004, is widely viewed as a modified continuation of the accountability model first put forth in “Partnership for Excellence”. From the State Legislature’s point of view, the purpose of ARCC is to evaluate community college performance in light of the state’s educational outcome priorities. The Chancellor’s Office, mandated to create an accountability plan, has developed a framework that they believe gives a fair picture of performance, and that will provide useful information to individual colleges and districts.
ASF — Assignable Square Feet. ASF is the usable space within buildings for teaching and work purposes (i.e., all classroom, office, lab spaces, conference, meeting, and support rooms). Non‐assignable space is the area of the building used for foot traffic and utilities (i.e., entry foyers, lobbies, hallways, stairways, restrooms, custodial, closets, and mechanical spaces.)
Bay Area — Counties that make up the Bay Area region per ABAG: Alameda, Contra Costa, Marin, Napa, San Francisco, San Mateo, Santa Clara, Solano, and Sonoma.
BOGG — Board of Governors’ Grant. The Board of Governors’ Grant waives the enrollment fees for eligible low‐income students who submit an application.
CA DOF — California Department of Finance. CA DOF provides population estimates and projections, using U.S. Census 2000 data, for California counties on ethnicity, age, and gender. For more information: www.dof.ca.gov
CalWORKS — CalWORKs funds are for the purpose of assisting welfare recipient students and those in transition off of welfare to achieve long‐term self‐sufficiency through coordinated student services offered at community colleges including: work study, job placement, child care, coordination, curriculum development and redesign, and under certain conditions post‐employment skills training, and instructional services. For more information: www.cccco.edu/divisions/ss/calworks/calworks.htm (Chancellor’s Office Website)
CBEDS — California Basic Educational Data System. CBEDS is an annual data collection which includes the following data elements from California public schools (K–12): enrollment, graduates, dropouts, vocational education, alternative education, adult education, course enrollment, classified staff, certificated staff, and teacher shortage and demand. For more information: www.cde.ca.gov/ds/sd/cb/reports.asp
CCCCO — California Community Colleges Chancellor’s Office or Systems Office. The Chancellor’s Office is the administrative branch of the California Community College system. Located in Sacramento, this state agency provides leadership and technical assistance to the 110 community colleges and 72 community college districts in California. For more information: www.cccco.edu
CDE — California Department of Education. CDE is the administrative body that serves K–12 education throughout the state of California. The data elements located within the “Data Quest” site include test

Office of Institutional Research Introduction 7 www.santarosa.edu
SONOMA COUNTY JUNIOR COLLEGE DISTRICT — Fact Book 2010
scores, enrollment rates, dropout rates, English Learners data and Special Education. For more information: http://data1.cde.ca.gov/dataquest/
CPEC — California Postsecondary Education Commission. CPEC’s database includes information on California postsecondary institutions: enrollments, first‐time freshmen, transfer students, degrees and certificates awarded, faculty and staff data, institutional finance data, and eligibility study data. It also includes information on California's elementary and secondary schools: enrollments and high school. For more information: www.cpec.ca.gov/OnLineData/OnLineData.asp
CTEA — CTEA and Technical Education Act, formerly known as Vocational and Technical Education Act (VTEA).. CTEA is also known as the Perkins Act. This federal program is administered through the state and provides the direction and funding to support continuous improvement in vocational, career and technical education. For more information: http://www.cccco.edu/OurAgency/EconDevWorkPrep/tabid/230/Default.aspx
Duplicated Enrollment — The student count for each course enrollment. A student enrolled in three courses would be counted for each of these courses, i.e., three duplicated enrollments. (A student unduplicated headcount is all students who enrolled in and attended at least one course. A student enrolled in three courses would be an unduplicated headcount of one.)
EOPS — Extended Opportunity Program and Services. EOPS is a program that assists full‐time, low income, educationally disadvantaged students. For more information: http://www.santarosa.edu/app/paying‐for‐college/eops/ (SRJC website) or www.cccco.edu/divisions/ss/eops/eops.htm (Chancellor’s Office website)
EOS — End of Semester. The last day of the semester or session.
FC — First Census. First Census of a course is the day nearest to one‐fifth (20%) of the length of the course. First Census data for full‐semester courses (17.5 week term length) is typically the first Monday of the fourth week of instruction.
FTEF — Full‐Time Equivalent Faculty. FTEF is based on the percentage of instructional hours per week considered a full‐time assignment for regular instructional employees.
FTES — Full‐Time Equivalent Student. FTES is the equivalent of 30 credit units enrolled or 525 student contact hours in credit or noncredit courses per student per year. FTES replaced Average Daily Attendance (ADA) as the basis for computation of state support from California.
GED — General Education Development. The GED test is given at Santa Rosa Junior College at least once a month. The American Council on Education recognizes the successful completion of the GED as equivalent to a high school diploma throughout the United States. For more information: http://www.santarosa.edu/app/placement/GED‐Tests/index.shtml (SRJC website) or http://www.acenet.edu/AM/Template.cfm?Section=GEDTS (American Council on Education website)
MIS — Management Information Services, California Community Colleges Chancellor’s Office. The Management Information Services unit is responsible for term and annual data collection from the 72 districts/110 colleges, maintenance of the data element dictionary, data reporting services for Federal and State agencies, data warehousing and systems development, ad hoc data and querying services, and decision support systems. For more information: www.cccco.edu/divisions/tris/mis.htm
SAM Code — Student Accountability Model Code. The SAM Code is used to indicate the degree to which a course is occupational and to assist in identifying course sequence in occupational programs. There are five separate codes:
A – Apprenticeship courses designed for indentured apprentices; B – Advanced Occupational courses taken by students in the advanced stages of their occupational
programs;

Office of Institutional Research Introduction 8 www.santarosa.edu
SONOMA COUNTY JUNIOR COLLEGE DISTRICT — Fact Book 2010
C – Clearly Occupational courses taken by students in the middle stages of their programs; D – Possibly Occupational courses taken by students in the beginning stages of their occupational programs;
and E – Non‐Occupational courses.
SIC — Standard Industrial Classification. This system defines job sectors in the Association of Bay Area Governments (ABAG) using classifications in the 1987 SIC Manual issued by the Federal Office of Management and Budget. The Standard Industrial Classification has been replaced by the new North American Industry Classification System (NAICS). For more information: www.census.gov/epcd/www/naics.html
Student Retention Rate — The percent of students retained in courses out of total enrolled in courses. The rate is calculated as the sum of duplicated course enrollments receiving an official grade of A, B, C, D, CR, or I divided by the number of duplicated course enrollments receiving a grade of A, B, C, D, F, CR, NC, W, or I.
Successful Course Completion — The percent of students successful in courses out of total students enrolled. Successful course completion rate is the sum of duplicated course enrollments receiving an official grade of A, B, C, or CR divided by the number of duplicated course enrollments with an official grade of A, B, C, D, F, CR, NC, W, or I.
TOP Code — Taxonomy of Programs Code. The TOP Code is a common numeric coding system by which districts and colleges categorize degree and certificate programs and courses on the basis of the similarities of their published goals and objectives. A TOP code is assigned to every course and is reported in the Chancellor's Office Management Information Services (MIS).
In addition, each degree or certificate awarded to a student is reported in the Management Information Services with a TOP code. Information reported by TOP Code is used to meet federal and state reporting requirements. Accountability reports on program completion, as well as vocational reports on course success, are among the many uses for TOP codes. For more information: www.labormarketinfo.edd.ca.gov/commcolleges/
WSCH — Weekly Student Contact Hours. WSCH is the number of class hours each course is regularly scheduled to meet during the week multiplied by the number of students actively enrolled in the course.
Unduplicated Headcount — A count of all students who enrolled in and attended at least one course. A student enrolled in three courses would be an unduplicated headcount of one. (A duplicated enrollment is the student count for each course enrollment. If a student is enrolled in three courses, the student is counted for each of these courses — three duplicated enrollments.)
Note:
Unless otherwise stated, the following notes apply to the contents of the Sonoma County Junior College District Fact Book.
The source for internal data is the Office of Institutional Research data extractions and existing reports generated from Information Technology. MIS (Management Information System) data may show differences when compared to internally generated data because of particular criteria applied when the data are selected.
When a breakdown of ethnicity includes a group called “Unknown,” this group includes all students who either left the category blank or who marked “Decline to state.”
Office of Institutional Research Introduction 9 www.santarosa.edu
SONOMA COUNTY JUNIOR COLLEGE DISTRICT — Fact Book 2010
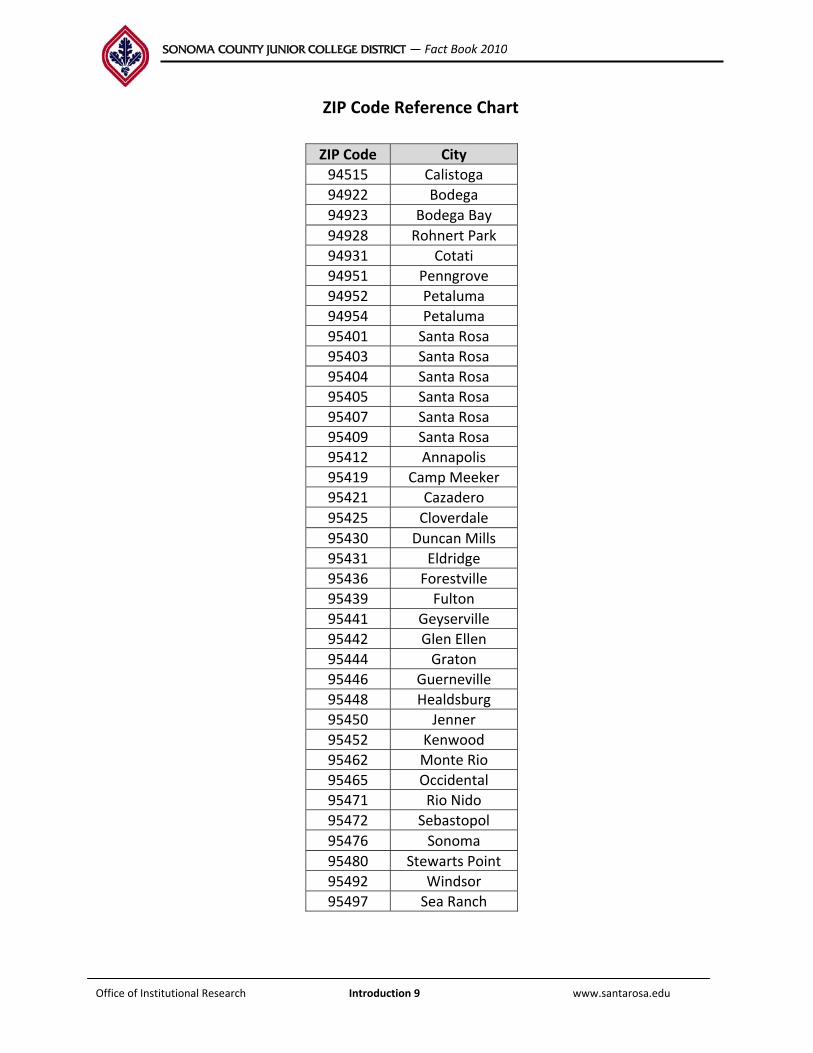
ZIP Code Reference Chart
ZIP Code City
94515 Calistoga
94922 Bodega
94923 Bodega Bay
94928 Rohnert Park
94931 Cotati
94951 Penngrove
94952 Petaluma
94954 Petaluma
95401 Santa Rosa
95403 Santa Rosa
95404 Santa Rosa
95405 Santa Rosa
95407 Santa Rosa
95409 Santa Rosa
95412 Annapolis
95419 Camp Meeker
95421 Cazadero
95425 Cloverdale
95430 Duncan Mills
95431 Eldridge
95436 Forestville
95439 Fulton
95441 Geyserville
95442 Glen Ellen
95444 Graton
95446 Guerneville
95448 Healdsburg
95450 Jenner
95452 Kenwood
95462 Monte Rio
95465 Occidental
95471 Rio Nido
95472 Sebastopol
95476 Sonoma
95480 Stewarts Point
95492 Windsor
95497 Sea Ranch
SONOMA COUNTY JUNIOR COLLEGE DISTRICT — Fact Book 2010 C – 1
Community
Introduction
This section of the Fact Book provides an overview of the district service area, including information about population, employment, high school, and college‐going rates. Where available, recent Bay Area, state and national data are included for comparison. Three themes run throughout this section. First, the population of Sonoma County has slowed down. Second, the proportion of Latinos and older adults continues to grow. Third, the majority of Sonoma County high school graduates who attend college in the Fall semester after graduation choose SRJC.
The Sonoma County Junior College District encompasses more than 1,600 square miles, including all of Sonoma County and small portions of Mendocino County along the coast to the north and Marinof Sonoma County and small portions of Mendocino County along the coast to the north and Marin County to the south (see the map on the following page). The District is bordered to the west by the Pacific Ocean and to the east by Napa and Lake Counties, encompassing 14 major high school districts. The District offers courses at over 70 locations.
Sonoma County, one of the nine counties in the Greater Bay Area, grew to an estimated population of 493,470 residents at the beginning of 2010. Though one of the smaller counties in terms of population and number of jobs in the Bay Area, Sonoma County’s population tripled between 1950 d 1980 d h 50% b 1980 d 2000 (U S C ) M h h lf fand 1980 and grew another 50% between 1980 and 2000 (U.S. Census). More than half of county
residents live along the US 101 corridor in the cities of Petaluma, Rohnert Park, and Santa Rosa. The Association of Bay Area Governments projects that the population of Sonoma County will continue to grow, but less rapidly — increasing 2.4% between 2010 and 2015. The slowdown in growth is attributed to the national economic downturn.
The proportion of Latinos in the total county population has increased recently. From 1970 to 2008*, the percentage of Latinos increased from 5% to 24%, and it is projected to continue increasing at a high rate. Projections of county 12th‐grade enrollment indicate the high school class of 2021 will be 42.8% Latino. In comparison to the Bay Area, Sonoma County has a higher percentage of White residents, while the county’s Hispanic/Latino population rate is relatively close to the overall Bay Area’s rate of 23%.
The proportion of Asians in the county population has increased slightly and is projected to continue increasing. Asians comprised almost 4% of county residents as of 2008*. The only ethnic group that has significantly decreased and will likely continue to decrease is Whites While whites are still thehas significantly decreased and will likely continue to decrease is Whites. While whites are still the largest ethnic group in the county, the proportion of whites as a percentage of the total population has declined steadily since 1990.
*Most current data from California Department of Finance at time of publication.
www.santarosa.edu/researchOffice of Institutional Research Community • C – 1

SONOMA COUNTY JUNIOR COLLEGE DISTRICT — Fact Book 2010 C – 2
S C t J i C ll Di t i t MS C t J i C ll Di t i t MSonoma County Junior College District Map(Including locations where SRJC offers courses)
Sonoma County Junior College District Map(Including locations where SRJC offers courses)
www.santarosa.edu/researchOffice of Institutional Research Community • C – 2
1/2007
SONOMA COUNTY JUNIOR COLLEGE DISTRICT — Fact Book 2010 C – 3
Santa Rosa Junior College Locations
Santa Rosa Campus: Established in 1918, SRJC operated as part of Santa Rosa High School until 1927, when a junior college district was formed. Burbank Park, a 40‐acre area north of then downtown Santa Rosa, was given to the College for a campus in 1929 by the City of Santa Rosa and the Chamber of Commerce. The first building on the site, which now includes a total of 104 acres, was Pioneer Hall completed in 1931. On July 1, 1966, the name of the district was changed to Sonoma County Junior College District.
The district’s newest building is the Student Services Center, which opened in Spring 2010. With its g , p p gcompletion, the Santa Rosa campus has over 570,000 assignable square feet of facilities.
Petaluma Campus: The Petaluma facility began as an off‐site location in the late 1960s and became an education center in 1974. In 1984, the College's Board of Trustees purchased 40 acres in east Petaluma for a permanent center. Phase I of the Petaluma Center construction was completed in the Fall of 1994; the 64,000‐square‐foot facility was dedicated and opened for classes in January of 1995. The Petaluma Center was officially designated a Campus on April 13, 1999.
With Phase II construction completed, the campus now has an additional 82,000 assignable square feet for teaching and working purposes.
Public Safety Training Center: Public Safety was established in 1958 as a law enforcement training program. It became a regional training center for the California north coast in 1973, adding Fire Technology and Emergency Medical Care programs shortly thereafter. The 20‐acre center in Windsor was completed in 2002. The program currently serves 6,000 students each year from areas throughout Californiathroughout California.
Shone Farm: In 1972, the Federal Government deeded Santa Rosa Junior College 360 acres of land located approximately 10 miles from the Santa Rosa campus at the site of the former international communications center near Forestville. The acreage is used for instruction in agriculture, natural resources, and the life sciences to develop extensive field laboratory areas to enrich the College's programs. The college farm is named after Robert Shone, a former college trustee. The Ag Pavilion was built in 2006; it added 32,000 assignable square feet to Shone Farm.
Culinary Arts Center: The Culinary Arts Center opened in January 2003. Located at the Brickyard Center in downtown Santa Rosa, this 5,500‐square‐foot leased facility is home to four certificate programs: Culinary Arts, Baking and Pastry, Front House Operations, and Support Services. This site is also the location of the SRJC Café and Bakery, where approximately 300 students a year receive practical, hands‐on experience working in a commercial kitchen, bakery, and restaurant that are open to the public. The new Robert Burdo building is slated to open 2012 and will support the culinary arts program and house the SRJC Culinary Café and Bakery.
Pepperwood Preserve: Established in 1979, this 3,117‐acre nature preserve is located between Santa Rosa and Calistoga. The Pepperwood Foundation and SRJC manage educational and public access to the preserve cooperatively. The educational program consists of a wide variety of courses, workshops, and field trips. Subjects include natural history, botany, zoology, natural resource management, anthropology, and astronomy. These activities are offered through Santa Rosa Junior College academic departments and the Community Education Program of the college.
www.santarosa.edu/researchOffice of Institutional Research Community • C – 3

SONOMA COUNTY JUNIOR COLLEGE DISTRICT — Fact Book 2010 C – 4
Sonoma County Population by EthnicityFive‐Year Increments: 1970 – 2005; and 2008
40%
50%
60%
70%
80%
90%
100%
Two or More Races
Other
Native American
Black
0%
10%
20%
30%
40%
1970 1975 1980 1985 1990 1995 2000 2005 2008
Asian & Pacific Islander
Hispanic/Latino
White
Hi i /Asian &
N iTwo or
WhiteHispanic/
Latino*
Asian &
Pacific
Islander
BlackNative
AmericanOther
Two or
More*
Races
Total
# 189,264 10,481 3,162 2,038 1,554 206,500
% 91.7% 5.1% 1.5% 1.0% 0.8% — — 100%
# 223 011 15 335 3 888 2 665 2 200 247 100
Sonoma County Population by Ethnicity
1970
# 223,011 15,335 3,888 2,665 2,200 247,100
% 90.3% 6.2% 1.6% 1.1% 0.9% — — 100%
# 268,768 21,299 4,926 3,454 2,953 301,400
% 89.2% 7.1% 1.6% 1.1% 1.0% — — 100%
# 288,410 30,389 7,374 4,228 3,199 333,600
% 86.5% 9.1% 2.2% 1.3% 1.0% — — 100%
# 327,805 41,220 10,250 5,278 3,669 388,222
1975
1980
1985
1990% 84.4% 10.6% 2.6% 1.4% 0.9% — — 100%
# 335,893 61,153 14,802 6,655 5,797 424,300
% 79.2% 14.4% 3.5% 1.6% 1.4% — — 100%
# 341,686 79,511 14,614 6,116 3,477 921 12,289 458,614
% 74.5% 17.3% 3.2% 1.3% 0.8% 0.2% 2.7% 100%
# 333,062 103,112 17,082 7,152 4,091 11,693 476,192
% 69 9% 21 7% 3 6% 1 5% 0 9% 2 5% 100%
1990
1995
2000
2005% 69.9% 21.7% 3.6% 1.5% 0.9% — 2.5% 100%
# 328,538 116,421 16,721 6,438 4,301 13,059 485,478
% 67.7% 24.0% 3.4% 1.3% 0.9% — 2.7% 100%
# 328,538 116,421 16,721 6,438 4,301 13,059 485,478
% 67.7% 24.0% 3.4% 1.3% 0.9% — 2.7% 100%
Sonoma County, Bay Area, and State Population by Ethnicity — 2008
County
2008
www.santarosa.edu/researchOffice of Institutional Research Community • C – 4
# 2,911,325 1,602,614 1,579,563 488,918 26,100 252,106 6,860,626
% 42.4% 23.4% 23.0% 7.1% 0.4% — 3.7% 100%
# 15,568,730 14,197,914 4,868,771 2,229,046 211,623 1,058,412 38,134,496
% 40.8% 37.2% 12.8% 5.8% 0.6% — 2.8% 100%
Bay Area
State

SONOMA COUNTY JUNIOR COLLEGE DISTRICT — Fact Book 2010 C – 5
State, Bay Area, and Sonoma County Population by Ethnicity2008
30.0%
40.0%
50.0%
60.0%
70.0%
80.0%
White
Hispanic/ Latino*
Asian & Pacific Islander
Black
Source: California Department of Finance
0.0%
10.0%
20.0%
Sonoma County Bay Area State
Black
Native American
Two or More Races
Sonoma County Population by Ethnicity
p
Note: * The U.S. Census changed racial/ethnic definitions in 2000. “Two or more” became a category in 2000. The current definition includes “Spanish/ Hispanic/Latino,” a self‐designated classification for people whose origins are Spain, the Spanish‐speaking countries of Central or South America, the Caribbean, or those identifying themselves generally as Spanish, Spanish‐American, etc. Origin can be viewed as ancestry, nationality, or country of birth of the person or the person’s parents or ancestors. Spanish/Hispanic/Latino people may be of any race, according to the U.S. Census definition.
Definition of Measure: A breakdown of Sonoma County population by major racial/ethnic groups according to the U.S. Census 2000 and California Department of Finance, including a comparison to the Bay Area and state figures.
Source: State of California, Department of Finance, California County Race/Ethnic Population Estimates and Components of Change by Year July 1, 2000—2008. Sacramento, California, June 2010. Note: These data are the most current available as of publication date.
Comparison Groups: Bay Area (nine individual counties) and California
Uses(s) of Measure: This measure helps to understand our service population for planning purposes by comparing the ethnicity of the District population to the Bay Area and state.
Analysis: The population of Sonoma County has grown over 130% in the past 30 years. During that time, the proportion of Hispanic/Latino residents increased dramatically from 5% in 1970 to 24% in 2008, while the proportion of White residents decreased from 92% to 68%. Also from 1970 to 2008, the proportion of Asians/Pacific Islanders increased from 1 5% to 3 4% The proportion of Black andthe proportion of Asians/Pacific Islanders increased from 1.5% to 3.4%. The proportion of Black and Native Americans residents has remained relatively stable.
In comparison to the Bay Area and California, Sonoma County has a higher proportion of Whites. The county’s Hispanic/Latino population rate is relatively close to the overall Bay Area’s Hispanic/Latino rate of 23%. The state’s Hispanic/Latino rate is over one‐third of the total state population. The Bay Area and the state have a higher proportion of Asians and Pacific Islanders than Sonoma County. See Note above on U.S. Census 2000 race/ethnic definition changes.
www.santarosa.edu/researchOffice of Institutional Research Community • C – 5
For more information: California Department of Finance —http://www.dof.ca.gov/HTML/DEMOGRAP/ReportsPapers/Estimates/E3/E3‐00‐04/E‐3_2000‐04.phpand U.S. Census —www.census.gov/main/www/cen2000.html
SONOMA COUNTY JUNIOR COLLEGE DISTRICT — Fact Book 2010 C – 6
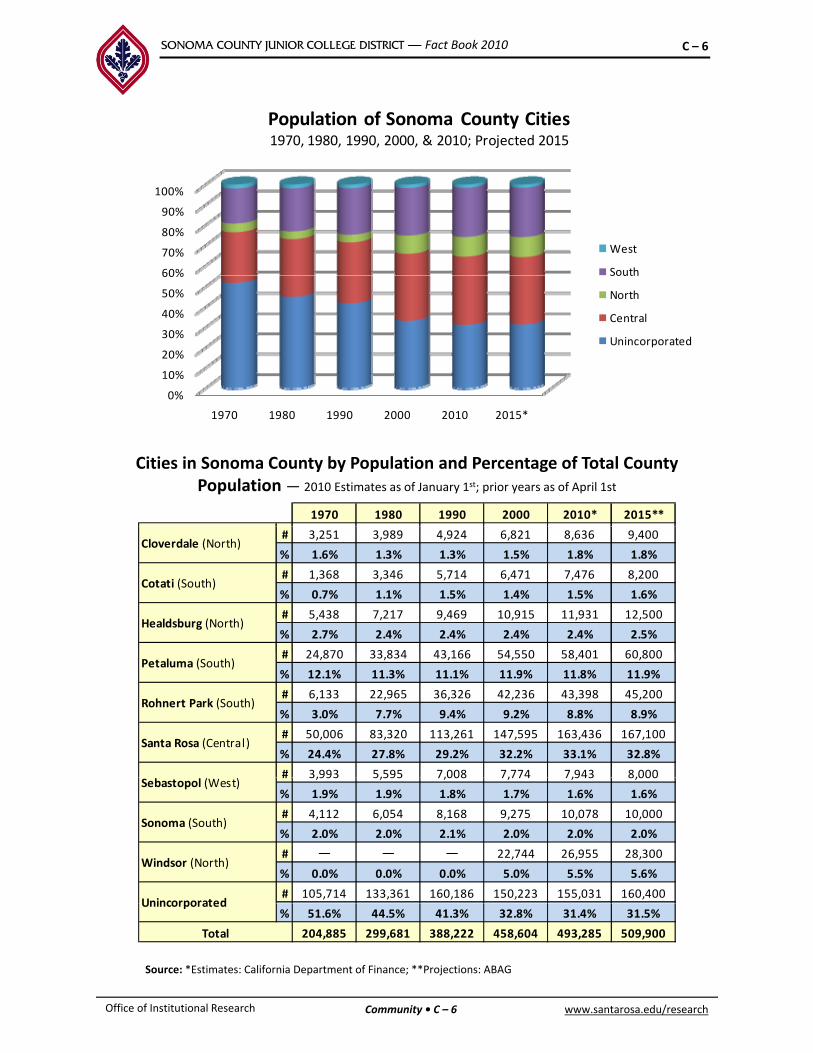
Population of Sonoma County Cities1970, 1980, 1990, 2000, & 2010; Projected 2015
60%
70%
80%
90%
100%
West
South
0%
10%
20%
30%
40%
50%
60% South
North
Central
Unincorporated
Cities in Sonoma County by Population and Percentage of Total County Population— 2010 Estimates as of January 1st; prior years as of April 1st
1970 1980 1990 2000 2010 2015*
1970 1980 1990 2000 2010* 2015**
# 3,251 3,989 4,924 6,821 8,636 9,400
% 1.6% 1.3% 1.3% 1.5% 1.8% 1.8%
# 1,368 3,346 5,714 6,471 7,476 8,200
% 0.7% 1.1% 1.5% 1.4% 1.5% 1.6%
# 5,438 7,217 9,469 10,915 11,931 12,500
% 2.7% 2.4% 2.4% 2.4% 2.4% 2.5%
# 24 870 33 834 43 166 54 550 58 401 60 800
Cloverdale (North)
Cotati (South)
Healdsburg (North)
# 24,870 33,834 43,166 54,550 58,401 60,800
% 12.1% 11.3% 11.1% 11.9% 11.8% 11.9%
# 6,133 22,965 36,326 42,236 43,398 45,200
% 3.0% 7.7% 9.4% 9.2% 8.8% 8.9%
# 50,006 83,320 113,261 147,595 163,436 167,100
% 24.4% 27.8% 29.2% 32.2% 33.1% 32.8%
# 3,993 5,595 7,008 7,774 7,943 8,000
Petaluma (South)
Rohnert Park (South)
Santa Rosa (Central)
# 3,993 5,595 7,008 7,774 7,943 8,000
% 1.9% 1.9% 1.8% 1.7% 1.6% 1.6%
# 4,112 6,054 8,168 9,275 10,078 10,000
% 2.0% 2.0% 2.1% 2.0% 2.0% 2.0%
# — — — 22,744 26,955 28,300
% 0.0% 0.0% 0.0% 5.0% 5.5% 5.6%
# 105,714 133,361 160,186 150,223 155,031 160,400
Sebastopol (West)
Sonoma (South)
Windsor (North)
Unincorporated
www.santarosa.edu/researchOffice of Institutional Research Community • C – 6
Source: *Estimates: California Department of Finance; **Projections: ABAG
% 51.6% 44.5% 41.3% 32.8% 31.4% 31.5%
204,885 299,681 388,222 458,604 493,285 509,900
Unincorporated
Total

SONOMA COUNTY JUNIOR COLLEGE DISTRICT — Fact Book 2010 C – 7
County Bay Area County Bay Area County Bay Area2015
% increase over 2010Sonoma County
Demographics (for com‐
parison with Bay Area)
2000 2005
% increase over 2000
2010
% increase over 2005
County Population 458,614 479,200 4.5% 4.6% 497,900 3.9% 3.5% 509,900 2.4% 4.6%
Household Population* 447,512 468,000 4.6% 4.7% 486,600 4.0% 3.5% 498,600 2.4% 4.6%
Persons Per Household 2.6 2.57 ‐1.2% 0.0% 2.58 0.4% 0.4% 2.59 0.4% 0.0%
Households 172,403 181,800 5.5% 4.7% 188,340 3.6% 3.3% 192,600 2.2% 4.4%
Employed Residents 235,069 237,700 1.1% ‐6.6% 242,400 2.0% 5.7% 247,300 2.0% 6.6%
Mean Household Income $82,800 $82,600 ‐0.2% ‐6.4% $84,300 2.1% 4.9% $89,000 5.3% 5.4%
parison with Bay Area)
Population of Sonoma County Cities
Definition of Measure: The historical, current, and projected population of Sonoma County cities according to the California Department of Finance based on U S Census 2000 data and the
Notes: *Non‐homeless household population.
Source: 2000 taken from U.S. Census; 2005, and 2010 and 2015 projections from ABAG
according to the California Department of Finance, based on U.S. Census 2000 data and the Association of Bay Area Governments (ABAG).
Source: The 2000 population data are based on U.S. Census 2000 data; State of California, Department of Finance, E‐1 City / County Population Estimates, with Annual Percent Change, January 1, 2008 and 2009. Sacramento, California, May 2009; the 2010 and 2015 projections and the Sonoma County/Bay Area Demographics are from ABAG.
Comparison Group: Bay Area – nine individual counties (Alameda, Contra Costa, Marin, Napa, San p p y ( pFrancisco, San Mateo, Santa Clara, Solano and Sonoma counties).
Use(s) of Measure: This measure defines the historical, current and future potential population by city within Sonoma County and provides a comparison rate to the total Bay Area, which can be used for planning and evaluation purposes.
Analysis: Sonoma County’s population has been steadily increasing since 1970. Since 2000, the cities with the greatest proportional growth are Cloverdale, Windsor, Cotati, and Santa Rosa.
In 2009, ABAG forecasted that Sonoma County population would increase by 2.4% between 2010 and 2015, projecting that the Bay Area would increase at a higher rate of 4.6%.
After a slight decrease in 2005 from 2000, the mean household income from Sonoma County is projected to grow (at least through 2015) at a lower rate than the Bay Area.
For more information:
California Department of Finance: htt // d f /HTML/DEMOGRAP/R t P /R t P hhttp://www.dof.ca.gov/HTML/DEMOGRAP/ReportsPapers/ReportsPapers.php ;
Association of Bay Area Governments: www.abag.ca.gov ;
and Bay Area Census: www.bayareacensus.ca.gov.
www.santarosa.edu/researchOffice of Institutional Research Community • C – 7
SONOMA COUNTY JUNIOR COLLEGE DISTRICT — Fact Book 2010 C – 8
U.S. Census Data
Definition of Measure: U.S. Census estimated data for Sonoma County, California and United States on people, businesses and geography. The U.S. Census website provides data on population, but most of the figures, including age, ethnicity and educational attainment, have not been updated since the 2000 U.S. Census.
Quick Facts — Sonoma County, California and Nation
Sonoma County – http://quickfacts.census.gov/qfd/states/06/06097.html
California – http://quickfacts.census.gov/qfd/states/06000.html
United States ‐ http://quickfacts.census.gov/qfd/states/00000.html
Social Economic Housing and American Community Survey Demographics Estimates —Social, Economic, Housing and American Community Survey Demographics Estimates —Sonoma County, California, and Nation
Definition of Measure: Estimated Sonoma County, California and United States data from U.S. Census on:
Social – school enrollment, educational attainment, disability status, citizenship, and place of birth, and language spoken at home;
Economic income employment status occupation and commuting to work;Economic – income, employment status, occupation and commuting to work;
Housing – occupancy, type of structure, housing value, housing costs and utilities;
Demographics – gender, age, and ethnicity.
US Census Fact Finder:
United States Fact Sheet: http://factfinder.census.gov/servlet/ACSSAFFFacts?_event=Search&geo_id=&_geoContext=&_street
For Sonoma County data:
Select the link aboveSelect the link above
Type “Sonoma County” in city/town, county or zip text box (upper right corner)
Type “California” in state text box
Click “Go”
For California data:
www.santarosa.edu/researchOffice of Institutional Research Community • C – 8
Select the link above
Type “California” in state text box
Click “Go”
SONOMA COUNTY JUNIOR COLLEGE DISTRICT — Fact Book 2010 C – 9
Sonoma County Employment by Industry2000 – 2020
0 10,000 20,000 30,000 40,000 50,000 60,000 70,000
Ag & Natural Resources
Construction
Manufacturing & Wholesale
2000 2020
Manufacturing & Wholesale
Retail Trade
Transp & Utilities
Information
Financial & LeasingFinancial & Leasing
Prof & Managerial Services
Health & Educ Services
Art, Rec & Other Services
Government
2000 2010 2015 2020
2000 2010* 2015* 2020*
Bay
Area
Bay
Area
Bay
Area
Bay
Area
Industry # % % # % % # % % # % %
Agriculture, Nat Resources 6,510 2.9% 0.7% 6,200 2.8% 0.7% 6,200 2.6% 0.7% 6,200 2.4% 0.6%
Construction 17,430 7.9% 6.2% 16,500 7.6% 6.2% 17,970 7.6% 6.2% 20,220 7.8% 6.2%
Manufacturing & Wholesale 37,940 17.1% 18.3% 34,610 15.8% 15.8% 36,930 15.6% 15.7% 39,290 15.2% 15.7%
Retail 26,890 12.1% 10.7% 25,200 11.5% 10.0% 27,260 11.5% 9.9% 29,430 11.4% 9.9%
Transportation & Utilities 7,630 3.4% 4.7% 7,250 3.3% 4.8% 7,280 3.1% 4.7% 7,350 2.9% 4.6%
Sonoma County Sonoma County Sonoma County Sonoma County
Information 5,400 2.4% 4.7% 5,180 2.4% 4.6% 5,830 2.5% 4.6% 6,750 2.6% 4.6%
Financial & Leasing 16,180 7.3% 7.5% 15,790 7.2% 7.8% 17,080 7.2% 7.8% 18,730 7.3% 7.7%
Prof & Managerial Services 22,800 10.3% 15.1% 23,520 10.8% 14.2% 26,230 11.1% 14.3% 28,920 11.2% 14.4%
Health & Educ Services 42,400 19.1% 16.6% 52,220 23.9% 18.4% 57,700 24.4% 18.6% 63,770 24.7% 18.7%
Arts, Rec & Other Services 30,110 13.6% 11.5% 24,560 11.2% 13.9% 26,250 11.1% 14.0% 28,200 10.9% 14.0%
Government 8,200 3.7% 3.9% 7,330 3.4% 3.6% 7,980 3.4% 3.6% 8,880 3.4% 3.5%
Total Jobs 221,490 100% 100% 218,360 100% 100% 236,710 100% 100% 257,740 100% 100.0%
www.santarosa.edu/researchOffice of Institutional Research Community • C – 9
*Projections
Source: Association of Bay Area Governments (ABAG)

SONOMA COUNTY JUNIOR COLLEGE DISTRICT — Fact Book 2010 C – 10
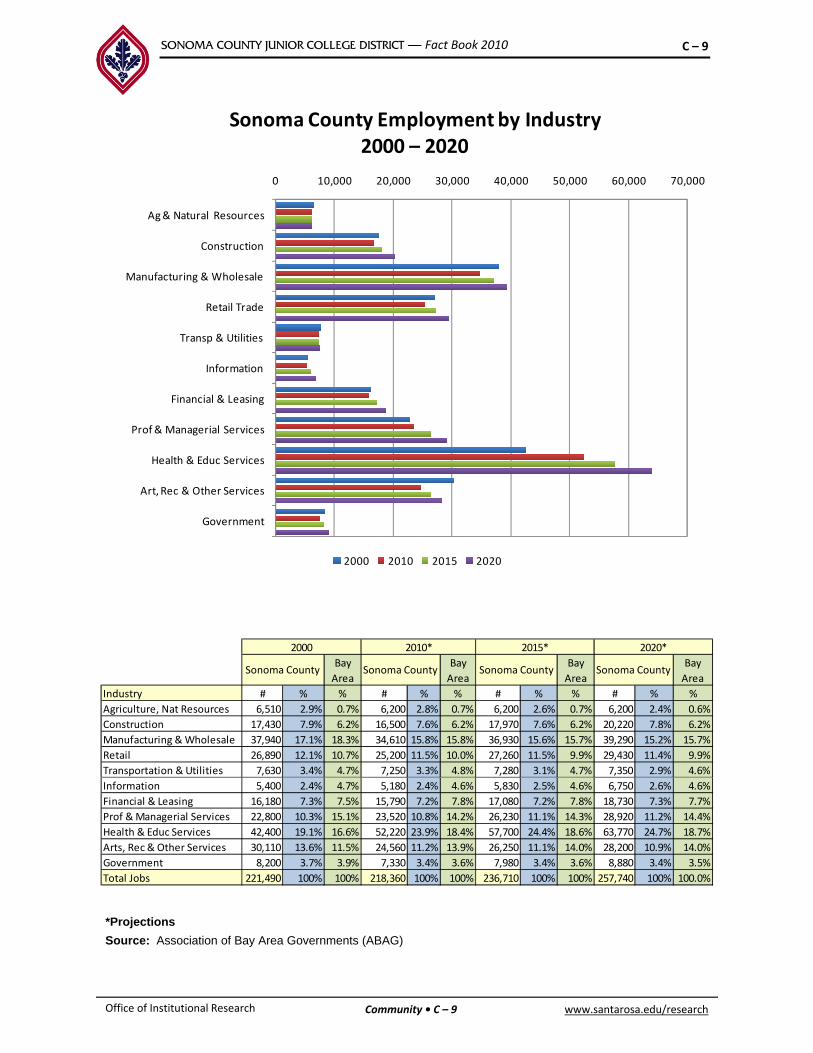
Employment in Sonoma County
Definition of Measure: Employee counts by industrial sector for Sonoma County: actual numbers for 2000, and projected numbers for 2010, 2015 and 2020. Bay Area rates are included for comparison purposes.
Source: Association of Bay Area Governments (ABAG).
Comparison Group: Bay Area – nine individual counties (Alameda, Contra Costa, Marin, Napa, San Francisco San Mateo Santa Clara Solano and Sonoma counties)Francisco, San Mateo, Santa Clara, Solano and Sonoma counties).
Use(s) of Measure: This measure shows the historical and future employment by industry for the community’s training and retraining needs, which can help project the educational needs of the future.
Analysis: The service sector employs the largest proportion of Sonoma County residents as well as Bay Area residents, and it is projected to grow even more. Manufacturing and Wholesale employs the second largest proportion of county residents, followed by Retail Trade.
ABAG predicted in 2009 that the County would add an additional 18,350 jobs between 2010 and 2015, with most being service jobs.
For more information:
Association of Bay Area Governments: www.abag.ca.gov
www.santarosa.edu/researchOffice of Institutional Research Community • C – 10
SONOMA COUNTY JUNIOR COLLEGE DISTRICT — Fact Book 2010 C – 11
Sonoma County High School Graduation and College Going Rates: 2005 – 2009
5,000
6,000
7,000
ates: 005 009
12th‐Grade Enrollment
1 000
2,000
3,000
4,000 Total High School Graduates
College Going
Enrollment at SRJC the following fall
0
1,000
2005 2006 2007 2008 2009
Sonoma County High School Students
SoCo High School Graduation College Going SoCo HS Grads enrolling
in SRJC the following
Year12th-Grade Enrollment
Total High School
Graduates
12th-Grade Graduation
Rate#
College Going Rate
#% of Total SoCo HS
Grads
% of Total College
Going HS Grads
2005 5,607 4,934 88.0% 3,258 66.0% 2,160 43.8% 66.3%
Rates HS Gradsin SRJC the following
Fall*
2006 5,888 4,857 82.5% 3,418 70.4% 2,380 49.0% 69.6%
2007 6,192 5,037 81.3% 3,467 68.8% 2,430 48.2% 70.1%
2008 6,253 5,198 83.1% 3,562 68.5% 2,562 49.3% 71.9%
2009 6,225 5,028 80.8% 4,010 79.8% 3,089 61.4% 77.0%
12th‐Grade Sonoma County High School Student College Going Rate
University California California Independent
#% of
college going
#% of
college going
#% of
college going
#% of
college going
2005 375 11.2% 524 15.7% 2,359 70.7% 78 2.3% 3,336
2006 332 9.7% 569 16.6% 2,517 73.6% — — 3,418
Year
of California
State University
Community Colleges
Independent Institutions College
Going Total
www.santarosa.edu/researchOffice of Institutional Research Community • C – 11
Source: CPEC and CBEDS.
2007 318 9.2% 584 16.8% 2,565 74.0% — — 3,467
2008 347 9.7% 532 14.9% 2,683 75.3% — — 3,562
2009 284 7.1% 537 13.4% 3,189 79.5% — — 4,010
SONOMA COUNTY JUNIOR COLLEGE DISTRICT — Fact Book 2010 C – 12
High School Graduation
and College Going Rates: 2005 – 2009
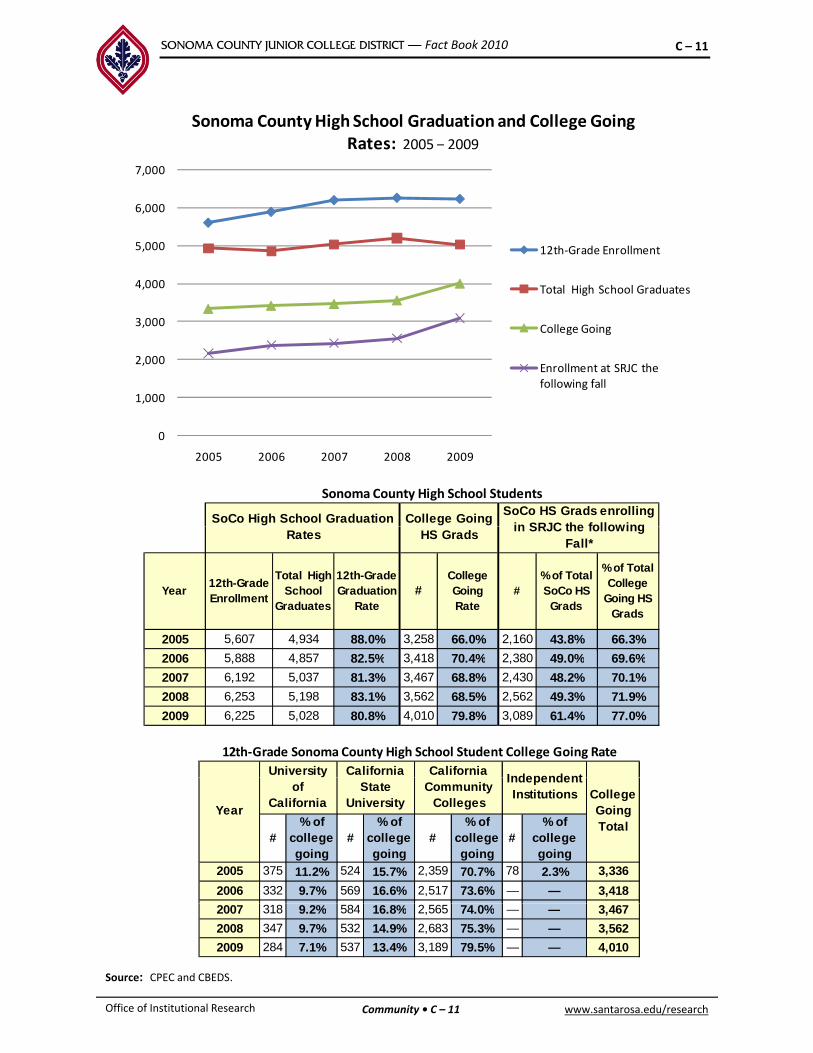
Definition of Measure: This measure includes the number of public and private high school seniors and graduates in Sonoma County and their attendance patterns at colleges and universities the fall after their graduation.
Sources: California Department of Education (Public 12th‐Grade Enrollment and Graduate Data); Private High Schools (Private 12th‐Grade Enrollment and Graduate Data); and California Postsecondary g ( ) f yEducation Commission (Sonoma County Graduates enrollment to public and independent institutions).
Use(s) of Measure: This measure has been used historically as an indicator of changes in college participation patterns of recent county high school graduates, especially their enrollment at Sonoma County Junior College District.
Analysis: Twelfth‐grade enrollment and the number of high school graduates decreased in 2009 in Sonoma County, with an 80% graduation rate. Over 79% of Sonoma County high school graduates went to college in 2009 – an increase of 11.3% from 2008.
The majority of county high school graduates (between 66% to 77%) who attend college in the Fall semester after graduation choose Santa Rosa Junior College. In 2009, the proportion of Sonoma County High School graduates attending SRJC increased to 61.4% ‐ a 12.1% increase from 2008. This could be due to the California State University admissions limitations and the downturn in the economy.
f h l f h h h l d h d ll h f ll fOf the approximately 80% of county high school graduates who attend college the fall after graduation, over 75% go on to California Community Colleges (the vast majority to SRJC); of the remaining, 7% to 11% go to a University of California campus, 13% to 17% go to a State University campus, and 2% go on to independent institutions .
College going rates to independent institutions for 2006 through 2009 were not available at the time of publication. The college‐going totals for these years will be slightly higher when the final figures are reported. Until then, the percentages for other destination campuses are marginally higher.p , p g p g y g
For more information:
California Department of Education: http://www.cde.ca.gov/ds/
and California Postsecondary Education Commission: www.cpec.ca.gov/OnLineData/OnLineData.asp
www.santarosa.edu/researchOffice of Institutional Research Community • C – 12

SONOMA COUNTY JUNIOR COLLEGE DISTRICT — Fact Book 2010 C – 13
Top Ten Counties' Rates of Public and Private High School Graduates Enrolling in fCalifornia Community Colleges: 2004–2009
# % # %
High School Grads
California Community
College Attendance
Rank CountyHigh
School Grads
California Community
College Attendance
Rank County
# % # %
1 Imperial 2,038 1,763 87% 1 Calaveras 515 386 75%
2 Glenn 396 246 62% 2 Glenn 357 242 68%
3 Sonoma 4,841 2,388 49% 3 Siskiyou 374 250 67%
4 Ventura 9,029 4,360 48% 4 Imperial 2,119 1,200 57%
5 Sutter 1,058 507 48% 5 Ventura 9,764 5,046 52%
6 San Luis Obispo 2,648 1,150 43% 6 Sonoma 5,037 2,565 51%
7 % 7 %
2004 2007
7 Alameda 13,382 5,710 43% 7 Butte 2,335 1,094 47%
8 Santa Barbara 4,232 1,725 41% 8 Sacramento 15,198 6,914 45%
9 Orange 32,127 12,734 40% 9 San Luis Obispo 2,831 1,188 42%
10 Mendocino 1,087 420 39% 10 El Dorado 2,116 860 41%
1 Siskiyou 518 305 59% 1 Calaveras 615 537 87%
2 Ventura 9,368 4,745 51% 2 Ventura 9,459 5,685 60%
3 Imperial 2,094 1,059 51% 3 Sonoma 4,677 2,683 57%
4 Sonoma 5,139 2,359 46% 4 Sacramento 14,307 7,404 52%
5 Sacramento 14,915 6,087 41% 5 San Francisco 3,934 2,035 52%
6 Santa Barbara 4,149 1,691 41% 6 Plumas 196 100 51%
7 San Luis Obispo 2,748 1,109 40% 7 Butte 2,305 1,134 49%
8 Mendocino 1,065 405 38% 8 Siskiyou 464 225 48%
9 Calaveras 502 190 38% 9 Santa Barbara 4,126 1,963 48%
2005 2008
10 Orange 33,512 12,540 37% 10 Tulare 4,899 2,241 46%
1 Siskiyou 470 334 71% 1 Glenn 418 387 93%
2 Calaveras 539 334 62% 2 Amador 333 297 89%
3 Sonoma 4,842 2,517 52% 3 Tehama 368 281 76%
4 Ventura 9,163 4,621 50% 4 Siskiyou 426 293 69%
5 Imperial 1,901 841 44% 5 Sonoma 5,028 3,189 63%2006 2009
6 San Luis Obispo 2,757 1,197 43% 6 Ventura 10,428 5,433 52%
7 Glenn 371 158 43% 7 Butte 2,230 1,150 52%
8 San Benito 575 230 40% 8 Tuolumne 579 266 46%
9 Sacramento 14,663 5,833 40% 9 Tulare 5,173 2,310 45%
10 Santa Barbara 4,344 1,717 40% 10 Sacramento 16,202 7,003 43%
2006 2009
www.santarosa.edu/researchOffice of Institutional Research Community • C – 13
Source: California Postsecondary Education Commission (CPEC) and California Department of Education.

SONOMA COUNTY JUNIOR COLLEGE DISTRICT — Fact Book 2010 C – 14
Top Ten Counties’ Rates of Public High School Graduates Enrolling in California
C i C ll 200 2009Community Colleges: 2004–2009
Definition of Measure: The number and percent of public high school graduates attending California Community Colleges the fall after graduation for the top ten counties in the state according to this measure.
Source: California Postsecondary Education Commission (CPEC)
l fComparison Group: California counties
Use(s) of Measure: This measure shows the proportion by county of high school graduates who access California Community Colleges.
Analysis: In 2009, Sonoma County ranked fifth in the state for high school graduates attending California Community Colleges. Over 60% of the Sonoma County’s public high school graduates chose to attend California Community Colleges, with the vast majority attending Santa Rosa Junior College. Withi S C t 75% f hi h h l d t h tt d ll h SRJC (Within Sonoma County, over 75% of high school graduates who attend college choose SRJC (see Sonoma County High School Graduation and College Going Rates).
Note: The Sonoma County Junior College District includes all of Sonoma County plus small areas of Mendocino and Marin counties. However, this measure, as defined by CPEC, includes only Sonoma County.
For more information:
C lif i P t d Ed ti C i iCalifornia Postsecondary Education Commission:www.cpec.ca.gov/OnLineData/OnLineData.asp
www.santarosa.edu/researchOffice of Institutional Research Community • C – 14

SONOMA COUNTY JUNIOR COLLEGE DISTRICT — Fact Book 2010 C – 15
High School Data, College Going Rates and Freshmen Pathways
Definition of Measure: The High School 12th Grade Enrollment and Graduation Data, College Going Rates (CGR) and SRJC Enrollment data.
High School 12th grade enrollment and graduation data: http://dq.cde.ca.gov/dataquest
To access the data:
1. Select Level (County)
2. Select Subject
Under “Student Demographics” select “Graduates”
3. Click “Submit”
4. Select Year of Data and County
Determine Time Frame
Select County
Click Submit
5. Select Report
“Grade 12 Enrollment and Graduates”
Click Submit
College Going Rates by County: http://www.cpec.ca.gov/StudentData/CollegeGoingRates.asp
SRJC Enrollment Data by High School: http://www.cpec.ca.gov/OnLineData/FreshmenPathway.asp
www.santarosa.edu/researchOffice of Institutional Research Community • C – 15

SONOMA COUNTY JUNIOR COLLEGE DISTRICT — Fact Book 2010 C – 16
Sonoma County Public School 12th‐Grade Enrollment Projections by Ethnicity: 2011 – 2021
60%
70%
80%
90%
100%
Multiple or No Response
Native American
10%
20%
30%
40%
50%
60%Asian/ Pacific Islander
Black
Filipino
Hispanic/ Latino
White
0%
2011 2012 2013 2014 2015 2016 2017 2018 2019 2020 2021
2011 2012 2013 2014 2015 2016 2017 2018 2019 2020 2021
So Co # 205 191 197 225 167 185 208 196 194 197 174
So Co % 3.5% 3.8% 4.0% 4.2% 3.5% 3.7% 4.0% 3.7% 3.4% 3.7% 3.1%
State % 8.0% 8.3% 8.2% 8.2% 8.2% 7.8% 7.8% 8.3% 7.8% 7.7% 8.4%
So Co # 157 162 136 124 138 123 107 115 117 105 100
So Co % 3.0% 2.4% 2.8% 2.1% 2.4% 2.4% 2.2% 2.2% 2.3% 1.9% 1.8%
State % 8.2% 7.8% 7.6% 7.4% 7.3% 7.3% 7.1% 6.8% 6.7% 6.2% 6.1%
So Co # 46 41 53 54 43 50 43 29 42 22 44
So Co % 0.8% 0.8% 0.9% 1.2% 1.0% 0.9% 0.9% 0.5% 0.8% 0.4% 0.8%
Asian
Black
Filipino
State % 2.6% 2.6% 2.7% 2.7% 2.7% 2.7% 2.6% 2.5% 2.4% 2.3% 2.3%
So Co # 1,785 1,902 1,937 2,014 1,947 1,871 2,168 2,189 2,214 2,272 2,376
So Co % 31.2% 32.8% 32.0% 35.2% 35.1% 37.7% 38.6% 40.7% 41.2% 42.2% 42.8%
State % 49.0% 48.3% 48.8% 49.6% 50.0% 50.5% 50.8% 51.2% 51.9% 52.0% 52.7%
So Co # 67 83 94 82 88 80 67 71 70 68 70
So Co % 1.2% 1.7% 1.6% 1.4% 1.5% 1.3% 1.2% 1.1% 1.2% 1.3% 1.3%
State % 0.8% 0.8% 0.8% 0.7% 0.8% 0.7% 0.7% 0.7% 0.7% 0.7% 0.6%
Native
American
Hispanic/
Latino
So Co # 27 26 24 33 26 35 30 20 39 22 23
So Co % 0.5% 0.6% 0.4% 0.6% 0.6% 0.7% 0.5% 0.3% 0.5% 0.4% 0.4%
State % 0.7% 0.6% 0.6% 0.6% 0.6% 0.6% 0.6% 0.6% 0.6% 0.6% 0.6%
So Co # 3,071 3,079 2,968 2,834 2,797 2,533 2,529 2,441 2,367 2,464 2,443
So Co % 55.7% 54.7% 54.8% 52.7% 53.6% 50.7% 49.7% 47.4% 45.8% 45.7% 44.0%
State % 28.3% 29.1% 28.6% 28.2% 27.5% 27.2% 26.7% 25.9% 25.3% 25.6% 25.1%
So Co # 152 124 216 133 154 192 203 218 210 238 321Multiple or
Pacific
Islander
White
www.santarosa.edu/researchOffice of Institutional Research Community • C – 16
Source: California Department of Education
So Co % 4.1% 3.2% 3.6% 2.6% 2.2% 2.6% 2.9% 3.9% 4.9% 4.4% 5.8%
State % 2.4% 2.4% 2.6% 2.6% 2.9% 3.2% 3.6% 4.0% 4.5% 4.9% 4.1%
Total So Co # 5,510 5,608 5,625 5,499 5,360 5,069 5,355 5,279 5,253 5,388 5,551
No
Response

SONOMA COUNTY JUNIOR COLLEGE DISTRICT — Fact Book 2010 C – 17
Sonoma County and State Data for the 12th‐grade Class of 2010
2010 # % # %
Asian 201 3.5% 44,340 9.3%
Black 156 2.7% 36,247 7.6%
Filipino 34 0.6% 13,377 2.8%
Hispanic/Latino 1,738 30.2% 216,751 45.3%
StateSonoma County
Public School 12th‐Grade Enrollment Projections: 2011– 2021
Native American 90 1.6% 3,957 0.8%
Pacific Islander 17 0.3% 3,152 0.7%
White 3,383 58.8% 148,010 30.9%
Multiple or No response 134 2.3% 12,669 2.6%
Total 5,753 100% 478,503 100%
j
Definition of Measure: Projections of Sonoma County and California’s public 12th‐grade enrollment by ethnicity, based on current K‐12 enrollment.
Source: California Department of Education, Data Quest
Comparison Group: California
Use(s) of Measure: This measure describes current 12th grade enrollment by ethnic groups forUse(s) of Measure: This measure describes current 12th‐grade enrollment by ethnic groups for Sonoma County and the state, and estimates future enrollment. This information projects future enrollment at the college.
Analysis: The number of high school seniors in Sonoma County peaked in 2010 and is projected to decrease slowly through 2016 and then increase to 5,551 in 2021. Sonoma County’s Latino 12th‐grade population is projected to increase markedly from 31% to 42% between 2011 and 2021. The proportion of white students is projected to decrease by 2021 to 44% of the county total.
By 2021, the state proportion of Latino 12th‐grade students is projected to increase to 53% and the white proportion is projected to decrease to 25%. The proportion of other ethnic groups is projected to remain relatively stable.
For more information:
California Department of Education – http://www.cde.ca.gov/ds/
www.santarosa.edu/researchOffice of Institutional Research Community • C – 17

SONOMA COUNTY JUNIOR COLLEGE DISTRICT — Fact Book 2010 C – 18
Sonoma County and State Secondary School Dropout Rate
Definition of Measure: Secondary schools dropout rates in Sonoma County and the state.
To access the data:
Go to California Department of Education: http://www.cde.ca.gov/ds/
Under “Highlights” select “Data Quest”U de g g ts se ect ata Quest1. Select “Level” (State, County, District, School)2. Select “Subject”Under “Student Demographics” select “Dropouts”Click “Submit” button
Select Year and Level, if appropriateClick “Submit” button
Select desired ReportClick “Submit” button
Note: On the report page, the type of report, year, level, subgroup and gender can be changed using the dropdown box located on the left side of the screen.
www.santarosa.edu/researchOffice of Institutional Research Community • C – 18

SONOMA COUNTY JUNIOR COLLEGE DISTRICT — Fact Book 2010 C – 19
Unemployment Rate
Definition of Measure: Unemployment rate for Sonoma County, California and the nation.
Sonoma County and California Unemployment Rate
http://www.labormarketinfo.edd.ca.gov/?pageid=164
Scroll down the website to access links to various reports, including monthly and annual reports, on p , g y p ,state and county data.
United States Unemployment Rate:
Monthly ‐http://data.bls.gov/PDQ/servlet/SurveyOutputServlet?data_tool=latest_numbers&series_id=LNS14000000
AnnualAnnual ‐http://data.bls.gov/PDQ/servlet/SurveyOutputServlet?data_tool=latest_numbers&series_id=LNU04000000&years_option=all_years&periods_option=specific_periods&periods=Annual+Data
www.santarosa.edu/researchOffice of Institutional Research Community • C – 19

SONOMA COUNTY JUNIOR COLLEGE DISTRICT — Fact Book 2010 SD – 1
Student Demographics
Introduction
This section of the Fact Book profiles our students by age, gender, ethnicity, financial aid status, and other measures. The diversity of our students is the main theme throughout this section.
In Fall 2009, the majority of SRJC students (57.4%) were White; this proportion decreased significantly over the past decade (down from 69% in 2000). During the same time period, the proportion of Hispanic/Latino students grew from 12.9% to 16.2%. The percentage of other ethnic groups in the student population remained more consistent over the past decade.
SRJC has a higher proportion of female students than male students, with a ratio of approximately 6:4 compared to the total California Community Colleges ratio of 5:4.
SRJC enrolled 85 international students in Fall 2010. Most of the international students came from Asia, Africa and Europe.
The District provides many forms of federal, state, and local financial aid to its students. Over $4.0 million in Doyle, foundation, business/community, and other scholarships were awarded in the 2008–09 academic year, which is down from previous years. During the same year, $11.2 million was disbursed in federal grants and loans, and over $3.7 million was disbursed in state grants.
In Spring 2009, Exchange Bank suspended the distribution of funds from the Doyle Trust to Santa Rosa Junior College resulting in no available funds for new Doyle Scholarships for the 2009 class of hi h h l i t i SRJC i F ll 2009 “B id i th D l ” i b i M 2009high school seniors entering SRJC in Fall 2009. “Bridging the Doyle” campaign began in May 2009 to bridge the gap made by the temporary loss of the Doyle Scholarships.
www.santarosa.edu/researchStudent Demographics • SD – 1

SONOMA COUNTY JUNIOR COLLEGE DISTRICT — Fact Book 2010 SD – 2
Age of Students
Definition of Measure: The District’s unduplicated credit and noncredit enrollment by ageDefinition of Measure: The District s unduplicated credit and noncredit enrollment by age group and the total enrollment at the End of Semester. (Birth dates are not available for approximately 0.1% of students.)
Accessibility: SRJC has converted to a new Student Information System (SIS). Many reports from Information Technology (IT) used in past Fact Books are now being updated and combined to minimize duplication and increase efficiency. While this conversion is in process, Fact Book users are being directed to the California Community College Chancellor’s Office Data Mart website to gain access to the District’s MIS* data. This measure can be accessed in previous Fact Books at: www santarosa edu/researchmeasure can be accessed in previous Fact Books at: www.santarosa.edu/research.
Below are the instructions to access the specific data for this report.
Term Datahttps://misweb.cccco.edu/mis/onlinestat/studdemo_coll_cube.cfm
To get SRJC data:To get SRJC data:Select “Santa Rosa” under College;Select Year and Term needed (only one year/term can be selected);Select “Age” under Column 1 Heading;Click “Get Report” button
To get Statewide data:Select “Statewide” under College;Select Statewide under College;Select Year and Term needed (only one year/term can be selected);Select “Age” under Column 1 Heading;Click “Get Report” button
Academic Year (Annual) Datahttps://misweb.cccco.edu/mis/onlinestat/studdemo_annual_college.cfm
To get SRJC data:Select “Santa Rosa” under College;Select Academic Year needed (only one year can be selected);Select “Age” under Column 1 Heading;Click “Get Report” button
To get Statewide data:Select “Statewide” under College;Select Academic Year needed (only one year can be selected);Select “Age” under Column 1 Heading;Click “Get Report” button
To download data, click on the “Download” hyperlink on the results page
*
www.santarosa.edu/researchOffice of Institutional Research Student Demographics • SD – 2
*Limitations to MIS dataData does not include credit students enrolled in full term courses earning less than .50 units and credit and noncredit students enrolled in short term courses with 8 or less hours of attendance.
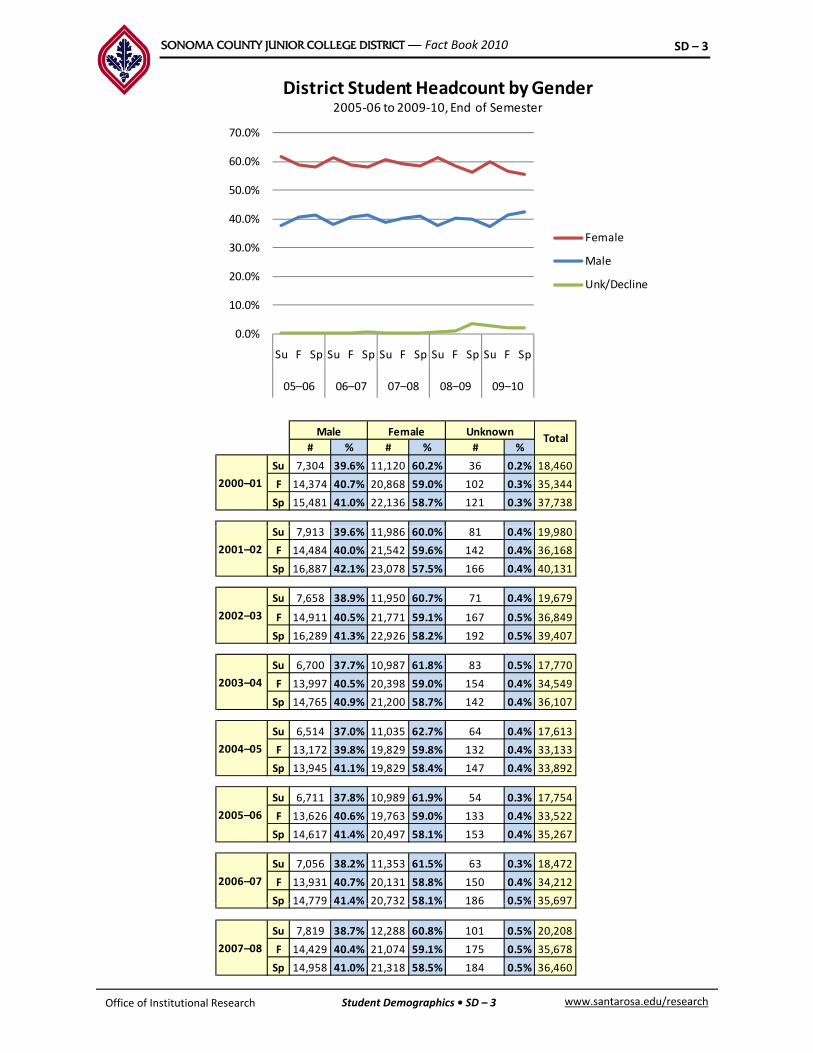
SONOMA COUNTY JUNIOR COLLEGE DISTRICT — Fact Book 2010 SD – 3
70.0%
District Student Headcount by Gender2005‐06 to 2009‐10, End of Semester
20 0%
30.0%
40.0%
50.0%
60.0%
Female
Male
0.0%
10.0%
20.0%
Su F Sp Su F Sp Su F Sp Su F Sp Su F Sp
05–06 06–07 07–08 08–09 09–10
Unk/Decline
# % # % # %
Su 7,304 39.6% 11,120 60.2% 36 0.2% 18,460
F 14,374 40.7% 20,868 59.0% 102 0.3% 35,344
Sp 15,481 41.0% 22,136 58.7% 121 0.3% 37,738
2000–01
Male Female UnknownTotal
Su 7,913 39.6% 11,986 60.0% 81 0.4% 19,980
F 14,484 40.0% 21,542 59.6% 142 0.4% 36,168
Sp 16,887 42.1% 23,078 57.5% 166 0.4% 40,131
Su 7,658 38.9% 11,950 60.7% 71 0.4% 19,679
F 14,911 40.5% 21,771 59.1% 167 0.5% 36,849
Sp 16,289 41.3% 22,926 58.2% 192 0.5% 39,407
2002–03
2001–02
Su 6,700 37.7% 10,987 61.8% 83 0.5% 17,770
F 13,997 40.5% 20,398 59.0% 154 0.4% 34,549
Sp 14,765 40.9% 21,200 58.7% 142 0.4% 36,107
Su 6,514 37.0% 11,035 62.7% 64 0.4% 17,613
F 13,172 39.8% 19,829 59.8% 132 0.4% 33,133
Sp 13,945 41.1% 19,829 58.4% 147 0.4% 33,892
2003–04
2004–05
Su 6,711 37.8% 10,989 61.9% 54 0.3% 17,754
F 13,626 40.6% 19,763 59.0% 133 0.4% 33,522
Sp 14,617 41.4% 20,497 58.1% 153 0.4% 35,267
Su 7,056 38.2% 11,353 61.5% 63 0.3% 18,472
F 13,931 40.7% 20,131 58.8% 150 0.4% 34,212
Sp 14,779 41.4% 20,732 58.1% 186 0.5% 35,697
2006–07
2005–06
www.santarosa.edu/researchOffice of Institutional Research Student Demographics • SD – 3
Sp 14,779 41.4% 20,732 58.1% 186 0.5% 35,697
Su 7,819 38.7% 12,288 60.8% 101 0.5% 20,208
F 14,429 40.4% 21,074 59.1% 175 0.5% 35,678
Sp 14,958 41.0% 21,318 58.5% 184 0.5% 36,460
2007–08

SONOMA COUNTY JUNIOR COLLEGE DISTRICT — Fact Book 2010 SD – 4
Gender of Students, continued
# % # % # %
Su 7,670 37.8% 12,435 61.3% 164 0.8% 20,269
F 14,652 40.4% 21,145 58.4% 429 1.2% 36,226
Sp 14,558 40.1% 20,501 56.4% 1,279 3.5% 36,338
Su 7,417 37.5% 11,838 59.8% 544 2.7% 19,799
2008–09
Male Female UnknownTotal
SRJC and State CCC Enrollment by GenderFall 2009 and Spring 2010
Su 7,417 37.5% 11,838 59.8% 544 2.7% 19,799
F 13,765 41.3% 18,875 56.6% 687 2.1% 33,327
Sp 14,012 42.5% 18,289 55.5% 668 2.0% 32,969
2009–10
UnknownT t l
Male Female
# % # % # %
SRJC 13,765 41.3% 18,875 56.6% 687 2.1% 33,327
CCC Statewide 800,408 44.5% 973,450 54.2% 23,373 1.3% 1,797,231
SRJC 14,012 42.5% 18,289 55.5% 668 2.0% 32,969
CCC Statewide 793,981 45.5% 928,783 53.3% 21,215 1.2% 1,743,979
Total
Spring
2010
Fall 2009
Gender of Students
Definition of Measure: District unduplicated credit and noncredit enrollment by gender at End of Semester for Summer, Fall, and Spring and a comparison to the California Community Colleges.
Source: Internal SRJC data (NSR/STRM740) and California Community Colleges Chancellor's Office Data Mart
Source: Internal SRJC data (NSR/STRM740) and California Community Colleges Chancellor’s Office Data Mart
Comparison Group: California Community Colleges
Use(s) of Measure: This measure shows the change in the gender composition of the student population from year to year, compared to the overall California Community College system. This measure is used for program planning purposes. p g p g p p
Analysis: Over the past decade, women at SRJC have outnumbered men at a ratio of approximately 6:4 while the statewide ratio is 5:4. Over 56% of Summer enrollment is female. Interestingly, the proportion of female students declines from Summer to Fall to Spring, while the proportion of male students increases. This shift could be due to the Public Safety Training Center posting a higher enrollment of predominantly male students in the Spring.
For additional information:
www.santarosa.edu/researchOffice of Institutional Research Student Demographics • SD – 4
Chancellor’s Office Data Mart: http://www.cccco.edu/SystemOffice/Divisions/TechResearchInfo/MIS/DataMartandReports/tabid/282/Default.aspx
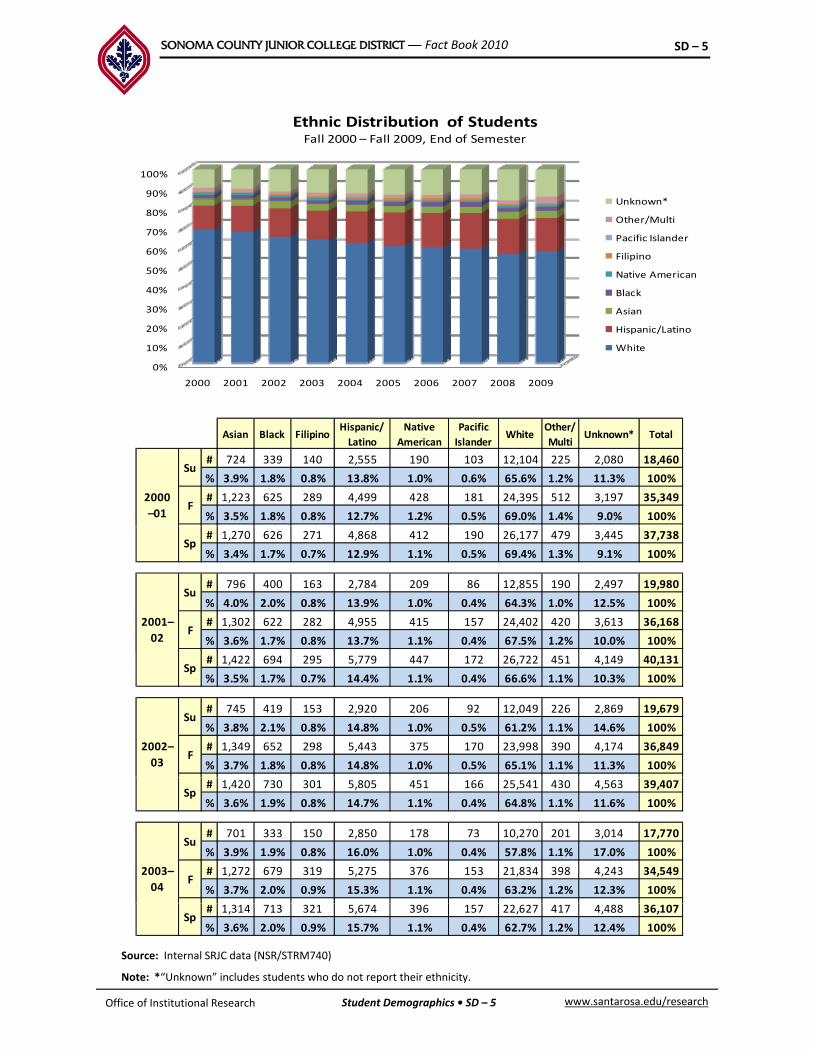
SONOMA COUNTY JUNIOR COLLEGE DISTRICT — Fact Book 2010 SD – 5
Ethnic Distribution of StudentsFall 2000 – Fall 2009, End of Semester
50%
60%
70%
80%
90%
100%
Unknown*
Other/Multi
Pacific Islander
Filipino
Native American
0%
10%
20%
30%
40%
2000 2001 2002 2003 2004 2005 2006 2007 2008 2009
Native American
Black
Asian
Hispanic/Latino
White
Asian Black FilipinoHispanic/
Latino
Native
American
Pacific
IslanderWhite
Other/
MultiUnknown* Total
# 724 339 140 2,555 190 103 12,104 225 2,080 18,460
% 3.9% 1.8% 0.8% 13.8% 1.0% 0.6% 65.6% 1.2% 11.3% 100%
# 1,223 625 289 4,499 428 181 24,395 512 3,197 35,349
% 3.5% 1.8% 0.8% 12.7% 1.2% 0.5% 69.0% 1.4% 9.0% 100%
2000
–01
Su
F
# 1,270 626 271 4,868 412 190 26,177 479 3,445 37,738
% 3.4% 1.7% 0.7% 12.9% 1.1% 0.5% 69.4% 1.3% 9.1% 100%
# 796 400 163 2,784 209 86 12,855 190 2,497 19,980
% 4.0% 2.0% 0.8% 13.9% 1.0% 0.4% 64.3% 1.0% 12.5% 100%
# 1,302 622 282 4,955 415 157 24,402 420 3,613 36,168
% 3.6% 1.7% 0.8% 13.7% 1.1% 0.4% 67.5% 1.2% 10.0% 100%
2001–
02
Su
Sp
F
# 1,422 694 295 5,779 447 172 26,722 451 4,149 40,131
% 3.5% 1.7% 0.7% 14.4% 1.1% 0.4% 66.6% 1.1% 10.3% 100%
# 745 419 153 2,920 206 92 12,049 226 2,869 19,679
% 3.8% 2.1% 0.8% 14.8% 1.0% 0.5% 61.2% 1.1% 14.6% 100%
# 1,349 652 298 5,443 375 170 23,998 390 4,174 36,849
% 3.7% 1.8% 0.8% 14.8% 1.0% 0.5% 65.1% 1.1% 11.3% 100%
Su
F2002–
03
Sp
# 1,420 730 301 5,805 451 166 25,541 430 4,563 39,407
% 3.6% 1.9% 0.8% 14.7% 1.1% 0.4% 64.8% 1.1% 11.6% 100%
# 701 333 150 2,850 178 73 10,270 201 3,014 17,770
% 3.9% 1.9% 0.8% 16.0% 1.0% 0.4% 57.8% 1.1% 17.0% 100%
# 1,272 679 319 5,275 376 153 21,834 398 4,243 34,549
% 3.7% 2.0% 0.9% 15.3% 1.1% 0.4% 63.2% 1.2% 12.3% 100%F
Sp
2003–
04
Su
www.santarosa.edu/researchOffice of Institutional Research Student Demographics • SD – 5
Source: Internal SRJC data (NSR/STRM740)
Note: *“Unknown” includes students who do not report their ethnicity.
# 1,314 713 321 5,674 396 157 22,627 417 4,488 36,107
% 3.6% 2.0% 0.9% 15.7% 1.1% 0.4% 62.7% 1.2% 12.4% 100%Sp

SONOMA COUNTY JUNIOR COLLEGE DISTRICT — Fact Book 2010 SD – 6
Ethnicity of Students, continued
Asian Black FilipinoHispanic/
Latino
Native
American
Pacific
IslanderWhite
Other/
MultiUnknown* Total
# 623 386 134 2,803 169 69 9,887 214 3,328 17,613
% 3.5% 2.2% 0.8% 15.9% 1.0% 0.4% 56.1% 1.2% 18.9% 100%
# 1,205 658 294 5,461 349 168 20,429 371 4,198 33,133
% 3.6% 2.0% 0.9% 16.5% 1.1% 0.5% 61.7% 1.1% 12.7% 100%
# 1,172 677 289 5,599 383 156 20,827 376 4,413 33,892
2004–
05
Su
F
, , , , ,
% 3.5% 2.0% 0.9% 16.5% 1.1% 0.5% 61.5% 1.1% 13.0% 100%
# 677 364 146 3,187 178 71 9,636 179 3,316 17,754
% 3.8% 2.1% 0.8% 18.0% 1.0% 0.4% 54.3% 1.0% 18.7% 100%
# 1,194 665 304 5,798 379 157 20,203 378 4,444 33,522
% 3.6% 2.0% 0.9% 17.3% 1.1% 0.5% 60.3% 1.1% 13.3% 100%
# 1,237 701 297 6,159 409 169 21,051 402 4,842 35,267
2005–
06
Sp
Su
F
# 1,237 701 297 6,159 409 169 21,051 402 4,842 35,267
% 3.5% 2.0% 0.8% 17.5% 1.2% 0.5% 59.7% 1.1% 13.7% 100%
# 747 404 134 3,178 193 98 9,932 201 3,585 18,472
% 4.0% 2.2% 0.7% 17.2% 1.0% 0.5% 53.8% 1.1% 19.4% 100%
# 1,236 745 299 6,055 403 151 20,367 404 4,552 34,212
% 3.6% 2.2% 0.9% 17.7% 1.2% 0.4% 59.5% 1.2% 13.3% 100%
# 1 279 802 280 6 576 440 180 21 126 411 4 584 35,678
2006–
07F
Sp
Su
# 1,279 802 280 6,576 440 180 21,126 411 4,584 35,678
% 3.6% 2.2% 0.8% 18.4% 1.2% 0.5% 59.2% 1.2% 12.8% 100%
# 814 427 171 3,818 222 93 11,029 216 3,418 20,208
% 4.0% 2.1% 0.8% 18.9% 1.1% 0.5% 54.6% 1.1% 16.9% 100%
# 1,251 778 293 6,506 421 162 21,137 408 4,741 35,697
% 3.5% 2.2% 0.8% 18.2% 1.2% 0.5% 59.2% 1.1% 13.3% 100%
# 1 305 838 324 6 666 422 203 21 457 413 4 836 36 464
F
Su
Sp
2007–
08
# 1,305 838 324 6,666 422 203 21,457 413 4,836 36,464
% 3.6% 2.3% 0.9% 18.3% 1.2% 0.6% 58.8% 1.1% 13.3% 100%
# 788 458 170 3,867 236 109 10,905 207 3,529 20,269
% 3.9% 2.3% 0.8% 19.1% 1.2% 0.5% 53.8% 1.0% 17.4% 100%
# 1,278 806 326 6,614 442 194 20,323 402 5,841 36,226
% 3.5% 2.2% 0.9% 18.3% 1.2% 0.5% 56.1% 1.1% 16.1% 100%
# 1 212 820 301 6 256 433 200 20 162 409 6 545 36 338
Sp
Su
F2008–
09
# 1,212 820 301 6,256 433 200 20,162 409 6,545 36,338
% 3.3% 2.3% 0.8% 17.2% 1.2% 0.6% 55.5% 1.1% 18.0% 100%
# 676 451 150 3,461 192 82 10,614 505 3,668 19,799
% 3.4% 2.3% 0.8% 17.5% 1.0% 0.4% 53.6% 2.6% 18.5% 100%
# 1,176 783 304 5,813 325 170 19,124 879 4,753 33,327
% 3.5% 2.3% 0.9% 17.4% 1.0% 0.5% 57.4% 2.6% 14.3% 100%
# 1 082 730 258 5 347 324 176 18 077 840 6 135 32 969
F
Sp
Su
2009–
10
www.santarosa.edu/researchOffice of Institutional Research Student Demographics • SD – 6
Source: Internal SRJC data (NSR/STRM40)
Note: *“Unknown” includes students who decline to state their ethnicity.
# 1,082 730 258 5,347 324 176 18,077 840 6,135 32,969
% 3.3% 2.2% 0.8% 16.2% 1.0% 0.5% 54.8% 2.5% 18.6% 100%Sp

SONOMA COUNTY JUNIOR COLLEGE DISTRICT — Fact Book 2010 SD – 7
SRJC and State CCC Enrollment by EthnicityFall 2009 and Spring 2010
Fall 2009 Spring 2010
# % # % # % # %
Asian 1,176 3.5% 193,542 10.8% 1,082 3.3% 192,108 11.0%
Black 783 2.3% 120,996 6.7% 730 2.2% 120,987 6.9%
Filipino 304 0.9% 52,709 2.9% 258 0.8% 49,531 2.8%
Hispanic/
Fall 2009 Spring 2010
SRJC CCC Statewide SRJC CCC Statewide
Latino 5,813 17.4% 521,013 29.0% 5,347 16.2% 533,279 30.5%
Native
American 325 1.0% 12,000 0.7% 324 1.0% 11,360 0.6%
Pacific
Islander 170 0.5% 11,983 0.7% 176 0.5% 11,193 0.6%
White 19,124 57.4% 560,369 31.2% 18,077 54.8% 559,049 32.0%
Other/Multi 879 2.6% 19,135 1.1% 840 2.5% 24,444 1.4%
Ethnicity of Students
D fi i i f M Th l di d di ll b h i i f SRJC f S
Source: Internal SRJC data (NSR/STRM740) and California Community Colleges Chancellor's Office Data Mart
Note: *“Unknown” includes students who do not report their ethnicity.
Unknown* 4,753 14.3% 305,544 17.0% 6,135 18.6% 246,660 14.1%
Total 33,327 100% 1,797,291 100% 32,969 100% 1,748,611 100%
Definition of Measure: The total credit and noncredit enrollment by ethnicity for SRJC for Summer, Fall, and Spring and for the California Community College system for Spring and Fall semesters, using ethnicity categories from the Chancellor’s Office MIS definitions.
Source: Internal SRJC data (NSR/STRM740) and California Community Colleges Chancellor’s Office Data Mart
Comparison Group: California Community Colleges
Use(s) of Measure: This measure shows the ethnic composition of the student population from year to year and from semester to semester. This measure is used for program planning purposes.
Analysis: The ethnic composition of students enrolled at SRJC continues to change. Although the majority of students are White, proportionally this group has decreased from 69% in Fall 2000 to 57.4% in Fall 2009. During the same period, the proportion of Hispanic/Latino students has increased from 12.7% to 17.4%. The largest proportion of Hispanic/Latino students was in Summer 2008 at 19 1% The growth of the Latino student population coincides with the changing demographics of19.1%. The growth of the Latino student population coincides with the changing demographics of Sonoma County and the growth in SRJC’s noncredit ESL program.
During Fall 2009, SRJC and the California Community College system had the same top three ethnic groups, though in significantly different proportions. Whites comprised the majority of students in both cases, but with SRJC showing a higher proportion of Whites and a lower proportion of Asian and Hispanics/Latinos, reflecting the demographic proportion of Sonoma County versus the State. SRJC has higher proportions of Unknown ethnicity than statewide.
www.santarosa.edu/researchOffice of Institutional Research Student Demographics • SD – 7
For additional information:
Chancellor’s Office Data Mart: http://www.cccco.edu/SystemOffice/Divisions/TechResearchInfo/MIS/DataMartandReports/tabid/282/Default.aspx

SONOMA COUNTY JUNIOR COLLEGE DISTRICT — Fact Book 2010 SD – 8
Educational Attainment of Students
Definition of Measure: The educational status or highest level of educational attainment ofDefinition of Measure: The educational status or highest level of educational attainment of SRJC credit and noncredit students, as indicated on the application for admission; these data are reported at the End of Semester. (Freshmen is defined as a student who has completed fewer than 30 semester units; Sophomore, a student who has completed 30, but fewer than 60 semester units, or who has 60 or more units but does not hold a degree).
Accessibility: SRJC has converted to a new Student Information System (SIS). Many reports from Information Technology used in past Fact Books are now being updated and combined to minimize duplication and increase efficiency. While this conversion is in process, Fact Book users are being directed to the California Community College Chancellor’s Office Data Mart website to gain access to the District’s MIS* data. This measure can be accessed in previous Fact Books at: www.santarosa.edu/research.
Below are the instructions to access the specific data for this report.
California Community Colleges Chancellor’s Office Data Mart Student Demographics for College/Statewide by Term file:https://misweb.cccco.edu/mis/onlinestat/studdemo_coll_cube.cfm
To get SRJC data:Select “Santa Rosa” under College;Select Year and Term needed (only one year/term can be selected);Select “Academic Level” under Column 1 Heading;Click “Get Report” button
To get Statewide data:Select “Statewide” under College;Select Year and Term needed (only one year/term can be selected);Select “Academic Level” under Column 1 Heading;Cli k “G t R t” b ttClick “Get Report” button
To download data, click on the “Download” hyperlink on the results page.
*Limitations to MIS data
Data does not include credit students enrolled in full term courses earning less than .50 units and credit and noncredit students enrolled in short term courses with 8 or less hours f tt dof attendance.
www.santarosa.edu/researchOffice of Institutional Research Student Demographics • SD – 8

SONOMA COUNTY JUNIOR COLLEGE DISTRICT — Fact Book 2010 SD – 9
Origins of International Students
100
120
140
Fall 2006 – Fall 2010, End of Semester
Oceania
South America
20
40
60
80
100 South America
North* & Central America
Middle East
Europe
Asia
Africa
0
Fall 2006 Fall 2007 Fall 2008 Fall 2009 Fall 2010
Fall 2006 Fall 2007 Fall 2008 Fall 2009 Fall 2010
Africa # 5 5 9 10 8
% 5.9% 5.4% 8.2% 8.1% 9.4%
Asia # 41 51 70 84 53
% 48.2% 54.8% 63.6% 67.7% 62.4%
Europe # 19 18 14 17 10
% 22.4% 19.4% 12.7% 13.7% 11.8%
Middle East # 2 2 2 2 2
% 2.4% 2.2% 1.8% 1.6% 2.4%
North* & Central America # 10 9 9 6 5
% 11.8% 9.7% 8.2% 4.8% 5.9%
South America # 4 5 4 2 3
% 4.7% 5.4% 3.6% 1.6% 3.5%
O i # 4 3 2 3 4
Source: Internal SRJC data (Admissions, Records and Enrollment Development)
Note: These numbers could include high school concurrent and visiting F‐1 students.
* Includes Canada
Oceania # 4 3 2 3 4
% 4.7% 3.2% 1.8% 2.4% 4.7%
Total # 85 93 110 124 85
www.santarosa.edu/researchOffice of Institutional Research Student Demographics • SD – 9
Includes Canada.
SONOMA COUNTY JUNIOR COLLEGE DISTRICT — Fact Book 2010 SD – 10
International Students
Definition of Measure: The total enrollment of international students by geographical origin, Fall semester, 2006–2010.
Source: Internal SRJC data (Admissions, Records and Enrollment Development)
Use(s) of Measure: This measure describes the international student population and compares the change in enrollment over time for program planning purposes.
Analysis: In Fall 2010, SRJC enrolled 85 international students, down from prior years. The majority of the international students come from Asia, followed by Africa and Europe.
www.santarosa.edu/researchOffice of Institutional Research Student Demographics • SD – 10
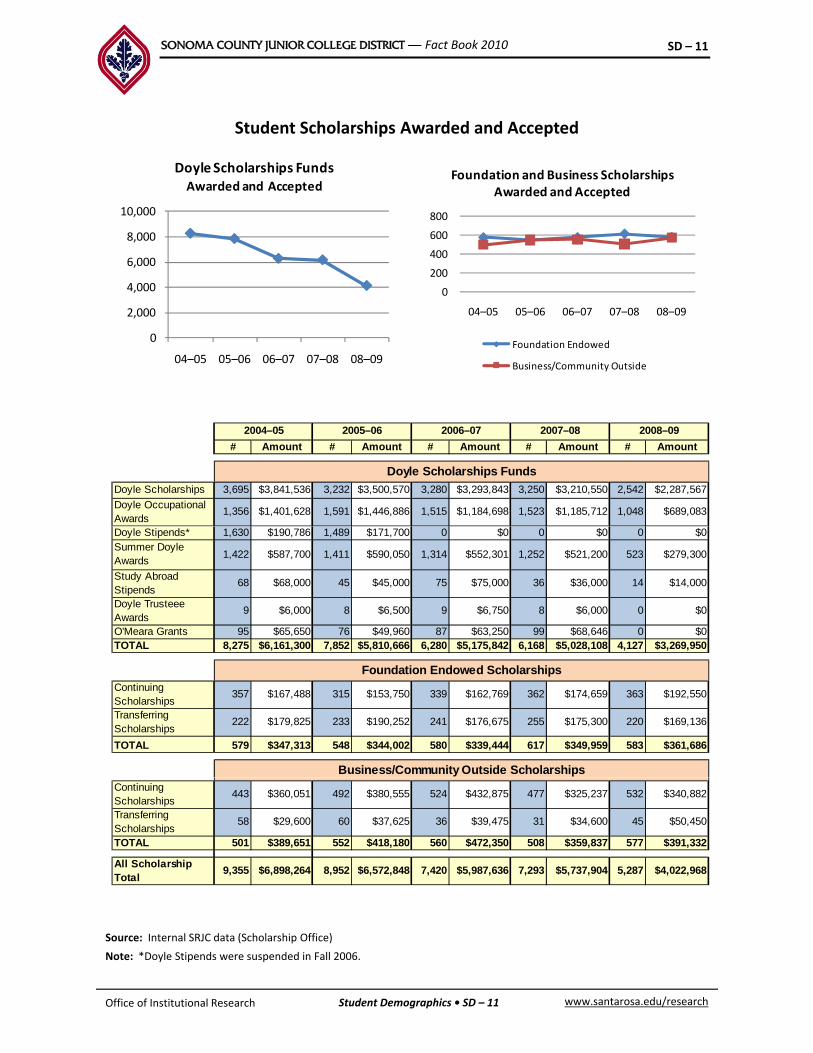
SONOMA COUNTY JUNIOR COLLEGE DISTRICT — Fact Book 2010 SD – 11
Student Scholarships Awarded and Accepted
6,000
8,000
10,000
Doyle Scholarships FundsAwarded and Accepted
200
400
600
800
Foundation and Business ScholarshipsAwarded and Accepted
0
2,000
4,000
04–05 05–06 06–07 07–08 08–09
0
200
04–05 05–06 06–07 07–08 08–09
Foundation Endowed
Business/Community Outside
# Amount # Amount # Amount # Amount # Amount
Doyle Scholarships 3,695 $3,841,536 3,232 $3,500,570 3,280 $3,293,843 3,250 $3,210,550 2,542 $2,287,567
Doyle Occupational Awards
1,356 $1,401,628 1,591 $1,446,886 1,515 $1,184,698 1,523 $1,185,712 1,048 $689,083
2004–05 2005–06 2006–07 2007–08 2008–09
Doyle Scholarships Funds
Doyle Stipends* 1,630 $190,786 1,489 $171,700 0 $0 0 $0 0 $0Summer Doyle Awards
1,422 $587,700 1,411 $590,050 1,314 $552,301 1,252 $521,200 523 $279,300
Study Abroad Stipends
68 $68,000 45 $45,000 75 $75,000 36 $36,000 14 $14,000
Doyle Trusteee Awards
9 $6,000 8 $6,500 9 $6,750 8 $6,000 0 $0
O'Meara Grants 95 $65,650 76 $49,960 87 $63,250 99 $68,646 0 $0TOTAL 8,275 $6,161,300 7,852 $5,810,666 6,280 $5,175,842 6,168 $5,028,108 4,127 $3,269,950
Continuing Scholarships
357 $167,488 315 $153,750 339 $162,769 362 $174,659 363 $192,550
Transferring Scholarships
222 $179,825 233 $190,252 241 $176,675 255 $175,300 220 $169,136
TOTAL 579 $347,313 548 $344,002 580 $339,444 617 $349,959 583 $361,686
Foundation Endowed Scholarships
Business/Community Outside ScholarshipsContinuing Scholarships
443 $360,051 492 $380,555 524 $432,875 477 $325,237 532 $340,882
Transferring Scholarships
58 $29,600 60 $37,625 36 $39,475 31 $34,600 45 $50,450
TOTAL 501 $389,651 552 $418,180 560 $472,350 508 $359,837 577 $391,332
All Scholarship Total
9,355 $6,898,264 8,952 $6,572,848 7,420 $5,987,636 7,293 $5,737,904 5,287 $4,022,968
www.santarosa.edu/researchOffice of Institutional Research Student Demographics • SD – 11
Source: Internal SRJC data (Scholarship Office)
Note: *Doyle Stipends were suspended in Fall 2006.

SONOMA COUNTY JUNIOR COLLEGE DISTRICT — Fact Book 2010 SD – 12
Student Scholarships Awarded and Accepted
Definition of Measure: The total number and amount of scholarships awarded and accepted by SRJC students over the past five years.
Source: Internal SRJC data (Scholarship Office)
Use(s) of Measure: This measure documents the change in scholarships awarded and accepted, including the Doyle Awards, which are exclusive to this District. This measure is an indicator of the strength of our scholarship program for providing access to SRJC.
Analysis: Over the past five years, the total number and amount of scholarships awarded and accepted peaked in 2004–05, at 9,355 and $6.9 million, respectively. In 2008–09 the total amount awarded was $4 million, down 42% from 2004–05. The number of Doyle Scholarships accepted was 4,127 in 2008–09 and is the majority of student scholarships awarded and accepted at SRJC. Foundation Endowed Scholarships increased while Business/Community Outside Scholarships decreased in 2007–08. In Spring 2009, Doyle Trust funds were suspended to Santa Rosa Junior College resulting in no available funds for new Doyle Scholarships for Fall 2009.
www.santarosa.edu/researchOffice of Institutional Research Student Demographics • SD – 12

SONOMA COUNTY JUNIOR COLLEGE DISTRICT — Fact Book 2010 SD – 13
Student Financial Aid Awards
3 000 000
3,500,000
4,000,000
4,500,000
State Financial Aid Distribution Based on Dollar Amount
2004–05 through 2008–09
$10,000,000
$12,000,000
Federal Financial Aid Distribution Based on Dollar Amount
2004–05 through 2008–09
0
500,000
1,000,000
1,500,000
2,000,000
2,500,000
3,000,000
04 05 05 06 06 07 07 08 08 09
$0
$2,000,000
$4,000,000
$6,000,000
$8,000,000
04–05 05–06 06–07 07–08 08–09
BOGG Waiver Cal Grant B
Cal Grant C EOPS/CARE
2008–092006–072005–062004–05 2007–08
04–05 05–06 06–07 07–08 08–09
Pell ACG SEOG
Chafee FWS BIA
Americorp Loan‐Subsidized Loan‐Unsubsidized
# Amount # Amount # Amount # Amount # Amount
Pell 1,903 $4,618,998 1,988 $4,746,415 1,876 $4,519,381 2,122 $5,410,049 2,405 $6,943,138ACG — — — — 14 $11,539 27 $19,975 54 $39,148SEOG 285 178,790 328 204,135 317 200,202 369 230,447 304 190,694Chafee — — 7 26,606 10 46,192 16 46,192 24 105,909FWS 156 341,542 129 298,054 135 354,412 128 342,444 126 329,820BIA 0 0 1 4,038 0 0 0 0 0 0Americorp 56 97 382 31 62 710 55 115 664 98 68 646 51 143 384
Federal
Americorp 56 97,382 31 62,710 55 115,664 98 68,646 51 143,384Loan–Subsidized 549 1,291,534 517 1,298,299 464 1,209,177 572 1,876,309 594 2,038,207Loan–Unsubsidized 271 669,783 260 753,650 259 783,806 280 827,550 391 1,475,524Total Federal 3,220 $7,198,029 3,261 $7,393,907 3,130 $7,240,373 3,612 $8,821,612 3,949 $11,265,824
Cal Grant B 345 $424,016 351 $433,876 442 $542,361 479 $589,352 471 $572,776Cal Grant C 102 46,296 118 50,616 160 70,272 165 69,516 151 62,496EOPS/CARE 365 119,973 391 157,881 354 149,689 303 117,418 511 144,512BOGG Waiver 7 973 3 333 364 8 164 3 448 005 8 049 3 003 540 7 671 2 501 008 9 329 2 937 841
State
BOGG Waiver 7,973 3,333,364 8,164 3,448,005 8,049 3,003,540 7,671 2,501,008 9,329 2,937,841Total State 8,785 $3,923,649 9,024 $4,090,378 9,005 $3,765,862 8,618 $3,277,294 10,462 $3,717,625
Total State and Federal
12,005 11,121,678$ 12,285 11,484,285$ 12,135 $11,006,235 12,230 $12,098,906 14,411 $14,983,449
www.santarosa.edu/researchOffice of Institutional Research Student Demographics • SD – 13
Source: Financial Aid Office (MIS and FISAP reports; SAFERS)
SONOMA COUNTY JUNIOR COLLEGE DISTRICT — Fact Book 2010 SD – 14
Student Financial Aid Awards
Definition of Measure: The amount of state and federal financial aid distributed to SRJC students over the past five years.
Source: Internal SRJC data (Financial Aid Office)
Use(s) of Measure: This measure shows the amount and type of federal and state financial aid distributed to SRJC students and is an indicator of student financial need and available aid.
Analysis: Federal and state financial aid distributed to SRJC students in the 2008–09 academic year totaled over $14 million, an increase of 35% since 2004–05. In the past three years, there have been two additions to the federal financial awards: the Chafee Grant in 2005–06; and Academic Competiveness Grant (ACG), in 2006–07. During the past year, both the total number of financial aid awards and the total dollar amount increased, from both state and federal sources. The BOGG Waiver was almost $3 million, up from 2007–08.
For more information:For more information:
http://www.santarosa.edu/app/paying‐for‐college/financial_aid_office/
www.santarosa.edu/researchOffice of Institutional Research Student Demographics • SD – 14
SONOMA COUNTY JUNIOR COLLEGE DISTRICT — Fact Book 2010 SD – 15
Student BOGG Fee Waivers Awarded
Definition of Measure: The Board of Governors’ Grant (BOGG) waives the enrollment fees for eligible low‐income students who submit an application. While the eligibility income levels vary from year to year, they are generally set at or near the federal poverty line.
Accessibility: SRJC has converted to a new Student Information System (SIS). Many reports from the Information Technology Department are now being updated and combined to minimize duplication and increase efficiency. While this conversion is in process, Fact Book users are being directed to the California Community College Chancellor’s Office Data Mart website to gain access to the District’s MIS* data. This measure can be accessed in previous Fact Books at: www.santarosa.edu/research.
Below are the instructions to access the specific data for this report.
California Community Colleges Chancellor’s Office Data Mart Student Financial Aid for College/Statewide file:https://misweb.cccco.edu/mis/onlinestat/sfawards.cfm
To get SRJC data:Select “Santa Rosa” under College;Select Year needed (only one year can be selected);Select “Board of Governors Enrollment Fee Waiver” under Financial Aid Type;If d d l t th ifi d hi d C l 1 H diIf needed, select the specific demographic under Column 1 Heading;Click “Get Report” button
To get Statewide data:Select “Statewide” under College;Select Year needed (only one year can be selected);Select “Board of Governors Enrollment Fee Waiver” under Financial Aid Type;Aid Type;Click “Get Report” button
To download data, click on the “Download” hyperlink on the results page.
*Limitations to MIS dataData does not include credit students enrolled full term courses earning less than .50 units and credit and noncredit students enrolled in short term courses with 8 or less hours of
dattendance.
www.santarosa.edu/researchOffice of Institutional Research Student Demographics • SD – 15
SONOMA COUNTY JUNIOR COLLEGE DISTRICT — Fact Book 2010 ED – 1
Employee Demographics
Introduction
This section of the Fact Book presents information on District employees by age, gender, ethnicity, d j b t It l i l d i d t C lif i C it C ll i l diand job category. It also includes comparison data on California Community Colleges, including
statewide totals when figures are available.
Based on internal data from SRJC Human Resources, the largest proportion of District employees by headcount is faculty, who comprise 49% of the SRJC workforce (10% tenured and 39% adjunct). Classified staff make up 14% of district employees, temporary staff make up 18%, and student workers another 17%. Managers comprise 3% of District employees.
SRJC employee headcount decreased from Fall 2008 to Fall 2009 In Fall 2009 the DistrictSRJC employee headcount decreased from Fall 2008 to Fall 2009. In Fall 2009, the District employed 1,680 faculty, classified staff, and administrators, not including temporary classified staff and student workers. SRJC’s Full Time Equivalent (FTE) total decreased from Fall 2008 to Fall 2009 as well. FTE calculations are based on MIS figures which include only academic temporary (adjunct) and permanent staff. Among adjunct and permanent staff, faculty comprise 56% of the District FTE total (29% tenured and 27.4% adjunct), classified comprise 40.5%, and administrators 3%.
The average age of District employees continues to rise. In Fall 2009, the average age of Educational Administrators was 56.8, while the average age of Tenure/Tenure Track faculty was 52.4, and Classified Support was 49.3. The statewide average age is lower for all employee classifications: 53.3 for Educational Administrators; 50.8 for Tenured/Tenure Track faculty; and 46.7 for Classified Support. There has been a significant number of retirements from the faculty, staff, and administrative ranks of Santa Rosa Junior College recently and this trend is likely to continue.
While SRJC employees are still predominantly White, that percentage decreased from 86.5% in 2005 to 84.1% in 2009 among permanent employees. Women comprise 59.4% of District % g p p y p %employees, compared to the statewide proportion of 55%. The statewide proportion of women employees has risen since 2005, while the District proportion peaked in 2008.
www.santarosa.edu/researchOffice of Institutional Research Employee Demographics • ED – 1
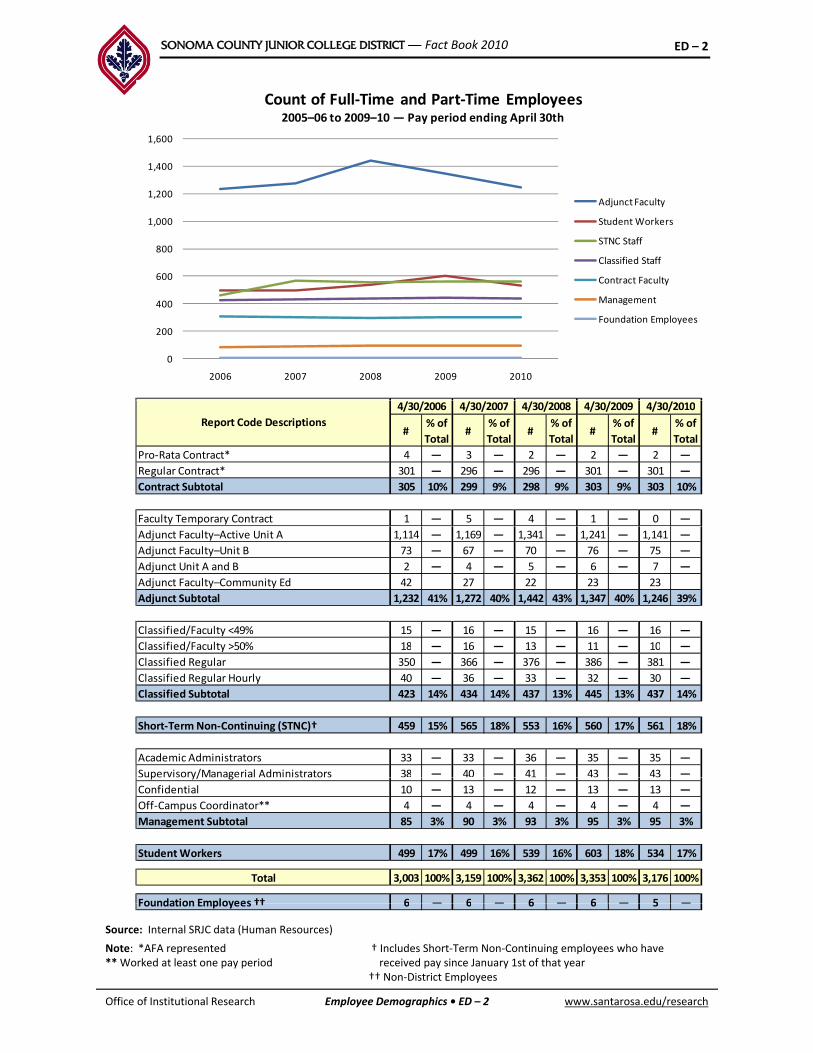
SONOMA COUNTY JUNIOR COLLEGE DISTRICT — Fact Book 2010 ED – 2
1,600
Count of Full‐Time and Part‐Time Employees2005–06 to 2009–10 — Pay period ending April 30th
600
800
1,000
1,200
1,400
Adjunct Faculty
Student Workers
STNC Staff
Classified Staff
0
200
400
600
2006 2007 2008 2009 2010
Contract Faculty
Management
Foundation Employees
#% of
Total#
% of
Total#
% of
Total#
% of
Total#
% of
Total
Pro‐Rata Contract* 4 — 3 — 2 — 2 — 2 —
Regular Contract* 301 — 296 — 296 — 301 — 301 —
Contract Subtotal 305 10% 299 9% 298 9% 303 9% 303 10%
Faculty Temporary Contract 1 — 5 — 4 — 1 — 0 —
4/30/2010
Report Code Descriptions
4/30/2006 4/30/2007 4/30/2008 4/30/2009
Adjunct Faculty–Active Unit A 1,114 — 1,169 — 1,341 — 1,241 — 1,141 —
Adjunct Faculty–Unit B 73 — 67 — 70 — 76 — 75 —
Adjunct Unit A and B 2 — 4 — 5 — 6 — 7 —
Adjunct Faculty–Community Ed 42 27 22 23 23
Adjunct Subtotal 1,232 41% 1,272 40% 1,442 43% 1,347 40% 1,246 39%
Classified/Faculty <49% 15 — 16 — 15 — 16 — 16 —
Classified/Faculty >50% 18 — 16 — 13 — 11 — 10 —
Classified Regular 350 — 366 — 376 — 386 — 381 —
Classified Regular Hourly 40 — 36 — 33 — 32 — 30 —
Classified Subtotal 423 14% 434 14% 437 13% 445 13% 437 14%
Short‐Term Non‐Continuing (STNC)† 459 15% 565 18% 553 16% 560 17% 561 18%
Academic Administrators 33 — 33 — 36 — 35 — 35 —
Supervisory/Managerial Administrators 38 — 40 — 41 — 43 — 43 — p y/ g
Confidential 10 — 13 — 12 — 13 — 13 —
Off‐Campus Coordinator** 4 — 4 — 4 — 4 — 4 —
Management Subtotal 85 3% 90 3% 93 3% 95 3% 95 3%
Student Workers 499 17% 499 16% 539 16% 603 18% 534 17%
Total 3,003 100% 3,159 100% 3,362 100% 3,353 100% 3,176 100%
Foundation Employees †† 6 — 6 — 6 — 6 — 5 —
www.santarosa.edu/researchOffice of Institutional Research Employee Demographics • ED – 2
Source: Internal SRJC data (Human Resources)
Note: *AFA represented † Includes Short‐Term Non‐Continuing employees who have ** Worked at least one pay period received pay since January 1st of that year
†† Non‐District Employees
Foundation Employees †† 6 — 6 — 6 — 6 — 5 —

SONOMA COUNTY JUNIOR COLLEGE DISTRICT — Fact Book 2010 ED – 3
Full‐Time and Part‐Time Employee Count
Definition of Measure: The unduplicated headcount of full‐time, part‐time, permanent and non‐continuing employees, based on SRJC Human Resources report code definitions on all paid employees from 2006 to 2010.
Note: Figures are for the pay period ending April 30th – the last full month of pay before the end of the Spring semester.
Source: Internal SRJC data (Human Resources)( )
Use(s) of Measure: This measure compares Spring semester employee headcount trends by job function over time.
Analysis: Altogether, the District employed 3,176 managers, faculty, adjunct faculty, classified, short‐term non‐continuing (STNC), and student workers in Spring 2010. This is a decrease from Spring 2009. The number of adjunct faculty and student workers decreased, while comparatively, classified, management, STNC’s and foundation employees remained stable.
www.santarosa.edu/researchOffice of Institutional Research Employee Demographics • ED – 3

SONOMA COUNTY JUNIOR COLLEGE DISTRICT — Fact Book 2010 ED – 4
District Employee Headcount and FTE DistributionFall 2005 – Fall 2009
20%
40%
60%
80%
100%
Fall 2005 Fall 2009
Educational Administrator
Tenured/Tenure Track
Academic Temporary
0%
20%
Headcount
FTE
Headcount
FTE
Headcount
FTE
Headcount
FTE
Headcount
FTE
Fall 2005 Fall 2006 Fall 2007 Fall 2008 Fall 2009
Academic Temporary
Classified Administrator
Classified Professional
Classified Support
JC State JC State JC State JC State JC State
# 33 1,924 33 1,965 36 2,059 33 2,043 32 2,086
Fall 2008Fall 2005
Educational Administrator
Fall 2009
Employee Headcount — State and District
Fall 2006 Fall 2007
% 1.8% 2.2% 1.8% 2.2% 1.9% 2.3% 1.8% 2.2% 1.9% 2.3%
# 306 17,569 303 18,196 299 17,840 304 18,157 299 18,467
% 17.1% 20.3% 16.8% 20.3% 15.9% 19.6% 16.2% 19.4% 17.8% 20.1%
# 983 40,029 1,016 41,624 1,087 42,949 1,077 45,156 881 42,733
% 55.1% 46.2% 56.4% 46.5% 57.8% 47.3% 57.3% 48.2% 52.4% 46.5%
# 7 1,404 8 1,470 9 1,425 7 1,281 8 1,606
% 0.4% 1.6% 0.4% 1.6% 0.5% 1.6% 0.4% 1.4% 0.5% 1.7%
Educational Administrator
Tenured/Tenure Track
Academic Temporary
Classified Administrator
# 72 1,812 67 1,817 67 2,062 69 2,129 67 2,179
% 4.0% 2.1% 3.7% 2.0% 3.6% 2.3% 3.7% 2.3% 4.0% 2.4%
# 384 23,883 373 24,425 382 24,454 388 24,996 393 24,792
% 21.5% 27.6% 20.7% 27.3% 20.3% 26.9% 20.7% 26.7% 23.4% 27.0%
# 1,785 86,621 1,800 89,497 1,880 90,789 1,878 93,762 1,680 91,863
% 100% 100% 100% 100% 100% 100% 100% 100% 100% 100%Total Headcount
Classified Professional
Classified Support
www.santarosa.edu/researchOffice of Institutional Research Employee Demographics • ED – 4

SONOMA COUNTY JUNIOR COLLEGE DISTRICT — Fact Book 2010 ED – 5
Fall 2009
FTE Distribution — State and District
Fall 2008Fall 2005 Fall 2006 Fall 2007
JC State JC State JC State JC State JC State
# 33 1,952 33 1,990 36 2,066 34 2,066 32 2,103
% 3.0% 3.2% 2.9% 3.1% 3.1% 3.2% 2.9% 3.1% 3.1% 3.2%
# 336 19,338 337 20,403 322 19,723 333 20,771 306 20,677
% 29.8% 31.3% 29.2% 31.8% 27.9% 30.7% 28.3% 31.1% 29.0% 31.3%
# 331 14,903 364 15,623 355 16,149 375 17,110 289 16,236
% 29.4% 24.1% 31.6% 24.4% 30.8% 25.2% 31.9% 25.6% 27.4% 24.6%
Educational Administrator
Tenured/ Tenure Track
Academic Temporary
# 7 1,406 8 1,473 9 1,432 7 1,292 8 1,615
% 0.6% 2.3% 0.7% 2.3% 0.8% 2.2% 0.6% 1.9% 0.7% 2.4%
# 52 1,716 52 1,741 52 1,964 54 2,079 54 2,116
% 4.6% 2.8% 4.5% 2.7% 4.5% 3.1% 4.6% 3.1% 5.1% 3.2%
# 366 22,448 358 22,921 370 22,827 372 23,571 367 23,338
% 32.5% 36.3% 31.1% 35.7% 32.1% 35.6% 31.7% 35.2% 34.7% 35.3%
# 1,125 61,763 1,152 64,151 1,155 64,161 1,175 66,889 1,056 66,085
Classified Administrator
Classified Professional
Classified Support
Total FTE
Employee Headcount and FTE Distribution
Source: California Community Colleges Chancellor’s Office Data Mart (MIS data).
Note: FTE = Full‐Time Equivalent
% 100% 100% 100% 100% 100% 100% 100% 100% 100% 100%Total FTE
Definition of Measure: The unduplicated headcount of administrators, faculty and classified staff and the distribution of full‐time equivalency by employee classification as of First Census, Fall Semesters 2005 through 2009 at SRJC and statewide for reporting community colleges. This measure does not include Short‐Term Non‐Continuing (STNC) employees, student workers, or Community Education instructors as those data are not available from this source.
Source: California Community Colleges Chancellor’s Office Data Mart (MIS data)
Comparison Group: California Community Colleges Statewide
Use(s) of Measure: This measure compares Fall employee headcount and FTE by employee classification at SRJC and compares SRJC employees with their counterparts statewide.
Analysis: In Fall 2009, the Sonoma County Junior College District employed 1,680 administrators, faculty, and classified staff, for a total full‐time equivalent of 1,056 employees.
Compared with statewide employee headcount averages in Fall 2098, SRJC has a higher percentage of Academic Temporary and Classified Professional and a lower percentage of all other employeeof Academic Temporary and Classified Professional and a lower percentage of all other employee classifications.
With regard to full‐time equivalent status, SRJC’s Academic Temporary and Classified Professional average higher percentage points than the State, while District Classified Administrators and Classified Support average a few percentage points lower. The largest single employee group in the district as measured by FTE is Classified Support, who comprise 34.7% of the District’s FTE for employees.
www.santarosa.edu/researchOffice of Institutional Research Employee Demographics • ED – 5
For additional information: Visit the Chancellor’s Office Data Mart at http://www.cccco.edu/SystemOffice/Divisions/TechResearchInfo/MIS/DataMartandReports/tabid/282/Default.aspx

SONOMA COUNTY JUNIOR COLLEGE DISTRICT — Fact Book 2010 ED – 6
Employees by Average Age and Employment Classification
50
52
54
56
58
Fall 2005 – Fall 2009
Fall 2005
Employees by Age — District and State
44
46
48 Fall 2006
Fall 2007
Fall 2008
Fall 2009
Employees by Age — District and State
SCJCD State SCJCD State SCJCD State SCJCD State SCJCD State
# 122 7,323 120 12,189 134 12,942 141 13,538 126 12,512
% 6.8% 8.5% 6.7% 13.6% 7.1% 14.3% 7.5% 14.4% 7.5% 13.6%
Fall 2005 Fall 2006 Fall 2007 Fall 2009Fall 2008
< 35% 6.8% 8.5% 6.7% 13.6% 7.1% 14.3% 7.5% 14.4% 7.5% 13.6%
# 323 15,735 300 20,556 308 19,716 296 20,188 266 19,445
% 18.1% 18.2% 16.6% 23.0% 16.4% 21.7% 15.8% 21.5% 15.8% 21.2%
# 577 28,200 579 26,514 585 26,430 562 26,428 489 25,780
% 32.3% 32.6% 32.2% 29.6% 31.1% 29.1% 29.9% 28.2% 29.1% 28.1%
# 622 31,352 642 23,562 692 24,521 688 25,528 618 25,882
% 34.8% 36.2% 35.7% 26.3% 36.8% 27.0% 36.6% 27.2% 36.8% 28.2%
# 141 3,627 159 6,327 161 6,837 191 7,738 181 8,242
35–44
45–54
55–64
65+
Employees by Classification —District and State
% 7.9% 4.2% 8.8% 7.1% 8.6% 7.5% 10.2% 8.3% 10.8% 9.0%
# 0 383 0 350 0 343 0 342 0 2
% 0% 0.4% 0% 0.4% 0% 0.4% 0% 0.4% 0% 0.0%
# 1,785 86,620 1,800 89,497 1,880 90,789 1,878 93,762 1,680 91,863
% 100% 100% 100% 100% 100% 100% 100% 100% 100% 100%
65+
Unknown
Total
State State State State State
# % % # % % # % % # % % # % %
< 35 0 0% 2.9% 0 0% 3.0% 0 0% 3.2% 0 0% 3.4% 1 3.1% 3.3%
35–44 2 6.1% 13.3% 1 3% 14.5% 3 8.3% 15.6% 1 3.0% 14.8% 1 3.1% 15.0%
45–54 11 33.4% 32.1% 11 33.3% 30.9% 8 22.2% 31.3% 8 24.3% 30.9% 6 18.8% 30.1%
Educational Administrators
Fall 2005 Fall 2006 Fall 2007 Fall 2008 Fall 2009
SCJCD SCJCD SCJCD SCJCD SCJCD
www.santarosa.edu/researchOffice of Institutional Research Employee Demographics • ED – 6
55–64 20 60.6% 46.9% 21 63.6% 46.4% 25 69.4% 44.8% 23 69.7% 44.5% 22 68.8% 44.6%
65+ 0 0% 4.4% 0 0% 4.8% 0 0% 4.7% 1 3.0% 6.0% 2 6.3% 7.0%
Unknown 0 0% 0.4% 0 0% 0.4% 0 0% 0.3% 0 0% 0.3% 0 0% 0%
Total 33 100% 100% 33 100% 100% 36 100% 100% 33 100% 100% 32 100% 100%
Avg. Age 55.0 — 53.0 55.6 — 53.0 56.0 — 52.8 56.6 — 53.0 56.8 — 53.3

SONOMA COUNTY JUNIOR COLLEGE DISTRICT — Fact Book 2010 ED – 7
Employees by Classification —District and State continued
State State State State State
# % % # % % # % % # % % # % %
SCJCD SCJCD SCJCD SCJCD SCJCD
Fall 2005 Fall 2006 Fall 2007 Fall 2008 Fall 2009
# % % # % % # % % # % % # % %
< 35 15 4.9% 6.9% 17 5.7% 6.7% 17 5.7% 7.0% 22 7.4% 6.7% 21 7.0% 6.3%
35–44 47 15.4% 21.2% 44 14.5% 22.4% 40 13.4% 22.0% 40 13.1% 21.9% 42 14.1% 21.9%
45–54 102 34.3% 32.4% 99 32.7% 31.1% 99 33.1% 30.5% 89 29.3% 29.8% 80 26.7% 29.3%
55–64 131 42.8% 33.5% 133 43.9% 33.7% 129 43.1% 33.8% 135 44.4% 34.2% 133 44.5% 34.8%
65+ 11 3.6% 5.2% 10 3.3% 5.6% 14 4.7% 6.2% 18 5.9% 6.9% 23 7.7% 7.9%
Unknown 0 0% 0.7% 0 0% 0.6% 0 0% 0.6% 0 0% 0.6% 0 0% 0%
Tenured/Tenure Track
Unknown 0 0% 0.7% 0 0% 0.6% 0 0% 0.6% 0 0% 0.6% 0 0% 0%
Total 306 100% 100% 303 100% 100% 299 100% 100% 304 100% 100% 299 100% 100%
Avg. Age 52.1 — 50.4 52.0 — 50.4 52.4 — 50.6 52.4 — 50.8 52.5 — 51.2
< 35 56 5.7% 14.6% 54 5.3% 14.2% 66 6.1% 14.9% 64 5.9% 15.1% 52 5.9% 14.3%
35–44 180 18.3% 21.4% 172 16.9% 22.9% 182 16.7% 21.4% 180 16.7% 21.4% 146 16.6% 21.0%
45–54 300 30.5% 28.3% 306 30.1% 26.9% 312 28.7% 26.5% 296 27.5% 25.5% 234 26.6% 25.1%
55–64 338 34.4% 25.4% 354 34.8% 25.1% 403 37.1% 25.9% 387 35.9% 25.9% 318 36.1% 26.8%
Academic Temporary
65+ 108 11.0% 9.6% 130 12.8% 10.4% 124 11.4% 10.9% 150 13.9% 11.7% 131 14.9% 12.8%
Unknown 0 0% 0.8% 0 0% 0.4% 0 0% 0.4% 0 0% 0.4% 0 0% 0.0%
Total 983 100% 100% 1,016 100% 100% 1,087 100% 100% 1,077 100% 100% 881 100% 100%
Avg. Age 52.4 — 49.0 52.9 — 49.0 52.7 — 49.3 53.2 — 49.4 53.7 — 50.0
< 35 0 0% 5.9% 1 14.3% 6.4% 1 11.1% 7.1% 1 14.3% 7.7% 0 0% 6.7%
35–44 1 12.5% 21.1% 1 14.3% 20.7% 1 11.1% 19.8% 1 14.3% 20.5% 2 25.0% 20.5%
Classified Administrator
45–54 2 25.0% 43.8% 2 28.6% 42.1% 2 22.2% 40.0% 2 28.6% 37.5% 2 25.0% 37.8%
55–64 3 37.5% 26.3% 3 42.9% 28.3% 3 33.3% 30.2% 2 28.6% 30.8% 3 37.5% 31.7%
65+ 2 25.0% 2.2% 0 0% 2.0% 2 22.2% 2.5% 1 14.3% 2.8% 1 12.5% 3.0%
Unknown 0 0% 0.6% 0 0% 0.5% 0 0% 0.5% 0 0% 0.7% 0 0% 0.1%
Total 8 100% 100% 7 100% 100% 9 100% 100% 7 100% 100% 8 100% 100%
Avg. Age 50.4 — 49.2 49.1 — 49.3 52.6 — 49.7 50.3 — 49.6 51.9 — 49.9
< 35 9 12 5% 17 9% 6 8 3% 15 8% 4 6 0% 17 6% 6 8 7% 18 1% 5 7 5% 17 3%
Classified Professional
< 35 9 12.5% 17.9% 6 8.3% 15.8% 4 6.0% 17.6% 6 8.7% 18.1% 5 7.5% 17.3%
35–44 10 13.9% 25.0% 13 18.1% 26.0% 9 13.4% 24.4% 8 11.6% 25.0% 8 11.9% 24.4%
45–54 30 41.7% 33.8% 29 40.3% 33.5% 30 44.8% 31.5% 28 40.6% 30.1% 26 38.8% 29.9%
55–64 17 23.6% 20.7% 18 25.0% 21.7% 17 25.4% 22.9% 20 29.0% 23.2% 21 31.3% 24.9%
65+ 6 8.3% 2.2% 6 8.3% 2.6% 7 10.4% 3.2% 7 10.1% 3.2% 7 10.4% 3.6%
Unknown 0 0% 0% 0 0% 0.5% 0 0% 0.3% 0 0% 0.3% 0 0% 0.0%
Total 72 100% 100% 72 100% 100% 67 100% 100% 69 100% 100% 67 100% 100%
Avg. Age 50.1 — 45.7 50.6 — 46.2 51.6 — 46.4 51.5 — 46.3 52.0 — 46.7
< 35 42 11.0% 19.2% 44 11.5% 18.9% 46 12.0% 19.5% 48 12.4% 19.8% 47 12.0% 18.9%
35–44 79 20.6% 23.8% 80 20.8% 23.7% 73 19.1% 22.5% 66 17.0% 21.8% 67 17.0% 21.2%
45–54 147 38.4% 33.5% 133 34.7% 32.8% 134 35.1% 31.7% 139 35.8% 31.0% 141 35.9% 31.3%
55–64 97 25.3% 20.1% 111 29.0% 20.9% 115 30.1% 22.7% 121 31.2% 23.3% 121 30.8% 24.3%
65+ 18 4.7% 3.1% 16 4.2% 3.3% 14 3.7% 3.5% 14 3.6% 3.9% 17 4.3% 4.2%
Unknown 0 0% 0.3% 0 0% 0.3% 0 0% 0.2% 0 0% 0.3% 0 0% 0.0%
Total 383 100% 100% 384 100% 100% 382 100% 100% 388 100% 100% 393 100% 100%
Classified Support
www.santarosa.edu/researchOffice of Institutional Research Employee Demographics • ED – 7
Source: California Community Colleges Chancellor’s Office Data Mart (MIS data).
Note: Employee age is calculated from MIS data element (EB02) Employee‐Birth‐Data as reported by the district.
Avg. Age 48.6 — 45.7 48.6 — 45.8 49.2 — 46.1 49.2 — 46.2 49.3 — 46.7
SONOMA COUNTY JUNIOR COLLEGE DISTRICT — Fact Book 2010 ED – 8
Employees by Age and Employment Classification
D fi iti f M H d t f d i i t t f lt d l ifi d t ff b dDefinition of Measure: Headcount for administrators, faculty and classified staff by age and classification compared to statewide data as of First Census Fall Semester 2005–2009. This measure does not include STNCs, student workers, and Community Education instructors as those data are not available from this source.
Source: California Community Colleges Chancellor’s Office Data Mart (MIS data)
Comparison Group: California Community Colleges Statewide
Use(s) of Measure: This measure compares employees by age and proportionate age groups forUse(s) of Measure: This measure compares employees by age and proportionate age groups for human resource planning.
Analysis: A number of SRJC administrators, faculty and classified staff are retiring or nearing retirement age, with 77% in the age range of 45 years or over. The average age of all classifications changed slightly over the past year, with the Educational Administrators average age the highest at 57 years.
The average age for all SRJC employee classifications continues to be higher than the corresponding state average.
For additional information:
Chancellor’s Office Data Mart: http://www.cccco.edu/SystemOffice/Divisions/TechResearchInfo/MIS/DataMartandReports/tabid/282/Default.aspx
www.santarosa.edu/researchOffice of Institutional Research Employee Demographics • ED – 8
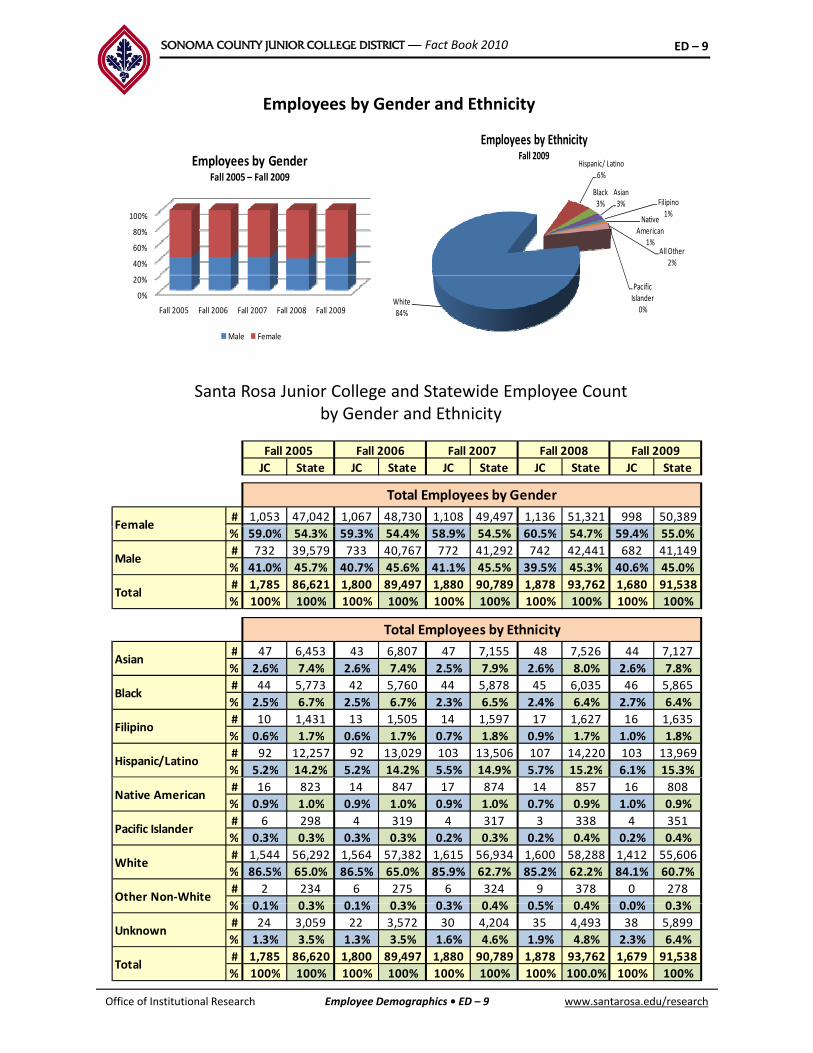
SONOMA COUNTY JUNIOR COLLEGE DISTRICT — Fact Book 2010 ED – 9
Employees by Gender and Ethnicity
Employees by Ethnicity
40%
60%
80%
100%
Employees by GenderFall 2005 – Fall 2009
Hispanic/ Latino6%
Black3%
Asian3% Filipino
1%Native
American1%
All Other2%
Fall 2009
Santa Rosa Junior College and Statewide Employee Count
0%
20%
Fall 2005 Fall 2006 Fall 2007 Fall 2008 Fall 2009
Male Female
White 84%
Pacific Islander
0%
by Gender and Ethnicity
JC State JC State JC State JC State JC State
# 1,053 47,042 1,067 48,730 1,108 49,497 1,136 51,321 998 50,389
Fall 2009
Total Employees by Gender
Fall 2007 Fall 2008Fall 2005 Fall 2006
Female% 59.0% 54.3% 59.3% 54.4% 58.9% 54.5% 60.5% 54.7% 59.4% 55.0%
# 732 39,579 733 40,767 772 41,292 742 42,441 682 41,149
% 41.0% 45.7% 40.7% 45.6% 41.1% 45.5% 39.5% 45.3% 40.6% 45.0%
# 1,785 86,621 1,800 89,497 1,880 90,789 1,878 93,762 1,680 91,538
% 100% 100% 100% 100% 100% 100% 100% 100% 100% 100%
# 47 6 453 43 6 807 47 7 155 48 7 526 44 7 127
Female
Male
Total
Total Employees by Ethnicity
# 47 6,453 43 6,807 47 7,155 48 7,526 44 7,127
% 2.6% 7.4% 2.6% 7.4% 2.5% 7.9% 2.6% 8.0% 2.6% 7.8%
# 44 5,773 42 5,760 44 5,878 45 6,035 46 5,865
% 2.5% 6.7% 2.5% 6.7% 2.3% 6.5% 2.4% 6.4% 2.7% 6.4%
# 10 1,431 13 1,505 14 1,597 17 1,627 16 1,635
% 0.6% 1.7% 0.6% 1.7% 0.7% 1.8% 0.9% 1.7% 1.0% 1.8%
# 92 12,257 92 13,029 103 13,506 107 14,220 103 13,969
% 5.2% 14.2% 5.2% 14.2% 5.5% 14.9% 5.7% 15.2% 6.1% 15.3%Hispanic/Latino
Filipino
Asian
Black
# 16 823 14 847 17 874 14 857 16 808
% 0.9% 1.0% 0.9% 1.0% 0.9% 1.0% 0.7% 0.9% 1.0% 0.9%
# 6 298 4 319 4 317 3 338 4 351
% 0.3% 0.3% 0.3% 0.3% 0.2% 0.3% 0.2% 0.4% 0.2% 0.4%
# 1,544 56,292 1,564 57,382 1,615 56,934 1,600 58,288 1,412 55,606
% 86.5% 65.0% 86.5% 65.0% 85.9% 62.7% 85.2% 62.2% 84.1% 60.7%
# 2 234 6 275 6 324 9 378 0 278
% 0 1% 0 3% 0 1% 0 3% 0 3% 0 4% 0 5% 0 4% 0 0% 0 3%
Native American
Pacific Islander
White
Other Non‐White
www.santarosa.edu/researchOffice of Institutional Research Employee Demographics • ED – 9
% 0.1% 0.3% 0.1% 0.3% 0.3% 0.4% 0.5% 0.4% 0.0% 0.3%
# 24 3,059 22 3,572 30 4,204 35 4,493 38 5,899
% 1.3% 3.5% 1.3% 3.5% 1.6% 4.6% 1.9% 4.8% 2.3% 6.4%
# 1,785 86,620 1,800 89,497 1,880 90,789 1,878 93,762 1,679 91,538
% 100% 100% 100% 100% 100% 100% 100% 100.0% 100% 100%
Unknown
Total

SONOMA COUNTY JUNIOR COLLEGE DISTRICT — Fact Book 2010 ED – 10
Santa Rosa Junior College and Statewide Employee Count by Gender and Ethnicity ContinuedGender and Ethnicity Continued
State State State State State
# % % # % % # % % # % % # % %
Female 12 36.4% 49.8% 13 39.4% 49.8% 16 44.4% 51.0% 15 45.5% 50.8% 15 46.9% 51.9%
Male 21 63.6% 50.2% 20 60.6% 50.2% 20 55.6% 49.0% 18 54.5% 49.2% 17 53.1% 48.1%
SCJCD
Fall 2006 Fall 2009
SCJCD
Educational Administrator
SCJCD
Fall 2007 Fall 2008
SCJCD SCJCD
Fall 2005
Total 33 100% 100% 33 100% 100% 36 100% 100% 33 100% 100% 32 100% 100%
Asian 3 9.1% 5.7% 3 9.1% 5.6% 3 8.3% 5.9% 3 9.1% 6.2% 3 9.4% 6.0%
Black 0 0% 10.4% 1 3.0% 9.9% 1 2.8% 9.9% 1 3.0% 10.0% 1 3.1% 10.6%
Filipino 0 0% 1.3% 0 0% 1.4% 0 0% 1.6% 0 0% 1.8% 0 0% 1.6%
Hispanic/Latino 3 9.1% 14.9% 3 9.1% 15.5% 2 5.6% 16.0% 2 6.1% 15.1% 1 3.1% 14.7%
Native American 0 0% 1.0% 0 0% 1.2% 0 0% 1.0% 0 0% 0.9% 0 0% 0.7%
Pacific Islander 0 0% 0.4% 0 0% 0.4% 0 0% 0.3% 0 0% 0.3% 0 0% 0.2%
White 27 81.8% 63.0% 26 78.8% 62.7% 30 83.3% 60.4% 27 81.8% 60.3% 27 84.4% 60.0%
Unknown 0 0% 3.0% 0 0% 3.2% 0 0% 4.6% 0 0% 4.9% 0 0.0% 5.7%
Other Non‐White 0 0% 0.3% 0 0% 0.2% 0 0% 0.3% 0 0% 0.3% 0 0.0% 0.4%
Total 33 100% 100% 33 100% 100% 36 100% 100% 33 100% 100% 32 100% 100%
Female 171 55.9% 51.7% 175 58.5% 51.7% 174 58.2% 52.5% 178 59.5% 52.9% 171 57.2% 53.3%
Male 135 44.1% 48.3% 128 42.8% 48.3% 125 41.8% 47.5% 126 42.1% 47.1% 128 42.8% 46.7%
Total 306 100% 100% 303 100% 100% 299 100% 100% 304 100% 100% 299 100% 100%
Asian 10 3 3% 7 1% 8 2 6% 7 2% 9 3 0% 7 5% 9 3 0% 7 6% 10 3 3% 7 3%
Tenured/Tenure Track
Asian 10 3.3% 7.1% 8 2.6% 7.2% 9 3.0% 7.5% 9 3.0% 7.6% 10 3.3% 7.3%
Black 6 2.0% 6.2% 6 2.0% 6.2% 6 2.0% 6.0% 6 2.0% 6.1% 5 1.7% 6.2%
Filipino 1 0.3% 1.0% 2 0.7% 1.0% 2 0.7% 1.1% 2 0.7% 1.1% 2 0.7% 1.1%
Hispanic/Latino 16 5.2% 11.4% 18 5.9% 11.8% 18 6.0% 12.2% 20 6.6% 12.5% 20 6.7% 12.7%
Native American 5 1.6% 1.1% 5 1.7% 1.2% 5 1.7% 1.1% 5 1.6% 1.1% 5 1.7% 0.9%
Pacific Islander 0 0% 0.2% 0 0% 0.2% 0 0% 0.2% 0 0% 0.2% 0 0% 0.3%
White 265 86.6% 70.5% 259 85.5% 69.5% 253 84.6% 68.3% 256 84.2% 67.8% 251 83.9% 65.6%
Unknown 2 0.7% 2.3% 2 0.7% 2.8% 2 0.7% 3.3% 2 0.7% 3.4% 6 2.0% 5.5%
Other Non‐White 1 0.7% 0.2% 3 1.0% 0.3% 4 1.3% 0.4% 4 1.3% 0.4% 0 0.0% 0.5%
Total 306 100% 100% 303 100% 100% 299 100% 100% 304 100% 100% 299 100% 100%
Female 571 58.1% 50.7% 592 58.3% 50.7% 628 57.8% 50.9% 648 60.2% 51.5% 521 59.1% 51.5%
Male 412 41.9% 49.3% 424 41.7% 49.3% 459 42.2% 49.1% 429 39.8% 48.5% 360 40.9% 48.5%
Total 983 100% 100% 1,016 100% 100% 1,087 100% 100% 1,077 100% 100% 881 100% 100%
Asian 23 2.3% 6.9% 22 2.2% 7.0% 24 2.2% 7.3% 26 2.4% 7.5% 21 2.4% 7.1%
Black 10 1.0% 4.8% 7 0.7% 4.6% 7 0.6% 5.0% 7 0.7% 5.0% 6 0.7% 4.8%
Academic Temporary
Filipino 6 0.6% 1.0% 8 0.8% 1.1% 9 0.8% 1.1% 12 1.1% 1.2% 10 1.1% 1.3%
Hispanic/Latino 32 3.3% 9.5% 30 3.0% 9.9% 40 3.7% 10.2% 40 3.7% 10.5% 34 3.9% 10.4%
Native American 8 0.8% 0.8% 6 0.6% 0.8% 9 0.8% 0.8% 7 0.7% 0.8% 7 0.8% 0.8%
Pacific Islander 3 0.3% 0.3% 2 0.2% 0.3% 2 0.2% 0.3% 1 0.1% 0.3% 1 0.1% 0.3%
White 882 89.7% 71.8% 922 90.8% 70.8% 974 89.6% 69.2% 957 88.9% 68.5% 782 88.8% 66.7%
Unknown 18 1.8% 4.6% 16 1.6% 5.1% 20 2.0% 5.8% 23 2.1% 5.8% 20 2.3% 8.4%
Other Non‐White 1 0.1% 0.3% 3 0% 0.4% 1 0.1% 0.4% 4 0.4% 0.4% 0 0% 0.2%
Total 983 100% 100% 1,016 100% 100% 1,087 100% 100% 1,077 100% 100% 881 100% 100%
www.santarosa.edu/researchOffice of Institutional Research Employee Demographics • ED – 10
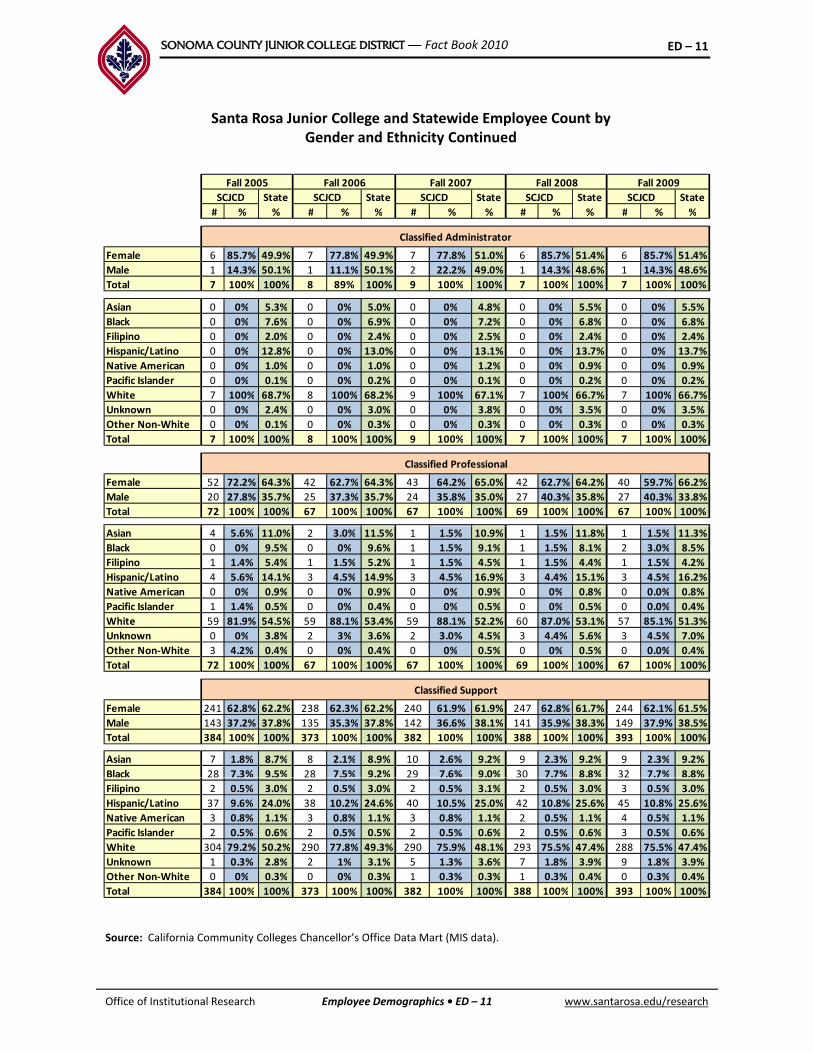
SONOMA COUNTY JUNIOR COLLEGE DISTRICT — Fact Book 2010 ED – 11
Santa Rosa Junior College and Statewide Employee Count by Gender and Ethnicity Continued
State State State State State
# % % # % % # % % # % % # % %
Female 6 85.7% 49.9% 7 77.8% 49.9% 7 77.8% 51.0% 6 85.7% 51.4% 6 85.7% 51.4%
Male 1 14.3% 50.1% 1 11.1% 50.1% 2 22.2% 49.0% 1 14.3% 48.6% 1 14.3% 48.6%
SCJCD
Fall 2005 Fall 2006
SCJCD SCJCD
Fall 2009
SCJCD
Classified Administrator
SCJCD
Fall 2007 Fall 2008
Total 7 100% 100% 8 89% 100% 9 100% 100% 7 100% 100% 7 100% 100%
Asian 0 0% 5.3% 0 0% 5.0% 0 0% 4.8% 0 0% 5.5% 0 0% 5.5%
Black 0 0% 7.6% 0 0% 6.9% 0 0% 7.2% 0 0% 6.8% 0 0% 6.8%
Filipino 0 0% 2.0% 0 0% 2.4% 0 0% 2.5% 0 0% 2.4% 0 0% 2.4%
Hispanic/Latino 0 0% 12.8% 0 0% 13.0% 0 0% 13.1% 0 0% 13.7% 0 0% 13.7%
Native American 0 0% 1.0% 0 0% 1.0% 0 0% 1.2% 0 0% 0.9% 0 0% 0.9%
Pacific Islander 0 0% 0.1% 0 0% 0.2% 0 0% 0.1% 0 0% 0.2% 0 0% 0.2%
White 7 100% 68.7% 8 100% 68.2% 9 100% 67.1% 7 100% 66.7% 7 100% 66.7%
Unknown 0 0% 2.4% 0 0% 3.0% 0 0% 3.8% 0 0% 3.5% 0 0% 3.5%
Other Non‐White 0 0% 0.1% 0 0% 0.3% 0 0% 0.3% 0 0% 0.3% 0 0% 0.3%
Total 7 100% 100% 8 100% 100% 9 100% 100% 7 100% 100% 7 100% 100%
Female 52 72.2% 64.3% 42 62.7% 64.3% 43 64.2% 65.0% 42 62.7% 64.2% 40 59.7% 66.2%
Male 20 27.8% 35.7% 25 37.3% 35.7% 24 35.8% 35.0% 27 40.3% 35.8% 27 40.3% 33.8%
Total 72 100% 100% 67 100% 100% 67 100% 100% 69 100% 100% 67 100% 100%
Classified Professional
Asian 4 5.6% 11.0% 2 3.0% 11.5% 1 1.5% 10.9% 1 1.5% 11.8% 1 1.5% 11.3%
Black 0 0% 9.5% 0 0% 9.6% 1 1.5% 9.1% 1 1.5% 8.1% 2 3.0% 8.5%
Filipino 1 1.4% 5.4% 1 1.5% 5.2% 1 1.5% 4.5% 1 1.5% 4.4% 1 1.5% 4.2%
Hispanic/Latino 4 5.6% 14.1% 3 4.5% 14.9% 3 4.5% 16.9% 3 4.4% 15.1% 3 4.5% 16.2%
Native American 0 0% 0.9% 0 0% 0.9% 0 0% 0.9% 0 0% 0.8% 0 0.0% 0.8%
Pacific Islander 1 1.4% 0.5% 0 0% 0.4% 0 0% 0.5% 0 0% 0.5% 0 0.0% 0.4%
White 59 81.9% 54.5% 59 88.1% 53.4% 59 88.1% 52.2% 60 87.0% 53.1% 57 85.1% 51.3%
Unknown 0 0% 3.8% 2 3% 3.6% 2 3.0% 4.5% 3 4.4% 5.6% 3 4.5% 7.0%
Other Non‐White 3 4 2% 0 4% 0 0% 0 4% 0 0% 0 5% 0 0% 0 5% 0 0 0% 0 4%Other Non White 3 4.2% 0.4% 0 0% 0.4% 0 0% 0.5% 0 0% 0.5% 0 0.0% 0.4%
Total 72 100% 100% 67 100% 100% 67 100% 100% 69 100% 100% 67 100% 100%
Female 241 62.8% 62.2% 238 62.3% 62.2% 240 61.9% 61.9% 247 62.8% 61.7% 244 62.1% 61.5%
Male 143 37.2% 37.8% 135 35.3% 37.8% 142 36.6% 38.1% 141 35.9% 38.3% 149 37.9% 38.5%
Total 384 100% 100% 373 100% 100% 382 100% 100% 388 100% 100% 393 100% 100%
Asian 7 1.8% 8.7% 8 2.1% 8.9% 10 2.6% 9.2% 9 2.3% 9.2% 9 2.3% 9.2%
Black 28 7.3% 9.5% 28 7.5% 9.2% 29 7.6% 9.0% 30 7.7% 8.8% 32 7.7% 8.8%
Classified Support
Filipino 2 0.5% 3.0% 2 0.5% 3.0% 2 0.5% 3.1% 2 0.5% 3.0% 3 0.5% 3.0%
Hispanic/Latino 37 9.6% 24.0% 38 10.2% 24.6% 40 10.5% 25.0% 42 10.8% 25.6% 45 10.8% 25.6%
Native American 3 0.8% 1.1% 3 0.8% 1.1% 3 0.8% 1.1% 2 0.5% 1.1% 4 0.5% 1.1%
Pacific Islander 2 0.5% 0.6% 2 0.5% 0.5% 2 0.5% 0.6% 2 0.5% 0.6% 3 0.5% 0.6%
White 304 79.2% 50.2% 290 77.8% 49.3% 290 75.9% 48.1% 293 75.5% 47.4% 288 75.5% 47.4%
Unknown 1 0.3% 2.8% 2 1% 3.1% 5 1.3% 3.6% 7 1.8% 3.9% 9 1.8% 3.9%
Other Non‐White 0 0% 0.3% 0 0% 0.3% 1 0.3% 0.3% 1 0.3% 0.4% 0 0.3% 0.4%
Total 384 100% 100% 373 100% 100% 382 100% 100% 388 100% 100% 393 100% 100%
www.santarosa.edu/researchOffice of Institutional Research Employee Demographics • ED – 11
Source: California Community Colleges Chancellor’s Office Data Mart (MIS data).

SONOMA COUNTY JUNIOR COLLEGE DISTRICT — Fact Book 2010 ED – 12
Employees by Gender and Ethnicity
Definition of Measure: Headcount of administrators, faculty, and classified staff by ethnicity and gender for employee classifications as of First Census, Fall Semesters 2004 through 2009, compared to statewide data. This measure does not include STNCs, student workers, and Community Education instructors as those data are not available from this source.
Source: California Community Colleges Chancellor’s Office Data Mart (MIS data)
Comparison Group: California Community Colleges Statewide
Use(s) of Measure: This measure shows trends in employee demographics.
Analysis: As of Fall 2009, the Sonoma County Junior College District employed 1,680 individuals in the categories of administrators, faculty and classified staff (not including STNCs, student workers, and Community Education instructors). Currently, females comprise 59.4% of SRJC employees compared to 55% statewide.
While SRJC employees are predominantly White, the percentage of Whites decreased from 86.5% in 2005 to 84 1% in 2009 similar to more marked statewide trend of 65 0% decreasing to 60 7%2005 to 84.1% in 2009, similar to more marked statewide trend of 65.0% decreasing to 60.7%.
For additional information:
Chancellor’s Office Data Mart: http://www.cccco.edu/SystemOffice/Divisions/TechResearchInfo/MIS/DataMartandReports/tabid/282/Default.aspx
www.santarosa.edu/researchOffice of Institutional Research Employee Demographics • ED – 12
SONOMA COUNTY JUNIOR COLLEGE DISTRICT — Fact Book 2010 E – 1
Enrollment
Introduction
Enrollment trends are perhaps the most important piece of information for institutional planning. Enrollment rates dictate state funding and drive many aspects of planning, including instructional programs, student services, and facilities. This section of the Fact Book examines enrollment from many different angles.
Enrollment at SRJC has been affected by the economy and the state budget crisis. Due to budget cuts, the District has reduced course offerings, which decreases enrollments. The credit and noncredit unduplicated enrollment have decreased in 2009–10. The annual credit headcount of 38,358 is the lowest headcount in the past ten years, and noncredit annual headcount dropped 12.4% from 2008–09.
The total number of students enrolled at Santa Rosa Junior College — including unduplicated credit and noncredit enrollment and Community Education— totaled 57,025 for the 2009–10 academic year.
In the past five years, the demographics of credit enrollments are a higher proportion of females (approximately 55%) , with the majority less than 25 years of age, and a higher proportion of Whites. Latino credit enrollments have increased to 18.2% in Fall 2009.
I S i 2010 32 3% f h l di ll Whi d 23 8% L i OldIn Spring 2010, 32.3% of the total noncredit enrollment was White and 23.8% was Latino. Older females comprise the largest segment of noncredit enrollments, followed by Latino enrollments. When compared to the California Community College system, SRJC has a higher proportion of Whites, females, and older students while the State has a larger proportion of all other ethnicities in both credit and noncredit enrollments. “Continuing students” constitute almost 70% of the total enrollment in Spring 2010.
The location (based on the budget code) where classes are held shows that the majority of enrollments are at the Santa Rosa campus, followed by the Petaluma campus and the Public Safety Training Center; 44.2% of the total enrollments were at the Santa Rosa campus in the Summer of 2009, 54.0% total enrollments in Fall 2009, and 54.1% in Spring 2010.
www.santarosa.edu/researchOffice of Institutional Research Enrollment • E – 1
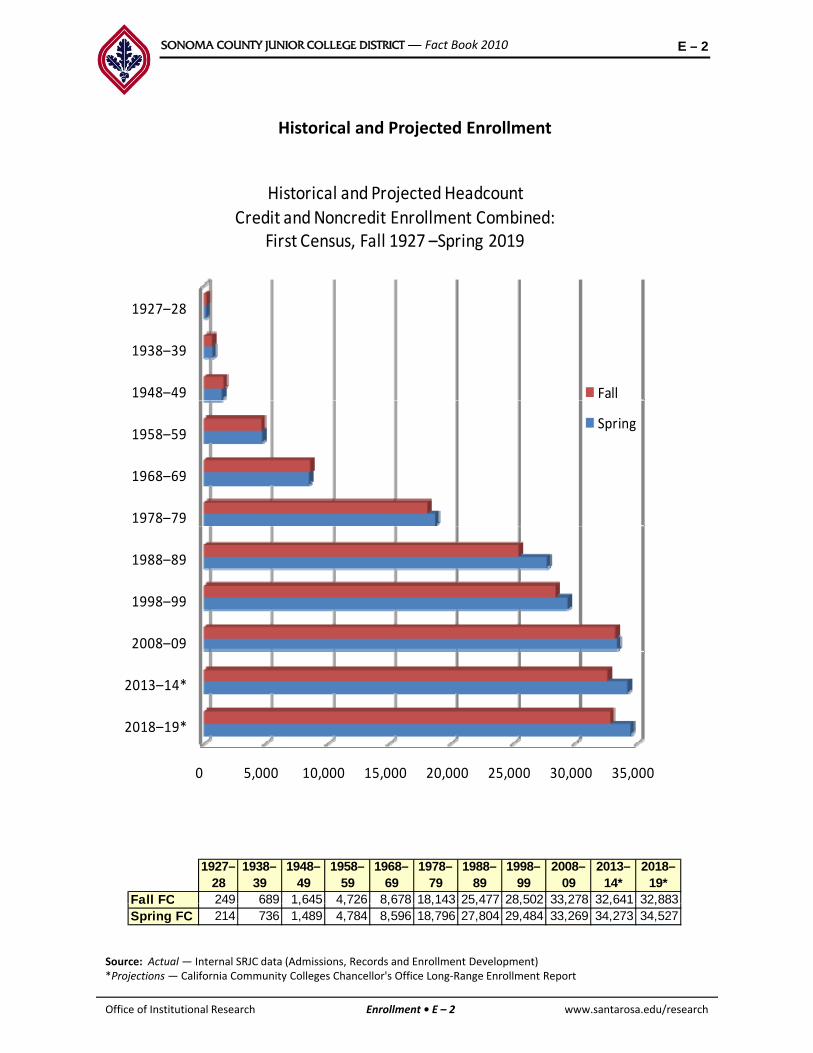
SONOMA COUNTY JUNIOR COLLEGE DISTRICT — Fact Book 2010 E – 2
Historical and Projected Enrollment
Historical and Projected Headcount
Credit and Noncredit Enrollment Combined:First Census, Fall 1927 –Spring 2019
1948–49
1938–39
1927–28
Fall
1978–79
1968–69
1958–59Spring
2008–09
1998–99
1988–89
0 5,000 10,000 15,000 20,000 25,000 30,000 35,000
2018–19*
2013–14*
0 5,000 10,000 15,000 20,000 25,000 30,000 35,000
1927–28
1938–39
1948–49
1958–59
1968–69
1978–79
1988–89
1998–99
2008–09
2013–14*
2018– 19*
Fall FC 249 689 1,645 4,726 8,678 18,143 25,477 28,502 33,278 32,641 32,883
www.santarosa.edu/researchOffice of Institutional Research Enrollment • E – 2
Source: Actual— Internal SRJC data (Admissions, Records and Enrollment Development)*Projections— California Community Colleges Chancellor's Office Long‐Range Enrollment Report
Fall FC 249 689 1,645 4,726 8,678 18,143 25,477 28,502 33,278 32,641 32,883Spring FC 214 736 1,489 4,784 8,596 18,796 27,804 29,484 33,269 34,273 34,527
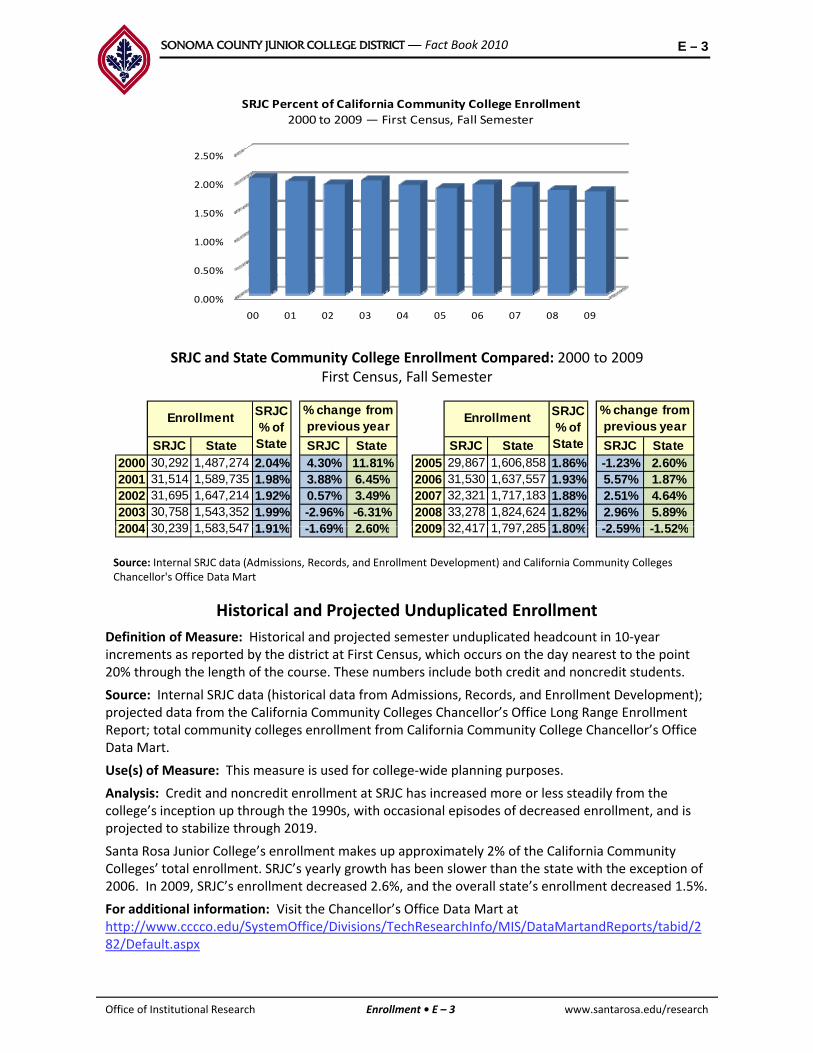
SONOMA COUNTY JUNIOR COLLEGE DISTRICT — Fact Book 2010 E – 3
SRJC Percent of California Community College Enrollment2000 to 2009 — First Census, Fall Semester
0.50%
1.00%
1.50%
2.00%
2.50%
SRJC and State Community College Enrollment Compared: 2000 to 2009 First Census, Fall Semester
0.00%
00 01 02 03 04 05 06 07 08 09
SRJC State SRJC State SRJC State SRJC State2000 30,292 1,487,274 2.04% 4.30% 11.81% 2005 29,867 1,606,858 1.86% -1.23% 2.60%2001 31,514 1,589,735 1.98% 3.88% 6.45% 2006 31,530 1,637,557 1.93% 5.57% 1.87%2002 31,695 1,647,214 1.92% 0.57% 3.49% 2007 32,321 1,717,183 1.88% 2.51% 4.64%2003 30,758 1,543,352 1.99% -2.96% -6.31% 2008 33,278 1,824,624 1.82% 2.96% 5.89%2004 30 239 1 583 547 1 91% 1 69% 2 60% 2009 32 417 1 797 285 1 80% 2 59% 1 52%
Enrollment Enrollment SRJC % of State
% change from previous year
% change from previous year
SRJC % of State
Historical and Projected Unduplicated Enrollment
Definition of Measure: Historical and projected semester unduplicated headcount in 10‐year i t t d b th di t i t t Fi t C hi h th d t t th i t
Source: Internal SRJC data (Admissions, Records, and Enrollment Development) and California Community Colleges Chancellor's Office Data Mart
2004 30,239 1,583,547 1.91% -1.69% 2.60% 2009 32,417 1,797,285 1.80% -2.59% -1.52%
increments as reported by the district at First Census, which occurs on the day nearest to the point 20% through the length of the course. These numbers include both credit and noncredit students.
Source: Internal SRJC data (historical data from Admissions, Records, and Enrollment Development); projected data from the California Community Colleges Chancellor’s Office Long Range Enrollment Report; total community colleges enrollment from California Community College Chancellor’s Office Data Mart.
Use(s) of Measure: This measure is used for college‐wide planning purposes.
Analysis: Credit and noncredit enrollment at SRJC has increased more or less steadily from the college’s inception up through the 1990s, with occasional episodes of decreased enrollment, and is projected to stabilize through 2019.
Santa Rosa Junior College’s enrollment makes up approximately 2% of the California Community Colleges’ total enrollment. SRJC’s yearly growth has been slower than the state with the exception of 2006. In 2009, SRJC’s enrollment decreased 2.6%, and the overall state’s enrollment decreased 1.5%.
www.santarosa.edu/researchOffice of Institutional Research Enrollment • E – 3
For additional information: Visit the Chancellor’s Office Data Mart at http://www.cccco.edu/SystemOffice/Divisions/TechResearchInfo/MIS/DataMartandReports/tabid/282/Default.aspx

SONOMA COUNTY JUNIOR COLLEGE DISTRICT — Fact Book 2010 E – 4
Total Number of Student EnrolledPer Year
40 000
50,000
60,000
70,000
Total Number of Student Enrolled Per Year1999–00 to 2009–10, including Community Education
0
10,000
20,000
30,000
40,000
99–00 00–01 01–02 02–03 03–04 04–05 05–06 06–07 07–08 08–09 09–10
U d li t d A l E ll t b C dit N dit d C it
SRJC Credit SRJC Noncredit Community Ed Program
Unduplicated Annual Enrollment by Credit, Noncredit and Community Education, with Percent of Change from Previous Year: 1999–00 to 2009–10
% change % change % change % change
Unduplicated Credit
Headcount
Unduplicated Non‐
Credit Headcount
Unduplicated
Community Education
Headcount
Total Number of
Students Enrolled
#
% change
from
previous
year
#
% change
from
previous
year
#
% change
from
previous
year
#
% change
from
previous
year
1999–00 46,837 2.9% 9,358 17.0% 5,797 ‐0.2% 61,992 4.5%
2000–01 47,814 2.1% 10,946 17.0% 5,578 ‐3.8% 64,338 3.8%
2001–02 48,880 2.2% 12,354 12.9% 5,689 2.0% 66,923 4.0%
2002–03 47,777 ‐2.3% 12,576 1.8% 6,221 9.4% 66,574 ‐0.5%, , , ,
2003–04 41,342 ‐13.5% 11,987 ‐4.7% 7,714 24.0% 61,043 ‐8.3%
2004–05 38,667 ‐6.5% 12,001 0.1% 8,328 8.0% 58,996 ‐3.4%
2005–06 39,588 2.4% 12,635 5.3% 8,540 2.5% 60,763 3.0%
2006–07 40,008 1.1% 12,746 0.9% 7,106 ‐16.8% 59,860 ‐1.5%
2007–08 41,384 3.4% 13,017 2.1% 7,079 ‐0.4% 61,480 2.7%
2008–09 41,563 0.4% 13,042 0.2% 6,419 ‐9.3% 61,024 ‐0.7%
2009–10 38,358 ‐7.7% 11,425 ‐12.4% 7,242 12.8% 57,025 ‐6.6%
www.santarosa.edu/researchOffice of Institutional Research Enrollment • E – 4
Source: Internal SRJC data (Custom report)
SONOMA COUNTY JUNIOR COLLEGE DISTRICT — Fact Book 2010 E – 5
Annual Enrollment
Definition of Measure: The total number of unduplicated credit and unduplicated noncredit students enrolled in the college and the total unduplicated participants in the Community Education program for a given academic year (Summer, Fall, and Spring), showing the percentage of growth or decline from the previous year.
Source: Internal SRJC data (Custom IT report for Community Education; Admissions, Records, and Enrollment Development for Annual Unduplicated Headcount).p p
Use(s) of Measure: This measure shows the total unduplicated number of students served by the college for planning purposes and community relations.
Analysis: Within the past ten years, enrollment has fluctuated. The total number of students enrolled reached an all‐time high of 66,923 in 2001‐02. The reductions in course offerings due to the state budget crisis contributed to the decrease enrollments in 2003–04 and again in 2009–10, which were 8% and 6.6% respectively. Community Education enrollment peaked in 2005–06 at 8,540 and grew almost 13% in 2009–10.
www.santarosa.edu/researchOffice of Institutional Research Enrollment • E – 5

SONOMA COUNTY JUNIOR COLLEGE DISTRICT — Fact Book 2010 E – 6
Student Credit and Noncredit Headcount by Semester
Definition of Measure: The unduplicated number of students enrolled in credit andDefinition of Measure: The unduplicated number of students enrolled in credit and noncredit courses in the Summer, Fall, and Spring semesters at the End of Semester.
Accessibility: SRJC has converted to a new Student Information System (SIS). Many Information Technology reports used in past Fact Books are now being updated and combined to minimize duplication and increase efficiency. While this conversion is in process, Fact Book users are being directed to the California Community College Chancellor’s Office Data Mart website to gain access to the District’s MIS* data. This measure can be accessed in previous Fact Books at: www.santarosa.edu/research.
Below are the instructions to access the specific data for this report.
California Community Colleges Chancellor’s Office Data Mart Student Demographics for College/Statewide by Term file:https://misweb.cccco.edu/mis/onlinestat/studdemo_coll_cube.cfmp _ _
To get SRJC data:Select “Santa Rosa” under College;Select Year and Term needed (only one year/term can be selected);Select “Unit Load” under Column 1 HeadingClick “Get Report” buttonCredit is defined as students enrolled units.Noncredit is listed separately.
To get Statewide data:Select “Statewide” under College;Select Year and Term needed (only one year/term can be selected);Select “Unit Load” under Column 1 Heading;Click “Get Report” button
d d f d d ll d l dCredit is defined as students enrolled units, including zero units.Noncredit is listed separately.
To download data, click on the “Download” hyperlink on the results page.
*Limitations to MIS dataData does not include credit students enrolled in full term courses earning less than .50 units and credit and noncredit students enrolled in short term courses with 8 or less hoursunits and credit and noncredit students enrolled in short term courses with 8 or less hours of attendance.
www.santarosa.edu/researchOffice of Institutional Research Enrollment • E – 6

SONOMA COUNTY JUNIOR COLLEGE DISTRICT — Fact Book 2010 E – 7
Full‐Time Credit, Part‐Time Credit, and Noncredit Enrollment
Definition of Measure: Unduplicated enrollment and proportions by full time and partDefinition of Measure: Unduplicated enrollment and proportions by full‐time and part‐time credit and noncredit categories at End of Semester, Summer, Fall, and Spring semesters. Full‐time is defined as students taking 12+ units; part‐time is students enrolled in 11.9 units or less per semester.
Accessibility: SRJC has converted to a new Student Information System (SIS). Many IT reports used in past Fact Books are now being updated and combined to minimize duplication and increase efficiency. While this conversion is in process, Fact Book users are being directed to the California Community College Chancellor’s Office Data Mart website to gain access to the District’s MIS* data. This measure can be accessed in previous Fact Books at: www.santarosa.edu/research.
Below are the instructions to access the specific data for this report. First Census data only.
California Community Colleges Chancellor’s Office Data Mart Student Demographics for y g g pCollege/Statewide by Term file:https://misweb.cccco.edu/mis/onlinestat/studdemo_coll_cube.cfm
To get SRJC data:Select “Santa Rosa” under College;Select Year and Term needed (only one year/term can be selected);Select “Unit Load” under Column 1 Heading;Click “Get Report” button
To get Statewide data:Select “Statewide” under College;Select Year and Term needed (only one year/term can be selected);Select “Unit Load” under Column 1 Heading;Click “Get Report” button
To download data, click on the “Download” hyperlink on the results page.
*Limitations to MIS dataData does not include credit students enrolled full term courses earning less than .50 units and credit and noncredit students enrolled in short term courses with 8 or less hours of attendance.
www.santarosa.edu/researchOffice of Institutional Research Enrollment • E – 7

SONOMA COUNTY JUNIOR COLLEGE DISTRICT — Fact Book 2010 E – 8
18 000
Credit Enrollment by GenderFall 2005 – Fall 2009
4 000
6,000
8,000
10,000
12,000
14,000
16,000
18,000
Female
Male
Unknown
0
2,000
4,000
Fall 2005 Fall 2006 Fall 2007 Fall 2008 Fall 2009
Credit Enrollment by AgeFall 2005 – Fall 2009
3,000
4,000
5,000
6,000
7,000
8,000
< 20
20 to 24
25 to 29
30 to 34
0
1,000
2,000
Fall 2005 Fall 2006 Fall 2007 Fall 2008 Fall 2009
35 to 39
40 to 49
50 +
14,000
16,000
18,000
20,000
Credit Enrollment by EthnicityFall 2005 – Fall 2009
White
Latino
Asian
2,000
4,000
6,000
8,000
10,000
12,000 Black
NativeAmerican
Filipino
PacificIslander
Other
www.santarosa.edu/researchOffice of Institutional Research Enrollment • E – 8
0
,
Fall 2005 Fall 2006 Fall 2007 Fall 2008 Fall 2009
Unknown

SONOMA COUNTY JUNIOR COLLEGE DISTRICT — Fact Book 2010 E – 9
4,500
Noncredit Enrollment by GenderFall 2005 – Fall 2009
1,000
1,500
2,000
2,500
3,000
3,500
4,000
Female
Male
Unknown
0
500
1,000
Fall 2005 Fall 2006 Fall 2007 Fall 2008 Fall 2009
Noncredit Enrollment by AgeFall 2005 – Fall 2009
2,000
2,500
3,000
3,500
4,000
4,500
< 20
20 to 24
25 to 29
30 to 34
0
500
1,000
1,500
Fall 2005 Fall 2006 Fall 2007 Fall 2008 Fall 2009
35 to 39
40 to 49
50 +
N dit E ll t b Eth i it
2000
2500
Noncredit Enrollment by Ethnicity
Fall 2005 – Fall 2009White
Latino
Asian
Black
500
1000
1500NativeAmerican
Filipino
PacificIslander
www.santarosa.edu/researchOffice of Institutional Research Enrollment • E – 9
0
500
Fall 2005 Fall 2006 Fall 2007 Fall 2008 Fall 2009
Other
Unknown

SONOMA COUNTY JUNIOR COLLEGE DISTRICT — Fact Book 2010 E – 10
State, District Credit and Noncredit Enrollment Compared
Gender and Age CreditGender and Age ‐ Credit
# % # % # % # %
Female 14,098 54.4% 861,290 53.3% 13,564 53.4% 828,546 52.5%
Male 11,368 43.9% 737,201 45.7% 11,392 44.9% 733,626 46.5%
Unknown 434 1.7% 16,291 1.0% 430 1.7% 15,923 1.0%
Fall 2009 Spring 2010
SRJC State SRJC State
Unknown 434 1.7% 16,291 1.0% 430 1.7% 15,923 1.0%
< 20 7,343 28.4% 448,797 27.8% 6,329 24.9% 385,817 24.4%
20 ‐ 24 7,489 28.9% 502,526 31.1% 8,015 31.6% 521,954 33.1%
25 ‐ 29 3,197 12.3% 212,937 13.2% 3,339 13.2% 218,300 13.8%
30 ‐ 34 1,730 6.7% 119,554 7.4% 1,826 7.2% 122,420 7.8%
35 ‐ 39 1,328 5.1% 87,495 5.4% 1,281 5.0% 88,005 5.6%
40 ‐ 49 2,331 9.0% 135,546 8.4% 2,208 8.7% 135,711 8.6%
50+ 2,482 9.6% 107,474 6.7% 2,388 9.4% 105,559 6.7%
Gender and Age ‐ Noncredit
Unknown — — 453 0.03% — — 329 0.02%
# % # % # % # %
Female 3,228 63.1% 112,178 61.5% 3,264 61.1% 102,915 60.4%
SRJC
Fall 2009 Spring 2010
SRJC StateState
Male 1,719 33.6% 63,252 34.7% 1,873 35.1% 62,258 36.5%
Unknown 170 3.3% 7,074 3.9% 201 3.8% 5,343 3.1%
< 20 116 2.3% 11,212 6.1% 118 2.2% 12,510 7.3%
20 ‐ 24 396 7.7% 15,821 8.7% 370 6.9% 15,726 9.2%
25 ‐ 29 454 8.9% 14,491 7.9% 507 9.5% 14,352 8.4%
30 ‐ 34 331 6.5% 13,188 7.2% 361 6.8% 12,796 7.5%
35 ‐ 39 349 6.8% 12,713 7.0% 365 6.8% 12,166 7.1%
40 49 533 10 4% 22 965 12 6% 582 10 9% 21 538 12 6%
Ethnicity ‐ Credit
40 ‐ 49 533 10.4% 22,965 12.6% 582 10.9% 21,538 12.6%
50+ 2,938 57.4% 83,883 46.0% 3,035 56.9% 74,233 43.5%
Unknown — — 8,231 4.5% — — 7,195 4.2%
# % # % # % # %
SRJC State SRJC State
Fall 2009 Spring 2010
# % # % # % # %
Asian 1,029 4.0% 171,330 10.6% 988 3.9% 169,545 10.7%
Black 679 2.6% 117,306 7.3% 648 2.6% 116,852 7.4%
Filipino 270 1.0% 51,116 3.2% 241 0.9% 47,687 3.0%
Hispanic/
Latino 4,709 18.2% 476,901 29.5% 4,738 18.7% 477,263 30.2%
Native
American 262 1.0% 11,522 0.7% 261 1.0% 10,810 0.7%
www.santarosa.edu/researchOffice of Institutional Research Enrollment • E – 10
Pacific
Islander 152 0.6% 11,689 0.7% 154 0.6% 10,830 0.7%
White 15,652 60.4% 516,449 32.0% 15,536 61.2% 513,809 32.6%
Multi 393 1.5% 18,974 1.2% 480 1.9% 24,157 1.5%
Unknown 2,754 10.6% 239,495 14.8% 2,340 9.2% 207,142 13.1%

SONOMA COUNTY JUNIOR COLLEGE DISTRICT — Fact Book 2010 E – 11
State, District Credit and Noncredit Enrollment Compared, continued
Ethnicity ‐ Noncredity
# % # % # % # %
Asian 90 1.8% 23,983 13.1% 105 2.0% 22,563 13.2%
Black 37 0.7% 4,097 2.2% 46 0.9% 4,135 2.4%
Filipino 10 0.2% 1,987 1.1% 11 0.2% 1,844 1.1%
Hispanic/
SRJC State SRJC State
Fall 2009 Spring 2010
Hispanic/
Latino 1,242 24.3% 48,632 26.6% 1,255 23.5% 56,016 32.9%
Native
American 22 0.4% 562 0.3% 28 0.5% 550 0.3%
Pacific
Islander 7 0.1% 360 0.2% 7 0.1% 363 0.2%
White 1,750 34.2% 48,085 26.3% 1,725 32.3% 45,240 26.5%
Multi 6 0.1% 228 0.1% 7 0.1% 287 0.2%
Unknown 1,953 38.2% 54,570 29.9% 2,154 40.4% 39,518 23.2%
www.santarosa.edu/researchOffice of Institutional Research Enrollment • E – 11

SONOMA COUNTY JUNIOR COLLEGE DISTRICT — Fact Book 2010 E – 12
Credit and Noncredit Enrollment by Gender and Age
F M Unk < 20 20 ‐ 24 25 ‐ 29 30 ‐ 34 35 ‐ 39 40 ‐ 49 50+ Totals
# 5,832 4,069 39 3,069 2,562 1,023 614 537 973 1,162 9,940
% 58.7% 40.9% 0.4% 30.9% 25.8% 10.3% 6.2% 5.4% 9.8% 11.7% 100%SU
CR
# 3,604 1,746 10 389 385 314 283 227 363 3,399 5,360
% 67.2% 32.6% 0.2% 7.3% 7.2% 5.9% 5.3% 4.2% 6.8% 63.4% 100%
# 14,012 10,539 115 6,379 6,585 2,672 1,669 1,457 2,826 3,078 24,666
% 56.8% 42.7% 0.5% 25.9% 26.7% 10.8% 6.8% 5.9% 11.5% 12.5% 100%
# 4,151 2,086 11 202 545 455 378 316 478 3,874 6,248
% 66.4% 33.4% 0.2% 3.2% 8.7% 7.3% 6.0% 5.1% 7.7% 62.0% 100%
# 14,343 11,099 126 6,202 6,663 2,868 1,755 1,537 3,150 3,393 25,568
% 56.1% 43.4% 0.5% 24.3% 26.1% 11.2% 6.9% 6.0% 12.3% 13.3% 100%
# 4,366 2,352 15 191 592 516 419 346 521 4,148 6,733
SU
FA
SP
NC
CR
NC
CR
NC
2005‐06
, , , ,
% 64.8% 34.9% 0.2% 2.8% 8.8% 7.7% 6.2% 5.1% 7.7% 61.6% 100%
# 5,858 4,145 41 3,001 2,569 1,108 652 523 973 1,218 10,044
% 58.3% 41.3% 0.4% 29.9% 25.6% 11.0% 6.5% 5.2% 9.7% 12.1% 100%
# 3,622 1,875 13 394 387 326 266 240 378 3,519 5,510
% 65.7% 34.0% 0.2% 7.2% 7.0% 5.9% 4.8% 4.4% 6.9% 63.9% 100%
# 14,351 10,781 124 6,809 6,536 2,769 1,616 1,423 2,833 3,270 25,256
% 56.8% 42.7% 0.5% 27.0% 25.9% 11.0% 6.4% 5.6% 11.2% 12.9% 100%
# 4,083 2,094 12 189 524 483 387 336 528 3,742 6,189
% 66 0% 33 8% 0 2% 3 1% 8 5% 7 8% 6 3% 5 4% 8 5% 60 5% 100%
CR
NC
NC
2006‐07
SU
CR
NC
FA
% 66.0% 33.8% 0.2% 3.1% 8.5% 7.8% 6.3% 5.4% 8.5% 60.5% 100%
# 14,563 11,229 139 6,353 6,856 2,952 1,739 1,509 2,918 3,604 25,931
% 56.2% 43.3% 0.5% 24.5% 26.4% 11.4% 6.7% 5.8% 11.3% 13.9% 100%
# 4,245 2,389 23 266 590 529 422 366 588 3,896 6,657
% 63.8% 35.9% 0.3% 4.0% 8.9% 7.9% 6.3% 5.5% 8.8% 58.5% 100%
# 6,675 4,897 51 4,243 2,725 1,178 627 572 1,003 1,275 11,623
% 57.4% 42.1% 0.4% 36.5% 23.4% 10.1% 5.4% 4.9% 8.6% 11.0% 100%
# 3,490 1,785 31 359 348 331 240 248 390 3,390 5,306
% 65.8% 33.6% 0.6% 6.8% 6.6% 6.2% 4.5% 4.7% 7.4% 63.9% 100%
SP
CR
NC
SU
CR
NC
# 14,855 11,121 128 7,235 6,582 2,980 1,693 1,367 2,772 3,475 26,104
% 56.9% 42.6% 0.5% 27.7% 25.2% 11.4% 6.5% 5.2% 10.6% 13.3% 100%
# 4,101 2,084 32 181 499 485 365 368 553 3,766 6,217
% 66.0% 33.5% 0.5% 2.9% 8.0% 7.8% 5.9% 5.9% 8.9% 60.6% 100%
# 14,996 11,560 129 6,657 6,904 3,261 1,826 1,457 2,822 3,758 26,685
% 56.2% 43.3% 0.5% 24.9% 25.9% 12.2% 6.8% 5.5% 10.6% 14.1% 100%
# 4,242 2,221 28 223 514 480 412 390 551 3,921 6,491
% 65.4% 34.2% 0.4% 3.4% 7.9% 7.4% 6.3% 6.0% 8.5% 60.4% 100%
# 6 726 4 748 68 4 317 2 762 1 224 672 496 913 1 158 11 542
FA
CR
NC
SP
CR
NC
2007‐08
# 6,726 4,748 68 4,317 2,762 1,224 672 496 913 1,158 11,542
% 58.3% 41.1% 0.6% 37.4% 23.9% 10.6% 5.8% 4.3% 7.9% 10.0% 100%
# 3,402 1,712 27 338 344 299 212 220 362 3,366 5,141
% 66.2% 33.3% 0.5% 6.6% 6.7% 5.8% 4.1% 4.3% 7.0% 65.5% 100%
# 15,241 11,450 194 7,531 6,972 3,126 1,755 1,433 2,641 3,427 26,885
% 56.7% 42.6% 0.7% 28.0% 25.9% 11.6% 6.5% 5.3% 9.8% 12.7% 100%
# 3,880 2,096 138 200 490 467 365 346 532 3,714 6,114
% 63.5% 34.3% 2.3% 3.3% 8.0% 7.6% 6.0% 5.7% 8.7% 60.7% 100%
# 14,687 11,494 706 6,904 7,432 3,343 1,801 1,438 2,678 3,291 26,887
% 54 6% 42 7% 2 6% 25 7% 27 6% 12 4% 6 7% 5 3% 10 0% 12 2% 100%
2008‐09
CR
NC
CR
NC
SU
CR
FA
% 54.6% 42.7% 2.6% 25.7% 27.6% 12.4% 6.7% 5.3% 10.0% 12.2% 100%
# 3,923 2,090 525 271 507 532 392 404 591 3,841 6,538
% 60.0% 32.0% 8.0% 4.1% 7.8% 8.1% 6.0% 6.2% 9.0% 58.7% 100%
# 6,797 5,034 64 4,228 3,147 1,341 738 563 928 1,090 12,035
% 57.1% 42.3% 0.5% 35.1% 26.1% 11.1% 6.1% 4.7% 7.7% 9.1% 100%
# 3,422 1,650 233 324 294 350 237 258 416 3,426 5,305
% 64.5% 31.1% 4.4% 6.1% 5.5% 6.6% 4.5% 4.9% 7.8% 64.6% 100%
# 14,098 11,368 434 7,343 7,489 3,197 1,730 1,328 2,331 2,482 25,900
% 54.4% 43.9% 1.7% 28.4% 28.9% 12.3% 6.7% 5.1% 9.0% 9.6% 100%
SP
2009 10
NC
FA
CR
SU
CR
NC
www.santarosa.edu/researchOffice of Institutional Research Enrollment • E – 12
# 3,228 1,719 170 116 396 454 331 349 533 2,938 5,117
% 63.1% 33.6% 3.3% 2.3% 7.7% 8.9% 6.5% 6.8% 10.4% 57.4% 100%
# 13,564 11,392 430 6,329 8,015 3,339 1,826 1,281 2,208 2,388 25,386
% 53.4% 44.9% 1.7% 24.9% 31.6% 13.2% 7.2% 5.0% 8.7% 9.4% 100%
# 3,264 1,873 201 118 370 507 361 365 582 3,035 5,338
% 61.1% 35.1% 3.8% 2.2% 6.9% 9.5% 6.8% 6.8% 10.9% 56.9% 100%
2009‐10
SP
CR
NC
FA
NC

SONOMA COUNTY JUNIOR COLLEGE DISTRICT — Fact Book 2010 E – 13
Credit and Noncredit Enrollment by Ethnicity
Asian Black FilipinoHispanic/
Latino
Native
American
Pacific
IslanderWhite
Other
/MultiUnknown Total
# 550 280 127 1 458 117 58 6 409 147 794 9 940# 550 280 127 1,458 117 58 6,409 147 794 9,940
% 5.5% 2.8% 1.3% 14.7% 1.2% 0.6% 64.5% 1.5% 8.0% 100%
# 81 39 9 1,178 26 4 2,037 21 1,965 5,360
% 1.5% 0.7% 0.2% 22.0% 0.5% 0.1% 38.0% 0.4% 36.7% 100%
# 1,033 579 283 3,660 302 136 16,583 334 1,756 24,666
% 4.2% 2.3% 1.1% 14.8% 1.2% 0.6% 67.2% 1.4% 7.1% 100%
# 111 45 10 1,647 30 10 2,302 24 2,069 6,248
% 1.8% 0.7% 0.2% 26.4% 0.5% 0.2% 36.8% 0.4% 33.1% 100%
# 1,057 595 274 3,757 322 141 17,208 362 1,852 25,568
% 4 1% 2 3% 1 1% 14 7% 1 3% 0 6% 67 3% 1 4% 7 2% 100%
SU
FA
CR
NC
CR
NC
CR
2005‐06
% 4.1% 2.3% 1.1% 14.7% 1.3% 0.6% 67.3% 1.4% 7.2% 100%
# 110 37 7 1,852 38 9 2,361 28 2,291 6,733
% 1.6% 0.5% 0.1% 27.5% 0.6% 0.1% 35.1% 0.4% 34.0% 100%
# 574 297 117 1,542 116 71 6,417 158 752 10,044
% 5.7% 3.0% 1.2% 15.4% 1.2% 0.7% 63.9% 1.6% 7.5% 100%
# 90 36 9 1,189 20 8 2,030 23 2,105 5,510
% 1.6% 0.7% 0.2% 21.6% 0.4% 0.1% 36.8% 0.4% 38.2% 100%
# 1,072 631 273 3,870 325 133 16,746 353 1,853 25,256
% 4.2% 2.5% 1.1% 15.3% 1.3% 0.5% 66.3% 1.4% 7.3% 100%
# 107 51 12 1 659 32 6 2 287 22 2 013 6 189
SP
NC
CR
2006‐07
CR
SU
FA
NC
# 107 51 12 1,659 32 6 2,287 22 2,013 6,189
% 1.7% 0.8% 0.2% 26.8% 0.5% 0.1% 37.0% 0.4% 32.5% 100%
# 1,105 640 260 3,955 330 140 17,177 356 1,968 25,931
% 4.3% 2.5% 1.0% 15.3% 1.3% 0.5% 66.2% 1.4% 7.6% 100%
# 91 54 12 1,962 36 8 2,420 27 2,047 6,657
% 1.4% 0.8% 0.2% 29.5% 0.5% 0.1% 36.4% 0.4% 30.7% 100%
# 659 313 139 1,895 137 76 7,362 178 864 11,623
% 5.7% 2.7% 1.2% 16.3% 1.2% 0.7% 63.3% 1.5% 7.4% 100%
# 76 33 10 1,364 19 6 2,031 16 1,751 5,306
% 1 4% 0 6% 0 2% 25 7% 0 4% 0 1% 38 3% 0 3% 33 0% 100%
NC
SP
CR
NC
SU
CR
NC% 1.4% 0.6% 0.2% 25.7% 0.4% 0.1% 38.3% 0.3% 33.0% 100%
# 1,097 669 250 4,113 327 157 17,196 350 1,945 26,104
% 4.2% 2.6% 1.0% 15.8% 1.3% 0.6% 65.9% 1.3% 7.5% 100%
# 93 46 11 1,772 25 5 2,276 26 1,963 6,217
% 1.5% 0.7% 0.2% 28.5% 0.4% 0.1% 36.6% 0.4% 31.6% 100%
# 1,104 696 288 4,145 332 173 17,553 370 2,024 26,685
% 4.1% 2.6% 1.1% 15.5% 1.2% 0.6% 65.8% 1.4% 7.6% 100%
# 91 54 10 1,864 35 11 2,386 22 2,018 6,491
% 1.4% 0.8% 0.2% 28.7% 0.5% 0.2% 36.8% 0.3% 31.1% 100%
# 615 338 137 1 975 143 85 7 205 162 882 11 542
FA
SP
2007‐08
CR
NC
CR
NC
# 615 338 137 1,975 143 85 7,205 162 882 11,542
% 5.3% 2.9% 1.2% 17.1% 1.2% 0.7% 62.4% 1.4% 7.6% 100%
# 84 35 8 1,250 22 5 1,993 17 1,727 5,141
% 1.6% 0.7% 0.2% 24.3% 0.4% 0.1% 38.8% 0.3% 33.6% 100%
# 1,148 704 308 4,435 350 181 17,300 358 2,101 26,885
% 4.3% 2.6% 1.1% 16.5% 1.3% 0.7% 64.3% 1.3% 7.8% 100%
# 97 45 11 1,749 30 7 2,175 22 1,978 6,114
% 1.6% 0.7% 0.2% 28.6% 0.5% 0.1% 35.6% 0.4% 32.4% 100%
# 1,051 693 275 4,268 340 183 16,523 356 3,198 26,887
% 3.9% 2.6% 1.0% 15.9% 1.3% 0.7% 61.5% 1.3% 11.9% 100%CR
CR
NC
2008‐09
SU
NC
FA
CR
% 3.9% 2.6% 1.0% 15.9% 1.3% 0.7% 61.5% 1.3% 11.9% 100%
# 91 61 13 1,687 35 10 2,269 25 2,347 6,538
% 1.4% 0.9% 0.2% 25.8% 0.5% 0.2% 34.7% 0.4% 35.9% 100%
# 439 277 101 1,528 121 58 5,178 0 4,333 12,035
% 3.6% 2.3% 0.8% 12.7% 1.0% 0.5% 43.0% 0% 36.0% 100%
# 69 36 13 1,271 25 6 1,834 0 2,051 5,305
% 1.3% 0.7% 0.2% 24.0% 0.5% 0.1% 34.6% 0% 38.7% 100%
# 1,029 679 270 4,709 262 152 15,652 393 2,754 25,900
% 4.0% 2.6% 1.0% 18.2% 1.0% 0.6% 60.4% 1.5% 10.6% 100%
# 90 37 10 1 242 22 7 1 750 6 1 953 5 117
NC
SP
2009‐10
SU
CR
NC
FA
CR
www.santarosa.edu/researchOffice of Institutional Research Enrollment • E – 13
# 90 37 10 1,242 22 7 1,750 6 1,953 5,117
% 1.8% 0.7% 0.2% 24.3% 0.4% 0.1% 34.2% 0.1% 38.2% 100%
# 988 648 241 4,738 261 154 15,536 480 2,340 25,386
% 3.9% 2.6% 0.9% 18.7% 1.0% 0.6% 61.2% 1.9% 9.2% 100%
# 105 46 11 1,255 28 7 1,725 7 2,154 5,338
% 2.0% 0.9% 0.2% 23.5% 0.5% 0.1% 32.3% 0.1% 40.4% 100%
SP
CR
NC
NC

SONOMA COUNTY JUNIOR COLLEGE DISTRICT — Fact Book 2010 E – 14
Credit and Noncredit Enrollment by Gender, Age, and Ethnicity
Definition of Measure: The demographic characteristics (gender, age, and ethnicity) of credit and noncredit students for Summer, Fall, and Spring semesters at First Census.
Source: California Community Colleges Chancellor’s Office Data Mart (MIS data)
Comparison Group: California Community Colleges
Use(s) of Measure: This measure shows the demographic makeup of credit and noncredit students enrolled at the District for program planning purposes.
Analysis: In the past five years the demographics of credit enrollments are a higher proportion of y p y g p g p pfemales (approximately 55%), with the majority less than 25 years of age, and predominately White. Latino credit enrollments have increased over 2% from Fall 2005 to Fall 2009, from 14.3% to 18.2%.
Older females comprise the largest segment of noncredit enrollments, followed by Latino enrollments. In Spring 2010, 32.3% of the total noncredit enrollment was White and 23.5% was Latino. The high proportion of “Unknown” ethnicity is due to the ethnicity section on the admission applications left blank or applicants declining to state primarily in the off campus Seniors programs.
Wh d h C lif i C i C ll SRJC h hi h i fWhen compared to the California Community College system, SRJC has a higher proportion of Whites, females, and older students while the State has a larger proportion of all other ethnicities in both credit and noncredit enrollments.
For additional information:
Chancellor’s Office Data Mart: http://www.cccco.edu/SystemOffice/Divisions/TechResearchInfo/MIS/DataMartandReports/tabid/282/Default.aspx282/Default.aspx
www.santarosa.edu/researchOffice of Institutional Research Enrollment • E – 14

SONOMA COUNTY JUNIOR COLLEGE DISTRICT — Fact Book 2010 E – 15
Student Headcount by Day/Evening Status and Unit Load
Definition of Measure: The number of unduplicated students enrolled by day evening andDefinition of Measure: The number of unduplicated students enrolled by day, evening, and credit and noncredit courses for Summer, Fall, and Spring semesters at the End of Semester.
Accessibility: SRJC has converted to a new Student Information System (SIS). Many Information Technology reports used in past Fact Books are now being updated and combined to minimize duplication and increase efficiency. While this conversion is in process, Fact Book users are being directed to the California Community College Chancellor’s Office Data Mart website to gain access to the District’s MIS* data. This measure can be accessed in previous Fact Books at: www.santarosa.edu/research.
Below are the instructions to access the specific data for this report.
California Community Colleges Chancellor’s Office Data Mart Student Demographics for College/Statewide by Term file:https://misweb.cccco.edu/mis/onlinestat/studdemo_coll_cube.cfm
T SRJC dTo get SRJC data:Select “Santa Rosa” under College;Select Year and Term needed (only one year/term can be selected);Select “Day/Evening Class” under Column 1 Heading;Select “Unit Load” under Column 2 HeadingClick “Get Report” buttonFull time is defined as students enrolled 12+ units.Part time is defined as students enrolled 11 9 units or lessPart time is defined as students enrolled 11.9 units or less.
To get Statewide data:Select “Statewide” under College;Select Year and Term needed (only one year/term can be selected);Select “Day/Evening Class” under Column 1 Heading’Select “Unit Load” under Column 2 Heading;Click “Get Report” buttonClick Get Report buttonFull time is defined as students enrolled 12+ units.Part time is defined as students enrolled 11.9 units or less.
To download data, click on the “Download” hyperlink on the results page.
*Limitations to MIS dataData does not include credit students enrolled in full term courses earning less than .50Data does not include credit students enrolled in full term courses earning less than .50 units and credit and noncredit students enrolled in short term courses with 8 or less hours of attendance.
www.santarosa.edu/researchOffice of Institutional Research Enrollment • E – 15

SONOMA COUNTY JUNIOR COLLEGE DISTRICT — Fact Book 2010 E – 16
Student Enrollment by Enrollment Status
# 11,164 3,255 2,861 2,399 0 19,679% 56.7% 16.5% 14.5% 12.2% 0% 100%# 19,813 8,501 6,754 1,776 5 36,849% 53.8% 23.1% 18.3% 4.8% 0% 100%# 22,647 5,798 8,019 2,923 20 39,407% 57.5% 14.7% 20.3% 7.4% 0.1% 100%
Unknown TotalContinuing New Returning Concurrent
Sp
2002–03
Su
F
# 11,260 2,939 2,509 986 76 17,770% 63.4% 16.5% 14.1% 5.5% 0.4% 100%# 19,787 7,687 5,702 1,373 0 34,549% 57.3% 22.2% 16.5% 4.0% 0% 100%# 22,754 4,559 6,504 2,275 15 36,107% 63.0% 12.6% 18.0% 6.3% 0% 100%
# 11,499 3,155 2,075 884 0 17,613% 65 3% 17 9% 11 8% 5 0% 0% 100%
Su
Su
2003–04 F
Sp
% 65.3% 17.9% 11.8% 5.0% 0% 100%# 19,311 7,752 4,840 1,230 0 33,133% 58.3% 23.4% 14.6% 3.7% 0% 100%# 21,519 4,927 5,820 1,611 15 33,892% 63.5% 14.5% 17.2% 4.8% 0% 100%
# 10,990 3,608 2,191 965 0 17,754% 61.9% 20.3% 12.3% 5.4% 0% 100%# 18,997 7,970 5,263 1,284 8 33,522
2005 06
2004–05 F
Sp
Su
F, , , , ,
% 56.7% 23.8% 15.7% 3.8% 0% 100%# 21,828 5,297 5,982 2,096 64 35,267% 61.9% 15.0% 17.0% 5.9% 0.2% 100%
# 11,624 3,513 2,170 1,150 15 18,472% 62.9% 19.0% 11.7% 6.2% 0.1% 100%# 19,267 8,233 5,127 1,585 0 34,212% 56.3% 24.1% 15.0% 4.6% 0% 100%# 22 478 4 963 6 049 2 185 22 35 697
2005–06
2006–07 F
F
Sp
Su
# 22,478 4,963 6,049 2,185 22 35,697% 63.0% 13.9% 16.9% 6.1% 0.1% 100%
# 12,093 4,736 2,284 1,094 1 20,208% 59.8% 23.4% 11.3% 5.4% 0% 100%# 20,389 8,328 5,328 1,632 1 35,678% 57.1% 23.3% 14.9% 4.6% 0% 100%# 23,182 5,037 6,124 2,037 80 36,460% 63.6% 13.8% 16.8% 5.6% 0.2% 100%
F
Sp
Su
2007–08
Sp
# 12,038 4,886 2,140 1,044 161 20,269% 59.4% 24.1% 10.6% 5.2% 0.8% 100%# 20,668 8,603 5,096 1,603 256 36,226% 57.1% 23.7% 14.1% 4.4% 0.7% 100%# 24,133 4,353 5,868 1,949 110 36,413% 66.3% 12.0% 16.1% 5.4% 0.3% 100%
# 6,717 9,257 2,667 990 168 19,799
2008–09
Su
F
Sp
Su
www.santarosa.edu/researchOffice of Institutional Research Enrollment • E – 16
% 33.9% 46.8% 13.5% 5.0% 0.8% 100%# 20,083 7,341 4,509 1,147 247 33,327% 60.3% 22.0% 13.5% 3.4% 0.7% 100%# 23,072 3,708 4,686 1,471 32 32,969% 70.0% 11.2% 14.2% 4.5% 0.1% 100%
2009–10
Su
F
Sp

SONOMA COUNTY JUNIOR COLLEGE DISTRICT — Fact Book 2010 E – 17
Enrollment by Enrollment StatusFall 2002 ‐ Fall 2009, End of Semester
10,000
15,000
20,000
25,000
0
5,000
2002 2003 2004 2005 2006 2007 2008 2009
Continuing New Returning Concurrent
Source: Internal SRJC data (NSR/STRM740)
Student Enrollment by Enrollment Status
Definition of Measure: This measure reports unduplicated headcount by enrollment status and term for continuing, new, returning, and concurrent students in the Summer, Fall and Spring semesters, as of the End of Semester. New, returning, and concurrent enrollment status is self‐reported on the admissions application; continuing enrollment status is based on the student being enrolled the previous semester.
Source: Internal SRJC data (NSR/STRM740)
Use(s) of Measure: This measure is an indicator of enrollment patterns, which affect fiscal stability; it is used for planning purposesstability; it is used for planning purposes.
Analysis: Continuing students have comprised around 60% of total enrollment, peaking at 70% in Spring 2010. In the Summer 2009, this trend reversed when continuing enrollment decreased to 34% and new students grew to almost 47% ‐ the largest proportion of new students in the Summer in the past eight years.
Concurrent enrollment dropped in all semesters in 2009–10. This trend began in the Summer 2003 due the passage of Senate Bill 338 that limits the number of concurrent enrollments.
www.santarosa.edu/researchOffice of Institutional Research Enrollment • E – 17
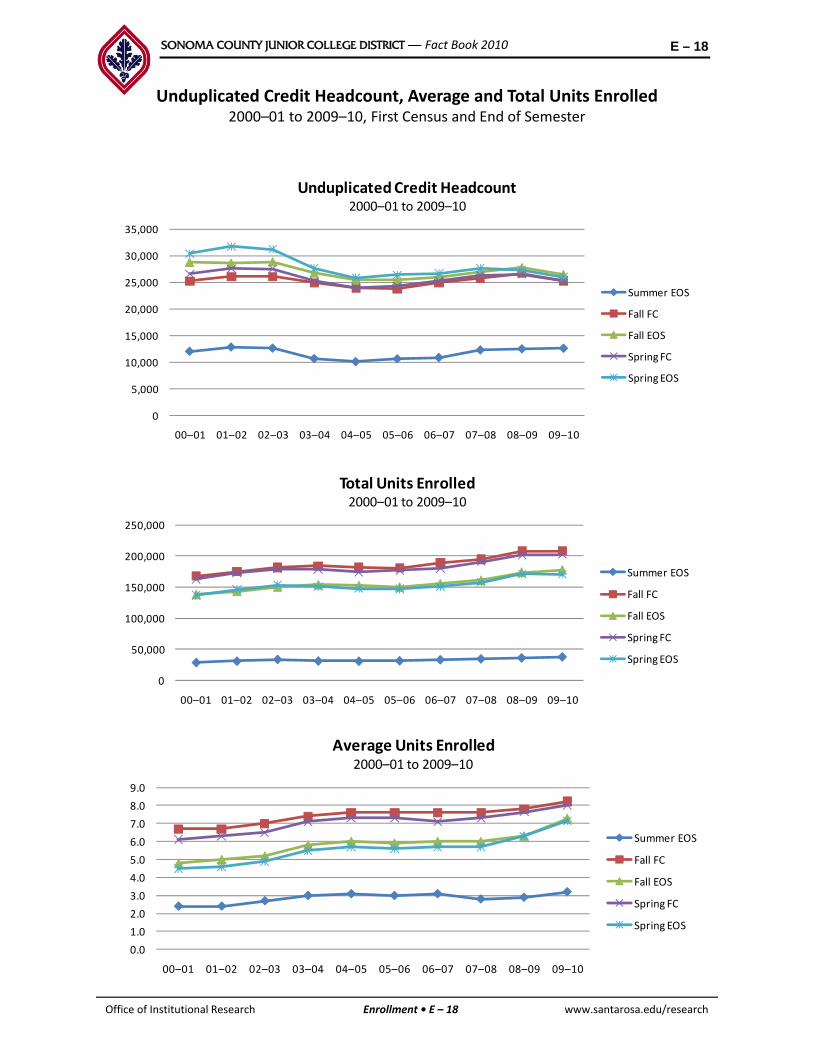
SONOMA COUNTY JUNIOR COLLEGE DISTRICT — Fact Book 2010 E – 18
Unduplicated Credit Headcount, Average and Total Units Enrolled2000–01 to 2009–10, First Census and End of Semester
30,000
35,000
Unduplicated Credit Headcount2000–01 to 2009–10
5,000
10,000
15,000
20,000
25,000Summer EOS
Fall FC
Fall EOS
Spring FC
Spring EOS
0
00–01 01–02 02–03 03–04 04–05 05–06 06–07 07–08 08–09 09–10
250 000
Total Units Enrolled2000–01 to 2009–10
50 000
100,000
150,000
200,000
250,000
Summer EOS
Fall FC
Fall EOS
Spring FC
0
50,000
00–01 01–02 02–03 03–04 04–05 05–06 06–07 07–08 08–09 09–10
Spring EOS
Average Units Enrolled2000–01 to 2009–10
3.0
4.0
5.0
6.0
7.0
8.0
9.0
Summer EOS
Fall FC
Fall EOS
Spring FC
www.santarosa.edu/researchOffice of Institutional Research Enrollment • E – 18
0.0
1.0
2.0
00–01 01–02 02–03 03–04 04–05 05–06 06–07 07–08 08–09 09–10
Spring FC
Spring EOS

SONOMA COUNTY JUNIOR COLLEGE DISTRICT — Fact Book 2010 E – 19
HeadcountTotal
Units
Average
Units
Enrolled
HeadcountTotal
Units
Average
Units
Enrolled
Su EOS 12,069 29,318 2.4
FC 25,233 167,863 6.7
EOS 28,711 138,414 4.8
Sp FC 26,584 162,843 6.1
EOS 30,412 136,884 4.5
Su EOS 12,866 31,463 2.4
FC 26,066 175,023 6.7F
2000
–01
2001
F
Su EOS 10,682 31,979 3.0
FC 23,777 180,690 7.6
EOS 25,433 150,234 5.9
FC 24,331 176,937 7.3
EOS 26,397 147,360 5.6
Su EOS 10,919 33,608 3.1
FC 24,974 189,222 7.6
2005
–06
F
Sp
2006 FEOS 28,576 143,362 5.0
Sp FC 27,594 173,068 6.3
EOS 31,712 146,264 4.6
Su EOS 12,657 34,095 2.7
FC 26,049 181,780 7.0
EOS 28,819 150,244 5.2
FC 27,535 179,570 6.5
F
F
2001
–02
2002
–03
Sp
EOS 25,982 155,613 6.0
FC 25,277 180,095 7.1
EOS 26,679 150,923 5.7
Su EOS 12,316 35,008 2.8
FC 25,807 194,962 7.6
EOS 26,907 161,034 6.0
FC 26,356 191,083 7.3
2006
–07
F
Sp
2007
–08
F
SEOS 31,173 153,246 4.9
Su EOS 10,721 31,645 3.0
FC 24,936 184,158 7.4
EOS 26,734 153,801 5.8
FC 25,265 178,782 7.1
EOS 27,620 150,951 5.5
S EOS 10 161 31 363 3 1
2003
–04
F
Sp
Sp
, ,
EOS 27,623 157,541 5.7
Su EOS 10,721 31,645 3.0
FC 26,693 207,672 7.8
EOS 26,734 153,801 5.8
FC 26,490 201,982 7.6
EOS 27,620 150,951 5.5
S EOS 12 629 38 074 3 2
2008
–09
F
Sp
Sp
Unduplicated Credit Headcount, Total Units Enrolled, andNote: FC = First Census; EOS = End of Semester
Su EOS 10,161 31,363 3.1
FC 23,919 181,693 7.6
EOS 25,406 152,676 6.0
FC 23,988 174,305 7.3
EOS 25,871 147,468 5.7
2004
–05
F
Sp
Su EOS 12,629 38,074 3.2
FC 25,801 210,525 8.2
EOS 26,449 177,395 7.3
FC 25,242 202,447 8.0
EOS 25,935 170,544 7.2Sp
2009
–10
F
Unduplicated Credit Headcount, Total Units Enrolled, andAverage Units Enrolled
Definition of Measure: This measure reports unduplicated credit headcount (the total number of students enrolled in credit courses), total units enrolled and average units enrolled (unduplicated credit headcount divided by total units) for Summer, Fall, and Spring semesters as of First Census and the End of Semester.
Source: Internal SRJC data (NSR/STRM740)
Use(s) of Measure: This measure is an indicator of enrollment patterns, which affect fiscal stability; it is used for planning purposes.
Analysis: Unduplicated credit headcount at First Census rose to an all‐time high for Spring 2002, then dropped again in 2003–04 due in part to enrollment fees increases. Credit headcount slowly increased until 2009–10 when budget cuts decreased course offerings and headcount reflected that changed.
Total units enrolled and average units enrolled rose steadily together beginning in 2001 02; while
www.santarosa.edu/researchOffice of Institutional Research Enrollment • E – 19
Total units enrolled and average units enrolled rose steadily together beginning in 2001–02; while enrollment peaked. When enrollment dipped, the students who were enrolled took more units on average.
SONOMA COUNTY JUNIOR COLLEGE DISTRICT — Fact Book 2010 E – 20
First Time Freshmen by Age and Semester
Definition of Measure: Total number of credit and noncredit first time freshmen by age forDefinition of Measure: Total number of credit and noncredit first‐time freshmen by age for Summer, Fall, and Spring semesters as of the End of Semester. First‐time freshmen are defined as never having attended any college; students self‐report this information on their application for admission. This measure excludes high school concurrent enrollments and international students.
Accessibility: SRJC has converted to a new Student Information System (SIS). Many Information Technology reports used in past Fact Books are now being updated andInformation Technology reports used in past Fact Books are now being updated and combined to minimize duplication and increase efficiency. While this conversion is in process, Fact Book users are being directed to the California Community College Chancellor’s Office Data Mart website to gain access to the District’s MIS* data. This measure can be accessed in previous Fact Books at: www.santarosa.edu/research.
Below are the instructions to access the specific data for this report.
California Community Colleges Chancellor’s Office Data Mart Student Demographics for College/Statewide by Term file:https://misweb.cccco.edu/mis/onlinestat/studdemo_coll_cube.cfm
To get SRJC data:Select “Santa Rosa” under College;S l t Y d T d d ( l /t b l t d)Select Year and Term needed (only one year/term can be selected);Select “Enrollment Status” under Column 1 Heading;Select “Academic Level” under Column 2 Heading;Select “Age” under Column 3 Heading;Click “Get Report” button
To get Statewide data:Select “Statewide” under College;Select Statewide under College;Select Year and Term needed (only one year/term can be selected);Select “Enrollment Status” under Column 1 Heading;Select “Academic Level” under Column 2 Heading;Select “Age” under Column 3 Heading;Click “Get Report” button
To download data, click on the “Download” hyperlink on the results page.To download data, click on the Download hyperlink on the results page.
*Limitations to MIS dataData does not include credit students enrolled in full term courses earning less than .50 units and credit and noncredit students enrolled in short term courses with 8 or less hours of attendance
www.santarosa.edu/researchOffice of Institutional Research Enrollment • E – 20

SONOMA COUNTY JUNIOR COLLEGE DISTRICT — Fact Book 2010 E – 21
Unduplicated Headcount by LocationFall 2000 – Fall 2009
60%
70%
80%
90%
100%Brickyard Center
Tech Acad / Online
Windsor
North Coast
SR Off‐Campus
0%
10%
20%
30%
40%
50% West County
Sonoma
North County
PSTC
Coddtwn/ Roh Park
Petaluma Campus0%
2000 2001 2002 2003 2004 2005 2006 2007 2008 2009 SR Campus
00–01 01–02 02–03 03–04 04–05 05–06 06–07 07–08 08–09 09–10
18,460 19,980 19,679 17,770 17,613 17,754 18,472 20,208 20,269 19,799
35,349 36,168 36,849 34,536 33,133 33,522 34,212 35,678 36,226 33,327
37,738 40,131 39,407 36,107 33,892 35,267 35,697 36,460 36,338 32,969
District
Totals
Su
F
Sp
00–01 01–02 02–03 03–04 04–05 05–06 06–07 07–08 08–09 09–10
# 9,514 10,683 10,075 8,966 8,802 9,076 9,557 10,471 10,711 9,388
% 48.7% 50.1% 48.2% 48.3% 47.8% 48.8% 49.3% 49.4% 50.3% 50.0%
# 22,186 22,529 22,648 22,269 21,355 21,600 21,707 22,739 23,398 21,416
% 56.1% 55.1% 54.2% 57.1% 56.9% 56.8% 56.3% 56.2% 57.4% 60.2%
# 23,289 23,654 24,064 22,939 21,704 21,980 22,131 22,948 23,378 21,270
% 54.3% 52.2% 54.0% 56.2% 56.7% 55.3% 55.0% 55.7% 56.7% 60.2%
Su
F
Sp
SR Campus
# 1,879 1,887 2,086 2,198 2,087 2,137 2,090 2,493 2,448 1,980
% 9.6% 8.8% 10.0% 11.8% 11.3% 11.5% 10.8% 11.8% 11.5% 10.5%
# 5,646 5,436 5,780 5,905 5,903 5,774 5,830 6,024 6,373 6,087
% 14.3% 13.3% 13.8% 15.1% 15.7% 15.2% 15.1% 14.9% 15.6% 17.1%
# 5,671 5,999 6,162 6,147 5,521 5,760 5,779 6,000 6,260 6,079
% 13.2% 13.2% 13.8% 15.1% 14.4% 14.5% 14.4% 14.6% 15.2% 17.2%
# 1 451 1 165 1 002
Su
F
Sp
Petaluma
Campus
# 1,451 1,165 1,002 — — — — — — —
% 7.4% 5.5% 4.8% — — — — — — —
# 1,923 1,579 1,319 — — — — — — —
% 4.9% 3.9% 3.2% — — — — — — —
# 2,259 1,946 1,515 29 — — — — — —
% 5.3% 4.3% 3.4% 0.1% — — — — — —
# 1,026 1,211 860 713 667 648 685 718 572 704
% 5 3% 5 7% 4 1% 3 8% 3 6% 3 5% 3 5% 3 4% 2 7% 3 7%
Su
Codding‐
town
P bli
F
Sp
Su
www.santarosa.edu/researchOffice of Institutional Research Enrollment • E – 21
% 5.3% 5.7% 4.1% 3.8% 3.6% 3.5% 3.5% 3.4% 2.7% 3.7%
# 1,913 1,466 1,851 1,530 1,433 1,547 1,491 1,446 1,217 1,395
% 4.8% 3.6% 4.4% 3.9% 3.8% 4.1% 3.9% 3.6% 3.0% 3.9%
# 2,179 2,810 2,435 1,806 1,947 1,947 1,826 1,720 1,646 1,485
% 5.1% 6.2% 5.5% 4.4% 5.1% 4.9% 4.5% 4.2% 4.0% 4.2%Sp
Public
Safety
Training
Center
F
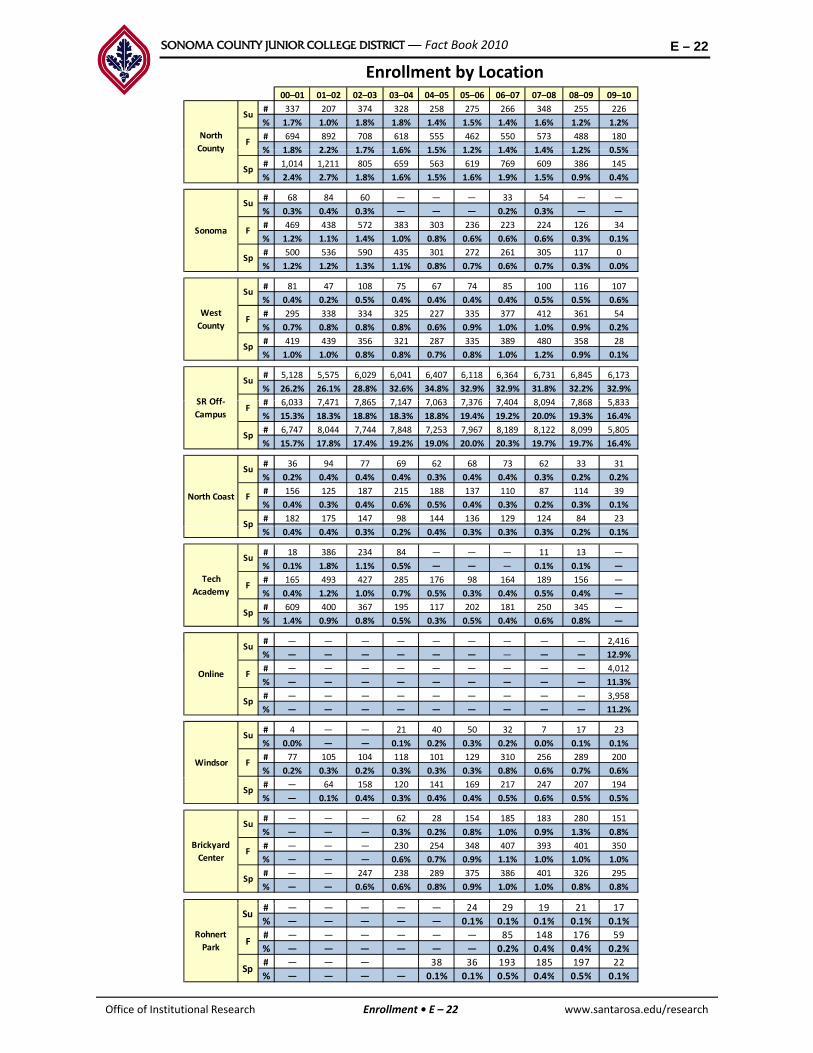
SONOMA COUNTY JUNIOR COLLEGE DISTRICT — Fact Book 2010 E – 22
Enrollment by Location00–01 01–02 02–03 03–04 04–05 05–06 06–07 07–08 08–09 09–10
# 337 207 374 328 258 275 266 348 255 226
% 1.7% 1.0% 1.8% 1.8% 1.4% 1.5% 1.4% 1.6% 1.2% 1.2%
# 694 892 708 618 555 462 550 573 488 180
% 1 8% 2 2% 1 7% 1 6% 1 5% 1 2% 1 4% 1 4% 1 2% 0 5%
Su
FNorth
County % 1.8% 2.2% 1.7% 1.6% 1.5% 1.2% 1.4% 1.4% 1.2% 0.5%
# 1,014 1,211 805 659 563 619 769 609 386 145
% 2.4% 2.7% 1.8% 1.6% 1.5% 1.6% 1.9% 1.5% 0.9% 0.4%
# 68 84 60 — — — 33 54 — —
% 0.3% 0.4% 0.3% — — — 0.2% 0.3% — —
# 469 438 572 383 303 236 223 224 126 34
% 1.2% 1.1% 1.4% 1.0% 0.8% 0.6% 0.6% 0.6% 0.3% 0.1%
# 500 536 590 435 301 272 261 305 117 0
% 1.2% 1.2% 1.3% 1.1% 0.8% 0.7% 0.6% 0.7% 0.3% 0.0%
County
F
Sp
Sp
Su
Sonoma
# 81 47 108 75 67 74 85 100 116 107
% 0.4% 0.2% 0.5% 0.4% 0.4% 0.4% 0.4% 0.5% 0.5% 0.6%
# 295 338 334 325 227 335 377 412 361 54
% 0.7% 0.8% 0.8% 0.8% 0.6% 0.9% 1.0% 1.0% 0.9% 0.2%
# 419 439 356 321 287 335 389 480 358 28
% 1.0% 1.0% 0.8% 0.8% 0.7% 0.8% 1.0% 1.2% 0.9% 0.1%
# 5,128 5,575 6,029 6,041 6,407 6,118 6,364 6,731 6,845 6,173
% 26.2% 26.1% 28.8% 32.6% 34.8% 32.9% 32.9% 31.8% 32.2% 32.9%
# 6 033 7 471 7 865 7 147 7 063 7 376 7 404 8 094 7 868 5 833SR Off
West
County
Su
F
Sp
Su
# 6,033 7,471 7,865 7,147 7,063 7,376 7,404 8,094 7,868 5,833
% 15.3% 18.3% 18.8% 18.3% 18.8% 19.4% 19.2% 20.0% 19.3% 16.4%
# 6,747 8,044 7,744 7,848 7,253 7,967 8,189 8,122 8,099 5,805
% 15.7% 17.8% 17.4% 19.2% 19.0% 20.0% 20.3% 19.7% 19.7% 16.4%
# 36 94 77 69 62 68 73 62 33 31
% 0.2% 0.4% 0.4% 0.4% 0.3% 0.4% 0.4% 0.3% 0.2% 0.2%
# 156 125 187 215 188 137 110 87 114 39
% 0.4% 0.3% 0.4% 0.6% 0.5% 0.4% 0.3% 0.2% 0.3% 0.1%
# 182 175 147 98 144 136 129 124 84 23
SR Off‐
Campus
North Coast F
Sp
Su
F
Sp
% 0.4% 0.4% 0.3% 0.2% 0.4% 0.3% 0.3% 0.3% 0.2% 0.1%
# 18 386 234 84 — — — 11 13 —
% 0.1% 1.8% 1.1% 0.5% — — — 0.1% 0.1% —
# 165 493 427 285 176 98 164 189 156 —
% 0.4% 1.2% 1.0% 0.7% 0.5% 0.3% 0.4% 0.5% 0.4% —
# 609 400 367 195 117 202 181 250 345 —
% 1.4% 0.9% 0.8% 0.5% 0.3% 0.5% 0.4% 0.6% 0.8% —
# — — — — — — — — — 2,416
% 12 9%Su
Tech
Academy
Sp
Sp
F
Su
% — — — — — — — — — 12.9%
# — — — — — — — — — 4,012
% — — — — — — — — — 11.3%
# — — — — — — — — — 3,958
% — — — — — — — — — 11.2%
# 4 — — 21 40 50 32 7 17 23
% 0.0% — — 0.1% 0.2% 0.3% 0.2% 0.0% 0.1% 0.1%
# 77 105 104 118 101 129 310 256 289 200
% 0.2% 0.3% 0.2% 0.3% 0.3% 0.3% 0.8% 0.6% 0.7% 0.6%
Online F
Sp
FWindsor
Su
# — 64 158 120 141 169 217 247 207 194
% — 0.1% 0.4% 0.3% 0.4% 0.4% 0.5% 0.6% 0.5% 0.5%
# — — — 62 28 154 185 183 280 151
% — — — 0.3% 0.2% 0.8% 1.0% 0.9% 1.3% 0.8%
# — — — 230 254 348 407 393 401 350
% — — — 0.6% 0.7% 0.9% 1.1% 1.0% 1.0% 1.0%
# — — 247 238 289 375 386 401 326 295
% — — 0.6% 0.6% 0.8% 0.9% 1.0% 1.0% 0.8% 0.8%
Sp
Brickyard
Center
Su
F
Sp
www.santarosa.edu/researchOffice of Institutional Research Enrollment • E – 22
# — — — — — 24 29 19 21 17
% — — — — — 0.1% 0.1% 0.1% 0.1% 0.1%
# — — — — — — 85 148 176 59
% — — — — — — 0.2% 0.4% 0.4% 0.2%
# — — — 38 36 193 185 197 22
% — — — — 0.1% 0.1% 0.5% 0.4% 0.5% 0.1%
Rohnert
Park
Su
F
Sp

SONOMA COUNTY JUNIOR COLLEGE DISTRICT — Fact Book 2010 E – 23
Unduplicated Headcount by LocationSummer 2009 – Spring 2010, End of Semester
60%
70%
80%
90%
100%
Brickyard Center
Online
Windsor
North Coast
SR Off‐Campus
West County
0%
10%
20%
30%
40%
50%
60%
Summer 2009 Fall 2009 Spring 2010
West County
Sonoma
North County
Pub Safety TC
Rohnert Park
Petaluma
SR Campus
Source: Internal SRJC Data (NSR/STRM740)
Notes: FC = First Census; EOS = End of Semester; CTM = Coddingtown Mall; PSTC = Public Safety Training Center
Opening dates: Petaluma campus — Spring 1995; CTM — Fall 1997; Tech Academy — Spring 2000;
and PSTC — Spring 2002.
Numbers under PSTC include the Criminal Justice Center at Los Guillicos and the SRJC Training Center at Two Rock, which were in place before PSTC opened in Windsor.
Enrollment by Location
Definition of Measure: The unduplicated headcount at the End of Semester by locations where classes are offered, including both credit and noncredit courses.
Note: Unduplicated headcount includes total student count (one SSN# counted one time) for the district total. As a result, the unduplicated district total does not equal the sum of all the locations. For example, a student taking courses at more than one campus is counted once in each location.
Source: Internal SRJC data (NSR/SIS740)
Use(s) of Measure: This measure is used to show the historical enrollment trends to assist planning and scheduling by location and for the District.
Analysis: Enrollment by location shifted in 2009–10 when Online became its own location. Since Online courses were included in Santa Rosa and Petaluma locations, proportions slightly decreased at these two campuses. Santa Rosa Campus has approximately 50% of the enrollments each semester, Petaluma Campus proportion has remained approximately 15%. Santa Rosa Off‐campus, where the majority of noncredit courses are offered, decreased its proportion in 2009–10, due to a reduction of courses offered.
www.santarosa.edu/researchOffice of Institutional Research Enrollment • E – 23

SONOMA COUNTY JUNIOR COLLEGE DISTRICT — Fact Book 2010 E – 24
100%
Units Enrolled by LocationFall 2000 – Fall 2009
Shone Farm
40%
50%
60%
70%
80%
90%Brickyard Center
Tech Acad/Online*
Windsor
North Coast
SR Off‐Campus
West County
Sonoma
0%
10%
20%
30%
40%
2000 2001 2002 2003 2004 2005 2006 2007 2008 2009
Sonoma
North County
PSTC
Coddtown/ Roh Park
Petaluma Campus
SR Campus
00–01 01–02 02–03 03–04 04–05 05–06 06–07 07–08 08–09 09–1000 01 01 02 02 03 03 04 04 05 05 06 06 07 07 08 08 09 09 10
29,318 31,463 34,095 31,645 31,363 31,979 33,608 35,008 36,506 38,074
138,414 143,362 150,244 153,794 152,676 150,234 155,613 161,034 173,741 177,395
136,884 146,264 153,246 150,951 147,468 147,360 150,923 157,541 171,114 170,544
00–01 01–02 02–03 03–04 04–05 05–06 06–07 07–08 08–09 09–10
# 21,247 23,442 24,983 23,632 22,714 23,527 24,982 26,089 28,092 23,519
% 72.5% 74.5% 73.3% 74.7% 72.4% 73.6% 74.3% 74.5% 77.0% 61.8%
# 113,016 116,109 120,874 123,809 122,366 121,189 122,096 127,201 136,868 131,622
% 81.7% 81.0% 80.5% 80.5% 80.1% 80.7% 78.5% 79.0% 78.8% 74.2%
District
Totals
Su
F
Sp
SR Campus
Su
F
# 110,273 115,855 120,272 120,995 118,216 116,386 117,618 124,102 134,194 125,453
% 80.6% 79.2% 78.5% 80.2% 80.2% 79.0% 77.9% 78.8% 78.4% 73.6%
# 3,381 3,677 4,676 4,636 4,576 4,708 4,628 5,002 4,769 4,688
% 11.5% 11.7% 13.7% 14.7% 14.6% 14.7% 13.8% 14.3% 13.1% 12.3%
# 17,223 17,539 18,634 20,998 22,232 21,650 23,247 23,985 27,387 27,857
% 12.4% 12.2% 12.4% 13.7% 14.6% 14.4% 14.9% 14.9% 15.8% 15.7%
# 15,715 17,598 19,373 20,095 19,463 20,537 21,518 22,263 25,909 26,567
% 11.5% 12.0% 12.6% 13.3% 13.2% 13.9% 14.3% 14.1% 15.1% 15.6%
# 1 051 759 712
Sp
Petaluma
Su
F
Sp
# 1,051 759 712 — — — — — — —% 3.6% 2.4% 2.1% — — — — — — —# 1,335 1,108 1,348 — — — — — — —% 1.0% 0.8% 0.9% — — — — — — —# 1,726 1,509 1,828 — — — — — — —% 1.3% 1.0% 1.2% — — — — — — —
# 3,227 2,821 2,961 2,720 3,599 3,131 3,259 3,062 2,668 3,148% 11.0% 9.0% 8.7% 8.6% 11.5% 9.8% 9.7% 8.7% 7.3% 8.3%# 4,008 3,936 4,690 4,327 4,134 4,258 5,395 4,941 4,393 4,369% 2 9% 2 7% 3 1% 2 8% 2 7% 2 8% 3 5% 3 1% 2 5% 2 5%
Codding‐
town
Su
F
Sp
Public
Safety
Training
Su
F% 2.9% 2.7% 3.1% 2.8% 2.7% 2.8% 3.5% 3.1% 2.5% 2.5%# 5,347 6,262 6,255 5,521 5,728 6,318 6,541 5,780 5,645 5,229% 3.9% 4.3% 4.1% 3.7% 3.9% 4.3% 4.3% 3.7% 3.3% 3.1%
# 57 26 112 66 27 23 14 57 41 —
% 0.2% 0.1% 0.3% 0.2% 0.1% 0.1% 0.0% 0.2% 0.1% —
# 683 849 608 588 380 310 404 444 311 —
% 0.5% 0.6% 0.4% 0.4% 0.2% 0.2% 0.3% 0.3% 0.2% —
# 1,084 1,354 802 639 387 487 617 398 239 —
% 0.8% 0.9% 0.5% 0.4% 0.3% 0.3% 0.4% 0.3% 0.1% —
Training
CenterSp
North
County
Su
F
Sp
www.santarosa.edu/researchOffice of Institutional Research Enrollment • E – 24
# — — — — — 23 26 16 20 16
% — — — — — 0.1% 0.1% 0.0% 0.1% 0.0%
# — — — — — — 159 264 252 89
% — — — — — — 0.1% 0.2% 0.1% 0.1%
# — — — 19 28 23 261 276 272 17
% — — — 0.0% 0.0% 0.0% 0.2% 0.2% 0.2% 0.0%
Rohnert
Park
Su
F
Sp

SONOMA COUNTY JUNIOR COLLEGE DISTRICT — Fact Book 2010 E – 25
Units by Location
00–01 01–02 02–03 03–04 04–05 05–06 06–07 07–08 08–09 09–10
# 91 142 87 — — — 35 51 — —
% 0.3% 0.4% 0.3% — — — 0.1% 0.1% — —
853 712 887 637 441 361 506 391 220 78
Su
# 853 712 887 637 441 361 506 391 220 78
% 0.6% 0.5% 0.6% 0.4% 0.3% 0.2% 0.3% 0.2% 0.1% 0.0%
# 788 894 871 559 522 358 419 480 214 —
% 0.6% 0.6% 0.6% 0.4% 0.4% 0.2% 0.3% 0.3% 0.1% —
# 24 — 60 — — — 20 51 48 24
% 0.1% — 0.2% — — — 0.1% 0.1% 0.1% 0.1%
# 346 478 530 243 200 243 484 551 400 —
% 0.2% 0.3% 0.4% 0.2% 0.1% 0.2% 0.3% 0.3% 0.2% —
# 449 576 457 408 268 406 602 598 466 —
Sonoma F
Sp
West
County
Su
F
Sp% 0.3% 0.4% 0.3% 0.3% 0.2% 0.3% 0.4% 0.4% 0.3% —
# 160 47 148 234 233 168 284 271 275 219
% 0.5% 0.1% 0.4% 0.7% 0.7% 0.5% 0.8% 0.8% 0.8% 0.6%
# 494 1,098 1,293 980 805 801 1,037 1,136 853 244
% 0.4% 0.8% 0.9% 0.6% 0.5% 0.5% 0.7% 0.7% 0.5% 0.1%
# 413 1,101 1,193 967 996 945 1,359 1,372 799 130
% 0.3% 0.8% 0.8% 0.6% 0.7% 0.6% 0.9% 0.9% 0.5% 0.1%
# 75 81 99 77 69 78 72 80 74 51
% 0 3% 0 3% 0 3% 0 2% 0 2% 0 2% 0 2% 0 2% 0 2% 0 1%Su
Sp
SR Off‐
Campus
Su
F
Sp
% 0.3% 0.3% 0.3% 0.2% 0.2% 0.2% 0.2% 0.2% 0.2% 0.1%
# 191 142 314 352 318 175 129 101 140 45
% 0.1% 0.1% 0.2% 0.2% 0.2% 0.1% 0.1% 0.1% 0.1% 0.0%
# 200 301 189 113 186 220 224 207 174 69
% 0.1% 0.2% 0.1% 0.1% 0.1% 0.1% 0.1% 0.1% 0.1% 0.0%
# 8 469 257 101 — — — 30 36 —
% 0.0% 1.5% 0.8% 0.3% — — — 0.1% 0.1% —
# 195 1,161 996 717 567 312 480 563 507 —
% 0.1% 0.8% 0.7% 0.5% 0.4% 0.2% 0.3% 0.3% 0.3% —
North Coast
Tech
Academy F
F
Sp
Su
# 891 774 755 442 296 478 429 586 1,031 —
% 0.7% 0.5% 0.5% 0.3% 0.2% 0.3% 0.3% 0.4% 0.6% —
# — — — — — — — — — 6,040
% — — — — — — — — — 15.9%
# — — — — — — — — — 10,963
% — — — — — — — — — 6.2%
# — — — — — — — — — 10,872
% — — — — — — — — — 6.4%
Online
Su
F
Sp
Sp
# — — — — 19 27 — — — —
% — — — — 0.1% 0.1% — — — —
# 72 225 71 34 54 100 581 487 551 459
% 0.1% 0.2% 0.05% 0.02% 0.04% 0.1% 0.4% 0.3% 0.3% 0.3%
# — 42 90 58 95 128 266 375 353 423
% — 0.03% 0.1% 0.04% 0.1% 0.1% 0.2% 0.2% 0.2% 0.2%
# — — — 179 126 294 288 300 329 263
% — — — 0.6% 0.4% 0.9% 0.9% 0.9% 0.9% 0.7%
# — — — 1,110 1,179 836 1,097 971 1,075 975Brickyard
Su
F
F
Sp
Su
Windsor
# 1,110 1,179 836 1,097 971 1,075 975
% — — — 0.7% 0.8% 0.6% 0.7% 0.6% 0.6% 0.5%
# — — 1,140 1,135 1,285 1,076 1,069 1,108 992 1,021
% — — 0.7% 0.8% 0.9% 0.7% 0.7% 0.7% 0.6% 0.6%
# — — — — — — — — 154 107
% — — — — — — — — 0.4% 0.3%
# — — — — — — — — 797 694
% — — — — — — — — 0.5% 0.4%
# — — — — — — — — 827 764
% — — — — — — — — 0 5% 0 4%
Shone
Farm
Su
F
Sp
y
CenterF
Sp
www.santarosa.edu/researchOffice of Institutional Research Enrollment • E – 25
Source: Internal SRJC Data (NSR/STRM740)
Notes: CTM = Coddingtown Mall; PSTC = Public Safety Training Center (includes Criminal Justice Center at Los Guillicos and SRJC Training Center at Two Rock)
* A student taking courses at more than one campus counted once in each location. Location is derived from budget codes and does not always coincide with the physical location of where classes are taught.
% — — — — — — — — 0.5% 0.4%
SONOMA COUNTY JUNIOR COLLEGE DISTRICT — Fact Book 2010 E – 26
Units by Location
Definition of Measure: The total units enrolled by semester for each location where the courses are offered at the End of Semester. Unit count figures reflect only those courses which the student is taking at that location. The district total is the combination of all credit units.
NOTE:Most current data available at time of publication. Location is derived from budget codes and does not always reflect the physical location of where classes are taught.
Source: Internal SRJC data (NSR/STRM740)Source: Internal SRJC data (NSR/STRM740)
Use(s) of Measure: This measure shows the trends of unit totals by location and is used for planning and facility development.
Analysis: Units by location shifted in 2009–10 when Online became its own location. Since Online courses were included in Santa Rosa and Petaluma locations, proportions slightly decreased at these two campuses. The majority of units enrolled are at the Santa Rosa campus, followed by the Petaluma campus and the Public Safety Training Center Petaluma Campus portion of the District’sPetaluma campus and the Public Safety Training Center. Petaluma Campus portion of the District s unit load remained stable at almost 16% in Fall 2009. Public Safety Training Center maintained approximately 3% of the district’s total units during Fall 2009 and Spring 2010.
www.santarosa.edu/researchOffice of Institutional Research Enrollment • E – 26

SONOMA COUNTY JUNIOR COLLEGE DISTRICT — Fact Book 2010 E – 27
High School Concurrent Enrollment2000 01 2009 10 E d f S
1 00
2,000
2,500
3,000
3,500
2000–01 to 2009–10, End of Semester
0
500
1,000
1,500
00–01 01–02 02–03 03–04 04–05 05–06 06–07 07–08 08–09 09–10
High School Concurrent Enrollment — Summer, Fall and Spring End of Semester
Summer Fall Spring
Source: Internal SRJC data (High School Concurrent Enrollment, NSR/STRM740)
00–01 01–02 02–03 03–04 04–05 05–06 06–07 07–08 08–09 09–10
Summer 1,978 2,223 2,399 984 884 963 1,055 1,091 1,044 990
Fall 1,611 1,623 1,773 1,371 1,229 1,281 1,583 1,630 1,603 1,147
Spring 2,501 2,751 2,915 2,277 1,612 2,092 2,186 2,037 1,950 1,471
High School Concurrent Enrollment
Definition of Measures: A chart and table of the unduplicated number of high school students enrolled concurrently at Santa Rosa Junior College at the End of Semester.
Source: Internal SRJC data (High School Concurrent Enrollment, NSR/STRM740)
Use(s) of Measures: This measure shows the trend of total high school concurrent enrollment and the courses that high school students take at SRJC for planning purposes.
Analysis: Senate Bill 338 affected high school concurrent enrollment by limiting the number of concurrent enrollments. The enrollment of high school concurrent students increased steadily for Summer, Fall and Spring semesters until 2002–03, with a consistent pattern of enrollment highest in the Spring and lowest in the Fall.
www.santarosa.edu/researchOffice of Institutional Research Enrollment • E – 27
SONOMA COUNTY JUNIOR COLLEGE DISTRICT — Fact Book 2010 SO – 1
Student Outcomes
Introduction
This section of the Fact Book presents various measures of student outcomes, including access, completions, retention, degrees, certificates, and transfer data. Where available, the most recent state figures are used as a comparison.
SRJC awarded 4,308 degrees and certificates in the 2009–10 academic year. In 2002–03, SRJC , g y ,began offering degrees by major rather than by the more general Liberal Arts or Interdisciplinary Studies degree. Since then, there has been considerable diversification in the range of degrees awarded. In 2009–2010, SRJC awarded 1,426 degrees – 995 Associate of Arts and 431 Associate of Sciences ‐ its highest number in the past five years.
Santa Rosa Junior College supplied almost 1.5% of all California Community College transfer students to both the University of California system and the California State University system – a total of 796 students in 2009–10 The majority of SRJC transfer students enroll in the Californiatotal of 796 students in 2009–10. . The majority of SRJC transfer students enroll in the California State University system. The number of students transferring from SRJC to University of California increased (17%) from 2008–09. In contrast, transfers to California State Universities decreased for SRJC (23%). This statewide trend is mostly due to limited admissions to CSU’s invoked by the state budget crisis
Where comparative data are available, outcomes show that SRJC students tend to outperform their counterparts who transfer from other colleges within California. SRJC transfers to the UC and CSU systems post higher GPAs and higher retention and persistence rates than transfer students from other California community colleges.
www.santarosa.edu/researchOffice of Institutional Research Student Outcomes • SO – 1
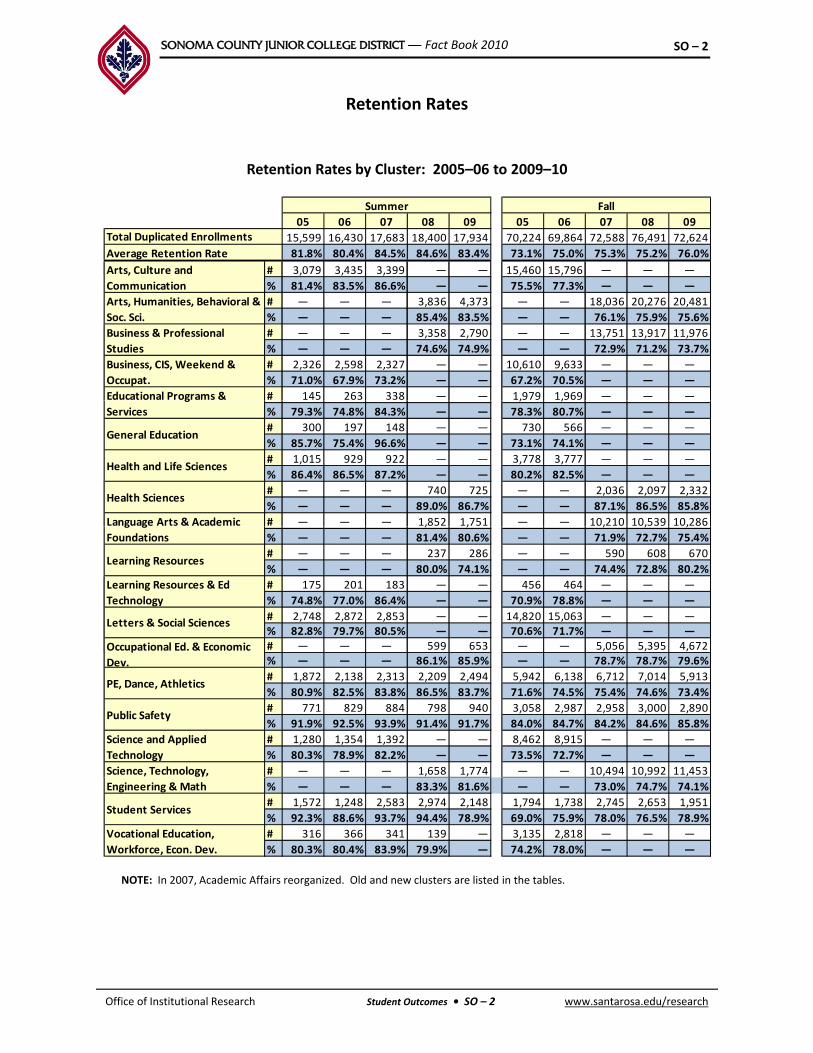
SONOMA COUNTY JUNIOR COLLEGE DISTRICT — Fact Book 2010 SO – 2
Retention Rates
Retention Rates by Cluster: 2005–06 to 2009–10
05 06 07 08 09 05 06 07 08 09
15,599 16,430 17,683 18,400 17,934 70,224 69,864 72,588 76,491 72,624
81.8% 80.4% 84.5% 84.6% 83.4% 73.1% 75.0% 75.3% 75.2% 76.0%
# 3,079 3,435 3,399 — — 15,460 15,796 — — —
Total Duplicated Enrollments
Average Retention Rate
Summer Fall
Arts, Culture and , , , , ,
% 81.4% 83.5% 86.6% — — 75.5% 77.3% — — —
# — — — 3,836 4,373 — — 18,036 20,276 20,481
% — — — 85.4% 83.5% — — 76.1% 75.9% 75.6%
# — — — 3,358 2,790 — — 13,751 13,917 11,976
% — — — 74.6% 74.9% — — 72.9% 71.2% 73.7%
# 2,326 2,598 2,327 — — 10,610 9,633 — — —
% 71.0% 67.9% 73.2% — — 67.2% 70.5% — — —
# 145 263 338 — — 1,979 1,969 — — —
,
Communication
Business, CIS, Weekend &
Occupat.
Educational Programs &
Business & Professional
Studies
Arts, Humanities, Behavioral &
Soc. Sci.
, ,
% 79.3% 74.8% 84.3% — — 78.3% 80.7% — — —
# 300 197 148 — — 730 566 — — —
% 85.7% 75.4% 96.6% — — 73.1% 74.1% — — —
# 1,015 929 922 — — 3,778 3,777 — — —
% 86.4% 86.5% 87.2% — — 80.2% 82.5% — — —
# — — — 740 725 — — 2,036 2,097 2,332
% — — — 89.0% 86.7% — — 87.1% 86.5% 85.8%
# — — — 1,852 1,751 — — 10,210 10,539 10,286
g
Services
Health Sciences
Health and Life Sciences
General Education
Language Arts & Academic , , , , ,
% — — — 81.4% 80.6% — — 71.9% 72.7% 75.4%
# — — — 237 286 — — 590 608 670
% — — — 80.0% 74.1% — — 74.4% 72.8% 80.2%
# 175 201 183 — — 456 464 — — —
% 74.8% 77.0% 86.4% — — 70.9% 78.8% — — —
# 2,748 2,872 2,853 — — 14,820 15,063 — — —% 82.8% 79.7% 80.5% — — 70.6% 71.7% — — —# — — — 599 653 — — 5,056 5,395 4,672Occupational Ed. & Economic
Letters & Social Sciences
Learning Resources & Ed
Technology
g g
Foundations
Learning Resources
% — — — 86.1% 85.9% — — 78.7% 78.7% 79.6%
# 1,872 2,138 2,313 2,209 2,494 5,942 6,138 6,712 7,014 5,913
% 80.9% 82.5% 83.8% 86.5% 83.7% 71.6% 74.5% 75.4% 74.6% 73.4%
# 771 829 884 798 940 3,058 2,987 2,958 3,000 2,890
% 91.9% 92.5% 93.9% 91.4% 91.7% 84.0% 84.7% 84.2% 84.6% 85.8%
# 1,280 1,354 1,392 — — 8,462 8,915 — — —
% 80.3% 78.9% 82.2% — — 73.5% 72.7% — — —
# — — — 1,658 1,774 — — 10,494 10,992 11,453Science, Technology,
p
Dev.
PE, Dance, Athletics
Public Safety
Science and Applied
Technology
NOTE: In 2007, Academic Affairs reorganized. Old and new clusters are listed in the tables.
% — — — 83.3% 81.6% — — 73.0% 74.7% 74.1%
# 1,572 1,248 2,583 2,974 2,148 1,794 1,738 2,745 2,653 1,951
% 92.3% 88.6% 93.7% 94.4% 78.9% 69.0% 75.9% 78.0% 76.5% 78.9%
# 316 366 341 139 — 3,135 2,818 — — —
% 80.3% 80.4% 83.9% 79.9% — 74.2% 78.0% — — —
Engineering & Math
Vocational Education,
Workforce, Econ. Dev.
Student Services
www.santarosa.edu/researchOffice of Institutional Research Student Outcomes • SO – 2

SONOMA COUNTY JUNIOR COLLEGE DISTRICT — Fact Book 2010 SO – 3
Retention Rates by Cluster, continued
06 07 08 09 10
69,836 69,599 72,964 73,367 70,634
73.8% 77.2% 75.8% 76.1% 76.6%
# 15,424 15,559 — — —
% 76.4% 79.3% — — —
# — — 18,211 19,898 20,238
Total Duplicated Enrollments
Average Retention Rate
Spring
Arts, Culture and
Communication
Arts, Humanities, Behavioral &
% — — 77.1% 76.3% 76.4%
# — — 14,519 12,485 11,091
% — — 73.6% 73.8% 73.9%
# 10,501 9,841 — — —
% 69.1% 73.2% — — —
# 2,177 2,096 — — —
% 78.1% 81.8% — — —
# 561 574 — — —
Business, CIS, Weekend &
Occupat.
Educational Programs &
Services
Business & CIS, CFS and
Culinary Arts
Soc. Sci.
# 561 574
% 74.2% 80.5% — — —
# 3,571 3,671 — — —
% 79.9% 83.4% — — —
# — — 2,035 2,133 2,101
% — — 87.5% 89.0% 85.8%
# — — 9,066 9,252 8,739
% — — 70.0% 71.9% 74.3%
General Education
Health and Life Sciences
Language Arts & Academic
Foundations
Health Sciences
# — — 634 702 808
% — — 75.9% 73.8% 75.7%
# 555 656 — — —
% 74.8% 76.7% — — —
# 13,934 14,331 — — —% 68.8% 73.5% — — —# — — 5,301 5,356 5,010% — — 81 1% 80 9% 81 9%
Learning Resources & Ed
Technology
Letters & Social Sciences
Occupational Ed. & Economic
Dev
Learning Resources
% 81.1% 80.9% 81.9%
# 6,509 6,818 7,418 7,281 6,414
% 73.1% 77.6% 76.2% 75.9% 76.4%
# 3,448 3,371 3,290 3,396 3,188
% 86.7% 87.0% 84.4% 86.5% 87.1%
# 8,197 8,245 — — —
% 72.9% 74.3% — — —
# — — 10,111 10,649 11,098
Public Safety
Science and Applied
Technology
PE, Dance, Athletics
Science, Technology,
Dev.
Note: In 2007, Academic Affairs reorganized. Old and new clusters are both listed in the tables above Summer 2007 data is in the prior cluster
% — — 73.0% 74.8% 74.1%
# 1,897 1,677 2,379 2,215 1,857
% 74.7% 76.7% 76.6% 74.8% 77.3%
# 3,062 2,760 — — —
% 76.6% 82.2% — — —
Student Services
Vocational Education,
Workforce, Econ. Dev.
Engineering & Math
www.santarosa.edu/researchOffice of Institutional Research Student Outcomes • SO – 3
both listed in the tables above. Summer 2007 data is in the prior cluster format.
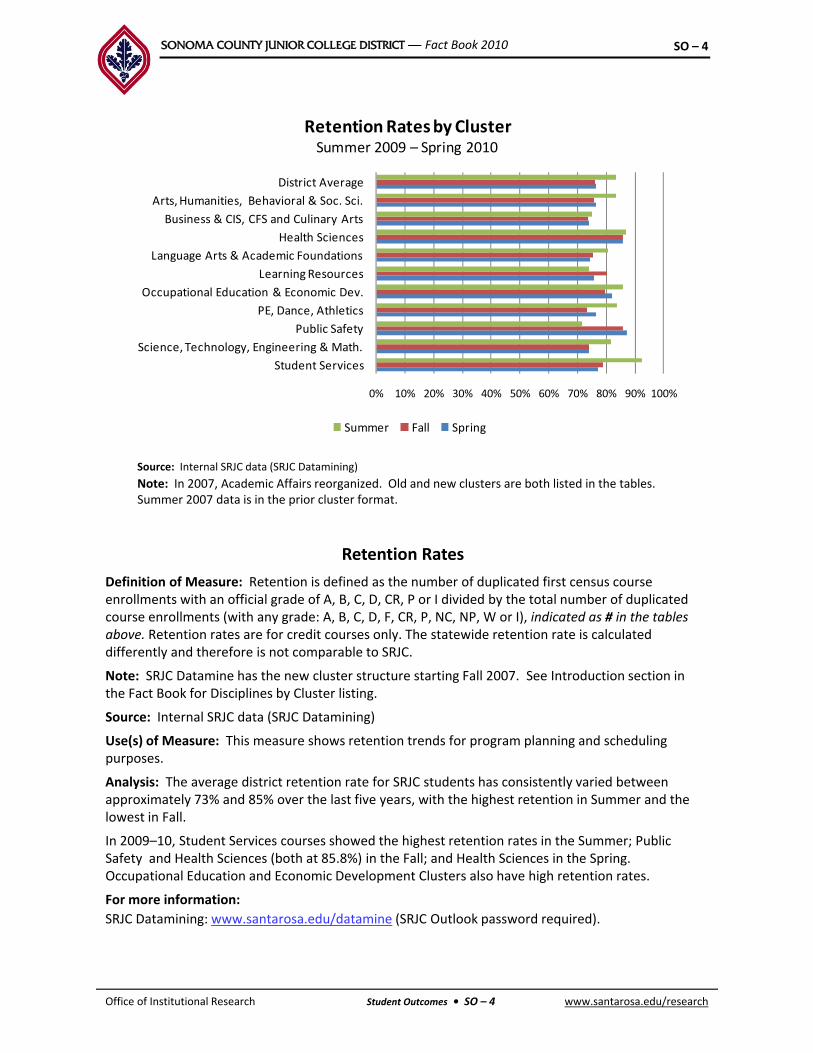
SONOMA COUNTY JUNIOR COLLEGE DISTRICT — Fact Book 2010 SO – 4
Retention Rates by ClusterSummer 2009 – Spring 2010
LearningResources
Language Arts & Academic Foundations
Health Sciences
Business & CIS, CFS and Culinary Arts
Arts, Humanities, Behavioral & Soc. Sci.
District Average
Summer 2009 Spring 2010
0% 10% 20% 30% 40% 50% 60% 70% 80% 90% 100%
Student Services
Science, Technology, Engineering & Math.
Public Safety
PE, Dance, Athletics
Occupational Education & Economic Dev.
Learning Resources
Source: Internal SRJC data (SRJC Datamining)
Note: In 2007, Academic Affairs reorganized. Old and new clusters are both listed in the tables. Summer 2007 data is in the prior cluster format.
Summer Fall Spring
Retention Rates
Definition of Measure: Retention is defined as the number of duplicated first census course enrollments with an official grade of A, B, C, D, CR, P or I divided by the total number of duplicated course enrollments (with any grade: A, B, C, D, F, CR, P, NC, NP, W or I), indicated as # in the tables above. Retention rates are for credit courses only. The statewide retention rate is calculated differently and therefore is not comparable to SRJCdifferently and therefore is not comparable to SRJC.
Note: SRJC Datamine has the new cluster structure starting Fall 2007. See Introduction section in the Fact Book for Disciplines by Cluster listing.
Source: Internal SRJC data (SRJC Datamining)
Use(s) of Measure: This measure shows retention trends for program planning and scheduling purposes.
A l i Th di i i f SRJC d h i l i d bAnalysis: The average district retention rate for SRJC students has consistently varied between approximately 73% and 85% over the last five years, with the highest retention in Summer and the lowest in Fall.
In 2009–10, Student Services courses showed the highest retention rates in the Summer; Public Safety and Health Sciences (both at 85.8%) in the Fall; and Health Sciences in the Spring. Occupational Education and Economic Development Clusters also have high retention rates.
For more information:
www.santarosa.edu/researchOffice of Institutional Research Student Outcomes • SO – 4
For more information:
SRJC Datamining: www.santarosa.edu/datamine (SRJC Outlook password required).

SONOMA COUNTY JUNIOR COLLEGE DISTRICT — Fact Book 2010 SO – 5
Successful Course Completion
Definition of Measure: The Successful Course Completion Rate is defined as the percentage of students who receive a grade of A, B, C, CR or P. To arrive at this rate, duplicated successful completions (grades A, B, C, CR or P) are divided by total course duplicated enrollments (grades A, B, C, D, F, CR, P, NC, NP, W, or I).
Accessibility: SRJC has converted to a new Student Information System (SIS). Many Information Technology (IT) reports used in past Fact Books are now being updated and combined to minimize duplication and increase efficiency. While this conversion is in process Fact Book users are being directed to the California Community Collegeprocess, Fact Book users are being directed to the California Community College Chancellor’s Office Data Mart website to gain access to the District’s MIS* data. This measure can be accessed in previous Fact Books at: www.santarosa.edu/research.
Below are the instructions to access the specific data for this report.
California Community Colleges Chancellor’s Office Data Mart Student Program Awards file:https://misweb.cccco.edu/mis/onlinestat/ret_sucs.cfm
To get SRJC data:Select “Santa Rosa” under College;Select Year and Term needed (only one term can be selected);Select Demographics, if neededSelect “Success Rate”Select Enrollment Status, if neededl k “ ” b hClick “Continue” button to the next screen
Select either “Summary enrollment count of all program types” or “Enrollment count by Program Type”For specific program data, select “Program Type” in Text Box or leave blank to get all programsClick “Get Report” button
To get Statewide data:gSelect “Statewide” under College;Select Year and Term needed (only one term can be selected);Select Demographics, if neededSelect “Success Rate”Select Enrollment Status, if neededClick “Continue” button to the next screenSelect either “Summary enrollment count of all program types” or “Enrollment count by Program Type”For specific program data, select “Program Type” in Text Box or leave blank to get all programsClick “Get Report” button
To download data, click on the “Download” hyperlink on the results page.
*Limitations to MIS data
www.santarosa.edu/researchOffice of Institutional Research Student Outcomes • SO – 5
Limitations to MIS dataData does not include credit students enrolled in full term courses earning less than .50 units and credit and noncredit students enrolled in short term courses with 8 or less hours of attendance.

SONOMA COUNTY JUNIOR COLLEGE DISTRICT — Fact Book 2010 SO – 6
Degrees and Certificates Awarded2005–06 to 2009–10
60%
70%
80%
90%
100%
Certificate ≥ 60 units
Certificate 30 < 60 units
Certificate 18 < 30 units
0%
10%
20%
30%
40%
50%
60%Certificate 12 < 18
Certificate 6 < 18 units
Certificate < 6 units
AS degree
AA degree
05–06 06–07 07–08 08–09 09–10
State
Degrees and Certificates Awarded2005
06
2006
07
2007
08
2008
09
2009
10
2009
10
SRJC
–06 –07 –08 –09 –10 –10
Associate of Arts (A.A.) degrees 932 911 859 859 995 60,900
% of total 22.2% 23.0% 22.1% 20.4% 23.1% 46.7%
Associate of Science (A.S.) degrees 222 239 251 335 431 23,834
% of total 5.3% 6.0% 6.5% 7.9% 10.0% 18.3%
Certificates requiring 6 to fewer than 18 units 446 521 541 353 598 10,718
% of total 10.6% 13.2% 13.9% 8.4% 13.9% 8.2%
Certificates requiring 12 to fewer than 18 units — — — — 6 699q g
% of total — — — — 0.1% 0.5%
Certificates requiring 18 to fewer than 30 units 191 181 139 170 206 10,115
% of total 4.5% 4.6% 3.6% 4.0% 4.8% 7.8%
Certificates requiring 30 to fewer than 60 units 191 187 189 190 224 18,080
% of total 4.5% 4.7% 4.9% 4.5% 5.2% 13.9%
Certificates requiring 60 or more semester units 41 38 18 48 34 1,531
% of total 1.0% 1.0% 0.5% 1.1% 0.8% 1.2%
( )Other Credit Awards (under 6 semester units) 2,176 1,883 1,894 2,263 1,814 5,156
% of total 51.8% 47.6% 48.7% 53.7% 42.1% 4.0%
Total Degrees and Certificates 4,199 3,960 3,891 4,218 4,308 130,334
General Education Development (GED) Awarded 298 314 447 509 N/A* N/A*
Total Awards (Including GED's) 4,497 4,274 4,338 4,727 4,308 130,334
T t l A i t D d C tifi t f 18 it 2 206 1 449 1 456 1 602 1 890 114 460
Total Chancellor's Office Approved Awards
www.santarosa.edu/researchOffice of Institutional Research Student Outcomes • SO – 6
Source: California Community College Chancellor's Office, Data Mart. *GED data not available at time of publication.
Total Associate Degrees and Certificates of 18+ units 2,206 1,449 1,456 1,602 1,890 114,460

SONOMA COUNTY JUNIOR COLLEGE DISTRICT — Fact Book 2010 SO – 7
Degrees, Certificates and GEDs Awarded
Definition of Measure: A summary of awards bestowed by SRJC (i.e., Associate of Arts degree, Associate of Science degree, various certificates, and General Education Development (GED) credentials) for the past five years with a one‐year statewide comparison. Separate totals are provided for Chancellor’s Office Approved Awards (certificates requiring 18 or more units) and local certificates.
Source: California Community College Chancellor’s Office Data Mart (MIS data).
i l f llComparison Group: California Community Colleges
Use(s) of Measure: This measure is one indicator of district productivity, as it shows the trends in total degrees, certificates and other awards over time.
Analysis: SRJC awarded a total of 4,308 degrees and certificates in 2009–10: the highest number of awards in the past five years. SRJC awarded 4% the total awards statewide, a higher proportion than its 1.8% of Community College enrollment statewide (see enrollment section “Historical and Projected Enrollment” for SRJC’s percentage of California Community College enrollment).j p g y g )
The proportion of awards by category differs considerably between SRJC and the statewide figures. The highest proportion of awards at SRJC in 2009–10 was in the category of “other credit awards” (under six semester units), which numbered 1,814 and constituted 42% of the total SRJC awards. These “other credit awards” bestowed by SRJC constituted 35% of the statewide total of 5,156 in this category in 2009–10.
In addition, the highest proportion of awards statewide in 2009–10 was Associate of Arts degrees at 47% i i A i t f A t d i d 23% f th t t l SRJC d hi h i47%; in comparison, Associate of Arts degrees comprised 23% of the total SRJC awards, which is an increase of almost 3% from 2008–09.
For more information:
Chancellor’s Office Data Mart: http://www.cccco.edu/SystemOffice/Divisions/TechResearchInfo/MIS/DataMartandReports/tabid/282/Default.aspx
www.santarosa.edu/researchOffice of Institutional Research Student Outcomes • SO – 7

SONOMA COUNTY JUNIOR COLLEGE DISTRICT — Fact Book 2010 SO – 8
Degrees Awarded by Program Chancellor’s Office Data (2 digit TOP code)
SRJC 2005–10; SRJC and State Comparison — 2009–10SRJC 2005 10; SRJC and State Comparison 2009 10
Associate of Arts (A.A.) DegreeSRJC
05–06
SRJC
06–07
SRJC
07–08
SRJC
08–09
SRJC
09–10
State
09–10
SRJC % of
09–10
State
Total
Agriculture and Natural Resources (01) 1 1 50 0.0%
Architecture and Environmental Design (02) 54 —
Biological Sciences (04) 153 —
Business and Management (05) 4 11 29 29 61 4,286 1.4%
Commercial Services (30) 62 —
Communications (06) 1 1 472 0.2%
Computer and Information Science (07) 173 —
Consumer Education & Home Economics (13) 15 20 33 25 31 1,207 2.6%
Education (08) 2 437 0.0%
Engineering & Related Industrial Technology (09) 5 5 4 300 1.3%
Environmental Sciences and Technologies (03) 16 —
Fi d A li d A (10) 19 22 33 33 40 1 395 2 9%Fine and Applied Arts (10) 19 22 33 33 40 1,395 2.9%
Foreign Language (11) 4 8 10 5 8 352 2.3%
Health (12) 1 822 0.1%
Humanities (15) 2 6 11 13 12 1,213 1.0%
Interdisciplinary Studies (49) 760 697 534 466 425 39,649 1.1%
Law (14) 223 —
Library Science (16) 16 —
Mathematics (17) 18 9 5 11 22 296 7.4%
Ph i l S i (19) 2 92Physical Sciences (19) 2 92 —
Psychology (20) 8 12 24 1,328 1.8%
Public Affairs & Services (21) 8 15 28 34 41 1,503 2.7%
Social Sciences (22) 88 120 162 223 325 6,748 4.8%
Total 918 911 859 859 995 60,847 1.6%
Associate Of Science (A.S.) Degree
Agriculture and Natural Resources (01) 11 10 16 14 17 547 3.1%
A hit t d E i t l D i (02) 2 143 1 4%Architecture and Environmental Design (02) 2 143 1.4%
Biological Sciences (04) 2 1 3 4 6 759 0.8%
Business and Management (05) 3,026 —
Commercial Services (30) 211 —
Communications (06) 145 —
Computer and Information Science (07) 2 1 1 610 0.2%
Consumer Education & Home Economics (13) 1 1,313 0.1%
Education (08) 1 97 1.0%
Engineering & Related Industrial Technology (09) 5 7 13 15 21 1 466 1 4%Engineering & Related Industrial Technology (09) 5 7 13 15 21 1,466 1.4%
Environmental Sciences and Technologies (03) 28 —
Fine and Applied Arts (10) 134 —
Health (12) 110 131 120 193 212 8,066 2.6%
Humanities (15) 4 —
Interdisciplinary Studies (49) 50 37 68 83 132 3,599 3.7%
Law (14) 205 —
Library Science (16) 19 —
Mathematics (17) 261
www.santarosa.edu/researchOffice of Institutional Research Student Outcomes • SO – 8
Mathematics (17) 261 —
Physical Sciences (19) 9 416 2.2%
Psychology (20) 32 —
Public Affairs & Services (21) 30 34 31 26 29 2,446 1.2%
Social Sciences (22) 305 —
Total 210 221 251 335 431 23,832 1.8%

SONOMA COUNTY JUNIOR COLLEGE DISTRICT — Fact Book 2010 SO – 9
Degrees Awarded by ProgramTOP Code and SRJC Code
TOP
Code
SRJC
CodeAssociate of Arts (A.A.) Degree
05–
06
06–
07
07–
08
08–
09
09–
10
2105 1019 Administration of Justice 4 9 23 26 31
2202 1004 Anthropology 3 3 4 4 12
1030 1025 Applied Graphics 3 5 7 5 2
1002 1005 Art 15 10 17 21 23
1006 1033 Art History 4 8 9 13
0850.1 1043 ASL: English Interpreter Education 2
0948 1039 Automotive Technology 5 5 4
0501 1030 Business Administration 2 8 22 23 55
1305 1002 Child Development 11 15 22 18 17
1306 1010 Culinary Arts 3 3 3 2 2
1008 1009 Dance 1 2 1 2 2
2204 1017 Economics 9 10 9 11 22
1501 1021 English 1 1 3 5 61501 1021 English 1 1 3 5 6
1303.1 1035 Fashion Studies: Apparel Design & Production 1 1 1
1303.3 1036 Fashion Studies: Custom Clothing & Alter 1
1303.2 1037 Fashion Studies: Fashion Merchandising 2 2
0901 1028 Floristry 1 1
2210 1032 Global Studies 1 2
2205 1013 History 7 3 5 7 22
4903 1022 Humanities 16 21 31 61 75
4903 1007 Humanities and Fine Arts 1 2 3
0506 1044 Human Resource Administration 5
2104 1014 Human Services: Advocacy 1 2 2 5 8
2104 1015 Human Services: Alcohol & Drug 3 3 3 3 3
1305.3 1016 Human Services: Gerontology 1 2
614.0 1040 Interactive Media Design 1 1
1302 1024 Interior Design: Retail Merchandising 1 3 3 1
2299 1020 L ti A i St di 2 3 22299 1020 Latin American Studies 2 3 2
4901 1003 Liberal Arts & Sciences, General 485 214 102 44 19
1701 1011 Mathematics 18 9 5 11 22
1004 1048 Music: Jazz Studies 1
1509 1012 Philosophy 1 5 6 5 4
2207 1031 Political Science 1 1 1 4 5
2001 1038 Psychology 2 8 13 25
0511 1034 Real Estate 2 3 7 6 305 03 ea state 3 6 3
1510 1041 Religious Studies 3 5 2
1307.1 1042 Restaurant Management 3
2201 1023 Social and Behavior Sciences 68 99 140 200 267
1105 1001 Spanish 4 8 11 5 8
1230.1 1029 Women's and Gender Studies 1
4901.1 1008.0 University Transfer 259 453 401 375 335
Total 918 898 862 889 1,005
www.santarosa.edu/researchOffice of Institutional Research Student Outcomes • SO – 9
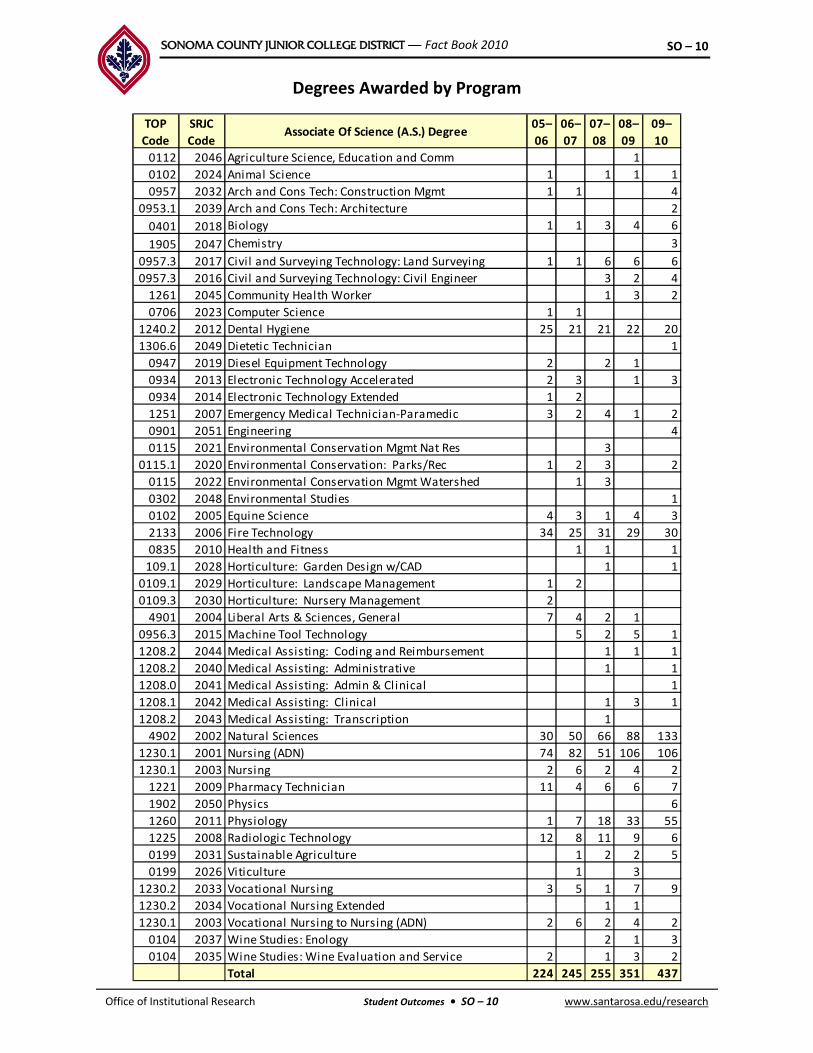
SONOMA COUNTY JUNIOR COLLEGE DISTRICT — Fact Book 2010 SO – 10
Degrees Awarded by Program
TOP
Code
SRJC
CodeAssociate Of Science (A.S.) Degree
05–
06
06–
07
07–
08
08–
09
09–
10
0112 2046 Agriculture Science, Education and Comm 1
0102 2024 Animal Science 1 1 1 1
0957 2032 Arch and Cons Tech: Construction Mgmt 1 1 4
0953.1 2039 Arch and Cons Tech: Architecture 2
0401 2018 Biology 1 1 3 4 6
1905 2047 Chemistry 3
0957.3 2017 Civil and Surveying Technology: Land Surveying 1 1 6 6 6
0957 3 2016 Ci il d S i T h l Ci i l E i 3 2 40957.3 2016 Civil and Surveying Technology: Civil Engineer 3 2 4
1261 2045 Community Health Worker 1 3 2
0706 2023 Computer Science 1 1
1240.2 2012 Dental Hygiene 25 21 21 22 20
1306.6 2049 Dietetic Technician 1
0947 2019 Diesel Equipment Technology 2 2 1
0934 2013 Electronic Technology Accelerated 2 3 1 3
0934 2014 Electronic Technology Extended 1 20934 2014 Electronic Technology Extended 1 2
1251 2007 Emergency Medical Technician‐Paramedic 3 2 4 1 2
0901 2051 Engineering 4
0115 2021 Environmental Conservation Mgmt Nat Res 3
0115.1 2020 Environmental Conservation: Parks/Rec 1 2 3 2
0115 2022 Environmental Conservation Mgmt Watershed 1 3
0302 2048 Environmental Studies 1
0102 2005 Equine Science 4 3 1 4 3
2133 2006 Fire Technology 34 25 31 29 30
0835 2010 Health and Fitness 1 1 1
109.1 2028 Horticulture: Garden Design w/CAD 1 1
0109.1 2029 Horticulture: Landscape Management 1 2
0109.3 2030 Horticulture: Nursery Management 2
4901 2004 Liberal Arts & Sciences, General 7 4 2 1
0956.3 2015 Machine Tool Technology 5 2 5 1
1208 2 2044 Medical Assisting: Coding and Reimbursement 1 1 11208.2 2044 Medical Assisting: Coding and Reimbursement 1 1 1
1208.2 2040 Medical Assisting: Administrative 1 1
1208.0 2041 Medical Assisting: Admin & Clinical 1
1208.1 2042 Medical Assisting: Clinical 1 3 1
1208.2 2043 Medical Assisting: Transcription 1
4902 2002 Natural Sciences 30 50 66 88 133
1230.1 2001 Nursing (ADN) 74 82 51 106 106
1230.1 2003 Nursing 2 6 2 4 2
1221 2009 Pharmacy Technician 11 4 6 6 7
1902 2050 Physics 6
1260 2011 Physiology 1 7 18 33 55
1225 2008 Radiologic Technology 12 8 11 9 6
0199 2031 Sustainable Agriculture 1 2 2 5
0199 2026 Viticulture 1 3
1230.2 2033 Vocational Nursing 3 5 1 7 9
1230 2 2034 V ti l N i E t d d 1 1
www.santarosa.edu/researchOffice of Institutional Research Student Outcomes • SO – 10
1230.2 2034 Vocational Nursing Extended 1 1
1230.1 2003 Vocational Nursing to Nursing (ADN) 2 6 2 4 2
0104 2037 Wine Studies: Enology 2 1 3
0104 2035 Wine Studies: Wine Evaluation and Service 2 1 3 2
Total 224 245 255 351 437

SONOMA COUNTY JUNIOR COLLEGE DISTRICT — Fact Book 2010 SO – 11
Degrees Awarded by Program
Definition of Measure: A tally of A A and A S degrees awarded to students over the pastDefinition of Measure: A tally of A.A. and A.S. degrees awarded to students over the past five years, including type of award. The table includes the taxonomy of program (TOP) code.
Source: California Community College Chancellor’s Office Data Mart.
Comparison Group: California Community Colleges
Use(s) of Measure: This measure shows the trends in degree awards by program as a performance measure and for planning purposes.
Analysis: In 2009–10, SRJC awarded its largest number of Associate of Arts and Associate of Science degrees in the past five years, 995 and 335 respectively. The top three degrees in regards to growth in Associate of Arts were Business and Management (TOP Code 05), Psychology (TOP Code 21) and Social Sciences (TOP Code 22). In Associate of Science degrees, the top three are Engineering & Related Industrial Technology (TOP Code 09), Health (TOP Code 12), and Interdisciplinary Studies‐Natural Sciences (TOP Code 49) .
www.santarosa.edu/researchOffice of Institutional Research Student Outcomes • SO – 11

SONOMA COUNTY JUNIOR COLLEGE DISTRICT — Fact Book 2010 SO – 12
Certificates Awarded by Program
TOP Cert 2005 2006 2007 2008 2009 TOP
Code
Cert
CodeCertificate Description PA
2005
– 06
2006
– 07
2007
– 08
2008
– 09
2009
– 10
A
0502 3274 Account Clerk Completion Certificate E 24 15 20 20 13
0502 3043 Accountant Assistant Career Certificate T 11 1 12 3 11
0514 3053 Administrative Assistant T 1 1 5 4 3
0514 3252 Administrative Support 1 E 4 2 6 2 3
0514 3253 Administrative Support 2 L 1 2 1 2 2pp0701 3162 Adobe Applications Specialist E 7 8 5 16 10
0702.1 3242 Adobe Certification Training: Il lustratror E 4 1 8 19 7
0702.1 3243 Adobe Certification Training: InDesign E 24 28 15 8 20
0702.1 3173 Adobe Certification Training: Photoshop E 9 44 27 5 14
3020 3098 Aeronautical and Aviation Technology L 2 0 1 0 0
0102 3002 Animal Science T 2 1 0 1 0
1030 3036 Applied Graphics T 11 12 10 9 15
0957 3174 Architectural Technician T 0 1 0 0 00957 3174 Architectural Technician T 0 1 0 0 0
0957 3133 Architecture and Construction Technology T 0 1 0 0 1
0957 3213 Architecture and Construction Technology T 0 2 0 1 4
0201 3283 Architecture: Technician Completion E 6 3 3 1 1
1002 3083 Art: Broad‐Base Art Training T 2 2 2 2 2
1002.3 3087 Art: Ceramics T 1 0 0 1 0
614.6 3105 Art: Computer Graphics T 0 1 1 0 0
1002.1 3084 Art: Drawing and Painting T 4 7 5 2 2
1030 3086 Art: Graphic Design T 0 1 0 0 01030 3086 Art: Graphic Design T 0 1 0 0 0
1009.1 3088 Art: Jewelry T 0 2 0 2 0
1011 3090 Art: Photography T 0 1 4 1 2
1002.2 3089 Art: Sculpture T 1 1 0 0 0
0850.1 3324 ASL: English Interpreter Education T 0 0 0 8 0
0948 3298 Automotive Technology: Brakes, Steering & Suspen. E 14 12 6 22 59
0948 3299 Automotive Technology: Engine Repair Specialist E 5 17 9 14 52
0948 3300 Automotive Technology: Transmission Specialist E 5 19 14 18 31
0948 3301 Automotive Technology Tune Up & Electronics Sp E 0 2 4 5 50948 3301 Automotive Technology: Tune‐Up & Electronics Sp. E 0 2 4 5 5
0948 3032 Automotive Technology T 16 14 9 6 3
B2105.5 3171 Basic Police Academy: Modular E 0 0 17 0 0
2105.5 3172 Basic Police Academy: Intensive E 58 98 118 0 0
2105.5 3282 Basic Police Academy E 13 17 1 79 109
0502 3118 Bookkeeper T 4 4 6 4 2
0502 3119 Bookkeeper Assistant L 2 8 3 12 8
C1305 3144 Child Development: Associate Teacher E 73 82 76 81 83
1305 3145 Child Development: Teacher L 20 19 24 19 12
2105.2 3149 Children In The Justice System L 15 16 13 19 32
0799 3284 Cisco Networking E 13 10 21 24 15
0957.3 3267 Civil and Surveying Tech: Civil Engineering T 1 2 4 7 13
0957.3 3268 Civil and Surveying Tech: Land Surveying T 6 10 5 9 8
2104 3106 Client Service Specialist L 1 2 1 1 0
www.santarosa.edu/researchOffice of Institutional Research Student Outcomes • SO – 12
2104 3106 Client Service Specialist L 1 2 1 1 0
0601 3165 Communication Studies L 0 1 0 0 0
1261 3154 Community Health Worker Training Program E 5 6 3 0 0
1261 3303 Community Health Worker Training Program L 0 0 1 6 11

SONOMA COUNTY JUNIOR COLLEGE DISTRICT — Fact Book 2010 SO – 13
Certificates Awarded by Program Continued
TOP Cert 200 2006 200 2008 2009 TOP
Code
Cert
CodeCertificate Description — C continued PA
2005
– 06
2006
– 07
2007
– 08
2008
– 09
2009
– 10
0957 3245 Construction Management: Basic Skills E 2 3 2 1 1
2105.1 3062 Corrections T 5 8 11 7 11
1306.3 3202 Culinary Arts L 38 49 34 35 29
1306.3 3179 Culinary Arts: Baking and Pastry E 26 30 29 34 31
1307.1 3209 Culinary Arts: Front House Operations E 7 5 7 3 2
D1008 3233 Dance: Ballet E 3 0 0 2 0
1008 3234 Dance: Hip Hop/Funk E 3 1 1 1 0
1008 3236 Dance: Jazz E 7 0 0 3 0
1008 3235 Dance: Modern E 3 0 2 1 0
1240.1 3176 Dental Assisting: 11‐Month T 23 14 20 16 19
0947 3033 Diesel Equipment Technology T 1 1 2 4 5
1306.2 3022 Dietetic Technology E 5 3 6 6 9
0701 3208 Dreamweaver Web Content Developer E 2 3 6 4 6
E0934 3039 Electronic Technology Accelerated T 1 0 0 0 13
0934 3178 Electronic Technology Extended T 3 9 8 0 0
1251 3160 Emergency Medical Technician ‐ Paramedic T 1 0 0 1 0
0115 3280 Environmental Conservation: Natural Resource Mgmt T 2 3 0 0 1
0115 3275 Environmental Conservation: Parks and Recreation T 1 1 0 1 1
0115 3276 Environmental Conservation: Watershed Mgmt T 3 4 1 0 1
0102 3148 Equine Science T 3 1 0 0 30102 3148 Equine Science T 3 1 0 0 3
F1303 3295 Fashion Studies: Apparel Design/Production T 5 1 0 0 0
1303 3296 Fashion Studies: Custom Clothing & Alterations L 0 3 0 0 0
1303 3297 Fashion Studies: Fashion Merchandising L 0 1 1 0 1
2133 3060 Fire Technology T 29 32 25 13 16
2133.5 3180 Firefighter I Academy E 98 92 101 96 31
109.2 3132 Floristry L 7 10 1 7 4
GG0799 3219 General Multimedia Completion Certificate E 0 1 1 1 0
0799 3273 Geographic Information Systems E 4 4 7 6 4
1030 3246 Graphic Design Production Fundamentals E 2 3 3 2 7
H0109 3203 Horticulture: Nursery Production Skil ls E 2 0 0 0 0
0109.1 3257 Horticulture: Garden Design L 5 4 1 1 0
0109.1 3258 Horticulture: Garden Design w/CAD Skil ls T 0 4 1 8 1
0109.1 3134 Horticulture: Landscape Management T 1 0 0 1 0
0109.1 3241 Horticulture: Landscape Technician E 1 1 0 2 2
0109.3 3255 Horticulture: Nursery Management T 1 0 1 0 0
0109 3240 Horticulture: Retail Garden Center Skil ls E 3 0 0 0 0
1307 3147 Hospitality T 2 0 5 1 3
0701 3212 HTML Web Content Developer E 14 5 13 10 22
0506 3143 Human Resource Administration E 28 20 21 37 24
0506 3325 Human Resource Administration L 0 0 0 0 3
www.santarosa.edu/researchOffice of Institutional Research Student Outcomes • SO – 13

SONOMA COUNTY JUNIOR COLLEGE DISTRICT — Fact Book 2010 SO – 14
Certificates Awarded by Program Continued
TOP Cert 2005 2006 2007 2008 2009 TOP
Code
Cert
CodeCertificate Description — H continued PA
2005
– 06
2006
– 07
2007
– 08
2008
– 09
2009
– 10
2104 3196 Human Services: Advocacy Emphasis T 5 4 5 7 10
2104.4 3194 Human Services: Alcohol and Drug Emphasis T 10 11 14 11 13
1309 3195 Human Services: Gerontology Emphasis T 2 2 0 1 1
I0614 3320 Interactive Media Design T 0 0 0 0 3
1302 3264 Interior Design: Retail Merchandising L 3 7 1 9 0
1302 3265 Interior Design: Residential T 0 0 0 2 1
0508 3190 International Business E 0 2 2 1 0
0514 3218 International Office Assistant E 2 2 1 0 2
L2105 3063 Law Enforcement T 12 5 13 10 11
0514 3217 Legal Office Support E 7 4 5 4 4
0514.1 3041 Legal Secretary T 0 0 0 0 2
0514.1 3223 Legal Secretary T 4 1 3 1 2g y
M0956.3 3034 Machine Tool Technology T 2 8 0 1 2
0956.3 3293 Machine Tool Technology: Basic CNC Lathe E 2 3 3 1 2
0956.3 3294 Machine Tool Technology: Basic CNC Mill E 1 4 2 2 2
1208 3155 Medical Assisting: Administrative and Clinical T 0 1 1 0 1
1203.7 3156 Medical Assisting: Administrative L 5 0 2 3 6
1203.7 3158 Medical Assisting: Claims Process/Coding L 2 0 0 0 0
1208 3157 Medical Assisting: Clinical T 7 1 7 10 161208 3157 Medical Assisting: Clinical T 7 1 7 10 16
1208.2 3288 Medical Assisting: Coding and Reimbursement T 2 0 4 4 7
1208.2 3159 Medical Assisting: Medical Transcription L 3 3 2 4 2
0702 3261 Microcomputer Systems Database User L 0 1 0 0 1
0708.2 3104 Microcomputer Systems Specialist T 1 1 0 0 0
0799 3228 Microsoft Office Specialist E 2 3 4 5 1
N0115 3277 Natural Resource Management E 0 2 1 1 0
k h0799 3249 Networking with A+ E 0 2 1 2 4
1230.3 3029 Nurse Assistant ‐ Home Health Aide E 0 0 2 0 0
O0514 3115 Office Assistant E 6 9 8 4 3
0506 3225 Office Manager E 0 1 1 0 0
0799 3250 Oracle Database User E 3 0 0 0 0
P0115.1 3278 Parks and Recreation Management E 4 2 0 0 00115.1 3278 Parks and Recreation Management E 4 2 0 0 0
0502 3067 Payroll E 2 3 3 1 3
0708.2 3287 PC Specialist T 0 0 4 0 0
1221 3251 Pharmacy Technician L 30 21 21 28 26
1239 3030 Psychiatric Technician T 33 28 23 21 15
R1225 3059 Radiologic Technology F 15 15 18 20 12
0511 3061 Real Estate L 25 12 9 4 4
1307 1 3322 Restaurant Management L 0 0 2 2 2
www.santarosa.edu/researchOffice of Institutional Research Student Outcomes • SO – 14
1307.1 3322 Restaurant Management L 0 0 2 2 2
0509.5 3014 Retail Merchandising Management L 1 0 0 1 0
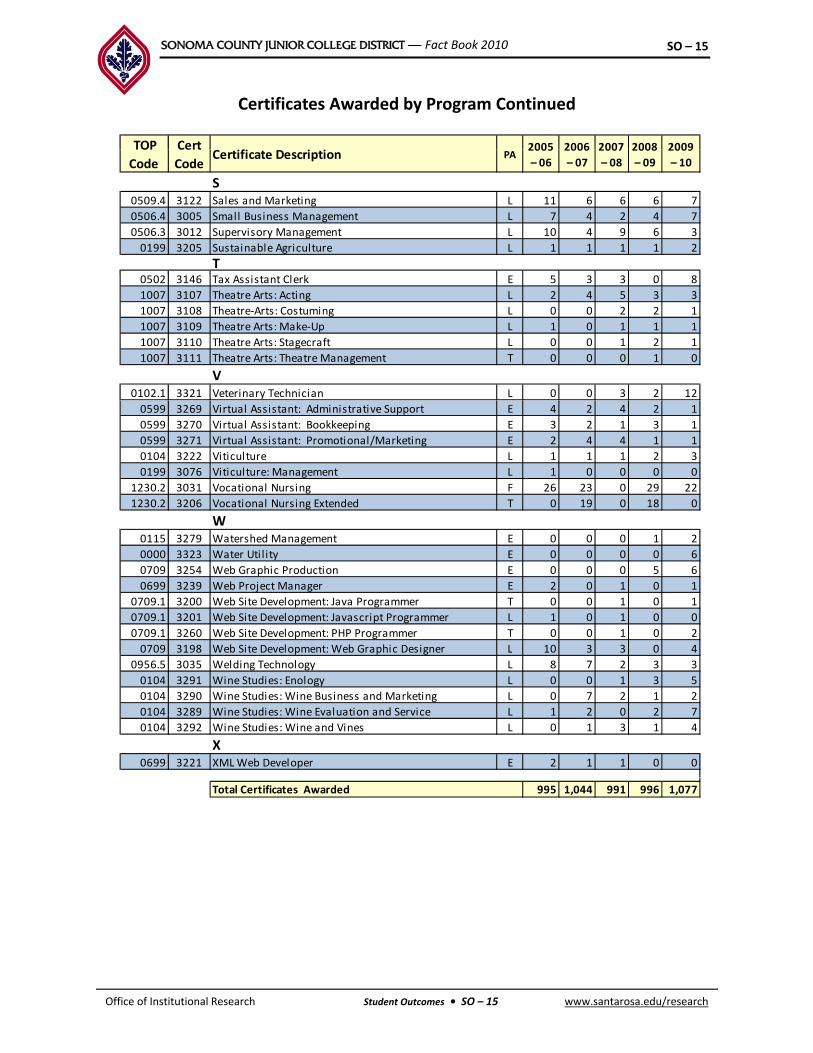
SONOMA COUNTY JUNIOR COLLEGE DISTRICT — Fact Book 2010 SO – 15
Certificates Awarded by Program Continued
TOP Cert 2005 2006 2007 2008 2009 TOP
Code
Cert
CodeCertificate Description PA
2005
– 06
2006
– 07
2007
– 08
2008
– 09
2009
– 10
S0509.4 3122 Sales and Marketing L 11 6 6 6 7
0506.4 3005 Small Business Management L 7 4 2 4 7
0506.3 3012 Supervisory Management L 10 4 9 6 3
0199 3205 Sustainable Agriculture L 1 1 1 1 2
Tl k0502 3146 Tax Assistant Clerk E 5 3 3 0 8
1007 3107 Theatre Arts: Acting L 2 4 5 3 3
1007 3108 Theatre‐Arts: Costuming L 0 0 2 2 1
1007 3109 Theatre Arts: Make‐Up L 1 0 1 1 1
1007 3110 Theatre Arts: Stagecraft L 0 0 1 2 1
1007 3111 Theatre Arts: Theatre Management T 0 0 0 1 0
V0102.1 3321 Veterinary Technician L 0 0 3 2 12
0599 3269 Virtual Assistant: Administrative Support E 4 2 4 2 1
0599 3270 Virtual Assistant: Bookkeeping E 3 2 1 3 1
0599 3271 Virtual Assistant: Promotional/Marketing E 2 4 4 1 1
0104 3222 Viticulture L 1 1 1 2 3
0199 3076 Viticulture: Management L 1 0 0 0 0
1230.2 3031 Vocational Nursing F 26 23 0 29 22
1230.2 3206 Vocational Nursing Extended T 0 19 0 18 0
W0115 3279 Watershed Management E 0 0 0 1 2
0000 3323 Water Utility E 0 0 0 0 6
0709 3254 Web Graphic Production E 0 0 0 5 6
0699 3239 Web Project Manager E 2 0 1 0 1
0709.1 3200 Web Site Development: Java Programmer T 0 0 1 0 1
0709.1 3201 Web Site Development: Javascript Programmer L 1 0 1 0 0
0709.1 3260 Web Site Development: PHP Programmer T 0 0 1 0 2
0709 3198 Web Site Development: Web Graphic Designer L 10 3 3 0 40709 3198 Web Site Development: Web Graphic Designer L 10 3 3 0 4
0956.5 3035 Welding Technology L 8 7 2 3 3
0104 3291 Wine Studies: Enology L 0 0 1 3 5
0104 3290 Wine Studies: Wine Business and Marketing L 0 7 2 1 2
0104 3289 Wine Studies: Wine Evaluation and Service L 1 2 0 2 7
0104 3292 Wine Studies: Wine and Vines L 0 1 3 1 4
X0699 3221 XML Web Developer E 2 1 1 0 0
Total Certificates Awarded 995 1,044 991 996 1,077
www.santarosa.edu/researchOffice of Institutional Research Student Outcomes • SO – 15
SONOMA COUNTY JUNIOR COLLEGE DISTRICT — Fact Book 2010 SO – 16
Certificates Awarded 2005–06 to 2009–10
Definition of Measure: A tally of (six or more unit) certificates awarded to students over the past five years, including type of award. The certificate table is an alphabetized summary that includes the taxonomy of program (TOP) code, certificate code, certificate description and the program award (PA) code. The TOP code schematic is a common, numeric coding system by which districts and colleges categorize degree and certificate programs and courses.
Note: A zero in a given year on the preceding table could indicate various things:
• no students earned awards in the program in question that year• no students earned awards in the program in question that year,
• the program was not offering awards that year,
• the program in question was not yet in existence that year, or
• the program has been discontinued.
Complete TOP code information can be found at http://www.ccccurriculum.info/Curriculum/RegulationsGuidelines/TOPCodes.htm.
The coding scheme for PA is as follows:
E = certificate requiring 6 to fewer than 18 semester units;
L = certificate requiring 19 to fewer than 30 semesters units;
T = certificate requiring 30 to fewer than 60 semester units; and
F = certificates requiring 60 or more units.
Source: Internal SRJC data (RPG211)
Use(s) of Measure: This measure shows trends in degree awards by program as a performance measure and for planning purposes.
Analysis: For the 2009–10 academic year, the largest number of program certificates awarded by SRJC are:
• Basic Police Academy (109);
• Child Development: Associate Teacher (83);Child Development: Associate Teacher (83);
• Automotive Technology: Brakes, Steering & Suspen (59);
• Automotive Technology: Engine Repair Specialist (52);
• Children in the Justice System (32);
• Firefighter I Academy (31);
• Culinary Arts (29);
• Culinary Arts: Baking and Pastry (28);Culinary Arts: Baking and Pastry (28);
• Pharmacy Technician (26);
• Human Resource Administration (24);
• Vocational Nursing (22);
• Adobe Certification Training: InDesign (20).
www.santarosa.edu/researchOffice of Institutional Research Student Outcomes • SO – 16

SONOMA COUNTY JUNIOR COLLEGE DISTRICT — Fact Book 2010 SO – 17
Placements into Chemistry, English, ESL, and Math Courses2005–06 to 2009–102005–06 to 2009–10
20%
40%
60%
80%
100%
Chemistry Placement Distribution2005–06 to 2009–10
40%
60%
80%
100%
English Placement Distribution2005–06 to 2009–10
0%
20%
05–06 06–07 07–08 08–09 09‐10
Chem 1A Chem 4A Chem 42/51
0%
20%
05–06 06–07 07–08 08–09 09‐10
Transfer English College English Developmental English
# % # % # % # % # %
Chemistry 1A 40 22.6% 43 24.0% 76 32.2% 74 28.9% 42 16.7%
Chemistry 4A 87 49.2% 89 49.7% 103 43.6% 52 20.3% 130 51.8%
Chemistry 42/51 50 28.2% 47 26.3% 57 24.2% 130 50.8% 79 31.5%
Total 177 100% 179 100% 236 100% 256 100% 251 100%
2009‐102008–09
Chemistry
2005–06 2006–07 2007–08
Note:Transfer English: English 1A
Transfer English 2,794 49.9% 2,068 42.3% 2,434 40.2% 2,462 38.0% 2,150 32.4%
College English 1,135 20.3% 1,198 24.5% 1,623 26.8% 1,670 25.8% 1,665 25.1%
Developmental English 1,667 29.8% 1,623 33.2% 2,005 33.1% 2,343 36.2% 2,811 42.4%
Total 5,596 100% 4,889 100% 6,062 100% 6,475 100% 6,626 100%
English
Transfer English: English 1ACollege English: English 100Developmental English: English 302, 305, 355, 357; CSKL 313, 318
www.santarosa.edu/researchOffice of Institutional Research Student Outcomes • SO – 17

SONOMA COUNTY JUNIOR COLLEGE DISTRICT — Fact Book 2010 SO – 18
ESL Placement Distribution2005–06 to 2009–10
Math Placement Distribution2005–06 to 2009–10
0%
20%
40%
60%
80%
100%
05–06 06–07 07–08 08–09 09‐10
ll l l d
0%
20%
40%
60%
80%
100%
05–06 06–07 07–08 08–09 09‐10
College ESL Developmental ESL Noncredit ESL Transfer Math College Math Developmental Math
# % # % # % # % # %
College ESL 49 3.1% 0 0% 0 0% 0 0% 0 0%
Developmental ESL 998 62.8% 940 69.9% 874 75.3% 879 92.5% 730 72.8%
Noncredit ESL 543 34.2% 404 30.1% 286 24.7% 71 7.5% 273 27.2%
Total 1,590 100% 1,344 100% 1,160 100% 950 100% 1,003 100%
2009–102008–09
ESL
2007–082005‐06 2006–07
College ESL: ESL 100
, , , ,
Transfer Math 1,008 21.8% 1,018 21.9% 963 24.6% 1,271 23.9% 1,084 22.1%
College Math 2,130 46.1% 2,390 51.5% 1,973 50.3% 2,599 48.8% 2,329 47.4%
Developmental Math 1,482 32.1% 1,234 26.6% 983 25.1% 1,452 27.3% 1,500 30.5%
Total 4,620 100% 4,642 100% 3,919 100% 5,322 100% 4,913 100%
Math
College ESL: ESL 100Developmental ESL: ESL 308, 310, 312, 314, 316, 320Noncredit ESL: ESL 701, 712, 713, 714, 715, 716
Transfer Math: Math 1A, 8A, 9 10, 15, 16, 25, 27, 36, 58
College Math: Math 150A, 155, 151Developmental Math: CSKL 100, 371, 372, 368A
Source: Internal SRJC data (Assessment Services)
Placements into Chemistry, English, ESL, and Math Courses
Definition of Measure: The results of the College’s assessment process to place students into appropriate courses for Chemistry, English, English as a Second Language (ESL), and Math.
Source: Internal SRJC data (Assessment Services)
Use(s) of Measure: This measure shows the trends of student placement for assessment and curriculum program purposes.p g p p
Analysis: During the past five years, the proportion of students placing into developmental, college‐level, and transfer‐level Math, English, Chemistry and ESL has fluctuated. This fluctuation is related to changes in assessment instruments and placement processes.
Over 42% of students who complete the assessment process for English placed into the developmental level, and another 25% placed into college‐level (with the remaining 32% placing into the transfer level).
h f h d l h d l l l l h l l h
www.santarosa.edu/researchOffice of Institutional Research Student Outcomes • SO – 18
In Math, over 30% of the students place at the developmental level, with almost 50% placing at the college level and less than 25% at the transfer level. In ESL, the majority of the students who complete the assessment process place into the developmental (72%) or noncredit levels (27.5%). In Chemistry, over one half place in Chemistry 4A, less than one fifth of students place in Chemistry 1A and almost one third place in Chemistry 42.
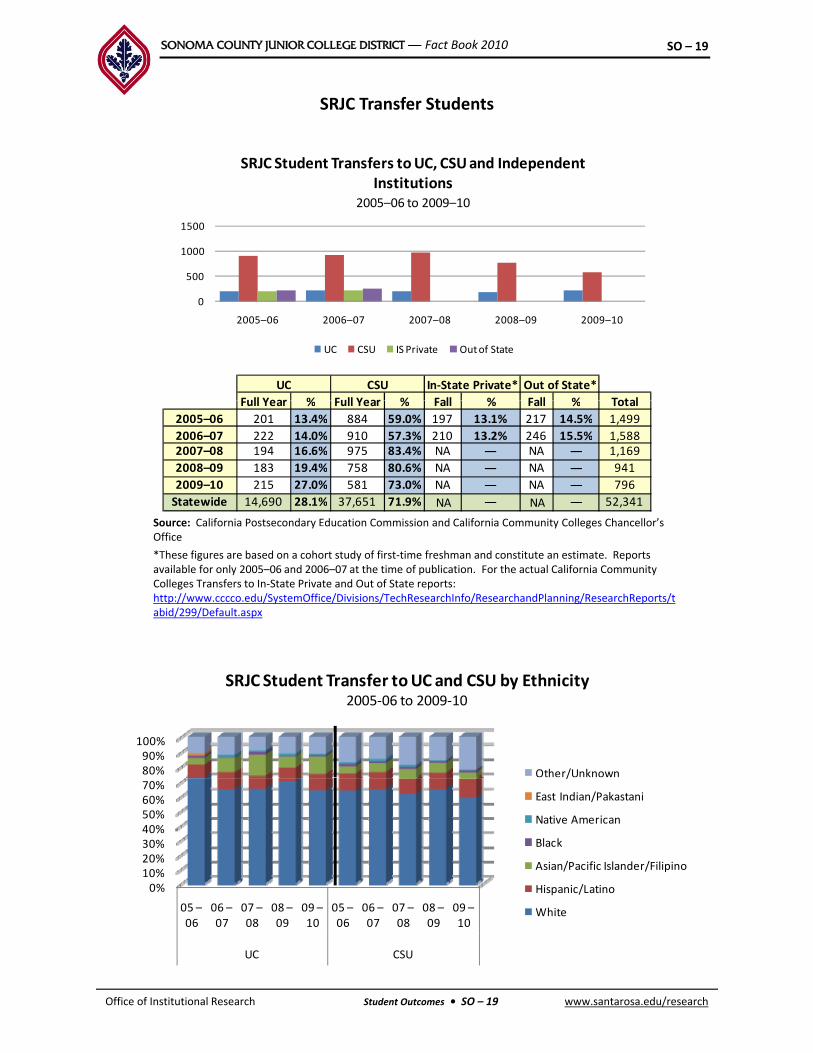
SONOMA COUNTY JUNIOR COLLEGE DISTRICT — Fact Book 2010 SO – 19
SRJC Transfer Students
500
1000
1500
SRJC Student Transfers to UC, CSU and Independent Institutions
2005–06 to 2009–10
0
500
2005–06 2006–07 2007–08 2008–09 2009–10
UC CSU IS Private Out of State
Full Year % Full Year % Fall % Fall % Total
Out of State*In‐State Private*UC CSU
Source: California Postsecondary Education Commission and California Community Colleges Chancellor’s
Full Year % Full Year % Fall % Fall % Total
2005–06 201 13.4% 884 59.0% 197 13.1% 217 14.5% 1,499
2006–07 222 14.0% 910 57.3% 210 13.2% 246 15.5% 1,5882007–08 194 16.6% 975 83.4% NA — NA — 1,169
2008–09 183 19.4% 758 80.6% NA — NA — 941
2009–10 215 27.0% 581 73.0% NA — NA — 796
Statewide 14,690 28.1% 37,651 71.9% NA — NA — 52,341
Source: California Postsecondary ducation Commission and California Community Colleges Chancellor sOffice
*These figures are based on a cohort study of first‐time freshman and constitute an estimate. Reports available for only 2005–06 and 2006–07 at the time of publication. For the actual California Community Colleges Transfers to In‐State Private and Out of State reports: http://www.cccco.edu/SystemOffice/Divisions/TechResearchInfo/ResearchandPlanning/ResearchReports/tabid/299/Default.aspx
80%90%100%
SRJC Student Transfer to UC and CSU by Ethnicity2005‐06 to 2009‐10
Other/Unknown
0%10%20%30%40%50%60%70%
/
East Indian/Pakastani
Native American
Black
Asian/Pacific Islander/Filipino
Hispanic/Latino
www.santarosa.edu/research
05 –06
06 –07
07 –08
08 –09
09 –10
05 –06
06 –07
07 –08
08 –09
09 –10
UC CSU
White
Office of Institutional Research Student Outcomes • SO – 19

SONOMA COUNTY JUNIOR COLLEGE DISTRICT — Fact Book 2010 SO – 20
Asian/ Pacific
Islander/ BlackHispanic/
Latino
Grand
Total
Native
AmericanWhite
Other/
Unknown
# % # % # % # % # % # %
UC 9 4.7% 3 1.6% 17 8.8% 0 0.0% 140 72.5% 24 12.4% 193
CSU 43 4.9% 15 1.7% 99 11.2% 10 1.1% 566 64.0% 151 17.1% 884
UC 22 9.9% 1 0.5% 24 10.8% 4 1.8% 145 65.3% 26 11.7% 222
CSU 55 6.2% 12 1.3% 99 11.1% 15 1.7% 582 65.1% 131 14.7% 894
UC 28 14.4% 4 2.1% 16 8.2% 2 1.0% 127 65.5% 17 8.8% 194
CSU 60 6 2% 16 1 6% 101 10 4% 12 1 2% 602 61 7% 184 18 9% 975
FilipinoLatino TotalAmerican Unknown
2005–2006
2007–2008
2006–2007
Source: California Postsecondary Education Commission
CSU 60 6.2% 16 1.6% 101 10.4% 12 1.2% 602 61.7% 184 18.9% 975
UC 14 7.7% 1 0.5% 16 8.7% 3 1.6% 129 70.5% 20 10.9% 183
CSU 51 6.7% 10 1.3% 78 10.3% 4 0.5% 496 65.4% 119 15.7% 758
UC 26 12.1% 2 0.9% 23 10.7% 2 0.9% 138 64.2% 24 11.2% 215
CSU 22 3.8% 10 1.7% 74 12.7% 2 0.3% 344 59.2% 129 22.2% 5812009–2010
2008–2009
SRJC Transfer Students
Definition of Measure: The number of students who transferred from SRJC to the University of California, California State University, or independent colleges and universities (non‐public) from 2005–06 to 2009–10. The Fall transfer number represents students who transferred and enrolled in classes starting in the Fall term whereas the Full‐Year transfer number include the Fall transfer gnumber plus Winter, Spring and Summer transfers.
Additionally, UC and CSU transfers by ethnicity show the total full‐year number of students transferring to the UC and CSU systems by ethnic grouping. The numbers for independent colleges and universities are incomplete as the data are unavailable.
Source: California Postsecondary Education Commission (CPEC)
Comparison Group: California Community CollegesComparison Group: California Community Colleges
Use(s) of Measure: This measure shows SRJC transfer student destinations as a performance measure and for planning purposes.
Analysis: In 2009–10, the number of students transferring from SRJC to University of California increased (17%) from 2008–09. In contrast, transfers to California State Universities decreased for SRJC (23%). This statewide trend is mostly due to limited admissions to CSU’s invoked by the state budget crisis. In‐State Private and Out of State transfer data was made available in 2006 from thebudget crisis. In State Private and Out of State transfer data was made available in 2006 from the Chancellor’s Office. These figures are based on a cohort study of first‐time freshmen and constitute as an estimate.
For More Information:
California Postsecondary Education Commission: http://www.cpec.ca.gov/OnLineData/TransferPathway.asp,
California State University website: // / / / /
www.santarosa.edu/researchOffice of Institutional Research Student Outcomes • SO – 20
http://www.asd.calstate.edu/performance/ccc/ccc0607/index.shtml,
UC Stat Finder http://statfinder.ucop.edu/default.aspx ; and SRJC Transfer Center: http://www.santarosa.edu/instruction/prepare_for_transfer/transfer‐statistics/

SONOMA COUNTY JUNIOR COLLEGE DISTRICT — Fact Book 2010 SO – 21
SRJC Transfers to the University of California2005–06 to 2009–10
60%
70%
80%
90%
100%
2005 06 to 2009 10
Santa Cruz
Santa Barbara
San Diego
Riverside
0%
10%
20%
30%
40%
50%
60% Riverside
Merced
Los Angeles
Irvine
Davis
Berkeley
2005–06 2006–07 2007–08 2008–09 2009–10
2005–06 2006–07 2007–08 2008–09 2009–10Statewide
09–10
SRJC's % of
state
Berkeley 43 63 43 37 53 2,274 2.3%
Davis 81 70 75 63 69 2,039 3.4%
Irvine 5 3 3 3 8 1,604 0.5%
Los Angeles 10 14 17 14 15 2,934 0.5%
Merced 0 1 0 1 1 181 0.6%
Riverside 3 1 0 1 3 1,064 0.3%
San Diego 11 13 13 13 19 2,359 0.8%
Source: California Postsecondary Education Commission (CPEC).
Note: UCSF is not included because it accepts only graduate transfers.
Santa Barbara 16 15 17 18 24 1,682 1.4%
Santa Cruz 32 42 26 33 23 553 4.2%
Total 201 222 194 183 215 14,690 1.5%
www.santarosa.edu/researchOffice of Institutional Research Student Outcomes • SO – 21
SONOMA COUNTY JUNIOR COLLEGE DISTRICT — Fact Book 2010 SO – 22
SRJC Transfer Students to the University of California
Definition of Measure: The total annual number of SRJC transfers to each University of California campus.
Source: California Postsecondary Education Commission (CPEC)
Comparison Group: California Community Colleges
Use(s) of Measure: This measure shows the trends in UC attendance by SRJC transfer students and i f i di t Thi i d f d i d t d t i l iis a performance indicator. This measure is used for academic and student services planning purposes.
Analysis: The number of SRJC students transferring to the University of California increased to 215 in 2009–10. SRJC student transfers make up approximately 1.5% of all California Community College students transferring to the UC system, over 3% at UC Davis and 4% at UC Santa Cruz. The majority of UC transfers from SRJC enroll at the Davis campus; followed by the Berkeley, Santa Barbara , Santa Cruz, San Diego and Los Angeles campuses, respectively.
For More Information:
CPEC: http://www.cpec.ca.gov/OnLineData/TransferPathway.asp
www.santarosa.edu/researchOffice of Institutional Research Student Outcomes • SO – 22

SONOMA COUNTY JUNIOR COLLEGE DISTRICT — Fact Book 2010 SO – 23
Transfers to the California State University System2005 06 to 2009 10
700
800
900
1000
2005–06 to 2009–10
San Jose
Humboldt
l l
100
200
300
400
500
600
700Cal Poly, SLO
San Diego
Chico
Sacramento
San Francisco
Sonoma
0
100
2005–06 2006–07 2007–08 2008–09 2009–10
2005–06 2006–07 2007–08 2008–09 2009–10Statewide
09–10
SRJC's % of
state
Bakersfield 2 2 3 3 1 083Bakersfield 2 2 3 3 — 1,083 —
Cal Poly, SLO 40 39 41 36 21 559 3.8%
Channel Island — 2 3 3 4 634 0.6%
Chico 57 33 47 40 44 1,502 2.9%
Dominguez Hills 2 3 0 3 1 2,242 0.0%
East Bay (Hayward) 4 5 7 7 11 2,061 0.5%
Fresno 8 3 5 6 8 1,444 0.6%
Fullerton 2 6 6 1 3 3,521 0.1%
Humboldt 29 18 37 17 19 590 3.2%
International Programs — 1 — — — — —
Long Beach 19 23 23 10 7 1,907 0.4%
Los Angeles 3 3 2 8 4 1,818 0.2%
Maritime Academy 2 0 2 1 1 65 1.5%
Monterey Bay 3 3 4 7 5 500 1.0%
Northridge 9 7 10 5 8 3,437 0.2%
P 4 3 3 6 2 1 458 0 1%Pomona 4 3 3 6 2 1,458 0.1%
Sacramento 71 72 74 64 53 3,249 1.6%
San Bernadino 1 1 — — 2 1,614 0.1%
San Diego 38 34 55 34 6 2,408 0.2%
San Francisco 141 153 139 126 110 2,868 3.8%
San Jose 22 23 31 26 15 1,939 0.8%
San Marcos — — 1 2 3 1,457 0.0%
Sonoma 426 474 481 350 253 541 46.8%
www.santarosa.edu/researchOffice of Institutional Research Student Outcomes • SO – 23
Source: SRJC Transfer Center Website (data from the California State University)
Sonoma 426 474 481 350 253 541 46.8%
Stanislaus 1 3 1 3 1 754 0.1%
Total 884 911 975 758 581 37,651 1.5%
SONOMA COUNTY JUNIOR COLLEGE DISTRICT — Fact Book 2010 SO – 24
SRJC Transfer Students to the California State University
Definition of Measure: The total annual number of SRJC transfer students to each California State University campus.
Source: California Postsecondary Education Commission (CPEC)
Comparison Group: California Community Colleges
Use(s) of Measure: This measure shows the trends in CSU attendance of SRJC transfer students and b i d f i di t Thi i d f d i d t d t ican be viewed as a performance indicator. This measure is used for academic and student services
planning purposes.
Analysis: SRJC transfer students comprised approximately 1.5% of all California Community College student transfers to the California State University System. In 2009–10, the number of SRJC students transferring to the California State University decreased to 541 students. This trend, where CSU’s admitted less students due to the state budget crisis, is happening statewide. Over 46% of community college students transferring to Sonoma State University come from SRJC. Besides SSU, the top CSU campuses that SRJC transfer students attend are San Francisco, Sacramento, Chico, San Luis Obispo, and San Jose.
For More Information:
CPEC: http://www.cpec.ca.gov/OnLineData/TransferPathway.asp
www.santarosa.edu/researchOffice of Institutional Research Student Outcomes • SO – 24

SONOMA COUNTY JUNIOR COLLEGE DISTRICT — Fact Book 2010 SO – 25
California State University Outcomes of SRJC Students
70%
80%
90%
100%
Continuation Rates for Transfer Students to the CSU System2004–05 to 2008–09*
0%
10%
20%
30%
40%
50%
60%
SRJC
All CCC's
One‐Year Continuation Rate and CSU GPA for Transfer Students
0%
2004–05 2005–06 2006–07 2007–08 2008–09*
Enrolled in CSU CSU Continuation Continuation
SRJC Transfers All Transfers to CSU
Enrolled in
# % # %
2004–05 575 496 86% 3.13 34,736 29,539 85% 2.94
2005–06 578 516 89% 3.16 34,296 29,076 85% 2.92
2006–07 662 558 84% 3.17 36,225 30,020 83% 2.92
2007–08 720 627 87% 3.14 36,625 30,921 84% 2.93
2008–09* 573 511 89% 3.15 33,278 28,238 85% 2.98
FallGPA GPAFall
*Most current data available
3.5
4
CSU GPA for Transfer Students2004–05 to 2008–09
Most current data available.
2.5
3
3.5
www.santarosa.edu/researchOffice of Institutional Research Student Outcomes • SO – 25
2
2004–05 2005–06 2006–07 2007–08 2008–09*
SRJC All CCC's

SONOMA COUNTY JUNIOR COLLEGE DISTRICT — Fact Book 2010 SO – 26
CSU Pre‐Admission Grade Point Average for Transfer Students
Total GPA Total GPA
2004–05 575 3.10 34,736 2.91
2005–06 578 3.12 34,296 2.91
2006–07 662 3.08 36,225 2.91
2007–08 720 3.05 36,625 2.99
2008–09* 573 3.07 33,278 3.03
All Transfers to CSUSRJC Transfers
CSU Outcomes of SRJC Students
Definition of Measure: The continuation rate, the pre‐admission grade point average, the CSU
Source: California State University, Office of Analytic Studies
Note: Continuation is defined as students who re‐enroll the following Fall Semester.
grade point average and the CSU pre‐admission GPA of SRJC transfers compared to all California Community Colleges’ (CCC) transfer students to the CSU system from 2004–05 through 2008–09. Continuation is defined as students who re‐enroll the following Fall semester.
Source: California State University, Office of Analytic Studies
Comparison Group: All transfer students to California State University System
Use(s) of Measure: This measure shows SRJC transfer student outcomes compared to all transferUse(s) of Measure: This measure shows SRJC transfer student outcomes compared to all transfer students at CSU as a performance measure and for planning purposes.
Analysis: SRJC transfer students outperform other California Community College student transfers to the California State University in pre‐admission GPA, CSU GPA, and one‐year continuation rates.
For more information: California State University Academic Performance Reportshttp://www.asd.calstate.edu/performance/index.shtml
www.santarosa.edu/researchOffice of Institutional Research Student Outcomes • SO – 26

SONOMA COUNTY JUNIOR COLLEGE DISTRICT — Fact Book 2010 SO – 27
University of California Outcomes of SRJC Students
70%
80%
90%
100%
Persistence Rates for Transfer Students in the UC System2003–04 to 2007–08*
0%
10%
20%
30%
40%
50%
60%
SRJC
All CCC's
One‐Year Persistence Rate and UC GPA for Transfer Students
0%
2003–04 2004–05 2005–06 2006–07 2007–08*
Persistance UC Persistance UCEnrolled in
SRJC Transfers All Transfers to UC
Enrolled in
% GPA % GPA
2003–04 190 96% 3.18 12,539 90% 2.88
2004–05 217 94% 3.20 13,114 90% 2.89
2005–06 197 94% 3.19 13,510 92% 2.91
2006–07 220 94% 3.22 13,871 91% 2.88
2007–08* 195 96% 3.21 13,909 90% 2.89
Source: University of California StatFinder
Fall Fall
4
UC GPA for Transfer Students2003–04 to 2007–08*
*2008–09 persistence data was not available at time of publication.
Note: Persistence rates show the percentages of students who were enrolled at the end of their
first year at UC.
2.5
3
3.5
SRJC
All CCC's
www.santarosa.edu/researchOffice of Institutional Research Student Outcomes • SO – 27
2
2003–04 2004–05 2005–06 2006–07 2007–08*
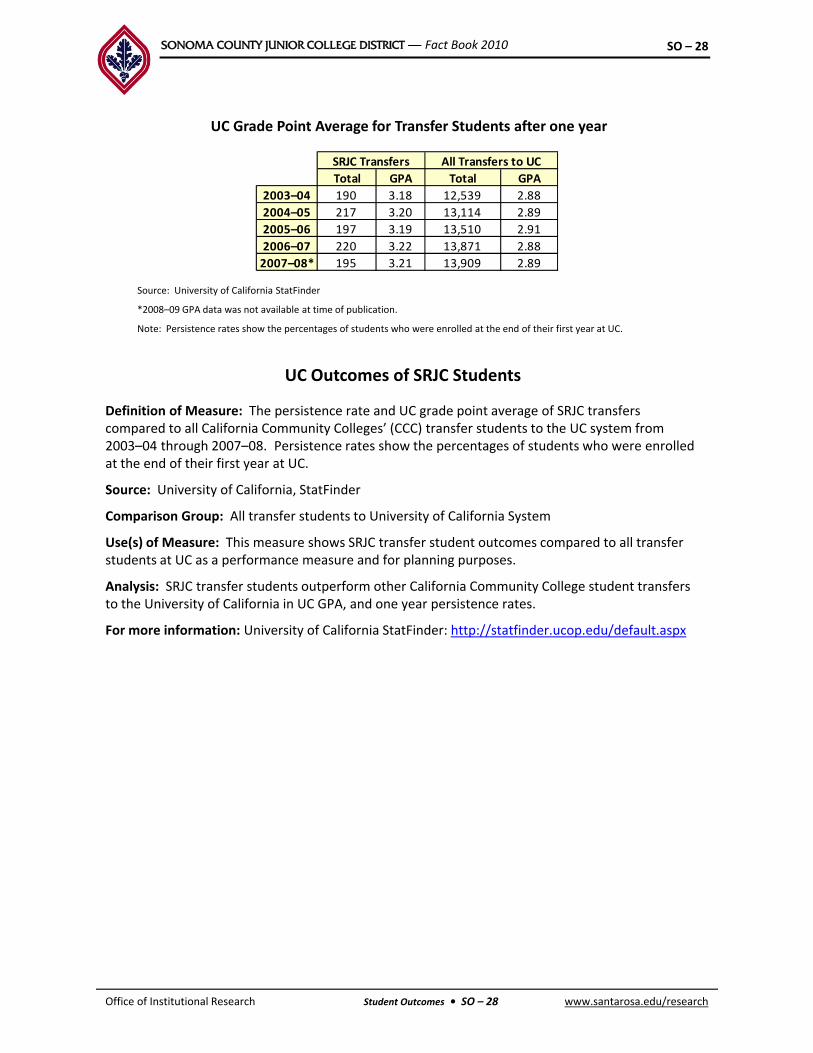
SONOMA COUNTY JUNIOR COLLEGE DISTRICT — Fact Book 2010 SO – 28
UC Grade Point Average for Transfer Students after one year
Total GPA Total GPA
2003–04 190 3.18 12,539 2.88
2004–05 217 3.20 13,114 2.89
2005–06 197 3.19 13,510 2.91
2006–07 220 3.22 13,871 2.88
2007–08* 195 3.21 13,909 2.89
All Transfers to UCSRJC Transfers
UC Outcomes of SRJC Students
Source: University of California StatFinder
*2008–09 GPA data was not available at time of publication.
Note: Persistence rates show the percentages of students who were enrolled at the end of their first year at UC.
Definition of Measure: The persistence rate and UC grade point average of SRJC transfers compared to all California Community Colleges’ (CCC) transfer students to the UC system from 2003–04 through 2007–08. Persistence rates show the percentages of students who were enrolled at the end of their first year at UC.
Source: University of California, StatFinder
Comparison Group: All transfer students to University of California System
Use(s) of Measure: This measure shows SRJC transfer student outcomes compared to all transfer students at UC as a performance measure and for planning purposes.
Analysis: SRJC transfer students outperform other California Community College student transfers to the University of California in UC GPA, and one year persistence rates.
For more information: University of California StatFinder: http://statfinder.ucop.edu/default.aspx
www.santarosa.edu/researchOffice of Institutional Research Student Outcomes • SO – 28

SONOMA COUNTY JUNIOR COLLEGE DISTRICT — Fact Book 2010 SO – 29
Career and Technical Education Act ( CTEA) Core Indicators Rates 2010‐11
Core 1 Skill Core 2 Core 3 Core 4 Core 5a NT* Core 5b NT*
Santa Rosa Junior College 95.82 64.10 77.92 82.86 56.25 46.59
Statewide for All Colleges 91.28 75.15 81.77 73.26 41.29 41.25
Santa Rosa Junior College 81.25 85.71 81.25 50.00 31.25 16.67
St t id f All C ll 89 78 89 59 86 67 68 41 32 85 34 04
Core 1 Skill
Attainment
Core 2
Completion
Core 3
Persistence
Core 4
Employment
Core 5a NT*
Participation
Core 5b NT*
Completion
Agriculture and Natural Resources (TOP Code 01)
Architecture and Related Technologies (TOP Code 02)
Statewide for All Colleges 89.78 89.59 86.67 68.41 32.85 34.04
Santa Rosa Junior College 86.06 86.80 78.57 81.40 42.11 46.31
Statewide for All Colleges 86.62 85.07 83.59 72.37 41.20 46.04
Santa Rosa Junior College 94.44 57.14 69.44 41.67 — —
Statewide for All Colleges 93.59 82.77 84.65 69.76 33.33 33.91
f
Business and Management (TOP Code 05)
Media and Communications (TOP Code 06)
Santa Rosa Junior College 73.39 96.43 76.19 70.67 36.79 41.25
Statewide for All Colleges 91.65 82.35 91.91 71.00 21.85 20.25
Santa Rosa Junior College 90.07 73.93 74.95 84.08 5.74 5.49
Statewide for All Colleges 91.49 56.33 77.61 82.84 6.66 9.35
S t R J i C ll 97 44 91 43 71 43 92 31 70 00 70 00
Engineering and Industrial Tech (TOP Code 09)
Information Technology
Fine and Applied Arts (TOP Code 10)
Santa Rosa Junior College 97.44 91.43 71.43 92.31 70.00 70.00
Statewide for All Colleges 92.82 83.74 84.96 68.19 45.33 45.56
Santa Rosa Junior College 71.53 98.55 81.34 89.94 14.53 12.36
Statewide for All Colleges 87.79 95.44 77.92 89.46 16.59 16.27
Santa Rosa Junior College 92.73 81.25 77.78 81.95 26.24 22.01
Statewide for All Colleges 89.63 79.37 82.02 74.97 11.01 11.19
Family and Consumer Sciences (TOP Code 13)
Health (TOP Code 12)
Santa Rosa Junior College 100.00 100.00 100.00 — 100.00 100.00Statewide for All Colleges 100.00 100.00 100.00 — 100.00 100.00
Santa Rosa Junior College 44.05 97.11 72.80 94.73 22.72 22.23
Statewide for All Colleges 85.14 78.73 79.69 87.94 25.60 27.55
Commercial Services (TOP Code 30)
Public and Protective Services (TOP Code 21)
Mathematics (TOP Code 17)
*NT = Non Traditional (under represented gender)
Source: CCCCO CTEA Website (CCCCO MIS DataBase, EDD Base Wage File, Department of Defense, Officeof Personnel Management, CSU Chancellor’s Office, UC Office of the President, 2000 Census.)
l l h l f l h l h
Santa Rosa Junior College 0.00 100.00 — 100.00 0.00 0.00
Statewide for All Colleges 91.13 71.82 66.46 73.76 7.35 8.42
www.santarosa.edu/researchOffice of Institutional Research Student Outcomes • SO – 29
Note: Total Count less than 10 students is in italics. Performance Rate less than goal is shaded. Total Count 10 or greater is bold.

SONOMA COUNTY JUNIOR COLLEGE DISTRICT — Fact Book 2010 SO – 30
Career and Technical Education Act (CTEA) Core Indicators
Definition of Measure: The Career Technical Education Act (CTEA) — also known as the Perkins Act — is a state‐administered federal program that provides direction and funding to support continuous improvement in career, and technical education. There are six core indicators that use percentage rates to measure the effectiveness of the program, using data collected through MIS:
Core 1 – Skill Attainment: GPA of 2.0 or higher and Grade C and above in Career Technical Education (CTE) courses (SAM A‐C).
Core 2 – Completion: Measures completions of vocational students “leavers and completers.” Receipt of a certificate or degree or equivalent or who complete a transfer program and become “Transfer Prepared” is considered a completion.
Core3 – Persistence or Transfer: Successful completion of a minimum “threshold of 12 or more units of related coursework” in a CTE program areas and who:
1) persisted in education at the community college level; or
2) transferred to a four year institution.
Core 4 – Employment (Student Placement): Measures CTE concentrators who did not transfer to a two or four year institution and were found during one of the four quarters following the cohort year in Unemployment Insurance (UI) covered employment, or apprenticeship program, the federal government or military in the year following the cohort year.
Core 5a – Participation: Participation of nontraditional (underrepresented gender) student ll i CTEenrollment in CTE programs
Core 5b – Completion: Completion of nontraditional (underrepresented gender) students in CTE programs.
Source: California Community Colleges Chancellor’s Office Career Technical Education website
Note: Career Technical Education Act (CTEA) is the Carl Perkins IV Career and Technical Education Act and was formerly known as the Vocational and Technical Education Act (VTEA).
Use(s) of Measure: This measure is used to show the progress of SRJC students in career andUse(s) of Measure: This measure is used to show the progress of SRJC students in career and technical education areas listed by Taxonomy of Programs (TOP) code as defined by CTEA.
Analysis: SRJC outperforms the State in Business and Management (TOP Code 05), Fine and Applied Arts (TOP Code 10) and Family and consumer Sciences (TOP Code 13). SRJC Completion (Core Indicator 2) performance and Non‐Traditional Participation and completions are mostly higher than the overall state levels.
For more information: https://misweb.cccco.edu/perkins/main.aspx
www.santarosa.edu/researchOffice of Institutional Research Student Outcomes • SO – 30

SONOMA COUNTY JUNIOR COLLEGE DISTRICT — Fact Book 2010 IE – 1
Institutional Effectiveness
Introduction
This section of the Fact Book presents various measures of institutional effectiveness including a comparison of SRJC student demographics with the population of Sonoma County as a whole, data on Full‐Time Equivalent Student per Full‐Time Equivalent Faculty (FTES/FTEF) ratios, student service contacts, average class size, and percentage of active sections offered per semester. Where
il bl t t t fi d iavailable, recent state figures are used as a comparison.
SRJC serves a higher proportion of female students compared to the Sonoma County and state proportions of females. SRJC enrolls a lower proportion of Whites compared to the county population and a higher proportion of Blacks.
The district‐wide FTES/FTEF ratio for credit and noncredit courses increased in 2009–10 to the highest in the past five years. Approximately two‐thirds of our FTES come from “Transfer Status” courses from the MIS Code status of “Transfer”courses from the MIS Code status of Transfer .
A large number of students made use of Student Services in 2009–10. Students visits to the Transfer Center and Student Health Services increased . The Categorical Programs of Disabled Student Programs and Services (DSPS), known locally as Disability Resources Department (DRD), and CalWORKS grew in 2009–10.
Average class size continues to increase in 2009–10. Average class size is generally higher in full‐semester courses than in short‐term courses and is very similar for both day and evening coursessemester courses than in short term courses and is very similar for both day and evening courses. The number of active sections remained stable in 2009–10 after decreasing District‐wide in 2008–09.
www.santarosa.edu/researchOffice of Institutional Research Institutional Effectiveness • IE – 1

SONOMA COUNTY JUNIOR COLLEGE DISTRICT — Fact Book 2010 IE – 2
SRJC Student Population By Ethnicity (Fall 2009) Compared to County and State Populations (2010 Projection)
70%
80%
90%
100%
Two or more races
Unknown
Filipino
10%
20%
30%
40%
50%
60% Native American
Black
Asian/Pacific Islander
Hispanic/Latino
White
0%
SRJC County State
Gender of College‐Aged Population
% of
CountySRJC
% of
EnrollmentCalifornia
% of
State
Sonoma
County
Male 13,087 42.2% 195,114 49.2% 15,342,528 49.6%
Female 17,326 55.9% 201,366 50.8% 15,594,010 50.4%
Unknown 604 1.9% — — — —
Total College‐Age 31,017 100% 396,480 100% 30,936,538 100%
≤19 7 459 24 0% 133 556 27 0% 11 253 559 28 8%
Gender of College‐Aged Population
Age
≤19 7,459 24.0% 133,556 27.0% 11,253,559 28.8%
20–24 7,885 25.4% 36,585 7.4% 2,915,534 7.4%
25–29 3,651 11.8% 36,552 7.4% 2,670,069 6.8%
30–39 2,061 6.6% 54,893 11.1% 5,145,890 13.1%
40–49 1,677 5.4% 64,097 12.9% 5,735,146 14.7%
50+ 2,864 9.2% 169,732 34.3% 11,415,478 29.2%
Unknown 5,420 — — — — —
Total 31,017 83% 495,415 100% 39,135,676 100%
Asian/Pacific Islander 1,278 4.1% 19,453 4.9% 3,980,211 12.9%
Black 716 2.3% 6,334 1.6% 1,835,572 5.9%
Filipino 280 0.9% — — — —
Hispanic/Latino 5,951 19.2% 77,846 19.6% 10,421,614 33.7%
Native American 284 0.9% 4,238 1.1% 205,884 0.7%
Ethnicity of College‐Aged Population
www.santarosa.edu/researchOffice of Institutional Research Institutional Effectiveness • IE – 2
White 17,402 56.1% 281,282 70.9% 13,986,805 45.2%
Two or more races 399 1.3% 7,327 1.8% 506,452 1.6%
Unknown 4,707 15.2% — — — —
Total 31,017 100% 396,480 100% 30,936,538 100%

SONOMA COUNTY JUNIOR COLLEGE DISTRICT — Fact Book 2010 IE – 3
Source: State and County estimates are from California Department of Finance; SRJC data are from California Community College Chancellor’s Office. Chancellor’s Office data was used for SRJC since internal SRJC data age b kd diff t th th t t d t d t i Ch ll ’ Offi SRJC t t l diffbreakdowns are different than the state and county data groupings. Chancellor’s Office SRJC totals may differ from SRJC internally compiled reports.
Note: College Age is defined as 15+ years old. *Ethnicity includes the entire SRJC student and Sonoma County populations regardless of age. “Unknown” for SRJC includes students who decline to state their ethnicity.
Population of Sonoma County By Ethnicity
Definition of Measure: A comparison between Fall 2009 Santa Rosa Junior College students and the projected Sonoma County and California population in 2010 (the most recent available county and state figures), including a breakdown by gender, age, and ethnicity.
Source: California Community College Systems Office, SRJC Data; California Department of Finance (DOF) for Sonoma County and California data Note: Chancellor’s Office data was used because the(DOF) for Sonoma County and California data. Note: Chancellor s Office data was used because the age ranges match DOF. Chancellor’s Office SRJC totals may differ from SRJC internally compiled reports.
Comparison Group: Sonoma County and California
Use(s) of Measure: This measure is an indicator of access to SRJC and can be used for outreach and program planning purposes.
Analysis: In comparing the gender and ethnic composition of the county with enrolled students, a y p g g p yfew trends emerge. SRJC serves a higher proportion of women and 20 through 29 year olds. The county population has a higher proportion of men, Whites, and Hispanic/Latinos than the district enrollment.
The state population by gender mirrors that of the county, while the ethnic and age distributions differ. The state has a higher proportion of Asians, Blacks, Hispanics/Latinos and residents under the age of 19 than Sonoma County.
For more information: Chancellor’s OfficeFor more information: Chancellor s Office http://www.cccco.edu/SystemOffice/Divisions/TechResearchInfo/MIS/DataMartandReports/tabid/282/Default.aspx and California Department of Financehttp://www.dof.ca.gov/research/demographic/reports/
www.santarosa.edu/researchOffice of Institutional Research Institutional Effectiveness • IE – 3
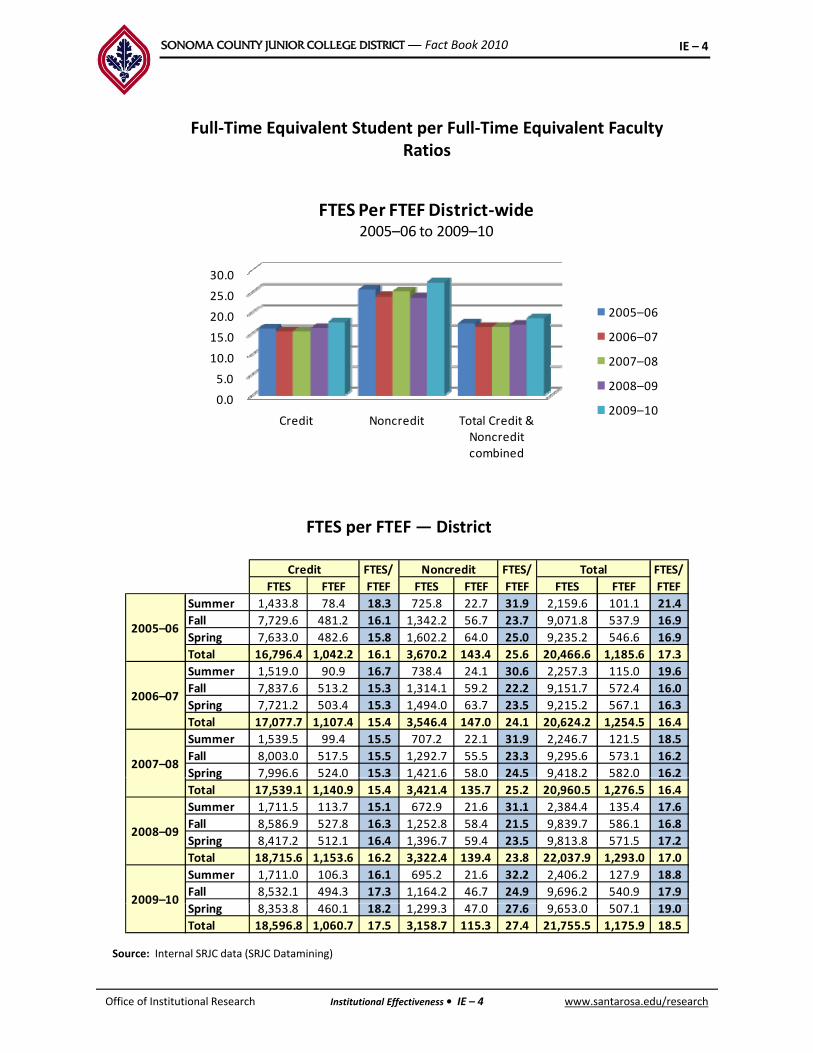
SONOMA COUNTY JUNIOR COLLEGE DISTRICT — Fact Book 2010 IE – 4
Full‐Time Equivalent Student per Full‐Time Equivalent Faculty RatiosRatios
30 0
FTES Per FTEF District‐wide2005–06 to 2009–10
0 0
5.0
10.0
15.0
20.0
25.0
30.0
2005–06
2006–07
2007–08
2008–09
FTES per FTEF District
0.0
Credit Noncredit Total Credit & Noncredit combined
2009–10
FTES per FTEF —District
FTES FTEF FTES FTEF FTES FTEF
Summer 1,433.8 78.4 18.3 725.8 22.7 31.9 2,159.6 101.1 21.4
Fall 7,729.6 481.2 16.1 1,342.2 56.7 23.7 9,071.8 537.9 16.9
Spring 7,633.0 482.6 15.8 1,602.2 64.0 25.0 9,235.2 546.6 16.9
T t l 16 796 4 1 042 2 16 1 3 670 2 143 4 25 6 20 466 6 1 185 6 17 3
Credit FTES/
FTEF
Noncredit FTES/
FTEF
Total FTES/
FTEF
2005–06
Total 16,796.4 1,042.2 16.1 3,670.2 143.4 25.6 20,466.6 1,185.6 17.3
Summer 1,519.0 90.9 16.7 738.4 24.1 30.6 2,257.3 115.0 19.6
Fall 7,837.6 513.2 15.3 1,314.1 59.2 22.2 9,151.7 572.4 16.0
Spring 7,721.2 503.4 15.3 1,494.0 63.7 23.5 9,215.2 567.1 16.3
Total 17,077.7 1,107.4 15.4 3,546.4 147.0 24.1 20,624.2 1,254.5 16.4
Summer 1,539.5 99.4 15.5 707.2 22.1 31.9 2,246.7 121.5 18.5
Fall 8,003.0 517.5 15.5 1,292.7 55.5 23.3 9,295.6 573.1 16.2
Spring 7,996.6 524.0 15.3 1,421.6 58.0 24.5 9,418.2 582.0 16.2
2006–07
2007–08p g , , ,
Total 17,539.1 1,140.9 15.4 3,421.4 135.7 25.2 20,960.5 1,276.5 16.4
Summer 1,711.5 113.7 15.1 672.9 21.6 31.1 2,384.4 135.4 17.6
Fall 8,586.9 527.8 16.3 1,252.8 58.4 21.5 9,839.7 586.1 16.8
Spring 8,417.2 512.1 16.4 1,396.7 59.4 23.5 9,813.8 571.5 17.2
Total 18,715.6 1,153.6 16.2 3,322.4 139.4 23.8 22,037.9 1,293.0 17.0
Summer 1,711.0 106.3 16.1 695.2 21.6 32.2 2,406.2 127.9 18.8
Fall 8,532.1 494.3 17.3 1,164.2 46.7 24.9 9,696.2 540.9 17.9
2008–09
2009–10
www.santarosa.edu/researchOffice of Institutional Research Institutional Effectiveness • IE – 4
Source: Internal SRJC data (SRJC Datamining)
Spring 8,353.8 460.1 18.2 1,299.3 47.0 27.6 9,653.0 507.1 19.0
Total 18,596.8 1,060.7 17.5 3,158.7 115.3 27.4 21,755.5 1,175.9 18.5
2009 10

SONOMA COUNTY JUNIOR COLLEGE DISTRICT — Fact Book 2010 IE – 5
Full‐Time Equivalent Student per Full‐Time Equivalent Faculty
Definition of Measure: Full‐Time Equivalent Student (FTES) is the equivalent of 30 credit units enrolled or 525 student contact hours in credit or noncredit courses per student per year.
Full‐Time Equivalent Faculty (FTEF) is based on the percentage of instructional hours per week considered a full‐time assignment for regular instructional employees. The FTES per FTEF ratio shows the full‐time equivalent students served by each full‐time equivalent faculty.
Source: Internal SRJC data (SRJC Datamining)Source: Internal SRJC data (SRJC Datamining)
Use(s) of Measure: This measure is used as an indicator of institutional efficiency for fiscal responsibility.
Analysis: The FTES/FTEF ratio for credit and noncredit courses in 2009–10 are the highest in the past five years. The FTES/FTEF ratio for noncredit courses is approximately 40% higher than for credit courses, in part because not all clusters report FTEF for noncredit courses (see FTES/FTEF per cluster below) The FTES/FTEF ratio tends to be highest during the Summer for both credit and noncreditbelow). The FTES/FTEF ratio tends to be highest during the Summer for both credit and noncredit.
For more information:
See Annual FTES in the Financial Section for a discussion of the proportion of credit to noncredit FTES/FTEF and how this proportion has changed over time.
SRJC Datamining: www.santarosa.edu/datamine (Outlook password required).
www.santarosa.edu/researchOffice of Institutional Research Institutional Effectiveness • IE – 5
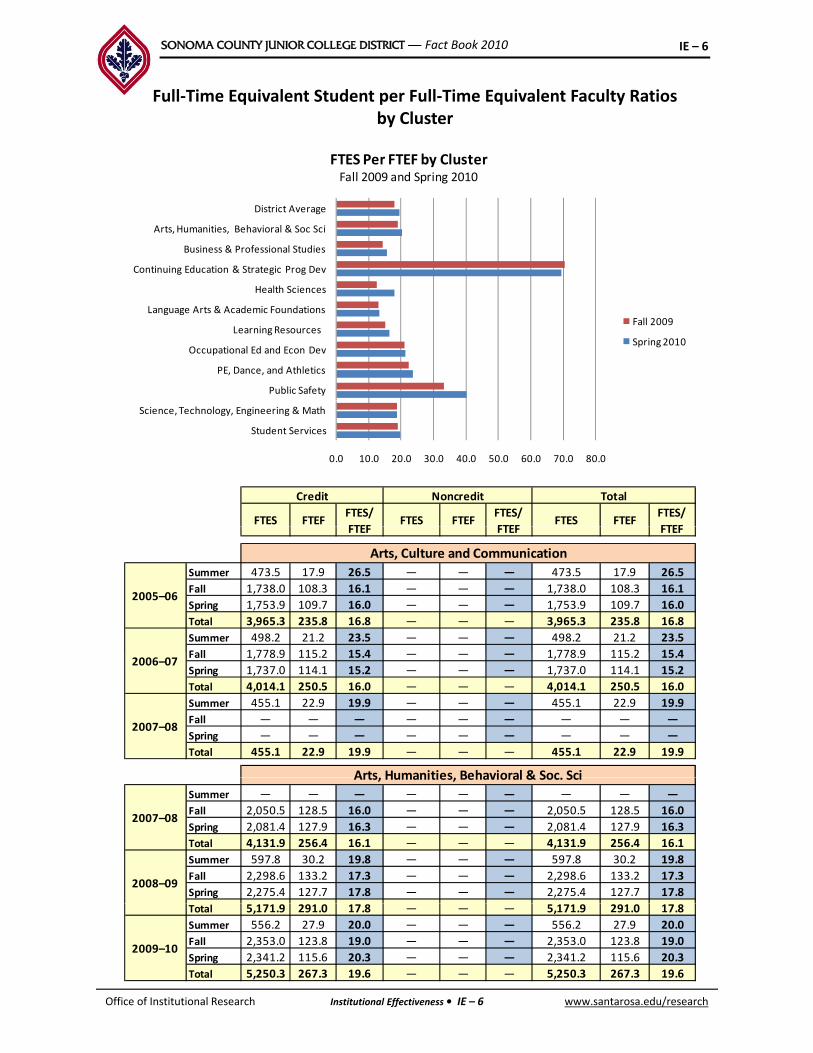
SONOMA COUNTY JUNIOR COLLEGE DISTRICT — Fact Book 2010 IE – 6
Full‐Time Equivalent Student per Full‐Time Equivalent Faculty Ratios by Cluster
Continuing Education & Strategic Prog Dev
Business & Professional Studies
Arts, Humanities, Behavioral & Soc Sci
District Average
FTES Per FTEF by ClusterFall 2009 and Spring 2010
Public Safety
PE, Dance, and Athletics
Occupational Ed and Econ Dev
Learning Resources
Language Arts & Academic Foundations
Health Sciences
Fall 2009
Spring 2010
0.0 10.0 20.0 30.0 40.0 50.0 60.0 70.0 80.0
Student Services
Science, Technology, Engineering & Math
FTES/
FTEF
Total
FTES
Credit Noncredit
FTESFTES/
FTEFFTEFFTEF FTES FTEF
FTES/
FTEF
Summer 473.5 17.9 26.5 — — — 473.5 17.9 26.5
Fall 1,738.0 108.3 16.1 — — — 1,738.0 108.3 16.1
Spring 1,753.9 109.7 16.0 — — — 1,753.9 109.7 16.0
Total 3,965.3 235.8 16.8 — — — 3,965.3 235.8 16.8
Summer 498.2 21.2 23.5 — — — 498.2 21.2 23.5
F ll 1 778 9 115 2 15 4 1 778 9 115 2 15 4
FTEF
2005–06
FTEF FTEF
Arts, Culture and Communication
Fall 1,778.9 115.2 15.4 — — — 1,778.9 115.2 15.4
Spring 1,737.0 114.1 15.2 — — — 1,737.0 114.1 15.2
Total 4,014.1 250.5 16.0 — — — 4,014.1 250.5 16.0
Summer 455.1 22.9 19.9 — — — 455.1 22.9 19.9
Fall — — — — — — — — —
Spring — — — — — — — — —
Total 455.1 22.9 19.9 — — — 455.1 22.9 19.9
Arts, Humanities, Behavioral & Soc. Sci
2006–07
2007–08
Summer — — — — — — — — —
Fall 2,050.5 128.5 16.0 — — — 2,050.5 128.5 16.0
Spring 2,081.4 127.9 16.3 — — — 2,081.4 127.9 16.3
Total 4,131.9 256.4 16.1 — — — 4,131.9 256.4 16.1
Summer 597.8 30.2 19.8 — — — 597.8 30.2 19.8
Fall 2,298.6 133.2 17.3 — — — 2,298.6 133.2 17.3
Spring 2,275.4 127.7 17.8 — — — 2,275.4 127.7 17.8
Arts, Humanities, Behavioral & Soc. Sci
2008–09
2007–08
www.santarosa.edu/researchOffice of Institutional Research Institutional Effectiveness • IE – 6
Total 5,171.9 291.0 17.8 — — — 5,171.9 291.0 17.8
Summer 556.2 27.9 20.0 — — — 556.2 27.9 20.0
Fall 2,353.0 123.8 19.0 — — — 2,353.0 123.8 19.0
Spring 2,341.2 115.6 20.3 — — — 2,341.2 115.6 20.3
Total 5,250.3 267.3 19.6 — — — 5,250.3 267.3 19.6
2009–10

SONOMA COUNTY JUNIOR COLLEGE DISTRICT — Fact Book 2010 IE – 7
FTES per FTEF by Cluster, continued
Credit Noncredit Total
FTES FTEFFTES/
FTES FTEFFTES/
FTES FTEFFTES/
Summer 124.4 9.2 13.5 5.8 0.0 — 130.2 9.2 14.2
Fall 711.0 54.7 13.0 58.8 0.2 352.8 769.8 54.8 14.0
Spring 736.0 57.8 12.7 64.7 0.1 848.5 800.6 57.9 13.8
Total 1,571.3 121.6 12.9 129.3 0.2 532.3 1,700.6 121.9 14.0
Summer 145.3 11.6 12.5 7.0 0.0 — 152.3 11.6 13.1
F ll 703 0 58 3 12 1 34 8 0 2 208 8 737 8 58 5 12 6
FTEF FTEF FTEF
Business, CIS, Weekend and Occupational
2005–06
Fall 703.0 58.3 12.1 34.8 0.2 208.8 737.8 58.5 12.6
Spring 719.0 57.1 12.6 28.4 0.1 372.7 747.4 57.2 13.1
Total 1,567.3 127.0 12.3 70.2 0.2 289.0 1,637.5 127.2 12.9
Summer 137.8 11.9 11.6 9.7 0.0 — 147.4 11.9 12.4
Fall — — — — — — — — —
Spring — — — — — — — — —
Total 137.8 11.9 11.6 9.7 0.0 — 147.4 11.9 12.4
Business & Professional Studies
2006–07
2007–08
Summer — — — — — — — — —
Fall 723.4 63.4 11.4 43.7 — — 767.1 63.4 12.1
Spring 725.7 59.8 12.1 40.9 — — 766.6 59.8 12.8
Total 1,602.7 140.1 11.4 95.1 — — 1,697.8 140.1 12.1
Summer 200.5 19.1 10.5 9.2 0.2 55.0 209.7 19.2 10.9
Fall 1,060.7 80.1 13.3 23.2 0.2 142.8 1,083.9 80.2 13.5
Spring 1,067.3 79.5 13.4 20.9 0.2 114.0 1,088.1 79.6 13.7
2 328 5 178 6 13 0 53 2 0 5 103 9 2 381 8 179 1 13 3
Business & Professional Studies
2008–09
2007–08
Total 2,328.5 178.6 13.0 53.2 0.5 103.9 2,381.8 179.1 13.3
Summer 206.1 16.1 12.8 10.9 0.0 — 217.0 16.1 13.5
Fall 1,072.5 75.6 14.2 20.6 0.2 114.0 1,093.2 75.8 14.4
Spring 1,046.8 67.7 15.5 18.8 0.1 231.4 1,065.6 67.8 15.7
Total 2,325.5 159.4 14.6 50.3 0.3 191.9 2,375.8 159.7 14.9
Summer — — — — — — — — —
Fall 849 3 19 0 44 7 849 3 19 0 44 7
Continuing Education & Strategic Program Development
2009–10
Fall — — — 849.3 19.0 44.7 849.3 19.0 44.7
Spring — — — 982.3 22.0 44.7 982.3 22.0 44.7
Total — — — 1,831.6 41.0 44.7 1,831.6 41.0 44.7
Summer — — — 518.1 11.9 43.7 518.1 11.9 43.7
Fall — — — 741.4 10.5 70.4 741.4 10.5 70.4
Spring — — — 851.4 12.3 69.2 851.4 12.3 69.2
Total — — — 2,110.8 34.7 60.8 2,110.8 34.7 60.8
2008–09
2009–10
Educational Programs and Services
Summer 8.0 0.8 10.1 558.9 14.5 38.6 566.9 15.3 37.1
Fall 183.0 13.5 13.6 941.8 25.2 37.4 1,124.8 38.7 29.1
Spring 187.3 13.7 13.7 1,173.9 30.0 39.1 1,361.1 43.7 31.1
Total 378.3 28.0 13.5 2,674.6 69.7 38.4 3,052.9 97.7 31.3
Summer 13.9 1.3 10.7 575.1 14.3 40.2 589.0 15.6 37.8
Fall 179.0 14.2 12.6 933.4 25.2 37.0 1,112.4 39.4 28.2
Spring 188.2 13.9 13.5 1,076.2 26.4 40.8 1,264.4 40.3 31.4
l 381 1 29 4 13 0 2 584 7 65 9 39 2 2 965 8 95 3 31 1
2005–06
2006–07
Educational Programs and Services
www.santarosa.edu/researchOffice of Institutional Research Institutional Effectiveness • IE – 7
Total 381.1 29.4 13.0 2,584.7 65.9 39.2 2,965.8 95.3 31.1
Summer 18.8 2.3 8.1 552.6 11.9 46.4 571.5 14.2 40.2
Fall — — — — — — — — —
Spring — — — — — — — — —
Total 18.8 2.3 8.1 552.6 11.9 46.4 571.5 14.2 40.2
2007–08

SONOMA COUNTY JUNIOR COLLEGE DISTRICT — Fact Book 2010 IE – 8
FTES per FTEF by Cluster, continued
Credit Noncredit Total
Summer — — — — — — — — —
Fall 1,398.6 105.2 13.3 316.3 35.0 9.0 1,714.9 140.2 12.2
Spring 1,237.1 98.8 12.5 323.6 34.8 9.3 1,560.7 133.6 11.7
Total 2,635.7 204.1 12.9 639.9 69.8 9.2 3,275.6 273.8 12.0
2007–08
FTES/
FTEFFTES FTEF FTEF FTES FTEF
Language Arts & Academic Foundations
FTESFTES/
FTEF
FTES/
FTEF
Summer 183.5 18.7 9.8 133.1 9.0 14.8 316.6 27.7 11.4
Fall 1,434.9 103.6 13.8 326.4 38.4 8.5 1,761.3 142.0 12.4
Spring 1,252.9 96.6 13.0 337.7 37.2 9.1 1,590.6 133.8 11.9
Total 2,871.2 218.9 13.1 797.3 84.6 9.4 3,668.5 303.5 12.1
Summer 189.6 16.0 11.8 10.9 0.0 — 200.5 16.0 12.5
Fall 1,392.9 99.3 14.0 352.1 34.9 10.1 1,745.0 134.1 13.0
Spring 1,198.1 84.3 14.2 371.5 33.5 11.1 1,569.7 117.8 13.3
Total 2 780 6 199 6 13 9 734 5 68 4 10 7 3 515 1 268 0 13 1
2009–10
2008–09
Total 2,780.6 199.6 13.9 734.5 68.4 10.7 3,515.1 268.0 13.1
Summer — — — — — — — — —
Fall 18.9 1.4 13.7 — — — 18.9 1.4 13.7
Spring 21.6 1.5 14.3 — — — 21.6 1.5 14.3
Total 40.4 2.9 14.0 — — — 40.4 2.9 14.0
Summer 8.0 0.5 14.6 — — — 8.0 0.5 14.6
2007–08
Learning Resources
Fall 19.9 1.5 13.5 — — — 19.9 1.5 13.5
Spring 24.1 1.6 15.2 — — — 24.1 1.6 15.2
Total 52.0 3.6 14.4 — — — 52.0 3.6 14.4
Summer 9.7 0.6 15.6 — — — 9.7 0.6 15.6
Fall 24.0 1.6 15.2 — — — 24.0 1.6 15.2
Spring 26.9 1.6 16.3 — — — 26.9 1.6 16.3
Total 60.6 3.8 15.8 — — — 60.6 3.8 15.8
2009–10
2008–09
L i R d Ed T h l
Summer 6.0 0.4 15.2 — — — 6.0 0.4 15.2
Fall 13.8 1.1 12.4 — — — 13.8 1.1 12.4
Spring 18.1 1.4 13.1 — — — 18.1 1.4 13.1
Total 37.8 2.9 13.1 — — — 37.8 2.9 13.1
Summer 6.3 0.5 12.6 — — — 6.3 0.5 12.6
Fall 14.4 1.2 12.0 — — — 14.4 1.2 12.0
Spring 21 2 1 5 14 1 — — — 21 2 1 5 14 1
2005–06
2006–07
Learning Resources and Ed Technology
Spring 21.2 1.5 14.1 — — — 21.2 1.5 14.1
Total 41.9 3.2 13.1 — — — 41.9 3.2 13.1
Summer 6.5 0.4 16.7 — — — 6.5 0.4 16.7
Fall — — — — — — — — —
Spring — — — — — — — — —
Total 6.5 0.4 16.7 — — — 6.5 0.4 16.7
2007–08
www.santarosa.edu/researchOffice of Institutional Research Institutional Effectiveness • IE – 8

SONOMA COUNTY JUNIOR COLLEGE DISTRICT — Fact Book 2010 IE – 9
FTES per FTEF by Cluster, continued
Credit Noncredit Total
FTES FTEFFTES/
FTEFFTES FTEF
FTES/
FTEFFTES FTEF
FTES/
FTEF
Summer 254.7 19.9 12.8 153.6 8.0 19.3 408.4 27.9 14.7
Fall 1,860.6 126.1 14.8 285.1 31.3 9.1 2,145.8 157.4 13.6
Spring 1,722.5 122.6 14.1 317.0 33.8 9.4 2,039.5 156.4 13.0
Total 3,837.9 268.6 14.3 755.8 73.1 10.3 4,593.7 341.7 13.4
Summer 258.8 22.5 11.5 147.6 9.5 15.5 406.4 32.0 12.7
Fall 1 905 1 136 5 14 0 299 9 35 1 8 5 2 205 0 171 6 12 8
FTEF FTEF FTEF
Letters and Social Sciences
2005–06
Fall 1,905.1 136.5 14.0 299.9 35.1 8.5 2,205.0 171.6 12.8
Spring 1,788.0 129.7 13.8 330.9 37.0 8.9 2,118.9 166.7 12.7
Total 3,951.9 288.7 13.7 778.4 81.6 9.5 4,730.3 370.3 12.8
Summer 260.3 23.7 11.0 135.3 10.0 13.6 395.5 33.7 11.8
Fall — — — — — — — — —
Spring — — — — — — — — —
Total 260.3 23.7 11.0 135.3 10.0 13.6 395.5 33.7 11.8
Occupational Education & Economic Dev
2006–07
2007–08
Summer — — — — — — — — —
Fall 462.7 25.4 18.2 — — — 462.7 25.4 18.2
Spring 516.9 28.5 18.1 — — — 516.9 28.5 18.1
Total 979.6 53.9 18.2 — — — 979.6 53.9 18.2
Summer 35.3 2.7 13.0 — — — 35.3 2.7 13.0
Fall 513.8 25.0 20.6 — — — 513.8 25.0 20.6
Spring 523.0 27.0 19.4 — — — 523.0 27.0 19.4
Occupational Education & Economic Dev
2008–09
2007–08
Spring 523.0 27.0 19.4 523.0 27.0 19.4
Total 1,072.1 54.7 19.6 — — — 1,072.1 54.7 19.6
Summer 42.4 2.9 14.8 — — — 42.4 2.9 14.8
Fall 471.4 22.5 21.0 — — — 471.4 22.5 21.0
Spring 511.4 24.1 21.2 — — — 511.4 24.1 21.2
Total 1,025.1 49.4 20.7 — — — 1,025.1 49.4 20.7
Summer 104 2 4 9 21 4 — — — 104 2 4 9 21 4
PE, Dance, Athletics
2009–10
Summer 104.2 4.9 21.4 — — — 104.2 4.9 21.4
Fall 544.5 25.3 21.5 — — — 544.5 25.3 21.5
Spring 541.7 24.2 22.3 — — — 541.7 24.2 22.3
Total 1,190.5 54.4 21.9 — — — 1,190.5 54.4 21.9
Summer 120.6 6.1 19.8 — — — 120.6 6.1 19.8
Fall 559.4 26.9 20.8 — — — 559.4 26.9 20.8
Spring 572.4 27.3 21.0 — — — 572.4 27.3 21.0
Total 1,252.4 60.3 20.8 — — — 1,252.4 60.3 20.8
2006–07
2005–06
Summer 127.3 6.9 18.5 — — — 127.3 6.9 18.5
Fall 612.8 30.2 20.3 — — — 612.8 30.2 20.3
Spring 625.1 29.7 21.1 — — — 625.1 29.7 21.1
Total 1,365.2 66.7 20.5 — — — 1,365.2 66.7 20.5
Summer 146.2 7.7 19.0 — — — 146.2 7.7 19.0
Fall 659.6 31.5 21.0 — — — 659.6 31.5 21.0
Spring 641.5 29.3 21.9 — — — 641.5 29.3 21.9
T t l 1 447 3 68 5 21 1 1 447 3 68 5 21 1
2007–08
2008–09
www.santarosa.edu/researchOffice of Institutional Research Institutional Effectiveness • IE – 9
Total 1,447.3 68.5 21.1 — — — 1,447.3 68.5 21.1
Summer 173.6 8.1 21.5 — — — 173.6 8.1 21.5
Fall 586.8 26.3 22.3 — — — 586.8 26.3 22.3
Spring 568.2 24.1 23.6 — — — 568.2 24.1 23.6
Total 1,328.6 58.5 22.7 — — — 1,328.6 58.5 22.7
2009–10

SONOMA COUNTY JUNIOR COLLEGE DISTRICT — Fact Book 2010 IE – 10
FTES per FTEF by Cluster, continued
Summer 95.8 1.1 83.8 2.3 — — 98.1 1.1 85.9
Fall 343.9 12.4 27.7 5.6 — — 349.5 12.4 28.2
FTES FTEF FTES FTEF
Noncredit TotalCredit
Public Safety
FTES FTEFFTES/
FTEF
FTES/
FTEF
FTES/
FTEF
Fall 343.9 12.4 27.7 5.6 349.5 12.4 28.2
Spring 444.5 13.9 32.0 3.7 — — 448.2 13.9 32.3
Total 884.2 27.4 32.2 11.6 — — 895.8 27.4 32.6
Summer 91.9 1.3 70.7 1.9 — — 93.8 1.3 72.2
Fall 387.6 14.5 26.7 4.7 — — 392.3 14.5 27.1
Spring 461.7 14.5 31.8 2.7 — — 464.4 14.5 32.0
Total 941.2 30.3 31.1 9.3 — — 950.5 30.3 31.4
Summer 115.9 1.4 85.2 2.7 — — 118.5 1.4 87.1
2006–07
2005–06
Fall 393.4 13.3 29.6 4.1 — — 397.5 13.3 29.9
Spring 437.9 17.6 24.8 2.1 — — 440.0 17.6 24.9
Total 947.2 32.3 29.3 8.8 — — 956.0 32.3 29.6
Summer 97.4 1.6 62.5 3.3 — — 100.7 1.6 64.6
Fall 400.9 14.3 28.1 3.9 — — 404.9 14.3 28.4
Spring 463.9 12.5 37.3 0.9 — — 464.9 12.5 37.3
Total 962.3 28.3 34.0 8.2 — — 970.5 28.3 34.3
S 92 9 2 2 42 0 0 4 93 3 2 2 42 1
2008–09
2007–08
Summer 92.9 2.2 42.0 0.4 — — 93.3 2.2 42.1
Fall 374.4 11.3 33.1 2.3 — — 376.7 11.3 33.3
Spring 448.1 11.2 39.8 4.1 — — 452.2 11.2 40.2
Total 915.4 24.8 36.9 6.8 — — 922.3 24.8 37.2
Summer 152.1 10.0 15.3 — — — 152.1 10.0 15.3
Fall 1,220.2 72.2 16.9 28.4 — — 1,248.7 72.2 17.3
Science and Applied Technology
2004–05
2009–10
Spring 1,142.8 71.6 16.0 30.8 — — 1,173.5 71.6 16.4
Total 2,515.1 153.8 16.4 59.2 — — 2,574.2 153.8 16.7
Summer 148.4 9.8 15.2 2.6 — — 151.0 9.8 15.4
Fall 1,055.2 66.8 15.8 36.4 — — 1,091.6 66.8 16.3
Spring 972.5 63.0 15.4 34.0 — — 1,006.4 63.0 16.0
Total 2,176.1 139.6 15.6 72.9 — — 2,249.0 139.6 16.1
Summer 162.6 10.5 15.5 2.3 — — 164.9 10.5 15.7
Fall 1 133 9 72 4 15 7 16 1 — — 1 150 0 72 4 15 9
2004 05
2005–06
Fall 1,133.9 72.4 15.7 16.1 — — 1,150.0 72.4 15.9
Spring 1,054.5 70.0 15.1 17.1 — — 1,071.6 70.0 15.3
Total 2,351.0 152.9 15.4 35.5 — — 2,386.5 152.9 15.6
Summer 164.7 11.7 14.0 1.6 — — 166.2 11.7 14.2
Fall — — — — — — — — —
Spring — — — — — — — — —
Total 164.7 11.7 14.0 1.6 — — 166.2 11.7 14.2
2006–07
2007–08
www.santarosa.edu/researchOffice of Institutional Research Institutional Effectiveness • IE – 10
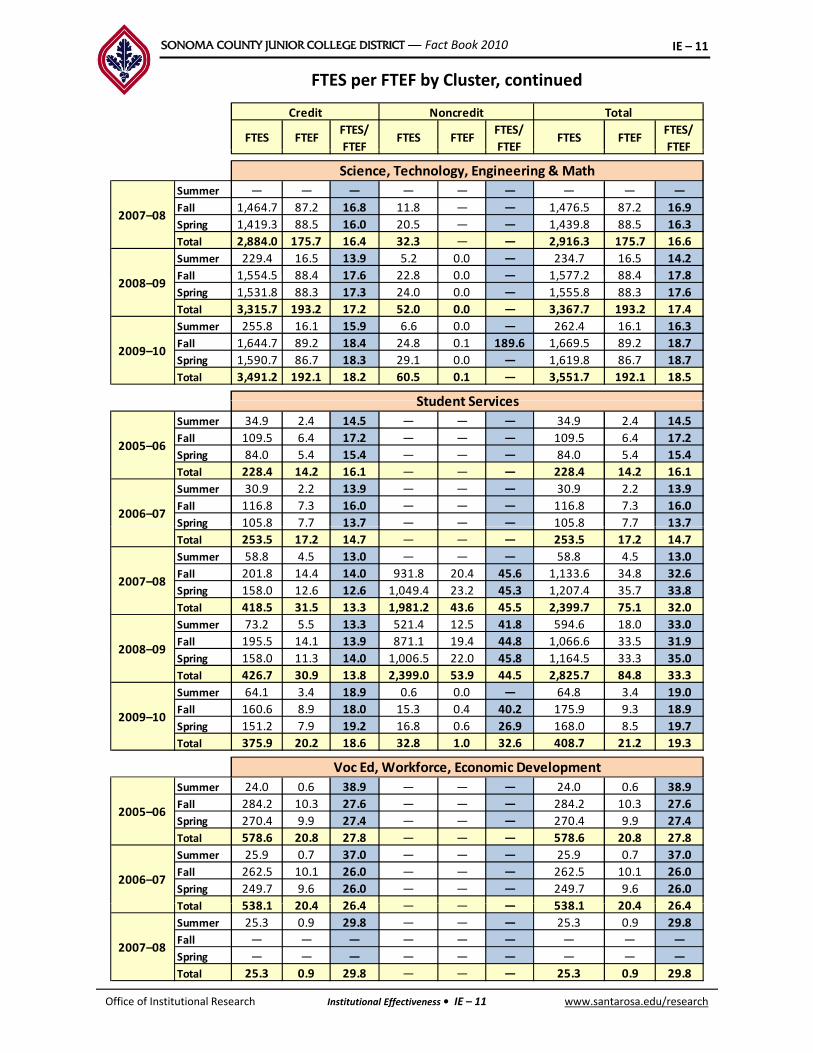
SONOMA COUNTY JUNIOR COLLEGE DISTRICT — Fact Book 2010 IE – 11
FTES per FTEF by Cluster, continued
FTES/
FTEF
FTES/
FTEF
FTES/
FTEF
Credit Noncredit
FTES FTEFFTES FTEF FTES FTEF
Total
Summer — — — — — — — — —
Fall 1,464.7 87.2 16.8 11.8 — — 1,476.5 87.2 16.9
Spring 1,419.3 88.5 16.0 20.5 — — 1,439.8 88.5 16.3
Total 2,884.0 175.7 16.4 32.3 — — 2,916.3 175.7 16.6
Summer 229.4 16.5 13.9 5.2 0.0 — 234.7 16.5 14.2
Fall 1 554 5 88 4 17 6 22 8 0 0 1 577 2 88 4 17 8
2007–08
FTEF FTEF FTEF
Science, Technology, Engineering & Math
Fall 1,554.5 88.4 17.6 22.8 0.0 — 1,577.2 88.4 17.8
Spring 1,531.8 88.3 17.3 24.0 0.0 — 1,555.8 88.3 17.6
Total 3,315.7 193.2 17.2 52.0 0.0 — 3,367.7 193.2 17.4
Summer 255.8 16.1 15.9 6.6 0.0 — 262.4 16.1 16.3
Fall 1,644.7 89.2 18.4 24.8 0.1 189.6 1,669.5 89.2 18.7
Spring 1,590.7 86.7 18.3 29.1 0.0 — 1,619.8 86.7 18.7
Total 3,491.2 192.1 18.2 60.5 0.1 — 3,551.7 192.1 18.5
2009–10
2008–09
Student Services
Summer 34.9 2.4 14.5 — — — 34.9 2.4 14.5
Fall 109.5 6.4 17.2 — — — 109.5 6.4 17.2
Spring 84.0 5.4 15.4 — — — 84.0 5.4 15.4
Total 228.4 14.2 16.1 — — — 228.4 14.2 16.1
Summer 30.9 2.2 13.9 — — — 30.9 2.2 13.9
Fall 116.8 7.3 16.0 — — — 116.8 7.3 16.0
Spring 105.8 7.7 13.7 — — — 105.8 7.7 13.7
2005–06
2006–07
Student Services
Spring 105.8 7.7 13.7 105.8 7.7 13.7
Total 253.5 17.2 14.7 — — — 253.5 17.2 14.7
Summer 58.8 4.5 13.0 — — — 58.8 4.5 13.0
Fall 201.8 14.4 14.0 931.8 20.4 45.6 1,133.6 34.8 32.6
Spring 158.0 12.6 12.6 1,049.4 23.2 45.3 1,207.4 35.7 33.8
Total 418.5 31.5 13.3 1,981.2 43.6 45.5 2,399.7 75.1 32.0
Summer 73.2 5.5 13.3 521.4 12.5 41.8 594.6 18.0 33.0
Fall 195.5 14.1 13.9 871.1 19.4 44.8 1,066.6 33.5 31.92008–09
2007–08
Spring 158.0 11.3 14.0 1,006.5 22.0 45.8 1,164.5 33.3 35.0
Total 426.7 30.9 13.8 2,399.0 53.9 44.5 2,825.7 84.8 33.3
Summer 64.1 3.4 18.9 0.6 0.0 — 64.8 3.4 19.0
Fall 160.6 8.9 18.0 15.3 0.4 40.2 175.9 9.3 18.9
Spring 151.2 7.9 19.2 16.8 0.6 26.9 168.0 8.5 19.7
Total 375.9 20.2 18.6 32.8 1.0 32.6 408.7 21.2 19.3
2009–10
2008 09
Voc Ed, Workforce, Economic Development
Summer 24.0 0.6 38.9 — — — 24.0 0.6 38.9
Fall 284.2 10.3 27.6 — — — 284.2 10.3 27.6
Spring 270.4 9.9 27.4 — — — 270.4 9.9 27.4
Total 578.6 20.8 27.8 — — — 578.6 20.8 27.8
Summer 25.9 0.7 37.0 — — — 25.9 0.7 37.0
Fall 262.5 10.1 26.0 — — — 262.5 10.1 26.0
Spring 249.7 9.6 26.0 — — — 249.7 9.6 26.0
T t l 538 1 20 4 26 4 538 1 20 4 26 4
2005–06
2006–07
www.santarosa.edu/researchOffice of Institutional Research Institutional Effectiveness • IE – 11
Total 538.1 20.4 26.4 — — — 538.1 20.4 26.4
Summer 25.3 0.9 29.8 — — — 25.3 0.9 29.8
Fall — — — — — — — — —
Spring — — — — — — — — —
Total 25.3 0.9 29.8 — — — 25.3 0.9 29.8
2007–08

SONOMA COUNTY JUNIOR COLLEGE DISTRICT — Fact Book 2010 IE – 12
FTES per FTEF by Cluster
Definition of Measure: Full‐Time Equivalent Student (FTES) is the equivalent of 30 credit units enrolled or 525 student contact hours in credit or noncredit courses per student per year. Full‐Time Equivalent Faculty (FTEF) is based on the percentage of instructional hours per week considered a full‐time assignment for regular instructional employees.
Note: Beginning in Fall 2007, SRJC Datamining used the new Cluster structure. The line chart only contains the updated Clusters but the tables include the old and new Clusters for comparison purposes. Refer to Introduction section for Disciplines by Clusters listing in prior p p p p y g pFact Books online.
Source: Internal SRJC data (SRJC Datamine)
Use(s) of Measure: This measure is used as an indicator of institutional efficiency for fiscal responsibility.
Analysis: The majority of the Clusters’ FTES/FTEF ratios have increased in 2009–10, most of them reaching their highest efficiency rate Continuing Education & Strategic Programthem reaching their highest efficiency rate. Continuing Education & Strategic Program Development, all noncredit courses, had the highest ratios of students to faculty in 2009–10. Public Safety, PE, Dance and Athletics and Occupational Ed and Economic Development are other higher ratio clusters compared to the District overall average.
For more information:
SRJC Datamining: www.santarosa.edu/datamine (Outlook password required.)
www.santarosa.edu/researchOffice of Institutional Research Institutional Effectiveness • IE – 12

SONOMA COUNTY JUNIOR COLLEGE DISTRICT — Fact Book 2010 IE – 13
16,000
FTES by Course Status2000–01 to 2009–10
8,000
10,000
12,000
14,000
Transfer
0
2,000
4,000
6,000
Vocational Ed
Basic Skills
Su F Sp Su F Sp Su F Sp Su F Sp
# 1,103.28 5,668.79 5,513.10 65.09 481.32 379.69 381.00 2,415.43 2,474.16 1,549.37 8,565.54 8,366.95
% 71.2% 66.2% 65.9% 4.2% 5.6% 4.5% 24.6% 28.2% 29.6% 100% 100% 100%
# 0.00 0.00 0.00 412.67 705.45 859.39 12.62 2.61 1.62 425.29 708.06 861.01
% 0.0% 0.0% 0.0% 97.0% 99.6% 99.8% 3.0% 0.4% 0.2% 100% 100% 100%
# 1 138 50 5 630 66 5 650 74 58 00 484 25 401 23 327 71 2 214 53 2 445 80 1 524 21 8 329 44 8 497 77
Transfer Status
2000–01
Cr
NC
TotalBasic Skills Status Vocational Education
2000‐01 2001‐02 2002‐03 2003‐04 2004‐05 2005‐06 2006‐07 2007‐08 2008‐09 2009‐10
# 1,138.50 5,630.66 5,650.74 58.00 484.25 401.23 327.71 2,214.53 2,445.80 1,524.21 8,329.44 8,497.77
% 74.7% 67.6% 66.5% 3.8% 5.8% 4.7% 21.5% 26.6% 28.8% 100% 100% 100%
# 0.00 0.00 0.00 401.28 773.53 923.05 19.97 7.64 5.71 421.25 781.17 928.76
% 0.0% 0.0% 0.0% 95.3% 99.0% 99.4% 4.7% 1.0% 0.6% 100% 100% 100%
# 1,164.60 5,827.27 5,780.97 64.38 514.65 443.64 329.73 2,189.75 2,367.02 1,558.71 8,531.67 8,591.63
% 74.7% 68.3% 67.3% 4.1% 6.0% 5.2% 21.2% 25.7% 27.6% 100% 100% 100%
# 0.00 0.00 0.00 429.58 855.87 956.84 15.45 3.08 1.96 445.03 858.95 958.80
% 0.0% 0.0% 0.0% 96.5% 99.6% 99.8% 3.5% 0.4% 0.2% 100% 100% 100%
# 1,107.90 5,907.05 5,650.77 65.08 473.66 429.90 278.89 2,183.96 2,232.95 1,451.87 8,564.67 8,313.62
% 76.3% 69.0% 68.0% 4.5% 5.5% 5.2% 19.2% 25.5% 26.9% 100% 100% 100%
# 0 00 0 00 0 00 449 47 824 10 923 67 14 57 5 65 4 66 464 04 829 75 928 33
2002–03
2003–04
2001–02
Cr
NC
Cr
NC
Cr
# 0.00 0.00 0.00 449.47 824.10 923.67 14.57 5.65 4.66 464.04 829.75 928.33
% 0.0% 0.0% 0.0% 96.9% 99.3% 99.5% 3.1% 0.7% 0.5% 100% 100% 100%
# 973.29 5,737.55 5,730.22 62.03 474.27 412.66 336.53 2,094.18 2,391.10 1,371.85 8,306.00 8,533.98
% 70.9% 69.1% 67.1% 4.5% 5.7% 4.8% 24.5% 25.2% 28.0% 100% 100% 100%
# 0.00 0.00 0.00 430.83 866.48 898.94 2.32 5.83 4.02 433.15 872.31 902.96
% 0.0% 0.0% 0.0% 99.5% 99.3% 99.6% 0.5% 0.7% 0.4% 100% 100% 100%
# 1,095.55 6,304.64 6,130.77 65.20 441.31 413.95 436.39 2,334.22 2,507.51 1,597.14 9,080.17 9,052.23
% 68.6% 69.4% 67.7% 4.1% 4.9% 4.6% 27.3% 25.7% 27.7% 100% 100% 100%
# 0.00 0.00 0.00 427.35 789.89 977.11 2.74 2.95 4.86 430.09 792.84 981.97
% 0.0% 0.0% 0.0% 99.4% 99.6% 99.5% 0.6% 0.4% 0.5% 100% 100% 100%
2004–05
2005–06
Cr
NC
Cr
NC
NC
# 1,187.90 6,479.10 6,112.90 69.17 477.82 422.35 509.78 2,514.66 2,508.78 1,766.85 9,471.58 9,044.03
% 67.2% 68.4% 67.6% 3.9% 5.0% 4.7% 28.9% 26.5% 27.7% 100% 100% 100%
# 0.00 0.00 0.00 458.47 330.30 363.66 1.94 4.94 2.98 460.41 335.24 366.64
% 0.0% 0.0% 0.0% 99.6% 98.5% 99.2% 0.4% 1.5% 0.8% 100% 100% 100%
# 1,179.43 6,501.50 6,464.13 83.41 470.80 400.36 540.83 2,534.74 2,639.25 1,803.67 9,507.04 9,503.74
% 65.4% 68.4% 68.0% 4.6% 5.0% 4.2% 30.0% 26.7% 27.8% 100% 100% 100%
# 0.00 0.00 0.00 440.44 832.23 913.23 2.66 4.16 2.66 443.10 836.39 915.89
% 0.0% 0.0% 0.0% 99.4% 99.5% 99.7% 0.6% 0.5% 0.3% 100% 100% 100%
# 1,319.45 7,029.74 6,496.63 92.72 463.06 412.87 615.89 2,748.62 2,626.72 2,028.06 10,241.42 9,536.22
% 65 1% 68 6% 68 1% 4 6% 4 5% 4 3% 30 4% 26 8% 27 5% 100% 100% 100%
2006–07
2007–08
Cr
Cr
NC
Cr
NC
www.santarosa.edu/researchOffice of Institutional Research Institutional Effectiveness • IE – 13
% 65.1% 68.6% 68.1% 4.6% 4.5% 4.3% 30.4% 26.8% 27.5% 100% 100% 100%
# 0.00 0.00 0.00 433.48 1,118.86 1,309.95 3.34 9.70 2.63 436.82 1,128.56 1,312.58
% 0.0% 0.0% 0.0% 99.2% 99.1% 99.8% 0.8% 0.9% 0.2% 100% 100% 100%
# 1,326.74 6,610.27 6,969.92 74.60 635.01 544.72 508.03 2,484.25 2,693.38 1,909.37 9,729.53 10,208.02
% 69.5% 67.9% 68.3% 3.9% 6.5% 5.3% 26.6% 25.5% 26.4% 100% 100% 100%
# 0.00 0.00 0.00 440.21 858.08 1,011.09 0.38 3.60 4.54 440.59 861.68 1,015.63
% 0.0% 0.0% 0.0% 99.9% 99.6% 99.6% 0.1% 0.4% 0.4% 100% 100% 100%
2009–10
Cr
NC
2008–09
NC

SONOMA COUNTY JUNIOR COLLEGE DISTRICT — Fact Book 2010 IE – 14
Credit FTES Proportion by Course Status2000–01 to 2009–10
50.0%
60.0%
70.0%
80.0%
90.0%
2000 01 to 2009 10
Transfer Status Su
Transfer Status F
Transfer Status Sp
Basic Skills Status Su
0.0%
10.0%
20.0%
30.0%
40.0% Basic Skills Status F
Basic Skills Status Sp
Vocational Education Su
Vocational Education F
Vocational Education Sp
FTES by Course Status
99–00 00–01 01–02 02–03 03–04 04–05 05–06 06–07 07–08 08–09 09‐10
Definition of Measure: Full‐Time Equivalent Student (FTES) is the equivalent of 30 credit units enrolled or 525 student contact hours in credit or noncredit courses per student per year. FTES is calculated by summing “Total Hours” in all enrollment records report to the Chancellor’s Office MIS during requested time period, then dividing by 525 for each MIS code. If “Total hours” cannot be derived because data is missing or set to “Unknown/Unreported” the enrollments are not included. Only enrollments for classes that are eligible for state apportionment purposes are included. This methodology is not the same as the methodology used in calculating the 320 report.
Source: California Community Colleges Chancellor’s Office Datamart
Use(s) of Measure: This measure can be used for institutional and program planning purposes.
Analysis: Courses coded with a MIS code of “Transfer Status” have the largest proportion of FTES at SRJC. Approximately two‐thirds of FTES in the Summer, Fall, and Spring semesters are “Transfer Status”. Vocational Education status had less than 30% of FTES in 2009–10. The proportion of credit FTES in Vocational Education peaked in 2008–09 with highest proportion in Summer 2008 at 30 4%FTES in Vocational Education peaked in 2008 09, with highest proportion in Summer 2008 at 30.4%. Basic Skills Status credit FTES grew to 6.5% in Fall 2009 – its largest proportion in the past ten years. Noncredit Basic Skills FTES is the majority of noncredit FTES at approximately 99% of the Basic Skills, Vocational and Transfer course status.
For more information:
California Community Colleges Chancellor’s Office Datamart: www.santarosa.edu/datamine
www.santarosa.edu/researchOffice of Institutional Research Institutional Effectiveness • IE – 14
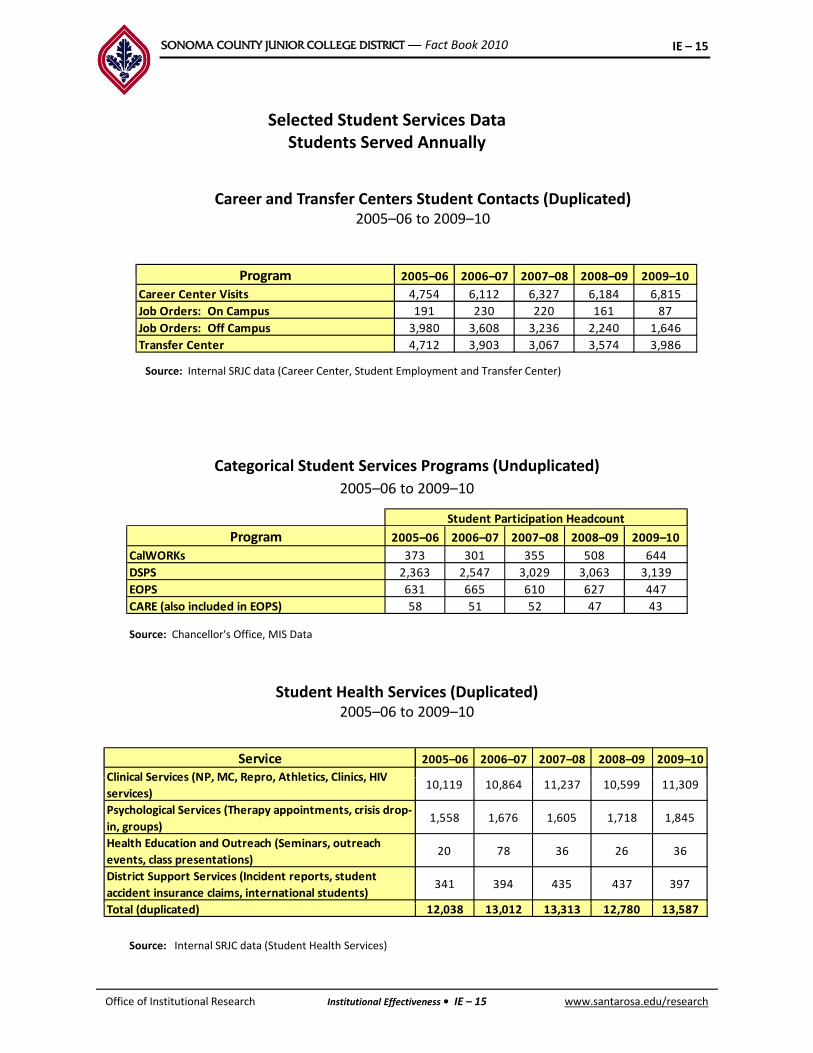
SONOMA COUNTY JUNIOR COLLEGE DISTRICT — Fact Book 2010 IE – 15
Selected Student Services DataStudents Served Annually
Career and Transfer Centers Student Contacts (Duplicated) 2005–06 to 2009–10
y
Program 2005 06 2006 07 2007 08 2008 09 2009 10
Source: Internal SRJC data (Career Center, Student Employment and Transfer Center)
Program 2005–06 2006–07 2007–08 2008–09 2009–10
Career Center Visits 4,754 6,112 6,327 6,184 6,815
Job Orders: On Campus 191 230 220 161 87
Job Orders: Off Campus 3,980 3,608 3,236 2,240 1,646
Transfer Center 4,712 3,903 3,067 3,574 3,986
Categorical Student Services Programs (Unduplicated)
2005–06 to 2009–10
Student Participation Headcount
Source: Chancellor's Office, MIS Data
Program 2005–06 2006–07 2007–08 2008–09 2009–10
CalWORKs 373 301 355 508 644
DSPS 2,363 2,547 3,029 3,063 3,139
EOPS 631 665 610 627 447
CARE (also included in EOPS) 58 51 52 47 43
Student Health Services (Duplicated)2005–06 to 2009–10
2005–06 2006–07 2007–08 2008–09 2009–10ServiceClinical Services (NP MC Repro Athletics Clinics HIV
341 394 435
26
Psychological Services (Therapy appointments, crisis drop‐
in, groups)
Health Education and Outreach (Seminars, outreach
events, class presentations)
District Support Services (Incident reports, student
accident insurance claims, international students)397
1,845
36
10,864 11,237 11,30910,599
437
Clinical Services (NP, MC, Repro, Athletics, Clinics, HIV
services)
1,676 1,605
20 78 36
1,718
10,119
1,558
www.santarosa.edu/researchOffice of Institutional Research Institutional Effectiveness • IE – 15
Source: Internal SRJC data (Student Health Services)
12,038 13,012 13,313 12,780 13,587Total (duplicated)
SONOMA COUNTY JUNIOR COLLEGE DISTRICT — Fact Book 2010 IE – 16
Selected Student Services Data
Definition of Measure: Summaries of total students served in selected areas of Student Services.
Source: Internal SRJC Data (Career, Counseling, and Student Health Service – internal count by department); Categorical Student Services (California Community Colleges Chancellor’s Office)
Use(s) of Measure: This measure is an indicator of usage of Student Services.
Analysis: A large number of students make use of Student Services on campus. Student visits to the Transfer Center increased and in 2009–10 Student Health Services served the highest number of students in the past five years at 13,587.
Disabled Student Programs and Services (DSPS) at SRJC, called Disability Resource Department (DRD), and California Work Opportunities and Responsibility to Kids (CalWORKs) continue to grow. Over the past five years, DSPS increased 33%. CalWORKs grew to over 600 participants in 2009–10. Extended Opportunities and Services (EOPS) served almost 450 students.
For more information:For more information:
Chancellor’s Office Data Mart: http://www.cccco.edu/SystemOffice/Divisions/TechResearchInfo/MIS/DataMartandReports/tabid/282/Default.aspx
www.santarosa.edu/researchOffice of Institutional Research Institutional Effectiveness • IE – 16
SONOMA COUNTY JUNIOR COLLEGE DISTRICT — Fact Book 2010 IE – 17
Selected Student Services Data
M t i l ti D tMatriculation Data
Definition of Measure: Summaries of total students served in selected areas of Matriculation in Student Services.
Accessibility: SRJC has converted to a new Student Information System (SIS). Many Information Technology (IT) reports used in past Fact Books are now being updated and combined to minimize duplication and increase efficiency. While this conversion is in process, Fact Book users are being directed to the California Community College Chancellor’s Office Data Mart website to gain access to the District’s MIS* data. This measure can be accessed in previous Fact Books at: www.santarosa.edu/research.
Matriculation Statistics (Orientation, Assessment, Counseling and Follow‐Up)
At the time of publication, SRJC 2008–09 Matriculation data was unavailable at the Chancellor’s Office website. Below are the instructions to access the data when it becomes available.
California Community Colleges Chancellor’s Office Data Mart Student Matriculation file: https://misweb.cccco.edu/mis/onlinestat/matric.cfm
To get SRJC data:Select “Santa Rosa” under College;Select Year and Term (only one year and term can be selected);Select Matriculation ServiceSelect Demographic, if neededClick “Get Report” button
To get Statewide data:Select “Statewide” under College;Select Year and Term needed (only one year/term can be selected);Select Matriculation ServiceSelect Demographics, if neededClick “Get Report” button
To download data, click on the “Download” hyperlink on the results page.
*Li it ti t MIS d t*Limitations to MIS dataData does not include credit students enrolled in full term courses earning less than .50 units and credit and noncredit students enrolled in short term courses with 8 or less hours of attendance.
www.santarosa.edu/researchOffice of Institutional Research Institutional Effectiveness • IE – 17

SONOMA COUNTY JUNIOR COLLEGE DISTRICT — Fact Book 2010 IE – 18
Average Class Size by Location: Short‐Term and Full‐Semester Credit Courses
Petaluma Campus
Other Locations (Online)
Shone Farm
Average Credit Class Size by Location ‐ Fall 2009
Full Semester
Short Term
Sebastopol / West County
Santa Rosa Off Campus
Santa Rosa
Public Safety Training Center
Point Arena / North Coast
Average Credit Class Size by SemesterSummer 2005—Spring 2010
0.0 5.0 10.0 15.0 20.0 25.0 30.0 35.0 40.0
District Average
Sonoma
15.0
20.0
25.0
30.0
Summer 2005 —Spring 2010
Summer
0.0
5.0
10.0
2005–06 2006–07 2007–08 2008–09 2009–10
Fall
Spring
District Average Class Size by Semester— Summer 2005 to Spring 2010
Su F Sp Su F Sp Su F Sp Su F Sp Su F Sp
Day — 23.7 23.9 — 24.3 22.5 — 21.5 20.5 — 24.4 25.7 — 26.4 26.2
Eve — 23.8 23.2 — 22.8 22.8 — 21.1 20.5 — 23.9 24.7 — 23.3 26.5
ll
Full
Semester
2005–06 2006–07 2007–08 2008–09 2009–10
www.santarosa.edu/researchOffice of Institutional Research Institutional Effectiveness • IE – 18
All — 23.7 23.7 — 23.9 22.7 — 21.4 20.5 — 24.3 25.4 — 25.5 26.3
Day 18.9 20.4 21.0 18.3 20.1 20.6 17.9 18.6 18.3 20.1 21.0 21.2 22.7 21.8 21.6
Eve 21.8 21.2 22.9 21.5 19.5 21.8 18.7 19.6 21.3 20.2 21.8 21.3 21.2 22.5 24.6
All 19.8 20.8 21.9 19.3 19.8 21.1 18.1 19.1 19.7 20.1 21.4 21.3 22.3 22.1 22.7
19.8 23.0 23.2 19.3 22.9 22.3 18.1 20.8 20.3 20.1 23.5 24.4 22.3 24.8 25.5
Short Term
Average

SONOMA COUNTY JUNIOR COLLEGE DISTRICT — Fact Book 2010 IE – 19
Average Class Size by Location
Su F Sp Su F Sp Su F Sp Su F Sp Su F Sp
Day — 23.7 24.3 — 24.7 22.7 — 21.5 20.6 — 23.9 25.6 — 25.8 25.2
Eve — 24.4 23.4 — 23.1 23.1 — 21.9 20.7 — 24.5 25.4 — 22.7 26.5
All — 23.8 24.0 — 24.3 22.8 — 21.6 20.6 — 24.1 25.5 — 25.0 25.5
Full
Semester
2005–06 2006–07 2007–08
Santa Rosa
2008–09 2009–10
Day 18.4 20.7 21.1 18.1 20.4 20.3 17.8 18.2 18.3 20.0 21.1 20.5 20.8 21.9 22.1
Eve 21.6 21.1 22.5 21.6 20.0 21.5 18.7 20.4 22.3 20.4 22.7 21.9 19.7 22.0 23.5
All 19.4 20.9 21.8 19.2 20.2 20.9 18.1 19.3 20.1 20.1 22.0 21.2 20.5 21.9 22.7
19.3 23.2 23.5 19.2 23.4 22.4 18.1 21.1 20.5 20.1 23.7 24.7 20.5 24.5 25.0
Day — 24.8 22.5 — 23.5 23.0 — 22.6 21.6 — 26.5 26.0 — 28.8 30.6
Average
Full
Short Term
Petaluma Campus
Eve — 25.3 25.2 — 24.4 24.3 — 21.9 22.2 — 25.4 25.5 — 27.4 30.2
All — 25.0 23.5 — 23.8 23.5 — 22.4 21.8 — 26.1 25.8 — 28.3 30.4
Day 23.0 20.5 20.2 20.6 19.3 20.2 19.1 20.1 19.8 24.2 16.8 21.7 28.6 20.3 23.0
Eve 23.6 22.7 26.3 21.5 19.2 23.5 21.9 17.5 21.0 21.3 24.3 21.0 27.4 23 25.1
All 23.1 21.3 22.1 20.9 19.3 21.2 20.0 19.4 20.1 23.3 21.1 21.4 28.2 21.6 23.7
23.1 24.1 23.2 20.9 22.8 23.0 20.0 21.7 21.5 23.3 25.5 25.1 28.2 27.6 29.6
Public Safety Training Center
Full
Semester
Short Term
Average
Day — 26.4 31.8 — 28.8 28.3 — 32.0 27.7 — 20.6 35.2 — 21.4 38.3
Eve — 29.2 29.8 — 27.1 28.9 — 25.8 30.7 — 29.7 31.0 — 32.9 33.1
All — 28.0 30.3 — 27.6 28.6 — 30.0 29.6 — 26.4 32.7 — 27.5 35.2
Day 19.5 21.7 23.0 21.3 22.1 25.1 26.1 21.5 17.1 19.0 21.6 21.1 21.9 21.5 19.4
Eve 24.5 24.7 24.7 24.5 18.4 23.2 20.8 20.5 19.5 20.7 19.1 29.3 23.1 18.8 23.4
All 21.8 22.8 23.7 22.5 20.7 24.4 23.9 21.2 18.2 19.6 20.4 29.3 22.4 20.4 20.9
21.8 24.2 24.9 22.5 22.5 25.4 23.9 23.2 20.3 19.6 22.9 25.9 22.4 23.1 25.0
Public Safety Training Center
Average
Short Term
Full
Semester
Day — — — — — — — — 15.0 — — — — — —
Eve — — — — — — — — — — — — — 0.7 0.3
All — — — — — — — — 15.0 — — — — 0.7 0.3
Day 14.1 15.2 18.7 12.5 17.7 17.2 11.2 16.2 17.6 11.4 17.2 16.7 6.8 18.4 18.2
Eve 26.8 20.5 23.6 25.0 18.5 22.5 16.4 18.5 18.8 20.7 20.2 18.3 14.8 22.7 23.8
ll 8 3 20 6 9 8 9 3 3 8 2 3 8 3 2 3 20 2 20 0
g
Short Term
Full
Semester
Brickyard Center
All 18.3 17.1 20.6 17.9 18.1 19.5 13.7 17.3 18.2 17.3 18.5 17.3 12.3 20.2 20.0
18.3 17.1 20.6 17.9 18.1 19.5 13.7 17.3 18.1 17.3 20.1 17.8 12.3 18.9 18.3
Day — — — — — — — — — — — — — — —
Eve — 12.1 17.2 — 10.6 18.4 — 11.4 13.3 — 15.2 25.0 — — —
All — 12.1 17.2 — 10.6 18.4 — 11.4 13.3 — 15.2 25.0 — — —
D 20 0
Average
Full
Semester
Healdsburg/North County
www.santarosa.edu/researchOffice of Institutional Research Institutional Effectiveness • IE – 19
Day 20.0 — — — — — — — — — — — — — —
Eve — — 9.0 8.0 11.5 19.0 11.5 9.5 8.0 11.8 — — — — —
All 20.0 — 9.0 8.0 11.5 19.0 11.5 11.5 19.0 11.8 — — — — —
20.0 12.1 16.3 8.0 10.7 18.5 11.5 11.2 12.1 11.8 15.2 25.0 — — —
Short Term
Average
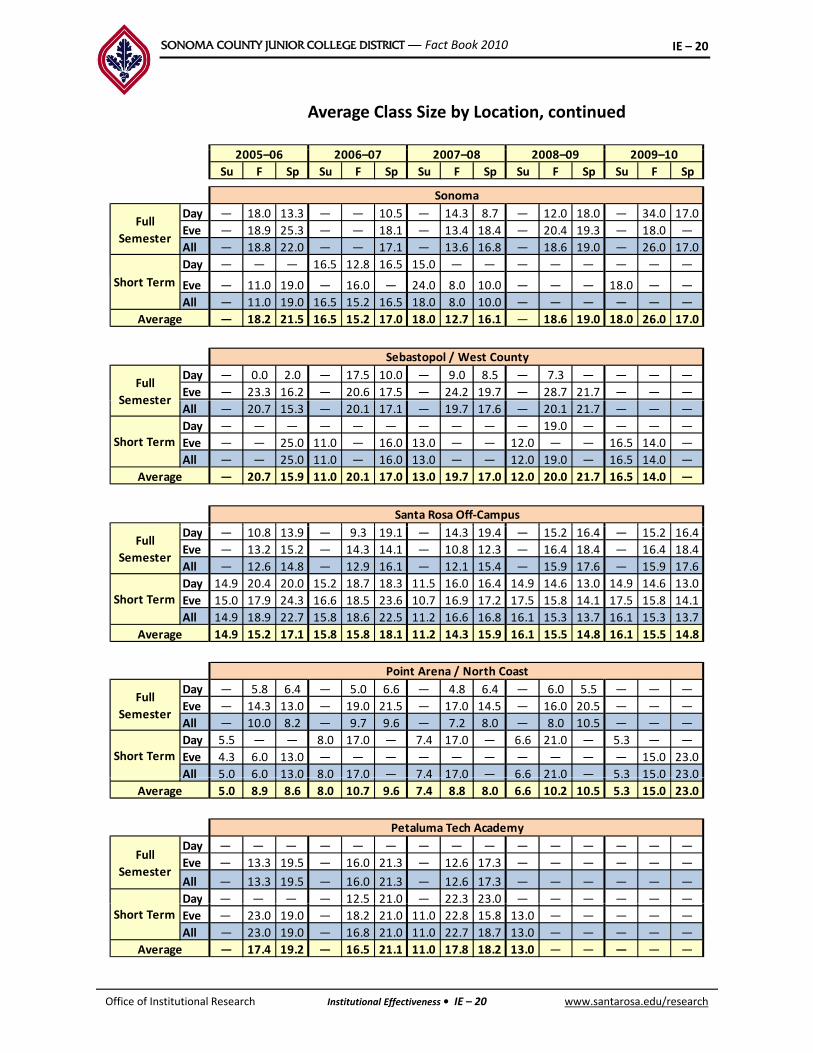
SONOMA COUNTY JUNIOR COLLEGE DISTRICT — Fact Book 2010 IE – 20
Average Class Size by Location, continued
Su F Sp Su F Sp Su F Sp Su F Sp Su F Sp
Day — 18.0 13.3 — — 10.5 — 14.3 8.7 — 12.0 18.0 — 34.0 17.0
Eve — 18.9 25.3 — — 18.1 — 13.4 18.4 — 20.4 19.3 — 18.0 —
All — 18.8 22.0 — — 17.1 — 13.6 16.8 — 18.6 19.0 — 26.0 17.0
Day — — — 16.5 12.8 16.5 15.0 — — — — — — — —
2005–06 2006–07 2007–08
Sonoma
2008–09 2009–10
Full
Semester
Eve — 11.0 19.0 — 16.0 — 24.0 8.0 10.0 — — — 18.0 — —
All — 11.0 19.0 16.5 15.2 16.5 18.0 8.0 10.0 — — — — — —
— 18.2 21.5 16.5 15.2 17.0 18.0 12.7 16.1 — 18.6 19.0 18.0 26.0 17.0
Day — 0.0 2.0 — 17.5 10.0 — 9.0 8.5 — 7.3 — — — —
Eve — 23.3 16.2 — 20.6 17.5 — 24.2 19.7 — 28.7 21.7 — — —Full
Semester
Sebastopol / West County
Average
Short Term
All — 20.7 15.3 — 20.1 17.1 — 19.7 17.6 — 20.1 21.7 — — —
Day — — — — — — — — — — 19.0 — — — —
Eve — — 25.0 11.0 — 16.0 13.0 — — 12.0 — — 16.5 14.0 —
All — — 25.0 11.0 — 16.0 13.0 — — 12.0 19.0 — 16.5 14.0 —
— 20.7 15.9 11.0 20.1 17.0 13.0 19.7 17.0 12.0 20.0 21.7 16.5 14.0 —
Semester
Average
Santa Rosa Off‐Campus
Short Term
Day — 10.8 13.9 — 9.3 19.1 — 14.3 19.4 — 15.2 16.4 — 15.2 16.4
Eve — 13.2 15.2 — 14.3 14.1 — 10.8 12.3 — 16.4 18.4 — 16.4 18.4
All — 12.6 14.8 — 12.9 16.1 — 12.1 15.4 — 15.9 17.6 — 15.9 17.6
Day 14.9 20.4 20.0 15.2 18.7 18.3 11.5 16.0 16.4 14.9 14.6 13.0 14.9 14.6 13.0
Eve 15.0 17.9 24.3 16.6 18.5 23.6 10.7 16.9 17.2 17.5 15.8 14.1 17.5 15.8 14.1
All 14.9 18.9 22.7 15.8 18.6 22.5 11.2 16.6 16.8 16.1 15.3 13.7 16.1 15.3 13.7
14.9 15.2 17.1 15.8 15.8 18.1 11.2 14.3 15.9 16.1 15.5 14.8 16.1 15.5 14.8Average
Full
Semester
Short Term
Day — 5.8 6.4 — 5.0 6.6 — 4.8 6.4 — 6.0 5.5 — — —
Eve — 14.3 13.0 — 19.0 21.5 — 17.0 14.5 — 16.0 20.5 — — —
All — 10.0 8.2 — 9.7 9.6 — 7.2 8.0 — 8.0 10.5 — — —
Day 5.5 — — 8.0 17.0 — 7.4 17.0 — 6.6 21.0 — 5.3 — —
Eve 4.3 6.0 13.0 — — — — — — — — — — 15.0 23.0
All 5.0 6.0 13.0 8.0 17.0 — 7.4 17.0 — 6.6 21.0 — 5.3 15.0 23.0
Point Arena / North Coast
Short Term
Full
Semester
All 5.0 6.0 13.0 8.0 17.0 7.4 17.0 6.6 21.0 5.3 15.0 23.0
5.0 8.9 8.6 8.0 10.7 9.6 7.4 8.8 8.0 6.6 10.2 10.5 5.3 15.0 23.0
Day — — — — — — — — — — — — — — —
Eve — 13.3 19.5 — 16.0 21.3 — 12.6 17.3 — — — — — —
All — 13.3 19.5 — 16.0 21.3 — 12.6 17.3 — — — — — —
Day — — — — 12.5 21.0 — 22.3 23.0 — — — — — —
Full
Semester
Petaluma Tech Academy
Average
www.santarosa.edu/researchOffice of Institutional Research Institutional Effectiveness • IE – 20
y
Eve — 23.0 19.0 — 18.2 21.0 11.0 22.8 15.8 13.0 — — — — —
All — 23.0 19.0 — 16.8 21.0 11.0 22.7 18.7 13.0 — — — — —
— 17.4 19.2 — 16.5 21.1 11.0 17.8 18.2 13.0 — — — — —
Short Term
Average

SONOMA COUNTY JUNIOR COLLEGE DISTRICT — Fact Book 2010 IE – 21
Average Class Size by Location, continued
2008–09 2009–102005–06 2006–07 2007–08
Su F Sp Su F Sp Su F Sp Su F Sp Su F Sp
Day — — — — — — 16.0 — — — — — —
Eve — 21.5 20.7 — 28.0 23.7 — 21.7 23.3 — 17.0 17.0 — 34.0 9.0
All — 21.5 20.7 — 28.0 23.7 — 21.7 21.8 — 17.0 17.0 — 34.0 9.0
Day — 30.0 29.0 — 24.5 27.0 — 36.0 19.0 — 14.0 — — — 30.0
Eve 30.0 3.0 — — 25.8 18.7 — 24.2 21.0 — 27.0 25.7 15.5 27.0 27.0
Windsor
Full
Semester
Short Term
All 30.0 16.5 29.0 — 25.5 20.8 — 26.2 20.5 — 24.8 25.7 15.5 27.0 27.5
30.0 19.0 22.8 — 26.0 22.0 — 24.7 21.2 — 22.9 23.5 15.5 28.2 24.9
Day — — — — 13.0 10.4 — 6.3 2.8 — 17.3 — — — —
Eve — — — — — 24.0 — 7.5 10.4 — 26.0 15.8 — — 35.0
All — — — — 13.0 13.4 — 6.8 10.4 — 19.5 15.8 — — 35.0
Rohnert Park
Full
Semester
Average
Day — — — — — — — — — — 19.0 21.3 — — —
Eve 24.0 — 36.0 29.0 15.0 20.0 9.5 8.9 20.5 21.0 19.1 33.8 17.0 29.5 —
All 24.0 — 36.0 29.0 15.0 20.0 9.5 8.9 20.5 21.0 19.1 28.4 17.0 29.5 35.0
24.0 — 36.0 29.0 14.3 15.5 9.5 8.3 9.1 21.0 19.3 23.8 17.0 29.5 35.0
Day — — — — — — — — — — 30.0 19.5 — 31.3 31.8
Eve 31 0 17 0 38 5 27 0
Shone Farm
Full
Short Term
Average
Eve — — — — — — — — — — 31.0 17.0 — 38.5 27.0
All — — — — — — — — — — 30.4 19.1 — 34.2 31.0
Day — — — — — — — — — 13.0 12.3 17.7 18.0 9.3 17.2
Eve — — — — — — — — — 19.0 26.8 24.9 25.0 19.4 25.8
All — — — — — — — — — 17.0 18.9 21.0 19.4 12.9 20.4
— — — — — — — — — 17.0 21.0 20.5 19.4 18.5 23.3
Other Locations (includes Online Courses)
Semester
Short Term
Average
Day — — — — — — — — — — 29.3 29.7 — 30.5 31.3
Eve — — — — — — — — — — 13.8 19.9 — 18.9 30.3
All — — — — — — — — — — 26.4 26.5 — 27.1 30.9
Day — — — — — — — — — — 24.5 25.3 29.5 25.0 25.5
Eve — — — — — — — — — — 19.8 26.5 30.3 27.9 33.3
All — — — — — — — — — — 23.8 25.4 29.6 25.3 28.8
— — — — — — — — — — 25.0 25.9 29.6 26.2 28.8
Full
Semester
Short Term
Average
Source: Internal SRJC data (SRJC Datamining)
www.santarosa.edu/researchOffice of Institutional Research Institutional Effectiveness • IE – 21

SONOMA COUNTY JUNIOR COLLEGE DISTRICT — Fact Book 2010 IE – 22
Average Class Size by Location: Short‐Term and Full‐Semester Credit Courses
Definition of Measure: Average Class Size for active (non‐cancelled) credit courses broken out by day and evening and by Summer, Fall, and Spring for full‐semester and short‐term credit courses as of first census.
Source: SRJC datamining
Use(s) of Measure: This measure is used for planning purposes as an indicator of fiscal responsibility, facilities planning, and class scheduling.
Analysis: Over the past five years, the average class size in the district has been at or above 20. Average class size grew in 2009‐10 to 24.8 students in the Fall and 25.5 in the Spring.
Average class size is generally higher in full semester courses than in short‐term courses at Santa Rosa and Petaluma campuses and the Public Safety Training Center. Beginning in 2007–08, full semester average class size have been higher at the Petaluma Campus. Largest average class size tends to be in the Fall and Spring semesters with the exception of the Public Safety Training Center and Petaluma Campus in Summer 2009. p
Average class sizes in full‐semester courses are quite close for both day and evening classes; with short‐term courses, average enrollment is usually higher in evening classes than in day classes.
For more information: http://www.santarosa.edu/datamine (Outlook password required).
www.santarosa.edu/researchOffice of Institutional Research Institutional Effectiveness • IE – 22

SONOMA COUNTY JUNIOR COLLEGE DISTRICT — Fact Book 2010 IE – 23
Active Sections by Location
Su F Sp Su F Sp Su F Sp Su F Sp Su F Sp
# 545 2,056 1,952 592 2,011 1,992 622 2,264 2,330 639 2,021 2,008 585 2,057 2,009
% 42.7% 58.0% 55.7% 43.8% 56.8% 56.4% 45.1% 59.8% 59.8% 46.1% 57.2% 57.8% 46.9% 63.1% 65.1%
# 242 988 1,048 258 1,036 1,038 278 1,032 1,068 270 1,040 976 220 877 761
% 19.0% 27.9% 29.9% 19.1% 29.2% 29.4% 20.1% 27.3% 27.4% 19.5% 29.4% 28.1% 17.6% 26.9% 24.7%
# 488 501 503 502 495 503 480 490 499 477 474 489 443 325 316
2008–092005–06 2006–07 2007–08
Day
Credit
Evening
Credit
Non
District
2009‐10
% 38.3% 14.1% 14.4% 37.1% 14.0% 14.2% 34.8% 12.9% 12.8% 34.4% 13.4% 14.1% 35.5% 10.0% 10.2%
# 1,275 3,545 3,503 1,352 3,542 3,533 1,380 3,786 3,897 1,386 3,535 3,473 1,248 3,259 3,086
% 100% 100% 100% 100% 100% 100% 100% 100% 100% 100% 100% 100% 100% 100% 100%
# 431 1,710 1,595 471 1,626 1,620 498 1,872 1,940 519 1,629 1,604 409 1,536 1,546
% 62.8% 69.3% 66.7% 63.6% 67.8% 67.6% 64.3% 70.4% 70.9% 66.3% 67.0% 67.8% 65.4% 68.9% 72.4%
# 189 709 752 198 727 725 199 721 735 186 745 701 157 645 540
% 27.6% 28.7% 31.4% 26.8% 30.3% 30.3% 25.7% 27.1% 26.9% 23.8% 30.6% 29.6% 25.1% 28.9% 25.3%
Credit
Total
Santa Rosa Campus
Evening
Credit
Day
Credit
# 66 48 45 71 47 50 77 65 61 78 59 62 59 48 49
% 9.6% 1.9% 1.9% 9.6% 2.0% 2.1% 9.9% 2.4% 2.2% 10.0% 2.4% 2.6% 9.4% 2.2% 2.3%
# 686 2,467 2,392 740 2,400 2,395 774 2,658 2,736 783 2,433 2,367 625 2,229 2,135
% 100% 100% 100% 100% 100% 100% 100% 100% 100% 100% 100% 100% 100% 100% 100%
# 77 259 262 76 292 263 78 299 275 75 297 282 49 260 242
% 69.4% 60.8% 61.2% 61.8% 62.8% 60.0% 57.8% 63.1% 60.2% 60.0% 62.5% 61.6% 55.7% 61.8% 63.0%
# 25 153 149 29 153 155 41 153 159 35 154 155 25 141 122
Petaluma Campus
Day
Credit
Evening
Non
Credit
Total
% 22.5% 35.9% 34.8% 23.6% 32.9% 35.4% 30.4% 32.3% 34.8% 28.0% 32.4% 33.8% 28.4% 33.5% 31.8%
# 9 14 17 18 20 20 16 22 23 15 24 21 14 20 20
% 8.1% 3.3% 4.0% 14.6% 4.3% 4.6% 11.9% 4.6% 5.0% 12.0% 5.1% 4.6% 15.9% 4.8% 5.2%
# 111 426 428 123 465 438 135 474 457 125 475 458 88 421 384
% 100% 100% 100% 100% 100% 100% 100% 100% 100% 100% 100% 100% 100% 100% 100%
# — — — — 2 7 — 2 2 — 2 2 — — —
% — — — — 33.3% 53.8% — 18.2% 20.0% — 22.2% 22.2% — — —
Rohnert Park
g
Credit
Day
Credit
Non
Credit
Total
# 1 — 1 1 4 6 1 9 8 1 7 7 1 2 1
% 100% — 100% 100% 66.7% 46.2% 100% 81.8% 80.0% 100% 77.8% 77.8% 100% 100% 100%
# — — — — — — — — — — — — — — —
% — — — — — — — — — — — — — — —
# 1 — 1 1 6 13 1 11 10 1 9 9 1 2 1
% 100% — 100% 100% 100% 100% 100% 100% 100% 100% 100% 100% 100% 100% 100%
# 17 41 48 20 41 49 18 36 47 20 32 53 23 43 46
Public Safety Training Center
Evening
Credit
Non
Credit
Total
Day
% 47.2% 52.6% 48.5% 52.6% 50.6% 53.8% 51.4% 50.7% 46.1% 57.1% 47.8% 62.4% 60.5% 56.6% 56.8%
# 15 30 43 13 34 35 13 29 48 11 29 26 11 26 28
% 41.7% 38.5% 43.4% 34.2% 42.0% 38.5% 37.1% 40.8% 47.1% 31.4% 43.3% 30.6% 28.9% 34.2% 34.6%
# 4 7 8 5 6 7 4 6 7 4 6 6 4 7 7
% 11.1% 9.0% 8.1% 13.2% 7.4% 7.7% 11.4% 8.5% 6.9% 11.4% 9.0% 7.1% 10.5% 9.2% 8.6%
# 36 78 99 38 81 91 35 71 102 35 67 85 38 76 81
% 100% 100% 100% 100% 100% 100% 100% 100% 100% 100% 100% 100% 100% 100% 100%
Non
Credit
Total
Evening
Credit
Credit
www.santarosa.edu/researchOffice of Institutional Research Institutional Effectiveness • IE – 23

SONOMA COUNTY JUNIOR COLLEGE DISTRICT — Fact Book 2010 IE – 24
Active Sections by Location, continued
Su F Sp Su F Sp Su F Sp Su F Sp Su F Sp
# 1 — — — — — — — — — — — — — —
% 6.7% — — — — — — — — — — — — — —
# — 15 18 2 20 21 5 21 17 4 16 7 — — —
% — 57.7% 60.0% 11.8% 60.6% 61.8% 22.7% 60.0% 54.8% 20.0% 50.0% 33.3% — — —
# 14 11 12 15 13 13 17 14 14 16 16 14 18 15 13
2006–07
Non
Day
Credit
Evening
Credit
North County
2005–06 2007–08 2008–09 2009–10
# 14 11 12 15 13 13 17 14 14 16 16 14 18 15 13
% 87.5% 42.3% 40.0% 88.2% 39.4% 38.2% 77.3% 40.0% 45.2% 80.0% 50.0% 66.7% 100% 100% 100%
# 15 26 30 17 33 34 22 35 31 20 32 21 18 15 13
% 100% 100% 100% 100% 100% 100% 100% 100% 100% 100% 100% 100% 100% 100% 100%
# — 2 3 2 4 4 1 4 2 — 2 1 — 1 —
% — 11.8% 23.1% 100% 25.0% 23.5% 50.0% 28.6% 12.5% — 25.0% 16.7% — 100% —
# — 12 10 — 12 13 1 10 13 — 6 5 — — —
% — 70.6% 76.9% — 75.0% 76.5% 50.0% 71.4% 81.3% — 75.0% 83.3% — — —
Sonoma
Day
Credit
Evening
Credit
Total
Non
Credit
% 70.6% 76.9% 75.0% 76.5% 50.0% 71.4% 81.3% 75.0% 83.3%
# — — — — — — — — 1 — — — — — —
% — — — — — — — — 6.3% — — — — — —
# — 14 13 2 16 17 2 14 16 — 8 6 — 1 —
% — 100% 100% 100% 100% 100% 100% 100% 100% — 100% 100% — 100% —
# — 1 1 — 2 1 — 5 4 — 3 — — — —
% — 6.3% 5.0% — 10.5% 4.5% — 25.0% 16.0% — 16.7% — — — —
# — 8 15 2 12 18 4 12 16 4 9 13 2 — —
West County
Credit
Non
Credit
Day
Credit
Total
Evening
% — 50.0% 75.0% 25.0% 63.2% 81.8% 44.4% 60.0% 64.0% 26.7% 50.0% 72.2% 20.0% — —
# 4 7 4 6 5 3 5 3 5 11 6 5 8 6 2
% 100% 43.8% 20.0% 75.0% 26.3% 13.6% 55.6% 15.0% 20.0% 73.3% 33.3% 27.8% 80.0% 100% 100%
# 4 16 20 8 19 22 9 20 25 15 18 18 10 6 2
% 100% 100% 100% 100% 100% 100% 100% 100% 100% 100% 100% 100% 100% 100% 100%
# 7 13 12 10 13 15 14 16 25 9 15 17 5 1 3
% 1.8% 2.9% 2.7% 2.5% 2.9% 3.3% 3.7% 3.7% 5.7% 2.4% 3.8% 4.1% 1.4% 0.4% 1.3%
Santa Rosa Off‐Campus
Non
Credit
g
Credit
Day
Credit
Total
# 4 30 26 7 31 31 7 40 32 8 26 16 4 5 1
% 1.0% 6.6% 5.8% 1.7% 7.0% 6.9% 1.8% 9.3% 7.3% 2.2% 6.5% 3.9% 1.2% 2.2% 0.4%
# 388 410 413 384 400 405 358 376 384 352 358 377 338 223 223
% 97.2% 90.5% 91.6% 95.8% 90.1% 89.8% 87.0% 87.1% 95.4% 89.7% 92.0% 97.4% 97.4% 98.2%
# 399 453 451 401 444 451 379 432 441 369 399 410 347 229 227
% 100% 100% 100% 100% 100% 100% 6% 100% 100% 100% 100% 100% 100% 100% 100%
# 4 4 8 5 5 7 5 5 8 5 5 4 4 — —
% 44 4% 43 8% 53 8% 71 4% 55 6% 58 3% 71 4% 62 5% 66 7% 62 5% 50 0% 100%
North Coast
Evening
Credit
Non
Credit
Day
C dit
Total
% 44.4% 43.8% 53.8% 71.4% 55.6% 58.3% 71.4% 62.5% 66.7% — 62.5% 50.0% 100% — —
# 3 7 4 — 2 2 — 1 2 — 1 2 — 1 1
% 33.3% 43.8% 30.8% — 22.2% 16.7% — 12.5% 16.7% — 12.5% 25.0% — 33.3% 100%
# 2 2 2 2 2 3 2 2 2 — 2 2 — 2 —
% 22.2% 12.5% 15.4% 28.6% 22.2% 25.0% 28.6% 25.0% 16.7% — 25.0% 25.0% — 66.7% —
# 9 13 14 7 9 12 7 8 12 5 8 8 4 3 1
% 100% 100% 100% 100% 100% 100% 100% 100% 100% — 100% 100% 100% 100% 100%
Evening
Credit
Non
Credit
Credit
Total
www.santarosa.edu/researchOffice of Institutional Research Institutional Effectiveness • IE – 24

SONOMA COUNTY JUNIOR COLLEGE DISTRICT — Fact Book 2010 IE – 25
Active Sections by Location, continued
Su F Sp Su F Sp Su F Sp Su F Sp Su F Sp
2008–092005–06 2006–07 2007–08 2009–10
# — — — — 2 2 — 3 4 — 1 5 — — —
% — — — — 15.4% 20.0% — 23.1% 28.6% — 7.7% 27.8% — — —
# — 7 13 — 11 8 1 10 10 1 8 13 — — —
% — 100% 100% — 84.6% 80% 100% 77% 71% 100% 62% 72% — — —
# — — — — — — — — — — 4 — — — —
% — — — — — — — — — — — — — — —
# — 7 13 — 13 10 1 13 14 1 13 18 — — —
% — 100% 100% — 100% 100% 100% 100% 100% 100% 69% 100% — — —
Tech Academy
Non
Credit
Day
Credit
Evening
Credit
Total
# — 1 1 — 2 1 — 1 2 — 1 — — — 1
% — — — — 16.7% 11.1% — 9.1% 18.2% — 7.7% — — — 12.5%
# 1 3 3 — 8 6 — 8 7 — 9 7 0 6 6
% 50.0% 50.0% 16.7% — 66.7% 66.7% — 72.7% 63.6% — 69.2% 77.8% 0.0% 66.7% 75.0%
# 1 2 2 1 2 2 1 2 2 1 3 2 1 3 1
% 50.0% 50.0% 33.3% 100% 16.7% 22.2% 100% 18.2% 18.2% 100% 23.1% 22.2% 100% 33.3% 12.5%
# 2 6 6 1 12 9 1 11 11 1 13 9 1 9 8
% 100% 100% 100% 100% 100% 100% 100% 100% 100% 100% 100% 100% 100% 100% 100%
Windsor
Day
Credit
Evening
Credit
Non
Credit
Total
# 8 25 22 8 22 23 8 21 21 8 22 22 5 23 21
% 66.7% 64.1% 61.1% 57.1% 50.0% 56.1% 57.1% 53.8% 50.0% 36.4% 55.0% 59.5% 50.0% 63.9% 70.0%
# 4 14 14 6 22 18 6 18 21 14 18 15 5 13 9
% 33.3% 35.9% 38.9% 42.9% 50.0% 43.9% 42.9% 46.2% 50.0% 63.6% 45.0% 40.5% 50.0% 36.1% 30.0%
# — — — — — — — — — — — — — — —
% — — — — — — — — — — — — — — —
# 12 39 36 14 44 41 14 39 42 22 40 37 10 36 30
% 100% 100% 100% 100% 100% 100% 100% 100% 100% 100% 100% 100% 100% 100% 100%
Brickyard
Evening
Credit
Non
Credit
Day
Credit
Total
# — — — — — — — — — — — — 86 181 134
% — — — — — — — — — — — — 85.1% 85.0% 73.6%
# — — — — — — — — — — — — 14 31 47
% — — — — — — — — — — — — 13.9% 14.6% 25.8%
# — — — — — — — — — — — — 1 1 1
% — — — — — — — — — — — — 1.0% 0.5% 0.5%
# — — — — — — — — — — — — 101 213 182
% — — — — — — — — — — — — 100% 100% 100%
Evening
Credit
Non
Credit
Total
Online
Day
Credit
Active Sections by Location, Time and Credit/Noncredit
Definition of Measure: The number of active (non‐cancelled) sections by semester and location by time and credit or noncredit. These numbers are based on End of Semester data, so they also include added sections.
Source: Internal SRJC Data (NSR/STRM740)
Use(s) of Measure: This measure is used for facility and services planning purposes.
% 100% 100% 100%
Use(s) of Measure: This measure is used for facility and services planning purposes.
Analysis: In 2008–09, in reactions to the state budget crisis the District reduced the number of sections offered. Therefore, the percentage of active sections has increased due to fewer classes being cancelled during the semester. The percentage of district‐wide active sections for day credit grew to over 60% in Fall 2009 and Spring 2010, after averaging around 57% in the prior four years. Evening credit sections have a lower rate of approximately 30% for Fall and Spring, and 20% for Summer.
Active sections vary by time and location Online classes have the highest proportion of day credit
www.santarosa.edu/researchOffice of Institutional Research Institutional Effectiveness • IE – 25
Active sections vary by time and location. Online classes have the highest proportion of day credit active sections of 85%. In Fall 2009, Santa Rosa had higher proportion of day credit active sections, approximately 69%, compared to Petaluma, approximately 62%. For evening credit sections, the location of higher proportions shift to Petaluma, approximately 33%, and Santa Rosa at 29%.
For more information: http://www.santarosa.edu/datamine (Outlook password required).

SONOMA COUNTY JUNIOR COLLEGE DISTRICT — Fact Book 2010 IE – 26
Accountability Reporting for Community Colleges (ARCC)
SRJC Rates over 5 years
2004‐ 2005‐ 2006‐ 2007‐ 2008‐Indicator
2004
2005
2005
2006
2006
2007
2007
2008
2008
2009
Student Progress and Achievement
Rate (6‐yr)56.0% 54.8% 55.6% 54.4% 56.4%
Percent of Students Who Earned at
Least 30 Units (6‐yr)74.8% 73.1% 75.0% 76.1% 77.8%
Persistence Rate (1‐yr) 68.2% 69.3% 71.4% 68.3% 72.2%
Annual Successful Course Completion
Rate for Credit Vocational Courses (1‐
yr)
77.4% 76.4% 78.6% 76.6% 76.5%
Annual Successful Course Completion
Rate for Credit Basic Skills Courses (1‐ 69.7% 69.8% 70.0% 71.9% 72.8%Rate for Credit Basic Skills Courses (1
yr)
69.7% 69.8% 70.0% 71.9% 72.8%
Improvement Rate for Credit Basic
Skills Courses (3‐yr)58.8% 55.7% 60.2% 54.7% 56.4%
Improvement Rate for Credit ESL
Courses (3‐yr)39.0% 43.7% 47.7% 43.1% 44.0%
2009–10 Comparative Statistics
IndicatorStatewide
Rate
SRJC's
Rate
Peer
Group
Average
Peer
Group
Low
Peer
Group
High
Student Progress and Achievement
Rate (6‐yr)51.1% 56.4% 55.7%** 42.3% 67.3%
Rate (6 yr)
Percent of Students Who Earned at
Least 30 Units (6‐yr)71.1% 77.8% 75.0%* 68.1% 83.8%
Persistence Rate (1‐yr) 66.0% 72.2% 72.6%* 66.3% 77.7%
Annual Successful Course Completion
Rate for Credit Vocational Courses (1‐ 76.0% 76.5% 75.1% 63.6% 87.3%
yr)
Annual Successful Course Completion
Rate for Credit Basic Skills Courses (1‐yr)61.1% 72.8% 65.7%* 56.6% 84.1%
Improvement Rate for Credit Basic Skills
Courses (3‐yr)52.7% 56.4% 55.0%** 44.0% 65.0%
I t R t f C dit ESL
www.santarosa.edu/researchOffice of Institutional Research Institutional Effectiveness • IE – 26
* = highest achieving peer group (out of six)** = second highest achieving peer group (out of six)
Improvement Rate for Credit ESL
Courses (3‐yr)47.5% 44.0% 50.7% 34.1% 71.4%

SONOMA COUNTY JUNIOR COLLEGE DISTRICT — Fact Book 2010 IE – 27
Accountability Reporting for Community Colleges (ARCC)Definition of Measure: The purpose of the ARCC report is to evaluate community college performance in light of the state’s educational outcome priorities. AB1417, passed in 2004, is widely viewed as a modified continuation of the accountability model first put forth in “Partnership for Excellence”. Two levels of outcomes are reported – system and college levels. The system level includes statewide data from all California Community Colleges that is aggregated, and there is no local accountability. The college level shows measured outcomes by individual colleges wherein colleges are held accountable, though currently there are no repercussions or rewards for low nor high rates. The outcomes for individual colleges are compared to the average outcomes for peer colleges. The peer groups were determined through statistical analysis of variables that are significant predictors of each outcome. Peer groupings may vary from year to year.
Note: All Districts are required to submit a Self‐Assessment in response to the college level outcomes and peer grouping analysis.
Source: SRJC Board Report (Chancellor’s Office data)
Use(s) of Measure: This measure tracks the District’s progress on Accountability Reporting for Community Colleges and is an indicator of institutional effectiveness.
Analysis: SRJC’s rates on all seven measures have been relatively stable over the past five years. The most notable gain is in “Annual Successful course completion Rate for Credit Basic Skills courses”.
SRJC generally outperforms the statewide and peer group averages. On the six of the seven college outcomes measures, SRJC posts higher rates than the statewide average. On five of the seven measures, SRJC’s rates are higher than the peer group average.
For more information: California Community Colleges Chancellor’s Office ARCC website: http://www.cccco.edu/SystemOffice/Divisions/TechResearchInfo/ResearchandPlanning/ARCC/tabid/292/Default.aspx
www.santarosa.edu/researchOffice of Institutional Research Institutional Effectiveness • IE – 27

SONOMA COUNTY JUNIOR COLLEGE DISTRICT — Fact Book 2010 IE – 28
Student Right To Know Rates
Student Right To Know RatesFall 2001 Fall 2006
25.0%
30.0%
35.0%
40.0%
45.0%
50.0%
Fall 2001 – Fall 2006
0.0%
5.0%
10.0%
15.0%
20.0%
Fall 2001 Fall 2002 Fall 2003 Fall 2004 Fall 2005 Fall 2006
Completion SRJC Completion Statewide Leavers SRJC Leavers Statewide
Fall 2001 Fall 2002 Fall 2003 Fall 2004 Fall 2005 Fall 2006
Completion SRJC 43.5% 46.2% 45.9% 33.7% 31.1% 29.8%
Completion Statewide 35.3% 36.0% 35.6% 24.8% 24.1% 24.8%
Leavers SRJC 12.1% 14.9% 9.3% 15.4% 14.3% 13.7%
Leavers Statewide 21 4% 29 6% 17 0% 25 1% 17 9% 16 7%
Student Right To Know Rates
Definition of Measure: Student Right To Know (SRTK) is a federally mandated cohort study of a group of students who are First‐Time Freshmen (FTF), enrolled full‐time and are degree seeking to provide a statistic of comparable effectiveness of college’s Completion Rate (total number that earned a degree certificate or Transfer prepared) and Leavers Rate (the total number of non
Leavers Statewide 21.4% 29.6% 17.0% 25.1% 17.9% 16.7%
earned a degree, certificate or Transfer prepared) and Leavers Rate (the total number of non‐completers who enrolled or transfer out to another institution). The students are identified in a fall term and their outcomes are measured over 3 to 6 years.
Source: California Community Colleges Chancellor’s Office
Comparison Group: California Community Colleges Systemwide
Use(s) of Measure: This mandated measure provides a statistic of college effectiveness.
Analysis: SRJC’s First Time Freshmen (FTF) cohorts have a higher rate of earning a degree or certificate, or successfully completing a transfer‐preparatory program compared to the California Community Colleges statewide. The past five SRJC cohorts’ completion rates range from 5% to 10.3% higher.
FTF cohorts also stay longer at SRJC instead of transferring as “non‐completers” to another educational institution. The SRTK Leavers Rate is lower for SRJC than overall statewide, meaning less t d t i th h t ll t f t f SRJC t th i tit ti t l t th i
www.santarosa.edu/researchOffice of Institutional Research Institutional Effectiveness • IE – 28
students in the cohorts enroll or transfer out of SRJC to other institutions to complete their education.
For more information: http://srtk.cccco.edu/index.asp

SONOMA COUNTY JUNIOR COLLEGE DISTRICT — Fact Book 2010 F – 1
Financial and Capital Outlay
Introduction
This section of the Fact Book presents various measures of fiscal stability, including general fund balance, revenues and expenditures, and facilities measures.
Fiscal challenges increased in 2009–10 requiring the District to monitor classes offered and departmental budgets. The District’s fiscal outlook was impacted by the statewide budget reduction, which required the district to review and alter funding decisions. These changes have challenged the District to take measures in order to continue providing high‐quality instruction and service to its students and the community.
Santa Rosa Junior College receives reimbursement from the State of California based on the number of students served and their unit load or contact hours, resulting in Full Time Equivalent Students or FTES. The rate of reimbursement is higher for credit courses than for noncredit and enhanced noncredit. Over the last ten years, SRJC’s general fund balance has fluctuated between eight and twelve million dollars.
In 2002, the citizens of Sonoma Count passed a bond measure in support of SRJC. As a result, SRJC has constructed new buildings, including the multi‐level parking structure, library, and student center g , g p g , y,on the Santa Rosa campus and numerous buildings on the Petaluma campus, nearly doubling its size. In addition, many other facilities have been expanded, repaired and upgraded utilizing bond funds, which can only be expended for capital outlay related to construction and retrofitting.
www.santarosa.edu/researchOffice of Institutional Research Financial and Capital Outlay • F – 1

SONOMA COUNTY JUNIOR COLLEGE DISTRICT — Fact Book 2010 F – 2
Annual Full‐Time Equivalent Student
15,000
20,000
Annual District FTES2000–01 to 2009–10
0
5,000
10,000 Credit
Noncredit
Enhanced NC
% change
f
% change
f
% change
f
CDCP NoncreditCredit Noncredit
T t l# %
from
previous
year
# %from
previous
year
# %from
previous
year
2000–01 15,678 83.0% 1.9% 3,219 17.0% 7.1% — — — 18,897
2001–02 16,371 82.7% 4.2% 3,398 17.2% 5.3% — — — 19,796
2002–03 16,858 82.3% 2.9% 3,618 17.7% 6.1% — — — 20,476
2003–04 16,862 82.6% 0.0% 3,562 17.4% –1.6% — — — 20,424
2004–05 16,907 82.8% 0.3% 3,519 17.2% –1.2% — — — 20,426
Total
2004 05 16,907 82.8% 0.3% 3,519 17.2% 1.2% 20,426
2005–06 16,592 81.9% –1.9% 3,671 18.1% 4.1% — — — 20,263
2006–07 16,729 82.5% 0.8% 3,547 17.5% – 3.5% — — — 20,276
2007–08 17,290 83.5% 3.2% 2,952 14.3% ‐20.2% 469 2.3% — 20,711
2008–09 17,772 83.6% 2.7% 2,953 13.9% 0.0% 538 2.5% — 21,263
2009–10 17,895 82.7% 0.7% 3,158 14.6% 6.5% 573 2.6% — 21,627
State and SRJC compared: 2009–10
Credit % Noncredit %CDCP
Noncredit% Total
17,895 82.7% 3,158 14.6% 573 2.6% 21,626
1,172,455 93.0% 46,994 3.7% 41,388 3.3% 1,260,837
SRJC
CCC Statewide*
www.santarosa.edu/researchOffice of Institutional Research Financial and Capital Outlay • F – 2
Source: Internal SRJC data (Admissions, Records and Enrollment Development) and Chancellor’s Office, Fiscal Services
SONOMA COUNTY JUNIOR COLLEGE DISTRICT — Fact Book 2010 F – 3
Annual FTES
Definition of Measure: Full‐Time Equivalent Student (FTES) is the equivalent of 30 credit units enrolled or 525 student contact hours in credit or noncredit courses per student per year, and is the state workload measure used to calculate reimbursement to the college for providing instruction. Career Development and College Preparation (CDCP) Enhanced Funding for Noncredit courses (SB 361) are listed separately. Enhanced funding is available for noncredit programs that create opportunities for career development and college preparation through career‐technical education, educational development and workforce preparation To be eligible for enhanced funding courseseducational development and workforce preparation. To be eligible for enhanced funding, courses must be part of a sequence that lead to a certificate of completion or a certificate of competency.
Credit, noncredit, and enhanced noncredit FTES have different reimbursement amounts. The estimated 2008–09 reimbursement rates for credit, noncredit and enhanced noncredit FTES are $4,578, $2,745 and $3,232 respectively.
Source: Internal SRJC data (Admissions, Records and Enrollment Development) and California Community College Chancellor’s OfficeCommunity College, Chancellor s Office
Comparison Group: California Community Colleges
Use(s) of Measure: This measure reviews the recent and historical FTES for providing instruction and is also a predictor of future funding for fiscal responsibility.
Analysis: Over the past decade, the largest proportional growth of credit FTES over the prior year was 2001–02 with a 4.2% increase. In 2009–10, the College’s credit FTES grew to 17,895 – an i f % f h h hi h i f di hincrease of 0.7% from 2008–09. SRJC has a much higher proportion of noncredit FTES when compared to statewide FTES. In 2009–10, SRJC noncredit FTES was 14.6% of the total FTES while the statewide FTES was 3.7% —a difference of 10.9%.
In 2009–10, the District received apportionment from CDCP courses. SRJC CDCP Noncredit was 2.6% of the total apportionment. Statewide CDCP funding was 3.3%.
For more information:
See Full‐Time Equivalent Student per Full‐Time Equivalent Faculty Ratios in the Institutional Effectiveness Section for a semester‐by‐semester break‐down of credit and noncredit FTES/FTEF ratios.
For statewide FTES: http://www.cccco.edu/ChancellorsOffice/Divisions/FinanceFacilities/FiscalServices/tabid/318/Default.aspx
www.santarosa.edu/researchOffice of Institutional Research Financial and Capital Outlay • F – 3

SONOMA COUNTY JUNIOR COLLEGE DISTRICT — Fact Book 2010 F – 4
General Fund Balance
$12 0
$14.0
Fund Balance in Millions2000–01 to 2009–10
$4.0
$6.0
$8.0
$10.0
$12.0
$0.0
$2.0
00–01 01–02 02–03 03–04 04–05 05–06 06–07 07–08 08–09 09–10
Fiscal Year Fund Balance
2000–01 $12,311,773$ , ,
2001–02 $12,690,591
2002–03 $10,974,371
2003–04 $10,605,181
2004–05 $10,249,567
2005–06 $9,230,055
2006–07 $8,469,429
2007–08 $10,010,011
$
Source: Internal SRJC data (Business Services, Annual District Audit)
2008–09 $8,492,320
2009–10 $9,218,725
www.santarosa.edu/researchOffice of Institutional Research Financial and Capital Outlay • F – 4

SONOMA COUNTY JUNIOR COLLEGE DISTRICT — Fact Book 2010 F – 5
General Fund Balance
Definition of Measure: The total General Fund Balance is the difference between the District’s revenues and expenditures at the end of the year. It excludes funds received and expended for capital projects. This amount is commonly referred to as “Board Reserves.”
Source: Internal SRJC data (Business Services, Annual Audits)
Use(s) of Measure: This measure is used to compare the historical General Fund Balance as an indicator of fiscal responsibility The Chancellor’s Office places an institution on a watch list if its fundindicator of fiscal responsibility. The Chancellor s Office places an institution on a watch list if its fund reserve or balance decreases to below 5% of annual operations.
Analysis: The General Fund Balance of the college has fluctuated between a high of $12.7 million in 2001–02 to a low of $8.5 million in 2006–07, and again in 2008–09. In 2009–10, the balance grew to $9.2 million mostly likely caused by cost savings measures and re‐engineering of employees.
www.santarosa.edu/researchOffice of Institutional Research Financial and Capital Outlay • F – 5
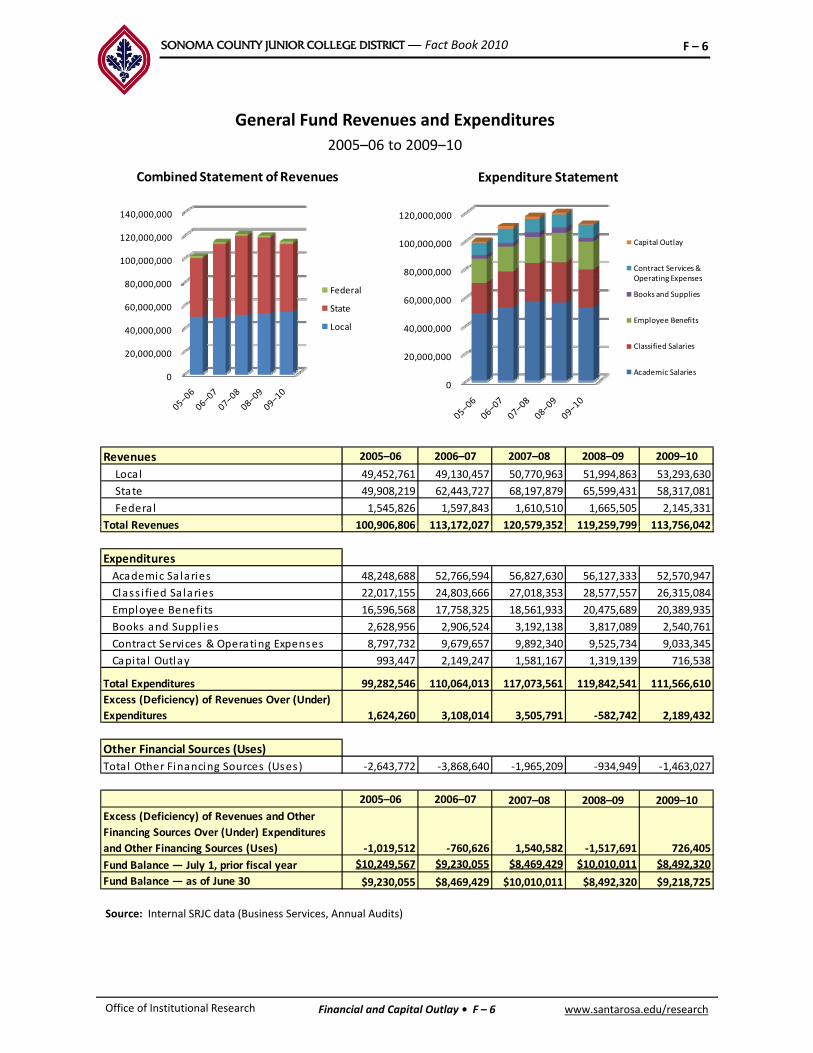
SONOMA COUNTY JUNIOR COLLEGE DISTRICT — Fact Book 2010 F – 6
General Fund Revenues and Expenditures
2005–06 to 2009–102005 06 to 2009 10
100,000,000
120,000,000
140,000,000
Combined Statement of Revenues
80,000,000
100,000,000
120,000,000
Expenditure Statement
Capital Outlay
Contract Services &
0
20,000,000
40,000,000
60,000,000
80,000,000Federal
State
Local
0
20,000,000
40,000,000
60,000,000
80,000,000Operating Expenses
Books and Supplies
Employee Benefits
Classified Salaries
Academic Salaries
Revenues 2005–06 2006–07 2007–08 2008–09 2009–10
Local 49,452,761 49,130,457 50,770,963 51,994,863 53,293,630
State 49,908,219 62,443,727 68,197,879 65,599,431 58,317,081
Federal 1,545,826 1,597,843 1,610,510 1,665,505 2,145,331
Total Revenues 100 906 806 113 172 027 120 579 352 119 259 799 113 756 042Total Revenues 100,906,806 113,172,027 120,579,352 119,259,799 113,756,042
Expenditures
Academic Sa laries 48,248,688 52,766,594 56,827,630 56,127,333 52,570,947
Class i fied Salaries 22,017,155 24,803,666 27,018,353 28,577,557 26,315,084
Employee Benefi ts 16,596,568 17,758,325 18,561,933 20,475,689 20,389,935
Books and Suppl ies 2,628,956 2,906,524 3,192,138 3,817,089 2,540,761
Contract Services & Operating Expenses 8,797,732 9,679,657 9,892,340 9,525,734 9,033,345
Capita l Outlay 993,447 2,149,247 1,581,167 1,319,139 716,538
Total Expenditures 99,282,546 110,064,013 117,073,561 119,842,541 111,566,610
Excess (Deficiency) of Revenues Over (Under)
Expenditures 1,624,260 3,108,014 3,505,791 ‐582,742 2,189,432
Other Financial Sources (Uses)
Total Other Financing Sources (Uses) ‐2,643,772 ‐3,868,640 ‐1,965,209 ‐934,949 ‐1,463,027
2005–06 2006–07 2007–08 2008–09 2009–10
Excess (Deficiency) of Revenues and Other
Financing Sources Over (Under) Expenditures
and Other Financing Sources (Uses) ‐1,019,512 ‐760,626 1,540,582 ‐1,517,691 726,405
Fund Balance — July 1, prior fiscal year $10,249,567 $9,230,055 $8,469,429 $10,010,011 $8,492,320
Fund Balance — as of June 30 $9,230,055 $8,469,429 $10,010,011 $8,492,320 $9,218,725
www.santarosa.edu/researchOffice of Institutional Research Financial and Capital Outlay • F – 6
Source: Internal SRJC data (Business Services, Annual Audits)

SONOMA COUNTY JUNIOR COLLEGE DISTRICT — Fact Book 2010 F – 7
General Fund Revenues and Expenditures
Definition of Measure: An annual summary of the revenues and expenditures as of the end of the fiscal year on June 30th, including the General Fund Balance with a chart of combined revenues and current expenditures for the past five years.
Source: Internal SRJC data (Business Services, Annual Audits)
Use(s) of Measure: This measure shows the historical revenues and expenditures for the District for planning and evaluation purposes. p g p p
Analysis: Overall revenues and expenditures decreased in 2009–10. Revenues decreased from the State though Local and Federal sources increased. Expenditures decreased in all categories including benefits.
www.santarosa.edu/researchOffice of Institutional Research Financial and Capital Outlay • F – 7

SONOMA COUNTY JUNIOR COLLEGE DISTRICT — Fact Book 2010 F – 8
Annual Capital Expenditures
$60,000,000
Capital Expenditures2005–06 to 2009–10
$0
$10,000,000
$20,000,000
$30,000,000
$40,000,000
$50,000,000
2005–06 2006–07 2007–08 2008–09 2009–10
Total State Total Local
2005 06 $ $
Total State Total Local
Source: Internal SRJC data (Administrative Services and Business Services)
2005–06 $11,118,643 $40,887,6392006–07 $20,974,397 $35,382,2542007–08 $2,514,369 $51,123,5212008–09 $415,191 $38,365,6212009–10 $319,499 $12,920,893
Source: Internal SRJC data (Administrative Services and Business Services)
www.santarosa.edu/researchOffice of Institutional Research Financial and Capital Outlay • F – 8

SONOMA COUNTY JUNIOR COLLEGE DISTRICT — Fact Book 2010 F – 9
Capital Expenditures
Definition of Measure: Capital expenditures for the past five years by local and state sources of monies. Capital expenditures include major construction, facility infrastructure, parking/roadways/landscaping, land acquisition, new construction, and modernization.
Source: Internal SRJC data (Administrative Services and Business Services)
Use(s) of Measure: This measure shows the capital expenditures for the past five years and can be used for facilities and program planning purposesused for facilities and program planning purposes.
Analysis: Measure A, which passed in Sonoma County in 2002, provided local funds to expand, repair, and upgrade SRJC facilities. In addition, the District has qualified for various funds from the state. In the past eight years, there have been major construction projects in the District — Frank P. Doyle Library in 2002–05; Ag Pavilion 2004–06; Petaluma Phase II 2005–09; Zumwalt Parking Pavilion 2005–07; Plover Library conversion 2006–08; the Bertolini Student Services Center 2007–10, B. Robert Burdo Culinary Arts Center 2010 – present.
www.santarosa.edu/researchOffice of Institutional Research Financial and Capital Outlay • F – 9

SONOMA COUNTY JUNIOR COLLEGE DISTRICT — Fact Book 2010 F – 10
Assignable Square Footage of District Buildings, by Date of Constructionor Acquisition
250,000
300,000
350,000
Construction or Acquisition1930–39 to 2000–09
0
50,000
100,000
150,000
200,000
1930–39 1940–49 1950–59 1960–69 1970–79 1980–89 1990–99 2000–09
Added
Assignable
Square
Footage
Analy 19,071
Bailey Field Support 1,562
Bussman 20,450
Added
Assignable
Square
Footage
Elliott House 959
Community Service 2,868
EOPS 1,650 ,
Garcia 6,776
Pioneer 11,415
Tauzer 33,160
Total 92,434
Burbank 21,812
21,812
1930–39
1940–49
,
Forsyth 8,207
Haehl 24,294
Lounibos 29,666
Adaptive PE 1,689
Shone Farm 26,900
Total 96,233
Staff Development 1,272
1980–89
Barnett 11,664
Doyle Student Center 18,610
Graphics 1,400
Shuhaw 27,271
Total 58,945
Bailey 12,002
Baker 20,070
1950–59
Maggini 24,741
Petaluma Campus 45,278
Pedroncell i Center 4,125
Call Child Development Ctr 15,899
Button Building 3,745
Custodial Center 1,966
Race 26,746
Total 123,772
1990–99
,
Bech 13,628
Kent Hall 10,693
Maintenance Compound 21,444
Temporaries 21,557
Total 99,394
Emeritus 34,342
Assessment Temporary 1,556
1960–69Public Safety Training Center 58,854
Analy Vil lage 17,085
Doyle Library 95,712
Ag Pavilion 32,227
Bailey Parking Structure 950
Petaluma Campus Phase II 82,058
Bertolini Student Center 37,363
Shone Farm 437
2000–09
www.santarosa.edu/researchOffice of Institutional Research Financial and Capital Outlay • F – 10
Assessment Temporary 1,556
Lark 25,269
Plover 28,830
Quinn 20,966
Temporaries 6,936
Total 117,899
1970–79
Total 324,686

SONOMA COUNTY JUNIOR COLLEGE DISTRICT — Fact Book 2010 F – 11
2009–10 Assignable Square Footage by Location
Source: Internal SRJC data (Administrative Services via Fusion)Note: This table covers all SRJC facilities, listing buildings the college owns rather than leases.
Santa Rosa Campus 570,274
Petaluma Campus 132,849
Public Safety Training Center, Windsor 58,854
Shone Farm 59,526
Total 821,503
Assignable Square Footage of District Buildings by Date of Construction or Acquisition
Definition of Measure: A listing for Assignable Square Footage (ASF) of permanent and temporary
Assignable square footage reflects the new state guidelines on how to measure square footage.
g g q g ( ) p p ydistrict buildings per decade. ASF is the usable space within buildings for teaching and work purposes (i.e., all added classroom, office, lab spaces, conference, meeting and support rooms). Non‐assignable space is the area of the building used for foot traffic and utilities (i.e., entry foyers, lobbies, hallways, stairways, restrooms, custodial, closets, and mechanical spaces). ASF is broken down by date of construction or the date the property was acquired by the District.
Source: Internal SRJC data (Administrative Services)
( ) f h h h bl b ld f f l dUse(s) of Measure: This measure shows the usable space in District buildings for facilities and program planning purposes.
Analysis: The District has added new buildings every decade, with the greatest growth in ASF occurring from 1990 to the present. As of the 2009–10 academic year, Sonoma County Junior College District had a total of 821,503 assignable square feet.
The academic year 2008–09 saw changes with the completion of the Bertolini Student Center on the Santa Rosa campus and the completion of the reconstruction of Phase I on the Petaluma CampusSanta Rosa campus and the completion of the reconstruction of Phase I on the Petaluma Campus. The assignable square footage on the table above reflects actual physical changes happening district wide.
www.santarosa.edu/researchOffice of Institutional Research Financial and Capital Outlay • F – 11

SONOMA COUNTY JUNIOR COLLEGE DISTRICT — Fact Book 2010 F – 12
Parking Ratios on Santa Rosa Campus
8.00
Student Headcount per Parking Space at the Santa Rosa Campus
Fall 2001 — Fall 2010, First Census
0.00
2.00
4.00
6.00
2001 2002 2003 2004 2005 2006 2007 2008 2009 2010
Day Ratio Evening Ratio
Students
on campus
Students per
parking space
Students
on campus
Students per
parking space
Fall 2001 2,378 16,300 6.85 12,018 5.05
Fall 2002 2,378 17,180 7.22 11,380 4.79
Day Evening
Parking
Spaces
, , ,
Fall 2003 2,378 17,319 7.28 11,277 4.74
Fall 2004 2,438 17,460 7.16 10,357 4.25
Fall 2005 2,438 17,792 7.30 10,652 4.37
Fall 2006 2,595 17,923 6.91 10,957 4.22
Fall 2007 3,821 18,712 4.90 11,207 2.93
Fall 2008 3,821 18,376 4.81 13,187 3.45
Fall 2009 3,821 20,563 5.38 12,174 3.19
ll 20 0 3 82 8 38 2 98
Source: Internal SRJC data – Admissions, Records, and Enrollment Development; Administrative Services
Fall 2010 3,821 18,117 4.74 11,381 2.98
www.santarosa.edu/researchOffice of Institutional Research Financial and Capital Outlay • F – 12

SONOMA COUNTY JUNIOR COLLEGE DISTRICT — Fact Book 2010 F – 13
Parking Ratios on Santa Rosa Campus
Definition of Measure: The ratio of the day and evening credit and noncredit student headcount to the number of parking spaces at the Santa Rosa campus as of First Census. If a student is taking a day as well as an evening class, the student is counted once in each category.
Source: Internal SRJC data (Admissions, Records and Enrollment Development and Campus Police)
Use(s) of Measure: This measure is used for facilities planning and access to the college.
Analysis: The increase in parking spaces in 2007 was due to the opening of the Zumwalt Parking Pavilion, which created an additional 1,100 spaces and caused a drop in the number of students per parking space. The decrease in the course offerings in 2009 and 2010 has lower the number of students on campus and has reduced the number of students per space. Prior increases in parking spaces occurred for various reasons, including re‐striping, expansion of current lots, and acquisition of additional lots.
www.santarosa.edu/researchOffice of Institutional Research Financial and Capital Outlay • F – 13

SONOMA COUNTY JUNIOR COLLEGE DISTRICT — Fact Book 2010 A – 1
Summary of Statistics by Location
2009–10
Sonoma County Junior College District — Location Statistics
# % # % # % # % # % # %
Total Headcount
Credit 8,509 90.6% 20,524 95.8% 20,156 94.8% 1,795 90.7% 5,717 93.9% 5,694 93.7%
Noncredi t 879 9.4% 892 4.2% 1,114 5.2% 185 9.3% 370 6.1% 385 6.3%
Total 9,388 100% 21,416 100% 21,270 100% 1,980 100% 6,087 100% 6,079 100%
Units Data
Units Enrolled 23,519 — 131,622 — 125,453 — 4,688 — 27,857 — 26,567 —
Petaluma CampusSummer 2009 Fall 2009 Spring 2010
Santa Rosa CampusSummer 2009 Fall 2009 Spring 2010
Average Units Enrolled 2.9 — 7.0 — 6.8 — 2.8 — 5.5 — 5.3 —
Unit Count
12+ 75 0.9% 4,121 20.1% 3,705 18.4% 0 0.0% 522 9.1% 438 7.7%
9.0 ‐ 11.5 110 1.3% 2,789 13.6% 2,629 13.0% 10 0.6% 544 9.5% 566 9.9%
6.0 ‐ 8.5 738 8.7% 3,594 17.5% 3,627 18.0% 92 5.1% 974 17.0% 986 17.3%
3.5 ‐ 5.5 1,717 20.2% 2,679 13.1% 2,801 13.9% 366 20.4% 950 16.6% 791 13.9%
0.5 ‐ 3.0 5,359 63.0% 5,565 27.1% 5,636 28.0% 1,220 68.0% 2,112 36.9% 2,260 39.7%
Zero 510 6.0% 1,776 8.7% 1,758 8.7% 107 6.0% 615 10.8% 653 11.5%
Total 8,509 100% 20,524 100% 20,156 100% 1,795 100% 5,717 100% 5,694 100%
ll ( li d)Enrollment (Duplicated)
Credit
Day 6,421 69.8% 15,576 59.9% 15,402 61.1% 1,211 64.4% 3,824 55.7% 3,720 55.6%
Evening 2,772 30.2% 10,414 40.1% 9,808 38.9% 670 35.6% 3,045 44.3% 2,965 44.4%
Total 9,193 100% 25,990 100% 25,210 100% 1,881 100% 6,869 100% 6,685 100%
Noncredit
Day 1,342 72.5% 5,333 64.5% 6,530 94.0% 90 32.5% 877 73.9% 840 66.2%
Evening 509 27.5% 2,929 35.5% 415 6.0% 187 67.5% 309 26.1% 429 33.8%
Total 1,851 100% 8,262 100% 6,945 100% 277 100% 1,186 100% 1,269 100%
Section CountSection Count
Credit
Day 409 72.3% 1,536 70.4% 1,546 74.1% 49 66.2% 260 64.8% 242 66.5%
Evening 157 27.7% 645 29.6% 540 25.9% 25 33.8% 141 35.2% 122 33.5%
Total 566 100% 2,181 100% 2,086 100% 74 100% 401 100% 364 100%
Noncredit
Day 44 — 32 66.7% 35 71.4% 5 — 8 40.0% 6 30.0%
Evening 15 — 16 33.3% 14 28.6% 9 — 12 60.0% 14 70.0%
Total 59 — 48 100% 49 100% 14 — 20 100% 20 100%
Total number of sections 625 — 2,229 — 2,135 — 88 — 421 — 384 —
Gender
Female 5,304 56.5% 11,673 54.5% 11,386 53.5% 1,111 56.1% 3,388 55.7% 3,314 54.5%
Male 3,909 41.6% 9,395 43.9% 9,534 44.8% 820 41.4% 2,589 42.5% 2,654 43.7%
Unknown 175 1.9% 348 1.6% 350 1.6% 49 2.5% 110 1.8% 111 1.8%
Ethnicity
Amer/Ak.Nat 122 1.3% 243 1.1% 237 1.1% 10 0.5% 52 0.9% 54 0.9%
Asian 450 4.8% 895 4.2% 856 4.0% 87 4.4% 216 3.5% 190 3.1%
Black 321 3.4% 642 3.0% 602 2.8% 48 2.4% 126 2.1% 114 1.9%
White 5,281 56.3% 12,955 60.5% 12,297 57.8% 1,149 58.0% 3,708 60.9% 3,580 58.9%, , , , , ,
Hispanic 1,984 21.1% 3,930 18.4% 3,738 17.6% 405 20.5% 1,138 18.7% 1,029 16.9%
Pac.Islander 52 0.6% 134 0.6% 143 0.7% 12 0.6% 40 0.7% 41 0.7%
Filipino 97 1.0% 219 1.0% 193 0.9% 24 1.2% 62 1.0% 52 0.9%
Other/Multiple 384 4.1% 655 3.1% 686 3.2% 69 3.5% 207 3.4% 184 3.0%
Unknown 697 7.4% 1,743 8.1% 2,518 11.8% 176 8.9% 538 8.8% 835 13.7%
Enrollment Status
Continuing 4,300 45.8% 13,120 61.3% 15,366 72.2% 837 42.3% 3,332 54.7% 4,159 68.4%
New 2,804 29.9% 4,738 22.1% 1,983 9.3% 711 35.9% 1,628 26.7% 723 11.9%
Returning 1,430 15.2% 3,711 17.3% 2,822 13.3% 260 13.1% 862 14.2% 867 14.3%
www.santarosa.edu/researchOffice of Institutional Research Appendix • A – 1
Enrichment 801 8.5% 813 3.8% 1,097 5.2% 153 7.7% 252 4.1% 330 5.4%
Unknown 53 0.6% 34 0.2% 2 0.0% 19 1.0% 13 0.2% 0 0.0%
Success Course Compl* — 83.6% — 71.5% — 72.1% — 82.7% — 69.3% — 71.3%
Retention Rates* — 86.0% — 76.2% — 76.5% — 84.7% — 74.7% — 76.2%
Note: There will be duplication in these numbers i f a student is enrolled at more than one location.
*Credit courses only
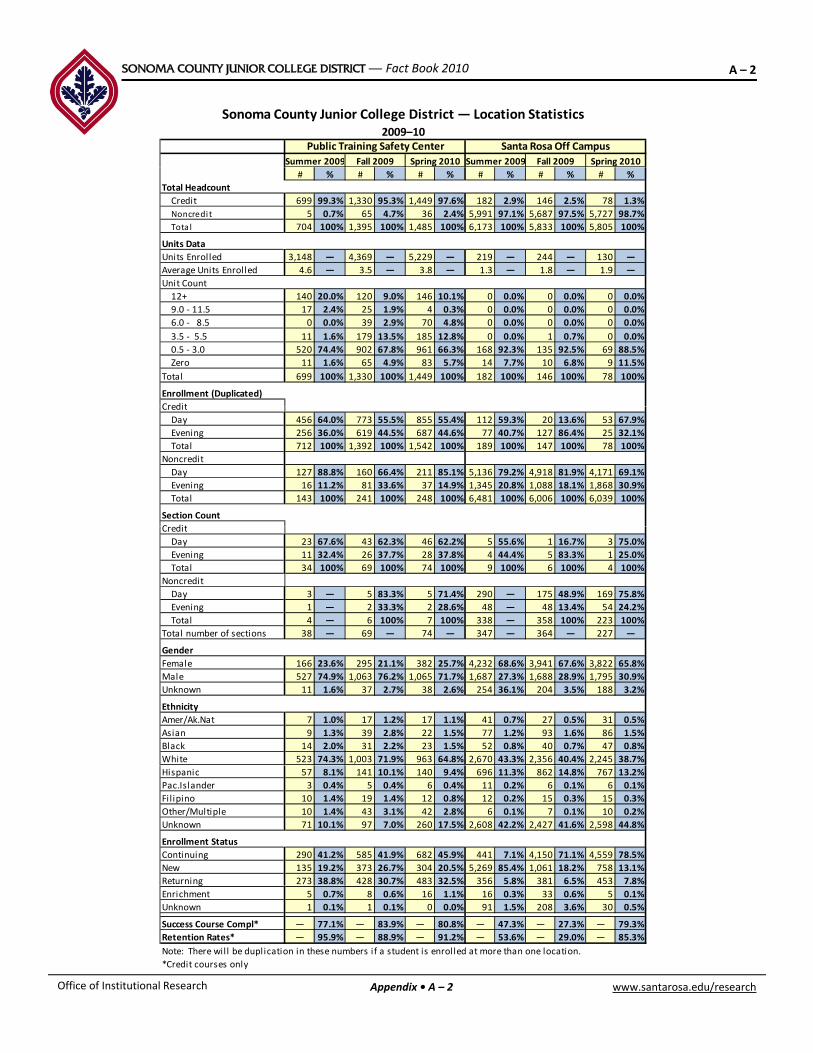
SONOMA COUNTY JUNIOR COLLEGE DISTRICT — Fact Book 2010 A – 2
Santa Rosa Off Campus2009–10
Sonoma County Junior College District — Location Statistics
Summer 2009 Fall 2009 Spring 2010
Public Training Safety Center
Summer 2009 Fall 2009 Spring 2010
# % # % # % # % # % # %
Total Headcount
Credit 699 99.3% 1,330 95.3% 1,449 97.6% 182 2.9% 146 2.5% 78 1.3%
Noncredi t 5 0.7% 65 4.7% 36 2.4% 5,991 97.1% 5,687 97.5% 5,727 98.7%
Tota l 704 100% 1,395 100% 1,485 100% 6,173 100% 5,833 100% 5,805 100%
Units Data
Units Enrolled 3,148 — 4,369 — 5,229 — 219 — 244 — 130 —
Average Units Enrolled 4.6 — 3.5 — 3.8 — 1.3 — 1.8 — 1.9 —
Unit Count
12+ 140 20.0% 120 9.0% 146 10.1% 0 0.0% 0 0.0% 0 0.0%
9.0 ‐ 11.5 17 2.4% 25 1.9% 4 0.3% 0 0.0% 0 0.0% 0 0.0%
6.0 ‐ 8.5 0 0.0% 39 2.9% 70 4.8% 0 0.0% 0 0.0% 0 0.0%
3.5 ‐ 5.5 11 1.6% 179 13.5% 185 12.8% 0 0.0% 1 0.7% 0 0.0%
0.5 ‐ 3.0 520 74.4% 902 67.8% 961 66.3% 168 92.3% 135 92.5% 69 88.5%
Zero 11 1.6% 65 4.9% 83 5.7% 14 7.7% 10 6.8% 9 11.5%
Total 699 100% 1,330 100% 1,449 100% 182 100% 146 100% 78 100%
Enrollment (Duplicated)
CreditCredit
Day 456 64.0% 773 55.5% 855 55.4% 112 59.3% 20 13.6% 53 67.9%
Evening 256 36.0% 619 44.5% 687 44.6% 77 40.7% 127 86.4% 25 32.1%
Total 712 100% 1,392 100% 1,542 100% 189 100% 147 100% 78 100%
Noncredit
Day 127 88.8% 160 66.4% 211 85.1% 5,136 79.2% 4,918 81.9% 4,171 69.1%
Evening 16 11.2% 81 33.6% 37 14.9% 1,345 20.8% 1,088 18.1% 1,868 30.9%
Total 143 100% 241 100% 248 100% 6,481 100% 6,006 100% 6,039 100%
Section Count
C ditCredit
Day 23 67.6% 43 62.3% 46 62.2% 5 55.6% 1 16.7% 3 75.0%
Evening 11 32.4% 26 37.7% 28 37.8% 4 44.4% 5 83.3% 1 25.0%
Total 34 100% 69 100% 74 100% 9 100% 6 100% 4 100%
Noncredit
Day 3 — 5 83.3% 5 71.4% 290 — 175 48.9% 169 75.8%
Evening 1 — 2 33.3% 2 28.6% 48 — 48 13.4% 54 24.2%
Total 4 — 6 100% 7 100% 338 — 358 100% 223 100%
Total number of sections 38 — 69 — 74 — 347 — 364 — 227 —
Gender
Female 166 23.6% 295 21.1% 382 25.7% 4,232 68.6% 3,941 67.6% 3,822 65.8%
Male 527 74.9% 1,063 76.2% 1,065 71.7% 1,687 27.3% 1,688 28.9% 1,795 30.9%
Unknown 11 1.6% 37 2.7% 38 2.6% 254 36.1% 204 3.5% 188 3.2%
Ethnicity
Amer/Ak.Nat 7 1.0% 17 1.2% 17 1.1% 41 0.7% 27 0.5% 31 0.5%
Asian 9 1.3% 39 2.8% 22 1.5% 77 1.2% 93 1.6% 86 1.5%
Black 14 2.0% 31 2.2% 23 1.5% 52 0.8% 40 0.7% 47 0.8%
White 523 74.3% 1,003 71.9% 963 64.8% 2,670 43.3% 2,356 40.4% 2,245 38.7%
Hispanic 57 8.1% 141 10.1% 140 9.4% 696 11.3% 862 14.8% 767 13.2%
Pac.Islander 3 0.4% 5 0.4% 6 0.4% 11 0.2% 6 0.1% 6 0.1%
Filipino 10 1.4% 19 1.4% 12 0.8% 12 0.2% 15 0.3% 15 0.3%
Other/Multiple 10 1.4% 43 3.1% 42 2.8% 6 0.1% 7 0.1% 10 0.2%
Unknown 71 10.1% 97 7.0% 260 17.5% 2,608 42.2% 2,427 41.6% 2,598 44.8%
Enrollment Status
Continuing 290 41.2% 585 41.9% 682 45.9% 441 7.1% 4,150 71.1% 4,559 78.5%
New 135 19.2% 373 26.7% 304 20.5% 5,269 85.4% 1,061 18.2% 758 13.1%
Returning 273 38.8% 428 30.7% 483 32.5% 356 5.8% 381 6.5% 453 7.8%
www.santarosa.edu/researchOffice of Institutional Research Appendix • A – 2
g
Enrichment 5 0.7% 8 0.6% 16 1.1% 16 0.3% 33 0.6% 5 0.1%
Unknown 1 0.1% 1 0.1% 0 0.0% 91 1.5% 208 3.6% 30 0.5%
Success Course Compl* — 77.1% — 83.9% — 80.8% — 47.3% — 27.3% — 79.3%
Retention Rates* — 95.9% — 88.9% — 91.2% — 53.6% — 29.0% — 85.3%
Note: There will be duplication in these numbers if a student is enrolled at more than one location.
*Credit courses only
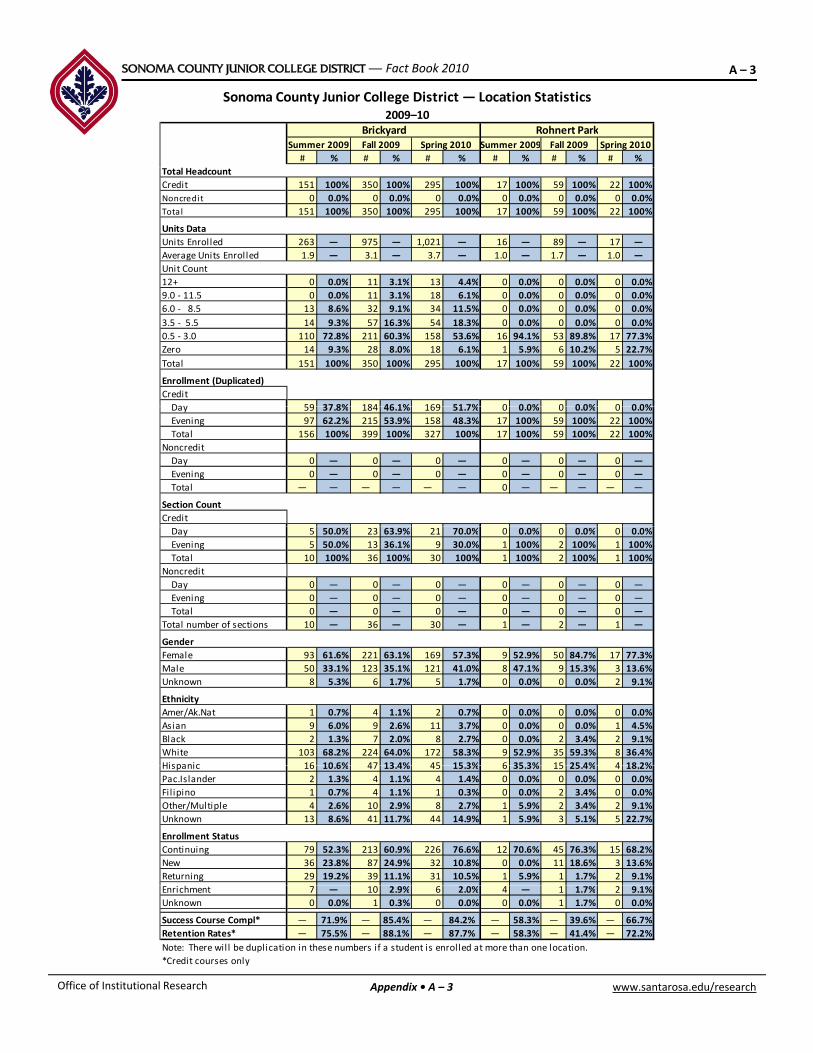
SONOMA COUNTY JUNIOR COLLEGE DISTRICT — Fact Book 2010 A – 3
# % # % # % # % # % # %
Rohnert Park
2009–10
Sonoma County Junior College District — Location Statistics
Summer 2009 Fall 2009 Spring 2010
BrickyardSummer 2009 Fall 2009 Spring 2010
Total Headcount
Credit 151 100% 350 100% 295 100% 17 100% 59 100% 22 100%
Noncredit 0 0.0% 0 0.0% 0 0.0% 0 0.0% 0 0.0% 0 0.0%
Total 151 100% 350 100% 295 100% 17 100% 59 100% 22 100%
Units Data
Units Enrolled 263 — 975 — 1,021 — 16 — 89 — 17 —
Average Units Enrolled 1.9 — 3.1 — 3.7 — 1.0 — 1.7 — 1.0 —
Unit Count
12+ 0 0.0% 11 3.1% 13 4.4% 0 0.0% 0 0.0% 0 0.0%
9.0 ‐ 11.5 0 0.0% 11 3.1% 18 6.1% 0 0.0% 0 0.0% 0 0.0%
6.0 ‐ 8.5 13 8.6% 32 9.1% 34 11.5% 0 0.0% 0 0.0% 0 0.0%
3.5 ‐ 5.5 14 9.3% 57 16.3% 54 18.3% 0 0.0% 0 0.0% 0 0.0%
0.5 ‐ 3.0 110 72.8% 211 60.3% 158 53.6% 16 94.1% 53 89.8% 17 77.3%
Zero 14 9.3% 28 8.0% 18 6.1% 1 5.9% 6 10.2% 5 22.7%
Total 151 100% 350 100% 295 100% 17 100% 59 100% 22 100%
Enrollment (Duplicated)
Credit
Day 59 37 8% 184 46 1% 169 51 7% 0 0 0% 0 0 0% 0 0 0%Day 59 37.8% 184 46.1% 169 51.7% 0 0.0% 0 0.0% 0 0.0%
Evening 97 62.2% 215 53.9% 158 48.3% 17 100% 59 100% 22 100%
Total 156 100% 399 100% 327 100% 17 100% 59 100% 22 100%
Noncredit
Day 0 — 0 — 0 — 0 — 0 — 0 —
Evening 0 — 0 — 0 — 0 — 0 — 0 —
Total — — — — — — 0 — — — — —
Section Count
Credit
Day 5 50.0% 23 63.9% 21 70.0% 0 0.0% 0 0.0% 0 0.0%
Evening 5 50.0% 13 36.1% 9 30.0% 1 100% 2 100% 1 100%
Total 10 100% 36 100% 30 100% 1 100% 2 100% 1 100%
Noncredit
Day 0 — 0 — 0 — 0 — 0 — 0 —
Evening 0 — 0 — 0 — 0 — 0 — 0 —
Total 0 — 0 — 0 — 0 — 0 — 0 —
Total number of sections 10 — 36 — 30 — 1 — 2 — 1 —
Gender
Female 93 61.6% 221 63.1% 169 57.3% 9 52.9% 50 84.7% 17 77.3%
Male 50 33.1% 123 35.1% 121 41.0% 8 47.1% 9 15.3% 3 13.6%
Unknown 8 5.3% 6 1.7% 5 1.7% 0 0.0% 0 0.0% 2 9.1%
Ethnicity
Amer/Ak.Nat 1 0.7% 4 1.1% 2 0.7% 0 0.0% 0 0.0% 0 0.0%
Asian 9 6.0% 9 2.6% 11 3.7% 0 0.0% 0 0.0% 1 4.5%
Black 2 1.3% 7 2.0% 8 2.7% 0 0.0% 2 3.4% 2 9.1%
White 103 68.2% 224 64.0% 172 58.3% 9 52.9% 35 59.3% 8 36.4%
Hispanic 16 10 6% 47 13 4% 45 15 3% 6 35 3% 15 25 4% 4 18 2%Hispanic 16 10.6% 47 13.4% 45 15.3% 6 35.3% 15 25.4% 4 18.2%
Pac.Islander 2 1.3% 4 1.1% 4 1.4% 0 0.0% 0 0.0% 0 0.0%
Filipino 1 0.7% 4 1.1% 1 0.3% 0 0.0% 2 3.4% 0 0.0%
Other/Multiple 4 2.6% 10 2.9% 8 2.7% 1 5.9% 2 3.4% 2 9.1%
Unknown 13 8.6% 41 11.7% 44 14.9% 1 5.9% 3 5.1% 5 22.7%
Enrollment Status
Continuing 79 52.3% 213 60.9% 226 76.6% 12 70.6% 45 76.3% 15 68.2%
New 36 23.8% 87 24.9% 32 10.8% 0 0.0% 11 18.6% 3 13.6%
Returning 29 19.2% 39 11.1% 31 10.5% 1 5.9% 1 1.7% 2 9.1%
www.santarosa.edu/researchOffice of Institutional Research Appendix • A – 3
Enrichment 7 — 10 2.9% 6 2.0% 4 — 1 1.7% 2 9.1%
Unknown 0 0.0% 1 0.3% 0 0.0% 0 0.0% 1 1.7% 0 0.0%
Success Course Compl* — 71.9% — 85.4% — 84.2% — 58.3% — 39.6% — 66.7%
Retention Rates* — 75.5% — 88.1% — 87.7% — 58.3% — 41.4% — 72.2%
Note: There will be duplication in these numbers if a student is enrolled at more than one location.
*Credit courses only

SONOMA COUNTY JUNIOR COLLEGE DISTRICT — Fact Book 2010 A – 4
# % # % # % # % # % # %
Point Arena/North Coast
2009–10
Sonoma County Junior College District — Location Statistics
Summer 2009 Fall 2009 Spring 2010
Healdsburg/North CountySummer 2009 Fall 2009 Spring 2010
# % # % # % # % # % # %
Total Headcount
Credit 0 0.0% 0 0.0% 0 0.0% 21 67.7% 15 38.5% 23 100%
Noncredi t 226 100% 180 100% 145 100% 10 32.3% 24 61.5% 0 0.0%
Total 226 100% 180 100% 145 100% 31 100% 39 100% 23 100%
Units Data
Units Enrolled 0 — 0 — 0 — 51 — 45 — 69 —
Average Units Enrolled 0.0 — 0.0 — 0.0 — 3.0 — 3.0 — 3.0 —
Unit Count
12+ 0 — 0 — 0 — 0 0 0% 0 0 0% 0 0 0%12+ 0 — 0 — 0 — 0 0.0% 0 0.0% 0 0.0%
9.0 ‐ 11.5 0 — 0 — 0 — 0 0.0% 0 0.0% 0 0.0%
6.0 ‐ 8.5 0 — 0 — 0 — 0 0.0% 0 0.0% 0 0.0%
3.5 ‐ 5.5 0 — 0 — 0 — 0 0.0% 0 0.0% 0 0.0%
0.5 ‐ 3.0 0 — 0 — 0 — 17 81% 15 100% 23 100%
Zero 0 — 0 — 0 — 4 19.0% 0 0.0% 0 0.0%
Total 0 — 0 — 0 — 21 100% 15 100% 23 100%
Enrollment (Duplicated)
Credit
D 0 0 0 21 100% 0 0 0% 0 0 0%Day 0 — 0 — 0 — 21 100% 0 0.0% 0 0.0%
Evening 0 — 0 — 0 — 0 0.0% 15 100% 23 100%
Total 0 — 0 — 0 — 21 100% 15 100% 23 100%
Noncredit
Day 31 13.5% 33 16.3% 25 16.8% 0 — 0 0.0% 0 —
Evening 198 86.5% 169 83.7% 124 83.2% 0 — 24 100% 0 —
Total 229 100% 202 100% 149 100% 0 — 24 100% 0 —
Section Count
Credit
Day 0 — 0 — 0 — 4 100% 0 0.0% 0 0.0%
Evening 0 — 0 — 0 — 0 0.0% 1 100% 1 100%
Total 0 — 0 — 0 — 4 100% 1 100% 1 100%
Noncredit
Day 4 — 3 20% 4 31% 0 — 0 0% 0 0%
Evening 14 — 12 80% 9 69% 0 — 2 100% 0 0%
Total 18 — 15 100% 13 100% 0 — 2 100% 2 100%
Total number of sections 18 — 15 — 13 — 4 — 3 — 3 —
Gender
Female 101 44.7% 91 50.6% 62 42.8% 18 58.1% 24 61.5% 13 56.5%
Male 111 49.1% 83 46.1% 80 55.2% 8 25.8% 13 33.3% 10 43.5%
Unknown 14 6.2% 6 3.3% 3 2.1% 5 2.2% 2 5.1% 3 13.0%
Ethnicity
Amer/Ak.Nat 0 0.0% 1 0.6% 3 2.1% 0 0.0% 0 0.0% 1 4.3%
Asian 2 0.9% 1 0.6% 1 0.7% 1 3.2% 1 2.6% 1 4.3%
Black 1 0.4% 1 0.6% 1 0.7% 0 0.0% 0 0.0% 0 0.0%
White 13 5.8% 11 6.1% 9 6.2% 15 48.4% 4 10.3% 7 30.4%
Hispanic 190 84.1% 130 72.2% 84 57.9% 9 29.0% 23 59.0% 7 30.4%p
Pac.Islander 0 0.0% 0 0.0% 0 0.0% 0 0.0% 0 0.0% 0 0.0%
Fil ipino 0 0.0% 0 0.0% 0 0.0% 0 0.0% 0 0.0% 0 0.0%
Other/Multiple 0 0.0% 1 0.6% 1 0.7% 0 0.0% 3 7.7% 1 4.3%
Unknown 20 8.8% 35 19.4% 46 31.7% 6 19.4% 8 20.5% 6 26.1%
Enrollment Status
Continuing 36 15.9% 111 61.7% 96 66.2% 13 41.9% 16 41.0% 2 8.7%
New 164 72.6% 53 29.4% 35 24.1% 15 48.4% 10 25.6% 2 8.7%
Returning 23 10.2% 14 7.8% 14 9.7% 3 9.7% 0 0.0% 1 4.3%
Enrichment 2 0.9% 2 1.1% 0 0.0% 0 0.0% 13 33.3% 18 78.3%
www.santarosa.edu/researchOffice of Institutional Research Appendix • A – 4
Enrichment 2 0.9% 2 1.1% 0 0.0% 0 0.0% 13 33.3% 18 78.3%
Unknown 1 0.4% 0 0.0% 0 0.0% 0 0.0% 0 0.0% 0 0.0%
Success Course Compl* — 0.0% — 0.0% — 0.0% — 76.2% — 100% — 100%
Retention Rates* — 0.0% — 0.0% — 0.0% — 76.2% — 100% — 100%
Note: There will be duplication in these numbers if a student is enrolled at more than one location.
*Credit courses only

SONOMA COUNTY JUNIOR COLLEGE DISTRICT — Fact Book 2010 A – 5
# % # % # % # % # % # %
Sebastopol
2009–10
Sonoma County Junior College District — Location Statistics
Summer 2009 Fall 2009 Spring 2010
SonomaSummer 2009 Fall 2009 Spring 2010
Total Headcount
Credit 0 — 34 100% 0 — 29 27.1% 0 0.0% 0 0.0%
Noncredit 0 — 0 0.0% 0 — 78 72.9% 54 100% 28 100%
Total 0 — 34 100% 0 — 107 100% 54 100% 28 100%
Units Data
Units Enrolled 0 — 78 — 0 — 24 — 0 — 0 —
Average Units Enrolled 0.0 — 3.0 — 0.0 — 1.0 — 0.0 — 0.0 —
Unit Count .
12+ 0 — 0 0 0% 0 — 0 0 0% 0 — 0 —12+ 0 0 0.0% 0 0 0.0% 0 0
9.0 ‐ 11.5 0 — 0 0.0% 0 — 0 0.0% 0 — 0 —
6.0 ‐ 8.5 0 — 0 0.0% 0 — 0 0.0% 0 — 0 —
3.5 ‐ 5.5 0 — 0 0.0% 0 — 0 0.0% 0 — 0 —
0.5 ‐ 3.0 0 — 26 76.5% 0 — 24 82.8% 0 — 0 —
Zero 0 — 8 23.5% 0 — 5 17.2% 0 — 0 —
Total 0 — 34 100% 0 — 29 100% 0 — 0 —
Enrollment (Duplicated)
Credit
D 0 34 100% 0 0 0 0% 0 0Day 0 — 34 100% 0 — 0 0.0% 0 — 0 —
Evening 0 — 0 0.0% 0 — 29 100% 0 — 0 —
Total 0 — 34 100% 0 — 29 100% 0 — 0 —
Noncredit
Day 0 — 0 — 0 — 48 60.8% 17 30.4% 0 0.0%
Evening 0 — 0 — 0 — 31 39.2% 39 69.6% 28 100%
Total 0 — 0 — 0 — 79 100% 56 100% 28 100%
Section Count
Credit
Day 0 — 1 100% 0 — 0 0.0% 0 — 0 —
Evening 0 — 0 0.0% 0 — 2 100% 0 — 0 —
Total 0 — 1 100% 0 — 2 100% 0 — 0 —
Noncredit
Day 0 — 0 — 0 — 6 2 33% 0 0%
Evening 0 — 0 — 0 — 2 4 67% 2 100%
Total 0 — 0 — 0 — 8 — 6 100% 2 100%
Total number of sections 0 — 1 — 0 — 10 — 6 — 2 —
Gender
Female 0 — 22 64.7% 0 — 45 42.1% 29 53.7% 16 57.1%
Male 0 — 11 32.4% 0 — 53 49.5% 25 46.3% 12 42.9%
Unknown 0 — 1 2.9% 0 — 9 8.4% 0 0.0% 28 100%
Ethnicity
Amer/Ak.Nat 0 — 0 0.0% 0 — 0 0.0% 0 0.0% 0 0.0%
Asian 0 — 1 2.9% 0 — 1 0.9% 0 0.0% 0 0.0%
Black 0 — 1 2.9% 0 — 2 1.9% 0 0.0% 0 0.0%
White 0 — 17 50.0% 0 — 20 18.7% 0 0.0% 0 0.0%
Hispanic 0 — 11 32 4% 0 — 65 60 7% 18 33 3% 10 35 7%Hispanic 0 — 11 32.4% 0 — 65 60.7% 18 33.3% 10 35.7%
Pac.Islander 0 — 0 0.0% 0 — 1 0.9% 0 0.0% 0 0.0%
Filipino 0 — 0 0.0% 0 — 0 0.0% 0 0.0% 0 0.0%
Other/Multiple 0 — 2 5.9% 0 — 0 0.0% 0 0.0% 0 0.0%
Unknown 0 — 2 5.9% 0 — 18 16.8% 36 66.7% 18 64.3%
Enrollment Status
Continuing 0 — 17 50.0% 0 — 17 15.9% 12 22.2% 14 50.0%
New 0 — 8 23.5% 0 — 79 73.8% 39 72.2% 7 25.0%
Returning 0 — 9 26.5% 0 — 8 7.5% 3 5.6% 6 21.4%
E i h 0 0 0 0% 0 3 2 8% 0 0 0% 1 3 6%
www.santarosa.edu/researchOffice of Institutional Research Appendix • A – 5
Enrichment 0 — 0 0.0% 0 — 3 2.8% 0 0.0% 1 3.6%
Unknown 0 — 0 0.0% 0 — 0 0.0% 0 0.0% 0 0.0%
Success Course Compl* — — — 84.2% — 100% — 55.3% — 20.3% — 0.0%
Retention Rates* — — — 84.2% — 100% — 55.3% — 20.3% — 0.0%
Note: There will be duplication in these numbers if a student is enrolled at more than one location.
*Credit courses only

SONOMA COUNTY JUNIOR COLLEGE DISTRICT — Fact Book 2010 A – 6
Sonoma County Junior College District — Location Statistics2009–10
On‐Line Shone FarmSummer 2009 Fall 2009 Spring 2010 Summer 2009 Fall 2009 Spring 2010
# % # % # % # % # % # %
Total Headcount
Credit 2,380 98.5% 3,969 98.9% 3,930 99.3% 86 100% 286 100.0% 300 100.0%
Noncredit 36 1.5% 43 1.1% 28 0.7% 0 0.0% 0 0.0% 0 0.0%
Total 2,416 100% 4,012 100% 3,958 100% 86 100% 286 100% 300 100%
Units Data
Units Enrolled 6,040 — 10,963 — 10,872 — 107 — 694 — 764 —
Average Units Enrolled 3.0 — 3.4 — 3.3 — 1.3 — 2.7 — 2.8 —
Unit Count
12+ 5 0.2% 37 0.9% 37 0.9% 0 0.0% 0 0.0% 0 0.0%
9.0 ‐ 11.5 28 1.2% 88 2.2% 81 2.1% 0 0.0% 2 0.7% 2 0.7%
6.0 ‐ 8.5 172 7.2% 415 10.5% 377 9.6% 0 0.0% 25 8.7% 21 7.0%
3.5 ‐ 5.5 220 9.2% 398 10.0% 430 10.9% 0 0.0% 39 13.6% 39 13.0%
0.5 ‐ 3.0 1,577 66.3% 2,329 58.7% 2,329 59.3% 82 95.3% 195 68.2% 212 70.7%
Zero 378 15.9% 702 17.7% 676 17.2% 4 4.7% 25 8.7% 26 8.7%
Total 2,380 100% 3,969 100% 3,930 100% 86 100% 286 100% 300 100%
Enrollment (Duplicated)
Credit
Day 2,103 83.1% 3,458 80.2% 3,054 68.7% 70 73.7% 148 48.1% 222 64.0%
Evening 429 16.9% 853 19.8% 1,389 31.3% 25 26% 160 51.9% 125 36%
Total 2,532 100% 4,311 100% 4,443 100% 95 100% 308 100% 347 100%
Noncredit
Day 39 100% 44 100% 29 100% 0 — 0 — 0 —
Evening 0 0.0% 0 0.0% 0 0.0% 0 — 0 — 0 —
Total 39 100% 44 100% 29 100% 0 — 0 — 0 —
Section Count
Credit
Day 86 86.0% 181 85.4% 134 — 4 80.0% 12 63.2% 16 72.7%
Evening 14 14.0% 31 14.6% 47 — 1 20.0% 7 36.8% 6 27.3%
Total 100 100% 212 100% 181 — 5 100% 19 100% 22 100%
Noncredit
Day 1 100% 1 100% 1 — 0 — 0 — 0 —
Evening 0 0.0% 0 0.0% 0 — 0 — 0 — 0 —
Total 1 100% 1 100% 0 — 0 — 0 — 0 —
Total number of sections 101 — 214 — 182 — 5 — 19 — 22 —
GenderGender
Female 1,626 67.3% 2,564 63.9% 2,538 64.1% 48 55.8% 155 54.2% 172 57.3%
Male 749 31.0% 1,393 34.7% 1,362 34.4% 35 40.7% 123 43.0% 122 40.7%
Unknown 41 1.7% 55 1.4% 58 1.5% 3 3.5% 8 2.8% 6 2.0%
Ethnicity
Amer/Ak.Nat 24 1.0% 49 1.2% 54 1.4% 0 0.0% 0 0.0% 2 0.7%
Asian 112 4.6% 138 3.4% 161 4.1% 1 1.2% 2 0.7% 7 2.3%
Black 50 2.1% 101 2.5% 90 2.3% 0 0.0% 1 0.3% 2 0.7%
White 1,682 69.6% 2,708 67.5% 2,615 66.1% 61 70.9% 225 78.7% 220 73.3%
Hispanic 261 10 8% 478 11 9% 443 11 2% 9 10 5% 18 6 3% 18 6 0%Hispanic 261 10.8% 478 11.9% 443 11.2% 9 10.5% 18 6.3% 18 6.0%
Pac.Islander 11 0.5% 26 0.6% 33 0.8% 0 0.0% 0 0.0% 1 0.3%
Filipino 21 0.9% 44 1.1% 42 1.1% 0 0.0% 2 0.7% 1 0.3%
Other/Multiple 61 2.5% 122 3.0% 89 2.2% 4 4.7% 12 4.2% 4 1.3%
Unknown 194 8.0% 346 8.6% 431 10.9% 11 12.8% 26 9.1% 45 15.0%
Enrollment Status
Continuing 1,603 14.1% 2,679 66.8% 3,025 76.4% 50 58.1% 159 55.6% 215 71.7%
New 341 18.5% 628 15.7% 299 7.6% 17 19.8% 70 24.5% 51 17.0%
Returning 448 0.9% 667 16.6% 599 15.1% 17 19.8% 48 16.8% 32 10.7%
www.santarosa.edu/researchOffice of Institutional Research Appendix • A – 6
Enrichment 21 0.1% 35 0.9% 35 0.9% 2 2.3% 9 3.1% 2 0.7%
Unknown 3 0.0% 3 0.1% 0 0.0% 0 0.0% 0 0.0% 0 0.0%
Success Course Compl* — 67.3% — 63.1% — 65.1% — 84.5% — 85.0% — 85.6%
Retention Rates* — 69.0% — 65.7% — 68.0% — 86.6% — 85.8% — 88.5%
Note: There will be duplication in these numbers if a student is enrolled at more than one location.
*Credit courses only
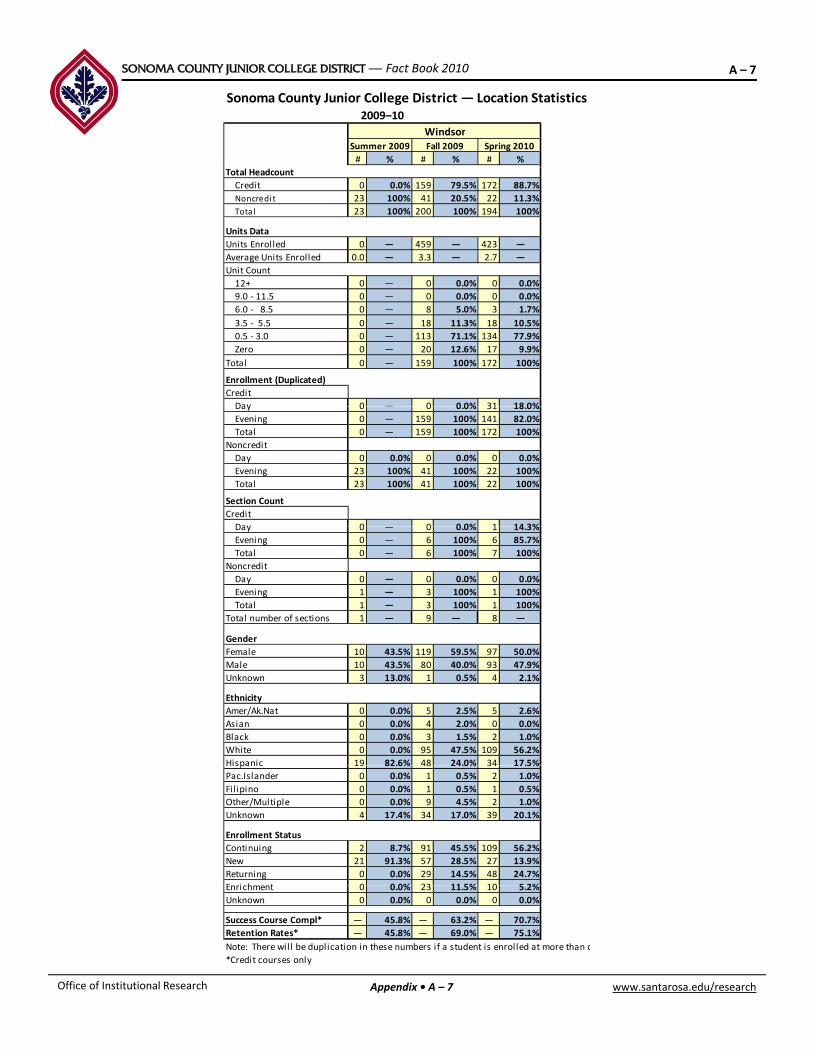
SONOMA COUNTY JUNIOR COLLEGE DISTRICT — Fact Book 2010 A – 7
# % # % # %
2009–10
WindsorSummer 2009 Fall 2009 Spring 2010
Sonoma County Junior College District — Location Statistics
Total Headcount
Credit 0 0.0% 159 79.5% 172 88.7%
Noncredi t 23 100% 41 20.5% 22 11.3%
Total 23 100% 200 100% 194 100%
Units Data
Units Enrolled 0 — 459 — 423 —
Average Units Enrolled 0.0 — 3.3 — 2.7 —
Unit Count
12+ 0 — 0 0.0% 0 0.0%
9.0 ‐ 11.5 0 — 0 0.0% 0 0.0%
6.0 ‐ 8.5 0 — 8 5.0% 3 1.7%
3.5 ‐ 5.5 0 — 18 11.3% 18 10.5%
0.5 ‐ 3.0 0 — 113 71.1% 134 77.9%
Zero 0 — 20 12.6% 17 9.9%
Total 0 — 159 100% 172 100%
Enrollment (Duplicated)
Credit
Day 0 — 0 0 0% 31 18 0%Day 0 0 0.0% 31 18.0%
Evening 0 — 159 100% 141 82.0%
Total 0 — 159 100% 172 100%
Noncredit
Day 0 0.0% 0 0.0% 0 0.0%
Evening 23 100% 41 100% 22 100%
Total 23 100% 41 100% 22 100%
Section Count
Credit
Day 0 0 0 0% 1 14 3%Day 0 — 0 0.0% 1 14.3%
Evening 0 — 6 100% 6 85.7%
Total 0 — 6 100% 7 100%
Noncredit
Day 0 — 0 0.0% 0 0.0%
Evening 1 — 3 100% 1 100%
Total 1 — 3 100% 1 100%
Total number of sections 1 — 9 — 8 —
Gender
Female 10 43.5% 119 59.5% 97 50.0%
Male 10 43.5% 80 40.0% 93 47.9%
Unknown 3 13.0% 1 0.5% 4 2.1%
Ethnicity
Amer/Ak.Nat 0 0.0% 5 2.5% 5 2.6%
Asian 0 0.0% 4 2.0% 0 0.0%
Black 0 0.0% 3 1.5% 2 1.0%
White 0 0.0% 95 47.5% 109 56.2%
Hispanic 19 82.6% 48 24.0% 34 17.5%Hispanic 19 82.6% 48 24.0% 34 17.5%
Pac.Islander 0 0.0% 1 0.5% 2 1.0%
Fil ipino 0 0.0% 1 0.5% 1 0.5%
Other/Multiple 0 0.0% 9 4.5% 2 1.0%
Unknown 4 17.4% 34 17.0% 39 20.1%
Enrollment Status
Continuing 2 8.7% 91 45.5% 109 56.2%
New 21 91.3% 57 28.5% 27 13.9%
Returning 0 0.0% 29 14.5% 48 24.7%
Enrichment 0 0 0% 23 11 5% 10 5 2%
www.santarosa.edu/researchOffice of Institutional Research Appendix • A – 7
Enrichment 0 0.0% 23 11.5% 10 5.2%
Unknown 0 0.0% 0 0.0% 0 0.0%
Success Course Compl* — 45.8% — 63.2% — 70.7%
Retention Rates* — 45.8% — 69.0% — 75.1%
Note: There will be duplication in these numbers i f a student is enrolled at more than o
*Credit courses only