Natural Resources Canada's Energy Fact Book 2020–2021
144
-
Upload
khangminh22 -
Category
Documents
-
view
1 -
download
0
Transcript of Natural Resources Canada's Energy Fact Book 2020–2021

ENERGY FACT BOOK2020–2021
Aussi disponible en français sous le titre : Cahier d’information sur l’énergie, 2020-2021
Information contained in this publication or product may be reproduced, in part or in whole, and by any means, for personal or public non-commercial purposes, without charge or further permission, unless otherwise specified.
You are asked to:
• Exercise due diligence in ensuring the accuracy of the materials reproduced.
• Indicate the complete title of the materials reproduced and the name of the author organization.
• Indicate that the reproduction is a copy of an official work that is published by Natural Resources Canada (NRCan) and that the reproduction has not been produced in affiliation with, or with the endorsement of, NRCan.
Commercial reproduction and distribution is prohibited except with written permission from NRCan. For more information, contact NRCan at [email protected].
Cat. No. M136-1E (Print) M136-1E-PDF (online)
ISSN 2370-3105
© Her Majesty the Queen in Right of Canada, as represented by the Minister of Natural Resources, 2020
PREFACE
The purpose of the Energy Fact Book is to provide key information on energy markets in Canada in a format that is easy to consult. Resources including a summary of units and conversion factors, abbreviations, and data sources used throughout this publication are available in the annexes.
All data is subject to revisions by statistical sources. In some instances, more than one source may be available and discrepancies in numbers may occur because of conceptual or methodological differences. In addition, some numbers may not add up precisely due to rounding.
This publication was assembled by the Energy and Economic Analysis Division of the Energy Policy and International Affairs Branch with the help of subject experts from across Natural Resources Canada (NRCan).
For questions or comments, contact NRCan at [email protected].
In this publication, energy industries are generally considered to include oil and gas extraction; coal mining; uranium mining; electric power generation, transmission and distribution; pipeline transportation; natural gas distribution; biofuels production; petroleum refineries; and support activities for oil and gas extraction. The petroleum sector is a subset of these industries, and in this publication consists of oil and gas extraction and support activities, pipeline transportation and distribution of oil and gas, and petroleum refineries.
Clean energy industries such as renewable and nuclear electricity generation, biofuels production and carbon capture and storage facilities are contained within the definition of energy industries. Some energy-related industries (e.g. petroleum product wholesaler-distributors and coal product manufacturing) are excluded because of a lack of data.

Energy Fact Book v
CONTENTS
Introduction viEnergy and the economy 1Energy and GHGs 27Crude oil 47Petroleum products 63Hydrocarbon gas liquids 69Natural gas 73Electricity 85Renewable energy 93Uranium and nuclear power 109Coal 117Annex 1 Units and conversion factors 123Annex 2 Abbreviations 126Annex 3 Sources 128
vi Energy Fact Book
INTRODUCTION
From an energy perspective, Canada is very fortunate. We have a large land mass, small population and one of the largest and most diverse supplies of energy in the world. Our rivers discharge close to 7% of the world’s renewable water – a tremendous source of hydroelectric power. We have the third-largest global supply of proven oil reserves and third-largest reserves of uranium; our energy resources are a source of strength that continues to shape our economy and society.
Canada is at the forefront of innovative technologies for how we produce and use energy. For example, low- or non-emitting forms of energy are growing in significance as part of our evolving electricity mix. In fact, wind and solar photovoltaic (PV) energy are the fastest-growing sources of electricity generation in Canada. In addition, technological advancements, such as co-generation, have resulted in an increase in energy-efficient practices and a reduction in greenhouse gas (GHG) emissions in areas such as the oil sands. Ongoing developments in areas such as grid-scale electricity storage, carbon capture and storage, and electric and alternative fuel vehicles have the potential to further transform the energy system.
For over ten years, the Energy Fact Book has provided a solid foundation for Canadians to understand and discuss important developments across the energy sector. A significant milestone in Canadian energy information will be marked this year, with the launch of the Canadian Center for Energy Information (CCEI). Housed at Statistics Canada, the CCEI will bring together Canada’s existing energy information in one place, facilitating access to products like the Energy Fact Book.

ENER
GY AN
D
THE EC
ONO
MY

2 Energy Fact Book Energy Fact Book 3
CANADA: A GLOBAL ENERGY LEADER
The amount of primary energy produced by Canada in 2018 is 32% more than in 2005. The world, on average, has increased energy production by 25% in the same period.
4 Saudi Arabia
1 China 18%
2 United States 15%
3 Russia 10%
5%
6 Canada 4%5 India 4%
WORLD TOTAL PRIMARY ENERGY PRODUCTION TOP ENERGY PRODUCERS, 2018 GLOBAL ENERGY RANKINGS FOR CANADA
Proved reserve/capacity
Production Exports
Crude oil 3 4 3
Uranium 3 2 4
Hydroelectricity 3 3 -
Electricity 8 6 3
Coal 16 13 7
Natural gas 17 4 6

Energy Fact Book 3
CANADIAN ENERGY PRODUCTION
Primary energy is energy that is found in nature before any processing or conversion. The Energy Fact Book calculates primary energy production by using two methods. The first method treats the energy embodied in uranium as primary energy, thereby capturing the uranium Canada produces and then exports. This method provides a more accurate picture of energy production in Canada.
The second method–also employed by the International Energy Agency (IEA), the Energy Information Administration (EIA) and others–treats domestic electricity production from nuclear energy as primary energy, but not uranium itself. Uranium is energy-dense, and Canada exports most of its uranium production, which explains why the two methods produce such different results.
4 Energy Fact Book Energy Fact Book 5
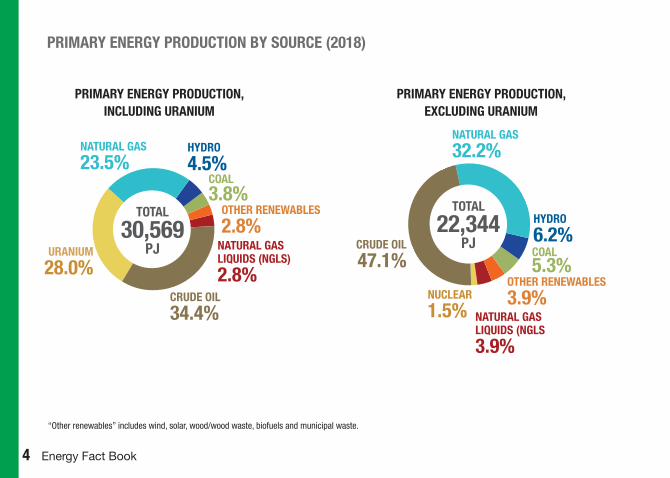
PRIMARY ENERGY PRODUCTION,INCLUDING URANIUM
NATURAL GAS
23.5%
URANIUM
28.0%
COAL3.8%
HYDRO
4.5%
OTHER RENEWABLES
2.8%NATURAL GAS LIQUIDS (NGLS)
2.8%CRUDE OIL
34.4%
PRIMARY ENERGY PRODUCTION, EXCLUDING URANIUM
CRUDE OIL
47.1%
NATURAL GAS
32.2%
COAL5.3%
HYDRO
6.2%
OTHER RENEWABLES
3.9%NATURAL GAS LIQUIDS (NGLS
3.9%
NUCLEAR
1.5%
“Other renewables” includes wind, solar, wood/wood waste, biofuels and municipal waste.
PRIMARY ENERGY PRODUCTION BY SOURCE (2018)
TOTAL
30,569PJ
TOTAL
22,344PJ
Energy Fact Book 5
0 1,000 2,000 3,000 4,000 5,000 6,000 7,000 8,000 9,000 10,000 11,000 12,000 13,000 14,000 15,000
Territories
Maritimes
N.L.
Que.
Ont.
Man.
Sask.
Alta.
B.C.
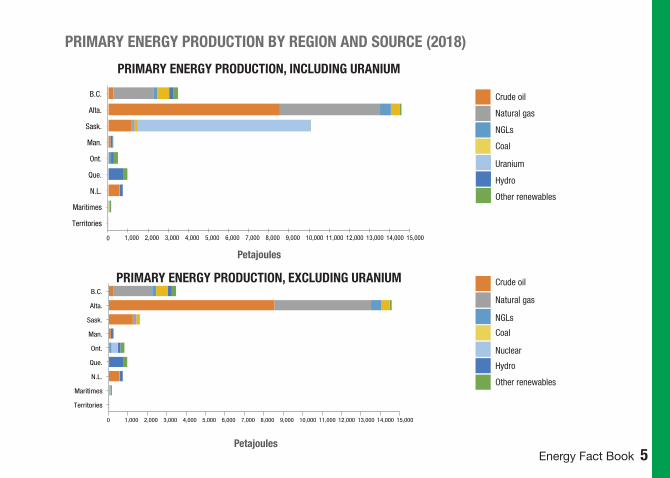
PRIMARY ENERGY PRODUCTION BY REGION AND SOURCE (2018)
Crude oil
Coal
Uranium
Natural gas
Hydro
Other renewables
NGLs
PRIMARY ENERGY PRODUCTION, INCLUDING URANIUM
Petajoules
Crude oil
Coal
Nuclear
Natural gas
Hydro
Other renewables
NGLs
Petajoules
0 1,000 2,000 3,000 4,000 5,000 6,000 7,000 8,000 9,000 10,000 11,000 12,000 13,000 14,000 15,000
Other renewables
Hydro
Uranium
Coal
NGLs
Natural gas
Crude oilTerritories
Maritimes
N.L.
Que.
Ont.
Man.
Sask.
Alta.
B.C.
PRIMARY ENERGY PRODUCTION, EXCLUDING URANIUM
6 Energy Fact Book Energy Fact Book 7
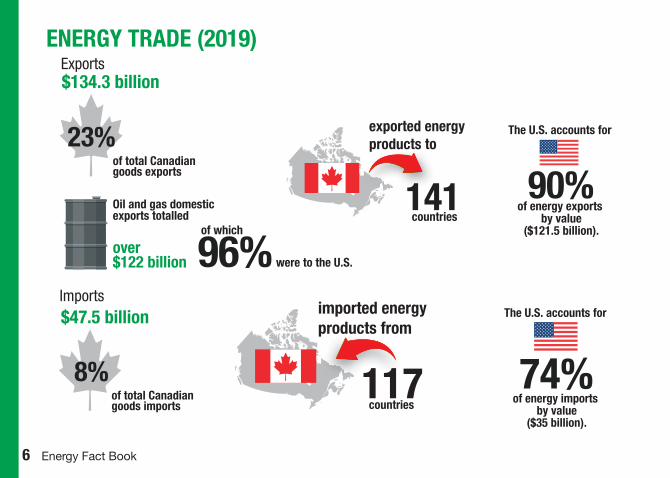
Exports$134.3 billion
23%of total Canadian goods exports
Oil and gas domestic exports totalled
over $122 billion 96%
of which
were to the U.S.
90%
exported energy products to
The U.S. accounts for
of energy exports by value
($121.5 billion).
141 countries
Imports$47.5 billion
8%of total Canadian goods imports
74%
imported energy products from
The U.S. accounts for
of energy imports by value
($35 billion).
117 countries
ENERGY TRADE (2019)
Energy Fact Book 7
Crude oil
Natural gas
Petroleum products
Electricity
Coal
Crude oil
Natural gas
Uranium
Petroleum products
Electricity
Coal
Crude oil
Natural gas
Uranium
Petroleum products
Electricity
Coal
Crude oil
Natural gas
Uranium
Petroleum products
Electricity
Coal
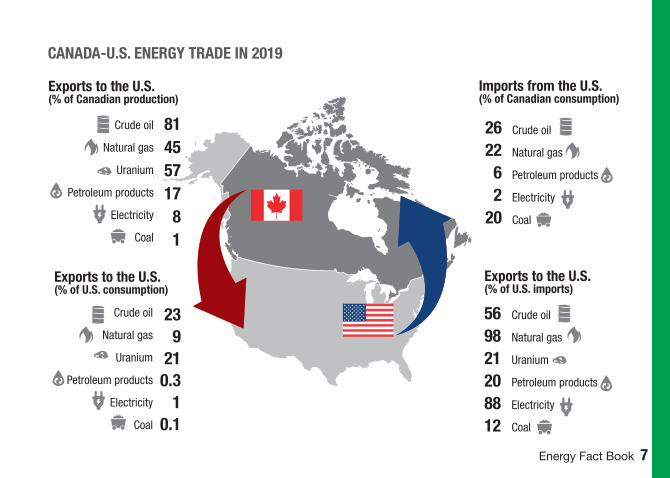
CANADA -U.S. ENERGY TRADE IN 2019
Exports to the U.S.(% of Canadian production)
Imports from the U.S.(% of Canadian consumption)
8145571781
262262
20
239
210.3
10.1
569821208812
Exports to the U.S.(% of U.S. consumption)
Exports to the U.S.(% of U.S. imports)
8 Energy Fact Book Energy Fact Book 9
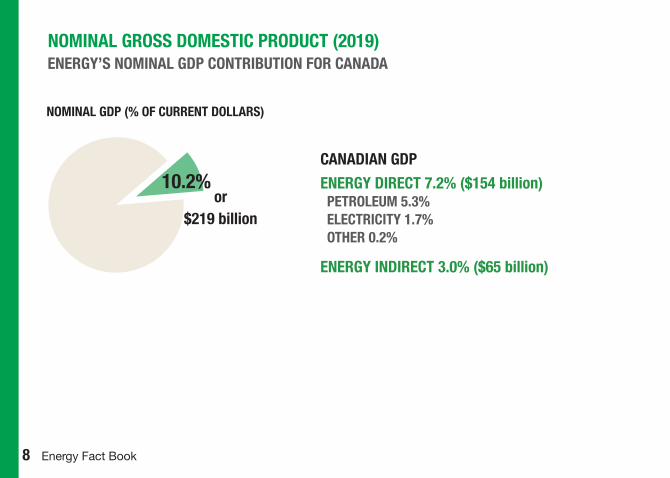
NOMINAL GROSS DOMESTIC PRODUCT (2019)ENERGY’S NOMINAL GDP CONTRIBUTION FOR CANADA
CANADIAN GDP
ENERGY DIRECT 7.2% ($154 billion)PETROLEUM 5.3% ELECTRICITY 1.7%OTHER 0.2%
ENERGY INDIRECT 3.0% ($65 billion)
10.2%or
$219 billion
NOMINAL GDP (% OF CURRENT DOLLARS)
Energy Fact Book 9
Y.T.
39
B.C.
15,030
N.W.T.
118
Alta.
76,001Sask.
13,415
Man.
3,857Ont.
19,951
Que.
15,381
N.B.
1,802
N.S.
872
P.E.I.
79
Nunavut
40N.L.
7,571
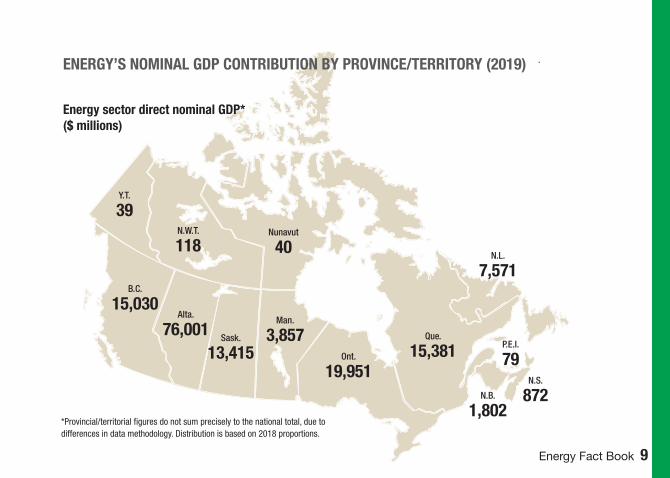
ENERGY’S NOMINAL GDP CONTRIBUTION BY PROVINCE/TERRITORY (2019)
Energy sector direct nominal GDP* ($ millions)
*Provincial/territorial figures do not sum precisely to the national total, due to differences in data methodology. Distribution is based on 2018 proportions.
10 Energy Fact Book Energy Fact Book 11
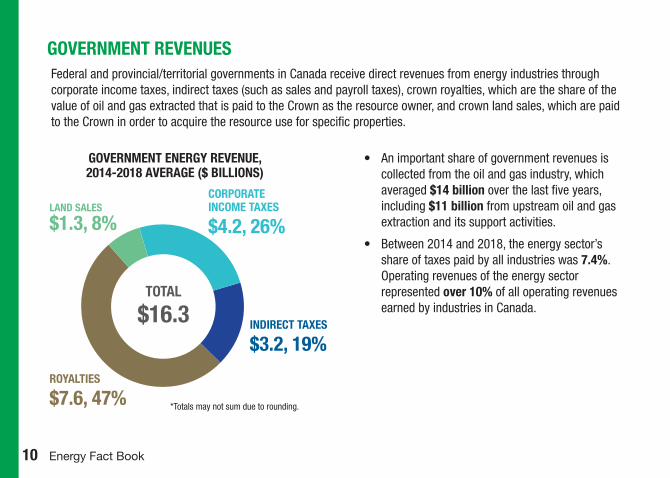
GOVERNMENT REVENUESFederal and provincial/territorial governments in Canada receive direct revenues from energy industries through corporate income taxes, indirect taxes (such as sales and payroll taxes), crown royalties, which are the share of the value of oil and gas extracted that is paid to the Crown as the resource owner, and crown land sales, which are paid to the Crown in order to acquire the resource use for specific properties.
GOVERNMENT ENERGY REVENUE, 2014-2018 AVERAGE ($ BILLIONS)
ROYALTIES
$7.6, 47%
LAND SALES
$1.3, 8%
CORPORATE INCOME TAXES
$4.2, 26%
INDIRECT TAXES
$3.2, 19%
• An important share of government revenues is collected from the oil and gas industry, which averaged $14 billion over the last five years, including $11 billion from upstream oil and gas extraction and its support activities.
• Between 2014 and 2018, the energy sector’s share of taxes paid by all industries was 7.4%. Operating revenues of the energy sector represented over 10% of all operating revenues earned by industries in Canada.
TOTAL
$16.3
*Totals may not sum due to rounding.

Energy Fact Book 11
TOTAL TAXES PAID BY ENERGY INDUSTRIES
0
2
4
6
8
10
12
14
2018201620142012201020082006Oil and gas extraction and support activities
Petroleum and coal product manufacturing Pipelines
Utilities
$ bi
llion

12 Energy Fact Book Energy Fact Book 13
Y.T.
105
B.C.
24,077
N.W.T.
254
Alta.
138,372Sask.
17,705
Man.
5,842
Ont.
51,941
Que.
30,014
N.L.
6,683
N.B.
3,932
N.S.
2,471
P.E.I.
210
Nunavut
187
EMPLOYMENT IN CANADA’S ENERGY SECTOR (2019)• About 14,350 Indigenous people living off-reserve are
directly employed in the energy sector.
TOTAL EMPLOYMENT
ENERGY DIRECT 1.5%PETROLEUM 0.9% ELECTRICITY 0.5%OTHER 0.1%
ENERGY INDIRECT 2.9%
4.4%
SHARE OF TOTAL EMPLOYMENT, 2019ENERGY SECTOR DIRECT EMPLOYMENTBY PROVINCE/TERRITORY*
*Provincial/territorial figures do not sum precisely to the national total due to rounding. Distribution is based on 2018 proportions.
DIRECT: 282,000 JOBS INDIRECT: 550,500 JOBS TOTAL: 832,500 JOBS

Energy Fact Book 13
PETROLEUM AND THE ECONOMY
EMPLOYMENT, 2019
DIRECT: 176,500 JOBSOIL AND GAS EXTRACTION: 73,000SUPPORT ACTIVITIES: 55,500EXPLORATION: 3,000NATURAL GAS TRANSMISSION AND DISTRIBUTION: 16,500CRUDE OIL PIPELINES: 4,000OTHER: 24,500
INDIRECT: 422,500 JOBS
Total Employment Energy Direct 1.5%Crude Oil 0.4% Electricity 0.4%
Energy Indirect 3.4%Construction 1.8%
NOMINAL GDP CONTRIBUTION FOR CANADA, 2019
NOMINAL GDP (% OF CURRENT DOLLARS)
TOTAL: 599,000 JOBS
7.8%or $167 billion
• Capital Expenditures (2019): $47 billion
• Canada’s oil and gas sector represents about 27% of the country’s GHG emissions.
• Exports (2019): $122 billion (1/5th of all exports)
Approximately 10,000 Indigenous people are employed in the oil and gas sector.
CANADIAN GDPPETROLEUM DIRECT 5.3% ($114 BILLION)
PETROLEUM INDIRECT 2.5% ($54 BILLION)
4TH Largest oil producer globally
Largest gas producer globally4TH

14 Energy Fact Book Energy Fact Book 15
INVESTMENTCAPITAL EXPENDITURES
Capital expenditures* in the energy industry, 2007-2019
*excludes residential expenditures and intellectual property investments such as exploration expenses
• Capital expenditures in Canada’s energy sector totalled $70 billion in 2019, 40% lower from a peak in 2014.
• Investment was stable from 2017-2019, with oil and gas extraction being the largest contributor at $33.3 billion in 2019, followed by electric power generation and transmission at $22.1 billion.
0
20
40
60
80
100
120
140
2019201820172016201520142013201220112010200920082007
$ bi
llion
Oil and gas extraction Other
Energy Fact Book 15
0
50
100
150
200
250
201820172016201520142013201220112010200920082007
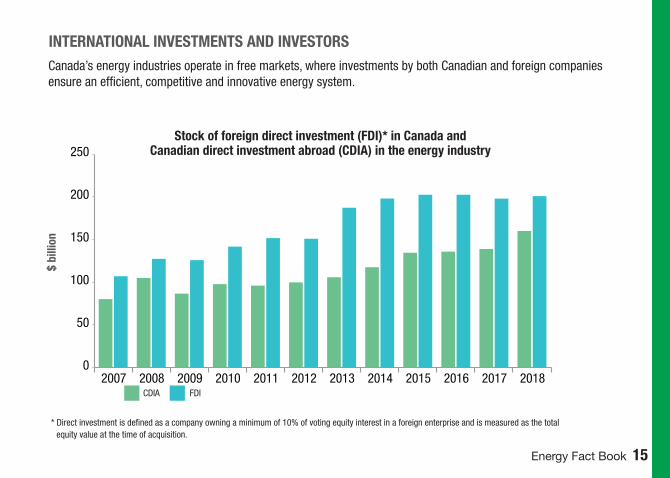
INTERNATIONAL INVESTMENTS AND INVESTORSCanada’s energy industries operate in free markets, where investments by both Canadian and foreign companies ensure an efficient, competitive and innovative energy system.
Stock of foreign direct investment (FDI)* in Canada and Canadian direct investment abroad (CDIA) in the energy industry
$ bi
llion
CDIA FDI
* Direct investment is defined as a company owning a minimum of 10% of voting equity interest in a foreign enterprise and is measured as the total equity value at the time of acquisition.

16 Energy Fact Book Energy Fact Book 17
STOCK OF FOREIGN DIRECT INVESTMENT IN CANADA AND CANADIAN DIRECT INVESTMENT ABROAD
• The stock of foreign direct investment (FDI) in the energy sector was up 1% in 2018, with increases reported in oil and gas extraction assets by Asia and Oceania and the United States.
• The energy industry’s share of overall FDI in Canada was 23% in 2018, down 1% from 2017.
• The stock of Canadian direct investment abroad (CDIA) was valued a record high $160 billion in 2018, up 15% from 2017.
• Investment in oil and gas extraction accounted for $85 billion of the CDIA stock in 2018.
FOREIGN CONTROL OF CANADIAN ASSETS
Foreign control is a measure of the extent to which foreign entities operate in Canada. Generally, a corporation is deemed to be foreign-controlled if more than 50% of its shares are owned by one or more foreign companies.
0%
10%
20%
30%
40%
50%
2017 2005 2006 2007 2008 2009 2010 2011 2012 2013 2014 2015 2016
FOREIGN CONTROL OF CANADIAN ASSETS
Perc
enta
ge c
ontr
olle
d
Oil and gas extraction and support activities
All non-financial industries
Utilities
Energy Fact Book 17
$3.3BAfrica
$12.2BAmericas (South and Central
America, Caribbean)
$195.7BU.S. and Mexico
$14.7BEurope
$3.9BAsia
$3.1BOceania
$452.2BCanada
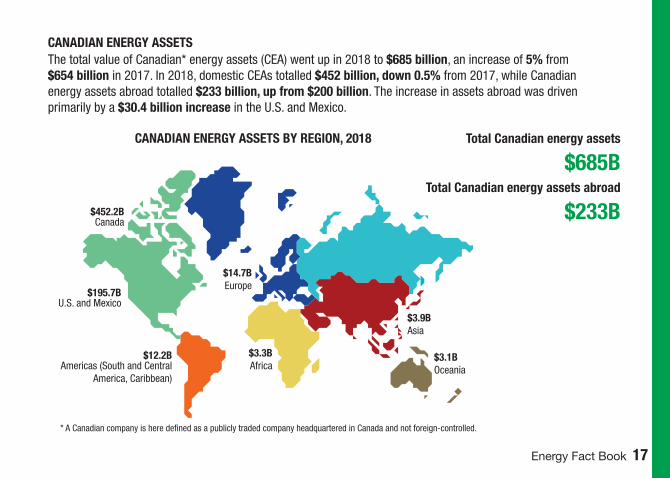
CANADIAN ENERGY ASSETSThe total value of Canadian* energy assets (CEA) went up in 2018 to $685 billion, an increase of 5% from $654 billion in 2017. In 2018, domestic CEAs totalled $452 billion, down 0.5% from 2017, while Canadian energy assets abroad totalled $233 billion, up from $200 billion. The increase in assets abroad was driven primarily by a $30.4 billion increase in the U.S. and Mexico.
* A Canadian company is here defined as a publicly traded company headquartered in Canada and not foreign-controlled.
CANADIAN ENERGY ASSETS BY REGION, 2018 Total Canadian energy assets
$685BTotal Canadian energy assets abroad
$233B

18 Energy Fact Book Energy Fact Book 19
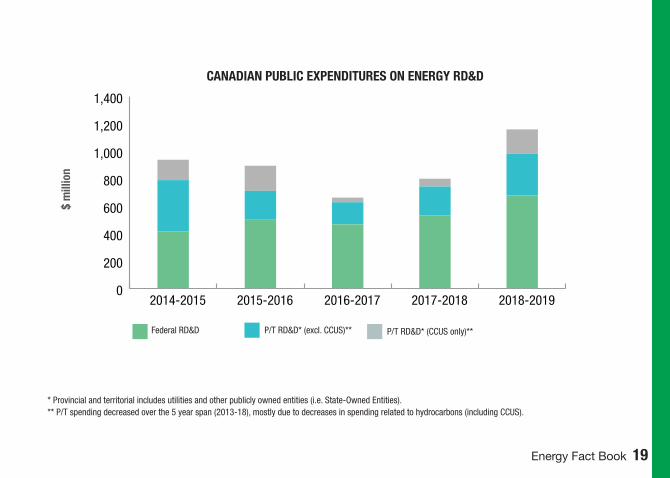
RESEARCH, DEVELOPMENT AND DEMONSTRATION
CANADIAN EXPENDITURES ON TOTAL ENERGY RD&DIn 2018-19, federal energy RD&D expenditures were $678M and provincial and territorial (P&T) government energy RD&D expenditures were $481M, for a combined total of $1,159M. This represents an increase of $360M from 2017-18.
In 2018-19, P&T spending increased by 81% ($215M increase), mostly driven by carbon capture, utilization and storage (CCUS) and other* related activities. CCUS, in particular, had a three fold increase in 2018-19 compared to 2017-18.
In 2018-19, federal spending increased by 27% ($145M increase), primarily driven by energy efficiency related activities. Energy efficiency increased to $289M in 2018-19, compared to $130M in 2017-18. Recent increases in federal spending align with Canada’s Mission Innovation objectives.
In 2015, all Mission Innovation members – including Canada – committed to double public investment in clean energy RD&D over five years. Canadian federal departments, agencies, and organizations are on track to double Canada’s annual clean energy RD&D investments from $387M in 2014-15 to $775M in 2019-20. Spending figures for the doubling commitment year, 2019-20 to be released in 2021.
The Canadian industry spent about $1.5B on energy R&D in 2017, a slight decrease from $1.6B in 2016.
Note: *Other is the sum of “Other power and storage technology” and “Other cross-cutting technology/research” categories.
Energy Fact Book 19
CANADIAN PUBLIC EXPENDITURES ON ENERGY RD&D
0
200
400
600
800
1,000
1,200
1,400
2018-20192017-20182016-20172015-20162014-2015
$ m
illio
n
Federal RD&D P/T RD&D* (excl. CCUS)** P/T RD&D* (CCUS only)**
* Provincial and territorial includes utilities and other publicly owned entities (i.e. State-Owned Entities). ** P/T spending decreased over the 5 year span (2013-18), mostly due to decreases in spending related to hydrocarbons (including CCUS).
20 Energy Fact Book Energy Fact Book 21
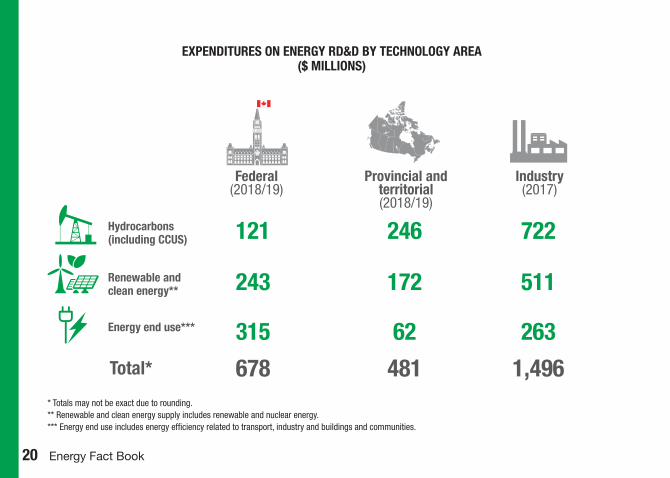
EXPENDITURES ON ENERGY RD&D BY TECHNOLOGY AREA ($ MILLIONS)
* Totals may not be exact due to rounding. ** Renewable and clean energy supply includes renewable and nuclear energy. *** Energy end use includes energy efficiency related to transport, industry and buildings and communities.
Federal (2018/19)
Provincial and territorial (2018/19)
Industry (2017)
Hydrocarbons (including CCUS)
Renewable and clean energy**
Energy end use***
Total*
121
243
315
678
246
172
62
481
722
511
263
1,496
Energy Fact Book 21
Energy sector Clean technology
Extraction, Transformation, Generation,Transmission, Distribution & Use of:
• Transportation
• Air, water
• Environmental
• Remediation
• Waste and recycling
• Water production, treatment, ef�ciency
• Agricultural practices and land use
• Advanced materials
Crude oil
Re�ned petroleum products
Natural gas
Coal
Uranium
Electricity
Renewable/non-emitting technologies • Solar • Wind • Hydro/wave/tidal • Geothermal • Biofuels/biomass • Nuclear • Carbon capture and storageTransmission • Smart grid • Energy storageEnergy ef�ciency technologies • Green buildings • Cogeneration
Clean energy technologies
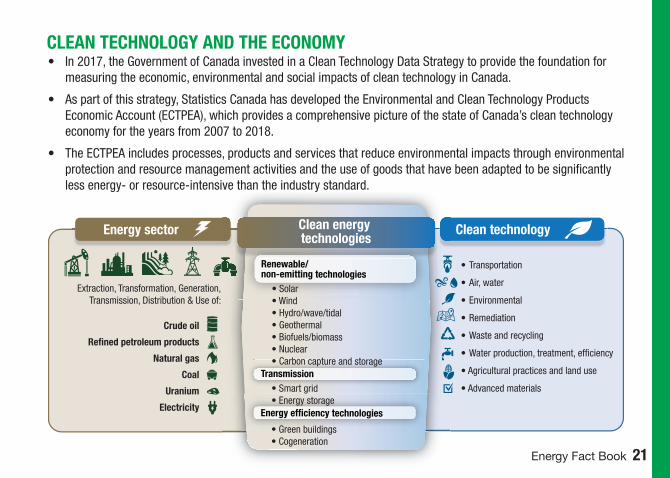
CLEAN TECHNOLOGY AND THE ECONOMY• In 2017, the Government of Canada invested in a Clean Technology Data Strategy to provide the foundation for
measuring the economic, environmental and social impacts of clean technology in Canada.
• As part of this strategy, Statistics Canada has developed the Environmental and Clean Technology Products Economic Account (ECTPEA), which provides a comprehensive picture of the state of Canada’s clean technology economy for the years from 2007 to 2018.
• The ECTPEA includes processes, products and services that reduce environmental impacts through environmental protection and resource management activities and the use of goods that have been adapted to be significantly less energy- or resource-intensive than the industry standard.
22 Energy Fact Book Energy Fact Book 23
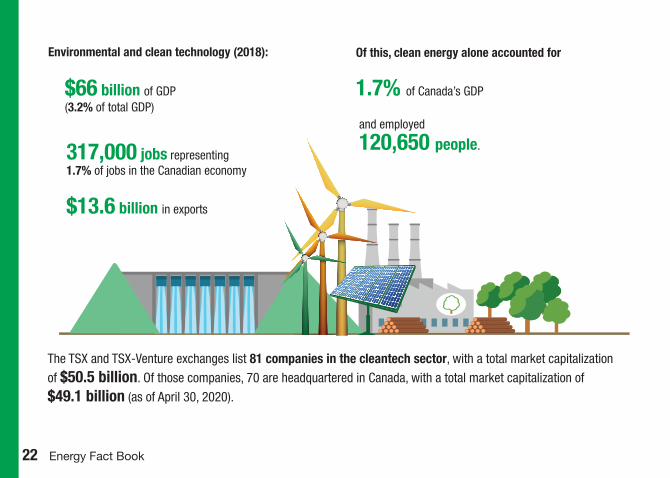
The TSX and TSX-Venture exchanges list 81 companies in the cleantech sector, with a total market capitalization
of $50.5 billion. Of those companies, 70 are headquartered in Canada, with a total market capitalization of
$49.1 billion (as of April 30, 2020).
Environmental and clean technology (2018): Of this, clean energy alone accounted for
$66 billion of GDP (3.2% of total GDP)
$13.6 billion in exports
317,000 jobs representing1.7% of jobs in the Canadian economy
and employed
120,650 people.
1.7% of Canada’s GDP
Energy Fact Book 23
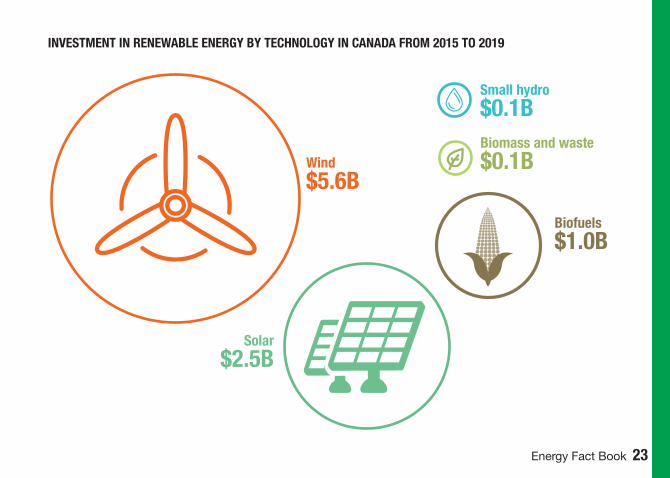
INVESTMENT IN RENEWABLE ENERGY BY TECHNOLOGY IN CANADA FROM 2015 TO 2019
Wind $5.6B
Small hydro $0.1B
Solar $2.5B
Biomass and waste $0.1B
Biofuels$1.0B
24 Energy Fact Book Energy Fact Book 25
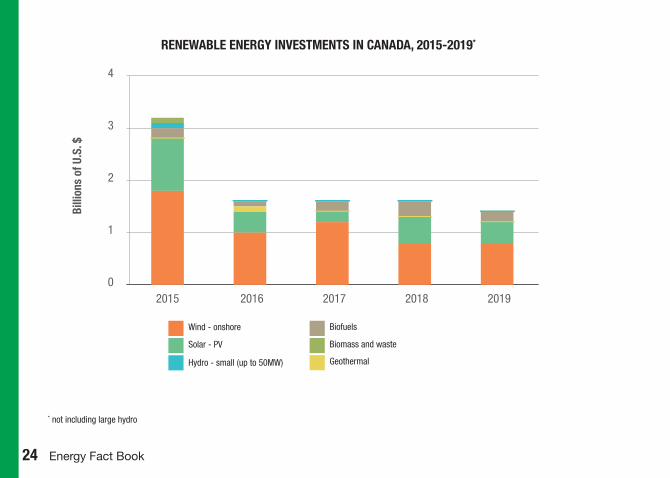
0
1
2
3
4
20192018201720162015
* not including large hydro
RENEWABLE ENERGY INVESTMENTS IN CANADA, 2015-2019*
Billi
ons
of U
.S. $
Wind - onshore
Solar - PV
Hydro - small (up to 50MW)
Biofuels
Biomass and waste
Geothermal
Energy Fact Book 25
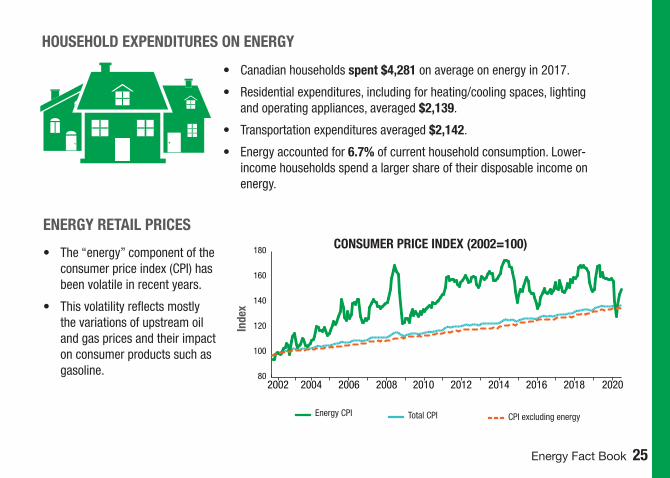
ENERGY RETAIL PRICES
HOUSEHOLD EXPENDITURES ON ENERGY
• Canadian households spent $4,281 on average on energy in 2017.
• Residential expenditures, including for heating/cooling spaces, lighting and operating appliances, averaged $2,139.
• Transportation expenditures averaged $2,142.
• Energy accounted for 6.7% of current household consumption. Lower-income households spend a larger share of their disposable income on energy.
• The “energy” component of the consumer price index (CPI) has been volatile in recent years.
• This volatility reflects mostly the variations of upstream oil and gas prices and their impact on consumer products such as gasoline. 80
100
120
140
160
180
20202018201620142012201020082006 20042002
CONSUMER PRICE INDEX (2002=100)
Energy CPI Total CPI CPI excluding energy
Inde
x

ENER
GY AN
D G
HG
S
28 Energy Fact Book Energy Fact Book 29
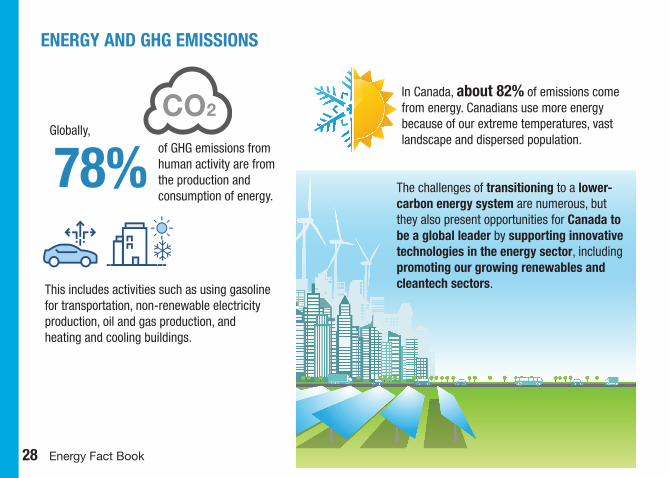
ENERGY AND GHG EMISSIONS
This includes activities such as using gasoline for transportation, non-renewable electricity production, oil and gas production, and heating and cooling buildings.
78%Globally,
In Canada, about 82% of emissions come from energy. Canadians use more energy because of our extreme temperatures, vast landscape and dispersed population.
The challenges of transitioning to a lower-carbon energy system are numerous, but they also present opportunities for Canada to be a global leader by supporting innovative technologies in the energy sector, including promoting our growing renewables and cleantech sectors.
of GHG emissions from human activity are from the production and consumption of energy.
Energy Fact Book 29
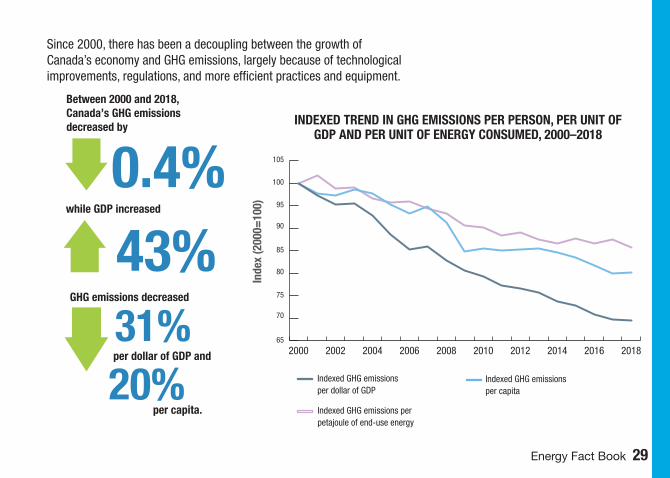
Between 2000 and 2018, Canada’s GHG emissions decreased by
0.4%
GHG emissions decreased
31%per dollar of GDP
per capita.20%
and
while GDP increased
43%
Since 2000, there has been a decoupling between the growth of Canada’s economy and GHG emissions, largely because of technological improvements, regulations, and more efficient practices and equipment.
65
70
75
80
85
90
95
100
105
2018201620142012201020082006200420022000
INDEXED TREND IN GHG EMISSIONS PER PERSON, PER UNIT OF GDP AND PER UNIT OF ENERGY CONSUMED, 2000–2018
Inde
x (2
000=
100)
Indexed GHG emissions per dollar of GDP
Indexed GHG emissions per petajoule of end-use energy
Indexed GHG emissions per capita
30 Energy Fact Book Energy Fact Book 31
0
100
200
300
400
500
600
700
800
2018201620142012201020082006200420022000
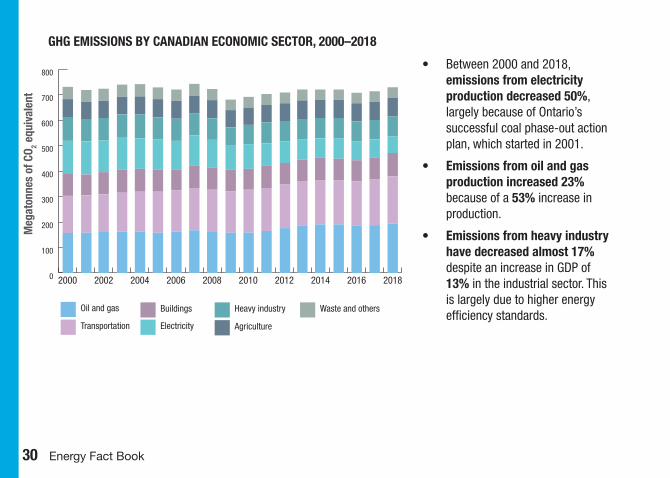
GHG EMISSIONS BY CANADIAN ECONOMIC SECTOR, 2000–2018M
egat
onne
s of
CO 2 e
quiv
alen
t
Oil and gas
Transportation
Buildings
Electricity
Heavy industry
Agriculture
Waste and others
• Between 2000 and 2018, emissions from electricity production decreased 50%, largely because of Ontario’s successful coal phase-out action plan, which started in 2001.
• Emissions from oil and gas production increased 23% because of a 53% increase in production.
• Emissions from heavy industry have decreased almost 17% despite an increase in GDP of 13% in the industrial sector. This is largely due to higher energy efficiency standards.
Energy Fact Book 31
0
50
100
150
200
2018201620142012201020082006200420022000
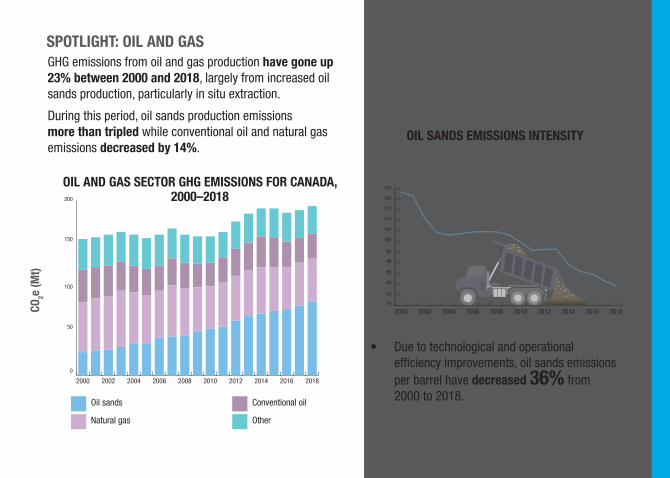
SPOTLIGHT: OIL AND GAS
OIL AND GAS SECTOR GHG EMISSIONS FOR CANADA, 2000–2018
GHG emissions from oil and gas production have gone up 23% between 2000 and 2018, largely from increased oil sands production, particularly in situ extraction.
During this period, oil sands production emissions more than tripled while conventional oil and natural gas emissions decreased by 14%.
CO2e
(Mt)
Oil sands
Natural gas
Conventional oil
Other
OIL SANDS EMISSIONS INTENSITY
70
75
80
85
90
95
100
105
110
115
120
125
2018201620142012201020082006200420022000
• Due to technological and operational efficiency improvements, oil sands emissions per barrel have decreased 36% from 2000 to 2018.
CO2e
(kg
per b
arre
l)
32 Energy Fact Book Energy Fact Book 33
0
20
40
60
80
100
120
140
2018201620142012201020082006200420022000
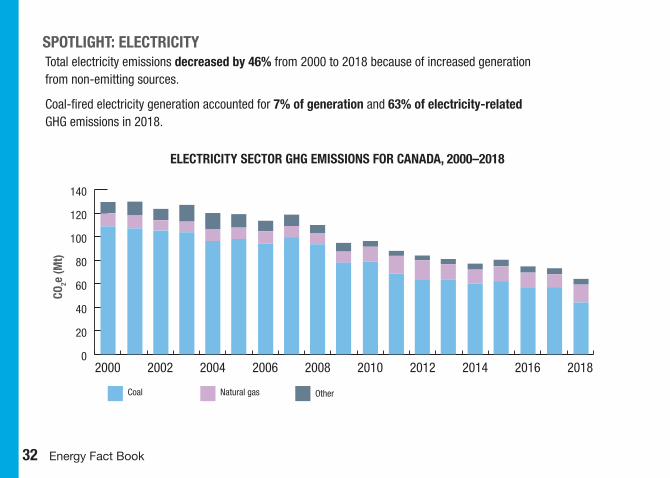
SPOTLIGHT: ELECTRICITY
ELECTRICITY SECTOR GHG EMISSIONS FOR CANADA, 2000–2018
Total electricity emissions decreased by 46% from 2000 to 2018 because of increased generation from non-emitting sources. Coal-fired electricity generation accounted for 7% of generation and 63% of electricity-related GHG emissions in 2018.
CO2e
(Mt)
Coal Natural gas Other
Energy Fact Book 33
1,552 2005
32,855 2018
17
3,796
2005
2018
1 552 2005
28 775 2017
17
3 573
2005
2017
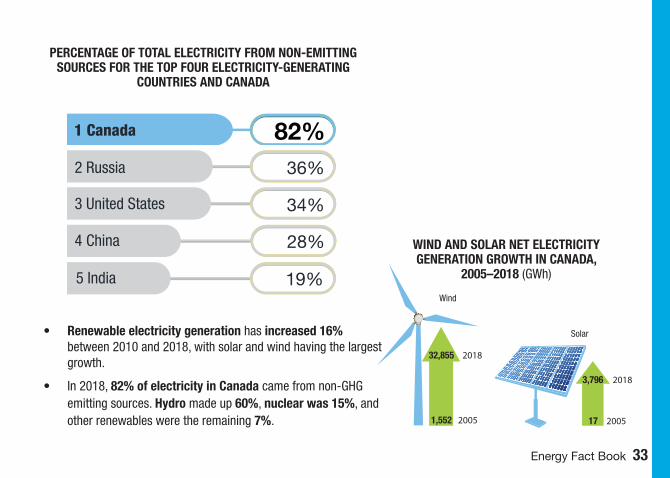
• Renewable electricity generation has increased 16% between 2010 and 2018, with solar and wind having the largest growth.
• In 2018, 82% of electricity in Canada came from non-GHG emitting sources. Hydro made up 60%, nuclear was 15%, and other renewables were the remaining 7%.
PERCENTAGE OF TOTAL ELECTRICITY FROM NON-EMITTING SOURCES FOR THE TOP FOUR ELECTRICITY-GENERATING
COUNTRIES AND CANADA
WIND AND SOLAR NET ELECTRICITY GENERATION GROWTH IN CANADA,
2005–2018 (GWh)
Wind
Solar
4 China
2 Russia 36%
3 United States 34%
28%
1 Canada 82%
5 India 19%
34 Energy Fact Book Energy Fact Book 35
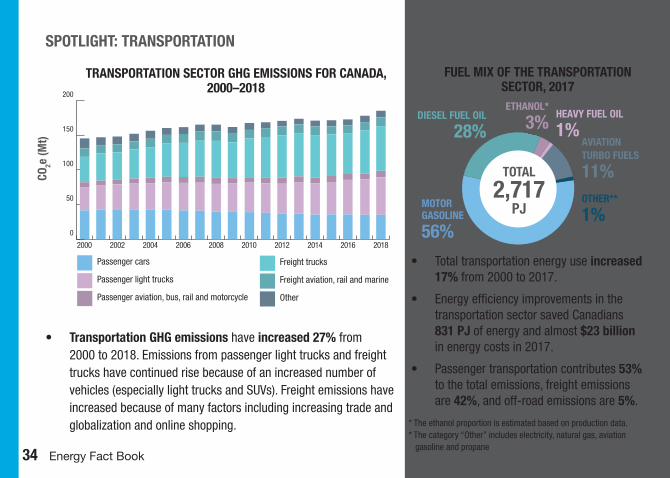
SPOTLIGHT: TRANSPORTATION
• Transportation GHG emissions have increased 27% from 2000 to 2018. Emissions from passenger light trucks and freight trucks have continued rise because of an increased number of vehicles (especially light trucks and SUVs). Freight emissions have increased because of many factors including increasing trade and globalization and online shopping.
0
50
100
150
200
2018201620142012201020082006200420022000
TRANSPORTATION SECTOR GHG EMISSIONS FOR CANADA, 2000–2018
CO2e
(Mt)
Passenger cars
Passenger light trucks
Passenger aviation, bus, rail and motorcycle
Freight trucks
Freight aviation, rail and marine
Other
FUEL MIX OF THE TRANSPORTATION SECTOR, 2017
MOTOR GASOLINE
56%
DIESEL FUEL OIL
28%AVIATION TURBO FUELS
11%
HEAVY FUEL OIL
1%ETHANOL*
3%
• Total transportation energy use increased 17% from 2000 to 2017.
• Energy efficiency improvements in the transportation sector saved Canadians 831 PJ of energy and almost $23 billion in energy costs in 2017.
• Passenger transportation contributes 53% to the total emissions, freight emissions are 42%, and off-road emissions are 5%.
TOTAL
2,717PJ
* The ethanol proportion is estimated based on production data.* The category “Other” includes electricity, natural gas, aviation gasoline and propane
OTHER**
1%
Energy Fact Book 35
FUEL MIX OF THE TRANSPORTATION SECTOR, 2017
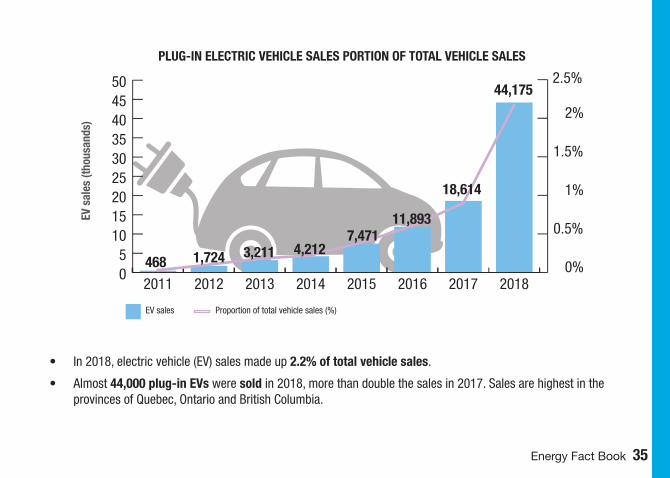
PLUG-IN ELECTRIC VEHICLE SALES PORTION OF TOTAL VEHICLE SALES
05
101520253035404550
201820172016201520142013201220110%
0.5%
1%
1.5%
2%
2.5%
• In 2018, electric vehicle (EV) sales made up 2.2% of total vehicle sales.
• Almost 44,000 plug-in EVs were sold in 2018, more than double the sales in 2017. Sales are highest in the provinces of Quebec, Ontario and British Columbia.
468 1,724 3,211 4,2127,471
11,893
44,175EV
sal
es (t
hous
ands
)
EV sales Proportion of total vehicle sales (%)
18,614
36 Energy Fact Book Energy Fact Book 37
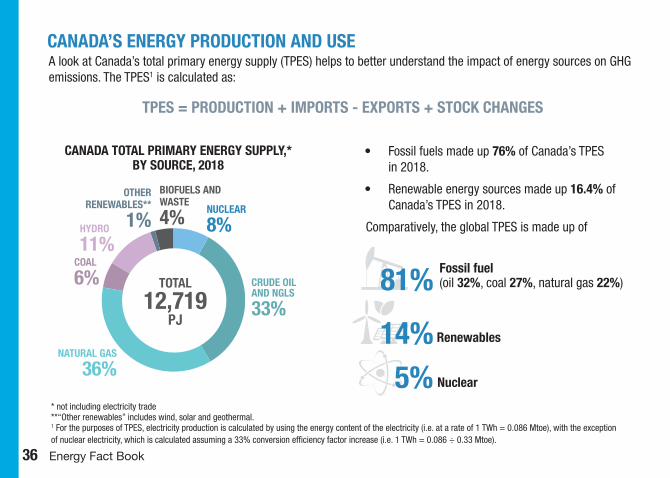
A look at Canada’s total primary energy supply (TPES) helps to better understand the impact of energy sources on GHG emissions. The TPES1 is calculated as:
TPES = PRODUCTION + IMPORTS - EXPORTS + STOCK CHANGES
• Fossil fuels made up 76% of Canada’s TPES in 2018.
• Renewable energy sources made up 16.4% of Canada’s TPES in 2018.
Comparatively, the global TPES is made up of
81% Fossil fuel (oil 32%, coal 27%, natural gas 22%)
5% 14% Renewables
Nuclear
CRUDE OIL AND NGLS 33%
NATURAL GAS
36%
NUCLEAR
8%HYDRO 11%
COAL
6%
OTHER RENEWABLES**
1%
CANADA TOTAL PRIMARY ENERGY SUPPLY,* BY SOURCE, 2018
* not including electricity trade**“Other renewables” includes wind, solar and geothermal.1 For the purposes of TPES, electricity production is calculated by using the energy content of the electricity (i.e. at a rate of 1 TWh = 0.086 Mtoe), with the exception of nuclear electricity, which is calculated assuming a 33% conversion efficiency factor increase (i.e. 1 TWh = 0.086 ÷ 0.33 Mtoe).
TOTAL
12,719PJ
CANADA’S ENERGY PRODUCTION AND USE
BIOFUELS AND WASTE
4%
Energy Fact Book 37
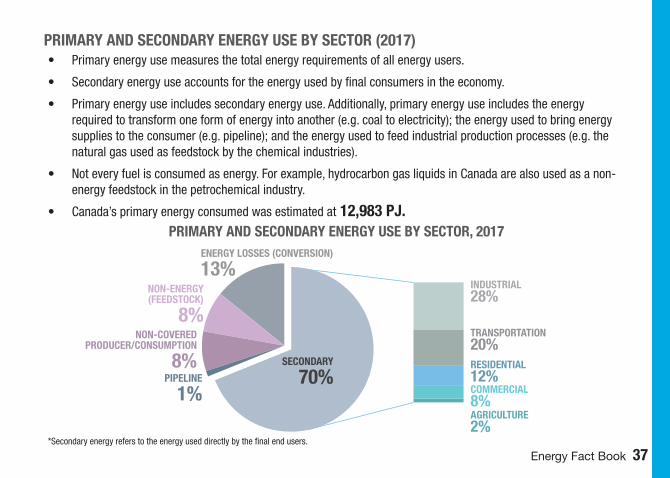
PRIMARY AND SECONDARY ENERGY USE BY SECTOR (2017)• Primary energy use measures the total energy requirements of all energy users.
• Secondary energy use accounts for the energy used by final consumers in the economy.
• Primary energy use includes secondary energy use. Additionally, primary energy use includes the energy required to transform one form of energy into another (e.g. coal to electricity); the energy used to bring energy supplies to the consumer (e.g. pipeline); and the energy used to feed industrial production processes (e.g. the natural gas used as feedstock by the chemical industries).
• Not every fuel is consumed as energy. For example, hydrocarbon gas liquids in Canada are also used as a non-energy feedstock in the petrochemical industry.
• Canada’s primary energy consumed was estimated at 12,983 PJ.PRIMARY AND SECONDARY ENERGY USE BY SECTOR, 2017
INDUSTRIAL 28%
NON-COVERED PRODUCER/CONSUMPTION
8%
ENERGY LOSSES (CONVERSION) 13%
NON-ENERGY (FEEDSTOCK)
8%
PIPELINE
1% COMMERCIAL8%
TRANSPORTATION 20%
SECONDARY
70%RESIDENTIAL 12%
AGRICULTURE2%
*Secondary energy refers to the energy used directly by the final end users.
38 Energy Fact Book Energy Fact Book 39
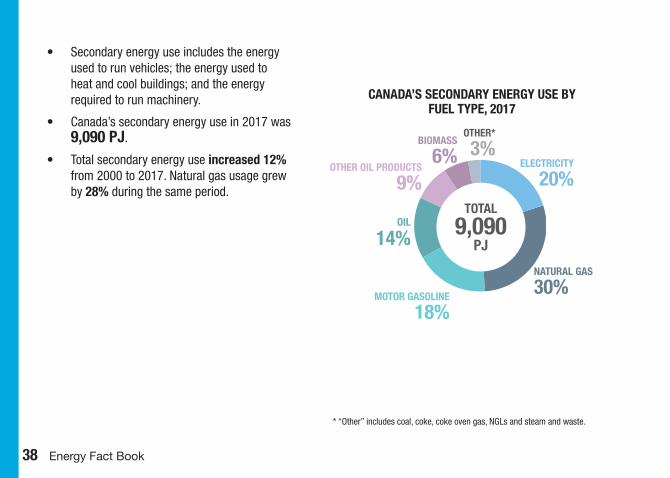
CANADA’S SECONDARY ENERGY USE BY FUEL TYPE, 2017
* “Other” includes coal, coke, coke oven gas, NGLs and steam and waste.
OIL 14%
OTHER OIL PRODUCTS 9%
ELECTRICITY
20%
NATURAL GAS
30%MOTOR GASOLINE
18%
OTHER*
3%BIOMASS
6%
• Secondary energy use includes the energy used to run vehicles; the energy used to heat and cool buildings; and the energy required to run machinery.
• Canada’s secondary energy use in 2017 was 9,090 PJ.
• Total secondary energy use increased 12% from 2000 to 2017. Natural gas usage grew by 28% during the same period.
TOTAL
9,090PJ
Energy Fact Book 39
* “Other” includes coal, coke, coke oven gas, NGLs and steam and waste.
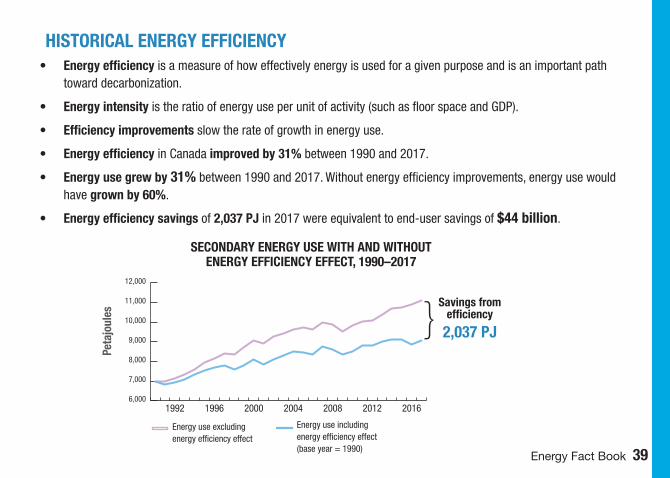
HISTORICAL ENERGY EFFICIENCY• Energy efficiency is a measure of how effectively energy is used for a given purpose and is an important path
toward decarbonization.
• Energy intensity is the ratio of energy use per unit of activity (such as floor space and GDP).
• Efficiency improvements slow the rate of growth in energy use.
• Energy efficiency in Canada improved by 31% between 1990 and 2017.
• Energy use grew by 31% between 1990 and 2017. Without energy efficiency improvements, energy use would have grown by 60%.
• Energy efficiency savings of 2,037 PJ in 2017 were equivalent to end-user savings of $44 billion.
SECONDARY ENERGY USE WITH AND WITHOUT ENERGY EFFICIENCY EFFECT, 1990–2017
6,000
7,000
8,000
9,000
10,000
11,000
12,000
2016201220082004200019961992
Energy use excluding energy efficiency effect
Energy use including energy efficiency effect (base year = 1990)
Peta
joul
es
Savings from efficiency
2,037 PJ}
40 Energy Fact Book Energy Fact Book 41
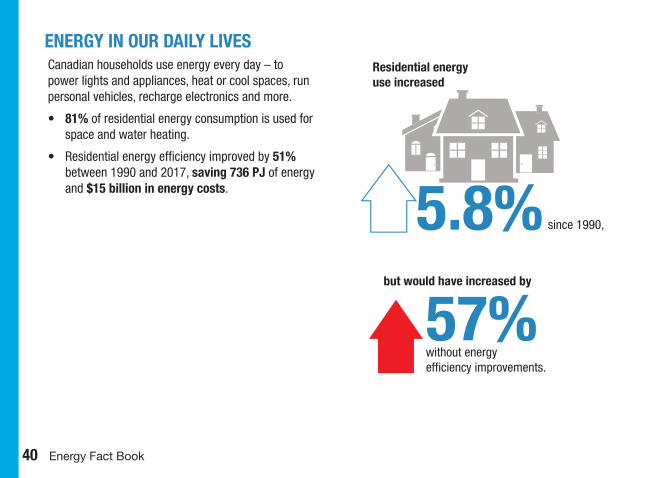
Canadian households use energy every day – to power lights and appliances, heat or cool spaces, run personal vehicles, recharge electronics and more.
• 81% of residential energy consumption is used for space and water heating.
• Residential energy efficiency improved by 51% between 1990 and 2017, saving 736 PJ of energy and $15 billion in energy costs.
without energy efficiency improvements.
Residential energy use increased
5.8% since 1990,
but would have increased by
57%
ENERGY IN OUR DAILY LIVES
Energy Fact Book 41
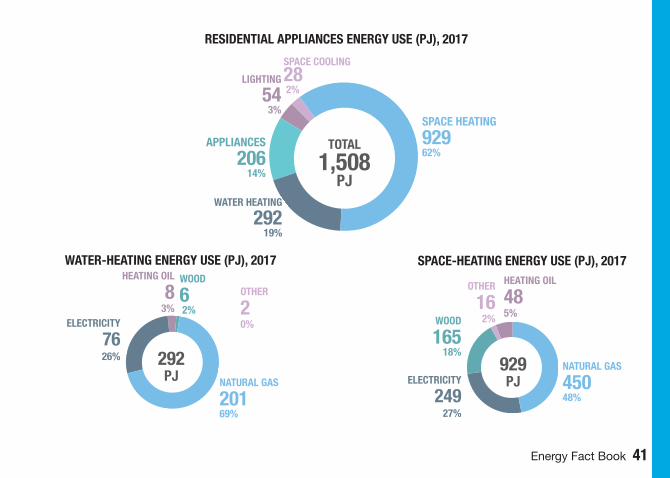
SPACE HEATING
929 62%
WATER HEATING
292 19%
APPLIANCES
206 14%
SPACE COOLING
28 2%
RESIDENTIAL APPLIANCES ENERGY USE (PJ), 2017
SPACE-HEATING ENERGY USE (PJ), 2017
NATURAL GAS
45048%
ELECTRICITY
24927%
HEATING OIL
485%
OTHER
162%WOOD
165 18%
WATER-HEATING ENERGY USE (PJ), 2017
NATURAL GAS
20169%
ELECTRICITY
7626%
HEATING OIL
83%
OTHER
20%
WOOD
6 2%
TOTAL
1,508PJ
929PJ
292PJ
LIGHTING
54 3%
42 Energy Fact Book Energy Fact Book 43
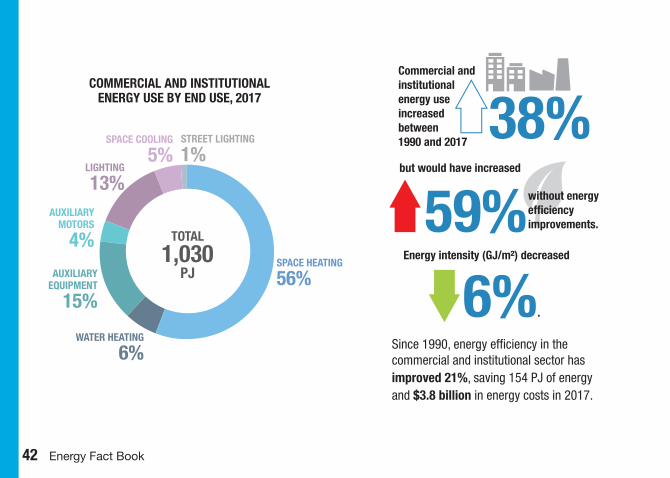
COMMERCIAL AND INSTITUTIONAL ENERGY USE BY END USE, 2017
Commercial and institutional energy use increased between 1990 and 2017
38%but would have increased
59%without energy ef�ciency improvements.
Energy intensity (GJ/m²) decreased
6%.
AUXILIARY EQUIPMENT
15%
AUXILIARY MOTORS
4%
STREET LIGHTING
1%
SPACE HEATING
56%
WATER HEATING
6%
SPACE COOLING
5%LIGHTING
13%
TOTAL
1,030PJ
Since 1990, energy efficiency in the commercial and institutional sector has improved 21%, saving 154 PJ of energy and $3.8 billion in energy costs in 2017.
Energy Fact Book 43
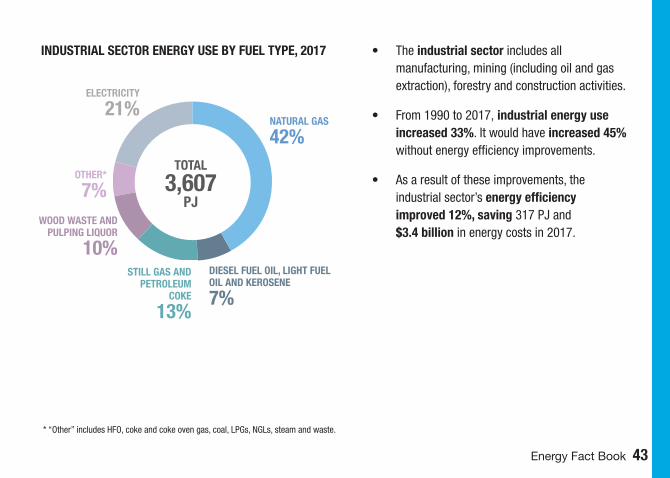
• The industrial sector includes all manufacturing, mining (including oil and gas extraction), forestry and construction activities.
• From 1990 to 2017, industrial energy use increased 33%. It would have increased 45% without energy efficiency improvements.
• As a result of these improvements, the industrial sector’s energy efficiency improved 12%, saving 317 PJ and $3.4 billion in energy costs in 2017.
INDUSTRIAL SECTOR ENERGY USE BY FUEL TYPE, 2017
STILL GAS AND PETROLEUM
COKE
13%
ELECTRICITY
21%NATURAL GAS
42%
DIESEL FUEL OIL, LIGHT FUEL OIL AND KEROSENE
7%
OTHER*
7%WOOD WASTE AND
PULPING LIQUOR
10%
TOTAL
3,607PJ
* “Other” includes HFO, coke and coke oven gas, coal, LPGs, NGLs, steam and waste.

44 Energy Fact Book Energy Fact Book 45
INDEXED TOTAL SECONDARY ENERGY USE INTENSITY PER CAPITAAND PER UNIT OF GDP, 2000–2017 (2000=100)
Per capita energy consumption was 8%
Canada used
20% less energy per dollar of GDP in 2017 than in 2000.
lower in 2017 than in 2000.
75
80
85
90
95
100
105
201720152013201120092007200520032001
Energy use intensity per unit of GDP
Energy use intensity per capita
Inde
x
Energy Fact Book 45
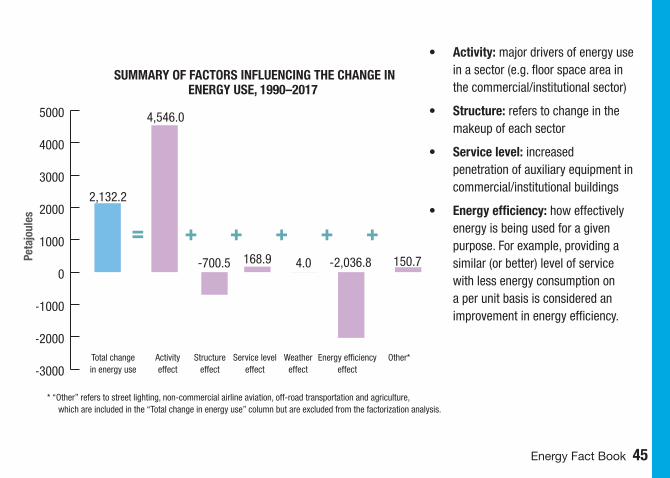
2,132.2
4,546.0
-700.5 168.9 4.0 -2,036.8 150.7
-3000
-2000
-1000
0
1000
2000
3000
4000
5000
= + ++++
• Activity: major drivers of energy use in a sector (e.g. floor space area in the commercial/institutional sector)
• Structure: refers to change in the makeup of each sector
• Service level: increased penetration of auxiliary equipment in commercial/institutional buildings
• Energy efficiency: how effectively energy is being used for a given purpose. For example, providing a similar (or better) level of service with less energy consumption on a per unit basis is considered an improvement in energy efficiency.
SUMMARY OF FACTORS INFLUENCING THE CHANGE IN ENERGY USE, 1990–2017
Total change in energy use
Activity effect
Weather effect
Energy efficiency effect
Service level effect
Other*Structure effect
* “Other” refers to street lighting, non-commercial airline aviation, off-road transportation and agriculture, which are included in the “Total change in energy use” column but are excluded from the factorization analysis.
Peta
joul
es
46 Energy Fact Book Energy Fact Book 47
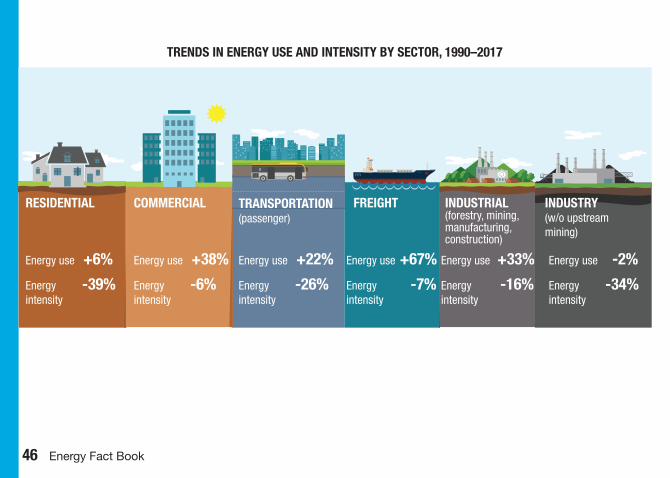
TRENDS IN ENERGY USE AND INTENSITY BY SECTOR, 1990–2017
RESIDENTIAL COMMERCIAL TRANSPORTATION (passenger)
FREIGHT INDUSTRIAL (forestry, mining, manufacturing, construction)
INDUSTRY (w/o upstream mining)
Energy use +6%
Energy -39% intensity
Energy use +38%
Energy -6% intensity
Energy use +22%
Energy -26% intensity
Energy use +67%
Energy -7% intensity
Energy use +33%
Energy -16% intensity
Energy use -2%
Energy -34% intensity

Energy Fact Book 47
CR
UD
E OIL
48 Energy Fact Book Energy Fact Book 49
6%
19%
12%
12%
5%
8%
15%
11%
8%
6%
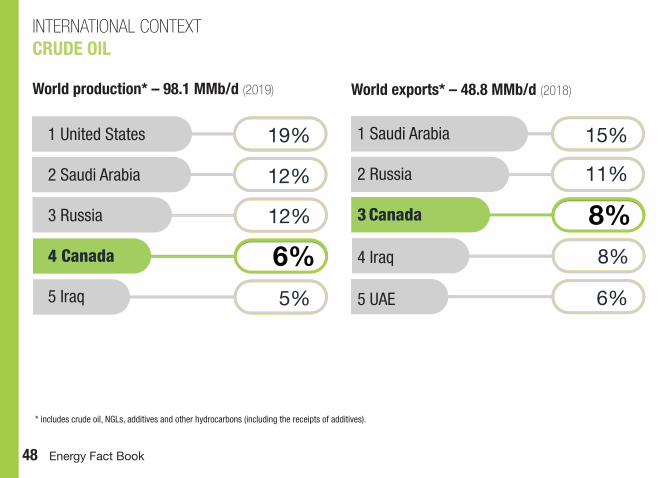
INTERNATIONAL CONTEXTCRUDE OIL
World production* – 98.1 MMb/d (2019) World exports* – 48.8 MMb/d (2018)
* includes crude oil, NGLs, additives and other hydrocarbons (including the receipts of additives).
1 United States
2 Saudi Arabia
3 Russia
4 Canada
5 Iraq
1 Saudi Arabia
2 Russia
3 Canada
4 Iraq
5 UAE
Energy Fact Book 49
Energy Fact Book 49
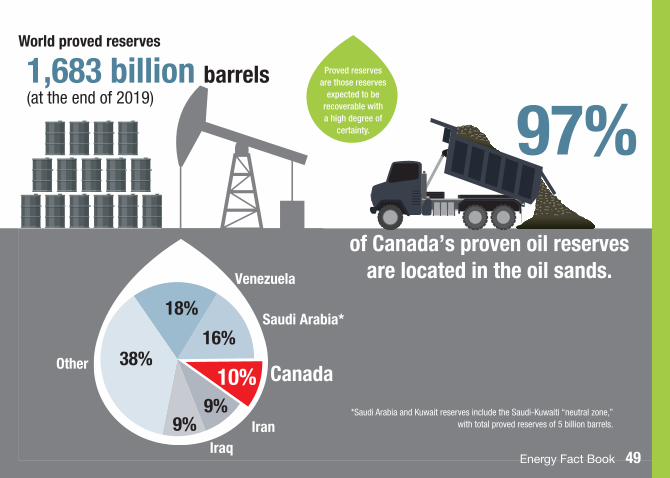
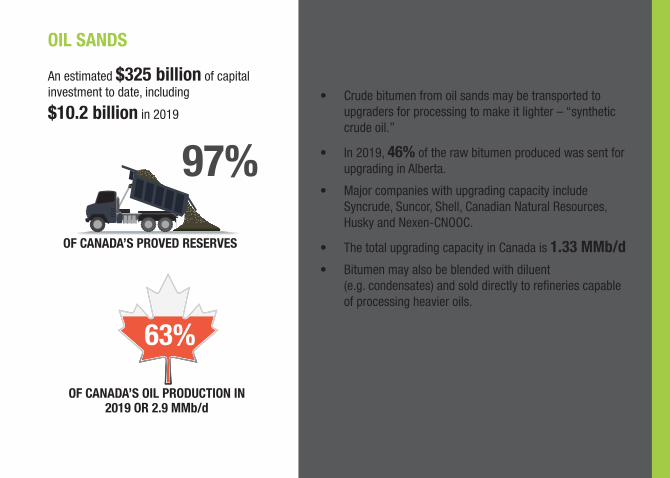
of Canada’s proven oil reserves are located in the oil sands.
97%1,683 billion barrels (at the end of 2019)
Venezuela
Saudi Arabia*
Canada
IranIraq
Other
9%9%
10%
16%
18%
38%
World proved reserves
*Saudi Arabia and Kuwait reserves include the Saudi-Kuwaiti “neutral zone,” with total proved reserves of 5 billion barrels.
Energy Fact Book 49
Proved reserves are those reserves
expected to be recoverable with a high degree of
certainty.

50 Energy Fact Book Energy Fact Book 51
CANADIAN RESOURCESREMAINING ESTABLISHED RESERVES* (billion barrels, as of December 2019)
* Reserves known to exist and are recoverable under current technological and economic conditions.
OIL WELLS COMPLETED AND AVERAGE METRES DRILLED IN WESTERN CANADA
Oil w
ell c
ount
s
Aver
age
met
res
drill
ed
Wells completed Average metres drilled
0
2,000
4,000
6,000
8,000
10,000
12,000
2019201820172016201520142013201220112010200920082007200620050
400
800
1,200
1,600
2,000
2,400
2,800
** Reserves also include proved reserves of pentanes plus (a crude-oil equivalent that is associated with oil production).
Canada total
167.7Oil sands
Conventional**
5.7
162
32.4 129.6mining in situ
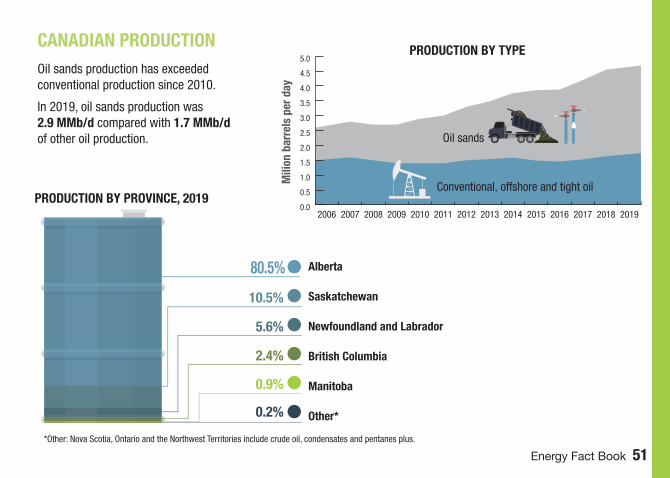
Energy Fact Book 51 *Other: Nova Scotia, Ontario and the Northwest Territories include crude oil, condensates and pentanes plus.
CANADIAN PRODUCTIONOil sands production has exceeded conventional production since 2010.
In 2019, oil sands production was 2.9 MMb/d compared with 1.7 MMb/d of other oil production.
Alberta
Saskatchewan
Newfoundland and Labrador
British Columbia
Manitoba
Other*
PRODUCTION BY TYPE
Mili
on b
arre
ls p
er d
ay
PRODUCTION BY PROVINCE, 2019
80.5%
0.2%
0.9%
2.4%
5.6%
10.5%
0.0
0.5
1.0
1.5
2.0
2.5
3.0
3.5
4.0
4.5
5.0
20192018201720162015201420132012201120102009200820072006
Oil sands
Conventional, offshore and tight oil
52 Energy Fact Book Energy Fact Book 53
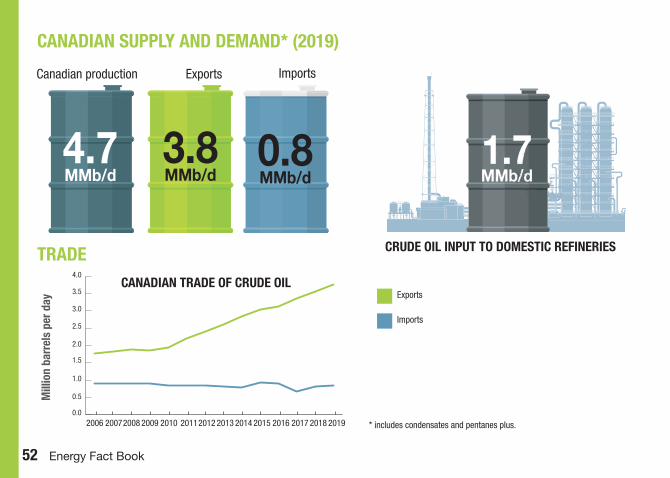
TRADECANADIAN TRADE OF CRUDE OIL
CANADIAN SUPPLY AND DEMAND* (2019)
Canadian production
CRUDE OIL INPUT TO DOMESTIC REFINERIES
Exports
Imports
* includes condensates and pentanes plus.
Mill
ion
barr
els
per d
ay
0.8MMb/d
3.8MMb/d
4.7MMb/d
1.7MMb/d
Exports Imports
0.0
0.5
1.0
1.5
2.0
2.5
3.0
3.5
4.0
20192018201720162015201420132012201120102009200820072006
Energy Fact Book 53
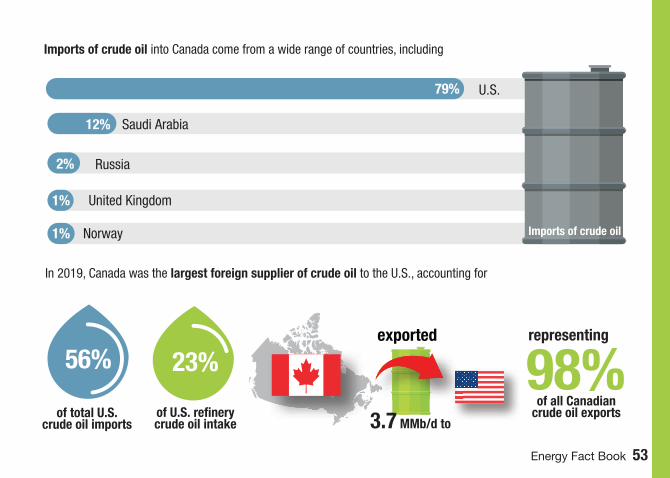
Imports of crude oil
79% U.S.
12% Saudi Arabia
United Kingdom
Russia
1% Norway
2%
98%of all Canadian
crude oil exportsof total U.S. crude oil imports
of U.S. re�nery crude oil intake
56% 23%exported
3.7 MMb/d to
1%
Imports of crude oil into Canada come from a wide range of countries, including
In 2019, Canada was the largest foreign supplier of crude oil to the U.S., accounting for
representing
54 Energy Fact Book Energy Fact Book 55
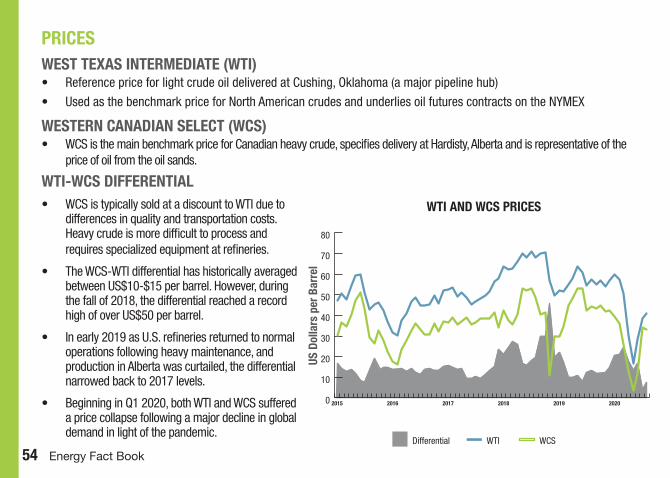
PRICESWEST TEXAS INTERMEDIATE (WTI)• Reference price for light crude oil delivered at Cushing, Oklahoma (a major pipeline hub)
• Used as the benchmark price for North American crudes and underlies oil futures contracts on the NYMEX
WESTERN CANADIAN SELECT (WCS)• WCS is the main benchmark price for Canadian heavy crude, specifies delivery at Hardisty, Alberta and is representative of the
price of oil from the oil sands.
Differential WCS
WTI-WCS DIFFERENTIAL• WCS is typically sold at a discount to WTI due to
differences in quality and transportation costs. Heavy crude is more difficult to process and requires specialized equipment at refineries.
• The WCS-WTI differential has historically averaged between US$10-$15 per barrel. However, during the fall of 2018, the differential reached a record high of over US$50 per barrel.
• In early 2019 as U.S. refineries returned to normal operations following heavy maintenance, and production in Alberta was curtailed, the differential narrowed back to 2017 levels.
• Beginning in Q1 2020, both WTI and WCS suffered a price collapse following a major decline in global demand in light of the pandemic.
WTI
WTI AND WCS PRICES
US D
olla
rs p
er B
arre
l
0
10
20
30
40
50
60
70
80
202020192018201720162015
Energy Fact Book 55
OIL SANDS
An estimated $325 billion of capital investment to date, including
$10.2 billion in 2019
BITUMEN UPGRADING
• Crude bitumen from oil sands may be transported to upgraders for processing to make it lighter – “synthetic crude oil.”
• In 2019, 46% of the raw bitumen produced was sent for upgrading in Alberta.
• Major companies with upgrading capacity include Syncrude, Suncor, Shell, Canadian Natural Resources, Husky and Nexen-CNOOC.
• The total upgrading capacity in Canada is 1.33 MMb/d • Bitumen may also be blended with diluent
(e.g. condensates) and sold directly to refineries capable of processing heavier oils.
OF CANADA’S PROVED RESERVES
OF CANADA’S OIL PRODUCTION IN 2019 OR 2.9 MMb/d
63%
97%
56 Energy Fact Book Energy Fact Book 57
Steam injection
Oil
formations deeper than 75 m
formation of75 m or less
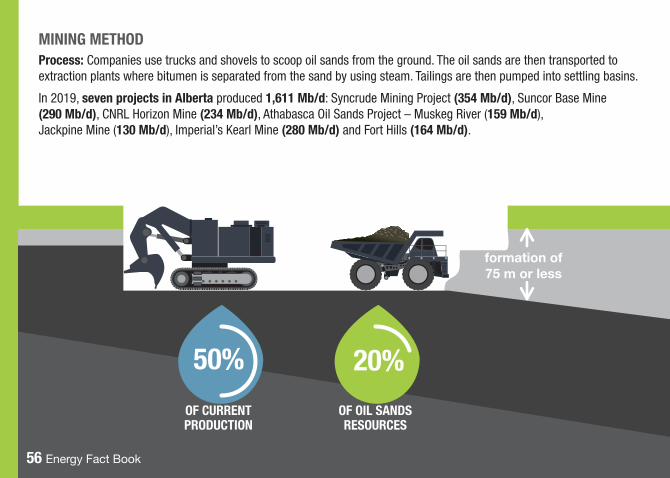
MINING METHODProcess: Companies use trucks and shovels to scoop oil sands from the ground. The oil sands are then transported to extraction plants where bitumen is separated from the sand by using steam. Tailings are then pumped into settling basins.
In 2019, seven projects in Alberta produced 1,611 Mb/d: Syncrude Mining Project (354 Mb/d), Suncor Base Mine (290 Mb/d), CNRL Horizon Mine (234 Mb/d), Athabasca Oil Sands Project – Muskeg River (159 Mb/d), Jackpine Mine (130 Mb/d), Imperial’s Kearl Mine (280 Mb/d) and Fort Hills (164 Mb/d).
OF CURRENT PRODUCTION
OF OIL SANDS RESOURCES
56 Energy Fact Book
50% 20%
Energy Fact Book 57
Steam injection
Oil
formations deeper than 75 m
formation of75 m or less
56 Energy Fact Book
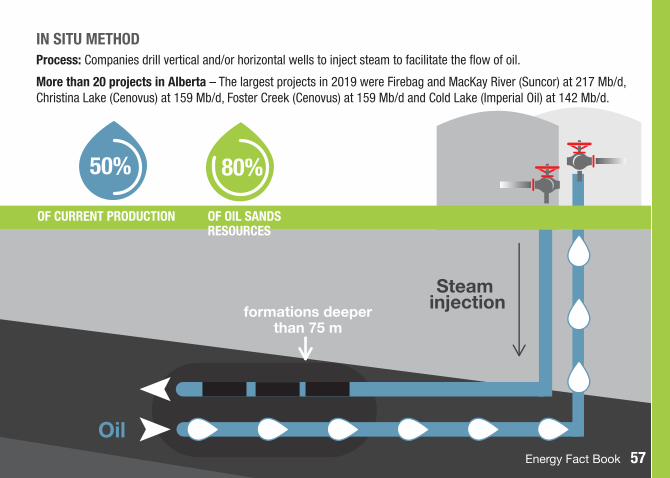
IN SITU METHODProcess: Companies drill vertical and/or horizontal wells to inject steam to facilitate the flow of oil.
More than 20 projects in Alberta – The largest projects in 2019 were Firebag and MacKay River (Suncor) at 217 Mb/d, Christina Lake (Cenovus) at 159 Mb/d, Foster Creek (Cenovus) at 159 Mb/d and Cold Lake (Imperial Oil) at 142 Mb/d.
OF CURRENT PRODUCTION OF OIL SANDS RESOURCES
Energy Fact Book 57
50% 80%
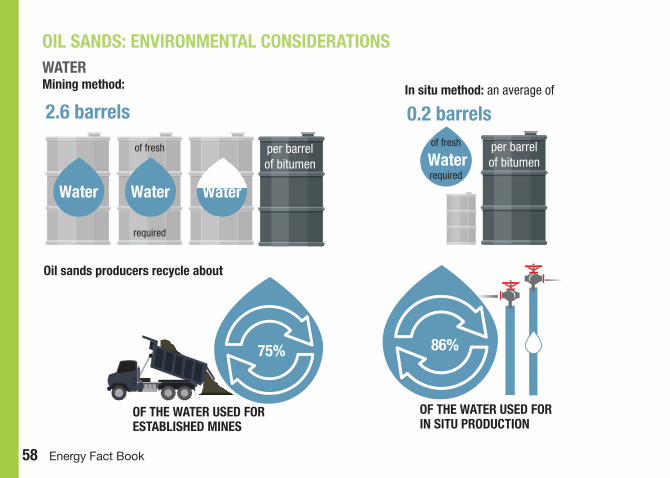
58 Energy Fact Book Energy Fact Book 59
OIL SANDS: ENVIRONMENTAL CONSIDERATIONSWATERMining method:
2.6 barrels
per barrel of bitumen
In situ method: an average of
Water
0.2 barrels
per barrel of bitumen
of fresh
required
Oil sands producers recycle about
OF THE WATER USED FOR ESTABLISHED MINES
OF THE WATER USED FOR IN SITU PRODUCTION
Water WaterWater
75% 86%
of fresh
required
Energy Fact Book 59
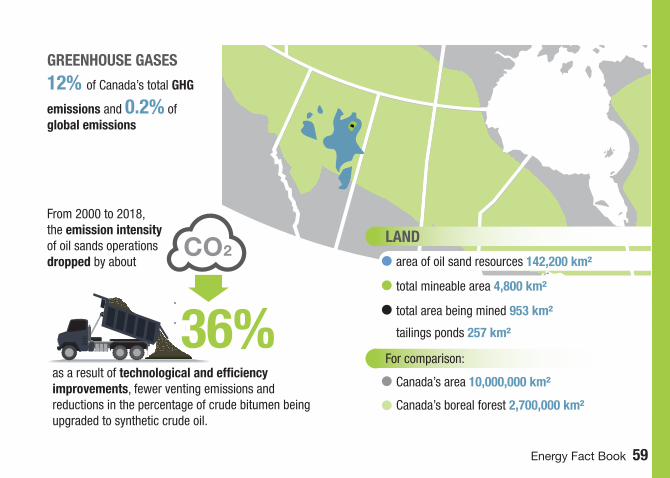
LAND
area of oil sand resources 142,200 km²
total mineable area 4,800 km²
total area being mined 953 km²
tailings ponds 257 km²
For comparison:
Canada’s area 10,000,000 km²
Canada’s boreal forest 2,700,000 km²
GREENHOUSE GASES
12% of Canada’s total GHG
emissions and 0.2% of global emissions
From 2000 to 2018, the emission intensity of oil sands operations dropped by about
as a result of technological and efficiency improvements, fewer venting emissions and reductions in the percentage of crude bitumen being upgraded to synthetic crude oil.
36%
60 Energy Fact Book Energy Fact Book 61
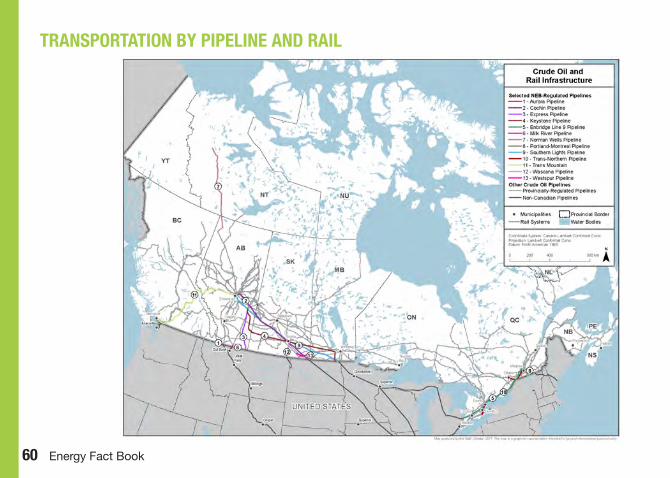
TRANSPORTATION BY PIPELINE AND RAIL
Energy Fact Book 61
2012 2013 2014 2015 20160
50,000
100,000
150,000
200,000
250,000
300,000
350,000
400,000
Q2Q1Q4Q3Q2Q1Q4Q3Q2Q1Q4Q3Q2Q1Q4Q3Q2Q1Q4Q3Q2Q1Q4Q3Q2Q1Q4Q3Q2Q1Q4Q3Q2Q120192017 2018 2020
Barr
els
per d
ay
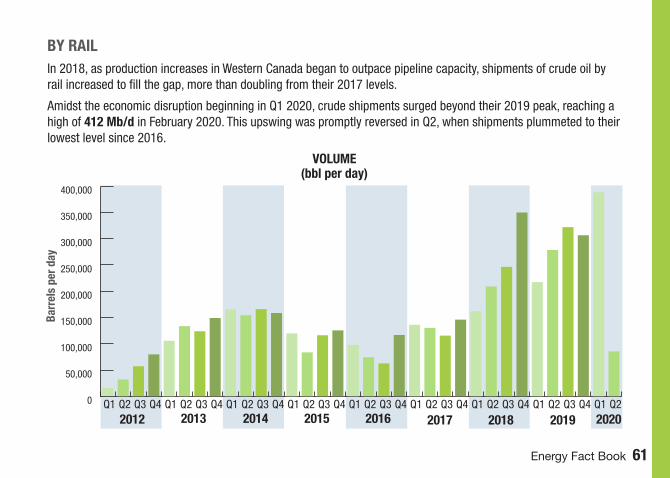
VOLUME (bbl per day)
BY RAILIn 2018, as production increases in Western Canada began to outpace pipeline capacity, shipments of crude oil by rail increased to fill the gap, more than doubling from their 2017 levels.
Amidst the economic disruption beginning in Q1 2020, crude shipments surged beyond their 2019 peak, reaching a high of 412 Mb/d in February 2020. This upswing was promptly reversed in Q2, when shipments plummeted to their lowest level since 2016.


PETR
OLEU
M
PR
OD
UCTS
64 Energy Fact Book Energy Fact Book 65
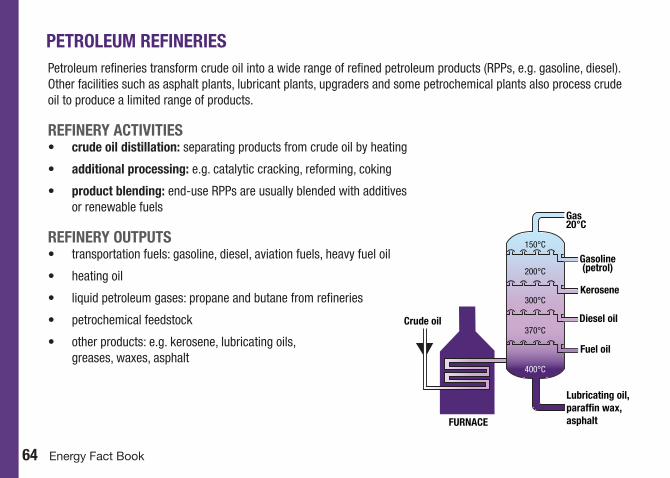
PETROLEUM REFINERIES
FURNACE
Crude oil
Lubricating oil,paraf�n wax,asphalt
Fuel oil
Diesel oil
Kerosene
Gasoline(petrol)
Gas20°C
150°C
200°C
300°C
370°C
400°C
Petroleum refineries transform crude oil into a wide range of refined petroleum products (RPPs, e.g. gasoline, diesel). Other facilities such as asphalt plants, lubricant plants, upgraders and some petrochemical plants also process crude oil to produce a limited range of products.
REFINERY ACTIVITIES• crude oil distillation: separating products from crude oil by heating
• additional processing: e.g. catalytic cracking, reforming, coking
• product blending: end-use RPPs are usually blended with additives or renewable fuels
REFINERY OUTPUTS• transportation fuels: gasoline, diesel, aviation fuels, heavy fuel oil
• heating oil
• liquid petroleum gases: propane and butane from refineries
• petrochemical feedstock
• other products: e.g. kerosene, lubricating oils, greases, waxes, asphalt
Energy Fact Book 65
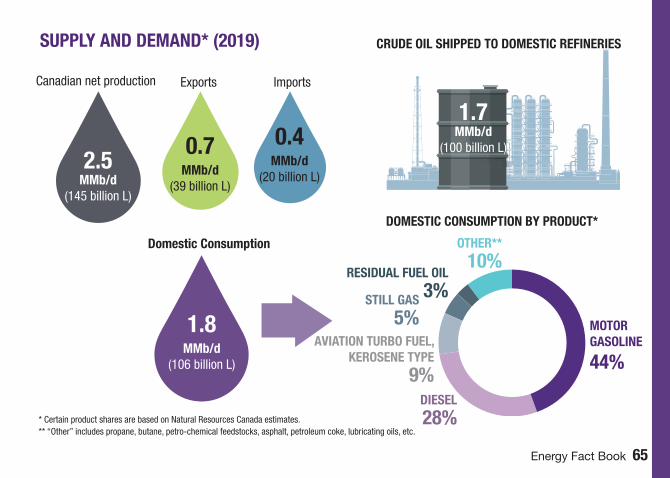
SUPPLY AND DEMAND* (2019)
Exports Imports
0.7MMb/d
(39 billion L)
0.4MMb/d
(20 billion L)2.5
MMb/d (145 billion L)
Canadian net production
Domestic Consumption
1.8 MMb/d
(106 billion L)
DOMESTIC CONSUMPTION BY PRODUCT*
* Certain product shares are based on Natural Resources Canada estimates.** “Other” includes propane, butane, petro-chemical feedstocks, asphalt, petroleum coke, lubricating oils, etc.
MOTOR GASOLINE
44%
DIESEL
28%
AVIATION TURBO FUEL, KEROSENE TYPE
9%
STILL GAS
5%
RESIDUAL FUEL OIL
3%
OTHER**
10%
1.7 MMb/d
(100 billion L)
CRUDE OIL SHIPPED TO DOMESTIC REFINERIES
66 Energy Fact Book Energy Fact Book 67
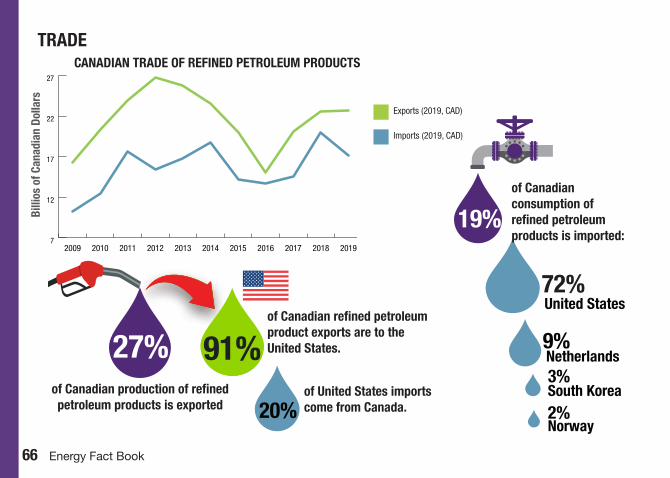
TRADE
91%27%
72%
9%
3%
2%
United States
Netherlands
South Korea
Norway
19%
20%
91%27%
72%
9%
3%
2%
United States
Netherlands
South Korea
Norway
19%
20%
of Canadian production of refined petroleum products is exported
7
12
17
22
27
20192018201720162015201420132012201120102009
CANADIAN TRADE OF REFINED PETROLEUM PRODUCTS
Billi
os o
f Can
adia
n Do
llars
Exports (2019, CAD)
Imports (2019, CAD)
of Canadian refined petroleum product exports are to the United States.
of United States imports come from Canada.
of Canadian consumption of refined petroleum products is imported:
Energy Fact Book 67
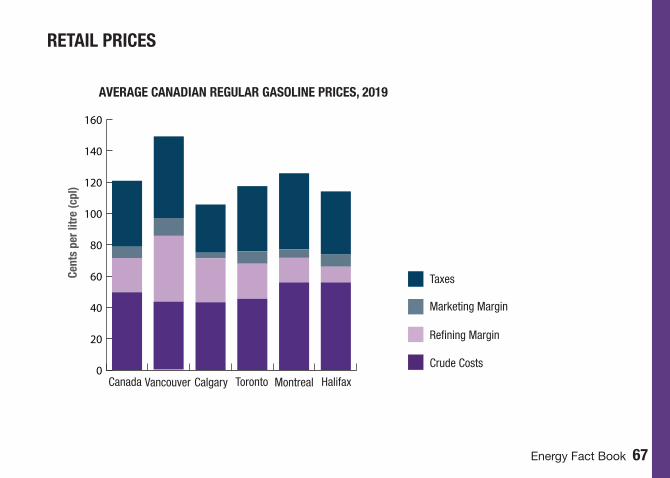
RETAIL PRICES
0
20
40
60
80
100
120
140
160
AVERAGE CANADIAN REGULAR GASOLINE PRICES, 2019
Cent
s pe
r litr
e (c
pl)
Vancouver Calgary
Marketing Margin
Taxes
Refining Margin
Crude Costs
HalifaxMontrealTorontoCanada
68 Energy Fact Book Energy Fact Book 69
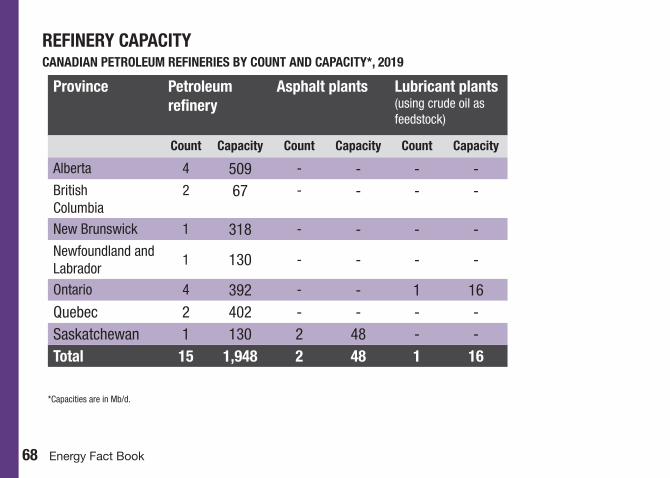
Province Petroleum refinery
Asphalt plants Lubricant plants (using crude oil as feedstock)
Count Capacity Count Capacity Count Capacity
Alberta 4 509 - - - -British Columbia
2 67 - - - -
New Brunswick 1 318 - - - -Newfoundland and Labrador
1 130 - - - -
Ontario 4 392 - - 1 16Quebec 2 402 - - - -Saskatchewan 1 130 2 48 - -Total 15 1,948 2 48 1 16
REFINERY CAPACITYCANADIAN PETROLEUM REFINERIES BY COUNT AND CAPACITY*, 2019
*Capacities are in Mb/d.
Energy Fact Book 69
HYD
RO
CAR
BO
N
GAS LIQ
UID
S
70 Energy Fact Book Energy Fact Book 71
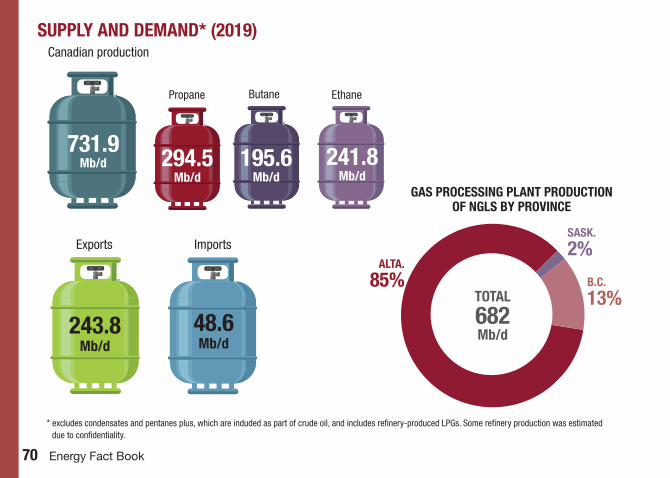
SUPPLY AND DEMAND* (2019)Canadian production
Exports Imports
Propane Butane Ethane
731.9 Mb/d 294.5
Mb/d195.6
Mb/d241.8
Mb/d
243.8Mb/d
48.6Mb/d
* excludes condensates and pentanes plus, which are induded as part of crude oil, and includes refinery-produced LPGs. Some refinery production was estimated due to confidentiality.
SASK.
2%ALTA.
85% B.C. 13%
GAS PROCESSING PLANT PRODUCTION OF NGLS BY PROVINCE
TOTAL
682Mb/d

Energy Fact Book 71
NATURAL GAS LIQUIDS ENERGY USE
TOTAL NATURAL GAS LIQUIDS ENERGY USEWAS 142.7 PJ IN 2017.
*secondary energy use
Sector Energy use* (PJ) % of the total
Residential 17.6 12.3%
Commercial 40.4 28.3%
Industrial 62.0 43.5%
Transportation 12.2 8.6%
Agriculture 10.5 7.3%
Total 142.7 100%
ALTA.
35%
NATURAL GAS LIQUIDS ENERGY USE BY PROVINCE, 2017
QUE.
12%
ONT. 35%
MAN. 3%
SASK. 5%
B.C. AND TERR.
6% ATL. 5%
TOTAL
143PJ

Uranium is a silvery-white
metal containing energy. After
being mined, milled, refined
and converted, uranium fuels
nuclear power generation.
NATU
RAL G
AS
74 Energy Fact Book Energy Fact Book 75
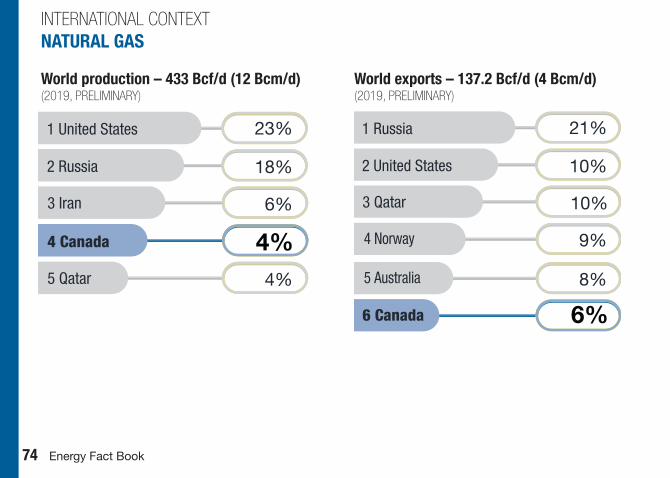
INTERNATIONAL CONTEXTNATURAL GAS
World production – 433 Bcf/d (12 Bcm/d) (2019, PRELIMINARY)
World exports – 137.2 Bcf/d (4 Bcm/d) (2019, PRELIMINARY)
4 Canada 4%
1 United States 23%
2 Russia 18%
3 Iran 6%
5 Qatar 4%
9%
1 Russia 21%
2 United States 10%
3 Qatar 10%
6%
4 Norway
6 Canada
8%5 Australia
Energy Fact Book 75
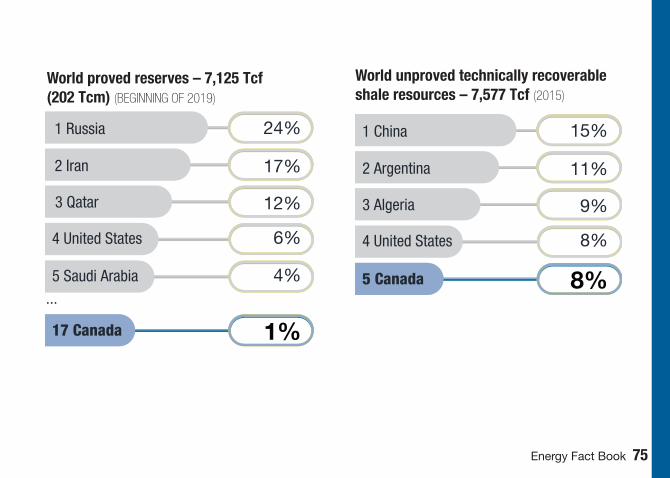
World proved reserves – 7,125 Tcf (202 Tcm) (BEGINNING OF 2019)
5 Saudi Arabia 4%
4 United States 6%
1%
1 Russia 24%
2 Iran 17%
3 Qatar 12%
17 Canada
...8%
1 China 15%
2 Argentina 11%
3 Algeria 9%
4 United States
8%
5 Canada
World unproved technically recoverable shale resources – 7,577 Tcf (2015)
76 Energy Fact Book Energy Fact Book 77
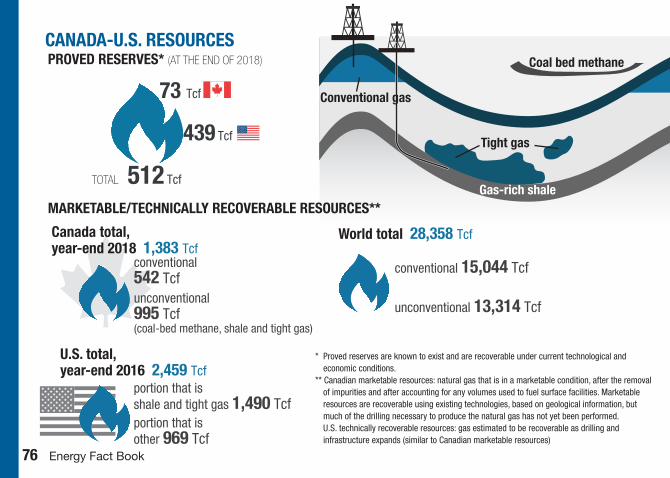
CANADA-U.S. RESOURCES
Conventional gas
Tight gas
Gas-rich shale
Coal bed methanePROVED RESERVES* (AT THE END OF 2018)
73 Tcf
439 Tcf
512 Tcf
MARKETABLE/TECHNICALLY RECOVERABLE RESOURCES**
conventional542 Tcf
Canada total, year-end 2018 1,383 Tcf
unconventional995 Tcf(coal-bed methane, shale and tight gas)
portion that is shale and tight gas 1,490 Tcfportion that is other 969 Tcf
U.S. total,year-end 2016 2,459 Tcf
conventional 15,044 Tcf
unconventional 13,314 Tcf
World total 28,358 Tcf
* Proved reserves are known to exist and are recoverable under current technological and economic conditions.
** Canadian marketable resources: natural gas that is in a marketable condition, after the removal of impurities and after accounting for any volumes used to fuel surface facilities. Marketable resources are recoverable using existing technologies, based on geological information, but much of the drilling necessary to produce the natural gas has not yet been performed.
U.S. technically recoverable resources: gas estimated to be recoverable as drilling and infrastructure expands (similar to Canadian marketable resources)
conventional542 Tcf
Canada total, year-end 2018 1,383 Tcf
unconventional995 Tcf(coal-bed methane, shale and tight gas)
portion that is shale and tight gas 1,490 Tcfportion that is other 969 Tcf
U.S. total,year-end 2016 2,459 Tcf
conventional 15,044 Tcf
unconventional 13,314 Tcf
World total 28,358 Tcf
TOTAL
Energy Fact Book 77
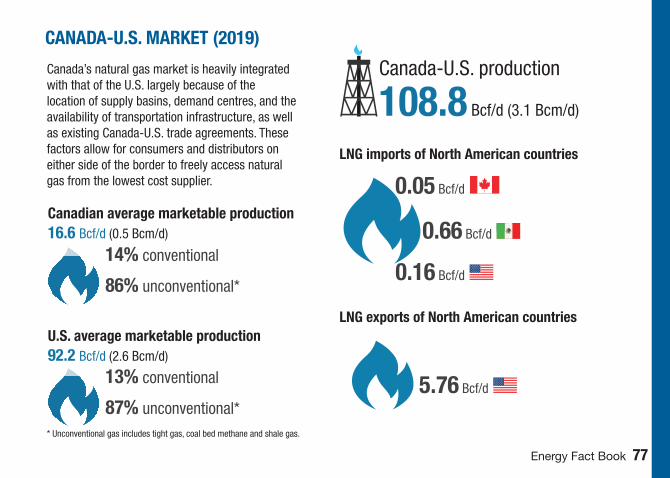
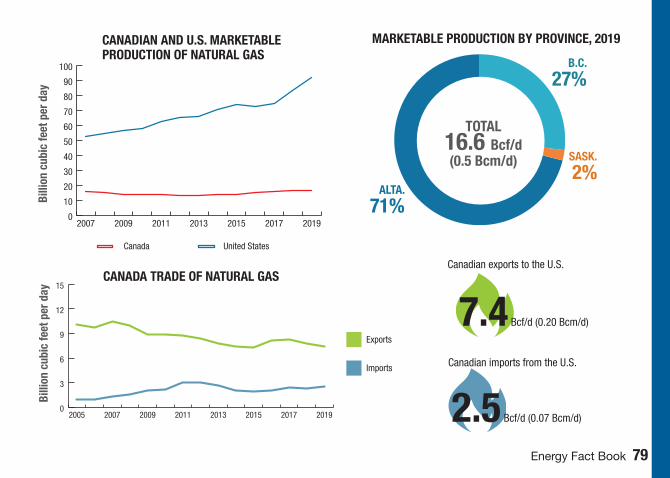
Canada’s natural gas market is heavily integrated with that of the U.S. largely because of the location of supply basins, demand centres, and the availability of transportation infrastructure, as well as existing Canada-U.S. trade agreements. These factors allow for consumers and distributors on either side of the border to freely access natural gas from the lowest cost supplier.
CANADA -U.S. MARKET (2019)
14% conventional
Canada-U.S. production
108.8 Bcf/d (3.1 Bcm/d)
Canadian average marketable production 16.6 Bcf/d (0.5 Bcm/d)
86% unconventional*
13% conventional
87% unconventional*
U.S. average marketable production 92.2 Bcf/d (2.6 Bcm/d)
North American LNG imports 0.27 Bcf/d (0.01 Bcm/d)
14% conventional
Canada-U.S. production
108.8 Bcf/d (3.1 Bcm/d)
Canadian average marketable production 16.6 Bcf/d (0.5 Bcm/d)
86% unconventional*
13% conventional
87% unconventional*
U.S. average marketable production 92.2 Bcf/d (2.6 Bcm/d)
North American LNG imports 0.27 Bcf/d (0.01 Bcm/d)
* Unconventional gas includes tight gas, coal bed methane and shale gas.
0.05 Bcf/d
0.66 Bcf/d
0.16 Bcf/d
5.76 Bcf/d
LNG imports of North American countries
LNG exports of North American countries
78 Energy Fact Book Energy Fact Book 79
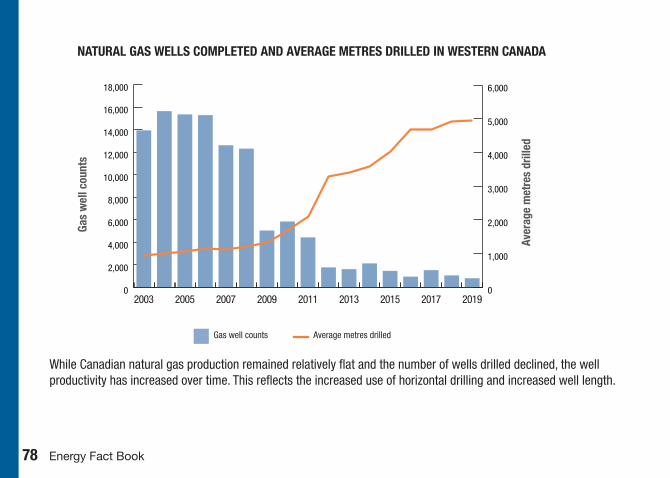
NATURAL GAS WELLS COMPLETED AND AVERAGE METRES DRILLED IN WESTERN CANADA
0
2,000
4,000
6,000
8,000
10,000
12,000
14,000
16,000
18,000
2019201720152013201120092007200520030
1,000
2,000
3,000
4,000
5,000
6,000Ga
s w
ell c
ount
s
Aver
age
met
res
drill
ed
While Canadian natural gas production remained relatively flat and the number of wells drilled declined, the well productivity has increased over time. This reflects the increased use of horizontal drilling and increased well length.
Gas well counts Average metres drilled
Energy Fact Book 79
0
10
20
30
40
50
60
70
80
90
100
2019201720152013201120092007
ALTA.
71%
B.C.
27%
SASK.
2%
MARKETABLE PRODUCTION BY PROVINCE, 2019CANADIAN AND U.S. MARKETABLE PRODUCTION OF NATURAL GAS
Canada United States
Billi
on c
ubic
feet
per
day
TOTAL16.6 Bcf/d(0.5 Bcm/d)
CANADA TRADE OF NATURAL GAS
7.4 Bcf/d (0.20 Bcm/d)
Canadian exports to the U.S.
Canadian imports from the U.S.
2.5 Bcf/d (0.07 Bcm/d)
Exports
Imports
0
3
6
9
12
15
20192017201520132011200920072005
Billi
on c
ubic
feet
per
day
80 Energy Fact Book Energy Fact Book 81
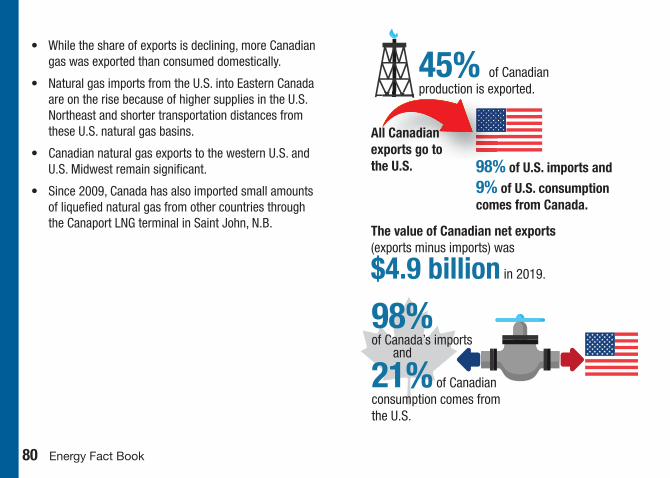
• While the share of exports is declining, more Canadian gas was exported than consumed domestically.
• Natural gas imports from the U.S. into Eastern Canada are on the rise because of higher supplies in the U.S. Northeast and shorter transportation distances from these U.S. natural gas basins.
• Canadian natural gas exports to the western U.S. and U.S. Midwest remain significant.
• Since 2009, Canada has also imported small amounts of liquefied natural gas from other countries through the Canaport LNG terminal in Saint John, N.B.
45% of Canadian production is exported.p
All Canadian exports go to the U.S. 98% of U.S. imports and
9% of U.S. consumption comes from Canada.
The value of Canadian net exports (exports minus imports) was
$4.9 billion in 2019.
98%of Canada’s imports
21% of Canadian consumption comes from the U.S.
and

Energy Fact Book 81
UPSTREAM PRICESThe AECO hub is Canada’s largest natural gas trading hub, and the AECO price serves as a benchmark for Alberta wholesale natural gas transactions.
0
3
6
9
12
15
18
21
24
2020201920182017201620152014201320122011201020092008
AECO PRICEAverage: 2008–2019 $3.39/MMbtu
Average: 2016 $2.18/MMbtu
Average: 2017 $2.20/MMbtu
Average: 2018 $1.54/MMbtu
Average: 2019 $1.80/MMbtuC$
/MM
btu
MONTHLY AVERAGE NATURAL GAS SPOT PRICES
Start of the North American shale gas revolution
2013–2014 Polar Vortex
Henry hub Dawn hub AECO C hub

82 Energy Fact Book Energy Fact Book 83
TRANSPORTATION
BY PIPELINE
Energy Fact Book 83
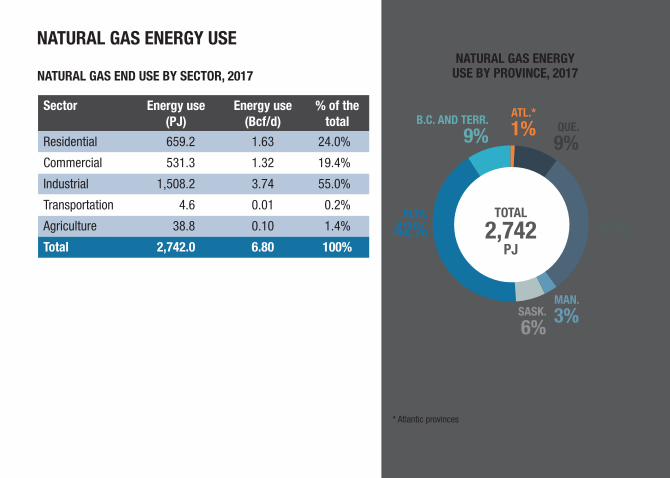
NATURAL GAS ENERGY USE
Sector Energy use (PJ)
Energy use (Bcf/d)
% of the total
Residential 659.2 1.63 24.0%
Commercial 531.3 1.32 19.4%
Industrial 1,508.2 3.74 55.0%
Transportation 4.6 0.01 0.2%
Agriculture 38.8 0.10 1.4%
Total 2,742.0 6.80 100%
NATURAL GAS END USE BY SECTOR, 2017NATURAL GAS ENERGY
USE BY PROVINCE, 2017
ALTA. 42%
B.C. AND TERR. 9%
ATL.*
1%
ONT.
30%
QUE.
9%
SASK.
6%
MAN.
3%
* Atlantic provinces
TOTAL
2,742PJ

ELECTR
ICITY
86 Energy Fact Book Energy Fact Book 87
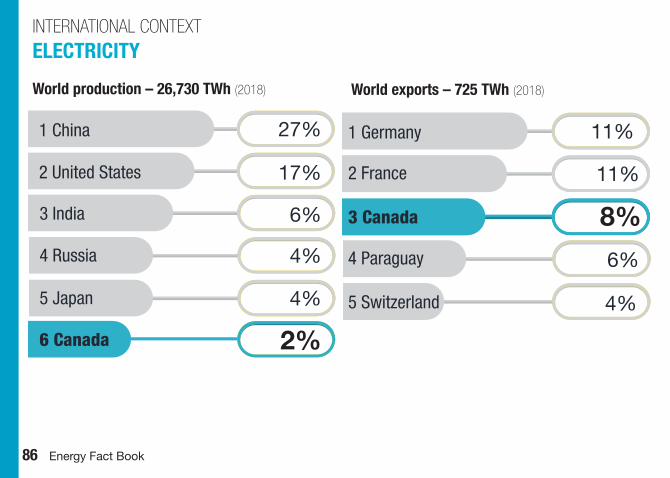
1 China 27%
2 United States 17%
3 India 6%
4 Russia
2%
4%
5 Japan 4%
6 Canada
INTERNATIONAL CONTEXTELECTRICITY
World production – 26,730 TWh (2018) World exports – 725 TWh (2018)
1 Germany 11%
2 France
4 Paraguay
11%
5 Switzerland 4%
8%6%
3 Canada
Energy Fact Book 87
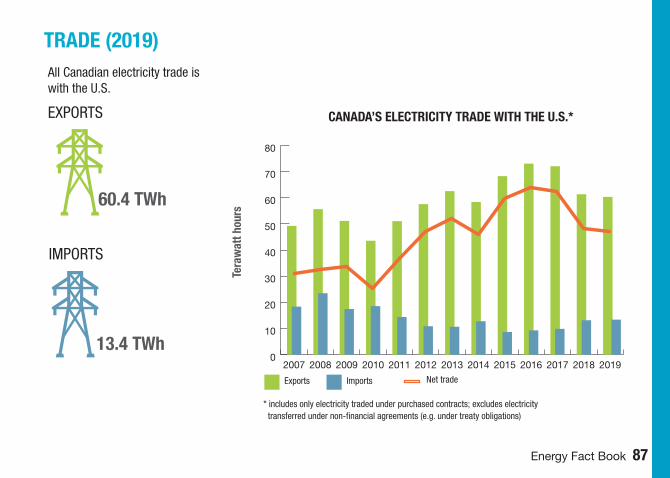
TRADE (2019)
60.4 TWh
EXPORTS
IMPORTS
13.4 TWh0
10
20
30
40
50
60
70
80
2019201820172016201520142013201220112010200920082007
Net tradeExports Imports
CANADA’S ELECTRICITY TRADE WITH THE U.S.*
All Canadian electricity trade is with the U.S.
* includes only electricity traded under purchased contracts; excludes electricity transferred under non-financial agreements (e.g. under treaty obligations)
Tera
wat
t hou
rs
88 Energy Fact Book Energy Fact Book 89
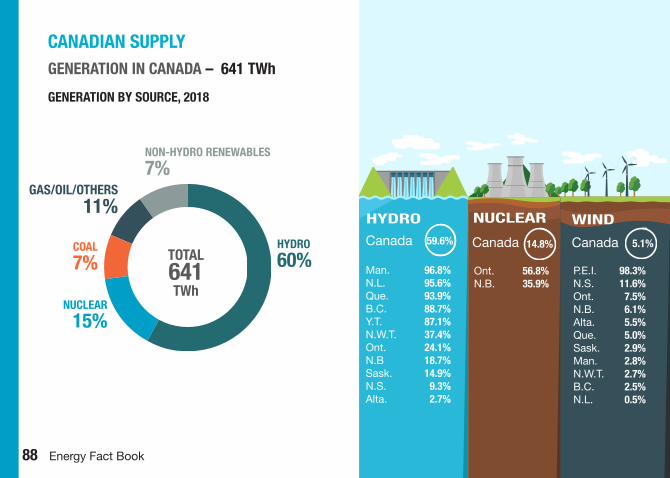
CANADIAN SUPPLYGENERATION IN CANADA – 641 TWh PROVINCIAL CHARACTERISTICS
GENERATION BY SOURCE, 2018
NON-HYDRO RENEWABLES
7%
HYDRO 60%
NUCLEAR 15%
COAL 7% TOTAL
641TWh
GAS/OIL/OTHERS 11%
Ont. 56.8%N.B. 35.9%
N.S. 0.2%
Man. 96.8%N.L. 95.6%Que. 93.9%B.C. 88.7%Y.T. 87.1%N.W.T. 37.4%Ont. 24.1%N.B 18.7%Sask. 14.9%N.S. 9.3%Alta. 2.7%
NUCLEARHYDRO
TIDAL
OTHERAlta. 0.3%
Canada Canada 14.8%
P.E.I. 98.3%N.S. 11.6%Ont. 7.5%N.B. 6.1%Alta. 5.5%Que. 5.0%Sask. 2.9%Man. 2.8%N.W.T. 2.7%B.C. 2.5%N.L. 0.5%
WIND
Canada 5.1%59.6%
B.C. 6.4%N.B. 4.0%Alta. 2.6%N.S. 2.5%Ont. 1.4%Que. 0.7%P.E.I. 0.6%Man. 0.1%Sask. 0.1%
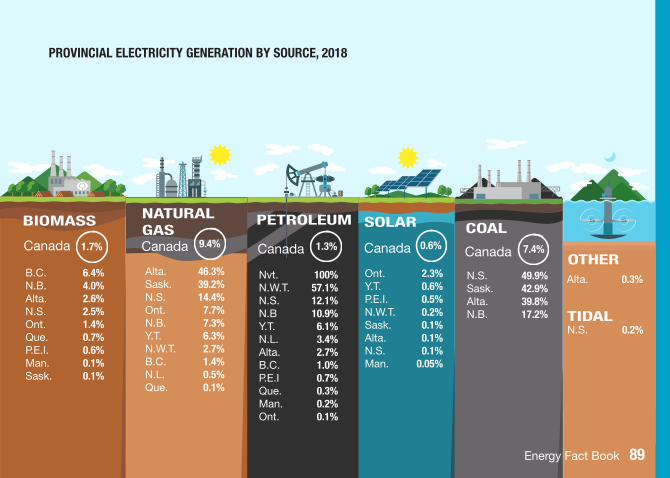
BIOMASS
Canada 1.7%
NATURAL GAS
Alta. 46.3%Sask. 39.2%N.S. 14.4%Ont. 7.7%N.B. 7.3%Y.T. 6.3%N.W.T. 2.7%B.C. 1.4%N.L. 0.5%Que. 0.1%
Canada 9.4%
N.S. 49.9%Sask. 42.9%Alta. 39.8%N.B. 17.2%
COAL
Canada 7.4%
PETROLEUM
Nvt. 100%N.W.T. 57.1%N.S. 12.1%N.B 10.9%Y.T. 6.1%N.L. 3.4%Alta. 2.7%B.C. 1.0%P.E.I 0.7%Que. 0.3%Man. 0.2%Ont. 0.1%
Canada 1.3%
Ont. 2.3%Y.T. 0.6%P.E.I. 0.5%N.W.T. 0.2%Sask. 0.1%Alta. 0.1%N.S. 0.1%Man. 0.05%
SOLAR
Canada 0.6%
Energy Fact Book 89
Ont. 56.8%N.B. 35.9%
N.S. 0.2%
Man. 96.8%N.L. 95.6%Que. 93.9%B.C. 88.7%Y.T. 87.1%N.W.T. 37.4%Ont. 24.1%N.B 18.7%Sask. 14.9%N.S. 9.3%Alta. 2.7%
NUCLEARHYDRO
TIDAL
OTHERAlta. 0.3%
Canada Canada 14.8%
P.E.I. 98.3%N.S. 11.6%Ont. 7.5%N.B. 6.1%Alta. 5.5%Que. 5.0%Sask. 2.9%Man. 2.8%N.W.T. 2.7%B.C. 2.5%N.L. 0.5%
WIND
Canada 5.1%59.6%
B.C. 6.4%N.B. 4.0%Alta. 2.6%N.S. 2.5%Ont. 1.4%Que. 0.7%P.E.I. 0.6%Man. 0.1%Sask. 0.1%
BIOMASS
Canada 1.7%
NATURAL GAS
Alta. 46.3%Sask. 39.2%N.S. 14.4%Ont. 7.7%N.B. 7.3%Y.T. 6.3%N.W.T. 2.7%B.C. 1.4%N.L. 0.5%Que. 0.1%
Canada 9.4%
N.S. 49.9%Sask. 42.9%Alta. 39.8%N.B. 17.2%
COAL
Canada 7.4%
PETROLEUM
Nvt. 100%N.W.T. 57.1%N.S. 12.1%N.B 10.9%Y.T. 6.1%N.L. 3.4%Alta. 2.7%B.C. 1.0%P.E.I 0.7%Que. 0.3%Man. 0.2%Ont. 0.1%
Canada 1.3%
Ont. 2.3%Y.T. 0.6%P.E.I. 0.5%N.W.T. 0.2%Sask. 0.1%Alta. 0.1%N.S. 0.1%Man. 0.05%
SOLAR
Canada 0.6%
Energy Fact Book 89
PROVINCIAL ELECTRICITY GENERATION BY SOURCE, 2018

90 Energy Fact Book Energy Fact Book 91
15.42
19.31
10.83
15.85
8.39
14.72
10.94
11.95
12.40
Vancouver
Edmonton
Charlottetown
Moncton
St. John’s
Montréal
Toronto
Winnipeg
Regina
6.92 9.48
11.27
5.15
13.23
6.46
5.66
8.71
15.06
19.35
Halifax, N.S.
17.52
0
5
10
15
20
ELECTRICITY PRICESAVERAGE LARGE INDUSTRIAL AND RESIDENTIAL ELECTRICITY PRICES* (AS OF APRIL 2019)
*including taxes
in cents/kWh
ResidentialIndustrial

Energy Fact Book 91
ELECTRICAL ENERGY USE
Sector Energy use (PJ) % of the total
Residential 604.1 33.3%
Commercial 429.7 23.7%
Industrial 739.0 40.8%
Transportation 4.4 0.2%
Agriculture 34.8 1.9%
Total 1812.0 100%
TOTAL ELECTRICAL ENERGY USE* WAS 1,812 PJIN 2017
*secondary energy use
ELECTRICAL ENERGY USE BY PROVINCE, 2017
QUE. 35%
ONT. 27%
MAN. 4%
SASK. 4%
ALTA. 11%
B.C. and TERR. 12%
ATL.* 7%
TOTAL
1,812PJ
* Atlantic provinces
92 Energy Fact Book Energy Fact Book 93
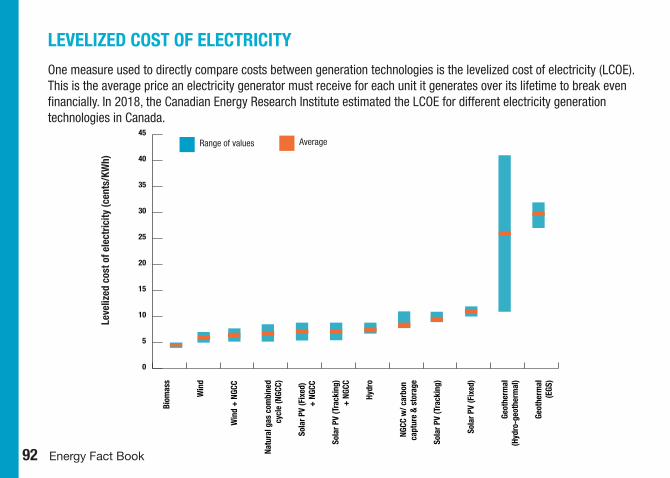
LEVELIZED COST OF ELECTRICITY
One measure used to directly compare costs between generation technologies is the levelized cost of electricity (LCOE). This is the average price an electricity generator must receive for each unit it generates over its lifetime to break even financially. In 2018, the Canadian Energy Research Institute estimated the LCOE for different electricity generation technologies in Canada.
0
5
10
15
20
25
30
35
40
45
Geot
herm
al (E
GS)
Geot
herm
al (H
ydro
-geo
ther
mal
)
Sola
r PV
(Fix
ed)
Sola
r PV
(Tra
ckin
g)
NGCC
w/ c
arbo
n ca
ptur
e &
stor
age
Hydr
o
Sola
r PV
(Tra
ckin
g) +
NGC
C
Sola
r PV
(Fix
ed)
+ NG
CC
Natu
ral g
as c
ombi
ned
cyc
le (N
GCC)
Win
d +
NGCC
Win
d
Biom
ass
Leve
lized
cos
t of e
lect
ricity
(cen
ts/K
Wh)
Range of values Average
Energy Fact Book 93
Uranium is a silvery-white
metal containing energy. After
being mined, milled, refined
and converted, uranium fuels
nuclear power generation.
REN
EWAB
LE EN
ERG
Y

94 Energy Fact Book Energy Fact Book 95
13.4% World
10.5% OECD countries only
Canada16.3%
INTERNATIONAL CONTEXTRENEWABLE ENERGY
World production – 80,733 PJ or 1,928 MTOE (2018)
1 China 15%
2 India 11%
3 United States 9%
4 Brazil 7%
5 Nigeria 6%
3%7 Canada
...Share of energy supply from
renewable sources (2018)
Energy Fact Book 95
*includes energy consumed for electricity and heat production and for biofuels in the transportation sector**is a biogasoline
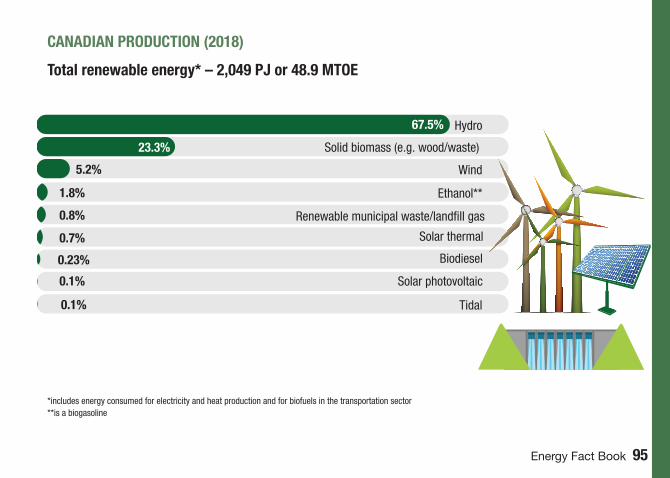
CANADIAN PRODUCTION (2018)
Total renewable energy* – 2,049 PJ or 48.9 MTOE
67.5% Hydro
23.3% Solid biomass (e.g. wood/waste)
Wind5.2%
Ethanol**1.8%
Renewable municipal waste/landfill gas0.8%
0.23% Biodiesel
Solar thermal0.7%
Tidal0.1%
0.1% Solar photovoltaic
96 Energy Fact Book Energy Fact Book 97
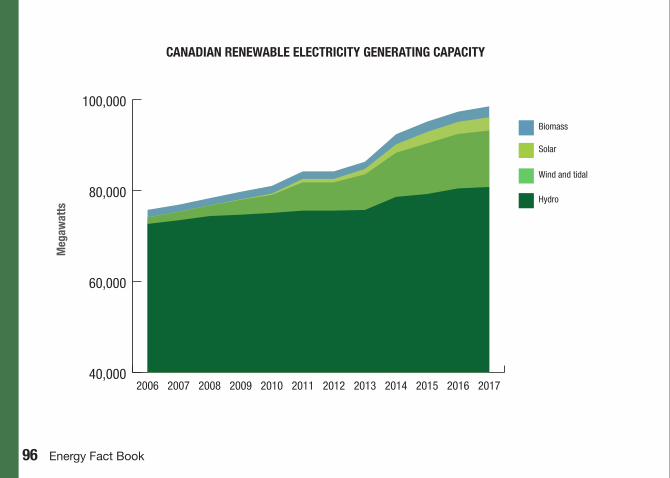
CANADIAN RENEWABLE ELECTRICITY GENERATING CAPACITYM
egaw
atts
Hydro
Wind and tidal
Solar
40,000
60,000
80,000
100,000
201720162015201420132012201120102009200820072006
Biomass

Energy Fact Book 97
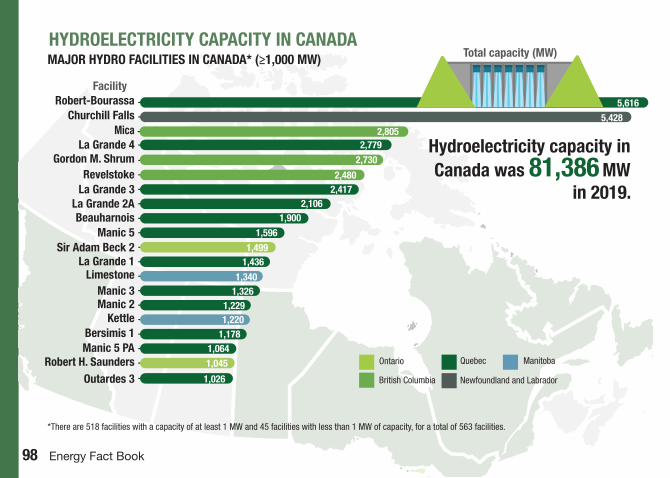
HYDROELECTRICITY
Moving water is the most important renewable energy source in Canada,
providing 60% of Canada’s electricity generation. In fact, in 2018, Canada was the third-largest producer of hydroelectricity in the world.
World generation of hydroelectricity – 4,214 TWh (2018)
5%
1 China 28%
2 Brazil 9%
3 Canada 9%4 United States
7%
5 Russia
INTERNATIONAL CONTEXTHYDROELECTRICITY
98 Energy Fact Book Energy Fact Book 99
Outardes 3Robert H. Saunders
Manic 5 PABersimis 1
KettleManic 2
LimestoneManic 3
La Grande 1Sir Adam Beck 2
Manic 5Beauharnois
La Grande 2A
Mica
La Grande 3Revelstoke
Gordon M. ShrumLa Grande 4
Churchill FallsRobert-Bourassa 5,616
5,428
2,7792,805
2,4172,480
2,1061,900
1,596
1,499
1,3401,326
1,2291,220
1,436
1,1781,0641,045
1,026
2,730Hydroelectricity capacity in Canada was 81,386 MW
in 2019.
*There are 518 facilities with a capacity of at least 1 MW and 45 facilities with less than 1 MW of capacity, for a total of 563 facilities.
QuebecOntario
Newfoundland and LabradorBritish Columbia
Manitoba
HYDROELECTRICITY CAPACITY IN CANADA MAJOR HYDRO FACILITIES IN CANADA* (≥1,000 MW)
Facility
Total capacity (MW)
Energy Fact Book 99
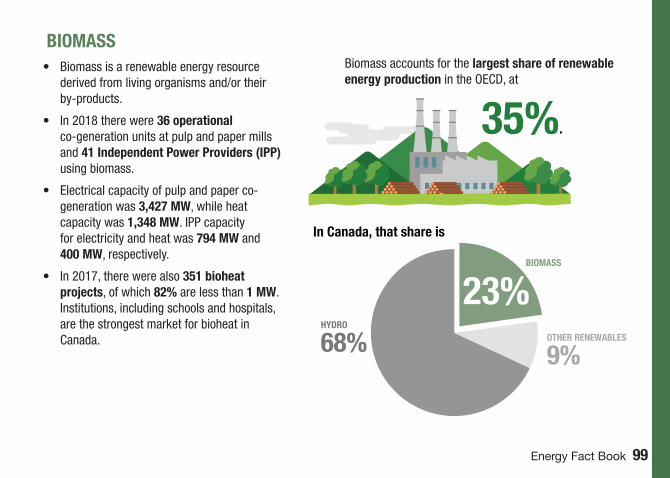
BIOMASS Biomass accounts for the largest share of renewable energy production in the OECD, at
HYDRO
68%
In Canada, that share is
35%.
23%OTHER RENEWABLES
9%
BIOMASS
• Biomass is a renewable energy resource derived from living organisms and/or their by-products.
• In 2018 there were 36 operational co-generation units at pulp and paper mills and 41 Independent Power Providers (IPP) using biomass.
• Electrical capacity of pulp and paper co-generation was 3,427 MW, while heat capacity was 1,348 MW. IPP capacity for electricity and heat was 794 MW and 400 MW, respectively.
• In 2017, there were also 351 bioheat projects, of which 82% are less than 1 MW. Institutions, including schools and hospitals, are the strongest market for bioheat in Canada.
100 Energy Fact Book Energy Fact Book 101
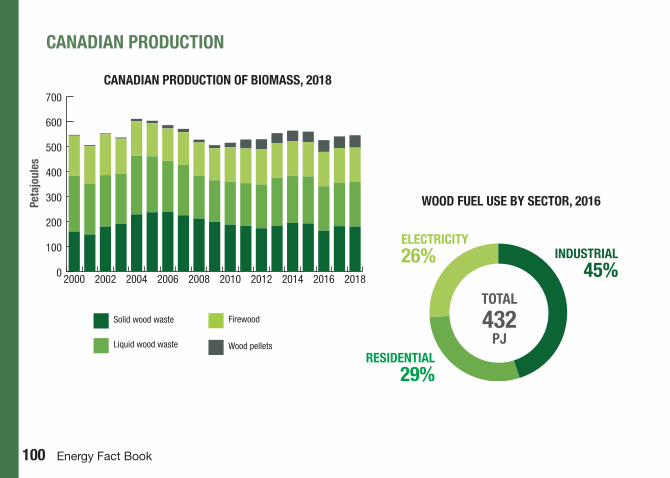
CANADIAN PRODUCTION OF BIOMASS, 2018
WOOD FUEL USE BY SECTOR, 2016
INDUSTRIAL45%
RESIDENTIAL29%
ELECTRICITY26%
0
100
200
300
400
500
600
700
2018201620142012201020082006200420022000
TOTAL
432PJ
CANADIAN PRODUCTION
Solid wood waste
Liquid wood waste
Firewood
Wood pellets
Peta
joul
es
Energy Fact Book 101
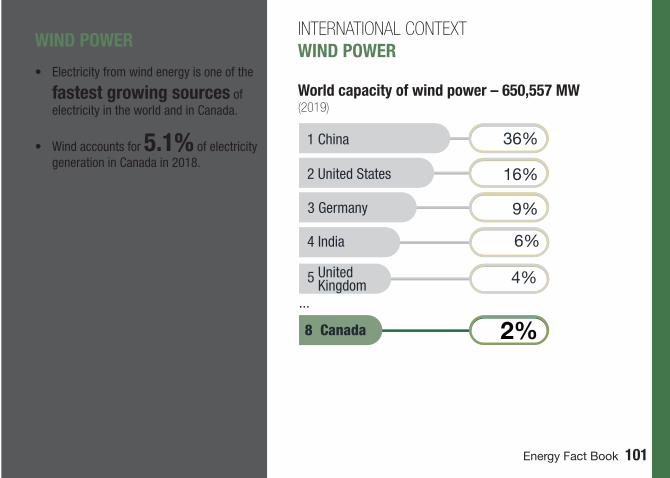
WIND POWER
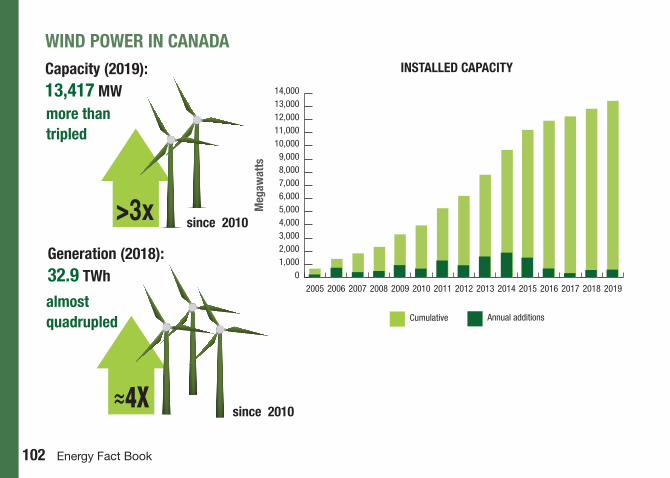
• Electricity from wind energy is one of the
fastest growing sources of electricity in the world and in Canada.
• Wind accounts for 5.1% of electricity generation in Canada in 2018.
World capacity of wind power – 650,557 MW (2019)
1 China 36%
2 United States 16%
3 Germany 9%
4 India 6%
2%
5 United Kingdom
4%
8 Canada
...
INTERNATIONAL CONTEXTWIND POWER
102 Energy Fact Book Energy Fact Book 103
WIND POWER IN CANADA
since 2010
almost quadrupled
≈4X
since 2010
more than tripled
>3x
01,0002,0003,0004,0005,0006,0007,0008,0009,000
10,00011,00012,00013,00014,000
201920182017201620152014201320122011201020092008200720062005
INSTALLED CAPACITY
Meg
awat
ts
Annual additionsCumulative
Capacity (2019): 13,417 MW
Generation (2018): 32.9 TWh
Energy Fact Book 103
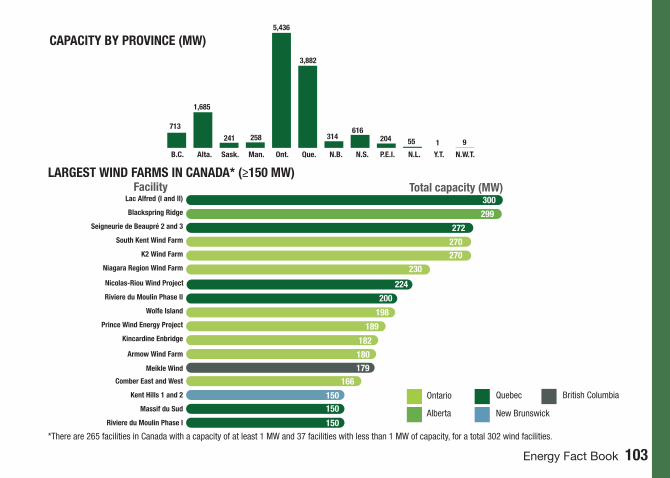
CAPACITY BY PROVINCE (MW)
300
299
272
270270
200
198
189
182
230
180
166
150150
150
179Meikle Wind
Riviere du Moulin Phase I
Massif du Sud
Kent Hills 1 and 2
Comber East and West
Armow Wind Farm
Kincardine Enbridge
Prince Wind Energy Project
Wolfe Island
Riviere du Moulin Phase II
Niagara Region Wind Farm
K2 Wind Farm
South Kent Wind Farm
Seigneurie de Beaupré 2 and 3
Blackspring Ridge
Lac Alfred (I and II)
224Nicolas-Riou Wind Project
LARGEST WIND FARMS IN CANADA* (≥150 MW)
*There are 265 facilities in Canada with a capacity of at least 1 MW and 37 facilities with less than 1 MW of capacity, for a total 302 wind facilities.
B.C. Alta. Sask. Man. Ont. Que. N.B. N.S. P.E.I. N.L. Y.T. N.W.T.
713
1,685
241 258
5,436
3,882
314616
204 55 1 9
Facility Total capacity (MW)
QuebecOntario
New BrunswickAlberta
British Columbia
104 Energy Fact Book Energy Fact Book 105
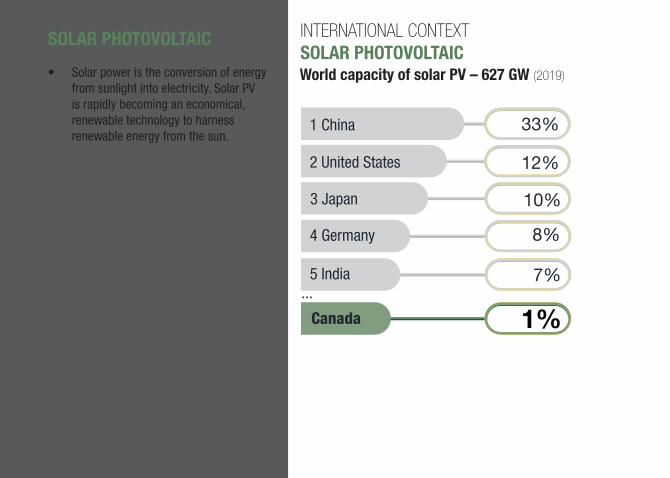
SOLAR PHOTOVOLTAIC
• Solar power is the conversion of energy from sunlight into electricity. Solar PV is rapidly becoming an economical, renewable technology to harness renewable energy from the sun.
World capacity of solar PV – 627 GW (2019)
1 China 33%
2 United States 12%
3 Japan 10%
4 Germany 8%
1% Canada
...5 India 7%
INTERNATIONAL CONTEXTSOLAR PHOTOVOLTAIC
Energy Fact Book 105
INTERNATIONAL CONTEXTSOLAR PHOTOVOLTAIC
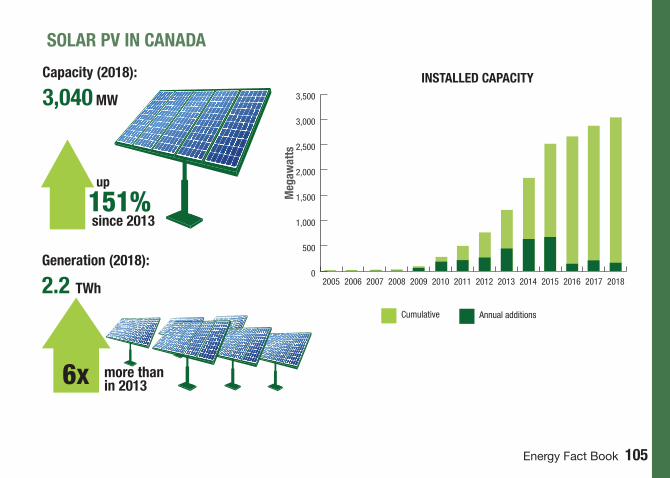
SOLAR PV IN CANADA
Capacity (2018):
3,040 MW
Generation (2018):
2.2 TWh
more than in 2013
up
since 2013
6x
151%
0
500
1,000
1,500
2,000
2,500
3,000
3,500
20182017201620152014201320122011201020092008200720062005
INSTALLED CAPACITY
Meg
awat
ts
Annual additionsCumulative
106 Energy Fact Book Energy Fact Book 107
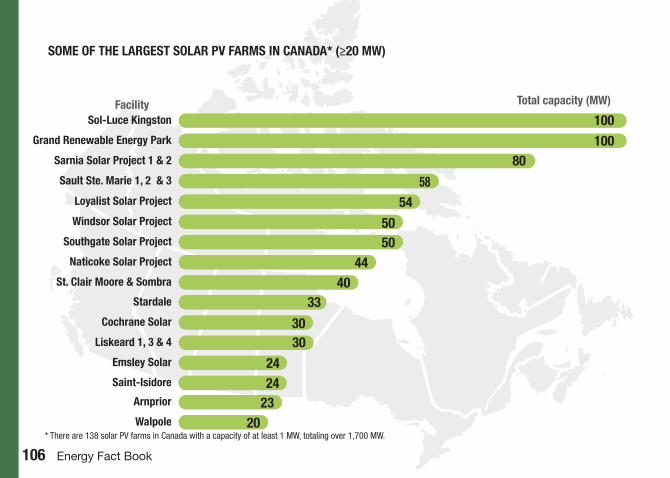
Walpole
Liskeard 1, 3 & 4
St. Clair Moore & Sombra
Naticoke Solar Project
Southgate Solar Project
Windsor Solar Project
Emsley Solar
Loyalist Solar Project
Cochrane Solar
Stardale
Sault Ste. Marie 1, 2 & 3
Sarnia Solar Project 1 & 2
Grand Renewable Energy Park
Sol-Luce Kingston272
10080
33
30
54
24
58
5050
4440
30
20
100
Arnprior
24Saint-Isidore
23
SOME OF THE LARGEST SOLAR PV FARMS IN CANADA* (≥20 MW)
Facility Total capacity (MW)
* There are 138 solar PV farms in Canada with a capacity of at least 1 MW, totaling over 1,700 MW.
Energy Fact Book 107
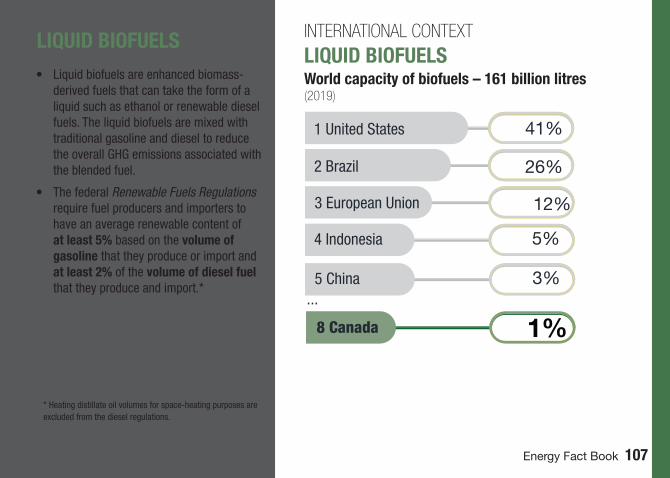
• Liquid biofuels are enhanced biomass-derived fuels that can take the form of a liquid such as ethanol or renewable diesel fuels. The liquid biofuels are mixed with traditional gasoline and diesel to reduce the overall GHG emissions associated with the blended fuel.
• The federal Renewable Fuels Regulations require fuel producers and importers to have an average renewable content of at least 5% based on the volume of gasoline that they produce or import and at least 2% of the volume of diesel fuel that they produce and import.*
* Heating distillate oil volumes for space-heating purposes are excluded from the diesel regulations.
World capacity of biofuels – 161 billion litres (2019)
1%
1 United States 41%
2 Brazil 26%
3 European Union 12%
4 Indonesia
5%
8 Canada
5 China 3%...
INTERNATIONAL CONTEXTLIQUID BIOFUELS
LIQUID BIOFUELS
108 Energy Fact Book Energy Fact Book 109
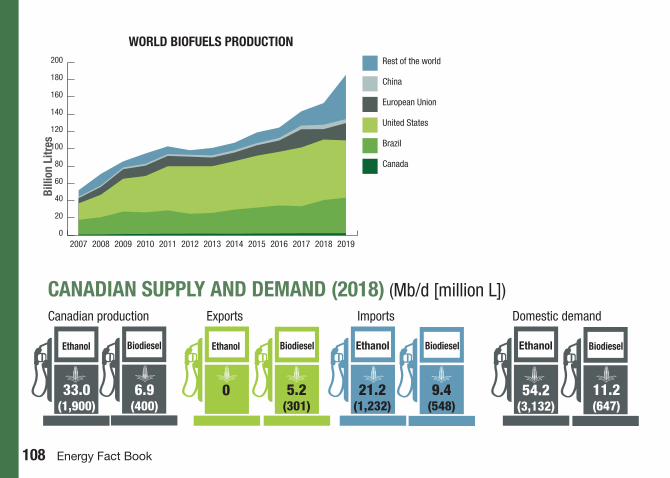
0
20
40
60
80
100
120
140
160
180
200
2019201820172016201520142013201220112010200920082007
WORLD BIOFUELS PRODUCTIONBi
llion
Litr
es
European Union
Canada
China
Brazil
Rest of the world
United States
CANADIAN SUPPLY AND DEMAND (2018) (Mb/d [million L])
BiodieselEthanol Biodiesel
33.0(1,900)
6.9(400)
EthanolEthanol Ethanol
54.2(3,132)
11.2(647)
21.2(1,232)
9.4(548)
0 5.2(301)
Biodiesel Biodiesel
Canadian production Exports Imports Domestic demand
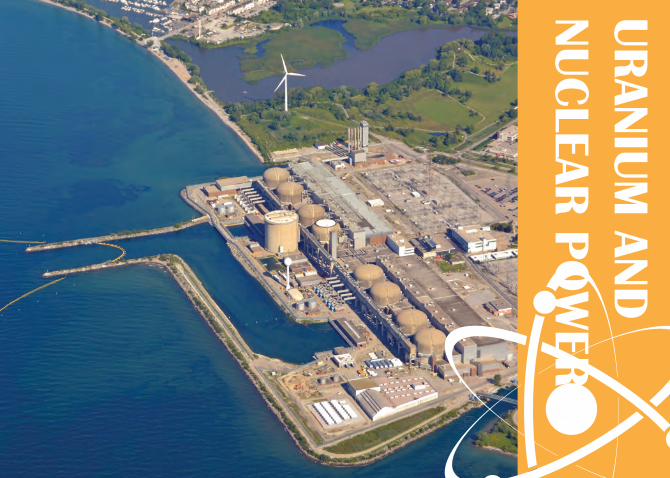
Energy Fact Book 109
Uranium is a silvery-white
metal containing energy. After
being mined, milled, refined
and converted, uranium fuels
nuclear power generation.
UR
ANIU
M AN
D
NU
CLEAR
PO
WER
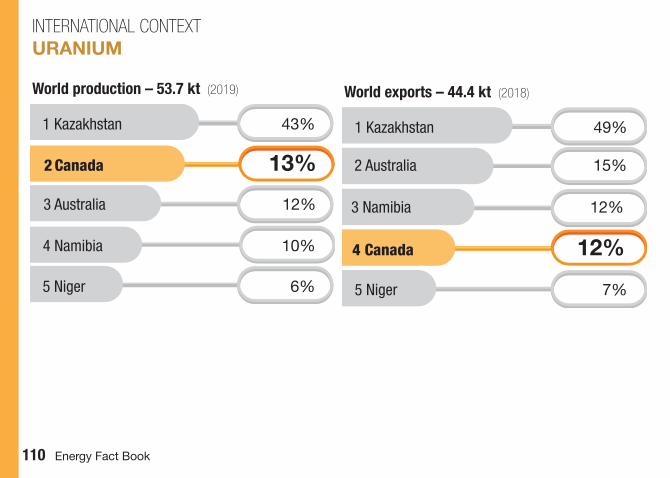
110 Energy Fact Book Energy Fact Book 111
INTERNATIONAL CONTEXTURANIUM
World production – 53.7 kt (2019)
1 Kazakhstan 43%
2 Canada 13%
3 Australia 12%
4 Namibia 10%
5 Niger 6%
World exports – 44.4 kt (2018)
1 Kazakhstan 49%
4 Canada 12%
2 Australia 15%
3 Namibia 12%
5 Niger 7%
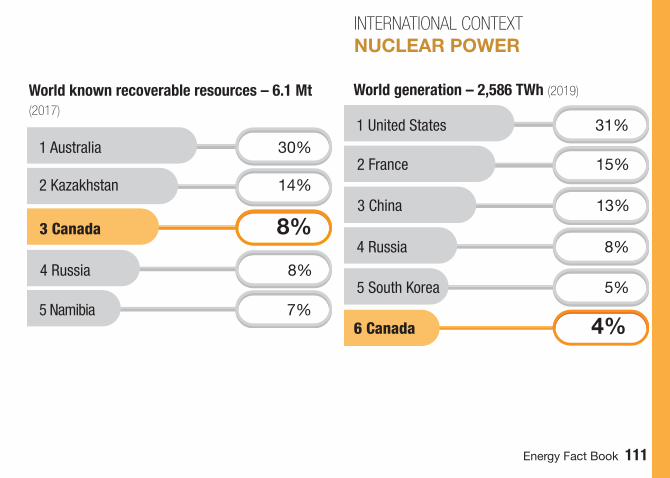
Energy Fact Book 111
World known recoverable resources – 6.1 Mt (2017)
1 Australia 30%
2 Kazakhstan 14%
4 Russia 8%
3 Canada 8%
5 Namibia 7%
INTERNATIONAL CONTEXTNUCLEAR POWER
World generation – 2,586 TWh (2019)
1 United States 31%
6 Canada 4%
3 China 13%
4 Russia 8%
5 South Korea 5%
2 France 15%
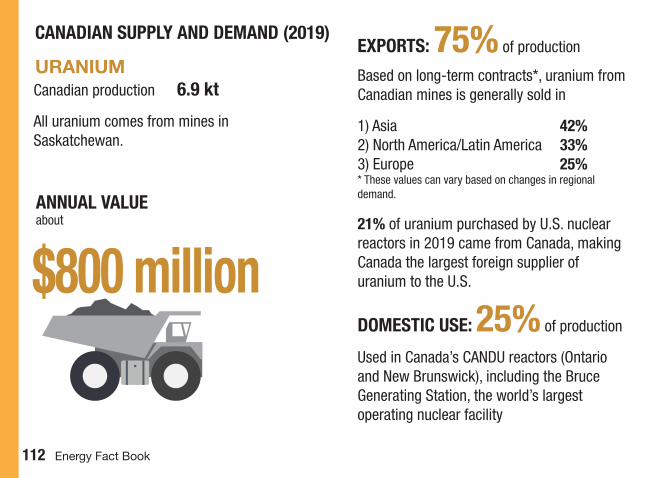
112 Energy Fact Book Energy Fact Book 113
CANADIAN SUPPLY AND DEMAND (2019)
URANIUM Based on long-term contracts*, uranium from Canadian mines is generally sold in
1) Asia 42%2) North America/Latin America 33%3) Europe 25%* These values can vary based on changes in regional demand.
21% of uranium purchased by U.S. nuclear reactors in 2019 came from Canada, making Canada the largest foreign supplier of uranium to the U.S.
DOMESTIC USE: 25% of production
Used in Canada’s CANDU reactors (Ontario and New Brunswick), including the Bruce Generating Station, the world’s largest operating nuclear facility
EXPORTS: 75% of production
Canadian production 6.9 kt
All uranium comes from mines in Saskatchewan.
ANNUAL VALUE about
$800 million
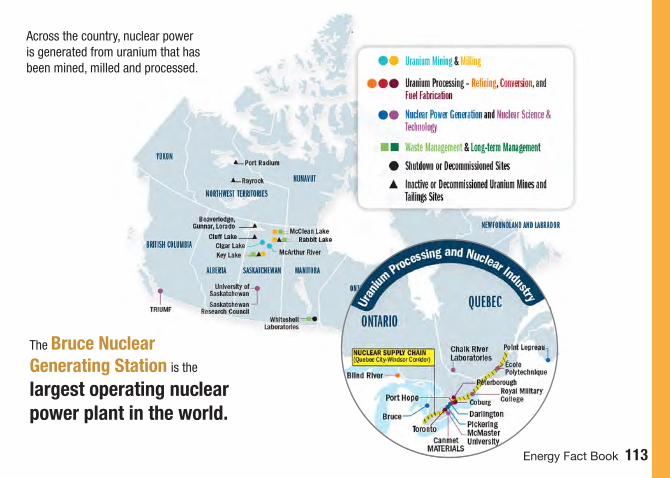
Energy Fact Book 113
The Bruce Nuclear Generating Station is the
largest operating nuclear power plant in the world.
Across the country, nuclear power is generated from uranium that has been mined, milled and processed.
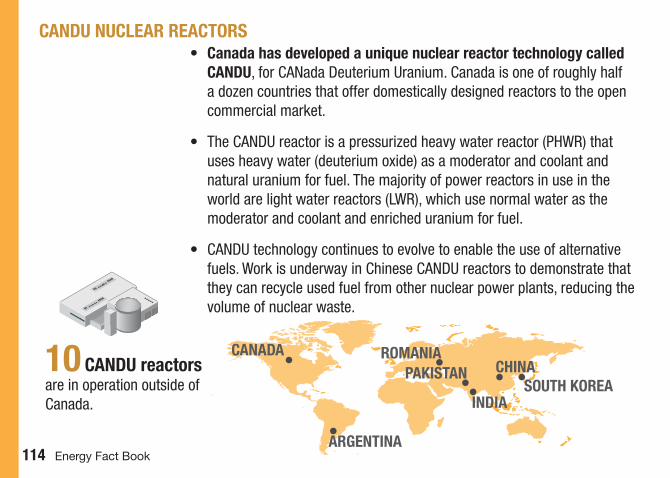
114 Energy Fact Book Energy Fact Book 115
• Canada has developed a unique nuclear reactor technology called CANDU, for CANada Deuterium Uranium. Canada is one of roughly half a dozen countries that offer domestically designed reactors to the open commercial market.
• The CANDU reactor is a pressurized heavy water reactor (PHWR) that uses heavy water (deuterium oxide) as a moderator and coolant and natural uranium for fuel. The majority of power reactors in use in the world are light water reactors (LWR), which use normal water as the moderator and coolant and enriched uranium for fuel.
• CANDU technology continues to evolve to enable the use of alternative fuels. Work is underway in Chinese CANDU reactors to demonstrate that they can recycle used fuel from other nuclear power plants, reducing the volume of nuclear waste.
CANDU NUCLEAR REACTORS
Nuclear in Canada
© Her Majesty the Queen in Right of Canada, as represented by the Minister of Natural Resources, 2017
Initiatives underway for long-term management of radioactive waste include:
�� Deep geologic repositories – suitable for all waste categories;�� Near-surface mounds – suitable for LLW and some ILW; and �� Tailings management facilities – specially designed for taillings.
All in keeping with internationally accepted approaches and best practices
Leader in nuclear research and technology, exporting Canadian-developed CANDU reactor technology
Nuclear science has broad applications: materials testing, pharmacology, nuclear medicine, food and agriculture, wastewater treatment, and environment protection.
Strong nuclear science and technology presence across Canada: 6 research reactors and a tokamak support R&D, and produce isotopes for medical and industrial applications.
Reinforced Concrete ContainersRadioactive waste is produced throughout the nuclear fuel cycle and safely managed in licensed storage facilities:
High-level waste - Nuclear fuel waste
Low and intermediate-level waste
Uranium mine and mill tailings waste
HLWL&ILW
UMMT
At plants in southern Ontario, fuel pellets are loaded into tubes and assembled into fuel bundles for CANDU reactors.
=400 kg of COAL
2.6 barrels of OIL
350 m3 of GASFUEL PELLET
25 cents
TUBES
PELLETS
FUEL BUNDLE
URANIUM M
ININ
G
M
ILLI
NG
R
EFINING
C
ONVERSION FUEL FABRICATION
WAS
TEM
ANAG
EMEN
T
LONG-TERM
MANAGEMENT
NUCLEA
R SC
IENC
E &
TEC
HN
OLO
GY
NUCLEA
R PO
WER
GEN
ERAT
ION
StartURANIUM ORE
Tailing LinePumphouse
Pore Water Collection System
Water
TailingsFilter Material
TAILINGS MANAGEMENT FACILITY
Surface Facilities
Waste
DEEP GEOLOGIC REPOSITORY
500 m
Waste
Multi-layer cover andliner systems
NEAR-SURFACE DISPOSAL FACILITY
The nuclear industry in Canada contributes $6 B to the Canadian economy and provides
$6 Billion60,000 jobsdirect jobs
30,000indirect jobs
30,000
YELLOWCAKE
U3O8At uranium mills, ore is processed into concentrate: “Yellowcake”.
The uranium mining industry is the largest private employer of Indigenous people in Saskatchewan. Saskatchewan
20% of the world’s production of uranium is mined and milled in northern Saskatchewan.
Yellowcake is refined at Blind River, Ontario, to produce uranium trioxide.
YELLOWCAKE REFINING URANIUM TRIOXIDE
U3O8 UO3
19 CANDU reactors at4 nuclear power generating stations 7th globally in nuclear power capacity
CANADA’S ELECTRICITY 16%
SUPPLYINGOVER
CANDU REACTOR
planned investment over 15 years to extend the life of 10 reactors in Ontario
supported by a stable domestic supply chain in southern Ontario and across Canada
UO2 is used to fuel CANDU nuclear reactors.
UF6 is exported for enrichment and use in foreign light water reactors.
CONVERSION
URANIUM TRIOXIDE
URANIUM HEXAFLUORIDE
URANIUM DIOXIDE
UO3
UO2
UF6
At Port Hope, Ontario, uranium trioxide is converted.
largest uranium producer in the world2nd
87% exported for use in foreign nuclear power reactors
$1.9 B
13% used to fuel Canadian nuclear power reactors
Uranium fuels the world’s nuclear power plants.
ONTARIO (Bruce, Pickering, Darlington)
NEW BRUNSWICK (Point Lepreau)
$25 B
in 2015
ALBERTA
McClean LakeRabbit Lake
Cigar LakeCluff Lake
Beaverlodge,Gunnar, Lorado
Key Lake
TRIUMF
University ofSaskatchewan
Port Radium
Rayrock
Darlington
Point LepreauWhiteshell Laboratories
SaskatchewanResearch Council Gentilly-1 & -2
McArthur RiverBRITISH COLUMBIA
YUKON
NUNAVUT
QUEBEC
NEWFOUNDLAND AND LABRADOR
P.E.I.
NOVA SCOTIANEW BRUNSWICK
ONTARIO
NORTHWEST TERRITORIES
SASKATCHEWAN MANITOBA
Uranium Mining & Milling
Uranium Processing – Refining, Conversion, and Fuel Fabrication
Nuclear Power Generation and Nuclear Science & Technology
Waste Management & Long-term Management
Pickering
Shutdown or Decommissioned Sites
Inactive or Decommissioned Uranium Mines and Tailings Sites
Agnew Lake
Douglas Point
Western Waste Management Facility
Chalk River LaboratoriesRophton NPD
Deloro
Peterborough
Coburg
Royal Military College
Elliot Lake Area
QUEBECONTARIO
Bruce
Port Hope
PickeringMcMaster University
Chalk River Laboratories
Darlington
TorontoCanmet
MATERIALS
Point Lepreau
École Polytechnique
Uran
ium Proce
ssing and Nuclear Industry
Blind River
Port Hope, Port Granby
NUCLEAR SUPPLY CHAIN(Quebec City-Windsor Corridor)
NUCLEAR ENERGY A KEY PART OF CANADA’S CLEAN AND LOW-CARBON ENERGY MIX � Nuclear electricity in Canada displaces over 50 million tonnes of GHG emissions annually. � Electricity from Canadian uranium offsets more than 300 million tonnes of GHG emissions worldwide.
10 CANDU reactorsare in operation outside of Canada. INDIA
PAKISTAN
ARGENTINA
SOUTH KOREA
ROMANIACHINA
CANADA

Energy Fact Book 115
GROSS CAPACITY OF NUCLEAR POWER PLANTS IN CANADAFacility Province Total
capacity (MW)Units
Darlington Ontario 3,512 4
Bruce A Ontario 3,220 4
Bruce B Ontario 3,390 4
Pickering A Ontario 1,084 2
Pickering B Ontario 2,160 4
Point Lepreau New Brunswick 705 1
URANIUM - PRICES*
* The majority of Canadian uranium production is sold by long-term contract, as opposed to the on the spot market.
US$
per p
ound
of U
3O8
0
10
20
30
40
50
60
70
80
90
100
201920172015201320112009200720052003200119991997
Spot contracts U.S. purchases from foreign suppliers

CO
AL
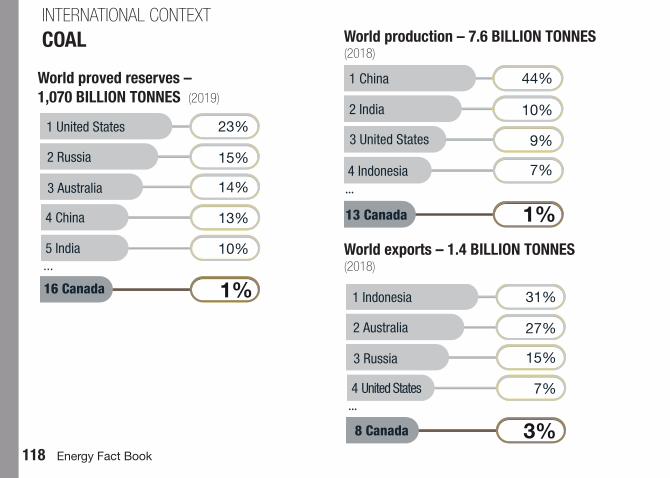
118 Energy Fact Book
INTERNATIONAL CONTEXTCOAL World production – 7.6 BILLION TONNES
(2018)
1 China 44%
2 India 10%
3 United States 9%
4 Indonesia
7%
13 Canada 1%...
World exports – 1.4 BILLION TONNES (2018)
7%
1 Indonesia 31%
2 Australia 27%
4 United States
3%
3 Russia
15%
8 Canada
...
World proved reserves –1,070 BILLION TONNES (2019)
13%
1 United States 23%
2 Russia 15%
4 China
10%5 India
1%
3 Australia
14%
16 Canada
...
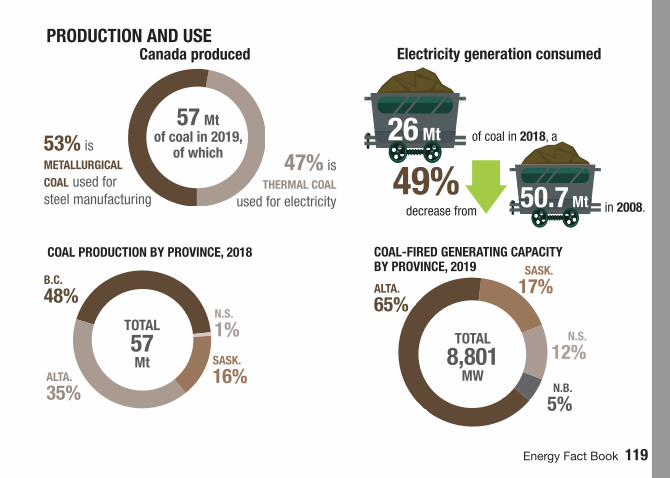
Energy Fact Book 119
PRODUCTION AND USE
COAL PRODUCTION BY PROVINCE, 2018
SASK. 16%ALTA.
35%
B.C. 48%
COAL-FIRED GENERATING CAPACITY BY PROVINCE, 2019
ALTA. 65%
SASK. 17%
N.S.
12%
N.B. 5%
TOTAL57Mt
TOTAL8,801
MW
49%
Canada produced
53% is METALLURGICAL COAL used for steel manufacturing
47% is THERMAL COAL
used for electricity
57 Mtof coal in 2019,
of which
Electricity generation consumed
26 Mt of coal in 2018, a
decrease from50.7 Mt in 2008.
N.S.
1%
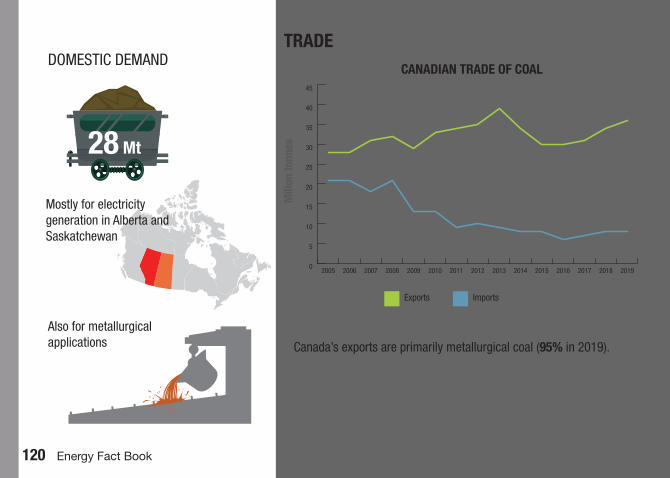
120 Energy Fact Book
TRADECANADIAN TRADE OF COAL
Exports ImportsM
ilion
tonn
es
0
5
10
15
20
25
30
35
40
45
201920182017201620152014201320122011201020092008200720062005
DOMESTIC DEMAND
28 Mt
Mostly for electricity generation in Alberta and Saskatchewan
Also for metallurgical applications Canada’s exports are primarily metallurgical coal (95% in 2019).
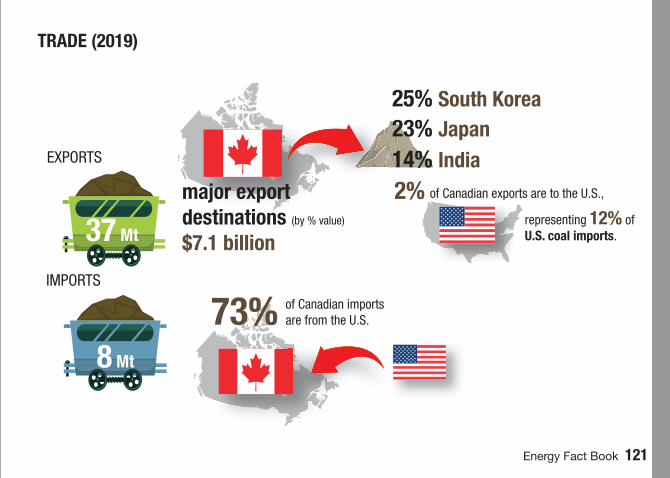
Energy Fact Book 121
TRADE (2019)
EXPORTS
IMPORTS
37 Mt
8 Mt
25% South Korea
major export destinations (by % value)
$7.1 billion
23% Japan14% India2%
73% of Canadian imports are from the U.S.
of Canadian exports are to the U.S.,
representing 12% of U.S. coal imports.

122 Energy Fact Book
ANNEXES
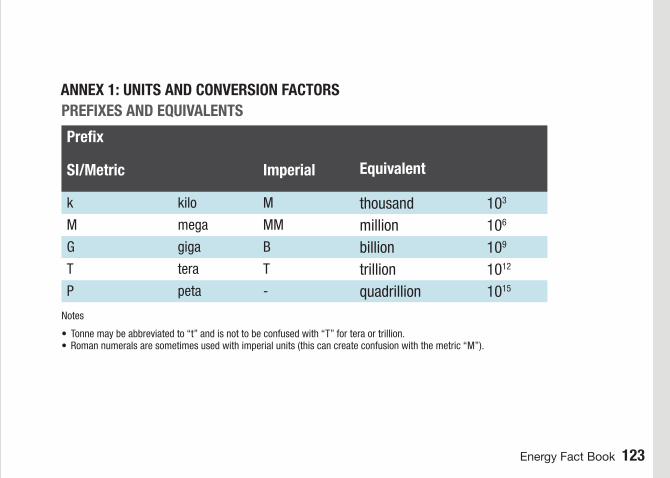
Energy Fact Book 123
ANNEX 1: UNITS AND CONVERSION FACTORS
Prefix EquivalentSI/Metric Imperial
k kilo M thousand 103
M mega MM million 106
G giga B billion 109
T tera T trillion 1012
P peta - quadrillion 1015
PREFIXES AND EQUIVALENTS
Notes
• Tonne may be abbreviated to “t” and is not to be confused with “T” for tera or trillion.• Roman numerals are sometimes used with imperial units (this can create confusion with the metric “M”).
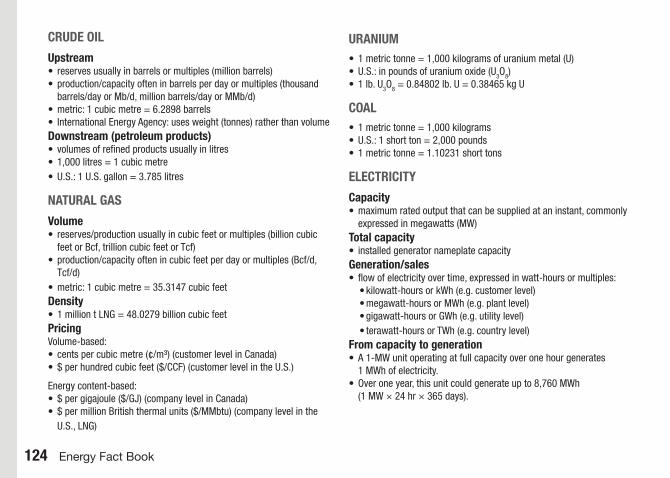
124 Energy Fact Book
CRUDE OIL
Upstream• reserves usually in barrels or multiples (million barrels)• production/capacity often in barrels per day or multiples (thousand
barrels/day or Mb/d, million barrels/day or MMb/d)• metric: 1 cubic metre = 6.2898 barrels• International Energy Agency: uses weight (tonnes) rather than volumeDownstream (petroleum products)• volumes of refined products usually in litres• 1,000 litres = 1 cubic metre• U.S.: 1 U.S. gallon = 3.785 litres
NATURAL GAS
Volume• reserves/production usually in cubic feet or multiples (billion cubic
feet or Bcf, trillion cubic feet or Tcf)• production/capacity often in cubic feet per day or multiples (Bcf/d,
Tcf/d)• metric: 1 cubic metre = 35.3147 cubic feetDensity• 1 million t LNG = 48.0279 billion cubic feetPricingVolume-based:• cents per cubic metre (¢/m³) (customer level in Canada)• $ per hundred cubic feet ($/CCF) (customer level in the U.S.)
Energy content-based:• $ per gigajoule ($/GJ) (company level in Canada)• $ per million British thermal units ($/MMbtu) (company level in the
U.S., LNG)
URANIUM• 1 metric tonne = 1,000 kilograms of uranium metal (U)• U.S.: in pounds of uranium oxide (U3O8) • 1 lb. U3O8 = 0.84802 lb. U = 0.38465 kg U
COAL• 1 metric tonne = 1,000 kilograms• U.S.: 1 short ton = 2,000 pounds• 1 metric tonne = 1.10231 short tons
ELECTRICITY
Capacity• maximum rated output that can be supplied at an instant, commonly
expressed in megawatts (MW)Total capacity• installed generator nameplate capacityGeneration/sales• flow of electricity over time, expressed in watt-hours or multiples:
• kilowatt-hours or kWh (e.g. customer level)• megawatt-hours or MWh (e.g. plant level)• gigawatt-hours or GWh (e.g. utility level)• terawatt-hours or TWh (e.g. country level)
From capacity to generation• A 1-MW unit operating at full capacity over one hour generates
1 MWh of electricity.• Over one year, this unit could generate up to 8,760 MWh
(1 MW × 24 hr × 365 days).
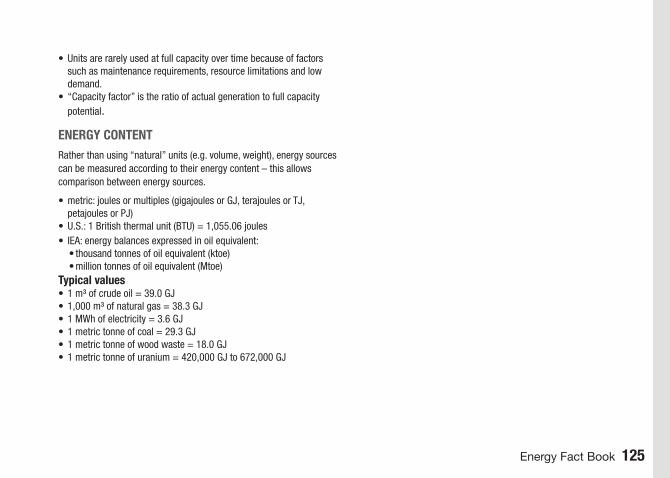
Energy Fact Book 125
• Units are rarely used at full capacity over time because of factors such as maintenance requirements, resource limitations and low demand.
• “Capacity factor” is the ratio of actual generation to full capacity potential.
ENERGY CONTENTRather than using “natural” units (e.g. volume, weight), energy sources can be measured according to their energy content – this allows comparison between energy sources.
• metric: joules or multiples (gigajoules or GJ, terajoules or TJ, petajoules or PJ)
• U.S.: 1 British thermal unit (BTU) = 1,055.06 joules• IEA: energy balances expressed in oil equivalent:
• thousand tonnes of oil equivalent (ktoe)• million tonnes of oil equivalent (Mtoe)
Typical values• 1 m³ of crude oil = 39.0 GJ• 1,000 m³ of natural gas = 38.3 GJ• 1 MWh of electricity = 3.6 GJ• 1 metric tonne of coal = 29.3 GJ• 1 metric tonne of wood waste = 18.0 GJ• 1 metric tonne of uranium = 420,000 GJ to 672,000 GJ
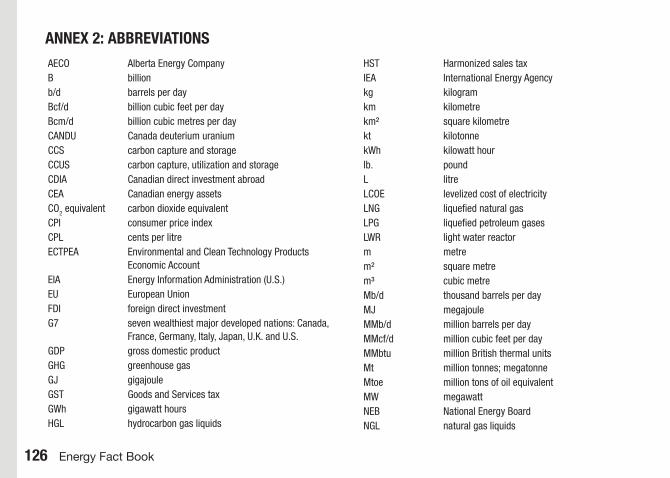
126 Energy Fact Book
ANNEX 2: ABBREVIATIONSAECO Alberta Energy Company B billion b/d barrels per dayBcf/d billion cubic feet per dayBcm/d billion cubic metres per dayCANDU Canada deuterium uraniumCCS carbon capture and storageCCUS carbon capture, utilization and storageCDIA Canadian direct investment abroadCEA Canadian energy assetsCO2 equivalent carbon dioxide equivalentCPI consumer price indexCPL cents per litreECTPEA Environmental and Clean Technology Products
Economic AccountEIA Energy Information Administration (U.S.)EU European UnionFDI foreign direct investmentG7 seven wealthiest major developed nations: Canada,
France, Germany, Italy, Japan, U.K. and U.S.GDP gross domestic productGHG greenhouse gasGJ gigajouleGST Goods and Services taxGWh gigawatt hoursHGL hydrocarbon gas liquids
HST Harmonized sales taxIEA International Energy Agencykg kilogramkm kilometrekm² square kilometrekt kilotonnekWh kilowatt hourlb. poundL litreLCOE levelized cost of electricityLNG liquefied natural gasLPG liquefied petroleum gasesLWR light water reactorm metrem² square metrem³ cubic metreMb/d thousand barrels per dayMJ megajouleMMb/d million barrels per dayMMcf/d million cubic feet per dayMMbtu million British thermal unitsMt million tonnes; megatonneMtoe million tons of oil equivalentMW megawattNEB National Energy BoardNGL natural gas liquids
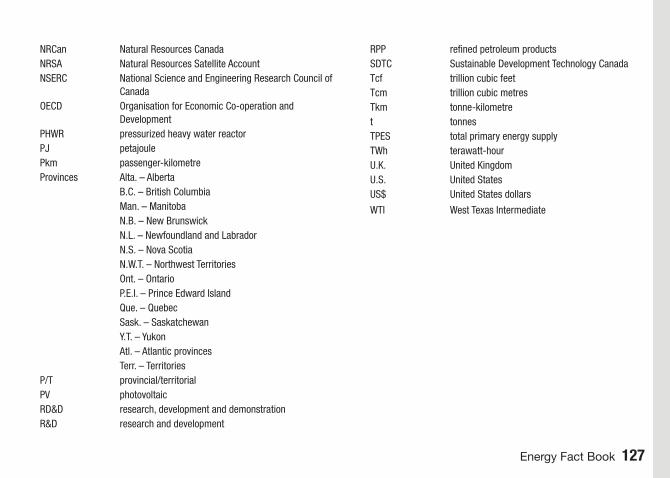
Energy Fact Book 127
NRCan Natural Resources CanadaNRSA Natural Resources Satellite AccountNSERC National Science and Engineering Research Council of
CanadaOECD Organisation for Economic Co-operation and
DevelopmentPHWR pressurized heavy water reactorPJ petajoulePkm passenger-kilometreProvinces Alta. – Alberta B.C. – British Columbia Man. – Manitoba N.B. – New Brunswick N.L. – Newfoundland and Labrador N.S. – Nova Scotia N.W.T. – Northwest Territories Ont. – Ontario P.E.I. – Prince Edward Island Que. – Quebec Sask. – Saskatchewan Y.T. – Yukon Atl. – Atlantic provinces Terr. – TerritoriesP/T provincial/territorialPV photovoltaicRD&D research, development and demonstrationR&D research and development
RPP refined petroleum productsSDTC Sustainable Development Technology CanadaTcf trillion cubic feetTcm trillion cubic metresTkm tonne-kilometret tonnesTPES total primary energy supplyTWh terawatt-hourU.K. United KingdomU.S. United StatesUS$ United States dollars
WTI West Texas Intermediate
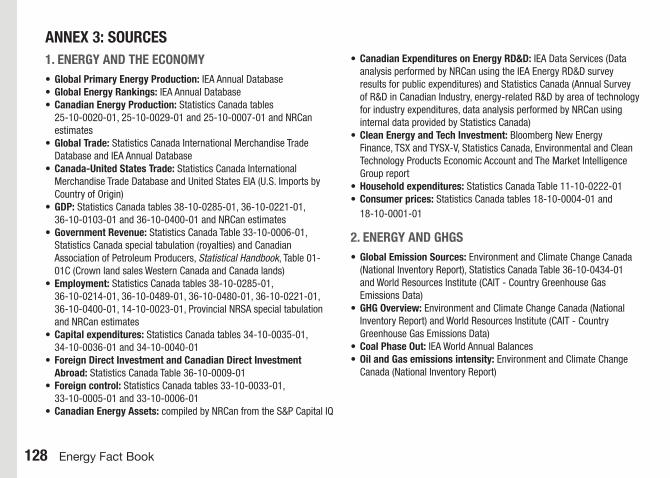
128 Energy Fact Book
ANNEX 3: SOURCES1. ENERGY AND THE ECONOMY • Global Primary Energy Production: IEA Annual Database• Global Energy Rankings: IEA Annual Database• Canadian Energy Production: Statistics Canada tables
25-10-0020-01, 25-10-0029-01 and 25-10-0007-01 and NRCan estimates
• Global Trade: Statistics Canada International Merchandise Trade Database and IEA Annual Database
• Canada-United States Trade: Statistics Canada International Merchandise Trade Database and United States EIA (U.S. Imports by Country of Origin)
• GDP: Statistics Canada tables 38-10-0285-01, 36-10-0221-01, 36-10-0103-01 and 36-10-0400-01 and NRCan estimates
• Government Revenue: Statistics Canada Table 33-10-0006-01, Statistics Canada special tabulation (royalties) and Canadian Association of Petroleum Producers, Statistical Handbook, Table 01-01C (Crown land sales Western Canada and Canada lands)
• Employment: Statistics Canada tables 38-10-0285-01, 36-10-0214-01, 36-10-0489-01, 36-10-0480-01, 36-10-0221-01, 36-10-0400-01, 14-10-0023-01, Provincial NRSA special tabulation and NRCan estimates
• Capital expenditures: Statistics Canada tables 34-10-0035-01, 34-10-0036-01 and 34-10-0040-01
• Foreign Direct Investment and Canadian Direct Investment Abroad: Statistics Canada Table 36-10-0009-01
• Foreign control: Statistics Canada tables 33-10-0033-01, 33-10-0005-01 and 33-10-0006-01
• Canadian Energy Assets: compiled by NRCan from the S&P Capital IQ
• Canadian Expenditures on Energy RD&D: IEA Data Services (Data analysis performed by NRCan using the IEA Energy RD&D survey results for public expenditures) and Statistics Canada (Annual Survey of R&D in Canadian Industry, energy-related R&D by area of technology for industry expenditures, data analysis performed by NRCan using internal data provided by Statistics Canada)
• Clean Energy and Tech Investment: Bloomberg New Energy Finance, TSX and TYSX-V, Statistics Canada, Environmental and Clean Technology Products Economic Account and The Market Intelligence Group report
• Household expenditures: Statistics Canada Table 11-10-0222-01• Consumer prices: Statistics Canada tables 18-10-0004-01 and
18-10-0001-01
2. ENERGY AND GHGS • Global Emission Sources: Environment and Climate Change Canada
(National Inventory Report), Statistics Canada Table 36-10-0434-01 and World Resources Institute (CAIT - Country Greenhouse Gas Emissions Data)
• GHG Overview: Environment and Climate Change Canada (National Inventory Report) and World Resources Institute (CAIT - Country Greenhouse Gas Emissions Data)
• Coal Phase Out: IEA World Annual Balances• Oil and Gas emissions intensity: Environment and Climate Change
Canada (National Inventory Report)
Energy Fact Book 129
• Electricity GHG: Environment and Climate Change Canada (Environmental Indicators: Greenhouse Gas Emissions by Canadian Economic Sector 1990 to 2016)
• Non-emitting electricity share: World Bank (Sustainable Energy for All database Global Tracking Framework)
• Solar and Wind Generation: IEA Annual Database• Transportation GHG: Environment and Climate Change Canada
(Environmental Indicators: Greenhouse Gas Emissions by Canadian Economic Sector 1990 to 2016)
• Transportation Fuel Mix: Office of Energy Efficiency’s National Energy Use Database
• Electric Vehicle Sales: Green Car Reports and Bloomberg New Energy Finance
• Province and Territory GHG Emissions: Environment and Climate Change Canada (Environmental Indicators: Greenhouse Gas Emissions by Province and territory 1990 to 2016) and Statistics Canada Table 17-10-0005-01
• Total primary energy supply: IEA Annual Database, World Energy Balances and IEA Standing Group on Long-Term Co-operation questionnaire
• Primary and secondary energy use: Office of Energy Efficiency’s National Energy Use Database
• Energy efficiency: Office of Energy Efficiency’s National Energy Use Database and NRCan (Energy Efficiency Trends in Canada 1990 to 2015)
• Energy intensity: Office of Energy Efficiency’s National Energy Use Database
• Energy in our daily lives: NRCan (Energy Efficiency Trends in Canada 1990 to 2015)
• Residential Energy Use, water heating and space heating: Office of Energy Efficiency’s National Energy Use Database and NRCan estimates
• Residential, commercial and institutional sector: Office of Energy Efficiency’s National Energy Use Database Trends in Energy Use and Intensity: Office of Energy Efficiency Energy Use Database (Efficiency Trends Analysis tables)
• Transition to a low-carbon Future: Pan-Canadian Framework on Clean Growth and Climate Change and Environment and Climate Change Canada (National Inventory Report)
• Carbon Price: The World Bank Carbon Pricing Dashboard
3. CRUDE OIL• World production and exports: IEA Online Data Services• World proved reserves: Oil and Gas Journal (Worldwide Look at
Reserves and Production)• Canadian resources: Canadian Association of Petroleum Producers
Statistical Handbook tables 2.6 (Crude Oil Remaining Established Reserves) and 2.1a (Crude Reserves) Alberta Energy Regulator ST98 (Alberta’s Energy Reserves and Supply/Demand Outlook), tables R4.5 (Conventional crude oil reserves as of each year-end), R3.2 (Reserve and production change highlights) and 1 (Resources, reserves and production summary)
• Wells completed and metres drilled in western Canada: Canadian Association of Petroleum Producers, Statistical Handbook, Table 1.2 (2017 Drilling activity)
• Canadian & provincial production: Statistics Canada tables 25-10-0014-01 and 25-10-0063-01 and NRCan analysis
130 Energy Fact Book
• Canadian supply and demand: Statistics Canada tables 25-10-0014-01, 25-10-0063-01, 25-10-0041-01 and 25-10-0039-01 and Statistics Canada International Merchandise Trade Database
• Trade: Statistics Canada tables 25-10-0014-01 and 25-10-0063-01 and Statistics Canada International Merchandise Trade Database, United States EIA (Imports by Country of Origin, Refining and Processing, total crude oil and products, consumption/sales)
• Prices: United States EIA tables (Spot Prices for Crude Oil) and Sproule
• Oil sands: Canadian Association of Petroleum Producers, Statistical Handbook, Table 4-16B (Canada Oil Sands Expenditures), Statistics Canada tables 34-10-0036-01, 25-10-0014-01 and 25-10-0063-01, Alberta Energy Regulator ST98 (Alberta’s Energy Reserves and Supply/Demand Outlook) table S3.1 (Crude bitumen production), Canada’s Oil Sands Innovation Alliance, CanOils Database and NRCan analysis
• Light tight Oil/Shale Oil: United States EIA (World Shale Gas Resources, Technically Recoverable Shale Oil Resources)
• Reserves by provinces: Alberta Energy Regulator ST98 (Alberta’s Energy Reserves and Supply/Demand Outlook) tables R4.1 (Reserves and production changes in crude oil) and R4.5 (Conventional crude oil reserves as of each year-end), Canadian Association of Petroleum Producers, Statistical Handbook, Table 2.1a (Crude Reserves) and NEB
• Environmental considerations: NRCan compiled using Environment and Climate Change Canada (National Inventory Report 1990 to 2016: Greenhouse Gas Sources and Sinks in Canada), World Resources Institute (CAIT - Country Greenhouse Gas Emissions Data), Alberta Government (Oil Sands Information Portal), Alberta
Energy Regulator, Statistics Canada, NRCan Boreal forest website, Alberta Government Lower Athabasca Regional Plan and Canadian Association of Petroleum Producers (Frequently used statistics)
• Pipelines: compiled by NRCan• Transportation: Statistics Canada table 23-10-0216-01, Canadian
Association of Petroleum Producers (Crude Oil Forecast, Markets & Transportation), Oil Sands Magazine (Crude-By-Rail Loading & Offloading Terminals), NEB (Featured articles, Canadian Crude Oil Exports by Rail – Quarterly Data) and various sources
• Key Facts: CanOils Database
4. PETROLEUM PRODUCTS• Canadian refineries: compiled by NRCan (from company
information, Conference Board of Canada, Canada’s Petroleum Refining Sector Canadian Fuels Association, Canadian Association of Petroleum Producers, Oil Sands magazine and CanOils Database)
• Canadian supply and demand: Statistics Canada tables 25-10-0042-01 and 25-10-0044-01 and NRCan analysis
• Refineries crude supply: Statistics Canada table 25-10-0063-01• Sales by Product: Statistics Canada table 25-10-0044-01 and
NRCan analysis• Trade: Statistics Canada table 25-10-0044-01, United States EIA
(U.S. Imports by Country of Origin for Petroleum and Other Liquids) and Statistics Canada International Merchandise Trade Database
• Gasoline prices: Kent Group Ltd (average retail prices for regular gasoline and diesel fuel) and data compiled by NRCan
• Refinery capacity: compiled by NRCan

Energy Fact Book 131
5. HYDROCARBON GAS LIQUIDS• Canadian supply and demand: Statistics Canada tables
25-10-0044-01 and 25-10-0036-01, NEB (Exports) and Statistics Canada International Merchandise Trade Database (Imports)
• Production by province: Canadian Association of Petroleum Producers, Statistical Handbook, tables 3.5 (Canadian Propane Production), 3.6 (Canadian Butane Production), and 3.14 (Canadian Ethane Production) and Statistics Canada table 25-10-0042-01
• Natural gas liquids energy use: Office of Energy Efficiency’s National Energy Use Database
6. NATURAL GAS• World production and exports: IEA (Natural Gas Information)• World proved reserves: Oil and Gas Journal• World resources and technically recoverable resources: IEA
(World Energy Outlook 2017, 2014 and 2013) tables 5.3 (Remaining technically recoverable natural gas resources by type and region), 8.2 (Remaining technically recoverable natural gas resources by type) and 3.3 (Remaining technically recoverable natural gas resources by type and region) and Oil and Gas Journal (Worldwide Look at Reserves and Production)
• Canada reserves: Canadian Association of Petroleum Producers Statistical Handbook table 2-13b (Marketable Natural Gas Remaining Established Reserves in Canada at Year End)
• United States reserves: United States EIA (Natural Gas Reserves Summary, dry gas)
• Canada resources and technically recoverable resources: NEB (Short-term Canadian natural gas deliverability 2014 to 2016 and Canada’s Energy Future 2017: Energy Supply and Demand Projections to 2040)
• United States resources and technically recoverable resources: United States EIA (Technically Recoverable Shale Oil and Shale Gas Resources, June 2013, US total)
• Shale gas and Tight Gas: United States EIA (World Shale Resource Assessments, Technically Recoverable Shale Gas Resources) Table 6 (Technically Recoverable Shale Gas Resources) and NEB (Canada’s Energy Future 2017: Energy Supply and Demand Projections to 2040)
• Canada-United States market: compiled by NRCan from Statistics Canada, United States EIA (US Natural Gas Imports by Country), NEB (Natural Gas Imports, Exports and Liquefied Natural Gas Statistics, Commodity Statistics for LNG imports, LNG Shipment Details)
• Wells completed and metres drilled in Canada: Daily Oil Bulletin (Wells Completions – Annual Breakdown by Province and Wells Counts and Metres Drilled – Western Canada) and Canadian Association of Petroleum Producers, Statistical Handbook, Table 1.2 (Drilling activity)
• Canadian and provincial production: Statistics Canada tables 25-10-0047-01 and 25-10-0055-01, NEB (Short term Canadian Natural Gas Deliverability 2014 to 2016)
• United States production: United States EIA (Annual energy Outlook) tables (Natural Gas Gross Withdrawals and Production, Natural Gas by Country Imports, Exports & LNG Statistics)
• North American LNG imports: International Gas Union (IGU World Gas LNG Report, 2018 edition) Table 3.2 (LNG Trade Volumes Between Countries)
• Trade: NEB (Natural Gas Imports, Exports and Liquefied Natural Gas Statistics, Commodity Statistics for Pipeline Trade Gas Monthly Summary for the Year), United States EIA (Natural Gas Consumption by End Use), Statistics Canada International Merchandise Trade Database and calculations by NRCan
132 Energy Fact Book
• Prices: Sproule Price Forecast• Pipelines: compiled by NRCan• Natural gas energy use: Office of Energy Efficiency• Consumption: Statistics Canada Table 25-10-0030-01 and IEA Annual
Mini-Questionnaire
7. ELECTRICITY• World production and exports: IEA database (Electricity Information
[note: IEA production/generation data is expressed on a “gross” basis, i.e. before generating station use])
• Trade: NEB Table (Electricity Exports and Imports Statistics), Statistics Canada and United States EIA Table 5.1 (Retail Sales of Electricity to Ultimate Customers)
• Canadian and provincial supply: compiled by Statistics Canada and NRCan’s Electricity Division from various sources
• Domestic demand: Statistics Canada Table 25-10-0030-01• Prices: Hydro-Québec (Comparison of Electricity Prices in Major North
American Cities) • Electricity energy use: Office of Energy Efficiency Comprehensive
Energy Use Database.• Levelized cost of electricity: Canadian Energy Research Institute,
Study No. 168. A Comprehensive Guide to Electricity Generation Options in Canada.
• World capacity: United Nations Energy Statistics Yearbook, Table 32 (Net installed capacity of electric generating plants)
8. RENEWABLE ENERGY• International context – Production: IEA (Renewables Information)• International context – share of energy supply: IEA (Electricity
Information, Energy Balances of OECD Countries, and Energy Balances of Non-OECD Countries) and United States EIA
• Domestic production: IEA (Renewables Information) and NRCan data based on Statistics Canada
• Hydro – international generation: IEA (Electricity Information, Energy Balances of OECD Countries, and Energy Balances of Non-OECD Countries)
• Hydro – capacity in Canada: Statistics Canada Table 25-10-0022-01 and compiled by NRCan
• Hydro – facilities and projects: compiled by NRCan from Statistics Canada and other public sources
• Wood and wood waste – Renewable balance: IEA database (Renewables balances)
• Wood and wood waste – production: Statistics Canada Table 25-10-0031-01, Statistics Canada International Merchandise Trade Database and NRCan
• Wood and wood waste – wood fuel use by sector: IEA (Renewables Information)
• Wood and wood waste – trade: Statistics Canada International Merchandise Trade Database
• Wind – international context: Global Wind Energy Council (Global Wind Report)
• Wind – capacity in Canada: compiled by NRCan from multiple sources (Canadian Wind Energy Association, Statistics Canada and NRCan)
• Wind – generation in Canada: Statistics Canada Table 25-10-0020-01
• Wind – wind farms: compiled by NRCan from Statistics Canada data and other public sources (including Canadian Wind Energy Association)
• Solar PV – international context: Renewable Energy Policy Network for the 21st Century (Renewables 2018 Global Status Report)
Energy Fact Book 133
• Solar PV – capacity in Canada: IEA (Canada’s Annual Report to the IEA Implementing Agreement on PV and 2018 Snapshot of Global Photovoltaic Markets) and compiled by NRCan
• Solar PV – solar PV farms: compiled by NRCan from Statistics Canada data and various public sources
• Solar PV – generation in Canada: Statistics Canada Table 25-10-0020-01
• Biofuels – production: Bloomberg New Energy Finance, F.O. Licht, Food and Agricultural Policy Research Institute, NRCan, United States EIA and Environment and Climate Change Canada
• Ethanol – production: United States EIA and Bloomberg New Energy Finance
• Biofuels – supply and demand : Data compiled by NRCan from various public sources (Bloomberg New Energy Finance, F.O. Licht, Food and Agricultural Policy Research Institute, Environment and Climate Change Canada [2016 Biodiesel Production from Industry Representatives])
• Biofuels/ethanol – imports/exports: Statistics Canada data and Statistics Canada International Merchandise Trade Database
• Biofuels – ethanol prices: Haver Analytics, Office of Energy Efficiency and Chicago Ethanol Market Price
• Biofuels – regulations: compiled by Office of Energy Efficiency from various public sources
9. URANIUM AND NUCLEAR POWER• World production and exports: World Nuclear Association (World
Uranium Mining) and NRCan estimate based on World Nuclear Association production data
• World known recoverable resources of uranium: World Nuclear Association (Supply of Uranium) and OECD Nuclear Energy Agency and International Atomic Energy Agency
• Nuclear power world generation: United States EIA (International Energy Statistics) table (Nuclear Electricity Net Generation), International Atomic Energy Agency, OECD, and Nuclear energy agency
• Canadian supply and demand: World Nuclear Association (Uranium in Canada), Cameco Annual report and compiled by NRCan from company information
• Purchases by U.S. nuclear reactors: United States EIA (Uranium Marketing Annual Report) Table 3 (Uranium purchased by owners and operators of U.S. civilian nuclear power reactors by origin country and delivery year)
• Nuclear power plants in Canada: compiled by NRCan from Statistics Canada Table 57-206, International Atomic Energy Agency Power Reactor Information System and other public sources
• Spot prices: UX Consulting Company provided by NRCan Uranium and Radioactive Waste Division
10. COAL• World proved reserves: World Energy Council (BP statistical review
of world energy)• World production and exports: IEA (Coal Information and world
energy balances)• Canadian supply and demand: Statistics Canada International
Merchandise Trade Database• Coal by province: Statistics Canada tables 25-10-0046-01 and
25-10-0017-01 and NRCan estimates• Coal-fueled power plants: compiled by NRCan from Statistics
Canada Table 57-206 and other public sources


CANADIAN CENTRE FOR ENERGY INFORMATION
The purpose of the Canadian Centre for Energy Information (CCEI) is to provide a convenient one-stop shop for information on Canada’s energy future. The CCEI will present energy information in a way
that is easy for a wide range of data users to understand. It will integrate data from federal, provincial and territorial sources across Canada.
https://energy-information.canada.ca/index-eng.htm