Modeling ductile to brittle transition temperature of functionally graded steels by artificial...
11
Modeling ductile to brittle transition temperature of functionally graded steels by fuzzy logic Ali Nazari • Amir Ali Milani Received: 12 January 2011 / Accepted: 23 February 2011 / Published online: 26 April 2011 Ó Springer Science+Business Media, LLC 2011 Abstract In this article, a model based on fuzzy logic (FL) for predicting ductile to brittle transition temperature of functionally graded steels in both crack divider and crack arrester configurations has been presented. Functionally graded steels containing graded ferritic and austenitic regions together with bainite and martensite intermediate layers were produced by electroslag remelt- ing. For purpose of building the model, training and testing using experimental results from 140 specimens produced from two basic composites were conducted. The used data as inputs in FL models are arranged in a format of six input parameters that cover the FGS type, the crack tip config- uration, the thickness of graded ferritic region, the thick- ness of graded austenitic region, the distance of the notch from bainite or martensite intermediate layer, and tem- perature. According to these input parameters, in the FL, the ductile to brittle transition temperature of each FGS specimen was predicted. It has been found that FL model will be valid within the ranges of variables. The training and testing results in the FL model have shown a strong potential for predicting the ductile to brittle transition temperature of each FGS specimen. Introduction Evaluations on damage of the composite and functionally graded structures is of very interesting fields in mechanics of materials [1, 2]. The ductile to brittle transition tem- perature (DBTT) is a phenomenon which is widely observed in BCC metals and in covalently based materials. Below a critical temperature (DBTT), the materials sud- denly lose their ductility. The controlling mechanism of this transition still remains unclear despite of large efforts made in experimental and theoretical investigation. Charpy (CVN) impact test is a widely used test on notched spec- imens which are submitted to the impact of a hammer with the given kinetic energy [3] to evaluate DBTT. Steel alloys have been investigated extensively during the past years due to its wide application in engineering. Ductile crack growth initiated by the formation of disconnected ductile microcracks can be found in most of steel alloys. However, the mechanism of the formation of microvoids and their special distribution ahead of the crack tip may be different. Recently, Ebrahimi and Seo [4] have investigated crack initiations in a two specific type of steels: a ferritic– pearlitic and a bainitic structural steel. In the ferritic– pearlitic steel, relatively large inclusions, mainly manga- nese sulfide, were found to be close to the crack tip, where microvoids may form due to high shear stresses, ductile cracks usually grow along the position of these particles. For bainitic steels, geometrical inhomogeneities were found to be the main reason for the formation of local microcracks. Very few fracture experiments, particularly dynamic fracture, of FGMs have been reported. Among them, crack tip deformation and fracture parameter history in func- tionally graded glass-filled epoxy were evaluated for low velocity impact loading by Rousseau and Tippur [5]. Guo and Noda [6] studied the dynamic response of a function- ally graded layered structure with a crack crossing the interface with in-plane impact loading condition. Xu et al. [7] investigated the plane strain problem of semi-infinite cracks in an infinite functionally graded orthotropic mate- rial with opening and in-plane shear impact loading modes. A. Nazari (&) A. A. Milani Department of Materials Science and Engineering, Saveh Branch, Islamic Azad University, Saveh, Iran e-mail: [email protected] 123 J Mater Sci (2011) 46:6007–6017 DOI 10.1007/s10853-011-5563-z
-
Upload
independent -
Category
Documents
-
view
0 -
download
0
Transcript of Modeling ductile to brittle transition temperature of functionally graded steels by artificial...
Modeling ductile to brittle transition temperature of functionallygraded steels by fuzzy logic
Ali Nazari • Amir Ali Milani
Received: 12 January 2011 / Accepted: 23 February 2011 / Published online: 26 April 2011
� Springer Science+Business Media, LLC 2011
Abstract In this article, a model based on fuzzy logic
(FL) for predicting ductile to brittle transition temperature
of functionally graded steels in both crack divider
and crack arrester configurations has been presented.
Functionally graded steels containing graded ferritic and
austenitic regions together with bainite and martensite
intermediate layers were produced by electroslag remelt-
ing. For purpose of building the model, training and testing
using experimental results from 140 specimens produced
from two basic composites were conducted. The used data
as inputs in FL models are arranged in a format of six input
parameters that cover the FGS type, the crack tip config-
uration, the thickness of graded ferritic region, the thick-
ness of graded austenitic region, the distance of the notch
from bainite or martensite intermediate layer, and tem-
perature. According to these input parameters, in the FL,
the ductile to brittle transition temperature of each FGS
specimen was predicted. It has been found that FL model
will be valid within the ranges of variables. The training
and testing results in the FL model have shown a strong
potential for predicting the ductile to brittle transition
temperature of each FGS specimen.
Introduction
Evaluations on damage of the composite and functionally
graded structures is of very interesting fields in mechanics
of materials [1, 2]. The ductile to brittle transition tem-
perature (DBTT) is a phenomenon which is widely
observed in BCC metals and in covalently based materials.
Below a critical temperature (DBTT), the materials sud-
denly lose their ductility. The controlling mechanism of
this transition still remains unclear despite of large efforts
made in experimental and theoretical investigation. Charpy
(CVN) impact test is a widely used test on notched spec-
imens which are submitted to the impact of a hammer with
the given kinetic energy [3] to evaluate DBTT. Steel alloys
have been investigated extensively during the past years
due to its wide application in engineering. Ductile crack
growth initiated by the formation of disconnected ductile
microcracks can be found in most of steel alloys. However,
the mechanism of the formation of microvoids and their
special distribution ahead of the crack tip may be different.
Recently, Ebrahimi and Seo [4] have investigated crack
initiations in a two specific type of steels: a ferritic–
pearlitic and a bainitic structural steel. In the ferritic–
pearlitic steel, relatively large inclusions, mainly manga-
nese sulfide, were found to be close to the crack tip, where
microvoids may form due to high shear stresses, ductile
cracks usually grow along the position of these particles.
For bainitic steels, geometrical inhomogeneities were
found to be the main reason for the formation of local
microcracks.
Very few fracture experiments, particularly dynamic
fracture, of FGMs have been reported. Among them, crack
tip deformation and fracture parameter history in func-
tionally graded glass-filled epoxy were evaluated for low
velocity impact loading by Rousseau and Tippur [5]. Guo
and Noda [6] studied the dynamic response of a function-
ally graded layered structure with a crack crossing the
interface with in-plane impact loading condition. Xu et al.
[7] investigated the plane strain problem of semi-infinite
cracks in an infinite functionally graded orthotropic mate-
rial with opening and in-plane shear impact loading modes.
A. Nazari (&) � A. A. Milani
Department of Materials Science and Engineering,
Saveh Branch, Islamic Azad University, Saveh, Iran
e-mail: [email protected]
123
J Mater Sci (2011) 46:6007–6017
DOI 10.1007/s10853-011-5563-z
Bezensek and Hancock [8] studied the toughness of laser
welded joints of low alloy steel under mode I and mixed
mode configuration along with Charpy impact tests.
Functionally graded steels have been produced by
electroslag remelting process (ESR) [9]. Studies on trans-
formation characteristics of FGSs produced from austenitic
stainless steel and plain carbon steel has revealed that as
chromium, nickel, and carbon atoms diffuse at remelting
stage, alternating regions with different transformation
characteristics are created. When appropriate arrangement
and thickness of original ferritic ( _a) and original austenitic
( _c) steels is selected to make electrodes, composites with
graded ferrite, and austenite regions together with bainite
or martensite layers may be made as follows [9];
ð _a _cÞel�!R ðabcÞcom
ð _c _a _cÞel�!R ðcMcÞcom
where a andcare graded ferrite and austenite regions in the
final composite, respectively, b and M are bainite and
martensite layers in the final composite, respectively, el is
electrode, com is composite, and R is remelting.
Transformation characteristics [9], tensile strength [10],
Charpy impact energy [11–13], and fracture toughness [14,
15] of FGSs has been modeled previously. Since func-
tionally graded steels are made of different structures,
investigations on DBTT seem interesting. One may antic-
ipate that by dislocating the crack in graded regions, the
transition temperature may be altered. Thus, in this study is
to investigate DBTT of FGSs in crack divider configuration
(Fig. 1a) together with DBTT of FGSs in crack arrester
configuration (Fig. 1b) and different notch tip positions
with respect to the bainite or martensite layers.
Over the last two decades, a different modeling method
based on fuzzy logic (FL) has become popular and has
been used by many researchers for a variety of engineering
applications. Fuzzy control theory can be applied on linear
and nonlinear systems. It does not need to handle the
tedious mathematical models of controlled body. It needs
only to set a simple controlling method based on engi-
neering experience. Therefore, it is particularly useful in
complicated structural control system. The Charpy impact
energy (CVN) can be calculated using the models built
with FL. It is convenient and easy to use these models for
numerical experiments to review the effects of each vari-
able on the CVN values [16, 17].
The aim of this study is to predict ductile to brittle
transition temperature of functionally graded steels in both
crack divider and crack arrester configurations by FL.
Totally 140 data of Charpy impact tests in different tem-
peratures were collected, trained, and tested by means of
FL. The obtained results have been compared by experi-
mental ones to evaluate the software power for predicting
the DBTT of FGSs.
Experimental procedure
Similar to the previous studies [9–15], to make FGSs, a
miniature ESR apparatus was used. The slag was a mixture
of 20% CaO, 20% Al2O3, and 60% CaF2. The original
ferritic and austenitic steels which used as electrodes were
commercial type AISI 1020 and AISI 316 steels with the
chemical composition presented in Table 1.
Two arrangements of ferritic–pearlitic and austenitic
steel slices in the form of a two-piece _a _c electrode and
three-piece _c _a _c electrode were spot welded. The height of
each slice in the two-piece _a _c electrode was 150 mm and in
the three-piece _c _a _c electrode, the height of the middle slice
was 25 mm and that of the neighboring slices was
137.5 mm.
Remelting was carried out under a constant power
supply of 16KVA. After remelting, composite ingots were
hot-pressed at 980 �C down to the thickness of 20 mm, and
then were air-cooled.
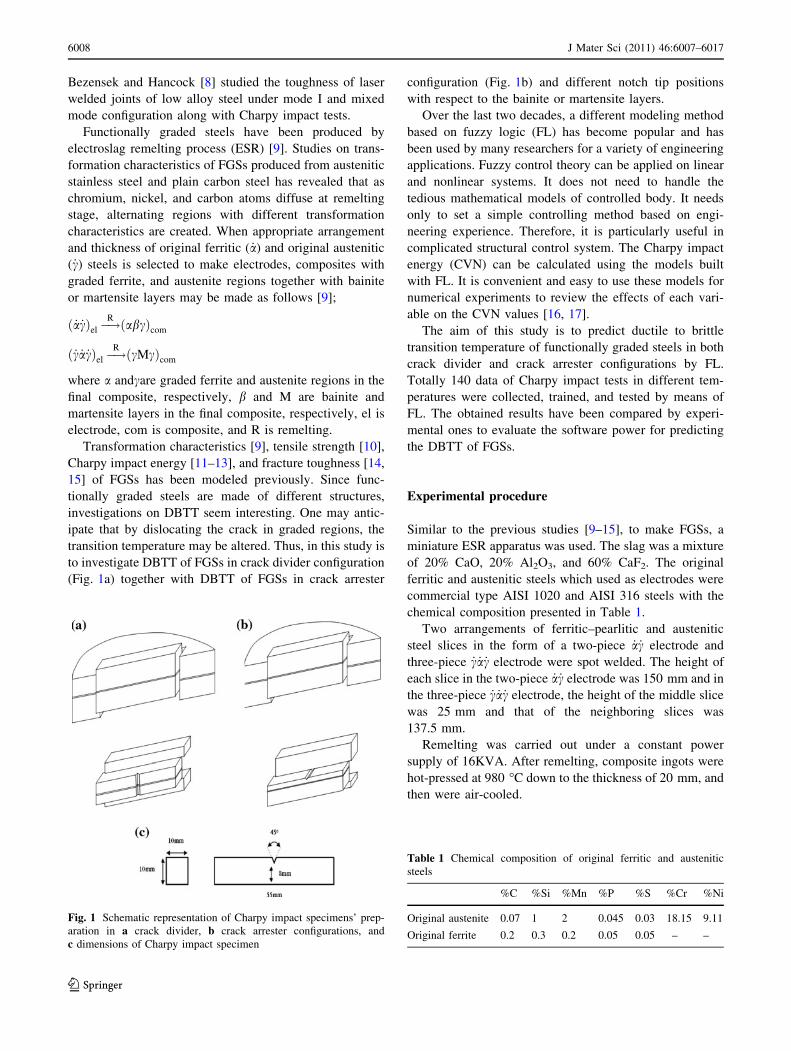
Fig. 1 Schematic representation of Charpy impact specimens’ prep-
aration in a crack divider, b crack arrester configurations, and
c dimensions of Charpy impact specimen
Table 1 Chemical composition of original ferritic and austenitic
steels
%C %Si %Mn %P %S %Cr %Ni
Original austenite 0.07 1 2 0.045 0.03 18.15 9.11
Original ferrite 0.2 0.3 0.2 0.05 0.05 – –
6008 J Mater Sci (2011) 46:6007–6017
123
The impact energy of FGSs in both crack divider and
crack arrester configurations was evaluated by Charpy
impact test in the range of 123–573 K, at intervals of 50 K,
using standard sized specimens (10 9 10 9 50 mm)
according to the ASTM E23 [18]. The dimension of the
specimens is shown in Fig. 1c. In crack divider configu-
ration, from the middle of each hot-pressed specimen eight
series of Charpy impact specimen was prepared. For crack
arrester configuration, from the produced abc composite
ingots, and at a certain temperature, eight series of Charpy
specimens were produced in some manner that the bainite
intermediate layers was placed at different positions with
respect to the notch tip; in four series of the specimens the
notch was placed in a and in the other four in c region. The
Charpy impact energy test was carried out triplicately and
the average of the obtained results was reported. From cMccomposite ingots, due to their symmetric configuration,
only four series of Charpy impact specimens with different
positions of bainite or martensite layers were produced for
each certain temperature.
Charpy impact energy of as-received ferritic and
austenitic steels which were annealed at 980 �C and then
were air-cooled and Charpy impact energy of single-phase
bainite and martensite with composition and mechanical
properties analogous to the bainite and martensite layers
was also measured in the range of 123–573 K, at intervals
of 50 K. The production method of single-phase specimens
with chemical composition and mechanical properties
identical to the bainitic and martensitic layers was similar
to the previous works [11, 12]. To do this, Charpy impact
specimens of the same composition and mechanical prop-
erties to bainitic and martensitic layers were produced.
Initially, the average chemical composition of bainite and
martensite layers was obtained (Table 2). Afterward,
bainitic and martensitic samples with the chemical com-
position in accordance to the average chemical composi-
tion of bainitic and martensitic layers were produced by
means of a vacuum induction furnace. Similar to the pri-
mary composites, the hot-pressing process was carried out
at 980 �C, followed by air cooling. Through trial and error
(i.e., conforming the chemical composition and changing
the cooling rate), the samples with the nearest hardness to
bainitic and martensitic layers were selected and Charpy
impact test specimens from the bainitic and martensitic
samples were made. Charpy impact test results of single-
phase bainite and martensite specimens produced from the
sample are shown in Table 3 [11, 12].
For metallographic examinations, the plates were sliced,
ground, polished, and etched in a ‘‘Kalling’’ solution and 1
pct ‘‘Nital.’’
Vickers microhardness tests were carried out using
100 g weight to evaluate microhardness profile and to
verify the location of bainite or martensite intermediate
layers.
Table 2 Chemical composition (wt%) of bainitic and martensitic layers together with the single-phase bainite and martensite specimens
produced from samples
Specimen studied Pct Cr Pct Ni Pct C Pct Si Pct Mn Pct S Pct P
Single-phase bainite 14.5 7.2 0.12 0.8 1.8 0.03 0.04
Bainite specimen produced from the sample 14.7 7.15 0.13 0.85 1.9 0.032 0.045
Single-phase martensite 7.3 3.2 0.19 0.39 0.3 0.04 0.05
Martensite specimen produced from the sample 7.38 3.14 0.21 0.28 0.28 0.033 0.055
Table 3 Impact test results of
the original ferrite, original
austenite, and single-phase
bainite specimen
Temperature (K) Charpy impact energy (J)
Original
ferrite ( _a)
Original
austenite ( _c)
Bainite specimen produced
from the sample
Martensite specimen produced
from the sample
123 22 135 95 8
173 30 136 102 8
223 42 138 104 9
273 60 139 106 10
323 68 142 110 11
373 74 146 113 11
423 80 148 115 11
473 88 149 119 12
523 92 151 123 12
573 96 154 127 13
J Mater Sci (2011) 46:6007–6017 6009
123
Experimental results
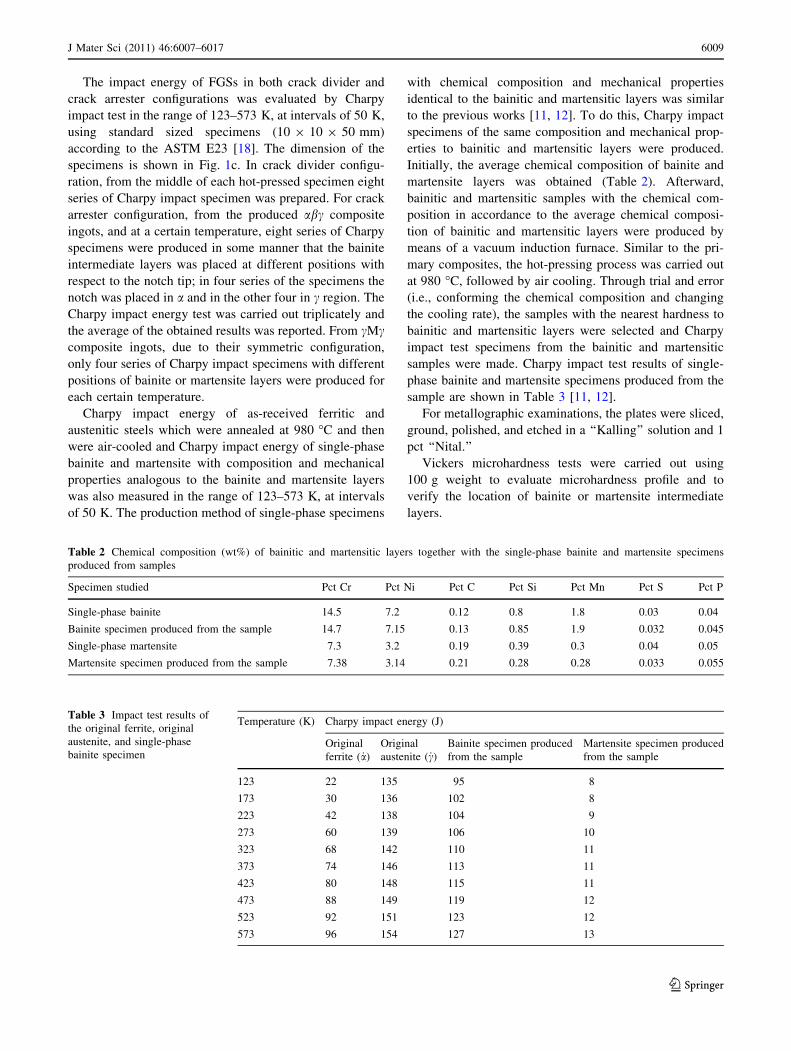
Figure 2a and b illustrate Vickers microhardness profile of
abc and cMc composites. The thickness of martensite layer
is 1.5 mm and that of bainite is 0.6 mm, which was verified
by Vickers microhardness examination and is in accor-
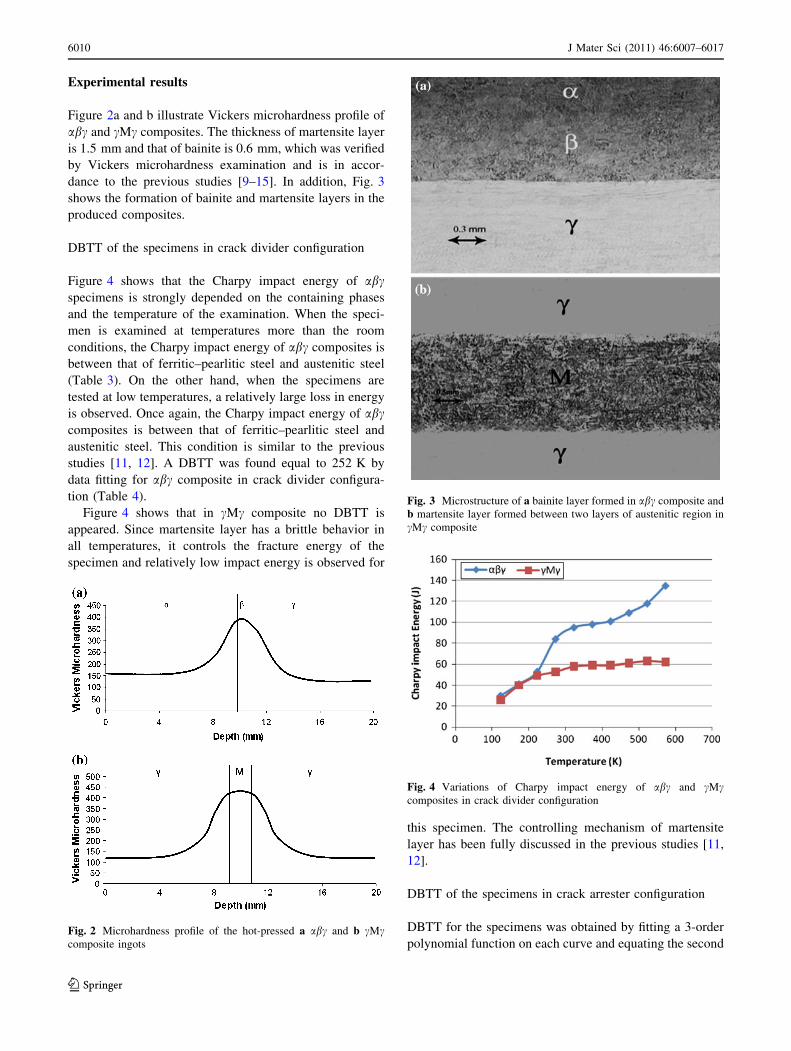
dance to the previous studies [9–15]. In addition, Fig. 3
shows the formation of bainite and martensite layers in the
produced composites.
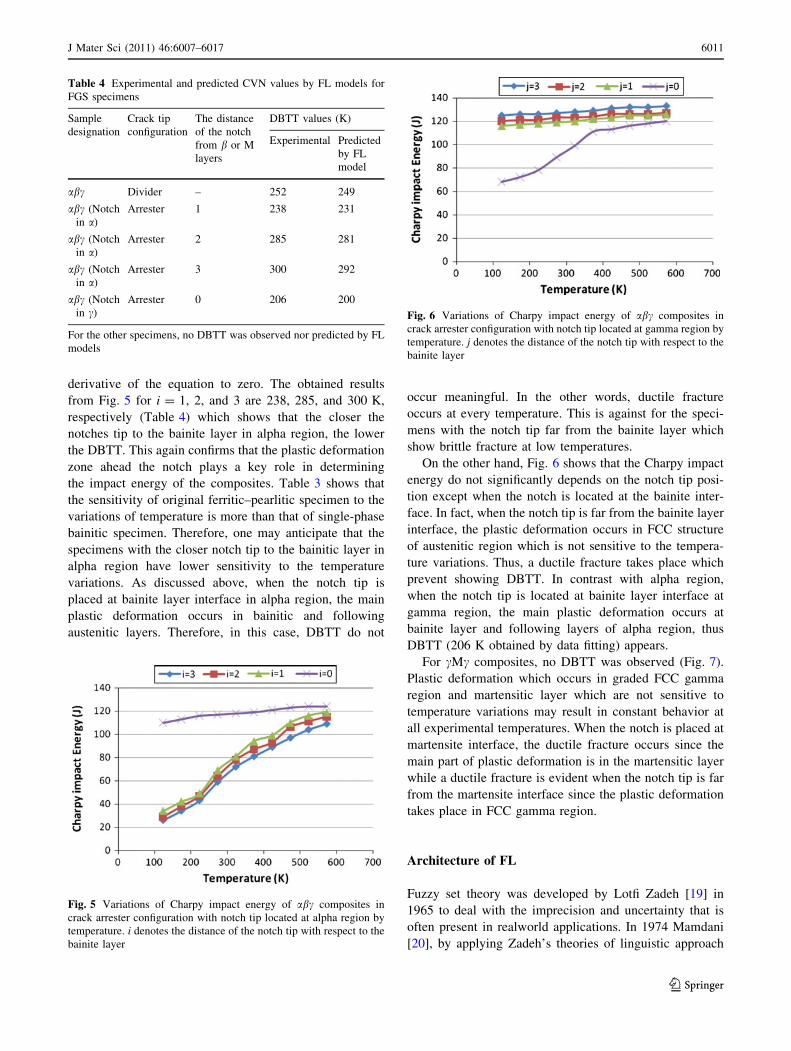
DBTT of the specimens in crack divider configuration
Figure 4 shows that the Charpy impact energy of abcspecimens is strongly depended on the containing phases
and the temperature of the examination. When the speci-
men is examined at temperatures more than the room
conditions, the Charpy impact energy of abc composites is
between that of ferritic–pearlitic steel and austenitic steel
(Table 3). On the other hand, when the specimens are
tested at low temperatures, a relatively large loss in energy
is observed. Once again, the Charpy impact energy of abccomposites is between that of ferritic–pearlitic steel and
austenitic steel. This condition is similar to the previous
studies [11, 12]. A DBTT was found equal to 252 K by
data fitting for abc composite in crack divider configura-
tion (Table 4).
Figure 4 shows that in cMc composite no DBTT is
appeared. Since martensite layer has a brittle behavior in
all temperatures, it controls the fracture energy of the
specimen and relatively low impact energy is observed for
this specimen. The controlling mechanism of martensite
layer has been fully discussed in the previous studies [11,
12].
DBTT of the specimens in crack arrester configuration
DBTT for the specimens was obtained by fitting a 3-order
polynomial function on each curve and equating the secondFig. 2 Microhardness profile of the hot-pressed a abc and b cMccomposite ingots
Fig. 3 Microstructure of a bainite layer formed in abc composite and
b martensite layer formed between two layers of austenitic region in
cMc composite
Fig. 4 Variations of Charpy impact energy of abc and cMccomposites in crack divider configuration
6010 J Mater Sci (2011) 46:6007–6017
123
derivative of the equation to zero. The obtained results
from Fig. 5 for i = 1, 2, and 3 are 238, 285, and 300 K,
respectively (Table 4) which shows that the closer the
notches tip to the bainite layer in alpha region, the lower
the DBTT. This again confirms that the plastic deformation
zone ahead the notch plays a key role in determining
the impact energy of the composites. Table 3 shows that
the sensitivity of original ferritic–pearlitic specimen to the
variations of temperature is more than that of single-phase
bainitic specimen. Therefore, one may anticipate that the
specimens with the closer notch tip to the bainitic layer in
alpha region have lower sensitivity to the temperature
variations. As discussed above, when the notch tip is
placed at bainite layer interface in alpha region, the main
plastic deformation occurs in bainitic and following
austenitic layers. Therefore, in this case, DBTT do not
occur meaningful. In the other words, ductile fracture
occurs at every temperature. This is against for the speci-
mens with the notch tip far from the bainite layer which
show brittle fracture at low temperatures.
On the other hand, Fig. 6 shows that the Charpy impact
energy do not significantly depends on the notch tip posi-
tion except when the notch is located at the bainite inter-
face. In fact, when the notch tip is far from the bainite layer
interface, the plastic deformation occurs in FCC structure
of austenitic region which is not sensitive to the tempera-
ture variations. Thus, a ductile fracture takes place which
prevent showing DBTT. In contrast with alpha region,
when the notch tip is located at bainite layer interface at
gamma region, the main plastic deformation occurs at
bainite layer and following layers of alpha region, thus
DBTT (206 K obtained by data fitting) appears.
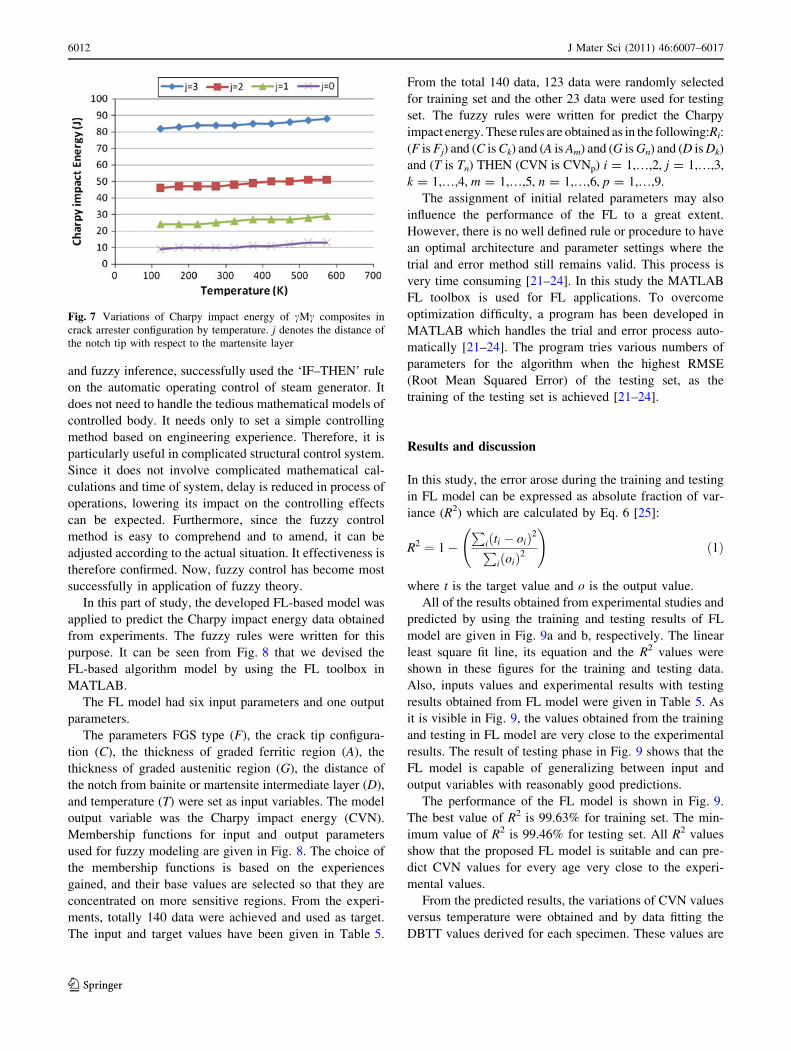
For cMc composites, no DBTT was observed (Fig. 7).
Plastic deformation which occurs in graded FCC gamma
region and martensitic layer which are not sensitive to
temperature variations may result in constant behavior at
all experimental temperatures. When the notch is placed at
martensite interface, the ductile fracture occurs since the
main part of plastic deformation is in the martensitic layer
while a ductile fracture is evident when the notch tip is far
from the martensite interface since the plastic deformation
takes place in FCC gamma region.
Architecture of FL
Fuzzy set theory was developed by Lotfi Zadeh [19] in
1965 to deal with the imprecision and uncertainty that is
often present in realworld applications. In 1974 Mamdani
[20], by applying Zadeh’s theories of linguistic approach
Table 4 Experimental and predicted CVN values by FL models for
FGS specimens
Sample
designation
Crack tip
configuration
The distance
of the notch
from b or M
layers
DBTT values (K)
Experimental Predicted
by FL
model
abc Divider – 252 249
abc (Notch
in a)
Arrester 1 238 231
abc (Notch
in a)
Arrester 2 285 281
abc (Notch
in a)
Arrester 3 300 292
abc (Notch
in c)
Arrester 0 206 200
For the other specimens, no DBTT was observed nor predicted by FL
models
Fig. 5 Variations of Charpy impact energy of abc composites in
crack arrester configuration with notch tip located at alpha region by
temperature. i denotes the distance of the notch tip with respect to the
bainite layer
Fig. 6 Variations of Charpy impact energy of abc composites in
crack arrester configuration with notch tip located at gamma region by
temperature. j denotes the distance of the notch tip with respect to the
bainite layer
J Mater Sci (2011) 46:6007–6017 6011
123
and fuzzy inference, successfully used the ‘IF–THEN’ rule
on the automatic operating control of steam generator. It
does not need to handle the tedious mathematical models of
controlled body. It needs only to set a simple controlling
method based on engineering experience. Therefore, it is
particularly useful in complicated structural control system.
Since it does not involve complicated mathematical cal-
culations and time of system, delay is reduced in process of
operations, lowering its impact on the controlling effects
can be expected. Furthermore, since the fuzzy control
method is easy to comprehend and to amend, it can be
adjusted according to the actual situation. It effectiveness is
therefore confirmed. Now, fuzzy control has become most
successfully in application of fuzzy theory.
In this part of study, the developed FL-based model was
applied to predict the Charpy impact energy data obtained
from experiments. The fuzzy rules were written for this
purpose. It can be seen from Fig. 8 that we devised the
FL-based algorithm model by using the FL toolbox in
MATLAB.
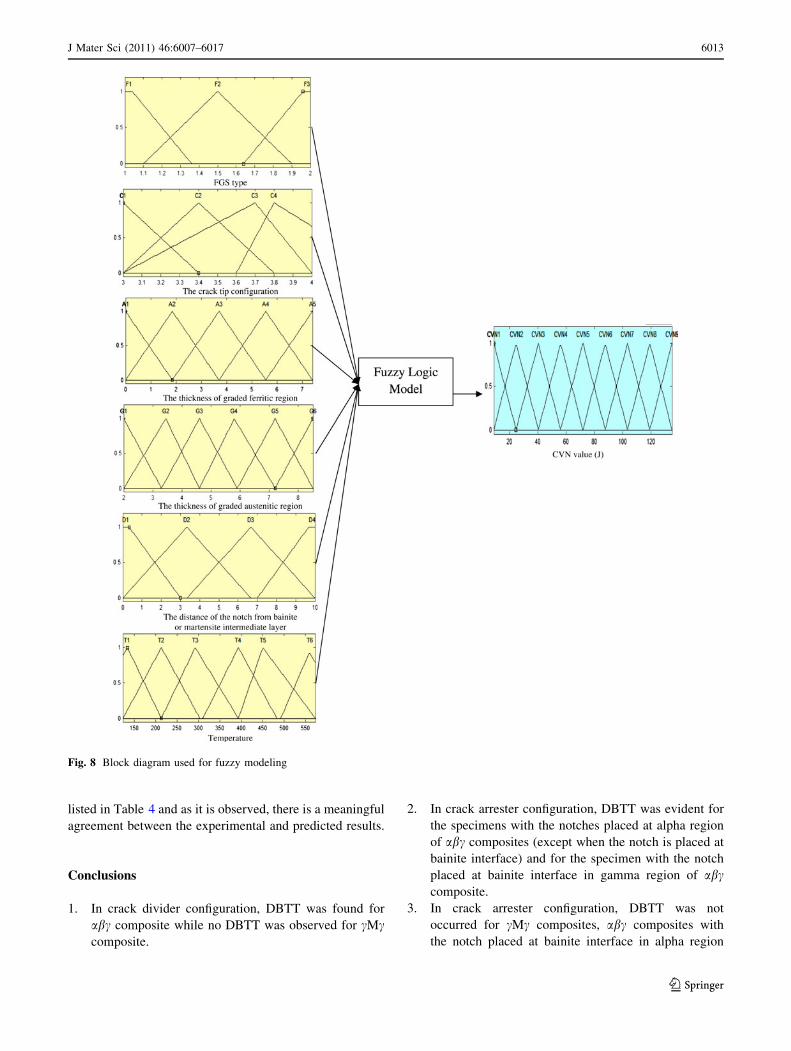
The FL model had six input parameters and one output
parameters.
The parameters FGS type (F), the crack tip configura-
tion (C), the thickness of graded ferritic region (A), the
thickness of graded austenitic region (G), the distance of
the notch from bainite or martensite intermediate layer (D),
and temperature (T) were set as input variables. The model
output variable was the Charpy impact energy (CVN).
Membership functions for input and output parameters
used for fuzzy modeling are given in Fig. 8. The choice of
the membership functions is based on the experiences
gained, and their base values are selected so that they are
concentrated on more sensitive regions. From the experi-
ments, totally 140 data were achieved and used as target.
The input and target values have been given in Table 5.
From the total 140 data, 123 data were randomly selected
for training set and the other 23 data were used for testing
set. The fuzzy rules were written for predict the Charpy
impact energy. These rules are obtained as in the following:Ri:
(F is Fj) and (C is Ck) and (A is Am) and (G is Gn) and (D is Dk)
and (T is Tn) THEN (CVN is CVNp) i = 1,…,2, j = 1,…,3,
k = 1,…,4, m = 1,…,5, n = 1,…,6, p = 1,…,9.
The assignment of initial related parameters may also
influence the performance of the FL to a great extent.
However, there is no well defined rule or procedure to have
an optimal architecture and parameter settings where the
trial and error method still remains valid. This process is
very time consuming [21–24]. In this study the MATLAB
FL toolbox is used for FL applications. To overcome
optimization difficulty, a program has been developed in
MATLAB which handles the trial and error process auto-
matically [21–24]. The program tries various numbers of
parameters for the algorithm when the highest RMSE
(Root Mean Squared Error) of the testing set, as the
training of the testing set is achieved [21–24].
Results and discussion
In this study, the error arose during the training and testing
in FL model can be expressed as absolute fraction of var-
iance (R2) which are calculated by Eq. 6 [25]:
R2 ¼ 1�P
iðti � oiÞ2P
iðoiÞ2
!
ð1Þ
where t is the target value and o is the output value.
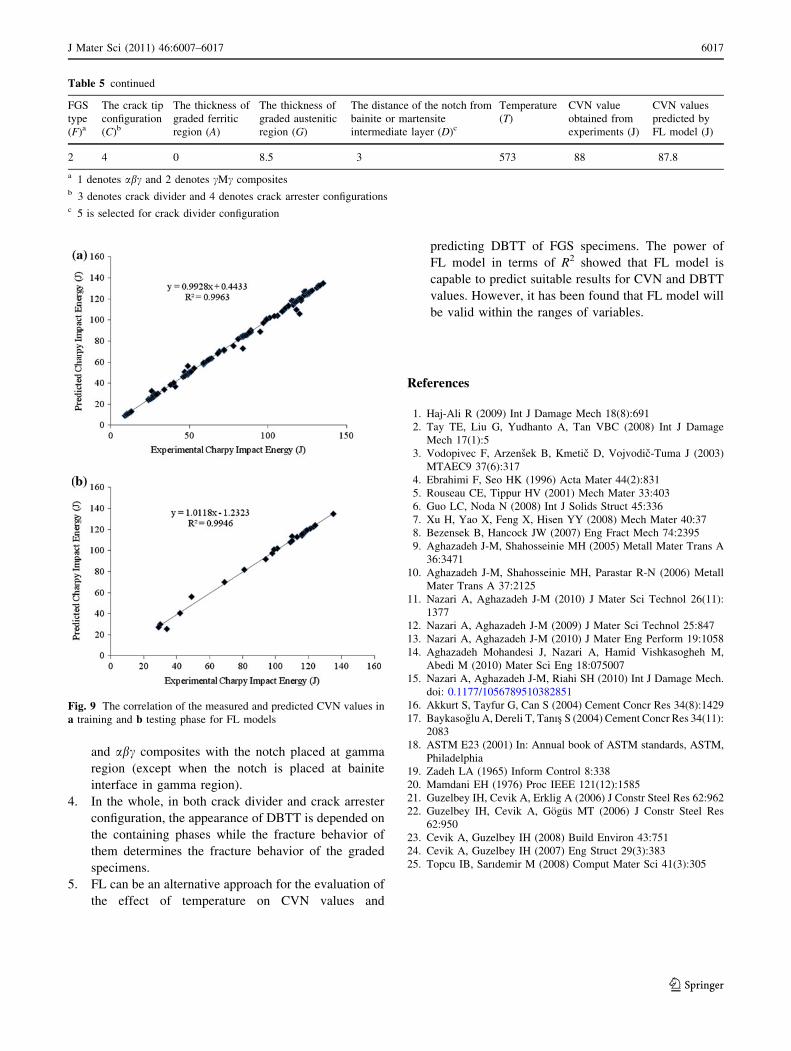
All of the results obtained from experimental studies and
predicted by using the training and testing results of FL
model are given in Fig. 9a and b, respectively. The linear
least square fit line, its equation and the R2 values were
shown in these figures for the training and testing data.
Also, inputs values and experimental results with testing
results obtained from FL model were given in Table 5. As
it is visible in Fig. 9, the values obtained from the training
and testing in FL model are very close to the experimental
results. The result of testing phase in Fig. 9 shows that the
FL model is capable of generalizing between input and
output variables with reasonably good predictions.
The performance of the FL model is shown in Fig. 9.
The best value of R2 is 99.63% for training set. The min-
imum value of R2 is 99.46% for testing set. All R2 values
show that the proposed FL model is suitable and can pre-
dict CVN values for every age very close to the experi-
mental values.
From the predicted results, the variations of CVN values
versus temperature were obtained and by data fitting the
DBTT values derived for each specimen. These values are
Fig. 7 Variations of Charpy impact energy of cMc composites in
crack arrester configuration by temperature. j denotes the distance of
the notch tip with respect to the martensite layer
6012 J Mater Sci (2011) 46:6007–6017
123
listed in Table 4 and as it is observed, there is a meaningful
agreement between the experimental and predicted results.
Conclusions
1. In crack divider configuration, DBTT was found for
abc composite while no DBTT was observed for cMccomposite.
2. In crack arrester configuration, DBTT was evident for
the specimens with the notches placed at alpha region
of abc composites (except when the notch is placed at
bainite interface) and for the specimen with the notch
placed at bainite interface in gamma region of abccomposite.
3. In crack arrester configuration, DBTT was not
occurred for cMc composites, abc composites with
the notch placed at bainite interface in alpha region
Fig. 8 Block diagram used for fuzzy modeling
J Mater Sci (2011) 46:6007–6017 6013
123
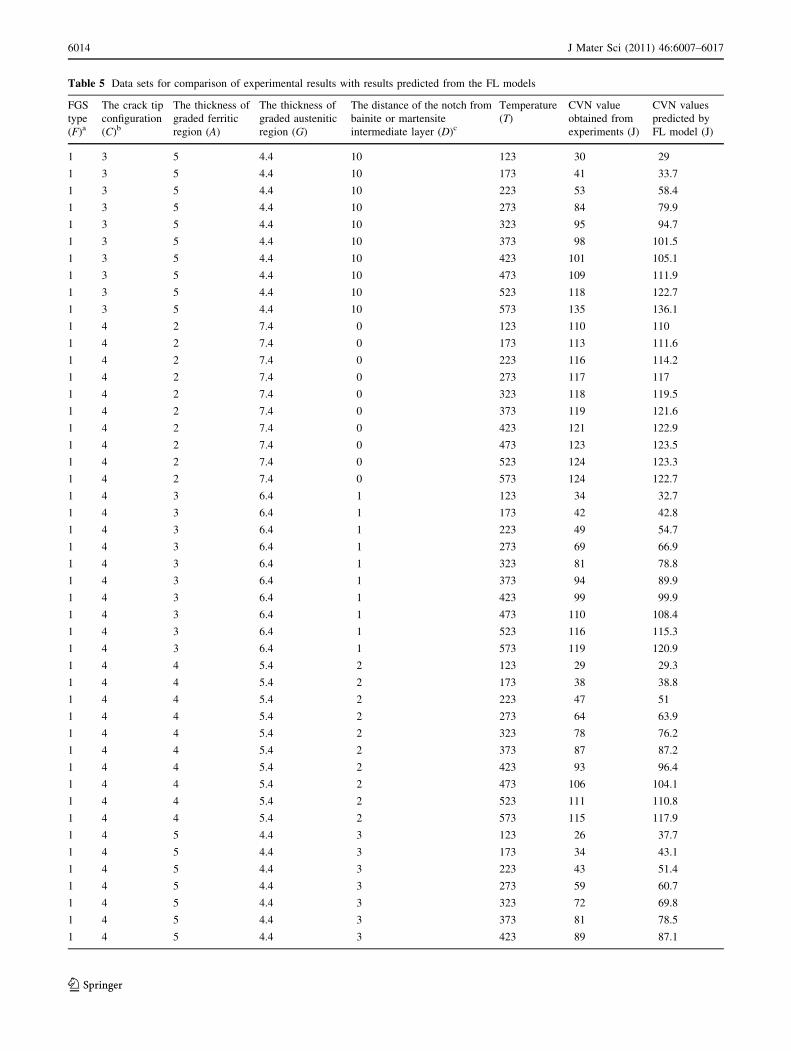
Table 5 Data sets for comparison of experimental results with results predicted from the FL models
FGS
type
(F)a
The crack tip
configuration
(C)b
The thickness of
graded ferritic
region (A)
The thickness of
graded austenitic
region (G)
The distance of the notch from
bainite or martensite
intermediate layer (D)c
Temperature
(T)
CVN value
obtained from
experiments (J)
CVN values
predicted by
FL model (J)
1 3 5 4.4 10 123 30 29
1 3 5 4.4 10 173 41 33.7
1 3 5 4.4 10 223 53 58.4
1 3 5 4.4 10 273 84 79.9
1 3 5 4.4 10 323 95 94.7
1 3 5 4.4 10 373 98 101.5
1 3 5 4.4 10 423 101 105.1
1 3 5 4.4 10 473 109 111.9
1 3 5 4.4 10 523 118 122.7
1 3 5 4.4 10 573 135 136.1
1 4 2 7.4 0 123 110 110
1 4 2 7.4 0 173 113 111.6
1 4 2 7.4 0 223 116 114.2
1 4 2 7.4 0 273 117 117
1 4 2 7.4 0 323 118 119.5
1 4 2 7.4 0 373 119 121.6
1 4 2 7.4 0 423 121 122.9
1 4 2 7.4 0 473 123 123.5
1 4 2 7.4 0 523 124 123.3
1 4 2 7.4 0 573 124 122.7
1 4 3 6.4 1 123 34 32.7
1 4 3 6.4 1 173 42 42.8
1 4 3 6.4 1 223 49 54.7
1 4 3 6.4 1 273 69 66.9
1 4 3 6.4 1 323 81 78.8
1 4 3 6.4 1 373 94 89.9
1 4 3 6.4 1 423 99 99.9
1 4 3 6.4 1 473 110 108.4
1 4 3 6.4 1 523 116 115.3
1 4 3 6.4 1 573 119 120.9
1 4 4 5.4 2 123 29 29.3
1 4 4 5.4 2 173 38 38.8
1 4 4 5.4 2 223 47 51
1 4 4 5.4 2 273 64 63.9
1 4 4 5.4 2 323 78 76.2
1 4 4 5.4 2 373 87 87.2
1 4 4 5.4 2 423 93 96.4
1 4 4 5.4 2 473 106 104.1
1 4 4 5.4 2 523 111 110.8
1 4 4 5.4 2 573 115 117.9
1 4 5 4.4 3 123 26 37.7
1 4 5 4.4 3 173 34 43.1
1 4 5 4.4 3 223 43 51.4
1 4 5 4.4 3 273 59 60.7
1 4 5 4.4 3 323 72 69.8
1 4 5 4.4 3 373 81 78.5
1 4 5 4.4 3 423 89 87.1
6014 J Mater Sci (2011) 46:6007–6017
123
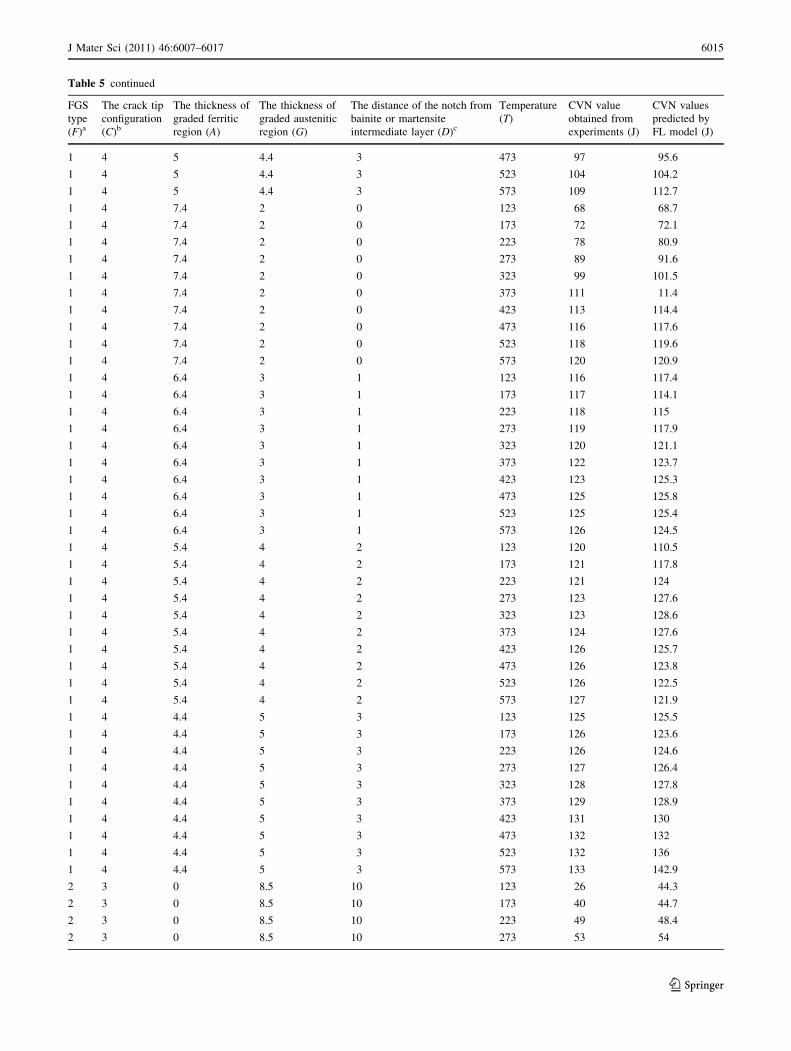
Table 5 continued
FGS
type
(F)a
The crack tip
configuration
(C)b
The thickness of
graded ferritic
region (A)
The thickness of
graded austenitic
region (G)
The distance of the notch from
bainite or martensite
intermediate layer (D)c
Temperature
(T)
CVN value
obtained from
experiments (J)
CVN values
predicted by
FL model (J)
1 4 5 4.4 3 473 97 95.6
1 4 5 4.4 3 523 104 104.2
1 4 5 4.4 3 573 109 112.7
1 4 7.4 2 0 123 68 68.7
1 4 7.4 2 0 173 72 72.1
1 4 7.4 2 0 223 78 80.9
1 4 7.4 2 0 273 89 91.6
1 4 7.4 2 0 323 99 101.5
1 4 7.4 2 0 373 111 11.4
1 4 7.4 2 0 423 113 114.4
1 4 7.4 2 0 473 116 117.6
1 4 7.4 2 0 523 118 119.6
1 4 7.4 2 0 573 120 120.9
1 4 6.4 3 1 123 116 117.4
1 4 6.4 3 1 173 117 114.1
1 4 6.4 3 1 223 118 115
1 4 6.4 3 1 273 119 117.9
1 4 6.4 3 1 323 120 121.1
1 4 6.4 3 1 373 122 123.7
1 4 6.4 3 1 423 123 125.3
1 4 6.4 3 1 473 125 125.8
1 4 6.4 3 1 523 125 125.4
1 4 6.4 3 1 573 126 124.5
1 4 5.4 4 2 123 120 110.5
1 4 5.4 4 2 173 121 117.8
1 4 5.4 4 2 223 121 124
1 4 5.4 4 2 273 123 127.6
1 4 5.4 4 2 323 123 128.6
1 4 5.4 4 2 373 124 127.6
1 4 5.4 4 2 423 126 125.7
1 4 5.4 4 2 473 126 123.8
1 4 5.4 4 2 523 126 122.5
1 4 5.4 4 2 573 127 121.9
1 4 4.4 5 3 123 125 125.5
1 4 4.4 5 3 173 126 123.6
1 4 4.4 5 3 223 126 124.6
1 4 4.4 5 3 273 127 126.4
1 4 4.4 5 3 323 128 127.8
1 4 4.4 5 3 373 129 128.9
1 4 4.4 5 3 423 131 130
1 4 4.4 5 3 473 132 132
1 4 4.4 5 3 523 132 136
1 4 4.4 5 3 573 133 142.9
2 3 0 8.5 10 123 26 44.3
2 3 0 8.5 10 173 40 44.7
2 3 0 8.5 10 223 49 48.4
2 3 0 8.5 10 273 53 54
J Mater Sci (2011) 46:6007–6017 6015
123
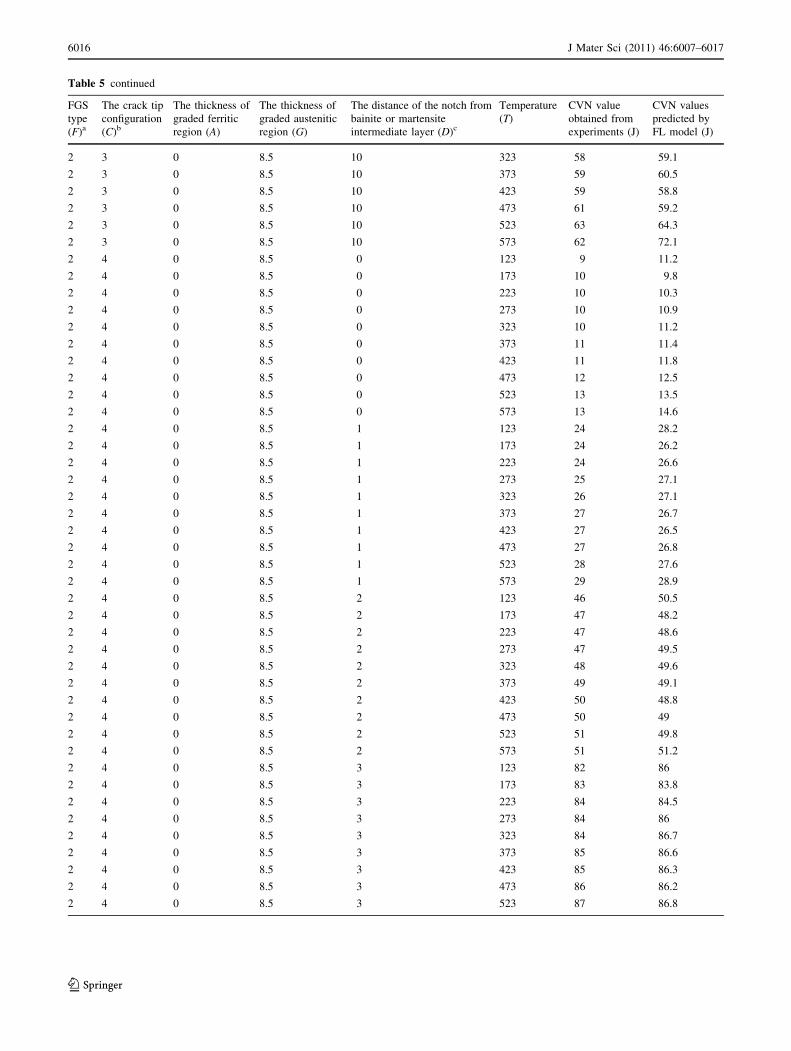
Table 5 continued
FGS
type
(F)a
The crack tip
configuration
(C)b
The thickness of
graded ferritic
region (A)
The thickness of
graded austenitic
region (G)
The distance of the notch from
bainite or martensite
intermediate layer (D)c
Temperature
(T)
CVN value
obtained from
experiments (J)
CVN values
predicted by
FL model (J)
2 3 0 8.5 10 323 58 59.1
2 3 0 8.5 10 373 59 60.5
2 3 0 8.5 10 423 59 58.8
2 3 0 8.5 10 473 61 59.2
2 3 0 8.5 10 523 63 64.3
2 3 0 8.5 10 573 62 72.1
2 4 0 8.5 0 123 9 11.2
2 4 0 8.5 0 173 10 9.8
2 4 0 8.5 0 223 10 10.3
2 4 0 8.5 0 273 10 10.9
2 4 0 8.5 0 323 10 11.2
2 4 0 8.5 0 373 11 11.4
2 4 0 8.5 0 423 11 11.8
2 4 0 8.5 0 473 12 12.5
2 4 0 8.5 0 523 13 13.5
2 4 0 8.5 0 573 13 14.6
2 4 0 8.5 1 123 24 28.2
2 4 0 8.5 1 173 24 26.2
2 4 0 8.5 1 223 24 26.6
2 4 0 8.5 1 273 25 27.1
2 4 0 8.5 1 323 26 27.1
2 4 0 8.5 1 373 27 26.7
2 4 0 8.5 1 423 27 26.5
2 4 0 8.5 1 473 27 26.8
2 4 0 8.5 1 523 28 27.6
2 4 0 8.5 1 573 29 28.9
2 4 0 8.5 2 123 46 50.5
2 4 0 8.5 2 173 47 48.2
2 4 0 8.5 2 223 47 48.6
2 4 0 8.5 2 273 47 49.5
2 4 0 8.5 2 323 48 49.6
2 4 0 8.5 2 373 49 49.1
2 4 0 8.5 2 423 50 48.8
2 4 0 8.5 2 473 50 49
2 4 0 8.5 2 523 51 49.8
2 4 0 8.5 2 573 51 51.2
2 4 0 8.5 3 123 82 86
2 4 0 8.5 3 173 83 83.8
2 4 0 8.5 3 223 84 84.5
2 4 0 8.5 3 273 84 86
2 4 0 8.5 3 323 84 86.7
2 4 0 8.5 3 373 85 86.6
2 4 0 8.5 3 423 85 86.3
2 4 0 8.5 3 473 86 86.2
2 4 0 8.5 3 523 87 86.8
6016 J Mater Sci (2011) 46:6007–6017
123
and abc composites with the notch placed at gamma
region (except when the notch is placed at bainite
interface in gamma region).
4. In the whole, in both crack divider and crack arrester
configuration, the appearance of DBTT is depended on
the containing phases while the fracture behavior of
them determines the fracture behavior of the graded
specimens.
5. FL can be an alternative approach for the evaluation of
the effect of temperature on CVN values and
predicting DBTT of FGS specimens. The power of
FL model in terms of R2 showed that FL model is
capable to predict suitable results for CVN and DBTT
values. However, it has been found that FL model will
be valid within the ranges of variables.
References
1. Haj-Ali R (2009) Int J Damage Mech 18(8):691
2. Tay TE, Liu G, Yudhanto A, Tan VBC (2008) Int J Damage
Mech 17(1):5
3. Vodopivec F, Arzensek B, Kmetic D, Vojvodic-Tuma J (2003)
MTAEC9 37(6):317
4. Ebrahimi F, Seo HK (1996) Acta Mater 44(2):831
5. Rouseau CE, Tippur HV (2001) Mech Mater 33:403
6. Guo LC, Noda N (2008) Int J Solids Struct 45:336
7. Xu H, Yao X, Feng X, Hisen YY (2008) Mech Mater 40:37
8. Bezensek B, Hancock JW (2007) Eng Fract Mech 74:2395
9. Aghazadeh J-M, Shahosseinie MH (2005) Metall Mater Trans A
36:3471
10. Aghazadeh J-M, Shahosseinie MH, Parastar R-N (2006) Metall
Mater Trans A 37:2125
11. Nazari A, Aghazadeh J-M (2010) J Mater Sci Technol 26(11):
1377
12. Nazari A, Aghazadeh J-M (2009) J Mater Sci Technol 25:847
13. Nazari A, Aghazadeh J-M (2010) J Mater Eng Perform 19:1058
14. Aghazadeh Mohandesi J, Nazari A, Hamid Vishkasogheh M,
Abedi M (2010) Mater Sci Eng 18:075007
15. Nazari A, Aghazadeh J-M, Riahi SH (2010) Int J Damage Mech.
doi: 0.1177/1056789510382851
16. Akkurt S, Tayfur G, Can S (2004) Cement Concr Res 34(8):1429
17. Baykasoglu A, Dereli T, Tanıs S (2004) Cement Concr Res 34(11):
2083
18. ASTM E23 (2001) In: Annual book of ASTM standards, ASTM,
Philadelphia
19. Zadeh LA (1965) Inform Control 8:338
20. Mamdani EH (1976) Proc IEEE 121(12):1585
21. Guzelbey IH, Cevik A, Erklig A (2006) J Constr Steel Res 62:962
22. Guzelbey IH, Cevik A, Gogus MT (2006) J Constr Steel Res
62:950
23. Cevik A, Guzelbey IH (2008) Build Environ 43:751
24. Cevik A, Guzelbey IH (2007) Eng Struct 29(3):383
25. Topcu IB, Sarıdemir M (2008) Comput Mater Sci 41(3):305
Table 5 continued
FGS
type
(F)a
The crack tip
configuration
(C)b
The thickness of
graded ferritic
region (A)
The thickness of
graded austenitic
region (G)
The distance of the notch from
bainite or martensite
intermediate layer (D)c
Temperature
(T)
CVN value
obtained from
experiments (J)
CVN values
predicted by
FL model (J)
2 4 0 8.5 3 573 88 87.8
a 1 denotes abc and 2 denotes cMc compositesb 3 denotes crack divider and 4 denotes crack arrester configurationsc 5 is selected for crack divider configuration
Fig. 9 The correlation of the measured and predicted CVN values in
a training and b testing phase for FL models
J Mater Sci (2011) 46:6007–6017 6017
123