Solidification Pattern of Si-Alloyed, Inoculated Ductile Cast ...
16
metals Article Solidification Pattern of Si-Alloyed, Inoculated Ductile Cast Irons, Evaluated by Thermal Analysis Iuliana Stan, Denisa Anca *, Stelian Stan and Iulian Riposan Citation: Stan, I.; Anca, D.; Stan, S.; Riposan, I. Solidification Pattern of Si-Alloyed, Inoculated Ductile Cast Irons, Evaluated by Thermal Analysis. Metals 2021, 11, 846. https://doi.org/ 10.3390/met11050846 Academic Editor: Annalisa Fortini Received: 20 April 2021 Accepted: 14 May 2021 Published: 20 May 2021 Publisher’s Note: MDPI stays neutral with regard to jurisdictional claims in published maps and institutional affil- iations. Copyright: © 2021 by the authors. Licensee MDPI, Basel, Switzerland. This article is an open access article distributed under the terms and conditions of the Creative Commons Attribution (CC BY) license (https:// creativecommons.org/licenses/by/ 4.0/). Materials Science and Engineering Faculty, Politehnica University of Bucharest, 060042 Bucharest, Romania; [email protected] (I.S.); [email protected] (S.S.); [email protected] (I.R.) * Correspondence: [email protected] Abstract: The solidification cooling curve itself as well as its first derivative, and related temperatures, reported to the calculated equilibrium temperatures in stable and metastable solidification systems, are used to predict the solidification characteristics of the cast iron. Silicon, as the most representative cast iron element, and inoculation, as graphitizing metallurgical treatment, have a major influence on the transition from the liquid to the solid state. Six experimental programs are performed, with Si content typically for non-alloyed (<3.0% Si), low (3.0–3.5% Si) and medium alloyed (4.5–5.5% Si) ductile cast irons, as Si-content increasing, and inoculation simultaneous effects. Silicon is an important influencing factor, but the base and minor elements also affect the equilibrium eutectic temperatures, much more in the Fe-C-Si-Xi stable system (15–20 ◦ C) than in the metastable system (5–10 ◦ C), comparing with their calculation based only on a Si effect (Fe-C-Si system). The highest positive effect of inoculation is visible in non-Si alloyed cast irons (2.5% Si): 9–15 ◦ C for the eutectic reaction and 3 to 4 times increased at the end of solidification (37–47 ◦ C). Increased Si content decreases inoculation power to 7–9 ◦ C for low alloying grade (up to 3.5% Si), with the lowest contribution at more than 4.5% Si (0.3–2.0 ◦ C). 2.5–3.5% Si ductile cast irons are more sensitive to high solidification undercooling, especially at the end of solidification (but with a higher efficiency of inoculation), compared to 4.5–5.5% Si ductile cast irons, at a lower undercooling level, and at lower inoculation contribution, as well. Keywords: ductile cast iron; solidification; eutectic reaction; end of solidification; stable system; metastable system; cooling curve analysis; silicon alloying; inoculation; eutectic undercooling 1. Introduction By free carbides avoiding and ferrite promoting, silicon has an important contribution to reach high ductility and toughness characteristics, accompanied by the best machinability conditions. The presence of the silicon atoms inside the ferrite structure contributes to increasing the tensile strength Rm ((+128 MPa)/% Si—maximum reached at 4.2–4.4% Si), the yield strength Rp 0.2 ((+118 MPa)/% Si—maximum reached at 4.6–4.8% Si), and the Brinell hardness ((+45 HB)/% Si—for 2.5–6% Si (150 HB to 310 HB), but with a drastic decrease of elongation A ((-5% A)/% Si)—at less than 4.3% Si, and (-30% A)/% Si, for 4.3% up to 4.8% Si) of the ferritic ductile cast irons [1]. In 3.2–4.3% Si ductile cast irons, the unstable mixed ferrite-pearlite matrix is replaced with more predictable and controllable ferritic grades, at a reduced hardness variation (±4 HB), increased cutting tool life, and better mechanical properties (Rm = 450–650 MPa; Rp 0.2 = 350–500 MPa; A = 10–20%); these materials are usually used in the automotive industry. Silicon (4–6% Si), and Si-Mo (2.5–5.5% Si, and 0.2–2.0% Mo) alloyed ductile cast irons are characterized by a high resistance to oxidation and corrosion at high tempera- tures. Molybdenum addition favors superior mechanical properties, especially at high temperatures (Rm = 400–650 MPa; Rp 0.2 = 250–550 MPa; A = 3–12%), typically for exhausted applications [2–4]. Metals 2021, 11, 846. https://doi.org/10.3390/met11050846 https://www.mdpi.com/journal/metals
-
Upload
khangminh22 -
Category
Documents
-
view
4 -
download
0
Transcript of Solidification Pattern of Si-Alloyed, Inoculated Ductile Cast ...

metals
Article
Solidification Pattern of Si-Alloyed, Inoculated Ductile CastIrons, Evaluated by Thermal Analysis
Iuliana Stan, Denisa Anca *, Stelian Stan and Iulian Riposan
�����������������
Citation: Stan, I.; Anca, D.; Stan, S.;
Riposan, I. Solidification Pattern of
Si-Alloyed, Inoculated Ductile Cast
Irons, Evaluated by Thermal Analysis.
Metals 2021, 11, 846. https://doi.org/
10.3390/met11050846
Academic Editor: Annalisa Fortini
Received: 20 April 2021
Accepted: 14 May 2021
Published: 20 May 2021
Publisher’s Note: MDPI stays neutral
with regard to jurisdictional claims in
published maps and institutional affil-
iations.
Copyright: © 2021 by the authors.
Licensee MDPI, Basel, Switzerland.
This article is an open access article
distributed under the terms and
conditions of the Creative Commons
Attribution (CC BY) license (https://
creativecommons.org/licenses/by/
4.0/).
Materials Science and Engineering Faculty, Politehnica University of Bucharest, 060042 Bucharest, Romania;[email protected] (I.S.); [email protected] (S.S.); [email protected] (I.R.)* Correspondence: [email protected]
Abstract: The solidification cooling curve itself as well as its first derivative, and related temperatures,reported to the calculated equilibrium temperatures in stable and metastable solidification systems,are used to predict the solidification characteristics of the cast iron. Silicon, as the most representativecast iron element, and inoculation, as graphitizing metallurgical treatment, have a major influenceon the transition from the liquid to the solid state. Six experimental programs are performed, withSi content typically for non-alloyed (<3.0% Si), low (3.0–3.5% Si) and medium alloyed (4.5–5.5%Si) ductile cast irons, as Si-content increasing, and inoculation simultaneous effects. Silicon is animportant influencing factor, but the base and minor elements also affect the equilibrium eutectictemperatures, much more in the Fe-C-Si-Xi stable system (15–20 ◦C) than in the metastable system(5–10 ◦C), comparing with their calculation based only on a Si effect (Fe-C-Si system). The highestpositive effect of inoculation is visible in non-Si alloyed cast irons (2.5% Si): 9–15 ◦C for the eutecticreaction and 3 to 4 times increased at the end of solidification (37–47 ◦C). Increased Si contentdecreases inoculation power to 7–9 ◦C for low alloying grade (up to 3.5% Si), with the lowestcontribution at more than 4.5% Si (0.3–2.0 ◦C). 2.5–3.5% Si ductile cast irons are more sensitive tohigh solidification undercooling, especially at the end of solidification (but with a higher efficiency ofinoculation), compared to 4.5–5.5% Si ductile cast irons, at a lower undercooling level, and at lowerinoculation contribution, as well.
Keywords: ductile cast iron; solidification; eutectic reaction; end of solidification; stable system;metastable system; cooling curve analysis; silicon alloying; inoculation; eutectic undercooling
1. Introduction
By free carbides avoiding and ferrite promoting, silicon has an important contributionto reach high ductility and toughness characteristics, accompanied by the best machinabilityconditions. The presence of the silicon atoms inside the ferrite structure contributes toincreasing the tensile strength Rm ((+128 MPa)/% Si—maximum reached at 4.2–4.4% Si),the yield strength Rp0.2 ((+118 MPa)/% Si—maximum reached at 4.6–4.8% Si), and theBrinell hardness ((+45 HB)/% Si—for 2.5–6% Si (150 HB to 310 HB), but with a drasticdecrease of elongation A ((−5% A)/% Si)—at less than 4.3% Si, and (−30% A)/% Si, for4.3% up to 4.8% Si) of the ferritic ductile cast irons [1].
In 3.2–4.3% Si ductile cast irons, the unstable mixed ferrite-pearlite matrix is replacedwith more predictable and controllable ferritic grades, at a reduced hardness variation(±4 HB), increased cutting tool life, and better mechanical properties (Rm = 450–650 MPa;Rp0.2 = 350–500 MPa; A = 10–20%); these materials are usually used in the automotiveindustry. Silicon (4–6% Si), and Si-Mo (2.5–5.5% Si, and 0.2–2.0% Mo) alloyed ductile castirons are characterized by a high resistance to oxidation and corrosion at high tempera-tures. Molybdenum addition favors superior mechanical properties, especially at hightemperatures (Rm = 400–650 MPa; Rp0.2 = 250–550 MPa; A = 3–12%), typically for exhaustedapplications [2–4].
Metals 2021, 11, 846. https://doi.org/10.3390/met11050846 https://www.mdpi.com/journal/metals

Metals 2021, 11, 846 2 of 16
Inoculation, an important metallurgical treatment, is applied to the liquid cast iron,usually after the Mg-treatment to forestall solidification at an excessive eutectic undercool-ing degree, favorable for carbides occurrence or/and undesired graphite morphologies.In this way, it is possible to obtain an as-cast structure without free carbides (promotersof bad machinability and brittleness) and with a high quality graphite shape (the bestexpected graphite morphology specifically for each cast iron type, at a lower size and ahigher nodule count).
Inoculation is recorded by addition of 0.05–1.0 wt.% alloy (inoculant, FeSiAlX, whereX = Ca, Ba, Sr, RE, etc.) in the tapped iron melt (1300–1500 ◦C). The main objective ofthis treatment is to promote active compounds (microns scale) in the iron melt, to act asactive graphite nucleation sites, at a lower eutectic undercooling, by improving the existentnucleation sites or/and by promoting new nucleation sites.
Factors influencing inoculation efficiency mainly refer to charge materials (pig iron/steelscrap ratio, recarburizers, preconditioners), melting furnace thermal regime, base ironchemical composition (Si, Mn, S) and iron residuals (Al, Ti, O, N), inoculating elements,inoculant type, inoculation procedure, holding time, pouring procedure, and castingcharacteristics [5].
Thermal (cooling curve) analysis is usually used to evaluate the solidification patternof ductile cast irons, in terms of the prediction of eutectic undercooling, important for freecarbide formation sensitivity, different graphite morphologies occurrence and the end ofsolidification defects (inter-eutectic cells free carbides and micro-shrinkage).
Important events on the cooling curve (the lowest and the highest eutectic tempera-tures and the temperature on the end of solidification), and on its first derivative (maximumrecalescence rate, the lowest level at the end of solidification, different graphitizing factors)offer important information on the solidification pattern of ductile iron castings. Thereferring of these events to the equilibrium temperatures in the stable and metastable Fe-Csystems offers more data on the specifics of primary structure characteristics [6–8].
The main objective of the present paper is to evaluate by thermal (cooling curve)analysis the solidification pattern of ductile cast irons, non-Si alloyed (<3.0% Si), low(3.0–3.5% Si), and medium Si alloyed (4.5–5.5% Si), as silicon content increases, whileinoculation application effects present simultaneously on the cooling curves events.
2. Materials and Methods
Six experimental programs are performed, for three groups of ductile cast irons, withsilicon content typically for non-alloyed (2.4–2.6% Si), lower limit (3.15–3.45% Si, lowalloying grade), and upper limit (4.5–5.5% Si, medium alloying grade) of High-Si ductilecast irons (two programs for each group) (Table 1, Figure 1).
More information on some experimental programs and previous reported results areavailable in our previous published papers: Program I [8], Program II [2], Program III [9],Program IV [10], and Program V [11]. New obtained data are added to selected data fromthese previous papers, in order to have a coherent evaluation of the simultaneous influenceof silicon and inoculation, for the entire range of silicon content in non-and Si alloyedductile cast irons for applications involving mechanical properties and oxidation resistance,such as for the automotive industry.
Charge materials include steel scrap, ductile iron returns, ferrosilicon and recarburizer,typically used for commercial ductile irons production. Experimental cast irons, obtainedby electric melting (10 kg—coreless induction furnace, 8000 Hz frequency, graphite crucible,1500–1550 ◦C superheating), are subjected to a nodularization treatment (Tundish-Covertechnique, 1.5–2.5 wt.% FeSiCaMgRE treatment alloys), followed by a FeSi-based alloysinoculation (Ca, Ba, Ce, Al as active elements), ladle and in-mold inoculation.

Metals 2021, 11, 846 3 of 16
Table 1. Experimental programs parameters.
Pr * Si Content(%)
Mg-Treatment **(Nodularization)
Inoculation(Graphitization)
I 2.48 2.0 wt.% FeSiCaMgRETundish Cover Ladle
0.5 wt.% Ca, Ce, S, O-FeSiPouring Ladle
II 2.55 2.0 wt.% FeSiCaMgRETundish Cover Ladle
0.3 wt.% Ca, Ce, S, O-FeSiPouring Ladle
III 3.15 2.0 wt.% FeSiCaMgRETundish Cover Ladle
0.5 wt.% Ca, Ba, Al-FeSiPouring Ladle
IV 3.44 2.5 wt.% FeSiCaMgRETundish Cover Ladle
0.5 wt.% Ca, Ba, Al-FeSiPouring Ladle
V 4.55 1.5 wt.% FeSiCaMgRETundish Cover Ladle
0.1 wt.% Ca, Ba, Al-FeSiIn-mold, Quick-CupTM
VI 5.25 1.5 wt.% FeSiCaMgRETundish Cover Ladle
0.1 wt.% Ca, Ba, Al-FeSiIn-mold, Quick-CupTM
* Pr—Experimental Program; ** RE—Rare Earth Elements.
Figure 1. Representative groups of experimental programs (Table 1) (a) non-Si alloyed; (b) low-Si alloyed; (c) medium-Si alloyed).
Mg-treatment alloys include 43–46% Si, 6–10% Mg, 1–2% Ca, 0.8–1.5% Al, Fe-bal. Ca,Ba, Al-FeSi alloys (0.94–1.0% Ca, 1.0–1.68% Ba, 0.96–1.1% Al, 72.6–75% Si, Fe-bal) and Ca,Ce, S, O-FeSi alloys (70–76% Si, 0.75–1.25% Ca, 0.75–1.25% Al, 1.5–2.0% RE, and less than Oand S-bearing compounds) [5] are selected as inoculants.
In ductile iron production, both the ladle and in-mold inoculation techniques areused. For higher silicon content ductile cast irons (>4% Si), trials V and VI, inoculationwas recorded just in the ceramic cup, and used for thermal (cooling curve) analysis, as thisinoculation technique is known to have the highest efficiency. This is considered necessaryfor high Si content ductile irons, according to the previously obtained results [2].
Metals 2021, 11, 846 4 of 16
A SPECTROLAB high-end spectrometer (SPECTROLAB, Sylmar, CA, USA) withhybrid optic (photomultiplier tubs (PMT) and CCD (Spectroscopic Charge Coupled Devicedetection system) detectors simultaneously are used for high precision metal analysis. Theinstrument achieves detection limits below 1 mg/kg.
The present paper focuses on the thermal (cooling curve) analysis (standard Quick-CupTM (Heraeus Electro-Nite International, Houthalen, Belgium) thermal analysis) [12] ofthe Mg-treated liquid cast irons, before and after the inoculation process. Un-inoculatedand inoculated iron melts are poured in standard ceramic cups (7.3 mm cooling modulus),including a thermocouple for thermal (cooling curve) analysis of the solidification process.Cooling modulus is the ratio between the volume and the total surface area of castings; itexpresses the capacity to transfer the heat from casting through the mold media, outwardly.A lower cooling modulus value leads to a higher solidification cooling rate, with importanteffects on the eutectic and eutectoid structure formation and characteristics.
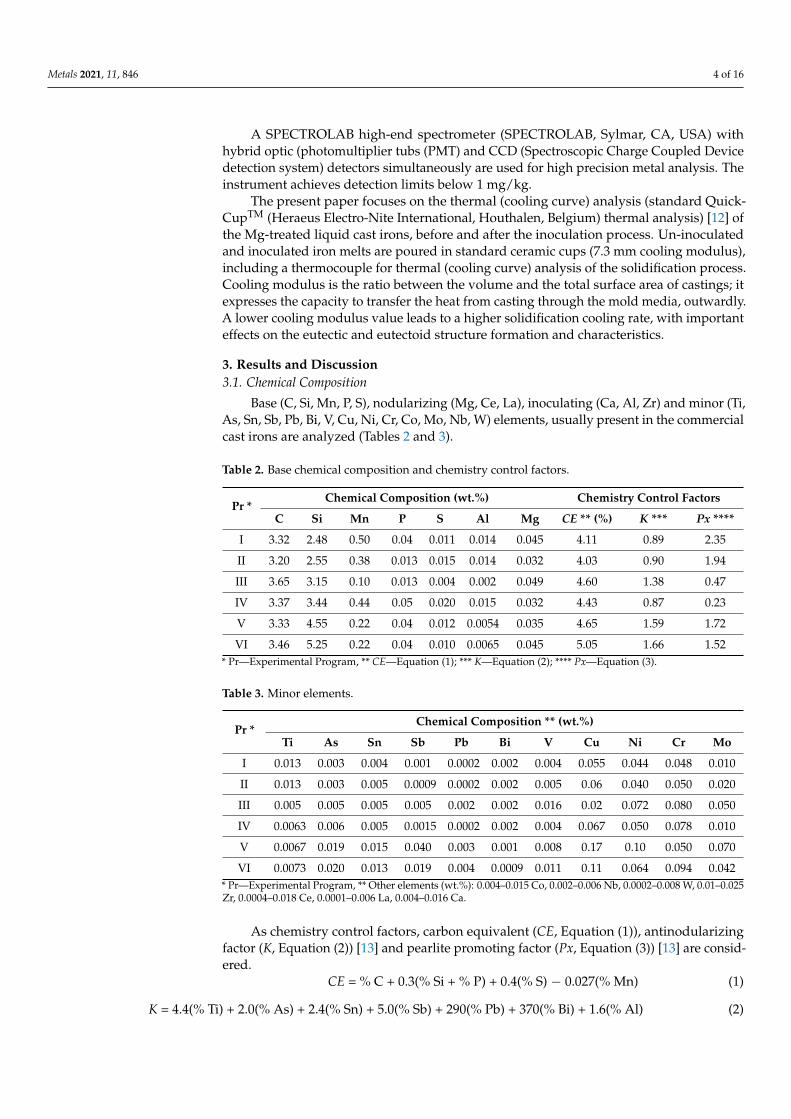
3. Results and Discussion3.1. Chemical Composition
Base (C, Si, Mn, P, S), nodularizing (Mg, Ce, La), inoculating (Ca, Al, Zr) and minor (Ti,As, Sn, Sb, Pb, Bi, V, Cu, Ni, Cr, Co, Mo, Nb, W) elements, usually present in the commercialcast irons are analyzed (Tables 2 and 3).
Table 2. Base chemical composition and chemistry control factors.
Pr *Chemical Composition (wt.%) Chemistry Control Factors
C Si Mn P S Al Mg CE ** (%) K *** Px ****
I 3.32 2.48 0.50 0.04 0.011 0.014 0.045 4.11 0.89 2.35
II 3.20 2.55 0.38 0.013 0.015 0.014 0.032 4.03 0.90 1.94
III 3.65 3.15 0.10 0.013 0.004 0.002 0.049 4.60 1.38 0.47
IV 3.37 3.44 0.44 0.05 0.020 0.015 0.032 4.43 0.87 0.23
V 3.33 4.55 0.22 0.04 0.012 0.0054 0.035 4.65 1.59 1.72
VI 3.46 5.25 0.22 0.04 0.010 0.0065 0.045 5.05 1.66 1.52* Pr—Experimental Program, ** CE—Equation (1); *** K—Equation (2); **** Px—Equation (3).
Table 3. Minor elements.
Pr *Chemical Composition ** (wt.%)
Ti As Sn Sb Pb Bi V Cu Ni Cr Mo
I 0.013 0.003 0.004 0.001 0.0002 0.002 0.004 0.055 0.044 0.048 0.010
II 0.013 0.003 0.005 0.0009 0.0002 0.002 0.005 0.06 0.040 0.050 0.020
III 0.005 0.005 0.005 0.005 0.002 0.002 0.016 0.02 0.072 0.080 0.050
IV 0.0063 0.006 0.005 0.0015 0.0002 0.002 0.004 0.067 0.050 0.078 0.010
V 0.0067 0.019 0.015 0.040 0.003 0.001 0.008 0.17 0.10 0.050 0.070
VI 0.0073 0.020 0.013 0.019 0.004 0.0009 0.011 0.11 0.064 0.094 0.042* Pr—Experimental Program, ** Other elements (wt.%): 0.004–0.015 Co, 0.002–0.006 Nb, 0.0002–0.008 W, 0.01–0.025Zr, 0.0004–0.018 Ce, 0.0001–0.006 La, 0.004–0.016 Ca.
As chemistry control factors, carbon equivalent (CE, Equation (1)), antinodularizingfactor (K, Equation (2)) [13] and pearlite promoting factor (Px, Equation (3)) [13] are consid-ered.
CE = % C + 0.3(% Si + % P) + 0.4(% S) − 0.027(% Mn) (1)
K = 4.4(% Ti) + 2.0(% As) + 2.4(% Sn) + 5.0(% Sb) + 290(% Pb) + 370(% Bi) + 1.6(% Al) (2)

Metals 2021, 11, 846 5 of 16
Px = 3(% Mn) − 2.65(% Si − 2) + 7.75(% Cu) + 90(% Sn) + 357(% Pb) + 333(% Bi) +20.1(% As) + 9.60 (% Cr) + 71.7(% Sb)
(3)
For 2.48–5.25% Si and 3.20–3.65% C, the experimental cast irons are characterizedby a large range carbon equivalent CE = 4.03–5.05%: slightly hypo-eutectic position forconventional, non-Si alloyed cast irons (2.48–2.55% Si, 4.03–4.11% CE), hyper-eutecticposition (CE = 4.43–4.60%) for a lower limit Si-alloyed cast irons (3.15–3.45% Si) and astrong hyper-eutectic behavior (CE = 4.65–5.05%) for the upper limit of Si-alloying ductilecast irons (4.55–5.25% Si). A residual magnesium level is typical for ductile cast irons(0.032–0.045% Mgres), with a supplementary nodularization contribution of 0.0004–0.018%Ceres and 0.0001–0.006% Lares.
Minor elements presence and content are typical for medium quality commercialductile cast irons, characterized by an upper limit of antinodularizing factor K, Equation (2)(0.87–1.66). Equation (2) illustrates the influence and establishes a rank of some importantelements, starting with aluminum (having the lowest detrimental effect), followed by tinand arsenic, titanium and antimony, up to the most hazardous elements, lead and bismuth.According to Thielman, in magnesium-treated irons, the complex antinodularizing factor Kshould not exceed 1.0 [13]. The presence of rare earth elements (Ce, La) in the final chemicalcomposition is quite useful to counteract the negative effect of antinodularizing elements,as the K factor exceeds the 1.0 level [5].
Pearlite promoting factor Px (Equation (3)) is normally decreased by silicon contentincreasing, but it is increased by Mn and many minor elements, which could decrease orjust counteract the silicon effect. According to the data in Tables 2 and 3, at the normalcontent of silicon (2.5% Si), cast irons are characterized by Px = 1.94–2.35, typically forferritic-pearlitic cast irons. Higher silicon content for the second group (3.15–3.44% Si) anda lower level of minor elements leads to very low Px values (0.23–0.47), favorable for theferritic structure. Despite the highest content of silicon (4.55–5.25% Si), the third groupis characterized by an intermediate Px level (1.52–1.72), due to the higher incidence ofpresence of the minor elements. Then it could be concluded that the favorable effect ofhigh silicon content in ferrite formation allows the tolerance of higher amounts of pearliteand carbide stabilizing elements in the chemical composition of the High-Si ductile castirons [1,2,14,15].
3.2. Thermal (Cooling Curve) Analysis
The well-known Fe-C phase diagram is obtained in equilibrium conditions, withvery pure materials, without minor elements, under vacuum melting and at very slowcooling rate (0.5–2.5 ◦C/min or 0.008–0.04 ◦C/s). On the contrary, the commercial cast ironssolidified in non-equilibrium conditions in the foundry industry, as a result of the complexchemistry (usually more than 30 elements, see Tables 2 and 3), involving different chargematerials and industrial melting procedures, with more than ten times higher castingssolidification rate (>0.4 ◦C/s) [5,16].
As a result, the solidification process will be more complicated, strongly influenced bythe cast iron chemical composition, characteristics of charge materials, melting parameters,metallurgical treatment applied to the molten iron, pouring parameters, castings charac-teristics, mold and core media, etc. Generally, the real Fe-C phase diagram is modified, interms of representative temperatures and carbon concentration, while the solidificationprocess is performed at a higher undercooling. Representative in this respect is the solidifi-cation cooling curve. A typical system of cooling curves [T = f(t)] and its first derivative[dT/dt = f(t)] is presented in Figure 2, referring to the Program I, Table 1.

Metals 2021, 11, 846 6 of 16
Figure 2. Typical cooling curves [T = f(t)] and their first derivative [dT/dt = f(t)] of un-inoculated (a) and inoculated (b)ductile cast irons (Program I, Table 1, CE = 4.11%) (TAL—temperature of austenitic liquidus; TEU—the lowest and TER—thehighest eutectic temperatures; TES—temperature at the end of solidification; FDES—the lowest peak on the first derivativeat the end of solidification).
The starting formation of the solid phase, as primary austenite, is clear marked by TAL(temperature of the austenitic liquidus) (Figure 2a), as a result of the heat released duringaustenite formation. It is corresponding to the zero level on the first derivative curve, andaccording to the hypo-eutectic position of this cast iron (CE = 4.11%). For hyper-eutecticcast irons, the primary graphite will be the first formed solid phase, corresponding to theTGL-temperature of the graphitic liquidus, usually less obvious on the cooling curve, dueto the lower heat released during the graphite formation, comparing to the austenite.
TEU represents the lowest and TER the highest eutectic temperature on the coolingcurve, both of them corresponding to zero level on the first derivative of the cooling curve(Figure 2a). Solid eutectic (austenite + graphite) formation means heat release, whichcould compensate for the lost heat; this process is usually expressed by a limited increasingtemperature (from TEU up to TER), representing the eutectic recalescence. The temperatureof the end of solidification (TES) corresponds to the lowest position of the first derivativeat the end of solidification, FDES (Figure 2b).
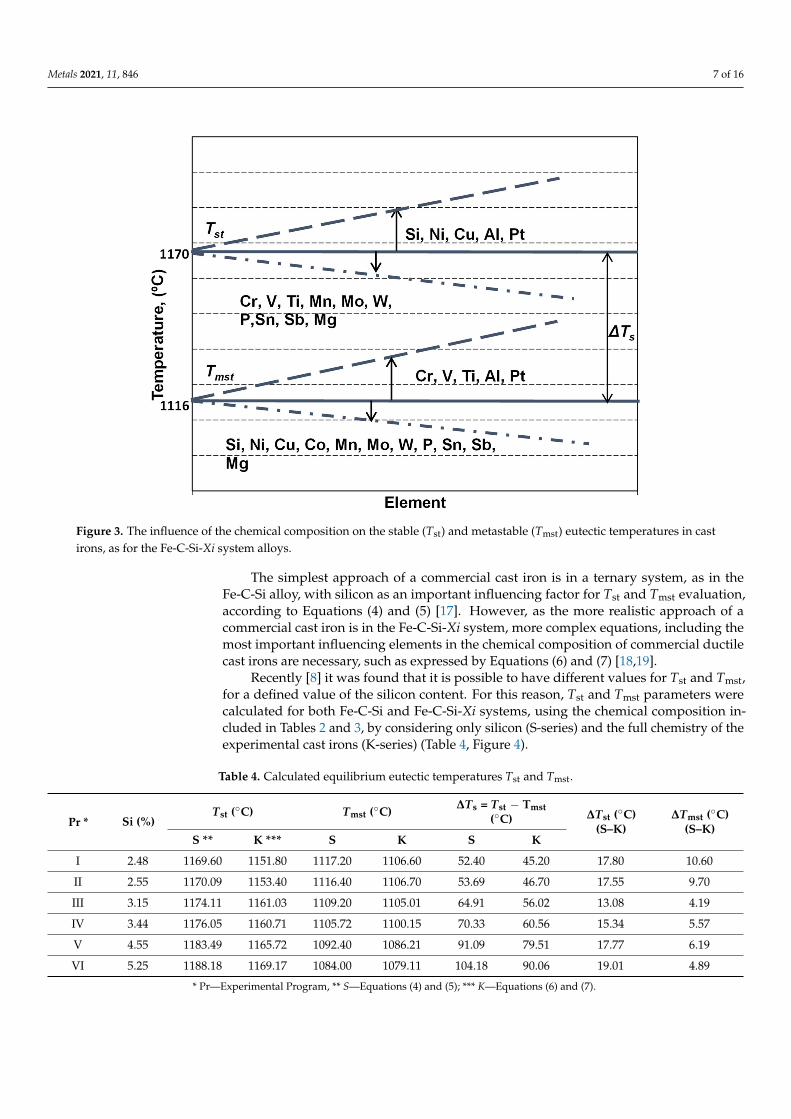
Important information on the primary structure, especially expressed by carbides tographite transition in the first part of eutectic reaction and on the results of the solidificationof the last liquid iron in the areas between the eutectic cells (carbides, micro-shrinkage)could be obtained. This is possible if TEU, TER and TES parameters are reported to theeutectic equilibrium temperatures in graphitic (stable—Tst) and carbidic (metastable—Tmst)Fe-C systems. These temperatures have fixed values in the binary Fe-C system, but variablelevels, depending on the presence, the content and the specific influence factor of otherelements, which affect the carbon solubility in the liquid iron (Figure 3).
Metals 2021, 11, 846 7 of 16
Figure 3. The influence of the chemical composition on the stable (Tst) and metastable (Tmst) eutectic temperatures in castirons, as for the Fe-C-Si-Xi system alloys.
The simplest approach of a commercial cast iron is in a ternary system, as in theFe-C-Si alloy, with silicon as an important influencing factor for Tst and Tmst evaluation,according to Equations (4) and (5) [17]. However, as the more realistic approach of acommercial cast iron is in the Fe-C-Si-Xi system, more complex equations, including themost important influencing elements in the chemical composition of commercial ductilecast irons are necessary, such as expressed by Equations (6) and (7) [18,19].
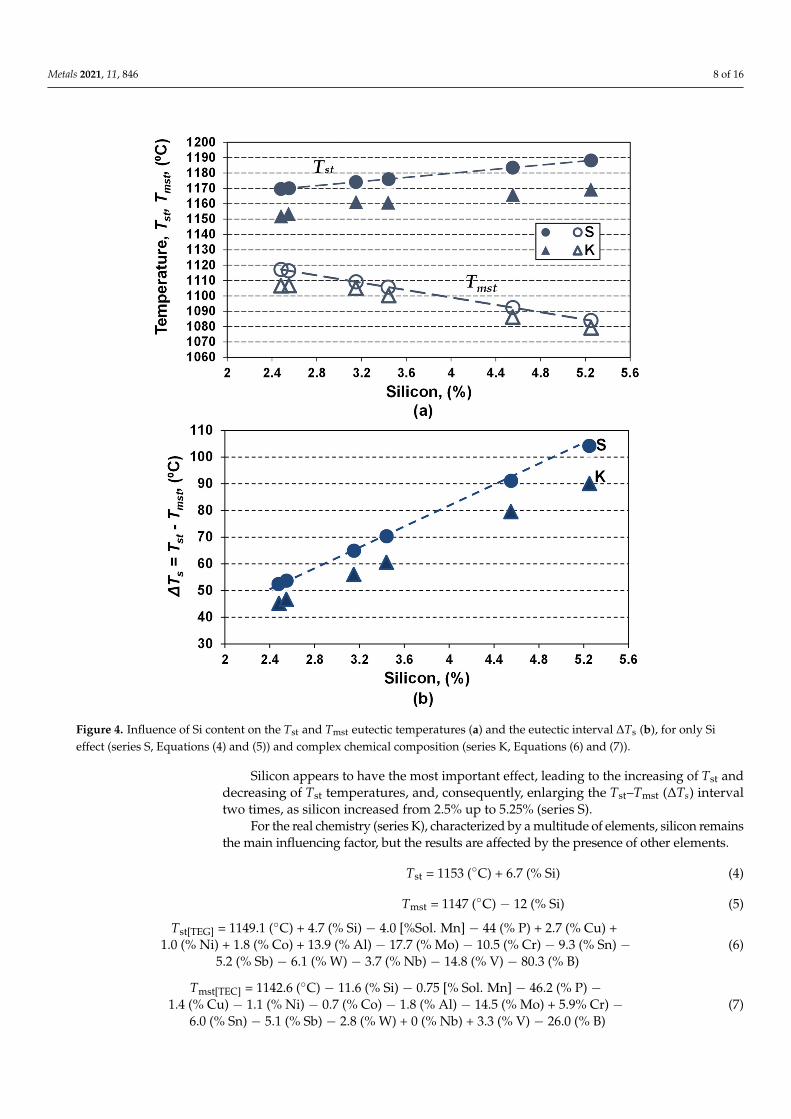
Recently [8] it was found that it is possible to have different values for Tst and Tmst,for a defined value of the silicon content. For this reason, Tst and Tmst parameters werecalculated for both Fe-C-Si and Fe-C-Si-Xi systems, using the chemical composition in-cluded in Tables 2 and 3, by considering only silicon (S-series) and the full chemistry of theexperimental cast irons (K-series) (Table 4, Figure 4).
Table 4. Calculated equilibrium eutectic temperatures Tst and Tmst.
Pr * Si (%)Tst (◦C) Tmst (◦C) ∆Ts = Tst − Tmst
(◦C) ∆Tst (◦C)(S–K)
∆Tmst (◦C)(S–K)
S ** K *** S K S K
I 2.48 1169.60 1151.80 1117.20 1106.60 52.40 45.20 17.80 10.60
II 2.55 1170.09 1153.40 1116.40 1106.70 53.69 46.70 17.55 9.70
III 3.15 1174.11 1161.03 1109.20 1105.01 64.91 56.02 13.08 4.19
IV 3.44 1176.05 1160.71 1105.72 1100.15 70.33 60.56 15.34 5.57
V 4.55 1183.49 1165.72 1092.40 1086.21 91.09 79.51 17.77 6.19
VI 5.25 1188.18 1169.17 1084.00 1079.11 104.18 90.06 19.01 4.89
* Pr—Experimental Program, ** S—Equations (4) and (5); *** K—Equations (6) and (7).
Metals 2021, 11, 846 8 of 16
Figure 4. Influence of Si content on the Tst and Tmst eutectic temperatures (a) and the eutectic interval ∆Ts (b), for only Sieffect (series S, Equations (4) and (5)) and complex chemical composition (series K, Equations (6) and (7)).
Silicon appears to have the most important effect, leading to the increasing of Tst anddecreasing of Tst temperatures, and, consequently, enlarging the Tst–Tmst (∆Ts) intervaltwo times, as silicon increased from 2.5% up to 5.25% (series S).
For the real chemistry (series K), characterized by a multitude of elements, silicon remainsthe main influencing factor, but the results are affected by the presence of other elements.
Tst = 1153 (◦C) + 6.7 (% Si) (4)
Tmst = 1147 (◦C) − 12 (% Si) (5)
Tst[TEG] = 1149.1 (◦C) + 4.7 (% Si) − 4.0 [%Sol. Mn] − 44 (% P) + 2.7 (% Cu) +1.0 (% Ni) + 1.8 (% Co) + 13.9 (% Al) − 17.7 (% Mo) − 10.5 (% Cr) − 9.3 (% Sn) −
5.2 (% Sb) − 6.1 (% W) − 3.7 (% Nb) − 14.8 (% V) − 80.3 (% B)(6)
Tmst[TEC] = 1142.6 (◦C) − 11.6 (% Si) − 0.75 [% Sol. Mn] − 46.2 (% P) −1.4 (% Cu) − 1.1 (% Ni) − 0.7 (% Co) − 1.8 (% Al) − 14.5 (% Mo) + 5.9% Cr) −
6.0 (% Sn) − 5.1 (% Sb) − 2.8 (% W) + 0 (% Nb) + 3.3 (% V) − 26.0 (% B)(7)
Metals 2021, 11, 846 9 of 16
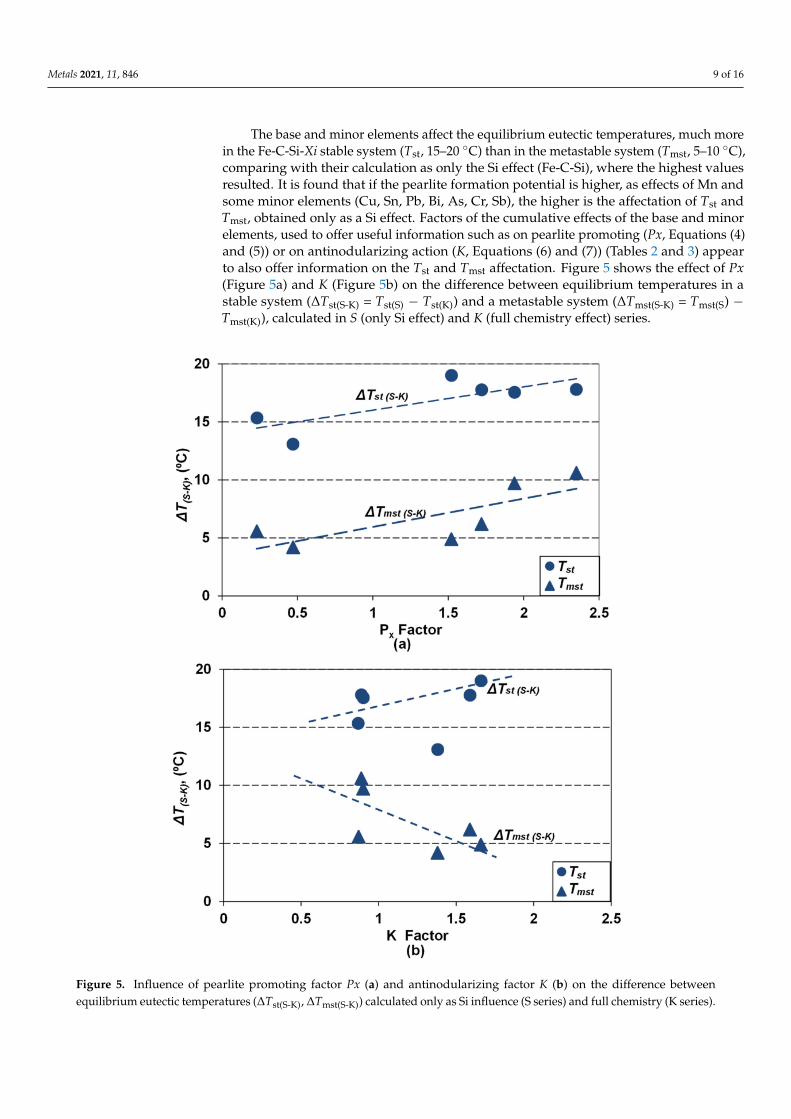
The base and minor elements affect the equilibrium eutectic temperatures, much morein the Fe-C-Si-Xi stable system (Tst, 15–20 ◦C) than in the metastable system (Tmst, 5–10 ◦C),comparing with their calculation as only the Si effect (Fe-C-Si), where the highest valuesresulted. It is found that if the pearlite formation potential is higher, as effects of Mn andsome minor elements (Cu, Sn, Pb, Bi, As, Cr, Sb), the higher is the affectation of Tst andTmst, obtained only as a Si effect. Factors of the cumulative effects of the base and minorelements, used to offer useful information such as on pearlite promoting (Px, Equations (4)and (5)) or on antinodularizing action (K, Equations (6) and (7)) (Tables 2 and 3) appearto also offer information on the Tst and Tmst affectation. Figure 5 shows the effect of Px(Figure 5a) and K (Figure 5b) on the difference between equilibrium temperatures in astable system (∆Tst(S-K) = Tst(S) − Tst(K)) and a metastable system (∆Tmst(S-K) = Tmst(S) −Tmst(K)), calculated in S (only Si effect) and K (full chemistry effect) series.
Figure 5. Influence of pearlite promoting factor Px (a) and antinodularizing factor K (b) on the difference betweenequilibrium eutectic temperatures (∆Tst(S-K), ∆Tmst(S-K)) calculated only as Si influence (S series) and full chemistry (K series).

Metals 2021, 11, 846 10 of 16
Elements promoting pearlite, with a cumulative effect expressed by the Px factor,act to increase the difference between both the considered eutectic temperatures (T(S-K)),practically with the same power. The ∆T(S-K) factor for high purity cast iron (Px < 0.5)reached 4–5 ◦C for Tmst and 13–15 ◦C for Tst, but it will reach 10 ◦C for Tmst and 20 ◦C forTst, for Px > 2.0, respectively.
Elements known with an antinodularizing action, with a cumulative effect expressedby the K factor, have different effects on the considered eutectic temperatures (Figure 5b).Factor ∆Tmst(S-K) decreases (from 5–10 ◦C up to 4–5 ◦C) by transition from medium purecast iron (K < 1.0) to lower purity cast iron (K = 1.5–2.0). The ∆Tst(S-K) factor has anun-conclusive evolution.
Table 5 summarizes the results obtained in thermal (cooling curve) analysis, as selectedrepresentative temperatures on the cooling curve, characteristics to the eutectic reaction andthe end of solidification, and the undercooling degrees referring to the stable and metastableequilibrium eutectic temperatures, as effects of silicon alloying and inoculation application.
Table 5. Representative parameters of thermal (cooling curve) analysis.
Pr * Si(%) Iron TEU
(◦C)TER(◦C)
TES(◦C)
∆Tm(◦C)
∆T1(◦C)
∆T2(◦C)
∆T3(◦C)
∆TEU(◦C)
∆TES(◦C)
I 2.48UI ** 1128.4 1129.9 1050.9 23.4 21.8 23.3 −55.7
14.0 36.6Inoc *** 1142.4 1145.1 1087.5 9.4 35.8 38.5 −19.1
II 2.55UI 1136.6 1136.8 1050.4 16.8 28.9 30.1 −56.3
9.2 47.2Inoc 1145.8 1147.7 1097.6 7.6 39.1 41.0 −9.1
III 3.15 Inoc 1144.53 1156.01 1107.17 16.5 39.52 51.0 2.16
IV 3.44UI 1138.34 1141.16 1089.03 22.37 38.19 41.01 −11.1
7.63 9.14Inoc 1145.97 1150.07 1098.17 14.74 45.82 49.92 −1.98
V 4.55UI 1156.1 1156.6 1104.4 9.62 69.89 70.39 18.9
1.8 2.3Inoc 1157.9 1158.6 1106.7 7.82 71.69 72.39 20.5
VI 5.25UI 1156.7 1158.9 1106.2 12.47 77.59 79.79 27.09
0.6 0.3Inoc 1157.3 1158.9 1106.5 11.87 78.19 79.79 27.39
* Pr—Experimental Program, ** UI—non-inoculation; *** Inoc—inoculation.
Figure 6 shows the influence of the silicon content and applied inoculation on therepresentative temperatures characterizing the eutectic formation and the end of solidifica-tion, showing: the lowest eutectic reaction temperature (TEU), the highest (recalescence)eutectic reaction temperature (TER), and the temperature of the end of solidification (TES).
Both the silicon content and the inoculation act as favorable influencing factors byincreasing all these temperatures, but at different powers depending on the consideredtemperature and the silicon alloying grade in ductile cast irons, respectively.
Increasing the silicon content from 2.5% up to 5.25% in the present experimentalprograms leads to increasing the representative temperatures, in both non-inoculated andinoculated ductile cast irons (UI/Inoc): TEU (from 1128.4 ◦C to 1156.7 ◦C/from 1142.4 to1157.9◦C), TER (from 1129.9 ◦C to 1158.9 ◦C/from 1145.1 ◦C to 1158.9 ◦C) and TES (from1050.4 ◦C to 1106.2 ◦C/from 1097.5 ◦C to 1106.7 ◦C). The power of increasing the silicon ishigher in less than 4.0% Si comparing with the highest silicon content range.
The highest effect of inoculation is visible in non-Si alloyed cast irons (2.5% Si):∆TEU = 9–14 ◦C, ∆TER = 11–15 ◦C and is 3 to 4 four times higher for TES (∆TES = 37–47 ◦C).For the low level silicon alloying grade (3.15–3.45% Si) beneficial inoculation effect, ex-pressed by temperatures increasing, it is reduced at 7 ◦C order for TEU and TER and 9 ◦Cfor TES, respectively. The highest alloying grade (4.55–5.25% Si) ductile cast irons arecharacterized by the lowest contribution of inoculation, expressed by ∆TEU = 0.6–1.8 ◦C,∆TER = 0–2 ◦C and ∆TES = 0.3–2.3 ◦C.

Metals 2021, 11, 846 11 of 16
Figure 6. Influence of the silicon content and inoculation on the TEU, TER and TES temperatures (a) and the differencebetween the inoculated and non-inoculated ductile cast irons (∆TEU, ∆TES) (b).
The representative temperatures TEU, TER and TES could offer useful information es-pecially if they are compared with equilibrium eutectic temperatures, in a stable (graphitic)system Tst and in a metastable (carbidic) system Tmst. Positions of these temperaturesreferring to the Tst–Tmst interval are expressed by a specific undercooling degree.

Metals 2021, 11, 846 12 of 16
The most important parameters are illustrated by Equations (8)–(11):
∆Tm = Tst − TEU (8)
∆T1 = TEU − Tmst (9)
∆T2 = TER − Tmst (10)
∆T3 = TES − Tmst (11)
The highest eutectic undercooling ∆Tm, as the difference between stable equilibriumeutectic temperature Tst and the lowest temperature level on the cooling curve TEU offersinformation on the real undercooling necessary for starting the eutectic reaction. Generally,the higher ∆Tm is, the higher is the possibility to form free carbides in the first stage ofsolidification. But the certitude of the free carbides formation, in specific solidificationconditions, could be obtained only if this parameter is higher than the ∆Ts = Tst–Tmst interval.
This means that the eutectic reaction will start below Tmst with carbides formation, butwithout information on the end of the eutectic reaction, when the temperature increased,due to the heat released as solid eutectic formation. Also, no information on it is happenedat the end of solidification, in non-equilibrium conditions, specifically for iron castingsproduction in the foundry industry.
Information on these important characteristics of the cast iron solidification couldalso be obtained by comparing TEU, TER and TES with Tmst, resulting in an undercoolingdegree ∆T1, ∆T2 and ∆T3, respectively. As free carbides could be formed only if the eutecticreaction temperatures are lower than Tmst, and graphite is promoted if these temperaturesare above Tmst, negative values mean carbides and positive values mean graphite, at thebeginning of the eutectic reaction (∆T1) and at the end of this reaction (∆T2), respectively.
Total graphitic structure is illustrated by positive values and total carbidic structure(white cast iron) by negative values, for both ∆T1 and ∆T2 parameters. Mottled cast ironis characterized by carbides formation at the beginning of the eutectic reaction (∆T1 isnegative) and graphite at the end of eutectic reaction (∆T2 is positive). The sensitiveness ofiron castings to form undesirable defects at the end of solidification, such as free carbidesand micro-shrinkage in the areas between eutectic cells is expressed by the ∆T3 under-cooling degree: the higher (more negative) is ∆T3, the higher is the occurrence of theseundesirable events.
Figure 7 shows the variation of the representative undercooling degrees, reporting toTst (∆Tm) and Tmst (∆T1, ∆T2, ∆T3) as effect of silicon content and inoculation application.Silicon favors the increasing of Tst and decreasing of Tmst (∆Ts = Tst–Tmst enlargement)(Figure 4), and, at the same time, the increasing of TEU, TER and TES parameters (Figure 6).As a result, the undercooling behavior during solidification will be influenced by both ofthese effects. Tst and Tmst are considered to be the effects of all the identified elements inthe final chemical composition of tested ductile cast irons (K series), including not onlysilicon influence, but also the complex behavior of the other elements (Figure 2).
Metals 2021, 11, 846 13 of 16
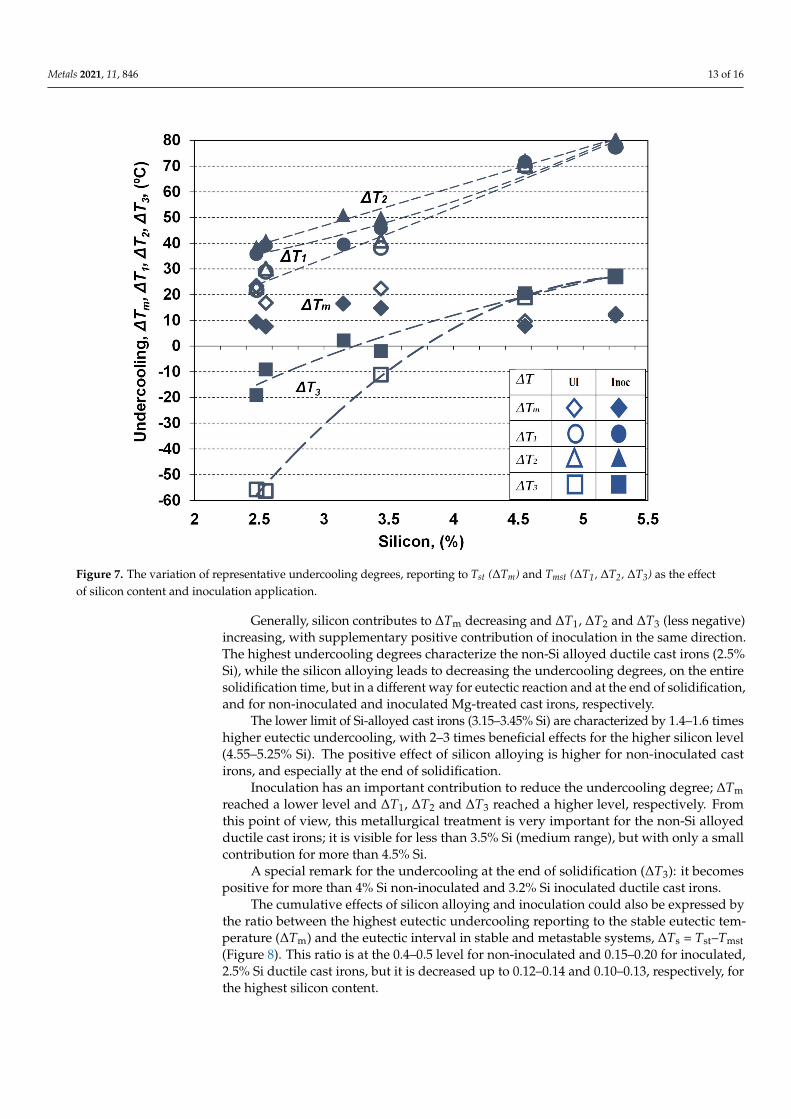
Figure 7. The variation of representative undercooling degrees, reporting to Tst (∆Tm) and Tmst (∆T1, ∆T2, ∆T3) as the effectof silicon content and inoculation application.
Generally, silicon contributes to ∆Tm decreasing and ∆T1, ∆T2 and ∆T3 (less negative)increasing, with supplementary positive contribution of inoculation in the same direction.The highest undercooling degrees characterize the non-Si alloyed ductile cast irons (2.5%Si), while the silicon alloying leads to decreasing the undercooling degrees, on the entiresolidification time, but in a different way for eutectic reaction and at the end of solidification,and for non-inoculated and inoculated Mg-treated cast irons, respectively.
The lower limit of Si-alloyed cast irons (3.15–3.45% Si) are characterized by 1.4–1.6 timeshigher eutectic undercooling, with 2–3 times beneficial effects for the higher silicon level(4.55–5.25% Si). The positive effect of silicon alloying is higher for non-inoculated castirons, and especially at the end of solidification.
Inoculation has an important contribution to reduce the undercooling degree; ∆Tmreached a lower level and ∆T1, ∆T2 and ∆T3 reached a higher level, respectively. Fromthis point of view, this metallurgical treatment is very important for the non-Si alloyedductile cast irons; it is visible for less than 3.5% Si (medium range), but with only a smallcontribution for more than 4.5% Si.
A special remark for the undercooling at the end of solidification (∆T3): it becomespositive for more than 4% Si non-inoculated and 3.2% Si inoculated ductile cast irons.
The cumulative effects of silicon alloying and inoculation could also be expressed bythe ratio between the highest eutectic undercooling reporting to the stable eutectic tem-perature (∆Tm) and the eutectic interval in stable and metastable systems, ∆Ts = Tst–Tmst(Figure 8). This ratio is at the 0.4–0.5 level for non-inoculated and 0.15–0.20 for inoculated,2.5% Si ductile cast irons, but it is decreased up to 0.12–0.14 and 0.10–0.13, respectively, forthe highest silicon content.

Metals 2021, 11, 846 14 of 16
Figure 8. The cumulative effects of silicon alloying and inoculation on the eutectic undercooling level.
Generally, the ∆Tm/∆Ts ratio is strongly affected by inoculation for less than 3.5% Si,but at a lower level, and less affected by inoculation for more than 4.5% Si. The 2.5–3.5% Siductile cast irons are more sensitive to high solidification undercooling (but with a higherefficiency of inoculation), comparing to 4.5–5.5% Si cast irons, at a lower undercooling level(but also at a lower inoculation effect). In high Si-ductile cast irons (especially for morethan 4% Si) the main objective of inoculation is not carbides avoiding, but the improvementof the nodular graphite compactness degree (affected by Si) [2,11,20].
It was found that the solidification time has a significant effect on the microstructureand mechanical properties of solution strengthened ferritic ductile iron. In particular, it hasbeen found that with increasing solidification times, the microstructure becomes coarserand the presence of defects increases. Moreover, the lower the cooling rate, the lower themeasured tensile and fatigue properties [21]. A recent work [22] found that the melt qualityis closely associated with the resultant morphology and number of austenite dendrites,graphite nodules, and matrix structure, in thin-walled ductile iron castings.
4. Conclusions
The present paper evaluates by a thermal (cooling curve) analysis the solidification pat-tern of ductile cast irons, non-Si alloyed (<3.0% Si), low (3.0–3.5% Si) and medium Si alloyed(4.5–5.5% Si), as silicon content increases and inoculation is applied with simultaneouseffects. The following conclusions could be drawn.
• Chemical analysis focuses not only on the base elements but also on the minor ele-ments, such as their cumulative effects such as the pearlite formation sensitiveness,antinodularizing action and on the values of eutectic temperatures in stable (graphitic)and metastable (carbidic) Fe-C-Si-Xi systems.
• Silicon is an important influencing factor, but the base and minor elements affectthe equilibrium eutectic temperatures, inclusively at high Si-content, much morein the Fe-C-Si-Xi stable system (∆Tst = 15–20 ◦C) than in the metastable system(∆Tmst = 5–10 ◦C), comparing their calculations with only the Si effect (Fe-C-Si system),where the highest values resulted.
• It is found that higher is the pearlite formation potential (Px), the higher is the affecta-tion of Tst and Tmst, obtained only as a Si effect: from 4–5 ◦C for Tmst and 13–15 ◦C
Metals 2021, 11, 846 15 of 16
for Tst in high purity cast iron (Px < 0.5) up to 10 ◦C for Tmst and 20 ◦C for Tst, forPx > 2.0.
• Elements known to have an antinodularizing action, with cumulative effect expressedby K factor, decrease Tmst (from 5–10 ◦C up to 4–5 ◦C) by transition from a mediumpure cast iron (K < 1.0) to a lower purity cast iron (K = 1.5–2.0), without a conclusiveevolution for Tst.
• Both Si-content and inoculation act as favorable influencing factors, by increasing therepresentative temperatures and decreasing the undercooling degrees for the eutecticreaction and at the end of solidification, but at a different power depending on theconsidered temperature and the Si-alloying grade.
• The highest positive effect of inoculation is visible in non-Si alloyed cast irons (2.5% Si):9–15 ◦C for the eutectic reaction and 3 to 4 times increased at the end of solidification(37–47 ◦C). Increased Si content decreases the inoculation power to 7–9 ◦C for a lowalloying grade (up to 3.5% Si), with the lowest contribution at more than 4.5% Si(0.3–2.0 ◦C).
• Si favors increasing of the eutectic interval (Tst–Tmst), and, at the same time, theincreasing of temperatures for the eutectic reaction and, at the end of solidification,with other elements contribution, as well. As a result, the undercooling behaviorduring solidification will be influenced by both effects.
• The highest undercooling characterizes the non-Si alloyed cast irons, while the lowerlimit of Si-alloyed cast irons are characterized by 1.4–1.6 times lower eutectic under-cooling, with 2–3 times higher beneficial effect for the higher Si level. The positiveeffect of Si-alloying is higher for non-inoculated cast irons, and especially at the endof solidification.
• Inoculation has an important contribution to reduce the undercooling degree, beingvery important for the non-Si alloying, visible for less than 3.5% Si, but with only asmall contribution for more than 4.5% Si. A special remark for the undercooling at theend of solidification, which becomes positive for more than 4% Si non-inoculated and3.2% Si inoculated ductile cast irons.
• 2.5–3.5% Si ductile cast irons are more sensitive to high solidification undercooling(but with a higher efficiency of inoculation), comparing to 4.5–5.5% Si cast irons, at alower undercooling level (but also at a lower inoculation effect). In high Si-ductile castirons (especially for more than 4% Si) the main objective of inoculation is not carbidesavoiding, but the improvement of the nodular graphite compactness degree (affectedby Si). This could be important especially in the furan resin molding technique, whereSulphur in P-toluenesulphonic acid (PTSA), usually is used as the hardener, has beenidentified as an important factor causing graphite degeneration [23].
Author Contributions: I.S., D.A., S.S. and I.R. contributed equally in conceiving, designing andperforming the experiments; analyzing the data; and writing the paper. All authors have read andagreed to the published version of the manuscript.
Funding: This research received no external funding.
Data Availability Statement: Not applicable.
Conflicts of Interest: The authors declare no conflict of interest.
References1. Stets, W.; Loblich, H.; Gassner, G.; Schumacher, P. Solution Strengthened Ferritic Ductile Cast Iron According DIN EN1563:2012–
Properties, Production and Application. In Proceedings of the “Keith Millis” Symposium on Ductile Iron, Nashville, TN, USA,15–17 October 2013; pp. 283–292.
2. Stan, S.; Riposan, I.; Chisamera, M.; Barstow, M. Solidification Pattern of Silicon Alloyed Ductile Cast Irons. In Proceedings of the122nd AFS Metalcasting Congress, Fort Worth, TX, USA, 3–5 April 2018; pp. 18–22.
3. EN 1563 Founding—Spheroidal Graphite Cast Irons. Available online: https://www.en-standard.eu/csn-en-1563-founding-spheroidal-graphite-cast-irons/ (accessed on 13 March 2021).

Metals 2021, 11, 846 16 of 16
4. Automotive Ductile Iron Castings for High Temperature Applications J2582_200406. Available online: https://www.sae.org/standards/content/j2582_200406/ (accessed on 13 March 2021).
5. Riposan, I.; Skaland, T. Modification and Inoculation of Cast Iron. In Cast Iron Science and Technology Handbook; Stefanescu, D.M.,Ed.; American Society of Materials: Materials Park, OH, USA, 2017; pp. 160–176.
6. Stefanescu, D.M. Thermal Analysis-Theory and Applications in Metalcasting. Int. J. Metalcasting 2015, 9, 7–22. [CrossRef]7. Sparkman, D. Microstructure by Thermal Analysis. AFS Trans. 2011, 119, 413–419.8. Cojocaru, A.M.; Riposan, I.; Stan, S. Solidification Influence in the Control of Inoculation Effects in Ductile Cast Irons by Thermal
Analysis. J. Therm. Anal. Calorim. 2019, 138, 2131–2143. [CrossRef]9. Anca, D.; Chisamera, M.; Stan, S.; Stan, I.; Riposan, I. Sulfur and Oxygen Effects on High-Si Ductile Iron Casting Skin Formation.
Coatings 2020, 10, 618. [CrossRef]10. Anca, D.; Chisamera, M.; Stan, S.; Riposan, I. Graphite Degeneration in High Si, Mg-Treated Iron Castings—Sulfur and Oxygen
Addition Effects. Int. J. Met. 2019, 14, 663–671. [CrossRef]11. Riposan, I.; Stefan, E.; Stan, S.; Pana, N.R.; Chisamera, M. Effects of Inoculation on Structure Characteristics of High Silicon
Ductile Cast Irons in Thin Wall Castings. Metals 2020, 10, 1091. [CrossRef]12. QuiK-Cup®QuiK-Lab®E Thermal Analysis of Cast Iron. Available online: https://www.heraeus.com/media/media/hen/
media_hen/products_hen/iron/QuikLabE_QuikCup_EN_lowres.pdf (accessed on 13 March 2021).13. Thielemann, T. Zur Wirkung van Spurenelementen in Gusseisen mit Kugelgraphit [Effects of trace elements in nodular graphite
cast irons]. Giessereitechnik 1970, 16, 16–24.14. Dommaaschk, C. Chances and Limits of High Silicon Ductile Iron. In Proceedings of the WFO Technical Forum, Gauteng, Africa,
14–17 March 2017.15. Hammersberg, P.; Hamberg, K.; Bjorkegren, L.E.; Lindkvist, J.; Borgstrom, H. Sensitivity to Variation of Tensile Properties of High
Silicon Ductile Iron. Mater. Sci. Forum 2018, 925, 280–287. [CrossRef]16. Zhou, J. Colour Metallurgy of Cast Iron. China Foundry 2009, 6, 57–69.17. Sillen, R.V. Novacast Technologies. 2006. Available online: www.novacast.se (accessed on 10 December 2006).18. Kanno, T.; Iwami, Y.; Kang, I. Prediction of Graphite Nodule Count and Shrinkage Tendency in Ductile Cast Iron With 1 Cup
Thermal Analysis. Int. J. Metalcast. 2017, 11, 94–100. [CrossRef]19. Kanno, T.; Fukuda, Y.; Morinaka, M.; Nakae, H. Effect of Alloying Elements on Graphite and Cementite Eutectic Temperature of
Cast Iron. J. JFS. 1998, 70, 465–470.20. Stan, S.; Riposan, I.; Chisamera, M.; Stan, I. Solidification Characteristics of Silicon Alloyed Ductile Cast Irons. J. Mater. Eng.
Perform. 2019, 28, 278–286. [CrossRef]21. Borsato, T.; Ferro, P.; Berto, F.; Carollo, C. Effect of Solidification Time on Microstructural, Mechanical and Fatigue Properties of
Solution Strengthened Ferritic Ductile Iron. Metals 2019, 9, 24. [CrossRef]22. Gorny, M.; Kawalec, M.; Sikora, G.; Olejnik, E.; Lopez, H. Primary Structure and Graphite nodules in Thin-Walled High-Nickel
Ductile Iron Castings. Metals 2018, 8, 649. [CrossRef]23. Ivan, N.; Chisamera, M.; Riposan, I. Graphite Degeneration In the Surface Layer of Ductile Iron Castings. Int. J. Cast Met. Res.
2013, 26, 138–142. [CrossRef]