Solidification Pattern of Si-Alloyed, Inoculated Ductile Cast ...
Upload
khangminh22Category
view
0download
0
INSTITUTE OF PHYSICS PUBLISHING JOURNAL OF PHYSICS D: APPLIED PHYSICS
J. Phys. D: Appl. Phys. 39 (2006) 4450–4456 doi:10.1088/0022-3727/39/20/023
Real time observation of dendriticsolidification in alloys by synchrotronmicroradiographyB Li1, H D Brody1, D R Black2, H E Burdette2 and C Rau3
1Department of Metallurgy and Materials Engineering, University of Connecticut, Storrs,CT 06269-3136, USA2 National Institute of Standards and Technology, Gaithersburg, MD 20899, USA3 Frederick-Seitz Materials Research Laboratory, University of Illinois at Urbana Champaign,Argonne, IL 60439, USA
Received 29 December 2005, in final form 16 July 2006Published 29 September 2006Online at stacks.iop.org/JPhysD/39/4450
AbstractA third generation synchrotron x-ray source and advanced imaging facilitieswere used to study dendritic solidification in metallic alloys in real time. Adigital camera and a video camera with different time and spatial resolutionwere tested to capture growing dendrites during solidification ofSn–13 wt%Bi and Al–25 wt%Cu alloys. The captured digital images showthat the morphology of the dendrites can be resolved with satisfactoryresolution and contrast. The trade-off between spatial resolution and timeresolution was discussed. The effect of beam characteristics such asintensity, parallelism and coherency on both spatial and time resolution wasanalysed, and potential improvements with higher image quality withreduced exposure time were also discussed.
1. Introduction
To unambiguously understand alloy solidification processesrequires direct observations of the growth of solid phases inthe melt, which is normally invisible for real alloys due totheir opacity. Though indirect observation techniques [1, 2]such as interface quenching have provided valuable insightstowards understanding alloy solidification, these techniquescannot observe detailed information of dendrite growth andsolute redistribution during the solidification of real alloysin real time. For instance, in interface quenching [1, 2],solidification is interrupted by quenching a solidifying sampleat the mushy temperatures. The remaining liquid rapidlysolidifies into a fine structure, and the primary solid phase canbe easily distinguished from the liquid when morphologicalobservations and quantitative measurements are performed onpolished surfaces of the sample. One disadvantage in theseobservations is that any information about microstructuralevolution before the quenching is lost. For direct observationsof solidification in transparent alloy analogues, there is asignificant difference between their thermal and physicalproperties and that of real alloys [3–6]. Therefore, directobservation in real time of real alloys is preferred in orderto achieve better understanding of alloy solidification.
The high penetrating power of hard x-rays (energy above10 keV) has made microradiography unique in observinginternal structures of metallic materials [7–12]. Among theapplications of microradiography is real time observation ofalloy solidification [10–12]. Early observations were limitedby the characteristics of available x-ray sources, such asintensity and divergence, and images were captured withlimited resolution and contrast and only qualitative results wereobtained [10–12]. More recently, advances in technology suchas digital cameras coupled with solid-state imaging detectorsthat have fast response to x-ray photons and new types of x-raysources have stimulated renewed interest in real time studiesof alloy solidification [13–17].
Despite the fact that more and more data have beencollected by the microradiography technique in studies ofalloy solidification [13–17], carrying out such experiments issomewhat difficult, in the sense that capturing high qualityimages is elusive. By quality we mean image contrast andresolution. To well resolve features of the growing solid phasein the melt of real alloys requires comprehensive knowledgeof x-ray optics, alloy solidification and modern imagingtechnology. Not surprisingly, most previous observationswere qualitative due to the limited image quality. To attain
0022-3727/06/204450+07$30.00 © 2006 IOP Publishing Ltd Printed in the UK 4450

Real time observation of dendritic solidification in alloys
quantitative analyses based on real time observations, higherimage quality has to be achieved.
In earlier experiments, dendrite coarsening and tempera-ture gradient zone melting (TGZM) in an Sn–13 wt%Bi alloywere studied using synchrotron radiation at the Cornell HighEnergy Synchrotron Source (CHESS) [18,19]. In these exper-iments, an x-ray optical system combined with a high resolv-ing power negative film was used to capture growing dendriteswith an exposure time of a fraction of a second (typically below0.1 s). Positive images were then developed in the darkroom.Quantitative data of dendrite coarsening and rate of TGZM indirectional solidification were obtained [18, 19]. Despite thehigh image quality in terms of spatial resolution and contrast,the photographic development of images is laborious and timeconsuming and the need to place the film in the experimentalenclosure limits temporal resolution. A real time digital imag-ing system, of comparable image quality, is more convenientand can easily identify the beginning of the dendrite growth.In the present paper, we describe an imaging system utilizinga third generation synchrotron radiation source, the AdvancedPhoton Source (APS), Argonne National Laboratory (ANL)and advanced digital camera systems, that provides improvedimage quality compared with previous results. We apply thissystem to the real time study of alloy solidification in Sn–Biand Al–Cu alloys.
2. Experimental method
When x-rays pass through a solidifying alloy sample, imagecontrast can be produced from several sources. One is thedensity difference between the solid and the liquid, whichis usually negligible. Another is the phase contrast that isproduced when a coherent x-ray beam refracts from structureswithin the sample with different indices of refraction. Thiskind of contrast has potential applications in imaging structuresthat only have small absorption contrast [20]. The major sourceof image contrast comes from the composition differencebetween the solid and the liquid. During cooling in alloysolidification, if we assume the solid is in equilibrium withthe liquid, then the liquid composition follows the liquidusline, and the solid composition follows the solidus line in anequilibrium phase diagram. Thus, the solute partition ratiok, defined as the ratio between the solid composition andthe liquid composition, plays an important role in the imagecontrast. For a eutectic alloy with k < 1, during solidification,the first formed solid is purer in a solute, and the solute has tobe rejected into the liquid, which is therefore enriched withthe solute. This important feature of solute redistributionin alloy solidification produces the image contrast that isnecessary to distinguish the solid from the liquid. Hence,larger differences in the absorption coefficients between thealloying elements, relatively higher nominal composition andsmaller partition ratio k, are preferred in order to capturehigh quality images of the growing solid. In this work,Sn–13 wt%Bi and Al–25 wt%Cu alloys were used to observedendritic solidification in real time.
Both Sn–13 wt%Bi and Al–25 wt%Cu alloys arehypoeutectic, with a eutectic point of (57 wt%Bi, 139 ◦C) and(33 wt%Cu, 548 ◦C), freezing range (from liquidus to eutectictemperature) of 75 ◦C and 28 ◦C, respectively. The absolute
CCDcamera
X-rays
Objectivelens
Scintillator
Mirror
Furnace and sampleassembly
~3cm
Heater
Figure 1. Schematic of experimental setup. The distance betweenthe scintillator and the sample was roughly 3 cm. The objective lenswas focused on the scintillator. The temperature gradient (G) on thesample could be upwards or downwards. In this work, G wasalways upwards (against the gravity) in order to minimize thermallydriven convection.
difference in absorption coefficients between Sn and Bi, Aland Cu is relatively large, and accordingly the Sn–Bi andAl–Cu alloys have often been used in microradiography studies[13,15,17–19].
Figure 1 shows schematically the experimental setupon the bending magnet line of sector 33-(UNICAT) of theAPS. The setup was composed of a solidification furnaceand an imaging system. The furnace was made up of twoidentical, separable heaters that reside on the top and bottomof the furnace, providing the desired temperature control.The cooling rate (ε) and the temperature gradient (G) wereadjustable through programmable temperature controllers.Cooling rates with sufficient linearity and thus steady stategrowth can be achieved.
A thin (typically 130 ∼ 150 µm in thickness), well-polished solid sample was sandwiched and sealed between twographite plates, and the sample assembly was fixed between thetop and the bottom heaters. Graphite was used because it hasgood heat conductivity and is almost transparent to the x-rays.Hence, intensity attenuation after the x-rays pass through thesample assembly was mainly caused by the metallic sample.In the case of Al–Cu samples, due to the much higher liquidustemperature than the Sn–Bi alloy, the surfaces of the graphitewere coated with a thin layer of BN in order to slow downoxidation at elevated temperatures. The total thickness of thegraphite walls was about 1.2 ∼ 1.5 mm.
The temperature control scheme in this work was such thatthe sample stayed still during solidification, but the temperaturewas decreased linearly in a well controlled fashion. The actualtemperature of the sample was measured by two thermocouples10.0 mm apart and directly attached to the sample. A moredetailed description of the construction of the furnace and thegraphite crucible, temperature control and measurement wasprovided elsewhere [21].
As shown in figure 1, after the x-rays passed througha solidifying sample, the absorption image of the samplewas recorded by the detector and the camera. The detectorcontained a scintillation crystal, which transformed theimpinging x-rays into visible light. A 5× object lens wasfocused on the scintillation screen. The detector, the sampleand the x-ray beam were carefully aligned before experiments,so that one of the thermocouple beads was seen in the fieldview and served as a good reference point for quantitative
4451

B Li et al
measurements. The image formed on the scintillator wasthen projected onto the chip of a CCD camera via theoptical microscope and then stored as digital information ona computer hard drive. For the experiments we used a highdynamic range (typically 14-bit), high signal-to-noise-ratioKodak KX2e camera with a 1536 × 1024 pixel array and9 × 9 µ m2 size of each Pixel. The scintillation screen wasa 150 µm-thick yttrium alumina garnet single crystal with a26 µm europium doped layer.
An infinity-corrected objective lens with a long workingdistance was used. For the 5× magnification the workingdistance is 34 mm and the numerical aperture is 0.14. A tubelens with 1× magnification is placed directly behind theobjective lens to form a real image on the CCD chip of thecamera 240 mm away. Using a 5× objective lens and 2 × 2binning of the camera, the effective size of each pixel on thescintillation screen is 3.6 µm. Typical exposure times are inthe order of a couple of seconds.
The x-ray beam was slit down to about 5 × 4 mm for realtime observations. The photon energy for the Al–25 wt%Cuand Sn–13 wt%Bi alloys was 13 KeV and 20 KeV, respectively.Though theoretically the best image contrast could be achievedwhen photon energy was chosen near the absorption edges ofthe elements, experimental results showed that photon energyslightly away from the absorption edges to the high end offeredbetter efficiency in the optics.
3. Results and discussion
Figure 2 shows digital images captured in the experiments.All the images presented are original without any imageenhancement. Figures 2(a)–(c) are the images of growingdendrites in the Sn–13 wt%Bi alloy when the sample wasdirectionally solidified at a cooling rate ε = 2◦ C min−1 andtemperature gradient G = 10◦ C cm−1, corresponding to alocal solidification time 2250 s. Each image was integratedover 3 s. In this scenario, the dendrites popped out across thewhole field of view quickly (figure 2(a)). At first glance, the‘primary’ dendrite arms look like they were growing alongthe temperature gradient, with secondary arms branching toboth sides of the ‘primary’ arms. However, a closer look atthe dendritic structure reveals that the ‘primary’ arms wereactually made up of well aligned, separate segments of shortarms, as schematically shown in the lower-left corner of thefield of view. Each segment conjoined two other branchesand formed a triplet. Such a growth pattern is very differentfrom the normal, directionally solidified dendritic structure.Figure 2(b) was captured 66 s after figure 2(a) and we canclearly see that dendrite coarsening was happening. Eachbranch of the triplets grew rounder and fatter, turning eachtriplet into a short solid band. At this time, a structure ofalternating solid and liquid bands was formed. Figure 2(c) isan image of the dendrites at the later stage of solidification,312 s after figure 2(a). Compared with figure 2(b), dendritesare coarser, and coarsening by coalescence can be clearlyseen. Neighbouring solid bands interconnected and eventuallycoalesced.
Each frame shown in figure 2 integrates over 3 s duringimaging, in order to accumulate sufficient intensity to achievebetter image quality in terms of contrast and resolution. Under
Figure 2. Transverse growth pattern in the Sn–13 wt% Bi alloycaptured by the digital camera, each frame is integrated over 3 s.The cooling rate ε = 2◦ C min−1 and the temperature gradientG = 10◦ C cm−1 (G was upwards), corresponding to a localsolidification time 2250 s. The dendrites (solid phase) were purer insolute (Bi) than the liquid due to the solute partitioning and hencewere less absorptive and looked brighter. (a) Transverse growthpattern with fine dendrites, (b) 66 s after (a), dendrite coarsening canbe seen. The solid triplets became separate, solid bands, (c) 312 safter (a). The solid bands interconnected by coalescence.
these growth conditions, the dendrite tips were moving at a rateof about 33 µm s−1 and the images of the moving tips would beblurred with such a long exposure time. Because the thickeningand coarsening rates of the side arms are much slower thanthe growth rate at the tips, this exposure is acceptable forimaging the growth of side arms behind the growth front. Inthe study of alloy solidification, solute redistribution aroundthe growing tips is of most interest, in the sense that featuressuch as interface instability and microsegregation are closelyassociated with solute redistribution. In order to capturemoving dendrite tips with reasonable resolution, exposure timehas to be reduced.
4452

Real time observation of dendritic solidification in alloys
Figure 3. Longitudinal growth pattern captured by the real time camera. Each frame was averaged over 0.3 s. Cooling rate ε = 2◦ C min−1
and temperature gradient G = 10◦ C cm−1. Solute enrichment in the mushy zone can be recognized. Dendrite selection can be seen. Theblack dot on the lower right corner was the thermocouple bead. (a) Longitudinal growth pattern, (b) 12 s after (a), (c) 44 s after (a) and (d)64 s after (a).
A real time x-ray sensitive video camera with much fasterread-out rate was then used to replace the digital camera, inorder to achieve faster data acquisition. The camera has a3 : 4 image aspect ratio and a 5.5 mm diagonal CCD chip with768 × 494 6.5 µm pixels. The overall image resolution isbetter than 10 µm. A scintillation coated fibre optic is coupleddirectly to the CCD chip. A frame grabber was used to capturedigital images. The grabber could capture 30 frames everysecond at full speed and allow on-chip image processing suchas integrating, averaging or summing over a certain numberof frames. Digital frames were then dumped in the computerstorage.
The change from the digital camera to the real timecamera sacrificed the overall image resolution, but significantlyreduced the exposure time. With the installation of the realtime camera and the image grabber, integration over the first10 of the 30 frames of each second resulted in a much shorterexposure time of about 0.3 s, and the growing dendrite tipscould be resolved under the applied growth condition in thiswork.
Figure 3 shows digital images of growing dendrites inthe Sn–13 wt%Bi alloy captured by the real time camera. Theframes were organized in time sequence. The growth conditionwas the same as in figure 2. Compared with the growthpattern in figure 2, the dendritic structure in this scenariowas much different, in that the dendrites took a well-defined,normal dendritic morphology. Sharp dendrite tips can be easily
recognized. The primary arms were growing upwards, at anangle of about 45◦ with respect to the temperature gradient.Dendrite selection can be seen during solidification. Someprimary arms were stopped when they impinged upon thesecondary arms protruding in front (figure 3(c)). In the meantime, some tertiary arms were developing into primary armsand reduced the primary dendrite arm spacing (figure 3(b)).
Another important feature we can see from figure 3 isthat the interdendritic regions (mushy zone) look darker thanthe liquid zone above the growth front. As expected, theseregions were enriched with solute (Bi) and, consequently,more absorptive. Within a small layer in front of the growingdendrite tips, a solute boundary layer can be recognizedas a result of the solute being rejected into the liquid.Solute redistribution is well known, but it is very difficultto quantitatively measure the liquid concentration duringalloy solidification [22]. Real time microradiography ofdendritic solidification in real alloys provides the possibility ofmeasuring solute partitioning during solidification. Mathiesenand Arnberg [15] have tried to extract a liquid compositionprofile from digital images.
The band structure obtained in figure 2 results fromtransverse growth of dendrites in thin samples, while thedendritic structure shown in figure 3 results from normal,longitudinal growth of dendrites. Figure 4 shows an imageof dendrites taken by contact microradiography. A thin, solidsample taken from a directionally solidified ingot was imaged.
4453

B Li et al
Figure 4. Image of a dendrite structure of a solid Sn–13 wt%Bisample by contact microradiography. The image was taken on atransverse section of a directionally solidified ingot. The plane ofview is perpendicular to the temperature gradient. The triplets weresimilar to that of figure 2(a).
The plane of view is perpendicular to the temperature gradient.If we compare figure 4 with figure 2(a), we can easily see thesetwo structures are similar, in the sense that they both consistof separate dendrite triplets. Figure 4 confirms that the patternin figure 2(a) originated from transverse growth. This can befurther understood from figure 5, which shows schematicallythe 3D structure of a dendrite in Sn–Bi alloys [23]. In figure 5,if we look at the dendrites against the [110] direction, then atransverse pattern of triplets in figures 2(a) and 4 can be seen. Ifwe look at the dendrites from the direction perpendicular to thepaper plane, then a longitudinal pattern in figure 3 can be seen.The preferred growth direction is [110] in a regular pattern.When the [110] direction is roughly along the temperaturegradient, the longitudinal pattern in figure 3 will be obtained.In the case of thin samples, the preferred growth direction[110] might be diverted to the direction of sample thickness(orthogonal to the temperature gradient), which is along thex-ray beam, due to the thermal fluctuation in the transversedirection. Because the graphite crucible was sandwichedbetween two brass blocks, minor temperature difference in thetransverse direction could result in an appreciable temperaturegradient on the thin metallic sample. The mechanism ofdendrite growth selection between transverse and longitudinalis worth future investigation.
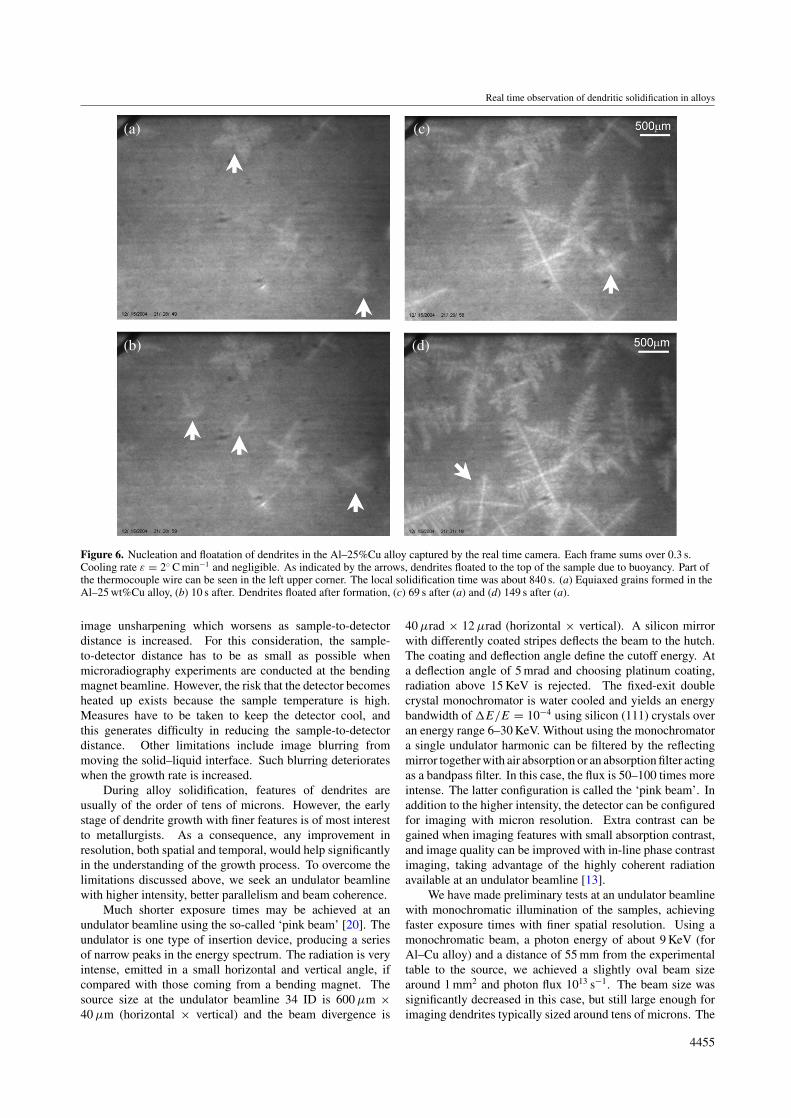
Figure 6 shows digital images of growing dendrites in theAl–25 wt%Cu alloy. The cooling rate ε was 2.0 ◦C min−1 witha negligible temperature gradient. Local solidification time inthis case was 840 s. We can see that equiaxed grains nucleatedin the melt. Interestingly, as soon as these grains were formed,they quickly floated to the top of the sample. This indicatesthat the solid is less dense than the liquid because the liquidwas enriched with Cu. This is consistent with the observationsfrom Mathiesen et al [13]
As we can see from the quality of the digital images,the application of the advanced microradiographic techniqueto observe dendritic solidification in real time in real alloysis encouraging and promising. However, under the givenexperimental conditions, the constraints of absorption contrastand available intensity and the consequential limitation on bothtemporal and spatial resolution have become obvious.
In principle, the x-ray imaging system can be configuredfor imaging with micrometre resolution, but in practice the
Figure 5. Schematic diagram showing the crystallographic structureof a dendrite in an Sn–Bi alloy (adapted from [23]). If we look at thedendrites against the [110] direction, then a transverse pattern oftriplets in figures 2(a) and 4 can be seen. If we look at the dendritesfrom the direction perpendicular to the paper plane, then alongitudinal pattern in figure 3 can be seen.
actual resolution achievable when imaging a mixture of solidand liquid in real samples is limited by several factors. Theefficiency of the CCD detector system decreases strongly withincreasing resolution, due to the fact that the high spatialresolution is achieved by a thinner and thus less efficient dopedlayer of the scintillation screen. In addition the number ofphotons per CCD-pixel decreases. As a result the exposuretimes increase and limit time resolved imaging.
The second difficulty comes from the weak absorptioncontrast of the features in the early stage of the growthof dendrites. When the growing dendrites reach a sizecomparable to the spatial resolution of the imaging systemwe would anticipate that they could be resolved. But this isnot the case due to the statistical nature of image quanta. If afeature with a given contrast C can be detected, it is given bythe rose signal-to-noise ratio �SNRRose = C
√A · qb, where
A is the area over which the number of photons is integratedand qb the average number of photons per area. The valueof the rose signal-to-noise ratio should be at least 5 so that afeature can be detected. For small (thin) objects and smallcontrast the number of photons has to be increased by thesquare to detect the structure. Consequently, it is not justthe spatial resolution that will determine if a feature can beresolved. If the magnitude of the contrast between regionsthat contain both solid and liquid and surrounding regions of100% liquid is not sufficiently large (typically a few per cent)for the detector, then the dendrites will not be resolved in theimaging system, even though their size already grows abovethe physical resolution of the optics. This resolvable contrastis related to the nominal composition of the alloy, the absolutedifference in the absorption coefficients of the alloy elementsand the equilibrium partition ratio.
Additional limitations on the image resolution come fromthe divergence of the x-ray beam, which produces geometrical
4454
Real time observation of dendritic solidification in alloys
(a) (c)
(b) (d)
Figure 6. Nucleation and floatation of dendrites in the Al–25%Cu alloy captured by the real time camera. Each frame sums over 0.3 s.Cooling rate ε = 2◦ C min−1 and negligible. As indicated by the arrows, dendrites floated to the top of the sample due to buoyancy. Part ofthe thermocouple wire can be seen in the left upper corner. The local solidification time was about 840 s. (a) Equiaxed grains formed in theAl–25 wt%Cu alloy, (b) 10 s after. Dendrites floated after formation, (c) 69 s after (a) and (d) 149 s after (a).
image unsharpening which worsens as sample-to-detectordistance is increased. For this consideration, the sample-to-detector distance has to be as small as possible whenmicroradiography experiments are conducted at the bendingmagnet beamline. However, the risk that the detector becomesheated up exists because the sample temperature is high.Measures have to be taken to keep the detector cool, andthis generates difficulty in reducing the sample-to-detectordistance. Other limitations include image blurring frommoving the solid–liquid interface. Such blurring deteriorateswhen the growth rate is increased.
During alloy solidification, features of dendrites areusually of the order of tens of microns. However, the earlystage of dendrite growth with finer features is of most interestto metallurgists. As a consequence, any improvement inresolution, both spatial and temporal, would help significantlyin the understanding of the growth process. To overcome thelimitations discussed above, we seek an undulator beamlinewith higher intensity, better parallelism and beam coherence.
Much shorter exposure times may be achieved at anundulator beamline using the so-called ‘pink beam’ [20]. Theundulator is one type of insertion device, producing a seriesof narrow peaks in the energy spectrum. The radiation is veryintense, emitted in a small horizontal and vertical angle, ifcompared with those coming from a bending magnet. Thesource size at the undulator beamline 34 ID is 600 µm ×40 µm (horizontal × vertical) and the beam divergence is
40 µrad × 12 µrad (horizontal × vertical). A silicon mirrorwith differently coated stripes deflects the beam to the hutch.The coating and deflection angle define the cutoff energy. Ata deflection angle of 5 mrad and choosing platinum coating,radiation above 15 KeV is rejected. The fixed-exit doublecrystal monochromator is water cooled and yields an energybandwidth of �E/E = 10−4 using silicon (111) crystals overan energy range 6–30 KeV. Without using the monochromatora single undulator harmonic can be filtered by the reflectingmirror together with air absorption or an absorption filter actingas a bandpass filter. In this case, the flux is 50–100 times moreintense. The latter configuration is called the ‘pink beam’. Inaddition to the higher intensity, the detector can be configuredfor imaging with micron resolution. Extra contrast can begained when imaging features with small absorption contrast,and image quality can be improved with in-line phase contrastimaging, taking advantage of the highly coherent radiationavailable at an undulator beamline [13].
We have made preliminary tests at an undulator beamlinewith monochromatic illumination of the samples, achievingfaster exposure times with finer spatial resolution. Using amonochromatic beam, a photon energy of about 9 KeV (forAl–Cu alloy) and a distance of 55 mm from the experimentaltable to the source, we achieved a slightly oval beam sizearound 1 mm2 and photon flux 1013 s−1. The beam size wassignificantly decreased in this case, but still large enough forimaging dendrites typically sized around tens of microns. The
4455

B Li et al
continuation of this study with increased resolution and shorterexposure would be of great interest. We will report the resultsafterwards.
4. Conclusions
We present qualitative observations of dendritic solidificationin real time in real alloys using an advanced microradiographictechnique, and the results are promising. The image qualityis satisfactory in terms of the image contrast and resolution.A transverse growth pattern was observed in the thin Sn–13 wt%Bi samples. Solute enrichment in the mushy zonecan be recognized. Floatation of solid in the liquid inthe Al–25 wt%Cu alloy was observed, indicating that thesolid is less dense than the liquid. This technique can beapplied to study a variety of phenomena in alloy solidificationsuch as solute redistribution within diffusion distance arounddendrite tips and structure formation and will help clarifymysteries in otherwise invisible processes of alloy casting andsolidification.
Acknowledgments
The UNICAT facility at the APS is supported by the US DOEunder Award No DEFG02-91ER45439, through the FrederickSeitz Materials Research Laboratory at the University ofIllinois at Urbana-Champaign, the Oak Ridge NationalLaboratory (US DOE contract DE-AC05-00OR22725 withUT-Battelle LLC), the National Institute of Standards andTechnology (US Department of Commerce) and UOP LLC.The APS is supported by the US DOE, Basic Energy Sciences,Office of Science, under contract No W-31-109-ENG-38.
References
[1] Kattamis T Z, Coughlin J C and Flemings M C 1967 Trans.AIME 239 1504
[2] Young K P and Kirkwood D H 1975 Metall. Trans. A 6 197[3] Kahlweit M 1968 Scr. Metall. 2 251[4] Marsh S P and Glicksman M E 1996 Metall. Trans. A 27 557[5] Glicksman M E and Schaefer R J 1966 Acta Metall.
14 1126[6] Jackson K A and Hunt J D 1965 Acta Metall. 13 1212[7] Tzavaras A A and Flemings M C 1965 AIME Trans. 233 355[8] McLean M 1973 Phil. Mag. 27 1253[9] Boettinger W J, Voorhees P W, Dobbyn R C and Burdette H E
1987 Metall. Trans. A 18 487[10] Miller E W J and Beech J 1972 In-situ radiographic
observations of alloy solidification Metallography 5 298[11] Curreri P A and Kaukler W F 1996 Metall. Trans. A 27 801[12] Sen S, Kaukler W F, Curreri P and Stefanescu D M 1997
Metall. Trans. A 28 2129[13] Mathiesen R H, Arnberg L, Ramsoskar K, Weitkamp T, Rau C
and Snigirev A 2002 Metall. Trans. B 33 613[14] Mathiesen R H, Arnberg L, Mo F, Weitkamp T and Snigirev A
1999 Phys. Rev. Lett. 83 5062[15] Mathiesen R H and Arnberg L 2005 Acta Mater. 53 947[16] Thi H N et al 2003 J. Phys. D: Appl. Phys 36 A83[17] Yasuda H et al 2004 J. Cryst. Growth. 262 645[18] Li B, Brody H D and Kazimirov A 2004 Phys. Rev. E
70 062602[19] Li B, Brody H D and Kazimirov A 2006 Metall. Trans. A 37
1039[20] Rau C, Weitkamp T, Snigirev A, Schroer C G, Benner B,
Kuhlmann M and Lengeler B 2002 Hard X-ray tomographywith high resolution Developments in X-ray Tomography IIIed U Bonse Proc. SPIE 4503 14–22
[21] Li B, Brody H D, Black D R, Burdette H E and Rau C 2006Meas. Sci. Technol. 17 1883
[22] Brody H D and Flemings M C 1966 Trans. AIME 263 615[23] Ahearn P J and Flemings M C 1967 Trans. AIME 239 1590
4456
Copyright © 2022 FDOKUMEN