Measurements and modeling of the microstructural morphology during equiaxed solidification of Al-Cu...
12
Measurements and Modeling of the Microstructural Morphology during Equiaxed Solidification of Al-Cu Alloys Ø. NIELSEN, B. APPOLAIRE, H. COMBEAU, and A. MO The morphology predicted by an equiaxed growth model recently presented elsewhere has been compared with quantitative experimental morphology measurements on a range of Al-Cu alloys. In the experiments, the samples have been solidified with a uniform temperature and quenched from the mushy state at the instant when the eutectic temperature was reached. The copper content and the amount of grain-refiner additions have been varied, resulting in both “clover-leaf” and dendritic equiaxed morphologies. Morphology characterization on both the intragranular and extragranular length scales has been performed on the quenched samples. Average heat-extraction rates, grain densities, and alloy compositions from the experiments have been used as input to the equiaxed grain- growth model, and the resulting morphology predictions have been compared with the morphology measurements. For the morphologies observed in the present study, the equiaxed growth model predicts higher values of the internal solid fraction than observed experimentally. This has been indicated to be due to the failure of commonly made modeling assumptions during the later stages of the solidification. I. INTRODUCTION Al alloys. This type of morphology has been suggested to result from some kind of cellular growth. [10] A comparison BECAUSE the quality of cast products is, to a great between the morphology predicted by the models in Refer- extent, controlled by the solidification conditions, the pro- ences 5 through 9 and experimental morphology character- duction of good castings requires a basic knowledge of the izations for this type of equiaxed microstructure has not mushy zone. This zone is characterized both by its micro- been reported. structural morphology and by properties observed on the A standard experimental technique for morphology inves- macroscopic scale, such as dendrite coherency and perme- tigations is to interrupt the solidification process by quench- ability to interdendritic melt flow. The parameters entering ing. This procedure relies on the assumption that the liquid on the micro and macro scales are, furthermore, interrelated. remaining at the instant of quenching will solidify with a An example is revealed in the mathematical modeling of morphology sufficiently different from the already-solidified macrosegregation formation. In this case, the momentum microstructure to be quantitatively distinguished by equation contains a solid/liquid interfacial drag term (i.e., metallography. In two recent works, [11,12] the development the permeability), which has been suggested to depend on of the solid fraction during the growth of primary aluminum the local morphology in terms of the volume fraction of was measured for different alloys using this quenching tech- solid, the specific surface of the solid, the volume fraction nique. Compared to the Scheil equation, the lever rule, and and specific surface of the grain envelopes, and the average differential thermal analysis measurements, the results sys- envelope shape factor. [1,2] The microstructural morphology tematically overestimated the calculated solid fraction, is, on the other hand, influenced by conditions given at the which indicates that the change in the heat-extraction rate macroscopic level, such as the alloying, inoculation, and at the quenching point did not produce an instantaneous cooling conditions. discernible change in the growth morphology. This tendency In micro-macro modeling of the equiaxed solidification is qualitatively confirmed by images of microstructures of of Al alloys (e.g., References 3 and 4), the development of industrial aluminum alloys quenched at dendrite coherency, the microstructural morphology is commonly estimated by as reported by Arnberg et al. [13] Consequently, conventional models that describe the solidification as a result of micro- quenching experiments cannot be considered to be reliable scale phenomena. [5–9] These models rely on simplifications for quantitative morphology characterization. of the real microstructure and on the separation of different The quenching method can, however, be considered to be length scales. Due to the lack of experimental investigation reliable at the instant when the remaining melt reaches the on equiaxed morphology development, these micromodels eutectic composition, as demonstrated in several works aim- have not yet been quantitatively validated for Al alloys. ing at correlating microstructural morphology with perme- Moreover, a dendritic morphology is assumed in the model- ability for Al-Cu alloys. [14–16,2] When an Al-Cu alloy is ing of the grain-envelope growth and of the solid-surface quenched at this instant, the remaining melt will solidify as development. A “clover-leaf” morphology is, however, a very fine Al-Al 2 Cu eutectic, which is easily discernible observed in the as-cast microstructures of well–grain refined from the primary Al phase. Thus, the distribution of eutectic inside the grain envelopes (intragranular) and between the grain envelopes (extragranular) can be measured and com- Ø. NIELSEN, Research Scientist, and A. MO, Professor, are with SIN- pared with modeling predictions. It should be noted that even TEF Materials Technology, N-0314 Oslo, Norway. B. APPOLAIRE, Asso- without quenching of the eutectic, an acceptable contrast ciate Professor, and H. COMBEAU, Professor, are with LSG2M, Ecole can be achieved, as utilized by Rappaz and The ´voz [5] for des Mines de Nancy, Parc de Saurupt, F-54042 Nancy Cedex, France. Manuscript submitted January 24, 2000. qualitative observations on Al-7 wt pct Si alloys. To the METALLURGICAL AND MATERIALS TRANSACTIONS A VOLUME 32A, AUGUST 2001—2049
Transcript of Measurements and modeling of the microstructural morphology during equiaxed solidification of Al-Cu...

Measurements and Modeling of the MicrostructuralMorphology during Equiaxed Solidification of Al-Cu Alloys
Ø. NIELSEN, B. APPOLAIRE, H. COMBEAU, and A. MO
The morphology predicted by an equiaxed growth model recently presented elsewhere has beencompared with quantitative experimental morphology measurements on a range of Al-Cu alloys. Inthe experiments, the samples have been solidified with a uniform temperature and quenched fromthe mushy state at the instant when the eutectic temperature was reached. The copper content andthe amount of grain-refiner additions have been varied, resulting in both “clover-leaf” and dendriticequiaxed morphologies. Morphology characterization on both the intragranular and extragranularlength scales has been performed on the quenched samples. Average heat-extraction rates, graindensities, and alloy compositions from the experiments have been used as input to the equiaxed grain-growth model, and the resulting morphology predictions have been compared with the morphologymeasurements. For the morphologies observed in the present study, the equiaxed growth model predictshigher values of the internal solid fraction than observed experimentally. This has been indicated to bedue to the failure of commonly made modeling assumptions during the later stages of the solidification.
I. INTRODUCTION Al alloys. This type of morphology has been suggested toresult from some kind of cellular growth.[10] A comparisonBECAUSE the quality of cast products is, to a great between the morphology predicted by the models in Refer-
extent, controlled by the solidification conditions, the pro- ences 5 through 9 and experimental morphology character-duction of good castings requires a basic knowledge of the izations for this type of equiaxed microstructure has notmushy zone. This zone is characterized both by its micro- been reported.structural morphology and by properties observed on the A standard experimental technique for morphology inves-macroscopic scale, such as dendrite coherency and perme- tigations is to interrupt the solidification process by quench-ability to interdendritic melt flow. The parameters entering ing. This procedure relies on the assumption that the liquidon the micro and macro scales are, furthermore, interrelated. remaining at the instant of quenching will solidify with aAn example is revealed in the mathematical modeling of morphology sufficiently different from the already-solidifiedmacrosegregation formation. In this case, the momentum microstructure to be quantitatively distinguished byequation contains a solid/liquid interfacial drag term (i.e., metallography. In two recent works,[11,12] the developmentthe permeability), which has been suggested to depend on of the solid fraction during the growth of primary aluminumthe local morphology in terms of the volume fraction of was measured for different alloys using this quenching tech-solid, the specific surface of the solid, the volume fraction
nique. Compared to the Scheil equation, the lever rule, andand specific surface of the grain envelopes, and the averagedifferential thermal analysis measurements, the results sys-envelope shape factor.[1,2] The microstructural morphologytematically overestimated the calculated solid fraction,is, on the other hand, influenced by conditions given at thewhich indicates that the change in the heat-extraction ratemacroscopic level, such as the alloying, inoculation, andat the quenching point did not produce an instantaneouscooling conditions.discernible change in the growth morphology. This tendencyIn micro-macro modeling of the equiaxed solidificationis qualitatively confirmed by images of microstructures ofof Al alloys (e.g., References 3 and 4), the development ofindustrial aluminum alloys quenched at dendrite coherency,the microstructural morphology is commonly estimated byas reported by Arnberg et al.[13] Consequently, conventionalmodels that describe the solidification as a result of micro-quenching experiments cannot be considered to be reliablescale phenomena.[5–9] These models rely on simplificationsfor quantitative morphology characterization.of the real microstructure and on the separation of different
The quenching method can, however, be considered to belength scales. Due to the lack of experimental investigationreliable at the instant when the remaining melt reaches theon equiaxed morphology development, these micromodelseutectic composition, as demonstrated in several works aim-have not yet been quantitatively validated for Al alloys.ing at correlating microstructural morphology with perme-Moreover, a dendritic morphology is assumed in the model-ability for Al-Cu alloys.[14–16,2] When an Al-Cu alloy ising of the grain-envelope growth and of the solid-surfacequenched at this instant, the remaining melt will solidify asdevelopment. A “clover-leaf” morphology is, however,a very fine Al-Al2Cu eutectic, which is easily discernibleobserved in the as-cast microstructures of well–grain refinedfrom the primary Al phase. Thus, the distribution of eutecticinside the grain envelopes (intragranular) and between thegrain envelopes (extragranular) can be measured and com-
Ø. NIELSEN, Research Scientist, and A. MO, Professor, are with SIN- pared with modeling predictions. It should be noted that evenTEF Materials Technology, N-0314 Oslo, Norway. B. APPOLAIRE, Asso- without quenching of the eutectic, an acceptable contrastciate Professor, and H. COMBEAU, Professor, are with LSG2M, Ecole
can be achieved, as utilized by Rappaz and Thevoz[5] fordes Mines de Nancy, Parc de Saurupt, F-54042 Nancy Cedex, France.Manuscript submitted January 24, 2000. qualitative observations on Al-7 wt pct Si alloys. To the
METALLURGICAL AND MATERIALS TRANSACTIONS A VOLUME 32A, AUGUST 2001—2049

Fig. 1—The experimental setup.
knowledge of the authors, quantitative morphology measure-ments have not been presented.
The purpose of this article is to present a comparisonbetween the morphology predicted by the equiaxed growth Fig. 2—Stages in the image analysis process.model recently presented in Reference 9 and quantitativeexperimental morphology investigations on Al-Cu alloyswith different morphologies. In the experiments, the Al-Cu
The thermocouple was calibrated by measuring the solidi-samples are solidified with a uniform temperature and arefication plateau of pure aluminum (.99.99 pct). The plateauquenched from the mushy state at the instant when the eutec-temperature was defined to be 660.3 8C, and the deviationtic temperature is reached. The copper content and theof the thermocouple from this absolute scale was assumedamount of grain-refiner addition are varied. The morphologyto be constant over the solidification interval of the sampleof the quenched samples is characterized on both the intra-alloys used (547 8C to 649 8C). The calibration routine wasgranular and extragranular length scales. Average heat-performed before and after each experiment, showing thatextraction rates, grain densities, and alloy compositions fromthe measured plateau temperature changed with less thanthe experiments are used as input to the model, and the0.1 8C. The same thermocouple was used in all the experi-resulting morphology predictions are compared with thements. The random error in the measuring system has beenexperimental results. Furthermore, the effect of the predictedestimated to be 60.5 8C.[17]morphology on the prediction of the mushy-zone permeabil-
ity is discussed.
B. Metallography and Image AnalysisII. EXPERIMENTAL
The quenched sample from each experiment was cut in aA. Procedure single section along the cylinder axis, mechanically ground,
polished down to 1 mm, and anodized. For each sample,The binary Al-Cu alloys were prepared in melt batchesbetween ten and 20 areas were randomly selected, and twoof 0.5 3 1023 m3 from pure aluminum (.99.99 pct) anddifferent gray-scale images were recorded from each area:copper. Each melt batch was heated to 720 8C and inoculated
with a certain amount of commercial Al-5 wt pct Ti-1 wt (1) a bright-field image, to distinguish the quenched Al-pct B rod master alloy. Prior to each experiment, the melt Al2Cu eutectic from the primary Al phase (Figurewas stirred with a graphite rod and a sample was taken for 2(a)); andspectroscopic chemical analysis. (2) a polarized-light image, to distinguish neighboring
A sketch of the experimental setup used for the solidifica- grains (Figure 2(b)).tion experiments is shown in Figure 1. Prior to each experi-
From the image recorded with polarized light, the meanment, a cylindrical graphite crucible with a 13 mm innerlinear intercept (l ) was measured for each sample usingradius and an 18 mm height was preheated by floating it onthe linear-intercept method. The average center-to-centertop of the molten alloy for 5 minutes. The crucible was thendistance between grains (d ) was calculated from the meanfilled with melt and allowed to cool in surroundings at roomlinear intercept by[18]
temperature, while the temperature in the solidifying samplewas recorded continuously using a 1 mm steel-mantled ther- d 5 Al [1]mocouple (type K) covered by boron nitride. The crucibleand sample were quenched at the eutectic temperature (547.7 where A is a constant with a value between 1.13 and 1.78,
depending on the grain shape.[18] Because the grain shape8C) by pouring cold water directly on the top surface of thesample. It was then possible to remove the thermocouple is not readily measured from two-dimensional images, the
value of A 5 1.5 was applied in the present study. Accordingfrom the quenched samples without remelting of the sampleand without destroying the thermocouple. to Fullman,[19] this value corresponds to a spherical grain
2050—VOLUME 32A, AUGUST 2001 METALLURGICAL AND MATERIALS TRANSACTIONS A

shape. Furthermore, the grain density (n) was estimated from 4 were each made in two variants, A and B, with differentamounts of grain refiner added. The B variants have morethe relationgrain refiner and, thus, a higher grain density than the Avariants. The average heat-extraction rates (Qexp), given inn 5
1
43
p 1d22
3 56
pd 3 [2]Table I, are determined from the relation
Qexp 5h(Teut) 2 h(Tliq)
texp5
cp(Teut 2 Tliq) 2 gEs L
texp[3]
which can be deduced by assuming that the average availablevolume for each grain is a sphere with a diameter of d.
where h is the specific enthalpy of the sample and texp isFrom the bright-field images (Figure 2(a)), a rough esti-the time required to cool the sample from the liquidus tem-mate of the average “cell,” or secondary dendrite arm spac-perature (Tliq) to the eutectic temperature (Teut), as determineding, in each sample was found by counting the number offrom the experimental temperature-time curves. The quanti-cells or secondary dendrite arms per unit length onties cp and L are the specific heat capacity and the specificselected grains.latent heat of the samples, respectively (Table III).In order to quantify the microstructural morphology at
Table II shows the results from the morphology measure-the instant when the eutectic temperature was reached, eachments along with calculated results for the comparison withbright-field image was transformed into a binary “solid-model predictions, to be discussed in Section V. It can be seenliquid” image (Figure 2(c)) using automatic image analysisthat an increase in the copper content generally decreases the(AIA). From these binary images, the volume fraction ofvalue of the internal solid fraction (gE
i ) in the quenchedsolid (gEs ) and the amount of solid surface per unit volume
samples, while an increase in the grain density increases(solid/liquid interfacial area concentration, SEs ) were mea-
gEi . For the surfaces, SE
s increases with increasing coppersured using AIA. The superscript E is used to representcontent and decreasing grain density, while SE
e increases withvalues at the eutectic temperature.increasing grain density. The solid fraction decreases withIn order to separate the intragranular and extragranularincreasing copper content, as expected, and is independentliquid phases, the grain envelopes were drawn manually inof grain density.each binary solid-liquid image. The identification of grains
Figure 3 shows representative examples of the morpholog-from the individual grain fragments in a two-dimensionalies in the quenched samples. Sample 1 (Figure 3(a)) has aimage was accomplished by consulting the polarized-lightnearly globular morphology (gE
i 5 0.951), where individualimage (Figure 2(b)). However, it is known that neighboringcells of some kind can be seen but cannot be quantitativelygrains can have different orientations even if they appear indistinguished. Samples 2 and 3B (Figures 3(b) and (d)) arethe same color in a polarized-light image. For grains wherealso quite globular, but, in these cases, individual cells canthis appeared to be the case, the shape and connectivity ofeasily be distinguished, indicating a separate length scalethe grain fragments were considered. For example, the largein the growth mode within the grain envelopes. However,white region in Figure 2(b) was assumed to consist of twopreferred growth directions and differences between primaryindividual grains. The error induced by this somewhat sub-and secondary arms typical for dendritic growth are notjective procedure is small, because the cases of doubt arediscernible from these images. Although rarely mentionedrare. From the resulting binary “envelope–extragranular liq-in the literature, this type of equiaxed morphology (clover-uid” image (Figure 2(d)), the volume fraction of the grainleaf) is very often observed in the as-cast microstructure ofenvelopes, gE
e , and the envelope/liquid interfacial areawell–grain refined Al alloys. Samples 3A and 4B (Figuresconcentration, SE
e , were measured using AIA.3(c) and (f)) are less globular, and sets of arms or cellsThe stereological assumptions and relations needed toaligned parallel to each other can be observed in additioncalculate the morphological quantities from the quantitiesto the clover-leaf equiaxed patterns. In fact, at least in theseprovided by the AIA are described in Reference 2. The finallimiting cases, the growth mode cannot be determined fromresults are reported as the mean value of the measurementstwo-dimensional images alone. Sample 4A is the only sam-on 10 to 20 images with the corresponding standard errorple which has a clear dendritic growth pattern, in whichin the mean. The volume fraction of solid within the grainprimary and secondary dendrite arms can easily be distin-envelope, gE
i 5 gEs /gE
e , hereafter called the internal solidguished from each other in a two-dimensional image.fraction, is also reported for each sample.
It should be emphasized that the image-analysis procedurerelies on the use of anodizing and polarized light to distin- IV. THE MODELguish between neighboring grains. However, because the
The model is described in detail elsewhere,[9] but is brieflyanodizing amplifies topography effects, obtaining the neces-summarized here along with some additional simplificationssary high-contrast bright-field images from the samplesand assumptions made in the present study. It is assumed that:requires a very careful polishing, short anodizing times, and
high magnifications. (1) there is no convection in the liquid phase and no crys-tal motion;
(2) the mass densities of the liquid and solid phases areIII. EXPERIMENTAL RESULTS equal;(3) the specific heat capacities of the liquid and solid phasesThe chemical compositions of the samples are given in
Table I, along with the measured grain densities, estimated are equal;(4) the material properties are constant (the thermophysicalcell or secondary dendrite arm spacings, and average heat-
extraction rates. The titanium content reflects the amount of data used in the calculations are given in Table III);(5) the nucleation occurs at the single instant when thegrain refiner added to each alloy. The alloys denoted 3 and
METALLURGICAL AND MATERIALS TRANSACTIONS A VOLUME 32A, AUGUST 2001—2051

Table I. The Samples Characterized by the Nominal Copper Content, w0, the Titanium and Impurity Content, the MeasuredGrain Density, nE, a Rough Estimate of the Cell or Secondary Dendrite Arm Spacing, lE
2, and the Average HeatExtraction Rate, Qexp
Sample w0 (Wt Pct Cu) Wt Pct Ti Wt Pct Others nE (1011m23) lE2 (mm) Qexp (103 J/(kg s))
1 4.70 0.017 ,0.02 1.08 6 0.08 — 5.62 10.0 0.009 ,0.03 1.5 6 0.1 42 5.53A 14.9 0.004 ,0.02 0.59 6 0.08 32 5.23B 15.6 0.025 ,0.03 2.3 6 0.1 39 5.04A 20.1 0.003 ,0.03 0.18 6 0.09 26 5.04B 19.7 0.009 ,0.03 1.18 6 0.08 36 4.7
*The titanium content reflects the amount of grain refiner added to each alloy. The error in the grain density is the standard error inthe mean. It does not account for systematic errors that can arise from the assumption of grain shape and from the measurement procedure.
Table II. The Experimental Results from the Morphology Measurements (Exp) along with Calculations Using SphericalGrain Envelopes, the Hemispherical Tip Model, and FDM Diffusion (Mod)
Sample Source gEs SE
s (104m21) gEe SE
e (104m21) gEi
1 exp 0.906 6 0.003 4.5 6 0.1 0.953 6 0.003 2.1 6 0.1 0.951 6 0.0044.70 wt pct Cu mod 0.89 2.1 0.89 2.1 1.0
2 exp 0.791 6 0.006 5.82 6 0.05 0.871 6 0.006 3.11 6 0.06 0.908 6 0.00910.0 wt pct Cu mod 0.75 2.1 0.75 2.1 1.0
3A exp 0.644 6 0.005 6.94 6 0.07 0.819 6 0.007 2.8 6 0.2 0.786 6 0.00914.9 wt pct Cu mod 0.61 2.1 0.63 1.4 0.96
3B exp 0.647 6 0.005 6.14 6 0.03 0.788 6 0.005 3.19 6 0.07 0.821 6 0.00715.6 wt pct Cu mod 0.59 2.1 0.59 2.1 1.0
4A exp 0.499 6 0.004 7.26 6 0.09 0.81 6 0.01 2.0 6 0.2 0.61 6 0.0120.1 wt pct Cu mod 0.44 3.9 0.69 1.0 0.64
4B exp 0.49 6 0.01 6.4 6 0.1 0.706 6 0.009 2.93 6 0.04 0.69 6 0.0119.7 wt pct Cu mod 0.46 4.4 0.52 1.5 0.89
*The symbols are defined in the text and in the Nomenclature. The error values are the standard error in the mean values. They do notaccount for systematic errors that can arise from the image analysis procedure.
Table III. Input Parameters Used in the Equiaxed diameter, which can be related to the local grain densityGrowth Model (Eq. [2]).
(2) A virtual envelope is defined, which connects the outer-Quantity Symbol Value Unit Referencemost points of the crystal in such a way that the envelope
Gibbs–Thompson constant G 2.4 3 1027 mK 20 surface is minimized. The volume fraction of solidDiffusivity of the liquid Dl 3 3 1029 m2/s 20 within the envelope (gi) provides information about theDiffusivity of the solid Ds 3 3 10213 m2/s 20 global morphology: when gi , 1, the crystal is porousSpecific latent heat L 3.97 3 105 J/kg 20
(dendritic or clover-leaf); when gi 5 1, the crystal isSpecific heat capacity cp 1 3 103 J/(kg K) —compact (globular). Thus, the change in morphologycan be assessed without tracking the real complex solid/liquid interface.
(3) In the model, the crystal evolution is controlled by thetemperature reaches the liquidus temperature of thekinetics of the envelope and by solidification of thealloy; andintragranular liquid phase (i.e., the liquid inside the enve-(6) the solidification of the primary Al phase ends at thelope). These two driving phenomena are assumed to beinstant when the eutectic temperature is reached.independent of each other. Hence, during growth, the
The model is based on the models presented by Rappaz morphology is a result of the competition between theand Thevoz[5,6] and Wang and Beckermann[21] and relies growth of the envelope and the solidification insideupon the following three main ideas (Figure 4). the envelope.(1) It is assumed that the crystals contained in a volume
where variations in the temperature are negligible canbe represented by a single unit sphere. The unit sphere A. Mathematical Formulationcontains one representative crystal having an averagebehavior. The volume fractions of the different phases The solidifying sample was assumed to have a uniform
temperature. This is reasonable, because the Biot numberare defined relative to the total volume of this unitsphere. Furthermore, if the grains are assumed not to of the sample is on the order of 1022 ¿ 1. This has two
consequences: (1) a single unit sphere can be assumed tomove relative to the solidifying sample, the diameter ofthe unit sphere can be set equal to the local final grain represent the whole sample; and (2) the temperature (T ) can
2052—VOLUME 32A, AUGUST 2001 METALLURGICAL AND MATERIALS TRANSACTIONS A

Fig. 5—The Al-Cu binary phase diagram.[22]
Due to the low titanium and impurity contents (TableI), the samples were treated as binary Al-Cu alloys in thecalculations. We have assumed local thermodynamical equi-librium and negligible curvature effects at the solid/liquidinterface. Hence, the solute concentration at the interfaceboth in the solid (w*s ) and in the liquid (w*l ) was related tothe temperature through the Al-Cu phase diagram, asexplained in Appendix A. The phase diagram was obtained
Fig. 3—Representative examples of the microstructures of the samples from the ThermoCalc database[22] and is given in Figure 5.quenched from the mushy state. The light primary Al phase corresponds The grain envelope was assumed to be either a sphere orto the solid phase at the time of quenching.
an octahedron. Furthermore, the envelope shape wasassumed to be preserved during the grain growth. For den-dritic growth, this relates the velocities of the secondarydendritical instabilities to those of the primary dendrite tipsin a simple manner. The envelope/liquid interfacial areaconcentration is given directly in terms of the grain densityand the grain fraction:[8]
Se 51fe
(36pn)1/3 g2/3e [5]
where fe is the average shape factor or sphericity of thegrain envelope, defined as the surface area of a sphere withthe same volume as the envelope divided by the actualsurface area of the envelope.[1] For a spherical envelope,fe 5 1, and for an octahedral one, fe 5 0.85.[9]
The envelope growth rate was assessed in two differentways, depending on the value of the internal solid fraction:
Fig. 4—In the equiaxed growth model, the growth of a crystal in a unit (1) for gi , 1,sphere with a diameter equal to the local final grain diameter is described.A virtual envelope, which connects the outermost points of the crystal, is dge
dt5 SeVm [6]defined. The volume fraction of solid within the envelope, gi , provides
information about the global morphology: when gi , 1, the crystal is porous(dendritic or clover-leaf); when gi 5 1, the crystal is compact (globular). where Vm is the average normal velocity of the envelope; and
(2) for gi 5 1,
dge
dt5 max 1SeVm,
dgs
dt 2 [7]be related to the fraction of solid through the energy balanceof the unit sphere, i.e.,
In the case of a spherical envelope, Vm equals the velocityQ 5 cp
dTdt
2 Ldgs
dt[4] of the primary dendrite tips (Vt). In the case of an octahedral
envelope, Vm 5 Vt /!3.[9] The velocity of the primary den-drite tips was assessed from dendrite-tip growth models,where Q is the heat-extraction rate and t is the time.
METALLURGICAL AND MATERIALS TRANSACTIONS A VOLUME 32A, AUGUST 2001—2053
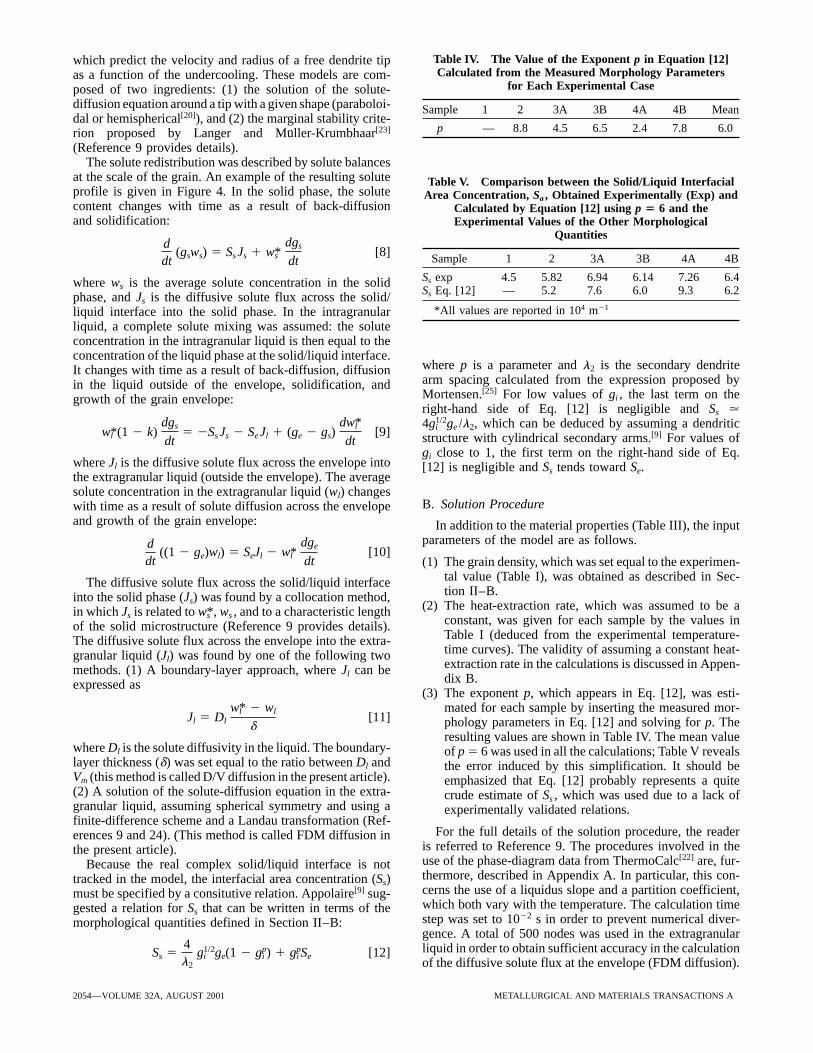
Table IV. The Value of the Exponent p in Equation [12]which predict the velocity and radius of a free dendrite tipCalculated from the Measured Morphology Parametersas a function of the undercooling. These models are com-
for Each Experimental Caseposed of two ingredients: (1) the solution of the solute-diffusion equation around a tip with a given shape (paraboloi- Sample 1 2 3A 3B 4A 4B Meandal or hemispherical[20]), and (2) the marginal stability crite-
p — 8.8 4.5 6.5 2.4 7.8 6.0rion proposed by Langer and Muller-Krumbhaar[23]
(Reference 9 provides details).The solute redistribution was described by solute balances
at the scale of the grain. An example of the resulting solute Table V. Comparison between the Solid/Liquid Interfacialprofile is given in Figure 4. In the solid phase, the solute Area Concentration, Sa , Obtained Experimentally (Exp) andcontent changes with time as a result of back-diffusion Calculated by Equation [12] using p 5 6 and theand solidification: Experimental Values of the Other Morphological
Quantitiesddt
(gsws) 5 Ss Js 1 w*sdgs
dt[8] Sample 1 2 3A 3B 4A 4B
Ss exp 4.5 5.82 6.94 6.14 7.26 6.4where ws is the average solute concentration in the solidSs Eq. [12] — 5.2 7.6 6.0 9.3 6.2phase, and Js is the diffusive solute flux across the solid/
*All values are reported in 104 m21liquid interface into the solid phase. In the intragranularliquid, a complete solute mixing was assumed: the soluteconcentration in the intragranular liquid is then equal to theconcentration of the liquid phase at the solid/liquid interface.
where p is a parameter and l2 is the secondary dendriteIt changes with time as a result of back-diffusion, diffusionarm spacing calculated from the expression proposed byin the liquid outside of the envelope, solidification, andMortensen.[25] For low values of gi , the last term on thegrowth of the grain envelope:right-hand side of Eq. [12] is negligible and Ss .4g1/2
i ge /l2, which can be deduced by assuming a dendriticw*l (1 2 k)
dgs
dt5 2Ss Js 2 Se Jl 1 (ge 2 gs)
dw*ldt
[9] structure with cylindrical secondary arms.[9] For values ofgi close to 1, the first term on the right-hand side of Eq.
where Jl is the diffusive solute flux across the envelope into [12] is negligible and Ss tends toward Se.the extragranular liquid (outside the envelope). The averagesolute concentration in the extragranular liquid (wl) changes
B. Solution Procedurewith time as a result of solute diffusion across the envelopeand growth of the grain envelope: In addition to the material properties (Table III), the input
parameters of the model are as follows.ddt
((1 2 ge)wl) 5 SeJl 2 w*ldge
dt[10]
(1) The grain density, which was set equal to the experimen-tal value (Table I), was obtained as described in Sec-The diffusive solute flux across the solid/liquid interfacetion II–B.into the solid phase (Js) was found by a collocation method,
(2) The heat-extraction rate, which was assumed to be ain which Js is related to w*s , ws , and to a characteristic lengthconstant, was given for each sample by the values inof the solid microstructure (Reference 9 provides details).Table I (deduced from the experimental temperature-The diffusive solute flux across the envelope into the extra-time curves). The validity of assuming a constant heat-granular liquid (Jl) was found by one of the following twoextraction rate in the calculations is discussed in Appen-methods. (1) A boundary-layer approach, where Jl can bedix B.expressed as
(3) The exponent p, which appears in Eq. [12], was esti-mated for each sample by inserting the measured mor-
Jl 5 Dl
w*l 2 wl
d[11] phology parameters in Eq. [12] and solving for p. The
resulting values are shown in Table IV. The mean valuewhere Dl is the solute diffusivity in the liquid. The boundary- of p 5 6 was used in all the calculations; Table V revealslayer thickness (d) was set equal to the ratio between Dl and the error induced by this simplification. It should beVm (this method is called D/V diffusion in the present article). emphasized that Eq. [12] probably represents a quite(2) A solution of the solute-diffusion equation in the extra- crude estimate of Ss , which was used due to a lack ofgranular liquid, assuming spherical symmetry and using a experimentally validated relations.finite-difference scheme and a Landau transformation (Ref-
For the full details of the solution procedure, the readererences 9 and 24). (This method is called FDM diffusion inis referred to Reference 9. The procedures involved in thethe present article).use of the phase-diagram data from ThermoCalc[22] are, fur-Because the real complex solid/liquid interface is notthermore, described in Appendix A. In particular, this con-tracked in the model, the interfacial area concentration (Ss)cerns the use of a liquidus slope and a partition coefficient,must be specified by a consitutive relation. Appolaire[9] sug-which both vary with the temperature. The calculation timegested a relation for Ss that can be written in terms of thestep was set to 1022 s in order to prevent numerical diver-morphological quantities defined in Section II–B:gence. A total of 500 nodes was used in the extragranularliquid in order to obtain sufficient accuracy in the calculationSs 5
4l2
g1/2i ge(1 2 gp
i ) 1 gpi Se [12]
of the diffusive solute flux at the envelope (FDM diffusion).
2054—VOLUME 32A, AUGUST 2001 METALLURGICAL AND MATERIALS TRANSACTIONS A

Fig. 6—The effect of the envelope shape on the development of the internal Fig. 7—The effect of the tip model on the development of the internalsolid fraction, gi (sample 3A, hemispherical tip model, and FDM diffusion). solid fraction, gi (sample 3A, spherical envelopes, and FDM diffusion).The open square represents the experimental value, and the closed squares The open square represents the experimental value, and the closed squaresrepresent the end points of the calculated curves. represent the end points of the calculated curves. With a paraboloidal shape,
the modeled morphology becomes globular already at a solid fractiongs . 0.1 for sample 3A, which does not comply with the experimentallyobserved morphology (Fig. 3(c)).
V. COMPARISON BETWEEN MODELINGPREDICTIONS AND THE MEASURED
MORPHOLOGY measurements, as well as in the solution of the diffusionequation in the extragranular liquid.With the growth model described in Section IV, different
results are obtained, depending on the choice of the mainmodel assumptions: the grain-envelope shape, the model for
B. The Effect of the Tip Modelthe solute diffusion in the extragranular liquid, and the modelfor the dendrite-tip growth. In this section, the effect of It is generally accepted that the shape of a freely growingchanging these model assumptions in a typical case (sample primary dendrite tip is well approximated by a paraboloid3A) is discussed. Furthermore, modeling predictions for the of revolution. For the high-grain-density samples used indifferent experimental conditions discussed previously are the present study, however, the instabilities grow freely onlypresented along with possible explanations for discrepancies during the first stages of solidification. At the instant whenbetween the predictions and the measurements. the eutectic temperature is reached, allowing us to view the
morphology, the grains have already impinged on each otherand the paraboloidal-tip model is probably not validA. The Effect of the Envelope Shapeanymore.
It turns out that choosing a hemispherical shape in theIn order to estimate the grain density from the linear-intercept measurements, as shown in Section II–B, it is model gives a better agreement between the modeled and
the experimental results. Figure 7 reveals the differencesnecessary to assume an envelope shape. Therefore, a calcula-tion of the envelope shape factor (fE
e ) using Eq. [5], based in the development of the internal solid fraction using thehemispherical- and paraboloidal-tip models. The higher tipon the measured values of SE
e , nE, and gEe , would be spurious.
A rough estimate of fEe can, however, be obtained from the velocity associated with a hemispherical tip increases the
envelope growth rate during recalescence. Thus, the mini-two-dimensional images using the procedure suggested inReference 2. With this procedure, the value of fE
e was esti- mum in the gi (t) curve occurs at a lower value of gi usingthe hemispherical-tip model than using the paraboloidal-tipmated to be between 0.78 and 0.82 for the samples in this
study. model. Using the hemispherical-tip model, the solidificationin the intragranular region is not completed (gE
i , 1) beforeA spherical envelope shape minimizes the surface-to-vol-ume ratio of the grains. Because the true value of fe is less the eutectic temperature is reached. However, the modeling
prediction of gEi 5 0.96 corresponds to a more globularthan 1, the assumption of spherical envelopes will underesti-
mate the measured values of SEe . An envelope shape with a morphology than the measured one (gE
i 5 0.786, Figure3(c)). With a paraboloidal-tip model, the modeled morphol-lower shape factor (e.g., the octahedral shape) would
decrease this discrepancy. However, such a choice would ogy has already become globular at gs . 0.1 for the casein Figure 7.increase the value of Se throughout the calculation and,
thereby, increase the solute flux at the envelope. In turn, Physically, it is not clear why the best agreement isachieved using the hemispherical-tip model. However,this would result in lower undercoolings and more globular
morphologies than observed experimentally. This effect is a visual inspection of the images in Figure 3 indicatesthat many of the tips appear more like hemisphericalrevealed in Figure 6, where it is shown that a spherical
envelope shape gives the best prediction of the internal solid needles than like paraboloids. For the dendritic sample 4A(Figure 3(e)), this tendency is less clear. As opposed to thefraction. It should be noted that a spherical envelope shape
is consistent with the assumption of spherical symmetry in other samples, choosing the paraboloidal-tip model for sam-ple 4A does not result in a completely globular modeledthe estimation of the grain densities from the linear-intercept
METALLURGICAL AND MATERIALS TRANSACTIONS A VOLUME 32A, AUGUST 2001—2055
morphology. However, even for this dendritic sample, usingthe hemispherical-tip model gives predictions that are closerto the experimental results than predictions obtained by usingthe paraboloidal-tip model. Anyway, the choice of the tipmodel is revealed to have a great effect on the modeledmorphology development.
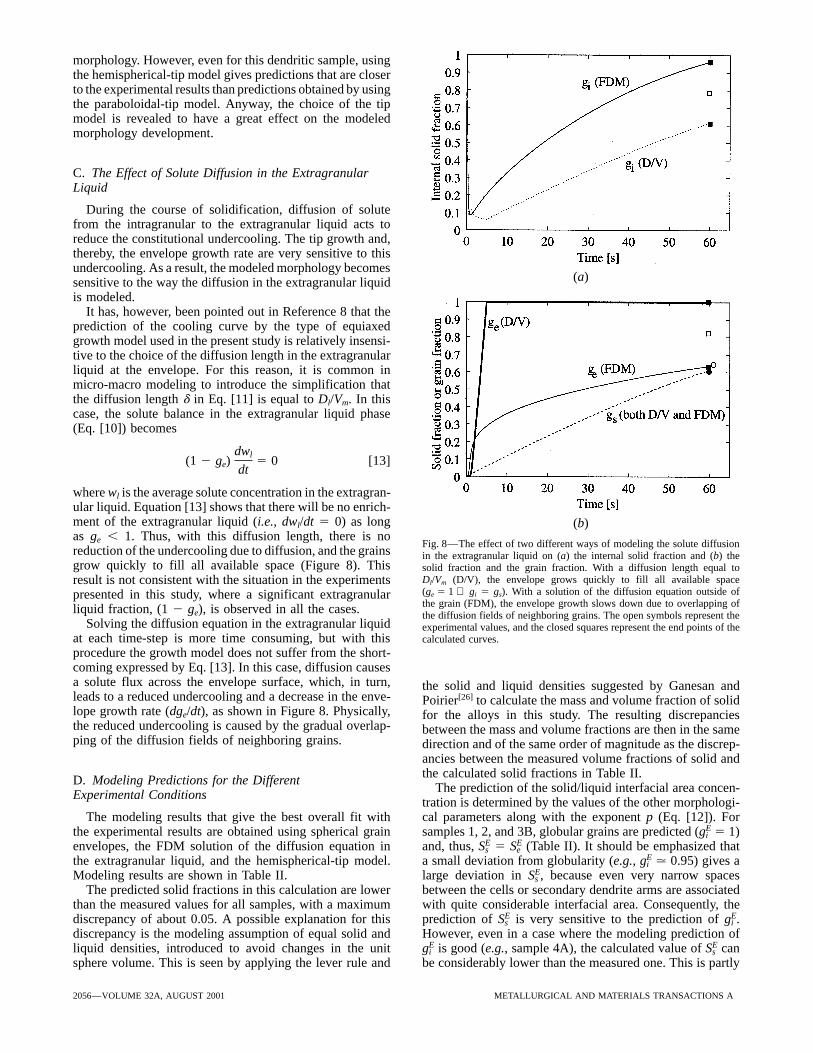
C. The Effect of Solute Diffusion in the ExtragranularLiquid
During the course of solidification, diffusion of solutefrom the intragranular to the extragranular liquid acts toreduce the constitutional undercooling. The tip growth and,thereby, the envelope growth rate are very sensitive to thisundercooling. As a result, the modeled morphology becomes
(a)sensitive to the way the diffusion in the extragranular liquidis modeled.
It has, however, been pointed out in Reference 8 that theprediction of the cooling curve by the type of equiaxedgrowth model used in the present study is relatively insensi-tive to the choice of the diffusion length in the extragranularliquid at the envelope. For this reason, it is common inmicro-macro modeling to introduce the simplification thatthe diffusion length d in Eq. [11] is equal to Dl/Vm. In thiscase, the solute balance in the extragranular liquid phase(Eq. [10]) becomes
(1 2 ge)dwl
dt5 0 [13]
where wl is the average solute concentration in the extragran-ular liquid. Equation [13] shows that there will be no enrich-ment of the extragranular liquid (i.e., dwl/dt 5 0) as long (b)as ge , 1. Thus, with this diffusion length, there is no
Fig. 8—The effect of two different ways of modeling the solute diffusionreduction of the undercooling due to diffusion, and the grains in the extragranular liquid on (a) the internal solid fraction and (b) thegrow quickly to fill all available space (Figure 8). This solid fraction and the grain fraction. With a diffusion length equal to
Dl/Vm (D/V), the envelope grows quickly to fill all available spaceresult is not consistent with the situation in the experiments(ge 5 1 ⇒ gi 5 gs). With a solution of the diffusion equation outside ofpresented in this study, where a significant extragranularthe grain (FDM), the envelope growth slows down due to overlapping ofliquid fraction, (1 2 ge), is observed in all the cases. the diffusion fields of neighboring grains. The open symbols represent the
Solving the diffusion equation in the extragranular liquid experimental values, and the closed squares represent the end points of theat each time-step is more time consuming, but with this calculated curves.procedure the growth model does not suffer from the short-coming expressed by Eq. [13]. In this case, diffusion causesa solute flux across the envelope surface, which, in turn, the solid and liquid densities suggested by Ganesan andleads to a reduced undercooling and a decrease in the enve- Poirier[26] to calculate the mass and volume fraction of solidlope growth rate (dge/dt), as shown in Figure 8. Physically, for the alloys in this study. The resulting discrepanciesthe reduced undercooling is caused by the gradual overlap- between the mass and volume fractions are then in the sameping of the diffusion fields of neighboring grains. direction and of the same order of magnitude as the discrep-
ancies between the measured volume fractions of solid andthe calculated solid fractions in Table II.D. Modeling Predictions for the Different
The prediction of the solid/liquid interfacial area concen-Experimental Conditionstration is determined by the values of the other morphologi-cal parameters along with the exponent p (Eq. [12]). ForThe modeling results that give the best overall fit with
the experimental results are obtained using spherical grain samples 1, 2, and 3B, globular grains are predicted (gEi 5 1)
and, thus, SEs 5 SE
e (Table II). It should be emphasized thatenvelopes, the FDM solution of the diffusion equation inthe extragranular liquid, and the hemispherical-tip model. a small deviation from globularity (e.g., gE
i . 0.95) gives alarge deviation in SE
s , because even very narrow spacesModeling results are shown in Table II.The predicted solid fractions in this calculation are lower between the cells or secondary dendrite arms are associated
with quite considerable interfacial area. Consequently, thethan the measured values for all samples, with a maximumdiscrepancy of about 0.05. A possible explanation for this prediction of SE
s is very sensitive to the prediction of gEi .
However, even in a case where the modeling prediction ofdiscrepancy is the modeling assumption of equal solid andliquid densities, introduced to avoid changes in the unit gE
i is good (e.g., sample 4A), the calculated value of SEs can
be considerably lower than the measured one. This is partlysphere volume. This is seen by applying the lever rule and
2056—VOLUME 32A, AUGUST 2001 METALLURGICAL AND MATERIALS TRANSACTIONS A

Table VI. Mushy-Zone Permeability Values for the Measured (Exp) and for the Predicted (Mod) Morphology Parametersin Table II Calculated by the Relation Suggested by Wang and Beckermann[1]
Sample 1 2 3A 3B 4A 4B
Exp 7 3 10214 6 3 10213 2 3 10212 3 3 10212 7 3 10212 9 3 10212
Mod 7 3 10213 8 3 10212 6 3 10211 3 3 10211 8 3 10211 1 3 10210
*All the values are reported in square meters.
due to the fact that the value of SEe is underestimated. In Even if these relations provide a good description of the
permeability as a function of a set of morphology parameters,addition, the use of an average value of the exponent p inEq. [12] can increase the discrepancy, because the value of an error in the predicted morphology can induce a large
uncertainty in the predicted permeability.the exponent varies from p 5 2.4 for sample 4A to p 5 8.8for sample 2 (Table IV). In a typical modeling case, the The accuracy of the mushy-zone permeability predictions
can be estimated from the magnitude of the discrepancyvalue of SEs changes by a factor of 2 when the value of p is
changed from 2.4 to 8.8. It should be noted that changing between the morphology measurements and the modelingpredictions observed in the present study. The permeabilitythe value of p in the model does not affect the other morphol-
ogy parameters. for the measured and for the predicted morphology parame-ters in Table II was calculated by the relation suggested byAs shown in Table II, the modeling predictions of the
internal solid fraction overestimate the measured values for Wang et al.[1] (listed in Appendix C). The results are pre-sented in Table VI, where we can see that the predictedall the experimental cases. For sample 4A, which has a
dendritic morphology, the discrepancy is small, but for all morphology parameters overestimate the permeability by afactor of 10 to 30 for the different samples. Consequently,the other samples, the error is considerable. The too-rapid
globularization (dgi/dt . 0) is a result of the reduced enve- in micro-macro modeling of casting processes involving thetype of grain morphology observed in the present study, thelope velocity as well as the continuing removal of solute by
diffusion across the envelope into the extragranular liquid. relative error in the calculated permeability could be aroundone order of magnitude.The relation between the velocity of the envelope and the
undercooling is based on the assumption that the tips growindependently of each other, in the sense that the diffusion
VII. CONCLUSIONSfields ahead of each tip are not influenced by the diffusionfields ahead of the neighboring tips. This assumption is For the purpose of testing the predictions of an equiaxedhardly fulfilled after the start of the overlapping of the diffu- growth model recently presented elsewhere,[9] the micro-sion fields of neighboring grains: at this stage, the tips grow structural morphology of equiaxed Al-Cu alloys has beento fill the extragranular spaces between the grains and the assessed at a single point during solidification by quenchingprobability of interacting with neighboring tips is high. solidifying samples at the instant when the eutectic tempera-Moreover, the morphologies in Figure 3 (e.g., samples 2 ture is reached. A recently developed metallographicaland 3B) indicate that enriched liquid can be trapped inside method has been used to distinguish between the intragranu-the grain envelopes (i.e., the intragranular liquid is no longer lar and extragranular length scales in the microstructure. Forwell mixed). If this entrapment reduces the diffusion of the equiaxed morphologies observed in the present study,solute across the envelope, the undercooling and, thus, the the growth model[9] predicts higher values of the internalenvelope growth rate would decrease more slowly, which solid fraction than observed experimentally. This has beenwould prevent globularization. More experimental results, indicated to be due to the failure of commonly made model-as well as modeling efforts, are needed in order to improve ing assumptions during the later stages of the solidification.the understanding of how the internal solid fraction develops The discrepancies have been shown to have a large effectduring solidification of Al alloys. on the calculation of the mushy-zone permeability, which,
The prediction of the envelope/liquid interfacial area con- in turn, can induce errors in micro-macro modeling. Morecentration relies on the prediction of ge , the measured value experimental results as well as modeling efforts are neededof the grain density, and the choice of the envelope shape in order to improve the understanding of how the internal(Eq. [5]). Table II shows that the predicted values of SE
e are solid fraction and the interfacial area concentrations developlow compared with the measured values. This is due to the during equiaxed solidification of Al alloys.choice of a spherical envelope along with the underestima-tion of gE
e , as discussed previously.
ACKNOWLEDGMENTSVI. PREDICTION OF THE MUSHY-ZONE The authors thank Mrs. G. Berg, SINTEF, for performing
PERMEABILITY the delicate sample preparation required for the morphologycharacterization. Thanks are also due to Ms. I. Furulund,In mathematical modeling of casting processes, the mor-
phology-dependent macroscopic mushy-zone properties are SINTEF, for help with the optical microscopy, and toMr. I. Farup, for assistance with the heat transfer modelingcalculated through constitutive relations. For example, in
macroscopic fluid-flow calculations, the mushy-zone perme- in Appendix B. We are also grateful to Professors G. Lesoultand L. Arnberg for their valuable discussion and suggestions.ability can be calculated by the Kozeny–Carman relation or
by the more elaborate model suggested by Wang et al.[1] The present work was funded by the Brite-EuRam project
METALLURGICAL AND MATERIALS TRANSACTIONS A VOLUME 32A, AUGUST 2001—2057

EMPACT, Project No. BE-1112 and Contract No. BRPR- Vm average normal velocity of the envelope, m/sVt velocity of a free dendrite tip, m/sCT95-0112, and with the following partners: Hoogovens
Corporate Services BV (The Netherlands), Hydro Alumin- w0 nominal solute concentration in a sample, wt pctwl average solute concentration in the extragranularium AS (Norway), Elkem Aluminium ANS (Norway), Pech-
iney Recherche (France), Vereinigte Aluminiumwerke AG liquid phase, wt pctw*
l solute concentration in the liquid at the solid/(Germany), Alusuisse-Lonza Services AG (Switzerland),Calcom SA (Switzerland), Technische Universiteit Delft liquid interface, wt pct
ws average solute concentration in the solid phase,(The Netherlands), Institut National Polytechnique de Lor-raine (France), and Ecole Polytechnique Federale de Lau- wt pct
w*s solute concentration in the solid phase at thesanne (Switzerland). SINTEF, together with the Norwegian
University of Science and Technology, participate, in the solid/liquid interface, wt pctaga heat-transfer coefficient at the graphite-air inter-EMPACT Project as a major subcontractor to Hydro Alumin-
ium AS and Elkem Aluminium ANS. The authors thank face, J/(Ks m2)amg heat-transfer coefficient at the metal-graphitethe EMPACT partners and the European Commission for
financial support. interface, J/(Ks m2)d solute-diffusion length at the envelope in the
extragranular liquid phase, mNOMENCLATURE Dt calculation time step, s
G Gibbs–Thompson constant, mKA stereological constantcp specific heat capacity, J/(kgK) l2 cell or secondary dendrite arm spacing, mm
fe shape factor of the grain envelopesd average center-to-center distance betweengrains, m
Dl diffusivity in the liquid, m2/sSuperscriptDs diffusivity in the solid, m2/s
E values of quantity at the eutectic temperaturegs volume fraction of the solid phasege volume fraction of the grain envelopesgi volume fraction of solid within the grain
APPENDIX AenvelopesAccommodation Procedure for the Phase-Diagramh specific enthalpy, J/kg
DataJl diffusive solute flux across the envelope into theextragranular liquid phase
In the present study, the liquidus curve was expressed asJs diffusive solute flux across the solid/liquid inter-face into the solid phase T 5 a1w*2
l 1 a2w*l 1 a3 [A1]k partition coefficientl mean linear intercept, m where w*l is the solute mass fraction of the liquid phase atL specific latent heat, J/kg thermodynamic equilibrium, and the coefficients ai (i 5m slope of the liquidus line, 8C/wt pct 1* . . . 3), given in Table AI, are based on a polynomial fitn grain density grains/m3
performed on coordinates for the liquidus curve of the Al-p exponent in the solid/liquid interfacial area con- Cu diagram obtained from the ThermoCalc database[22] (Fig-
centration relation ure 5).Q heat-extraction rate, J/kg s In a similar way, a linear expression for the partitionQexp average experimental heat-extraction rate, J/kg s coefficient has been determined from a linear least-squaresS surface-to-volume ratio of sample, m21
regression on partition coefficients obtained from theSs solid/liquid interfacial area concentration, m21
phase diagram:[22]
Se envelope/liquid interfacial area concentration,m21 k 5 b1w*l 1 b2 [A2]
t time, stexp measured solidification time, s In order to keep the solution procedure of the model,
which handles the constant liquidus slope (m) and partitionT temperature, 8CTeut eutectic temperature, 8C coefficient (k), we have supposed that m and k were constant
during a calculation time-step (Dt) and equal to their valuesTg temperature in the graphite crucible, 8CTliq liquidus temperature, 8C at the previous time-step:
Table AI. Thermodynamical Data Used in the Equiaxed Growth Model
Quantity Symbol Value Unit Reference
Eutectic temperature Teut 547.7 8C 22Coefficients in Eq. [A14] a1 20.0343726 8C/(wt pct)2 22
a2 22.16885 8C/wt pct 22a3 659.4 8C 22
Coefficients in Eq. [A17] b1 1.4 3 1023 1/wt pct 22b2 9.45 3 1022 — 22
2058—VOLUME 32A, AUGUST 2001 METALLURGICAL AND MATERIALS TRANSACTIONS A

(a)
Fig. B1—Results from a heat flow model of the solidification experiment.(b)The temperature in the metal sample, T, and in the graphite mold, Tg ,
was assumed to be uniform, while the surrounding air remains at roomFig. B2—(a) and (b) The effect of a varying and constant heat extractiontemperature, Ta. Q and Q(avr) denote the time-dependent heat extractionrate, Q, on the predicted temperature, T, and on the development of therate calculated by Eq. [B1] and the average heat extraction calculated byinternal solid fraction, gi. (b) is a close-up of (a) in the first 5 s.Eq. [3], respectively. amg and aga denote the heat-transfer coefficients at
the metal-graphite and graphite-air interfaces, respectively.
from the cooling rate prior to solidification. This means thatQ increases during solidification, and it was decided to usethe constant average heat-extraction rates obtained from Eq.m(t) 5 1 T
w*l 2t
5 2a1w*l (t) 1 a2 [A3][3] in the calculations.
In order to check whether the assumption of a constantheat-extraction rate is reasonable, a varying Q value with
k(t) 5w*s (t)
w*l (t)5 b1w*l (t) 1 b2 [A4] time during solidification was studied in a simple heat-flow
model. It was assumed that the metal sample and the graphitewhere w*s is the solute mass fraction of the solid phase at mold each has a uniform temperature and that the sur-thermodynamic equilibrium. Hence, the sample temperature rounding air remains at room temperature during the experi-at the new time-step, t 1 Dt, was written as ment. Furthermore, the heat transfer at the two interfaces
(metal-graphite and graphite-air) was modeled by two con-T(t 1 Dt) 5 T(t) 1 m(t)(w*l (t 1 Dt) 2 w*l (t)) [A5] stant heat-transfer coefficients. The solidification path was
given by the enthalpy as a function of the solid fraction,At the end of a new time-step, w*l (t 1 Dt) is known, andh 5 cpT 1 L(1 2 gs). This path was calculated by the growthm and k can be updated by Eqs. [A3] and [A4].model, using a constant value of Q. Thus, the temperaturein the sample and in the mold (Tg) were calculated as func-
APPENDIX B tions of time, along with the heat-extraction rate, given byThe Heat Flow in the Experiment
Q(t) 5 Samg(T(t) 2 Tg(t)) [B1]In the modeling of the heat flow in the type of experiment
performed in this study, it is often assumed that the heat- where S is the surface-to-volume ratio of the sample andamg is the heat-transfer coefficient between the sample andextraction rate, Q, is a constant that can be estimated, e.g.,
from the cooling rate (T) prior to the start of solidification, the graphite mold.As shown in Figure B1, the evolution of latent heat rightby Q 5 cpT. However, in the present work, the measured
solidification times lead to average values of Q (cf., Eq. [3]) after the start of the solidification reduces the cooling rateof the sample (dT /dt) more than it reduces the cooling ratethat are about a factor of two higher than the values obtained
METALLURGICAL AND MATERIALS TRANSACTIONS A VOLUME 32A, AUGUST 2001—2059

Table CI. The Equations in the Permeability Relation Presented in Reference 1
K 51S2
eF3ge
febG2
Permeability [C1]
b 5bd
(gne 1 (bd /bl)2n)1/2n, n 5 0.176 log10 bd 1 0.275
General correlation [C2]
bd 53!5
(12gs /ge)3/2
Ss
feSeInterdendritic permeability [C3]
bl 5 592
ge
2143
g5/3e
223g1/3e 1 3g5/3
e 2 2g6/3e
1Cp (fe)
2b2d (1 2 tanh (bd)/bd)
2b2d 1 3(1 2 tanh (bd)/bd)6
1/2
Extradendritic permeability [C4]
Cp (fe) 5 5 f2e : 0.3 , ge , 1
1.26 log10 1 fe
0.1632 : 0 , ge , 0.3Grain shape function [C5]
Kv 5 ge 1bbd2
2
Flow partition coefficient [C6]
4. C.Y. Wang and C. Beckermann: Metall. Mater. Trans. A, 1996, vol.of the mold (dTg/dt). Thereby, the temperature difference27A, pp. 2765-83.(T 2 Tg) between the sample and the mold increases, which
5. M. Rappaz and P. Thevoz: Acta Metall., 1987, vol. 35, pp. 1487-97.causes an increased Q value from the sample due to Eq. 6. M. Rappaz and P. Thevoz: Acta Metall., 1987, vol. 35, pp. 2929-33.[B1]. The calculated Q(t) curve was implemented in the 7. C.Y. Wang and C. Beckermann: Mater. Sci. Eng., 1993, vol. A171,
pp. 199-211.equiaxed growth model by evaluating the value of Q(t) at8. C.Y. Wang and C. Beckermann: Metall. Trans. A, 1993, vol. 24A, pp.each time-step. Figure B2 shows the temperature and the
2787-2802.development of the internal solid fraction in modeling cases 9. B. Appolaire: Ph.D. Thesis, Institut National Polytechnique de Lor-with constant and varying Q values. With a varying Q value, raine, Lorraine, France, 1999.
10. L. Backerud and M. Johnsson: in Light Metals 1996, W. Hale, ed.,recalescence occurs at a lower undercooling because theWarrendale, PA, 1996, pp. 679-85.instantaneous Q value is lower than the average value in
11. A.M. Figuerdo, Y. Sumartha, and M.C. Flemings: in Light Metals,this region. However, during recalescence, the instantaneousWarrendale, PA, 1998, pp. 1103-06.
Q value increases above the average value, and the under- 12. S.W. Chen and C.C. Huang: Acta Mater., 1996, vol. 44, pp. 1955-65.cooling becomes higher for the case with a varying Q value. 13. L. Arnberg, L. Backerud, and G. Chai: Solidification Characteristics
of Aluminum Alloys, vol. 3, Dendritic Coherency, AFS, Inc., DesAs shown in Figure B2, these two counteracting effects resultPlaines, IL, 1996.in the development of a morphology that is not significantly
14. D.R. Poirier and S. Ganesan: Mater. Sci. Eng., 1992, vol. A157, pp.different in the two cases. This was found to be true for all 113-23.the samples, which indicates that even if the assumption of 15. D.R. Poirier and P. Ocansey: Mater. Sci. Eng., 1993, vol. A171, pp.
231-40.a constant heat-extraction rate is not strictly correct, the use16. A.J. Duncan, Q. Han, and S. Viswanathan: Metall. Mater. Trans. B,of this assumption in the present context does not influence
1999, vol. 30B, pp. 745-50.the predicted results significantly.17. T. Magnusson, Ø. Nielsen, L. Pedersen, and P.A. Tøndel: Technical
Report No. STF24 A98541, SINTEF, Oslo, 1998.18. A.W. Thompson: Metallography, 1972, vol. 5, pp. 366-69.APPENDIX C 19. R.L. Fullman: Trans. AIME, 1953, vol. 197, pp. 447-52.
Permeability Relation from Reference 1 20. W. Kurz and D.J. Fisher: Fundamentals of Solidification, Trans TechPublications, Aedermannsdorf, Switzerland, 1992, p. 294.Table CI lists the equations in the permeability relation 21. C.Y. Wang and C. Beckermann: Metall. Mater. Trans. A, 1996, vol.
suggested by Wang et al.[1] The necessary input to the rela- 27A, pp. 2754-64.22. EUR18171-COST507 Thermochemical Database for Light Metalltion is gs , Ss , ge , Se , and fe , as defined in the Nomenclature.
Alloys, I. Ansara, A.T. Dinsdale, and M.H. Rand, eds., Office forthe Official Publications of the European Communities, Luxenbourg,1998-XI, vol. 2.REFERENCES
23. J.S. Langer and H. Muller-Krumbhaar: Acta Metall., 1978, vol. 26,pp. 1681, 1689, and 1697.1. C.Y. Wang, S. Ahuja, C. Beckermann, and H.C. de Groh III: Metall.
Mater. Trans. B, 1995, vol. 26B, pp. 111-20. 24. M. Rappaz and W.J. Boettinger: Acta Mater., 1999, vol. 47, pp.3205-19.2. Ø. Nielsen, L. Amberg, A. Mo, and H. Thevik: Metall. Mater. Trans.
A, 1999, vol. 30A, pp. 2455-62. 25. A. Mortensen: Metall. Trans. A, 1991, vol. 22A, pp. 569-74.26. S. Ganesan and D.R. Poirier: Metall. Trans. A, 1987, vol. 18A, pp.3. M. Rappaz, P. Thevoz, and J.L. Desbiolles: Metall. Trans. A, 1989,
vol. 20A, pp. 311-22. 721-23.
2060—VOLUME 32A, AUGUST 2001 METALLURGICAL AND MATERIALS TRANSACTIONS A