
Super-Diffusivity in a Shear Flow Model¶from Perpetual Homogenization
Upload
khangminh22Category
view
1download
0
Purdue UniversityPurdue e-Pubs
Open Access Dissertations Theses and Dissertations
12-2016
Microstructural evolution during thehomogenization heat treatment of 6XXX and7XXX aluminum alloysPikee PriyaPurdue University
Follow this and additional works at: https://docs.lib.purdue.edu/open_access_dissertations
Part of the Materials Science and Engineering Commons
This document has been made available through Purdue e-Pubs, a service of the Purdue University Libraries. Please contact [email protected] foradditional information.
Recommended CitationPriya, Pikee, "Microstructural evolution during the homogenization heat treatment of 6XXX and 7XXX aluminum alloys" (2016).Open Access Dissertations. 988.https://docs.lib.purdue.edu/open_access_dissertations/988

Graduate School Form30 Updated
PURDUE UNIVERSITYGRADUATE SCHOOL
Thesis/Dissertation Acceptance
This is to certify that the thesis/dissertation prepared
By
Entitled
For the degree of
Is approved by the final examining committee:
To the best of my knowledge and as understood by the student in the Thesis/Dissertation Agreement, Publication Delay, and Certification Disclaimer (Graduate School Form 32), this thesis/dissertation adheres to the provisions of Purdue University’s “Policy of Integrity in Research” and the use of copyright material.
Approved by Major Professor(s):
Approved by:
Head of the Departmental Graduate Program Date

i
MICROSTRUCTURAL EVOLUTION DURING THE HOMOGENIZATION HEAT
TREATMENT OF 6XXX AND 7XXX ALUMINUM ALLOYS
A Dissertation
Submitted to the Faculty
of
Purdue University
by
Pikee Priya
In Partial Fulfillment of the
Requirements for the Degree
of
Doctor of Philosophy
December 2016
Purdue University
West Lafayette, Indiana

ii
Dedicated to my family.

iii
ACKNOWLEDGEMENTS
I, first acknowledge the support of my family members and my husband, Debashish,
which made my graduate life a memorable and enjoyable experience. I thank my advisors,
Prof. Matthew Krane and Prof. David Johnson, for supervising this work and having an
unshakable belief in me, even though there were setbacks. I acknowledge, contributions to
this research work from my committee members, Prof. Kevin Trumble and Prof. Mysore
Dayananda.
My experiments in MSE labs would not have been possible without instructional
and technical support from Patricia Metcalf, David Meyer, Jameson Root and Tim
Vanmeter. I also thank Gamini Mendis for helping me with the Differential Scanning
Calorimetry.
I gratefully acknowledge financial support from Shandong Nanshan Aluminum Co.,
Beijing Nanshan Institute of Aeronautical Materials for this research work.
Finally, I thank Sailei Zhang, whose previous contributions and discussions helped in
the work. I thank Yiwei Sun, for her experiments which helped me validate my numerical
results. I also thank Jeff Yanke, Alex Plotkowski, Kyle Fezi, Daniel Klenosky and John
Coleman who were always available for discussions and made the lab an enjoyable place to
work in.

iv
TABLE OF CONTENTS
Page
LIST OF TABLES ............................................................................................................. ix
LIST OF FIGURES ........................................................................................................... xi
LIST OF SYMBOLS ...................................................................................................... xvii
ABSTRACT ...................................................................................................................... xx
CHAPTER 1. INTRODUCTION ................................................................................. 1
1.1 Processing Stages of a Heat Treatable Aluminum Alloy ..................................... 1
1.2 Homogenization of As-cast Aluminum Alloys .................................................... 2
1.2.1 Alloy chemistries .......................................................................................... 4
1.2.2 As-cast and as-homogenization microstructures .......................................... 5
1.2.2.1 Al-Si-Mg-Fe-Mn alloys ............................................................................. 5
1.2.2.2 Al-Zn-Cu-Mg-Zr alloys ............................................................................. 5
1.3 Research Objectives ............................................................................................. 6
1.3.1 Study of Microstructural Evolution in Al-Si-Mg-Fe-Mn Alloys during
Homogenization and Post-homogenization Quenching .............................................. 6
1.3.2 Study of Microstructural Evolution in Al-Zn-Cu-Mg-Zr Alloys during
Homogenization ........................................................................................................... 9
1.3.3 Study of Reprecipitation of Secondary Phases in Al-Zn-Cu-Mg-Zr alloys
during Post-homogenization Quenching ................................................................... 11
1.3.4 Study of Radial Variation of Microstructure after Homogenization across
a DC-Cast AA7050 Billet .......................................................................................... 13
CHAPTER 2. NUMERICAL DESCRIPTION .......................................................... 16

v
Page
2.1 Literature Review ............................................................................................... 16
2.1.1 Early Studies on Modeling Dissolution and Growth of Particles ............... 17
2.2 Studies in Multicomponent Multiphase Systems ............................................... 17
2.3 Cellular-Automaton Finite Volume Model ........................................................ 22
2.3.1 Growth and Dissolution Algorithm ............................................................ 22
2.3.1.1 Diffusion Controlled Kinetics.................................................................. 23
2.3.1.2 Interface Reaction Rate-controlled Kinetics ........................................... 24
2.3.2 Thermodynamic and Kinetic Data .............................................................. 27
2.3.3 Nucleation Model........................................................................................ 27
2.3.4 Curvature Model ......................................................................................... 29
2.3.5 Model Validation ........................................................................................ 31
2.3.5.1 1D and 2D Binary Model ........................................................................ 31
2.3.5.2 Homogenization of Al-Si-Mg (Ternary) Alloy ......................................... 32
2.3.5.3 Homogenization of Multicomponent Multiphase Alloys ......................... 33
2.4 Particle Size Distribution Finite Difference Model ............................................ 34
2.4.1 Nucleation Model........................................................................................ 39
2.4.2 Growth Model ............................................................................................. 41
2.4.3 Model Validation ........................................................................................ 42
2.5 Coupling the Two Models .................................................................................. 43
CHAPTER 3. MICROSTRUCTURAL EVOLUTION
DURING HOMOGENIZATION OF AL-SI-MG-FE-MN ALLOYS .............................. 44
3.1 Introduction ........................................................................................................ 44
3.2 Domain Description ............................................................................................ 46
3.3 Microstructural Evolution during Homogenization ........................................... 50
3.3.1 Baseline Behavior of Microstructure .......................................................... 50
3.3.2 Effect of Temperature ................................................................................. 54
3.3.3 Effect of Initial Alloy Composition ............................................................ 57
3.3.3.1 Comparison with Phase Diagrams ......................................................... 60
3.3.4 Effect of Initial Microstructural Features ................................................... 62
3.4 Microstructural Evolution during Post-homogenization Quenching ................. 63
vi
Page
3.4.1 Behavior of Microstructure during Quenching from the Homogenization
Temperature ............................................................................................................... 65
3.4.2 Effect of Cooling Rate ................................................................................ 66
3.4.3 Effect of Initial Mg Composition ................................................................ 69
3.5 Process Recommendations ................................................................................. 72
3.6 Conclusion .......................................................................................................... 73
CHAPTER 4. MICROSTRUCTURAL EVOLUTION
DURING HOMOGENIZATION OF AL-ZN-CU-MG-ZR ALLOYS ............................ 75
4.1 Introduction ........................................................................................................ 75
4.2 Domain Description ............................................................................................ 78
4.3 Experimental Procedures .................................................................................... 79
4.4 Evolution of Microstructure ............................................................................... 83
4.4.1 Initial Microstructure of the Baseline Composition.................................... 83
4.4.2 Comparison of Homogenization Schedules for Precipitation of Al3Zr
Dispersoids ................................................................................................................ 84
4.4.2.1 One-step Homogenization ....................................................................... 86
4.4.2.2 Slow Heating ........................................................................................... 88
4.4.2.3 Two-step Homogenization ....................................................................... 90
4.4.2.4 Comparison of f/r for Different Schedules ............................................. 92
4.4.3 Evolution of Composition Profiles during Homogenization ...................... 92
4.4.4 Microstructural Evolution of Interdendritic Phases during
Homogenization ......................................................................................................... 94
4.4.4.1 Stage I ...................................................................................................... 95
4.4.4.2 Stage II .................................................................................................... 96
4.4.4.3 Stage III ................................................................................................... 96
4.4.5 Microstructural Evolution of Al3Zr Dispersoids during Homogenization . 99
4.4.6 Effect of Heating Rate on Dispersoids ...................................................... 103
4.4.7 Process Recommendations........................................................................ 104
4.5 Conclusion ........................................................................................................ 110
vii
Page
CHAPTER 5. IMPROVED 7XXX COMPOSITIONs FOR EASE
OF HOMOGENIZATION AND EXTRUSION ............................................................ 112
5.1 Introduction ...................................................................................................... 112
5.2 Effect of Composition on Evolution of Interdendritic Phases .......................... 114
5.2.1 Effect on As-cast and Homogenized Microstructure ................................ 115
5.2.2 Comparison with Phase Diagrams ............................................................ 120
5.3 Effect of Composition on Evolution of Al3Zr Dispersoids .............................. 122
5.3.1 Effect on Zr Microsegregation in As-cast Microstructure ........................ 122
5.3.2 Effect on Thermodynamics and Kinetics of Precipitation ........................ 123
5.3.3 Effect on Dispersoid Precipitation ............................................................ 125
5.4 Experimental Validation ................................................................................... 127
5.5 Improved Composition Ranges ........................................................................ 129
5.6 Conclusion ........................................................................................................ 130
CHAPTER 6. MICROSTRUCTURE DUE TO PRECIPITATION
DURING COOLING OF 7XXX ALLOYS ................................................................... 132
6.1 Introduction ...................................................................................................... 132
6.2 Domain Description .......................................................................................... 134
6.3 Experimental Validation ................................................................................... 134
6.4 Numerical Results and Discussion ................................................................... 137
6.4.1 Effect of Cooling Rates ............................................................................. 140
6.4.1.1 Continuous Cooling Curves .................................................................. 144
6.4.1.2 Time Temperature Transformation Curves ........................................... 146
6.4.2 Effect of Composition ............................................................................... 147
6.5 Conclusion ........................................................................................................ 154
CHAPTER 7. RADIAL VARIATION OF MICROSTRUCTURE IN A
DIRECT CHILL CAST BILLET ON HOMOGENIZATION ....................................... 155
7.1 Introduction ...................................................................................................... 155
7.2 Domain Description .......................................................................................... 158
7.3 Radial Variation in Microstructure ................................................................... 160
7.3.1 Initial As-cast Microstructure ................................................................... 160

viii
Page
7.3.2 Homogenized Microstructure ................................................................... 164
7.3.3 Post-homogenization Cooled Microstructure ........................................... 167
7.4 Process Recommendations ............................................................................... 167
7.5 Conclusion ........................................................................................................ 170
CHAPTER 8. CONCLUSIONS AND RECOMMENDATIONS FOR
FUTURE WORK ........................................................................................................... 171
8.1 Conclusions ...................................................................................................... 171
8.2 Future Work ...................................................................................................... 175
8.2.1 Experimental Verification of Interface Reaction-controlled Phase
Transformations ....................................................................................................... 175
8.2.2 Computationally Efficient 2D Microstructural Model ............................. 176
8.2.3 Modeling Thermo-CalcTM based Solidification Microstructure ............... 178
8.2.4 Modeling Homogenization during Post-solidification Cooling ................ 178
8.2.5 Experimental Verification of Composition Effects in 7XXX Alloys ....... 179
References ....................................................................................................................... 180
APPENDICES
Appendix A ..................................................................................................................... 193
Appendix B ..................................................................................................................... 194
VITA ............................................................................................................................... 195

ix
LIST OF TABLES
Table .............................................................................................................................. Page
Table 2.1: Comparison of the peaks in the dispersoid size number density distributions
from predictions of the current model and the experiments of Sun et al.[12] .................... 42
Table 3.1: Variation in alloy composition to study its effect on homogenization kinetics
........................................................................................................................................... 49
Table 3.2: Variation in as-cast microstructural features to study their effect on
homogenization times. ...................................................................................................... 50
Table 4.1: Values of parameters for the precipitation model............................................ 79
Table 4.2: Homogenization schedules for different test cases run ................................... 86
Table 5.1: The different test cases run for different compositions. ................................ 115
Table 5.2: Summary of effect of composition on as-cast microstructure and
homogenization time ....................................................................................................... 120
Table 5.3: Comparison of the predicted and experimentally measured microstructure of
the DS Top and DS Bottom samples after homogenization for 5hrs at 420°C and 24hrs
for interdendritic phase 40hrs for dispersoids at 480°C. ................................................ 129
Table 6.1: The phases and property values for the phases used by the numerical model
......................................................................................................................................... 134
Table 6.2: The predicted number densities and mean platelet lengths for the different
precipitated phases. ......................................................................................................... 137
Table 6.3: Test cases run to study the effect of cooling rates on precipitation ............... 140
Table 6.4: Test cases run to study the effect of composition on precipitation ................ 140
Table 7.1: Values of the heat transfer parameters used. ................................................. 159

x
Appendix Table .............................................................................................................. Page
Table A.1: Diffusion constant (Do) and activation energy (Qd) in equation (2.11) for
elements in the α-Al matrix in the presence of other elements for Al-Si-Mg-Fe-Mn
alloy.............................................................................................................................................193
Table A.2: Diffusion constant (Do) and activation energy (Qd) in equation (2.11) for
elements in the α-Al matrix in the presence of other elements for Al-Zn-Cu-Mg-Zr
alloy.............................................................................................................................................193
Table B.1: List of used phase abbreviations for Al-Si-Mg-Fe-Mn alloy system..............194
Table B.2: List of used phase abbreviations for Al-Zn-Cu-Mg-Zr alloy system..............194

xi
LIST OF FIGURES
Figure ............................................................................................................................. Page
Figure 1.1: Schematic showing the various processing stages for a typical 6XXX alloy
extrusion. The stages in red indicate the processes studied in this work. ........................... 2
Figure 1.2: (a) As-cast Al-1.2Si-0.78Mg-0.33Fe-0.5Mn-0.14Cr alloy showing needle
shaped β-AlFeSi and globular α-Al(Fe,Mn)Si phases1 (Mrówka-Nowotnik et al.) (b)
Nucleation of α-Al(Fe,Mn)Si on β-AlFeSi needles in AA6005 after homogenization for
2 hrs at 540°C17 (Kuijpers et al.) (c) The solidification phases in as-cast AA7050 alloy12
(Jia et al.) A/B/C: T phase, D: S phase, E: Al7Cu2Fe, F: α-Al matrix (d) Diffusion
networks formed during homogenization showing nucleation of S phase after 2 hrs at
380°C12 (Jia et al.) 1/2: T phase, 3/4: S phase. ................................................................. 8
Figure 2.1: Sensitivity of constants in the nucleation model ............................................ 29
Figure 2.2: Height function calculations for curvature of center cell in 3X7 array. (a)
microstructure with stray interface: y(1) = 4.35, y(2) = 3.4, y(3) = 2.55. (b)
microstructure with nucleating phase, γ, on an existing phase, β: y(1) = 6.6, y(2) = 4.2,
y(3) = 3.5. .......................................................................................................................... 31
Figure 2.3: (a) Initial (5% for α and 45% for β); final concentrations (3.5% for α and
52.5% for β) and diffusion coefficients (4×10-14 m2/s for both the phases) for the 2
phase 1D binary model validation experiment; (b) Grid dependent solutions for the
binary model and its comparison with the analytical solution; (c) Initial (2% for α and
52.5% for β); final concentrations (3.5% for α and 52.5% for β) and diffusion
coefficients (9.2×10⁻¹³ m2/s and 9.2×10⁻¹⁶ m2/s for α and β respectively) for the
2 phase 2D binary model validation experiment. (b) The analytical and numerical
solutions for a grid size of 10-7m. ..................................................................................... 35
Figure 2.4: (a) Initial microstructure; and microstructures after (b) 0.05 s; (c)10 s;
(d) 0.5 h; (e) 1 h; (f) 2 h; and (g) 4 h of homogenization at 820 K (547°C). The final
volume fraction is lower than that predicted by Thermo-CalcTM due to curvature effects.
........................................................................................................................................... 36
xii
Figure ............................................................................................................................. Page
Figure 2.5: Simulated dissolution kinetics of the precipitates at different temperatures
from the 2D homogenization model. ................................................................................ 37
Figure 2.6: Curvature driven evolution of a dissolving square precipitate (a) initial (b)
at 1 hr (β-AlFeSi in α-Al matrix) and of a circular precipitate (c) initial (d) at 1 hr
(Al2Cu in α-Al matrix) . .................................................................................................... 38
Figure 3.1: (a) Baseline initial microstructure for homogenization models. Colors
indicate the different phases: green β-AlFeSi; orange α-Al(FeMn)Si; cyan Mg2Si; and
blue: α-Al matrix. (b) Baseline initial concentration field, based on non-equilibrium
(Scheil) solidification. (c) The numerical radial domain for the precipitation model
showing nucleation and growth of dispersoids. ................................................................ 48
Figure 3.2: Microstructural evolution during homogenization at 580°C, showing only
the -Al(FeMn)Si (in red). (a) Initial microstructure with the position of the β–AlFeSi
needles indicated by white lines; (b) at 10 mins, showing -Al(FeMn)Si nucleation
along the edges of needles of β–AlFeSi; (c) at 1 hour, showing thinning and separation
of β into smaller needles; (d) at 3 hours, showing -Al(FeMn)Si globules forming
where the β dissolved; (e) at 6 hours, showing complete dissolution of β needles; and
(f) at 8 hours, showing beads of -Al(FeMn)Si where the two -Al dendrites meet . ... 52
Figure 3.3: Microstructural evolution of baseline conditions. (a) Absolute volume
fraction evolution of β-AlFeSi and α-Al(FeMn)Si with time, showing two stages of
phase transformation. Relative α-Al(FeMn)Si volume fraction is also indicated (b) Mn
and (c) Fe concentration profiles along the centerline of the microstructure (local
increases at 10 minutes are due to dissolution of β-AlFeSi precipitates). (d)
Compositions at the interface and matrix in the interdendritic region. ............................ 53
Figure 3.4: Comparison of predicted transient relative α-Al(FeMn)Si volume fraction
with measurements of Kuijpers et al17. ............................................................................. 56
Figure 3.5: Morphology of the α-Al(FeMn)Si phase after homogenization of baseline
composition for 8 hours at (a) 540°C, (b) 570°C, and (c) 580°C. .................................... 56
Figure 3.6: Effect of initial alloy composition on transformation to α-Al(FeMn)Si, or β-
AlFeSi independently varying (a) Fe, (b)Mn, and (c) Si from the baseline. .................... 59
Figure 3.7: Effect of Si and Mn on the stable equilibrium phases at 580°C for Fe
contents of (a) 0.07% (b) 0.27% and (c) 0.37%. The 2 phase regions are separated by 3
phase regions which are separated by 4 phase regions. .................................................... 61
Figure 3.8: Effect of variation in size of microstructural features on homogenization
times: (a) β-AlFeSi plate thickness and (b) relative α-Al(FeMn)Si volume fraction. ...... 64

xiii
Figure ............................................................................................................................. Page
Figure 3.9: Effect of cooling rates on evolution of (a) particle density, (b) particle size
distribution, (c) matrix Mg concentration, and (d) Mg2Si volume fraction. ..................... 68
Figure 3.10: Effect of Mg on phase boundaries for the baseline composition, Phase
regions A: α-Al+α-Al(FeMn)Si+β-AlFeSi+Q; B: α-Al+ α-Al(FeMn)Si+ β-AlFeSi+Q
+Si; C: α -Al+ α-Al(FeMn)Si+ β-AlFeSi+Q+Mg₂Si; D: α-Al+α-Al(FeMn)Si+Mg₂Si;
E: α -Al+α-Al(FeMn)Si+Liquid ....................................................................................... 70
Figure 3.11: Effect of Mg on (a) particle density, (b) particle size, (c) average matrix
Mg concentration, and (d) Mg2Si volume fraction during cooling at 250°C/hr. .............. 71
Figure 4.1: (a) Predicted composition diffusion network in the interdendritic particles
as predicted by the diffusion based model as observed by Jia et al.12; (b) The predicted
microstructure of spherical S phase (in red) nucleated on the interdendritic η during
homogenization; (c) the comparison of homogenization times predicted by the
diffusion-based model with experiments by Fan et al.11 (d) comparison with
predictions from the interface-reaction rate control based model with experiments
from Fan et al.11 ................................................................................................................ 77
Figure 4.2: (a) A sample as-cast microstructure with a schematic of the computational
domain superimposed over half an α-Al grain. (b) Schematic of half grain domain
showing coupling of the two models: homogenization model with phase change in cell
1 and diffusion across the grain and precipitation model in each cell in the half grain. ... 80
Figure 4.3: (a) A sample homogenized microstructure showing the Al3Zr dispersoids
in α-Al matrix. (b) Schematic of 1D radial domain showing size distribution of
dispersoids across the radial domain................................................................................. 81
Figure 4.4: Initial composition on the half grain domain, showing the as-cast,
type microsegregation predicted by Thermo-CalcTM for Al-6.2Zn-2.3Cu-2.35Mg-
0.13Zr. ............................................................................................................................... 84
Figure 4.5: Evolution of (a) number density; (b) mean radius of dispersoids and (c)
remnant volume fraction of secondary phases during single step homogenization at
different temperatures. ...................................................................................................... 87
Figure 4.6: Evolution of (a) number density and (b) mean radius of dispersoids with
time during slow heating from 300°C to 475°C at different heating rates. ...................... 90
Figure 4.7: Evolution of (a) number density and (b) mean radius of dispersoids with
time during two step homogenization. .............................................................................. 91
Figure 4.8: Comparison of (a) 𝑓/𝑟 ratios from the center to the edge of the grain and
(b) volume fraction of S phase remaining for different homogenization schedules. ........ 93

xiv
Figure ............................................................................................................................. Page
Figure 4.9: Composition of Cu along the half SDAS at different times of
homogenization at 450°C (a) predicted by the numerical model (b) measured by EDS. . 94
Figure 4.10: Evolution of predicted and measured volume fraction of secondary phases
during homogenization at 450°C. The equilibrium microstructure contains no η phase. 95
Figure 4.11: (a) XRD plots (b) DSC curves of samples as-cast and homogenized at
450°C. The arrows on the DSC plots indicate start of the endothermic peaks for the
corresponding phases. ....................................................................................................... 98
Figure 4.12: Secondary Electron images of Al-6.2Zn-2.3Cu-2.35Mg-0.13Zr alloy after
(a) Step I; (b) Step II; (c) Step III; (d) Comparison of numerically predicted and
experimentally observed size distribution of dispersoids after 3 steps of
homogenization. (Step I: 10 hrs at 420 oC; Step II: 4 hrs at 470 oC; Step III: 15 hrs
at 480 oC) ........................................................................................................................ 101
Figure 4.13: (a) Time evolution of mean dispersoid radius and number density
during homogenization at 450°C; Time evolution of (b) number density (c) volume
fraction of the dispersoids at different positions across the grain; (d) Size distribution
of the dispersoids at the different normalized positions across the half grain (1 refers
to the grain center). ........................................................................................................ 102
Figure 4.14: Microstructure after (a) heating at 10°C/min to 420°C and holding for 10
hours (b) followed by heating at 1°C/min to 470°C and holding for 5 hours................. 104
Figure 4.15: (a) Schematic of the Al-Al3Zr phase diagram (b) the reversion and
coarsening of the dispersoids on fast heating. ................................................................ 105
Figure 4.16: Backscattered Electron micrographs of the Al-6.2Zn-2.3Cu-2.35Mg-
0.13Zr after (a) Step I (white phase is η+S); (b) Step II (white phase is S); (c) Step
III(white phase is S); The grey phase is α-Al.(d) Numerically predicted volume
fraction of secondary phases compared to experiments. ................................................ 108
Figure 4.17: (a) DSC plots and (b) XRD spectra from samples after every step of
homogenization. Curves: (1) as-cast; (2) after 420oC for 10 hours; (3) after (2) +
470oC for 4 hours; (4) after (3) + 480oC for 15 hours. ................................................... 109
Figure 5.1: Effect of varying amounts of (a) Zn, (b) Cu and (c) Mg on the initial
volume fraction of interdendritic particles in the as-cast state for the base composition
of Al-6Zn-2Cu-2Mg-0.13Zr predicted by Thermo-CalcTM. ........................................... 117
Figure 5.2: Effect of alloying elements (a),(b) Zn; (c),(d) Cu and (e),(f) Mg on
evolution of T/V and S phases respectively during homogenization at 450°C. ............. 119

xv
Figure ............................................................................................................................. Page
Figure 5.3: Effect of Cu and Mg on phase diagrams for (a) 4%, (b) 6%, (c) 8%, (d)
10% Zn at 45 ................................................................................................................... 121
Figure 5.4: (a) Variation of volume fraction of Al3Zr in the as-cast state with
composition for the baseline case of Al-6Zn-2Cu-2Mg-0.13Zr predicted by Thermo-
CalcTM (b) Composition of Zr across the SDAS for variation of Mg ............................. 123
Figure 5.5: Variation of (a) supersaturation, (b) nucleation, (c) growth rates for
varying amounts of Mg for the baseline case of Al-6Zn-2Cu-2Mg-0.13Zr ................... 124
Figure 5.6: Effect of composition on number density and mean radius of the
dispersoids (a),(b) Zn; (c),(d) Cu; (e), (f) Mg; (g),(h) Zr for homogenization at 450°C
for 30 hrs and 470°C for 5 hrs. ....................................................................................... 126
Figure 6.1: (a) Back scattered electron image of a homogenized and furnace cooled
Al-6.2Zn-2.3Cu-2.35Mg-0.13Zr; EDS mapping for (b) Zn; (c) Cu and (d) Mg. ........... 138
Figure 6.2: (a) XRD plot of the Al-6.2Zn-2.3Cu-2.35Mg-0.13Zr as-cast,
homogenized/water quenched and homogenized/furnace cooled samples (b) DSC
plots for the same indicating the onset temperatures of listed processes. ....................... 139
Figure 6.3: The evolution of predicted number densities of various phases precipitated
showing the temperature ranges of precipitation ............................................................ 141
Figure 6.4: Effect of cooling rates on (a) mean length of platelets (b) the number
density (c) volume fraction and (d) size distribution of different precipitated phases. .. 143
Figure 6.5: Simulated Continuous Cooling Curves for AA7050 showing the high
temperature, medium temperature and low temperature precipitation regions. The
solid lines showing the start temperatures and dashed lines showing the end
temperatures of precipitation. ......................................................................................... 145
Figure 6.6: Time Temperature Transformation curves for AA7050 showing the time
required for precipitation of 1% S, 0.001% η and 0.0005% T. ...................................... 147
Figure 6.7: Phase diagrams corresponding to the Al rich corner of an Al-6Zn-2Cu-
2Mg alloy showing the effect of (a) Zn (𝐴: 𝛼 − 𝐴𝑙 + 𝑆 + 𝑉;𝐵: 𝛼 − 𝐴𝑙 + 𝑆 + 𝜂 +𝑉; 𝐶: 𝛼 − 𝐴𝑙 + 𝑉; 𝐷: 𝛼 − 𝐴𝑙 + 𝜂 + 𝑉); (b) Cu (𝐴: 𝛼 − 𝐴𝑙 + 𝜂 ; 𝐵: 𝛼 − 𝐴𝑙 + 𝑆 + 𝑉 +𝜂)and (c) Mg (𝐴: 𝛼 − 𝐴𝑙 + 𝜃 + 𝑉; 𝐵: 𝛼 − 𝐴𝑙 + 𝑆 + 𝑉; 𝐶: 𝛼 − 𝐴𝑙 + 𝑆 + 𝜃; 𝐷: 𝛼 − 𝐴𝑙 +𝑉; 𝐸: 𝛼 − 𝐴𝑙 + 𝑆 + 𝜃 + 𝑉; 𝐹: 𝛼 − 𝐴𝑙 + 𝑉; 𝐺: 𝛼 − 𝐴𝑙 + 𝑉 + 𝜂; 𝐻: 𝛼 − 𝐴𝑙 + 𝑇 + 𝜃 +𝜂; 𝐼: 𝛼 − 𝐴𝑙 + 𝜂 + 𝜃 + 𝑉; 𝐽: 𝛼 − 𝐴𝑙 + 𝜂; 𝐾: 𝛼 − 𝐴𝑙 + 𝑉 + 𝜃) on the stable phases at
different temperatures. .................................................................................................... 149

xvi
Figure ............................................................................................................................. Page
Figure 6.8: Effect of Zn content on (a) number density (b) Mean length of the
platelets (c) volume fraction for different precipitated phases and (d) composition of
the matrix. ....................................................................................................................... 150 Figure 6.9: Effect of Cu content on (a) number density (b) Mean length of the platelets
(c) volume fraction for different precipitated phases and (d) composition of the
matrix. ............................................................................................................................. 152
Figure 6.10: Effect of Mg content on (a) number density (b) Mean length of the
platelets (c) volume fraction for different precipitated phases and (d) composition of
the matrix. ...................................................................................................................... 153
Figure 7.1: Schematic showing the inputs and outputs of the numerical models
involved........................................................................................................................... 157
Figure 7.2: Schematic showing the axisymmetric domain and the boundary
conditions during industrial cooling of the billet. The positions were microstructures
are compared are numbered. The initial temperature is ambient temperature at the
beginning of the heating cycle. ....................................................................................... 159
Figure 7.3: The homogenization heating, holding, and cooling cycle chosen in the
study showing little variation in temperatures at the 3 positions studied. ...................... 161
Figure 7.4: The predicted (a) compositions and (b) LST and SDAS across the radius
of the billet. ..................................................................................................................... 162
Figure 7.5: (a) Predicted as-cast volume fractions of secondary phases at different
radial positions in the billet; The microsegregation across the grains for (b) Cu and
Zr and (c) Zn and Mg. ..................................................................................................... 163
Figure 7.6: (a) Evolution of the T+V phases; (b) S phase during homogenization; (c)
The number density and mean radii of the dispersoids across the radii of the billet
after Step II of homogenization. ..................................................................................... 165
Figure 7.7: The radial variation of (a) number density, (b) mean length of the platelets,
(c) volume fraction, (d) size distribution of the phases precipitated during cooling
under industrial conditions and (e) radial variation of the composition of the matrix. .. 168
Figure 8.1: Geometry of the interface cell showing the reconstructed interface and its
movement perpendicular to the normal .......................................................................... 177

xvii
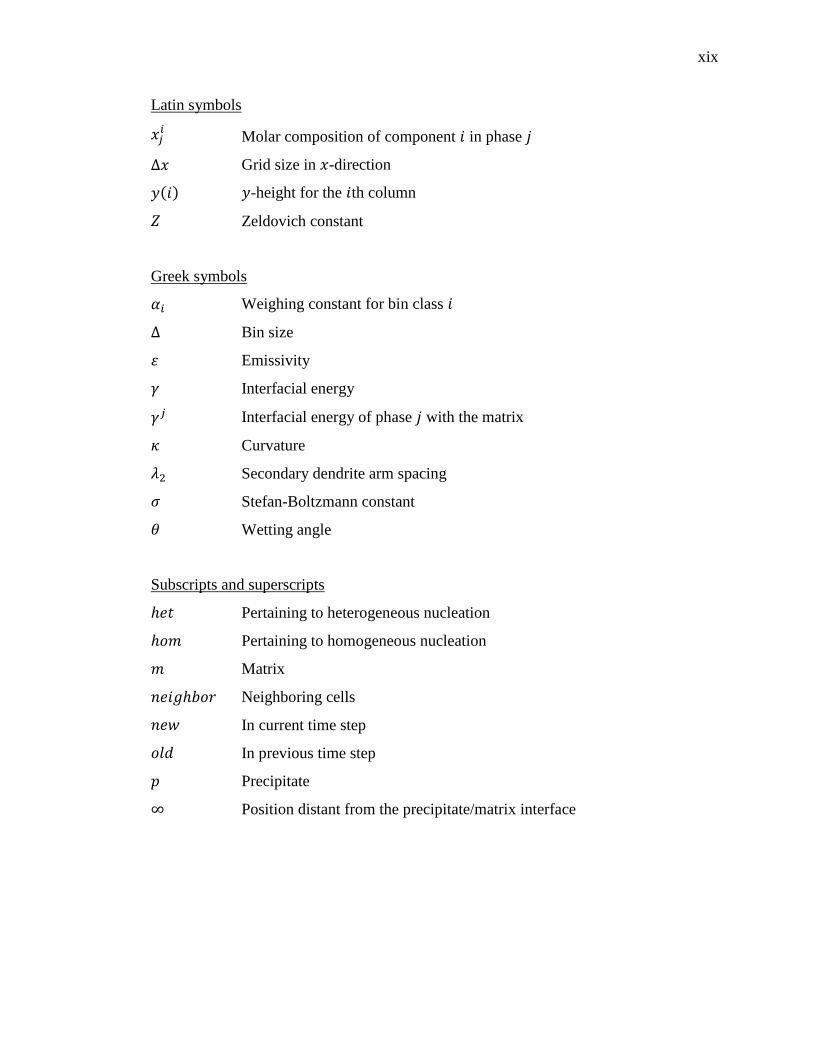
LIST OF SYMBOLS
Latin Symbols
𝐴 Aspect ratio
𝐴𝑒𝑞 Aspect ratio at nucleation
𝑐𝑝 Specific heat capacity
𝐶̅ Mean composition of the matrix
𝐶𝑒 Equilibrium composition of the matrix
𝐶𝑖 Composition of component 𝑖
𝐶𝑖𝑘 Composition of component 𝑘 in phase 𝑖
𝐶𝑖𝑗𝑘 Composition of component 𝑘 in phase 𝑖 in the 𝑗th neighbor
𝐶𝑖𝑘∗ Equilibrium composition of component 𝑘 in phase 𝑖
𝐷0 Diffusion constant
𝐷𝑖 Diffusion coefficient of component 𝑖
𝐷𝑖𝑗𝑘 Diffusion coefficient of component 𝑖 due to composition gradient of 𝑗 in 𝑘
𝑓𝑖 Mass fraction of phase 𝑖
∆𝑓𝑖 Change in mass fraction of phase 𝑖
∆𝑓𝑖/𝑗 Change in mass fraction of phase 𝑖 to phase 𝑗
∆𝐺 Driving force for nucleation
∆𝐺𝑑𝑓 Driving force for phase transformation
∆𝐺𝑑𝑖𝑓𝑓 Free energy dissipated in diffusional processes
∆𝐺𝑓𝑟𝑖𝑐 Free energy dissipated in overcoming interfacial friction
∆𝐺𝑁 Mean driving force for nucleation
∆𝐺𝜎 Standard deviation of driving force for nucleation
ℎ Heat transfer coefficient
𝐻′̅̅ ̅ Mean projected area of a precipitate

xviii
Latin symbols
𝑗0 Nucleation rate pre-factor
𝑗𝑗 Nucleation rate for 𝑗th phase
𝑘𝐵 Boltzmann constant
𝑘𝑐 Thermal conductivity
𝑀 Mobility
𝑀0 Mobility constant
𝑁 Number of nucleation sites
𝑁𝐴 Number of precipitates per unit area
𝑁𝐴𝑣 Avagadro number
𝑁𝑗 Number of precipitates of phase 𝑗
𝑁𝑚𝑎𝑥 Maximum number of nucleation sites
𝑁𝑡𝑜𝑡 Total number of precipitates
𝑁𝑉 Number of precipitates per unit volume
(𝑁𝐴)𝑖 Number of precipitates per unit area for the 𝑖th size class
(𝑁𝑉)𝑖 Number of precipitates per unit volume for the 𝑖th size class
𝑃𝑍 Zener pressure
𝑄𝑑 Activation energy for diffusion
𝑄𝑚 Activation energy for interface mobility
𝑟 Radius, radial co-ordinate
𝑟𝑐 Critical radius of the nuclei
𝑅0 Radius of the billet
𝑡 Time
𝑡𝑓 Local solidification time
∆𝑡 Time step
𝑣 Velocity of the precipitate/matrix interface
𝑣𝑗 Velocity of the 𝑗th phase/matrix interface
𝑣𝑖/𝑗 Velocity of the 𝑖th and 𝑗th phase interface
𝑉𝑖 Molar volume of 𝑖th precipitate phase
𝑥𝑖 Molar composition of component 𝑖
xix
Latin symbols
𝑥𝑗𝑖 Molar composition of component 𝑖 in phase 𝑗
∆𝑥 Grid size in 𝑥-direction
𝑦(𝑖) 𝑦-height for the 𝑖th column
𝑍 Zeldovich constant
Greek symbols
𝛼𝑖 Weighing constant for bin class 𝑖
∆ Bin size
𝜀 Emissivity
𝛾 Interfacial energy
𝛾𝑗 Interfacial energy of phase 𝑗 with the matrix
𝜅 Curvature
𝜆2 Secondary dendrite arm spacing
𝜎 Stefan-Boltzmann constant
𝜃 Wetting angle
Subscripts and superscripts
ℎ𝑒𝑡 Pertaining to heterogeneous nucleation
ℎ𝑜𝑚 Pertaining to homogeneous nucleation
𝑚 Matrix
𝑛𝑒𝑖𝑔ℎ𝑏𝑜𝑟 Neighboring cells
𝑛𝑒𝑤 In current time step
𝑜𝑙𝑑 In previous time step
𝑝 Precipitate
∞ Position distant from the precipitate/matrix interface

xx
ABSTRACT
Priya, Pikee. Ph.D., Purdue University, December 2016. Microstructural Evolution during
Homogenization Heat Treatment of 6XXX and 7XXX Aluminum Alloys. Major
Professors: Matthew John M. Krane and David R. Johnson
Homogenization heat treatment of as-cast billets is an important step in the
processing of aluminum extrusions. Microstructural evolution during homogenization
involves elimination of the eutectic morphology by spheroidisation of the interdendritic
phases, minimization of the microsegregation across the grains through diffusion,
dissolution of the low-melting phases, which enhances the surface finish of the extrusions,
and precipitation of nano-sized dispersoids (for Cr-, Zr-, Mn-, Sc-containing alloys), which
inhibit grain boundary motion to prevent recrystallization. Post-homogenization cooling
reprecipitates some of the phases, changing the flow stress required for subsequent
extrusion. These precipitates, however, are deleterious for the mechanical properties of the
alloy and also hamper the age-hardenability and are hence dissolved during solution heat
treatment.
Microstructural development during homogenization and subsequent cooling
occurs both at the length scale of the Secondary Dendrite Arm Spacing (SDAS) in
micrometers and dispersoids in nanometers. Numerical tools to simulate microstructural
development at both the length scales have been developed and validated against
experiments. These tools provide easy and convenient means to study the process.
xxi
A Cellular Automaton-Finite Volume-based model for evolution of interdendritic
phases is coupled with a Particle Size Distribution-based model for precipitation of
dispersoids across the grain. This comprehensive model has been used to study the effect
of temperature, composition, as-cast microstructure, and cooling rates during post-
homogenization quenching on microstructural evolution. The numerical study has been
complimented with experiments involving Scanning Electron Microscopy, Energy
Dispersive Spectroscopy, X-Ray Diffraction and Differential Scanning Calorimetry and a
good agreement has with numerical results has been found.
The current work aims to study the microstructural evolution during
homogenization heat treatment at both length scales which include the (i) dissolution and
transformation of the as-cast secondary phases; (ii) precipitation of dispersoids; and (iii)
reprecipitation of some of the secondary phases during post-homogenization cooling. The
kinetics of the phase transformations are mostly diffusion controlled except for the η to S
phase transformation in 7XXX alloys which is interface reaction rate controlled which has
been implemented using a novel approach. Recommendations for homogenization
temperature, time, cooling rates and compositions are made for Al-Si-Mg-Fe-Mn and Al-
Zn-Cu-Mg-Zr alloys. The numerical model developed has been applied for a through
process solidification-homogenization modeling of a Direct-Chill cast AA7050 cylindrical
billet to study the radial variation of microstructure after solidification, homogenization
and post-homogenization cooling.

1
CHAPTER 1. INTRODUCTION
1.1 Processing Stages of a Heat Treatable Aluminum Alloy
Aluminum alloys of 6XXX (Al-Si-Mg) and 7XXX (Al-Zn-Cu-Mg) series are the
most commonly used alloys for extrusions. They fall in the category of “heat-treatable”
alloys which can be heat treated for strength from precipitation strengthening. They find
application in architectural, automobile and aircraft (7XXX) industry. The 6XXX and
7XXX alloys are characterized as the “soft” and “hard” alloys with yield strength of <375
MPa and >550 MPa respectively. The various processing stages of a heat treatable
aluminum alloy like the 6XXX and 7XXX series alloys, undergoing extrusion are:
(i) Casting: The alloys are cast usually by Direct-Chill casting using grain refiners for
a finer microstructure.
(ii) Homogenization: The alloys are homogenized at a temperature high enough to
dissolve the coarse interdendritic phases at the grain boundaries. Post-
homogenization cooling follows holding at the homogenization temperature.
(iii) Pre-heating: Pre-heat is done to dissolve any precipitates formed during quenching
and to reduce the flow stress during extrusion.
(iv) Extrusion: The alloy billet is extruded through a die to the desired size and shape.
(v) Solution-treatment: The component is then, heated at a high temperature to result
in a supersaturated solid solution on quenching.

2
(vi) Age-hardening: The component is heated at an intermediate temperature to
precipitate strengthening particles.
A typical processing lifecycle of a 6XXX series alloy extrusion along with the temperature
range for each stage is shown in Figure 1.1.
Figure 1.1: Schematic showing the various processing stages for a typical 6XXX alloy
extrusion. The stages in red indicate the processes studied in this work.
1.2 Homogenization of As-cast Aluminum Alloys
Homogenization of as-cast alloys refers to the heat treatment provided to these
alloys to eliminate the as-cast eutectic morphology and compositional inhomogeneity
which are undesirable during downstream thermo-mechanical processing such as hot-
rolling, extrusion, forging etc. Homogenization after casting of aluminum based alloys is
an important process step which (i) reduces microsegregation leading to homogeneous
properties across the secondary dendrite arm spacing; (ii) dissolves the eutectic phases
formed during casting which have low melting point and may melt during subsequent
processing; (iii) helps in spherodization of non-soluble phases to reduce stress

3
concentrators in the alloy improving the fracture toughness and enhances surface finish;
and (iv) facilitates precipitation of dispersoids which pin grain boundaries inhibiting
recrystallization during extrusion (for alloys containing Mn, Cr, Zr and Sc). Post-
homogenization cooling conditions determines the nature and amount of secondary phases
precipitated which determines the processing parameters during the thermo-mechanical
processing that follows. These precipitates may also affect the age-hardenability of the
alloy reducing the much desired mechanical strength of the component.
Microstructural evolution during homogenization is of immense importance as it
determines the processing parameters during downstream processing and the resulting
mechanical properties of the component. Microstructural development during
homogenization and subsequent cooling occurs both at the length scale of the Secondary
Dendrite Arm Spacing (SDAS) in μm and dispersoids in nm. This makes the problem
complex, requiring characterization at both the length scales. Numerical tools to simulate
microstructural development at both these length scales, which have been validated against
experiments, provide a simple and convenient means to study homogenization. These
numerical tools can be used for process optimization. They also provide insight into the
mechanisms controlling phase transformations and morphological evolution during
homogenization with lesser number of experiments. The phase transformation kinetics
determines the time and energy consumed in homogenizing these alloys which may be as
long as 48 hours for 7XXX alloys.
The aim of this work is to study the microstructural evolution during
homogenization heat treatment at both the above mentioned length scales, which include
the (i) dissolution and transformation of the secondary phases formed during casting; (ii)
4
precipitation of dispersoids and (iii) re-precipitation of some of the secondary phases
during post-homogenization cooling. The numerical study has been complimented with
experiments. The numerical model developed has been applied for a through process
solidification-homogenization modeling of a Direct-Chill cast AA7050 cylindrical billet to
study the radial variation of microstructure after solidification, homogenization and post-
homogenization cooling.
1.2.1 Alloy chemistries
Both the 6XXX and 7XXX aluminum alloys may have Fe as an impurity which is
difficult to eliminate during extraction and which produces undesirable phases such as the
β-AlFeSi and α-Al(Fe,Mn)Si for 6XXX alloys1 and Al7Cu2Fe in 7XXX series alloys2.
Manganese is added to 6XXX alloys to mitigate the deleterious effects of acicular
β-AlFeSi by transforming it to the more favorable globular α-Al(Fe,Mn)Si3. It may also
have other elements such as Cr, Ti, Li, Zr and Sc in traces, some of which form dispersoids
during homogenization and post homogenization quenching4. The alloy chemistry studied
in this work is Al-Si-Mg-Fe-Mn alloy.
The Fe-containing Al7Cu2Fe phase in 7XXX series alloys remains after
homogenization and is difficult to eliminate2. The alloy chemistry studied in this work is
Al-Zn-Cu-Mg-Zr which is devoid of impurities like Fe, Mn and Ti which may otherwise
be present in 7XXX alloys. Zirconium and scandium are added to 7XXX alloys to
precipitate nano-sized coherent L12 precipitates which are very stable and inhibit grain
boundary movement during recrystallization at high temperatures 5.

5
1.2.2 As-cast and as-homogenization microstructures
1.2.2.1 Al-Si-Mg-Fe-Mn alloys
As-cast Al-Si-Mg-Fe-Mn alloys are mostly α-Al with a eutectic morphology
consisting of acicular β-AlFeSi (monoclinic crystal structure) and globular α-Al(FeMn)Si
(cubic crystal structure) precipitates. The interdendritic regions may also have irregular
Mg2Si or Si particles depending on the composition1. The acicular β-AlFeSi are detrimental
to the hot ductility of the extrusions due to their low melting points and their ability to act
as stress concentrators6. They also degrade surface finish during extrusion7. The presence
of Mn in the alloy enhances extrudability by changing the morphology of the interdendritic
phases through the transformation of acicular β-AlFeSi to globular α-Al(FeMn)Si during
homogenization3.
Mg2Si phase precipitates during post-homogenization quenching, depending on the
Mg composition of the alloy 8. The amount of Mg2Si precipitated determines the amount
of residual Mg in solid solution, which affect the flow stress during extrusion9. It lowers
the flow stress during extrusion but also reduces the age-hardenability of the alloy as it
requires Mg for precipitation of strengthening particles during the age-hardening heat
treatment. The as-cast and homogenized microstructures for Al-Si-Mg-Fe-Mn alloys are
shown in Figure 1.2 (a) and (b) respectively.
1.2.2.2 Al-Zn-Cu-Mg-Zr alloys
As-cast Al-Zn-Cu-Mg-Zr alloys are mostly α-Al consisting of a eutectic
morphology of compositional variants of the η (MgZn2) or the T (Al2Mg3Zn3) as coarse
interdendritic particles10–12. Deng at al.2 reports Cu and Mg rich aluminides instead of the
η or T phases in as-cast AA7050. They also reported traces of S (Al2CuMg) phase. The
6
coarse η, Cu- and Mg-rich non-equilibrium aluminides, and the T phases, all of which are
detrimental for the mechanical properties12, transform to the more globular S phase during
homogenization which in turn gradually dissolves at higher temperatures.
Along with the dissolution and transformation of the secondary phases,
precipitation of nano-sized coherent L12 Al3Zr dispersoids occurs across the grains. These
dispersoids inhibit recrystallization by pinning grain boundaries during high temperature
thermo-mechanical processing and the solution heat treatment5.
Post-homogenization quenching reprecipitates some of the S, η/M, and T phases at
various temperatures depending on their solvus13. This nucleation occurs at different
nucleation sites including previously precipitated dispersoids, dislocations and grain
boundaries14. These reprecipitated particles may act as nucleation sites for recrystallized
grains, affect the mechanical properties, and reduce the age-hardenability of the alloy15,16.
The as-cast and homogenized microstructures for Al-Zn-Cu-Mg-Zr alloys are shown in
Figure 1.2 (c) and (d) respectively.
1.3 Research Objectives
1.3.1 Study of Microstructural Evolution in Al-Si-Mg-Fe-Mn Alloys during
Homogenization and Post-homogenization Quenching
Microstructural evolution during homogenization of Al-Si-Mg-Fe-Mn alloys
occurs in two stages at different length scales: while holding at the homogenization
temperature and during quenching to room temperature. During holding at the
homogenization temperature diffusion on the scale of the secondary dendrite arm spacing
(SDAS) (in case of dendritic or grain size in case of a cellular microstructure), in
micrometers occurs accompanied by phase transformations of the interdendritic phases at

7
the grain boundaries. The β-AlFeSi at the grain boundaries transforms to the α-
Al(Fe,Mn)Si. On the other hand, post-homogenization quenching leads to Mg2Si phase
dispersoid precipitation at the nanometer to submicron scale. In this work, a numerical
model has been developed that estimates microstructural changes during both the stages.
Numerical modeling of homogenization gives insight into transient microstructural
behavior at both length scales, including factors affecting the phase transformations,
allowing better control of the process and alloy chemistry and selection of homogenization
temperature and quench rate to improve the process. In the current study, two different
models have been used to study microstructural changes at the two length scales. A
diffusion-based 2D finite volume-cellular automaton model simulates microstructural
changes at the SDAS scale during homogenization and the Mg concentration distribution
obtained is used as the starting point for a 1D finite difference model of precipitation at the
dispersoid length scale during post-homogenization cooling. The models are thus “loosely”
coupled to give a comprehensive picture of microstructural changes. The model
development and validation is explained in detail in CHAPTER 2. This study is discussed
in detail in CHAPTER 3.
This study aims to:
model microstructural changes at both length scales during homogenization and post
homogenization cooling;
study the effect of processing parameters (temperature, time, and cooling rates) on
microstructural evolution to obtain an optimum homogenization schedule;
study the effect of composition on microstructure to obtain optimum composition
ranges for minimum homogenization times, low flow stress during extrusion, and good

8
(a) (b)
(c) (d)
Figure 1.2: (a) As-cast Al-1.2Si-0.78Mg-0.33Fe-0.5Mn-0.14Cr alloy showing needle
shaped β-AlFeSi and globular α-Al(Fe,Mn)Si phases1 (Mrówka-Nowotnik et al.) (b)
Nucleation of α-Al(Fe,Mn)Si on β-AlFeSi needles in AA6005 after homogenization for 2
hrs at 540°C17 (Kuijpers et al.) (c) The solidification phases in as-cast AA7050 alloy12
(Jia et al.) A/B/C: T phase, D: S phase, E: Al7Cu2Fe, F: α-Al matrix (d) Diffusion
networks formed during homogenization showing nucleation of S phase after 2 hrs at
380°C12 (Jia et al.) 1/2: T phase, 3/4: S phase.

9
age-hardenability, are based on Mg composition distributions after homogenization and
cooling; and
study the effect of as-cast microstructural features during casting on homogenization
times to adjust the casting process to minimize time and energy spent on
homogenization.
One reason to start with the study of microstructural evolution of a 6XXX alloy
was that these alloys are important commercially and have been extensively studied
experimentally. There exist reports of the experimental observations of microstructure
during homogenization of a number of 6XXX alloys in literature. The alloy chosen in this
study as the baseline case was AA6005 alloy. The numerical results have been compared
with the experimental results in literature17 and a close match has been found. The model
developed for Al-Si-Mg-Fe-Mn system was the foundation on which the model for
microstructural evolution in 7XXX alloys was developed.
1.3.2 Study of Microstructural Evolution in Al-Zn-Cu-Mg-Zr Alloys during
Homogenization
As mentioned earlier the coarse interdendritic η to S phase transformation at the
grain boundaries is accompanied with precipitation of nano-sized coherent metastable
Al3Zr dispersoids across the grains during homogenization of Al-Zn-Cu-Mg-Zr alloys. The
microstructure gradually varies from the center of the grain to the grain boundary because
of microsegregation making the problem complex. The alloy is fully homogenized when
the interdendritic volume of remnant η, S and T phases is minimized and numerous fine
Al3Zr dispersoids precipitate across the grain.

10
Homogenization is a costly affair as the sluggish nature of these phase
transformations requires a large amount of time2,10. For example, homogenization times
for a given SDAS are underestimated even if the analysis is based on diffusion of Cu, the
slowest diffusing major element10. For a diffusion-controlled phase transformation,
diffusion is the slowest step and the dissolution of the secondary phases occurs before the
Cu distribution across the SDAS becomes uniform. However, this is not the case for
homogenization of some AA7XXX alloys, where an interface reaction rate-controlled
kinetics for the phase transformation of secondary phases may be the rate-limiting
phenomenon. Conversely, precipitation of Al3Zr dispersoids is diffusion controlled and has
been successfully modeled using the Kampmann Wagner Neumann (KWN) approach in
the past18, which predicts nucleation and growth of precipitates based on evolution of
particle size distribution function. In this study a complete homogenization model has been
used to consider both effects.
In the present study, a comprehensive model has been developed to predict
microstructural changes simultaneously occurring at the two different length scales for a
multicomponent Al-Zn-Cu-Mg-Zr alloy system. The phase transformation of η to S phase
and the dissolution of both in the interdendritic regions is modeled using a cellular-
automaton finite volume approach as used for Al-Si-Mg-Fe-Mn alloys, incorporating
interface reaction-controlled kinetics, while the diffusion-controlled Al3Zr precipitation in
the grains is modeled using a finite difference Particle Size Distribution (PSD) model. The
models are coupled together to predict changes in composition profiles in the primary α,
which are gradually levelled by diffusion. The model is validated against experimental
observations from electron microscopy, Energy Dispersive Spectroscopy (EDS), X-Ray

11
Diffraction (XRD) and Differential Scanning Calorimetry (DSC) conducted on as-cast and
homogenized alloy samples. Composition profiles, volume fraction of the interdendritic
phases, dispersoid number density and their radii have been compared. Based on the
numerical results and experiments, an optimized homogenization schedule has been
proposed for AA7050 which compares favorably with optimized experimental schedules
in the literature. The advantage of the current model is that it can also be easily extended
to optimize homogenization schedules for other 7XXX compositions. The numerical
model is discussed in CHAPTER 2 and the study can be found in CHAPTER 4.
This study aims to:
study microstructural changes at both length scales during holding at homogenization
temperature; numerical results are validated through experiments involving EDS, XRD
and DSC;
study the effect of processing parameters (temperature and time) on microstructural
evolution to obtain an optimum multi-stage homogenization schedule that minimizes
time and energy consumption; and
study the effect of composition on microstructure to obtain optimum composition
ranges for minimum homogenization times, minimized recrystallization during
extrusion and improved mechanical properties. The effect of compositions is discussed
in CHAPTER 5.
1.3.3 Study of Reprecipitation of Secondary Phases in Al-Zn-Cu-Mg-Zr alloys during
Post-homogenization Quenching
Post-homogenization quenching is important as larger precipitated particles may
act as nucleation sites for particle-stimulated nucleation of recrystallization, which is

12
undesirable for mechanical properties of the alloy15,16. These particles may also remain
undissolved during preheating and melt during thermo-mechanical processing, affecting
the mechanical properties of the component6. Because 7XXX alloys are quench sensitive,
it is very difficult to control precipitation during cooling after solution heat treatment before
aging (more so at lower cooling rates), which reduces the age hardenability of the alloy by
reducing the solute available for hardening precipitates19.
Owing to the importance of cooling, in this work we aim to do a comprehensive
study of precipitation during cooling over a range of cooling rates relevant to the industrial
practice and a range of compositions belonging to the 7XXX alloys. We choose a numerical
approach in this work first, validating our initial results with experiments (EDS, XRD,
DSC). We have developed a Particle Size Distribution (PSD) based numerical approach to
model precipitation of multiple phases of plate-like morphology during cooling from
homogenization temperature of 7XXX alloys.
Time Temperature Transformation (TTT) and Continuous Cooling Curves (CCC)
for aluminum alloys are difficult to construct using the traditional dilatometric methods
owing to the small volume fraction of precipitates in these alloys. These have been
constructed for some of the 7XXX alloys using resistivity and differential scanning
calorimetry techniques. However, while these curves are necessary to optimize the age
hardening heat treatment of these alloys, they do not exist for AA7050, a commercially
important alloy. In this work, we use our numerical results to predict TTT and CCC for
AA7050.

13
This study aims to:
develop a model to study precipitation of multiple phases during post-homogenization
quenching considering the experimentally observed plate-like morphology;
study the effect of cooling rate on microstructural evolution to obtain an optimum
cooling rate with optimum precipitation to have low flow stress and complete
dissolution of the precipitates during extrusion and solution heat treatment to improve
age-hardenability;
study the effect of composition on microstructure to obtain optimum composition
ranges for improved processability and age-hardenability; and
predict CCC and TTT curves for AA7050 to help optimize the aging heat treatment.
This study has been discussed including the experiments performed to validate the
numerical studies in detail in CHAPTER 6.
1.3.4 Study of Radial Variation of Microstructure after Homogenization across a DC-
Cast AA7050 Billet
The models developed in this work are a part of the larger through-process
modeling effort of the various processing stages for aluminum alloy extrusions such as
casting, homogenization, extrusion and aging, discussed in section 1.1. This involves
multiscale modeling to capture the keylinks among processing, structure and properties of
heat treatable aluminum alloys. It involves modeling across different time and length scales.
This forms the basis for Integrated Computational Material Engineering (ICME). ICME
has been gaining importance in recent times owing to its contributions to enhancing
performance and productivity of materials.20,21
14
This work studies the effect of homogenization heat treatment on the microstructure
across the diameter of a DC-cast AA7050 cylindrical billet. The DC-cast billet has
microstructure and macrosegregation as predicted by the DC casting solidification model
by Fezi et al22. The solidification time as a function of radial positions predicted by this
model and used to find the SDAS from an empirical relationship. These compositions and
SDAS lengths are used as the initial microstructure for the homogenization and cooling
models developed in this work. A heat transfer model for the billet predicts the
temperatures at different radial positions during the heating and cooling cycles. All modes
of heat transfer (conduction within the billets, convection and radiation at the surface) are
considered. This work has been described in detail in CHAPTER 7.
This work is an example for the practical application of the models developed in
this work. The heat treatment process causes a variation of microstructure across the radius
of the billet due first to differences in initial compositions and SDAS which are produced
during casting and also because temperature history is different at different radial positions.
This study aims to:
apply the solidification and homogenization models to a simulated DC-cast AA7050
cylindrical billet;
predict the radial difference in microstructure based on the predictions of the DC-cast
solidification model;
study the effect of homogenization and post-homogenization cooling on microstructure
across the radius; and
design a homogenization heat treatment for the entire billet.

15
This work helps us understand the homogenization heat treatment for 6XXX and
7XXX alloys in a special reference to the phase transformations which occur at different
length and time scales. The study enhances the understanding about the phase
transformations, helping us design improved homogenization heat treatments. The
computational tools developed in this work can be instrumental in prediction of
microstructure during homogenization and post homogenization cooling. The tools are
capable of both qualitative and quantitative prediction of morphology and microstructure.
With modifications, these tools can also be used for prediction of microstructure during
thermomechanical processing and aging heat treatments. The future recommended works
are described in CHAPTER 8.

16
CHAPTER 2. NUMERICAL DESCRIPTION
2.1 Literature Review
Owing to the importance of the homogenization heat treatment, a number of
attempts have been made to study it both experimentally and numerically in a wide variety
of alloy systems. The emphases of these studies are: (i) microstructural evolution –
dissolution, phase transformations, precipitation and the changes they bring to
microstructure and properties; and (ii) transformation kinetics - factors affecting it which
helps in process optimization. With growing advancement in computational capabilities,
numerical modeling is increasingly being used to study homogenization. It is a cost
effective means to gain insights into the factors controlling the kinetics and microstructure
and to help fine-tune the process parameters to optimize the process.
Modeling homogenization requires knowledge of the as-cast microstructure, phase
diagram information of the alloy system, diffusion coefficients, and parameters relating to
nucleation and surface tension. A reasonable knowledge of the phase diagrams restricted
the initial efforts to model homogenization. The initial attempts were basically particle
dissolution based models in binary systems. But with the coming of reasonably accurate
thermodynamic and kinetic databases through CALPHAD based softwares such as
Thermo-CalcTM, the homogenization models today provide more information. This section
is a comprehensive attempt to review works in the past that modeled homogenization,

17
including their predictions and limitations. The numerical techniques used and major
contributions of these studies have been highlighted. We start with the early studies in
binary alloy systems and then move on to studies in multicomponent alloy systems.
2.1.1 Early Studies on Modeling Dissolution and Growth of Particles
Analytical models for particle dissolution in 1D were the first attempts to model
homogenization and related processes such as aging. Aaron23 and Whelan24 produced the
first analytical solutions for particle radius at various times during dissolution based on
super-saturation and diffusivity. Tanzilli and Heckel25 proposed a model for diffusion
controlled, moving interface for spherical, planar and cylindrical geometries of precipitates.
Aaron and Kotler26 and Nolfi et al.27 considered the varying effects of diffusion, interface
reaction and curvature on dissolution or growth kinetics. Tundal and Ryum28 studied the
effect of size distribution of particles on dissolution kinetics in binary alloys and found it
to have a significant effect. Nojiri and Enomoto29 used Green’s function method to model
dissolution kinetics for spherical precipitates and showed that the same method can be used
for growth of non-zero radius particles. This model was used to study the effect of curvature
by Enomoto and Nojiri30 again, who found that the dissolution rate was faster for smaller
precipitates. Sinder and Pelleg31 considered homogenization after dissolution of
precipitates in a planar and spherical geometry and found homogenization to be much
slower for the planar case.
2.2 Studies in Multicomponent Multiphase Systems
Vermolen et al.32 formulated a mathematical model to study dissolution of
stoichiometric Mg2Si particles in Al-Si-Mg alloys. It was a 1D diffusion problem with a
moving boundary, which is also known as a Stefan problem. The model considered a

18
simple geometry but took grain size distribution into consideration. It was assumed that the
concentrations at the interface had a constant solubility product at that temperature. The
evolution of second phase fraction and matrix inhomogeneity with time were studied.
Although lab-scale experimental validation was not done, the homogenization times
predicted matched the industrial practice. In a different study using the same methodology,
a Finite Element model was used to simulate phase transformation of β-AlFeSi to α-
Al(FeMn)Si in Al-Mg-Si alloys17. The interfacial concentrations were determined from
solubility product information from Thermo-CalcTM. The geometry of the computational
domain consisting of the two phases was inspired from experimental observations. The
model could predict the transformed volume fractions up to 50% transformation when
compared to experimental values.
The Alstruc homogenization model33 was developed in 2001 in an attempt to
semiquantitatively estimate microstructural changes in 3XXX, 5XXX, 6XXX wrought
alloys and Al-Si foundry alloys during homogenization and cooling. It has separate sub-
routines for each alloy. The program incorporates a multiparticle model to deal with
particle nucleation, coarsening and growth during heating and cooling cycles and one-
particle dissolution model to deal with dissolution, transformation and spheroidization of
the interdendritic particles during holding. The phase diagram information is incorporated
from sources in literature. The model results compared well with experiments and the
existing discrepancies were attributed to inaccurate phase diagram information.
A diffusion-based 1D model was used to simulate homogenization in binary and
ternary Mg-Al-Zn alloys by Das et al.34 The 1D model consisted of the matrix phase and
the second phase with dissolution occurring at the moving boundary. Local equilibrium

19
was maintained at the interface, based on thermodynamic data from FactSage FTlite
database. The phase fraction evolution for the binary Mg-Al was found to match the
experiments. The model was extended to ternary alloys. The model did not predict phase
transformations, precipitation and partial melting at grain boundaries during
homogenization.
Phase field is a widely used methodology to predict microstructural evolution. A
minimization of Gibbs free energy which has an interfacial and chemical component is
used to determine the morphology and the local phase fractions and concentrations.
Warnken et al.35 modeled as-cast microstructure in Ni-based superalloys using phase field
and extended the study to homogenization heat treatment. The free energy and mobility
data was procured from CALPHAD databases published by NIST. A multiphase field
method was used to study phase evolution in as-cast Aluminum alloys by Bottger et al.36
and was extended to homogenization. This model was able to predict evolution of multiple
phases and concentration profiles with time during homogenization.
Eivani et al.37,38 modeled different aspects of homogenization in Al-Zn-Mg alloys
using different models. They predicted the dissolution of Al-Fe-Mn-Si particles through
the Thinning Discontinuation and Full Dissolution mechanism37 and verified the results
experimentally. They considered a diffusion-based 2D model to simulate dissolution of
cylindrical precipitates with round edges and surface perturbations. The volume fractions
and thickness of the precipitates matched well with experiments. However, they found that
the dissolution of the low melting phases was an interface reaction controlled (transfer of
elements across the interface was the slowest step controlling the dissolution rate) rather
than a diffusion controlled process. He calibrated the kinetic coefficient for the interface

20
reaction from the experimental results and was able to reproduce the dissolution rates better
than the diffusion controlled model.
Development of the commercial software, DICTRATM (Diffusion Induced
Transformations), which could simulate diffusion induced transformations in 1D led to
various studies in the field of homogenization of alloys. Samaras and Haidemenopoulos 39
and Haidemenopoulos et al.40 studied homogenization in 6XXX series Aluminum alloys
using DICTRATM which includes multicomponent diffusion. They used composition
profiles after casting as predicted by Thermo-CalcTM, as initial conditions. They could
predict dissolution of Mg2Si and transformation of β-AlFeSi to α-Al(FeMn)Si during
homogenization of these alloys. The transformed volume fractions were compared to
experimental results from Kuijpers et al.17 The model however, underestimated the
homogenization times when compared to experiments which may be because of the 1D
nature of the model.
Many numerical studies have focused on simulation and optimization of the
nucleation of dispersoids4,38,41,42 during homogenization considering the importance of
dispersoids in inhibiting the recrystallization during later thermomechanical processing.
This involves length scales much smaller than that considered for dissolution and phase
transformation simulation. In one of the earlier studies, Robson and Prangnell18 modeled
nucleation, growth and coarsening of the Al3Zr precipitates in AA7050 based on an
approach by Kampmann and Wagner43. The model predicted number densities and
precipitate radii distributions which compared well with the experiments. Based on the
model predictions, they proposed a two-step homogenization process which would
considerably increase the dispersoid number density in low Zr containing areas of the

21
grains and thereby reduce the recrystallized fraction. This practice is currently used in
industrial homogenization of AA7050. A similar model was proposed by Eivani et al.38 for
Al-4.5Zn-1Mg and they were able to make predictions of number densities and radii which
matched experiments. The effect of homogenization temperature, time and Zr composition
was also evaluated.
In a more recent work by Du et al.42, they have coupled numerical models at the
two length scales to predict microstructural evolution in Al-Mn-Fe-Si alloys during
homogenization. They have used a 1D Pseudo-Front Tracking (PFT) model based on work
by Gandin and Jacot4 to simulate the dissolution of the interdendritic phase and a
Kampmann and Wagner43 approach to model dispersoid nucleation, growth, and
coarsening. Both the models use Thermo-CalcTM. The two models are coupled using the
splitting method adopted by Pope44 in combustion modeling where the spatial distribution
of a component is affected by both rate of reaction such as precipitation or combustion and
change due to mixing such as diffusion or convection. The predicted composition profiles,
volume fraction of the interdendritic phases, size distribution of dispersoids, and width of
the dispersoid free zones at different temperatures compared well with experimental results.
The numerical model of phase nucleation, growth and coarsening in the current
work is derived from the early studies with modifications for a multicomponent system
coupled with Thermo-CalcTM for thermodynamic data. It incorporates the effects of
curvature on the morphology. The microstructural evolution during homogenization occurs
at two different length scales: the coarse interdendritic particles dissolve and transform to
globular intermetallics, while fine dispersoids are precipitated during homogenization and
post-homogenization cooling. These changes are modeled using a cellular automaton finite

22
volume model and a particle size distribution finite difference model, respectively. These
models have been coupled together for the two alloy systems studied.
2.3 Cellular-Automaton Finite Volume Model
The microstructural changes occurring at the grain boundaries where the coarse
interdendritic particles formed during casting dissolve and transform to the more
favourable globular intermetallics are modelled using a cellular automaton finite volume
model. This model simulates:
(i) dissolution of coarse interdendritic paticles;
(ii) transformation to globular interdendritic
(iii) redistribution of alloying elements across the grain through diffusion
The 2D finite volume-cellular automaton model predicts microstructural evolution in a
simple and computationally efficient manner, based on the solidification model of Krane
et al.45 and Shao et al.46, as modified as below for solid-solid phase transformations. The
model predicts multicomponent diffusion-controlled, interface reaction controlled and
mixed controlled dissolution and growth of solid phases depending on local temperature
and curvature.
2.3.1 Growth and Dissolution Algorithm
The computational domain is divided into a uniform Cartesian grid of cells, each of
which is the phase (matrix), β phase, γ phase or an interface including more than one
phase. In each interface cell, the volume fraction of phases β+γ is between 0 and 1, with
the remainder being α-Al. The rejection and absorption of solute near the phase boundaries

23
sets up composition gradients in the α-Al matrix and the multicomponent diffusion of those
elements is found from the solution to the species conservation equations,
𝜕𝐶𝑖
𝜕𝑡= ∑ 𝐷𝑖𝑗
𝑘 [𝜕2𝐶𝑗
𝜕𝑥2+
𝜕2𝐶𝑗
𝜕𝑦2]
𝑗
, (2.1)
in which interaction of different element gradients is modeled with cross diffusion terms (i
≠ j). The diffusion equations (2.1) are discretized using an implicit finite volume method
and solved using Gauss-Siedel with successive over-relaxation47. Each simulation time
step consists of first the growth algorithm followed by the solution of the diffusion equation
(2.1). The grid spacing used was capable of resolving the microstructural features at the
SDAS length scale. This grid size was chosen after calculations at smaller grid sizes
showed no significant dependence on ∆𝑥.
The growth algorithm is different depending on the kinetic rate controlling step
during the phase transformation. Two processes run in series to complete the
transformation: the diffusion of alloying elements across the grain and the exchange of
atoms at the interface of the interdendritic particles. The rate controlling step is the slowest
of the two. The kinetics is diffusion controlled when diffusion across the grains is the
slowest step or the interface reaction rate controlled when exchange of atoms at the
interface is the slowest step.
2.3.1.1 Diffusion Controlled Kinetics
The change in fraction of the precipitate phases is calculated by exchanging solute
with the neighboring cells to keep all phases in interface and neighboring cells at their

24
equilibrium values, as calculated by Thermo-CalcTM and adjusted for interface curvature.
The changes in phase fractions (e.g., Δfβ or Δfγ, which may be positive or negative) are
found from a mass balance of each component, k, before and after the movement of the
phase boundary:
(1 − 𝑓𝛽 − 𝑓𝛾)𝐶𝛼𝑘 + 𝑓𝛽𝐶𝛽
𝑘 + 𝑓𝛾𝐶𝛾𝑘 + ∑ ∑ 𝐶𝑗𝑖
𝑘3𝑗=1
𝑛𝑖=1 = (𝑓𝛽 + ∆𝑓𝛽)𝐶𝛽
𝑘∗ +
(𝑓𝛾 + ∆𝑓𝛾)𝐶𝛾𝑘∗ + (1 − 𝑓𝛽 − 𝑓𝛾 − ∆𝑓𝛽 − ∆𝑓𝛾)𝐶𝛼
𝑘∗ + ∑ ∑ 𝐶𝑖𝑗𝑘∗3
𝑗=1𝑛𝑖=1
(2.2)
∆𝑓𝛽(𝐶𝛽𝑘∗ − 𝐶𝛼
𝑘∗) + ∆𝑓𝛾(𝐶𝛾𝑘∗ − 𝐶𝛼
𝑘∗) = (1 − 𝑓𝛽 − 𝑓𝛾)(𝐶𝛼𝑘 − 𝐶𝛼
𝑘∗)
+𝑓𝛽(𝐶𝛽𝑘 − 𝐶𝛽
𝑘∗) + 𝑓𝛾(𝐶𝛾𝑘 − 𝐶𝛾
𝑘∗) + ∑ ∑(𝐶𝑗𝑖𝑘 − 𝐶𝑗
𝑘∗)
3
𝑗=1
𝑛
𝑖=1
(2.3)
On the right side, the first 3 terms refer to the changes in composition of 3 phases in the
interface cell, while the last term is the rejection or pick-up from n neighboring cells. Each
interface cell is updated with the new volume fractions and phase concentrations and the
solute absorbed or rejected is distributed among the neighboring cells as described in Krane
et al.45 modified for multicomponent and multiphase system.
2.3.1.2 Interface Reaction Rate-controlled Kinetics
The driving force for phase transformations at the interface cell is dissipated by the
diffusional processes or work against “frictional” forces of the interface expressed as48:
∆𝐺𝑑𝑓 = ∆𝐺𝑑𝑖𝑓𝑓 + ∆𝐺𝑓𝑟𝑖𝑐 (2.4)

25
For diffusion controlled phase transformations, the “friction” offered by the interface is
negligible. Diffusion in the matrix is slower than the exchange of atoms at the interface
leading to local equilibrium at the interface. However, for interface reaction rate controlled
phase transformations exchange of atoms at the interface is slower than diffusion in the
matrix leading to off-equilibrium conditions at the interface. The friction at the interface
determines its velocity, expressed as48:
𝑣 = 𝑀∆𝐺𝑓𝑟𝑖𝑐 (2.5)
where, mobility of the interface, M has a dependence on temperature, T similar to diffusion
coefficient.
𝑀 = 𝑀0exp (−𝑄𝑚
𝑅𝑇)
(2.6)
In the present study, phase fraction changes for the precipitate phases (η and S
phases) in the interface cell are calculated with the assumption of both diffusion-controlled
and interface reaction rate-controlled phase transformations. For the latter, ∆𝐺𝑑𝑓 is
calculated from Thermo-CalcTM and the TCAL1 database using the TQ-Interface. For
interface reaction rate controlled process, ∆𝐺𝑑𝑖𝑓𝑓 is assumed to be small compared to
∆𝐺𝑓𝑟𝑖𝑐 leading to the assumption:
∆𝐺𝑑𝑓 ≅ ∆𝐺𝑓𝑟𝑖𝑐 (2.7)
Equation (2.6) is used in (2.4) to calculate the velocity of the different interfaces which for
a 1D case transforms to the phase fraction change for different phases according to:
∆𝑓𝛽/𝛼 =𝑣𝛽/𝛼∆𝑡
∆𝑥
(2.8)

26
The interfaces of different phases are assumed to be parallel to each other and the cell
boundary with their velocities perpendicular to the interfaces. The total volume fraction
change of any given phase, j, is the sum of volume fraction of all other phases transforming
to phase j.
An important aspect of an interface reaction rate controlled process is the off
equilibrium concentrations of the phases at the interface. The precipitate phases are
assumed to be at equilibrium concentrations which seems to be a valid assumption owing
to the limited solubility and very slow diffusivities of intermetallic phases. The
concentration of component k in the 𝛼–Al matrix is calculated by mass conservation of the
component before and after phase change in the interdendritic cell expressed as equation
(2.9) giving the value for the new off equilibrium matrix composition for a 1D case where
cell 1 is the interface cell and cell 2 its neighbor.
[(1 − 𝑓𝛽 − 𝑓𝛾 − ∆𝑓𝛽 − ∆𝑓𝛾)𝐶𝛼𝑘 𝑛𝑒𝑤 + (𝑓𝛽 + ∆𝑓𝛽)𝐶𝛽
𝑘∗ + (𝑓𝛾 + ∆𝑓𝛾)𝐶𝛾𝑘∗] +
𝐶𝛼𝑘 𝑛𝑒𝑤 = [(1 − 𝑓𝛽 − 𝑓𝛾)𝐶𝛼
𝑘 𝑜𝑙𝑑 + 𝑓𝛽𝐶𝛽𝑘 𝑜𝑙𝑑 + 𝑓𝛾𝐶𝛾
𝑘 𝑜𝑙𝑑] + 𝐶𝛼𝑘 𝑛𝑒𝑖𝑔ℎ𝑏𝑜𝑟
(2.9)
𝐶𝛼𝑘 𝑛𝑒𝑤 =
∑ 𝑓𝑗(𝐶𝑗𝑘 𝑜𝑙𝑑 − 𝐶𝑗
𝑘∗)2j=1 + (1 − 𝑓𝛽 − 𝑓𝛾)𝐶𝛼
𝑘 𝑜𝑙𝑑 + 𝐶𝛼𝑘 𝑛𝑒𝑖𝑔ℎ𝑏𝑜𝑟
− ∆𝑓𝛽𝐶𝛽𝑘∗ − ∆𝑓𝛾𝐶𝛾
𝑘∗
2 − 𝑓𝛽 − 𝑓𝛾 − ∆𝑓𝛽 − ∆𝑓𝛾
(2.10)
On both sides of equation (2.9), the first 3 terms denote the solute in three phases in the
interface/interdendritic cell 1; whereas, the fourth term is for the neighboring cell 2.
After the phase fractions from diffusion controlled and interface reaction rate
controlled processes are calculated, they are compared and the smaller of the two is chosen
as the phase fraction change. This assumption is realistic as there is a competition between

27
the thermodynamic driving force leading to equilibrium conditions and the kinetic restraint
offered by the interface which determines the extent of phase change.
In every time step, phase fraction changes are calculated. The amount of solute
rejected or absorbed in the process is distributed in the neighboring cells described by
Krane et al.45 with modifications for multicomponent and multiphase systems. The
concentrations developed at the interface are then levelled by the diffusion process in each
time step.
2.3.2 Thermodynamic and Kinetic Data
Commercial software for thermodynamic calculations (Thermo-CalcTM, using the
TQ-Interface and TCAL1 database) calculates the equilibrium concentrations. Software for
diffusion-controlled phase transformations (DICTRATM) generates diffusion coefficients
of component i in the presence of component j in the α-Al matrix (𝐷𝑖𝑗α−Al) as a function of
temperature using the aluminum-based mobility database (MOBAL2).
𝐷𝑖𝑗α−Al = 𝐷0 exp (−
𝑄𝑑
𝑅𝑇)
(2.11)
The constants, 𝐷0 and Q, are found for each element in the matrix and are listed in
Appendix A. The diffusion coefficients are assumed to be independent of composition over
the range studied. Diffusion coefficients in intermetallic phases are negligible compared to
those in the matrix.
2.3.3 Nucleation Model
The nucleation of α-Al(FeMn)Si on β-AlFeSi needles for Al-Si-Mg-Fe-Mn alloys
is predicted using the model of Thevoz et al.49 This model assumes a continuous, Gaussian

28
distribution of 𝑑𝑁
𝑑(∆𝐺) over possible values of the driving force for nucleation, ∆𝐺, which
depends on supersaturation.
𝑑𝑁
𝑑(∆𝐺)=
𝑁𝑚𝑎𝑥
∆𝐺𝜎√2𝜋𝑒
−[∆𝐺−∆𝐺𝑁
√2∆𝐺𝜎]
2
(2.12)
There exists no reference for the values of nucleation constants for this model for 6XXX
alloys. The value 𝑛𝑚𝑎𝑥 determines the size of the plot of the Gaussian distribution of
dn/d(ΔG) over possible values of the driving force for nucleation and does not affect the
nucleation probability. The driving force, ∆𝐺𝑁 , for transformation of β-AlFeSi to α-
Al(FeMn)Si has been calculated from Thermo-Calc and this value has been used as a
reference around which the values have been varied to match model predictions to the
experimental initial β-AlFeSi to Al(FeMn)Si transformation rates in Kuijpers et al17. The
fitted distribution is defined by its amplitude (𝑛𝑚𝑎𝑥 = 1000), the value of the mean driving
force for nucleation (∆𝐺𝑁 = 8000 J/mole), and the distribution’s standard deviation (∆𝐺𝜎
= 1500 J/mole). A sensitivity test has been performed, and the results vary less as compared
to the variation in the constants as seen in Figure 2.1. The area under the curve in equation
(2.12), represents the cumulative probability for nucleation (n) in the interface cell of
interest as a function of undercooling.
𝑛(∆𝐺) = ∫𝑑𝑛
𝑑(∆𝐺). 𝑑(∆𝐺)
∆𝐺
0
(2.13)

29
Figure 2.1: Sensitivity of constants in the nucleation model
The driving force for nucleation is calculated as a function of local concentration
and temperature in Thermo-CalcTM. This probability of nucleation is compared to a
random number between 0 and 1 to determine if the α-Al(FeMn)Si phase nucleates in a
given interface cell. If nucleation occurs, the volume fraction of the new phase and
composition redistribution is found from the growth algorithm discussed above.
2.3.4 Curvature Model
The equilibrium concentration calculations from the thermodynamic databases do not
account for interface curvature, which does influence morphological evolution. The matrix

30
equilibrium concentration including curvature is calculated using the Thomson-Freundlich
equation50,
𝑙𝑛𝐶𝛼
𝑖∗
𝐶𝛼𝑖
=2𝛾𝜅𝑉𝛽
𝑅𝑇
(2.14)
The calculation of curvature is important as it guides the morphological evolution
of the precipitates. Curvature in equation (2.13) is calculated using the height function
method developed by Cummins et al.51 for Volume Of Fluid (VOF) interfaces. The first
step is the determination of the normal to the phase boundary, as described in Yanke et
al.52 If the normal is more vertical, then a 3×7 array of control volumes around the
interface cell of interest is used to find κ. The curvature of a 2D line can be found from
𝜅 = 𝑑2𝑦
𝑑𝑥2 [1 + (𝑑𝑦
𝑑𝑥)
2
]−3/2
, (2.15)
where the derivatives are approximated by the finite differences
𝑑𝑦
𝑑𝑥=
𝑦(3)−𝑦(1)
2Δ𝑥 and
𝑑2𝑦
𝑑𝑥2 =𝑦(3)−2𝑦(2)+𝑦(1)
Δ𝑥2 . (2.16)
The estimated positions of the interface in each of the three columns (y(i), i =
1,2,3) are used to evaluate the differences in equation (2.16). Examples of these
calculations are found in Figure 2.2. The number in each cell represents the volume
fraction of the different phases which sum to give y-values during curvature calculation.
If the normal is more horizontal, the same procedure is applied to a 7×3 array of cells
where the height function is taken in the x direction in the 3 rows.

31
Figure 2.2: Height function calculations for curvature of center cell in 3X7 array. (a)
microstructure with stray interface: y(1) = 4.35, y(2) = 3.4, y(3) = 2.55. (b)
microstructure with nucleating phase, γ, on an existing phase, β: y(1) = 6.6, y(2) = 4.2,
y(3) = 3.5.
2.3.5 Model Validation
2.3.5.1 1D and 2D Binary Model
The model has been developed in stages starting from a 1D binary two-phase model
and moving on to 2D multicomponent three-phase model. The 1D binary homogenization
model has been validated against the analytical solution53. A 2-phase Al-Al2Cu diffusion
couple is chosen for the validation, where the position of the interface changes due to
difference in equilibrium concentrations of both the phases. The initial and final
concentrations of the two phases and the diffusion coefficient chosen for the validation test
are shown in Figure 2.3(a). A grid dependence study has also been done. (Figure 2.3(b)).
The solutions are found to closely match the analytical solution for grid size of 1×10⁻⁸ m.

32
Also, the binary and ternary models have been validated with well-known transformations
from DICTRA, such as austenite to ferrite.
The 2D validation of the model involved comparing the dissolution rate of a circular
precipitate in a uniform matrix with the approximate solution for smaller times from
Whelan24. A grid size of 10-7 m is used. The analytical and numerical solution for a binary
system is shown in Figure 2.3(d). The numerical solution differs from the analytical
solution by a maximum of 0.2 μm at 10 s.
2.3.5.2 Homogenization of Al-Si-Mg (Ternary) Alloy
Dissolution of Mg2Si during homogenization of a ternary Al-1Si-1.6Mg alloy was
studied for an initial validation of the work. The initial microstructure consisted of a matrix
α-Al phase and a eutectic phase with an aggregate composition of α-Al-Mg2Si eutectic.
The morphology of the initial microstructure is shown in Figure 2.4(a). The
homogenization process is simulated at four different temperatures: 487, 507, 527 and
547 °C. The equilibrium volume percentage of Mg2Si phase predicted by Thermo-CalcTM
at these temperatures are 1.54%, 1.32%, 0.77% and 0.77% respectively. A eutectic
structure treated numerically as one phase with an average composition of 6.4 wt% Si and
10.6 wt % Mg is used. Within the first few seconds, the region with eutectic composition
breaks into globular Mg2Si particles. The spheroidization is very fast owing to the large
compositional differences between the eutectic structure and the equilibrium precipitate
phase. The elongated precipitates are spheroidized with time as observed in Figure 2.4.
The predictions show that microsegregation developed during solidification is
substantially reduced within the first 10-15 min of homogenization as the Mg2Si volume

33
decays exponentially with time (Figure 2.5). This matches experiments by Cai et al.54 The
decay is slower for lower temperatures than at higher temperatures. The dissolution kinetics
curve seems to have 2 stages with different rates. Initially, the dissolution is very rapid
until the equilibrium volume fraction at that temperature is reached. At these early times,
the rate of volume change is governed by large differences between the equilibrium and
existing concentrations of the precipitates. The dissolution rate decreases as the precipitate
dissolution is governed more by curvature and the concentration difference has decreased.
The equilibrium state of the precipitate and the matrix is governed by two factors:
the equilibrium concentrations and the interface curvature. The rate of volume change of
the precipitate phase is governed by diffusion near the interface. After the bulk of the
precipitate and matrix away from the interface reach nearly equilibrium concentrations for
a given temperature, the growth or dissolution of the precipitates is governed primarily by
the curvature effects and larger precipitates grow at the expense of the smaller ones. This
also validates the curvature model as it models the Oswald ripening.
2.3.5.3 Homogenization of Multicomponent Multiphase Alloys
For multicomponent three-phase model, the comparisons with current
transformation rate predictions and the experimental data are found in CHAPTER 3 and 4
for Al-Si-Mg-Fe-Mn and Al-Zn-Cu-Mg-Zr alloys. To illustrate the ability of the model to
maintain shape during curvature-dominated phase transformations, a planar coherent
interface between β-AlFeSi and an α-Al matrix, with a third nucleating phase (α-
Al(FeMn)Si) at the phase boundary, was simulated. This interface remains planar during
dissolution of the β (Figure 2.6). A circular precipitate (θ-Al2Cu) with an incoherent

34
interface to an α-Al matrix remains circular while dissolving. The same results are found
for both cases during growth of the intermetallics.
2.4 Particle Size Distribution Finite Difference Model
During the quenching from the homogenization temperature, microstructural
changes occur at a much finer length scale (1nm-1μm) than the dissolution of the as-cast
structure during homogenization. Modeling the precipitation and growth of dispersoids at
the scale of the secondary arm spacing (10-100μm) would be computationally very
expensive, a particle size distribution based model based on work by Myhr and Grong55
has been developed for two different morphologies: spherical and plate-shaped precipitates
formed during homogenization of the alloys. The various assumptions in the model are:
(i) Precipitates of different phases of pre-assigned morphologies are allowed to
nucleate and with overlapping growth and coarsening stages depending on
supersaturation.
(ii) The interfacial energy is assumed to be constant all around the precipitate.
(iii) The precipitates are assumed to be nucleating heterogeneously on pre-existing
dispersoids and dislocations in the alloy.
(iv) The growth of the precipitates is dependent on the supersaturation of the slowest
diffusing element in the precipitate phase.

35
(a) (b)
(c) (d)
Figure 2.3: (a) Initial (5% for α and 45% for β); final concentrations (3.5% for α and
52.5% for β) and diffusion coefficients (4×10-14 m2/s for both the phases) for the 2 phase
1D binary model validation experiment; (b) Grid dependent solutions for the binary
model and its comparison with the analytical solution; (c) Initial (2% for α and 52.5% for
β); final concentrations (3.5% for α and 52.5% for β) and diffusion coefficients
(9.2×10⁻¹³ m2/s and 9.2×10⁻¹⁶ m2/s for α and β respectively) for the 2 phase 2D binary
model validation experiment. (b) The analytical and numerical solutions for a grid size of
10-7m.

36
Figure 2.4: (a) Initial microstructure; and microstructures after (b) 0.05 s; (c)10 s; (d) 0.5
h; (e) 1 h; (f) 2 h; and (g) 4 h of homogenization at 820 K (547°C). The final volume
fraction is lower than that predicted by Thermo-CalcTM due to curvature effects.

37
Figure 2.5: Simulated dissolution kinetics of the precipitates at different temperatures
from the 2D homogenization model.

38
Figure 2.6: Curvature driven evolution of a dissolving square precipitate (a) initial (b) at
1 hr (β-AlFeSi in α-Al matrix) and of a circular precipitate (c) initial (d) at 1 hr (Al2Cu in
α-Al matrix) .
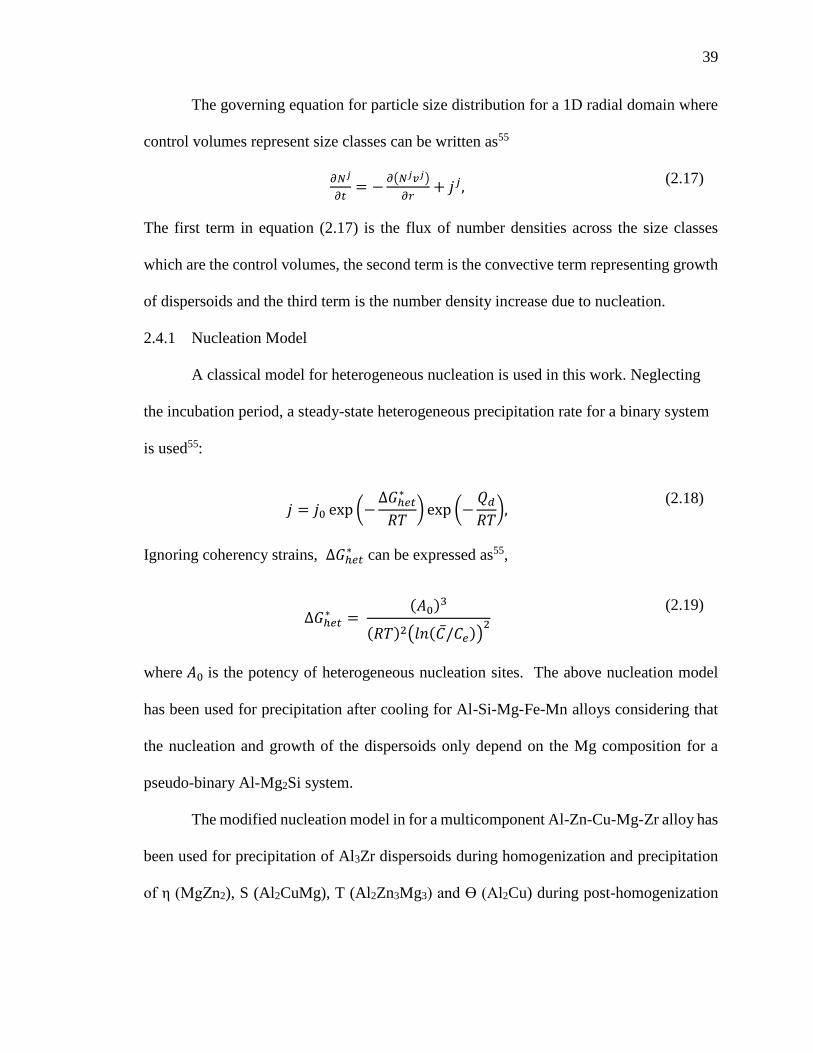
39
The governing equation for particle size distribution for a 1D radial domain where
control volumes represent size classes can be written as55
𝜕𝑁𝑗
𝜕𝑡= −
𝜕(𝑁𝑗𝑣𝑗)
𝜕𝑟+ 𝑗𝑗,
(2.17)
The first term in equation (2.17) is the flux of number densities across the size classes
which are the control volumes, the second term is the convective term representing growth
of dispersoids and the third term is the number density increase due to nucleation.
2.4.1 Nucleation Model
A classical model for heterogeneous nucleation is used in this work. Neglecting
the incubation period, a steady-state heterogeneous precipitation rate for a binary system
is used55:
𝑗 = 𝑗0 exp (−∆𝐺ℎ𝑒𝑡
∗
𝑅𝑇) exp (−
𝑄𝑑
𝑅𝑇),
(2.18)
Ignoring coherency strains, ∆𝐺ℎ𝑒𝑡∗ can be expressed as55,
∆𝐺ℎ𝑒𝑡∗ =
(𝐴0)3
(𝑅𝑇)2(𝑙𝑛(𝐶̅/𝐶𝑒))2
(2.19)
where 𝐴0 is the potency of heterogeneous nucleation sites. The above nucleation model
has been used for precipitation after cooling for Al-Si-Mg-Fe-Mn alloys considering that
the nucleation and growth of the dispersoids only depend on the Mg composition for a
pseudo-binary Al-Mg2Si system.
The modified nucleation model in for a multicomponent Al-Zn-Cu-Mg-Zr alloy has
been used for precipitation of Al3Zr dispersoids during homogenization and precipitation
of η (MgZn2), S (Al2CuMg), T (Al2Zn3Mg3) and Ө (Al2Cu) during post-homogenization

40
cooling. The source term, 𝑗, in eqn. (2.17) is modeled by classical nucleation theory for
heterogeneous nucleation as4:
𝑗 = (𝑁𝑚𝑎𝑥 − 𝑁𝑡𝑜𝑡)𝑍𝛽𝑒𝑥𝑝 [−∆𝐺ℎ𝑜𝑚𝑓(𝜃)
𝑘𝐵𝑇],
(2.20)
where 𝑁𝑚𝑎𝑥 is the number of heterogeneous nucleation sites present in the alloy taken as
1.5×10²¹/m3 which is the estimated number of dislocation intersections, and 𝑁𝑡𝑜𝑡 is the
total number of existing dispersoids. The factor 𝑍, is the Zeldovitch’s factor accounting for
fluctuations in nucleus size due to exchange of atoms between the nucleus and the matrix
𝑍 =∆𝐺𝑁
2
2𝜋𝑉𝐵𝛾3/2√𝑁𝐴𝑣𝑅𝑇. The coefficient 𝛽 in eqn. (2.20) is the rate of transfer of solute atoms
from matrix to the nucleus expressed for a multicomponent alloy as 𝛽 =4𝜋𝑟𝑐
2
𝑎4 𝑀𝑖𝑛(𝐷𝑖𝑥𝑖),
where 𝑟𝑐 is the critical radius of the dispersoids given by 𝑟𝑐 =2𝛾𝑉𝐵
∆𝐺𝑁. In eqn (2.19), ∆𝐺ℎ𝑜𝑚
is given by ∆𝐺ℎ𝑜𝑚 =16𝜋𝛾3𝑉𝐵
2
3∆𝐺𝑁2 . Present work assumes heterogeneous nucleation. The
wetting angle function, 𝑓(𝜃) in eqn. (2.20) is expressed as 𝑓(𝜃) =1
4(2+𝑐𝑜𝑠𝜃)(1−𝑐𝑜𝑠𝜃)2. The
values of the parameters considered in this work have been taken from numerical studies
from Gandin and Jacot in the literature4. The driving force for nucleation in a
multicomponent alloy is calculated as4:
∆𝐺𝑁 = 𝑅𝑇 ∑ 𝑥𝑝𝑖 ln (
𝑥∞𝑖
𝑥𝑚𝑖
)
𝑛
𝑖=1
, (2.21)

41
2.4.2 Growth Model
Growth of the precipitates of phase j of radius r represented by 𝑣𝑗can be expressed as55
𝑣𝑗 =𝑑𝑟
𝑑𝑡=
�̅�−𝐶𝑖𝑗
𝐶𝑝𝑗
−𝐶𝑖𝑗
𝐷𝑖
𝑟,
(2.22)
for spherical precipitates and
𝑣𝑗 =𝑑𝑟
𝑑𝑡=
1
3(
�̅�−𝐶𝑖𝑗
𝐶𝑝𝑗
−𝐶𝑖𝑗
𝐴𝐷𝑖
𝑝𝑡)−1/2,
(2.23)
for plate-shaped precipitates56. That interface concentration, 𝐶𝑖𝑗, is calculated after taking
account of interfacial curvature using the Thomson-Freundlich equation from the
equilibrium composition given by the phase diagram, 𝐶𝑒𝑗. The interfacial concentration for
the spherical50 and plate-shaped precipitates57 can be expressed as:
𝑙𝑛𝐶𝑖
𝑗
𝐶𝑒𝑗
=2𝛾𝑗𝜅𝑉𝑗
𝑅𝑇
(2.24)
and
𝐶𝑖𝑗
𝐶𝑒𝑗
= {1 + (𝐴𝑒𝑞 + 𝐴
𝐴𝑒𝑞)
𝛾𝑗𝑉𝑗
𝑟𝑅𝑇
1 − 𝐶𝑒𝑗
𝐶𝑝𝑗
} (2.25)
respectively.
The driving force for nucleation and the critical nuclei are calculated at each time
step for a given concentration of the alloying elements. Taking into account size
fluctuations58, jj nuclei are added to size class corresponding to 𝑟𝑒𝑓𝑓 = 𝑟𝑐 + 1/2√𝑘𝑩𝑇
𝜋𝛾 as
shown in Figure 3.1(b). The size evolution in time is calculated using equation 2.16 for the
desired homogenization schedules. The control volume size is 1 × 10⁻¹⁰𝑚 and time step
∆𝑡 varies with temperature. The first control volume starts at Δ𝑟/2 and no dispersoids are

42
allowed in the last control volume to allow for the free growth of all the precipitated
dispersoids. The governing equation (2.17) is discretized using an implicit time scheme
and solved at each time step using the Tridiagonal Matrix Algorithm (TDMA)47.
2.4.3 Model Validation
The results of the precipitation model are in good agreement with the experiments
of Sun et al.59 during post-homogenization cooling of Al-Si-Mg-Fe-Mn alloys. Predicted
peaks in dispersoid size distributions from different post-homogenization cooling
conditions (air-cooled, and furnace-cooled) fall in the range of ±0.25 𝜇𝑚 of the
experimental observations (Table 2.1). The mean dispersoid sizes for the different cooling
rates are also compared and are seen to decrease with increasing cooling rates.
The experimental results in CHAPTER 4 (precipitation of Al3Zr dispersoids) and
CHAPTER 5 (precipitation during cooling) also show a reasonable match with the
predicted results for Al-Zn-Cu-Mg-Zr alloys.
Table 2.1: Comparison of the peaks in the dispersoid size number density distributions
from predictions of the current model and the experiments of Sun et al.59
Cooling rate
Numerical peak
dispersoid size
(μm)
Experimental
peak dispersoid
size (μm)
Experimental
mean size
(μm)
Furnace cooled (0.036 °C/s)
(0.036K/s(°C/s))
0.5 0.25 0.19±0.10
Air cooled (0.83°C/s) 0.1 0.25 0.18±0.09
Water quenched (140°C/s)
K/s(°C/s))
0.001 0.2 0.16±0.06

43
2.5 Coupling the Two Models
The models at the grain size or the SDAS length scale is coupled with the model at
the dispersoid size length scale for both the alloy groups studied. While the end
homogenized compositions predicted by one model serves as the initial composition for
the second model to predict precipitation during cooling of Al-Si-Mg-Fe-Mn and Al-Zn-
Cu-Mg-Zr alloys leading to a ‘loose’ coupling, for prediction of precipitation of Al3Zr
dispersoids during homogenization of Al-Zn-Cu-Mg-Zr alloys, both the models are ‘tightly’
coupled as the concentrations predicted by one model is used by the second model and
vice-versa as will also be explained in CHAPTER 4.

44
CHAPTER 3. MICROSTRUCTURAL EVOLUTION DURING HOMOGENIZATION
OF AL-SI-MG-FE-MN ALLOYS
3.1 Introduction
Microstructural evolution during homogenization and quenching of these alloys is
complex, with changes occurring at two length scales:
(1) Secondary dendrite arm spacing (SDAS) length scale (10-100 μm): Dissolution and
phase transformation of needle-like β-AlFeSi into globular α-Al(FeMn)Si (Kuijpers et
al.17), and dissolution of Mg2Si (Cai et al.54) occurs during homogenization. The
evolution depends on the temperature and time of homogenization, composition of the
alloy, and the size of microstructural features in the as-cast alloy.
(2) Dispersoid length scale (1 nm-1 μm): Precipitation of fine, spherical Mg2Si occurs
during post- homogenization quenching (Milkereit et al.8). More Mg left in the α-Al
matrix after precipitation and growth of Mg2Si increases the flow stress during
extrusion, while less Mg decreases the age-hardenability of the alloy after extrusion.
The microstructure at the dispersoid length scale depends on the rate of post-
homogenization cooling and Mg content of the alloy.
Compositions and processing routes leading to easy-to-extrude microstructures are
not obvious. While addition of Mn facilitates the transformation of needle-like β-AlFeSi
into globular α-Al(FeMn)Si3, addition of Mg and Si improves the age-hardenability9 of the
alloy. The β-AlFeSi is difficult to eliminate during casting due to very low solubility of Fe
45
in Al. However, this phase can be controlled by adopting measures during casting discussed
later which affect the relative α-Al(FeMn)Si volume fraction and β-AlFeSi needle
thickness. To what extent these features affect the time taken for homogenization when
transformation from β-AlFeSi to α-Al(FeMn)Si is complete is examined here.
Homogenization of these alloys has been studied with both experiments and
numerical models in the past. Birol60–62 optimized the homogenization schedule for 6063,
6005 and 6060 by examining experimentally the microstructure, conductivity, and
microhardness of these alloys. He proposed homogenizing long enough to transform all β-
AlFeSi to α-Al(FeMn)Si and cooling the alloy in the range of 100-300ºC/hr, so dispersoids
precipitate fine enough to dissolve during extrusion but remain undissolved during preheat,
increasing extrudability and age hardening potential. The typical extrusion temperatures
are 500-550ºC as compared to the preheat temperatures of 450°C and homogenization
temperatures of 580°C59.
Numerical modeling of homogenization gives insight into transient microstructural
behavior at both length scales, including factors affecting the phase transformations,
allowing better control of the process and alloy chemistry and selection of homogenization
temperature and quench rate to improve the process. Numerical studies by Kuijpers et al.17
and Haidemenopoulos et al.40, simulated homogenization of 6000 series alloys using finite
element modeling and DICTRATM, respectively. While their results predict the trends in
the experiments, the models in Kuijpers et al.17 and Haidemenopoulos et al.40 underpredict
measured homogenization times. Possible approaches to improve agreement are: (i)
consideration of multi-component diffusion; (ii) use of 2D or 3D models; and (iii)

46
consideration of spatial distribution and scale of microstructural features such as thickness
of β-AlFeSi needles.
In the current study, two different models have been used to study microstructural
changes at the two length scales. A 2D finite volume-cellular automaton model simulates
microstructural changes at the SDAS scale during homogenization and the Mg
concentration distribution obtained is used as the starting point for a 1D finite difference
model of precipitation at the dispersoid length scale during post-homogenization cooling.
3.2 Domain Description
Several sets of conditions were used in this study to simulate the effect of
temperature, composition (Fe, Mn, Si), and microstructural features in the as-cast alloy on
kinetics during isothermal homogenization. The baseline conditions for these studies were
a composition of Al-0.83Si-0.7Mg-0.27Fe-0.18Mn (wt %), which falls within the
composition specification of AA6005, and T = 580 oC. The SDAS was taken as 24μm, with
relative α-Al(FeMn)Si volume fraction of 0.10 and a β-AlFeSi plate thickness of 0.4 μm,
all of which fall in the experimental ranges for as-cast AA600563. This baseline condition
consists of needle shaped β-AlFeSi and globular α-Al(FeMn)Si and Mg2Si phases in the
interdendritic region, as seen in Figure 3.1(a). To simulate the evolution of an α-
Al(FeMn)Si seed on a β-AlFeSi needle during homogenization, a hemispherical seed is
added on one of the needles. A composition gradient from the center of the dendrite to the
interdendritic region is assumed, based on Scheil type64 solidification calculated by
Thermo-CalcTM. The grid spacing used was Δx = Δy = 10-7 m, which was capable of
resolving the microstructural features at the SDAS length scale. This grid size was chosen

47
after calculations at smaller grid sizes showed no significant dependence on Δx below 10-
7 m.
The Mg composition across the SDAS is homogenized after holding at the
homogenization temperature, which is used as the initial condition for the precipitation
model during quenching. The numerical domain for the smaller scale precipitation model
is a 1D radial domain where dispersoid size classes are the control volumes as shown in
Figure 3.1(b). The values of all the parameters are taken from Myhr and Grong55, who
simulated precipitation and growth in Al-Si-Mg alloys. The 1D radial domain is discretized
with an implicit finite difference method. The number evolution in the 15000 control
volumes corresponding to different size classes (0.1nm-3μm) is done using the nucleation
and growth models as discussed in CHAPTER 2.
The first variation from the base case was lowering the homogenization temperature
to 540oC and 570oC. The effect of initial alloy composition on homogenization kinetics
was studied in ranges of CSi, CFe, CMn, and CMg which cover the specification of most of
the 6XXX alloys65. The SDAS was taken as 24μm with relative α-Al(FeMn)Si volume
fraction of 0.1 and β-AlFeSi plate thickness of 0.4 μm. Table 3.1 shows the specific
compositions for these cases. The effect of the relative sizes of as-cast microstructural
features on homogenization behavior was also studied for variations of β-AlFeSi plate
thickness and α-Al(FeMn)Si volume fraction. The specific values of these microstructural
features, shown in Table 3.2, fall in the ranges experimentally observed by Sha et al66.

48
(c)
Figure 3.1: (a) Baseline initial microstructure for homogenization models. Colors indicate
the different phases: green β-AlFeSi; orange α-Al(FeMn)Si; cyan Mg2Si; and blue: α-Al
matrix. (b) Baseline initial concentration field, based on non-equilibrium (Scheil)
solidification. (c) The numerical radial domain for the precipitation model showing
nucleation and growth of dispersoids.
Growth of N particles
𝜕𝑁
𝜕𝑡= −
𝜕(𝑁𝑣)
𝜕𝑟+ 𝑆
rn
Nn=0
Nucleation of j particles
If r3<reff<r4 N3 = N3 + j
r1=∆r/2 r2 r3 r4 rn-2 rn-
N1 N2 N3 v

49
The effect of Mg content on the precipitation behavior of Mg2Si during post-
homogenization cooling was studied for Mg composition in the range of 0.5-1.1%. At the
homogenization temperature of 580°C, 0.7% Si is left in the alloy which does not form part
of the of the remnant α-Al(FeMn)Si after holding for 8hrs from the calculations using the
homogenization model for the base case of Al-0.83Si-0.7Mg-0.27Fe-0.18Mn. Thus for the
composition of other elements (Fe and Mn), there is enough Si in the alloy for the entire
range of Mg composition studied here considering Mg to Si ratio in Mg2Si to be 2:1. From
thermodynamic calculations in Thermo-CalcTM, Mg does not form a part of the remnant α-
Al(FeMn)Si and is responsible for the amount of Mg2Si precipitated during post-
homogenization cooling. The cooling rates chosen for the study were 1000, 500, 250and
150°C/hr which includes the industrially practiced cooling rate of 150°C/hr.
Table 3.1: Variation in alloy composition to study its effect on homogenization kinetics
Cases Fe (wt %) Mn (wt %) Si (wt %) Mg (wt %)
Fe1 0.07 0.18 0.83 0.7
Fe2 0.17 0.18 0.83 0.7
Fe3 0.27 0.18 0.83 0.7
Fe4 0.37 0.18 0.83 0.7
Mn1 0.27 0.01 0.83 0.7
Mn2 0.27 0.1 0.83 0.7
Mn3 0.27 0.2 0.83 0.7
Mn4 0.27 0.3 0.83 0.7
Si2 0.27 0.18 0.6 0.7
Si3 0.27 0.18 0.8 0.7
Si4 0.27 0.18 1.2 0.7

50
Table 3.2: Variation in as-cast microstructural features to study their effect on
homogenization times.
Cases SDAS
(μm)
β-AlFeSi
plate
thickness
(μm)
Relative α-Al(FeMn)Si
fraction (%)
Pt1/Ra1 24 0.4 10
Pt2 24 0.5 10
Ra2 24 0.4 30
Ra3 24 0.4 40
3.3 Microstructural Evolution during Homogenization
In this study, two phase transformations are simulated during the homogenization
of the as-cast structure:
(i) Dissolution of Mg2Si and
(ii) Transformation of β-AlFeSi to α-Al(FeMn)Si.
3.3.1 Baseline Behavior of Microstructure
The predicted microstructural evolution during homogenization of the baseline
composition at 580oC can be seen in Figure 3.2. These changes include the complete and
rapid dissolution of globular Mg2Si and the slower growth of globular α-Al(FeMn)Si from
transformation of needle shaped β-AlFeSi and by the coarsening of the existing α-
Al(FeMn)Si, consistent with published measurements by Cai et al.54, Kuijpers63, and
Haidemenopoulos et al.40 The needles of β-AlFeSi dissolve, forming α-Al(FeMn)Si at its
interface with the α-Al. The needles thin and break into smaller needles. During dissolution,
surface perturbations provide nucleation sites for α-Al(FeMn)Si, forming a necklace of
growing precipitates in the interdendritic region. The initial α-Al(FeMn)Si globules
51
coarsen and maintain their shape. These predicted growth of the α-Al(FeMn)Si phase
matches well with the experimental observations of Kuijper et al.17, as seen in Figure 6.
Here the relative volume fraction of α-Al(FeMn)Si is defined as ratio of the volume fraction
of α-Al(FeMn)Si to the total volume fraction of α-Al(FeMn)Si and β-AlFeSi. The
transformation of β-AlFeSi to α-Al(FeMn)Si is complete when the relative volume fraction
reaches 1 which is referred to as the homogenization time. However, removal of
microsegregation in α-Al may require more time.
For a more detailed examination of the microstructural evolution during baseline
homogenization conditions, Figure 3.3 shows more of the transient behavior of the alloy.
Figure 3.3(a) clearly shows two distinct stages of the process. In stage I, there is a rapid
decrease in the β-AlFeSi volume fraction, which dissolves into α-Al matrix and transforms
to α-Al(FeMn)Si. This stage continues until the local excess Mn in the matrix (indicated
by the hump around X = 17-18 μm in Figure 3.3(b)) diffuses away into the matrix or is
consumed by the growing α-Al(FeMn)Si. Once the excess Mn is gone between 25 and 30
minutes, a transition to stage II occurs. By this time, local excess of Fe concentration have
also disappeared, as seen in Figure 3.3(c). In Stage II, the transformation rate is much less
and gradually decreases with time. The dissolution of β-AlFeSi into the α-Al matrix is
complete and the remaining β-AlFeSi transforms to α-Al(FeMn)Si, slowing down the
overall transformation rate.

52
Figure 3.2: Microstructural evolution during homogenization at 580°C, showing only the
-Al(FeMn)Si (in red). (a) Initial microstructure with the position of the β–AlFeSi
needles indicated by white lines; (b) at 10 mins, showing -Al(FeMn)Si nucleation
along the edges of needles of β–AlFeSi; (c) at 1 hour, showing thinning and separation of
β into smaller needles; (d) at 3 hours, showing -Al(FeMn)Si globules forming where
the β dissolved; (e) at 6 hours, showing complete dissolution of β needles; and (f) at 8
hours, showing beads of -Al(FeMn)Si where the two -Al dendrites meet .
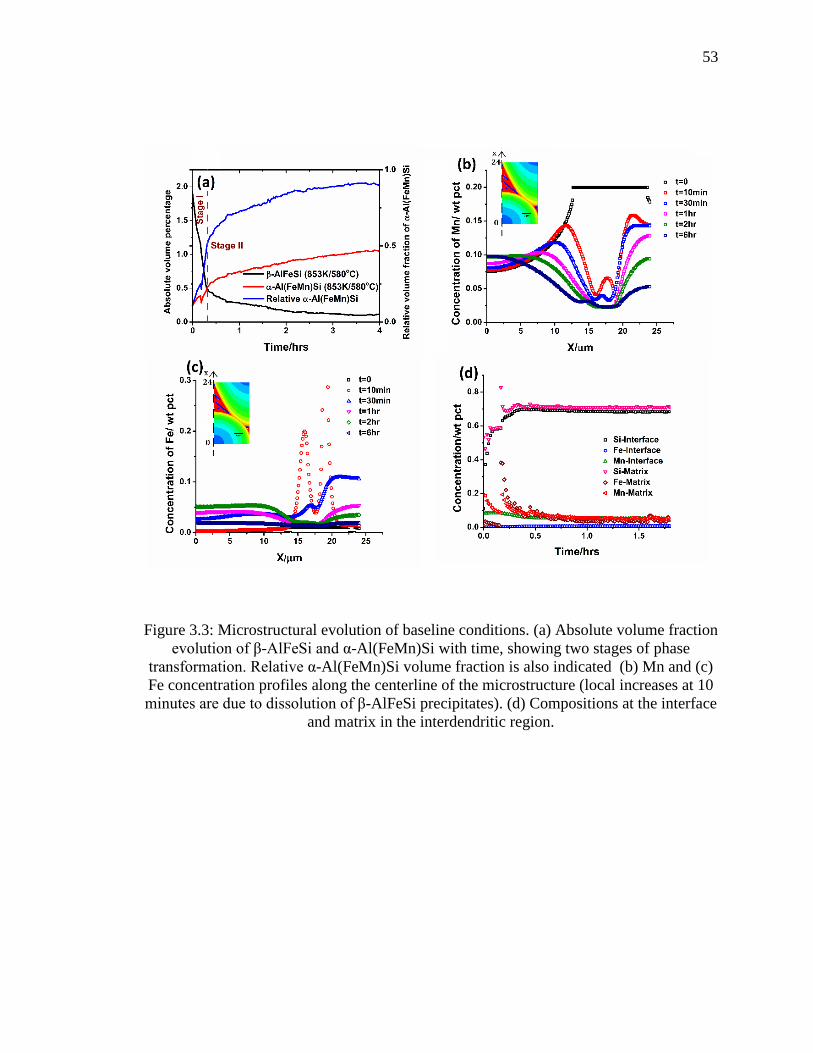
53
Figure 3.3: Microstructural evolution of baseline conditions. (a) Absolute volume fraction
evolution of β-AlFeSi and α-Al(FeMn)Si with time, showing two stages of phase
transformation. Relative α-Al(FeMn)Si volume fraction is also indicated (b) Mn and (c)
Fe concentration profiles along the centerline of the microstructure (local increases at 10
minutes are due to dissolution of β-AlFeSi precipitates). (d) Compositions at the interface
and matrix in the interdendritic region.

54
Figure 3.3(d) shows the transient compositions of Fe, Mn, and Si in the α-Al matrix,
both at the interface and in the matrix locally in the interdendritic region. The fast Stage I
transformation rate is driven by the initially large differences in Fe and Mn composition,
while the Si composition is comparatively uniform because of faster Si diffusion.
Discontinuities at 10 minutes are due to dissolution of the nucleated α-Al(FeMn)Si in
partially filled cells when the β-AlFeSi phase dissolves and the partially filled cell is fully
surrounded by α-Al matrix. This is a numerical artifact which can be minimized by using
smaller grid sizes. The Mn and Fe compositions become more uniform around 20 min, at
the transition from Stage I to II, after this time, the slow transformation rate is controlled
by the small difference in Fe. The compositions tend to equilibrium concentrations at
580°C. A similar abrupt decrease in phase transformation rate has also been reported by
McQueen et al.9, which they attributed to site-saturation of nucleation (i.e., nucleation stops
and transformation is driven only by the growth of the existing α-Al(FeMn)Si).
3.3.2 Effect of Temperature
In addition to the baseline at 580°C, the simulations are repeated at 540°C and
570°C, at which temperatures Thermo-CalcTM shows with lower equilibrium α-
Al(FeMn)Si volume fractions and there is a strong temperature dependence of the
homogenization rates. Dissolution of Mg2Si is still fast, but slower at lower temperatures
(15 minutes at 570°C and 42 minutes at 540°C compared to 10 minutes at 580°C, relative
to the β-AlFeSi to α-Al(FeMn)Si transformation, consistent with previous results reported
by Cai et al.54, Kuijper63, and Haidemenopoulos et al.40 The rate of transformation from β-
AlFeSi to α-Al(FeMn)Si is faster at higher temperatures due to increased diffusivities. The
equilibrium volume fraction of β for Al-0.83Si-0.7Mg-0.27Fe-0.18Mn predicted by

55
Thermo-CalcTM at 540°C is very small (0.004%), and zero at higher temperatures. The
equilibrium volume fractions of α-Al(FeMn)Si at these temperatures (540, 570, and 580C)
are 1.42%, 1.38% and 1.36%, marking a slight decrease in the temperature range. As seen
in Figure 3.4, the evolution of relative α-Al(FeMn)Si at all three temperatures matches well
with experiments from Kuijpers et al.17 While equilibrium is not reached after 8h at 540°C
and 570°C, at 580C the volume fraction of β-AlFeSi reaches equilibrium as the relative
volume fraction of α-Al(FeMn)Si approaches 1 in 8 hrs (Fig. 3.4). At higher temperatures
(587°C) incipient melting67 due to the reaction α-Al + β-AlFeSi + Si → L at may be a
problem. The alloy finally melts at 600°C. For better extrudability than the as-cast structure,
all of β-AlFeSi should be eliminated and α-Al(FeMn)Si which cannot be eliminated,
minimized. The globular shapes of the remaining α-Al(FeMn)Si particles enhance hot
ductility and surface finish during extrusion at higher temperatures.
Microstructures predicted by the model after homogenization for 8 hrs at 540°C,
570°C and 580C are compared in Figure 3.5. The 540°C microstructure still has remnants
of the β needles bounded by α-Al(FeMn)Si, while higher temperature microstructures have
the α-Al matrix with mostly α-Al(FeMn)Si globules of various sizes (larger at higher
temperature). In this temperature range (570-580C), the effect of lower temperature over
8 hours is only to slow the transformation rates, as the equilibrium phase volume fractions
are not a strong function of temperature. The phase transformation kinetics predicted by
the model are fitted to the Johnson-Mehl-Avrami equation68,69,
∆𝑓α−Al(FeMn)Si = 1 − exp(−(𝑘𝑡)𝑛), (3.1)

56
Figure 3.4: Comparison of predicted transient relative α-Al(FeMn)Si volume fraction
with measurements of Kuijpers et al17.
Figure 3.5: Morphology of the α-Al(FeMn)Si phase after homogenization of baseline
composition for 8 hours at (a) 540°C, (b) 570°C, and (c) 580°C.
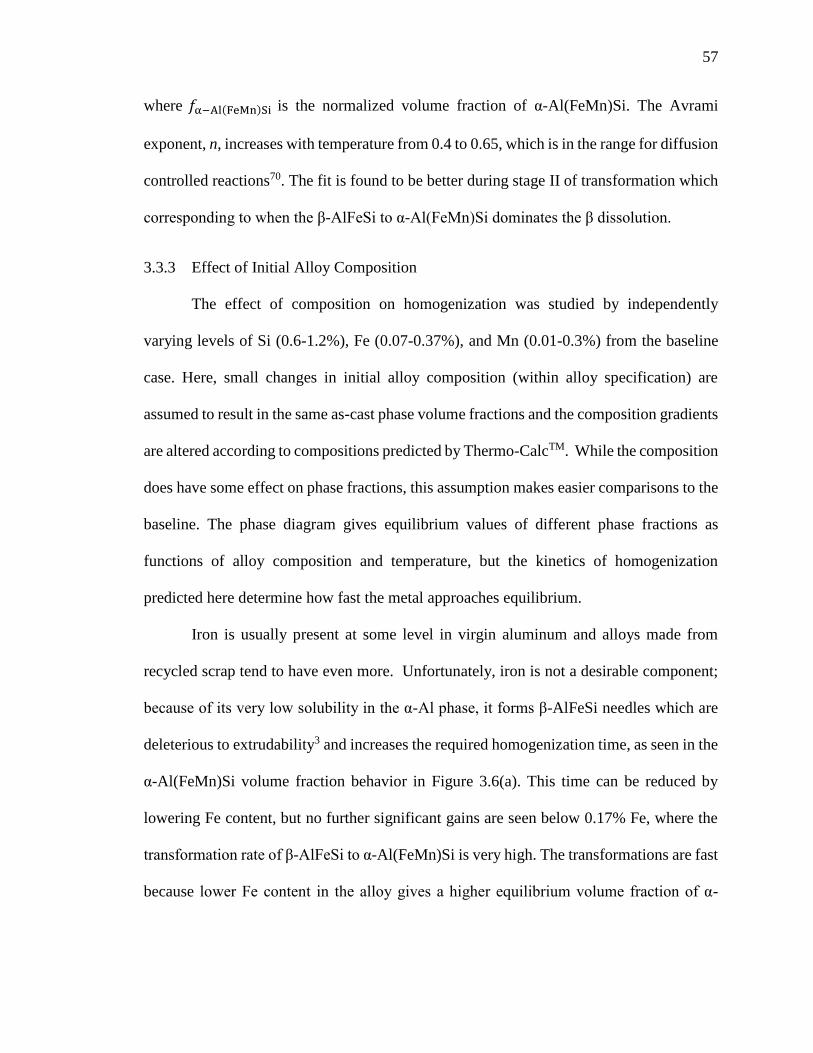
57
where 𝑓α−Al(FeMn)Si is the normalized volume fraction of α-Al(FeMn)Si. The Avrami
exponent, n, increases with temperature from 0.4 to 0.65, which is in the range for diffusion
controlled reactions70. The fit is found to be better during stage II of transformation which
corresponding to when the β-AlFeSi to α-Al(FeMn)Si dominates the β dissolution.
3.3.3 Effect of Initial Alloy Composition
The effect of composition on homogenization was studied by independently
varying levels of Si (0.6-1.2%), Fe (0.07-0.37%), and Mn (0.01-0.3%) from the baseline
case. Here, small changes in initial alloy composition (within alloy specification) are
assumed to result in the same as-cast phase volume fractions and the composition gradients
are altered according to compositions predicted by Thermo-CalcTM. While the composition
does have some effect on phase fractions, this assumption makes easier comparisons to the
baseline. The phase diagram gives equilibrium values of different phase fractions as
functions of alloy composition and temperature, but the kinetics of homogenization
predicted here determine how fast the metal approaches equilibrium.
Iron is usually present at some level in virgin aluminum and alloys made from
recycled scrap tend to have even more. Unfortunately, iron is not a desirable component;
because of its very low solubility in the α-Al phase, it forms β-AlFeSi needles which are
deleterious to extrudability3 and increases the required homogenization time, as seen in the
α-Al(FeMn)Si volume fraction behavior in Figure 3.6(a). This time can be reduced by
lowering Fe content, but no further significant gains are seen below 0.17% Fe, where the
transformation rate of β-AlFeSi to α-Al(FeMn)Si is very high. The transformations are fast
because lower Fe content in the alloy gives a higher equilibrium volume fraction of α-

58
Al(FeMn)Si, hence a higher driving force for transformation. Because iron is almost never
removed from aluminum alloys, some way to mitigate its effect is needed. The addition of
manganese to iron containing aluminum alloys allows the iron to be taken up by globular
α-Al(FeMn)Si instead of the needle shaped β-AlFeSi, a change which improves surface
finish and ductility of the extruded alloys3. It can be seen in Figure 3.6(b) that for low Mn
(~0.01%), a reverse transformation of α-Al(FeMn)Si to β-AlFeSi occurs which is
undesirable. Figure 3.6(b) shows that increasing Mn over the range from 0.1% to 0.3%
has the opposite trend from iron, leading to a considerable decrease in homogenization
time. It should be noted that lower homogenization times for high Mn may be because of
higher equilibrium volume fractions of α-Al(FeMn)Si leading to higher driving force
similar to low Fe cases.
The age hardenability of aluminum is improved by the addition of Si9 and
simulations were run with CSi lower and higher than the baseline. Figure 3.6(c) shows the
lower value of CSi (0.6%) comes to equilibrium faster than the baseline (0.8%) and that
trend reverses at CSi = 1.2%. The increase in Si speeds transformation of β-AlFeSi to α-
Al(FeMn)Si in stage I for Si content from 0.6% to 0.8% and slows it from 0.8% to 1.2%,
due to initial increase and then decrease in equilibrium volume fractions of α-Al(FeMn)Si
with increase in Si content. An increase beyond about 1.2% is not desirable as the alloy
melts at 580°C at these high Si contents.
These predicted trends due to composition variation are valid as long as the
equilibrium phases are only α-Al and α-Al(FeMn)Si; the homogenization model only
simulates those phases. Other phases appear based on composition as seen in Figure 3.7.
If the composition is changed to lower Si, then other, less desirable Fe-bearing phases

59
Figure 3.6: Effect of initial alloy composition on transformation to α-Al(FeMn)Si, or β-
AlFeSi independently varying (a) Fe, (b)Mn, and (c) Si from the baseline.

60
(Al13Fe4) appear, while an increase in silicon content much above the 1.2% shown here
would cause incipient melting above 580oC.
3.3.3.1 Comparison with Phase Diagrams
Figure 3.7 shows the phase diagram information with different phase boundaries
which are affected by the composition of Si, Mn and Fe keeping Mg constant at 0.7%. This
information is acquired from Thermo-CalcTM using the TCAL1 database. Figure 15(a), (b)
and (c) show effect of Si and Mn for increasing Fe compositions of 0.07, 0.27 and 0.37%
respectively.
The phases favorable for extrusion are α-Al(FeMn)Si in α-Al matrix which is the
phase present at higher Si and higher Mn contents. The Al8Fe2Si phase corresponds to the
α-Al(FeMn)Si phase but has a hexagonal crystal structure as opposed to the otherwise
cubic crystal structure. It has been reported for very low Mn contents (<0.01%) by Tanihata
et al.71. This is also a favorable phase which can be attained for a Si composition ~0.6%
and Mn content <0.01%. The phases which are totally undesirable are the Fe containing
Al13Fe4 (Skjerpe72) and β-AlFeSi (AlFe2Si2) (Gorny et al.73) which are plate-like. These
phases are the dominant phases at low Mn, low Si and high Fe contents. Al6Mn is the phase
present at high Mn and low Si contents in the alloy (Bahadur74).
If we compare the results for variation in alloying elements with the phase diagram
information, we find the trends follow the phase diagram as expected. Higher Fe leads to
an expansion of the Al13Fe4 and Al9Fe2Si2 phase regions as can be seen in Figure 3.7(b)
and (c). This is manifested by higher homogenization times from the numerical calculations.

61
=
(a) (b)
(c)
Figure 3.7: Effect of Si and Mn on the stable equilibrium phases at 580°C for Fe contents
of (a) 0.07% (b) 0.27% and (c) 0.37%. The 2 phase regions are separated by 3 phase
regions which are separated by 4 phase regions.

62
The phase boundaries do not change for Fe content <0.2% leads to saturation of
homogenization times at <0.2% Fe.
On the contrary, increase in Mn leads to the α-Al(FeMn)Si + α-Al phase region
manifested by lower homogenization times as seen in the results. However, no gain in
homogenization time is achieved beyond 0.2% as this phase region is retained on any
further increase in Mn content. The phase diagram also reveals that a very small amount of
Mn addition leads to the α-Al(FeMn)Si + α-Al and Al8Fe2Si + α-Al phase regions which
are phases favorable for extrusion.
The favorable Al8Fe2Si + α-Al phase region is attainable at Mn contents as low as
<0.01% for intermediate Si contents of 0.5-0.6%. This phase information is manifested as
an optimum Si range for Mn content <0.2% to achieve microstructure favorable for
extrusion. For higher Mn contents Si content above a specific limit is favorable leading to
the α-Al(FeMn)Si + α-Al phase region. On increasing Si content beyond 0.8%, into the 3
phase region of α-Al(FeMn)Si +β-AlFeSi + α-Al manifested as increase in homogenization
time.
3.3.4 Effect of Initial Microstructural Features
The effect of size of microstructural features on homogenization times was
investigated by independently changing β-AlFeSi needle thickness and relative α-
Al(FeMn)Si volume fraction. The grid size and time step used were the same as in the
baseline study. The test cases for specific variations of microstructural features are shown
in Table 3.2.
Figure 3.8(a) shows the effect of β-AlFeSi needle thickness on α-Al(FeMn)Si
growth, which is faster for the thinner needle thickness. Finer plates of β-AlFeSi can be

63
obtained by faster cooling during solidification75, but this practice may also lead to higher
overall as-cast volume fractions of β-AlFeSi76. Nuclei of α-Al(FeMn)Si form at the
interface of β-AlFeSi and α-Al as β-AlFeSi dissolution occurs there. Finer β-AlFeSi
needles lead to an increase in surface area per unit volume where these phase
transformations can occur.
Initial α-Al(FeMn)Si volume fraction is varied in Figure 3.8(b), where higher levels
(30%, 40%) reach the equilibrium values sooner than the 10% baseline microstructure as
the starting microstructure has α-Al(FeMn)Si volume fraction closer to equilibrium value.
Relative α-Al(FeMn)Si volume fractions depend on growth velocities77,78 and cooling
rates76 during casting over a range of cooling rates found in DC casting and with and
without TiB275 or boron nitride78 grain refiners.
3.4 Microstructural Evolution during Post-homogenization Quenching
The precipitation sequence of Mg2Si during quenching involves independent
clusters of Mg and Si atoms followed by co-clusters and small precipitates. These
precipitates form β″ needle-shaped precipitates which transform to β ′ lath-shaped and rod-
shaped precipitates79. However, this precipitation sequence is not taken into account as it
would involve anisotropic shapes and surface energies. In order to simplify the problem
(flux into and out of the radial control volumes) all the precipitates right from nucleation
are taken as spherical with uniform thermodynamic properties including the surface energy.
The quasi-binary Al-Mg2Si phase diagram is used for tie-line calculation during nucleation
and growth, reducing the complexities introduced in compositions of clusters and other
metastable phases.

64
Figure 3.8: Effect of variation in size of microstructural features on homogenization
times: (a) β-AlFeSi plate thickness and (b) relative α-Al(FeMn)Si volume fraction.

65
3.4.1 Behavior of Microstructure during Quenching from the Homogenization
Temperature
Precipitation of Mg2Si dispersoids occurs in two stages during post-
homogenization cooling. The first precipitation occurs in the temperature range of 400-
420°C and the second precipitation occurs at temperature range of 200-320°C as seen in
Figure 3.9(a). The first precipitation stage was also reported by Birol80. However, he did
not observe the second precipitation stage which can explained by the fact that very small
clusters of Mg2Si are nucleated during the second stage causing a little change in the Mg
concentration in the matrix or volume fraction of Mg2Si as can be seen in Figure 3.9(c) and
(d). The estimation of the nucleation stages by Birol80 were done on the basis of
conductivity which seems to be unaffected by this nucleation stage.
The two nucleation stages result in a bimodal distribution of the dispersoid number
density with the size of precipitates. The bimodal distribution is explained by diffusion of
Mg and Si during the quench. Once the initial nucleation of Mg2Si due to supersaturation
occurs, it grows by diffusion enabled by the availability of Mg and Si from the nearby
matrix. As these precipitates grow, there is a swift decrease in Mg near them in the matrix
leading to an increase in the free energy needed for nucleation and decrease in the
nucleation rate. At lower temperatures, however, the equilibrium Mg concentration of the
matrix phase decreases drastically increasing its supersaturation level and causing the
precipitation of a new batch of Mg2Si. These precipitates cannot grow as fast as the early
group because the temperature is too low for significant diffusion.
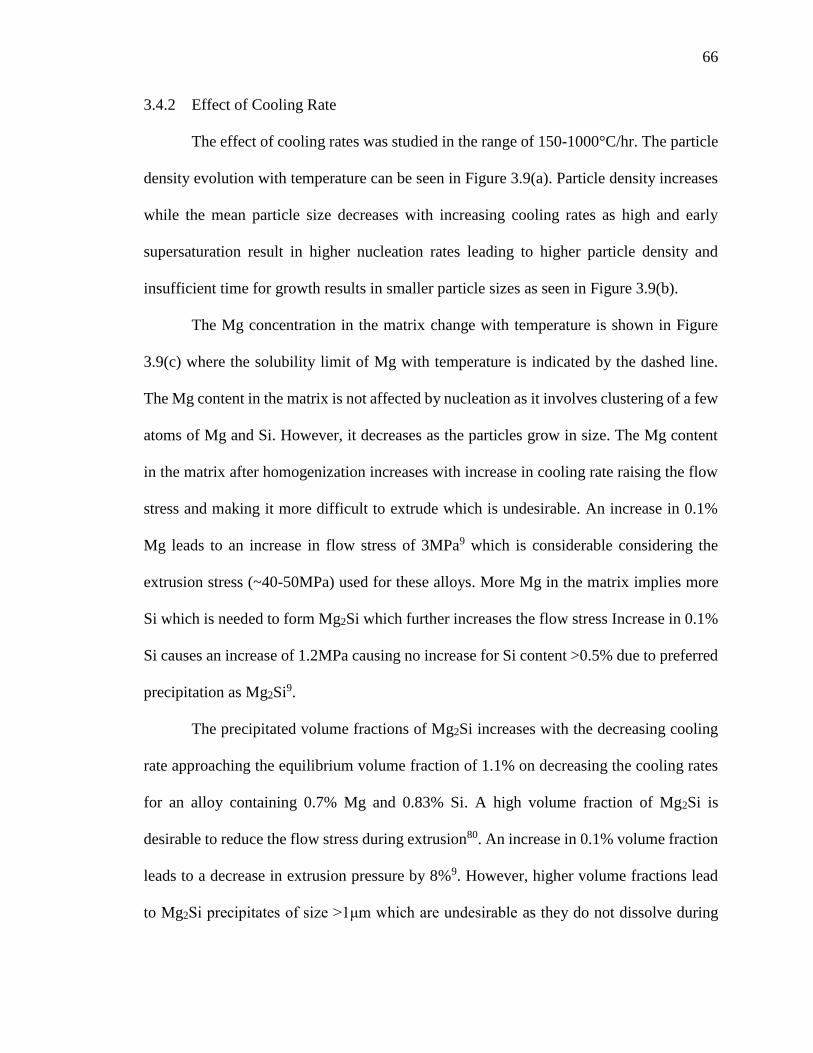
66
3.4.2 Effect of Cooling Rate
The effect of cooling rates was studied in the range of 150-1000°C/hr. The particle
density evolution with temperature can be seen in Figure 3.9(a). Particle density increases
while the mean particle size decreases with increasing cooling rates as high and early
supersaturation result in higher nucleation rates leading to higher particle density and
insufficient time for growth results in smaller particle sizes as seen in Figure 3.9(b).
The Mg concentration in the matrix change with temperature is shown in Figure
3.9(c) where the solubility limit of Mg with temperature is indicated by the dashed line.
The Mg content in the matrix is not affected by nucleation as it involves clustering of a few
atoms of Mg and Si. However, it decreases as the particles grow in size. The Mg content
in the matrix after homogenization increases with increase in cooling rate raising the flow
stress and making it more difficult to extrude which is undesirable. An increase in 0.1%
Mg leads to an increase in flow stress of 3MPa9 which is considerable considering the
extrusion stress (~40-50MPa) used for these alloys. More Mg in the matrix implies more
Si which is needed to form Mg2Si which further increases the flow stress Increase in 0.1%
Si causes an increase of 1.2MPa causing no increase for Si content >0.5% due to preferred
precipitation as Mg2Si9.
The precipitated volume fractions of Mg2Si increases with the decreasing cooling
rate approaching the equilibrium volume fraction of 1.1% on decreasing the cooling rates
for an alloy containing 0.7% Mg and 0.83% Si. A high volume fraction of Mg2Si is
desirable to reduce the flow stress during extrusion80. An increase in 0.1% volume fraction
leads to a decrease in extrusion pressure by 8%9. However, higher volume fractions lead
to Mg2Si precipitates of size >1μm which are undesirable as they do not dissolve during

67
extrusion at typical preheat 450ºC and extrusion temperatures of 500-550ºC and decrease
the age-hardenability of the alloy leading to lower alloy strength59. Lower cooling rates of
~250°C/hr are preferable that lead to Mg2Si particles <1 μm in diameter but not all in the
nm range which keep the flow stress of the alloy in control and dissolves during extrusion
making Mg and Si available for age-hardening reactions during later processing stages.
An estimation of the temperature distribution from the center to the surface of a
cooling billet would help understand the variation in microstructure in the billet during
cooling. Johannes and Jowett81 have done an estimation of the temperature distributions
for finite lengths and diameters of billet on air cooling from 450°C considering a heat
transfer coefficient for air of 14W/m2K and all modes of heat transfer, conduction in the
billet, convection and radiation at the surface of the billet. According to Johannes and
Jowett81 the cooling rates at the edge and at a distance >60cm from the edge of a cylindrical
billet of diameter 5cm are 960°C/hr and 690°C/hr respectively and for a diameter of 40cm
the cooling rates at the edge and >40cm from edge are 420°C/hr and 120°C/hr respectively.
Also the initial cooling rate at the center and the surface of a billet of infinite length are
600°C/hr and 480°C/hr respectively for a billet 5cm in diameter and 60°C/hr and 180 °C/hr
respectively for a billet 40cm in diameter.
The variation in cooling rate can cause variations in Mg present in the matrix after
precipitation, size and volume fraction of the dispersoids more so along the length of the
billets than in the radial direction.

68
(a) (b)
(c) (d)
Figure 3.9: Effect of cooling rates on evolution of (a) particle density, (b) particle size
distribution, (c) matrix Mg concentration, and (d) Mg2Si volume fraction.

69
3.4.3 Effect of Initial Mg Composition
Results in Figure 3.10 were generated by Thermo-CalcTM (TCAL1 database) and
shows the effect of Mg content on phase boundaries for the baseline composition. It can be
seen that at temperatures as high as the homogenization temperatures near incipient melting,
only α-Al and α-Al(FeMn)Si are present for the entire Mg range studied. However, at lower
temperatures, other phases including β-AlFeSi, Q, Si and Mg2Si can form depending upon
the Mg content of the alloy. These phases dissolve during high temperature
homogenization, and upon subsequent cooling there is a strong driving force for (primarily)
Mg2Si precipitation8. The other phases may also precipitate but have been neglected in the
following discussion.
The presence of Mg does not affect the volume fractions of α-Al(FeMn)Si or β-
AlFeSi during homogenization but is mainly responsible for precipitation of Mg2Si during
post-homogenization cooling. Figure 3.11(a) shows the effect of Mg on the evolution of
Mg2Si particle density during cooling at a rate of 250°C/hr, from the homogenization
temperature of 580°C.
Precipitation starts at temperatures below 500°C being lower for lesser Mg contents
due to lower supersaturation levels (lower solvus temperature). Figure 3.11(b) shows the
final particle density distribution with particle size for different Mg concentrations. It can
be seen that one of the particle sizes corresponding to the highest number density lies in
the nm range while the other lies in the μm range. The particle size in the μm range
increases with increase in Mg content because of early nucleation. The amount of Mg in

70
Figure 3.10: Effect of Mg on phase boundaries for the baseline composition, Phase
regions A: α-Al+α-Al(FeMn)Si+β-AlFeSi+Q; B: α-Al+ α-Al(FeMn)Si+ β-AlFeSi+Q+Si;
C: α -Al+ α-Al(FeMn)Si+ β-AlFeSi+Q+Mg₂Si; D: α-Al+α-Al(FeMn)Si+Mg₂Si; E: α -
Al+α-Al(FeMn)Si+Liquid
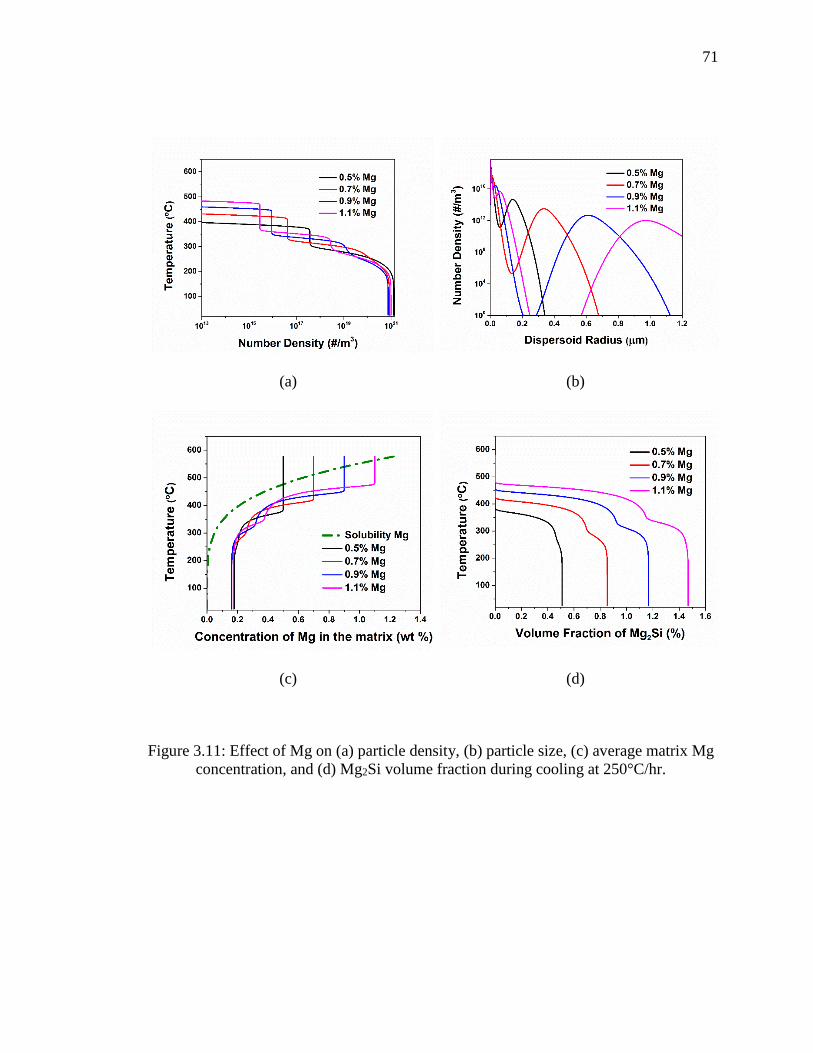
71
Figure 3.11: Effect of Mg on (a) particle density, (b) particle size, (c) average matrix Mg
concentration, and (d) Mg2Si volume fraction during cooling at 250°C/hr.
(a) (b)
(c) (d)

72
the matrix which determines the flow stress during extrusion seems to be minimally
affected by the Mg composition of the alloy as can be seen in Figure 3.11(c) as the excess
Mg in the alloy is used up in formation of larger volume fractions of Mg2Si as seen in
Figure 3.11(d).
The Mg content in the alloy does not seem to affect the amount of Mg left in the
matrix. It may however affect the amount of Si left in the matrix after precipitation of
Mg2Si, which may affect the flow stress during extrusion9. Also very high Mg content can
lead to dispersoids > 1μm in size which are difficult to dissolve during pre-heat before
extrusion which are undesirable as they remain undissolved during pre-heat and hamper
the age-hardenability of the alloy. Finally, the Mg/Si ratios in the 6XXX series alloys
(typically >1.73)82 are specified to optimize the final aging response, and this constraint
must also be considered when selecting the Mg concentration for improved extrudability.
3.5 Process Recommendations
Homogenization at temperatures lower than 580°C requires longer times and ends
with higher volume fractions of β-AlFeSi and α-Al(FeMn)Si. Homogenization at higher
temperatures would further reduce the α-Al(FeMn)Si volume fractions and time required,
but causes local incipient melting. Homogenization at 580°C for 8 hrs eliminates all of β-
AlFeSi which transforms into globular α-Al(FeMn)Si. The final microstructure should
have good ductility and not affect the extrudate surface finish.
Cooling at rates higher than 250°C/hr leads to smaller volume fraction Mg2Si
dispersoids less than 1 μm, which dissolve in the α-Al matrix during preheat before
extrusion and thus increase the extrusion flow stress. On the other hand, lower cooling rates

73
lead to larger volume fractions of Mg2Si dispersoids greater than 1μm. In this case, the
flow stress is lower, but the Mg2Si is difficult to dissolve during preheat, leaving less Mg
and Si in the matrix to feed age hardening. The suggested cooling rate while improve the
extrudability compared to the industrial cooling practice.
Using these results, homogenization at a temperature of 580°C for 8hrs and cooling
at 250°C/hr are suggested for Al-0.83Si-0.7Mg-0.27Fe-0.18Mn alloy. For further
improvement, this composition can be modified to CFe < 0.17, CMn > 0.2, and CSi between
0.6 and 0.8, producing to a microstructure with no β-AlFeSi needles after homogenization
for 8 hrs at 580°C. On the other hand, 0.5-0.7% Mg can produce Mg2Si dispersoids which
are <1 μm, with only a slight effect on extrusion flow stress. (All of these changes are still
in the specification range for 6XXX series alloys.) These intermediate ranges of Si and
Mg can be practiced in the industry for easily homogenizable and extrudable
microstructures. Finally, homogenization time can also be decreased by refining the as-cast
structure by higher solidification rates and the use of grain refiners78.
3.6 Conclusion
Numerical models have been developed to study the microstructural evolution at
the SDAS and dispersoid length scales during homogenization and post-homogenization
quenching of Al-Si-Mg-Fe-Mn alloys. The models are able to predict microstructures
which match experiments well. The needle-like β-AlFeSi in the as-cast microstructure
transform into globular α-Al(FeMn)Si during homogenization, while Mg2Si dispersoids
precipitate during post-homogenization. These phase transformations are diffusion
controlled processes. While Fe and Mn composition differences between the matrix and
phase interface drive the initial stage of the homogenization phase transformation, only Fe

74
composition differences influence the later stage. A closer look at the diffusion lengths
(Mn: 1.8 μm; Fe: 6.6 μm; Si: 39 μm for t=0.5 hr) indicates Mn is the slowest diffusing
element which transfers from the matrix to the α-Al(Fe,Mn)Si in Stage I mostly while the
transfer of the next slowest element Fe from the β-AlFeSi to matrix mostly happens in
Stage II. Transfer of Fe from β-AlFeSi to α-Al(Fe,Mn)Si also occurs, in both the stages.
The Mg2Si precipitates during quenching, driven by Mg supersaturation in the matrix.
Alloy compositions and processing conditions likely to give improved extrudability and
age-hardenability are suggested.

75
CHAPTER 4. MICROSTRUCTURAL EVOLUTION DURING HOMOGENIZATION
OF AL-ZN-CU-MG-ZR ALLOYS
4.1 Introduction
Aluminum alloys of Al-Zn-Cu-Mg-Zr (AA7XXX) are commonly used in
aerospace applications due to their high specific strength, good fracture toughness and
corrosion resistance83,84. The combination of properties come from the chemistry of the
alloy and the mechanics of precipitation strengthening. The as-cast alloy consists of the
coarse interdendritic phases which are detrimental to mechanical properties12. The as-cast
coarse particles and microsegregation in the primary α phase are reduced during
homogenization, while precipitation of coherent Al3Zr dispersoids also occurs.
Recrystallization during deformation processing and solution heat treating85 which may
degrade mechanical properties is reduced by the presence of Al3Zr16. Furthermore, large
undissolved particles above a critical size limit may stimulate recrystallization15, and hence
such particles should be eliminated. Thus homogenization involves changes in
microstructure at the grain size (SDAS) and the dispersoid length scales, all of which affect
properties during and after subsequent processing, underlining the importance of this
processing step.
As-cast Al-Zn-Cu-Mg-Zr alloys consist of compositional variants of the η (MgZn2)
or the T (Al2Mg3Zn3) as coarse interdendritic particles which transform to the S phase
(Al2CuMg) during homogenization2,10,86. Jia et al.12 reported nucleation of S phase at edges

76
of the T phase leading to formation of diffusion networks. The η phase and Cu and Mg rich
non equilibrium aluminides transform to S which gradually dissolves on further
homogenization as reported by Deng et al.2 in AA7050. The alloy is fully homogenized
when the interdendritic volume of η, S and T phases is minimized and numerous fine Al3Zr
dispersoids precipitate across the grain.
The processing parameters and compositions which improve the homogenization
treatment and microstructure are complex to pin down to because of the complexities of
the phase transformations occurring. Along with the dissolution and transformation of the
interdendritic particles, the precipitation of Al3Zr dispersoids occurs across the grain,
during homogenization. Numerical modeling of simultaneous phase transformations at
both the length scales makes it easier to study and optimize the process and compositions.
The diffusion based model worked well for the 6XXX series alloys which were
homogenized at high temperatures in the range of 540-580°C. However, homogenization
of 7XXX series alloys is done at lower temperatures of 450-480°C due to low melting
temperature (475°C) of the eutectic. An attempt was made to simulate the η (MgZn2)/ T
(Al2Mg3Zn3) to S (Al2CuMg) phase transformation in 7XXX series alloy similar to the β-
AlFeSi to -Al(FeMn)Si transformation in 6XXX series alloys. The microstructures
predicted by the model resemble the experimentally found microstructures12. Diffusion
networks were observed in the η phase and circular S phase precipitates precipitated out in
the interdendritic regions as can be seen in Figure 4.1(a) and (b). However, the diffusion-
based model predicted homogenization times which were 1 order of magnitude smaller
than that experimentally observed by Fan at al.11 as seen in Figure 4.1(c).
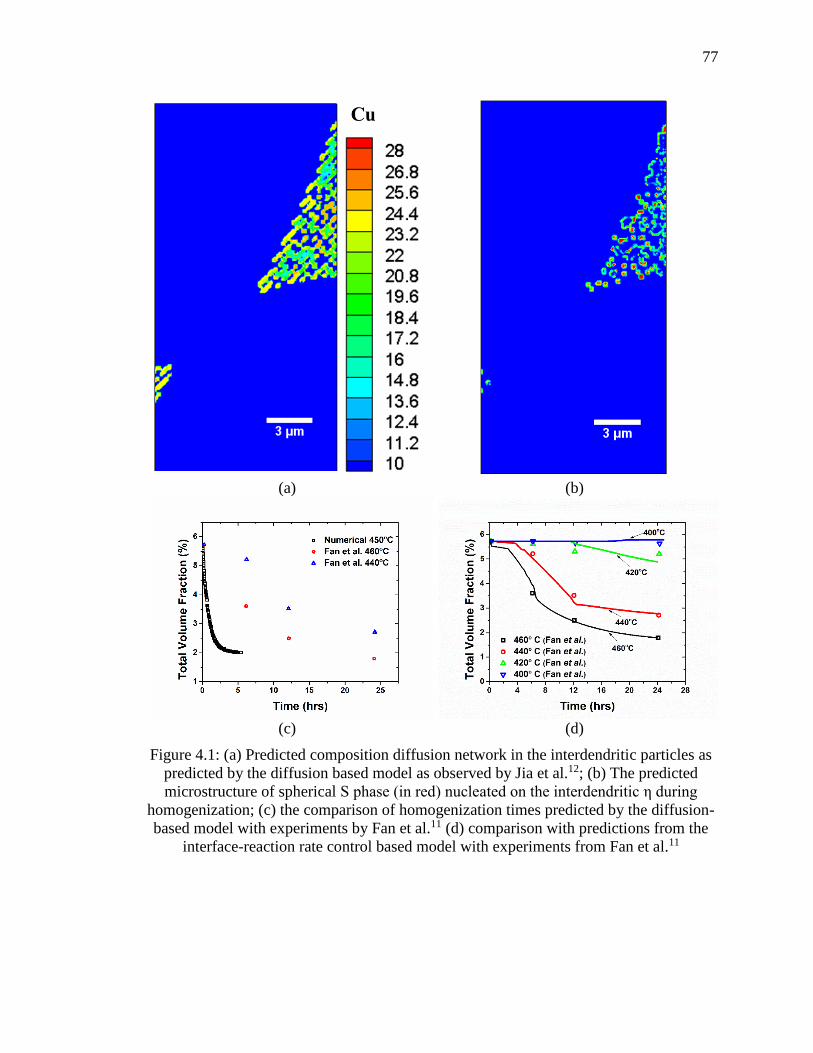
77
(a) (b)
(c) (d)
Figure 4.1: (a) Predicted composition diffusion network in the interdendritic particles as
predicted by the diffusion based model as observed by Jia et al.12; (b) The predicted
microstructure of spherical S phase (in red) nucleated on the interdendritic η during
homogenization; (c) the comparison of homogenization times predicted by the diffusion-
based model with experiments by Fan et al.11 (d) comparison with predictions from the
interface-reaction rate control based model with experiments from Fan et al.11

78
The results from the diffusion based model implied diffusion was not the slowest
step at these temperatures and the transformation was interface reaction controlled where
the transfer of atoms at the interface was slower than their diffusion in the matrix. The
diffusion based model was modified to include the effect of interface mobility on the
evolution of the phases. The interface reaction rate control based model was able to predict
the kinetics well as shown in Figure 4.1(d). This model was coupled with the precipitation
model to get a comprehensive picture of microstructure at both the length scales. This
model was validated against laboratory-scale experiments. The improved homogenization
schedule was proposed.
4.2 Domain Description
The transformation of the interdendritic η and S is modeled using the CA-FV model
discussed in CHAPTER 2. The numerical domain representing half the grain consists of
10 cells (control volumes) with concentrations in each pertaining to Gulliver-Scheil 64
solution during casting predicted as by Thermo-CalcTM. The position of the domain with
respect to an equiaxed grain is represented in Figure 4.2(a). Cell 1 includes the area near
the grain boundary with the interdendritic phases, whereas cell 10 is positioned at the center
of the grain. Cells 2-10 are entirely the α-Al matrix phase, while Cell 1 has the
interdendritic region, including a phase fraction of η + S phases between 0 and 1, with the
remaining being α-Al as shown in Figure 4.2(b).
In every time step, changes in η and S phase fractions are calculated. The amount
of solute rejected or absorbed in the process is distributed in the neighboring cell 2 as
described by Krane et al.45 (In that work, solute was redistributed to only one phase, the
liquid, and here only to the α phase.) The concentration gradient developed at the interface

79
in the interdendritic cell 1 and neighboring cell 2 is levelled by the diffusion process in
each time step. The grid size ∆x=10-6m and ∆t=375s at 480°C.
Transformation and dissolution of the interdendritic phases (η and S) during
homogenization is accompanied by precipitation of nanosized, coherent dispersoids of
metastable L12 Al3Zr throughout the primary α phase. This process is modeled as in Myhr
and Grong55, by calculating the distribution of dispersoid number density (N) over
dispersoid size (r), as shown in Figure 4.3(b). The control volume size is Δr = 10−10𝑚
and time step ∆𝑡𝑠𝑢𝑏 = 75 𝑠 at 480°C. This size distribution tracking is carried out in each
of the 10 cells of the half-grain domain as shown in Figure 4.2(b).
The values of various parameters used by the precipitation model required by the
model are listed in Table 4.1.
Table 4.1: Values of parameters for the precipitation model.
Parameter Value
Molar volume of Al3Zr, 𝑉 10-5 m3/mole
Interfacial energy of α-Al/Al3Zr, γ 0.816 J/m2
Lattice parameter of Al, a 4.08×10⁻¹⁰ m
Number of nucleation sites, Nmax 1.5×10⁻²¹
Wetting angle, θ 45o
4.3 Experimental Procedures
The numerical predictions of the model were compared to experimental observations in as-
cast and homogenized samples. An aluminum alloy (Al-6.2Zn-2.3Cu-2.35Mg-0.13Zr, in

80
(a)
(b)
Figure 4.2: (a) A sample as-cast microstructure with a schematic of the computational
domain superimposed over half an α-Al grain. (b) Schematic of half grain domain
showing coupling of the two models: homogenization model with phase change in cell 1
and diffusion across the grain and precipitation model in each cell in the half grain.

81
(a)
(b)
Figure 4.3: (a) A sample homogenized microstructure showing the Al3Zr dispersoids in
α-Al matrix. (b) Schematic of 1D radial domain showing size distribution of dispersoids
across the radial domain

82
wt%) meeting the commercial specification for AA7050 was induction melted and cast.
High purity starting materials were used to eliminate the presence of Fe-containing
intermetallic phases and were melted and mixed in an argon atmosphere to minimize gas
porosity. The as-cast cylindrical samples (L = 10 cm, D = 2.5 cm) were homogenized on
different schedules in a box furnace and then polished for microscopic characterization
using a FEI XL40 Scanning Electron Microscope and Phenom desktop SEM. Energy
Dispersive X-Ray Spectroscopy was used to determine the presence of secondary phases
and measure the composition at different positions in the α-Al grain. The volume fraction
of the secondary phases at the grain boundary was calculated by analysis of SEM images
using the counting grid technique. The number density and mean radius of the Al3Zr
dispersoids were calculated by image analysis of the SEM images using ImageJ. The 2D
number density (areal) and mean radii was converted to 3D(volume) data using Schwartz-
Saltykov stereological method87. The areal size distribution was divided into small bin sizes,
∆. The volume number density of a particular size class, j, (𝑁𝑉)𝑗 was dependent on ate
areal number density, (𝑁𝐴)𝑖 excluding the contribution to this size class from all the larger
precipitates expressed as:
(𝑁𝑉)𝑗 =1
∆[𝛼𝑖(𝑁𝐴)𝑖 − 𝛼𝑖+1(𝑁𝐴)𝑖+1 − 𝛼𝑖+2(𝑁𝐴)𝑖+2 − … … … … − 𝛼𝑘(𝑁𝐴)𝑘] (4.1)
where, i and j are integer values between 1 to k, k being the total number of bins.
X-Ray Diffraction using a Bruker D8 Diffractometer and Differential Scanning
Calorimetry (DSC) using a TA Instruments Q1000 Differential Scanning Calorimeter were
used to characterize the phases present after each homogenization schedule. The DSC was

83
performed on the as-cast and homogenized samples using Al pans and a heating rate of
30°C/minute in an argon atmosphere.
4.4 Evolution of Microstructure
4.4.1 Initial Microstructure of the Baseline Composition
The numerical model predicts time evolution of volume fraction of interdendritic η
and S phases, composition profiles across the grains, number densities and size
distributions of Al3Zr dispersoids across the grains for different homogenization schedules.
The model is provided with an idealized initial microstructure resembling an as-cast Al-
6.2Zn-2.3Cu-2.35Mg-0.13Zr (wt%) alloy. The 10 μm long domain is a one dimensional
representation of half a grain, with η phase at the grain boundary. This boundary region is
represented by the first cell in the 1D domain and includes both η and α-Al. The
composition distribution of various alloying elements across the α-Al grain was predicted
by Themo-CalcTM, assuming Scheil conditions, and is shown in Fig. 4.4. Zn, Cu and Mg
have partition coefficients less than 1 and thus show a composition increase from center to
the grain boundary, whereas Zr has the opposite trend due to a partition coefficient (kZr)
greater than unity (kZr= 1.4). Real as-cast microstructures of Al-Zn-Cu-Mg-Zr alloys may
sometimes contain S phase in small quantities2, but it has been neglected in the initial
conditions. The composition of the η phase (Laves phases in Thermo-CalcTM) is taken from
predictions by Themo-CalcTM to be Al-41.5 Zn-32.4 Cu-20.7 Mg with a fη = 0.0572 over
the entire domain. (While the stoichiometric composition of η is MgZn2, the phases
calculated in ThermoCalcTM and represented by η, all have the same crystal structure and
wide solid solubility of Zn, Cu, and Mg.)

84
Figure 4.4: Initial composition on the half grain domain, showing the as-cast, Scheil-type
microsegregation predicted by Thermo-CalcTM for Al-6.2Zn-2.3Cu-2.35Mg-0.13Zr.
4.4.2 Comparison of Homogenization Schedules for Precipitation of Al3Zr Dispersoids
Dispersoids of Al3Zr in Al-Zn-Cu-Mg-Zr alloys are important as they pin grain boundaries
and inhibit recrystallization during extrusion and solution heat treatment85.
Recrystallization can be prevented by a sufficient volume fraction of coherent dispersoids,
small enough in size to exert a Zener drag pressure, PZ which can be expressed
mathematically as88:
𝑃𝑍 =1.5𝑓𝛾
𝑟
(4.2)
However, the number density and volume fraction of the dispersoids across the grains is
not uniform due to microsegregation during casting. The Al-Zr system is a peritectic

85
system with partition coefficient for Zr >1 (kZr~1.4), causing lower concentrations of Zr in
regions near the grain boundaries as shown in Figure 4.4. The Zr concentration can be low
enough to cause a dispersoid-free zone in that region. It is difficult to prevent
recrystallization in these dispersoid-free zones16.
The aim of this study is to evaluate homogenization at different temperatures for
different times to determine an optimized homogenization schedule for AA7050 alloy. We
will specifically compare the number densities, mean radius and volume fraction to mean
radius ratios along the length of the SDAS for three schedules: (i) single step
homogenization; (ii) multistep homogenization and (iii) slow heating to the
homogenization. The model is different from previous studies as it includes a
multicomponent model of dispersoid nucleation and growth and considers simultaneous
transformation of the η to S, redistribution of alloying elements, and the nucleation and
growth of the Al3Zr dispersoids leading to realistic nucleation and growth rates and
microstructures.
Three different types of homogenization schedules are evaluated for maximum
number density and minimum dispersoid radius to get f/r ratios above the critical value to
avoid recrystallization. The different test cases that were run are provided in Table 4.2. For
the SSH and TSH schedules, the homogenization temperatures are reached instantaneously
involving no ramp from the room temperature. Same is true for SHH to reach 300°C after
which there is a slow ramp.

86
Table 4.2: Homogenization schedules for different test cases run
Homogenization schedule
SSH1 Single step homogenization at 420°C
SSH2 Single step homogenization at 450°C
SSH3 Single step homogenization at 470°C
SHH1 Slow heating from 300°C to 475°C at 5°/hr followed by homogenization at 470°C
SHH2 Slow heating from 300°C to 475°C at 10°/hr followed by homogenization at 470°C
SHH3 Slow heating from 300°C to 475°C at 20°/hr followed by homogenization at 470°C
TSH1 Two step homogenization: 380°C and 470°C
TSH2 Two step homogenization: 400°C and 470°C
TSH3 Two step homogenization: 420°C and 470°C
4.4.2.1 One-step Homogenization
The most straightforward schedule for 7XXX series alloys is to homogenize at a
single temperature at which the η to S phase transformation and their dissolution is fast.
With these phases melting at temperatures above 475°C, it seems that the alloy should be
heat treated below that temperature for fast elimination of the η and S phases without
forming liquid. Such a homogenization schedule would save both time and cost for the heat
treatment. However, the dispersoids formed near this incipient melting temperature coarsen
very fast, which could be minimized by lowering the homogenization temperature at the
cost of time needed to eliminate the interdendritic phases.
Homogenization at the temperature of 470°C and the lower temperatures (420°C
and 450°C) was simulated. Figure 4.5(a) and (b) show the evolution of number density and

87
(a) (b)
(c)
Figure 4.5: Evolution of (a) number density; (b) mean radius of dispersoids and (c)
remnant volume fraction of secondary phases during single step homogenization at
different temperatures.

88
dispersoid radius with time at these 3 temperatures, respectively. There is a steep increase
in the number density initially which saturates later on. Because of faster diffusion of Zr in
Al at higher temperatures, the saturation is faster. There is little difference in the saturated
number densities at these three temperatures but the mean dispersoid radii are different at
these temperatures. While the growth of dispersoids is very slow at 420°C, it is relatively
rapid at 470°C due to faster diffusion of Zr in Al.
It might seem that lower temperatures are ideal for homogenization as the
dispersoids are smaller in size. However, η to S phase transformation is very sluggish at
lower temperatures. The equilibrium volume fraction of the η and S phases are also higher
at lower temperatures so not all of those are eliminated. While all the η transforms to S at
470°C this is not true at 420°C as seen in Figure 4.5(c). The segregation existing in the as-
cast microstructure also is removed more slowly at lower temperatures.
4.4.2.2 Slow Heating
Because number density evolution is faster and mean radius coarsening is slower
at lower temperatures while elimination of microsegregation and η/S phases is faster at
higher temperatures, slow heating to homogenization temperatures of 470°C seems to be a
viable homogenization schedule which is also more realistically attainable in practice. In
this work three, different ramp rates of 20°/hr, 10°C/hr and 5°/hr are evaluated to form an
industrially acceptable microstructure in a reasonable amount of time.
Figure 4.6(a) and (b) show the evolution of number density and mean radius of
dispersoids with time respectively, at different heating rates between 5-20°C/hr. The
number density increases very slowly initially after which it accelerates until it gradually

89
saturates.Figure 4.6(a) and (b) show the evolution of number density and mean radius of
dispersoids with time respectively, at different heating rates between 5-20°C/hr. The
number density increases very slowly initially after which it accelerates until it gradually
saturates. The initial number density curve is steeper for faster heating rates because of the
rapid increase in temperature. As more time is spent at lower temperatures (400°C-425°C)
where increase in number density is considerable, the number densities at lower heating
rates is higher. It can be seen that the saturated number density at 470°C is higher at lower
heating rates. The mean radius evolution shows a trend different from the number density.
It increases very slowly at low temperatures gradually increases parabolically in the
temperature range 400°C to 450°C and then increases linearly above 450°C to 475°C. The
growth rate is higher at high temperatures owing to higher diffusion leading to very rapid
coarsening of the dispersoids.
While faster heating rate may seem to be an attractive homogenization schedule
option as far as mean radius of dispersoids is concerned, the number densities for the three
cases are comparable. However, we should also keep in mind the time taken to eliminate
the η and S phases. The predicted volume fractions of η and S phases remaining at 470°C
in the alloy are, 4.12% and 0.83%; 2.53% and 1.15%, and 0% and 2.47% at heating rates
of 20°C/hr, 10°C/hr and 5°C/hr respectively. It can be seen that slower heating rates lead
to more transformation of η to S phase, which can be eliminated in a shorter time when
compared to faster heating rates, during holding at 470°C. So an intermediate heating rate
seems to be an answer to having a distribution of fine dispersoids with a high number
density as well as more η to S phase transformation.

90
(a) (b)
Figure 4.6: Evolution of (a) number density and (b) mean radius of dispersoids with time
during slow heating from 300°C to 475°C at different heating rates.
4.4.2.3 Two-step Homogenization
To take advantage of the faster nucleation rates at lower temperatures (400-450°C)
and faster η to S phase transformation and dissolution at higher temperatures (450-475°C),
it would be useful to evaluate a two-step homogenization treatment schedule, consisting of
a lower temperature stage for dispersoid nucleation followed by a higher temperature stage
for interdendritic phase dissolution. Here, we have evaluated 3 homogenization schedules:
(i) holding at 380°C for 35 hours followed by 470°C for 15 hrs; (ii) holding at 400°C for
20 hours followed by 470°C for 15 hrs; and (iii) holding at 420°C for 10 hours followed
by 470°C for 15 hrs.
Figure 4.7(a) and (b) show the time evolution of number density and mean radius
of the dispersoids for the above-mentioned homogenization schedules. The number density
of the dispersoids increases steadily, approaching saturation during the first step. There is
a steep increase in dispersoid production rate at the beginning of the second step. The

91
number density then proceeds towards saturation. The mean radius of the dispersoids show
a similar trend during the first step, however at higher temperatures the mean radius
increases steeply and continues to do so after 10 hrs. Both the number density and mean
radius of the dispersoids during the first step is higher at higher temperatures. However,
there is little difference in the final number density and mean radius of the dispersoids after
the second step at 470°C for 15 hrs.
As there is no difference in the final number density and mean radius after 10 hrs
of holding at 470°C, the factor that differentiates the schedules is the time taken to
eliminate the η and S phases. Most of the S phase dissolves at 470°C, leaving 0.95%, 0.92%
and 0.89% η for first step at 380°C, 400°C and 420°C, respectively. So, holding at 420°C
for the first step seems to be a time and energy saving step due to more η to S phase
transformation.
(a) (b)
Figure 4.7: Evolution of (a) number density and (b) mean radius of dispersoids with time
during two step homogenization.

92
4.4.2.4 Comparison of 𝑓/𝑟 for Different Schedules
To inhibit grain boundary movement and minimize recrystallization, the
dispersoids must exert enough Zener pressure, which is proportional to the volume fraction
and depends inversely on the mean radius of the dispersoids (eqn. 4.2). An optimized
homogenization schedule can be determined after evaluating the Zener pressure by the
precipitated dispersoids. It should however, be kept it mind that there is a variation of Zr
concentration from the center to the edge of the grain leading to variation in volume
fractions and mean radius from the center to the edge of the grain. To be able to evaluate
the best homogenization schedule we should have a look at the 𝑓/𝑟 ratio variation from
the center to the edge of the grain. Figure 4.8(a) shows the variation of 𝑓/𝑟 ratios along the
SDAS for one test case from each homogenization schedule.
Comparison of 𝑓/𝑟 ratios for the three homogenization schedules in Figure 4.8(a)
shows that 𝑓/𝑟 ratios for slow heating and two step homogenization are comparable and
both are better than the single step homogenization. Two step homogenization is slightly
better than slow heating. Two step homogenization provides the best recrystallization
resistance across the grain. It is also the most cost and energy efficient schedule as it takes
less time to remove microsegregation and dissolve the interdendritic phases as seen in
Figure 4.8(b). Next we try to study the two-step homogenization process in detail and try
to improve on it to make time efficient in terms of dissolution of the secondary phases too.
4.4.3 Evolution of Composition Profiles during Homogenization
The composition profiles of Cu across the grain at different times during
homogenization of the as-cast alloy at 450°C predicted by the numerical model and from
the EDS measurements are shown in Figure 4.9. Of the four elements tracked by the model
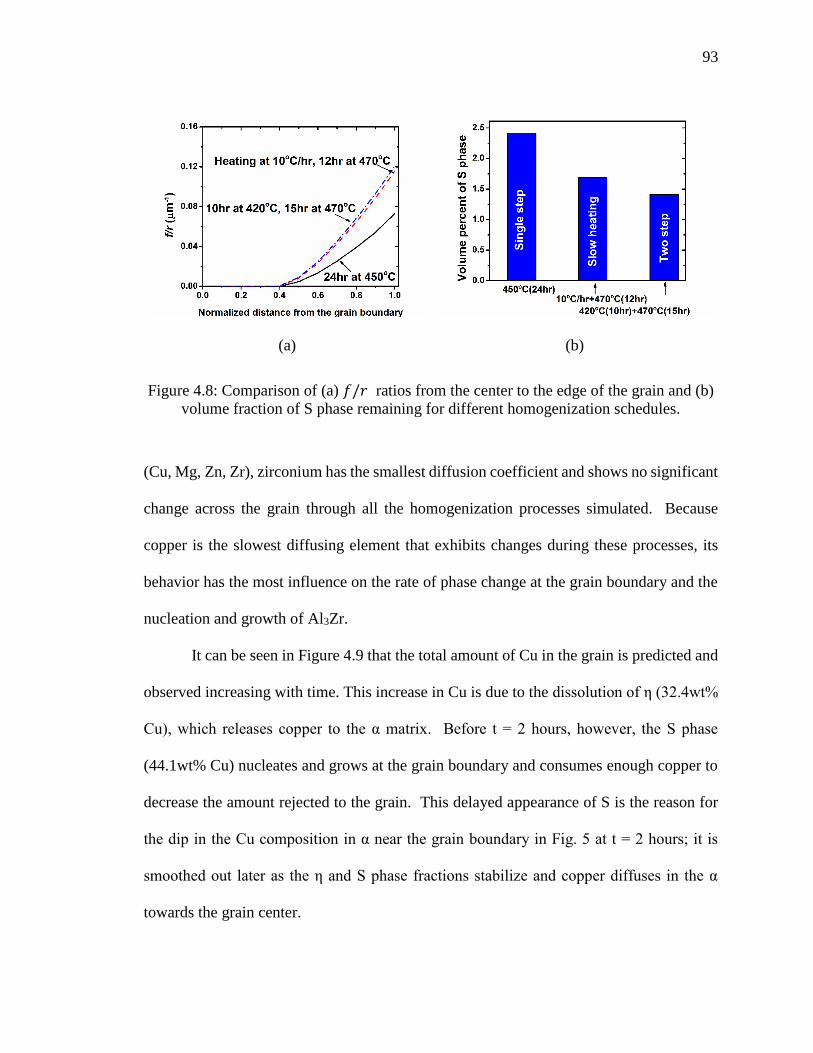
93
(a) (b)
Figure 4.8: Comparison of (a) 𝑓/𝑟 ratios from the center to the edge of the grain and (b)
volume fraction of S phase remaining for different homogenization schedules.
(Cu, Mg, Zn, Zr), zirconium has the smallest diffusion coefficient and shows no significant
change across the grain through all the homogenization processes simulated. Because
copper is the slowest diffusing element that exhibits changes during these processes, its
behavior has the most influence on the rate of phase change at the grain boundary and the
nucleation and growth of Al3Zr.
It can be seen in Figure 4.9 that the total amount of Cu in the grain is predicted and
observed increasing with time. This increase in Cu is due to the dissolution of η (32.4wt%
Cu), which releases copper to the α matrix. Before t = 2 hours, however, the S phase
(44.1wt% Cu) nucleates and grows at the grain boundary and consumes enough copper to
decrease the amount rejected to the grain. This delayed appearance of S is the reason for
the dip in the Cu composition in α near the grain boundary in Fig. 5 at t = 2 hours; it is
smoothed out later as the η and S phase fractions stabilize and copper diffuses in the α
towards the grain center.

94
(a) (b)
Figure 4.9: Composition of Cu along the half SDAS at different times of homogenization
at 450°C (a) predicted by the numerical model (b) measured by EDS.
4.4.4 Microstructural Evolution of Interdendritic Phases during Homogenization
The as-cast Al-6.2Zn-2.3Cu-2.35Mg-0.13Zr (wt%) alloy has a dendritic
microstructure with the interdendritic particles mainly consisting of aluminides with an
EDS-measured average composition Al-16Cu-14.5Zn-15.5Mg (wt%). These aluminides
and their transformation to the S-phase have also been observed by Deng et al2. and are
represented here by the η phase.
Figure 4.10 shows the evolution at 450°C of volume fractions of different phases
with time from the as-cast microstructure predicted by the homogenization model. The
equilibrium microstructure at 450oC includes the α and S phases, but not η (as well as
nanosized Al3Zr discussed in section 4.4.5). The transformation of η to S phase and the
gradual dissolution of both secondary phases to their equilibrium values are observed. The
curves clearly show three distinct stages of phase evolution behavior. The dominating

95
mechanism and kinetics in each stage are different and are discussed in the following
sections.
Figure 4.10: Evolution of predicted and measured volume fraction of secondary phases
during homogenization at 450°C. The equilibrium microstructure contains no η phase.
4.4.4.1 Stage I
During this first stage, there is no change in total volume fraction of the two
secondary phases in the interdendritic region as η transforms to S. Nucleation and growth
of S phase occurs at a high and steady rate until 1.6 hours (Figure 4.10), as it takes Cu from
the α phase and the consumed η. This transformation is modeled as controlled by the

96
interface reaction rate, leading to a linear decay of volume fraction with time. The
interfacial transfer of Cu atoms from η to S is sluggish and is the rate-determining step.
4.4.4.2 Stage II
Stage II commences when the net S growth rate slows. The growth of S comes at
the expense of η (as described above), but, as its volume fraction exceeds the equilibrium
value (seen in Figure 4.10), a diffusion-controlled S ⇒ α reaction begins. This
transformation rate increases as the S fraction increases further from equilibrium,
continually decreasing the net rate of S production. This stage hence has a mixed influence
of both the interface reaction rate and diffusion controlled kinetics. This process continues
until all the η phase disappears at about 11 hours of homogenization at 450°C.
4.4.4.3 Stage III
With the η gone, the third stage consists of diffusion-controlled dissolution of S
into the α-Al matrix, as the S has reached volume fractions above the equilibrium level.
This process continues at ever slower rates. After 26 hours at 450°C, the process is
terminated, as it may take another day of simulation time to approximate equilibrium.
This predicted behavior of the phase volume fractions has also been verified
through XRD and DSC measurements as seen in Figure 4.11. The strongest intensity peaks
for η and S phase lie within 30° < 2θ < 50°. Fig. 5(a) shows η peaks (~35° and 40°-45°) in
the initial as-cast microstructure, but they fade over the first few hours, while the S peaks
begin to appear at 2 hours as stage II commences. A very small quantity of η is detected at
5 hours and none at 12 hours, which either represents a very sluggish dissolution rate at the
end or a reappearance during quenching. The amount of S peaks in the measurement at 12
97
hours (beginning of Stage III), after which it decreases. The strongest peaks in the plot at
2θ = 38.4o and 44.7o are the α phase.
Similar observations are also made using the DSC measurements seen in Figure
4.11(b). The start temperature of the peaks is calculated by drawing tangents where the
peak begins and when the peak is fully developed which intersect at the start temperature.
The exothermic peak starting at 478°C in the DSC plot for the as-cast alloy is likely
associated with the melting of the η phase. A bigger endothermic peak at 487°Cnext to it
is identified to be aluminides with composition of Al-54.4%, Cu-16%, Zn-14.5%, Mg-15.5%
measured by EDS. These aluminides are solid solutions of the η phase. As the alloy is
homogenized, the exothermic peak pertaining to melting of S phase at 489°C can be
identified along with the earlier peak of 478°C at 2 hrs which remains at 5 hours as the
amount of S grows during stages I and II. However, the endothermic peak at 478°C is no
longer seen at 5 hours as all the η dissolves after Stage II. At the same time the exothermic
peak pertaining to the aluminide is replaced by the endothermic peaks by S phase with
composition of Al-56.9%, Mg-23.8% and Cu-19.4% measured by EDS. Because the S
phase dissolves during Stage III, the endothermic peak intensity is low at 26 hours. The
percent η+S volumes from these XRD and DSC measurements are compared to predictions
in Figure 4.10 and show a very good agreement

98
(a)
(b)
Figure 4.11: (a) XRD plots (b) DSC curves of samples as-cast and homogenized at
450°C. The arrows on the DSC plots indicate start of the endothermic peaks for the
corresponding phases.

99
4.4.5 Microstructural Evolution of Al3Zr Dispersoids during Homogenization
During homogenization of Al-Zn-Cu-Mg-Zr alloys, along with the interdendritic
phase transformations and composition diffusion at the grain size length scale,
microstructural changes occur on a smaller length scale. Nanosized Al3Zr dispersoids can
precipitate throughout the matrix, a process in which diffusion is the rate-limiting step and
which has been numerically modeled by Robson89. Their work assumed homogeneous
nucleation (not the more likely heterogeneous), resulting in fewer active nucleation sites
and so lower final number densities and dispersoid radii that have been experimentally
observed. The present model for Al3Zr behavior is based on Robson’s89, except with the
assumption of heterogeneous nucleation and the linkage to the grain scale microstructure
evolution model. The numerical predictions are compared to experimental observations in
Figure 4.12, and the simulation results fall within the experimentally observed ranges. The
initial number of heterogeneous nucleation sites considered in the model has a profound
effect on the predicted number densities and size distributions which causes the deviations
seen in the predicted values from experimental measurements.
The time evolution of number density and mean radius of the dispersoids on
homogenization at 450°C can be seen in Fig. 4.13(a). No direct correlation of the time
evolution with the different stages observed in the evolution of the interdendritic particles
is seen. The number density increases sharply initially and then levels off as the nucleation
sites saturate. The mean radius also increases very quickly at first, but then growth slows
due to decreasing compositional supersaturation.
There is a compositional gradient of Zr in the as-cast alloy due to microsegregation
as seen in Figure 4.4. The composition is highest at the center (0.162%) and it decreases

100
towards the grain boundary (0.004%). The diffusion of Zr in Al is very slow compared to
the other elements and so there is no noticeable change in the Zr distribution across the
grain, even after prolonged homogenization. This Zr variation causes a variation of
microstructure across the grain and so the precipitation kinetics also vary. Fig. 4.13(b) and
(c) show the time evolution of number density and volume fraction at various normalized
positions on the half grain (0 being the edge of the grain and 1 the center). There is a
dispersoid free zone close to the grain boundary, which is detrimental to the alloy’s
mechanical properties, as the Al3Zr inhibits recrystallization during downstream solution
heat treating prior to aging. As the rate of increase of volume fraction and number density
is highest at the grain center, it attains the critical volume fraction to mean radius ratio
required to pin grain boundaries before other positions. This ratio is a measure of the
pinning pressure applied by these dispersoids to inhibit grain boundary motion during
recrystallization. Homogenization for longer durations would be required to precipitate
dispersoids at closer to the grain boundary, but in that time mean values of the older
dispersoids would be much larger.
The number density increases from the grain boundary to the center and a saturation
of all the heterogeneous nucleation sites in the center is observed. As the driving force for
nucleation of Al3Zr is highest at the center of the grain (where the Zr concentration is
highest), the number density there shows the fastest increase. Because of this abundance
of Zr, growth is also faster at the center, giving the highest volume fraction, as seen in
Figure 4.13(c). Figure 4.13(d) shows the dispersoid size distribution at different positions
across the half grain. Again, the higher availability of Zr allows faster nucleation and
growth, and so the distribution of Al3Zr radii is shifted to higher values there.

101
(a) (b)
(c) (d)
Figure 4.12: Secondary Electron images of Al-6.2Zn-2.3Cu-2.35Mg-0.13Zr alloy after
(a) Step I; (b) Step II; (c) Step III; (d) Comparison of numerically predicted and
experimentally observed size distribution of dispersoids after 3 steps of homogenization.
(Step I: 10 hrs at 420 oC; Step II: 4 hrs at 470 oC; Step III: 15 hrs at 480 oC)

102
(a) (b)
(c) (d)
Figure 4.13: (a) Time evolution of mean dispersoid radius and number density during
homogenization at 450°C; Time evolution of (b) number density (c) volume fraction of
the dispersoids at different positions across the grain; (d) Size distribution of the
dispersoids at the different normalized positions across the half grain (1 refers to the grain
center).

103
4.4.6 Effect of Heating Rate on Dispersoids
During the course of the experiments conducted, we found that the heating rate at
the beginning and in between the homogenization stages had a profound effect on the
dispersoid number density and mean radius. Fast heating rates led to dissolution of the
previously formed dispersoids leading to a reduction in number density and coarsening of
the dispersoids. ‘Reversion’ which refers to the dissolution of the precipitated dispersoids
on sudden increase of temperature was responsible for such a phenomenon. Figure 4.14
shows the microstructure of the dispersoids precipitated at heating of the sample at
10°C/min and holding at 420°C for 10 hours. The number density of the sample is 330μm-
3 which is less than the number density when the sample was heated at a much slower
heating rate of 20°C/hr as seen in Figure 4.12 (a). Figure 4.14(b) shows the microstructure
after the next homogenization step at 470°C for 5 hours which was reached at a very fast
heating rate of 1°C/min. The number density of this microstructure was found to be
25.5μm-3 which shows that most of the dispersoids formed in the previous step were
dissolved during faster heating. Coarsening of the dispersoids was also observed as the
mean radius of the dispersoids was calculated to be 25.2 nm as compared to 13.9 nm in the
previous step.
The reversion and coarsening of the dispersoids can be explained on the bases of
the phase diagram. Figure 4.15 shows the schematic of the Al-Al3Zr phase diagram. At a
temperature T0, the concentration of the matrix at the Al-Al3Zr interface is Cp0 for the
matrix composition of Cm0 > Cp0 leading to growth of the dispersoid. On suddenly
increasing the temperature to T1 the matrix composition remains Cm0 while the composition
at the interface becomes Cp1 > Cm0 leading to dissolution of the dispersoids as shown in the

104
schematic in Figure 4.15(b). Due to dissolution, the composition of the matrix increases to
Cm1> Cm0 leading to rapid growth of the dispersoids. Thus fast heating due to this sequence
of procedures leads to dissolution and coarsening of the diapersoids, which was also
reported by Morere et al.85.
(a) (b)
Figure 4.14: Microstructure after (a) heating at 10°C/min to 420°C and holding for 10
hours (b) followed by heating at 1°C/min to 470°C and holding for 5 hours.
4.4.7 Process Recommendations
The findings in this study about the microstructural evolution occurring at the grain
size and dispersoid scales can be used to suggest homogenization schedules which can
minimize time and energy consumption. The end microstructure after homogenization of
Al-Zn-Cu-Mg-Zr alloys ideally is devoid of all secondary phases and should have a
uniform distribution of nanosized coherent Al3Zr dispersoids. The η and S phases are
undesirable because they degrade the mechanical properties and act as nucleation sites for

105
(a)
(b)
Figure 4.15: (a) Schematic of the Al-Al3Zr phase diagram (b) the reversion and
coarsening of the dispersoids on fast heating.

106
recrystallization, while the dispersoids are desired to pin the grain boundaries, inhibiting
recrystallization.
The interdendritic secondary phase η present in the as-cast alloy transforms to the
S phase during homogenization. From DSC measurements, the incipient melting point of
the η phase is 478°C and that of the S phase is 489°C, which agree with literature values2.
To minimize homogenization time without melting the initially present η phase, we need
to homogenize at a temperature close enough to the melting point of η for fast diffusion
but not enough to cause melting. During homogenization, the η dissolves completely in
Step II and the dissolution of S phase continues during Step III, the latter of which can be
sped up by increasing the temperature by 10°C. This increase can be done because melting
point of S phase is 10°C higher than that of dissolved η.
Section 4.4.2 has a detailed study on the precipitation of Al3Zr dispersoids in these
alloys to find a schedule that produces a microstructure with a distribution of Al3Zr
dispersoids across the entire grain with a high volume fraction/mean radius ratio. It was
found that homogenizing these alloys first at a lower temperature (420°C) for 10 hours
leads to precipitation of a nanosized, coherent dispersoids which apply a higher pinning
pressure. This temperature has low enough diffusion and supersaturation needed for
nucleation but not high enough to cause rapid coarsening of the dispersoids. This step can
be followed by homogenization at a higher temperature necessary to dissolve the secondary
phases.
We recommend a three step homogenization for the Al-6.2Zn-2.3Cu-2.35Mg-
0.13Zr alloy (AA7050):

107
(i) Step I: Homogenize at 420°C for 10 hours to precipitate many small Al3Zr
dispersoids, increasing pinning pressure to minimize recrystallization during
later processing;
(ii) Step II: Homogenize at 470°C below the melting point of η, for 4 hours to
transform it to S phase completely; and
(iii) Step III: Homogenize at 480°C below the melting point of S phase for 15 hours
to minimize it.
A slow heating rate of 20°C./hr was chosen to transition between the steps.
Typical experimental microstructures observed after each step can be seen in Figure
4.16(a)-(c). Figure 4.16(d) shows the predicted and observed time evolution of various
phases during the three step homogenization schedule. The observed volume fractions
match the predicted values within the range of experimental uncertainty. Figure 4.17 shows
the DSC curves and XRD spectra for the alloy in the as-cast condition and after each
homogenization step. It can be seen that after Step I the endothermic peak for the S phase
appears and that pertaining to η disappears. The peak corresponding to the aluminides
overlap with the S phase melting after Step I. After Step II, we observe a shift in the
endothermic peak pertaining to S phase melting to higher temperatures, indicating absence
of the aluminides. None of the endothermic peaks are visible after Step III, indicating
complete dissolution of the secondary phases. However, some small amount of S is left
after Step III, which goes undetected in DSC but is visible in the micrographs in Figure
4.16(c). The XRD plots in Fig. 4.17(b) indicate similar trends. While the peaks
corresponding to the S phase (~35°) appear along with those of η after Step I, those

108
(a) (b)
(c) (d)
Figure 4.16: Backscattered Electron micrographs of the Al-6.2Zn-2.3Cu-2.35Mg-0.13Zr
after (a) Step I (white phase is η+S); (b) Step II (white phase is S); (c) Step III(white
phase is S); The grey phase is α-Al.(d) Numerically predicted volume fraction of
secondary phases compared to experiments.

109
(a)
(b)
Figure 4.17: (a) DSC plots and (b) XRD spectra from samples after every step of
homogenization. Curves: (1) as-cast; (2) after 420oC for 10 hours; (3) after (2) + 470oC
for 4 hours; (4) after (3) + 480oC for 15 hours.
400 425 450 475 500
-8
-6
-4
-2
0
S
Aluminides
as-cast
420oC 10hrs
420oC 10hrs+470oC 5hrs
420oC 10hrs+470oC 5hrs+480oC 20hrs
He
at
Flo
w (
a. u
.)
Temperature (oC)
S

110
corresponding to η (close to 38°) disappear after Step II. Only the peaks corresponding to
α-Al can be seen after Step III.
Figure 4.12(d) shows a comparison of experimental and numerical number density
and mean dispersoids sizes after the 3 step homogenization and a reasonable match is seen.
The observed mean radius after Step I is more than the predicted value because the number
density was calculated from image analysis of SEM micrographs with poor contrast at very
small sizes, thereby discounting the smaller structures. Both the number density and mean
radius generally increase after every step.
4.5 Conclusion
A model of coupled phase transformations at two different length scales during
homogenization of Al-Zn-Cu-Mg-Zr alloys has been developed. A CA-FV based model
which simulates elemental diffusion in the grain and microstructural evolution of the
interdendritic η and S phases has been linked to a PSD-based model which simulates
precipitation of Al3Zr dispersoids across the grain, providing a comprehensive picture of
time evolution of microstructure. The sluggish nature of the η to S phase transformation is
attributed to interface-controlled kinetics, which is included in the numerical model using
a novel approach. During homogenization, η transforms to S phase and the remaining S
phase then dissolves to reach the equilibrium volume fraction. While this occurs, the Al3Zr
precipitates and grows, but are mostly found near the grain center which has the highest Zr
concentration in the as-cast microstructure.
Based on the sequence and rates of transformations, a three stage homogenization
schedule is suggested for this alloy. Homogenization at 420°C for 10 hours, followed by
470°C for 4 hrs and 480°C for 15 hours, is seen to produce a microstructure consisting of

111
uniform nanosized dispersoids with maximum pinning pressure and minimum secondary
phases. The suggested homogenization temperatures are 8-9°C below the incipient melting
temperatures of the alloy also indicated by the DSC results. This model can easily be used
for optimizing the homogenization schedules for other 7XXX alloys which will be
discussed in the next chapter. An accurate prediction for the duration of Step II needed to
dissolve the η, helps in making the process time efficient by taking advantage of the faster
diffusion at higher temperatures in Step III.

112
CHAPTER 5. IMPROVED 7XXX COMPOSITIONS FOR EASE OF
HOMOGENIZATION AND EXTRUSION
5.1 Introduction
Compositional variations in Al-Zn-Cu-Mg-Zr alloys have significant effects on the
microstructure after casting and homogenization, which influences the workability and
mechanical properties of these alloys90–94 during extrusion. The varying amounts of
alloying elements lead to stabilization of coarse interdendritic particles13, as well as affect
the distribution of fine dispersoids95 across the secondary dendrite arm spacing (SDAS) or
the grain during homogenization of the as-cast alloys. Thus the alloying elements affect
the microstructure both at the SDAS and the dispersoid length scale.
The composition determines the stable or metastable phases which remain after
processing. The η, T or S phases that remain affects the mechanical properties: strength,
ductility and fracture toughness of the component92,94. While the η and η’ phases are
desirable, T and S are not. The η and η’ precipitates formed during age-hardening of these
alloys, increase the strength and fracture toughness of the alloy92,94. The T and S phases
have low melting temperatures96 which might melt during thermo-mechanical processing.
The S phase is brittle and also affects the fracture toughness of the material97,98.
Increase in the Zn:Mg ratio decreases the amount of T and S phases in the alloy13.
Increasing the Zn also improves the strength of the component94. However, very high
amounts of (Zn+Cu+Mg) make the component quench sensitive13, requiring very high

113
cooling rates to subdue precipitation which may lead to residual stresses99,100 and
deformation which is not uniform. Decreasing the Mg and Cu content decreases the amount
of T phase and S phase both of which are desirable. However, they are needed for age-
hardening precipitation reactions of these alloys101.
Alloying elements in these multi-component alloys also affect the solubility of Zr
in Al, affecting their microsegregation during casting, and nucleation and growth during
homogenization. Because there is a variation of Zr composition across the SDAS which is
not eliminated after homogenization due to its low diffusivity, there is a difference in
microstructure along the SDAS which also depends on the composition of the alloy.
Robson and Prangnell95 have looked at the effect of Zn, Cu and Mg on precipitation of
Al3Zr dispersoids. However, the effect on the initial microsegregation of Zr which in turn
affects the precipitation behavior has not been considered. In this study, we try to evaluate
the microstructure both in the interdendritic regions and across the grains in the as-cast and
homogenized parts, which is affected by variations in compositions.
For ease of homogenization, (i) the initial volume fractions of the interdendritic
fraction should be minimum and (ii) the transformed S phase volume fractions should be
low so that a homogenized structure with a uniform distribution of Al3Zr dispersoids and
minimum S phase in α-Al is achieved in minimum time. For ease of extrusion, (i) S phase
in the homogenized alloy should be minimum (affects hot ductility) and (ii) there should
be a high number density of fine nano-sized Al3Zr dispersoids across the grain (to inhibit
recrystallization). Compositions which lead to these microstructural goals are investigated.
The current study is a comprehensive study of the effect of composition on
microstructure after homogenization at two different length scales. The aim is to achieve a

114
microstructure which is easy to homogenize and extrude. A numerical model which
couples microstructure development in the interdendritic regions involving transformation
of η to S phase, and their subsequent dissolution, with the precipitation of Al3Zr dispersoids
across the SDAS, discussed in CHAPTER 4, has been used here. The initial as-cast
microstructure (interdendritic volume fractions and microsegregation) predicted by
Thermo-CalcTM is used. Microstructural evolution for compositions in the range of the
specification for 7XXX is studied to reach improved composition ranges for better
extrudability, minimum recrystallization and better age-hardenability. Experiments
performed by Sun et al.102 verify the microstructural evolution during homogenization for
a solute rich and solute lean specimen.
Effect of alloying elements Zn, Cu, Mg and Zr on the microstructure after
homogenization at 450°C has been numerically studied. The baseline case was that of Al-
6Zn-2Cu-2Mg-0.13Zr pertaining to AA7050 alloy. The ratios of Zn/Mg in the range of
1.5 to 6 and Zn+Cu+Mg in the range of 8 to 14 wt% have been investigated. The various
compositions that have been investigated numerically into are provided in Table 5.1.
5.2 Effect of Composition on Evolution of Interdendritic Phases
Composition of the alloy affects the phases formed during solidification as well as
the phase transformations during homogenization. It also affects the phases present after
post-homogenization processing: extrusion and age-hardening which will not be discussed
in the current work.
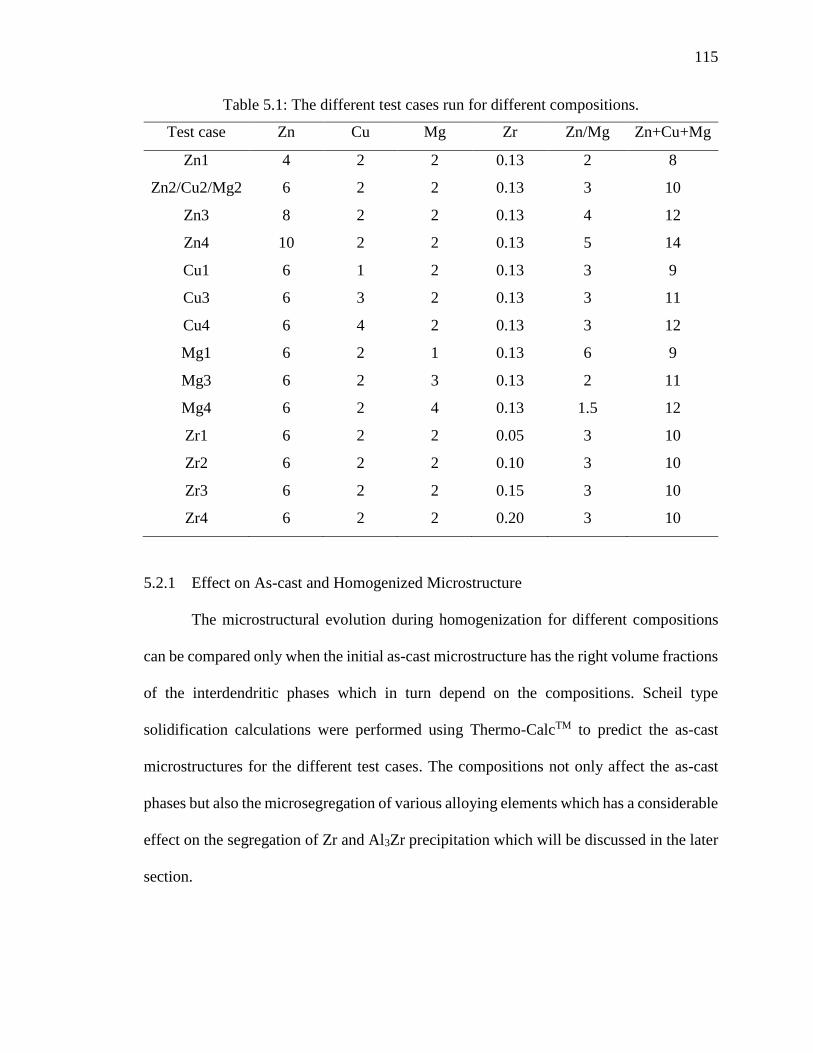
115
Table 5.1: The different test cases run for different compositions.
Test case Zn Cu Mg Zr Zn/Mg Zn+Cu+Mg
Zn1 4 2 2 0.13 2 8
Zn2/Cu2/Mg2 6 2 2 0.13 3 10
Zn3 8 2 2 0.13 4 12
Zn4 10 2 2 0.13 5 14
Cu1 6 1 2 0.13 3 9
Cu3 6 3 2 0.13 3 11
Cu4 6 4 2 0.13 3 12
Mg1 6 2 1 0.13 6 9
Mg3 6 2 3 0.13 2 11
Mg4 6 2 4 0.13 1.5 12
Zr1 6 2 2 0.05 3 10
Zr2 6 2 2 0.10 3 10
Zr3 6 2 2 0.15 3 10
Zr4 6 2 2 0.20 3 10
5.2.1 Effect on As-cast and Homogenized Microstructure
The microstructural evolution during homogenization for different compositions
can be compared only when the initial as-cast microstructure has the right volume fractions
of the interdendritic phases which in turn depend on the compositions. Scheil type
solidification calculations were performed using Thermo-CalcTM to predict the as-cast
microstructures for the different test cases. The compositions not only affect the as-cast
phases but also the microsegregation of various alloying elements which has a considerable
effect on the segregation of Zr and Al3Zr precipitation which will be discussed in the later
section.
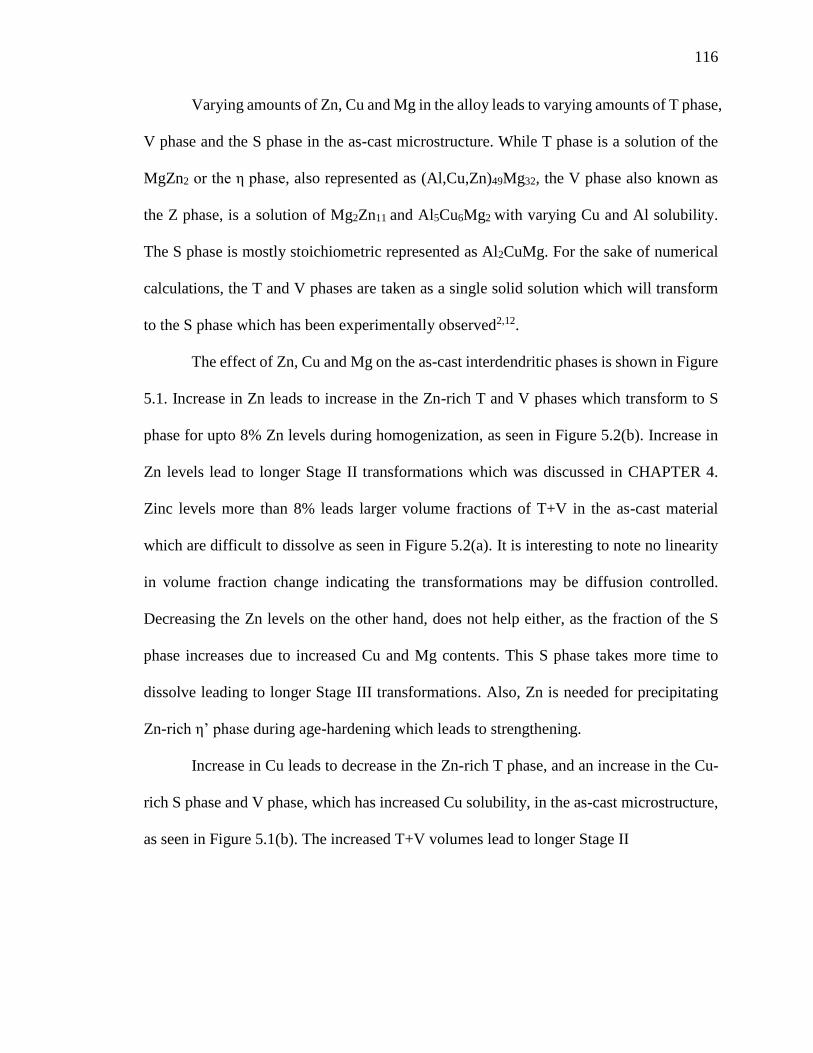
116
Varying amounts of Zn, Cu and Mg in the alloy leads to varying amounts of T phase,
V phase and the S phase in the as-cast microstructure. While T phase is a solution of the
MgZn2 or the η phase, also represented as (Al,Cu,Zn)49Mg32, the V phase also known as
the Z phase, is a solution of Mg2Zn11 and Al5Cu6Mg2 with varying Cu and Al solubility.
The S phase is mostly stoichiometric represented as Al2CuMg. For the sake of numerical
calculations, the T and V phases are taken as a single solid solution which will transform
to the S phase which has been experimentally observed2,12.
The effect of Zn, Cu and Mg on the as-cast interdendritic phases is shown in Figure
5.1. Increase in Zn leads to increase in the Zn-rich T and V phases which transform to S
phase for upto 8% Zn levels during homogenization, as seen in Figure 5.2(b). Increase in
Zn levels lead to longer Stage II transformations which was discussed in CHAPTER 4.
Zinc levels more than 8% leads larger volume fractions of T+V in the as-cast material
which are difficult to dissolve as seen in Figure 5.2(a). It is interesting to note no linearity
in volume fraction change indicating the transformations may be diffusion controlled.
Decreasing the Zn levels on the other hand, does not help either, as the fraction of the S
phase increases due to increased Cu and Mg contents. This S phase takes more time to
dissolve leading to longer Stage III transformations. Also, Zn is needed for precipitating
Zn-rich η’ phase during age-hardening which leads to strengthening.
Increase in Cu leads to decrease in the Zn-rich T phase, and an increase in the Cu-
rich S phase and V phase, which has increased Cu solubility, in the as-cast microstructure,
as seen in Figure 5.1(b). The increased T+V volumes lead to longer Stage II

117
(a) (b)
(c)
Figure 5.1: Effect of varying amounts of (a) Zn, (b) Cu and (c) Mg on the initial volume
fraction of interdendritic particles in the as-cast state for the base composition of Al-6Zn-
2Cu-2Mg-0.13Zr predicted by Thermo-CalcTM.
4 5 6 7 8 9 10
0.0
0.5
1.0
1.5
2.0
2.5
3.0
3.5
4.0
V
olu
me
of
se
co
nd
ary
ph
as
e (
%)
Weight % Zn
T phase
V phase
S phase
1 2 3 4
0
1
2
3
4
5
6
Vo
lum
e o
f s
ec
on
da
ry p
ha
se
(%
)
Weight % Cu
T phase
V phase
S phase
1 2 3 4
0
1
2
3
4
5
6
7
8
9
Vo
lum
e o
f s
ec
on
da
ry p
ha
se
(%
)
Weight % Mg
T phase
V phase
S phase

118
transformations to S phase during homogenization, resulting in larger volume fractions of
S phase as seen in Figure 5.2(d). This S phase needs to be minimized leading to longer
Stage III transformations. Low Cu compositions of ~1% leads to a short Stage II and even
shorter Stage III as the volume fraction of S phase formed is low and easy dissolves to give
a S phase free microstructure which is desirable. However, Cu is needed in the alloy for
strength and ductility103.
Increase in Mg content leads to an increase in the Mg-rich T and S phases and a
decrease in the Zn-rich V phase in the as-cast microstructure as seen in Figure 5.1(c). The
S phase is seen to decrease after 3% Mg as it is replaced by T phase which is even richer
in Mg. A peculiar thing to note during homogenization is higher Mg leads to an initial
increase in T phase and decrease in S phase owing to microsegregation of Mg which leads
to a very high concentration of Mg near grain boundaries which favors a reversion of S
phase to T phase (Figure 5.2(e) and (f)). Increasing the Mg content leads to an increase in
the Stage I and Stage II transformations when the T phase transforms to S phase. Mg of 4%
leads to an extended Stage II without a Stage I, which extends to more than 50 hours as
seen in Figure 5.2(e). There is no linearity in the volume fraction change indicating
diffusion controlled transformations for high Mg content of 4%. The amount of
transformed S is minimum for 1% Mg which has a short Stage II and Stage III leading to
complete dissolution of S phase during homogenization as seen in Figure 5.2(f).
Magnesium is however, a much needed alloying element needed for the strengthening η’
precipitates.

119
(a) (b)
(c) (d)
(e) (f)
Figure 5.2: Effect of alloying elements (a),(b) Zn; (c),(d) Cu and (e),(f) Mg on evolution
of T/V and S phases respectively during homogenization at 450°C.
0 10 20 30 40 500
1
2
3
4
5
6
7
Vo
lum
e o
f V
/T p
ha
se
(%
)
Time (hrs)
Al-4Zn-2Cu-2Mg-0.13Zr
Al-6Zn-2Cu-2Mg-0.13Zr
Al-8Zn-2Cu-2Mg-0.13Zr
Al-10Zn-2Cu-2Mg-0.13Zr
0 10 20 30 40 500
1
2
3
4
5
6
7
Vo
lum
e o
f S
ph
as
e (
%)
Time (hrs)
Al-4Zn-2Cu-2Mg-0.13Zr
Al-6Zn-2Cu-2Mg-0.13Zr
Al-8Zn-2Cu-2Mg-0.13Zr
Al-10Zn-2Cu-2Mg-0.13Zr
0 10 20 30 40 500
1
2
3
4
5
6
7
Vo
lum
e o
f V
/T p
ha
se
(%
)
Time (hrs)
Al-6Zn-1Cu-2Mg-0.13Zr
Al-6Zn-2Cu-2Mg-0.13Zr
Al-6Zn-3Cu-2Mg-0.13Zr
Al-6Zn-4Cu-2Mg-0.13Zr
0 10 20 30 40 500
1
2
3
4
5
6
7
Vo
lum
e o
f S
ph
as
e (
%)
Time (hrs)
Al-6Zn-1Cu-2Mg-0.13Zr
Al-6Zn-2Cu-2Mg-0.13Zr
Al-6Zn-3Cu-2Mg-0.13Zr
Al-6Zn-4Cu-2Mg-0.13Zr
0 10 20 30 40 500
1
2
3
4
5
6
7
8
9
Vo
lum
e o
f V
/T p
ha
se
(%
)
Time (hrs)
Al-6Zn-2Cu-1Mg-0.13Zr
Al-6Zn-2Cu-2Mg-0.13Zr
Al-6Zn-2Cu-3Mg-0.13Zr
Al-6Zn-2Cu-4Mg-0.13Zr
0 10 20 30 40 500
1
2
3
4
5
6
7
8
9
Vo
lum
e o
f S
ph
as
e (
%)
Time (hrs)
Al-6Zn-2Cu-1Mg-0.13Zr
Al-6Zn-2Cu-2Mg-0.13Zr
Al-6Zn-2Cu-3Mg-0.13Zr
Al-6Zn-2Cu-4Mg-0.13Zr

120
5.2.2 Comparison with Phase Diagrams
Table 5.2 summarizes the effect of composition on as-cast microstructure and time taken
for homogenization. The effect of composition on microstructural evolution witnessed in
this study is because these alloying elements affect the phase diagrams for quaternary Al-
Zn-Cu-Mg system. The phase diagram information is incorporated in the numerical model
from Thermo-CalcTM using the TCAL1 database. An older version for these phase
diagrams is available from Stawbridge et al104. An updated version from Thermo-CalcTM
using TCAL1 database is presented in Figure 5.3 for compositions of 4%, 6%, 8% and
10% Zn.
Table 5.2: Summary of effect of composition on as-cast microstructure and
homogenization time
As-cast Homogenized
Higher Zn More T, More V More time for stage II and stage III
Higher Cu More S and V, Less T Way more time for stage III
Higher Mg More T and S, Less V More time for stage I and lesser time for stage III
With increase in Zn content the number of stable phases in the composition range
investigated increases. At low Zn content, Mg-rich T is stable at low Cu contents and Cu-
rich Ө is stable at low Mg contents as seen in Figure 5.3(a). At intermediate compositions
of Cu and Mg the S phase stabilizes. With increase in Zn, V phase with high Cu solubility
stabilizes for higher Cu contents as seen in Figure 5.3(b). For still higher Zn of 6% the η
phase appears as seen in Figure 5.3(c). For Zn as high as 10%, the Zn-rich V phase regions

121
(a) (b)
(c) (d)
Figure 5.3: Effect of Cu and Mg on phase diagrams for (a) 4%, (b) 6%, (c) 8%, (d) 10%
Zn at 45

122
expands. The as-cast and homogenized microstructures, as expected, show trends similar
to these phase diagrams.
5.3 Effect of Composition on Evolution of Al3Zr Dispersoids
Composition not only affects the microstructure in the interdendritic regions near the
grain boundaries but also affects the microstructure within the grains. This happens due to
difference in Zr concentrations across the grains brought in by microsegregation during
casting. Zirconium has a very low diffusivity owing to which it is not “homogenized” even
after prolonged durations of holding at homogenization temperature ranges. Presence of Zr
above the solubility limits during homogenization causes the precipitation of Al3Zr
dispersoids whose number density and radius and hence the microstructure across the
grains depends on the (a) initial Zr concentration; (b) solubility limits (c) nucleation and
growth rates all of which are affected by composition. These in turn affect the homogenized
microstructure which needs a uniform distribution of fine Al3Zr dispersoids.
5.3.1 Effect on Zr Microsegregation in As-cast Microstructure
As the difference in dispersoid microstructure across the grains occurs due to the
microsegregation of Zr that was caused during solidification, the microsegregation in the
initial microstructure to start with for different compositions should be correct. In an earlier
study by Robson and Prangnell95 these initial as-cast microstructures were not considered
leading to results which are different from that reported here. The microsegregations have
been predicted from Scheil type calculations using Thermo-CalcTM. The solidification of
Al-Zn-Cu-Mg starts with crystallization of equilibrium L12/DO23 Al3Zr in the matrix
followed by crystallization of the fcc α-Al phase. So, some Zr is lost in precipitating out
these primary precipitates.
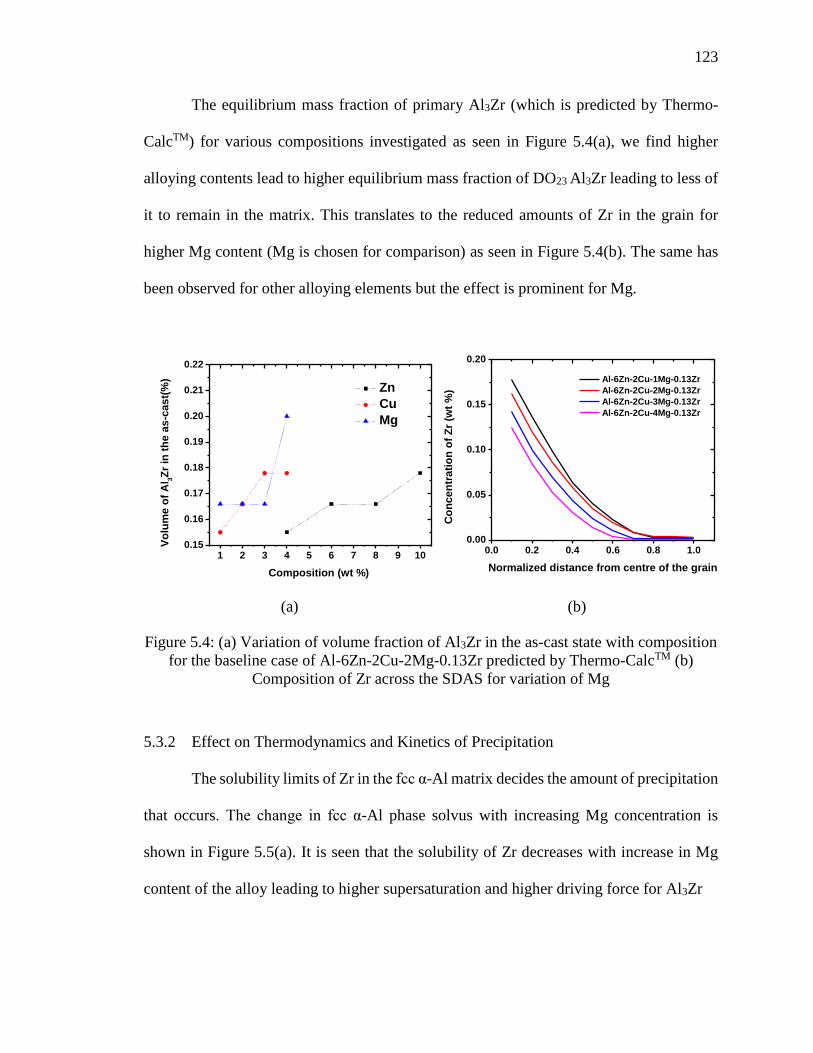
123
The equilibrium mass fraction of primary Al3Zr (which is predicted by Thermo-
CalcTM) for various compositions investigated as seen in Figure 5.4(a), we find higher
alloying contents lead to higher equilibrium mass fraction of DO23 Al3Zr leading to less of
it to remain in the matrix. This translates to the reduced amounts of Zr in the grain for
higher Mg content (Mg is chosen for comparison) as seen in Figure 5.4(b). The same has
been observed for other alloying elements but the effect is prominent for Mg.
(a) (b)
Figure 5.4: (a) Variation of volume fraction of Al3Zr in the as-cast state with composition
for the baseline case of Al-6Zn-2Cu-2Mg-0.13Zr predicted by Thermo-CalcTM (b)
Composition of Zr across the SDAS for variation of Mg
5.3.2 Effect on Thermodynamics and Kinetics of Precipitation
The solubility limits of Zr in the fcc α-Al matrix decides the amount of precipitation
that occurs. The change in fcc α-Al phase solvus with increasing Mg concentration is
shown in Figure 5.5(a). It is seen that the solubility of Zr decreases with increase in Mg
content of the alloy leading to higher supersaturation and higher driving force for Al3Zr
1 2 3 4 5 6 7 8 9 100.15
0.16
0.17
0.18
0.19
0.20
0.21
0.22
Vo
lum
e o
f A
l 3Z
r in
th
e a
s-c
as
t(%
)
Composition (wt %)
Zn
Cu
Mg
0.0 0.2 0.4 0.6 0.8 1.00.00
0.05
0.10
0.15
0.20
Al-6Zn-2Cu-1Mg-0.13Zr
Al-6Zn-2Cu-2Mg-0.13Zr
Al-6Zn-2Cu-3Mg-0.13Zr
Al-6Zn-2Cu-4Mg-0.13Zr
Co
nc
en
tra
tio
n o
f Z
r (w
t %
)
Normalized distance from centre of the grain

124
(a) (b)
(c)
Figure 5.5: Variation of (a) supersaturation, (b) nucleation, (c) growth rates for varying
amounts of Mg for the baseline case of Al-6Zn-2Cu-2Mg-0.1
0
100
200
300
400
500
0.00 0.01 0.02 0.03 0.04
Al-6Zn-2Cu-1Mg-0.13Zr
Al-6Zn-2Cu-2Mg-0.13Zr
Al-6Zn-2Cu-3Mg-0.13Zr
Al-6Zn-2Cu-4Mg-0.13Zr
Weight % Zr
Te
mp
era
ture
(oC
)
425 450 475 5000
1x10⁹
2x10⁹
3x10⁹
4x10⁹
Al-6Zn-2Cu-1Mg-0.13Zr
Al-6Zn-2Cu-2Mg-0.13Zr
Al-6Zn-2Cu-3Mg-0.13Zr
Al-6Zn-2Cu-4Mg-0.13Zr
Nu
cle
ati
on
ra
te (#
/m3s
)
Temperature (oC)
425 450 475 5000.0
5.0x10⁻²²
1.0x10⁻²¹
1.5x10⁻²¹
Su
pers
atu
rati
on
(
Gro
wth
rate
)
Al-6Zn-2Cu-1Mg-0.13Zr
Al-6Zn-2Cu-2Mg-0.13Zr
Al-6Zn-2Cu-3Mg-0.13Zr
Al-6Zn-2Cu-4Mg-0.13Zr
Temperature (oC)
AX

125
nucleation and growth. The same trend is true for increasing Cu and Zn compositions.
However, Mg has a greater influence on solubility limits as compared to Zn or Cu.
The nucleation and growth rates for various compositions in the order of increasing
Mg content for various temperatures is shown in Figure 5.5(b) and (c) respectively. Both
the nucleation and growth rates increase with increasing temperatures owing to increased
diffusivity at higher temperatures which is characteristic of heterogeneous nucleation and
growth. The nucleation and growth rates for different compositions, do not vary till a
temperature of 450°C, after which increased Mg compositions lead to increase in both
nucleation and growth rates as seen in Figure 5.5(b) and (c). To study the effect of
composition on dispersoid precipitation, two temperatures of 450°C and 470°C have been
chosen pertaining to the regimes with no and some difference in nucleation and growth
rates.
5.3.3 Effect on Dispersoid Precipitation
The effect of varying amounts of Zn, Cu, Mg and Zr on the microstructure (number
density and radius of dispersoids) across the grains about the baseline case of Al-6Zn-2Cu-
2Mg-0.13Zr has been shown in Figure 5.6. The number densities and mean radii of the
dispersoids at temperature of 450°C on homogenization for 30 hrs ((a),(c),(e)) and 470°C
on homogenization for 5 hrs ((b),(d),(f)) have been compared. It can be seen that both the
number densities and mean radii decrease with increasing amounts of Zn, Cu and Mg.
While both of them increase with increasing amount of Zr. This is true for both the
temperatures, 450°C pertaining to regime with no difference in nucleation and growth rates
and 470°C pertaining to the regime with difference in nucleation and growth rates as can
be seen in Figure 5.5(c) and (d).

126
450°C for 30 hrs 470°C for 5 hrs
(a) (b)
(c) (d)
(e) (f)
(g) (h)
Figure 5.6: Effect of composition on number density and mean radius of the dispersoids
(a),(b) Zn; (c),(d) Cu; (e), (f) Mg; (g),(h) Zr for homogenization at 450°C for 30 hrs and
470°C for 5 hrs.
4 5 6 7 8 9 105.2
5.4
5.6
5.8
6.0
6.2
Dispersoid size
Number density
Concentration of Zn (wt %)
Dis
pe
rso
id s
ize
(n
m)
550
600
650
700
Nu
mb
er
de
ns
ity
(
m-3)
4 5 6 7 8 9 104.4
4.6
4.8
5.0
5.2
Dis
pe
rso
id s
ize
(n
m)
Concentration of Zn (wt %)
400
420
440
460
480
500
520
540
Dispersoid size
Number density
Nu
mb
er
de
ns
ity
(
m-3)
1.0 1.5 2.0 2.5 3.0 3.5 4.05.2
5.4
5.6
5.8
6.0
6.2 Dispersoid size
Number density
Concentration of Cu (wt %)
Dis
pe
rso
id s
ize
(n
m)
550
600
650
700
Nu
mb
er
de
ns
ity
(
m-3)
1.0 1.5 2.0 2.5 3.0 3.5 4.04.6
4.8
5.0
5.2
440
460
480
500
520
540
Nu
mb
er
den
sit
y (
m-3)
Dis
pers
oid
siz
e (
nm
)
Concentration of Cu (wt %)
Dispersoid size
Number density
1.0 1.5 2.0 2.5 3.0 3.5 4.05.2
5.4
5.6
5.8
6.0
6.2
Concentration of Mg (wt %)
Dis
pers
oid
siz
e (
nm
)
550
600
650
700
Nu
mb
er
den
sit
y (
m-3) Dispersoid size
Number density
1.0 1.5 2.0 2.5 3.0 3.5 4.04.2
4.4
4.6
4.8
5.0
5.2
5.4
420
440
460
480
500
520
540
Nu
mb
er
den
sit
y (
m-3)
Concentration of Mg (wt %)
Dis
pers
oid
siz
e (
nm
) Dispersoid size
Number density
0.05 0.10 0.15 0.205.5
6.0
6.5
7.0
7.5
Concentration of Zr (wt %)
Dis
pers
oid
siz
e (
nm
)
600
650
700
750
800
850
900
Nu
mb
er
den
sit
y (
m-3)
Dispersoid size
Number density
0.05 0.10 0.15 0.204.7
4.8
4.9
5.0
Concentration of Zr (wt %)
Dis
pers
oid
siz
e (
nm
)
Dispersoid size
Number density
460
480
500 N
um
ber
den
sit
y (
m-3)

127
The trend observed in this study is reverse to the trend observed by Robson and
Prangnell95 who did not consider the initial microsegregation of Zr in the as-cast
microstructure. Although the solubility of Zr is decreased with increasing alloy content
leading to increase in nucleation and growth rates, the availability of lesser amount of Zr
across the grains with increasing alloying content restricts both the number density and
mean radii. Thus the initial microsegregation is very crucial in determining the effect of
composition on dispersoid precipitation.
The effect of Zr content on microstructure on homogenization at the two
temperatures can be seen in Figure 5.6(g) and (h) respectively. It can be seen that at 450°C,
the mean radius of the dispersoids sees a sharp increase after 0.15% Zr, which is not
desirable as a very fine distribution of dispersoids is required to pin grain boundaries. Also,
both the number density and mean radius seem to saturate after 0.15% leading to no gain
in benefits of adding more Zr above 0.15% Zr.
5.4 Experimental Validation
To study the effect of composition on microstructure, Sun et al.102 performed
experiments on two separate samples with different compositions. The alloy of
composition Al-6.2Zn-2.4Cu-2.3Mg-0.13Zr was first statically cast, and then remelted and
directionally solidified. Due to segregation of the alloying elements, a solute lean top and
a solute rich bottom of the directionally solidified sample was acquired which was
homogenized. It should be noted that Zr content was less in the bottom while it was more
in the top sample due to a partition coefficient of 1.4 which is unlike other alloying
elements which have a partition coefficient less than 1.

128
The exact composition of the samples from EDX/OES methods is Al-5.1Zn-1.4Cu-
2.2Mg-0.11Zr for the bottom sample and Al-6.6Zn-3.4Cu-4.3Mg-0.03Zr for the top sample.
The DS top and bottom samples were homogenized for 5hrs at 420°C and for 24 to 40 hrs
at 480°C.
Numerical test cases were set up pertaining to the compositions of the two samples
and were run for the homogenization schedule that had been experimentally provided. The
initial microstructure was chosen as predicted by Thermo-CalcTM. The comparison of the
microstructure at the two length scales is provided in Table 5.3. It can be seen that the
results for dispersoids are within the experimental errors. The average size of the
dispersoids are higher because of the larger dispersoids which might have been formed
during directional solidification. Also images of dispersoid rich zones have been analyzed
which might lead to overprediction of the number densities. The model predicted melting
for the DS top sample while it predicted full dissolution of the interdendritic particles for
the bottom sample. The discrepancy for the top sample may be because of the variation of
melting point of the remnant S phase in the sample which seems to be higher for the sample
than that predicted by Thermo-CalcTM as no melting was observed in the sample.
The recrystallization behavior of these two samples have been compared by Yiwei
et al.102 and in spite of the higher Zr in the bottom sample, it was found to be less resistant
to recrystallization. This can be attributed to the coarser dispersoids found for this sample
which has also been predicted by the model.

129
Table 5.3: Comparison of the predicted and experimentally measured microstructure of
the DS Top and DS Bottom samples after homogenization for 5hrs at 420°C and 24hrs
for interdendritic phase 40hrs for dispersoids at 480°C.
DS Top DS Bottom
Experimental Numerical Experimental Numerical
Interdendritic phases
Volume fraction (%) 1.5±0.89 Melting 1.0±0.97 0
Al3Zr dispersoids
Number density (/μm3) 725 528 826 583
Mean diameter (nm) 28.5±12.4 15.2 37.1±20.0 17.7
5.5 Improved Composition Ranges
This study is helpful in throwing light on the effect of composition on as-cast and
homogenized microstructures for Al-Zn-Cu-Mg-Zr alloys. The composition affects the as-
cast microstructure by affecting the volume fraction of interdendritic phases and
microsegregation which affects the microstructural evolution during homogenization and
subsequent processing. More alloying elements in general increase the amount of
interdendritic phases which increase the amount of homogenization time needed to
minimize them. We need an optimum amount of alloying elements to take advantage of
them and for ease of processing.
Increasing Zn increases the time needed for homogenization. However, Zn above
6 minimizes S phase considerably but leads to other phases like T and V in the as-cast
microstructure, which need to be dissolved before extrusion and age-hardening by
homogenization at higher temperatures. Having Zn higher than 8% leads to very high
alloying element content increasing the quench sensitivity of the alloy requiring high

130
cooling rates to subdue precipitation which can induce residual stress and is also difficult
to attain for thick forgings. So, a Zn content of 6-8% with Zn/Mg ratio of 3-4 is desirable.
High Cu or Mg increases the S phase that remains after homogenization which is
difficult to dissolve. Low Cu and Mg (~1%) leads to easy homogenization with no
detrimental interdendritic particles which is desirable. However, they are both needed for
good mechanical properties of the alloy. The desirable Cu and Mg content is in the range
of 1-2% with Mg:Cu of 1-2.
The composition of Zn, Cu and Mg affect the amount of primary Al3Zr precipitated
during solidification, leaving remaining Zr available for precipitation of fine dispersoids
during homogenization. These precipitates formed during solidification are coarse and
incoherent, and hence undesirable. In general increase in alloying content increases the
tendency for precipitation during solidification leading to fewer fine coherent dispersoids
at high alloy contents. This is however the reverse, if cooling during solidification exceeds
a critical cooling rate leading to less or no precipitation of Al3Zr. Alloying elements
decrease the solid solubility of Zr leading to higher volume fractions of metastable Al3Zr
which is desirable. But this advantage can be taken only when we can prevent Al3Zr from
precipitation during solidification. No significant gain in number density or mean radius
observed above 0.15% Zr at both temperatures investigated in the study. Hence a Zr content
of 0.1-0.15% is the optimum range to attain fine distribution of numerous metastable
coherent Al3Zr dispersoids.
5.6 Conclusion
The model developed in CHAPTER 4 is used to study the effect of composition on
microstructural evolution during homogenization in 7XXX alloys. A microstructure with

131
minimum S and uniform distribution of fine, coherent Al3Zr dispersoids is desired after
homogenization. The composition affects the volume fraction of secondary particles and
microsegregation during solidification which has a profound effect on the microstructure
during homogenization and subsequent processing. Higher Zn, Cu and Mg contents lead
to higher amounts of interdendritic particles and hence require more time to homogenize.
Higher alloying content also leads to increased quench sensitivity. Higher alloy content
also leads to decrease in solid solubility of Zr leading to higher driving force for nucleation
of dispersoids. This is however, possible only when the cooling rate during solidification
is fast enough to prevent primary Al3Zr from nucleating. These precipitates are coarse and
incoherent and decrease the amount of Zr needed for precipitation of dispersoids which is
undesirable. For solidification otherwise, higher alloying content leads to lower number
densities for dispersoids. This result contradicts previous studies by Robson and
Prangnell95, who did not take the initial solidification microstructure into consideration.
Based on the study an improved composition range of 6-8%Zn, 1-2%Cu, 1-2%Mg
and 0.1-0.15%Zr has been suggested. It should be noted that these suggestions are made
solely based on ease of homogenization and extrusion, and so, are closer to composition of
the AA7075 alloys except for higher Zn and also closer to the AA7050 except for lower
Cu. Copper in the range of 2-2.5% is intentionally added to AA7050 to improve its fracture
toughness and corrosion resistance which has not been taken into account.

132
CHAPTER 6. MICROSTRUCTURE DUE TO PRECIPITATION DURING COOLING
OF 7XXX ALLOYS
6.1 Introduction
Aluminum 7XXX alloys fall in the category of heat-treatable alloys which derive
mechanical strength through the age-hardening heat treatment. Prior to age hardening the
processing steps after the metal is cast consist of homogenization to get rid of
microsegregation, low melting interdendritic particles, and precipitate dispersoids,
followed by thermo-mechanical processing such as extrusion or hot rolling. The metal is
then solution treated to reach a supersaturated solid solution prior to aging when
precipitation of strengthening particles occurs. Each high temperature processing step is
followed by cooling to room temperature. While we have some understanding of the
microstructural evolution during these processes, less information is in the literature about
its behavior during the subsequent quenching. The microstructure after quenching is the
initial condition for the next processing step and determines the mechanical properties.
Precipitation during cooling in 7XXX alloys is important and has been studied by
many researchers. Early studies on precipitation in 7XXX series observed η/M
(Description of the phases in appendix B) phase precipitation on previous Zr or Cr based
dispersoids99,105. Precipitation of only the η phase has also been reported by a recent study
on a 7A09 alloy106. However, precipitation of the S and T phases were reported by Godard
et al.14 Godard reported heterogeneous nucleation of η on dispersoids at higher

133
temperatures followed by precipitation of metastable S’ and T on grain boundaries, sub-
grain boundaries, and dislocations at intermediate temperatures and homogeneous
nucleation of metastable η’ at low temperatures during cooling of an AA7010 alloy.
Robson107 reported the precipitation sequence in AA7050 through step quenching
experiments and microstructural examination. He reported a complex precipitation
sequence of S’ needles within grain, followed by M phase within the grain and S phase at
the grain boundaries, followed by numerous metastable M’ needles in the grain at lower
temperatures during slow cooling of AA7050. Controlling the precipitation of these phases
by controlling the composition of an AA7175 alloy has been suggested by Lim et al13.
A microstructure ideal for ease of extrusion without recrystallization should be free
from all precipitates. S phase has a solvus temperature of 493°C, which is close to the
melting temperature and is so very difficult to dissolve during pre-heat. All the phases
precipitated during cooling have low melting temperatures and can easily melt during
extrusion. They also hamper the age-hardenability of the alloy. They should therefore, be
fine enough to dissolve during pre-heat. According to McQueen and Celliers108 particles
of size >0.6μm do not dissolve during preheat. Also, any precipitates with size >1μm leads
to particle stimulated nucleation of recrystallization108.
In this work we aim to do a comprehensive study of precipitation during cooling
over a range of cooling rates relevant to the industrial practice and a range of compositions
belonging to the 7XXX alloys. The aim here is to minimize the precipitation during cooling
and to have precipitates smaller than 0.6μm. We choose a numerical approach in this work,
first validating our initial results with experiments. We have developed a Particle Size
Distribution (PSD) based numerical approach to model precipitation of multiple phases

134
during cooling from homogenization temperature of 7XXX alloys. This model is used to
study the effect of cooling rates and compositions. Continuous Cooling Curves (CCC) and
Time Temperature Transformation (TTT) curves are also predicted for AA7050.
6.2 Domain Description
The numerical domain is a 1D radial domain similar to the precipitation model in
CHAPTER 3, as shown on Figure 3.1(b). As precipitation of 4 different phases are modeled,
4 such domains are considered one for each phase. Four precipitate classes: S (Al2CuMg),η
(MgZn2), T(Al2Zn3Mg3), and Ө (Al2Cu) phases are considered in the study as these phases
have been found in the experimental studies13,109 and also predicted by Thermo-CalcTM.
These phases S, η and T, are plate/needle-shaped13,107 and are assigned these
experimentally observed morphologies in the model. The values of the various constants
in the numerical model for the four phases have been listed in Table 6.1.
Table 6.1: The phases and property values for the phases used by the numerical model
Phases S, η, T, Ө
Molar volume (m3/mole) 1×10⁻⁵
Interfacial energy (J/m2) 0.18
Aspect ratio 10
6.3 Experimental Validation
Precipitation of the S, η, T and Ө phases is predicted by ThermoCalcTM during
cooling of the baseline composition of Al-6.2Zn-2.3Cu-2.35Mg-0.13Zr. The phases
precipitated were characterized through Energy Dispersive Spectroscopy (EDS) mapping,

135
X-Ray Diffraction (XRD) and Differential Scanning Calorimetry (DSC) during cooling an
Al-6.2Zn-2.3Cu-2.35Mg-0.13Zr alloy in the furnace.
An Al-6.2Zn-2.3Cu-2.35Mg-0.13Zr alloy was induction melted in vacuum and cast
in cylindrical copper molds of size 10cm length and 2.5cm diameter. This cylindrical ingot
was then cut into smaller samples and homogenized in the box furnace for 10 hrs at 420°C
to precipitate the Al3Zr dispersoids, 4hrs at 470°C to dissolve the aluminides and 16hrs at
480°C to minimize the S phase as proposed in CHAPTER 4. These samples are then
furnace cooled by letting the sample remain in the furnace which had been switched off.
The samples are then polished using silica papers and colloidal silica and observed under
a Phenom ProX Desktop Scanning Electron Microscope (SEM).
Figure 6.1 shows the microstructure of furnace cooled sample and the
corresponding EDS mapping. Abundant plate-like precipitates are observed in the furnace
cooled sample. The coarser particles at the grain boundaries are the remnant S phase also
indicated by the XRD plot for the homogenized sample as seen in Figure 6.2(a), after three
step homogenization with some Zn solubility. There are smaller disk shape precipitates
near the grain boundaries (look like small rectangles) with Mg, Zn and Cu solubilities may
be the η phase precipitates. There are finer and longer precipitates within the grains seem
to have Cu with little or no Zn may be the S phase or the Ө phase.
To better characterize the phases precipitated XRD and DSC runs were also
conducted on the as-cast, homogenized/water quenched, and homogenized/furnace cooled
samples. The XRD plot in Figure 6.2(a) shows peaks corresponding to mostly η in as-cast,
mostly S in homogenized and both the phases in furnace cooled samples. Other phases may
have precipitated but at volume fractions too small to be detected by XRD. Figure 6.2(b)
136
shows the DSC plot of the as-cast sample with an endothermic peak corresponding to the
aluminides present in the as-cast microstructure. The homogenized/water quenched sample
shows the onset of dissolution of the S phase while the furnace cooled sample shows the
onset of the dissolution of the η and S phases. These peaks were also observed by Shu et
al.101
The number density of the precipitates was calculated using the mean projected
height technique87 for disc-like precipitates where the mean projected height of the
particles is
𝐻′̅̅ ̅ = 𝜋𝑟/2. (6.1)
The number of particles per unit area, which is calculated from the 2D SEM micrographs,
then translates to the number of particles per unit volume using the relationship:
𝑁𝑉 =𝑁𝐴
𝐻′̅̅ ̅.
(6.2)
The plate radius for the particles was calculated using the relationship:
𝑟 =𝑁𝐿
𝑁𝐴.
(6.3)
A test case corresponding to the cooling experiment for the composition of Al-
6.2Zn-2.3Cu-2.35Mg-0.23Zr was run using the numerical model. The cooling rate selected
was 130°C/hr which corresponds to our furnace cooling conditions, as measured by Sun et
al.59 The model predicts precipitation of coarse S, η T and Ө phases, some of which have
been experimentally verified as seen in Figures 6.1 and 6.2. The number density and mean
platelet lengths are listed in Table 6.2. The total number density of the particles found
experimentally using the projected image technique stated above was 3.1×10²⁰ ± 2.2×10¹⁹
/m3, which is of the same order of magnitude of the predicted total number density. The

137
predicted number density is very sensitive to the total number of nucleation sites which has
been taken as 1×10²² /m3 which may be less than the actual number of nucleation sites
available. The mean platelet length is 3.04μm which is very less compared to 0.31μm (for
visible plates >0.1 in length) found numerically which is very sensitive to surface energy
values. The variation is also observed because not all the precipitated particles were plate
like. The experimental number density and mean platelet length corresponds to all the
precipitates visible in the micrographs as it is difficult to visibly characterize the different
phases. Here we try to make a semi-quantitative study of the effects of cooling rates and
composition on precipitation response of 7XXX alloys during cooling.
Table 6.2: The predicted number densities and mean platelet lengths for the different
precipitated phases.
Phase Number density (/m3) Mean platelet length (μm)
Al2CuMg (S) 6.3×10¹⁹ 0.16
MgZn2 (η) 6.6×10²⁰ 1.2×10⁻²
Al2Mg3Zn3 (T) 1.5×10¹⁸ 4.0×10⁻³
Al2Cu (Ө) 6.7×10¹⁵ 4.0×10⁻³
Total/Mean 7.2×10²⁰ 0.02
6.4 Numerical Results and Discussion
The baseline case for this study is an AA7050 alloy with composition 6Al-6.2Zn-
2.3Cu-2.35Mg-0.13Zr, although the role of Zr is only to precipitate dispersoids as
discussed in CHAPTER 4. The test cases run to study the effect of cooling rates are listed
in Table 6.3. The different test cases run to study the effect of composition are listed in
Table 6.4.

138
(a) (b)
(c) (d)
Figure 6.1: (a) Back scattered electron image of a homogenized and furnace cooled Al-
6.2Zn-2.3Cu-2.35Mg-0.13Zr; EDS mapping for (b) Zn; (c) Cu and (d) Mg.

139
(a)
(b)
Figure 6.2: (a) XRD plot of the Al-6.2Zn-2.3Cu-2.35Mg-0.13Zr as-cast,
homogenized/water quenched and homogenized/furnace cooled samples (b) DSC plots
for the same indicating the onset temperatures of listed processes.

140
Table 6.3: Test cases run to study the effect of cooling rates on precipitation
Cooling rate (°C/hr) Zn(wt%) Cu(wt%) Mg(wt%) Zr(wt%)
1 150 6.2 2.3 2.35 0.13
2 250 6.2 2.3 2.35 0.13
3 500 6.2 2.3 2.35 0.13
4 1000 6.2 2.3 2.35 0.13
Table 6.4: Test cases run to study the effect of composition on precipitation
Cooling rate (°C/hr) Zn (wt%) Cu (wt%) Mg (wt%) Zr (wt%)
1 250 4 2 2 0.13
2 250 6 2 2 0.13
3 250 8 2 2 0.13
4 250 10 2 2 0.13
5 250 6 1 2 0.13
6 250 6 3 2 0.13
7 250 6 4 2 0.13
8 250 6 2 1 0.13
9 250 6 2 3 0.13
10 250 6 2 4 0.13
The CCC are plotted based on test cases for the composition of Al-6.2Zn-2.3Cu-
2.35Mg-0.13Zr for cooling rates of 0.01, 0.1, 1, 10 and 100°C/s. The TTT curves are
plotted for the same composition at isothermal temperatures of 100, 150, 200, 250, 300,
350, 400 and 450°C.
6.4.1 Effect of Cooling Rates
The model predicts precipitation of S (Al2CuMg), η (MgZn2), T (Al2Mg3Zn3) and
Ө (Al2Cu) phases during cooling in the range of 150-1000°C/hr. The number density

141
evolution of each of the phases with time, is shown in Figure 6.3. The precipitation can be
categorized into three temperature ranges:
(i) High temperature precipitation: S phase solvus (494°C for composition of Al-
6Zn-2Cu-2Mg-0.13Zr) is the highest and so it precipitates first. Precipitation of
S phase is very fast and occurs mostly at temperatures above 400°C.
(ii) Medium temperature precipitation: The η phase (solvus temperature of 423°C
for composition of Al-6Zn-2Cu-2Mg-0.13Zr) precipitates at temperatures
ranging from 300 to 400°C.
(iii) Low temperature precipitation: Cooling to temperatures below 200°C leads to
supersaturation and diffusion enough to precipitate the T and Ө phases (solvus
temperatures of 174°C and 80°C respectively, for composition of Al-6Zn-2Cu-
2Mg-0.13Zr).
Figure 6.3: The evolution of predicted number densities of various phases precipitated
showing the temperature ranges of precipitation

142
As the S phase nucleates first at a high temperature it gets ample time at high
temperature for diffusion to occur leading to longer platelets as compared to other phases
as seen in Figure 6.4(a). The length of the precipitates decrease with increasing cooling
rate, as the time available for growth is smaller for higher cooling rates.
The number density of the S phase increases with decreasing cooling rate as seen
in Figure 6.4(b), because higher cooling rates lead to higher supersaturation before
precipitation begins, but still at high enough temperature to have significant diffusion.
However, this is not true for other phases where the number densities decrease with cooling
rate as these phases have a lower solvus where diffusion is extremely slow leading to
nucleation (requiring local rearrangement of atoms through diffusion) of lesser precipitates.
There is a crossover of maximum number of precipitates from S to η phase at cooling rates
lower than 650°C/hr. At higher cooling rates although the S phase precipitates are more,
they are smaller in length. The Ө phase here, is the last to precipitate and has the minimum
number density.
The volume fraction of S phase shows little change in the range of 150-1000°C/hr
while it decreases for other phases as seen in Figure 6.4(c). As the volume fractions do not
vary much with cooling rates, the composition of the matrix does not vary with cooling
rates, leading to flow stresses insensitive to cooling rates in the range of 150-1000°C/hr.
Figure 6.4(d) shows the predicted size distribution of the platelets of η and S for
the 4 cooling rates studied. It can be seen that the average size of the platelets decreases
with increasing cooling rates. Also, as S phase platelets get enough time at higher
temperatures leading to higher growth facilitated by diffusion, they are larger than the η
phase platelets which have less time to grow.

143
(a) (b)
(c) (d)
Figure 6.4: Effect of cooling rates on (a) mean length of platelets (b) the number density
(c) volume fraction and (d) size distribution of different precipitated phases.
144
6.4.1.1 Continuous Cooling Curves
Figure 6.5 shows the cooling curves for the Al-6.2Zn-2.3Cu-2.35Mg-0.13Zr
(AA7050), as predicted by the numerical model for cooling rates varying over a range of
4 orders of magnitude. The curves have the start (solid lines) and end temperatures (dashed
lines) of the precipitation of different phases through high, medium and low temperature
precipitation reactions. The start temperature is when number density for that particular
phase has its first non 0 value and the end temperature, when it becomes constant. The
nucleation is not evenly distributed over the range of temperatures shown. The nucleation
rate is more initially and decreases with time.
The precipitation regions of the S phase start at lower temperatures at higher
cooling rates due to the fact that higher supersaturation is needed to overcome slower
diffusion for nucleation at lower temperatures. As nucleation and growth is limited, the
supersaturation grows as the temperatures drop, leading nucleation continuing at lower
temperatures at higher cooling rates, leading to a large S phase precipitation region at
higher cooling rates. The number density of S phase is higher at higher cooling rates but
they are finer in size due to limited growth. These smaller platelets more easily dissolve
during preheating before extrusion. There is an overlap of the high and medium
temperature precipitation reaction stages at higher cooling rates. The medium and the low
temperature precipitation reactions begin early at higher cooling rates due to availability of
solute in the alloy. No precipitation at temperatures below 50°C is observed.

145
The S (490°C), η(470°C), T(480°C) and Ө(540°C) phases are low melting
temperature phases which, if they do not dissolve during preheat (> 0.6μm) , may melt
during extrusion6. S phase is brittle and reduces the toughness of the alloy97. If larger than
a critical size (>1μm) , they may also cause particle stimulated nucleation of
recrystallization15. To have a favorable microstructure with precipitates < 0.6μm, the
cooling rates need to be > 500°C/hr.
In case of cooling after solution heat treatment before aging, any S phase is
undesirable as it might remain in the final microstructure. Elimination of S phase is possible
if we quench the alloy at very high cooling rates. However, cooling at very high cooling
rates causes residual stresses which may cause distortion or cracking. To minimize these
Figure 6.5: Simulated Continuous Cooling Curves for AA7050 showing the high
temperature, medium temperature and low temperature precipitation regions. The solid
lines showing the start temperatures and dashed lines showing the end temperatures of
precipitation.

146
effects, warm water or glycol quenching has been proposed which is found to increase
cooling rates with reduced residual stresses110. The glycol has a very high boiling point and
does not form a vapor blanket stage but dissociates to form a residue which uniformly
covers the section leading to uniform heat transfer all across the component which reduces
residual stresses. The residue later dissolves at lower temperatures. Cooling at 10-100°C/s
(36000-360000°C/hr) greatly reduces the unfavorable S phase, which remained the same
for the cooling rate range of 150-1000°C/hr. A high cooling rate is highly desirable in the
300-480°C temperature range to avoid the high temperature S phase precipitation.
6.4.1.2 Time Temperature Transformation Curves
The numerical model was also used to predict the Time Temperature
Transformation curves. Isothermal cases were run at several temperatures to note the
precipitation volume fractions. Figure 6.6 shows the TTT curve for the precipitated S, η
and T phases for AA7050 alloy. The red hollow circles indicate the time required to
precipitate a volume fraction of 1% S during isothermal treatment in the temperature range
of 250-450°C. As mentioned earlier the CCC also suggest very fast quenching in this
temperature range to avoid S phase precipitation.
The η phase precipitates in the temperature range of 150-350°C, with the nose of
the curve lying at approximately 275°C. The aging heat treatment is done to form fine
metastable η’ phase precipitates prior to the stable η precipitates. However, at this
temperature, η’ grows fast enough to transform into undesirable coarse stable η precipitates.
η’ precipitation also is accompanied simultaneously by the undesirable T phase precipitates,

147
occurring in the temperature range of 150-250°C. At temperature of 100-125°C, the TTT
curve for η lies ahead of the curve for T phase. In this temperature range, supersaturation
is high enough to precipitate numerous fine-sized metastable η’ precipitates without
precipitation of the T phase. This temperature range is hence ideal for aging of these alloys.
Figure 6.6: Time Temperature Transformation curves for AA7050 showing the time
required for precipitation of 1% S, 0.001% η and 0.0005% T.
6.4.2 Effect of Composition
The effect of individual compositional variations of alloying elements Zn, Cu and
Mg on the precipitation of different phases has been studied. The compositional variation

148
leads to change in the phase diagram, which leads to difference in the phases that precipitate
including the formation of a new phase, V, which is a solid solution of Mg2Zn11 and formed
at higher Zn content.
Figure 6.7 shows the effect of increasing Zn, Cu and Mg contents on the stable
phases in 7XXX alloys as predicted by Thermo-CalcTM using the TCAL1 database. The
base composition is Al-6Zn-2Cu-2Mg. As seen in Figure 6.7(a) for low Zn compositions
(low Zn:Mg) lead to T phase stabilization which is Mg-rich, which is undesirable. Too
much Zn stabilizes the Zn-enriched η and V phases which, also have a low melting point.
The S phase, which is ideally Zn free diminishes at higher Zn contents. Ө is formed at low
temperatures for Zn > 3% and is less harmful because its small size and higher melting
point.
The effect of Zn on the precipitation behavior of 7XXX alloys in the range of 4 to
10 wt% is shown in Figure 6.8. The undesirable S phase is decreases in number and size
due to lower supersaturation, with increase in Zn composition as seen in Figure 6.8(a) and
(b). However, the Zn-rich, V phase is precipitated in large volume fractions (Figure 6.8(c))
at high Zn contents which is still undesirable. Also, increase in Zn leads to higher Cu and
Mg contents (Figure 6.8(d)) in the alloy due to lower S (Al2CuMg) phase volume fractions.
Although higher Zn contents seems to be a good proposition for lower S phase precipitation,
the undesirable V phase and the high flow stresses are deleterious. An intermediate Zn
composition of 6-8% have more η and Ө which are less harmful than the other phases.
Figure 6.7(b) clearly indicates the expansion of the α-Al+S phase region with
increase in Cu content. Low Cu content stabilizes the Mg and Zn-rich T (Al2Mg3Zn3) phase,

149
(a) (b)
(c)
Figure 6.7: Phase diagrams corresponding to the Al rich corner of an Al-6Zn-2Cu-2Mg
alloy showing the effect of (a) Zn (𝐴: 𝛼 − 𝐴𝑙 + 𝑆 + 𝑉;𝐵: 𝛼 − 𝐴𝑙 + 𝑆 + 𝜂 + 𝑉; 𝐶: 𝛼 −𝐴𝑙 + 𝑉; 𝐷: 𝛼 − 𝐴𝑙 + 𝜂 + 𝑉); (b) Cu (𝐴: 𝛼 − 𝐴𝑙 + 𝜂 ; 𝐵: 𝛼 − 𝐴𝑙 + 𝑆 + 𝑉 + 𝜂) and (c)
Mg (𝐴: 𝛼 − 𝐴𝑙 + 𝜃 + 𝑉; 𝐵: 𝛼 − 𝐴𝑙 + 𝑆 + 𝑉; 𝐶: 𝛼 − 𝐴𝑙 + 𝑆 + 𝜃; 𝐷: 𝛼 − 𝐴𝑙 + 𝑉; 𝐸: 𝛼 −𝐴𝑙 + 𝑆 + 𝜃 + 𝑉; 𝐹: 𝛼 − 𝐴𝑙 + 𝑉; 𝐺: 𝛼 − 𝐴𝑙 + 𝑉 + 𝜂; 𝐻: 𝛼 − 𝐴𝑙 + 𝑇 + 𝜃 + 𝜂; 𝐼: 𝛼 − 𝐴𝑙 +
𝜂 + 𝜃 + 𝑉; 𝐽: 𝛼 − 𝐴𝑙 + 𝜂; 𝐾: 𝛼 − 𝐴𝑙 + 𝑉 + 𝜃) on the stable phases at different
temperatures.

150
(a) (b)
(c) (d)
Figure 6.8: Effect of Zn content on (a) number density (b) Mean length of the platelets (c)
volume fraction for different precipitated phases and (d) composition of the matrix.

151
which is replaced by the η phase, which has more Cu solubility than T. The Cu rich-Ө
(Al2Cu) phase appears at low temperatures for Cu >1%.
The effect of Cu content in a 7XXX alloy in the composition range of 1 to 4% is
shown in Figure 6.9. The S phase number density increases sharply from 1% to 2% Cu
content after which it is replaced by the Cu-rich Ө phase (Figure 6.9(a)). Also, higher Cu
content leads to higher Zn content (Figure 6.9(d)) in the alloy due to lower η, with lower
Mg due higher S phase volume fractions. Lower Mg leads to lower flow stresses during
extrusion which is desired. However, the length of the S phase platelets and the volume
fractions continue to increase due to higher availability of Cu (Figure 6.9(b) and (c)). The
size of S phase reaches >0.6μm which is undesirable. Also at the other end, at very low Cu
concentrations of 1%, the undesirable Mg-rich T phase exists which is again a nuisance.
An Cu content of 1-1.5% (on the lower side) is therefore considered to be good for a
precipitated microstructure with more η than S phase precipitates.
Figure 6.7(c) shows the effect of Mg content on the phases precipitated during
cooling from the homogenization temperature of 480°C. High Mg stabilizes the η and T
phases. At low Mg concentrations, Cu-rich Ө exists, which is replaced by the S and η
phases with increased Mg solubility, as Mg content increases. At very high Mg contents,
the Mg-rich T phase exists.
The effect of Mg content in the composition range of 1-4% in 7XXX series alloys
has been shown in Figure 6.10. The number density of undesirable S phase decreases and
η decreases, with increasing Mg content as seen in Figure 6.10(a). The trend reverses at
higher Mg content of ~4%. However, the length of the S phase platelets increases with Mg
and is the maximum for intermediate Mg contents of ~3% (Figure 6.10(b)) when the

152
(a) (b)
(c) (d)
Figure 6.9: Effect of Cu content on (a) number density (b) Mean length of the platelets
(c) volume fraction for different precipitated phases and (d) composition of the matrix.

153
(a) (b)
(c) (d)
Figure 6.10: Effect of Mg content on (a) number density (b) Mean length of the platelets
(c) volume fraction for different precipitated phases and (d) composition of the matrix.

154
number density of S phase is the lowest. The S phase volume fractions are also high. At
high Mg contents, the undesirable low melting T phase appears which is deleterious during
extrusion. Also, the flow stress for extrusion increases tremendously due to increase in Mg
content which is undesirable. At lowest Mg contents, the S phase number densities are
higher. Therefore, a composition of ~2% Mg is desirable for a microstructure with fewer
S and η phase precipitates with no T phase.
6.5 Conclusion
A study of precipitation during post-homogenization cooling of 7XXX alloys is
done. The initial numerical results for a furnace cooled sample are validated against
experiments. The effect of cooling rates and compositions on the precipitation response are
evaluated. A very high cooling rate of > 500°C/hr can lead to precipitates <0.6μm in size
and lower volume fractions of all phases. A cooling rate of >10°C/s (36000°C/hr) would
keep the S phase to minimum which is desirable after solution heat treatment. This is
however, difficult to attain for thick sections. At high cooling rates, the precipitated phases
are also fine in size so as to dissolve during pre-heat before extrusion. The composition
range of 6-8% Zn, 1-1.5%Cu and ~2% Mg is found to reduce the amount of precipitated
coarse S phase leading to easily extrudable microstructures with good age hardenability.
The CCC and TTT curves for AA7050 have also been predicted by the numerical model.

155
CHAPTER 7. RADIAL VARIATION OF MICROSTRUCTURE IN A DIRECT CHILL
CAST BILLET ON HOMOGENIZATION
7.1 Introduction
The work described in previous chapters is a part of the larger scale integrated study,
from casting to evaluating the performance of aluminum extrusions after heat treatment
and deformation. The various processes studied are casting, homogenization, and
deformation. One process affects the ones downstream, here making the study complex
and involving a wide range of length and time scales. There is a complex interplay of
processing, microstructure and properties which has to be understood. This is what forms
the basis for “Integrated Computational Materials Engineering” (ICME).
“Through process modeling” is not a new concept and has increasingly being used
in different fields. Talking of metal processing, several researchers have attempted it in the
past. Solidification and homogenization are two very closely related processes and have
been done by many researchers. Early studies by Brooks et al.111 involved evolution of the
microsegregation during casting and homogenization of stainless steel welds. It essentially
involved solving the mass diffusion equations in a cylindrical domain with a given
temperature history with movement of the solid-liquid interface boundary based on phase
equilibria equations. The DICTRATM software, which is able to predict one dimensional
diffusion induced phase transformations, has increasingly been used to predict
solidification and homogenization microstructures in various alloy systems.

156
Lippard et al.112 and Samaras and Haidemenopoulos39 used DICTRATM to predict
microsegregation and phase fraction evolutions during casting and homogenization of
AerMet100 steel and AA6061, respectively. The Pseudo-Front-Tracking method113 was
used by Gandin and Jacot4 to model solidification and homogenization in AA3003 alloy
which was coupled with a precipitation model to predict width of the precipitate-free zones.
Warnken et al.35 used phase-field methodology to study evolution of as-cast microstructure
and homogenization in nickel-based alloys.
Some of the larger scale through process modelling studies include works by
Neumann et al.114 and Tin et al.115 who modeled processing of aluminum sheets and Ni-
based superalloy discs, respectively. Neumann et al.114 modelled casting, homogenization
and forming of the Al sheets, where the model in each step produced results which, along
with some experimental results, were fed to the next model to create a through process
model. For instance, the casting model predicted grain size and microsegregation which,
along with the experimentally measured grain size distribution, was fed into the
homogenization model. Tin et al.115 described an integrated model to predict grain structure
and defects during various processing stages of a gas turbine disc of INCONEL alloy 718.
The process-stream that was studied were Vacuum Arc Remelting (VAR), homogenization,
cogging, forging, and heat treatment.
The current study combines the numerical study of the first two processing stages
of aluminum extrusions, namely casting and homogenization. These processes are studied
for a DC-cast cylindrical billet of AA7050. The DC-casting solidification model in the
continuum scale developed by Fezi et al.22 feeds the radial microstructural and composition
information to the meso-scale homogenization and precipitation models developed in this

157
Microsegregation,
Vol fraction of sec phases
DC- CASTING MODEL
Macrosegregation Local solidification time
SDAS THERMO-CALCTM
HOMOGENIZATION MODEL
Microstructure (across billet radius)
Interdendritic phases
dispersoids
work to determine the radial variation of microstructure after homogenization and cooling
of the billet under industrial conditions. While the solidification model directly predicts the
macrosegregation, giving the radial variation of compositions in the billet, the Secondary
Dendrite Arms Spacing (SDAS) is indirectly estimated based on the predicted
solidification times. This microstructural information helps us predict the microsegregation
and volume fraction of the interdendritic phases from Thermo-CalcTM, which can be used
Figure 7.1: Schematic showing the inputs and outputs of the numerical models involved.

158
to study the microstructural evolution during homogenization and cooling. The flow of the
simulations is illustrated in Figure 7.1.
The radial variation of the as-cast microstructure in a cylindrical billet causes a
variation in microstructural evolution during homogenization. A radial variation of
homogenization temperature history during industrial processing conditions is also
considered. A homogenization schedule right for the entire cross section of the billet,
without causing remelting of the secondary phases has been proposed.
7.2 Domain Description
The heat transfer in a cylindrical billet under industrial homogenization conditions
is modeled. The domain is axisymmetric with radius of 0.35m and the boundary conditions
shown in Figure 7.2. The conduction of heat in the billet is modeled through the heat
conduction equation in cylindrical coordinates as:
1
𝛼
𝜕𝑇
𝜕𝑡=
1
𝑟
𝜕
𝜕𝑟(𝑟
𝜕𝑇
𝜕𝑟) (7.1)
where 𝛼 = 𝑘𝑐/𝜌𝑐𝑝. A symmetry conditions is applied at the centerline.
𝜕𝑇
𝜕𝑟= 0 𝑎𝑡 𝑟 = 0 (7.2)
The convective and radiation heat losses at the boundary are considered at billet surface as
−𝜕𝑇
𝜕𝑟=
ℎ
𝑘𝑐(𝑇𝑅0
− 𝑇∞) + 𝜀𝜎(𝑇𝑅0
4 − 𝑇∞4 ) 𝑎𝑡 𝑟 = 𝑅0 (7.3)

159
Figure 7.2: Schematic showing the axisymmetric domain and the boundary conditions
during industrial cooling of the billet. The positions were microstructures are compared
are numbered. The initial temperature is ambient temperature at the beginning of the
heating cycle.
Table 7.1: Values of the heat transfer parameters used.
Parameters Values116
𝛼 6.24 × 10⁻⁵ m2/s
𝑘𝑐 153 W/Mk
ℎ 10 W/m2K (heating)
100 W/m2K (cooling by forced air)
𝜀 0.09
𝜎 5.67 × 10⁻⁸ W/m2K4
1 2 3 z
R0 = 0.35m 𝑻∞= 30°C
r
𝑻𝒊𝒏𝒊𝒕= 480°C

160
Eqn. 7.1 is discretized using implicit finite difference scheme and solved using TDMA47.
The radial control volume size and time step are ∆r=3.5mm and ∆t=5s. The values of the
various parameters used in the study are listed in Table 7.1. The heat transfer coefficients
are the estimated values for air with free convection and air with forced convection during
heating and cooling the billet, respectively117 which is the case during industrial processing
conditions. The microstructure at r=0, r=R/2 and r=R after (i) casting, (ii) homogenization,
and (iii) post-homogenization cooling are compared in the study.
The temperature profile at the three positions during the proposed homogenization
schedule for AA7050 (CHAPTER 4) are compared in Figure 7.3. The temperatures at the
3 positions (Figure 7.2) during heating, holding, and cooling does not vary much for a billet
of radius 0.35m. The Biot number, Bi(=hr/kc) indicates the dominant heat transfer mode,
is 0.023 and 0.23 during heating and cooling respectively. Bi << 1 indicates heat conduction
in the billet offers little resistance to heat transfer and the temperature difference in the
body is small compared to the external temperature difference as seen in the results.
However, it would have made a difference for a larger sized billet.
7.3 Radial Variation in Microstructure
7.3.1 Initial As-cast Microstructure
The initial as-cast microstructure was based on the predictions by the DC-Cast
solidification model for a AA7050 alloy of nominal composition Al-6.2Zn-2.3Cu-2.25Mg-
0.115Zr. The mixture composition and local solidification time (LST) were taken at three
different radial locations at an axial height of 1.5m from a billet of height 3m. Figure 7.4
shows the mixture composition for Zn, Cu, and Mg, the LST, and the calculated secondary
dendrite arm spacing for the surface, mid-radius, and centerline. The LST was calculated

161
based on when the control volume started and finished solidification and does not take into
consideration the movement of solid particles. To take account of solid motion, the LST is
assumed to be within 10% of the value predicted by the model. The relationship between
Figure 7.3: The homogenization heating, holding, and cooling cycle chosen in the study
showing little variation in temperatures at the 3 positions studied.
LST and SDAS was taken from Dantzig and Rappaz64, which is valid for Al alloys where
0.1 s < LST < 107 s.
𝜆2 = 𝐾𝑡𝑓1/3 (6.4)
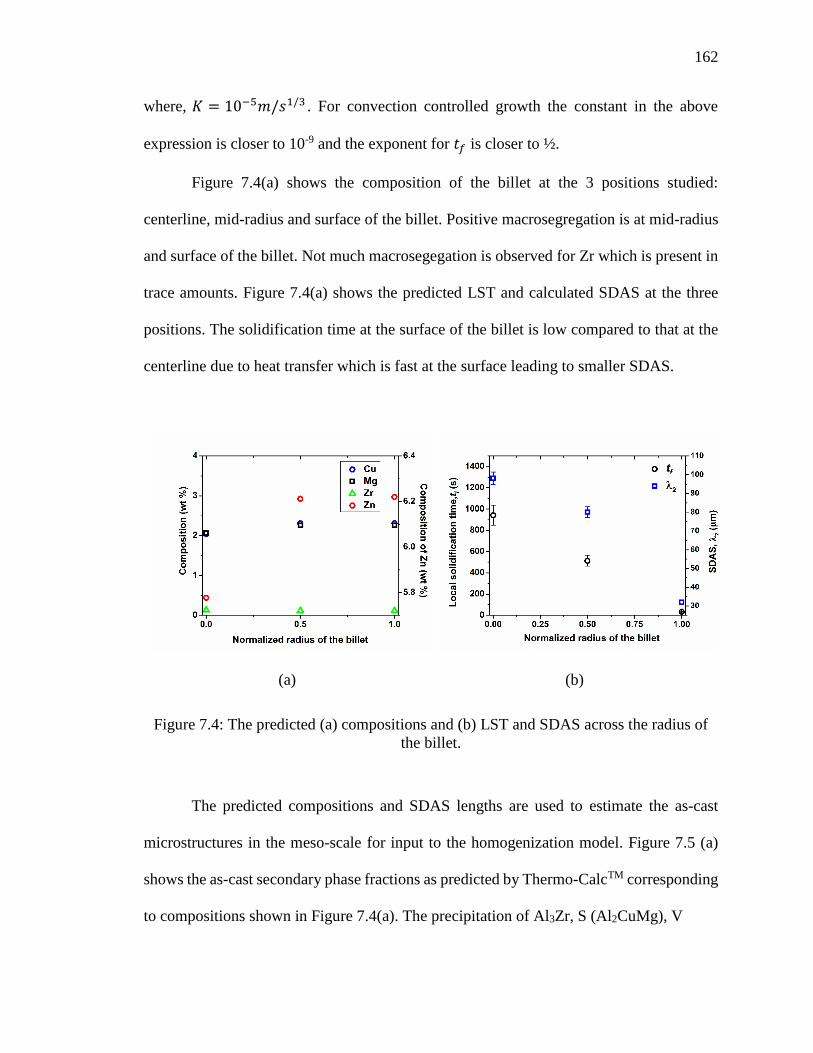
162
where, 𝐾 = 10−5𝑚/𝑠1/3 . For convection controlled growth the constant in the above
expression is closer to 10-9 and the exponent for 𝑡𝑓 is closer to ½.
Figure 7.4(a) shows the composition of the billet at the 3 positions studied:
centerline, mid-radius and surface of the billet. Positive macrosegregation is at mid-radius
and surface of the billet. Not much macrosegegation is observed for Zr which is present in
trace amounts. Figure 7.4(a) shows the predicted LST and calculated SDAS at the three
positions. The solidification time at the surface of the billet is low compared to that at the
centerline due to heat transfer which is fast at the surface leading to smaller SDAS.
(a) (b)
Figure 7.4: The predicted (a) compositions and (b) LST and SDAS across the radius of
the billet.
The predicted compositions and SDAS lengths are used to estimate the as-cast
microstructures in the meso-scale for input to the homogenization model. Figure 7.5 (a)
shows the as-cast secondary phase fractions as predicted by Thermo-CalcTM corresponding
to compositions shown in Figure 7.4(a). The precipitation of Al3Zr, S (Al2CuMg), V

163
(a)
(b) (c)
Figure 7.5: (a) Predicted as-cast volume fractions of secondary phases at different radial
positions in the billet; The microsegregation across the grains for (b) Cu and Zr and (c)
Zn and Mg.

164
(solution of Mg2Zn11 and Al5Cu6Mg2) and T(Al2Mg3Zn3) phases are predicted by Thermo-
CalcTM. As the compositions and temperatures of the mid-radius and surface positions are
the same, the volume fraction of the secondary phases are the same. The secondary phases
in general are more at the surface which has a higher composition. However, the primary
Al3Zr is higher at the centerline due to higher Zr composition at the centerline which
follows a macrosegregartion pattern reverse of other elements.
The predicted compositions are also used in Figure 7.5(b) and (c) to show the
microsegregation predicted by Thermo-CalcTM at the centerline and surface of the billet
respectively. The amount of Zn, Cu and Mg is higher at the mid-radius and surface
positions, leading to higher amounts of these elements across the grain, while Zr is higher
at the centerline.
The initial microstructure for the homogenization model at each position is
represented by the 1D half-grain domain described in Section 4.2 of CHAPTER 4 with the
predicted microsegregation of elements and interdendritic phases in the interdendritic 1st
cell. The T and V are taken as a single phase and they convert to the S phase.
7.3.2 Homogenized Microstructure
Microstructure changes at the grain boundaries and also across the grain during
homogenization. The transformation and dissolution of the T, V and S phases occurs at the
grain boundaries while nano-sized coherent metastable Al3Zr are precipitated across the
grain. Due to different compositions across the radius of the billet which leads to a
difference in the as-cast interdendritic phase fractions, there is a variation in the
transformation and dissolution kinetics as shown in Figure 7.6. The three homogenization

165
(a) (b)
(c)
Figure 7.6: (a) Evolution of the T+V phases; (b) S phase during homogenization; (c) The
number density and mean radii of the dispersoids across the radii of the billet after Step II
of homogenization.

166
steps involving 10 hours at 420°C to precipitate dispersoids followed by a second step at
470°C to dissolve T+V and a third at 480°C to minimize S is provided.
During step I, the T+V transform to S. After step I, the amount of T+V and S at the
centerline is less than that at the mid-radius and surface positions because of the lower as-
cast volume fraction of T+V. During step II, the T+V completely dissolve at the centerline
in 3.5 hrs while they do so for the surface and mid-radius positions in 4 hrs as seen in
Figure 7.6(a). If we move on to the next step without allowing for complete dissolution of
T+V across the entire cross section of the billet, these phase might melt. To ensure the T+V
phases do not melt, we need to move on to the next step after 4 hours. Redissolution of
some of the precipitated S phase is observed (‘reversion’) during heating from 420°C to
470°C and from 470°C to 480°C as seen in Figure 7.6(b). Step III involves dissolution of
the S phase in which the billet has to be heated for more than 10 hours.
Dispersoids of Al3Zr precipitate in the grains across the cross section of the billet.
The centerline is Zn, Cu and Mg lean and Zr rich compared to the mid radius and the
surface. Solute lean centerline has more primary Al3Zr as seen in Figure 7.5(a) still leaving
more Zr during microsegregation as seen in Figure 7.5(c). As seen in Figure 7.6(c), the
number densities and mean radii of the dispersoids are both higher at the centerline than at
the surface and mid-radius positions due to more nucleation and growth due to higher
supersaturation of Zr at the centerline. This leads to higher probability of recrystallization
at the periphery than at the center of the billet. This is also observed in industrial extrusions,
where peripheral coarse grained microstructures118 is a major problem.

167
7.3.3 Post-homogenization Cooled Microstructure
Industrial practice of cooling the billet involves forcing air over its surface after the
furnace is switched off. As seen in Figure 7.3, this practice causes cooling at a rate of
approximately 148°C/hr at all the three radial positions. The precipitation model is used to
simulate the microstructural evolution during post-homogenization cooling. The
precipitation of S (Al2CuMg), η (MgZn2), T (Al2Mg3Zn3) and Ө(Al2Cu), in the decreasing
order of temperature, is predicted by the model at all the radial positions.
The number density of the η and T phases are more towards the surface than at the
center while the undesirable S phase is more at the centerline, due to higher Zn at the mid-
radius and surface positions as seen in Figure 7.7(a). The mean lengths of these platelets
are longer and volume fractions are higher at the surface as seen in Figure 7.7(b) and (c)
due to higher solute available for growth. As seen in Figure 7.7(d) the size of the S platelets
at the surface exceeds 0.6μm and may not dissolve during pre-heat and may cause melting
at the surface which may affect the surface finish7. Also larger precipitates at the surface
may lead to particle stimulated nucleation of recrystallized grains15 leading to
inhomogeneous mechanical properties across the cross section of the billet. The solute
remaining in the matrix is higher at the surface leading to more extrusion pressure required
for extrusion9. The precipitation during cooling, in general produces inhomogeneous
precipitation leading to inhomogeneous mechanical properties across the cross section of
the billet.
7.4 Process Recommendations
Based on the study, a billet of radius 0.35m needs to be homogenized for 10 hrs at
420 °C to precipitate dispersoids, 4 hrs at 470°C to dissolve T+V and more than 10 hrs at

168
(a) (b)
(c) (d)
(e)
Figure 7.7: The radial variation of (a) number density, (b) mean length of the platelets, (c)
volume fraction, (d) size distribution of the phases precipitated during cooling under
industrial conditions and (e) radial variation of the composition of the matrix.

169
480°C to minimize S phase. Sampling at the mid-radius and surface is necessary to
determine a proper homogenization schedule as they have a higher composition leading to
higher volume fractions of secondary interdendritic phases which take longer to dissolve
during step II. Increasing the temperature to 480°C before T dissolves in the entire cross-
section may cause melting at the surface and mid-radius causing pores degrading the
mechanical properties of the billet.
The Zr macrosegregation in the billet causes higher Zr at the centerline position
leading to higher Al3Zr dispersoid number density compared to the surface making the
surface more prone to recrystallization. Addition of a trace element with a
macrosegregation profile reverse of that of Zr would solve the problem both at the macro
and the micro scale. Addition of Scandium, which has a partition coefficient less than 1
(whereas kZr>1) is a viable solution to the problem leading to macrosegregation and
microsegregation patterns reverse of Zr119. A kSc <1 would lead to segregation reverse of
Zr and precipitate L12 Al3Sc and Al3(Sc,Zr) in regions lean in Zr. The Al3(Sc,Zr)
dispersoids are nano-sized and coherent and more efficient than Al3Zr in increasing the
strength.119 Thus, addition of Sc may not only lead to uniform mechanical properties across
the cross section of the billet, but may also reduce dispersoid free zones by precipitating
Al3(Sc,Zr) type precipitates close to the grain boundary. Sc in the range of 0.18-0.2% can
be added to Zr (0.1-0.2%) containing 7XXX alloys.
Precipitation during cooling under industrial conditions, produces precipitates more
in number and larger in size (>6 μm) at the surface than at the centerline position. The
larger precipitates may induce particle stimulated nucleation of the recrystallization which
can be inhibited by having more dispersoids at these positions. This is possible by having

170
Sc in the alloy as described above. The particles may also not dissolve affecting the surface
finish for which a cooling rate higher than the general industrial practice is needed.
7.5 Conclusion
The radial variation of microstructure during DC-casting and homogenization of a
cylindrical billet of radius 0.35m has been studied. The DC casting model by Fezi et al.22
and homogenization model from the current work have been used to characterize the radial
variation of microstructure. Macrosegregation causes difference in compositions across the
cross section of the billet leading to higher compositions and interdendritic phases at the
mid-radius and surface positions. 10 hrs at 420°C, 4 hrs at 470°C and more than 10hrs at
480°C leads to homogenization across the entire billet without remelting any of the
interdendritic phases when taken to higher temperatures. This schedule matches the
scheduled proposed for this alloy in CHAPTER 4. The lower Zr content at the surface
leading to lower number densities of Al3Zr dispersoids, so these regions are more prone to
recrystallization. Addition of Sc in the range of 0.18-0.2%, might lead to more uniform
microstructure and mechanical properties across the grains and also across the cross section
of the billet. Post-homogenization cooling under industrial conditions leads to larger
precipitates at the surface which may cause particle stimulated nucleation of
recrystallization or may even remain undissolved during preheat causing melting. Using
higher cooling rates can reduce the size of the precipitates as discussed in CHAPTER 5.
Higher cooling rates are only possible for smaller sections.

171
CHAPTER 8. CONCLUSIONS AND RECOMMENDATIONS FOR FUTURE WORK
8.1 Conclusions
Numerical models have been developed to study the microstructural evolution at
the SDAS and dispersoid length scales during homogenization and post-homogenization
quenching of Al-Si-Mg-Fe-Mn (6XXX) and Al-Zn-Cu-Mg-Zr (7XXX) alloys. The models
are able to predict microstructures which match experiments well. The effect of
temperature, composition, cooling rates and initial microstructural features are studied.
Recommendations for improvement of the homogenization schedule for improved
extrudability and age-hardenability are suggested. The models developed have been
applied to study the radial distribution of microstructure to devise a homogenization
schedule for a DC-cast cylindrical billet of radius 0.35 m.
In Al-Si-Mg-Fe-Mn alloys, two models which simulate microstructural evolution
at the SDAS and dispersoid length scales are loosely coupled with each other. The needle-
like β-AlFeSi in the as-cast microstructure transform into globular α-Al(FeMn)Si during
homogenization, while Mg2Si dispersoids precipitate during post-homogenization cooling.
These phase transformations are diffusion controlled processes, transfer of solute across
the grains being the slowest step during phase transformation. While Fe and Mn
composition differences between the matrix and phase interface drive the initial stage of
172
the homogenization phase transformation, only Fe composition differences influence the
later stage. The Mg2Si precipitation during quenching is driven by Mg supersaturation in
the matrix.
Homogenization at a temperature of 580°C for 8 hrs and cooling at 250°C/hr are
suggested for Al-0.83Si-0.7Mg-0.27Fe-0.18Mn alloy. For further improvement, this
composition can be modified to CFe < 0.17, CMn > 0.2, and CSi between 0.6 and 0.8,
producing a microstructure with no β-AlFeSi needles after homogenization for 8 hrs at
580°C. The composition is still within the specification for 6XXX alloys. On the other
hand, 0.5-0.7% Mg can produce Mg2Si dispersoids which are <1 μm, with only a slight
effect on extrusion flow stress. Finally, homogenization time can also be decreased by
refining the as-cast structure by higher solidification rates and the use of grain refiners.
Higher solidification rates can be achieved by “Fusible Metal Mold”120 technique, in which
a low melting metal is added on the surface of the mold which melts and fills in the air gap
between the mold and the casting.
In 7XXX series alloys, a model of coupled phase transformations at two different
length scales during homogenization of Al-Zn-Cu-Mg-Zr alloys has been developed. A
CA-FV based model which simulates elemental diffusion in a grain and microstructural
evolution of the interdendritic η and S phases has been linked to a PSD-based model which
simulates precipitation of Al3Zr dispersoids across the grain, providing a comprehensive
picture of time evolution of microstructure. The sluggish nature of the η to S phase
transformation is attributed to interface-controlled kinetics, where transfer of Cu atoms at
the interface is the slowest step in phase transformation. This is included in the numerical
model. During homogenization, η transforms to S phase after which S phase dissolves to

173
reach the equilibrium volume fraction. While this S phase dissolution occurs, the Al3Zr
dispersoids precipitate and grow throughout the grain, although they are mostly found near
the grain center which has the highest Zr concentration in the as-cast microstructure.
Based on the sequence and rates of transformations, a three-stage homogenization
schedule is suggested for this alloy. Homogenization at 420°C for 10 rs, followed by 470°C
for 4 hrs and 480°C for 15 hrs, is seen to produce a microstructure consisting of uniform
nanosized dispersoids with maximum pinning pressure and minimum secondary phases.
The overall composition affects the volume fraction of secondary particles and
microsegregation during solidification, and this has a profound effect on the
microstructural evolution during homogenization and subsequent processing. Higher Zn,
Cu and Mg contents lead to higher amounts of interdendritic T, V and S phase particles
and hence require more time to homogenize. Higher alloying content also leads to
increased ‘quench sensitivity’ which makes it difficult to subdue precipitation even at high
cooling rates. Higher alloy content also leads to decreased solid solubility of Zr, leading to
higher driving force for nucleation of dispersoids. This is however, possible only when the
cooling rate during solidification is fast enough to prevent primary Al3Zr from nucleating
in the as-cast structure. Those precipitates would be much coarser than those formed during
homogenization with incoherent interface and would decrease the amount of Zr available
for precipitation of dispersoids which is undesirable. For solidification under normal
conditions, higher alloying content leads to lower number densities for dispersoids. Based
on the present study an improved composition range of 6-8%Zn, 1-2%Cu, 1-2%Mg and
0.1-0.15%Zr has been suggested. The suggested composition has lesser Cu than AA7050
and lesser Zn compared to AA7075. Cu is added to AA7050 to increase corrosion

174
resistance and age hardenability whereas Zn leads to increase in strength in AA7075. The
suggestions here are solely based on ease of homogenization and extrusion. Other factors
have not been taken into account.
The effect of cooling rates and compositions on the precipitation response are
evaluated. A very high cooling rate of >500°C /hr can lead to minimum precipitation with
precipitates <0.6 μm which can easily dissolve during preheat. Cooling at >10°C/s
(36000°C/hr) can lead to even lower precipitation which is desired after solution treatment
for improved age-hardenability. The composition range of 6-8% Zn, 1-1.5%Cu and ~2%
Mg is found to reduce the amount of precipitated coarse S phase leading to easily
extrudable microstructures with good age hardenability. The CCC and TTT curves for
AA7050 have also been predicted by the numerical model.
The radial variation of microstructure during DC-casting and homogenization of a
cylindrical billet of radius 0.35 m has been studied. The DC casting model by Fezi et al.22
and homogenization model from the current work have been used to characterize the radial
variation of microstructure. Macrosegregation causes difference in compositions across the
cross section of the billet leading to higher compositions and interdendritic phases at the
mid-radius and surface positions. A heat treatment of 10 hrs at 420°C, 4 hrs at 470°C and
more than 10 hrs at 480°C leads to homogenization across the entire billet without
remelting any of the interdendritic phases. This matches the homogenization schedule for
AA7050 proposed in CHAPTER 4. Due to lower Zr content at the surface leading to lower
number densities of Al3Zr dispersoids, these regions are more prone to recrystallization.
Addition of Sc might lead to more uniform microstructure and mechanical properties
across the grain and across the cross section of the billet. Industrial cooling practice leads

175
to precipitation of the undesirable phases larger than 0.6 μm at the surface which might not
dissolve and affect the surface finish of the extrudate. Quenching at higher cooling rates is
therefore, desired.
8.2 Future Work
This work studies the homogenization heat treatment in Al-Si-Mg-Fe-Mn and Al-
Zn-Cu-Mg-Zr alloys in detail. The phase transformation kinetics is predicted and process
recommendations are made. There are, however, other related areas where additional work
must be done. The predictive ability of the numerical model developed can be increased
and extended to other processes.
8.2.1 Experimental Verification of Interface Reaction-controlled Phase Transformations
The η to S phase transformation has been discussed in CHAPTER 4 and is predicted
to be interface reaction rate-controlled, unlike the other important reactions which are
diffusion controlled. The transfer of Cu atoms across the interface is slower than its
diffusion across the grain. This aspect of the phase transformation can to be investigated
further.
One way of finding whether a transformation is interface reaction controlled is by
finding the Avrami exponent, n as in eqn. 3.1. The values of n in the range of 3 or above
indicates an interface reaction rate control70. However, the transformation of η to S is
accompanied with other transformations of dissolution of η and S, making it difficult to
find out experimentally.
Another method would be to monitor the interface mobility with time. For interface
reaction rate control the interface velocity should be constant121 leading to a linear
dependence of transformed volume fraction on time. This method, although possible, has

176
to be conducted in very controlled environments so that the measurements are not affected
by other transformations occurring.
An experimental verification of the kinetics would involve observation of the η/S
interface. The ratio of the ledge lengths to the ledge heights seen on the interfaces are
indicative of the kinetic rate controlling step for plate like precipitates122. Larger ledge
length to height ratios indicate inhibition of interface movement related to interface
reaction rate control. Numerical study by Wang et al.123 propose interface reaction rate
control for ledge length to height ratio greater than 128 is no longer diffusion controlled
transformation. Such an experimental verification through Transmission Electron
Microscopy (TEM) would be advantages to better understand the kinetics.
8.2.2 Computationally Efficient 2D Microstructural Model
CHAPTER 2 describes the 2D CA-FV based diffusion-based numerical model used
to study the microstructural evolution in Al-Si-Mg-Fe-Mn alloys during homogenization.
The study is later discussed in detail in CHAPTER 3. This growth algorithm from this
model has been used by the numerical model to study microstructure in Al-Zn-Cu-Mg-Zr
alloys. However, the Al-Zn-Cu-Mg-Zr alloy model is 1D and couples the precipitation
model for modeling the simulataneous precipitation of dispersoids. The interface reaction
rate controlled growth algorithm in this model has been developed for a 1D domain and
can be extended to 2D.
The 2D extension of the 1D model for Al-Zn-Cu-Mg-Zr alloys requires piecewise
linear “interface reconstruction”52,124,125. As the normal of the interface is already
calculated for finding the curvature, interface reconstruction should be easy and straight-
forward. The normal can be used to create a linear interface perpendicular to it depending
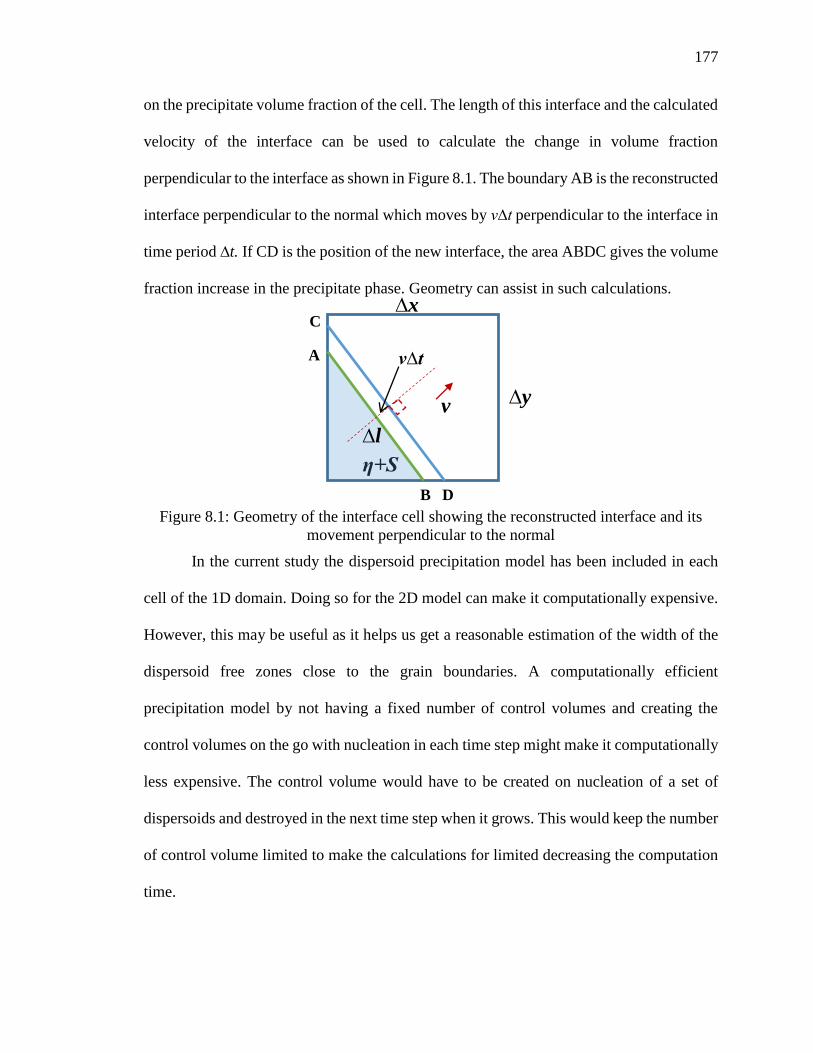
177
on the precipitate volume fraction of the cell. The length of this interface and the calculated
velocity of the interface can be used to calculate the change in volume fraction
perpendicular to the interface as shown in Figure 8.1. The boundary AB is the reconstructed
interface perpendicular to the normal which moves by v∆t perpendicular to the interface in
time period ∆t. If CD is the position of the new interface, the area ABDC gives the volume
fraction increase in the precipitate phase. Geometry can assist in such calculations.
Figure 8.1: Geometry of the interface cell showing the reconstructed interface and its
movement perpendicular to the normal
In the current study the dispersoid precipitation model has been included in each
cell of the 1D domain. Doing so for the 2D model can make it computationally expensive.
However, this may be useful as it helps us get a reasonable estimation of the width of the
dispersoid free zones close to the grain boundaries. A computationally efficient
precipitation model by not having a fixed number of control volumes and creating the
control volumes on the go with nucleation in each time step might make it computationally
less expensive. The control volume would have to be created on nucleation of a set of
dispersoids and destroyed in the next time step when it grows. This would keep the number
of control volume limited to make the calculations for limited decreasing the computation
time.
η+S
B
A
D
C
v
v∆t
∆l
∆y
∆x

178
8.2.3 Modeling Thermo-CalcTM based Solidification Microstructure
Cellular Automata have been used by researchers45,126,127 in the past for predicting
solidification microstructures. However, most of these studies were on binary alloys
involving only a liquid and one solid phase. Also, the thermodynamic data was used from
previous literature through partition coefficients and empirical relationships. The current
model predicts microstructure during phase transformations involving 3 phases for a 4
component alloy system. The model extracts thermodynamic data from Thermo-CalcTM
through TQ-Interface. This model can be modified to predict Thermo-Calc based
solidification microstructure in a multicomponent alloy.
As the model can handle 3 phases, the nucleation of the primary α matrix can easily
be modelled with the third phase being the eutectic mixture. The curvature model can be
used to calculate undercooling which leads to the dendritic morphology. The major
modification would be the thermodynamic model and use of the TQ-Interface based on the
alloy being studied. The model can also be extended to more number of alloying elements
by modification of the growth algorithm.
8.2.4 Modeling Homogenization during Post-solidification Cooling
Homogenization is a post-solidification heat treatment and can start during the
cooling from solidification. Solidification involves cooling from very high temperatures
typically 650°C for aluminum alloys. The models developed in this study can be used to
study the evolution of microstructure in alloys during post-solidification cooling. The
change in microstructure is considerable given that the high temperatures reached and time
taken by the casting to cool. This makes a difference in alloys which take comparatively
less time to homogenize, such as the 6XXX alloys.

179
Considering the geometry and dimensions of the casting, the initial microstructure
may have a spatial variation which can be modeled as a heat transfer problem similar to
CHAPTER 6. While the surface which cools faster may “homogenize” less, the center may
remain comparatively more “homogenized”. Also, depending on the cooling rate the
precipitation response, which depends on the Mg concentrations and cooling rates, would
also be different which can be tracked using the precipitation model. The transformation
of interdendritic particles, precipitation of spherical and plate-like precipitates can be
modeled easily.
8.2.5 Experimental Verification of Composition Effects in 7XXX Alloys
The effect of compositional variations on the evolution of interdendritic and
dispersoid phases has been discussed in CHAPTER 5. Some of the results involving
dispersoid number density and mean radius and their variation on varying the Zn, Cu and
Mg compositions differ from those predicted by numerical model by Robson and
Pragnell.18 The reason behind this discrepancy is the precipitation of DO23 Al3Zr during
solidification which reduces the amount of Zr available for precipitation of dispersoids
during homogenization which was not considered by Robson and Prangnell18. This finding
from Thermo-Calc predictions has to be verified experimentally.
The Al3Zr formed during casting can be studied through microscopic observation
of as-cast microstructures of alloys of various compositions. The number densities
predicted after homogenization can also be compared to that of experimentally
homogenized samples. It should however take into consideration the dispersoids which
were formed during casting. The primary Al3Zr are mostly petal-like as found by Knipling
et al.119 in Al-Sc-Zr alloys.

180
REFERENCES

180
REFERENCES
1. Mrówka-Nowotnik G, Sieniawski J, Wierzbińska M. Analysis of intermetallic
particles in AlSi1MgMn aluminium alloy. J Achiev Mater Manuf Eng. 2007;20:7-8.
2. Deng Y, Yin Z, Cong F. Intermetallic phase evolution of 7050 aluminum alloy
during homogenization. Intermetallics. 2012;26:114-121.
doi:10.1016/j.intermet.2012.03.006.
3. Zajac S, Hutchinson B, Johansson A, Gullman LO. Microstructure control and
extrudability of Al–Mg–Si alloys microalloyed with manganese. Mater Sci Technol.
1994;10(4):323-333. doi:10.1179/mst.1994.10.4.323.
4. Gandin C-A, Jacot A. Modeling of precipitate-free zone formed upon
homogenization in a multi-component alloy. Acta Mater. 2007;55(7):2539-2553.
doi:10.1016/j.actamat.2006.11.047.
5. Robson JD. Optimizing the homogenization of zirconium containing commercial
aluminium alloys using a novel process model. Mater Sci Eng. 2002;338:219-229.
6. Lassance D, Schmitz M, Delannay F, Pardoen T. Linking microstructure and high
temperature ductility in aluminium alloys AA6xxx. 15th Eur Conf Fract Adv Fract
Mech Life Saf Assess. 2004.
7. Minoda T, Hayakawa H, Yoshida H. A mechanism of pick-up formation on 6063
aluminum alloy extrusions. Keikinzoku/Journal Japan Inst Light Met.
1999;49(6):253-257.
8. Milkereit B, Wanderka N, Schick C, Kessler O. Continuous cooling precipitation
diagrams of Al–Mg–Si alloys. Mater Sci Eng A. 2012;550:87-96.
doi:10.1016/j.msea.2012.04.033.

181
9. McQueen HJ, Spigarelli S, Kassner ME, Evangelista E. Hot Deformation and
Processing of Aluminum Alloys. CRC Press; 2011.
10. Wang H, Xu J, Kang Y, Tang M, Zhang Z. Study on inhomogeneous characteristics
and optimize homogenization treatment parameter for large size DC ingots of Al–
Zn–Mg–Cu alloys. J Alloys Compd. 2014;585:19-24.
doi:10.1016/j.jallcom.2013.09.139.
11. Fan X, Jiang D, Meng Q, Zhang BY, Wang T. Evolution of eutectic structures in
Al-Zn-Mg-Cu alloys during heat treatment. Trans Nonferrous Met Soc China.
2006:577-581.
12. Jia P, Cao Y, Geng Y, He L, Xiao N, Cui J. Studies on the microstructures and
properties in phase transformation of homogenized 7050 alloy. Mater Sci Eng A.
2014;612:335-342. doi:10.1016/j.msea.2014.06.027.
13. Lim ST, Eun IS, Nam SW. Control of equilibrium phases (M, T, S) in the modified
aluminum alloy 7175 for thick foriging applications. Mater Trans. 2003;44(1):181-
187.
14. Godard D, Archambault P, Aeby-Gautier E, Lapasset G. Precipitation sequences
during quenching of the AA 7010 alloy. In: Acta Materialia. Vol 50. ; 2002:2319-
2329. doi:10.1016/S1359-6454(02)00063-0.
15. F. J. Humphreys, Hatherly M. Recrystallization and Related Annealing Phenomena.
Oxford, UK: Pergamon Press; 1996.
16. Wu L-M, Wang W-H, Hsu Y-F, Trong S. Effects of homogenization treatment on
recrystallization behavior and dispersoid distribution in an Al–Zn–Mg–Sc–Zr alloy.
J Alloys Compd. 2008;456(1-2):163-169. doi:10.1016/j.jallcom.2007.02.054.
17. Kuijpers NCW, Vermolen FJ, Vuik K, Zwaag S Van Der. A Model of the β-AlFeSi
to α-Al ( FeMn ) Si Transformation in Al – Mg – Si Alloys. Mater Trans.
2003;44(7):1448-1456.
18. Robson J., Prangnell P. Modelling Al3Zr dispersoid precipitation in
multicomponent aluminium alloys. Mater Sci Eng A. 2003;352(1-2):240-250.
doi:10.1016/S0921-5093(02)00894-8.

182
19. Cavazos JL, Colas R. Quench sensitivity of a heat treatable aluminum alloy. Mater
Sci Eng A. 2003;363(1-2):171-178. doi:10.1016/S0921-5093(03)00616-6.
20. Allison J, Li M, Wolverton C, Su XM. Virtual aluminum castings: An industrial
application of ICME. JOM. 2006;58(11):28-35. doi:10.1007/s11837-006-0224-4.
21. Allison J. Integrated computational materials engineering: A perspective on
progress and future steps. JOM. 2011;63(4):15-18. doi:10.1007/s11837-011-0053-
y.
22. Fezi K, Coleman J, Krane MJM. Macrosegregation during Direct Chill Casting of
Aluminum Alloy 7050. In: Light Metals 2015. Hoboken, NJ, USA: John Wiley &
Sons, Inc.; 2015:871-875. doi:10.1002/9781119093435.ch146.
23. Aaron HB. On the Kinetics of Precipitate Dissolution. Met Sci J. 1968;2(1):192-193.
doi:10.1179/030634568790443170.
24. Whelan MJ. On the Kinetics of Precipitate Dissolution. Met Sci. 1969;3(4):95-97.
doi:10.1179/030634568790443170.
25. Tanzilli RA, Heckel RW. Numerical Solutions to the Finite, Diffusion-Controlled,
Two-Phase, Moving-Interface Problem (with Planar, Cylindrical, and Spherical
Interfaces). Trans Metall Soc AIME. 1968;242(November):2313-2321.
26. Aaron HB, Kotler GR. Second phase dissolution. Metall Trans. 1971;2(2):393-408.
doi:10.1007/BF02663326.
27. Nolfi F V, Shewmon PG, Foster JS. The Dissolution and Growth Kinetics of
Spherical Precipitates. 1969;245(July):1427-1433.
28. Tundal UH, Ryum N. Dissolution of particles in binary alloys: part I. computer
simulations. Metall Trans A. 1992;23(2):433-444. doi:10.1007/BF02801160.
29. Nojiri N, Enomoto M. Diffusion-controlled dissolution of a spherical precipitate in
an infinite binary alloy. Scr Metall Mater. 1995;32(5):787-791. doi:10.1016/0956-
716X(95)91604-N.
30. Enomoto M. Influence of interfacial curvature on the growth and dissolution kinetics
of a spherical precipitate. Scr Mater. 1997;36(6):625-632. doi:10.1016/S1359-
6462(96)00432-0.

183
31. Sinder M, Pelleg J. On homogenization of a binary alloy after dissolution of planar
and spherical precipitates. Metall Mater Trans A. 2000;31(June):1525-1530.
doi:10.1007/s11661-000-0163-6.
32. Vermolen F, Vuik K, Zwaag S Van Der. A mathematical model for the dissolution
kinetics of Mg 2 Si-phases in Al – Mg – Si alloys during homogenisation under
industrial conditions. 1998;254:13-32.
33. Dons AL. The Alstruc homogenization model for industrial Al alloys. J Light Met.
2001;1:133-149.
34. Das SK, Kang D-H, Jung I-H. Experimental and Diffusion Simulation for the
Homogenization of As-cast Mg-Al, Mg-Zn, and Mg-Al-Zn Alloys. Metall Mater
Trans A. 2014;45(11):5212-5225. doi:10.1007/s11661-014-2443-6.
35. Warnken N, Ma D, Drevermann a., Reed RC, Fries SG, Steinbach I. Phase-field
modelling of as-cast microstructure evolution in nickel-based superalloys. Acta
Mater. 2009;57(19):5862-5875. doi:10.1016/j.actamat.2009.08.013.
36. Böttger B, Carré A, Eiken J. Simulation of microstructure formation in technical
aluminum alloys using the multiphase-field method. Trans Indian ….
2009;62(October):299-304. http://link.springer.com/article/10.1007/s12666-009-
0046-5.
37. Eivani a. R, Ahmed H, Zhou J, Duszczyk J. Evolution of Grain Boundary Phases
during the Homogenization of AA7020 Aluminum Alloy. Metall Mater Trans A.
2009;40(3):717-728. doi:10.1007/s11661-008-9741-9.
38. Eivani a. R, Ahmed H, Zhou J, Duszczyk J. An experimental and theoretical
investigation of the formation of Zr-containing dispersoids in Al–4.5Zn–1Mg
aluminum alloy. Mater Sci Eng A. 2010;527(9):2418-2430.
doi:10.1016/j.msea.2010.01.012.
39. Samaras SN, Haidemenopoulos GN. Modelling of microsegregation and
homogenization of 6061 extrudable Al-alloy. J Mater Process Technol. 2007;193(1-
3):63-73. doi:10.1016/j.jmatprotec.2007.03.126.

184
40. Haidemenopoulos GN, Kamoutsi H, Zervaki a. D. Simulation of the transformation
of iron intermetallics during homogenization of 6xxx series extrudable aluminum
alloys. J Mater Process Technol. 2012;212(11):2255-2260.
doi:10.1016/j.jmatprotec.2012.06.026.
41. Robson J. A new model for prediction of dispersoid precipitation in aluminium
alloys containing zirconium and scandium. Acta Mater. 2004;52(6):1409-1421.
doi:10.1016/j.actamat.2003.11.023.
42. Du Q, Poole WJ, Wells M a., Parson NC. Microstructure evolution during
homogenization of Al–Mn–Fe–Si alloys: Modeling and experimental results. Acta
Mater. 2013;61(13):4961-4973. doi:10.1016/j.actamat.2013.04.050.
43. Wagner R, Kampmann R, Voorhees PW. Homogeneous Second-Phase Precipitation.
In: Phase Transformations in Materials. Weinheim, FRG: Wiley-VCH Verlag
GmbH & Co. KGaA; 2005:309-407. doi:10.1002/352760264X.ch5.
44. Pope SB. Computationally efficient implementation of combustion chemistry using
in situ adaptive tabulation. Combust Theory Model. 1997;1(1):41-63.
doi:10.1088/1364-7830/1/1/006.
45. Krane MJM, Johnson DR, Raghavan S. The development of a cellular automaton-
finite volume model for dendritic growth. Appl Math Model. 2009;33(5):2234-2247.
doi:10.1016/j.apm.2008.06.007.
46. Shao R, Trumble K, Krane M. Effects of geometric constrains on alloy solidification
in metal-matrix composites. In: Modeling of Casting, Welding and Advanced
Solidifcation Processes - XII. ; 2009:495-503.
47. Patankar S. Numerical Heat Transfer and Fluid Flow. Taylor & Francis; 1980.
48. Hillert M. Solute drag , solute trapping and diffusional dissipation of Gibbs energy.
Acta Mater. 1999;47(18):4481-4505.
49. Thévoz P, Desbiolles JL, Rappaz M. Modeling of equiaxed microstructure
formation in casting. Metall Trans A. 1989;20(2):311-322.
doi:10.1007/BF02670257.
50. Swalin RA. Thermodynamics of Solids. Wiley; 1972.

185
51. Cummins SJ, Francois MM, Kothe DB. Estimating curvature from volume fractions.
Comput Struct. 2005;83(6-7):425-434. doi:10.1016/j.compstruc.2004.08.017.
52. Yanke J, Fezi K, Trice RW, Krane MJM. Simulation of Slag-Skin Formation in
Electroslag Remelting Using a Volume-of-Fluid Method. Numer Heat Transf Part
A Appl. 2015;67(3):268-292. doi:10.1080/10407782.2014.937208.
53. Morillon T. Prediction of secondary phase dissolution during heat treatment of a Ni-
Cr-Mo alloy. 2004;(December).
54. Cai M, Robson JD, Lorimer GW, Parson NC. Simulation of the Casting and
Homogenization of Two 6xxx Series Alloys. Mater Sci Forum. 2002;396-402:209-
214. doi:10.4028/www.scientific.net/MSF.396-402.209.
55. Myhr OR, Grong Ø. Modelling of non-isothermal transformations in alloys
containing a particle distribution. Acta Mater. 2000;48(7):1605-1615.
doi:10.1016/S1359-6454(99)00435-8.
56. Liu G, Zhang GJ, Ding XD, Sun J, Chen KH. Modeling the strengthening response
to aging process of heat-treatable aluminum alloys containing plate/disc- or
rod/needle-shaped precipitates. Mater Sci Eng A. 2003;344(1–2):113-124.
doi:10.1016/S0921-5093(02)00398-2.
57. Ferrante M, Doherty RD. Influence of interfacial properties on the kinetics of
precipitation and precipitate coarsening in aluminium-silver alloys. Acta Metall.
1979;27(10):1603-1614. doi:10.1016/0001-6160(79)90043-9.
58. Rougier L, Jacot A, Gandin C-A, et al. Numerical simulation of precipitation in
multicomponent Ni-base alloys. Acta Mater. 2013;61(17):6396-6405.
doi:10.1016/j.actamat.2013.07.018.
59. Sun Y, Johnson DR, Trumble K, Priya P, Krane MJM. Effect of Mg2Si Phase on
Extrusion of AA 6005 Aluminum Alloy. Light Met 2014. 2014:429-433.
60. Birol Y. The effect of homogenization practice on the microstructure of AA6063
billets. J Mater Process Technol. 2004;148(2):250-258.
doi:10.1016/j.jmatprotec.2004.01.056.
61. Birol Y. Optimization of homogenization for a low alloyed AlMgSi alloy. Mater
Charact. 2013;80(Table 1):69-75. doi:10.1016/j.matchar.2013.03.013.

186
62. Birol Y. Homogenization of en AW 6005A Alloy for Improved Extrudability.
Metall Mater Trans A. 2013;44(1):504-511. doi:10.1007/s11661-012-1379-y.
63. Kuijpers NCW. Kinetics of the β-AlFeSi to α-Al (FeMn) Si transformation in Al-
Mg-Si alloys. 2004.
64. Dantzig J, Rappaz M. Solidification. EPFL press; 2009.
65. Int Alloy Des Chem Compos Limits Wrought Alum Wrought Alum Alloy 2015 Alum
Assoc Arlington.
66. Sha G, O’Reilly K, Cantor B, Worth J, Hamerton R. Growth related metastable
phase selection in a 6xxx series wrought Al alloy. Mater Sci Eng A. 2001;304-
306:612-616. doi:10.1016/S0921-5093(00)01545-8.
67. Mondolfo LF. Aluminum Alloys: Structure and Properties. Elsevier; 2013.
68. Avrami M. Kinetics of phase change. III. Granulation, phase change, and
microstructure. J Chem Phys. 1941;9(2):177-184.
69. Johnson WA, Mehl RF. Reaction kinetics in processes of nucleation and growth.
Trans Aime. 1939;135(8):396-415.
70. Christian JW. The Theory of Transformations in Metals and Alloys. Pergamon Press,
Oxford; 1977.
71. Tanihata H, Matsuda K, Ikeno S. High Resolution Transmission Electron
Microscope Observation of the Metastable Phase in an Aged Commercial AA6063.
Mater Sci Forum. 1996;217-222:809-814.
doi:10.4028/www.scientific.net/MSF.217-222.809.
72. Skjerpe P. Intermetallic phases formed during DC-casting of an Al−0.25 Wt Pct
Fe−0.13 Wt Pct Si alloy. Metall Trans A. 1987;18(2):189-200.
doi:10.1007/BF02825700.
73. Gorny A, Manickaraj J, Cai Z, Shankar S. Evolution of Fe based intermetallic phases
in Al-Si hypoeutectic casting alloys: Influence of the Si and Fe concentrations, and
solidification rate. J Alloys Compd. 2013;577:103-124.
doi:10.1016/j.jallcom.2013.04.139.
74. Bahadur A. Intermetallic phases in Al-Mn alloys. J Mater Sci. 1988;23(1):48-54.
doi:10.1007/BF01174033.

187
75. Verma A, Kumar S, Grant PS, O’Reilly K a. Q. Influence of cooling rate on the Fe
intermetallic formation in an AA6063 Al alloy. J Alloys Compd. 2013;555:274-282.
doi:10.1016/j.jallcom.2012.12.077.
76. Hsu C, O’Reilly K A. Q, Cantor B, Hamerton R. Non-equilibrium reactions in 6xxx
series Al alloys. Mater Sci Eng A. 2001;304-306:119-124. doi:10.1016/S0921-
5093(00)01467-2.
77. Meredith MW, Worth J, Hamerton R. Intermetallic Phase Selection during
Solidification of Al-Fe-Si(-Mg) Alloys. Mater Sci Forum. 2002;396-402:107-112.
doi:10.4028/www.scientific.net/MSF.396-402.107.
78. Sha G, O’Reilly K, Cantor B, Hamerton R, Worth J. Effect of Grain Refiner on
Intermetallic Phase Formation in Directional Solidification of 6xxx Series Wrought
Al Alloys. Mater Sci Forum. 2000;331-337:253-258.
doi:10.4028/www.scientific.net/MSF.331-337.253.
79. Edwards GA, Stiller K, Dunlop GL, Couper MJ. The precipitation sequence in Al–
Mg–Si alloys. Acta Mater. 1998;46(11):3893-3904. doi:10.1016/S1359-
6454(98)00059-7.
80. Birol Y. Effect of cooling rate on precipitation during homogenization cooling in an
excess silicon AlMgSi alloy. Mater Charact. 2012;73:37-42.
doi:10.1016/j.matchar.2012.07.015.
81. Johannes VI, Jowett CW. Temperature distribution in aluminum extrsuion billets.
Six Int Alum Extrus Technol Semin. 1996.
82. Asensio-Lozano J, Suarez-Pena B, Voort GF Vander. Effect of processing steps on
the mechanical properties and surface appearance of 6063 aluminium extruded
products. Materials (Basel). 2014;7(6):4224-4242. doi:10.3390/ma7064224.
83. Williams JC, Starke EA. Progress in structural materials for aerospace systems. Acta
Mater. 2003;51(19):5775-5799. doi:10.1016/j.actamat.2003.08.023.
84. Hunsicker HY. Developement of Al-Zn-Cu-Mg alloys. Philos Trans R Soc London.
1976;282(1307):359-376.

188
85. Morere B, Shahani R, Maurice C, Driver J. The influence of Al3Zr dispersoids on
the recrystallization of hot-deformed AA 7010 alloys. Metall Mater Trans A.
2001;32(3):625-632. doi:10.1007/s11661-001-0079-9.
86. Fan X, Jiang D, Meng Q, Zhong L. The microstructural evolution of an Al–Zn–Mg–
Cu alloy during homogenization. Mater Lett. 2006;60(12):1475-1479.
doi:10.1016/j.matlet.2005.11.049.
87. Underwood EE. Quantitative Stereology. Addison-Wesley Pub. Co.; 1970.
https://books.google.com/books?id=Epg1AAAAIAAJ.
88. Doherty RD, Srolovitz DJ, Rollett AD, Anderson MP. On the volume fraction
dependence of particle limited grain growth. Scr Metall. 1987;21:675-679.
doi:http://dx.doi.org/10.1016/0036-9748(87)90383-8.
89. Robson J. Optimizing the homogenization of zirconium containing commercial
aluminium alloys using a novel process model. Mater Sci Eng A. 2002;338(1-
2):219-229. doi:10.1016/S0921-5093(02)00061-8.
90. Li XM, Starink M. J. The effect of compositional variations on characteristics of
coarse intermetallic particles in overaged 7000 aluminium alloys. Mater Sci Technol.
2001;17:1324-1328. doi:10.1179/026708301101509449.
91. Li XM, Starink MJ. DSC Study on Phase Transitions and Their Correlation with
Properties of Overaged Al-Zn-Mg-Cu Alloys. J Mater Eng Perform.
2011;21(June):977-984. doi:10.1007/s11665-011-9973-5.
92. Sharma MM, Ziemian CW, Eden TJ. Processing and Composition Effects on the
Fracture Behavior of Spray-Formed 7XXX Series Al Alloys. J Mater Eng Perform.
2010;19(9):1344-1351. doi:10.1007/s11665-010-9624-2.
93. Sharma MM. Microstructural and mechanical characterization of various modified
7XXX series spray formed alloys. Mater Charact. 2008;59(1):91-99.
doi:10.1016/j.matchar.2007.01.013.
94. Salamci E. Mechanical properties of spray cast 7xxx series aluminium alloys.
Turkish J Eng Environ Sci. 2002;26(4):345-352.
http://www.scopus.com/scopus/inward/record.url?eid=2-s2.0-
0036309869&partnerID=40&rel=R8.0.0.

189
95. Robson J., Prangnell P. Modelling Al3Zr dispersoid precipitation in
multicomponent aluminium alloys. Mater Sci Eng A. 2003;352(1-2):240-250.
doi:10.1016/S0921-5093(02)00894-8.
96. Li X, Starink MJ. Analysis of Precipitation and Dissolution in Overaged 7xxx
Aluminium Alloys Using DSC. Mater Sci Forum. 2000;331:1071-1076.
97. Kamp N, Sinclair I, Starink MJ. Toughness-Strength Relations in the Overaged 7449
Al-Based Alloy. Metall Mater Trans A. 2002;33(April).
98. Morris AJ, Robey RF, Couch PD, De los Rios E. A Comparison of the Damage
Tolerance of 7010 T7451 and 7050 T7451. Mater Sci Forum. 1997;242:181-186.
doi:10.4028/www.scientific.net/MSF.242.181.
99. Deschamps A, Brechet Y. Nature and distribution of quench-induced precipitation
in an Al-Zn-Mg-Cu alloy. Scr Mater. 1998;39(11):1517-1522.
100. Tanner DA, Robinson JS. Residual stress prediction and determination in 7010
aluminum alloy forgings. Exp Mech. 2000;40(1):75-82. doi:10.1007/BF02327551.
101. Shu WX, Hou LG, Zhang C, et al. Tailored Mg and Cu contents affecting the
microstructures and mechanical properties of high-strength Al-Zn-Mg-Cu alloys.
Mater Sci Eng A. 2016;657:269-283. doi:10.1016/j.msea.2016.01.039.
102. Sun Y. et al. unpublished work (2016).
103. Liao Y G, Han X Q, Zeng M X, Jin M. Influence of Cu on microstructure and tensile
properties of 7XXX series aluminum alloy. Mater Des. 2015;66(PB):581-586.
doi:10.1016/j.matdes.2014.05.003.
104. Wang M, Lu MS. Handbook of Light Metal Material Processing: Part I.
Metallurgical Industry Press, Beijing, China; 1979.
105. Archambault P, Godard D. High temperature precipitation kinetics and TTT curve
of a 7xxx alloy by in-situ electrical resistivity measurements and differential
calorimetry. Scr Mater. 2000;42(7):675-680. doi:10.1016/S1359-6462(99)00419-4.
106. Zhang YH, Yang SC, Ji HZ. Microstructure evolution in cooling process of Al-Zn-
Mg-Cu alloy and kinetics description. Trans Nonferrous Met Soc China (English Ed.
2012;22(9):2087-2091. doi:10.1016/S1003-6326(11)61432-5.

190
107. Robson JD. Microstructural evolution in aluminium alloy 7050 during processing.
Mater Sci Eng A. 2004;382(1-2):112-121. doi:10.1016/j.msea.2004.05.006.
108. McQueen HJ, Celliers OC. Application of hot workability studies to extrusion
processing. Part III: Physical and mechanical metallurgy of Al-Mg-Si and Al-Zn-
Mg alloys. Can Metall Q. 1997;36(2):73-86. doi:10.1016/S0008-4433(97)00003-7.
109. Zhang Y, Milkereit B, Kessler O, Schick C, Rometsch PA. Development of
continuous cooling precipitation diagrams for aluminium alloys AA7150 and
AA7020. J Alloys Compd. 2014;584:581-589. doi:10.1016/j.jallcom.2013.09.014.
110. Tanner DA, Robinson JS. Reducing residual stress in 2014 aluminium alloy die
forgings. Mater Des. 2008;29(7):1489-1496. doi:10.1016/j.matdes.2007.07.002.
111. Brooks JA, Baskes MI, Greulich FA. Solidification modeling and solid-state
transformations in high-energy density stainless steel welds. Metall Trans A.
1991;22(4):915-926. doi:10.1007/BF02659001.
112. Lippard HE, Campbell CE, Dravid VP, et al. Microsegregation behavior during
solidification and homogenization of AerMet100 steel. Metall Mater Trans B.
1998;29(1):205-210. doi:10.1007/s11663-998-0023-0.
113. Juric D, Tryggvason G. A Front-Tracking Method for Dendritic Solidification. J
Comput Phys. 1996;123(1):127-148. doi:10.1006/jcph.1996.0011.
114. Neumann L, Kopp R, Ludwig a, et al. Simulation of casting, homogenization, and
hot rolling: consecutive process and microstructure modelling for aluminium sheet
production. Model Simul Mater Sci Eng. 2004;12(1):S19-S31. doi:10.1088/0965-
0393/12/1/S02.
115. Tin S, Lee PD, Kermanpur A, Rist M, McLean M. Integrated modeling for the.
manufacture of Ni-based superalloy discs from solidification to final heat treatment.
Metall Mater Trans A. 2005;36A(9):2493-2504. doi:10.1007/s11661-005-0123-2.
116. Bird RB, Stewart WE, Lightfoot EN. Transport Phenomena. 2nd ed. John Wiley &
Sons, Inc.; 1960.
117. Hui YH. Handbook of Food Science, Technology, and Engineering. Vol 149. CRC
press; 2006.

191
118. Jensrud O. High Strength Aluminium Alloys Extrusions - A Review of the Thermo-
Mechanical-Process in High Performance Profile Manufacturing. Key Eng Mater.
2011;491:11-18. doi:10.4028/www.scientific.net/KEM.491.11.
119. Knipling KE, Karnesky RA, Lee CP, Dunand DC, Seidman DN. Precipitation
evolution in Al-0.1Sc, Al-0.1Zr and Al-0.1Sc-0.1Zr (at.%) alloys during isochronal
aging. Acta Mater. 2010;58(15):5184-5195. doi:10.1016/j.actamat.2010.05.054.
120. Ji Y-L, Zhang W, Chen X-Y, Li J-G. Increasing Solidification Rate of M2 High-
Speed Steel Ingot by Fusible Metal Mold. Acta Metall Sin (English Lett.
2016;29(4):382-387. doi:10.1007/s40195-016-0398-x.
121. Locker LD, Capio CD. Reaction kinetics of tungsten thin films on silicon (100)
surfaces. J Appl Phys. 1973;44(10):4366-4369. doi:10.1063/1.1661965.
122. Doherty RD, Ferrante M, Chen YH. On the growth kinetics of plate-shaped
precipitates. Scr Metall. 1978;12(3):885-891.
123. Wang W, Murray JL, Hu SY, Chen LQ, Weiland H. Modeling of Plate-like
Precipitates in Aluminum Alloys—Comparison between Phase Field and Cellular
Automaton Methods. J Phase Equilibria Diffus. 2007;28(3):258-264.
doi:10.1007/s11669-007-9021-1.
124. Rudman M. A volume-tracking method for incompressible multifluid flows with
large density variations. Int J Numer Methods Fluids. 1998;28(2):357-378.
doi:10.1002/(SICI)1097-0363(19980815)28:2<357::AID-FLD750>3.0.CO;2-D.
125. Rider WJ, Kothe DB. Reconstructing Volume Tracking. J Comput Phys.
1998;141(2):112-152. doi:10.1006/jcph.1998.5906.
126. Shao R, Krane M, Trumble K. Infiltration and directional solidification of CMSX-4
through a particulate ceramic preform. Metall Mater …. 2005;36(September):2461-
2469. doi:10.1007/s11661-005-0120-5.
127. Zhang S, Krane MJM, Johnson DR. Effects of Geometric Constraint on
Solidification Microstructural Development of Peritectic TiAl Alloys. Mater Sci
Forum. 2014;783-786:1147-1152. doi:10.4028/www.scientific.net/MSF.783-
786.1147.

192
128. Wolverton C. Crystal structure and stability of complex precipitate phases in Al-Cu-
Mg-(Si) and Al-Zn-Mg alloys. Acta Mater. 2001;49(16):3129-3142.
doi:10.1016/S1359-6454(01)00229-4.
129. Wang SC, Starink MJ. Precipitates and intermetallic phases in precipitation
hardening Al–Cu–Mg–(Li) based alloys. Int Mater Rev. 2005;50(4):193-215.
doi:10.1179/174328005X14357.
130. Dubost B, Audier M, Jeanmart P, Lang J, Sainfort P. Structure of stable intemetallic
compounds in the Al-Li-Cu-(Mg) and Al-Li-Zn-(Cu) systems. J Phys Colloq.
1987;48(C3):497-504.

APPENDIX

193
APPENDIX A
Diffusion Coefficients
Table A.1: Diffusion constant (Do) and activation energy (Qd) in equation (2.11) for
elements in the α-Al matrix in the presence of other elements for Al-Si-Mg-Fe-Mn alloy
system.
𝐷0(m2/s) Qd(kJ/mole)
)
𝐷0(m2/s) Qd(kJ/mole)
𝐷𝑆𝑖𝑆𝑖𝐴𝑙 1.4 × 10⁻⁵ 118 𝐷𝐹𝑒𝑆𝑖
𝐴𝑙 −2.6 × 10⁻⁷ 137
𝐷𝑆𝑖𝑀𝑔𝐴𝑙 −6.1 × 10⁻⁸ 109 𝐷𝐹𝑒𝑀𝑔
𝐴𝑙 −5.3 × 10⁻¹² 68
𝐷𝑆𝑖𝐹𝑒𝐴𝑙 −1.7 × 10⁻⁷ 106 𝐷𝐹𝑒𝐹𝑒
𝐴𝑙 2.7 × 10⁻¹ 213
𝐷𝑆𝑖𝑀𝑛𝐴𝑙 −2.5 × 10⁻⁷ 109 𝐷𝐹𝑒𝑀𝑛
𝐴𝑙 6.8 × 10⁻¹⁴ 46
𝐷𝑀𝑔𝑆𝑖𝐴𝑙 −1.3 × 10⁻⁷ 114 𝐷𝑀𝑛𝑆𝑖
𝐴𝑙 −8.6 × 10⁻⁹ 118
𝐷𝑀𝑔𝑀𝑔𝐴𝑙 2.1 × 10⁻⁵ 121 𝐷𝑀𝑛𝑀𝑔
𝐴𝑙 −7.2 × 10⁻⁹ 118
𝐷𝑀𝑔𝐹𝑒𝐴𝑙 5.4 × 10⁻⁷ 113 𝐷𝑀𝑛𝐹𝑒
𝐴𝑙 1.1 × 10⁻⁹ 111
𝐷𝑀𝑔𝑀𝑛𝐴𝑙 8.1 × 10⁻⁷ 113 𝐷𝑀𝑛𝑀𝑛
𝐴𝑙 2.6 × 10⁻³ 199
Table A.2: Diffusion constant (Do) and activation energy (Qd) in equation (2.11) for
elements in the α-Al matrix in the presence of other elements for Al-Zn-Cu-Mg-Zr alloy
system.
𝐷0(m2/s) Qd(kJ/mole) 𝐷0(m2/s) Qd(kJ/mole)
𝐷𝑍𝑛𝑍𝑛𝐴𝑙 1.2 × 10⁻⁵ 116 𝐷𝑀𝑔𝑍𝑛
𝐴𝑙 −2.1 × 10⁻⁶ 118
𝐷𝑍𝑛𝐶𝑢𝐴𝑙 −2.7 × 10⁻¹⁰ 102 𝐷𝑀𝑔𝐶𝑢
𝐴𝑙 1.8 × 10⁻⁶ 123
𝐷𝑍𝑛𝑀𝑔𝐴𝑙 −9.1 × 10⁻⁹ 110 𝐷𝑀𝑔𝑀𝑔
𝐴𝑙 2.5 × 10⁻⁵ 120
𝐷𝑍𝑛𝑍𝑟𝐴𝑙 −1.2 × 10⁻⁸ 108 𝐷𝑀𝑔𝑍𝑟
𝐴𝑙 1.6 × 10⁻⁵ 119
𝐷𝐶𝑢𝑍𝑛𝐴𝑙 −6.2 × 10⁻⁷ 120 𝐷𝑍𝑟𝑍𝑛
𝐴𝑙 −6.2 × 10⁻¹⁸ 114
𝐷𝐶𝑢𝐶𝑢𝐴𝑙 3.6 × 10⁻⁵ 135 𝐷𝑍𝑟𝐶𝑢
𝐴𝑙 −6.8 × 10⁻¹⁷ 142
𝐷𝐶𝑢𝑀𝑔𝐴𝑙 −3.7 × 10⁻⁷ 120 𝐷𝑍𝑟𝑀𝑔
𝐴𝑙 −1.8 × 10⁻¹⁷ 119
𝐷𝐶𝑢𝑍𝑟𝐴𝑙 1.34 × 10⁻⁵ 135 𝐷𝑍𝑟𝑍𝑟
𝐴𝑙 4.7 × 10⁻⁹ 115

194
APPENDIX B
List of abbreviations for phases
Table B.1: List of used phase abbreviations for Al-Si-Mg-Fe-Mn alloy system.
Phase Formula Crystal structure63
α-Al(Fe,Mn)Si Al12(FeMn)3Si, Al12(FeMn)3Si cubic
β-AlFeSi Al5FeSi, Al4.5FeSi monoclinic
β' Mg2Si monoclinic
Table B.2: List of used phases abbreviations for Al-Zn-Cu-Mg-Zr alloy system.
Phases Formula Crystal structure128–130
η/M MgZn2 orthorhombic
η' MgZn2 (precursor of η) orthorhombic
S Al2CuMg orthorhombic
S’ Al2CuMg (precursor of S) orthorhombic
T Al2Mg3Zn3, Mg32(Al,Cu,Zn)49 cubic
V/Z Mg2Zn11 + Al5Cu6Mg2 hexagonal
Ө Al2Cu tetragonal

VITA
195
VITA
Pikee Priya
Graduate School, Purdue University
Pikee Priya was born in Deoghar, India and lived with her parents, brother and sister until
secondary school after which she joined senior secondary school at DAV Jawahar Vidya
Mandir in Ranchi. She graduated from DAV in 2001. She started her engineering studies
at National Institute of Technology, Jamshedpur from which she graduated in year 2006.
She was awarded an Alumni Gold Medal for her academic performance. She worked for a
software firm as a Programmer Analyst after which she returned to academia for her
Master’s in 2009. She had an all India Graduate Aptitude Test in Engineering ranking of 1
in Metallurgical engineering. She worked on first principle Density Functional Theory
calculations for her Master’s Thesis. She started school at Purdue University under Prof.
Matthew Krane and Prof. David Johnson in Spring, 2012 where she worked on meso-scale
microstructural modeling, heat treatment experiments and microstructural characterization.
Copyright © 2022 FDOKUMEN