Response of stream invertebrates to short-term salinization: A mesocosm approach

Science of the Total Environment 511 (2015) 444–453
Contents lists available at ScienceDirect
Science of the Total Environment
j ourna l homepage: www.e lsev ie r .com/ locate /sc i totenv
Desertification, salinization, and biotic homogenization in a drylandriver ecosystem
Seiji Miyazono a,⁎, Reynaldo Patiño b, Christopher M. Taylor c
a Texas Cooperative Fish and Wildlife Research Unit, Texas Tech University, Lubbock, TX 79409-2120, USAb U.S. Geological Survey, Texas Cooperative Fish and Wildlife Research Unit, Texas Tech University, Lubbock, TX 79409-2120, USAc Department of Biology, University of Texas-Pan American, Edinburg, TX 78539, USA
H I G H L I G H T S
• Hydrologic/biotic trends and their association were examined in a desert river.• Decreased tributary flow led to decreased flow and increased salinity downstream.• This spatially uneven hydrologic change caused region-wide habitat homogenization.• Habitat homogenization led to biotic homogenization via changes in native fishes.• Salinization as habitat driver of biotic homogenization is novel finding.
⁎ Corresponding author.E-mail address: [email protected] (S. Miyazo
http://dx.doi.org/10.1016/j.scitotenv.2014.12.0790048-9697/© 2014 Published by Elsevier B.V.
a b s t r a c t
a r t i c l e i n f oArticle history:Received 5 November 2014Received in revised form 22 December 2014Accepted 22 December 2014Available online xxxx
Editor: D. Barcelo
Keywords:Biotic homogenizationHabitat homogenizationRiver dischargeSalinizationRio ConchosRio Grande
This study determined long-term changes in fish assemblages, river discharge, salinity, and local precipitation,and examinedhydrological drivers of biotic homogenization in a dryland river ecosystem, the Trans-Pecos regionof the Rio Grande/Rio Bravo del Norte (USA/Mexico). Historical (1977–1989) and current (2010–2011) fishassemblages were analyzed by rarefaction analysis (species richness), nonmetric multidimensional scaling(composition/variability), multiresponse permutation procedures (composition), and paired t-test (variability).Trends in hydrological conditions (1970s–2010s) were examined by Kendall tau and quantile regression, andassociations between streamflow and specific conductance (salinity) by generalized linear models. Since the1970s, species richness and variability of fish assemblages decreased in the Rio Grande below the confluencewith the Rio Conchos (Mexico), a major tributary, but not above it. There was increased representation oflower-flow/higher-salinity tolerant species, thus making fish communities below the confluence taxonomicallyand functionally more homogeneous to those above it. Unlike findings elsewhere, this biotic homogenizationwas due primarily to changes in the relative abundances of native species. While Rio Conchos dischargewas N 2-fold higher than Rio Grande discharge above their confluence, Rio Conchos discharge decreased duringthe study period causing Rio Grande discharge below the confluence to also decrease. Rio Conchos salinity islower than Rio Grande salinity above their confluence and, as Rio Conchos discharge decreased, it caused RioGrande salinity below the confluence to increase (reduced dilution). Trends in discharge did not correspond totrends in precipitation except at extreme-high (90th quantile) levels. In conclusion, decreasing discharge fromthe Rio Conchos has led to decreasing flow and increasing salinity in the Rio Grande below the confluence.This spatially uneven desertification and salinization of the Rio Grande has in turn led to a region-wide homog-enization of hydrological conditions and of taxonomic and functional attributes of fish assemblages.
© 2014 Published by Elsevier B.V.
1. Introduction
Changes in hydrological conditions and other habitat alterationscaused by anthropogenic activities and the effects of these changeson native aquatic biotas are primary concerns in river ecosystems
no).
worldwide (Bailey et al., 2006; Kingsford et al., 2006; Pool and Olden,2012). The effects could be direct, by impacting the ability of residentspecies to survive, migrate or reproduce in their native ranges(Kingsford et al., 2006; Cañedo-Argüelles et al., 2013) or indirect, byfacilitating the establishment of non-native species (Kingsford et al.,2006; Olden, 2006; Lee et al., 2013) including harmful algae (Paerland Paul, 2012; Patiño et al., 2014). Environmental drivers of bioticchange (e.g., biotic homogenization), however, are not well understood

445S. Miyazono et al. / Science of the Total Environment 511 (2015) 444–453
(Olden, 2006; Pool and Olden, 2012). In particular, while secondary(anthropogenic) salinization is considered to be among the largestthreats to river ecosystems worldwide, its impacts and managementremain relatively understudied (Bailey et al., 2006).
Biotic homogenization is the process whereby the introduction ofcosmopolitan (generalist) species coupled with extirpation of endemicspecies increases the genetic, taxonomic, or functional similarities ofregional biotas (McKinney and Lockwood, 1999; Olden and Rooney,2006; Rahel, 2010). Because individual species within a communitytypically vary in their tolerance limits to environmental variables(Linam and Kleinsasser, 1998), changes in hydrological conditions,such as flow and salinity, can directly affect change in fish assemblages.While flow (Rahel, 2010; Taylor, 2010) and broader watershed driversof biotic change (Olden, 2006; Olden et al., 2008, 2010; Winter et al.,2008; Rahel, 2010) have been previously addressed, the influence ofsalinization has been largely – if not completely – ignored in studies ofbiotic homogenization.
The Trans-Pecos region of the Rio Grande/Rio Bravo del Norte (USA-Mexico international border) offers a unique opportunity to explore andimprove our understanding of long-term changes and associationsbetween hydrologic and biotic variables, especially in dryland riverecosystems. This region has historical information available forretrospective analyses of fish assemblages and of relevant hydrologicalvariables such as water quality (salinity), river discharge, and precipita-tion. In addition, a comprehensive characterization of fish faunas of theregionwas conducted in the 1970s (Hubbs et al., 1977), which providesa valuable reference point for assessments of later biotic change causedby continuing anthropogenic pressures to the ecosystem. The study offish faunas found that regional variation in salinity was a prominentfactor associated with the distribution of fish assemblages. Namely, inthe 1970s, fish assemblages were classified into three groups: a salineRio Grande fauna above the confluence with the Rio Conchos (majortributary), a Rio Conchos–Rio Grande fauna below the confluence, anda tributary creek fauna, also downstream of the confluence (Hubbset al., 1977).
Several post-1970s studies provided general information about fishfaunas of the Trans-Pecos region (Bestgen and Platania, 1988;Edwards et al., 2002; Calamusso et al., 2005; Garrett and Edwards,2014), and some also qualitatively described changes (declines) inriver discharge below the confluence with the Rio Conchos (Garrettand Edwards, 2014). These studies, however, did not subject theirdata to quantitative analysis and did not address the role that changesin stream salinity (e.g., due to changes in flow below confluence) mayplay in affecting fish assemblages. The specific objectives of the presentstudy thus were to quantitatively determine post-1970s change in fishassemblages, river discharge, salinity, and local precipitation, and toexamine associations between hydrologic and biotic changes. Theworking hypothesis was that spatially uneven changes (below/abovethe Rio Conchos confluence) in hydrological conditions would lead tospatially uneven changes in fish faunas, and to region-wide habitatand biotic homogenizations. To our knowledge, this study is the firstto address the interaction of salinity and flow regime, and its influenceon the process of homogenization of freshwater habitats and biota.
2. Materials and methods
2.1. Study area
The Trans-Pecos region of the Rio Grande/Rio Bravo del Norte (RioGrande) is situated in the northern part of the Chihuahuan Desert anddefines a N1000-km segment of border between Mexico and the USA(Fig. 1). From El Paso (Texas, USA) to the confluence with the RioConchos (Chihuahua, Mexico), its main tributary in the region, anthro-pogenic degradation of the river and its watersheds over the last centu-ry transformed the river into a channelized, shallow, heavily siltedstream with relatively slow and saline flow that is often dry during
periods of drought (Hubbs et al., 1977; Everitt, 1993; Edwards et al.,2002; Schmidt et al., 2003; Calamusso et al., 2005). Discharge from theRio Conchos markedly changes the habitat characteristics of the RioGrande. From the Rio Conchos confluence to Amistad Reservoir (“BigBend area”), the Rio Grande has relatively deeper runs and largersubstrate, is of lower salinity (Bestgen and Platania, 1988), and providesrefugia to native fish faunas (Platania, 1990). The Rio Grande in the BigBend area also receives discharge from a series of intermittenttributaries, which serve as important spawning and nursery groundsfor several native fishes (Hubbs and Wauer, 1973; Miyazono andTaylor, 2013a).
According toHubbs et al. (1977), the salineRioGrandefish faunaup-stream of the confluence with the Rio Conchos is represented by nativeas well as non-native, salt-tolerant fishes (e.g., Dorosoma cepedianum,Cyprinus carpio, and Cyprinella lutrensis), the Rio Conchos–Rio Grandefauna by south Texas and Mexican species (e.g., Notropis jemezanus,Notropis braytoni, and Rhinichthys cataractae), and the tributary creekfauna by Chihuahuan fish species (e.g., Notropis chihuahua). The impor-tance of the Big Bend area to the conservation of native faunas and florasof the Rio Grande Basin is highlighted by the presence of multiplenational and state parks and protected areas on both sides of theinternational border (Raines et al., 2012; Garrett and Edwards, 2014).However, anthropogenic stressors on the hydrology of the area remainimportant concerns (Schmidt et al., 2003; Calamusso et al., 2005).
2.2. Data sources
Fish information for this studywas grouped into current (2010–2011)and historical (1977–1989) data. Current data were obtained fromvarious sources including Miyazono and Taylor (2013a) (sites 7–9 and11, total 9 samples), Edwards (2013) (sites 10 and 12–20, total 10samples) (Fig. 1; Table 1), and by new sampling of the mainstem (sites1–6, total 6 samplings) (Fig. 1; Table 1). New sampling was conductedfrom 16 March to 2 April in 2011. Samples were collected with a seine(4.2 m × 1.7 m, 5 mmmesh) for 35–45 min per site. All available habitattypes (i.e., riffles, pools, and runs) were sampled within a stream reach.Fish N 25-cm total length were identified, counted, and returned to thewater. Smaller individuals were fixed in 10% formalin and brought tothe laboratory for identification, and preserved in 50% ethanol. All fishcollections were deposited into the Texas Natural History Collection.Historical fish assemblage data were gathered from Hubbs et al. (1977)(sites 1–7, 10, and 12–20, total 17 samples), Bestgen and Platania(1988) (sites 1–3 and 5–10, total 9 samples), and Linam et al. (2002)(sites 8 and 11, total 2 samples) (Fig. 1; Table 1).
Water quality monitoring sites, flow gages, and weather stationswithin the Trans-Pecos region with a similar period of record to thefish assemblage datawere selected for analyses (Fig. 1; Table 2). Specificconductance data (1970s–2011)were obtained from 6monitoring sitesin the area (Texas Commission on Environmental Quality; http://www80.tceq.texas.gov/SwqmisPublic/public/default.htm), river dis-charge data (1977–2011) from 10 selected gage stations (InternationalBoundary and Water Commission, http://www.ibwc.state.gov/), andprecipitation data (1977–2011) from 10 selected weather stations(National Climatic Data Center; http://www.ncdc.noaa.gov/).
2.3. Statistical analyses
Multiresponse permutation procedures (MRPPs) with the Sorensendistancemeasurewere used to examine differences between the histor-ical fish assemblage data in 1977 and 1988–1989; MRPP is a nonpara-metric procedure that examines group differences (McCune andGrace, 2002). This preliminary analysis was done to determinewhetherthe two historical datasets, collected 10 years apart, could be combinedfor comparisons against current data.
Fish sampling sites were classified into five geographic groupsaccording to the following criteria: all sites (region-wide), mainstem

1 2
3
45
6
7 89 10 11
12
1314
1516
17 181920
A
B
C
D EF
i
ii
iii
iv
v
vi
G
H I
J
Langtry
Alamito Creek
Terlingua Creek
Rio Conchos
100 km
N
Tornillo Creek
USA
Mexico
Texas
a
b
c
d
ef
g
h
i
j
El Paso
Fig. 1. Location of water quality monitoring station (empty squares with roman numerals), weather stations (solid triangles with large letters), river discharge gages (empty circles withsmall letters) and fish sampling sites (solid circles with Arabic numerals) in the Trans-Pecos region in Texas, USA.
446 S. Miyazono et al. / Science of the Total Environment 511 (2015) 444–453
above the confluence with Rio Conchos, mainstem below the conflu-ence (Big Bend area), Alamito Creek (tributary below the confluence),and Terlingua Creek (tributary below the confluence). Changes inspecies richness between historical and current fish assemblages wereassessed with rarefaction analysis using EcoSim700 (Gotelli andEntsminger, 2001). Rarefaction analysis standardizes species richnessto account for differences in species abundances among comparedsamples (Gotelli and Graves, 1996). Monte Carlo procedures were
Table 1Study sites, sampling periods, and references for fish assemblage data in the Trans-Pecos regiby an X.
Site 1977 1988–1989 2010–2011 Reference
1 X X X Hubbs et al. (12 X X X Hubbs et al. (13 X X X Hubbs et al. (14 X X Hubbs et al. (15 X X X Hubbs et al. (16 X X X Hubbs et al. (17 X X X Hubbs et al. (18 X X X Hubbs et al. (19 X X Bestgen and Pla10 X X Bestgen and Pla11 X X Linam et al. (2012 X X Hubbs et al. (113 X X Hubbs et al. (114 X X Hubbs et al. (115 X X Hubbs et al. (116 X X Hubbs et al. (117 X X Hubbs et al. (118 X X Hubbs et al. (119 X X Hubbs et al. (120 X X Hubbs et al. (1
used to draw 5000 random samples at specified abundance levelspermitting 95% confidence intervals to be calculated.
Fish assemblage data were ordinated with nonmetric multidimen-sional scaling (NMS) to assess the long-term changes. This procedureevaluates the similarities in species and environmental space by usinga rank distance measure, and it is not severely affected by zero-truncation problems and nonlinearity (McCune and Grace, 2002).Multiresponse permutation procedures were used to determine
on in Texas, USA. Availability of data for particular sites at particular periods is indicated
977), Bestgen and Platania (1988); this study977), Bestgen and Platania (1988); this study977), Bestgen and Platania (1988); this study977); this study977), Bestgen and Platania (1988); this study977), Bestgen and Platania (1988); this study977), Bestgen and Platania (1988), Miyazono and Taylor (2013a)977), Bestgen and Platania (1988), Linam et al. (2002), Miyazono and Taylor (2013a)tania (1988), Miyazono and Taylor (2013a)tania (1988), Edwards (2013)02), Miyazono and Taylor (2013a)977), Edwards (2013)977), Edwards (2013)977), Edwards (2013)977), Edwards (2013)977), Edwards (2013)977), Edwards (2013)977), Edwards (2013)977), Edwards (2013)977), Edwards (2013)

Table 2Study site information for specific conductance, river discharge, and precipitation in the Trans-Pecos region in Texas, USA.
Site Variable No. Period of record Location
i Specific conductance 13272 1972–2013 The Rio Grande at Courchesne Bridgeii Specific conductance 13232 1987–2010 The Rio Grande at Neely Canyoniii Specific conductance 13230 1977–2013 The Rio Grande above the Rio Conchosiv Specific conductance 13229 1972–2013 The Rio Grande below the Rio Conchosv Specific conductance 13228 1974–2013 The Rio Grande at Santa Elena Canyonvi Specific conductance 13223 1972–2013 The Rio Grande at Foster Rancha River discharge 08-3650.00 1977–2011 The Rio Grande below American Dam at El Pasob River discharge 08-3705.00 1977–2011 The Rio Grande at Fort Quitmanc River discharge 08-3712.00 1977–2011 The Rio Grande near Candelariad River discharge 08-3715.00 1977–2011 The Rio Grande above the Rio Conchos near Presidioe River discharge 08-3730.00 1977–2011 The Rio Conchos near Ojinagaf River discharge 08-3742.00 1977–2011 The Rio Grande below Rio Conchos near Presidiog River discharge 08-3740.00 1977–2011 Alamito Creek near Presidioh River discharge 08-3745.00 1977–2011 Terlingua Creek near Terlinguai River discharge 08-3750.00 1977–2011 The Rio Grande at Johnson Ranch near Castolonj River discharge 08-3772.00 1977–2011 The Rio Grande at Foster Ranch near LangtryA Precipitation 419088 1981–2011 TornilloB Precipitation 413266 1977–2011 Fort HancockC Precipitation 417262 1977–2011 PresidioD Precipitation 415596 1977–2009 MarfaE Precipitation 410174 1977–2011 AlpineF Precipitation 415579 1977–2011 MarathonG Precipitation 411524 1980–2011 CastolonH Precipitation 411715 1977–2011 Chisos BasinI Precipitation 416792 1977–2011 Panther JunctionJ Precipitation 415048 1977–2011 Langtry
0 5000 10000 15000 20000 25000
0
5
10
15
20
25
30
Abundance
Spec
ies
richn
ess
Fig. 2. Rarefaction curves (95% confidence interval) of species richness for fish assem-blages at all study sites combined (broken line: historical data; solid line: current data).
447S. Miyazono et al. / Science of the Total Environment 511 (2015) 444–453
whether the observed fish assemblage dissimilarities for the two timeperiods (1977–1989 vs. 2010–2011) were statistically significant.Spatial variability in fish assemblages was assessed by calculatingpairwise Bray–Curtis distances for each period and then tested formean differences with a paired t-test. Fish relative abundance data nor-malized with the arcsine square root transformation were used forNMS, MRPP, and paired t-test. PC-ORD version 6 (McCune andMefford, 1999) was used to perform NMS and MRPP, and statisticalprogram R, Version 3.01 (R Development Core Team 2013) was usedto perform a paired t-test.
Data for specific conductance (a function of salinity) were relativelysparse and not always uniformly distributed within the calendar year;thus, trend analysis for salinity was based on annual median valuesusing Kendall tau (Helsel and Hirsch, 2002) and Sen slopes (Sen,1968). Kendall tau evaluates the strength and direction of themonoton-ic relation between environmental variables and time, and the Sen slopeis an estimate of the (annual) rate of change over the period of record.Data density for discharge and precipitation was relatively high,allowing the use of quantile regression for analysis of trends. Quantileregression can be used to estimate trends not only in medians butalso in extreme values (Koenker and Bassett, 1978). Daily meandischarge for each selected river gage and monthly cumulative precipi-tation for each selectedweather stationwere grouped by year and usedto estimate long-term trends in median (50th quantile) and extremequantiles (10th and 90th quantiles). The slope of the regressionlines for each quantile is the estimate of its (annual) rate of changeover the study period. These analyses were performed in statisticalprogram R, Version 3.01 (R Development Core Team, 2013) using theKendall 2.2 package (McLeod, 2011), the zyp 0.10-1 package(Bronaugh and Werner, 2013), and the quantreg 5.05 package(Koenker et al., 2013).
Serial correlation is common in hydrological data and may result inunderestimation of the variance of correlation coefficients, although es-timates of the coefficients remain unbiased (Helsel and Hirsch, 2002).This problem can be addressed by including autoregressive (AR) errorsin regression models (Helsel and Hirsch, 2002). Generalized linearmodels with AR terms (AUTOREG procedure, SAS version 9.3; SASInstitute, Cary, NC, USA) were used to confirm and more closelyexamine selected associations suggested by results of trend analysis.
3. Results
3.1. Changes in fish assemblages
There were no significant differences in the historical fish assem-blage data of 1977 and 1988–1989 (MRPP: T = 0.76, p = 0.45), andthey were combined for comparison against current data.
When data from all sites were combined (region-wide) for analysis,results of rarefaction analyses indicated that the species richness ofcurrent fish assemblages was significantly lower than that of historicalfish assemblages as indicated by the clear separation of the curves(Fig. 2).When the analysiswas conducted on each geographic subgroupseparately, however, two patterns emerged. Species richness of currentfish assemblages at the Rio Grande below the confluence with the RioConchos (Fig. 3B) and at Alamito Creek (Fig. 3C) was still clearly lowerthan their respective historical fish assemblages. For the Rio Grandeabove the confluence (Fig. 3A) and Terlingua Creek (Fig. 3D), however,the two rarefaction curves overlapped considerably suggesting that thespecies richness at these sites did not differ significantly between the
0
2
4
6
8
10
12
14
16
0
2
4
6
8
10
12
0
2
4
6
8
10
12
14
0 1000 2000 3000 4000
0 500 1000 1500 2000 2500
0 1000 2000 3000 4000 5000
0 2000 4000 6000 8000 10000 12000
0
5
10
15
20
25
30
Abundance
Spec
ies
richn
ess
D
BA
C
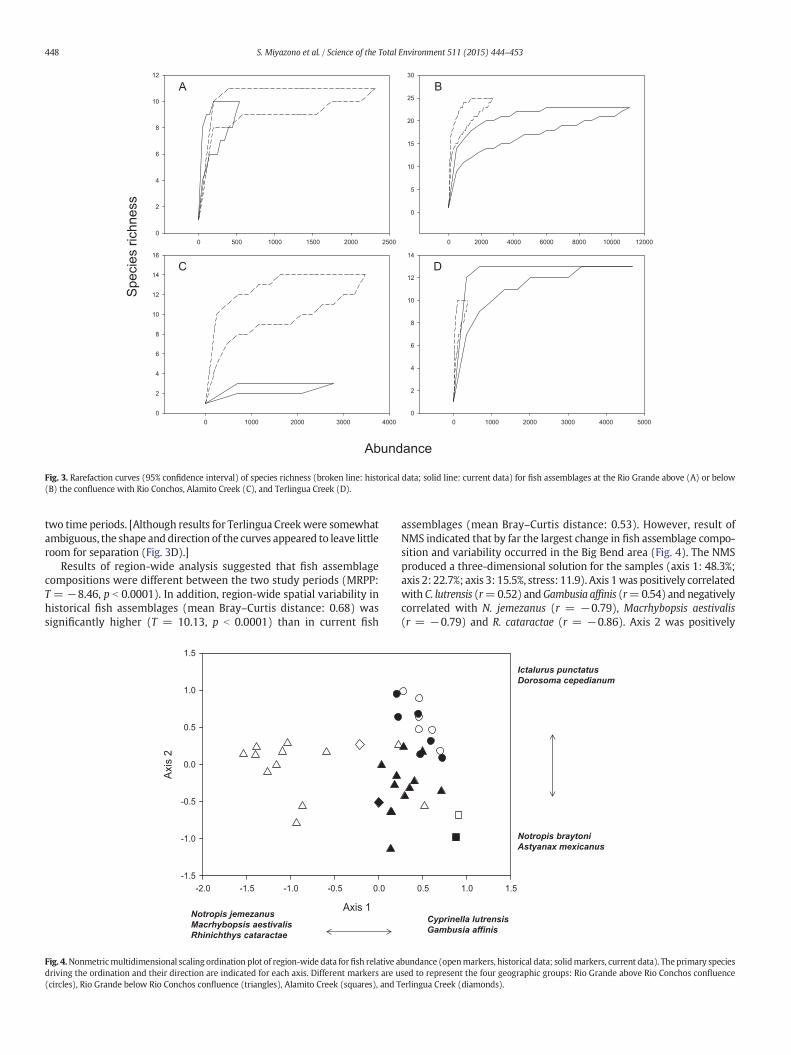
Fig. 3. Rarefaction curves (95% confidence interval) of species richness (broken line: historical data; solid line: current data) for fish assemblages at the Rio Grande above (A) or below(B) the confluence with Rio Conchos, Alamito Creek (C), and Terlingua Creek (D).
448 S. Miyazono et al. / Science of the Total Environment 511 (2015) 444–453
two time periods. [Although results for Terlingua Creekwere somewhatambiguous, the shape anddirection of the curves appeared to leave littleroom for separation (Fig. 3D).]
Results of region-wide analysis suggested that fish assemblagecompositions were different between the two study periods (MRPP:T = −8.46, p b 0.0001). In addition, region-wide spatial variability inhistorical fish assemblages (mean Bray–Curtis distance: 0.68) wassignificantly higher (T = 10.13, p b 0.0001) than in current fish
Axis 1
-2.0 -1.5 -1.0 -0.5 0.0
Axis
2
-1.5
-1.0
-0.5
0.0
0.5
1.0
1.5
Notropis jemezanusMacrhybopsis aestivalisRhinichthys cataractae
Fig. 4.Nonmetricmultidimensional scaling ordination plot of region-wide data forfish relative adriving the ordination and their direction are indicated for each axis. Different markers are u(circles), Rio Grande below Rio Conchos confluence (triangles), Alamito Creek (squares), and T
assemblages (mean Bray–Curtis distance: 0.53). However, result ofNMS indicated that by far the largest change in fish assemblage compo-sition and variability occurred in the Big Bend area (Fig. 4). The NMSproduced a three-dimensional solution for the samples (axis 1: 48.3%;axis 2: 22.7%; axis 3: 15.5%, stress: 11.9). Axis 1was positively correlatedwith C. lutrensis (r=0.52) andGambusia affinis (r=0.54) and negativelycorrelated with N. jemezanus (r = −0.79), Macrhybopsis aestivalis(r = −0.79) and R. cataractae (r = −0.86). Axis 2 was positively
0.5 1.0 1.5
Cyprinella lutrensisGambusia affinis
Ictalurus punctatusDorosoma cepedianum
Notropis braytoniAstyanax mexicanus
bundance (openmarkers, historical data; solidmarkers, current data). The primary speciessed to represent the four geographic groups: Rio Grande above Rio Conchos confluenceerlingua Creek (diamonds).

449S. Miyazono et al. / Science of the Total Environment 511 (2015) 444–453
correlated with Ictalurus punctatus (r = 0.60) and D. cepedianum (r =0.51), and negatively correlated with N. braytoni (r = −0.67) andAstyanax mexicanus (r = −0.60). The primary reason for the change infish assemblage composition and variability in the Big Bend area was alarge decrease in the relative abundance of N. jemezanus, M. aestivalisand R. cataractae and corresponding increase in the abundance ofC. lutrensis and G. affinis.
3.2. Spatial variability in hydrological conditions
Between the mid-1970s and early 2010s (Table 2), median specificconductance was relatively low in El Paso (Courchesne Bridge; ~1200μS/cm), higher from Fort Quitman (3440 μS/cm) to just above theconfluence with Rio Conchos (2880 μS/cm), intermediate from justbelow the confluence (1900 μS/cm) to Terlingua Creek (2210 μS/cm),and returned to low values at the downstream-most site of the studyarea near Langtry (1160 μS/cm) (Table 3; Fig. 1). Long-term salinitydata for the Rio Conchos and minor tributaries (Alamito Creek andTerlingua Creek) were not available for analysis.
Between 1977 and 2011 (Table 2), overall median (50th quantile)discharge in themainstemRio Grande from El Paso to just above the con-fluence with Rio Conchos was fairly consistent at ~3–4 m3/s (Table 4),and in Rio Conchos above the confluence, it was ~8 m3/s (Table 4).Below the confluence, overall median discharge was ~13 m3/s, which isapproximately the sum of both upstream median discharges (Table 4).Median discharge at the mainstem site near Castolon (Table 2; Fig. 1)did not change appreciably (~13.5m3/s) relative to just below the conflu-ence, but it nearly doubled at the last study gage near Langtry (~22m3/s)(Table 4; Fig. 1). Median discharges at Alamito Creek (0.03 m3/s) andTerlingua Creek (0.07 m3/s) were relatively low (Table 4). Between1977 and 2011 (Table 2), overall median monthly precipitation at eachselected weather station ranged between 8.4 and 21.6 mm (Table 5).
3.3. Trends in hydrological conditions
No long-term trends in median salinity were detected at the El Pasoand Fort Quitman sites during the studyperiod (Table 3). Salinitymono-tonically increased in mainstem sites from just upstream of the conflu-ence with Rio Conchos to near Langtry (Table 3). The rate of increasevaried from 36 μS/cm per year just above the confluence (1.2% annualincrease), to 53 μS/cm per year just below the confluence (2.8% annualincrease), to 49 μS/cm per year near Terlingua Creek (2.2% annualincrease), to 7.4 μS/cm per year (0.6% annual increase) at the farthestdownstream station near Langtry (Table 3; Fig. 1). Thus, the highestrate of change in the Rio Grande was observed just below the conflu-ence with the Rio Conchos, resulting in a 3-fold increase in mediansalinity at this site during the study period (Fig. 5). Trend analyses forsalinity could not be conducted for the minor tributaries because oflack of sufficient data.
Median and extreme (10th/90th quantile) discharges generallydecreasedmonotonically in Rio Conchos and in allmainstemRioGrandesites below the confluence (Table 4; Appendix A, Figs. S1 and S2). Thedecrease in median discharge at these sites was 0.55–0.68 m3/s peryear (Table 4), equivalent to 7.3% annual decrease in the Rio Conchosabove the confluence, 4.9% in the Rio Grande just below the confluence,4.7% near Castolon, and 3.1% near Langtry. Conversely, median and
Table 3Trend analysis (Kendall tau coefficient) and rate of annual change (Sen slope) for median specifitributaries). Minimum (min), median, and maximum (max) values, and percent annual changeshown. Coefficients highlighted in bold are significant (p b 0.05).
Site i Site ii Site iii
Tau 0.11 0.15 0.36Sen slope 3.3 25 36Min, median, max 288, 1202, 9560 328, 3440, 6740 300, 2880% annual change +0.3 +0.1 +1.2
extreme-low (10th quantile) discharge generally increased at themainstem sites above the Rio Conchos (Table 4; Appendix A, Fig. S3).Consistent with findings at the Rio Conchos and the mainstem sitesbelow the confluence, however, extreme-high discharge at theupstream sites also significantly decreased (Table 4). Median andextreme-high discharges all decreased in Alamito Creek but at TerlinguaCreek, only extreme discharges (high and low) decreased significantly.
Median and extreme (high and low) monthly precipitation seemedto generally decrease during the study period — all but one estimatewere negative regardless of statistical significance (Table 5; AppendixA, Fig. S4). The only exception was an extreme-high precipitationestimate in a weather station near Alpine, Texas (Table 2; Fig. 1),where the sign was positive although not significant. Some of theextreme-low precipitation estimates indicated no trend (estimate =0) because the 10th quantile value for all or most years already was atthe lowest value possible, 0 mm (Table 5).
Associations of Rio Grande salinity below the confluence with timeand with upstream discharge variables were further explored usinggeneralized linear models. Akaike's Information Criterion and total R2
were used to rank the models. Salinity was significantly autocorrelatedat this site, but its positive association with time (trend) was confirmed(models 1–3; Table 6). Inclusion of median discharge for Rio Conchosyielded the best model (model 1), and its association with salinitybelow the confluence was significant and negative. Inclusion of mediandischarge for Rio Conchos and Rio Grande (above confluence) yieldedthe next best model (model 2), but the association was significant(and negative) only for Rio Conchos discharge. Inclusion of mediandischarge only for Rio Grande (above confluence) yielded the lessermodel (model 3), and the association between Rio Grande dischargeabove and salinity below the confluence was non-significant. Lineartrend coefficients in models 1 and 2 (~52 μS/cm per year; Table 6)were practically identical to the Sen slope estimate of 53 μS/cm peryear (Table 3).
4. Discussion
4.1. Biotic change and homogenization
Results of this study indicated that taxonomic homogenization of fishassemblages occurred in the Trans-Pecos Region of the RioGrande duringthe study period. Compared to historical collections (1977–1989), cur-rent (2010–2011) species richness decreased in the Big Bend area ofthemainstem and in Alamito Creek, especially in the latter.While histor-ical collections for Alamito Creek contained 14 fish species, includingstate-listed threatened native species such as Campostoma ornatum andN. chihuahua (Hubbs et al., 2008), current data indicated the presenceof only three species at this site (G. affinis, C. lutrensis, and Carpiodescarpio). In addition, the spatial variability of fish assemblages decreasedconsiderably in the Big Bend area of the Rio Grande. This decrease wasprimarily due to increased relative abundances of C. lutrensis andG. affinis coupled with decreased relative abundances of M. aestivalis,N. jemezanus, and R. cataractae (all five species are native to the region).Conversely, species richness in the Rio Grande above the confluencewith Rio Conchos or in Terlingua Creek did not change between thehistorical and current collection periods. The net effect of these temporalchanges was to make fish assemblages in the mainstem Rio Grande
c conductance (μS/cm)measured at 6 selectedmonitoring sites (data are not available for[100(Sen slope/median)] recorded at each monitoring site over the study period are also
Site iv Site v Site vi
0.72 0.53 0.2553 49 7.4
, 6450 163, 1900, 4421 300, 2210, 5580 500, 1160, 3500+2.8 +2.2 +0.6

Table 4Trend analysis (quantile regression) and rate of annual change for river discharge (m3/s) measured at 10 selected streamflow gages. The 10th, 50th, and 90th quantile values, and percentannual change [100(rate of change/quantile)] recorded at each gage over the study period are also shown. Significant changes (p b 0.05) are in bold type.
Flow gage 10th quantile 50th quantile 90th quantile
10th value Annual change % annual change 50th value Annual change % annual change 90th value Annual change % annual change
a 0.04 0.0004 1.0 3.03 −0.0850 −2.8 7.56 −0.3744 −4.9b 0.45 0.0262 5.8 3.96 0.0367 0.9 14.50 −0.5229 −3.6c 0.11 0.0150 13.6 3.48 0.0522 1.5 13.30 −0.4788 −3.6d 0.31 0.0041 1.3 3.34 0.0394 1.2 12.58 −0.5159 −4.1e 0.84 −0.2377 −28.3 7.57 −0.5489 −7.3 44.70 −1.4250 −3.2f 2.59 −0.2396 −9,2 12.70 −0.6283 −4.9 60.60 −1.9684 −3.2g 0.01 0.0000 0.0 0.03 −0.0007 −2.3 0.07 −0.0017 −2.4h 0.03 −0.0005 −1.7 0.07 0.0000 0 1.01 −0.0191 −1.9i 2.29 −0.2415 −10.5 13.50 −0.6165 −4.7 66.30 −2.0130 −3.0j 9.32 −0.2708 −2.9 21.70 −0.6833 −3.1 79.00 −2.3850 −3.0
450 S. Miyazono et al. / Science of the Total Environment 511 (2015) 444–453
below and above the confluence with the Rio Conchos taxonomicallymore similar to each other.
Curiously, the regional taxonomic homogenization of fish assem-blages observed in this studywas based primarily on changes in relativeabundances of native species, either increases or decreases. This findingdiffers from other studies of biotic homogenization where increasedtaxonomic similarity of aquatic and terrestrial faunas is typically theresult of relative increases and decreases in exotic generalists and nativespecies, respectively (McKinney and Lockwood, 1999; Olden, 2006;Rahel, 2010; Pool and Olden, 2012; Toussaint et al., 2014). The choiceof spatial scale can influence the results of studies of biotic homogeniza-tion (Rahel, 2010). The present study was geographically limitedcompared to some earlier studies. However, the analysis based onregional, sub-regional, and individual tributary creek scales (selectedaccording to clear habitat criteria) provided generally unambiguousobservations and reasonable confidence in the conclusion that taxonomichomogenization of fish assemblageswas based on changes in the relativecomposition of native species at multiple spatial scales.
4.2. Habitat change and homogenization
Rio Grande discharge above the confluence with Rio Conchos isstrongly influenced by water releases from upstream reservoirs in NewMexico (USA) and by water withdrawals, and salinity in this reach ofthe river increases in a downstream direction (Moyer et al., 2013).Below the confluence, discharge is strongly dependent on Rio Conchosflow (Schmidt et al., 2003), and salinity decreases in a downstreamdirection (Raines et al., 2012). Rio Conchos discharge is also influencedby upstream reservoir operations and water withdrawals and is thesubject of an international treaty (Kelly, 2001). These earlier observationsare consistent with the spatial distributions of discharge and salinityrecorded during the present study. Also, in agreement with findings ofa recent study (Raines et al., 2012), median discharge below the conflu-ence increased in a downstream direction due to local gains in the
Table 5Trend analysis (quantile regression) and rate of annual change for total monthly precipitationand percent annual change [100(rate of change/quantile)] recorded at each weather station ov
Weather station 10th quantile 50th quantile
10th value Annual change % annual change 50th value An
A 0.00 0.000 0.0 11.700 −0B 0.00 0.000 0.0 10.400 −0C 0.00 0.000 0.0 8.400 −0D 0.52 −0.044 −8.5 19.800 −0E 0.50 −0.021 −4.2 18.200 −0F 0.00 0.000 0.0 16.300 −0G 0.00 0.000 0.0 11.900 −0H 0.00 −0.025 – 15.800 −0I 0.30 −0.033 −11 21.600 −0J 0.50 −0.030 −6.0 16.300 −0
lower reaches. In the present study, the net gain in median flow wasestimated at 71% (nearly double) between the confluence with the RioConchos and the last study gage near Langtry.
Post-1970s trends in hydrological conditionswere observed primar-ily in the Rio Conchos and in theRioGrandebelow the confluence. In theRio Conchos, median discharge decreased during the study period at anannual rate of 7.3% and, in the Rio Grande just below the confluence, therate of decrease was 4.9%. Because streamflow in the Rio Grande belowthe confluence is mostly derived from Rio Conchos discharge (Schmidtet al., 2003; present study), and because Rio Grande discharge upstreamof the confluence showed small positive trends (1.2%per year just abovethe confluence), the negative trend in flow below the confluence is thedirect consequence of the negative trend in discharge from the Rio Con-chos. Also, while median discharge declined at all mainstem study sitesin the Big Bend area, themagnitude of the decline became progressivelysmaller in a downstream direction, from 4.9% per year just below theconfluence to 3.1% per year at Langtry. This phenomenon was likelydue to streamflowgains in the lower reaches (see discussion in precedingparagraph).
Median salinity in the Rio Grande remained monotonically stableduring the study period at the upstream sites of El Paso and FortQuitman, but increased at all other mainstem sites from just upstreamthe confluencewith Rio Conchos (1.2% per year in specific conductance)to the lowermost study site near Langtry. The highest rate of salinityincrease (2.8% per year) was observed just below the confluence withthe Rio Conchos, and the lowest rate was observed near Langtry (0.6%per year). Water quality data for the Rio Conchos was not available forthis study, but other studies have reported that Rio Conchos salinity isabout one-half of Rio Grande salinity above the confluence (Gutiérrezand Carreón-Hernández, 2004; Miyamoto et al., 2006; Gutiérrez andJohnson, 2014). Results of generalized linear models showed thatmainstem salinity below the confluence is inversely associated withRio Conchos discharge — the lower the Rio Conchos discharge, thehigher the Rio Grande salinity below the confluence. This negative
(mm) measured at 10 selected weather stations. The 10th, 50th, and 90th quantile values,er the study period are also shown. Significant changes (p b 0.05) are in bold type.
90th quantile
nual change % annual change 90th value Annual change % annual change
.304 −2.6 47.300 −0.252 −0.5
.193 −1.9 49.900 −0.038 −0.1
.220 −2.6 58.990 −1.183 −2.0
.200 −1.0 87.060 −0.056 −0.1
.376 −2.2 91.650 0.325 0.4
.425 −2.6 81.540 −0.985 −1.2
.290 −2.4 60.190 −0.129 −0.2
.312 −2.0 73.420 −0.234 −0.3
.150 −0.7 104.240 −0.192 −0.2
.241 −1.5 73.450 −0.210 −0.3
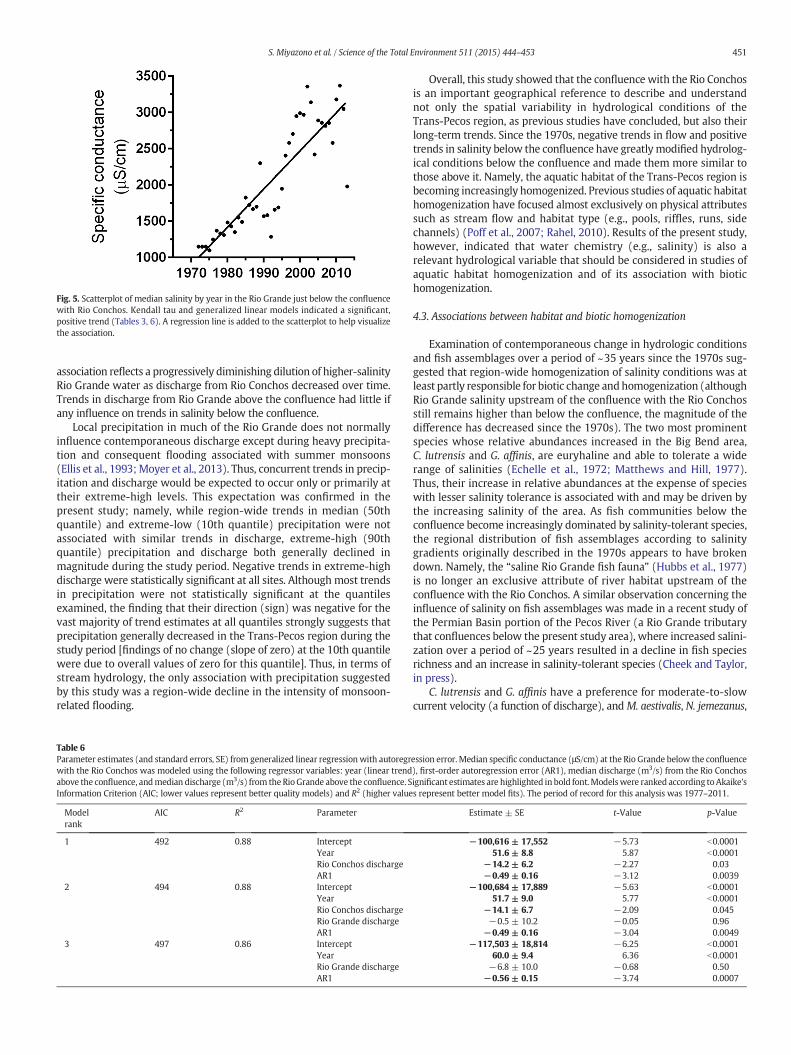
Fig. 5. Scatterplot of median salinity by year in the Rio Grande just below the confluencewith Rio Conchos. Kendall tau and generalized linear models indicated a significant,positive trend (Tables 3, 6). A regression line is added to the scatterplot to help visualizethe association.
451S. Miyazono et al. / Science of the Total Environment 511 (2015) 444–453
association reflects a progressively diminishing dilution of higher-salinityRio Grande water as discharge from Rio Conchos decreased over time.Trends in discharge from Rio Grande above the confluence had little ifany influence on trends in salinity below the confluence.
Local precipitation in much of the Rio Grande does not normallyinfluence contemporaneous discharge except during heavy precipita-tion and consequent flooding associated with summer monsoons(Ellis et al., 1993;Moyer et al., 2013). Thus, concurrent trends in precip-itation and discharge would be expected to occur only or primarily attheir extreme-high levels. This expectation was confirmed in thepresent study; namely, while region-wide trends in median (50thquantile) and extreme-low (10th quantile) precipitation were notassociated with similar trends in discharge, extreme-high (90thquantile) precipitation and discharge both generally declined inmagnitude during the study period. Negative trends in extreme-highdischarge were statistically significant at all sites. Although most trendsin precipitation were not statistically significant at the quantilesexamined, the finding that their direction (sign) was negative for thevast majority of trend estimates at all quantiles strongly suggests thatprecipitation generally decreased in the Trans-Pecos region during thestudy period [findings of no change (slope of zero) at the 10th quantilewere due to overall values of zero for this quantile]. Thus, in terms ofstream hydrology, the only association with precipitation suggestedby this study was a region-wide decline in the intensity of monsoon-related flooding.
Table 6Parameter estimates (and standard errors, SE) from generalized linear regressionwith autoregrwith the Rio Conchos was modeled using the following regressor variables: year (linear trendabove the confluence, andmedian discharge (m3/s) from the RioGrande above the confluence. SInformation Criterion (AIC; lower values represent better quality models) and R2 (higher value
Modelrank
AIC R2 Parameter
1 492 0.88 InterceptYearRio Conchos dischargeAR1
2 494 0.88 InterceptYearRio Conchos dischargeRio Grande dischargeAR1
3 497 0.86 InterceptYearRio Grande dischargeAR1
Overall, this study showed that the confluence with the Rio Conchosis an important geographical reference to describe and understandnot only the spatial variability in hydrological conditions of theTrans-Pecos region, as previous studies have concluded, but also theirlong-term trends. Since the 1970s, negative trends in flow and positivetrends in salinity below the confluence have greatly modified hydrolog-ical conditions below the confluence and made them more similar tothose above it. Namely, the aquatic habitat of the Trans-Pecos region isbecoming increasingly homogenized. Previous studies of aquatic habitathomogenization have focused almost exclusively on physical attributessuch as stream flow and habitat type (e.g., pools, riffles, runs, sidechannels) (Poff et al., 2007; Rahel, 2010). Results of the present study,however, indicated that water chemistry (e.g., salinity) is also arelevant hydrological variable that should be considered in studies ofaquatic habitat homogenization and of its association with biotichomogenization.
4.3. Associations between habitat and biotic homogenization
Examination of contemporaneous change in hydrologic conditionsand fish assemblages over a period of ~35 years since the 1970s sug-gested that region-wide homogenization of salinity conditions was atleast partly responsible for biotic change andhomogenization (althoughRio Grande salinity upstream of the confluence with the Rio Conchosstill remains higher than below the confluence, the magnitude of thedifference has decreased since the 1970s). The two most prominentspecies whose relative abundances increased in the Big Bend area,C. lutrensis and G. affinis, are euryhaline and able to tolerate a widerange of salinities (Echelle et al., 1972; Matthews and Hill, 1977).Thus, their increase in relative abundances at the expense of specieswith lesser salinity tolerance is associated with and may be driven bythe increasing salinity of the area. As fish communities below theconfluence become increasingly dominated by salinity-tolerant species,the regional distribution of fish assemblages according to salinitygradients originally described in the 1970s appears to have brokendown. Namely, the “saline Rio Grande fish fauna” (Hubbs et al., 1977)is no longer an exclusive attribute of river habitat upstream of theconfluence with the Rio Conchos. A similar observation concerning theinfluence of salinity on fish assemblages was made in a recent study ofthe Permian Basin portion of the Pecos River (a Rio Grande tributarythat confluences below the present study area), where increased salini-zation over a period of ~25 years resulted in a decline in fish speciesrichness and an increase in salinity-tolerant species (Cheek and Taylor,in press).
C. lutrensis and G. affinis have a preference for moderate-to-slowcurrent velocity (a function of discharge), andM. aestivalis, N. jemezanus,
ession error. Median specific conductance (μS/cm) at the Rio Grande below the confluence), first-order autoregression error (AR1), median discharge (m3/s) from the Rio Conchosignificant estimates are highlighted in bold font.Modelswere ranked according toAkaike'ss represent better model fits). The period of record for this analysis was 1977–2011.
Estimate ± SE t-Value p-Value
−100,616 ± 17,552 −5.73 b0.000151.6 ± 8.8 5.87 b0.0001
−14.2 ± 6.2 −2.27 0.03−0.49 ± 0.16 −3.12 0.0039
−100,684 ± 17,889 −5.63 b0.000151.7 ± 9.0 5.77 b0.0001
−14.1 ± 6.7 −2.09 0.045−0.5 ± 10.2 −0.05 0.96
−0.49 ± 0.16 −3.04 0.0049−117,503 ± 18,814 −6.25 b0.0001
60.0 ± 9.4 6.36 b0.0001−6.8 ± 10.0 −0.68 0.50
−0.56 ± 0.15 −3.74 0.0007

452 S. Miyazono et al. / Science of the Total Environment 511 (2015) 444–453
and R. cataractae prefer faster currents (Yu and Peters, 2002; Heard et al.,2012; for G. affinis, see Fig. 4 in Heard et al., 2012). Coupled with decreas-ingdischarge in themainstemof the Big Bendarea, relative abundances ofC. lutrensis and G. affinis increased in the area while those ofM. aestivalis,N. jemezanus, and R. cataractae decreased. In addition, C. ornatum andN. chihuahua are known to prefer deep tributary pool habitats in the re-gion, which require adequate levels of flow to be maintained (Miyazonoand Taylor, 2013b).While these two specieswere currently still abundantin Terlingua Creek, which did not experience decreases in mediandischarge, they were absent in Alamito Creek, which experienced adecrease. These observations suggest that regional shifts in fish assem-blage compositions according to flow preferences or tolerances werealso caused by the spatially uneven change in discharge during thestudy period. Similar findings have been reported in other river basins(Rahel, 2010; Taylor, 2010).
Fish assemblages did not significantly change in the Rio Grandeabove the confluence with the Rio Conchos, but this observation shouldnot be interpreted as an indication that they are in good condition. Thisreach of the river was severely degraded long before samples for thepresent study were collected (Hubbs et al., 1977; Everitt, 1993;Schmidt et al., 2003). Also, while the decline in the intensity ofmonsoonrain-related flooding is likely to have influenced the integrity of theriver ecosystem, this phenomenon occurred region-wide and does notseem to have influenced regional habitat or biotic homogenizationprocesses during the study period.
5. Conclusions
Results of this study are relevant to the advancement of currentunderstanding of biotic homogenization. Desertification of aquatichabitats is defined as habitat shrinkage or loss of water (Minckley andUnmack, 2000). Changes in water quantity, however, are often accom-panied by changes inwater quality and the latter can havemajor, cumu-lative effects on the health and sustainability of aquatic ecosystems. Thisstudy showed that discharge from the Rio Conchos monotonicallydecreased since the 1970s causing not only desertification (loss ofwater) but also considerable salinization of the Big Bend area of theRio Grande. This regionally uneven change in hydrological conditionsmade Rio Grande habitat below the Rio Conchos confluence more sim-ilar to that above it. Regional hydrological homogenization, in turn, wasassociated with and likely led to regional functional and taxonomichomogenization of fish faunas. These observations highlight the impor-tance of addressinghydrological variables in studies of biotic homogeni-zation, including water quality which is rarely considered, especiallywhen objectives include the characterization of functional aspects ofbiotic homogenization. Moreover, unlike results of earlier studies(Rahel, 2010), taxonomic homogenization in the present study wasprimarily due to changes in relative abundances of native fishes.Changes in exotic species, whose presence in the region generallypre-dates the study period, did not seem to contribute appreciably tobiotic homogenization.
The present results are also relevant to the conservation of naturalresources of theBig Bend area of the RioGrande Basin,whichhas uniqueecological value among North American desert ecosystems. If currenthydrological trends in the area continue, the integrity of its currentfish assemblages may continue to deteriorate and current efforts toreestablish extirpated species (Moring et al., 2014) may not be fullysuccessful or fail. In addition, the increased salinity could bring a newmajor threat to the area: the highly toxic golden alga (Prymnesiumparvum). Golden alga was detected in the upper reach of the Trans-Pecos region in 2012 (TPWD, 2014), and it is likely that downstreamdispersal is taking place. Because blooms of golden alga are facilitatedby salinity levels ≥ 1200–2000 μS/cm (Patiño et al., 2014) and mediansalinity in much the Big Bend area has already reached these levels,there is growing risk of golden alga establishment in the region. Interna-tional cooperation to improve and maintain adequate hydrological
conditions may be necessary for the long-term sustainability of the BigBend area ecosystem and the services it provides.
Acknowledgments
This research was supported by Texas Parks and Wildlife Depart-ment (Grant # E-103-R), Texas Tech University, and Texas CooperativeFish and Wildlife Research Unit. Allison Pease provided advice on anearlier version of the manuscript, Matt VanLandeghem assisted withgeneralized linear model analysis, and Jose Zavala and RobertChristensen helped with fieldwork. Fish protocols were approved byTexas Tech University Institutional Animal Care and Use Committee(# 09018–04). The Texas Cooperative Fish and Wildlife Research Unitis jointly supported by U.S. Geological Survey, Texas Tech University,Texas Parks and Wildlife Department, The Wildlife Management Insti-tute, andU.S. Fish andWildlife Service. Anyuse of trade,firm, or productnames is for descriptive purposes only and does not imply endorsementby the U.S. Government.
Appendix A. Supplementary data
Supplementary data to this article can be found online at http://dx.doi.org/10.1016/j.scitotenv.2014.12.079.
References
Bailey, P.C.E., Boon, P.I., Blinn, D.W., Williams, W.D., 2006. Salinisation as an ecologicalperturbation to rivers, streams and wetlands of arid and semi-arid regions. In:Kingsford, R. (Ed.), Ecology of Desert Rivers. Cambridge University Press, New York,pp. 280–314.
Bestgen, K.R., Platania, S.P., 1988. The ichthyofauna and aquatic habitats of the Rio Grandefrom the New Mexico-Texas border to Big Bend National Park. Albuquerque: FinalReport to the U.S. Fish and Wildlife Service, Office of Endangered Species.
Bronaugh, D., Werner, A., 2013. Zhang + Yue-Pilon Trends Package. R Package Version0.10-1. (Available at: http://cran.r-project.org/web/packages/zyp).
Calamusso, B., Rinne, J.N., Edwards, R.J., 2005. Historic changes in the Rio Grande fishfauna: status, threats, and management of native species. In: Rinne, J.N., Hughes,R.M., Calamusso, B. (Eds.), Historical Changes in Large River Fish Assemblages ofthe Americas. Bethesda: American Fisheries Society, Symposium 45, pp. 205–223.
Cañedo-Argüelles, M., Kefford, B.J., Piscart, C., Prat, N., Schäfer, R.B., Schulz, C., 2013.Salinisation of rivers: an urgent ecological issue. Environ. Pollut. 173, 157–167.
Cheek, C.A., Taylor, C.M., 2014. Salinity and geomorphology drive long-term changes tolocal and regional fish assemblage attributes in the lower Pecos River, Texas. Ecol.Freshw. Fish (in press).
Echelle, A.A., Echelle, A.F., Hill, L.G., 1972. Interspecific interactions and liming factors ofabundance and distribution in the Red River pupfish, Cyprinodon rubrofluviatilis.Am. Midl. Nat. 88, 109–130.
Edwards, R.J., 2013. Biological monitoring of the repatriation efforts for the endangeredRio Grande silvery minnow (Hybognathus amarus) in Texas. Final Report to TexasParks and Wildlife.
Edwards, R.J., Garrett, G.P., Marsh-Matthews, E., 2002. Conservation and status of the fishcommunities inhabiting the Rio Conchos basin and middle Rio Grande, Mexico andU.S.A. Rev. Fish Biol. Fish. 12, 119–132.
Ellis, S.R., Levings, G.W., Carter, L.F., Richey, S.F., Radell, M.J., 1993. Rio Grande Valley,Colorado, New Mexico, and Texas. J Am Water Resour Assoc 29, 617–648.
Everitt, B., 1993. Channel responses to declining flow on the Rio Grande between Ft.Quitman and Presidio, Texas. Geomorphology 6, 225–242.
Garrett, G.P., Edwards, R.J., 2014. Changes in fish populations in the lower canyons of theRio Grande. In: Hoyt, C.A., Karges, J. (Eds.), Proceedings of the Sixth Symposium onthe Natural Resources of the Chihuahuan Desert Region. Chihuahuan Desert ResearchInstitute, Fort Davis, pp. 396–408 (Available at: http://cdri.org/publications/proceedings-of-the-symposium-on-the-natural-resources-of-the-chihuahuan-desert-region/).
Gotelli, N.J., Entsminger, G.L., 2001. ECOSIM: Null Models Software for Ecology, Ver. 7.69.Acquired Intelligence Inc. and Kesey-Bear (Available at: http://www.garyentsminger.com/ecosim/index.htm).
Gotelli, N.J., Graves, G.R., 1996. Null Models in Ecology. Smithsonian Institution Press,Washington, DC.
Gutiérrez, M., Carreón-Hernández, E., 2004. Salinidad en el bajo Rio Conchos: aportes ytendencias. Terra Latinoam. 22, 499–506.
Gutiérrez, M., Johnson, E., 2014. Salinity trend in the Lower Rio Conchos, Chihuahua. In:Hoyt, C.A., Karges, J. (Eds.), Proceedings of the Sixth Symposium on the Natural Re-sources of the Chihuahuan Desert Region. Chihuahuan Desert Research Institute,Fort Davis, pp. 60–70 (Available at: http://cdri.org/publications/proceedings-of-the-symposium-on-the-natural-resources-of-the-chihuahuan-desert-region/sixth-symposium-on-the-natural-resources-of-the-chihuahuan-desert-region/aquatics/salinity-trend-of-the-lower-rio-conchos).

453S. Miyazono et al. / Science of the Total Environment 511 (2015) 444–453
Heard, T.C., Perkin, J.S., Bonner, T.H., 2012. Intra-annual variation in fish communities andhabitat associations in a Chihuahua desert reach of the Rio Grande/Rio Bravo DelNorte. West. North Am. Nat. 72, 1–15.
Helsel, D.R., Hirsch, R.M., 2002. Statistical methods in water resources. U.S. GeologicalSurvey Techniques of Water Resources Investigations, Book 4 (Chapter A3).
Hubbs, C., Wauer, R., 1973. Seasonal changes in the fish fauna of Tornillo Creek, BrewsterCounty, Texas. Southwest. Nat. 17, 375–379.
Hubbs, C., Miller, R.R., Edwards, R.J., Thompson, K.W., Marsh, E., Garret, G., et al., 1977.Fishes inhabiting the Rio Grande, Texas and Mexico, between El Paso and the PecosConfluence. Importance, preservation, and management of riparian habitat. USDAForest Service General Technical Report RM-43.
Hubbs, C., Edwards, R.J., Garrett, G.P., 2008. An annotated checklist of the freshwaterfishes of Texas, with keys to identification of species. Texas Acad Sci (Available at:http://www.texasacademyofscience.org/).
Kelly, M.E., 2001. The Rio Conchos: A Preliminary Overview. Texas Center for Policy Stud-ies, Austin (Available at: http://www.texascenter.org/publications/rioconchos.pdf).
Kingsford, R.T., Lemly, A.D., Thompson, J.R., 2006. Impacts of dams, river management anddiversions on desert rivers. In: Kingsford, R. (Ed.), Ecology of Desert Rivers.Cambridge University Press, New York, pp. 203–247.
Koenker, R., Bassett, G.W., 1978. Regression quantiles. Econometrica 46, 33–50.Koenker, R., Portnoy, S., Ng, P.T., Zeileis, A., Grosjean, P., Ripley, B.D., 2013. Quantile
Regression. R Package Version 5.05. (Available at: http://cran.r-project.org/web/packages/quantreg).
Lee, C.E., Moss, W.E., Olson, N., Chau, K.F., Chang, Y.-M., Johnson, K.E., 2013. Feasting infreshwater: impacts of food concentration on freshwater tolerance and the evolutionof food × salinity response during the expansion from saline into fresh waterhabitats. Evol. Appl. 6, 673–689.
Linam, G.W., Kleinsasser, L.J., 1998. Classification of Texas freshwater fishes into trophicand tolerance groups. Austin: River Studies Report No. 14. Resource ProtectionDivision Texas Parks and Wildlife Department.
Linam, G.W., Kleinsasser, L.J., Mayes, K.B., 2002. Regionalization of the index of bioticintegrity for Texas streams. Austin: River Studies Report No. 17. Resource ProtectionDivision Texas Parks andWildlife Department (Available at: https://www.tpwd.state.tx.us/publications/pwdpubs/media/pwd_rp_t3200_1086.pdf).
Matthews,W.J., Hill, L.G., 1977. Tolerance of the red shiner,Notropis lutrensis (Cyprinidae)to environmental parameters. Southwest. Nat. 22, 89–98.
McCune, B., Grace, J.B., 2002. Analysis of Ecological Community. MjM Software Design,Gleneden Beach.
McCune, B., Mefford, M.J., 1999. PC-ORD (Multivariate Analysis of Ecological Data),Version 6. MjM Software Design, Gleneden Beach.
McKinney, M.L., Lockwood, J.L., 1999. Biotic homogenization: a few winners replacingmany losers in the next mass extinction. Trends Ecol. Evol. 14, 450–453.
McLeod, A.I., 2011. Kendall Rank Correlation and Mann–Kendall Trend Test. R PackageVersion 2.2. (Available at: http://cran.r-project.org/web/packages/Kendall).
Minckley, W.L., Unmack, P.J., 2000. Western springs: their faunas and threats to their ex-istence. In: Abell, R.A., Olson, D.M., Dinerstein, E., Hurley, P., Diggs, J.T., Eichbaum, W.,Walters, S., Wettengel, W., Allnutt, T., Loucks, C.J., Hedao, P., Taylor, C. (Eds.),Freshwater Ecoregions of North America: A Conservation Assessment. Island Press,Washington, DC, p. 52.
Miyamoto, S., Yuan, F., Anand, S., 2006. Influence of tributaries on salinity of AmistadInternational Reservoir. Technical Report TR — 292. Texas Water Resources Institute(Available at: http://twri.tamu.edu/media/3901/miyamoto-8-amistad-pub.pdf. Lastaccessed, 5 September 2014).
Miyazono, S., Taylor, C.M., 2013a. Effects of habitat size and isolation on species immigra-tion–extinction dynamics and community nestedness in a desert river system.Freshw. Biol. 58, 1303–1312.
Miyazono, S., Taylor, C.M., 2013b. Distribution, abundance, and habitat of the threatenedminnows Campostoma ornatum and Notropis chihuahua in the Trans-Pecos region ofTexas. Southwest. Nat. 58, 163–169.
Moring, J.B., Braun, C.L., Pearson, D.K., 2014. Mesohabitats, Fish Assemblage Composition,and Mesohabitat Use of the Rio Grande Silvery Minnow Over a Range of Seasonal
Flow Regimes in the Rio Grande/Rio Bravodel Norte, In and Near Big Bend NationalPark, Texas, 2010–11. Scientific Investigations Report 2013–5210. U.S. Departmentof the Interior, U.S. Geological Survey.
Moyer, D.L., Anderholm, S.K., Hogan, J.F., Phillips, F.M., Hibbs, B.J., Witcher, J.C., et al., 2013.Knowledge and understanding of dissolved solids in the Rio Grande–San Acacia, NewMexico, to Fort Quitman, Texas, and plan for future studies and monitoring. U.S.Geological Survey Open-File Report 2013–1190.
Olden, J.D., 2006. Biotic homogenization: a new research agenda for conservationbiogeography. J. Biogeogr. 33, 2027–2039.
Olden, J.D., Rooney, T.P., 2006. On defining and quantifying biotic homogenization. GlobalEcol. Biogeogr. 15, 113–120.
Olden, J.D., Kennard, M.J., Pusey, B.J., 2008. Species invasions and the changing biogeogra-phy of Australian freshwater fishes. Global Ecol. Biogeogr. 17, 25–37.
Olden, J.D., Kennard, M.J., Leprieur, F., Tedesco, P.A., Winemiller, K.O., García-Berthou, E.,2010. Conservation biogeography of freshwater fishes: recent progress and futurechallenges. Divers. Distrib. 16, 496–513.
Paerl, H.W., Paul, V.J., 2012. Climate change: links to global expansion of harmfulcyanobacteria. Water Res. 46, 1349–1363.
Patiño, R., Dawson, D., VanLandeghem, M.M., 2014. Retrospective analysis of associationsbetween water quality and toxic blooms of golden alga (Prymnesium parvum) inTexas reservoirs: implications for understanding dispersal mechanisms and impactsof climate change. Harmful Algae 33, 1–11.
Platania, S.P., 1990. The ichthyofauna of the Rio Grande drainage, Texas and Mexico, fromBoquillas to San Ygnacio. Albuquerque: Final Report to the U.S. Fish and WildlifeService, Office of Endangered Species.
Poff, N.L., Olden, J.D., Merritt, D.M., Pepin, D.M., 2007. Homogenization of regional riverdynamics by dams and global biodiversity implications. Proc. Natl. Acad. Sci. U. S. A.104, 5732–5737.
Pool, T.K., Olden, J.D., 2012. Taxonomic and functional homogenization of an endemicdesert fish fauna. Divers. Distrib. 18, 366–376.
Rahel, F.J., 2010. Homogenization, differentiation, and the widespread alteration of fishfaunas. In: Gido, K.B., Jackson, D.A. (Eds.), Community Ecology of Stream Fishes:Concepts, Approaches, and Techniques. Bethesda: American Fisheries Society,Symposium 73, pp. 311–326.
Raines, T.H., Turco, M.J., Connor, P.J., Bennett, J.B., 2012. Streamflow gaines and lossess andselected water-quality observations in five subreaches of the Rio Grande/Rio Bravodel Norte from near Presidio to Langtry, Texas, Big Bend area, United States andMexico 2006. U.S. Geological Survey Scientific Investigations Report 2012–5125.
Schmidt, J.C., Everitt, B.L., Richard, G.A., 2003. Hydrology and geomorphology of the RioGrande and implications for river restoration. In: Garrett, G.P., Allan, N.L. (Eds.),Aquatic Fauna of the Northern Chihuahuan Desert. University Special PublicationsNumber 46, Museum of Texas Tech, Lubbock, pp. 25–42.
Sen, P.K., 1968. Estimates of the regression coefficient based on Kendall's tau. J. Am. Stat.Assoc. 63, 1379–1389.
Taylor, C.M., 2010. Covariation among plains stream assemblages, flow regimes, andpatterns of water use. In: Gido, K.B., Jackson, D.A. (Eds.), Community Ecology ofStream Fishes: Concepts, Approaches, and Techniques. Bethesda: American FisheriesSociety, Symposium 73, pp. 447–459.
Toussaint, A., Beauchard, O., Oberdorff, T., Brosse, S., Villéger, S., 2014. Historical assem-blage distinctiveness and the introduction of widespread non-native species explainworldwide changes in freshwater fish taxonomic dissimilarity. Global Ecol. Biogeogr.23, 574–584.
TPWD, 2014. Golden Alga Bloom Expanded Status Reports. Texas Parks and WildlifeDepartment, Austin (Available at: http://www.tpwd.state.tx.us/landwater/water/environconcerns/hab/ga/status2.phtml#rio).
Winter, M., Kühn, I., Nentwig, W., Klotz, S., 2008. Spatial aspects of trait homogenizationwithin the German flora. J. Biogeogr. 35, 2289–2297.
Yu, S.-L., Peters, E.J., 2002. Diel and seasonal habitat use by red shiner (Cyprinellalutrensis). Zool. Stud. 41, 229–235.
Copyright © 2022 FDOKUMEN