Favretto et al 2016 dryland ecosystem services tradeoffs.pdf
Upload
independentCategory
view
1download
0
Is There an Association between Dryland Salinity and RossRiver Virus Disease in Southwestern Australia?
Andrew Jardine,1 Peter Speldewinde,1,2 Michael D. A. Lindsay,3 Angus Cook,1 Cheryl A. Johansen,4
and Philip Weinstein1
1School of Population Health, M431, The University of Western Australia, 35 Stirling Highway, Crawley, Western Australia 6009, Australia2Centre of Excellence in Natural Resource Management, The University of Western Australia, Albany, Western Australia 6330, Australia3Mosquito-Borne Disease Control Branch, WA Department of Health, Shenton Park, Western Australia 6008, Australia4Arbovirus Surveillance and Research Laboratory, Discipline of Microbiology and Immunology, The University of Western Australia, Crawley, Western
Australia 6009, Australia
Abstract: Land use change has the potential to cause severe ecosystem degradation and drive changes in
disease transmission and emergence. Broadscale clearing of native vegetation for agriculture in southwestern
Australia has resulted in severe ecosystem degradation, which has been compounded by the subsequent
development of large areas of dryland salinity. The mosquito-borne disease, Ross River virus (RRV), has been
noted as a potential adverse human health outcome in these salinity affected regions. The association between
dryland salinity and RRV disease was therefore tested by undertaking a spatial analysis of disease notification
records using standard and Bayesian techniques. To overcome inherent limitations with notification data,
serological RRV antibody prevalence was also investigated. Neither method revealed a significant association
with dryland salinity, however, the spatial scale imposed limited the sensitivity of both studies. Thus, further
multidisciplinary studies are required to overcome these limitations and advance understanding of this eco-
system health issue, particularly using variables that can be investigated on a finer scale.
Keywords: Dryland salinity, Waterlogging, Ross River virus, Mosquito-borne disease, Western Australia
INTRODUCTION
Rapid and broadscale land clearing for agriculture in inland
southwest Western Australia (WA) has resulted in severe
ecosystem degradation, leaving only small highly frag-
mented patches of natural vegetation (Hobbs, 1993). Land
clearing alters the water balance because annual shallow-
rooted pasture crops use less water than native deep-rooted
perennial native vegetation, resulting in increased recharge
and runoff. This ultimately leads to rising of the water
table, bringing saline water into the root zone of plants
(Clarke et al., 2002). The combination of hypoxia due to
waterlogging and high salinity strongly adversely affects
growth (Barrett-Lennard, 2003), further compounding
ecosystem degradation and biodiversity loss (Cramer and
Hobbs, 2002). Currently, 1.047 million hectares of south-
west WA are affected by waterlogging and dryland salinity,
and this area may expand up to a further 1.7–3.4 million
hectares if trends continue (George et al., 2006).
Soil and water salinization resulting from agricultural
development has been noted to potentially influence
mosquito population composition and associated disease
Published online: February 20, 2008
Correspondence to: Andrew Jardine, e-mail: [email protected]
EcoHealth 5, 58–68, 2008DOI: 10.1007/s10393-007-0151-z
Original Contribution
� 2008 International Association for Ecology and Health

risk (Mulla et al., 1987) but has received little research
attention to date. The limited available evidence supports
this observation, indicating that disease risk can both in-
crease or decrease depending on a range of factors specific
to the local setting (Klinkenberg et al., 2004; Temel, 2004).
These two case studies are detailed further in Table 1. These
studies on irrigation-induced salinity and malaria overseas
permit the tentative hypothesis that waterlogging and land
salinization have the potential to alter the species compo-
sition of native mosquito fauna, which may in turn alter the
health risk from mosquito-borne diseases to the local hu-
man population.
Recent research in southwestern Australia has investi-
gated this concept further and indicates that dryland
salinity and waterlogging may have altered the mosquito
ecology in the region by facilitating the inland spread of
Aedes camptorhynchus (Lindsay et al., 2007). This species
has been confirmed as the major vector of Ross River Virus
(RRV) in southern Australia (Ballard and Marshall, 1986;
Russell, 1995) and breeds in brackish to highly saline water,
frequently feeds on humans, and can disperse a long dis-
tance from breeding sites (Lee et al., 1984). Breeding is
primarily associated with coastal saltmarsh habitat, how-
ever, preliminary mosquito collections in inland regions of
southwestern Australia indicate that the species composi-
tion has changed over the past 50 years as the severity of
waterlogging and salinity has increased, and Ae. camp-
torhynchus is now widely established in salinity affected
areas (Lindsay et al., 2007).
Increased surface water salinity and soil waterlogging
may act synergistically to augment breeding of Ae. camp-
torhynchus (Jardine et al., 2007). Increasing salinity nega-
tively influences aquatic biodiversity (Pinder et al., 2005),
resulting in a reduction of salt-tolerant mosquito larval
predators and interspecific resource competition from
other salt-sensitive aquatic biota. Additionally, waterlog-
ging may also provide a greater area of potential mosquito
breeding habitat due to increased volume and duration of
surface water retention induced by waterlogging (Jardine
et al., 2007).
RRV disease is the most common arboviral infection in
Australia with 67,621 laboratory-diagnosed cases reported
in Australia to the end of 2006, since reporting began in
1991 (Communicable Diseases Network Australia, 2007).
RRV disease (also referred to as ‘‘epidemic polyarthritis’’) is
characterized by rheumatic joint manifestations, rash,
constitutional effects and other presentations including
splenomegaly, hematuria, glomerulonephritis, paresthesia, Tab
le1.
Exi
stin
gSt
ud
ies
Inve
stig
atin
ga
Lin
kb
etw
een
Soil
Sali
niz
atio
nan
dM
osq
uit
o-b
orn
eD
isea
se
Ref
eren
ceL
oca
tio
nan
dye
ar(s
)Sa
lin
ity
typ
eE
ffec
tso
nm
osq
uit
op
op
ula
tio
ns
Eff
ects
on
dis
ease
tran
smis
sio
n
Kli
nke
nb
erg
etal
.,20
04P
un
jab
,P
akis
tan
1970
–19
99Ir
riga
tio
n-i
nd
uce
dso
il
sali
niz
atio
nan
dw
ater
logg
ing
Ch
ange
inre
lati
ved
om
inan
ceo
f
the
pri
mar
ym
alar
iave
cto
r,
An
oph
eles
culi
cifa
cies
,to
the
mo
resa
lt-t
ole
ran
tb
ut
less
-effi
cien
tve
cto
r,
An
.st
eph
ensi
Mal
aria
tran
smis
sio
nn
egat
ivel
y
asso
ciat
edw
ith
sali
nit
y
dev
elo
pm
ent
ove
rti
me
Tem
el,
2004
Aze
rbij
an,
1999
Irri
gati
on
-in
du
ced
soil
sali
niz
atio
n
No
tin
vest
igat
ed.
Ho
wev
er,
the
pri
mar
ym
alar
iave
cto
rin
Aze
rbij
an,
An
.sa
char
ovi,
is
mo
der
atel
ysa
lt-t
ole
ran
t
Mal
aria
inci
den
cep
osi
tive
ly
corr
elat
edw
ith
incr
easi
ng
area
of
sali
ne
lan
d
Dryland Salinity and Ross River Virus Disease 59

headache, neck stiffness, and photophobia (Russell, 2002).
Symptomatic disease predominantly affects those aged be-
tween 20–60 years, peaking in the 30–40 years age group.
Infected individuals who develop disease completely re-
cover after a widely variable duration of a few days to over a
year, and thereafter possess long-lasting immunity (Russell,
2002).
In the southwest of WA, RRV activity is primarily
focused in the Swan Coastal Plain between Perth and
Dunsborough (Lindsay et al., 1992, 1996). Accordingly,
regular intensive mosquito and virus surveillance is carried
out in this region (Johansen et al., 2005a). However, small
clusters of cases have also occurred further inland (Lindsay,
1995; Lindsay et al., 2005) where Ae. camptorhynchus has
now become established (Lindsay et al., 2007).
The possibility of an association between dryland
salinity in inland southwest WA and RRV disease has been
suggested previously (Horwitz et al., 2001; Jardine et al.,
2007; Lindsay et al., 2007). The aim of this study was to
directly test this association using RRV disease notification
records and data from a serological survey.
Only two previous surveys of human RRV neutralizing
antibody prevalence have been conducted in WA, both in
known RRV endemic coastal regions of the southwest. A
survey of 271 serum samples from blood donors tested by
neutralization assay in the Peel region (Fig. 1) of WA in
1993 determined a seroprevalence of 8.5% (Johansen,
1998). A subsequent random serological survey was con-
ducted on 806 samples from coastal localities in the
southwest of WA, revealing an overall seroprevalence of
7.2% (Dodsley et al., 2001). Both studies showed a slightly
higher RRV antibody prevalence in males (�60%), and a
greatest prevalence among the 40–60 year-old-age group,
consistent with the studies from the eastern states, reviewed
in Harley et al. (2001).
Interestingly, both studies also showed evidence of a
relatively low antibody prevalence in the region where the
majority of virus notifications occur in the state (Lindsay
et al., 1992, 1996, 2005). Serological studies have not pre-
viously been undertaken on residents from inland regions
of southwest WA.
MATERIALS AND METHODS
Study Region
The study region is illustrated in Figure 1. The estimated
resident population at June 2005 in this region was 31,639
(ABS, 2006b). Future population estimates for this region
indicate that this figure will remain relatively static (in con-
trast to strong population growth forecast for coastal regions
of the southwest), with the estimated resident population in
2031 predicted to increase slightly to 32,480 (Western Aus-
tralian Planning Commission, 2005). The climate is tem-
perate with hot dry summers and cool wet winters. The
average annual rainfall ranges from 700 mm in the west,
decreasing to less than 400 mm in the east. The primary
industry in the region is agriculture, including broad acre
cropping, sheep grazing, and wool production. This region
has been almost completely cleared of all native vegetation
for agriculture and, as a result, a significant area of this region
is now affected by dryland salinity (George et al., 1995).
Data Sources
Data on all doctor-notified and laboratory-reported cases
of RRV from the study region between July 1988 and June
2006 were extracted from the enhanced surveillance data-
base by the Mosquito-Borne Disease Control branch
(MBDC), WA Department of Health (WADOH). In WA, it
is mandatory for doctors to report serologically confirmed
Figure 1. Map of southwestern Australia with the study region
indicated by shading. Numbered areas indicate subregions used in
the serological survey. A more detailed map of the study region is
shown in Figure 2.
60 Andrew Jardine et al.

cases of RRV to the state Department of Health and each
case is then recorded based on place of residence. Further
follow-up is then undertaken to determine the most likely
location of infection, which is not necessarily the place of
residence. The notification is sent to the local government
in which the patient resides and an Environmental Health
Officer in the region administers an enhanced surveillance
questionnaire for each case to determine timing of symp-
tom onset, exposure to biting mosquitoes, and travel his-
tory prior to becoming ill. The MBDC branch then use this
information to record the probable location of infection in
the enhanced surveillance database, rather than simply
recording it as the individual’s residential address as occurs
in other states (Lindsay et al., 2005). This case follow-up
process is completed for approximately 70% of notifica-
tions [M. Lindsay, 2006, unpublished data].
Soil-Landscape Systems data (metadata date: 03/02/
2005) developed by the Natural Resource Assessment
Group of the WA Department of Agriculture was used to
calculate the salinity and waterlogging variables in this
study. Soil-landscape mapping contains a nested hierarchy
of landscape and associated soil units, reflecting both
landscape and soil processes, and also incorporates geo-
logical and environmental variables. The dataset is de-
scribed in detail in Schoknecht et al. (2004).
Population data for each Local Government Area
(LGA) in the study region were obtained from the 1996
Census of Population and Housing (ABS, 1996). This
census dataset was used as it lies closest to the middle of the
RRV notification data range (i.e., July 1988–June 2006).
Calculation of Area of Salinity and Waterlogging
ArcGIS 9 (ESRI, Redlands, CA) was used to map the Soil-
Landscape Systems data and calculate the area of salinity
and waterlogging as a percentage of the total area in each
LGA. The area of salinity was calculated by multiplying the
area of each polygon in the LGA by the percentage of land
defined in the dataset as either at high risk of salinity or
presently saline. All polygons in each LGA were then added
together to give a total area of saline land in each LGA,
which was divided by the total area of the LGA to give a
percentage. Salinity was then coded into the following
tertile categories based on percentage of land affected; 1
(<7.89%), 2 (7.89%–14.32%), and 3 (>14.33%).
Percentage area of waterlogging for each LGA was
calculated in the same way as for salinity using the per-
centage of each polygon defined in the dataset as either at
high or very high risk of waterlogging, then coded into
tertile categories; 1 (<4.53%), 2 (4.53% – 8.54%), and 3
(>8.54%).
Negative Binomial Regression Modeling of
Cumulative Incidence Rate
Negative binomial regression was undertaken in STATA
v9.2 (StataCorp LP, College Station, TX) to test the
hypothesis that increasing area of salinity and/or water-
logging was associated with a high cumulative incidence
rate of RRV. This regression model was selected as good-
ness-of-fit tests using the Pearson statistic indicated that
standard Poisson analysis was inappropriate. The correla-
tion coefficient of 0.673 between the salinity and water-
logging variables indicated that these two variables were
strongly correlated; therefore, both variables were examined
separately to limit problems of colinearity. A combined
indicator of dryland salinity was also constructed by adding
the numerical value of the salinity and waterlogging cate-
gories together, and this indicator was modeled separately
to investigate possible interaction between the two vari-
ables.
Therefore, in the negative binomial regression model,
RRV cumulative incidence was the dependent variable, and
either salinity, waterlogging, or combined dryland salinity
indicator categories were the independent variables. The
1996 population based on census data was used as the offset
variable.
Bayesian Analysis
The mapping of standard incidence rates (SIR) can be
problematic. A small change in the expected value or in the
observed value can produce a large change in the SIR
(Lawson et al., 2003). This process tends to produce highly
unstable estimates with low frequency diseases, particularly
where the base populations are also relatively small (Mar-
shall, 1991). Additionally, SIRs of geographically proximate
areas tend to display positive spatial autocorrelation (Pas-
cutto et al., 2000). Bayesian methods overcome these
concerns regarding classic mapping of disease rates to a
certain extent.
Empirical Bayes models are the most robust as they can
model any random effects arising from the prior distribu-
tion (Lawson et al., 2000). In this context, a random effect
may be considered as an extra quantity of variation (or
variance component) which is estimable within a map and
Dryland Salinity and Ross River Virus Disease 61
which can be ascribed a defined probabilistic structure
(Lawson et al., 2003).
A Besag, York, and Mollie (BYM) model (Besag et al.,
1991; Lawson et al., 2003) was used as it is considered to be
one of the most robust and well-validated for spatial
analysis of disease (Lawson et al., 2000). This model
decomposes area-specific random effects into two compo-
nents. One component takes into account correlated het-
erogeneity (effects that vary in a spatially structured way
and represent the correlation of neighboring locations on a
map), and the other component represents uncorrelated
heterogeneity (effects that vary in an unstructured way and
represent unobserved covariates or confounding variables).
Mathematically, the BYM model is expressed as:
logðhiÞ ¼ aþ bxi þ bi þ hi
where hi corresponds to the relative risk, bxi the explana-
tory variable, bi the correlated heterogeneity and hi the
uncorrelated heterogeneity for the area i.
Models were run through WinBUGS� (MRC Biosta-
tistics Unit, Cambridge, UK) and compared using the
deviance information criterion (DIC) (Spiegelhalter et al.,
2002). Models with lower DIC value are usually selected as
providing the best representation of the data. A burn in of
10,000 iterations was used to ensure convergence before a
sample of 5000 iterations was used to calculate sample
means and DIC. For each WinBUGS simulation, alpha and
betas were monitored to ensure the simulation was
exploring all of the possible distribution space. At the end
of each simulation, the distribution of the alpha and beta
parameters was checked to ensure the simulation had re-
turned a normal distribution. The history of each simula-
tion was also checked to ensure convergence. In most cases,
convergence occurred within 200 iterations.
Serological Survey
The serological study methodology was approved by The
University of Western Australia Human Research Ethics
Committee (Project No RA/4/1/1300). A sampling method
similar to Dodsley et al. (2001) was used to enable com-
parison of results between the studies. Serum samples were
obtained from an existing serum bank maintained by
PathWest Laboratory Medicine WA, the primary public
pathology facility in WA. All samples sent for testing at
PathWest from across the state are stored in the serum
bank for 12 months before being discarded.
Four subregions were selected from within the study
region as detailed in Table 4 (see Fig. 1 for locations of
each subregion). These subregions were selected as they
varied significantly by area of salinity and waterlogging.
Deidentified samples were selected from the PathWest
database by residential postcode as required by the ethics
committee, with dates of sample collection between 10/11/
2004 and 8/29/2005. As mentioned previously, samples sent
for testing for suspected arbovirus infection were excluded
to avoid introducing bias. Every second sample (in chro-
nological order of collection) was excluded in subregion 2
to give approximately equal numbers of samples between
subregions. Duplicate blood samples were excluded so each
sample represented a unique individual.
Each serum sample was tested for the presence of
neutralizing antibodies to RRV in a serum neutralization
assay (Rosenbaum et al., 1972) modified as described by
Johansen (2005b), to determine the seroprevalence of
antibodies to this virus in each subregion. Observed dif-
ferences were tested for statistical significance by chi-
squared tests corrected for continuity using SPSS 14.0
(SPSS Incorporated, Chicago, IL).
RESULTS
RRV Disease Cases in the Study Region
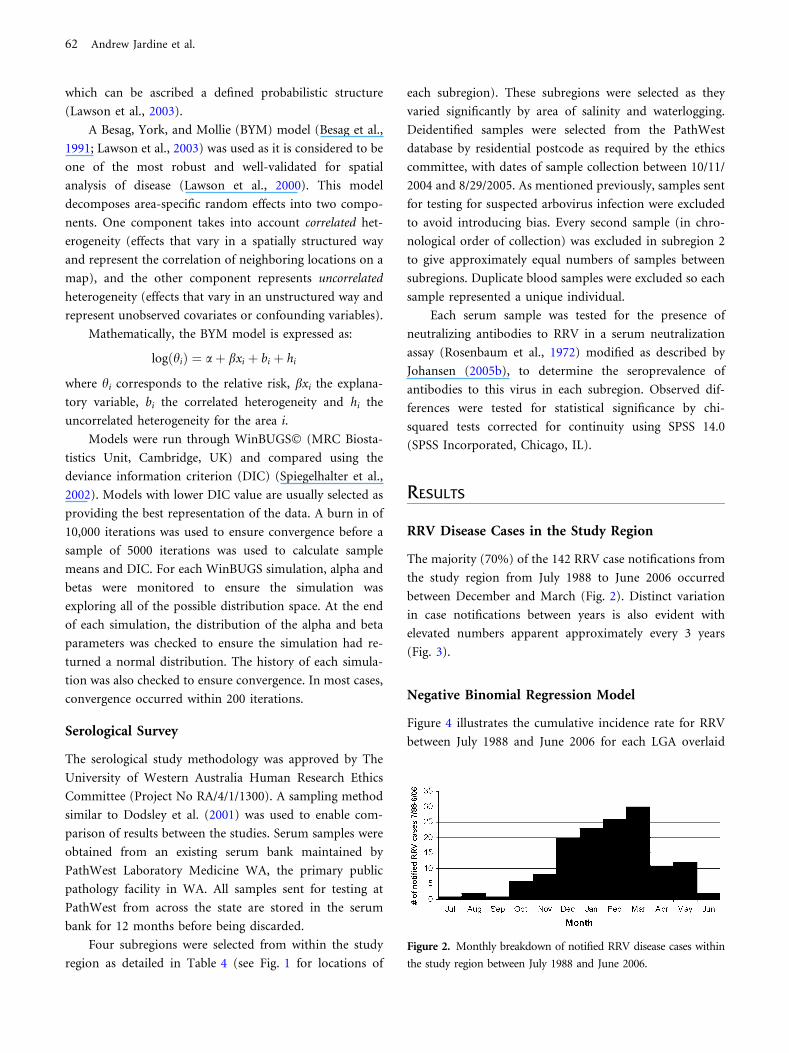
The majority (70%) of the 142 RRV case notifications from
the study region from July 1988 to June 2006 occurred
between December and March (Fig. 2). Distinct variation
in case notifications between years is also evident with
elevated numbers apparent approximately every 3 years
(Fig. 3).
Negative Binomial Regression Model
Figure 4 illustrates the cumulative incidence rate for RRV
between July 1988 and June 2006 for each LGA overlaid
Figure 2. Monthly breakdown of notified RRV disease cases within
the study region between July 1988 and June 2006.
62 Andrew Jardine et al.

on the percentage of salinity in each polygon. Note that
the circles representing the cumulative incidence rate
within each LGA are placed at the centroid, represent the
rate for the whole LGA, and are a continuous variable,
with circle diameter directly proportionate to the inci-
dence rate.
Table 2 contains the cumulative incidence rate ratios
for each independent variable category derived from the
negative binomial regression analysis. The lowest category
of each independent variable (i.e., salinity, waterlogging
= 1 or combined indicator = 2) was set as the baseline
(incidence rate ratio = 1) to which each other strata was
compared. No significant associations were observed be-
tween the RRV cumulative incidence rate and the indi-
vidual nor combined waterlogging and salinity variables.
Bayesian Analysis
The addition of either salinity or waterlogging variables to
the Bayesian model did not significantly lower the DIC
value from the baseline model a + b + h (DIC = 114.069)
Figure 3. Annual (July–June) incidence of RRV disease notifications
from the study region.
Figure 4. Salinity (percentage of
area at high risk or presently
saline) overlaid by RRV cumula-
tive incidence rate for each LGA.
Note that the incidence rate is a
continuous variable and the circle
diameter is directly proportional to
the incidence rate for the whole
LGA, as indicated in the legend.
Table 2. Cumulative Incidence Rate Ratios for Each Indepen-
dent Variable Category Derived from the Negative Binomial
Regression Analysis
RRV cases
Cumulative incidence
rate ratio
95% CI
Salinity category
1 (baseline) 1.00
2 1.96 0.85–4.55
3 1.22 0.83–1.78
Waterlogging category
1 (baseline) 1.00
2 0.54 0.23–1.25
3 0.95 0.65–1.37
Combined index of environmental degradation
(waterlogging + salinity)
2 (baseline) 1.00
3 2.16 0.68–6.82
4 0.81 0.32–2.05
5 1.18 0.79–1.75
6 1.15 0.88–1.50
Dryland Salinity and Ross River Virus Disease 63

(Table 3), and therefore it is unlikely that salinity or
waterlogging explains the distribution of RRV cases using
this Bayesian model.
Serosurvey
The greatest prevalence of neutralizing antibodies to RRV
was observed in Kojonup (Table 4), one of the lower saline
and waterlogged subregions; however, none of the differ-
ences between the subregions were significant.
Across the four subregions, there was a large statisti-
cally significant (P value = <0.01) disparity in RRV anti-
body seroprevalence between the genders, with a male-to-
female prevalence rate ratio of 4.5:1.0 (Table 5). There was
a general trend of increasing seroprevalence with age group,
however, this was not statistically significant (P value =
0.103) (Table 5). After adjustment for age and sex based
on 2005 estimated resident population data (ABS, 2006a),
the seroprevalence across the four subregions was calcu-
lated to be 5.4%.
DISCUSSION
Notification Data
The negative binomial regression modeling using cumula-
tive incidence rates did not show any significant association
between RRV notification incidence between July 1988 and
June 2006 and salinity, waterlogging, or a combined indi-
cator of both.
It is important to note that although the best available
enhanced case notification and environmental exposure
data were used, the analysis was constrained by the fact that
a relatively rare disease was being investigated in a sparse
human population. It is thus subject both to possible
exposure misclassification and unstable disease rate esti-
mates (Marshall, 1991).
Table 3. Deviance Information Criterion (DIC) for Ross River
Virus at the Local Government Area Levela
Model DIC
a 132.177
a + b 113.531
a + b + h 114.069
a + sal + b + h 114.922
a + watl + b + h 113.394
asal, presence of salinity; watl, presence of waterlogging.
Table 5. RRV Antibody Prevalence from Inland Southwest WA
by Gender and Age Group
Gender RRV-antibody-positive
samples
Samples
tested
Percentage
with antibodies
Male 19 231 8.23
Female 6 320 1.88
Age group
£ 19 years 2 67 2.99
20–29 years 2 136 1.47
30–39 years 6 127 4.72
40–49 years 7 93 7.53
50–59 years 2 61 3.28
‡60 years 6 67 8.96
Total 25 551 4.54
Table 4. Subregions Used in the Serosurvey and the Percentage of Their Area Affected by Salinity and Waterlogginga
Subregion Salinityb (%) Water loggingb (%) No. of samplesc No. posd Preve (%) RRV cuml inc./1000f
1: Boddington, Williams 4.15 0.59 103 5 4.85 2.94
2: Narrogin Town and Shire 14.32 6.22 160 5 3.13 2.37
3: Wagin, Dumbleyung 16.06 5.43 142 6 4.26 2.44
4: Kojonup 7.89 1.86 146 9 6.12 5.82
Total 551 25 4.54
aSee Figure 1 for location within study region. Prevalence of neutralizing antibodies to RRV in residents of four subregions with differing severity of salinity
and waterlogging.bPercentage of subregion affected.cNumber of blood samples tested.dNumber of samples positive for neutralizing antibodies to RRV.ePrevalence of neutralizing antibodies to RRV.fCumulative incidence rate (7/88–6/06) per 1000 population.
64 Andrew Jardine et al.

These limitations in spatial analysis of RRV have been
reported in other studies. An assessment of RRV disease at
the LGA scale has previously been carried out in Queens-
land, the state with the highest RRV incidence in Australia
(Gatton et al., 2004). This study used cumulative notifi-
cation data over a 10-year period to estimate an average
seasonal incidence rate for each LGA. Despite the large
number of cases included in the analysis, the authors rec-
ognized that a spatial analysis at the broad LGA scale could
only provide a general indication of disease patterns across
the state.
Ryan et al. (2006) conducted a spatial analysis of RRV
cases in Redland Shire, a densely populated urban region in
coastal southeast Queensland. They conducted the analyses
over a range of scales and, with the dense population and
large numbers of RRV notifications in the region, were able
to utilize a maximum resolution of a 0.25 km2 grid. They
demonstrated clearly that ‘‘the use of arbitrary adminis-
trative boundaries for spatial analyses has the potential to
mask any small-scale heterogeneity in disease patterns’’
(Ryan et al., 2006). This is also equally true for the envi-
ronmental data. Salinity and waterlogging are, of course,
variable within each LGA, and by assignment of an overall
LGA percentage, this spatial heterogeneity was not taken
into account. However, given the sparse population and
resultant low case numbers in the present study region,
aggregation of data to the LGA level was the only option
available.
The Bayesian analysis overcame some of the limitations
relating to the small resident population size and resultant
low number of RRV notifications in the study region. Again
no evidence of a significant link between RRV cumulative
incidence and either salinity or waterlogging in inland
southwest WA was determined. However, RRV notification
data are thought to represent a significant underestimate of
the true incidence (Russell, 2002). Therefore, the seropre-
valence of neutralizing antibodies to RRV in residents of
four regions of inland southwest WA were also determined
with respect to dryland salinity and waterlogging.
RRV Antibody Seroprevalence in Inland Southwest
WA
The results from this cross-sectional study indicated (i) an
overall crude seroprevalence of 4.5%; and (ii) an age–sex
adjusted seroprevalence of 5.4% across the four subregions
studied. Direct comparisons to other studies can be prob-
lematic due to different sampling procedures and study
design. A similar sample selection procedure was used by
Dodsley et al. (2001), although this group used the hem-
agglutination inhibition method to initially screen all
samples. The crude prevalence of 4.3% across the four in-
land regions surveyed in the southwest of the state found in
our study was lower than the 7.8% reported by Dodsley
et al. (2001) from coastal regions. The only other previous
RRV antibody survey in southern WA reported a preva-
lence of 8.4% from a sample of blood donors in the coastal
Peel region, where RRV is known to be enzootic (Johansen,
1998). This difference in seroprevalance between the inland
and coastal regions is reflected by the enhanced surveillance
notification data. The annual average notification rate of
RRV per 100,000 residents between July 1995 and June
2007 across the four inland regions included in the current
serosurvey was 20.33, compared to 61.12 in the coastal Peel
region [M. Lindsay, unpublished data].
An elevated prevalence of RRV infection with age was
evident in the current study. This trend is commonly ob-
served in antibody prevalence studies in regions where RRV
is endemic (Harley et al., 2001), however, the increasing
trend was not statistically significant and cannot be used as
evidence of RRV being endemic in the study region. The
male-to-female ratio of 4.5:1.0 was statistically significant
and much larger than previously observed in WA (Dodsley
et al., 2001; Johansen, 1998) or other parts of Australia
(reviewed in Harley et al., 2001). Some of this disparity may
be explained by gender-based differences in the location
and nature of occupations which put individuals at risk of
exposure to RRV. Statistics show that across the four
subregions, 20% of males work in the typically outdoor
occupations of agriculture, forestry, or fishing, compared
with only 8% of females. Females were more likely to work
in typically indoor jobs, with 22% working in retail, edu-
cation, or health and community services, compared with
only 7% of males (ABS, 2001). Therefore, the greater ten-
dency for males to work in outdoor occupations may lead
to increased exposure to potentially infected mosquitoes
and explain the increased seroprevalence observed.
Seroprevalence and Dryland Salinity/Waterlogging
There was no significant association between the prevalence
of antibodies to RRV in humans and residence in areas
affected by salinity or waterlogging. Indeed, the subregion
with the greatest seroprevalence had a relatively low per-
centage area of both variables at the LGA level. The results
reflect the analysis of RRV notifications and do not provide
Dryland Salinity and Ross River Virus Disease 65

evidence to support the hypothesis that salinity and
waterlogging in inland agricultural regions of southwest
WA has significantly increased the risk of RRV infection in
the resident human population.
Limitations
The fact that a relatively uncommon disease was being
investigated in a sparse human population meant it was
necessary to use a large base unit of analysis both spatially
(LGA) and temporally (cumulative incidence over 18
years). This limited the capacity of the studies described in
this article to detect small changes in disease risk.
Another important factor to consider in this study is
population movement between regions, as individuals with
RRV may have acquired the infection elsewhere. Popula-
tion mobility data show that between the 1996 and 2001
censuses, there was a net population efflux of 9.5% and
0.7% from the Upper and Lower Great Southern statistical
divisions, respectively (which incorporate the study region)
(ABS, 2003). More detailed information regarding regional
population movements in WA were obtained in a series of
reports commissioned by the Regional Development
Council, Government of Western Australia using focus
groups (2–3 per region) and telephone interviews (150 per
region). The reports relevant to the study region indicated
relatively high population stability compared with other
regions in the state (Patterson Market Research, 1998ab).
While the relative stability of the population in the study
region indicates it is unlikely that population mobility will
exert significant bias on the results, the possibility that
some RRV-antibody-positive individuals identified in this
study may have acquired the infection elsewhere still exists.
Travel behavior of residents from the study region is
also important; unfortunately, no information is available
regarding specific travel behavior of residents in the study
region. However, there is no reason to assume that travel
behavior would differ between those living in saline versus
non-saline regions.
CONCLUSION
Using both disease notification and serological data, no
evidence could be found to support the hypothesis that
there is a significant association between dryland salinity
and RRV infection in inland southwest WA. In certain sit-
uations (such as the sparse human population spread over
a large area, as encountered in the current study), varia-
tions in disease rates are difficult to detect. Thus, the po-
tential for dryland salinity to increase RRV disease risk
cannot be entirely ruled out; however, if any association
does exist, it is likely to be small.
The studies described in this article represent an
important first step and raise a number of avenues for
further research. A similar study in dryland salinity affected
regions of eastern Australia where human population
densities are greater may overcome some of the limitations
faced in the current study, and further develop a better
understanding of the potential for dryland salinity to
influence RRV disease risk. Epidemiological studies also
need to be supplemented by further ecological or envi-
ronmental data to more clearly delineate health hazard.
Field-based studies of variables that can be investigated on
a smaller scale would be most useful, such as mosquito
population dynamics, and mosquito and vertebrate host
infection rates. Until such further studies are undertaken,
there is no evidence to suggest that changes are necessary to
currently used mosquito-borne disease control practices in
saline regions.
It is also worth noting that the area affected by dryland
salinity in southwest WA is predicted to expand by up to
three times to 3.4 million hectares over coming decades
(George et al., 2006). While increasing efforts to ameliorate
dryland salinity on the grounds of reducing RRV risk is
currently not justified based on the available evidence, this
situation may change as dryland salinity spreads and new
evidence comes to light. Ultimately, however, amelioration
of dryland salinity is clearly warranted on environmental
grounds alone; therefore, any potential reduction in human
health risk is simply an added benefit from an ecosystem
health perspective, and is consistent with the current rec-
ommendations for sustainable environmental management
(Millennium Ecosystem Assessment, 2005).
ACKNOWLEDGMENTS
Parts of this work were supported by the Cooperative
Research Centre for the Plant Based Management of
Dryland Salinity. Sarah Power provided technical support
in the laboratory, and Scott Carver assisted with useful
discussions regarding some of the issues presented. The
Department of Agriculture and Food Western Australia is
acknowledged for providing the Soil-Landscape Systems
Data.
66 Andrew Jardine et al.

REFERENCES
ABS (1996) Census of Population and Housing, 1996. Canberra,Australia: Australian Bureau of Statistics
ABS (2001) Census of Population and Housing, 2001. Canberra,Australia: Australian Bureau of Statistics
ABS (2003) Census of Population and Housing: Population Growthand Distribution, Australia, 2001. ABS Catalogue No 2035.0,Canberra, Australia: Australian Bureau of Statistics
ABS (2006a) Population by age and sex, Western Australia, June2005. ABS Catalogue No 3235.5.55.001, Canberra, Australia:Australian Bureau of Statistics
ABS (2006b) Regional Population Growth Australia, 2004–2005.ABS Catalogue No 3218.0, Canberra, Australia: Australian Bu-reau of Statistics
Ballard JWO, Marshall ID (1986) An investigation of the potentialof Aedes camptorhynchus as a vector of Ross River virus. Aus-tralian Journal of Experimental Biology and Medical Science64:197–200
Barrett-Lennard EG (2003) The interaction between waterloggingand salinity in higher plants: causes, consequences and impli-cations. Plant and Soil 253:35–54
Besag J, York J, Mollie A (1991) Bayesian image restoration withtwo applications in spatial statistics. Annals of the Institute ofStatistical Mathematics 43:1–59
Clarke CJ, George RJ, Bell RW, Hatton TJ (2002) Dryland salinityin south-western Australia: its origins, remedies, and futureresearch directions. Australian Journal of Soil Research 40:93–113
Communicable Diseases Network Australia (2007) NationalNotifiable Diseases Surveillance System. Communicable DiseasesNetwork Australia, Department of Health and Ageing. Avail-able: http://www9.health.gov.au/cda/source/Rpt_4_sel.cfm [ac-cessed January15, 2007]
Cramer VA, Hobbs RJ (2002) Ecological consequences of alteredhydrological regimes in fragmented ecosystems in southernAustralia: impacts and possible management responses. AustralEcology 27:546–564
Dodsley NA, Broom AK, Smith DW, Plant AJ, Lindsay MD (2001)Ross River virus: determining the prevalence in the south westof Western Australia. Arbovirus Research in Australia 8:122–125
Gatton ML, Kelly-Hope LA, Kay BH, Ryan PA (2004) Spatial-temporal analysis of Ross River virus disease patterns inQueensland, Australia. American Journal of Tropical Medicineand Hygiene 71:629–635
George R, Clarke JA, English P (2006) Modern and palaeogeo-graphic trends in the salinisation of the Western Australianwheatbelt. Proceedings of the Australian Earth Sciences Conven-tion 2006, Melbourne. Available: http://www.earth2006.org.au/papers/extendedpdf/George%20Richard%20-%20Modern%20and%20palaeogeographic-extended.pdf [accessed September22, 2006]
George RJ, McFarlane DJ, Speed RJ (1995) The consequences of achanging hydrologic environment for native vegetation insouthwestern Australia. In: Saunders DA, Craig JL, Mattiske EM(editors), Nature Conservation 4: the Roles of Networks. Syd-ney, Australia: Surrey Beatty & Sons, pp 9–22
Harley D, Sleigh A, Ritchie S (2001) Ross River virus transmission,infection, and disease: a cross-disciplinary review. ClinicalMicrobiology Reviews 14:909–932
Hobbs RJ (1993) Effects of landscape fragmentation on ecosystemprocesses in the Western Australian wheatbelt. Biological Con-servation 64:193–201
Horwitz P, Lindsay M, O’Connor M (2001) Biodiversity, ende-mism, sense of place, and public health: inter-relationships forAustralian inland aquatic systems. Ecosystem Health 7:253–265
Jardine A, Speldewinde P, Carver S, Weinstein P (2007) Drylandsalinity and Ecosystem Distress Syndrome: human healthimplications. EcoHealth 4:10–17
Johansen CA (1998) The Ecology and Epidemiology of CertainArboviruses in the South of Western Australia. MSc Thesis,Department of Microbiology, University of Western Australia,Perth, Australia
Johansen CA, Broom AK, Lindsay MDA, Maley FM, Power SL,Gordon CJ, et al. (2005) Surveillance of arboviruses in mos-quitoes from the southwest of Western Australia between 2000and 2004. Arbovirus Research in Australia 9:159–163
Johansen CA, Mackenzie JS, Smith DW, Lindsay MD (2005)Prevalence of neutralising antibodies to Barmah Forest, Sindbisand Trubanaman viruses in animals and humans in the south-west of Western Australia. Australian Journal of Zoology 53:51–58
Klinkenberg E, Konradsen F, Herrel N, Mukhtar M, van der HoekW, Amerasinghe FP (2004) Malaria vectors in the changingenvironment of the southern Punjab, Pakistan. Transactions ofthe Royal Society of Tropical Medicine and Hygiene 98:442–449
Lawson AB, Biggeri AB, Boehning D, Lesaffre E, Viel J-F, Clark A,et al. (2000) Disease mapping models: an empirical evaluation.Statistics in Medicine 19:2217–2241
Lawson AB, Browne WJ, Vidal Rodeiro CL (2003) Disease Map-ping with WinBUGS and MlwinN. Senn S (editor), Chichester,UK: Wiley
Lee DJ, Hicks MM, Griffiths M, Russell RC, Marks EN (1984) TheCulicidae of the Australasian Region, Vol 3. EntomologyMonograph No 2, Canberra, Australia: Australian GovernmentPublishing Service
Lindsay M, Oliveira N, Jasinska E, Johansen C, Harrington S,Wright AE, et al. (1996) An outbreak of Ross River virus diseasein southwestern Australia. Emerging Infectious Diseases 2:117–120
Lindsay MD (1995) Ecology and Epidemiology of Ross River Virusin Western Australia. PhD Thesis, Department of Microbiology,University of Western Australia, Perth, Australia
Lindsay MD, Condon RJ, Mackenzie JS, Johansen CA, D’ErcoleM, Smith DW (1992) A major outbreak of Ross River virusinfection in the south-west of Western Australia and the Perthmetropolitan area. Communicable Diseases Intelligence 16:290–294
Lindsay MDA, Breeze AL, Harrington SA, Johansen CA, BroomAK, Gordon CJ, et al. (2005) Ross River and Barmah Forestviruses in Western Australia, 2000/01-2003/04: contrastingpatterns of disease activity. Arbovirus Research in Australia9:194–201
Lindsay MDA, Jardine A, Johansen CA, Wright AE, HarringtonSA, Weinstein P (2007) Mosquito (Diptera: Culicidae) faunaand the potential for mosquito-borne disease in inland areas ofsouth west Western Australia. Australian Journal of Entomology46:60–64
Marshall M (1991) A review of methods for the statistical analysisof spatial patterns of disease. Journal of the Royal StatisticalSociety–Series A 154:421–441
Dryland Salinity and Ross River Virus Disease 67
Millennium Ecosystem Assessment (2005) Ecosystems and HumanWell-being: Health Synthesis. Washington, DC: Island Press
Mulla MS, Mian LS, Gratz NG (1987) Agricultural managementpractices—their impacts on production of vector and pestmosquitoes. Journal of Agricultural Entomology 4:97–131
Pascutto C, Wakefield J, Best NG, Richardson S, Bernardinelli L,Staines A, et al. (2000) Statistical issues in the analysis of diseasemapping data. Statistics in Medicine 19:2493–2519
Patterson Market Research (1998a) Living in the regions: theWestern Australians: the Great Southern report. Patterson MarketResearch in conjunction with Focused Management and Ha-mesSharley: Perth. Available: http://www.dlgrd.wa.gov.au/Publications/StatInfo/LivingInRegions [accessed July 20, 2006]
Patterson Market Research (1998b) Living in the regions: theWestern Australians: the Wheatbelt report. Patterson MarketResearch in conjunction with Focused Management and HamesSharley: Perth. Available: http://www.dlgrd.wa.gov.au/Publications/StatInfo/LivingInRegions [accessed July 20, 2006]
Pinder AM, Halse SA, McRae JM, Shiel RJ (2005) Occurrence ofaquatic invertebrates of the wheatbelt region of Western Aus-tralia in relation to salinity. Hydrobiologia 543:1–24
Rosenbaum MJ, Sullivan EJ, Edwards EA (1972) Techniques forcell cultivation in plastic microtitration plates and their appli-cation in biological assays. In: Wasley GD (editor), AnimalTissue Culture. Advances in Techniques. London: Butterworth,pp 49–81
Russell RC (1995) Arboviruses and their vectors in Australia: anupdate on the ecology and epidemiology of some mosquito-borne arboviruses. Review of Medical and Veterinary Entomology83:141–158
Russell RC (2002) Ross River virus: ecology and distribution.Annual Review of Entomology 47:1–31
Ryan PA, Alsemgeest D, Gatton ML, Kay BH (2006) Ross Rivervirus disease clusters and spatial relationship with mosquitobiting exposure in Redland Shire, Southern Queensland, Aus-tralia. Journal of Medical Entomology 43:1042–1059
Schoknecht N, Tille P, Purdie B (2004) Soil-landscape mapping insouth-western Australia: overview of methodology and inputs.Department of Agriculture, Government of Western Australia.Resource management technical report 280. Available:http://www.agric.wa.gov.au/pls/portal30/docs/FOLDER/IKMP/LWE/LAND/TR280.PDF [accessed August 20, 2004]
Spiegelhalter DJ, Best NG, Carlin BP, van der Linde A (2002)Bayesian measures of model complexity and fit. Journal of theRoyal Statistical Society—Series B 64:583–639
Temel T (2004) Malaria from the gap: need for cross-sector co-operation in Azerbaijan. Acta Tropica 89:249–259
Western Australian Planning Commission (2005) Western Aus-tralia Tomorrow. Western Australian Planning Commission.Population report No 6. Available: http://www.wapc.wa.gov.au/Publications/723.aspx [accessed August 21, 2006]
68 Andrew Jardine et al.
Copyright © 2022 FDOKUMEN