assessing desertification and land degradation using
27
i Final project 2017 ASSESSING DESERTIFICATION AND LAND DEGRADATION USING TRENDS OF NORMALIZED DIFFERENCE VEGETATION INDEX TIME SERIES: CASE STUDY IN STEPPE ZONE IN MONGOLIA Ikhbayar Tsevelmaa Agency for Land Administration and Management, Geodesy and Cartography Government Building 12, Ulaanbaatar, Mongolia [email protected] Supervisors: Atli Gudjónsson EFLA Engineering [email protected] Ingibjörg Jónsdóttir University of Iceland [email protected] ABSTRACT Desertification and land degradation are causing a serious environmental problem in Mongolia, with climate change and human activities being major contributors to the land degradation. This study was aimed to assess land degradation and desertification using the remotely sensed Normalized Difference Vegetation Index (NDVI) time series and the amount of precipitation. GIS and statistical analyses were used to estimate the trend of the annual average NDVI for June, July and August from 2006 to 2016. Moreover, analyses were conducted to identify the effects of precipitation variation and human activities on the trend of NDVI. The Mongolian real steppe subzone was selected as a study site since the area is vulnerable to desertification. The study results reveal an increasing trend in NDVI values in 86.54% of the total study area and a decreasing trend in NDVI values in 13.5% from 2006 to 2016. Overall, 13.5% of the total area, or a 2,923.4 sq. km area, has been affected by desertification. The human impact zone had a higher declining trend than the no impact zone. There was a positive moderate correlation between change in precipitation and the NDVI trend in the study area. The study indicates that the effects of precipitation variance on the changes in the trend of the NDVI resulted from more than human activities in the study area. Land Restoration Training Programme Keldnaholt, 112 Reykjavik, Iceland
-
Upload
khangminh22 -
Category
Documents
-
view
2 -
download
0
Transcript of assessing desertification and land degradation using
i
Final project 2017
ASSESSING DESERTIFICATION AND LAND DEGRADATION USING
TRENDS OF NORMALIZED DIFFERENCE VEGETATION INDEX TIME
SERIES: CASE STUDY IN STEPPE ZONE IN MONGOLIA
Ikhbayar Tsevelmaa
Agency for Land Administration and Management, Geodesy and Cartography
Government Building 12, Ulaanbaatar, Mongolia
Supervisors:
Atli Gudjónsson
EFLA Engineering
Ingibjörg Jónsdóttir
University of Iceland
ABSTRACT
Desertification and land degradation are causing a serious environmental problem in Mongolia,
with climate change and human activities being major contributors to the land degradation. This
study was aimed to assess land degradation and desertification using the remotely sensed
Normalized Difference Vegetation Index (NDVI) time series and the amount of precipitation.
GIS and statistical analyses were used to estimate the trend of the annual average NDVI for
June, July and August from 2006 to 2016. Moreover, analyses were conducted to identify the
effects of precipitation variation and human activities on the trend of NDVI. The Mongolian
real steppe subzone was selected as a study site since the area is vulnerable to desertification.
The study results reveal an increasing trend in NDVI values in 86.54% of the total study area
and a decreasing trend in NDVI values in 13.5% from 2006 to 2016. Overall, 13.5% of the total
area, or a 2,923.4 sq. km area, has been affected by desertification. The human impact zone had
a higher declining trend than the no impact zone. There was a positive moderate correlation
between change in precipitation and the NDVI trend in the study area. The study indicates that
the effects of precipitation variance on the changes in the trend of the NDVI resulted from more
than human activities in the study area.
Land Restoration Training Programme
Keldnaholt, 112 Reykjavik, Iceland

UNU Land Restoration Training Programme
ii
This paper should be cited as:
Tsevelmaa I (2017) Assessing desertification and land degradation using trends of Normalized
Difference Vegetation Index time series: case study in steppe zone in Mongolia. United Nations
University Land Restoration Training Programme [final project]
http://www.unulrt.is/static/fellows/document/tsevelmaa2017.pdf

UNU Land Restoration Training Programme
iii
TABLE OF CONTENTS 1. Introduction ........................................................................................................................ 4
1.1 Project effects and importance for land condition assessment .................................... 5 1.2 Goal and objectives ..................................................................................................... 6
2. Method of study ................................................................................................................. 6 2.1 Study area .................................................................................................................... 6 2.2 Datasets utilized ........................................................................................................... 9 2.3 Data analyses ............................................................................................................. 10 2.4 Data processing.......................................................................................................... 12
3. Results .............................................................................................................................. 12
3.1 Trends in annual average NDVI ................................................................................ 12 3.2 Trends in annual accumulated precipitation of study area ........................................ 14
3.3 Spatial distribution of human activities ..................................................................... 16 3.4 Impacts of human activities on NDVI trend .............................................................. 18 3.5 Effects of precipitation and human activity on NDVI trends .................................... 19
4. Discussion ........................................................................................................................ 20
4.1 Limitations ................................................................................................................. 21 5. Conclusions ...................................................................................................................... 22
ACKNOWLEDGEMENTS ..................................................................................................... 23 LITERATURE CITED ............................................................................................................ 24 APPENDICES .......................................................................................................................... 26
UNU Land Restoration Training Programme
4
1. INTRODUCTION
Mongolia is a Central Asian land-locked country located between Russia and China and its
territory covers 1,566,000 sq. km. The Mongolian plateau is characterized by continental
climate and an arid, particularly vulnerable ecosystem (Eckert et al. 2015). The Mongolian
territory is divided into six natural zones: alpine, mountain taiga, forest steppe, steppe, Gobi
and desert (Dash et al. 2003). The steppe zone is the largest natural zone of Mongolia which
accounts for 34.2% of the total area. The steppe zone is divided into three subzones: meadow
steppe, real steppe and arid steppe. Land degradation and desertification affect the whole area
of the steppe zone (Dash et al. 2003). The steppe zone is defined as an arid area with
precipitation lower than 250 mm per year (Dash et al. 2003). The arid area is vulnerable to
changes in the climate, and human activities and land degradation processes happen more
rapidly in this area (FAO and LADA 2007). The decrease in biodiversity and loss of vegetation
in the Gobi and steppe zones is considered one of the main indicators of desertification. These
factors make the Gobi and steppe zones more vulnerable and prone to land degradation, and
human activities and climate variations can trigger further vegetation cover loss and
desertification (Dash et al. 2003). For these reasons, the real steppe subzone located in the east
part of Mongolia was selected for the study site.
The UNCCD definition of desertification is “land degradation in arid, semi-arid and dry sub-
humid areas resulting from various factors, including climatic variations and human activities”
(UNCCD 2013). Early detection and observation of land degradation is the main challenge of
scientists and policymakers (Higginbottom & Symeonakis 2014). It is better and easier to
prevent or minimize land degradation than to restore degraded and desertified land. Remote
sensing methods are the main choice for the development of an environmental monitoring
system because of its availability to rapid overview over large regions at relatively low cost
(Higginbottom & Symeonakis 2014). The most frequently used satellite earth observation
dataset is the NDVI (Normalized Difference Vegetation Index). The NDVI is the estimated
result of remote sensing measurements that indicate greenness of the vegetation and patterns of
green biomass (Forkel et al. 2013). The NDVI is selected as one of the biophysical indicators
of land degradation assessment in arid areas (FAO & LADA 2007). Mongolian and
international scientists have agreed that long-term decline of vegetation cover is a sign of
desertification (Dash et al. 2003; Lantieri, as cited in FAO & LADA 2007).
Climate variation and human activities are accelerating land degradation processes and the
effects are rapidly expanding in arid areas (Dash et al. 2003). Climate variation is a primary
impact that affects environmental changes in the steppe zone (Dash et al. 2003). The most
important climatic parameter in the land degradation assessment of drylands is precipitation
(FAO & LADA 2007). Land condition and desertification impact can be estimated by
comparison between NDVI series and the rainfall series (Lantieri, as cited in FAO & LADA
2007). Therefore, precipitation and NDVI data were selected as main indicators for the study.
In addition to climate variations, as mentioned before human activities highly contribute to
desertification. Grazing, mining, cultivation and other land conversion practised by humans are
considered principal causes of land degradation and desertification (MOFA 2015). These
activities intensify desertification in the dryland of Mongolia (Dash et al. 2003). Mongolia has
five types of pastoral livestock: goats, sheep, cattle, horses and camels. In 2017, the total
number of livestock had reached 61 million (National Statistical Office of Mongolia 2017) and
this growth in livestock numbers has led to land degradation (Wang & Batkhishig 2014).
Overgrazing has affected biodiversity and the loss of some indigenous species (Wang &

UNU Land Restoration Training Programme
5
Batkhishig 2014). Moreover, there are large mining industries located in the dry zones of
Mongolia and they impact the ecosystem of the surrounding dry areas heavily (Dash et al.
2003). This study was conducted to assessing the response of vegetative cover to human
activities and to identify human activities which contributed to loss of vegetative cover.
Scientific research papers commonly review complex methods which combine statistical and
ecological framework using NDVI data in the assessment of land degradation and
desertification. Recently, many researchers have been using statistical analysis for NDVI time
series to detect land degradation by the trend sign of NDVI and the precipitation amount. For
example, Gao et al. (2013) used the Pearson correlation coefficient to predict long-term
variation of NPP (net primary productive) on the Tibetan Plateau. Also, Zhang et al. (2013) and
Bai & Dent (2007) used statistical analyses methods on NDVI values for assessing the decline
and regeneration of vegetation cover.
This study aimed to assess land degradation and desertification using trends in NDVI and
identifying the response to precipitation variance and human activities. The complex method
of GIS and statistical analyses was conducted to identify trends in vegetation cover using
remotely sensed NDVI and precipitation time series data from June, July and August from 2006
to 2016. Statistical and spatial analysing methods were used for estimating the linear trend in
NDVI and amount of precipitation. The outcome of this study can be used to predict future
trends of decline and regeneration of the vegetation cover in the study area.
1.1 Project effects and importance for land condition assessment
Assessment of land condition is the initial process of land management planning and
implementing mitigation measures of land degradation. Accurate and real-time information
about land condition is critical for land managers and policymakers to develop a proper policy
and land management plan. Furthermore, it is important to increase awareness about
desertification and land degradation among the decisionmakers and public (Institute of
Geoecology, Mongolian Academy of Science 2014).
Even though land restoration measures are included in land management plans, most regions of
Mongolia are affected by desertification and land degradation (MNEGDT 2012). Land
management sector officials and land officers are usually facing a lack of information about the
land condition. The law on land of Mongolia includes provisions for land condition assessment
measures identified as “monitoring of land quality and characteristics” (Law on Land-
Mongolia 2002). According to this legal provision, every 5 years officials organize land
characteristic and quality monitoring measures. Land management actions at all administration
levels have been conducted based on these land monitoring data. But determining land
condition has required much cost, time and labour. Therefore, frequency and time of land
degradation monitoring is long-term (5 years), and usually means state officials using outdated
monitoring data for land management planning. Thus, there is a need to introduce a simpler and
cost-effective method that can be used in annual land condition monitoring assessment. Remote
sensing measurements can be one of the candidates for the assessment in land condition, in
addition to existing monitoring measures (Higginbottom & Symeonakis 2014). The main
advantage of remote sensing measurement is the possibility to analyse a large area in a short
time. On the other hand, it is impossible to use remote sensing to measure some attributes of
land in detail. Therefore, land officials need to develop a new complex method to assess land
condition, combining field survey data and remote sensing measurements. The remote sensing

UNU Land Restoration Training Programme
6
(a) (b)
data analyses can be validated by geographic data and field surveying measurements. This study
and other similar studies can contribute to developing time and cost-saving, easy, and effective
land condition monitoring methods based on remotely sensed earth observation data analyses
validated by field surveying and geographical data.
1.2 Goal and objectives
Overall goal: To assess land degradation and desertification using trends of NDVI time series
and identifying the effects of human activities and precipitation variation.
Specific objectives:
• To estimate trends in annual average NDVI and annual average accumulated precipitation
for June, July and August from 2006 to 2016.
• To identify the effects of human activities and precipitation variables on the NDVI trend.
2. METHOD OF STUDY
2.1 Study area
Location: The study area is located in the east part of Mongolia; the elevation ranges between
604 - 1,555 m above sea level and covers a total area of 21,735.9 sq. km. The site is located
across the territory of Erdenetsagaan soum1 of the Sukhbaatar aimag2 and Matad, the Khalkhgol
soum of Dornod aimag, and borders with China in the south and north, respectively. The study
area belongs to the real steppe subzone of Mongolian steppe (Fig. 1 and Figure 2).
Figure 1. View of real steppe subzone landscape. (a) Landscape of southern part of the study
area. (b) Landscape of northern part of the study area. (Photos: (a) T. Bekhe, (b) N. Motsumoto)
1 Mongolia has a 4-level of administration unit; Soum is the third level of administration unit, like a district. 2 “Aimag” is the secondary level administration unit of Mongolia, like a province. An Aimag is divided into Soums.

UNU Land Restoration Training Programme
7
Figure 2. Mongolia is divided into six natural zones. Each natural zone is divided into different subzones according to its ecosystem features and
altitude. The red line indicates the boundary of the study area.

UNU Land Restoration Training Programme
8
Land use: The land use of the study area can be divided into two different sections, depending
on human influence: under human influence and with no human impact. The southern part of
the area is under high pressure from human activities: it has a substantial number of livestock
and 14 mining sites currently under operation. In the northern part there is a small number of
livestock and 45300 ha of croplands. In the middle part, there is a special protected area without
any disturbance by human activities (Figure 3). These parts make the study area a unique place
that allows assessment of how the human activities have affected the vegetation cover in the
steppe zone. The main land use types causing pressure on the land in the study area are grazing
and track roads (Figure 4). The areas under pasturing activities include areas around water
points and herders’ seasonal camps where a substantial number of animals crowd. Moreover,
people use dirt roads in their everyday activities due to the fact there is no paved road in the
study area. Dirt roads are easily broken under the effects of water and wind impact and vehicles
create new tracks along the old road, resulting in the formation and expansion of the multiple
dirt roads in the study area. In addition, mining activities cause the formation and expansion of
dirt roads. Additionally, the special protected area located in the centre and southern part of the
study area could be used as a reference area to compare areas affected by human influence.
Figure 3. Land use of study area. Total area of study area is 21735.09 sq. km. The elevation of
the study area gradually increases from north to south.

UNU Land Restoration Training Programme
9
(a) (b)
Figure 4. (a) Land use around water points. (b) Expansion of road impact zones (Photos: (a)
https://www.mofa.gov.mn/new/cache/widgetkit/gallery/40/00001891-e45241de83.jpg (b)
http://resource.24tsag.mn/24tsag/photo/2013/9/845304d747af1e3e/465a9de2030ac65boriginal
.jpg )
Climate features: The climate of the Mongolian steppe zone is very variable due to high
variations in temperature, low precipitation and strong winds (Dash et al. 2003). The growing
season in Mongolia is very short, from May to August, and the highest temperatures and highest
precipitation occur from June to August (Figure 5). Figure 5 shows the Khalkhgol
meteorological station’s data, which is located within the study area.
Figure 5. Monthly average precipitation and monthly average temperature of Khalkhgol soum
(Data from the Mongolian National Agency for Meteorology and Environment Monitoring)
2.2 Datasets utilized
The temporal coverage of the study was 11 years from 2006 to 2016. The remotely sensed
NDVI and precipitation data of June, July and August were collected for that period.
Normalized difference vegetation index (NDVI): This study analysed data from the MODIS
satellite’s MOD13A3 NDVI data of June, July and August for a period of 11 years. The
MOD13A3 vegetation index product is the Terra MODIS version 6 NDVI dataset which
referred to the continuity index from the National Oceanic and Atmospheric Administration-
Advanced Very High Resolution Radiometer (NOAA-AVHRR) (Solano et al. 2010). MODIS
NDVI is calculated following the formula:
-30
-25
-20
-15
-10
-5
0
5
10
15
20
25
Jan Feb Mar Apr May Jun Jul Aug Sep Oct Nov Dec
0
10
20
30
40
50
60
70
80
90
100
Tem
per
ature
(°C
)
Pre
cip
itat
ion (
mm
)
Precipitation (mm) Temperature (°C)

UNU Land Restoration Training Programme
10
(I)
MOD13A3 NDVI data values range from -2000 – 10000 with a scale factor of 0.0001. The
lower values (below 1000) represent water bodies, snow, barren land, rock and sand. The higher
values (above 1000) represent vegetation cover such as shrubs, grasslands and forest.
MOD13A3 NDVI data’s spatial resolution is 1 km and the temporal resolution is monthly.
MOD13A3 data are a global vegetation dataset spanning three decades (Forkel et al. 2013)
which allows the use of long-term analyses of land cover in large areas (Ustin et al. 2009). This
study focused on quite a large area and the MOD13A3 dataset was compatible for this study.
The data are open and freely accessible from USGS’s (United States Geological Survey)
homepage: earthexplorer.usgs.gov (More detailed information is included in Appendix I).
Precipitation data: The distribution of the weather station network is very sparse across
Mongolia. The study area is located across the territory of three soums and each soum has one
weather station monitoring changes in the weather. These weather stations estimate the monthly
precipitation data for the whole area of each soum, which is inadequate to generate a spatial
distribution of monthly precipitation with close approximation of scale and accuracy to the
NDVI dataset. In order to estimate spatial distribution of the amount of precipitation densely
distributed precipitation data are needed. Therefore, remotely sensed precipitation data derived
from TRMM’s (Tropical rainfall measuring mission) were acquired to estimate the annual
average accumulated precipitation for June, July and August from 2006 to 2016. In 1997, the
TRMM mission was jointly launched by NASA (National Aeronautics Space Agency) and
JAXA (Japanese Aerospace Exploration Agency) to study the climate factors of precipitation
and weather. TRMM’s monthly precipitation 3B43 data were collected for this study. Multi-
satellite precipitation 3B43 data give the monthly precipitation estimated by the Microwave-IR
gauge on a global scale combining two months starts from 1998 (Huffman 2016). The spatial
resolution of this product is a 0.25оx0.25о grid and the temporal resolution is monthly (Huffman
2016). It presents the monthly average precipitation in mm/hour per pixel of the 0.25оx0.25о
grid. 3B43 precipitation data can be downloaded with the format NetCDF from NASA’s
precipitation measurement missions (PMM) homepage: https://pmm.nasa.gov/data-
access/downloads/ (More detailed information is included in Appendix I).
Vector data: The vector data include roads, settlement areas and herders’ seasonal location
points, wells, rivers and streams within the selected area. The data acquired were from the
“National unified land territory registration” data which has been developed by the Agency of
Land Administration and Land Management, Geodesy and Cartography.
2.3 Data analyses
NDVI trend analyses: Recently many scientific papers have been published related to the
vegetative cover analyses, mostly used statistical analyses for estimating the trend in NDVI.
There are some studies using the Pearson correlation coefficient to calculate the relationship
between the NDVI variables and its time duration in a specific part of the Mongolian Plateau
(Gao et al. 2013; Zhang et al. 2013). The Pearson correlation coefficient is used to measure
linear relationship between two quantitative and continuous variables. In this study the Pearson
correlation coefficient was used for investigating correlations between the total annual NDVI
values for a selected area and the sequence of the given time n. Piao & Fang (2002) used the
𝑁𝐷𝑉𝐼 =𝑁𝐼𝑅 − 𝑅𝑒𝑑
𝑁𝐼𝑅 + 𝑅𝑒𝑑
UNU Land Restoration Training Programme
11
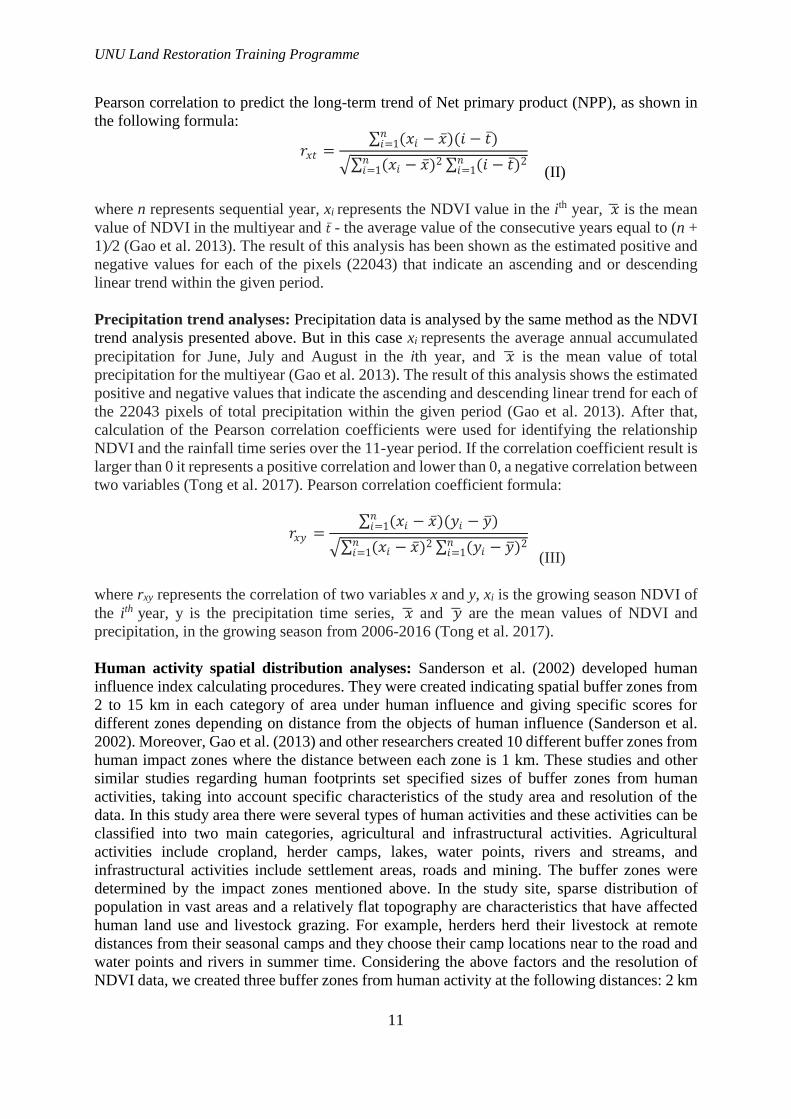
Pearson correlation to predict the long-term trend of Net primary product (NPP), as shown in
the following formula:
(II)
where n represents sequential year, xi represents the NDVI value in the ith year, �̅� is the mean
value of NDVI in the multiyear and 𝑡̅ - the average value of the consecutive years equal to (n +
1)/2 (Gao et al. 2013). The result of this analysis has been shown as the estimated positive and
negative values for each of the pixels (22043) that indicate an ascending and or descending
linear trend within the given period.
Precipitation trend analyses: Precipitation data is analysed by the same method as the NDVI
trend analysis presented above. But in this case xi represents the average annual accumulated
precipitation for June, July and August in the ith year, and �̅� is the mean value of total
precipitation for the multiyear (Gao et al. 2013). The result of this analysis shows the estimated
positive and negative values that indicate the ascending and descending linear trend for each of
the 22043 pixels of total precipitation within the given period (Gao et al. 2013). After that,
calculation of the Pearson correlation coefficients were used for identifying the relationship
NDVI and the rainfall time series over the 11-year period. If the correlation coefficient result is
larger than 0 it represents a positive correlation and lower than 0, a negative correlation between
two variables (Tong et al. 2017). Pearson correlation coefficient formula:
(III)
where rxy represents the correlation of two variables x and y, xi is the growing season NDVI of
the ith year, y is the precipitation time series, �̅� and �̅� are the mean values of NDVI and
precipitation, in the growing season from 2006-2016 (Tong et al. 2017).
Human activity spatial distribution analyses: Sanderson et al. (2002) developed human
influence index calculating procedures. They were created indicating spatial buffer zones from
2 to 15 km in each category of area under human influence and giving specific scores for
different zones depending on distance from the objects of human influence (Sanderson et al.
2002). Moreover, Gao et al. (2013) and other researchers created 10 different buffer zones from
human impact zones where the distance between each zone is 1 km. These studies and other
similar studies regarding human footprints set specified sizes of buffer zones from human
activities, taking into account specific characteristics of the study area and resolution of the
data. In this study area there were several types of human activities and these activities can be
classified into two main categories, agricultural and infrastructural activities. Agricultural
activities include cropland, herder camps, lakes, water points, rivers and streams, and
infrastructural activities include settlement areas, roads and mining. The buffer zones were
determined by the impact zones mentioned above. In the study site, sparse distribution of
population in vast areas and a relatively flat topography are characteristics that have affected
human land use and livestock grazing. For example, herders herd their livestock at remote
distances from their seasonal camps and they choose their camp locations near to the road and
water points and rivers in summer time. Considering the above factors and the resolution of
NDVI data, we created three buffer zones from human activity at the following distances: 2 km
𝑟𝑥𝑡 = (𝑥𝑖 − �̅�)(𝑖 − 𝑡̅𝑛𝑖=1 )
(𝑥𝑖 − �̅�)2 (𝑖 − 𝑡̅)2𝑛𝑖=1
𝑛𝑖=1
𝑟𝑥𝑦 = (𝑥𝑖 − �̅�)(𝑦𝑖 − 𝑦 𝑛𝑖=1 )
(𝑥𝑖 − �̅�)2 (𝑦𝑖 − 𝑦 )2𝑛𝑖=1
𝑛𝑖=1

UNU Land Restoration Training Programme
12
(high impact zone), 4 km (medium impact zone) and 10 km (low impact zone) from. Only one
buffer zone was created with a 1 km distance zone from cropland and the mining area depends
on the specification of land use. Then we carried out overlay analyses to combine NDVI
ascending and descending trend values and various human impact zones to generate the spatial
distribution of NDVI trends on each human impact buffer zone (Gao et al. 2013).
2.4 Data processing
ArcGIS 10.3.1 program’s Spatial analyst tools, Multidimension tools, and Conversion tools
were used for the data processing. The statistical analyses were conducted in MS Excel 2016
and SAS Enterprise Guide 7.1.
NDVI data: The annual average NDVI values were calculated from the monthly NDVI
MOD13A3 data for June, July and August for the period of 2006 to 2016. Then each 11-year
NDVI mean values were extracted from each pixel within the study area for the 22043 points
for the next analyses. The 11-year annual average NDVI trend was calculated using the Pearson
correlation coefficient for each year’s annual mean values for the 22043 points, using MS Excel
2016. A significance test was conducted for the correlation coefficient of the NDVI trend
analyses to identify the probability value (p value). After that, spatial distributions of the NDVI
trend images were generated using the spatial analyst tool.
Precipitation data: TRMM 3b43 surface precipitation data from the TRMM satellite with a
0.25о grid resolution were imported using netCDF format and clipped accordingly to conform
to the border study area. In order to estimate the correlation between the trend in NDVI and the
precipitation amount, the spatial resolution of these two datasets should be the same. In doing
so, we changed the spatial resolution of the TRMM precipitation data from a 0.25о grid to 1
km, using the resample tool of the raster processing. After that, we calculated the average
accumulated precipitation for the 3 months (June, July, August), using the raster calculator tool
and producing its spatial distribution image. Then images were extracted for the total 22043
points to generate each year’s spatial distribution map and numerical variables of the amount
of precipitation. The 11-year linear trend of precipitation was calculated using the Pearson
correlation coefficient formula on each year’s average accumulated precipitation value of
22043 points. After that, a two-tailed significance test was conducted on the correlation
coefficient of the NDVI trend analysis to identify the probability value (p value).
Vector data processing: Human influence specific buffer zones were created 2 km, 4 km and
10 km from roads, settlement areas, wells, springs, rivers and streams within the study area.
The buffer zones were converted into raster format with 1 km resolution. The effect of human
activities on the NDVI trend were defined through identifying the spatial distribution of the
decreasing and increasing trends in the NDVI values among the human impact buffer zones
with different distances of 2 km, 4 km, 10 km from the human activities using overlay analysis.
3. RESULTS
3.1 Trends in annual average NDVI
Summary statistical analyses were conducted to estimate the 11-year annual average NDVI
values before analysing the multi-year trend (Appendix 2). Over the 11 years dynamic changes

UNU Land Restoration Training Programme
13
in the annual average NDVI values tended to increase in given periods, but there was no
significant increase or decrease in trends in any given period (Figure 6). The increasing
trendline exceeds the line for the total average from the middle of the whole period (Figure 6).
Figure 6. 11-year (2006-2016) trend in annual average NDVI for June, July and August.
Figure 7 shows the spatial distribution of the NDVI trend calculated with a Pearson correlation
coefficient for the 22,043 points (x; y). Most of the increased trends were observed in the
southern part, whereas the and decreased trends were mostly observed in the northern part of
the study area (Figure 7). The maximum increasing trend R value was 0.86 (p < 0.001) (p value
calculated using two-tailed T test), and the minimum decreasing trend R value was -0.54 (p <
0.1). The distribution of the increasing NDVI trend occupied 86.5% 18,810.52 sq. km) of the
total study area and the decreasing trend 13.5% (2,923.4 sq. km) (Table 1).
Table 1. Spatial distribution percentage of NDVI trend values.
Area (sq.
km)
Percentage of
total area (%)
Increasing trend 18810.52 86.54
Decreasing trend 2923.37 13.45
Total 21735.09 100.00
y = 80.204x + 4103.3
R² = 0.1136
0
1000
2000
3000
4000
5000
6000
2006 2007 2008 2009 2010 2011 2012 2013 2014 2015 2016
ND
VI
va
lue
Year
NDVI trend
NDVI Average Linear (NDVI)

UNU Land Restoration Training Programme
14
Figure 7. Pearson correlation coefficient’s NDVI trend R values specified the following classes:
moderately decreasing trend R value was -0.54 (p < 0.09) - -0.4 (p < 0.2), decreasing -0.4 (p <
0.2) – 0 (p < 0.9), moderately increasing 0.4 (p > 0.2) - 0.6 (p > 0.05), significantly increasing
0.6 (p < 0.05) - 0.83 (p < 0.001).
3.2 Trends in annual accumulated precipitation of study area
The 11-year annual accumulated precipitation for June, July and August was calculated before
analysing for the multi-year trend (Appendix 3). As shown in Figure 8, the 11-year dynamic
change average annual accumulated precipitation tended to increase in the given period. Also,
there were some significant changes in the graphs which show high variance of annual
accumulated precipitation in the given period (Figure 8). The increasing trendline exceeded the
line for the total average from the middle of the whole period which was same result as the
NDVI linear trend.
Moderately decreasing
Decreasing
Increasing
Moderately increasing
Significantly increasing

UNU Land Restoration Training Programme
15
Figure 8. Dynamic change in 11-year trends in average annual accumulated precipitation for
June, July and August.
Figure 9. Spatial distribution of 11-year trends in average annual accumulated precipitation for
June, July and August. The estimation result of the precipitation trend shows that 99.6% of the
study area had an increasing trend and 0.4% a decreasing trend.
y = 6.0537x + 165.36
R² = 0.0985
0
50
100
150
200
250
300
350
2006 2007 2008 2009 2010 2011 2012 2013 2014 2015 2016
Pre
cip
iati
on
mm
Year
Annual sum precipitation Average Linear (Annual sum precipitation)

UNU Land Restoration Training Programme
16
Figure 9 shows the spatial distribution of the precipitation trend calculated with the Pearson
correlation coefficient for the 22,043 points (x; y). Precipitation in the study area tended to
increase during the 11 years. The maximum increasing trend R value was 0.7 (p < 0.001), and
the minimum decreasing trend R value was -0.01 (p < 0.9).
The precipitation trend had a higher variance than the NDVI variation but generally the trend
variance of 2 variations looked similar over the 11-year period (Figure 10).
Figure 10. Comparison of annual average NDVI and annual accumulated precipitation of given
period.
3.3 Spatial distribution of human activities
The spatial distribution of human impact buffer zones was created from the following human
activities: herder camps, water points, lakes, rivers, settlement areas and roads (Figure 11). The
total area of the study site high impact zone was 30.1% (6,542.3 sq. km), medium impact zone
22.6% (4,912.1 sq. km), low impact zone 18.9% (4,101.4 sq. km) and no impact zone 28.4%
(6,177.1 sq. km).
The NDVI decreasing trend values were distributed over 16.28% of the high impact zone and
9.1% of the no impact zone (Table 2). The percentage of the area with a decreasing trend of
NDVI gradually decreased from the high impact zone to the no impact zone (Figure 12).
0
50
100
150
200
250
300
350
0
1000
2000
3000
4000
5000
6000
2004 2006 2008 2010 2012 2014 2016 2018
Pre
cip
itat
ion m
m
ND
VI
val
ue
Year
Mean value of NDVI Mean value of total precipitation

UNU Land Restoration Training Programme
17
Figure 11. Spatial distribution of human impact zones classified as the following: severely 0-2
km, moderately 2-4 km, slightly 4-10 km.
Table 2. Percentage of spatial distribution of decreasing NDVI trend in human impact zones.
Human impact zone
High impact
zone
Medium
impact zone
Low impact
zone
No impact
zone
Decreasing trend % 16.28 15.79 12.69 9.09
Percentage in total study area % 30.21 22.49 18.95 28.35
Figure 12. Percentage of spatial distribution of decreasing NDVI trend in human impact zones.
16.28 15.7912.69
9.09
0
5
10
15
20
High impact
zone
Medium impact
zone
Low impact
zone
No impact zoneDec
reas
ing t
rend
in
ND
VI
(%)
Decreasing trend Linear (Decreasing trend)

UNU Land Restoration Training Programme
18
3.4 Impacts of human activities on NDVI trend
As shown in Table 3, in the impact zones from roads and settlement areas an NDVI decreasing
trend was observed for 18.96% of the total area of the 2 km buffer zone, in the 4 km buffer zone
21.77% and in the 10 km buffer zone 22.81%, respectively. The impact zone of roads had more
decreasing trend values than settlement areas.
Table 3. Percentage of NDVI decreasing trends in impact zones of settlement areas and roads.
Buffer zone distance (km) 2 4 10
Urban area (%) 10.26 11.54 13.33
Road area (%) 18.16 19.30 15.84
Total percentage decreasing trends 18.96 21.77 22.81
As shown in Table 4, in the impact zones from grazing activities 88.5% increased and 11.5%
decreased. Overall, the increasing NDVI trend occupied 85.23% of the total grazing impact
zone and the decreasing trend 17.03%.
Table 4. Percentage of spatial distribution of NDVI decreasing trends in impact zones from
grazing activities.
Buffer zone distance (km) 2 4 10
Herders camp (%) 10.58 17.66 15.99
Wells and springs (%) 12.66 16.78 14.59
Rivers and streams (%) 6.65 7.58 10.45
Lakes and ponds (%) 20.48 19.78 21.58
Total percentage 11.5 15.22 15.38
In the 1 km buffer zones from cropland 32.1% of the total area had a detectable decreasing
trend in NDVI (Table 5). There were no NDVI declining trends observed in the impact zones
from mining activities.
Table 5. Percentage of NDVI decreasing trend distribution in the impact zones of cropland and
mining activities
Other human activity factors Cropland (1 km distance
buffer)
Mining (1 km distance
buffer)
Decreasing trend (%) 32.1 0.00
Figure 13 shows the percentage of values of negative trends in the total area of 1-10 km impact
zone. Most of the decreasing trends observed in the area around cropland and lakes and ponds
was about 20% of the total area of the impact zones.

UNU Land Restoration Training Programme
19
Figure 13. Percentage of decreasing trend distribution in different impact zones.
The distribution of the NDVI trend values in the no impact zones showed the following results:
in natural reserves, 100% increasing trend; strictly protected areas, increasing trend 89.63% and
decreasing trend 10.37%; borderline areas, increasing trend 93.92%, decreasing trend 6.08%
(Table 6).
Table 6. NDVI trend in the no human influence zones
State special needs areas Natural reserves
(area: 3911.72 sq.km)
Strictly protected areas
(area: 572.02 sq.km)
Borderline areas
(area: 6279.67 sq.km)
Decreasing trend (%) 0 10.4 6.1
3.5 Effects of precipitation and human activity on NDVI trends
Correlation coefficients were calculated for the NDVI trends, precipitation trend and human
impact zones to identify the effects of precipitation and human activities on the NDVI trend.
The spatial distribution of the NDVI trend, precipitation trend and index of human impact zones
was used for calculating the correlation matrix (Table 7). As shown in the correlation matrix,
the spatial distribution of the NDVI trend was positive and moderately correlated with the
spatial distribution of the precipitation trend and positive but weakly correlated with the spatial
distribution of human activities.
Figure 14 shows the distribution of correlation coefficients for NDVI and precipitation (for
June, July and August) from 2006 to 2016. Most of the strong positive correlation R values
were 0.94 (p < 0.001), the lowest R value -0.38 (p < 0.2).
Table 7. Correlation matrix of three variables.
Parameter Trend of NDVI Trend of precipitation Human influence
Trend of NDVI 1 0.35 0.05
Trend of precipitation 0.35 1 0.06
Human influence 0.05 0.06 1
0
5
10
15
20
25
30
35
Herders camp Wells and
springs
Rivers and
streams
Lakes and
ponds
Urban Road Cropland
Dec
reas
ing t
rend
in
ND
VI(
%)
1 km 2 km 4 km 10 km

UNU Land Restoration Training Programme
20
Figure 14. Correlation coefficient of annual average NDVI and annual accumulated
precipitation (for June, July and August) from 2006 to 2016. Correlation coefficient of NDVI
and Precipitation R values specified the following classes: weak negative R value was above -
0.38 (p = 0.2) to -0.1, weak positive 0 (p < 0.9) – 0.4 (p < 0.2), moderate positive 0.4 (p > 0.2)
- 0.6 (p > 0.05), strong positive 0.6 (p < 0.05) - 0.94 (p < 0.001).
4. DISCUSSION
The spatial distribution of the NDVI trend shows that in 11-year period 13.5% of the total area
has a decreasing trend. The vegetation cover decline for the long term is defined as a sign of
desertification (Lantieri, as cited in FAO and LADA 2007); it can therefore be concluded that
13.5% (2,923.4 sq. km area) of the total study area was affected by the potential impact of
desertification. A significant negative trend was not detected in the study area, only a weak and
moderately negative trend -0.54 (p < 0.09) – -0.1 (p < 0.9) was detected for the given period.
The variations in the average annual NDVI values and average annual accumulated
precipitation trend results show similar dispersion (Figure 10). Land condition and
desertification impact can be estimated by comparison between NDVI series and the rainfall
series (FAO and LADA 2007). The correlation matrix revealed that the spatial distribution of
NDVI trend was moderately positive (R=0.35, p<0.001) correlated with the spatial distribution
of the precipitation trend and weakly positive (R=0.05, p<0.001) correlated with the spatial

UNU Land Restoration Training Programme
21
distribution of human activities. But the map of the spatial distribution of the correlation
coefficients between annual average NDVI and annual accumulated precipitation in the given
period revealed a different result. For example, a strong correlation (R>0.6, p<0.05) was
observed for most of the study area, especially in the south and centre parts, and weak and
moderate correlations were observed in the northern part (Figure 14). Other factors influencing
changes in the vegetation cover besides precipitation, such as human activities, strong winds
and temperature variations, occurred in the areas where weak and moderate correlations were
observed. Also, in the area where a strong positive correlation was observed, vegetation cover
change was highly dependent on variation in precipitation. Overall, both comparison results
prove that there is an obvious correlation between spatial distribution of the NDVI trend and
the precipitation trend. The climate variation is a primary impact that affects environmental
changes in the Arid steppe zone of Mongolia (Dash et al. 2003).
The vegetation cover has been changed variously, depending on the different land use types.
Vegetation cover decline mostly occurred within the areas around lakes and croplands in the
study area. The “State special needs” area was chosen as representative of the no impact zons
to compare an active human impact zone with and a no impact zone. In the “State special needs”
area the lowest NDVI decreasing trend was observed. In detail, the natural reserved area
increasing trend accounted for 100% of the area and 89.6% of the special protected area. In the
overall result, the highest percentage (16.3%) of the NDVI decreasing trend was observed in
the high impact zone and the lowest percentage (9.1%) of the decreasing trend was observed in
the no impact zone. The results of this comparison revealed the percentage of the decreasing
trend gradually decreasing from the high impact zone to the no impact zone, which shows that
human activities can affect vegetation and lead to changes in vegetative cover in different ways.
Climate variation and human activities are accelerating land degradation processes and the
effects are rapidly increasing in arid areas (Dash et al. 2003). The significantly increasing
precipitation trend observed in the north-western part of the study area may be because of the
influence of the big lake (Buir) near to this area (Figure 9). The combined effects of human
activities and precipitation variations are affecting the vegetation cover in the steppe zones. The
precipitation factor appears to be affecting the decline of the vegetation cover more than human
activity, according to the results of this study. In addition to precipitation, strong winds and
high variation in temperature are major climatic factors impacting land degradation and the
fragile ecosystem of the steppe zone (Dash et al. 2003). These climatic factors need to be
considered in further studies on land degradation.
4.1 Limitations
Despite promising results there are some limitations to the datasets that were used in this
research and the methodologies applied. Remotely sensed data have a common limitation
concerning atmospheric, clouds, anisotropic and spectral effects which affect the quality of the
results. For this study, the geometric resolution of MODIS NDVI data also influenced the
accuracy of the study. Especially, NDVI data resolution was partially coarse to identify NDVI
changes around small objects such as settlement areas and herder camps. A total of 320
meteorological stations are currently under operation in Mongolia. But in the study area, there
are only two meteorological stations in existence which is insufficient to interpolate spatial
distribution of rainfall in such a large area. TRMM’s multi-satellite monthly data provided the
availability to generate spatial distribution of the amount of precipitation. However, in
estimating the relationship between rainfall and NDVI data, there may be errors caused by

UNU Land Restoration Training Programme
22
spatial resolution differences. The method of this study was not able to fully represent total
impacts which caused land degradation and desertification in the steppe area. In the steppe zone,
there are various impacts which affect the change in vegetative cover, such as a wind speed and
temperature variation. Also, the NDVI is a remotely sensed measurement of visible green
patches of vegetation rather than an absolute indicator of vegetation biomass. Thus, further
studies still need to use proper indicators capable of indicating plant biomass such as climatic
factors, NDVI, EVI (Enhanced vegetation index) and NPP (Net primary productivity). The
methodology of this study can be used to identify trends in any remotely sensed biophysical
indicators of land degradation using any scale of time series dataset. Additionally, it is possible
to conduct analyses using time series data of NDVI and rainfall which cover the entire year
period to identify changes in other seasons.
5. CONCLUSIONS
The study was aimed to identify effects of precipitation variation and human activities on the
decline of vegetative cover. Pearson correlation analysis was used to identify the linear trend
of precipitation and NDVI variance over the 11-year period from 2006 to 2016. The dispersion
of decreasing trend values of NDVI occupies 13.5% of the study area which means that for the
2,923.4 sq. km area there is the potential impact of land degradation. The percentage of
decreasing trend in NDVI among the human impact zones showed that there has been a certain
impact of human activity on the change in vegetation cover. The precipitation variance has
moderately and human activities weakly affected the vegetation cover change. In the south and
centre part of the study area the precipitation factor dominated the vegetation cover change. In
the north part of the research area weak and moderate correlation was observed. This means
there are more factors which affect the vegetation cover change. The variation in precipitation
leads to increased vulnerability of the steppe zone to desertification. Both factors have their
own effects on the decline of the NDVI trend, but the precipitation factor has a larger impact
than human activities on the change of vegetation cover of the real steppe subzone. For further
development of the methodology it is necessary to consider more biophysical indicators of plant
biomass, and also other climatic and topographic parameters, and to prolong the observation
period and increase the accuracy of the dataset. Overall this method gives opportunity to
conduct a relatively quick estimation of the situation in a large area. Also, this method is suitable
to identify regions where land degradation is a considerable problem.

UNU Land Restoration Training Programme
23
ACKNOWLEDGEMENTS
I would like to express my special thanks of gratitude to my supervisors, Atli Gudjónsson and
Ingibjörg Jónsdóttir, who provided me with professional guidance and dedicated support to
successfully complete my project.
I would like to express my gratitude to the UNU-LRT Director and staff for their kind support
for carrying out this project and assistance during this programme. Also thanks to the all
lecturers, those who shared with us valuable knowledge and experience.
My sincere thanks go to my dearest and beloved wife, Narantsatsral.Ts, who unceasingly
encouraged and inspired me to attend this programme.
I also would like to thank my directors and colleagues at the Agency for Land Administration
and Management, Geodesy and Cartography, and I appreciate your support and kindness.
Finally, many thanks to the UNU-LRT 2017 fellows and my friends for your cordial
relationship and fruitful collaboration.
UNU Land Restoration Training Programme
24
LITERATURE CITED
Dash D, Jalbaa K, Khaulanbek A, Mandakh N (2003) Говь хээрийн бүсийн экосистемийг
нөхөн сэргээх, хамгаалах шинжлэх ухааны үндэслэл [Sceintific basis of restoring and
protectting ecosystem of the Gobi and Steppe zones].
http://www.eic.mn/DLDbase/upload/2012/tadesertbook/3/20121220_6190_3.pdf (accessed 14
July 2017) (in Mongolian).
Eckert S, Hüsler F, Liniger H, Hodel E (2015) Trend analysis of MODIS NDVI time series for
detecting land degradation and regeneration in Mongolia. Journal of Arid Environments
113:16–28
FAO, LADA (2007) Technical Report 2, Biophysical indicator toolbox (Pressure/State).
http://projects.inweh.unu.edu/kmland/display.php?ID=226&DISPOP=VRCPR (accessed 1
July 2017).
Forkel M, Carvalhais N, Verbesselt J, Mahecha MD, Neigh CSR, Reichstein M (2013) Trend
change detection in NDVI time series: Effects of inter-annual variability and methodology.
Remote Sensing 5:2113–2144.
Gao Q, Wan Y, Li Y, Guo Y, Ganjurjav, Qin X, Jiangcun W, Wang B (2013) Effects of
topography and human activity on the net primary productivity (NPP) of alpine grassland in
northern Tibet from 1981 to 2004. International Journal of Remote Sensing 34:2057–2069.
Higginbottom T, Symeonakis E (2014) Assessing land degradation and desertification using
vegetation index data: Current frameworks and future directions. Remote Sensing 6:9552–
9575.
Huffman GJ (2016) The Transition in Multi-Satellite products from TRMM to GPM (TMPA
to IMERG). https://pmm.nasa.gov/sites/default/files/document_files/TMPA-to-
IMERG_transition.pdf (accessed 9 July 2017).
Institude of Geoecology, Mongolian Academy of Science (2014) Цөлжилтийг сааруулах
технологи боловсруулж турших [Core Technology Project Report on desertification
reduction technology development and experiment].
http://www.eic.mn/DLDbase/upload/2016/tadesertbook/3/20160603_124_3.pdf (accessed 9
July 2017) (in Mongolian).
Law on Land Mongolia (2002) http://www.legalinfo.mn/law/details/216 (accessed 6 June
2017) (in Mongolian).
MNEGDT (Ministry of Nature, Environment, Green Development and Tourism) (2012)
Байгаль орчны төлөв байдлын тайлан 2014-2015 [Environmental perspective report 2014-
2015]. http://www.eic.mn/DLDbase/upload/2015/tadesertbook/4/20150616_6685_4.pdf
(accessed 9 July 2017) (in Mongolian).
MOFA (Ministry of food and agriculture of Mongolia) (2015) National Report on the
Rangeland Health of Mongolia. https://jornada.nmsu.edu/files/Mongolia-Rangeland-health-
Report_EN.pdf (accessed 9 July 2017).

UNU Land Restoration Training Programme
25
National statistical office of Mongolia (2017) Monthly Statistical Report of Mongolia.
http://www.1212.mn/statHtml/statHtml.do?orgId=976&tblId=DT_NSO_1001_021V1&conn_
path=I2&language=en (accessed 9 July 2017).
Piao S, Fang J (2002) Terrestrial net primary production and its spatio-temporal patterns in
Qinghai-Xizang Plateau, China during 1982-1999. Journal of Natural Resources 17:373—380.
Sanderson EW, Jaiteh M, Levy MA, Redford KH, Wannebo A V, Woolmer G (2002) The
human footprint and the last of the wild. BioScience 52:891.
Solano R, Didan K, Jacobson A, Huete A (2010) MODIS Vegetation Index User’s Guide
(MOD13 Series). The University of Arizona 2010:38.
Tong S, Zhang J, Bao Y, Wurina, Terigele, Weilisi, Lianxiao (2017) Spatial and temporal
variations of vegetation cover and the relationships with climate factors in Inner Mongolia
based on GIMMS NDVI3g data. Journal of Arid Land 9:394–407.
UNCCD (2013) Desertification a visual synthesis.
http://www.unccd.int/Lists/SiteDocumentLibrary/Publications/Desertification-EN.pdf
(accessed 1 July 2017).
Ustin S, Jacquemoud S, Palacios-Orueta1 A, Li L, Whiting M (2009) Remote sensing based
assessment of biophysical indicators for land degradation and desertification. Pp. 15–44. In:
Roeder A and Hill J (eds.) Recent Advances in Remote Sensing and Geoinformation Processing
for Land Degradation Assessment. CRC Press, London.
Wang Q, Batkhishig O (2014) Impact of overgrazing on semiarid ecosystem soil properties: A
Case study of the eastern Hovsgol lake area, Mongolia. Ecosystem & Ecography 4:1–7.
Zhang X, Lu X, Wang X (2013) Spatial-temporal NDVI variation of different alpine grassland
classes and groups in Northern Tibet from 2000 to 2013. Mountain Research and Development
35:254–263.

UNU Land Restoration Training Programme
26
APPENDICES
Appendix I. Detailed information from remotely sensed NDVI, precipitation data and vector data.
Dataset name Definition Source Temporal
coverage
Type Spatial
resolution
Temporal
resolution
Scale
factor &
unit
MODIS
satellite’s
MOD13A3
NDVI
Monthly
average
vegetation index
data
MODIS Normalized Difference
Vegetation Index (NDVI)
complements NOAA's (National
oceanic and atmospheric
administration) Advanced Very
High-Resolution Radiometer
(AVHRR) NDVI products
homepage: earthexplorer.usgs.gov
Monthly NDVI data
of June, July and
August in period from
2006-2016.
HDF 1km monthly 0.0001
TRMM’s
(Tropical rainfall
measuring
mission) multi
satellite’s 3b43
data
Monthly
average
precipitation
amount
TRMM mission was jointly launched
by NASA (National aeronautics
space agency) and JAXA (Japanese
aerospace exploration agency)
USGS’s (United States geological
survey)
homepage:
https://pmm.nasa.gov/data-
access/downloads/trmm
Monthly precipitation
data of June, July and
August in period from
2006-2016.
NetCDF 0.25оx0.25о
grid monthly mm/hour
Unified land
territory
registration data
Land use data.
(Herders
seasonal
location, well,
river, stream,
spring, road,
urban area etc.)
ALAGAC (Agency of Land
administration, geodesy and
cartography)
2012 shp (Shape file) 1:100 000
UNU Land Restoration Training Programme
27
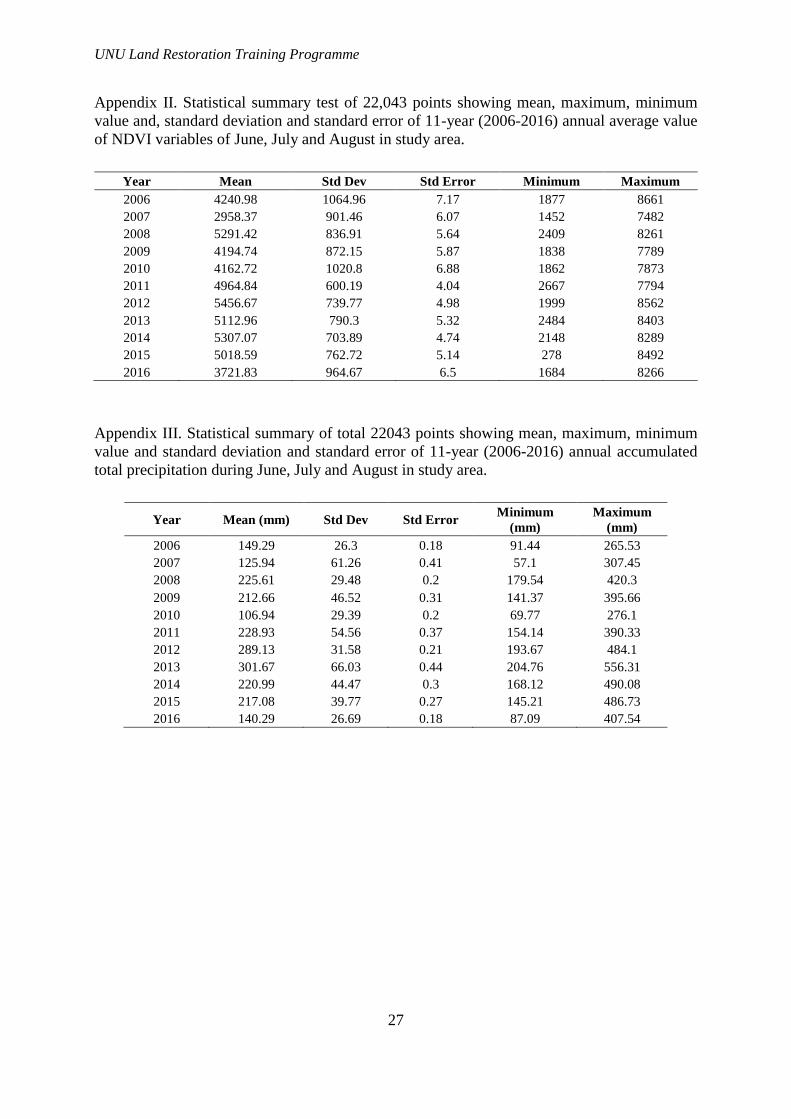
Appendix II. Statistical summary test of 22,043 points showing mean, maximum, minimum
value and, standard deviation and standard error of 11-year (2006-2016) annual average value
of NDVI variables of June, July and August in study area.
Year Mean Std Dev Std Error Minimum Maximum
2006 4240.98 1064.96 7.17 1877 8661
2007 2958.37 901.46 6.07 1452 7482
2008 5291.42 836.91 5.64 2409 8261
2009 4194.74 872.15 5.87 1838 7789
2010 4162.72 1020.8 6.88 1862 7873
2011 4964.84 600.19 4.04 2667 7794
2012 5456.67 739.77 4.98 1999 8562
2013 5112.96 790.3 5.32 2484 8403
2014 5307.07 703.89 4.74 2148 8289
2015 5018.59 762.72 5.14 278 8492
2016 3721.83 964.67 6.5 1684 8266
Appendix III. Statistical summary of total 22043 points showing mean, maximum, minimum
value and standard deviation and standard error of 11-year (2006-2016) annual accumulated
total precipitation during June, July and August in study area.
Year Mean (mm) Std Dev Std Error Minimum
(mm)
Maximum
(mm)
2006 149.29 26.3 0.18 91.44 265.53
2007 125.94 61.26 0.41 57.1 307.45
2008 225.61 29.48 0.2 179.54 420.3
2009 212.66 46.52 0.31 141.37 395.66
2010 106.94 29.39 0.2 69.77 276.1
2011 228.93 54.56 0.37 154.14 390.33
2012 289.13 31.58 0.21 193.67 484.1
2013 301.67 66.03 0.44 204.76 556.31
2014 220.99 44.47 0.3 168.12 490.08
2015 217.08 39.77 0.27 145.21 486.73
2016 140.29 26.69 0.18 87.09 407.54