Connecting Indicators with land degradation and desertification
38
Connecting Indicators with land degradation and desertification Kosmas C. 12 , Kairis Or. 12 , Karavitis Ch. 12 , Acikalin S. 1 , Alcalá M. 2 , Alfama P. 3 , Atlhopheng J. 4 , Barrera J. 5 , Belgacem A. 6 , Benet A. 7 , Brito J. 3 , Chaker M. 8 , Chanda R. 4 , Coelho C. 9 , Darkoh M. 4 , Diamantis I. 10 , Domingo F. 7 , Ermolaeva O. 11 , Fassouli V. 12 , Fei W. 13 , Feng J. 13 , Fernandez J. 7 , Fernandez F. 5 , Ferreira A. 14 , Gokceoglu C. 1 , Gonzalez D. 2 , Gungor H. 1 , Juying J. 13 , Khatteli H. 6 , Khitrov N. 11 , Kounalaki A. 12 , Laouina A. 8 , Lollino P. 15 , Lopes M. 14 , Magole L. 4 , Medina L. 2 , Mendoza M. 2 , Morais P. 14 , Mulale K. 4 , Ocakoglu F. 1 , Ouessar M. 6 , Ovalle C. 5 , Pegoraro E. 7 , Perez C. 5 , Perkins J. 4 , Pliakas F. 10 , Polemio M. 15 , Pozo A. 5 , Prat C. 2 , Qinke Y. 13 , Ramos A. 2 , Ramos J. 2 , Rey A. 7 , Riquelme J. 5 , Romanenkov V. 11 , Rui L. 13 , Santaloia F. 15 , Sebego R. 4 , Sghaier M. 6 , Silva N. 3 , Sizemskaya M. 11 , Soares J. 9 , Sonmez H. 1 , Taamallah H. 6 , Tezcan L. 1 , Torri D. 15 , Ungaro F. 15 , Valente S. 9 , Zagal E. 5 , Zeiliguer A. 11 , Zhonging W. 13 , Ziogas A. 10 . 1 Eskisehir Osmangazi University, Turkey 2 Institut de Recherche pour le Développement, Mexico 3 National Institut for Agriculture Research and Development, Cape Verde 4 University of Botswana, Botswana 5 Instituto de Investigaciones Agropecuarias, Chile 6 Institut des Regions Arides, Tunisia 7 Estacion Experimental de Zonas Aridas, Spain 8 University of Mohamed V, Chair UNESCO-GN, Morocco 9 University of Aveiro, Portugal 10 Democritus University of Thrace, Greece 11 Moscow State University of Environmental Engineering, Russia 12 Agricultural University of Athens, Greece 13 Institute of Soil and Water Conservation, China 14 Escola Superior Agraria de Gois, Portugal 15 Research Institute for Hydrogeological Protection, Italy 1. Introduction Indicators are becoming increasingly important tools for communicating information to decision makers and the public, as well as in measuring the environmental performance and evaluating the progress made by measures 1
-
Upload
agriculturalathensu -
Category
Documents
-
view
0 -
download
0
Transcript of Connecting Indicators with land degradation and desertification
Connecting Indicators with land degradation anddesertification
Kosmas C.12, Kairis Or.12, Karavitis Ch.12, Acikalin S.1, AlcaláM.2, Alfama P.3, Atlhopheng J.4, Barrera J.5, Belgacem A.6,Benet A.7, Brito J.3, Chaker M.8, Chanda R.4, Coelho C.9, DarkohM.4, Diamantis I.10, Domingo F.7, Ermolaeva O.11, Fassouli V.12,Fei W.13, Feng J.13, Fernandez J.7, Fernandez F.5, Ferreira A.14,Gokceoglu C.1, Gonzalez D.2, Gungor H.1, Juying J.13, KhatteliH.6, Khitrov N.11, Kounalaki A.12, Laouina A.8, Lollino P.15,Lopes M.14, Magole L.4, Medina L.2, Mendoza M.2, Morais P.14,Mulale K.4, Ocakoglu F.1, Ouessar M.6, Ovalle C.5, PegoraroE.7, Perez C.5, Perkins J.4, Pliakas F.10, Polemio M.15, PozoA.5, Prat C.2, Qinke Y.13, Ramos A.2, Ramos J.2, Rey A.7,Riquelme J.5, Romanenkov V.11, Rui L.13, Santaloia F.15, SebegoR.4, Sghaier M.6, Silva N.3, Sizemskaya M.11, Soares J.9,Sonmez H.1, Taamallah H.6, Tezcan L.1, Torri D.15, Ungaro F.15,Valente S.9, Zagal E.5, Zeiliguer A.11, Zhonging W.13, ZiogasA.10.
1Eskisehir Osmangazi University, Turkey2Institut de Recherche pour le Développement, Mexico3National Institut for Agriculture Research and Development, Cape Verde4University of Botswana, Botswana5Instituto de Investigaciones Agropecuarias, Chile6Institut des Regions Arides, Tunisia7Estacion Experimental de Zonas Aridas, Spain8University of Mohamed V, Chair UNESCO-GN, Morocco9University of Aveiro, Portugal10Democritus University of Thrace, Greece11Moscow State University of Environmental Engineering, Russia12Agricultural University of Athens, Greece13Institute of Soil and Water Conservation, China14Escola Superior Agraria de Gois, Portugal15Research Institute for Hydrogeological Protection, Italy
1. Introduction
Indicators are becoming increasingly important tools forcommunicating information to decision makers and thepublic, as well as in measuring the environmentalperformance and evaluating the progress made by measures
1
applied to combat land degradation. As has been pointedout by UNCCD, indicators can be considered valuable toolsfor assessing desertification risk and for analyzing theeffectiveness of the various land management practicesfor combating desertification. By using an appropriatenumber of indicators, complex processes such as soilerosion, soil salinization, and land desertification maybe effectively described without using complexmathematical expressions or models that require anexcessive amount of data. The European EnvironmentalAgency has considered that an indicator is a measure,generally quantitative, that can be used to illustrateand communicate complex phenomena simply, includingtrends and progress over time (EEA, 2005). Policy makersneed to have as clear as possible a view of suchinterrelations in the overall complex system. The mainmeans of communicating the pertinent information isthrough indicators. Indicators can be used to monitor theimplementation of systemic policy objectives, as well asto represent trends and developments in the state of asystem. Many international or national organizationshave recognized that environmental and socio-economicindicators are playing a significant role in supportingdevelopmental policies.
An environmental indicator is a parameter or a valuederived from parameters that describe the state of theenvironment and its impact on human beings, ecosystemsand materials, the pressures on the environment, thedriving forces and the responses steering that system(ETDS, 2010). In environmental sciences, a singleindicator cannot efficiently describe a complex processsuch as soil erosion or land desertification. Indicatorscombined in certain ways, creating an Index, permitmultiple measurements to be made in various systems, andhence the monitoring of the state of the environment, thecomparison of different sub-systems and the maintenanceof the Index as well as a policy making instrument.
Many authors have considered that classification ofindicators must take into account the linkages between;(a) pressures exerted on the environment by humanactivities, (b) changes in quality of the environmentalcomponents, and (c) societal responses to these changes
2
that can be a useful and valuable tool for land-users andpolicy makers (O’ Connor, 1994; Pieri et al., 1995;SCOPE, 1995; Dumanski and Pieri, 1996). The Organizationfor Economic Co-operation and Development (OECD, 2003)has early on established the following criteria forselecting environmental indicators:
Provide a representative picture of environmentalconditions, pressures on the environment or society’sresponses;
be simple, easy to interpret and able to show trendsover time;
be responsive to changes in the environment andrelated human activities;
provide a basis for international comparisons; be either national in scope or applicable to regionalenvironmental issues of national significance;
have a threshold or reference value against which tocompare it, so that users can assess the significanceof the values associated with it;
be theoretically well founded in technical andscientific terms;
be based on international standards and internationalconsensus about its validity;
lend itself to being linked to economic models,forecasting and information systems.
The data required to support the indicator should be(a) readily available or made available at a reasonablecost/benefit ratio, (b) adequately documented and ofknown quality, and (c) updated at regular intervals inaccordance with reliable procedures. The establishment ofan indicator monitoring system for environmental purposesis scale-dependent. Some indicators such as rainseasonality, drainage density are useful over largeareas. In order to practically enhance the sustainability ofland management, research on using indicators for assessingland degradation and desertification risk must initially focusat farm level. However, as Hammond et al. (1995) states,decision-makers and the public need highly aggregatedindicators that, at the final stage, must be limited innumbers. This means that data collection may involve a
3
large number of indicators but the final presentationshould be a few aggregated indices that are easilyunderstood and can be compared in order to determinetrends. The objectives of this work are: (a) to evaluatethe effectiveness of using indicators for assessing landdegradation and desertification in a wide range ofphysical environmental, social and economic conditions,and (b) to identify a minimum number of indicatorsrelated to land management that can be effectively usedfor combating land degradation in areas prone todesertification.
2. Defining list of indicators
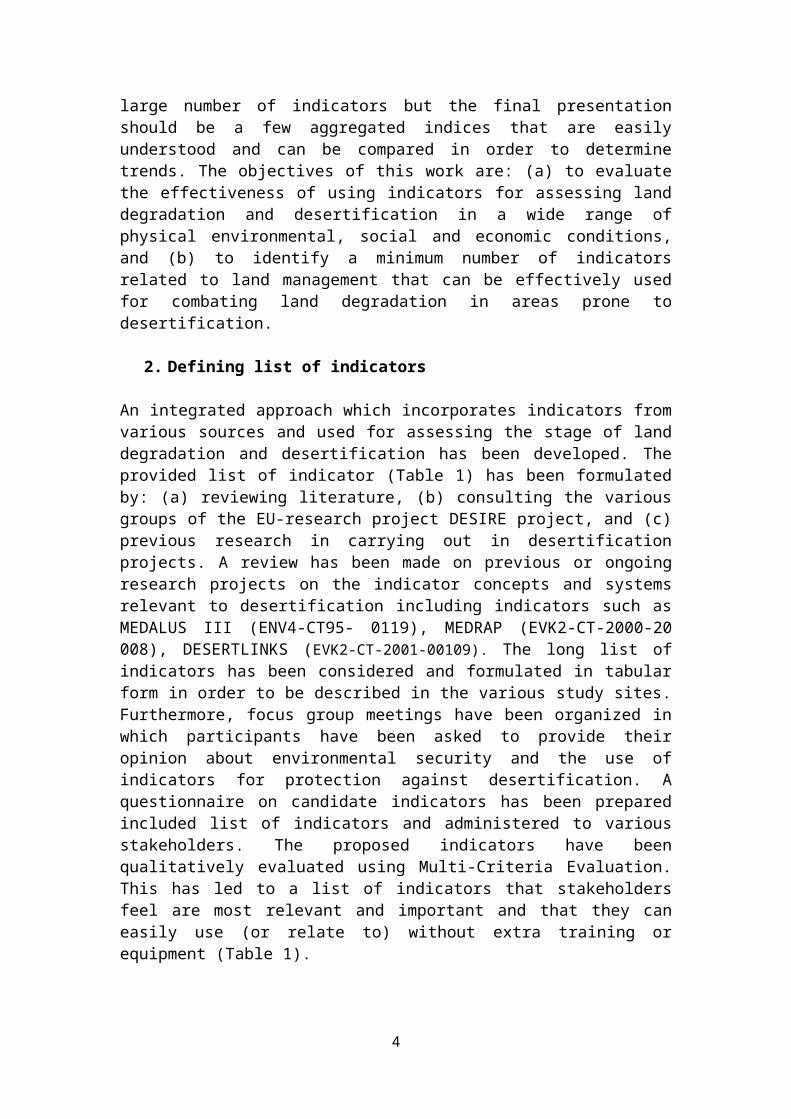
An integrated approach which incorporates indicators fromvarious sources and used for assessing the stage of landdegradation and desertification has been developed. Theprovided list of indicator (Table 1) has been formulatedby: (a) reviewing literature, (b) consulting the variousgroups of the EU-research project DESIRE project, and (c)previous research in carrying out in desertificationprojects. A review has been made on previous or ongoingresearch projects on the indicator concepts and systemsrelevant to desertification including indicators such asMEDALUS III (ENV4-CT95- 0119), MEDRAP (EVK2-CT-2000-20008), DESERTLINKS (EVK2-CT-2001-00109). The long list ofindicators has been considered and formulated in tabularform in order to be described in the various study sites.Furthermore, focus group meetings have been organized inwhich participants have been asked to provide theiropinion about environmental security and the use ofindicators for protection against desertification. Aquestionnaire on candidate indicators has been preparedincluded list of indicators and administered to variousstakeholders. The proposed indicators have beenqualitatively evaluated using Multi-Criteria Evaluation.This has led to a list of indicators that stakeholdersfeel are most relevant and important and that they caneasily use (or relate to) without extra training orequipment (Table 1).
4
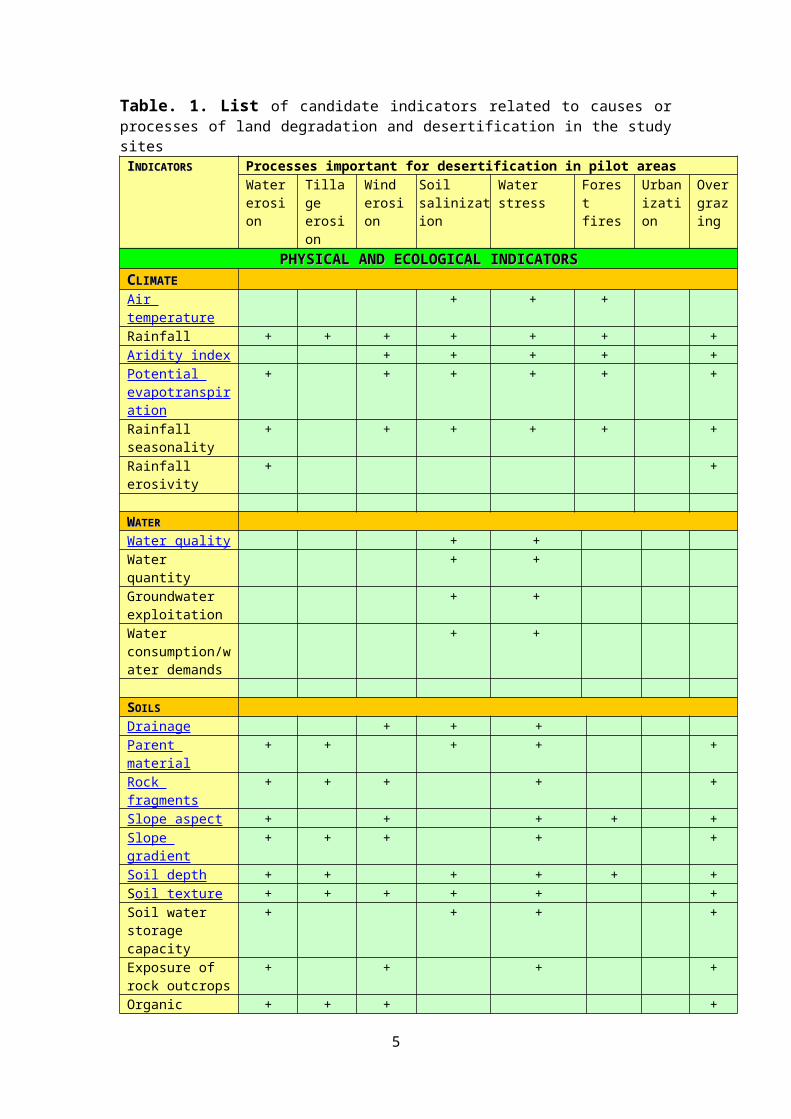
Table. 1. List of candidate indicators related to causes orprocesses of land degradation and desertification in the studysites IINDICATORSNDICATORS Processes important for desertification in pilot areas
Watererosion
Tillage erosion
Wind erosion
Soil salinization
Water stress
Forest fires
Urbanization
Overgrazing
PHYSICAL AND ECOLOGICAL INDICATORSPHYSICAL AND ECOLOGICAL INDICATORSCCLIMATELIMATEAir temperature
+ + +
Rainfall + + + + + + +Aridity index + + + + +Potential evapotranspiration
+ + + + + +
Rainfall seasonality
+ + + + + +
Rainfall erosivity
+ +
WWATERATERWater quality + +Water quantity
+ +
Groundwater exploitation
+ +
Water consumption/water demands
+ +
SSOILSOILS Drainage + + +Parent material
+ + + + +
Rock fragments
+ + + + +
Slope aspect + + + + +Slope gradient
+ + + + +
Soil depth + + + + + +Soil texture + + + + + +Soil water storage capacity
+ + + +
Exposure of rock outcrops
+ + + +
Organic + + + +
5
matter surface horizonDegree of soil erosion
+ + +
electrical conductivity
=
VVEGETATIONEGETATIONMajor Land use
+ + + + + +
Vegetation cover type
+ + + + +
Plant cover + + + + +Deforested area
+ + + +
WWATERATER RUNOFFRUNOFFDrainage density
+ +
Flooding frequency
+
Impervious surface area
+ + + +
FFIRESIRESFire frequency
+ + + +
Fire risk + +Burned area + + + +
ECONOMICAL INDICATORSECONOMICAL INDICATORSAAGRICULTUREGRICULTUREFarm ownership
+ + + +
Farm size + +Land fragmentation
+ +
Net farm income
+ + +
Parallel employment
+ + +
CCULTIVATIONULTIVATIONTillage operations
+ + + +
Tillage depth + + +Tillage direction
+ + +
6
Mechanizationindex
+ +
HHUSBANDRYUSBANDRYGrazing control
+ + + + +
Grazing intensity
+ + + + +
LLANDAND MANAGEMENTMANAGEMENTFire protection
+ + + + +
Sustainable farming
+
Reclamation of affected areas
+
Reclamation of mining areas
+ + +
Soil erosion control measures
+ + + + + +
Soil water conservation measures
+ + +
Terracing (presence of)
+ + + + +
LLANDAND USEUSELand abandonment
+ + + + +
Land use intensity
+ + + + + +
Land use type + + + + +Period of existing landuse
+ +
% urban area +Rate of change of urban area
+
Distance fromseashore
+
WWATERATER USEUSE Aquifer over exploitation
+ +
Irrigation percentage of
+ + +
7
arable landRunoff water storage
+ + + +
Water consumption by sector
+
Water scarcity
+ + + +
TTOURISMOURISM Tourism intensity
+ + + + + +
Tourism change
+ + +
SSOCIALOCIALHuman povertyindex
+ + +
Old age index + + + +Population density
+ + + + + + +
Population growth rate
+ + + + +
Population distribution
+
IINSTITUTIONALNSTITUTIONALEU farm subsidies
+ + + +
Protected areas
+ +
Policy enforcement
+ + + + + +
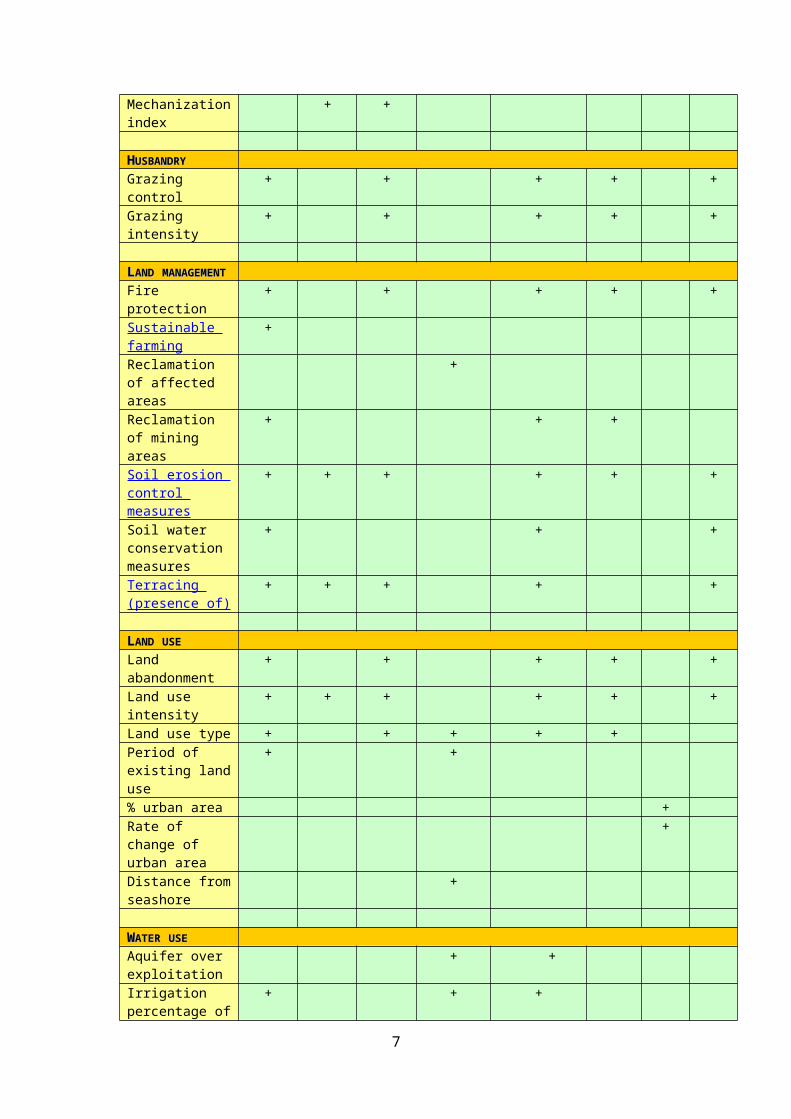
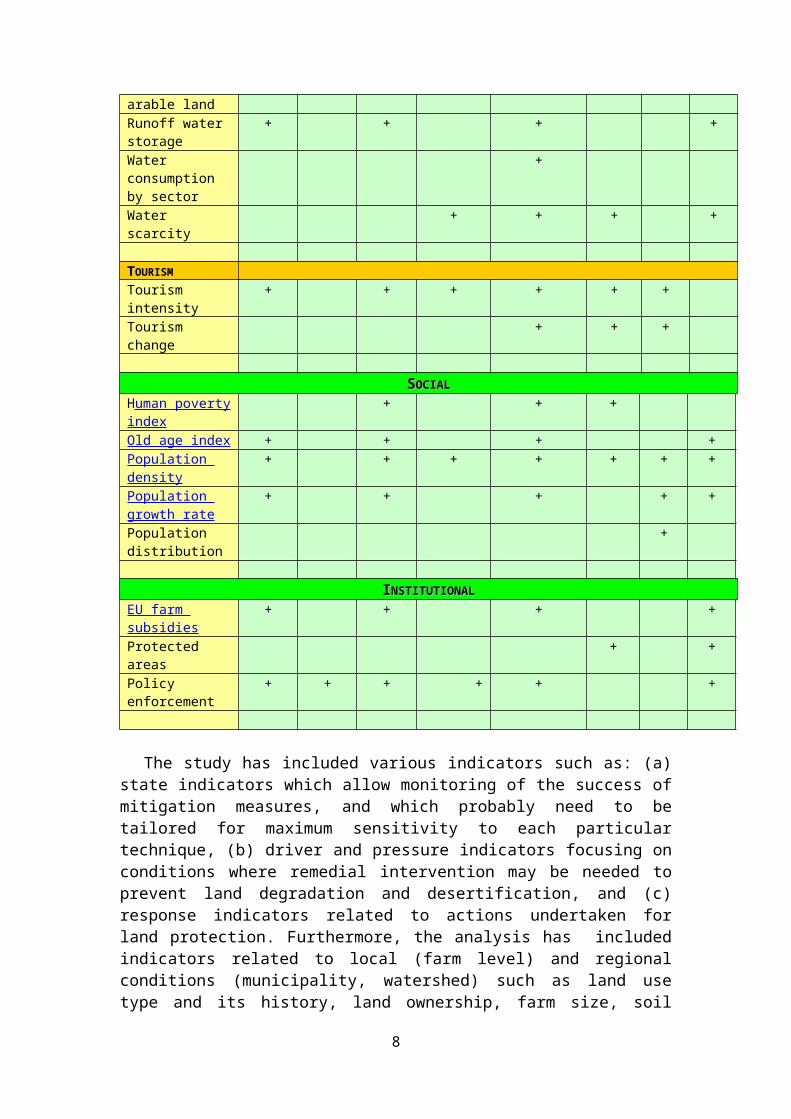
The study has included various indicators such as: (a)state indicators which allow monitoring of the success ofmitigation measures, and which probably need to betailored for maximum sensitivity to each particulartechnique, (b) driver and pressure indicators focusing onconditions where remedial intervention may be needed toprevent land degradation and desertification, and (c)response indicators related to actions undertaken forland protection. Furthermore, the analysis has includedindicators related to local (farm level) and regionalconditions (municipality, watershed) such as land usetype and its history, land ownership, farm size, soil
8
properties, relief, type of vegetation and plant cover,tillage practices, water quality and quantity, soilerosion control measures, soil water conservationmeasures, subsidies allocated, population density,migration rate, etc. Each indicator has been described bydefining distinct classes (Table 2). The classes havebeen defined using existing classification systems suchas the European geo-referenced soil data base, orexisting research data. Weighing indices have beenassigned in the various classes of the indicators basedon existing research data or classified according to theimportance to land degradation and desertification.
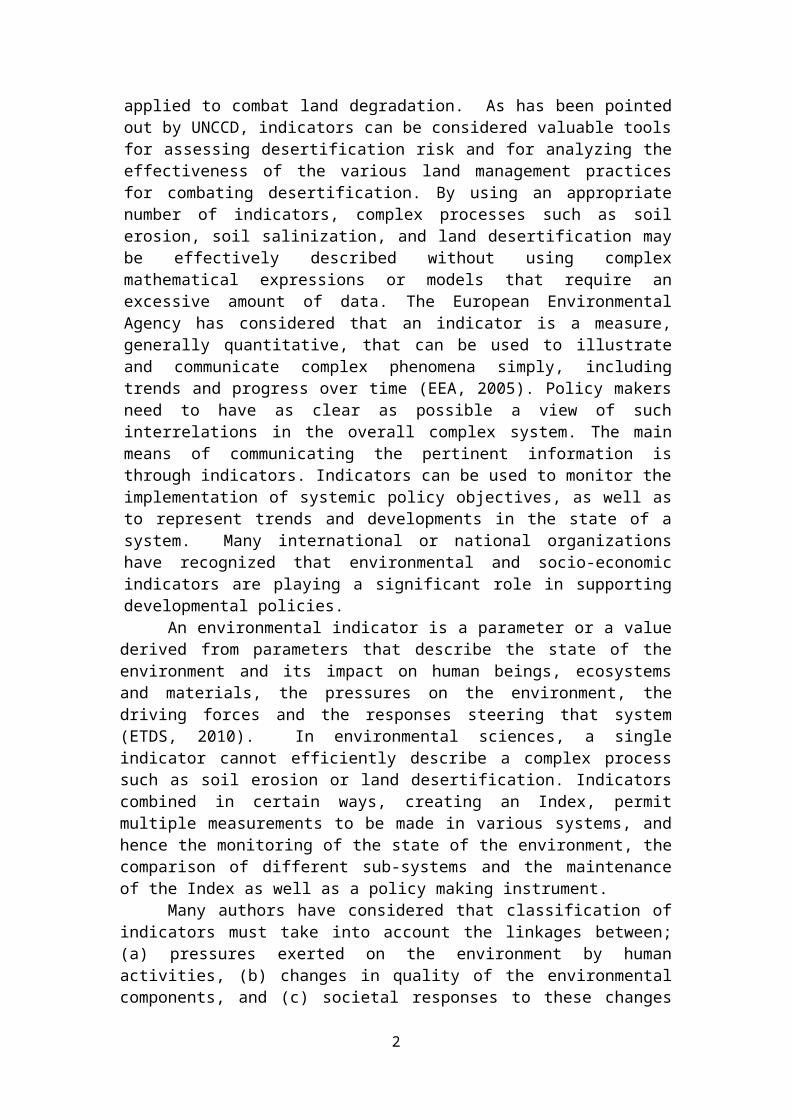
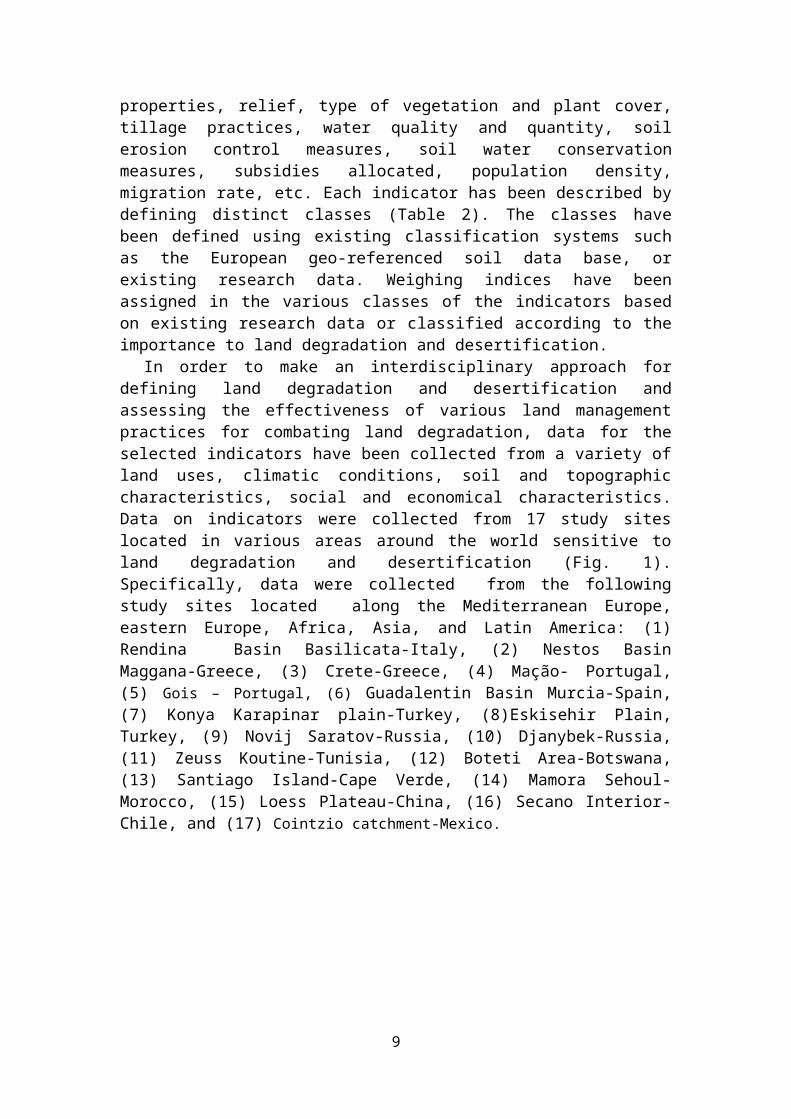
In order to make an interdisciplinary approach fordefining land degradation and desertification andassessing the effectiveness of various land managementpractices for combating land degradation, data for theselected indicators have been collected from a variety ofland uses, climatic conditions, soil and topographiccharacteristics, social and economical characteristics.Data on indicators were collected from 17 study siteslocated in various areas around the world sensitive toland degradation and desertification (Fig. 1).Specifically, data were collected from the followingstudy sites located along the Mediterranean Europe,eastern Europe, Africa, Asia, and Latin America: (1)Rendina Basin Basilicata-Italy, (2) Nestos BasinMaggana-Greece, (3) Crete-Greece, (4) Mação- Portugal,(5) Gois – Portugal, (6) Guadalentin Basin Murcia-Spain,(7) Konya Karapinar plain-Turkey, (8)Eskisehir Plain,Turkey, (9) Novij Saratov-Russia, (10) Djanybek-Russia,(11) Zeuss Koutine-Tunisia, (12) Boteti Area-Botswana,(13) Santiago Island-Cape Verde, (14) Mamora Sehoul-Morocco, (15) Loess Plateau-China, (16) Secano Interior-Chile, and (17) Cointzio catchment-Mexico.
9
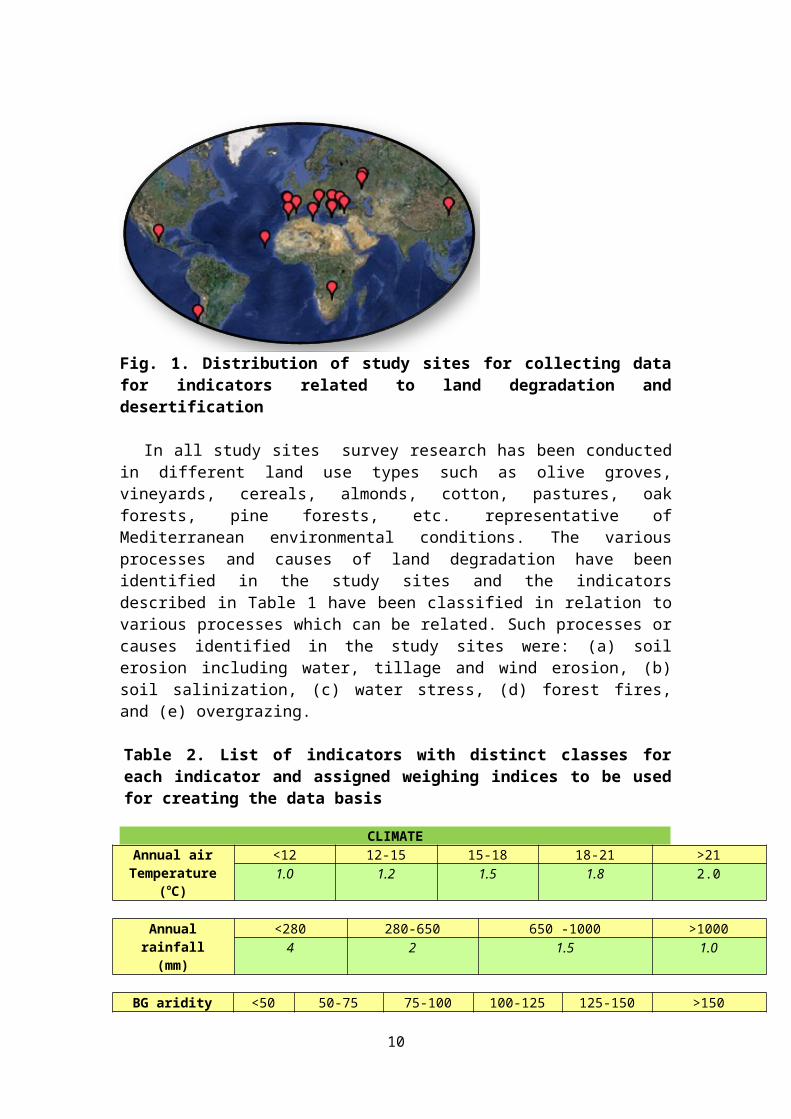
Fig. 1. Distribution of study sites for collecting datafor indicators related to land degradation anddesertification
In all study sites survey research has been conductedin different land use types such as olive groves,vineyards, cereals, almonds, cotton, pastures, oakforests, pine forests, etc. representative ofMediterranean environmental conditions. The variousprocesses and causes of land degradation have beenidentified in the study sites and the indicatorsdescribed in Table 1 have been classified in relation tovarious processes which can be related. Such processes orcauses identified in the study sites were: (a) soilerosion including water, tillage and wind erosion, (b)soil salinization, (c) water stress, (d) forest fires,and (e) overgrazing.
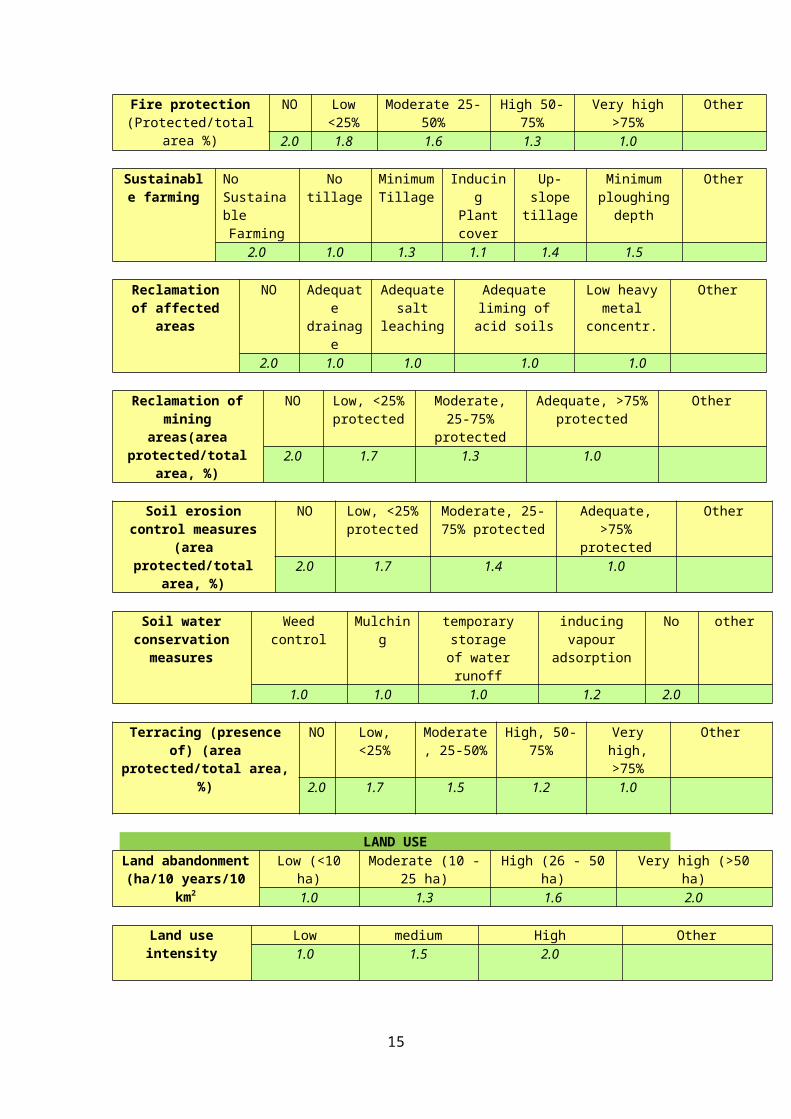
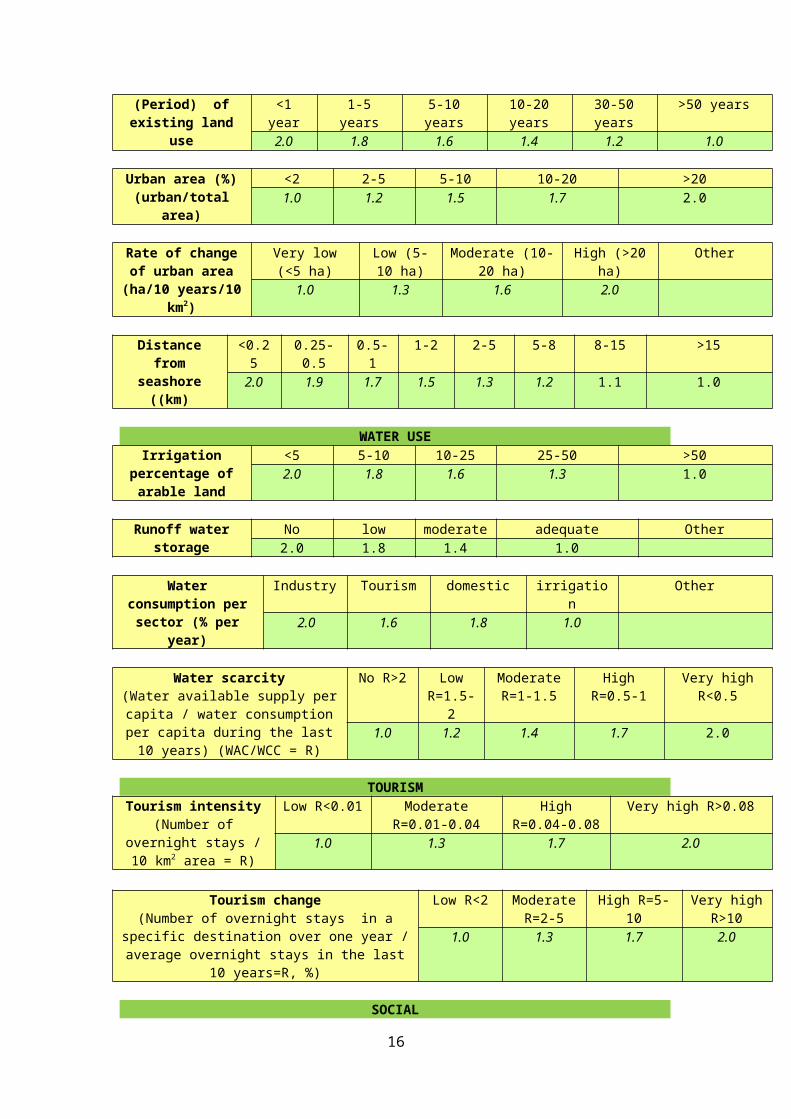
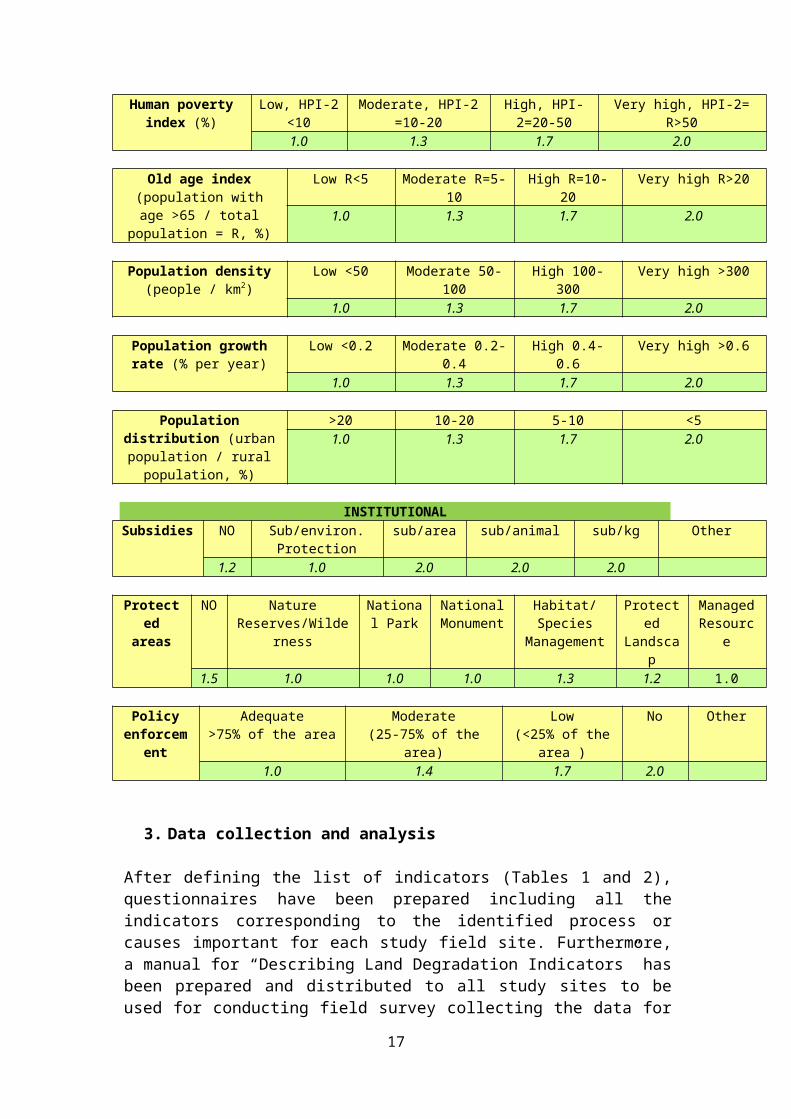
Table 2. List of indicators with distinct classes foreach indicator and assigned weighing indices to be usedfor creating the data basis
CLIMATEAnnual airTemperature
(oC)
<12 12-15 15-18 18-21 >211.0 1.2 1.5 1.8 2.0
Annualrainfall(mm)
<280 280-650 650 -1000 >10004 2 1.5 1.0
BG aridity <50 50-75 75-100 100-125 125-150 >150
10
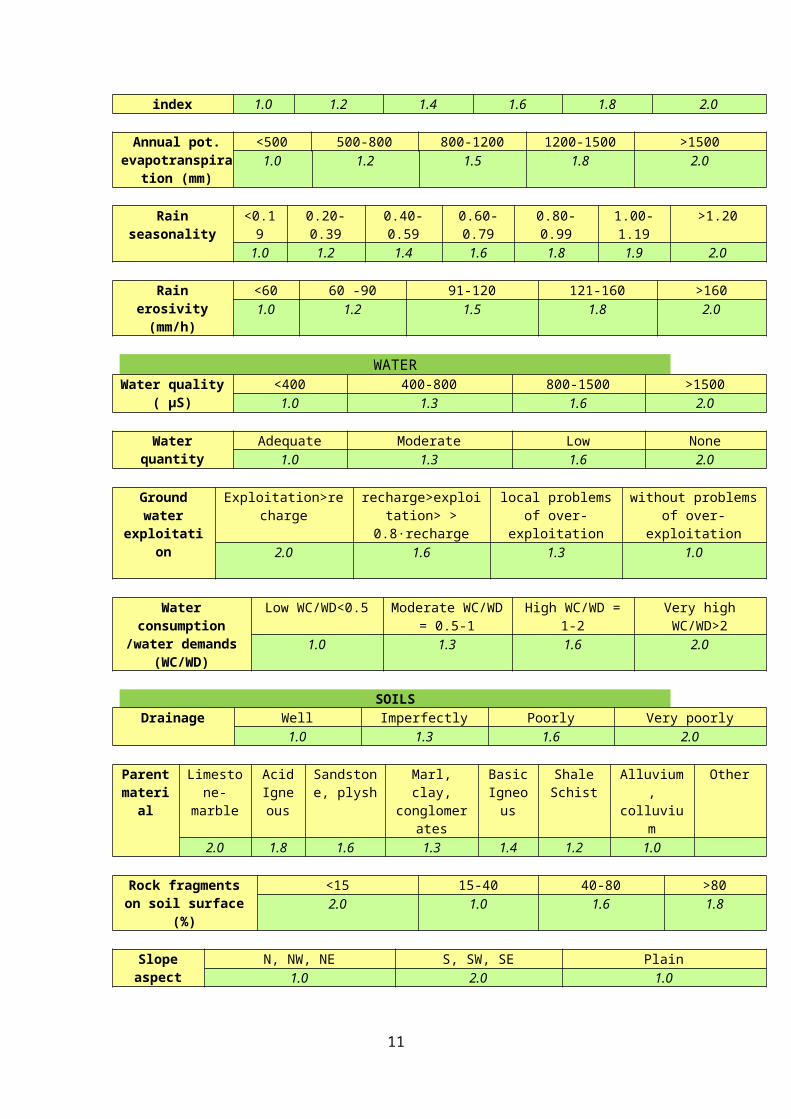
index 1.0 1.2 1.4 1.6 1.8 2.0
Annual pot.evapotranspira
tion (mm)
<500 500-800 800-1200 1200-1500 >15001.0 1.2 1.5 1.8 2.0
Rainseasonality
<0.19
0.20-0.39
0.40-0.59
0.60-0.79
0.80-0.99
1.00-1.19
>1.20
1.0 1.2 1.4 1.6 1.8 1.9 2.0
Rainerosivity(mm/h)
<60 60 -90 91-120 121-160 >1601.0 1.2 1.5 1.8 2.0
WATERWater quality
( μS)<400 400-800 800-1500 >15001.0 1.3 1.6 2.0
Waterquantity
Adequate Moderate Low None1.0 1.3 1.6 2.0
Groundwater
exploitation
Exploitation>recharge
recharge>exploitation> >
0.8·recharge
local problemsof over-
exploitation
without problemsof over-
exploitation2.0 1.6 1.3 1.0
Waterconsumption
/water demands(WC/WD)
Low WC/WD<0.5 Moderate WC/WD= 0.5-1
High WC/WD =1-2
Very highWC/WD>2
1.0 1.3 1.6 2.0
SOILSDrainage Well Imperfectly Poorly Very poorly
1.0 1.3 1.6 2.0
Parentmaterial
Limestone-
marble
AcidIgneous
Sandstone, plysh
Marl,clay,
conglomerates
BasicIgneous
ShaleSchist
Alluvium,
colluvium
Other
2.0 1.8 1.6 1.3 1.4 1.2 1.0
Rock fragmentson soil surface
(%)
<15 15-40 40-80 >802.0 1.0 1.6 1.8
Slopeaspect
N, NW, NE S, SW, SE Plain1.0 2.0 1.0
11
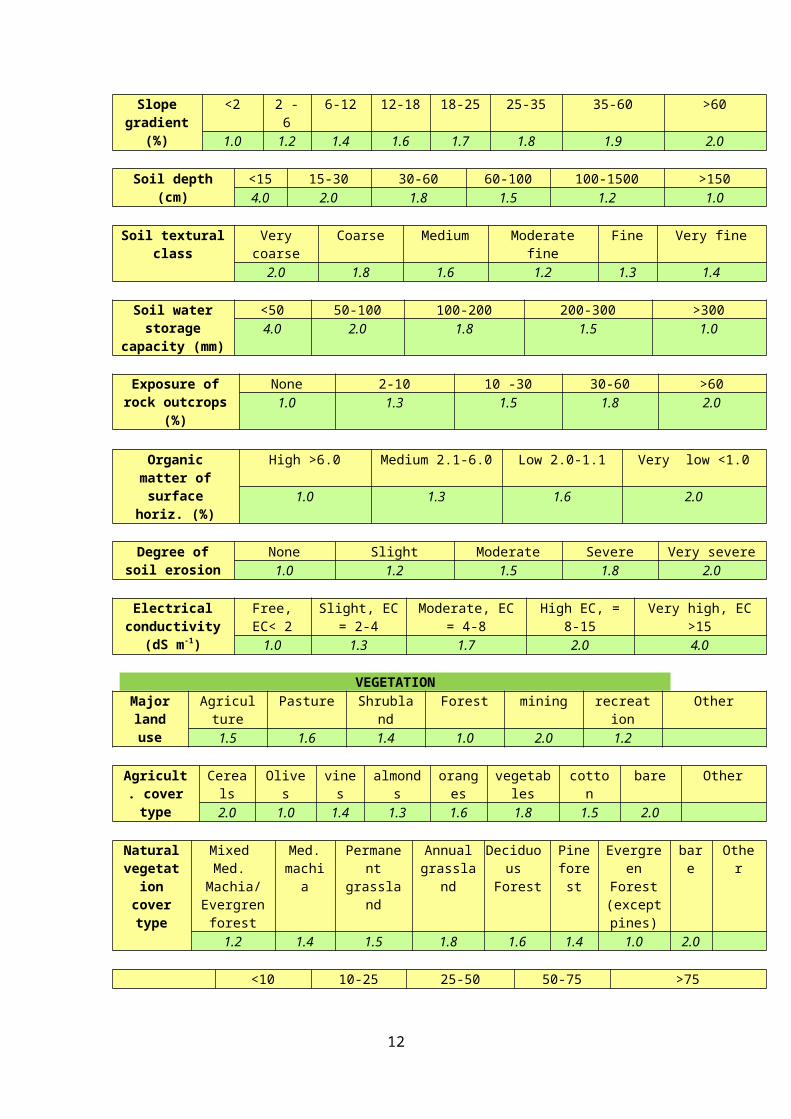
Slopegradient
(%)
<2 2 -6
6-12 12-18 18-25 25-35 35-60 >60
1.0 1.2 1.4 1.6 1.7 1.8 1.9 2.0
Soil depth(cm)
<15 15-30 30-60 60-100 100-1500 >1504.0 2.0 1.8 1.5 1.2 1.0
Soil texturalclass
Verycoarse
Coarse Medium Moderatefine
Fine Very fine
2.0 1.8 1.6 1.2 1.3 1.4
Soil waterstorage
capacity (mm)
<50 50-100 100-200 200-300 >3004.0 2.0 1.8 1.5 1.0
Exposure ofrock outcrops
(%)
None 2-10 10 -30 30-60 >601.0 1.3 1.5 1.8 2.0
Organicmatter ofsurface
horiz. (%)
High >6.0 Medium 2.1-6.0 Low 2.0-1.1 Very low <1.0
1.0 1.3 1.6 2.0
Degree ofsoil erosion
None Slight Moderate Severe Very severe1.0 1.2 1.5 1.8 2.0
Electricalconductivity
(dS m-1)
Free,EC< 2
Slight, EC= 2-4
Moderate, EC= 4-8
High EC, =8-15
Very high, EC>15
1.0 1.3 1.7 2.0 4.0
VEGETATIONMajorlanduse
Agriculture
Pasture Shrubland
Forest mining recreation
Other
1.5 1.6 1.4 1.0 2.0 1.2
Agricult. covertype
Cereals
Olives
vines
almonds
oranges
vegetables
cotton
bare Other
2.0 1.0 1.4 1.3 1.6 1.8 1.5 2.0 Naturalvegetationcovertype
MixedMed.Machia/Evergrenforest
Med.machia
Permanent
grassland
Annualgrassla
nd
Deciduous
Forest
Pineforest
Evergreen
Forest(exceptpines)
bare
Other
1.2 1.4 1.5 1.8 1.6 1.4 1.0 2.0
<10 10-25 25-50 50-75 >75
12
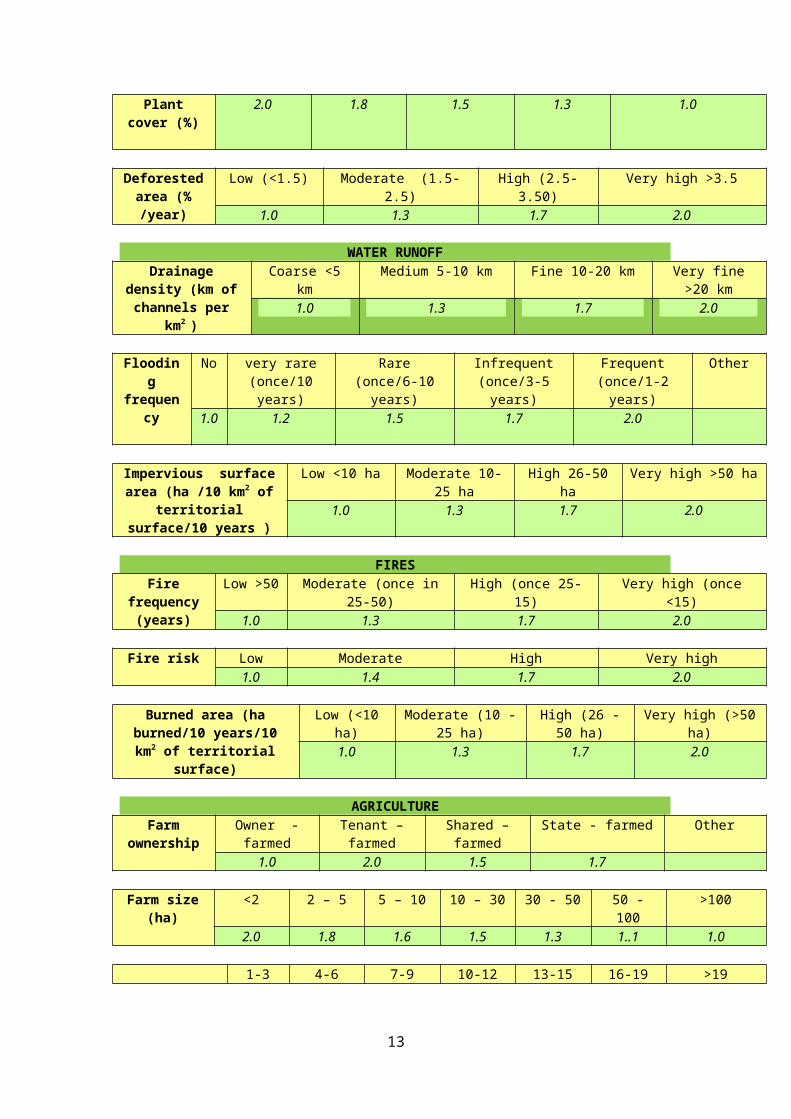
Plantcover (%)
2.0 1.8 1.5 1.3 1.0
Deforestedarea (%/year)
Low (<1.5) Moderate (1.5-2.5)
High (2.5-3.50)
Very high >3.5
1.0 1.3 1.7 2.0
WATER RUNOFFDrainage
density (km ofchannels per
km2 )
Coarse <5km
Medium 5-10 km Fine 10-20 km Very fine>20 km
1.0 1.3 1.7 2.0
Flooding
frequency
Νο very rare(once/10years)
Rare(once/6-10years)
Infrequent(once/3-5years)
Frequent(once/1-2years)
Other
1.0 1.2 1.5 1.7 2.0
Impervious surfacearea (ha /10 km2 of
territorialsurface/10 years )
Low <10 ha Moderate 10-25 ha
High 26-50ha
Very high >50 ha
1.0 1.3 1.7 2.0
FIRESFire
frequency(years)
Low >50 Moderate (once in25-50)
High (once 25-15)
Very high (once<15)
1.0 1.3 1.7 2.0
Fire risk Low Moderate High Very high1.0 1.4 1.7 2.0
Burned area (haburned/10 years/10km2 of territorial
surface)
Low (<10ha)
Moderate (10 -25 ha)
High (26 -50 ha)
Very high (>50ha)
1.0 1.3 1.7 2.0
AGRICULTUREFarm
ownershipOwner -farmed
Tenant –farmed
Shared –farmed
State - farmed Other
1.0 2.0 1.5 1.7
Farm size(ha)
<2 2 – 5 5 – 10 10 – 30 30 - 50 50 -100
>100
2.0 1.8 1.6 1.5 1.3 1..1 1.0
1-3 4-6 7-9 10-12 13-15 16-19 >19
13
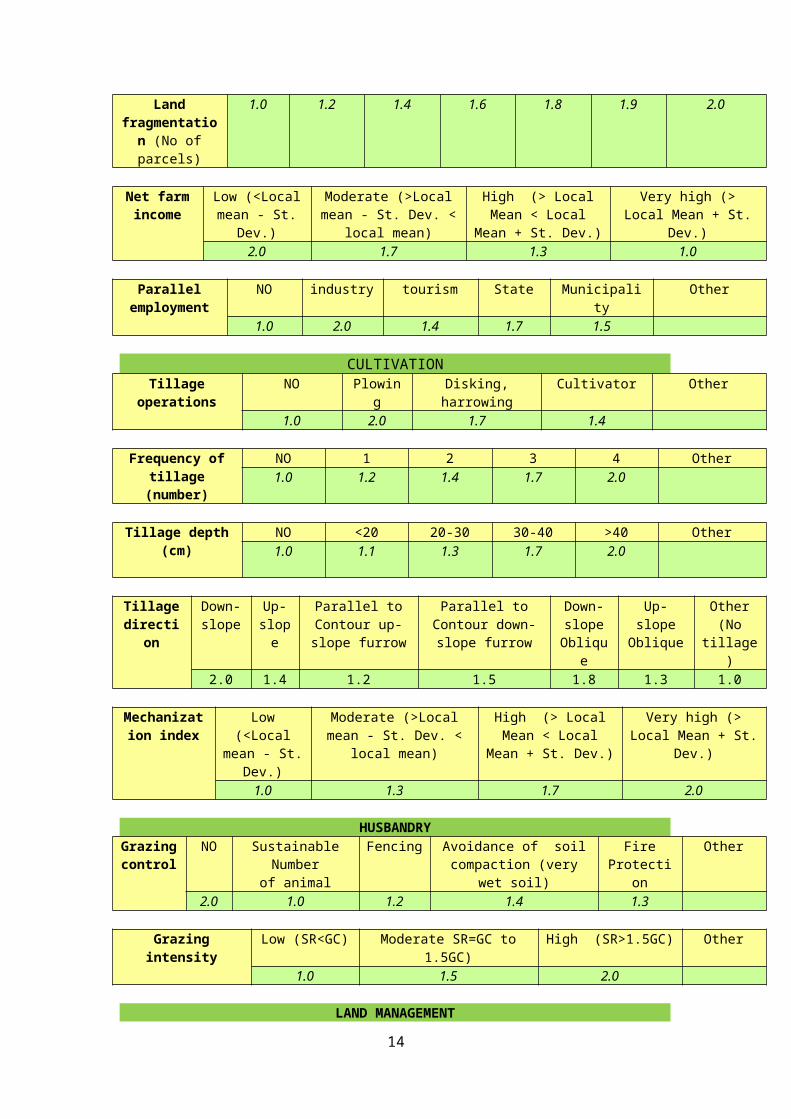
Landfragmentation (No ofparcels)
1.0 1.2 1.4 1.6 1.8 1.9 2.0
Net farmincome
Low (<Localmean - St.
Dev.)
Moderate (>Localmean - St. Dev. <
local mean)
High (> LocalMean < Local
Mean + St. Dev.)
Very high (>Local Mean + St.
Dev.)2.0 1.7 1.3 1.0
Parallelemployment
NO industry tourism State Municipality
Other
1.0 2.0 1.4 1.7 1.5
CULTIVATIONTillage
operationsNO Plowin
gDisking,harrowing
Cultivator Other
1.0 2.0 1.7 1.4
Frequency oftillage(number)
NO 1 2 3 4 Other1.0 1.2 1.4 1.7 2.0
Tillage depth(cm)
NO <20 20-30 30-40 >40 Other1.0 1.1 1.3 1.7 2.0
Tillagedirecti
on
Down-slope
Up-slope
Parallel toContour up-slope furrow
Parallel toContour down-slope furrow
Down-slopeObliqu
e
Up-slopeOblique
Other(No
tillage)
2.0 1.4 1.2 1.5 1.8 1.3 1.0
Mechanization index
Low(<Local
mean - St.Dev.)
Moderate (>Localmean - St. Dev. <
local mean)
High (> LocalMean < Local
Mean + St. Dev.)
Very high (>Local Mean + St.
Dev.)
1.0 1.3 1.7 2.0
HUSBANDRYGrazingcontrol
NO SustainableNumber
of animal
Fencing Avoidance of soilcompaction (very
wet soil)
FireProtecti
on
Other
2.0 1.0 1.2 1.4 1.3
Grazingintensity
Low (SR<GC) Moderate SR=GC to1.5GC)
High (SR>1.5GC) Other
1.0 1.5 2.0
LAND MANAGEMENT
14
Fire protection(Protected/total
area %)
NO Low<25%
Moderate 25-50%
High 50-75%
Very high>75%
Other
2.0 1.8 1.6 1.3 1.0
Sustainable farming
NoSustainableFarming
Notillage
MinimumTillage
Inducing
Plantcover
Up-slopetillage
Minimumploughingdepth
Other
2.0 1.0 1.3 1.1 1.4 1.5
Reclamationof affected
areas
NO Adequate
drainage
Adequatesalt
leaching
Adequateliming ofacid soils
Low heavymetal
concentr.
Other
2.0 1.0 1.0 1.0 1.0
Reclamation ofmining
areas(areaprotected/total
area, %)
NO Low, <25%protected
Moderate,25-75%
protected
Adequate, >75%protected
Other
2.0 1.7 1.3 1.0
Soil erosioncontrol measures
(areaprotected/total
area, %)
NO Low, <25%protected
Moderate, 25-75% protected
Adequate,>75%
protected
Other
2.0 1.7 1.4 1.0
Soil waterconservationmeasures
Weedcontrol
Mulching
temporarystorageof waterrunoff
inducingvapour
adsorption
Νο other
1.0 1.0 1.0 1.2 2.0
Terracing (presenceof) (area
protected/total area,%)
NO Low,<25%
Moderate, 25-50%
High, 50-75%
Veryhigh,>75%
Other
2.0 1.7 1.5 1.2 1.0
LAND USELand abandonment(ha/10 years/10
km2
Low (<10ha)
Moderate (10 -25 ha)
High (26 - 50ha)
Very high (>50ha)
1.0 1.3 1.6 2.0
Land useintensity
Low medium High Other1.0 1.5 2.0
15
(Period) ofexisting land
use
<1year
1-5years
5-10years
10-20years
30-50years
>50 years
2.0 1.8 1.6 1.4 1.2 1.0
Urban area (%)(urban/total
area)
<2 2-5 5-10 10-20 >201.0 1.2 1.5 1.7 2.0
Rate of changeof urban area(ha/10 years/10
km2)
Very low(<5 ha)
Low (5-10 ha)
Moderate (10-20 ha)
High (>20ha)
Other
1.0 1.3 1.6 2.0
Distancefrom
seashore((km)
<0.25
0.25-0.5
0.5-1
1-2 2-5 5-8 8-15 >15
2.0 1.9 1.7 1.5 1.3 1.2 1.1 1.0
WATER USEIrrigation
percentage ofarable land
<5 5-10 10-25 25-50 >502.0 1.8 1.6 1.3 1.0
Runoff waterstorage
No low moderate adequate Other2.0 1.8 1.4 1.0
Waterconsumption persector (% per
year)
Industry Tourism domestic irrigation
Other
2.0 1.6 1.8 1.0
Water scarcity(Water available supply percapita / water consumptionper capita during the last10 years) (WAC/WCC = R)
No R>2 LowR=1.5-
2
ModerateR=1-1.5
HighR=0.5-1
Very highR<0.5
1.0 1.2 1.4 1.7 2.0
TOURISMTourism intensity
(Number ofovernight stays /10 km2 area = R)
Low R<0.01 ModerateR=0.01-0.04
HighR=0.04-0.08
Very high R>0.08
1.0 1.3 1.7 2.0
Tourism change(Number of overnight stays in a
specific destination over one year /average overnight stays in the last
10 years=R, %)
Low R<2 ModerateR=2-5
High R=5-10
Very highR>10
1.0 1.3 1.7 2.0
SOCIAL
16
Human povertyindex (%)
Low, HPI-2<10
Moderate, HPI-2=10-20
High, HPI-2=20-50
Very high, HPI-2=R>50
1.0 1.3 1.7 2.0
Old age index(population withage >65 / total
population = R, %)
Low R<5 Moderate R=5-10
High R=10-20
Very high R>20
1.0 1.3 1.7 2.0
Population density(people / km2)
Low <50 Moderate 50-100
High 100-300
Very high >300
1.0 1.3 1.7 2.0
Population growthrate (% per year)
Low <0.2 Moderate 0.2-0.4
High 0.4-0.6
Very high >0.6
1.0 1.3 1.7 2.0
Populationdistribution (urbanpopulation / ruralpopulation, %)
>20 10-20 5-10 <51.0 1.3 1.7 2.0
INSTITUTIONALSubsidies NO Sub/environ.
Protectionsub/area sub/animal sub/kg Other
1.2 1.0 2.0 2.0 2.0
Protected
areas
NO NatureReserves/Wilde
rness
National Park
NationalMonument
Habitat/Species
Management
Protected
Landscap
ManagedResourc
e
1.5 1.0 1.0 1.0 1.3 1.2 1.0
Policyenforcem
ent
Adequate>75% of the area
Moderate(25-75% of the
area)
Low(<25% of the
area )
No Other
1.0 1.4 1.7 2.0
3. Data collection and analysis
After defining the list of indicators (Tables 1 and 2),questionnaires have been prepared including all theindicators corresponding to the identified process orcauses important for each study field site. Furthermore,a manual for “Describing Land Degradation Indicators” hasbeen prepared and distributed to all study sites to beused for conducting field survey collecting the data for
17
the identified indicators (http://www.desire-project.eu).In order to have more accurate and uniform data basis onthe studied indicators, an event was organized in theEskisehir Plain study site, including representativesfrom all study sites, in which a presentation was carriedout on how to fill the defined questionnaires.
Data for the various indicators to be used forassessing desertification risk and land managementpractices for combating desertification have beencollected in 1672 field sites Data related to soilerosion were subdivided based on the major land use typenamely agriculture, pastures, and forests (Table 3). Thisdivision has been made for a more suitable use of certainindicators such as tillage operations, tillage direction,which are very important for agricultural areas, but notfor forested-areas, while the indicators grazingintensity, burned area which are more significant forpastures or forested–areas, but not for agriculturalareas.
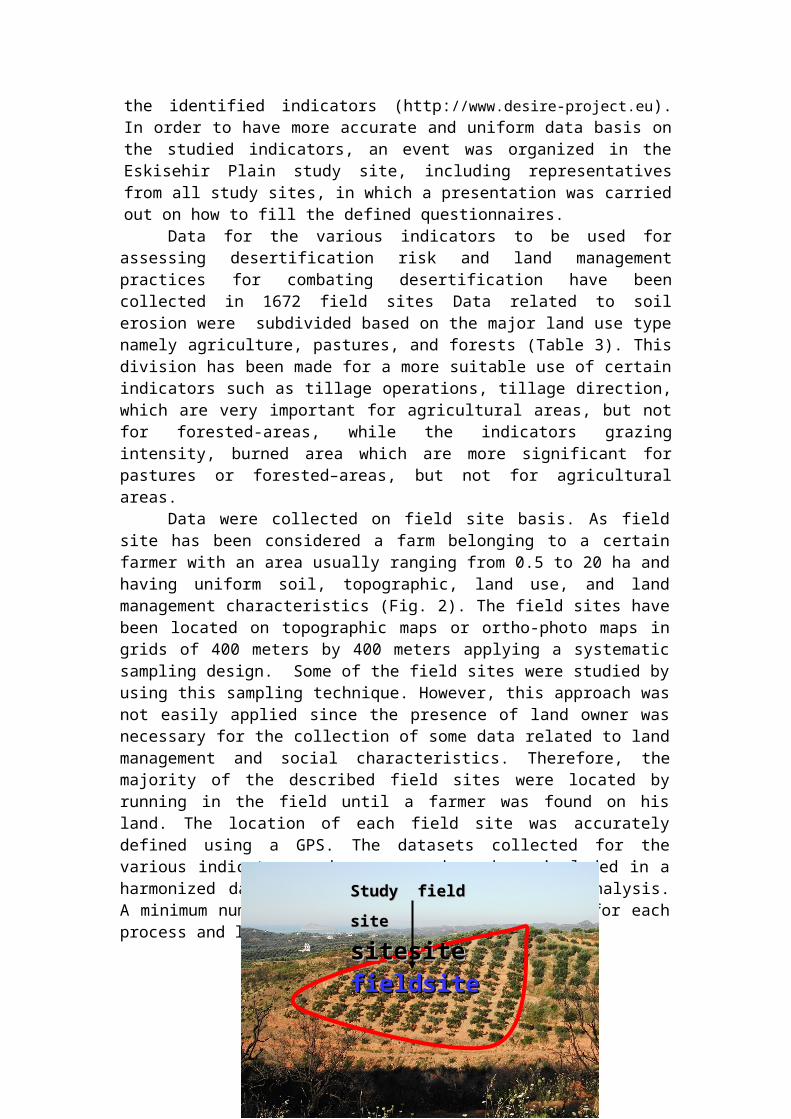
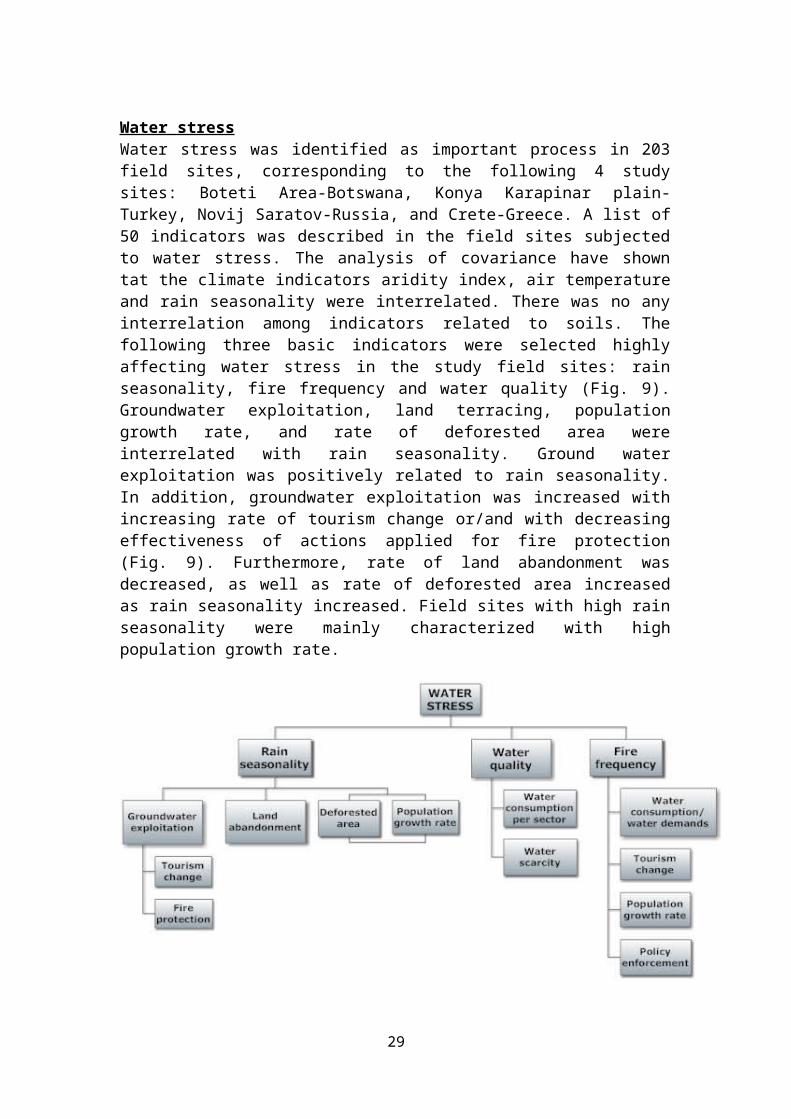
Data were collected on field site basis. As fieldsite has been considered a farm belonging to a certainfarmer with an area usually ranging from 0.5 to 20 ha andhaving uniform soil, topographic, land use, and landmanagement characteristics (Fig. 2). The field sites havebeen located on topographic maps or ortho-photo maps ingrids of 400 meters by 400 meters applying a systematicsampling design. Some of the field sites were studied byusing this sampling technique. However, this approach wasnot easily applied since the presence of land owner wasnecessary for the collection of some data related to landmanagement and social characteristics. Therefore, themajority of the described field sites were located byrunning in the field until a farmer was found on hisland. The location of each field site was accuratelydefined using a GPS. The datasets collected for thevarious indicators and processes have been included in aharmonized database in excel form for further analysis.A minimum number of 30 filed sites were studied for eachprocess and land use.
18
Study field Study field sitesite sitesitesitesite fieldsitefieldsite
Fig. 2. Example of study field site with certain soil,topography, land use, and land management characteristicsbelonging to a certain farmer
The selection of indicators highly affecting landdegradation and desertification was conducted using thecorrelation matrix analysis of variance in which thedegree of soil erosion or the land desertification wascompared with the independent variables of indicators.Important indicators considered for the comparativeanalysis of the study field sites were those withcorrelation coefficients values greater than 0.40.
4. Results and Discussion
The obtained results shows that the main processes andcauses identified in the various field sites were soilerosion (including water, tillage and wind erosion), soilsalinization, water stress, forest fires, and overgrazing(Table 3). Water erosion was identified as the mostimportant process of land degradation and desertificationdescribed in 798 field sites corresponding to thefollowing 9 study sites: Guadalentin Basin Murcia-Spain,Secano Interior-Chile, Boteti Area-Botswana, SantiagoIsland-Cape Verde, Cointzio catchment-Mexico, MamoraSehoul-Morocco, Eskisehir-Turkey, Zeuss Koutine-Tunisia,Novij Saratov-Russia, and Crete-Greece
Table 3. Land degradation processes and causes with thecorresponding land uses and distribution in the study sites
19
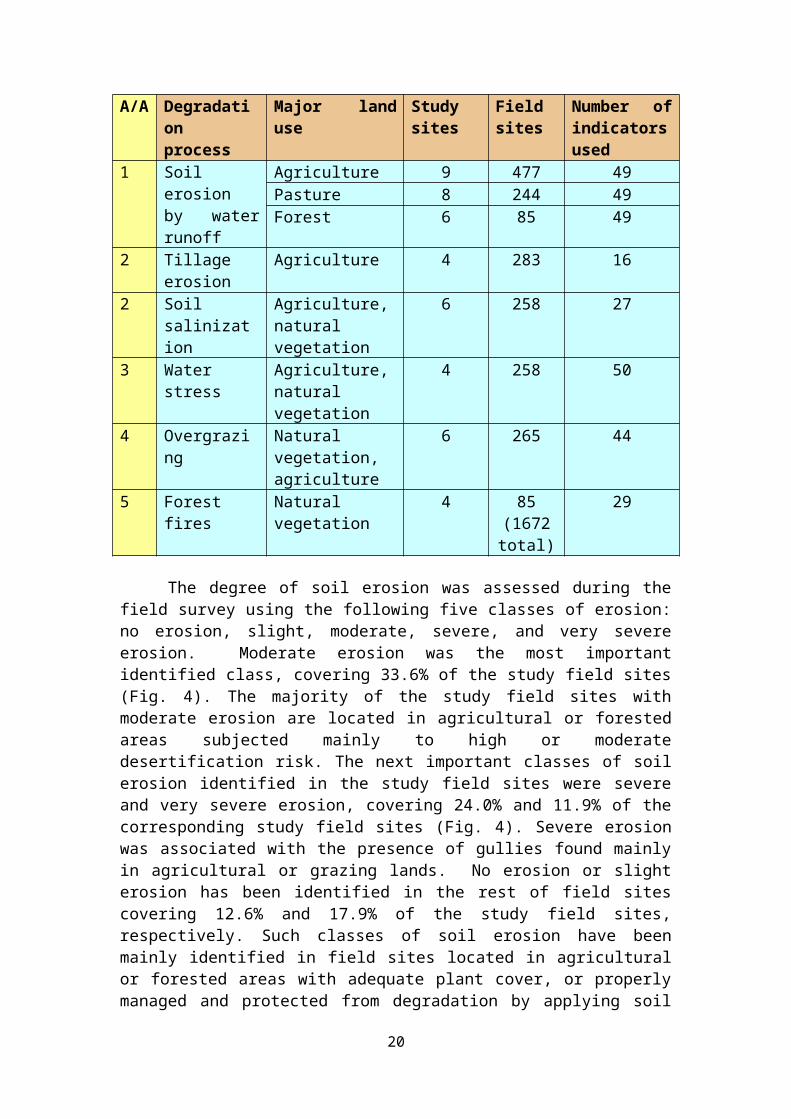
A/A Degradationprocess
Major landuse
Studysites
Fieldsites
Number ofindicatorsused
1 Soilerosionby waterrunoff
Agriculture 9 477 49Pasture 8 244 49Forest 6 85 49
2 Tillageerosion
Agriculture 4 283 16
2 Soilsalinization
Agriculture,naturalvegetation
6 258 27
3 Waterstress
Agriculture,naturalvegetation
4 258 50
4 Overgrazing
Naturalvegetation,agriculture
6 265 44
5 Forestfires
Naturalvegetation
4 85(1672total)
29
The degree of soil erosion was assessed during thefield survey using the following five classes of erosion:no erosion, slight, moderate, severe, and very severeerosion. Moderate erosion was the most importantidentified class, covering 33.6% of the study field sites(Fig. 4). The majority of the study field sites withmoderate erosion are located in agricultural or forestedareas subjected mainly to high or moderatedesertification risk. The next important classes of soilerosion identified in the study field sites were severeand very severe erosion, covering 24.0% and 11.9% of thecorresponding study field sites (Fig. 4). Severe erosionwas associated with the presence of gullies found mainlyin agricultural or grazing lands. No erosion or slighterosion has been identified in the rest of field sitescovering 12.6% and 17.9% of the study field sites,respectively. Such classes of soil erosion have beenmainly identified in field sites located in agriculturalor forested areas with adequate plant cover, or properlymanaged and protected from degradation by applying soil
20
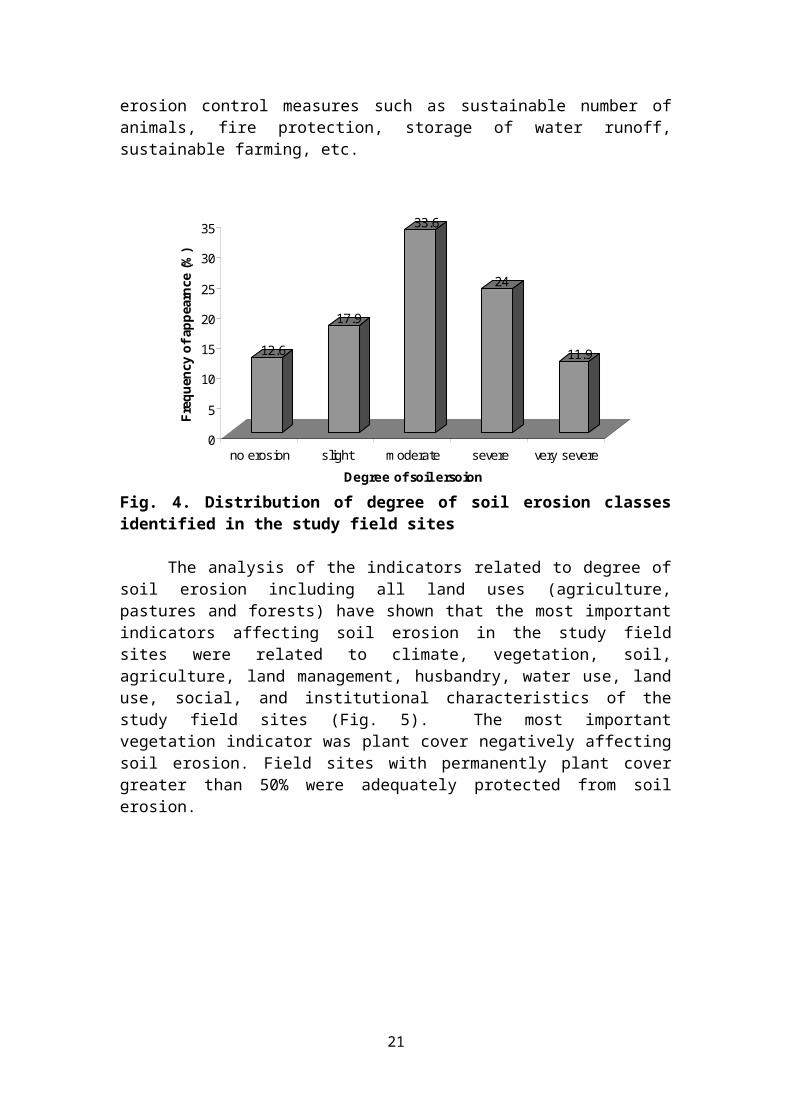
erosion control measures such as sustainable number ofanimals, fire protection, storage of water runoff,sustainable farming, etc.
12.6
17.9
33.6
24
11.9
0
5
10
15
20
25
30
35
Frequency of app
earnce (%
)
no erosion slight m oderate severe very severeDegree of soil ersoion
Fig. 4. Distribution of degree of soil erosion classesidentified in the study field sites
The analysis of the indicators related to degree of
soil erosion including all land uses (agriculture,pastures and forests) have shown that the most importantindicators affecting soil erosion in the study fieldsites were related to climate, vegetation, soil,agriculture, land management, husbandry, water use, landuse, social, and institutional characteristics of thestudy field sites (Fig. 5). The most importantvegetation indicator was plant cover negatively affectingsoil erosion. Field sites with permanently plant covergreater than 50% were adequately protected from soilerosion.
21
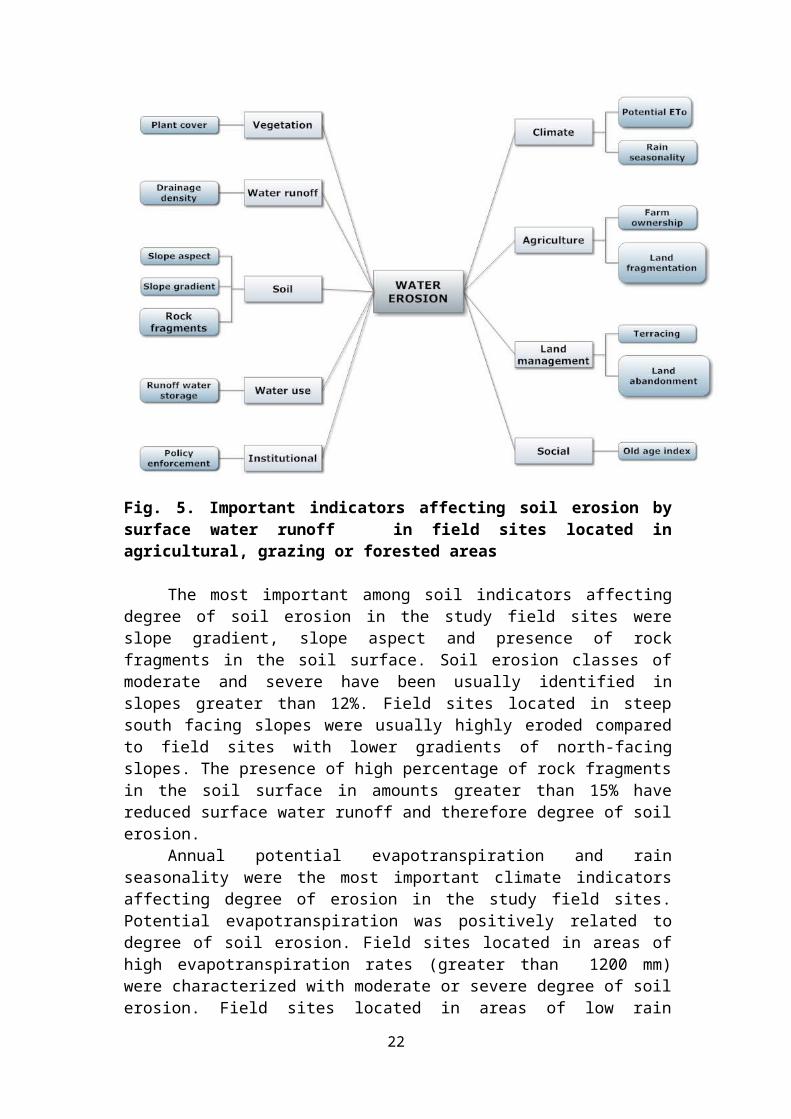
Fig. 5. Important indicators affecting soil erosion bysurface water runoff in field sites located inagricultural, grazing or forested areas
The most important among soil indicators affectingdegree of soil erosion in the study field sites wereslope gradient, slope aspect and presence of rockfragments in the soil surface. Soil erosion classes ofmoderate and severe have been usually identified inslopes greater than 12%. Field sites located in steepsouth facing slopes were usually highly eroded comparedto field sites with lower gradients of north-facingslopes. The presence of high percentage of rock fragmentsin the soil surface in amounts greater than 15% havereduced surface water runoff and therefore degree of soilerosion.
Annual potential evapotranspiration and rainseasonality were the most important climate indicatorsaffecting degree of erosion in the study field sites.Potential evapotranspiration was positively related todegree of soil erosion. Field sites located in areas ofhigh evapotranspiration rates (greater than 1200 mm)were characterized with moderate or severe degree of soilerosion. Field sites located in areas of low rain
22
seasonality (lower than 0.40) have been subjected tohigher soil erosion.
The most important water runoff indicator affectingsoil erosion was drainage density. Drainage density waspositively related to soil erosion. Moderate to severeerosion has been defined in field sites with highdrainage density network. This indicator is interrelatedto the type of surface geological formations with lowinfiltration rates which affects drainage density andsoil characteristics.
As it was expected, actions for soil erosion controlhad a great effect on the degree of erosion identified inthe study field sites. The most important actionidentified by the analysis of the data was runoff waterstorage. Field sites, in which actions for storingsurface water runoff in have been undertaken, had usuallyerosion classes of slight or no erosion. Furthermore,land terracing was positively related to degree of soilerosion. Field sites with high percentage of landterracing had higher soil erosion due to poor designingor managing terraces. Filed sites located in areas withhigh rate of land abandonment (higher than 25 (ha/10years/10 km2) were subjected to higher soil erosion. Thecorrelations estimated for other actions such assustainable farming, soil erosion control measures, etc.were relatively low. Finally, field sites in which theexiting regulations for environmental protection wereapplied, degree of soil erosion were mainly characterizedas moderate to low.
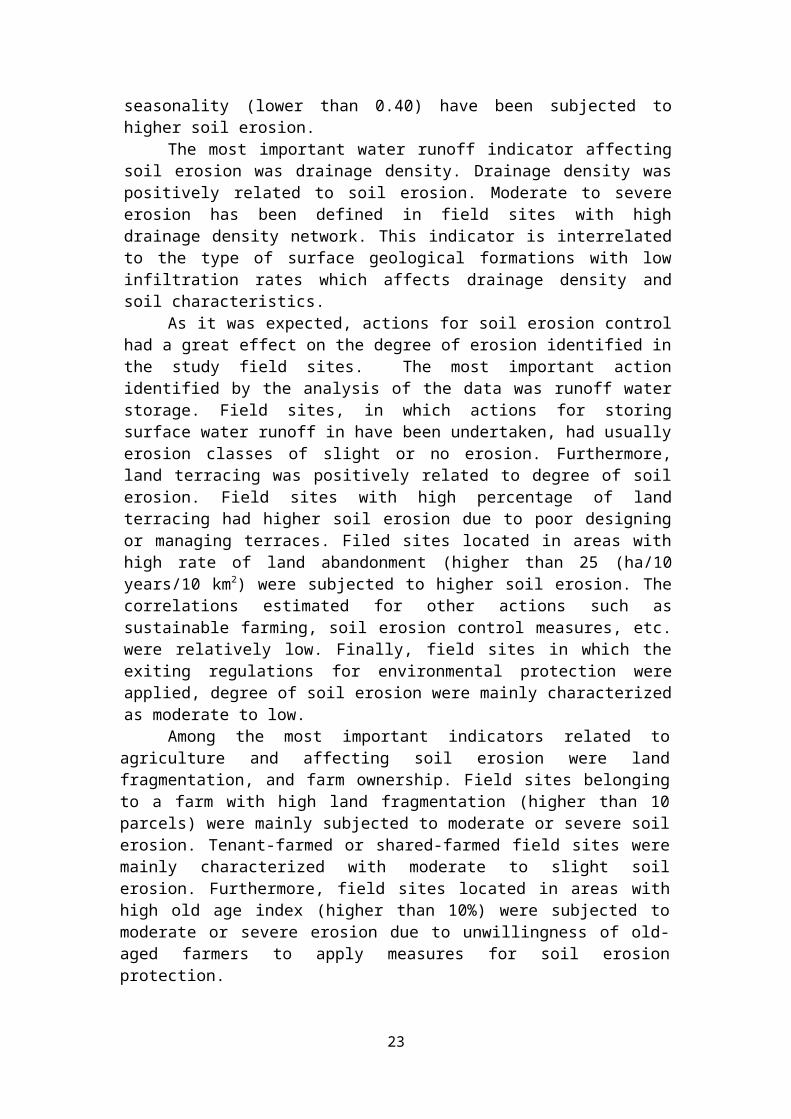
Among the most important indicators related toagriculture and affecting soil erosion were landfragmentation, and farm ownership. Field sites belongingto a farm with high land fragmentation (higher than 10parcels) were mainly subjected to moderate or severe soilerosion. Tenant-farmed or shared-farmed field sites weremainly characterized with moderate to slight soilerosion. Furthermore, field sites located in areas withhigh old age index (higher than 10%) were subjected tomoderate or severe erosion due to unwillingness of old-aged farmers to apply measures for soil erosionprotection.
23
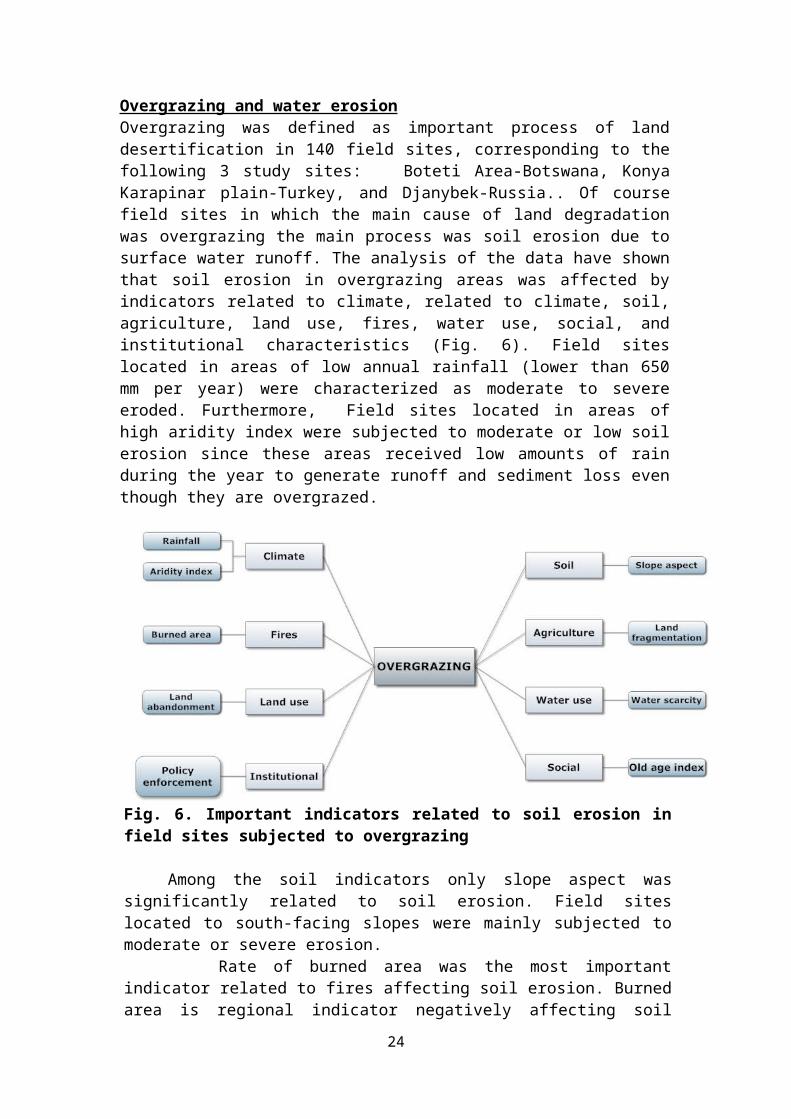
Overgrazing and water erosionOvergrazing was defined as important process of landdesertification in 140 field sites, corresponding to thefollowing 3 study sites: Boteti Area-Botswana, KonyaKarapinar plain-Turkey, and Djanybek-Russia.. Of coursefield sites in which the main cause of land degradationwas overgrazing the main process was soil erosion due tosurface water runoff. The analysis of the data have shownthat soil erosion in overgrazing areas was affected byindicators related to climate, related to climate, soil,agriculture, land use, fires, water use, social, andinstitutional characteristics (Fig. 6). Field siteslocated in areas of low annual rainfall (lower than 650mm per year) were characterized as moderate to severeeroded. Furthermore, Field sites located in areas ofhigh aridity index were subjected to moderate or low soilerosion since these areas received low amounts of rainduring the year to generate runoff and sediment loss eventhough they are overgrazed.
Fig. 6. Important indicators related to soil erosion infield sites subjected to overgrazing
Among the soil indicators only slope aspect wassignificantly related to soil erosion. Field siteslocated to south-facing slopes were mainly subjected tomoderate or severe erosion.
Rate of burned area was the most importantindicator related to fires affecting soil erosion. Burnedarea is regional indicator negatively affecting soil
24
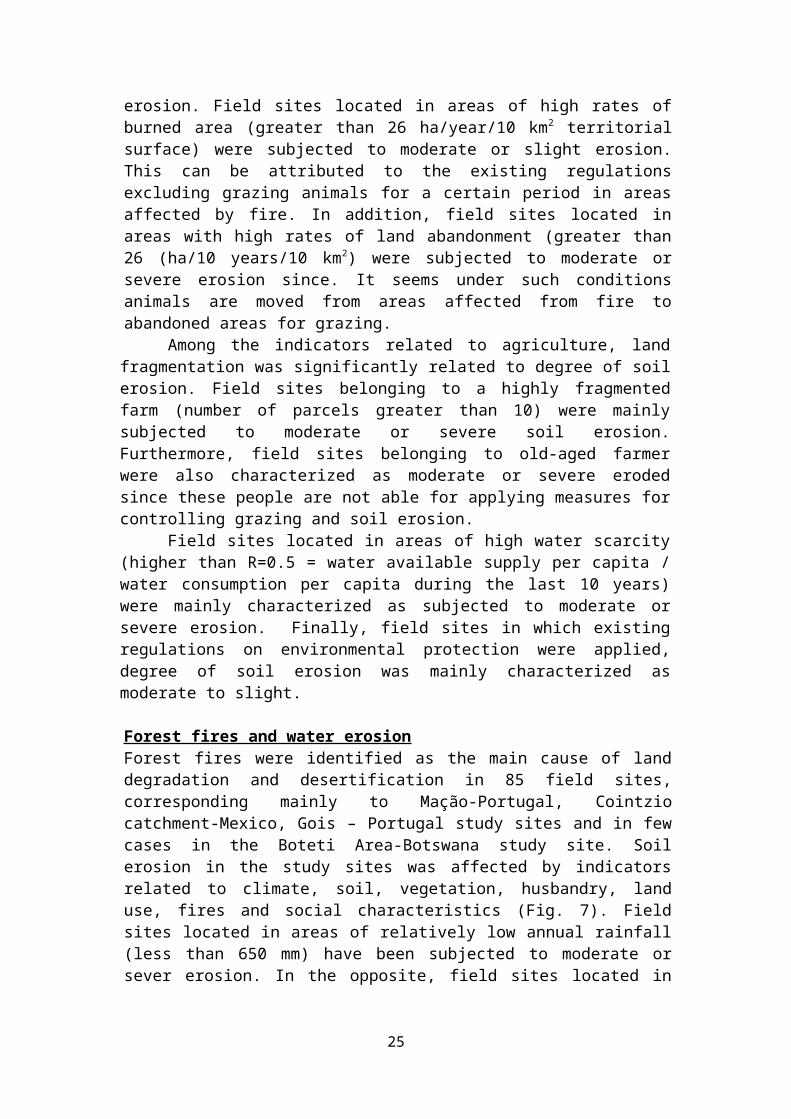
erosion. Field sites located in areas of high rates ofburned area (greater than 26 ha/year/10 km2 territorialsurface) were subjected to moderate or slight erosion.This can be attributed to the existing regulationsexcluding grazing animals for a certain period in areasaffected by fire. In addition, field sites located inareas with high rates of land abandonment (greater than26 (ha/10 years/10 km2) were subjected to moderate orsevere erosion since. It seems under such conditionsanimals are moved from areas affected from fire toabandoned areas for grazing.
Among the indicators related to agriculture, landfragmentation was significantly related to degree of soilerosion. Field sites belonging to a highly fragmentedfarm (number of parcels greater than 10) were mainlysubjected to moderate or severe soil erosion.Furthermore, field sites belonging to old-aged farmerwere also characterized as moderate or severe erodedsince these people are not able for applying measures forcontrolling grazing and soil erosion.
Field sites located in areas of high water scarcity(higher than R=0.5 = water available supply per capita /water consumption per capita during the last 10 years)were mainly characterized as subjected to moderate orsevere erosion. Finally, field sites in which existingregulations on environmental protection were applied,degree of soil erosion was mainly characterized asmoderate to slight.
Forest fires and water erosionForest fires were identified as the main cause of landdegradation and desertification in 85 field sites,corresponding mainly to Mação-Portugal, Cointziocatchment-Mexico, Gois – Portugal study sites and in fewcases in the Boteti Area-Botswana study site. Soilerosion in the study sites was affected by indicatorsrelated to climate, soil, vegetation, husbandry, landuse, fires and social characteristics (Fig. 7). Fieldsites located in areas of relatively low annual rainfall(less than 650 mm) have been subjected to moderate orsever erosion. In the opposite, field sites located in
25
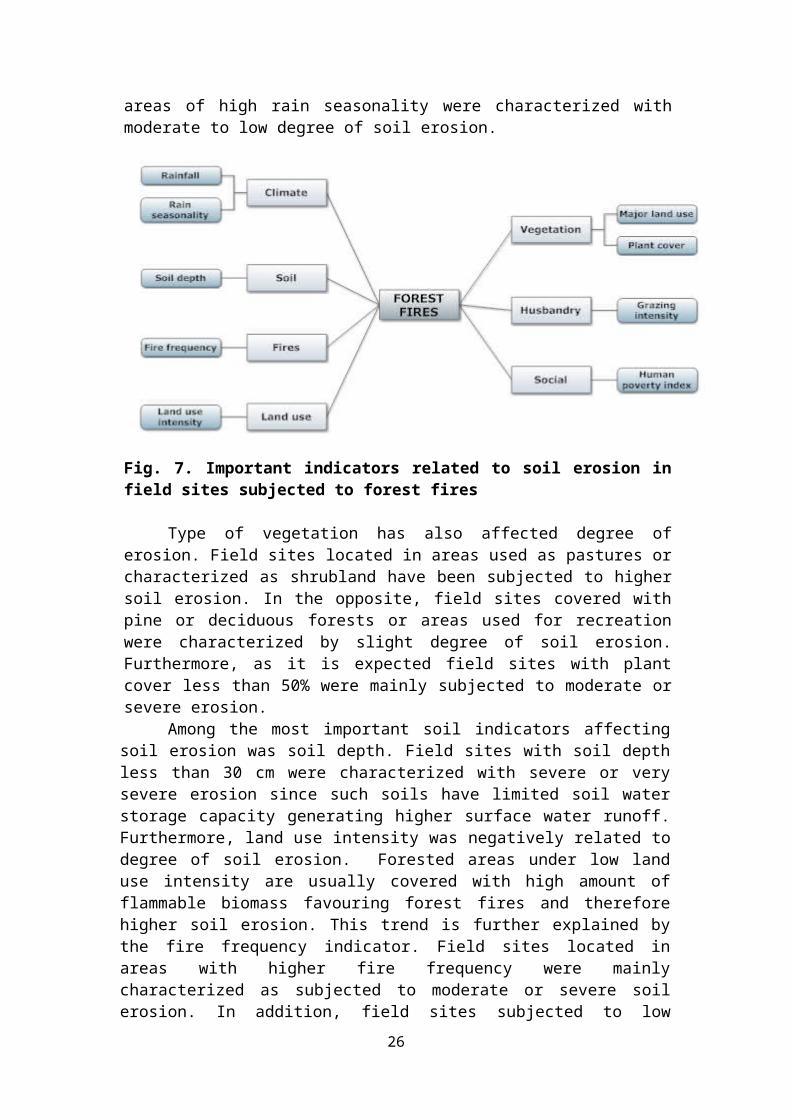
areas of high rain seasonality were characterized withmoderate to low degree of soil erosion.
Fig. 7. Important indicators related to soil erosion infield sites subjected to forest fires
Type of vegetation has also affected degree oferosion. Field sites located in areas used as pastures orcharacterized as shrubland have been subjected to highersoil erosion. In the opposite, field sites covered withpine or deciduous forests or areas used for recreationwere characterized by slight degree of soil erosion.Furthermore, as it is expected field sites with plantcover less than 50% were mainly subjected to moderate orsevere erosion.
Among the most important soil indicators affectingsoil erosion was soil depth. Field sites with soil depthless than 30 cm were characterized with severe or verysevere erosion since such soils have limited soil waterstorage capacity generating higher surface water runoff.Furthermore, land use intensity was negatively related todegree of soil erosion. Forested areas under low landuse intensity are usually covered with high amount offlammable biomass favouring forest fires and thereforehigher soil erosion. This trend is further explained bythe fire frequency indicator. Field sites located inareas with higher fire frequency were mainlycharacterized as subjected to moderate or severe soilerosion. In addition, field sites subjected to low
26
grazing intensity (sustainable rate lower than grazingcapacity) were mainly characterized by moderate to severesoil erosion.
Among the social indicators, human poverty index wasmore significantly related to degree of soil erosion.Field sites located in areas with high poverty index weresubjected to moderate or slight soil erosion.
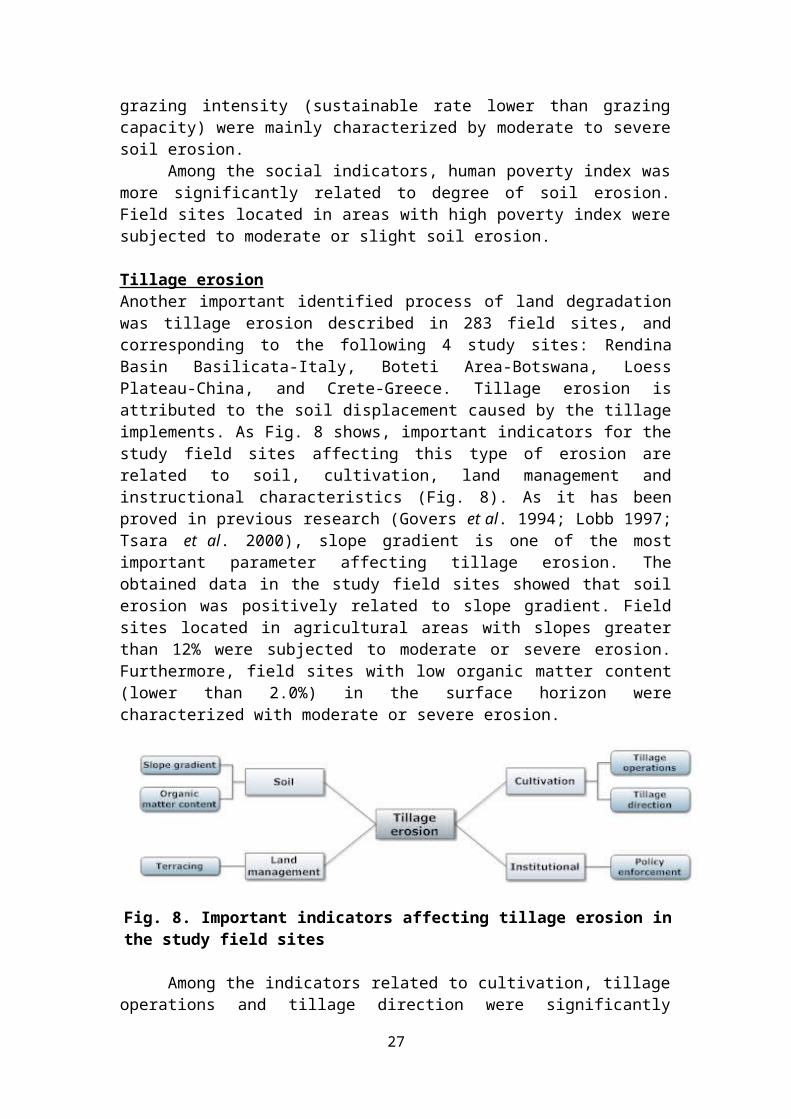
Tillage erosionAnother important identified process of land degradationwas tillage erosion described in 283 field sites, andcorresponding to the following 4 study sites: RendinaBasin Basilicata-Italy, Boteti Area-Botswana, LoessPlateau-China, and Crete-Greece. Tillage erosion isattributed to the soil displacement caused by the tillageimplements. As Fig. 8 shows, important indicators for thestudy field sites affecting this type of erosion arerelated to soil, cultivation, land management andinstructional characteristics (Fig. 8). As it has beenproved in previous research (Govers et al. 1994; Lobb 1997;Tsara et al. 2000), slope gradient is one of the mostimportant parameter affecting tillage erosion. Theobtained data in the study field sites showed that soilerosion was positively related to slope gradient. Fieldsites located in agricultural areas with slopes greaterthan 12% were subjected to moderate or severe erosion.Furthermore, field sites with low organic matter content(lower than 2.0%) in the surface horizon werecharacterized with moderate or severe erosion.
Fig. 8. Important indicators affecting tillage erosion inthe study field sites
Among the indicators related to cultivation, tillageoperations and tillage direction were significantly
27
affecting soil erosion. Field sites subjected toploughing, disking or harrowing were mainly subjected tomoderate or severe erosion. Furthermore, field siteswhere cultivation was conducted in the down slope oroblique direction were mainly characterized by moderateto severe erosion. In addition, land terracing wasnegatively related to soil erosion. Field sites with highpercentage of terraces (greater 50%) were subjected toslight degree of erosion since in such cases land isusually not cultivated or cultivation is carried outalong the contour lines. Finally, agricultural areas inwhich some measures of soil protection were applied soilerosion were significantly reduced.
Soil salinization Soil salinization was another important degradationprocess identified in 258 field sites, corresponding tothe following 6 study sites: Nestos Basin Maggana-Greece,Boteti Area-Botswana, and Konya Karapinar plain-Turkey,Novij Saratov-Russia, Djanybek-Russia, and Crete-Greece.Important indicator affecting soil electricalconductivity of the study sites were only water qualityand groundwater exploitation. Field sites located inareas of low quality of groundwater overexploited werecharacterized with electrical conductivity (grater thanor 4 dS m-1.
The analysis of covariance among indicators relatedto soil salinization (correlation coefficient greaterthan 0.75) have shown the following interrelated pairs ofindicators: (a) air temperature-irrigation percentage ofarable land, (b) aridity index - tourism intensity, (c)farm ownership - irrigation percentage of arable land,(d) distance from seashore - irrigation percentage ofarable land, and (e) aquifer over-exploitation -irrigation percentage of arable land. Irrigationpercentage of arable land increased with: (a) increasingannual air temperature, (b) increasing rate ofexploitation of ground water, and (c) decreasing distancefrom the seashore. Furthermore, owner-farmed land wasmore frequent irrigated than tenant-farmed ones. Finallytourism intensity which affects water consumption washigher in areas characterized by high aridity index.
28
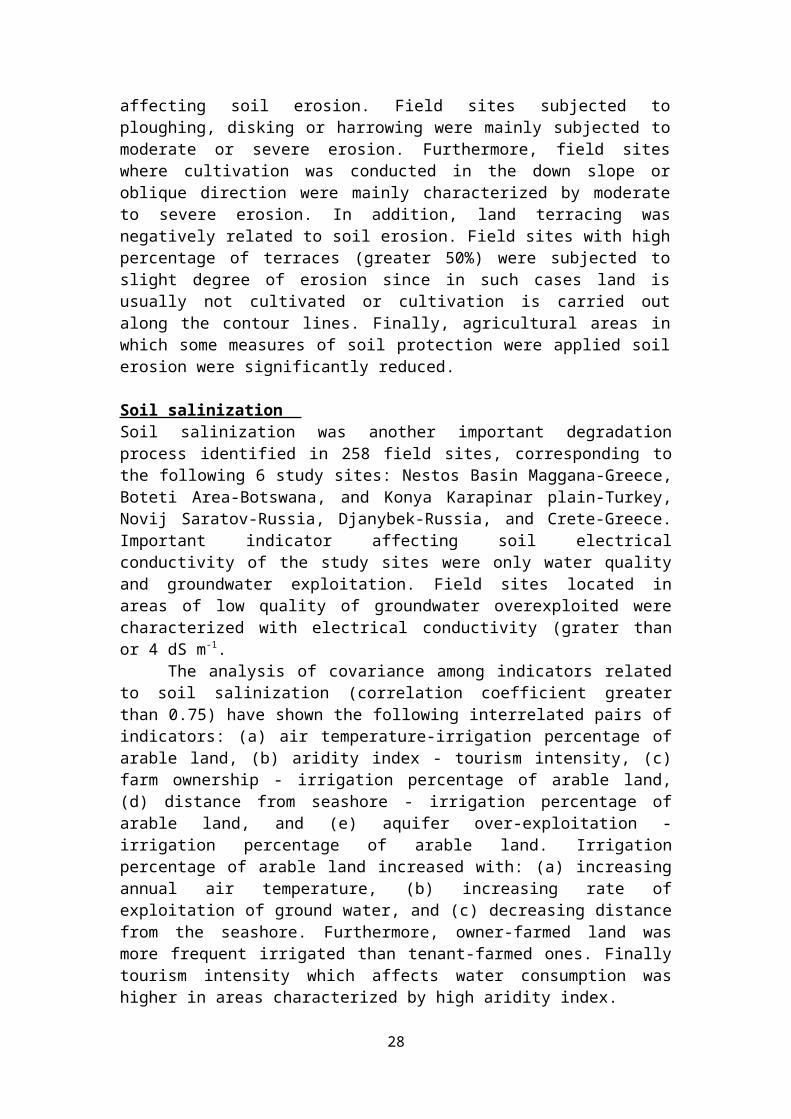
Water stressWater stress was identified as important process in 203field sites, corresponding to the following 4 studysites: Boteti Area-Botswana, Konya Karapinar plain-Turkey, Novij Saratov-Russia, and Crete-Greece. A list of50 indicators was described in the field sites subjectedto water stress. The analysis of covariance have showntat the climate indicators aridity index, air temperatureand rain seasonality were interrelated. There was no anyinterrelation among indicators related to soils. Thefollowing three basic indicators were selected highlyaffecting water stress in the study field sites: rainseasonality, fire frequency and water quality (Fig. 9).Groundwater exploitation, land terracing, populationgrowth rate, and rate of deforested area wereinterrelated with rain seasonality. Ground waterexploitation was positively related to rain seasonality.In addition, groundwater exploitation was increased withincreasing rate of tourism change or/and with decreasingeffectiveness of actions applied for fire protection(Fig. 9). Furthermore, rate of land abandonment wasdecreased, as well as rate of deforested area increasedas rain seasonality increased. Field sites with high rainseasonality were mainly characterized with highpopulation growth rate.
29
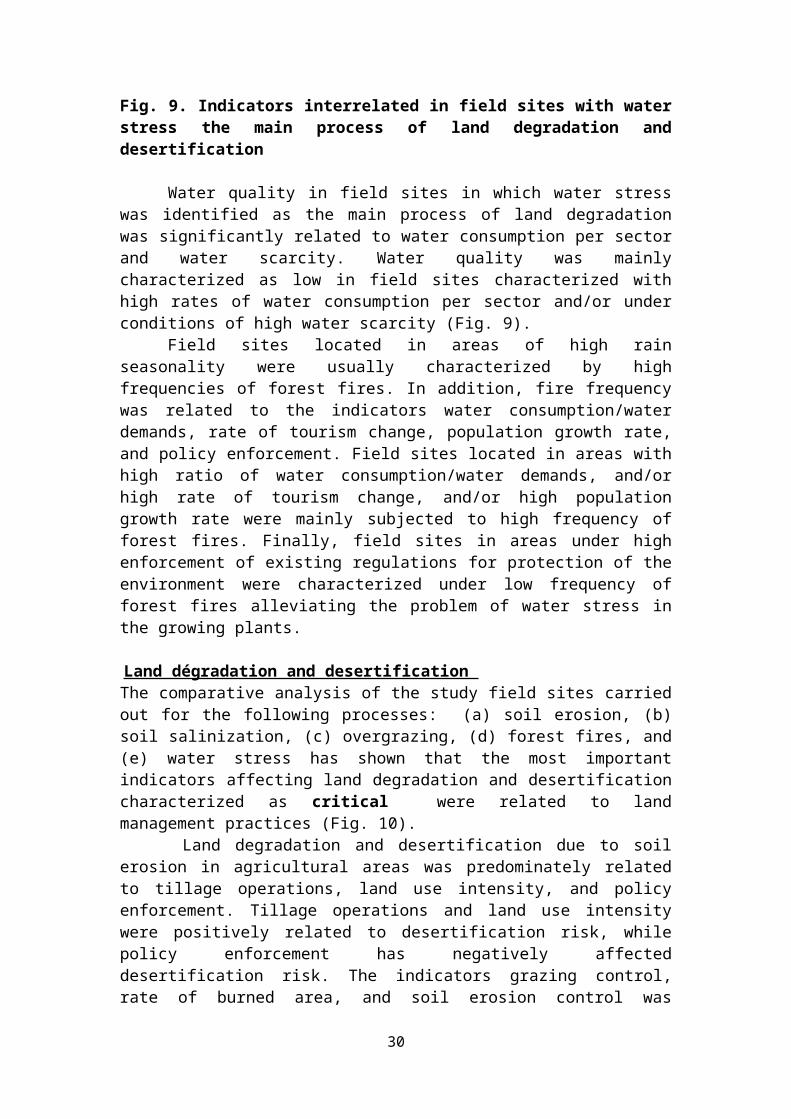
Fig. 9. Indicators interrelated in field sites with waterstress the main process of land degradation anddesertification
Water quality in field sites in which water stresswas identified as the main process of land degradationwas significantly related to water consumption per sectorand water scarcity. Water quality was mainlycharacterized as low in field sites characterized withhigh rates of water consumption per sector and/or underconditions of high water scarcity (Fig. 9).
Field sites located in areas of high rainseasonality were usually characterized by highfrequencies of forest fires. In addition, fire frequencywas related to the indicators water consumption/waterdemands, rate of tourism change, population growth rate,and policy enforcement. Field sites located in areas withhigh ratio of water consumption/water demands, and/orhigh rate of tourism change, and/or high populationgrowth rate were mainly subjected to high frequency offorest fires. Finally, field sites in areas under highenforcement of existing regulations for protection of theenvironment were characterized under low frequency offorest fires alleviating the problem of water stress inthe growing plants.
Land dégradation and desertification The comparative analysis of the study field sites carriedout for the following processes: (a) soil erosion, (b)soil salinization, (c) overgrazing, (d) forest fires, and(e) water stress has shown that the most importantindicators affecting land degradation and desertificationcharacterized as critical were related to landmanagement practices (Fig. 10).
Land degradation and desertification due to soilerosion in agricultural areas was predominately relatedto tillage operations, land use intensity, and policyenforcement. Tillage operations and land use intensitywere positively related to desertification risk, whilepolicy enforcement has negatively affecteddesertification risk. The indicators grazing control,rate of burned area, and soil erosion control was
30
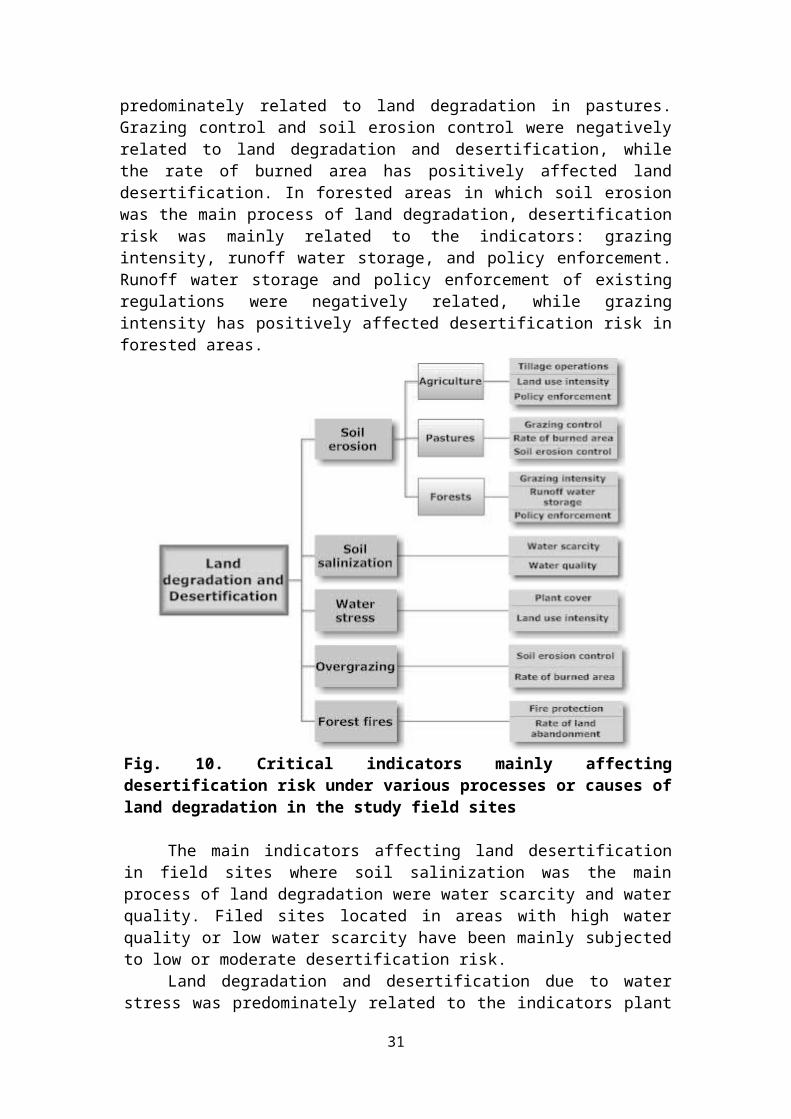
predominately related to land degradation in pastures.Grazing control and soil erosion control were negativelyrelated to land degradation and desertification, whilethe rate of burned area has positively affected landdesertification. In forested areas in which soil erosionwas the main process of land degradation, desertificationrisk was mainly related to the indicators: grazingintensity, runoff water storage, and policy enforcement.Runoff water storage and policy enforcement of existingregulations were negatively related, while grazingintensity has positively affected desertification risk inforested areas.
Fig. 10. Critical indicators mainly affectingdesertification risk under various processes or causes ofland degradation in the study field sites
The main indicators affecting land desertificationin field sites where soil salinization was the mainprocess of land degradation were water scarcity and waterquality. Filed sites located in areas with high waterquality or low water scarcity have been mainly subjectedto low or moderate desertification risk.
Land degradation and desertification due to waterstress was predominately related to the indicators plant
31
cover and land use intensity. Field sites subjected tohigh land use intensity or having low permanent plantcover have been mainly characterized by moderate to highdesertification risk.
Land degradation and desertification due toovergrazing has predominately related to the indicatorssoil erosion control, and rate of burned area. Fieldsites located in areas subjected to high rates of burnedarea or without any action for soil erosion control havebeen mainly characterized with moderate or highdesertification risk. On the contrary, field sites inwhich adequate measures of soil erosion control have beenapplied; desertification risk was mainly characterized aslow.
The indicators fire protection and rate of landabandonment have been mainly related to desertificationin areas where forest fires has been defined as the maincause of land degradation. Field sites located in areasin which adequate measures have been undertaken for fireprotection have been subjected to low desertificationrisk. On the contrary, field sites located in areas withlow rates of land abandonment were predominatelycharacterized with low to moderate desertification risk.
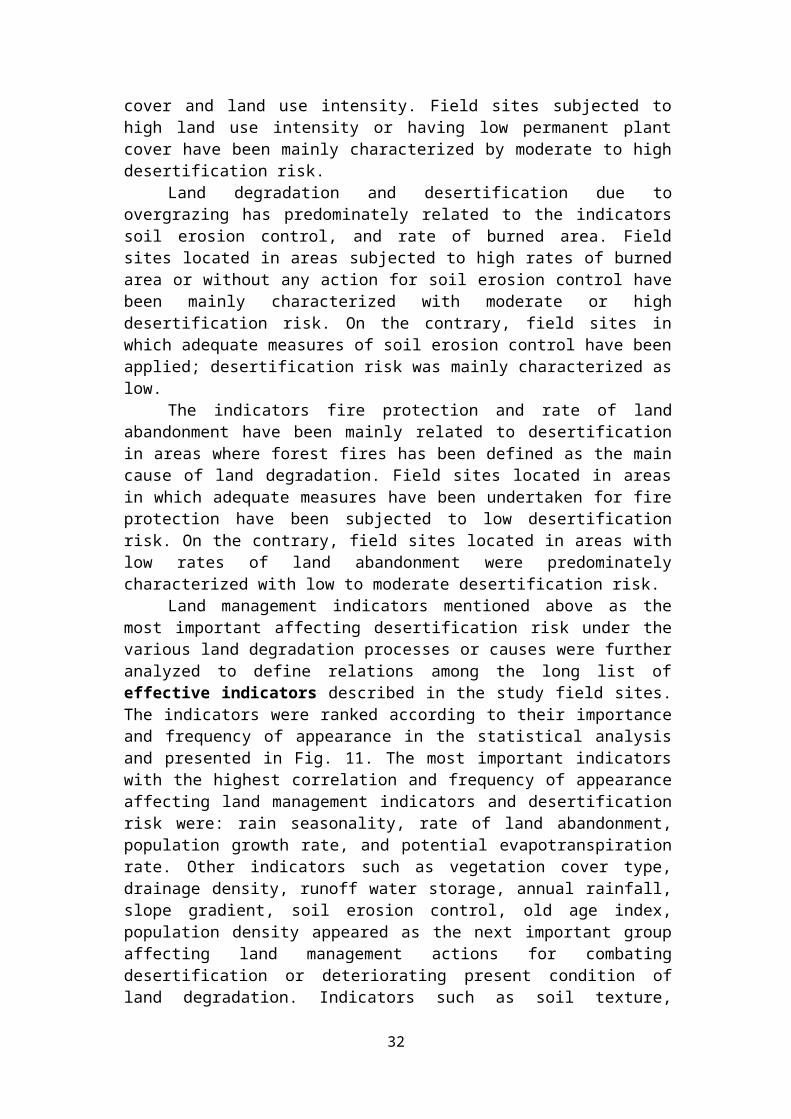
Land management indicators mentioned above as themost important affecting desertification risk under thevarious land degradation processes or causes were furtheranalyzed to define relations among the long list ofeffective indicators described in the study field sites.The indicators were ranked according to their importanceand frequency of appearance in the statistical analysisand presented in Fig. 11. The most important indicatorswith the highest correlation and frequency of appearanceaffecting land management indicators and desertificationrisk were: rain seasonality, rate of land abandonment,population growth rate, and potential evapotranspirationrate. Other indicators such as vegetation cover type,drainage density, runoff water storage, annual rainfall,slope gradient, soil erosion control, old age index,population density appeared as the next important groupaffecting land management actions for combatingdesertification or deteriorating present condition ofland degradation. Indicators such as soil texture,
32
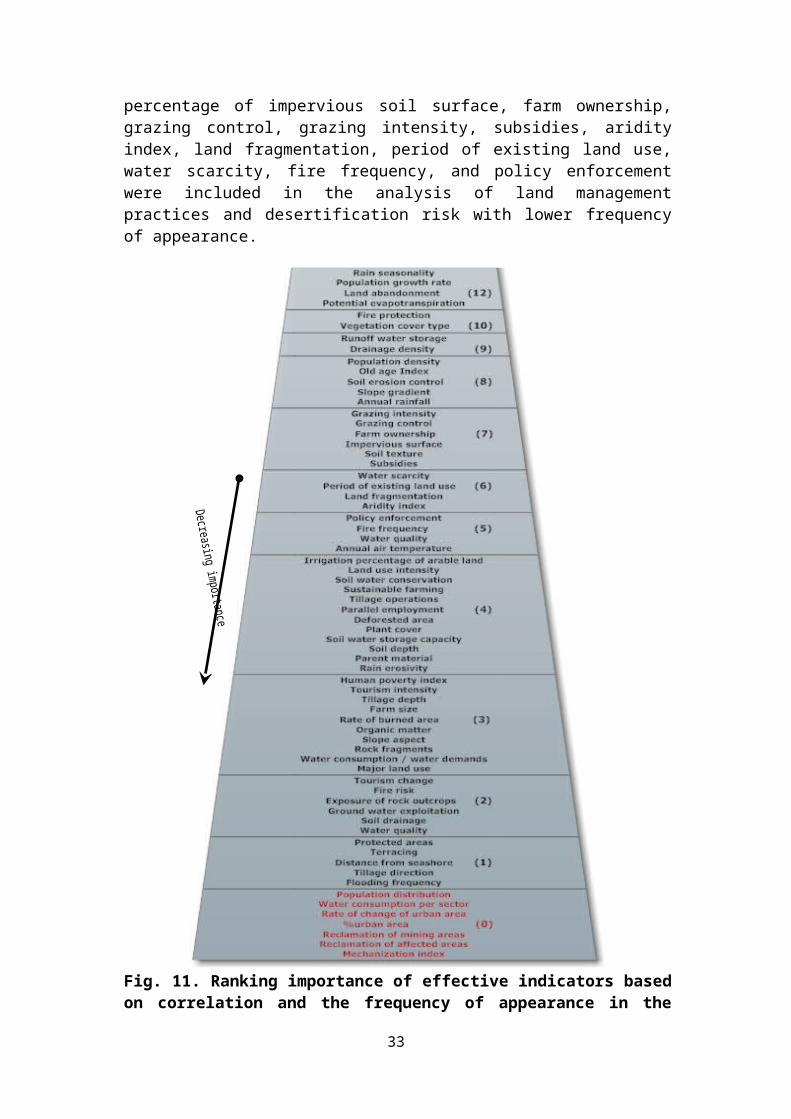
percentage of impervious soil surface, farm ownership,grazing control, grazing intensity, subsidies, aridityindex, land fragmentation, period of existing land use,water scarcity, fire frequency, and policy enforcementwere included in the analysis of land managementpractices and desertification risk with lower frequencyof appearance.
Fig. 11. Ranking importance of effective indicators basedon correlation and the frequency of appearance in the
33
comparative analysis of the study field sites (numbers inparenthesis corresponds to frequency of appearance in theanalysis)
Some indicators such as rain erosivity, parentmaterial, soil depth, soil water storage capacity, rateof deforested area, parallel employment, sustainablefarming, irrigation percentage of arable land, major landuse, water consumption/water demands, rock fragments,slope aspect, organic matter on the soil surface, farmsize, tillage depth, tourism intensity, soil drainage,water quantity, ground water exploitation, exposure ofrock outcrops, fire risk, tourism change, etc., appearedin the analysis less frequently but are very importantfor some processes or causes of desertification such assoil salinization, water stress, overgrazing, and forestfires. There were also indicators such as mechanizationindex, reclamation of affected areas, reclamation ofmining areas, % urban area, rate of change of urban area,water consumption per sector, and population distributionthat were not included in any analysis of desertificationrisk.
Some indicators such as policy enforcement,population growth rate, old age index there weredescribed as subjected to cause-effect relationships. Insome cases cause and effect are reserved, and that inother cases there might be a correlation, but not acause-effect relationship at all. This is particularlythe case for indicators related to policy enforcement.The central meaning of policy enforcement or betterpolicy followed used in this study is related to theimplementation of existing regulations on environmentalprotection and it is related to land user decision.Policy formulation on environmental protection is relatedto the politicians and can be associated to the livingconditions of the people or to the land managementcharacteristics resulting in unfavourable changes in thephysical environment. In this report policy enforcementis related to the degree of implementation of a specificpolicy formulated for the protection of the environment.
Conclusions
34
The analysis of the existing data collected from thevarious study sites has shown that indicators may bewidely, even globally, used for assessing the variousland management practices on land degradation anddesertification at field level. Of course, someindicators related to agriculture, social andinstitutional characteristics in some cases show trendsthat are opposite to what happens in other study sites.These trends can be explained by further investigationincluding other indicators or processes affectingdesertification risk that it was not possible to considerin this effort. Applied to desertification risk,efficiency and performance indicators seem the mostpromising for further research, particularly combinedwith economic principles. In this regard policymaking maybenefit using the indicators as an aid, a means toachieve more focus responses timely and accurately.However, the great number of indicators may be treatedcautiously, since confusion or “noise” may proliferateleading to the same pre-existing obscurity for theselected policy responses.
The questionnaire of indicators used in this studydid not work appropriate in some field sites for thefollowing indicators: farm ownership (Boteti Area-Botswana, Mação-Portugal), vegetation cover type (Mação-Portugal, Boteti Area-Botswana, Novij Saratov-Russia),land fragmentation (Mamora Sehoul-Morocco), parallelemployment (Mamora Sehoul-Morocco), tillage operations(Mamora Sehoul-Morocco, Santiago Island-Cape Verde),major land use (Konya plain-Turkey, Boteti Area-Botswana,Mação-Portrugal), land use type (Boteti Area-Botswana),and grazing intensity (Mação-Portugal). The indicatorsystem used in DESIRE project can be easily improved byincluding new classes for describing these indicators.
Acknowledgments
This work was carried out as part of the EuropeanCommission, DG Research-Environment Programme, Unit ofManagement of Natural Resources, Integrated Project
35
DESIRE (contract No: 037046). The financial support bythe European Commission is greatly acknowledged.
References
Dumanski, J. and Pieri, C., 1996. Application of thepressure-state-response framework for the land qualityindicators (LQI) programme. Proceedings of the workshoporganized by the FAO Agriculture and SustainableDevelopment Departments, 25-26 January. Rome: FAO.
EEA-European Environmental Agency. Identification ofindicators for a Transport and Environment ReportingSystem. Final Report, 1998
EEA Technical report “EEA core set of indicators,Guide/No1/2005
OECD environmental indicators, development, measurementand use, Reference Paper, 2003
ETDS- Environmental Terminology and Discovery Service(Information-base). European Environment Agency.http://glossary.eea.europa.eu/EEAGlossary/search_html.Retrieved 2010-06-17.
Hammond, Allen, Albert Adriaanse, Eric Rodenburg, DirkBryant, and Richard Woodward. 1995. EnvironmentalIndicators. World Resources Institute, Washington,D.C. 49 p.
Kosmas, C., Kirkby, M. and Geeson, N. 1999. Manual on:Key indicators of desertification and mappingenvironmentally sensitive areas to desertification.European Commission, Energy, Environment andSustainable Development, EUR 18882, 87 p.
O’ Connor, J.C., 1994. Environmental performancemonitoring indicators. In: Monitoring Progress onSustainable Development, A user-oriented workshop.Washington D.C.: World Bank.
Pieri, C., Dumanski, J., Hamblin, A., Young, A., 1995.Land quality indicators. Washington D.C.: World Bank.
SCOPE, 1995. Environmental indicators: a systematicapproach to measuring and reporting on the environmentin the context of sustainable development. In: Gouzee,N., Mazija, B., Bharz, S.B.(eds), Indicators ofsustainable development for decision-making. Brussels:Federal Planning Office.
36
Steel, R., Torrie, J., and Dickey D. 1997. Principles andprocedures of statistics: A biometrical approach.WCB/McGraw-Hill, a Division of the McGraw-HillCompanies, 666 pp.
37

38