Powering, Protecting, Connecting. - AnnualReports.com
112
2012 ANNUAL REPORT Powering, Protecting, Connecting.
-
Upload
khangminh22 -
Category
Documents
-
view
3 -
download
0
Transcript of Powering, Protecting, Connecting. - AnnualReports.com

2012 ANNUAL REPORT
Powering, Protecting, Connecting.

Rogers helps power, protect and connect our world with reliability, efficiency and performance. Our innovative materials technologies are enabling transformative megatrends like internet connectivity, mass transit, and clean technology. By delivering solutions for tomorrow’s breakthroughs, we are building a cleaner, safer and more connected world.
PoweringThe world is demanding more efficient power. As global energy consumption grows, our planet’s future depends on developing cleaner sources of energy. You will find Rogers’ Power Electronics Solutions at the heart of a growing array of clean technologies that are making the world run better. Inside today’s high efficiency motor drives, our Direct-Bond Copper Substrates enable performance and efficiency. In high speed traction motors and alternative energy applications,
our innovative busbars are critical for distributing the generated power. While concern for our planet continues to grow, our Power Electronics Solutions are delivering greater power efficiency and a cleaner future for us all.
ProtectingWe live in a world where risk abounds. It’s a challenge to keep families safe and help products last longer. In planes, trains and automobiles, Rogers’ High Performance Foams protect passengers and critical components from vibration and noise. On the sports field, our unique wearable impact protection helps minimize injury. On the go, advanced cushioning from Rogers protects tablets and smart phones from dust, moisture and impact. In a world where safety,
security and durability are growing concerns, our High Performance Foams protect people and the products that make life better.
ConnectingThe way the world communicates is changing fast. Ever-increasing demand for more speed, bandwidth, and functionality is driving continuous innovation and revolutionizing communications. Printed Circuit Materials from Rogers are at the heart of the next-generation wireless networks, power amplifiers and smart antennas that reliably connect us around the globe. By enabling radar-based vehicle safety systems, our materials help drivers to be aware of potential traffic
dangers by enabling blind spot detection. When people, devices or enterprises connect, our high frequency Printed Circuit Materials ensure the speed and reliability of their connections.
Rogers Corporation (NYSE: ROG) is a global technology leader in specialty materials and components for consumer electronics, power electronics, mass transit, clean technology, and telecommunications infrastructure. With more than 180 years of materials science and engineering experience, Rogers provides product designers with solutions to help them power, protect and connect our world with greater reliability, efficiency and performance. Rogers’ three core businesses include Power Electronics Solutions for high-voltage rail traction, wind and solar power conversion; High Performance Foams for cushioning, sealing and impact protection in tablets and smart phones, aircraft, rail and automotive interiors, sporting goods, apparel and gear; and Printed Circuit Materials for wireless infrastructure, power amplifiers, smart antennas, and radar systems for automotive and defense applications. Headquartered in Connecticut (USA), Rogers operates manufacturing facilities in the United States, China, Germany, Belgium, and South Korea, with joint ventures and sales offices worldwide. For more information, visit www.rogerscorp.com.

Financial Highlights – Continuing Operations
1
Growth Drivers27% Internet 20 Clean Technology 8% Mass Transit
Other Markets10 %
%
7% Automotive 6% Defense6% Cell Phones (non-Internet) 5 % Other 5 % Medical and Personal Protection 3 % Consumer Electronics 2% Printing 1 % Appliance
2012 Percentage of Sales by Market
50% Asia 25% Europe 23 % United States2% Other
2012 Percentage of Sales by Region
Industrial
(US dollars in millions, except per share amounts)
2012 2011 2010 2009 2008
Net Sales $498.8 $548.3 $373.2 $ 286.8 $359.4
YEAR/YEAR PERCENT CHANGE (9)% 47% 30% (20)% (12)%
Income Before Taxes $ 22.7 $ 55.8 $ 44.4 $ (16.6) $ 27.8
Income (Loss) from Continuing Operations $ 69.1 $ 44.3 $ 38.6 $ (59.2) $ 23.3
YEAR/YEAR PERCENT CHANGE 56% 15% 165% (354)% 10%
Basic Earnings Per Share $4.21 $2.76 $2.44 $(3.77) $1.38
Diluted Earnings Per Share $4.07 $2.64 $2.41 $(3.77) $1.36
Shareholders’ Equity $ 434.2 $ 338.3 $330.5 $ 293.0 $ 336.1
Long-Term Debt $ 98.0 $ 122.5 $ — $ — $ —
Diluted Earnings Per ShareNet Income
Other SalesCore Sales
Diluted Earnings Per ShareNet Income
Other SalesCore Sales
Diluted Earnings Per ShareNet Income
Other SalesCore Sales
Sales(US dollars in millions)
2012 Percentage of Sales by Market 2012 Percentage of Sales by Region
Net Income(US dollars in millions)
Diluted Earnings Per Share(US dollars)

2012 was a challenging year across many markets—and Rogers was not immune to these challenges. Although overall results were below expectations, we focused on delivering results in the areas under our control and made significant progress in laying a foundation for future growth. These efforts helped improve profitability, with the full potential of our streamlining and improvements to be further realized as the global economy improves.
Our High Performance Foams business achieved excellent growth in the Consumer segment with our innovative PORON®XRD® Extreme Impact Protection materials used in wearable protection applications for leading sports brands. We also saw strong demand for our sealing and vibration mitigation materials for conventional and electrified automobiles. The strong growth performance in these segments however was offset by other market dynamics resulting in lower overall growth for the business than anticipated. In mobile internet devices like tablets and smart phones, performance was negatively impacted by a shift in display technology that reduced overall cushioning content per device in some platforms. As the market leader in this segment, Rogers’ position remains strong as we continue to collaborate closely with industry leaders, introducing new, innovative sealing and cushioning products that are winning many next-generation designs.
For Printed Circuit Materials, our globally recognized leadership position in high frequency circuit board materials has enabled Rogers to access the high growth market for radar-based automotive safety sensors. This has resulted in strong demand for Rogers’ materials used in this emerging application area. Despite lower infrastructure investment around the world, growth in demand for our materials used in smart antenna technologies for cellular towers offset relatively flat demand in base station power amplifier applications. In the high speed digital market, a faster shift towards ultra-low loss board performance led us to delay capacity expansion as we realigned Rogers’ product development to reflect this market need.
Our biggest challenge came in the Power Electronics Solutions segment as industrial capital spending was curtailed and governments around the globe constrained investment in high speed rail, wind and solar energy infrastructure. These changes impacted demand for substrates used in industrial motor drive controls, as well as busbars for power distribution in rail traction and clean energy applications.
2
To Our Shareholders:
In 2012, Rogers Corporation celebrated its 180th anniversary and embarked on a transformational journey designed to accelerate future growth. In a challenging global economy, we gained new customers, introduced new technologies, improved operations, and streamlined our cost structure. These actions have strengthened the Company and positioned us well to benefit as markets improve. Global megatrends continue to offer new opportunities for the innovative materials technologies from Rogers that help customers to power, protect and connect our world.

3
Despite these near-term challenges, we stayed true to our objective to transform the Company into a more market-driven, customer-focused specialty materials solutions provider that is better positioned to achieve higher growth and profitability. Our actions centered on the following priorities:
Driving Growth Pursuing a strategy focused on three global megatrends—internet growth, mass transit, and clean technology—has been a key to Rogers’ recent success. As a valued supplier to many of the world’s leading innovators, we continued to enhance our capabilities to understand and support their technology roadmaps.
Strong customer relationships have always been at the heart of Rogers’ success. Customers value Rogers for our broad portfolio of unique technologies, the quality and reliability of products, and the talent and dedication of our global team. In the first quarter of 2012, we reorganized the Company’s global sales team to enable greater alignment with the businesses it serves. This change is already yielding greater speed, efficiency, and responsiveness for customers. Other improvement initiatives are helping to further reduce lead times, improve delivery, and drive closer customer collaboration on next-generation materials solutions.
In 2012, the Company celebrated the 10th anniversary of our manufacturing and business center in Suzhou, China, while we continued to build greater depth in our Asia sales, marketing and general management teams. Across every business, we upgraded marketing capabilities by acquiring expertise and investing in marketing training and tools. These actions are helping us identify new opportunities to expand our portfolio of technology solutions to better serve our customers.
Enhancing ProfitabilityTo strengthen profitability and address the global economic challenges, we acted quickly and decisively to introduce streamlining and restructuring initiatives early in 2012. The Rogers team achieved a wide range of cost improvements by realigning resources, restructuring or exiting underperforming businesses, and disposing of redundant facilities. Due to the success of these efforts, we now expect to deliver over $20 million in annualized cost improvements in 2013 versus the original $10 million target. In 2014, Rogers should see further progress as the full benefits of the move of certain Power Electronics Solutions inspection operations to Hungary are realized. In addition, our team continues to aggressively pursue manufacturing excellence initiatives that are expected to result in sustained improvement in operating efficiency.
Creating Our Future By aligning the Company’s strategy with significant global megatrends, we continue to identify many growth opportunities both organic and through acquisition. Rogers is well positioned for growth as markets improve. Moving to the next phase of our journey, our team will focus on strong operational performance, prudent cost management and market-driven investments in new technologies to enhance Rogers’ portfolio of materials solutions. To further strengthen our growth engine, we plan to increase investment in R&D capabilities and innovation.
Finally, I would like to thank our employees for their continued commitment to the success of Rogers, and our shareholders and customers for their confidence in us. We remain focused on our journey, optimistic about the future and committed to helping power, protect and connect our world.
Sincerely,
Bruce D. HoechnerPresident and Chief Executive Officer

QUARTER NET SALESMANUFACTURING
PROFIT NET INCOME/(LOSS)BASIC NET INCOME/
(LOSS) PER SHAREDILUTED NET INCOME/
(LOSS) PER SHARE
2012 Fourth $124,176 $42,711 $ 5,179 $ 0.31 $ 0.30
Third 129,134 42,977 59,124 3.60 3.48
Second 125,296 36,654 6,417 0.40 0.39
First 120,155 36,404 (1,586) (0.10) (0.10)
2011 Fourth $125,251 $ 37,174 $ 3,740 $ 0.23 $ 0.22
Third 146,295 50,906 15,904 0.98 0.94
Second 142,167 48,452 13,488 0.85 0.81
First 134,628 42,453 11,118 0.70 0.67
12/31/07 12/30/08 12/31/09 12/31/10 12/31/11 12/31/12
Rogers Corporation $100.00 $61.52 $67.15 $84.74 $81.66 $110.01
S&P Industrials 100.00 60.08 72.65 92.07 91.53 105.58
S&P Small Cap 600 Electronic Equipment, Instruments & Components 100.00 55.09 82.55 107.82 101.18 111.60
0.00 01 02 03 04
0.20
0.40
0.60
0.80
1.00
1.20
1.40
Ja
n-08
Apr
-08
Jul-0
8
Oct
-08
Jan-
09
Apr
-09
Jul-0
9
Oct
-09
Jan-
10
Apr
-10
Jul-1
0
Oct
-10
Jan-
11
Apr
-11
Jul-1
1
Oct
-11
ROGERS CORPORATION
EQUI
VALE
NT V
ALUE
200801 02 03 04
200901 02 03 04
201001 02 03 04
201101 02 03 04
2012
S&P 500 RUSSELL 2000
RELATIVE CLOSING VALUES
Shareholder Information
Quarterly Results from Continuing Operations (Unaudited)(Dollars in thousands, except per share amounts)
Performance Graph
Rogers Corporation vs S&P 500 and Russell 2000FIVE YEAR RELATIVE STOCK PERFORMANCE
4
The graph at right compares the cumulative total return on Rogers capital stock over the past five fiscal years with the cumulative total return on the Standard & Poor’s Industrials Index (S&P Industrials) and the S&P Small Cap 600 Electronic Equipment, Instruments & Components Index. Cumulative total return is measured assuming an initial investment of $100 on December 31, 2007 and the reinvestment of any dividends as of the end of Rogers’ fiscal years.
$0
$20
$40
$60
$80
$100
$120
12/30/07 12/31/08 12/31/09 12/31/10 12/31/11 12/31/12
COMPARISON OF 5 YEAR CUMULATIVE TOTAL RETURN* Among Rogers Corporation, the S&P Industrials Index,
and S&P Small Cap 600 Electronic Equipment, Instruments & Components
Rogers Corporation S&P Industrials S&P Small Cap 600 Electronic Equipment, Instruments & Components
COMPARISON OF FIVE YEAR CUMULATIVE TOTAL RETURN
*$100 invested on 12/31/06 in stock or index, including reinvestment of dividends. Indexes calculated on month-end basis. Copyright© 2012 S&P, a division of The McGraw-Hill Companies Inc. All rights reserved.
COMPARISON OF FIVE YEAR CUMULATIVE TOTAL RETURN
RELATIVE CLOSING VALUES

UNITED STATESSECURITIES AND EXCHANGE COMMISSION
Washington, D.C. 20549
FORM (Mark One)
ANNUAL REPORT PURSUANT TO SECTION 13 OR 15(d) OF THE SECURITIES EXCHANGE ACT OF 1934For the fiscal year ended December 31, 2012
OR
TRANSITION REPORT PURSUANT TO SECTION 13 OR 15(d) OF THE SECURITIES EXCHANGE ACT OF1934
For the transition period from toCommission File No. 1-4347
ROGERS CORPORATION(Exact name of Registrant as specified in its charter)
Massachusetts(State or other jurisdiction of
incorporation or organization)(I. R. S. EmployerIdentification No.)
P.O. Box 188, One Technology Drive, Rogers, Connecticut 06263-0188 (Address of principal executive offices)
Registrant's telephone number, including area code: (860) 774-9605
Securities registered pursuant to Section 12(b) of the Act:
Title of Each Class Name of Each Exchange on Which RegisteredCommon Stock, $1 Par Value New York Stock Exchange
Rights to Purchase Capital Stock New York Stock Exchange
Securities registered pursuant to Section 12(g) of the Act: None
Indicate by check mark if the registrant is a well-known seasoned issuer, as defined in Rule 405 of the Securities Act. Yes No
Indicate by check mark if the registrant is not required to file reports pursuant to Section 13 or Section 15(d) of the Act. Yes No Indicate by check mark whether the registrant (1) has filed all reports required to be filed by Section 13 or 15(d) of the Securities Exchange Act of 1934 during the preceding 12 months (or for such shorter period that the registrant was required to file such reports), and (2) has been subject to such filing requirements for the past 90 days. Yes No Indicate by check mark whether the registrant has submitted electronically and posted on its corporate Web site, if any, every Interactive Data File required to be submitted and posted pursuant to Rule 405 of Regulation S-T (§ 232.405 of this chapter) during the preceding 12 months (or for such shorter period that the registrant was required to submit and post such files). Yes No Indicate by check mark if disclosure of delinquent filers pursuant to Item 405 of Regulation S-K (§ 229.405 of this chapter) is not contained herein, and will not be contained, to the best of registrant's knowledge, in definitive proxy or information statements incorporated by reference in Part III of this Form 10-K or any amendment to this Form 10-K.
Indicate by check mark whether the registrant is a large accelerated filer, an accelerated filer, a non-accelerated filer, or a smaller reporting company. See the definitions of “large accelerated filer”, “accelerated filer” and “smaller reporting company” in Rule 12b-2 of the Exchange Act.Large accelerated filer Accelerated filer Non-accelerated filer Smaller reporting company
(Do not check if a smaller reporting company)
Indicate by checkmark whether the registrant is a shell company (as defined in Rule 12b-2 of the Act) Yes No
The aggregate market value of the voting common equity held by non-affiliates as of June 29, 2012, the last business day of the registrant's most recently completed second fiscal quarter, was approximately $633,906,597. Rogers has no non-voting common equity.
The number of shares outstanding of common stock as of February 4, 2013 was 16,963,897.

2
Documents Incorporated by Reference:
Portions of Rogers’ Definitive Proxy Statement for its 2013 Annual Meeting of Shareholders, currently scheduled for May 3, 2013, are incorporated by reference into Part III of this Form 10-K.
3
ROGERS CORPORATIONFORM 10-K
December 31, 2012
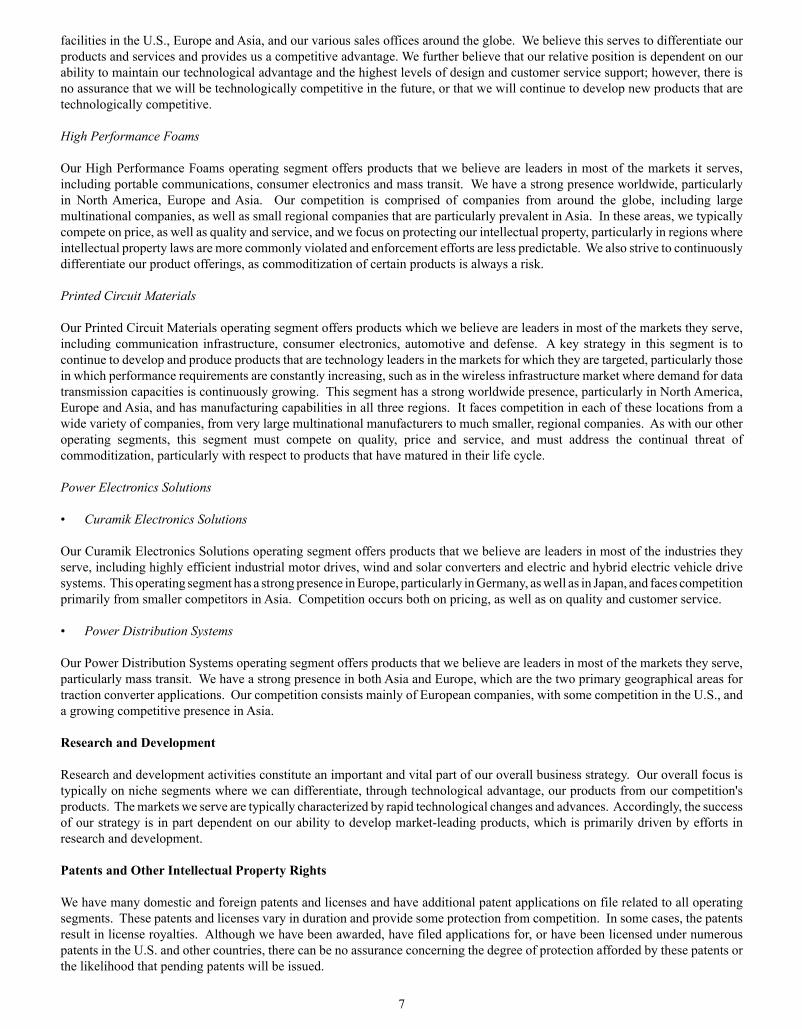
TABLE OF CONTENTSPart I
Item 1. BusinessItem 1A. Risk FactorsItem 1B. Unresolved Staff CommentsItem 2. PropertiesItem 3. Legal ProceedingsItem 4. Mine Safety Disclosures
Part IIItem 5. Market for Registrant's Common Equity, Related Stockholder Matters and Issuer Purchases of Equity SecuritiesItem 6. Selected Financial Data Item 7. Management's Discussion and Analysis of Financial Condition and Results of OperationsItem 7A. Quantitative and Qualitative Disclosures About Market RiskItem 8. Financial Statements and Supplementary DataItem 9. Changes in and Disagreements with Accountants on Accounting and Financial DisclosureItem 9A. Controls and ProceduresItem 9B. Other Information
Part IIIItem 10. Directors, Executive Officers and Corporate GovernanceItem 11. Executive CompensationItem 12. Security Ownership of Certain Beneficial Owners and Management and Related Stockholder MattersItem 13. Certain Relationships and Related Transactions, and Director Independence Item 14. Principal Accountant Fees and Services
Part IVItem 15. Exhibits, Financial Statement Schedules
Signatures
4
10
17
17
18
21
22
23
24
45
46
94
94
96
96
96
96
98
98
98
103

4
Part I
Item 1. Business
Industry
Rogers Corporation, founded in 1832, is one of the oldest publicly traded U.S. companies in continuous operation. We have adapted our products over the 180 years of our history to meet the changing needs of the various markets we have served and currently serve. Today we predominantly supply a wide range of specialty materials products across a wide range of end markets, including portable communications, communications infrastructure, consumer electronics, mass transit, automotive, defense, and clean technology.
Our continued focus is on three megatrends that we believe will fuel the future growth of the Company - continued growth of the internet, expansion of mass transit, and investment in clean technology. These trends and their related markets all require materials that perform to the highest standards, which has been a key strength of our products over the years. Within the industries impacted by these megatrends, our products are sold into a variety of markets, including high technology applications, such as cellular base stations and antennae, hand held wireless devices, energy efficient motor drives, wind and solar energy applications, and electric and hybrid-electric vehicles. We continue to focus on business opportunities around the globe, as evidenced by our strong presence in the three major geographic regions we serve - North America, Europe, and Asia. We are also focused on growing our business both organically, by expanding our current product portfolio and market presence, as well as through external ventures, such as acquisitions, strategic partnerships and investments in technology.
As used herein, the “Company,” “Registrant,” “Rogers, “we, “our, “us” and similar terms include Rogers Corporation and its subsidiaries, unless the context indicates otherwise.
Business Segments & Products
Our reporting structure is comprised of the following operating segments: High Performance Foams (HPF), Printed Circuit Materials (PCM), Curamik Electronics Solutions (CES) and Power Distribution Systems (PDS), which comprise our Power Electronics Solutions (PES) core strategic category and the Other reportable segment.
Segment StructureCore Strategic
High Performance FoamsPrinted Circuit MaterialsPower Electronics Solutions
Curamik Electronics SolutionsPower Distribution Systems
Other
Core Strategic
High Performance Foams
Our High Performance Foams operating segment includes polyurethane and silicone foam products. These foams have characteristics that offer functional advantages in many market applications, and serve to differentiate our products from other commonly available materials.
High Performance Foams are sold to fabricators, distributors and original equipment manufacturers (OEMs) for applications in portable communications, consumer electronics, mass transit and other markets. Trade names for our High Performance Foams include: PORON® urethane foams used for making high performance gaskets and seals in vehicles, portable communications devices, computers and peripherals; PORON cushion insole materials for footwear and related products; PORON healthcare and medical materials for body cushioning and orthotic appliances; R/bak® compressible printing plate backing and mounting products for cushioning flexographic plates for printing on packaging materials; PORON for high impact cushioning protection, and

5
BISCO® silicone foams, solids, sponge and extrusion products for making flame retardant gaskets and seals in communications infrastructure equipment, aircraft, trains, cars and trucks, and for shielding extreme temperature or flame.
Our continued focus on growing the Company is highlighted in this segment as we acquired SK Utis Co., Ltd. (Utis), a high performance polyurethane foam business located in South Korea, in 2010. Utis, a former subsidiary of SK Chemicals Co. Ltd., was established in 2005 and has quickly grown into a high quality supplier of polyurethane foam solutions for portable communications, entertainment, and industrial applications to leading Korean-based OEMs. Utis has a solid presence in several key markets we have targeted for growth, including mobile internet devices and high definition televisions, among others. This acquisition has also allowed us to extend our presence into the dynamic Korean marketplace.
In 2009, we acquired certain assets of MTI Global Inc.’s silicone foam business. MTI Global Inc. had established a solid presence as a solutions provider in several key markets that we are targeting for future growth, including mass transit and other markets requiring high reliability, high performance materials. The addition of the product lines from MTI Global Inc. has expanded the opportunities for both our existing products, as well as the acquired products, through exposure to new markets and applications. We are also leveraging the acquired technologies to create even more innovative materials solutions. We have two 50% owned joint ventures that extend and complement our worldwide business in High Performance Foams. Rogers INOAC Corporation (RIC), a joint venture with Japan-based INOAC Corporation, manufactures high performance polyurethane foam materials in Mie and Taketoyo, Japan to predominantly serve the Japanese market. In 2004, we further extended our relationship with INOAC Corporation with the formation of another joint venture in Suzhou, China, Rogers INOAC Suzhou Corporation (RIS), which also manufactures polyurethane foam materials primarily for the Chinese market.
Printed Circuit Materials
Our Printed Circuit Materials operating segment includes printed circuit board laminate products for high frequency, high performance applications. Our Printed Circuit Materials have characteristics that offer performance and other functional advantages in many market applications, and serve to differentiate our products from other commonly available materials.
Printed Circuit Materials are sold principally to independent and captive printed circuit board manufacturers that convert our laminates to custom printed circuits.
The polymer-based dielectric layers of our rigid circuit board laminates are proprietary materials that provide highly specialized electrical and mechanical properties. Trade names for our rigid printed circuit board materials include RO3000®, RO4000®, RT/duroid®, ULTRALAM®, RO2800® and TMM® laminates. All of these laminates are used for making circuitry that receive, transmit, and process high frequency communications signals, yet each laminate has varying properties that address specific needs and applications within the communications market. High frequency circuits are used in the equipment and devices that comprise wireless communications systems, including cellular communications, digital cellular communications, paging, direct broadcast television, global positioning, mobile radio communications, and radar.
In the fourth quarter of 2010, we sold our 50% interest in Rogers Chan Chung Technologies, Inc. (RCCT) to our partner, Chan Chung Plastics Co., Ltd, effectively ending our participation in the flexible circuit materials market.
Power Electronics Solutions
Our Power Electronics Solutions category is comprised of two operating segments - Curamik Electronics Solutions and Power Distribution Systems.
• Curamik Electronics Solutions
We acquired Curamik in the first quarter of 2011. Founded in 1983 and headquartered in Eschenbach, Germany, Curamik is a manufacturer of direct copper bonded (DCB) ceramic substrate products used in the design of intelligent power management devices, such as insulated gate bipolar transistor (IGBT) modules. These devices enable a wide range of products including highly efficient industrial motor drives, wind and solar converters and electric and hybrid electric vehicle drive systems. Most of Curamik’s products are manufactured using state-of-the-art automated processes in its facility in Germany.
• Power Distribution Systems
The Power Distribution Systems operating segment manufactures busbar power distribution products in Ghent, Belgium and Suzhou, China under the RO-LINX POWERCIRCUIT® trade name. We sell these RO-LINX POWERCIRCUIT products to manufacturers of high power electrical inverter and converter systems for use in mass transit (e.g. high speed trains) and clean

6
technology applications (e.g. wind turbines, solar farms and electric vehicles). In the industrial application area, our RO-LINX POWERCIRCUIT products are utilized in a large variety of variable frequency drives for high to mid power applications.
This reporting segment included the results of the Thermal Management Solutions operating segment, which qualified as a discontinued operation in 2011. All results have been recast to exclude this segment from our consolidated results from continuing operations.
Other
The Other reportable segment consists of elastomer rollers, floats and our inverter distribution activities.
Elastomer components are sold to OEMs for applications in ground transportation, office equipment, consumer and other markets. Trade names for our elastomer components include: NITROPHYL® floats for level sensing in fuel tanks, motors, and storage tanks and ENDUR® elastomer rollers and belts for document handling in copiers, printers, mail sorting machines and automated teller machines.
Inverters are sold primarily to OEMs and fabricators that in turn sell to various other third parties that primarily serve the portable communication and automotive markets.
Our 50% owned joint venture with Mitsui Chemicals, Inc. of Japan, Polyimide Laminate Systems, LLC (PLS), which had complemented our Printed Circuit Materials business, was dissolved on March 31, 2010 as Rogers and Mitsui Chemicals, Inc, entered into an agreement to dissolve the joint venture and to have Rogers assume any outstanding assets and liabilities of PLS. The parties also agreed that, going forward, all the distribution activity that PLS previously engaged in would be conducted through Rogers. Therefore, beginning in the second quarter of 2010, these activities were reported on a gross basis as part of our consolidated results. At that time, PLS became an operating segment with its results reported in the Other operating segment. Further, in early 2011, PLS completed its distribution activities as its products came to end of life.
This segment, also previously included the results of the Composite Material Division operating segment, which qualified as a discontinued operation in the fourth quarter of 2012 when we shut down production of our non-woven composite materials. All results have been recast to exclude this segment from our consolidated results from continuing operations.
Prior to 2011, this segment included sales of our electroluminescent lamp products, which came to end of life at that time and are no longer produced.
Sales and Marketing
Most of our products are sold through direct sales channels positioned near major concentrations of our customers throughout North America, Europe and Asia. Our products were sold to 3,000 customers worldwide in 2012. Our largest individual customer represents approximately 4% of Rogers' total sales for 2012. Although the loss of all of the sales made to any one of our larger customers would require a period of adjustment during which the results of a particular operating segment would be adversely impacted, we believe that such adjustments could be successfully made over a period of time due to the diversity of our customer base. We also believe that our business relationships with the major customers within our key markets are favorable, and that we are in a good position to respond promptly to variations in customer requirements and technology trends. However, the possibility exists of losing all of the business of any major customer in any product line.
We market our full range of products throughout the world. Almost all of our sales are facilitated through our own worldwide sales force, with a small percentage facilitated through independent agents and distributors.
Competition
Our Core Strategic operating segments - HPF, PCM, CES and PDS- all participate in industries that are characterized by strong global competition. This competition, which is comprised not only of those companies that make directly competing materials, but also those companies that make comparable and, therefore, potentially substitutable materials, is typically from substantially larger, multinational manufacturers that often have greater financial resources than we do, as well as smaller regional producers with lower overhead costs and profit requirements. This latter type of low cost competitor is particularly prevalent in Asia.
Our overall strategy across our Core Strategic operating segments is to offer highly regarded, technologically advanced products that are price competitive in relation to value and to link our product offerings with superior market knowledge, technical know-how, and customer service. Further, we believe that in order to provide outstanding customer support we must be geographically close to our customers in order to provide local service, support and distribution, which we achieve through our manufacturing
7
facilities in the U.S., Europe and Asia, and our various sales offices around the globe. We believe this serves to differentiate our products and services and provides us a competitive advantage. We further believe that our relative position is dependent on our ability to maintain our technological advantage and the highest levels of design and customer service support; however, there is no assurance that we will be technologically competitive in the future, or that we will continue to develop new products that are technologically competitive.
High Performance Foams
Our High Performance Foams operating segment offers products that we believe are leaders in most of the markets it serves, including portable communications, consumer electronics and mass transit. We have a strong presence worldwide, particularly in North America, Europe and Asia. Our competition is comprised of companies from around the globe, including large multinational companies, as well as small regional companies that are particularly prevalent in Asia. In these areas, we typically compete on price, as well as quality and service, and we focus on protecting our intellectual property, particularly in regions where intellectual property laws are more commonly violated and enforcement efforts are less predictable. We also strive to continuously differentiate our product offerings, as commoditization of certain products is always a risk.
Printed Circuit Materials
Our Printed Circuit Materials operating segment offers products which we believe are leaders in most of the markets they serve, including communication infrastructure, consumer electronics, automotive and defense. A key strategy in this segment is to continue to develop and produce products that are technology leaders in the markets for which they are targeted, particularly those in which performance requirements are constantly increasing, such as in the wireless infrastructure market where demand for data transmission capacities is continuously growing. This segment has a strong worldwide presence, particularly in North America, Europe and Asia, and has manufacturing capabilities in all three regions. It faces competition in each of these locations from a wide variety of companies, from very large multinational manufacturers to much smaller, regional companies. As with our other operating segments, this segment must compete on quality, price and service, and must address the continual threat of commoditization, particularly with respect to products that have matured in their life cycle.
Power Electronics Solutions
• Curamik Electronics Solutions
Our Curamik Electronics Solutions operating segment offers products that we believe are leaders in most of the industries they serve, including highly efficient industrial motor drives, wind and solar converters and electric and hybrid electric vehicle drive systems. This operating segment has a strong presence in Europe, particularly in Germany, as well as in Japan, and faces competition primarily from smaller competitors in Asia. Competition occurs both on pricing, as well as on quality and customer service.
• Power Distribution Systems
Our Power Distribution Systems operating segment offers products that we believe are leaders in most of the markets they serve, particularly mass transit. We have a strong presence in both Asia and Europe, which are the two primary geographical areas for traction converter applications. Our competition consists mainly of European companies, with some competition in the U.S., and a growing competitive presence in Asia.
Research and Development
Research and development activities constitute an important and vital part of our overall business strategy. Our overall focus is typically on niche segments where we can differentiate, through technological advantage, our products from our competition's products. The markets we serve are typically characterized by rapid technological changes and advances. Accordingly, the success of our strategy is in part dependent on our ability to develop market-leading products, which is primarily driven by efforts in research and development.
Patents and Other Intellectual Property Rights
We have many domestic and foreign patents and licenses and have additional patent applications on file related to all operating segments. These patents and licenses vary in duration and provide some protection from competition. In some cases, the patents result in license royalties. Although we have been awarded, have filed applications for, or have been licensed under numerous patents in the U.S. and other countries, there can be no assurance concerning the degree of protection afforded by these patents or the likelihood that pending patents will be issued.

8
While our patents provide some advantage and protection, we believe that a large part of our competitive position and future success is largely determined by such factors as the innovative skills, systems and process knowledge, and technological expertise of our personnel; the range and success of new products we develop; and our customer service and support. It is our policy to defend our patents when we determine it is in our best interests and the best interests of our shareholders to do so. We also own a number of registered and unregistered trademarks and have acquired certain confidential and proprietary technology that we believe to be of importance to our business.
Overall, we believe that our patents provide an important competitive advantage in many of our businesses; however, in general, no single patent or group of patents is in itself essential to our business as a whole or to any of our operating segments.
Environment
The nature and scope of our business brings us in regular contact with the general public and a variety of businesses and government agencies. Such activities inherently subject us to the possibility of litigation related to environmental matters, which is defended and handled in the ordinary course of business. We have established accruals for matters for which management considers a loss to be probable and reasonably estimable. We do not believe that the outcome of any of these environmental matters will have a material adverse effect on our results of operations, financial position or cash flows, nor have we had any material recurring costs or capital expenditures relating to environmental matters, except as disclosed in Item 3 “Legal Proceedings” and Note 14 to the Consolidated Financial Statements of this Form 10-K. However, there can be no assurances that the ultimate liability concerning these matters will not have a material adverse effect on us.
Raw Materials
We are required to purchase a wide variety of raw materials in order to manufacture our various products and materials. Some of these raw materials are only available through limited sources. If the continuous supply of raw materials were interrupted, our production could be negatively impacted. When this has occurred in the past, we have typically purchased sufficient quantities of the particular raw material in advance to sustain production until alternative materials and production processes could be qualified with customers. We believe that similar responses could mitigate potential raw material availability issues in the future; however, this strategy may not work in all cases. As such, we would have to work closely with our customers and suppliers to mitigate the impact of any raw material shortages on our business, but such shortages could have a material negative impact on our businesses under certain circumstances.
Seasonality
In our opinion, there is no material concentration of products or markets within the business that are seasonal in nature, except for some minor seasonality for those products used in cellular telephones due to the annual new model launch timetable, which can vary slightly from year to year in terms of timing and impact.
Employees
As of December 31, 2012, we employed approximately 2,400 employees.
Backlog
Our backlog of firm orders was $43.3 million at December 31, 2012, as compared to $33.1 million at December 31, 2011. The increase at the end of 2012 was primarily related to the CES, which experienced an increase in backlog of $10.7 million at December 31, 2012 as compared to December 31, 2011.

9
Executive Officers
Our executive officers as of February 20, 2013 are as follows:
Name Age Present PositionYear Elected toPresent Position Other Positions Held During 2008-2012
Bruce D. Hoechner 53 President and ChiefExecutive Officer (CEO)
2011 President, Asia Pacific Region, Dow AdvancedMaterials Division, Rohm and Haas Companyfrom 2009 to September 2011; Corporate VicePresident, General Manager of Rohm & HaasCoatings Asia Pacific from 2007 to 2009
Robert C. Daigle 49 Senior Vice Presidentand Chief TechnologyOfficer
2009 Vice President, Research and Development andChief Technology Officer from October 2003to June 2009
Gary M. Glandon 54 Vice President and ChiefHuman ResourcesOfficer
2012 Chief Human Resources Officer, Solutia from October 2010- July 2012; Chief Human Resources Officer, Energy Conversion Devices Inc. from July 2009- October 2010; Chief People Officer, Insight Ent. from February 2005- April 2009.
Debra J. Granger 53 Vice President, CorporateCompliance and Controls
2007
Jeffrey M. Grudzien 51 Vice President, AdvancedCircuit MaterialsDivision
2012 Vice President, Sales and Marketing September 2007 to February 2012
Dennis M. Loughran 55 Vice President, Financeand Chief FinancialOfficer, PrincipalFinancial Officer
2006
Terrence W. Mahoney 65 Vice President andGeneral Counsel
2009 Counsel, McDermott Will & Emery LLP from July 2008 to July 2009; Partner, Dewey & LeBoeuf LLP from November 2001 to July 2008
Paul B. Middleton 45 Director of Finance –Treasury Operations,New BusinessDevelopment andCorporate Treasurer
2010 Treasurer from July 2009 to April 2010; Principal Accounting Officer from August 2007 to July 2009
Ronald J. Pelletier 39 Corporate Controller andPrincipal AccountingOfficer
2009 Corporate Controller from September 2008 toJuly 2009; Manager Financial Reporting fromJanuary 2004 to September 2008
Robert M. Soffer 65 Vice President andSecretary
2007
Luc Van Eenaeme 53 Vice President, Rogers Europe and Managing Director Curamik
2011 Vice President, Rogers Europe from 2004 toAugust 2011

10
Available Information
We make available through a link on our website (http://www.rogerscorp.com), free of charge, our annual reports on Form 10-K, quarterly reports on Form 10-Q, current reports on Form 8-K, reports filed pursuant to Section 16 and amendments to those reports filed pursuant to Section 13(a) or 15(d) of the Securities Exchange Act of 1934 (Exchange Act) as soon as reasonably practicable after we electronically file such material with, or furnish it to, the Securities and Exchange Commission (SEC). In addition, the SEC maintains an internet site that contains these reports, proxy and information statements, and other information regarding issuers that file electronically with the SEC (http://www.sec.gov).
We also make available on our website, in a printable format, the charters for a number of our various Board of Director committees, including the Audit Committee, Compensation and Organization Committee, and Nominating and Governance Committee, in addition to our Corporate Governance Guidelines, Bylaws, Code of Business Conduct and Ethics, Related Party Transactions Policy and Compensation Recovery Policy. Our website is not incorporated into or a part of this Form 10-K.
Item 1A. Risk Factors
Our business, financial condition and results of operations are subject to various risks, including those discussed below, which may affect the value of our stock. The risks discussed below are those that we believe are currently the most significant, although additional risks not presently known to us or that we currently deem less significant may also impact our business, financial condition and results of operations, perhaps materially.
The global credit and financial markets, although somewhat stabilized, could experience additional disruption, which could materially and adversely affect our business and results of operations.
Conditions in the global credit and financial markets continue to be uncertain and there can be no assurances that there will not be future deterioration in credit and financial markets and in confidence in overall economic conditions. These economic uncertainties affect businesses such as ours in a number of ways, making it difficult to accurately forecast and plan our future business activities. Adverse global economic conditions in our markets will likely negatively impact our business, which could result in the following conditions, among others:
• Reduced demand for our products;• Increased price competition for our products;• Increased credit or other financial difficulties at our suppliers that could result in delays in their ability to supply us
with necessary raw materials, components or finished products;• Increased risk of excess and obsolete inventories;• Increased risk of the collectability of cash from our customers;• Increased risk in potential reserves for doubtful accounts and write-offs of accounts receivable; and• Higher operating costs as a percentage of revenues.
Continued or additional volatility in the global credit and financial markets could also have a significant impact on our ability to generate returns on our investment portfolio, our ability to obtain financing, and consequently, our ability to further diversify our business through strategic acquisitions or other alliances (an important component of our long-term growth strategy), and our ability to obtain and hold insurance, among other things. Our investments and certain other assets are impacted by market conditions, including conditions that affect interest rates and the liquidity and creditworthiness of the banks and other intermediaries through which we hold investments, and any decrease in their or our ability to liquidate our investments could negatively affect our financial position.
Our future revenue, gross margins, operating results and net income are difficult to predict and may materially fluctuate.
Our future revenue, gross margins, operating results and net income are difficult to predict and may be materially affected by a number of factors, including:
• the effects of adverse economic conditions in the U.S. and international markets;• changes in customer demand for our products and for end products that incorporate our materials;• loss of or significant declines in sales to key customers;• the timing of new product announcements or introductions by us, our customers, or our competitors;• competitive pricing pressures;• fluctuations in manufacturing yields, adequate availability of copper and other raw materials, and manufacturing, assembly
and testing capacity; • significant declines in backlog;

11
• the timing, delay or cancellation of significant customer orders and our ability to manage inventory;• changes in geographic, product, or customer mix;• the effects of the expiration of issued patents;• our ability to utilize our manufacturing facilities at efficient levels;• potential significant litigation-related costs;• the difficulties inherent in forecasting future operating expense levels, including with respect to costs associated with
labor, utilities, transportation and raw materials;• the costs related to compliance with increasing worldwide regulations;• changes in our effective tax rates in the U.S., China or other jurisdictions; and • the effects of public health emergencies, natural disasters, security risks, terrorist activities, international conflicts and
other events beyond our control.
In addition, the market segments on which we have recently focused-- products which (i) enable the growth of the Internet and the increased performance of mobile communication devices; (ii) support the reliability and efficiency of clean energy technology; and (iii) improve the performance and comfort of mass transit systems-- have been characterized by wide fluctuations in product supply and demand. From time to time, these industries have experienced significant downturns, often in connection with, or in anticipation of, maturing product cycles, reductions in government spending, and declines in general economic conditions. These downturns have been characterized by diminished product demand, production over-capacity and accelerated price erosion. Our business is also subject to rapid technological changes and there can be no assurance, depending on the mix of future business, that products stocked in our inventory will not be rendered obsolete before we ship them. As a result of this and other factors, there can be no assurance that we will not experience material fluctuations in future revenue, gross margins, operating results and net income on a quarterly or annual basis. In addition, if our revenue, gross margins, operating results and net income do not meet the expectations of securities analysts or investors, the market price of our common stock may decline.
Our future success depends upon our ability to continue to innovate, improve our products, develop and market new products, and identify and enter new markets.
Our future success depends in part upon our ability to continue to develop new products and improve our product and process technologies. Our success in these efforts will be determined by our ability to anticipate market requirements in our product development efforts, and the acceptance and continued commercial success of the end user's products. Additionally, our success depends upon our ability to adapt to technological changes and to support established and emerging industry standards.
In particular, some of the markets on which we focus are characterized by frequent new product introductions, evolving industry standards, rapid changes in product and process technologies, price competition and many new potential applications. To continue to be successful in these areas, we must be able to consistently develop, produce and supply materials that meet the demanding expectations of customers for quality, performance and reliability at competitive prices. Our timely introduction of new products to meet these needs could be affected by engineering or other development program delays and problems in effectively and efficiently increasing production to meet customer needs. In addition, rapid technological change, significant pricing pressures and short lead times characterize the end-use markets for devices and equipment into which our products are often incorporated. Because we manufacture and sell our own materials to meet the needs of these markets, our results may be negatively affected by these factors.
We may be unable to adequately protect our proprietary rights, which may limit our ability to compete effectively.
Our success depends, in part, on our ability to protect our intellectual property. We primarily rely on patents, copyrights, and trademarks, as well as nondisclosure agreements and other methods to protect our proprietary technologies and processes. Despite our efforts to protect our proprietary technologies and processes, it is possible that competitors and other unauthorized third parties may obtain, copy, use or disclose our technologies, products, and processes. Moreover, the laws and/or judicial systems of foreign countries in which we design, manufacture, market and sell our products may afford little or no effective protection of our proprietary technology.
There can be no assurances that the claims allowed in our issued patents will be sufficiently broad to protect our technology. In addition, any of our existing or future patents may be challenged, invalidated or circumvented. As such, any rights under these patents may not provide us with meaningful protection. If our patents do not adequately protect our technology, our competitors may be able to offer products similar to ours. Our competitors may also be able to develop similar technology independently or design around our patents. We may also be negatively affected by, and subject to increased competition as a result of, the normal expiration of our issued patents.
We try to control access to and distribution of our technologies, documentation and other proprietary information. Despite these efforts, internal or external parties may attempt to copy, disclose, obtain or use our products or technology without authorization.

12
Also, former employees may seek employment with our business partners, customers or competitors, and there can be no assurance that the confidential nature of our proprietary information will be maintained in the course of such future employment.
We are exposed to business, economic, political, legal and other risks through our significant worldwide operations.
We have significant foreign operations, particularly in Asia and Europe, which exposes us to business, political and economic changes that could negatively impact our future sales, expenses and financial condition. For fiscal 2012, sales of our products to foreign customers accounted for approximately 76.9% of our net sales. As of December 31, 2012, we employed approximately 1,700 employees overseas.
It is anticipated that with the passage of time, design decisions related to the products we make will be increasingly made by Asian, rather than European or North American-based, original equipment manufacturers (“OEMs”). There can be no assurance that we will be as successful obtaining design wins with respect to these Asian OEMs as we historically have been with European and North American OEMs.
Although we engage in hedging transactions to help reduce our exposure to currency exchange rate fluctuations, there can be no assurance that our competitive position will not be adversely affected by changes in the exchange rate of the U.S. dollar against other currencies.
Also, potential interest rate increases, as well as high energy and other consumer costs, could have an adverse impact on industrial and consumer spending patterns and could adversely impact demand for our products and the products our materials are in.
While a substantial portion of our cash is generated outside the U.S., we require a significant amount of cash in the U.S. to address our operating requirements, including the funding of acquisitions, and debt and interest payments, among other things. If we are unable to address our U.S. cash requirements through our U.S. operations cash flows, by efficient and timely repatriations of overseas cash, through borrowings under our current credit facility or from other sources of cash obtained at an acceptable cost, our business strategies and operating results could be adversely affected.
We are also subject to the risks associated with ongoing uncertainties and political and economic instability in many countries around the world, as well as economic disruption from acts of terrorism and the response to them by the U.S. and its allies. Other business risks associated with international operations include, but are not limited to, increased managerial complexities; air transportation disruptions; expropriation; currency controls; additional costs related to foreign taxes, tariffs and freight rate increases; exposure to different business practices and differing legal standards, particularly with respect to price protection; intellectual property and environmental compliance; trade and travel restrictions; pandemics; import and export license requirements and restrictions; difficulties in staffing and managing worldwide operations; longer accounts receivable cycles and collections; and unexpected changes in regulatory requirements. We may also be subject to unanticipated income taxes, excise duties, import taxes, export taxes, value added tax, or other governmental assessments, and taxes may be impacted by changes in legislation in the tax jurisdictions in which we operate. In addition, our organization and capital structure may limit our ability to transfer funds between countries, particularly into the United States, without incurring adverse tax consequences.
We expect our business to continue to have a strong presence in Asia, particularly in China, in the foreseeable future, as the Asian marketplace is a key factor to our current and future success. Our operations in these markets may be adversely affected by China's continuously evolving laws and regulations, including those relating to taxation, import and export tariffs, currency controls, environmental regulations, and intellectual property rights and enforcement of those rights. Enforcement of existing laws or agreements may be inconsistent, as there is a high degree of fragmentation among regulatory authorities resulting in uncertainties as to which authorities have jurisdiction over particular parties or transactions. In addition, changes in the political environment, governmental policies, or U.S. and China relations could result in revisions to laws or regulations or their interpretation and enforcement, potentially resulting in increased taxation, restrictions on imports, import duties or currency revaluations, all of which could have an adverse effect on our business plans and operational results.
Availability of and changes in the costs and quality of certain key raw materials could negatively impact our profit margins and our ability to produce products in a timely manner to required specifications.
We use certain key raw materials in our manufacturing processes, including, but not limited to, copper and certain types of resins, that could be subject to price volatility due to availability, demand and global monetary policies. In addition, these materials are often sourced from single or limited sources that expose us to price increases and that further expose us to the risk of not being able to procure enough material to meet our customer demands and increase the potential for inconsistent incoming material quality. Any inability to obtain timely deliveries of materials of acceptable quantity or quality, or a significant increase in the prices of materials, could have a material adverse effect on our operating results.
13
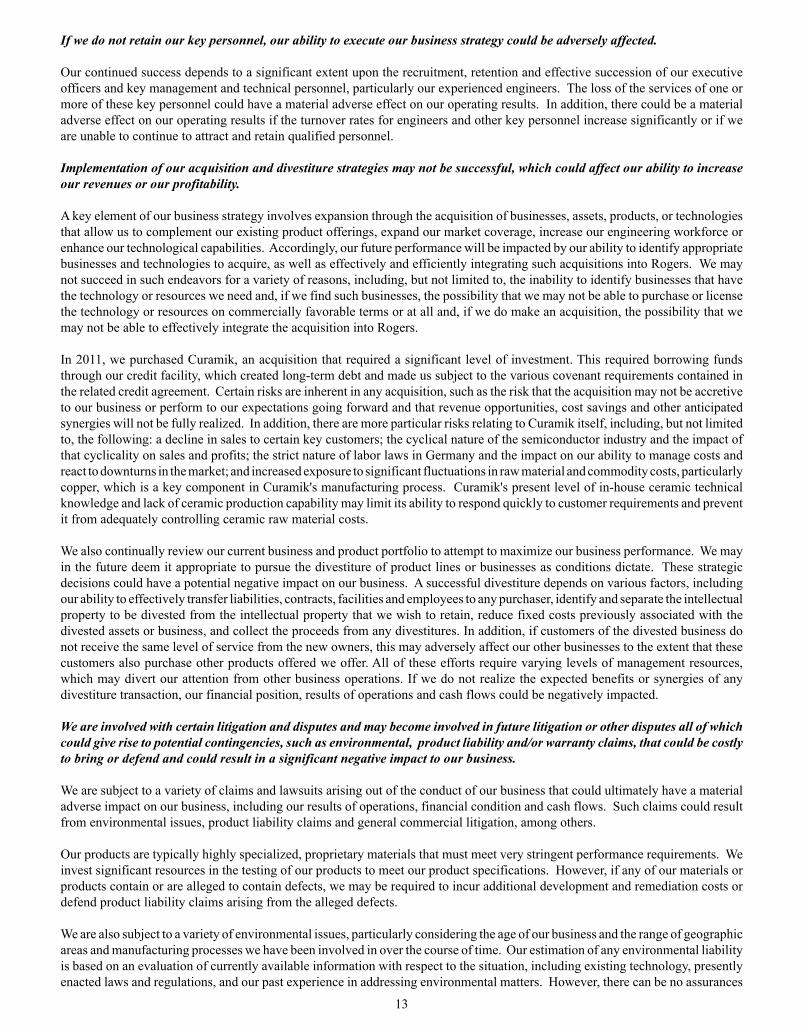
If we do not retain our key personnel, our ability to execute our business strategy could be adversely affected.
Our continued success depends to a significant extent upon the recruitment, retention and effective succession of our executive officers and key management and technical personnel, particularly our experienced engineers. The loss of the services of one or more of these key personnel could have a material adverse effect on our operating results. In addition, there could be a material adverse effect on our operating results if the turnover rates for engineers and other key personnel increase significantly or if we are unable to continue to attract and retain qualified personnel.
Implementation of our acquisition and divestiture strategies may not be successful, which could affect our ability to increase our revenues or our profitability.
A key element of our business strategy involves expansion through the acquisition of businesses, assets, products, or technologies that allow us to complement our existing product offerings, expand our market coverage, increase our engineering workforce or enhance our technological capabilities. Accordingly, our future performance will be impacted by our ability to identify appropriate businesses and technologies to acquire, as well as effectively and efficiently integrating such acquisitions into Rogers. We may not succeed in such endeavors for a variety of reasons, including, but not limited to, the inability to identify businesses that have the technology or resources we need and, if we find such businesses, the possibility that we may not be able to purchase or license the technology or resources on commercially favorable terms or at all and, if we do make an acquisition, the possibility that we may not be able to effectively integrate the acquisition into Rogers.
In 2011, we purchased Curamik, an acquisition that required a significant level of investment. This required borrowing funds through our credit facility, which created long-term debt and made us subject to the various covenant requirements contained in the related credit agreement. Certain risks are inherent in any acquisition, such as the risk that the acquisition may not be accretive to our business or perform to our expectations going forward and that revenue opportunities, cost savings and other anticipated synergies will not be fully realized. In addition, there are more particular risks relating to Curamik itself, including, but not limited to, the following: a decline in sales to certain key customers; the cyclical nature of the semiconductor industry and the impact of that cyclicality on sales and profits; the strict nature of labor laws in Germany and the impact on our ability to manage costs and react to downturns in the market; and increased exposure to significant fluctuations in raw material and commodity costs, particularly copper, which is a key component in Curamik's manufacturing process. Curamik's present level of in-house ceramic technical knowledge and lack of ceramic production capability may limit its ability to respond quickly to customer requirements and prevent it from adequately controlling ceramic raw material costs.
We also continually review our current business and product portfolio to attempt to maximize our business performance. We may in the future deem it appropriate to pursue the divestiture of product lines or businesses as conditions dictate. These strategic decisions could have a potential negative impact on our business. A successful divestiture depends on various factors, including our ability to effectively transfer liabilities, contracts, facilities and employees to any purchaser, identify and separate the intellectual property to be divested from the intellectual property that we wish to retain, reduce fixed costs previously associated with the divested assets or business, and collect the proceeds from any divestitures. In addition, if customers of the divested business do not receive the same level of service from the new owners, this may adversely affect our other businesses to the extent that these customers also purchase other products offered we offer. All of these efforts require varying levels of management resources, which may divert our attention from other business operations. If we do not realize the expected benefits or synergies of any divestiture transaction, our financial position, results of operations and cash flows could be negatively impacted.
We are involved with certain litigation and disputes and may become involved in future litigation or other disputes all of which could give rise to potential contingencies, such as environmental, product liability and/or warranty claims, that could be costly to bring or defend and could result in a significant negative impact to our business.
We are subject to a variety of claims and lawsuits arising out of the conduct of our business that could ultimately have a material adverse impact on our business, including our results of operations, financial condition and cash flows. Such claims could result from environmental issues, product liability claims and general commercial litigation, among others.
Our products are typically highly specialized, proprietary materials that must meet very stringent performance requirements. We invest significant resources in the testing of our products to meet our product specifications. However, if any of our materials or products contain or are alleged to contain defects, we may be required to incur additional development and remediation costs or defend product liability claims arising from the alleged defects.
We are also subject to a variety of environmental issues, particularly considering the age of our business and the range of geographic areas and manufacturing processes we have been involved in over the course of time. Our estimation of any environmental liability is based on an evaluation of currently available information with respect to the situation, including existing technology, presently enacted laws and regulations, and our past experience in addressing environmental matters. However, there can be no assurances

14
that our estimates will not be disputed or that any ultimate liability concerning this site will not have a material adverse effect on us.
We are currently engaged in proceedings involving a superfund site, as a participant in a group of potentially responsible parties (PRPs). Although current regulations impose potential joint and several liability upon each named party at any superfund site, we expect our contribution for cleanup to be limited due to the number of other PRPs, and our share of the alleged contributions of waste to the sites, which we believe is de minimis.We are also involved in the remediation of certain polychlorinated biphenyl (PCB) contamination at our Woodstock, Connecticut manufacturing facility.
Further, we are involved in certain asbestos-related product liability litigation. The level of such litigation has escalated in certain U.S. states in recent years and involves hundreds of companies that have been named as defendants. At December 31, 2012, there were 319 claims pending against us. We expect that additional claims will be brought against us in the future. Our ultimate liability with respect to such pending and unasserted claims is subject to various uncertainties, including the following:
• the number of claims that are brought in the future;• the costs of defending and settling these claims;• the risk of exhaustion of applicable insurance policies;• the risk of insolvencies among our insurance carriers;• the possibility that adverse jury verdicts could require us to pay damages in amounts greater than the amounts for which
we have historically settled claims; and • the risk of adverse changes in the Federal and state laws governing the compensation of asbestos claimants.
We believe we have sufficient insurance to cover the majority of costs related to these claims and that we have valid defenses to the majority of these claims and intend to defend ourselves vigorously in these matters. However, there can be no assurances that the ultimate resolution of these matters will be consistent with our expectations and will not have a material adverse effect on us. For further information, see Item 3 Legal Proceedings and Note 14 in Item 8 Financial Statements and Supplementary Data of this Form 10-K.
We are subject to increasingly strict environmental regulations, which could increase our expense and affect our operating results.
Our business is subject to increasingly strict environmental regulations that control and restrict the use, transportation, emission, discharge, storage and disposal of certain chemicals, gases and other substances used or produced in our various manufacturing processes. Public attention to environmental controls has continued to increase and changes in environmental regulations may require us to invest in potentially costly pollution control equipment or alter the way our products are made. In addition, we use hazardous and regulated materials that subject us to risks for strict liability for damages caused by accidental releases, regardless of fault. Any failure to control such materials adequately or to comply with regulatory restrictions or contractual obligations could increase our expenses and adversely affect our operating results.
New climate change regulations could require us to change our manufacturing processes or obtain substitute materials that may cost more or be harder to procure for our manufacturing operations. In addition, new restrictions on carbon dioxide or other greenhouse gas emissions could result in additional costs for us. Greenhouse gas legislation has been introduced in the U.S. legislature and we expect increased worldwide regulatory activity in the future. The cost of complying, or of failing to comply, with these and other climate change and emissions regulations could have an adverse effect on our business plans and results of operations.
Our current reserve levels may not be adequate to cover potential exposures.
We establish reserves to cover various exposures, including uncollectible accounts receivable, excess or obsolete inventory, fair market value write-downs of certain assets, and various other liabilities. However, these reserves may not be adequate to cover future impairments or losses. These reserves are subject to analysis and adjustment on a regular basis and are based on management's best estimates based on the facts and circumstances known at the time. Such reserves are subject to many uncertainties, including the assumptions used to value certain assets, forward looking forecasted financial information, and bankruptcy or financial problems at key customers, among others. In the case of litigation matters for which reserves have not been established because the loss is not deemed probable or reasonably estimable, facts and circumstances could change related to such matters that could result in such matters being decided against us and require the payment of damages or other expenditures in amounts that are not presently accrued. The effects on our financial results of many of these factors depend in some cases on our ability to obtain insurance covering potential losses.

15
If we are unable to generate sufficient cash flow, we may not be able to service our debt obligations, including making payments on our outstanding line of credit.
In the first quarter of 2011, we borrowed $145.0 million against our existing line of credit to finance our strategic acquisition of Curamik and have $98.0 million of outstanding debt remaining at December 31, 2012. Our ability to make payments of principal and interest on our indebtedness when due depends upon the cash flows generated from our future performance, which will be subject to general economic conditions, industry cycles and financial, business and other factors affecting our consolidated operations, many of which are beyond our control. If we are unable to generate sufficient cash flow from operations in the future to service our debt, we may be required to, among other things, seek additional financing in the debt or equity markets; refinance or restructure all or a portion of our indebtedness; sell selected assets; reduce or delay planned capital expenditures; or reduce or delay planned operating expenditures. Such measures might not be sufficient to enable us to service our debt, which could negatively impact our financial results. In addition, any such financing, refinancing, or sale of assets might not be available on economically favorable terms. In addition, our indebtedness could require us to dedicate a substantial portion of our cash flows from operations to payments on our debt, thereby reducing the amount of cash flows available for working capital, capital expenditures, investments in technology and research and development, acquisitions, dividends and other general corporate purposes; limit our flexibility in planning for, or reacting to, changes in the industries in which we compete; place us at a competitive disadvantage compared to our competitors, some of whom have lower debt service obligations and greater financial resources than we do; limit our ability to borrow additional funds; or increase our vulnerability to general adverse economic and industry conditions.
Restrictions in our credit facility may limit our activities and materially and adversely affect our assets, financial position and cash flows.
Our current credit facility imposes, and future debt instruments to which we may become subject may impose, certain restrictions that limit our ability to engage in activities that could otherwise benefit the Company, including undertaking certain transactions, creating certain credit lines on our assets and incurring certain subsidiary indebtedness, among others. Our ability to comply with these financial restrictions and covenants is dependent on the cash flows generated from our future performance, which is subject to prevailing economic conditions and other factors, including factors that are beyond our control, as further discussed in this Item 1A. In addition, our credit facility requires us to maintain compliance with specified financial ratios. If we breach any of the covenants under our credit facility and we do not obtain appropriate waivers, our operations may be negatively impacted by the consequences of such breaches, including the declaration of any outstanding indebtedness to be immediately due and payable.
Changes in tax rates and exposure may lead to additional income tax liabilities.
We are subject to income taxes in both the U.S. and various foreign jurisdictions, and our domestic and international tax liabilities are subject to the allocation of income among these different jurisdictions. Our effective tax rates could be adversely affected by changes in the mix of earnings in countries with differing statutory tax rates, increases in tax rates, changes in the valuation of deferred tax assets and liabilities or in tax laws, each of which could adversely affect our profitability. In particular, the carrying value of deferred tax assets is dependent on our ability to generate future taxable income. In addition, the amount of income taxes we pay is subject to audits in various jurisdictions, and a material assessment by a tax authority could adversely affect profitability.
The requirements to evaluate goodwill and non-amortizable assets for impairment may result in a write-off of all or a portion of our recorded amounts, which would negatively affect our operating results and financial condition.
We are required to perform an impairment review of both goodwill and non-amortizable intangible assets on an annual basis, or when facts and circumstances around such assets indicate the potential for an impairment to have occurred. In 2012, we did not have an impairment of our goodwill or non-amortizable intangible assets; however, there can be no assurances that future impairments will not occur. Any impairment may result in a write-off of all or a portion of our recorded amounts, which would negatively affect our operating results and financial condition.
Our stock price may be volatile.
The market price of our common stock has fluctuated widely from the beginning of fiscal year 2010 through the end of fiscal year 2012, with our stock price reaching a high of $ 52.44 per share and a low of $23.57 per share during that time period. Consequently, the current market price of our common stock may not be indicative of future market prices, and we may be unable to sustain or increase the value of an investment in our common stock. Factors affecting our stock price may include, but are not limited to, the following:
• changes in the long-term outlook for our Company in the markets we serve;• variations in operating results from quarter to quarter;• changes in earnings estimates by analysts or our failure to meet analysts' expectations;

16
• changes in the market value of publicly traded customers or suppliers, which could decrease their demand for our products;• market conditions in the industries and markets in which we participate;• general economic conditions;• political changes, hostilities or natural disasters such as hurricanes and floods; and• low trading volume of our common stock.
In addition, the New York Stock Exchange can experience significant price and volume fluctuations and continued market fluctuations could adversely affect the market price of our stock.
Employee benefit cost increases could reduce our profitability.
Our profitability is affected by employee benefit costs, particularly medical, pension and other employee benefits. In recent years, employee medical costs have increased due to factors such as the increase in health care costs in the U.S. These factors will continue to put pressure on our business and financial performance, as employee benefit costs continue to escalate. Although we actively seek to control increases in employee benefit costs and encourage employees to maintain healthy lifestyles to reduce future potential medical costs, there can be no assurance that we will succeed in limiting future cost increases. Continued employee benefit cost increases could have an adverse effect on our results of operations, cash flows and financial condition.
We also sponsor a limited number of defined benefit plans that cover certain employees. Our costs of providing defined benefit plans have risen dramatically over the past few years, and are dependent upon a number of factors and assumptions that drive our projected liabilities and annual expenses, such as discount rates, the actual and projected rates of return on the plans' assets, governmental regulation, global equity prices, portfolio composition and our required and/or voluntary contributions to the plans. Changes in assumptions, the ability to grow our pension investments over time to increase the value of the plans' assets, and other factors relating to worldwide and domestic economic trends and financial market conditions, could all have a negative impact on our pension plans, which could result in an increase in our pension liabilities, a reduction in the funded status of our plan, increases in annual expense recognized related to the plans, and requirements to increase funding for some or all of our defined benefit plans, among other factors, all of which could negatively impact our operations and financial condition.
Security breaches and other disruptions could compromise our information and expose us to liability, which could adversely affect our business/operating revenues, margins, competitive position and reputation.
In the ordinary course of our business, we collect and store sensitive data, including intellectual property, our proprietary business information and that of our customers and business partners, and personally identifiable information of our employees, in our data centers and on our networks. The secure processing, maintenance and transmission of this information is critical to our operations and business strategy. Despite our security measures, our information technology and infrastructure may be vulnerable to attacks by hackers or breached due to employee error, malfeasance or other disruptions. Any such breach could compromise our networks and the information stored there could be accessed, publicly disclosed, lost or stolen. Any such access, disclosure or other loss of information could result in legal claims or proceedings, liability under laws that protect the privacy of personal information, regulatory penalties, disruption to our operations, and damage to our reputation, which could adversely affect our business/operating revenues, margins, competitive position and reputation.
Our business could be negatively affected by collective labor arrangements and labor laws.
We have one U.S. collective bargaining unit and various non-U.S. collective labor arrangements. We are subject to potential work stoppages, union and works council campaigns and potential labor disputes, any of which could adversely impact our productivity and results of operations. In addition, collective bargaining agreements, union contracts and labor laws may impair our ability to reduce our labor costs by streamlining existing manufacturing facilities and in restructuring our business because of limitations on personnel and salary changes and similar restrictions. Further, we may be subject to work stoppages, which are beyond our control, at our suppliers or customers
Our business could be negatively affected by unanticipated events that are beyond our control.
Our business and operating results may be affected by certain events that we cannot anticipate and that are beyond our control, such as natural disasters and national emergencies, which could disrupt production at our facilities, or at the facilities of our customers and suppliers, and cause delayed deliveries, canceled orders and possibly loss of market share. From time to time, we purchase certain raw materials from single or limited sources, and, even if our facilities are not directly affected by such events, we could be affected by interruptions of production at our suppliers. In addition, our customers could be affected by certain events, which could decrease demand for our products.

17
Item 1B. Unresolved Staff Comments
None.
Item 2. Properties
On December 31, 2012, we operated various manufacturing facilities and sales offices throughout the United States, Europe and Asia. The following table provides certain information about our principal general offices and manufacturing facilities:
Location Floor Space (Sq Ft) Type of Facility Leased / Owned
United States
Rogers, Connecticut 506,000 Manufacturing / Administrative Offices Owned
Carol Stream, Illinois 215,000 Manufacturing Owned
Chandler, Arizona 156,000 Manufacturing Owned
Woodstock, Connecticut 152,000 Manufacturing Owned
Chandler, Arizona 142,000 Manufacturing Owned
Chandler, Arizona 120,000 Manufacturing Owned
Windham, Connecticut 88,000 Formerly Manufacturing Owned
Dallas, Texas 2,000 Sales Office Leased through 11/13
Belgium
Ghent, Belgium 114,000 Manufacturing Owned
Evergem, Belgium 77,000 Manufacturing Owned
Germany
Eschenbach, Germany 149,000 Manufacturing / Administrative Offices Leased through 6/21
Bremen, Germany 68,000 Manufacturing / Administrative Offices Leased through 01/13
Asia
Suzhou, China 324,000 Manufacturing Owned
Suzhou, China 170,000 Manufacturing / Administrative Offices Owned
Suzhou, China 130,000 Manufacturing Owned
Suzhou, China 92,000 Manufacturing Owned
Ansan, Korea 40,000 Manufacturing Leased through 10/13
Suzhou, China 30,000 Manufacturing Owned
Tokyo, Japan 3,094 Sales Office Leased through 1/14
Taipei, Taiwan, R.O.C. 1,000 Sales Office Leased through 7/13
Hwasung City, Korea 1,000 Sales Office Leased through 8/13
Singapore 1,000 Sales Office Leased through 10/13
Shanghai, China 1,000 Sales Office Leased through 7/13
Shenzhen, China 1,000 Sales Office Leased through 5/14
Beijing, China 1,000 Sales Office Leased through 5/15

18
Item 3. Legal Proceedings
We are currently engaged in the following environmental and legal proceedings:
Superfund Sites
We are currently involved as a potentially responsible party (PRP) in one active case involving a waste disposal site, the Chatham Superfund Site. The costs incurred since inception for this claim have been immaterial and have been primarily covered by insurance policies, for both legal and remediation costs. In this matter we have been assessed a cost sharing percentage of approximately 2% in relation to the range for estimated total cleanup costs of $17.0 million to $24.0 million. We believe we have sufficient insurance coverage to fully cover this liability and have recorded a liability and related insurance receivable of approximately $0.3 million as of December 31, 2012, which approximates our share of the low end of the estimated liability range. We believe we are a de minimis participant at this site and, as such, have been allocated an insignificant percentage of the total PRP cost sharing responsibility. Based on facts presently known to us, we believe that the potential for the final results of this case having a material adverse effect on our results of operations, financial position or cash flows is remote. This case has been ongoing for many years and we believe that it will continue on for the indefinite future. No time frame for completion can be estimated at the present time.
In the fourth quarter of 2011, the United States Environmental Protection Agency (EPA) notified us that we were a PRP for the cleanup of the Omega Chemical Corporation Superfund Site in Los Angeles County, California. In the first quarter of 2012, we were notified that we were no longer a PRP related to this superfund site.
PCB Contamination
We have been working with the Connecticut Department of Energy and Environmental Protection (CT DEEP) and the EPA, Region I, in connection with certain polychlorinated biphenyl (PCB) contamination at our facility in Woodstock, Connecticut. The issue was originally discovered in the soil at the facility in the late 1990s, and this initial issue was remediated in 2000. Further contamination was later found in the surrounding groundwater, which we addressed in 2011 with the installation of a pump and treat system. To date, we have spent approximately $2.5 million in remediation and monitoring costs related to these issues and expect to incur future costs, related primarily to the maintenance of the pump and treat system now in place at the site, to be de minimis.
As we were remediating the groundwater contamination issue, we discovered additional PCB contamination in the building at this facility during the first quarter of 2010. Remediation costs related to this contamination are expected to approximate $1.0 million, which was recorded as our original liability during 2010. To date, we have incurred $0.7 million in remediation costs related to this issue and anticipate that the remaining reserve of $0.3 million will be adequate to cover the remaining remediation work related to this issue.
We believe that these efforts will continue for several more years and no time frame for completion can be estimated at the present time.
Asbestos Litigation
A significant number of asbestos-related product liability claims have been brought against numerous United States industrial companies where the third-party plaintiffs allege personal injury from exposure to asbestos-containing products. We have been named, along with hundreds of other companies, as a defendant in some of these claims. In virtually all of these claims filed against us, the plaintiffs are seeking unspecified damages, or, if an amount is specified, such amount merely represents a jurisdictional amount. However, occasionally specific damages are alleged and in such situations, plaintiffs' lawyers often sue dozens of defendants, frequently without factual basis or support. As a result, even when a specific amount of damages is alleged, such action can be arbitrary, both as to the amount being sought and the defendant being charged with such damages.
We did not mine, mill, manufacture or market asbestos; rather we made a limited number of products which contained encapsulated asbestos. Such products were provided to industrial users. We stopped manufacturing these products in the late 1980s.
• Claims
We have been named in asbestos litigation primarily in Illinois, Pennsylvania and Mississippi. As of December 31, 2012, there were 319 pending claims compared to 242 pending claims at December 31, 2011. The number of pending claims at a particular time can fluctuate significantly from period to period depending on how successful we have been in getting these cases dismissed or settled. Some jurisdictions prohibit specifying alleged damages in personal injury tort cases such as these, other than a minimum jurisdictional amount which may be required for such reasons as allowing the case to be litigated in a jury trial (which the plaintiffs believe will be more favorable to them than if heard only before a judge) or allowing the case to be litigated in federal court. This is in contrast to commercial litigation, in which specific alleged damage claims are often permitted. The prohibition on specifying

19
alleged damages sometimes applies not only to the suit when filed but also during the trial – in some jurisdictions the plaintiff is not actually permitted to specify to the jury during the course of the trial the amount of alleged damages the plaintiff is claiming. Further, in those jurisdictions in which plaintiffs are permitted to claim specific alleged damages, many plaintiffs nonetheless still choose not to do so. In those cases in which plaintiffs are permitted to and choose to assert specific dollar amounts in their complaints, we believe the amounts claimed are typically not meaningful as an indicator of a company’s potential liability. This is because (1) the amounts claimed may bear no relation to the level of the plaintiff’s injury and are often used as part of the plaintiff’s litigation strategy, (2) the complaints typically assert claims against numerous defendants, and often the alleged damages are not allocated against specific defendants, but rather the broad claim is made against all of the defendants as a group, making it impossible for a particular defendant to quantify the alleged damages that are being specifically claimed against it and therefore its potential liability, and (3) many cases are brought on behalf of plaintiffs who have not suffered any medical injury, and ultimately are resolved without any payment or payment of a small fraction of the damages initially claimed. Of the 319 claims pending as of December 31, 2012, 72 claims do not specify the amount of damages sought, 245 claims cite jurisdictional amounts, and only two (2) claims (less than 1.0% of the total pending claims) specify the amount of damages sought not based on jurisdictional requirements. Of these two (2) claims, one (1) claim alleges compensatory and punitive damages of $20 million each and one (1) claim alleges compensatory damages of $65 million and punitive damages of $60 million. These two (2) claims name between ten (10) and 21 defendants. However, for the reasons cited above, we do not believe that this data allows for an accurate assessment of the relation that the amount of alleged damages claimed might bear to the ultimate disposition of these cases.
We believe the rate at which plaintiffs filed asbestos-related suits against us increased in 2001, 2002, 2003 and 2004 because of increased activity on the part of plaintiffs to identify those companies that sold asbestos-containing products, but which did not directly mine, mill or market asbestos. A significant increase in the volume of asbestos-related bodily injury cases arose in Mississippi in 2002. This increase in the volume of claims in Mississippi was apparently due to the passage of tort reform legislation (applicable to asbestos-related injuries), which became effective on September 1, 2003 and which resulted in a higher than average number of claims being filed in Mississippi by plaintiffs seeking to ensure their claims would be governed by the law in effect prior to the passage of tort reform. The number of asbestos related suits filed against us decreased slightly in 2005 and 2006, but increased slightly in 2007, declined in 2008 and increased again in 2009 and 2010. The number of lawsuits filed against us in 2011 and 2012 was significantly higher than in 2010. These new lawsuits are reflected on the NERA and Marsh reports. (See "Impact of Financials Statements" section below.)
• Defenses
In many cases, plaintiffs are unable to demonstrate that they have suffered any compensable loss as a result of exposure to our asbestos-containing products. We continue to believe that a majority of the claimants in pending cases will not be able to demonstrate exposure or loss. This belief is based in large part on two factors: the limited number of asbestos-related products manufactured and sold by us and the fact that the asbestos was encapsulated in such products. In addition, even at sites where the presence of an alleged injured party can be verified during the same period those products were used, our liability cannot be presumed because even if an individual contracted an asbestos-related disease, not everyone who was employed at a site was exposed to the asbestos containing products that we manufactured. Based on these and other factors, we have and will continue to vigorously defend ourselves in asbestos-related matters.
• Dismissals and Settlements
Cases involving us typically name 50-300 defendants, although some cases have had as few as one (1) and as many as 833 defendants. We have obtained dismissals of many of these claims. For the year ended December 31, 2012, we were able to have 93 claims dismissed and settled sixteen (16) claims. For the year ended December 31, 2011, 120 claims were dismissed and eight (8) were settled. The majority of costs have been paid by our insurance carriers, including the costs associated with the small number of cases that have been settled. Such settlements totaled approximately $6.3 million for the year ended December 31, 2012, compared to $8.1 million for the year ended 2011 and such settlement amounts were paid by our insurance carriers. Although these figures provide some insight into our experience with asbestos litigation, no guarantee can be made as to the dismissal and settlement rates that we will experience in the future.
Settlements are made without any admission of liability. Settlement amounts may vary depending upon a number of factors, including the jurisdiction where the action was brought, the nature and extent of the disease alleged and the associated medical evidence, the age and occupation of the claimant, the existence or absence of other possible causes of the alleged illness of the alleged injured party and the availability of legal defenses, as well as whether the action is brought alone or as part of a group of claimants. To date, we have been successful in obtaining dismissals for many of the claims and have settled only a limited number. The majority of settled claims were settled for immaterial amounts, and the majority of such costs have been paid by our insurance carriers. In addition, to date, we have not been required to pay any punitive damage awards.

20
• Potential Liability
National Economic Research Associates, Inc. (NERA), a consulting firm with expertise in the field of evaluating mass tort litigation asbestos bodily-injury claims, has historically been engaged to assist us in projecting our future asbestos-related liabilities and defense costs with regard to pending claims and future unasserted claims. Projecting future asbestos costs is subject to numerous variables that are extremely difficult to predict, including the number of claims that might be received, the type and severity of the disease alleged by each claimant, the long latency period associated with asbestos exposure, dismissal rates, costs of medical treatment, the financial resources of other companies that are co-defendants in claims, uncertainties surrounding the litigation process from jurisdiction to jurisdiction and from case to case and the impact of potential changes in legislative or judicial standards, including potential tort reform. Furthermore, any predictions with respect to these variables are subject to even greater uncertainty as the projection period lengthens. In light of these inherent uncertainties, the variability of our claims history and consultations with NERA, we currently believe that ten years is the most reasonable period for recognizing a reserve for future costs, and that costs that might be incurred after that period are not reasonably estimable at this time. As a result, we also believe that our ultimate asbestos-related contingent liability (i.e., our indemnity or other claim disposition costs plus related legal fees) cannot be estimated with certainty. (See "Impact of Financials Statements" section below for further discussion.)
• Insurance Coverage
Our applicable insurance policies generally provide coverage for asbestos liability costs, including coverage for both resolution and defense costs. Following the initiation of asbestos litigation, an effort was made to identify all of our primary, umbrella and excess level insurance carriers that provided applicable coverage beginning in the 1950s through the mid-1980s. Where appropriate, carriers were put on notice of the litigation. Marsh USA, Inc., also known as Marsh Risk Consulting (Marsh), a consulting firm with expertise in the field of evaluating insurance coverage and the likelihood of recovery for asbestos-related claims, has historically been engaged to work with us to project our insurance coverage for asbestos-related claims. Marsh’s conclusions are based primarily on a review of our coverage history, application of reasonable assumptions on the allocation of coverage consistent with certain industry practices, an assessment of the creditworthiness of the insurance carriers, analysis of applicable deductibles, retentions and policy limits, the experience of NERA and a review of NERA’s reports.
• Cost Sharing Agreement
To date, our insurance carriers have paid for substantially all of the settlement and defense costs associated with our asbestos-related claims. The current cost sharing agreement between us and such insurance carriers is primarily designed to facilitate the ongoing administration and payment of such claims by the carriers until the applicable insurance coverage is exhausted. This four year agreement expires on January 25, 2015 and replaced an older agreement that had expired.
In 2012, the primary layer insurance policies providing coverage for the January 1, 1967 to June 30, 1969 period exhausted. The cost sharing agreement contemplates that any excess carrier over exhausted primary layer carriers will become a party to the cost sharing agreement, replacing the coverage provided by the exhausted primary policies if the carrier providing such excess coverage is not already a party to the cost sharing agreement. The excess carrier providing coverage for the period set forth above is not already a party to the cost sharing agreement. Such excess carrier has been notified of the exhaustion and is reviewing the cost sharing agreement at this time, but is currently providing applicable insurance coverage.
• Impact on Financial Statements
The models developed for determining the potential exposure and related insurance coverage were developed by outside consultants deemed to be experts in their respective fields with the forecast for asbestos related liabilities generated by NERA and the related insurance receivable projections developed by Marsh. The models contain numerous assumptions that significantly impact the results generated by the models. We believe the assumptions made are reasonable at the present time, but are subject to uncertainty based on the actual future outcome of our asbestos litigation. Historically, due to the inherent uncertainties of the forecast process and our limited amount of settlement and claims history, we utilized a forecast period of five years, which we concluded was the most reasonable period for recognizing a reserve for projected asbestos liabilities, and that costs that might be incurred after that period were not reasonably estimable at that time. In 2012, we reviewed this assumption and determined that it was appropriate to extend the forecast period from five years to 10 years. We reached this conclusion due to the fact that we now have considerably more experience in addressing asbestos related lawsuits and have a longer history of activity to use as a baseline to more accurately project the liability over a longer period than previously disclosed. Further, settlement trends have become more meaningful in recent years and we believe that we now have a more meaningful history of data on which to base our projections. Further, we determined that a 10 year projection period is now appropriate as, although we have a longer and more consistent history of data over the last few years, we do not believe we have sufficient data to justify a longer projection period at this time.As of December 31, 2012, the estimated liability and estimated insurance recovery for the ten-year period through 2022 was $51.4 million and $48.3 million, respectively, resulting in an additional charge of $2.9 million recognized in the fourth quarter of 2012 ($0.2 million was previously recognized throughout 2012). For sensitivity purposes, if the forecast period was decreased to five years, the projected liability and related insurance recovery would be $30.1 million and $29.2 million, respectively. Also, if the forecast

21
period was increased to fifteen years, the projected liability and related insurance recovery would be $67.9 million and $63.3 million, respectively.
The amounts recorded for the asbestos-related liability and the related insurance receivables described above were based on facts known at the time and a number of assumptions. However, projecting future events, such as the number of new claims to be filed each year, the average cost of disposing of such claims, the length of time it takes to dispose of such claims, coverage issues among insurers and the continuing solvency of various insurance companies, as well as the numerous uncertainties surrounding asbestos litigation in the United States could cause the actual liability and insurance recoveries for us to be higher or lower than those projected or recorded.
There can be no assurance that our accrued asbestos liabilities will approximate our actual asbestos-related settlement and defense costs, or that our accrued insurance recoveries will be realized. We believe that it is reasonably possible that we will incur additional charges for our asbestos liabilities and defense costs in the future, which could exceed existing reserves, but such excess amount cannot be reasonably estimated at this time. We will continue to vigorously defend ourselves and believe we have substantial unutilized insurance coverage to mitigate future costs related to this matter.
Other Environmental and General Litigation
• In the second quarter of 2010, the CT DEEP contacted us to discuss a disposal site in Killingly, Connecticut. We are currently in the very early stages of evaluating this matter and have initiated internal due diligence work related to the site to better understand the issue and our alleged involvement. Currently, we do not know the nature and extent of any alleged contamination at the site, how many parties could be potentially involved in any remediation, if necessary, or the extent to which we could be deemed a potentially responsible party. CT DEEP has not made any assessment of the nature of any potential remediation work that may be done, nor have they made any indication of any potential costs associated with such remediation. Therefore, based on the facts and circumstances known to us at the present time, we are not able to estimate the probability of incurring a contingent liability related to this site, nor are we able to reasonably estimate any potential range of exposure at this time. As such, no reserve has been established for this matter at this time. We continually monitor this situation and are in correspondence with the CT DEEP as appropriate. When and if facts and circumstances related to this mater change, we will review our position and our ability to estimate the probability of any potential loss contingencies, as well as the range of any such potential exposure.
• The Rogers Corporate Headquarters located in Rogers, Connecticut is part of the Connecticut Voluntary Corrective Action Program (VCAP). As part of this program, we have started conversations with the CT DEEP to begin to determine if any corrective actions need to be taken at the site related to any potential contamination issues. We are currently in the very early stages of evaluating this matter and have initiated internal due diligence work related to the site to better understand any potential issues. However, at this time, it is currently unknown what the nature and extent of any potential contamination is at the site, nor what any potential remediation or associated costs would be if any such issues were found. Therefore, based on the facts and circumstances known to us at the present time, we are unable to estimate the probability of incurring a contingent liability related to this site, nor are we able to reasonably estimate any potential range of exposure at this time. As such, no reserve has been established for this matter at this time.
In addition to the above issues, the nature and scope of our business brings us in regular contact with the general public and a variety of businesses and government agencies. Such activities inherently subject us to the possibility of litigation, including environmental and product liability matters that are defended and handled in the ordinary course of business. We have established accruals for matters for which management considers a loss to be probable and reasonably estimable. It is the opinion of management that facts known at the present time do not indicate that such litigation, after taking into account insurance coverage and the aforementioned accruals, will have a material adverse impact on our results of operations, financial position, or cash flows.
For additional discussion on our environmental and litigation matters, see Note 14 to the Consolidated Financial Statements in Item 8 of this Form 10-K.
Item 4. Mine Safety Disclosures
Not applicable.

22
Part II
Item 5. Market for Registrant's Common Equity, Related Stockholder Matters and Issuer Purchases of Equity Securities
Our common stock is traded on the New York Stock Exchange under the symbol “ROG”. As of the end of business on February 4, 2013, we had 577 shareholders of record. On the same date, the trading price of our common stock closed at $46.80 per share.
Capital Stock Market Prices
The following table sets forth the high and low prices during each quarter of the last two fiscal years on a per share basis:
2012 2011High Low High Low
Fourth $ 50.09 $ 38.39 $ 45.33 $ 35.88Third 44.55 34.61 52.44 38.39Second 41.24 35.87 48.00 39.96First 42.29 32.19 47.99 38.91
Dividend Policy
We did not pay any dividends on our common stock in fiscal 2012 and 2011. We periodically evaluate the desirability of paying a dividend; however, at present, we expect to maintain a policy of emphasizing longer-term growth of capital rather than immediate dividend income. We are also currently restricted in our ability to pay dividends under our current, amended credit agreement (see Item 7. Management's Discussion and Analysis of Financial Condition and Results of Operations in this Form 10-K), in that we cannot make cash dividend payments if a default or event of default has occurred and is continuing or shall result from the cash dividend payment.

23
Item 6. Selected Financial Data
(Dollars in thousands, except per share amounts)
2012 2011 2010 2009 2008Sales and Income From Continuing Operations
Net sales $ 498,761 $ 548,341 $ 373,230 $ 286,777 $ 359,357Income (loss) before income taxes 22,650 55,768 44,401 (16,555) 27,781Income (loss) 69,134 44,250 38,551 (59,185) 23,319
Per Share Data From Continuing Operations
Basic $ 4.21 $ 2.76 $ 2.44 $ (3.77) $ 1.38Diluted 4.07 2.64 2.41 (3.77) 1.36Book value 25.68 20.85 20.87 18.61 21.47
Financial Position From Continuing Operations
Current assets $ 306,190 $ 264,789 $ 220,590 $ 163,391 $ 183,263Current liabilities 84,502 78,558 65,246 42,802 59,574Ratio of current assets to current liabilities 3.6 to 1 3.4 to 1 3.4 to 1 3.8 to 1 3.1 to 1
Cash, cash equivalents and short-term investments $ 114,863 $ 79,728 $ 80,321 $ 58,137 $ 70,625Working capital 221,688 186,231 155,344 120,589 123,689Property, plant and equipment, net 149,017 148,182 118,804 121,812 143,145Total assets 759,278 676,785 482,598 405,327 472,326Long-term debt and lease obligation less currentmaturities 84,442 122,610 — — —Shareholders’ equity 434,152 338,256 330,532 292,950 336,144Long-term debt as a percentage of shareholders’equity 19.4% 36.2% — — —
Other DataDepreciation and amortization from continuingoperations $ 27,130 $ 26,308 $ 15,700 $ 17,212 $ 18,397Research and development expenses fromcontinuing operations 19,311 21,530 17,754 17,301 21,858Capital expenditures from continuing operations 23,774 21,316 12,241 12,087 21,004Number of employees (average) 2,441 2,566 1,940 1,735 1,960Net sales per employee (in thousands) $ 204 $ 214 $ 192 $ 165 $ 183Number of shares outstanding at year end 16,904,441 16,220,648 15,841,341 15,743,491 15,654,123
The financial data included within the preceding table should be read in conjunction with our Management's Discussion and Analysis of Financial Condition and Results of Operations as well as the Financial Statements and Supplementary Data (Items 7 and 8 of this Form 10-K), and with our previously filed Forms 10-K.

24
Item 7. Management's Discussion and Analysis of Financial Condition and Results of Operations
The following discussion and analysis of our financial condition and results of operations should be read together with the Selected Financial Data and our Consolidated Financial Statements and the related notes that appear elsewhere in this Form 10-K.
Forward Looking Statements
Certain statements in this Form 10-K may constitute “forward-looking statements” within the meaning of the Private Securities Litigation Reform Act of 1995. Such forward-looking statements are based on management's expectations, estimates, projections and assumptions. Words such as “expects,” “anticipates,” “intends,” “believes,” “estimates,” “should,” “target,” “may,” “project,” “guidance,” and variations of such words and similar expressions are intended to identify such forward-looking statements. Such forward-looking statements involve known and unknown risks, uncertainties, and other factors that may cause our actual results or performance to be materially different from any future results or performance expressed or implied by such forward-looking statements. Such factors include, but are not limited to, changing business, economic, and political conditions both in the United States and in foreign countries, particularly in light of the sovereign debt crisis being experienced globally and the uncertain outlook for global economic growth, particularly in several of our key markets; uncertainty regarding resolution of the United States fiscal cliff and debt ceiling issues; increasing competition; any difficulties in integrating acquired businesses into our operations and the possibility that anticipated benefits of acquisitions and divestitures may not materialize as expected; delays or problems in completing planned operational enhancements to various facilities; our achieving less than anticipated benefits and/or incurring greater than anticipated costs relating to streamlining initiatives or that such initiatives may be delayed or not fully implemented due to operational, legal or other challenges; changes in product mix; the possibility that changes in technology or market requirements will reduce the demand for our products; the possibility of significant declines in our backlog; the possibility of breaches of our information technology infrastructure; the development and marketing of new products and manufacturing processes and the inherent risks associated with such efforts and the ability to identify and enter new markets; the outcome of current and future litigation; our ability to retain key personnel; our ability to adequately protect our proprietary rights; the possibility of adverse effects resulting from the expiration of issued patents; the possibility that we may be required to recognize impairment charges against goodwill and non-amortizable assets in the future; the possibility of increasing levels of excess and obsolete inventory; increases in our employee benefit costs could reduce our profitability; the possibility of work stoppages, union and work council campaigns, labor disputes and adverse effects related to changes in labor laws; the accuracy of our analysis of our potential asbestos-related exposure and insurance coverage; the fact that our stock price has historically been volatile and may not be indicative of future prices; changes in the availability and cost and quality of raw materials, labor, transportation and utilities; changes in environmental and other governmental regulation which could increase expenses and affect operating results; our ability to accurately predict reserve levels; our ability to obtain favorable credit terms with our customers and collect accounts receivable; our ability to service our debt; certain covenants in our debt documents could adversely restrict our financial and operating flexibility; fluctuations in foreign currency exchange rates; and changes in tax rates and exposure which may increase our tax liabilities. Such factors also apply to our joint ventures. We make no commitment to update any forward-looking statement or to disclose any facts, events, or circumstances after the date hereof that may affect the accuracy of any forward-looking statements, unless required by law. Additional information about certain factors that could cause actual results to differ from such forward-looking statements include, but are not limited to, those items described in Item 1A, Risk Factors, in this Form 10K.
Business Overview
Company Background and Strategy
We are a global enterprise that provides our customers with innovative solutions and industry leading products in a variety of markets, including portable communications, communications infrastructure, consumer electronics, mass transit, automotive, defense and clean technology. We generate revenues and cash flows through the development, manufacture, and distribution of specialty material-based products that are sold to multiple customers, primarily original equipment manufacturers (OEMs) and contract manufacturers that, in turn, produce component products that are sold to end-customers for use in various applications. As such, our business is highly dependent, although indirectly, on market demand for these end-user products. Our ability to forecast future sales growth is largely dependent on management's ability to anticipate changing market conditions and how our customers will react to these changing conditions. It is also highly limited due to the short lead times demanded by our customers and the dynamics of serving as a relatively small supplier in the overall supply chain for these end-user products. In addition, our sales represent a number of different products across a wide range of price points and distribution channels that do not always allow for meaningful quantitative analysis of changes in demand or price per unit with respect to the effect on sales and earnings.
Strategically, our current focus is on three mega trends that we believe will fuel the future growth of our Company - continued growth of the internet and the variety of ways in which it can be accessed, expansion of mass transit, and further investment in clean technology. These trends and their related markets all require materials that perform to the highest standards, which has been a key strength of our products over the years. We are also focused on growing our business both organically and through

25
strategic acquisitions or technology investments that will add to or expand our product portfolio, as well as strengthen our presence in existing markets or expand into new markets. We will continue to focus on business opportunities and invest in expansion around the globe. Our vision is to be the leading innovative, growth oriented, and high technology materials solutions provider for our selective markets. To achieve this vision, we must have an organization that can cost effectively develop, produce and market products and services that provide clear advantages for our customers and markets.
2012 Executive Summary
2012 was a year of transition for Rogers Corporation. Under the direction of our management team, led by our new President and CEO, Bruce Hoechner, we implemented several measures to streamline our organization and rationalize our cost structure in order to better position the Company for profitable growth in the future. The goal of these actions is to become a more streamlined company, both from an organizational and cost perspective, that is focused on customer needs, with efficient manufacturing capabilities and an empowered workforce.
The initiatives we implemented occurred over the course of 2012 and touched all areas of the Company. These initiatives included the following: (i) implementation of an early retirement program for certain eligible employees; (ii) realignment of our organizational structure by consolidating a number of senior executive positions, reorganizing certain business functions and redeploying resources across the Company; (iii) shutting down the Power Distribution Systems start-up operation in North America; (iv) liquidating the outstanding auction rate security investments; (v) beginning to close down and relocate certain production at the High Performance Foams manufacturing facility in Bremen, Germany (to be completed in the first quarter of 2013); (vi) shutting down the operations of the non-woven composite materials product lines in Rogers, Connecticut; and (vii) initiating a plan to relocate the final inspection operations of the Curamik Electronics Solutions’ operating segment from its facility in Eschenbach, Germany to a lower cost region in Hungary. We also introduced internal programs for our employees to help build a culture of accountability that we believe will drive us to higher levels of employee and customer satisfaction.
As a result of these streamlining and rationalization initiatives, we have incurred approximately $20.4 million of net pre-tax charges in 2012. We initially anticipated that these actions would result in annualized cost savings of approximately $13.0 million by the end of 2012. However, actual savings began to exceed those projections in the third quarter of 2012, and we now estimate that annualized savings as a result of these initiatives will approach $20.0 million. Some of these savings will be used to reinvest in certain areas of the Company, such as research and development, and in adding resources in strategic areas of the Company, such as sales and marketing, in order to drive future growth. However, we believe that our overall cost structure will remain lower than it was prior to the implementation of these initiatives. Going forward, we will continue to pursue other initiatives aimed at further streamlining our business and reducing our overall cost structure, enabling us to continue to profitably grow the Company.
From an operations perspective, net sales were $498.8 million in 2012, a decline of 9.0% from $548.3 million in 2011. These results are primarily attributable to the decline in sales in the Power Electronics Solutions operating segments, as the Curamik Electronics Solutions (CES) operating segment achieved sales of $92.4 million in 2012, a decline of 30.5% from $132.9 million of net sales in 2011, and the Power Distribution Systems (PDS) operating segment had net sales in 2012 of $41.9 million, an 11.5% decline from $47.3 million in 2011. These declines are primarily attributable to the slowdown of capital infrastructure spending in mass transit, wind energy, and industrial motor drive markets, primarily in Europe and China. We anticipate that these markets will remain at these levels in the near term, but the long term outlook remains positive. Net sales in the High Performance Foams (HPF) operating segment increased by 1.0% to $179.4 million in 2012 from $177.6 million in 2011, while net sales in the Printed Circuit Materials (PCM) operating segment declined by 2.7% from $166.4 million in 2011 to $161.9 million in 2012. We believe that the long term outlook for these segments remains strong as spending in wireless infrastructure and other key markets is projected to increase in the future.
Over the course of 2012, we experienced a steady increase in sales volumes over the first nine months of the year, and achieved improved profitability performance over that time as our streamlining initiatives lowered our overall cost structure, enabling greater profitability per sales dollar. These results were tempered by a decline in sales in the fourth quarter, as we experienced a considerable drop off in orders across all of our businesses at the end of the year. We believe that this decrease in demand was likely related to the broader economic environment, including concerns over the U.S. fiscal cliff issues. The market indices appear to be more positive as we enter 2013, and we believe we will see improved growth as the year unfolds. The outlook for 2013 remains strong, particularly with the build out of 4G/LTE in the telecom space and as the China stimulus package benefits the mass transit and energy markets.
Going forward, we will continue to pursue initiatives aimed at further controlling our cost structure in order to maintain our improved operating leverage. We will also continue to focus on profitable growth as we focus on expanding our application base for current products, while pursuing new opportunities externally. We believe that the actions taken in 2012, as well as our internal initiatives and focus, will enable us to achieve our strategic goals to grow the Company, while increasing value to our shareholders.

26
Results of Continuing Operations
The following table sets forth, for the periods indicated, selected operations data expressed as a percentage of net sales.
2012 2011 2010Net sales 100.0% 100.0% 100.0%Gross margins 31.8% 32.6% 36.7%
Selling and administrative expenses 20.0% 18.9% 23.5%Research and development expenses 3.9% 3.9% 4.8%Restructuring and impairment charges 2.8% 0.1% —Operating income (loss) 5.1% 9.7% 8.6%
Equity income in unconsolidated joint ventures 1.0% 1.0% 2.3%Other income (expense), net —% 0.4% 0.4%Realized gain (loss) (0.7)% —% (0.1)%Interest income (expense), net (0.9)% (0.9)% —Gain on acquisition or disposal — — 0.9%Income (loss) from continuing operations before income taxes 4.5% 10.2% 12.1%
Income tax expense (benefit) (9.3)% 2.1% 1.6%
Income (loss) from continuing operations 13.8% 8.1% 10.5%
2012 vs. 2011
Net Sales
Net sales in 2012 were $498.8 million, a 9.0% decrease from $548.3 million of sales in 2011. The decline in sales in 2012 is primarily related to the performance of the Curamik Electronics Solutions operating segment, which experienced a 30.5% decrease in sales from $132.9 million in 2011 to $92.4 million in 2012, as well as an 11.5% decline in sales in the Power Distribution Systems operating segment from $47.3 million in 2011 to $41.9 million in 2012. Sales in the Printed Circuit Materials operating segment also declined slightly, from $166.4 million in 2011 to $161.9 million in 2012. These declines were partially offset by a slight increase in sales in the High Performance Foams operating segment from $177.6 million in 2011 to $179.4 million in 2012. See “Segment Sales and Operations” below for further discussion on segment performance.
Gross Margin
Gross margin decreased by approximately 80 basis points from 32.6% in 2011 to 31.8% in 2012. The primary drivers of the decrease in margins was the decline in sales volumes from 2011 to 2012, which contributed approximately 25 basis points to the decline, as well as a 6.5% decline in overall inventory levels from 2012 to 2011 resulting in unfavorable absorption during the period. This decrease is primarily attributable to our focus on working capital management and lowering inventory levels to better match current demand. This decline was partially offset by improved operating leverage on sales as a result of the streamlining activities that occurred throughout 2012. These activities favorably impacted margins by approximately 70 basis points in 2012. We expect that margins will continue to improve as the impacts of the streamlining initiatives are realized, particularly when and if sales volumes increase.
Selling and Administrative Expenses
Selling and administrative (S&A) expenses were $99.7 million in 2012, a decrease of 3.7% from $103.5 million in 2011. 2012 S&A expenses included approximately $5.8 million of special charges comprised primarily of a $2.9 million charge taken as a result of increasing the forecast period on asbestos related liabilities from 5 to 10 years during the fourth quarter of 2012, as well as a charge of $2.0 million related to the settlement of a pension obligation with the former Chief Executive Officer of the Company. 2011 results included approximately $3.1 million of special charges primarily associated with the acceleration of compensation

27
expense related to the change of Chief Executive Officers during the year. The overall decline in spending, excluding these charges, of $6.8 million can be attributed primarily to a reduction of $8.8 million of incentive and equity compensation costs due to the lower level of performance of the business in 2012 as compared to 2011. This decline was partially offset by a $4.2 million increase in costs related to the defined benefit pension and retiree medical plans in 2012 as compared to 2011 as the projected long term liability on the benefit plans increased as a result of unfavorable market conditions. Excluding these charges, S&A as a percentage of sales increased slightly from 18.2% in 2011 to 18.7% in 2012, mainly due to the decline in sales volumes experienced during 2012, partially offset by cost savings from our streamlining initiatives, which did not fully impact results until the second half of 2012.
Research and Development Expenses
Research and development (R&D) expenses were $19.3 million in 2012, a decrease of 10.3%, from $21.5 million in 2011. As a percentage of sales, R&D expenses were 3.9% in 2012 and 3.9% in 2011. Historically, we have targeted a 6% R&D investment as a percentage of net sales; however, in the past few years these percentages have been in the 3.5% - 4.0% range. Going forward, we intend to increase the investment in R&D initiatives, and believe that we will migrate closer to the 6% target over the course of time. R&D will continue to be an important driver to growth for the Company. We intend to reinvest in this area to improve our existing technologies and find new applications for existing materials, as well as to explore new, emerging technologies that we believe will complement or extend our existing product portfolio.
Restructuring and Impairment Charges
Restructuring and impairment charges were $14.1 million in 2012 as compared to $0.4 million in 2011. In 2012, these charges were comprised primarily of the following: (i) $7.1 million in severance related charges resulting from the streamlining initiatives that took place throughout the year, including the early retirement program implemented in the first quarter of 2012; (ii) approximately $2.3 million related to the shut-down of the Bremen manufacturing facility in Germany and relocation of certain production to the manufacturing facility in Carol Stream, Illinois; and (iii) $3.8 million in severance related charges resulting from actions taken to move of the final inspection operations of Curamik from Germany to Hungary. The 2011 charge relates to the write down to fair value of a dormant facility located in Richmond, Virginia that was acquired in 2009 as part of the MTI acquisition. This facility was sold in the second quarter of 2012.
Equity Income in Unconsolidated Joint Ventures
Equity income in unconsolidated joint ventures was $4.7 million in 2012, a decrease of 13.0% from $5.5 million in 2011. The decline is driven primarily by the softening in certain domestic and export markets in Japan, particularly in LCD televisions, domestic mobile phones and general industrial applications.
Other Income (Expense), Net
Other income (expense), net was an expense of $0.2 million in 2012 as compared to income of $1.9 million in 2011. 2011 results included a gain of $1.9 million on the sale of a building in China. Excluding this gain, results were relatively consistent year over year.
Realized Gain (Loss)
Realized gain (loss) represents the portion of the auction rate security impairment that relates to credit losses and is required to be recorded in the consolidated statements of income (loss). The amount of loss recognized in 2012 was $3.2 million as compared to a loss of $0.2 million in 2011. The increase in the loss in 2012 is due to the liquidation of the auction rate securities portfolio in the first quarter of 2012, which resulted in the Company receiving net cash proceeds of approximately $25.4 million.
Interest Income (Expense), Net
Interest income (expense), net was expense of $4.3 million in 2012 as compared to expense of $4.9 million in 2011. This expense relates to the interest expense on our long-term debt, as well as the interest expense on the long term obligation related to the leased facility in Eschenbach, Germany that contains most of the CES manufacturing operations. The overall decline in the expense is driven by a decline in the long term debt during 2012, as we paid down the facilities by $24.5 million from $122.5 million at December 31, 2011 to $98.0 million at December 31, 2012.

28
Income Tax Expense (Benefit)
Our effective tax rate was (205.2%) in 2012 and 20.7% in 2011. In both 2012 and 2011, our tax rate was favorably impacted by the tax benefit associated with certain discrete rate items recorded during the year and also benefited from favorable tax rates on certain foreign business activity. In 2012, the rate was primarily impacted by the following items: (i) 232.5% benefit related to the reversal of the valuation allowance on the US deferred tax assets; and (ii) 15.1% benefit related to foreign source income which is taxed at lower rates than income generated in the US. In 2011, the rate was primarily impacted by the following items: (i) 8.3% benefit related to the international tax rate differential; (ii) 3.6% benefit related to changes in the valuation allowance on the US deferred tax assets; (iii) 1.8% benefit related to foreign source income that is tax at lower rates than income generated in the US; and (iv) 1.5% benefit from other general business credits.
In 2009, we established a valuation allowance against substantially all of our U.S. deferred tax assets as we concluded that we did not have sufficient evidence to support the position that these assets would be utilized in the future. This conclusion was reached primarily due to the presence of recent cumulative losses in the US and upon consideration of all other available evidence, both positive and negative, using a “more likely than not standard” in accordance with applicable accounting guidance. As of the end of the third quarter of 2012, we concluded that a valuation allowance against these assets is no longer necessary as we are no longer in, nor are we expecting to be in, a cumulative loss in the forseeable future. Also, in appropriate circumstances we have the opportunity to undertake a tax planning strategy to ensure that our deferred tax assets do not expire unutilized. This strategy is based upon our ability to make a tax election to capitalize certain expenses that will result in generating taxable income to allow us to utilize our deferred tax assets before they expire. We would undertake such a strategy to realize these deferred tax assets prior to expiration only if we determined it was reasonable, prudent, and feasible. This, along with other positive evidence, such as our recent history of positive taxable income, led us to conclude in 2012 that it is more likely than not that we will ultimately be able to realize our deferred tax assets.
In 2012, we incurred a $2.0 million net operating loss for German income tax purposes. Under German law, tax losses may be carried forward indefinitely. We also incurred a $1.0 million net operating loss in one of our Chinese entities which has a 5 year life. We believe that we will generate sufficient taxable income in both jurisdictions such that both of these carryforwards should be fully realized.
Further, our effective tax rate benefited from the tax holiday on the earnings of our subsidiaries in China, which expired at the end of 2011. Under the business license agreement granted to Rogers Technologies (Suzhou) Company (RSZ), a wholly-owned subsidiary of ours, the first two years of cumulatively profitable operations were taxed at a zero percent tax rate followed by a reduced tax rate in subsequent years that gradually increased to the 25% full rate of tax beginning in 2012. In 2012, RSZ reported pretax income of $19.4 million which was subject to the full tax rate of 25%. In 2011, RSZ reported pretax income of $17.9 million, which was subject to a reduced tax rate of 24%. Also, under the business license agreement granted to Rogers (Shanghai) International Trading Company Ltd. (RSH), also a wholly-owned subsidiary of ours, RSH was subject to a reduced rate of tax that gradually increased to the 25% full rate of tax beginning in 2012. In 2012, RSH reported pretax income of $1.5 million which was subject to the full tax rate of 25%. In 2011, RSH reported pretax income of $2.4 million which was subject to a reduced tax rate of 24%.
Backlog
The backlog of firm orders was $43.3 million at December 31, 2012, as compared to $33.1 million at December 31, 2011. The increase at the end of 2012 was primarily related to the CES operating segment, which experienced an increase in backlog of $10.7 million at December 31, 2012 as compared to December 31, 2011.
2011 vs. 2010
Net Sales
Net sales in 2011 were $548.3 million, an increase of 46.9% from $373.2 million of sales in 2010. 2011 sales included approximately $132.9 million related to Curamik, which was acquired at the beginning of 2011. Excluding Curamik, organic growth was approximately $42.2 million, or 11.3%. This sales increase was attributable to volume improvement across all of our Core Strategic segments, led by High Performance Foams, which increased by 18.6% from $149.7 million in 2010 to $177.6 million in 2011; Printed Circuit Materials, which increased by 18.0% from $141.1 million in 2010 to $166.4 million in 2011; and the Power Distribution Systems segment, which increased by 12.4% from $42.1 million in 2010 to $47.3 million in 2011. A primary driver of these increases was the strong demand for the industry leading products and materials produced by these segments, particularly over the first nine months of 2011, as volumes declined in the fourth quarter. Additional factors impacting these results are discussed in greater detail in the “Segment Sales and Operations” section below.

29
Gross Margin
Gross margin decreased by approximately 11.2% from 36.7% in 2010 to 32.6% in 2011. During 2011, margins were impacted by several factors, many of which were anticipated and planned for by management. Most notably, such factors included the start-up costs associated with our new PCM manufacturing facility in Suzhou, China, and our PDS operations in North America; increased costs of certain raw materials used in many of our production processes, and unfavorable product sales mix in certain segments. As we move into the production phase in these new production facilities, we expect the start-up and qualification costs to decline and margins to improve over time. Also, margins were negatively impacted by the acquisition of Curamik, which has historically operated at lower margins than our legacy operations. However, Curamik has lower operating costs, so overall profitability is very similar to our core businesses. Further, margins were negatively impacted by a one-time charge of approximately $1.8 million recorded in the first quarter of 2011 related to the write up of Curamik inventory to fair value, as required under the purchase accounting rules. Sequentially, margins improved over the first three quarter of 2011, but declined significantly in the fourth quarter due to the decline in sales and a negative impact from inventory absorption.
Selling and Administrative Expenses
Selling and administrative (S&A) expenses were $103.5 million in 2011, an increase of $15.9 million, or 18.2%, from $87.6 million in 2010. The increase in 2011 expenses is partially attributable to the acquisition of Curamik, which added approximately $13.9 million of expense during the year including $1.3 million of costs incurred to acquire the business and approximately $3.5 million in amortization expense related to the intangible assets created as part of the purchase. Also contributing to the increase were approximately $3.1 million in one-time charges incurred in the fourth quarter of 2011 associated with the acceleration of compensation expense related to the change of Chief Executive Officers during the quarter. Further contributing to the increase in S&A were incremental sales and marketing costs of approximately $6.9 million incurred to support the higher sales volumes and future growth initiatives. These increases were partially offset by a net decline in incentive and equity compensation costs of approximately $6.0 million, as well as declines in spending in certain areas as a result of the cost control measures that were in place due to the recession. As a percentage of sales, overall selling and administrative expense declined significantly to 18.9% in 2011 from 23.5% in 2010. This decline was partially driven by our ability to grow sales organically and absorb a significant acquisition in Curamik without materially increasing our S&A spending. Also, Curamik's overall operating costs are lower as a percentage of sales than our legacy segments' costs, which contributed to the percentage decline.
Research and Development Expenses
Research and development (R&D) expenses were $21.5 million in 2011, an increase of $3.7 million, or 20.8%, from $17.8 million in 2010. As a percentage of sales, R&D expenses were 3.9% in 2011 and 4.8% in 2010. Historically, we have targeted a 6% R&D investment as a percentage of net sales; however, with our sales growth we believe that our short term R&D investment rate will be in the 4% range.
Restructuring and Impairment Charges
In the first quarter of 2012, we signed an agreement to sell our facility in Richmond, Virginia for $1.5 million. We acquired this facility as part of the MTI acquisition and subsequently moved operations from Richmond to our High Performance Foams manufacturing facility in Carol Stream, Illinois, so the facility was vacant and has been classified as held for sale since 2009. This facility had a book value of approximately $1.8 million prior to the signing of the agreement, and we recorded an impairment charge of approximately $0.4 million in the fourth quarter of 2011, which represents the write down to the selling price less approximately $0.1 million of estimated selling costs.
Equity Income in Unconsolidated Joint Ventures
Equity income in unconsolidated joint ventures was $5.5 million in 2011, a decrease of $3.2 million from $8.7 million in 2010. 2010 results included approximately $0.9 million of equity income related to the RCCT joint venture, which was divested in the fourth quarter of 2010. The remaining year-over-year decrease is attributable to a decline in performance at our foam joint ventures, Rogers INOAC Suzhou (RIS) in China and Rogers INOAC Corporation (RIC) in Japan.
Other Income (Expense), Net
Other income was $1.9 million in 2011, an increase of $0.5 million from $1.4 million in 2010. The increase is primarily due to a gain of approximately $1.9 million on the sale of a building in China, partially offset by an unfavorable impact of $0.5 million related to foreign currency fluctuations and our related hedging program. Also, 2010 results included commission income of $0.6 million from PLS, which ended operations during the year.

30
Realized Gain (Loss)
Realized gain (loss) is the portion of the auction rate security impairment that relates to credit losses and is required to be recorded in the consolidated statements of income (loss). The amount of loss recognized in 2011 was $0.2 million, a decrease from the $0.6 million loss recognized in 2010. The change was attributable to market conditions surrounding the securities underlying the auction rate securities, as well as redemption of a tranche of auction rate securities during 2011 at less than par value.
Interest Income (Expense), Net
Interest income (expense), net was $0.2 million of interest income in 2010 and $4.9 million of interest expense in 2011. The interest expense in 2011 was primarily due to the recognition of $3.8 million of expense related to our long-term debt obligations resulting from the funding of the Curamik acquisition in the first quarter of 2011. Additionally, in 2011, we incurred approximately $0.7 million of expense associated with a capital lease obligation that we acquired as part of the Curamik acquisition. No such debt obligation existed in 2010.
Income Tax Expense (Benefit)
Our effective tax rate was 20.7% in 2011 and 13.2% in 2010. In both 2011 and 2010, our tax rate was favorably impacted by the tax benefit associated with certain discrete rate items recorded during the year and also benefited from favorable tax rates on certain foreign business activity. In 2010, our effective tax rate was also favorably impacted by the release of a portion of the valuation allowance against our U.S. deferred tax assets. In the fourth quarter of 2010, we developed a tax planning strategy that would allow us to recognize certain deferred tax assets, resulting in a partial reduction of our valuation allowance. This strategy is based upon our ability to make a tax election to capitalize certain expenses that will result in generating taxable income to allow us to utilize our deferred tax assets before they expire. We would undertake such a strategy to realize these deferred tax assets prior to expiration only if we determined it was reasonable, prudent, and feasible. In both 2011 and 2010, we had cumulative losses in the U.S. As the realization of deferred taxes is principally dependent upon the achievement of future taxable income, the estimation of which requires significant management judgment, we concluded that given the weight of both positive and negative evidence, a valuation allowance should be placed against a significant portion of our U.S. deferred tax assets, for which there is neither a tax planning strategy nor source of taxable income against which it would offset.
Our tax holiday on the earnings of our subsidiaries in China expired at the end of 2011. Under the business license agreement granted to Rogers Technologies (Suzhou) Company (RSZ), a wholly-owned subsidiary of ours, the first two years of cumulatively profitable operations were taxed at a zero percent tax rate followed by a reduced tax rate in subsequent years that gradually increased to the 25% full rate of tax beginning in 2012. In 2011, RSZ reported pretax income of $17.9 million which was subject to a tax rate of 24%. In 2010, RSZ reported pretax income of $18.1 million, which was subject to a tax rate of 22%. Under the business license agreement granted to Rogers (Shanghai) International Trading Company Ltd. (RSH), also a wholly-owned subsidiary of ours, RSH was subject to a reduced rate of tax that gradually increased to the 25% full rate of tax beginning in 2012. In 2011, RSH reported pretax income of $2.4 million which was subject to a tax rate of 24%. In 2010, RSH reported pretax income of $4.8 million which was subject to a tax rate of 22%.
Backlog
Our backlog of firm orders was $33.1 million at December 31, 2011, as compared to $38.7 million at December 31, 2010. The decrease at the end of 2011 was primarily related to the decreased customer demand across almost all of our businesses, with the largest impact at PDS, which experienced a decrease in backlog of $3.6 million at December 31, 2011 as compared to December 31, 2010.

31
Segment Sales and Operations
Core Strategic
High Performance Foams
(Dollars in millions) 2012 2011 2010
Net sales $ 179.4 $ 177.6 $ 149.7Operating income (loss) 25.8 28.3 17.4
The High Performance Foams (HPF) operating segment is comprised of polyurethane and silicone foam products, which are sold into a wide variety of markets for various applications, such as portable communications, consumer electronics, and mass transit markets for gaskets, sealing, and cushioning applications.
2012 vs. 2011- Net sales increased by 1.0% from $177.6 million in 2012 to $179.4 million in 2012. This improvement was driven by strong sales of the segment's newest product introduction, PORON® XRD® extreme impact materials for molded applications, which added $3.2 million in incremental sales in 2012, as well as a 10.8% improvement in sales into general industrial applications, including protective cases for mobile internet devices and automotive and hybrid electric vehicles. These increases were partially offset by lower sales into the wind and solar markets, which declined 40.9% in 2012 as compared to 2011.
Operating income declined by 8.7% from $28.3 million in 2011 to $25.8 million in 2012. 2012 results included approximately $7.8 million of special charges, including $3.2 million related to the shutdown of the silicone foams manufacturing facility in Bremen, Germany, $2.2 million of net severance related charges as a result of our streamlining initiatives, $0.7 million in allocated pension settlement charges (as further described in the "Selling and Administrative Expenses" section above) and $1.0 million of allocated asbestos charges (as further described in in the "Selling and Administrative Expenses" section above). 2011 results included approximately $1.6 million of special charges primarily associated with its allocated portion of the acceleration of compensation expense related to the change of Chief Executive Officers during the year. Excluding these special charges, operating income increased by approximately 12.0% from 2011 to 2012 on a 1.0% increase in sales due in part to lower costs as a result of the streamlining initiatives, which created better operating leverage on lower sales volumes, as well as an overall favorable sales mix. These favorable results were partially offset by approximately $1.1 million of incremental costs incurred in 2012 as compared to 2011 related to the startup of the PORON® XRD® molded foam product line.
2011 vs. 2010 - Net sales in this segment increased by 18.6%, from $149.7 million in 2010 to $177.6 million in 2011. Operating profits increased significantly as well, improving by approximately 62.6% from $17.4 million in 2010 to $28.3 million in 2011. The 2010 results include approximately $0.9 million of integration costs associated with the acquisition of Utis in the second quarter of 2010. 2011 results were driven by strong demand for the segment's foams across almost all product lines and in geographic regions. In particular, we continued to experience success with our polyurethane foam products in cushioning, sealing and energy management for portable electronic devices, particularly large touch-screen mobile internet devices. Sales of our silicone foams gained momentum in 2011 due to increased demand in various markets, including aircraft, communications infrastructure, solar power, and hybrid electric vehicle applications. HPF also gained traction in one of its newest product lines, PORON® molded components, primarily for applications in sports and impact apparel, as well as mobile internet devices. Like most of our other segments, HPF experienced a decline in sales volumes in the fourth quarter of 2011, which we believe was driven by the rationalizing of inventory in the marketplace, as well as global economic trends.
Printed Circuit Materials
(Dollars in millions) 2012 2011 2010
Net sales $ 161.9 $ 166.4 $ 141.1Operating income (loss) 8.2 11.1 11.0
The Printed Circuit Materials (PCM) operating segment is comprised of high frequency circuit material products used for making circuitry that receive, process and transmit high frequency communications signals, in a wide variety of markets and applications, including wireless communications, high reliability, and automotive, among others.
2012 vs. 2011- Net sales in 2012 were $161.9 million, a decline of 2.7% from $166.4 million in 2011. The decline was due primarily to a 19.7% decline in sales into high reliability applications, as well as a 21.1% decline into the satellite TV market for LNB (Low Noise Blockdown) converters. These declines were partially offset by a 72.5% increase in sales into the automotive

32
market primarily for radar safety sensor applications, as our laminate products continue to gain traction in the market, as well as a 73.2% increase in sales in new base station antenna applications for communications infrastructure.
Operating income declined by 26.1% from $11.1 million in 2011 to $8.2 million in 2012. 2012 results included approximately $2.3 million of net special charges comprised primarily of $2.9 million in severance charges incurred as part of our overall streamlining initiatives, $0.6 million in charges related to pension settlement accounting (as further described in the "Selling and Administrative Expenses" section above), and $0.9 million of allocated asbestos charges (as further described in in the "Selling and Administrative Expenses" section above). These charges were partially offset by a one-time benefit of $2.1 million related to inventory valuation adjustments and $0.5 million related to an insurance reimbursement of a previously settled product liability claim. 2011 results included approximately $1.1 million of special charges primarily associated with its allocated portion of the acceleration of compensation expense related to the change of Chief Executive Officers during the year. Excluding these special charges, operating income decreased by approximately 13.6% from $12.2 million in 2011 to $10.5 million in 2012. This decline is primarily attributable to the decline in sales volumes, as well as the impact from the 15.9% decrease in inventory during the year. These declines were partially offset by lower spending as a result of our streamlining initiatives.
2011 vs. 2010 - Net sales in this segment increased by 18.0% in 2011 to $166.4 million from $141.1 million in 2010, while operating income remained relatively flat year over year. 2010 results included a one-time benefit of $2.5 million from the recovery of insurance proceeds related to the CalAmp lawsuit, which had been previously settled in 2008. In 2011, the segments growth was driven by strong demand in the wireless infrastructure market, primarily due to expansion of third generation (3G) and fourth generation (4G) systems globally, as well as for antenna radar applications for the high reliability and automotive markets. Demand was also strong for materials used in the aerospace, defense and other high reliability markets, as well as in the automotive market for radar safety sensors and in satellite televisions. At the end of 2011, particularly in the fourth quarter, sales in this segment declined significantly from levels achieved in the first three quarters of the year. We believe this decline was driven by global economic trends, as well as the rationalization of inventory in the supply chain.
Power Electronics Solutions
• Curamik Electronics Solutions
(Dollars in millions) 2012 2011 2010
Net sales $ 92.4 $ 132.9 $ —Operating income (loss) (11.7) 7.8 —
The Curamik Electronics Solutions (CES) operating segment is comprised of power electronic substrate products, which are used primarily in the design of intelligent power management devices, such as IGBT (insulated gate bipolar transistor) modules that enable a wide range of products including highly efficient industrial motor drives, wind and solar energy converters and electrical systems in automobiles. We acquired the business on January 4, 2011.
2012 vs. 2011- On a year to date basis, net sales declined by 30.5% from $132.9 million in 2011 to $92.4 million in 2012. This decline was due primarily to the continued lower demand in renewable energy and industrial motor drive applications, which declined 15.0% and 31.0%, respectively, in 2012 as compared to 2011, as well as further inventory corrections in the supply chain. We believe that these markets will remain at these levels for the near term, but the long term outlook remains positive. Also contributing to the decline in sales is the impact of foreign currency exchange rates, which contributed approximately $6.2 million to the overall sales decline as the USD appreciated against the Euro by approximately 8.7% during 2012 as compared to 2011. The segment transacted approximately 82% in 2012 in Euro as compared to 77% in 2011.
As CES works through this current downturn, we continue to look for ways to improve the segment's cost structure and better serve our customers. Early in the third quarter of 2012, we announced a plan to relocate the final inspection operations from our facility in Eschenbach, Germany to Hungary. The move is expected to enable more cost effective performance of the inspecting operations. We expect the move to be complete in 2013.
Overall, operating results declined from operating income of $7.8 million in 2011 to an operating loss of $11.7 million in 2012. 2012 results included approximately $7.4 million of special charges consisting primarily of the following: $3.8 million in severance charges related to the move to Hungary (as described above); $1.4 million in severance related charges as part of the Company's streamlining initiatives; $0.6 million related to the reserve of an uncollectible receivable, $0.6 million related to the allocated portion of one time asbestos charges (as further described in the "Selling and Administrative Expenses" section above), and $0.4 million in charges related to pension settlement accounting (as further described in the "Selling and Administrative Expenses" section above). Excluding these charges, CES operating loss for 2012 was $4.2 million. This overall decline in results can be directly attributable to the decline in volumes and the associated contribution loss on those sales, partially offset by lower spending as a result of our streamlining initiatives.

33
2011 vs. 2010 - Net sales in this segment were $132.9 million in 2011 and operating profits were $7.8 million. These volumes represent a record for the segment, and its performance for the year exceeded our initial expectations with sequential growth in the first three quarters of the year, followed by a decline in sales in the fourth quarter (as experienced by all of our core segments). The overall 2011 results were driven by strong demand for the segments products across its primary markets, which consist of energy efficient motor drives, wind and solar power generations, and HEV/EB applications, and regions, which include Europe and Japan. At the end of the year, the decline in volumes was due primarily to lower demand in wind and general industrial applications, as well as from customers reducing their inventory levels.
Curamik's operating results included approximately $1.3 million of one-time costs associated with the acquisition and integration of the business, including consulting, legal and audit fees, as well as severance charges and other integration costs. 2011 results also included approximately $3.5 million of non-cash amortization charges related to the intangible assets created as part of the purchase of the business (see Note 6 to the Consolidated Financial Statements in the 2011 Form 10-K) and approximately $1.8 million of one-time non-cash charges related to the amortization of the step-up of inventory to its fair value at the acquisition date.
• Power Distribution Systems
(Dollars in millions) 2012 2011 2010
Net sales $ 41.9 $ 47.3 $ 42.1Operating income (loss) (0.4) 3.5 2.9
The Power Distribution Systems (PDS) operating segment designs and manufactures busbars, which are used primarily in power distribution systems products in mass transit and clean technology applications.
2012 vs. 2011- Net sales in 2012 were $41.9 million, a decline of 11.5% from $47.3 million in 2011. The decline was due primarily to the significant slowdown in spending on infrastructure projects in the mass transit and renewable energy markets, particularly in Europe and China, as sales declined by 28.0% and 25.0%, respectively, in those regions. Also, overall sales into the renewable energy market declined by 34.1% as the wind and solar energy markets continue to lag. These declines were partially offset by strong sales into the mass transit and automotive markets in North America, which increased in total by 88.4% in 2012 as compared to 2011.
Operating results declined from operating income of $3.5 million in 2011 to an operating loss of $0.4 million in 2012. 2012 results included $1.8 million of special charges comprised primarily of $0.7 million of charges related to the shut-down of manufacturing operations in North America, $0.4 million of other severance and allocated pension settlement related charges (as further described in the "Selling and Administrative Expenses" section above), and $0.2 million of allocated asbestos charges (as further described in in the "Selling and Administrative Expenses" section above). The remaining decline in operating performance can be primarily attributable to the lost contribution related to the decline in sales volumes described above, partially offset by lower spending as a result of our streamlining initiatives.
2011 vs. 2010 - Net sales in this segment increased by 12.4% from $42.1 million in 2010 to $47.3 million in 2011, while operating profit increased from $2.9 million in 2010 to $3.5 million in 2011. These increases were driven by strong demand over the first nine months of the year for this segment's products in mass transit and power electronic applications. In the fourth quarter of 2011, this segment began experiencing softening sales in mass transit and wind turbines. In particular, the PDS segment experienced lower demand for its products in the fourth quarter due primarily to the temporary suspension of railway construction investments by the Ministry of Railways (MOR) in China as a result of their debt issues and the safety investigation initiated after a train crash in Wenzhou, Zhejiang province in July 2011, in which two high-speed bullet trains collided. The MOR had decided to continue the railway investment plans but at a slightly slower pace than their initial plan. China also addressed the issues with wind and solar energy connections to the grid, all of which are unrelated to the performance of our products.
Other
(Dollars in millions) 2012 2011 2010
Net sales $ 23.2 $ 24.0 $ 40.4Operating income (loss) 3.8 2.7 0.3
Our Other reportable segment consists of our elastomer rollers and floats products, as well as the inverter distribution business.
In the second quarter of 2012, we decided to cease production of non-woven composite materials products in an effort to redeploy resources to focus on our Core Strategic segments. At December 31, 2012, manufacturing operations have been shut down and final sales are expected to occur in the first quarter of 2013. Additionally, during the fourth quarter of 2011, we also ended operations

34
at our Thermal Management Solutions (TMS) operating segment. These operating segments are being treated as a discontinued operations and their results are no longer included in this reportable segment. All prior periods have been recast to reflect such changes.
2012 vs 2011- Net sales declined 3.3% from $24.0 million 2011 to $23.2 million 2012. The decline in sales is primarily due to a 45.4% decline in sales of inverter products from our legacy Durel business; which was partially offset by a 9.1% increase in sales of elastomer component and float products.
Operating results improved by 40.7% from an operating profit of $2.7 million in 2011 to $3.8 million in 2012. 2012 results included approximately $0.5 million of special charges related primarily to allocated severance and pension settlement related costs. The improvement in operating profit is due primarily to the operating performance of the elastomer component and float products, which improved by 123.6% due to increased volumes and other cost reduction initiatives.
2011 vs. 2010 - In 2011, sales in the segment declined by approximately 40.6% from $40.4 million in 2010 to $24.0 million in 2011. 2010 results included approximately $13.5 million in sales from distribution activities related to our former joint venture with Mitsui Chemicals, Inc. of Japan, Polyimide Laminate Systems, LLC (PLS) distribution activities, which reached end of life in 2010. The remainder of the decline was related to the further decline in the electroluminescent lamps (EL) sales. However, even though volumes declined, operating profit improved from $0.3 million in 2010 to $2.7 million in 2011. The improvement was driven by sales of inverter products, offset by the end of the PLS distribution sales.
Joint Ventures
Rogers INOAC Corporation (RIC)
RIC, our joint venture with Japan-based INOAC Corporation, was established over 25 years ago and manufactures high performance PORON urethane foam materials in Japan. Sales remained consistent from 2011 to 2012, following a decrease of 9% from 2010 to 2011. The decline in sales in 2011 was due primarily to the continued weakness in the Japanese domestic and export markets, particularly LCD TV's, domestic mobile phones and general industrial applications.
Rogers INOAC Suzhou Corporation (RIS)
RIS, our joint venture agreement with INOAC Corporation for the purpose of manufacturing PORON urethane foam materials in China, began operations in 2004. Sales declined 15% from 2011 to 2012, and decreased 12% from 2010 to 2011. Sales declined due to increased softening in the Asian markets it serves.
Discontinued Operations
In the fourth quarter of 2011, we made the strategic decision to end the operations of our TMS operating segment. We had invested in its operations for the last few years, but had difficulty gaining traction in the market and working through issues in the manufacturing process. Therefore, we determined that we would not achieve future success in this operation and chose to shut down operations rather than invest further. For the years ended December 31, 2012, 2011 and 2010, operating losses of $0.1 million, $6.8 million and $3.8 million, net of tax, respectively, were reflected as discontinued operations in the accompanying consolidated statements of income (loss). Net sales associated with the discontinued operations for the years ended December 31, 2012, 2011 and 2010 were $0.1 million, $0.9 million and $1.0 million, respectively. The tax related to the discontinued operations was immaterial for 2012 and was $0.1 million and $0.1 million of tax expense for December 31, 2011 and 2010, respectively.
In the second quarter of 2012, we decided to cease production of our non-woven composite materials operating segment located in Rogers, Connecticut in an effort to redeploy resources to focus more on our Core Strategic operations. Sales of non-woven products have been steadily declining for several years and totaled approximately $5.3 million for the year ended December 31, 2012 and $4.8 million for the year ended December 31, 2011 and $5.0 million for the year ended December 31, 2010. Manufacturing operations were complete by the end of 2012 and last sales out of inventory are expected to end in the first quarter of 2013. For the year ended December 31, 2012, operating loss of $0.1 million and for the year ended December 31, 2011 and 2010, operating losses of $0.4 million and $0.2 million, net of tax, respectively, were reflected as discontinued operations in the accompanying consolidated statements of income (loss). The tax related to the discontinued operations was $0.1 million , $0.2 million and $0.1 million of tax expense for December 31, 2012, 2011 and 2010, respectively.

35
Product and Market Development
Our research and development team is dedicated to growing our business by developing cost effective solutions that enable or improve upon the performance of customers' products, as well as identifying business and technology acquisition opportunities to expand our market presence. Our long-term plan is to invest in the range of 6% of net sales annually into research and development. Currently, R & D spend is in the 4% of sales range; however, going forward, we plan to invest more in R&D activities as we work to grow the Company both organically and through external investments.
Liquidity, Capital Resources and Financial Position
We believe that our ability to generate cash from operations to reinvest in our business is one of our fundamental strengths. While the U.S. financial markets have grown more stable since the global recession of 2008, significant volatility still remains in the global markets, particularly in Europe. We believe that our existing sources of liquidity and cash flows that are expected to be generated from our operations, together with our available credit facilities, will be sufficient to fund our operations, capital expenditures, research and development efforts, and debt service commitments, as well as our other operating and investing needs, for at least the next twelve months. We continue to have access to the remaining portion of the line of credit available under the Amended Credit Agreement (as defined in the Credit Facilities section which follows), as amended, should any issue or strategic opportunities arise. We continually review and evaluate the adequacy of our cash flows, borrowing facilities and banking relationships to ensure that we have the appropriate access to cash to fund both our near-term operating needs and our long-term strategic initiatives.
(Dollars in thousands)
Key Balance Sheet Accounts:December 31,
2012December 31,
2011Cash and cash equivalents $ 114,863 $ 79,728Accounts receivable 78,788 77,286Inventory 73,178 77,935Outstanding borrowing on credit facilities (short term and long term) 98,000 122,500
(Dollars in thousands)
Key Cash Flow Measures:December 31,
2012December 31,
2011Cash provided by (used in) operating activities of continuing operations $ 40,367 22,084
Cash provided by (used in) investing activities of continuing operations 1,368 (145,836)
Cash provided by (used in) financing activities of continuing operations (8,455) 128,266
At December 31, 2012, cash and cash equivalents were $114.9 million as compared to $79.7 million at the end of 2011, an increase of $35.2 million, or approximately 44.2%. This increase was due primarily to the following: (i) liquidation of the auction rate securities portfolio, resulting in net proceeds of $25.4 million; (ii) $17.0 million received for stock option exercises; (iii) $1.4 million received for the sale of our facility in Richmond, Virginia; and (iv) cash generated from operations. These increases in cash were partially offset by cash outlays of (i) $16.0 million in contributions to our defined benefit pension plan; (ii) $24.5 million of payments on our debt facility; (iii) a $6.2 million pension retirement payout to the former CEO; and (iv) $6.6 million of annual incentive compensation payments related to 2011 performance.
The following table illustrates the location of our cash and cash equivalents by our three major geographic areas as of the periods indicated:
(Dollars in thousands) 2012 2011 2010U.S. $ 26,813 $ 20,027 $ 27,305Europe 47,918 35,259 20,954Asia 40,132 24,442 31,876Total cash and cash equivalents $ 114,863 $ 79,728 $ 80,135
Cash held in certain foreign locations could be subject to additional taxes if we repatriated such amounts back to the U.S. from foreign countries that have a lower tax rate than in the U.S. Our current policy is that the historical earnings and cash in these locations will be permanently reinvested in those foreign locations.
36
Working capital was $221.7 million, $186.2 million and $155.3 million in 2012, 2011 and 2010, respectively.
Significant changes in our balance sheet accounts from December 31, 2011 to December 31, 2012 are as follows:
Inventories decreased $4.7 million, or 6.1%, from $77.9 million at December 31, 2011 to $73.2 million at December 31, 2012. This decrease is primarily attributable to our focus on working capital management and lowering inventory levels to better match current demand.
Long-term marketable securities, which represents the value of auction rate securities, had a balance of $25.9 million at December 31, 2011. These securities were completely liquidated during 2012. As of December 31, 2012, we do not have any long-term marketable securities on our balance sheet.
Long-term asbestos-related insurance receivables increased from $21.9 million at December 31, 2011 to $40.1 million at December 31, 2012 and asbestos-related liabilities increased from $22.3 million at December 31, 2011 to $43.2 million at December 31, 2012. These increases are due to the change in the forecast period for asbestos-related claims from 5 years to 10 years, which occurred in the fourth quarter of 2012.
Overall, our debt position declined by $24.5 million from $122.5 million at December 31, 2011 to $98.0 million at December 31, 2012 due to payments made on the facilities during 2012. Long-term debt decreased by $37.5 million from $115.0 million at December 31, 2011 to $77.5 million at December 31, 2012, while the current portion of long term debt increased by $13.0 million from $7.5 million at December 31, 2011 to $20.5 million at December 31, 2012. This increase in the short term portion of the debt is due to management anticipating additional voluntary principal payments combined with an increase in the scheduled payments for our debt facility over the next twelve months.
Accrued employee benefits and compensation decreased by 23.0% from $30.1 million at December 31, 2011 to $23.2 million at December 31, 2012. This decrease is primarily attributable to the $6.0 million decline in the accrual for the annual incentive compensation plan in 2012 as compared to 2011.
During 2012, we had $1.4 million of net cash provided by investing activities as compared to $145.8 million of net cash used in investing activities in 2011 and $22.2 million in 2010 of net cash used in investing activities. The investing activities in 2012 includes liquidating our auction rate security portfolio, receiving net proceeds of $25.4 million. For 2011, investing activities included the acquisition of Curamik, net of cash acquired, for $139.8 million. Investing activities in 2010 include $25.9 million related to the purchase of Utis. Capital expenditures were $23.8 million, $21.3 million and $12.2 million in 2012, 2011 and 2010, respectively.
Net cash used in financing activities was $8.5 million in 2012 and net cash provided by financing activities were $128.3 million and $1.5 million in 2011 and 2010, respectively. 2011 was impacted by the initial draw on the line of credit for $145.0 million to fund the acquisition of Curamik.
Credit Facilities
On July 13, 2011, we entered into an amended and restated $265.0 million secured five year credit agreement. This credit agreement (“Amended Credit Agreement”) is with (i) JPMorgan Chase Bank, N.A., as administrative agent; (ii) HSBC Bank USA, National Association; (iii) RBS Citizens, National Association; (iv) Fifth Third Bank; and (v) Citibank, N.A. JPMorgan Securities LLC and HSBC Bank USA, National Association acted as joint bookrunners and joint lead arrangers; HSBC Bank USA, National Association and RBS Citizens, National Association acted as co-syndication agents; and Fifth Third Bank and Citibank, N.A. acted as co-documentation agents. The Amended Credit Agreement amends and restates the credit agreement signed between the Company and the same banks on November 23, 2010 and increased our borrowing capacity from $165.0 million under the original agreement to $265.0 million under the Amended Credit Agreement.
Key features of the Amended Credit Agreement, as compared to the November 23, 2010 credit agreement, include (1) an increase in credit from $165.0 million to $265.0 million with the addition of a $100.0 million term loan; (2) the extension of maturity from November 23, 2014 to July 13, 2016; (3) a 25 basis point reduction in interest costs; (4) an increase in the size of permitted acquisitions from $25.0 million to $100.0 million; and (5) an increase in permitted additional indebtedness from $20.0 million to $120.0 million.
The Amended Credit Agreement provides for the extension of credit in the form of (1) a $100.0 million term loan (which refinances outstanding borrowings in the amount of $100.0 million from the existing revolving credit line), as further described below; and (2) up to $165.0 million of revolving loans, in multiple currencies, at any time and from time to time until the maturity of the Amended Credit Agreement, on July 13, 2016. We may borrow, pre-pay and re-borrow amounts under the $165.0 million revolving portion of the Amended Credit Agreement; however, with respect to the $100.0 million term loan portion, any principal amounts re-paid may not be re-borrowed. Borrowings may be used to finance working capital needs, for letters of credit and for general corporate purposes in the ordinary course of business, including the financing of permitted acquisitions (as defined in the Amended Credit Agreement).

37
Borrowings under the Amended Credit Agreement will bear interest based on one of two options. Alternate base rate loans will bear interest that includes a base reference rate plus a spread of 75 - 150 basis points, depending on our leverage ratio. The base reference rate will be the greater of the (1) prime rate; (2) federal funds effective rate plus 50 basis points; and (3) adjusted 1-month London interbank offered (“LIBO”) rate plus 100 basis points. Eurocurrency loans will bear interest based on the adjusted LIBO rate plus a spread of 175 - 250 basis points, depending on our leverage ratio.
In addition to interest payable on the principal amount of indebtedness outstanding from time to time under the Amended Credit Agreement, the Company is required to pay a quarterly fee of 0.20% to 0.35% (based upon its leverage ratio) of the unused amount of the lenders’ commitments under the Amended Credit Agreement.
In connection with the Amended Credit Agreement, we transferred borrowings in the amount of $100.0 million from the revolving credit line under the November 23, 2010 credit agreement to the term loan under the Amended Credit Agreement. The Amended Credit Agreement requires the mandatory quarterly repayment of principal of amounts borrowed under such term loan. Payments commenced on September 30, 2011, and are scheduled to be completed on June 30, 2016. The aggregate payments due are as follows:
2011 $2.5 million2012 $7.5 million2013 $12.5 million2014 $17.5 million2015 $35.0 million2016 $25.0 million
The Amended Credit Agreement is secured by many of the assets of Rogers and our World Properties, Inc, subsidiary, including but not limited to, receivables, equipment, intellectual property, inventory, stock in certain subsidiaries and real property.
As part of the Amended Credit Agreement, we are restricted in our ability to perform certain actions, including, but not limited to, our ability to pay dividends, incur additional debt, sell certain assets, and make capital expenditures, with certain exceptions. Further, we are required to maintain certain financial covenant ratios, including a leverage ratio of no more than 3.0 to 1.0 and a minimum fixed charge coverage ratio (FCCR) of 1.25 to 1.0. This ratio measures the Company's ability to cover its fixed charge obligations. The key components of fixed charges are capital expenditures, scheduled debt payments, capital lease payments, income taxes paid in cash, rent and interest expenses.
In the first quarter of 2012, through an amendment to the Amended Credit Agreement, the FCCR was modified from 2.50 to 1.25 of Adjusted Earnings Before Interest Taxes Depreciation and Amortization (EBITDA). Several factors contributed to the need for an amendment to this covenant. The 2.50 ratio was based on a more robust set of financial projections, and these have moderated to some extent with the recent events in the marketplace and the overall global economy, particularly in Europe and China. Additionally, there were no mandatory term loan payments when the original ratio was determined, which would further stress the ratio. Finally, we forecasted an increase in planned capital investment to support certain strategic initiatives, which added pressure to the ratio as well.
Relevant Fixed Charge metrics are detailed in the table below.
Periods Q4 2011 Q1 2012 Q2 2012 Q3 2012 Q4 2012Covenant Limit (minimum) 2.50 1.25 1.25 1.25 1.25Actual FCCR 2.60 2.27 2.09 1.93 2.18
As of December 31, 2012, we were in compliance with all of our covenants, as we achieved actual ratios of approximately 1.35 on the leverage ratio and 2.18 on the fixed charge coverage ratio.If an event of default occurs, the lenders may, among other things, terminate their commitments and declare all outstanding borrowings to be immediately due and payable together with accrued interest and fees. We are in compliance with all financial and other covenants as of December 31, 2012.
In connection with the establishment of the initial credit in 2010, we capitalized approximately $2.3 million of debt issuance costs and, in connection with the Amended Credit Agreement, as amended, we capitalized an additional $0.1 million of debt issuance costs in 2012. These costs will be amortized over the life of the Amended Credit Agreement, as amended, which will terminate in June 2016. We incurred amortization expense of $0.5 million for the years ended 2012 and 2011, respectively. At December 31, 2012, we have approximately $1.8 million of credit facility costs remaining to be amortized.

38
In the first quarter of 2011, we made an initial draw on the line of credit of $145.0 million to fund the acquisition of Curamik. During 2012, we made principal payments of $24.5 million on the debt. We made $22.5 million of principal payments in fiscal 2011. We are obligated to pay $12.5 million on this debt obligation and are scheduling $8.0 million of discretionary revolver payments within the next 12 months. As of December 31, 2012, our outstanding debt related to the Amended Credit Agreement, as amended, consists of $90.0 million of term loan debt and $8.0 million on the revolving line of credit. We have the option to pay part of or the entire amount at any time over the remaining life of the Amended Credit Agreement, as amended, with any balance due and payable at the agreement's expiration.
In addition, as of December 31, 2012 we had the following standby letter of credit (LOC) and guarantees that were backed by the Amended Credit Agreement, as amended:
• $1.4 million letter of credit to guarantee Rogers workers compensation plan;• $0.1 million letter guarantee to guarantee a payable obligation for a Chinese subsidiary (Rogers Suzhou);• $0.1 million letter guarantee to guarantee a payable obligation for a Chinese subsidiary (Rogers Suzhou) .
Interest
We incurred interest expense on our outstanding debt of $2.9 million for the year ended December 31, 2012 and $3.8 million for the year ended December 31, 2011. We incurred an unused commitment fee of approximately $0.4 million for the year ended December 31, 2012 and approximately $0.2 million for the year ended December 31, 2011. In July 2012, we entered into an interest rate swap to hedge the variable interest rate on 65% of the term loan debt, then outstanding, effective July 2013. At December 31, 2012, the term loan debt amounted to $90.0 million of our total outstanding debt of $98.0 million. At December 31, 2012, the rate charged on this debt is the 1 month LIBOR at 0.25% plus a spread of 2.25%.
We also incurred interest expense on the capital lease of $0.6 million and $1.0 million for the years ended December 31, 2012 and 2011, respectively.
Capital Lease
During the first quarter of 2011, we recorded a capital lease obligation related to the acquisition of Curamik for its primary manufacturing facility in Eschenbach, Germany. We have an option to purchase the property in either 2013 or upon the expiration of the lease in 2021 at a price which is the greater of (i) the then-current market value or (ii) the fiscal residual book value of the land including the buildings and installations thereon. The total obligation recorded for the lease as of December 31, 2012 is $8.4 million. Depreciation expense related to the capital lease was $0.4 million for the years ending December 31, 2012 and 2011. These expenses are included as depreciation expense in Cost of Sales on our consolidated statements of income (loss). Interest expense related to the debt recorded on the capital lease is included in interest expense on the consolidated statements of income (loss). See “Interest” section above for further discussion.
Auction Rate Securities
During the first quarter of 2012, we liquidated our auction rate securities portfolio, receiving net proceeds of $25.4 million on a stated par value of $29.5 million. As a result of this liquidation, we recognized a loss on the discount of the securities of $3.2 million (the remaining difference between the liquidation proceeds and par value of $0.9 million had previously been recognized as an impairment loss). Since the markets for these securities failed in the first quarter of 2008, we had already redeemed $24.9 million of these securities, mostly at par. However, due to the fact that par value redemptions had recently slowed with no clear path for full redemption over the next several years and the rate of return on these securities was very low, management determined that a discounted redemption of the remainder of the portfolio was in the best financial interests of the Company.

39
Contractual Obligations
The following table summarizes our significant contractual obligations as of December 31, 2012:
(Dollars in thousands) Payments Due by Period
TotalLess than
1 Year 1-3 Years 3-5 YearsMore than
5 YearsOperating leases $ 5,739 $ 2,457 $ 1,933 $ 908 $ 441Capital lease 7,484 1,422 1,617 1,616 2,829Interest payments on capital lease 3,665 537 972 982 1,174Inventory purchase obligation 10,845 10,845 — — —Capital commitments 7,342 7,342 — — —Pension and retiree health and life insurance benefits (1) 104,227 8,925 17,667 18,909 58,726Outstanding borrowings on credit facilities 98,000 12,500 52,500 33,000 —Interest payments on outstanding borrowings (2) 7,782 2,954 4,359 469 —Total $ 245,084 $ 46,982 $ 79,048 $ 55,884 $ 63,170
(1) Pension benefit payments, which amount to $92.1 million, are expected to be paid through the utilization of pension plan assets; retiree health and life insurance benefits, which amount to $12.1 million, are expected to be paid from operating cash flows.
(2) Estimated future interest payments are based on (1) rates that range from 0.32% to 1.56%, which take into consideration projected forward LIBOR rates, (2) a leverage-based spread and (3) the related impact of the interest rate swap.
Other long-term liabilities, such as deferred taxes, unrecognized tax benefits and asbestos-related product liability reserves, have been excluded from the table due to the uncertainty of the timing of payments combined with the absence of historical trends to be used as a predictor for such payments.
Effects of Inflation
We do not believe that inflation had a material impact on our business, sales, or operating results during the periods presented.
Off-Balance Sheet Arrangements
We do not have any off-balance sheet arrangements that have, or are, in the opinion of management, reasonably likely to have, a current or future material effect on our financial condition or results of operations.
Critical Accounting Policies
Our Consolidated Financial Statements are prepared in accordance with U.S. generally accepted accounting principles, which require management to make estimates, judgments and assumptions that affect the amounts reported in the financial statements and accompanying notes. We base our estimates on historical experience and on various other assumptions that are believed to be reasonable under the circumstances and believe that appropriate reserves have been established based on reasonable methodologies and appropriate assumptions based on facts and circumstances that are known; however, actual results may differ from these estimates under different assumptions or conditions. An accounting policy is deemed to be critical if it requires an accounting estimate to be made based on assumptions that are highly judgmental and uncertain at the time the estimate is made, if different estimates could reasonably have been used, or if changes to those estimates are reasonably likely to periodically occur that could affect the amounts carried in the financial statements. These critical accounting policies are as follows:
Revenue Recognition
We recognize revenue when all of the following criteria are met: (1) we have entered into a binding agreement, (2) the product has shipped and title has passed, (3) the sales price to the customer is fixed or is determinable, and (4) collectability is reasonably assured. We recognize revenue based upon a determination that all criteria for revenue recognition have been met, which, based on the majority of our shipping terms, is considered to have occurred upon shipment of the finished product. Some shipping terms require the goods to be through customs or be received by the customer before title passes. In those instances, revenues are not recognized until either the customer has received the goods or they have passed through customs, depending on the circumstances.

40
As appropriate, we record estimated reductions to revenue for customer returns and allowances and warranty claims. Provisions for such allowances are made at the time of sale and are typically derived from historical trends and other relevant information.
Allowance for Doubtful Accounts
The allowance for doubtful accounts is established to represent our best estimate of the net realizable value of the outstanding accounts receivable. The allowance for doubtful accounts is determined based on a variety of factors that affect the potential collectability of receivables, including length of time receivables are past due, customer credit ratings, financial stability of customers, specific one-time events and past customer history. In addition, in circumstances when we are made aware of a specific customer's inability to meet its financial obligations, a specific allowance is established. The majority of accounts are individually evaluated on a regular basis and appropriate reserves are established as deemed appropriate based on the criteria previously mentioned. The remainder of the reserve is based on our estimates and takes into consideration historical trends, market conditions and the composition of our customer base. The risk with this estimate is associated with failure to become aware of potential collectability issues related to specific accounts and thereby becoming exposed to potential unreserved losses. Historically, our estimates and assumptions around the allowance have been reasonably accurate and we have processes and controls in place to closely monitor customers and potential credit issues. Additionally, we have credit insurance on certain accounts that mitigates some of the risk of loss. Over the past three years, our allowance as a percentage of total receivables has ranged from 1.3% to 2.6%. A 50 basis point increase in our current year allowance to receivable ratio would increase our allowance reserve by approximately $0.4 million.
Inventory Valuation
Inventories are stated at the lower of cost or market with costs determined primarily on a first-in first-out basis. We also maintain a reserve for excess, obsolete and slow-moving inventory that is primarily developed by utilizing both specific product identification and historical product demand as the basis for our analysis. Products and materials that are specifically identified as obsolete are fully reserved. In general, most products that have been held in inventory greater than one year are fully reserved unless there are mitigating circumstances, including forecasted sales or current orders for the product. The remainder of the allowance is based on our estimates, and fluctuates with market conditions, design cycles and other economic factors. Risks associated with this allowance include unforeseen changes in business cycles that could affect the marketability of certain products and an unexpected decline in current production. We closely monitor the market place and related inventory levels and have historically maintained reasonably accurate allowance levels. In addition, we value certain inventories using the last-in, first-out (LIFO) method. Accordingly, a LIFO valuation reserve is calculated using the link chain index method and is maintained to properly value these inventories. Our obsolescence reserve has ranged from 8.6% to 18.1% of gross inventory over the last three years. A one hundred basis point increase to the December 31, 2012 obsolescence reserve would increase the reserve by approximately $1.1 million.
Goodwill and Other Intangibles
We have made acquisitions over the years that included the recognition of goodwill and other intangible assets. Goodwill and indefinite lived intangibles are tested for impairment annually or more frequently if events or changes in circumstances indicate the carrying value may have been impaired. Application of the goodwill impairment test requires significant judgment, including the identification of reporting units, assignment of assets and liabilities to reporting units, and determination of the fair value of each reporting unit. Determining the fair value of a reporting unit is subjective and requires the use of significant estimates and assumptions, including revenue growth rates and operating margins, discount rates, and future market conditions, among others. We review goodwill for impairment using a two-step process. The first step of the impairment test requires a comparison of the implied fair value of each of our reporting units to the respective carrying value. If the carrying value of a reporting unit is less than its implied fair value, no indication of impairment exists and a second step is not performed. If the carrying amount of a reporting unit is higher than its fair value, there is an indication that impairment may exist and a second step must be performed. In the second step, the impairment is computed by comparing the implied fair value of the reporting unit's goodwill with the carrying amount of the goodwill. If the carrying amount of the reporting unit's goodwill is greater than the implied fair value of its goodwill, an impairment loss must be recognized for the excess and charged to operations.
In 2012, we estimated the fair value of our reporting units using an income approach based on the present value of future cash flows. We believe this approach yields the most appropriate evidence of fair value as our reporting units are not easily compared to other corporations involved in similar businesses. We further believe that the assumptions and rates used in our annual impairment test are reasonable, but inherently uncertain. We perform our annual goodwill impairment testing in the fourth quarter of the year. However, since the Curamik Electronics Solutions operating segment (also a reporting unit as defined for this test) results declined substantially in 2012 as compared to 2011, we determined that this decline was an indicator of impairment and performed an interim impairment test as of September 30, 2012. In accordance with applicable accounting guidance, we chose to perform Step 1 of the goodwill impairment test, which compared the fair value of the Curamik Electronics Solutions operating segment to its carrying amount (including goodwill and definite and indefinite-lived intangible assets). The fair value of the operating segment

41
was determined using a discounted cash flow model based on our most recent forecasts of the business, taking into consideration macro-economic and other market trends known to us at that time. Based on this model, we determined that the fair value of the operating segment exceeded its carrying amount by approximately 14.6% and that no impairment of goodwill existed as of September 30, 2012. From a sensitivity perspective, if the fair value of the Curamik Electronics Solutions operating segment declined by 10% , the fair value of the operating unit would exceed the carrying value by approximately 3.1% . These amounts are both significantly lower than the calculation performed in the fourth quarter of 2011 (our annual impairment test date), which yielded a fair value that was approximately 55.1% in excess of the operating segment's carrying value, which reflects the current decline in the segment's results. In the fourth quarter of 2012, we reviewed the assumptions utilized in the third quarter of 2012 discounted cash flow model and no facts or circumstances existed that would cause us to change any of the underlying assumptions in that original model. Therefore, we concluded that no impairment existed as of December 31, 2012. CES had approximately $78.8 million of goodwill associated with it at December 31, 2012.
We believe that the assumptions and rates used in the impairment test related to Curamik Electronics Solutions are reasonable, but inherently uncertain. The key assumptions used in the discounted cash flow model include a discount rate of 14%, terminal growth rate of 3%, sales growth rate that ranges from 0% to 18.6% with a compounded annual growth rate of approximately 11% over the projected period, and an improving operating profit margin driven by current streamlining initiatives and better leverage on growing sales volumes. These assumptions are based on our current understanding of the markets, products and customers of Curamik Electronics Solutions, as well as projections for raw material prices, sales prices, and incremental cost streamlining initiatives, among others, over the period of the discounted cash flow model. If we fail to achieve the forecasted growth rates or the margin improvements assumed in the model or other assumptions utilized in the model need to be modified, the operating segment's fair value could become less than its carrying value, resulting in a future impairment of goodwill, other intangibles and other long lived assets of the operating segment.
For the two other reporting units with goodwill and intangible assets, High Performance Foams and Elastomer Components Division (ECD), the 2012 impairment test was performed in the fourth quarter of 2012. The HPF and ECD reporting units had allocated goodwill of approximately $24.0 million and $2.2 million, respectively, at December 31, 2012. No impairment charges resulted from this analysis. The excess of fair value over carrying value for these reporting units was 470% for HPF and 170% for ECD. From a sensitivity perspective, if the fair value of these operating segments declined by 10%, the fair value of the HPF operating segment would exceed its carrying value by approximately 415% and the fair value of the ECD operating segment would exceed its carrying value by approximately 140%. These valuations are based on a five year discounted cash flow analysis, which utilized a discount rate of approximately 14% and a terminal year growth rate of 3%.
Intangible assets, such as purchased technology, customer relationships, work force, and the like, are generally recorded in connection with a business acquisition. Values assigned to intangible assets are determined based on estimates and judgments regarding expectations of the success and life cycle of products and technology acquired, the value of the acquired businesses customer base, as well as the value of its existing work force, among others. These assets are reviewed at least annually, or more frequently, if facts and circumstances surrounding such assets indicate a possible impairment of the asset exists. In 2012, there were no indicators of impairment on any of our other intangible assets associated with the HPF and ECD operating segments. The intangible assets associated with the CES operating segment were tested in conjunction with the interim goodwill impairment analysis performed during the third quarter of 2012 and it was determined that no impairment existed on these assets as a result of that analysis.
Long-Lived Assets
We review property, plant and equipment, and other long-term assets, including investments, for impairment whenever events or changes in circumstances indicate the carrying value of assets may not be recoverable. Recoverability of these assets is measured by comparison of their carrying value to future undiscounted cash flows the assets are expected to generate over their remaining economic lives. If such assets are considered to be impaired, the impairment to be recognized in earnings equals the amount by which the carrying value of the assets exceeds their market value determined by either a quoted market price, if available, or a value determined by utilizing a discounted cash flow analysis. In the future, deterioration in our business could result in additional impairment charges. Evaluation of impairment of long-lived assets requires estimates of future operating results that are used in the preparation of the expected future undiscounted cash flows. Actual future operating results and the remaining economic lives of our long-lived assets could differ from the estimates used in assessing the recoverability of these assets. These differences could result in impairment charges, which could have a material adverse impact on our results of operations. In addition, in certain instances, assets may not be impaired but their estimated useful lives may decrease. In these situations, we amortize the remaining net book values over the revised useful lives.

42
Environmental Contingencies
We accrue for environmental investigation, remediation, operating and maintenance costs when it is probable that a liability has been incurred and the amount can be reasonably estimated. For environmental matters, the most likely cost to be incurred is accrued based on an evaluation of currently available facts with respect to each individual site, including existing technology, current laws and regulations and prior remediation experience. For sites with multiple potential responsible parties (PRPs), we consider our likely proportionate share of the anticipated remediation costs and the ability of the other parties to fulfill their obligations in establishing a provision for those costs. Where no amount within a range of estimates is more likely to occur than another, the low end of the range is accrued. When future liabilities are determined to be reimbursable by insurance coverage, an accrual is recorded for the potential liability and a receivable is recorded for the estimated insurance reimbursement amount. We are exposed to the uncertain nature inherent in such remediation and the possibility that initial estimates will not reflect the final outcome of a matter.
Product Liability and Workers' Compensation Costs
Workers' compensation liabilities in the U.S. are recognized for claims incurred (including claims incurred but not reported) and for changes in the status of individual case reserves. At the time a workers' compensation claim is filed, a liability is estimated to settle the claim and accrued at that time. The liability for workers' compensation claims is determined based on estimates of the nature and severity of the claims and based on analysis provided by third party administrators and by various state statutes and reserve requirements. We have developed our own trend factors based on our specific claims experience. In other countries where workers' compensation claims are applicable, we typically maintain insurance coverage with limited deductible payments. Because the liability is an estimate, the ultimate liability may be more or less than reported.
For product liability claims, we typically maintain insurance coverage with reasonable deductible levels to protect us from potential exposures. Any liability associated with such claims is based on management's best estimate of the potential claim value, while insurance receivables associated with related claims are not recorded until verified by the insurance carrier.
For asbestos related claims, we recognize projected asbestos liabilities and related insurance receivables, with any difference between the liability and related insurance receivable recognized as an expense in the consolidated statements of income (loss). In order to determine projected asbestos related liabilities, we have historically engaged National Economic Research Associates, Inc. (NERA), a consulting firm with expertise in the field of evaluating mass tort litigation asbestos bodily-injury claims. Further, in order to determine the projected insurance coverage on the asbestos liabilities, we have historically engaged Marsh USA, Inc, also known as Marsh Risk Consulting (Marsh), to develop these projections. Projecting future asbestos costs and related insurance coverage is subject to numerous variables that are extremely difficult to predict, including the number of claims that might be received, the type and severity of the disease alleged by each claimant, the long latency period associated with asbestos exposure, dismissal rates, costs of medical treatment, the financial resources of other companies that are co-defendants in claims, uncertainties surrounding the litigation process from jurisdiction to jurisdiction and from case to case, and the impact of potential changes in legislative or judicial standards, including potential tort reform.
The models developed for determining the potential exposure and related insurance coverage were developed by outside consultants deemed to be experts in their respective fields with the forecast for asbestos related liabilities generated by NERA and the related insurance receivable projections developed by Marsh. The models contain numerous assumptions that significantly impact the results generated by the models. We believe the assumptions made are reasonable at the present time, but are subject to uncertainty based on the actual future outcome of our asbestos litigation. Historically , due to the inherent uncertainties of the forecast process and our limited amount of settlement and claims history, we utilized a forecast period of five years, which we concluded was the most reasonable period for recognizing a reserve for projected asbestos liabilities, and that costs that might be incurred after that period were not reasonably estimable at that time. In 2012, we reviewed this assumption and determined that it was appropriate to extend the forecast period from five years to 10 years. We reached this conclusion due to the fact that we now have considerably more experience in addressing asbestos related lawsuits and have a longer history of activity to use as a baseline to more accurately project the liability over a longer period than previously disclosed. Further, settlement trends have become more meaningful in recent years and we believe that we now have a more meaningful history of data on which to base our projections. Further, we determined that a 10 year projection period is now appropriate as, although we have a longer and more consistent history of data over the last few years, we do not believe we have sufficient data to justify a longer projection period at this time. As of December 31, 2012, the estimated liability and estimated insurance recovery for the ten-year period through 2022 was $51.4 million and $48.3 million, respectively, resulting in an additional charge of $2.9 million recognized in the fourth quarter of 2012 ($0.2 million was previously recognized throughout 2012). For sensitivity purposes, if the forecast period was decreased to five years, the projected liability and related insurance recovery would be $30.1 million and $29.2 million, respectively. Also, if the forecast period was increased to fifteen years, the projected liability and related insurance recovery would be $67.9 million and $63.3 million, respectively.

43
Given the inherent uncertainty in making future projections, we plan to have the projections of current and future asbestos claims periodically re-examined, and we will update them further if needed based on our experience, changes in the underlying assumptions that formed the basis for NERA's and Marsh's models, and other relevant factors, such as changes in the tort system. There can be no assurance that our accrued asbestos liabilities will approximate our actual asbestos-related settlement and defense costs, or that our accrued insurance recoveries will be realized. We believe that it is reasonably possible that we will incur additional charges for our asbestos liabilities and defense costs in the future, which could exceed existing reserves, but cannot reasonably estimate such excess amounts at this time.
Legal Contingencies
From time to time we are a defendant in legal matters, including those involving environmental law and product liability (as discussed in more detail above). As required by US GAAP, we determine whether an amount with respect to a loss from a loss contingency should be accrued by assessing whether a loss is deemed probable and the loss amount can be reasonably estimated. Separately, we would analyze any potential insurance proceeds that would be available to offset the claim amounts. Estimates of potential outcomes of these contingencies are developed in consultation with internal and external counsel. While this assessment is based upon all available information, litigation is inherently uncertain and the ultimate outcome of such litigation could be more or less than original estimates. Final resolution of such matters could negatively effect our results of operations, cash flows and financial position.
Pension and Other Postretirement Benefits
We provide various defined benefit pension plans for our U.S. employees and sponsor three defined benefit health care plans and a life insurance plan. The costs and obligations associated with these plans are dependent upon various actuarial assumptions used in calculating such amounts. These assumptions include discount rates, salary growth, long-term rates of return on plan assets, mortality rates, and other factors. The assumptions used were determined as follows: (i) the discount rate used is based on comparisons to various indexes, particularly the Citigroup bond index; (ii) the salary growth rate is based on our historical and projected level of salary increases; and (iii) the long-term rate of return on plan assets is determined based on historical portfolio results, market conditions and our expectations of future returns. We determine these assumptions based on consultation with outside actuaries and investment advisors. Any changes in these assumptions could have a significant impact on future recognized pension costs, assets and liabilities. The rates used to determine our costs and obligations under our pension and postretirement plans are disclosed in Note 9 of the Consolidated Financial Statements of this Form 10-K. Each assumption has different sensitivity characteristics. For the year ended December 31, 2012, a 25 basis point decrease in the discount rate would have increased our total pension expense by approximately $0.6 million and a 25 basis point reduction in the long-term rate of return on plan assets would have increased our total pension expense by approximately $0.3 million.
Income Taxes
The objective of accounting for income taxes is to recognize the amount of taxes payable or refundable for the current fiscal year and the deferred tax assets and liabilities for the future tax consequences of events that have been recognized in our Financial Statements. Deferred tax assets and liabilities reflect temporary differences between amounts of assets and liabilities for financial and tax reporting. Such amounts are adjusted, as appropriate, to reflect changes in tax rates expected to be in effect when the temporary differences reverse. We establish a valuation allowance to offset any deferred tax assets if, based upon available evidence, it is more likely than not that some or all of the deferred tax asset will not be realized. The determination of the amount of a valuation allowance to be provided on recorded deferred tax assets involves estimates regarding (i) the timing and amount of the reversal of taxable temporary differences; (ii) expected future taxable income; and (iii) the impact of tax planning strategies. In assessing the need for a valuation allowance, we consider all available positive and negative evidence, including past operating results, projections of future taxable income and the feasibility of ongoing tax planning strategies. The projections of future taxable income include a number of estimates and assumptions regarding our volume, pricing and costs. Additionally, valuation allowances related to deferred tax assets can be impacted by changes to tax laws.
Significant judgment is required in determining income tax provisions and in evaluating tax positions. We establish additional provisions for income taxes when, despite the belief that tax positions are fully supportable, there remain certain positions that are likely to be challenged and that may not be sustained on review by tax authorities. In the normal course of business, we are examined by various Federal, State and foreign tax authorities. We regularly assess the potential outcomes of these and any future examinations for the current or prior years in determining the adequacy of our provision for income taxes. We continually assess the likelihood and amount of potential adjustments and adjust the income tax provision, the current tax liability and deferred taxes in the period in which the facts that give rise to a revision become known.
It is our policy that no U.S. taxes are provided on undistributed earnings of certain wholly-owned foreign subsidiaries because substantially all such earnings are expected to be reinvested indefinitely. If circumstances change and it becomes apparent that

44
some or all of the undistributed earnings of our wholly-owned foreign subsidiaries will not be indefinitely reinvested, provision for the tax consequences, if any, will be recorded in the period circumstances change. We do provide deferred taxes for the undistributed earnings of our Japanese high performance foams joint venture.
Stock-Based Compensation
Stock-based compensation expense associated with stock options and related awards is recognized in the consolidated statements of income (loss). Determining the amount of stock-based compensation expense to be recorded requires us to develop estimates to be used in calculating the grant-date fair value of stock options. We calculate the grant-date fair values using the Black-Scholes valuation model. The use of valuation models requires us to make estimates for the following assumptions:
Expected volatility - In determining expected volatility, we consider a number of factors, including historical volatility and implied volatility.
Expected term - We use historical employee exercise data to estimate the expected term assumption for the Black-Scholes valuation model.
Risk-free interest rate - We use the yield on zero-coupon U.S. Treasury securities for a period commensurate with the expected term assumption as the risk-free interest rate.
Expected dividend yield – We do not currently pay dividends on our common stock; therefore, a dividend yield of 0% was used in the Black-Scholes model.
The amount of stock-based compensation expense recognized during a period is based on the value of the portion of the awards that are ultimately expected to vest. Forfeitures are estimated at the time of grant and revised, if necessary, in subsequent periods if actual forfeitures differ from those estimates. The term “forfeitures” is distinct from “cancellations” or “expirations” and represents only the unvested portion of the surrendered option. Based on an analysis of our historical forfeitures, we have applied an annual forfeiture rate of 3% to all unvested stock-based awards as of December 31, 2012. The rate of 3% represents the portion that is expected to be forfeited each year over the vesting period. This analysis is re-evaluated annually and the forfeiture rate is adjusted as necessary. Ultimately, the actual expense recognized over the vesting period will only be for those awards that vest.

45
Item 7A. Quantitative and Qualitative Disclosures About Market Risk
Market Risk
• Foreign Operations
Our financial results are affected by changes in foreign exchange rates and economic conditions in foreign countries in which we do business. Our primary overseas markets are in Europe and Asia, thus exposing us to exchange rate risk from fluctuations in the Euro and the various currencies used in the Far East. Exposure to variability in currency exchange rates is mitigated, when possible, through the use of natural hedges, whereby purchases and sales in the same foreign currency and with similar maturity dates offset one another. We further mitigate this exposure through hedging activities by entering into foreign exchange forward contracts with third parties when the use of natural hedges is not possible or desirable. We currently do not use derivative instruments for trading or speculative purposes. We monitor foreign exchange risks and at times manage such risks on specific transactions. Our risk management process primarily uses analytical techniques and sensitivity analysis. In 2012, a 10% increase/decrease in exchange rates would have resulted in an approximate increase/decrease to sales and net income of $6.2 million and $0.5 million, respectively.
• Interest Rate Risk
During the first quarter of 2011, we borrowed $145.0 million against our existing credit facilities to finance the strategic acquisition of Curamik Electronics GmbH. Therefore, we are exposed to interest rate risk, as the interest charged on our facility fluctuates with movements in the benchmark LIBOR rate. In 2012, in order to limit the exposure to upward movement in interest rates, we entered into an interest rate swap, which will take effect in July 2013. This instrument caps our exposure to upward movements in rates at 0.752% on 65% of the outstanding debt. Any movement in rates above this level would be offset by gains related on the swap. At December 31, 2012, the effective rate of interest we are paying on the debt facility approximates 2.50%. Based on our current outstanding debt of $98.0 million, a 100 basis point increase in the LIBOR rate would increase the amount of interest expense by $1.0 million, annually. However, that increase would fully impact only 35% of the debt, while effective LIBOR on the other 65% is capped at 0.752%
• Commodity Risk
We are subject to fluctuations in the cost of raw materials used to manufacture our materials and products. In particular, we are exposed to market fluctuations in commodity pricing as we utilize certain materials, such as copper and ceramic, that are key materials in certain of our products. In order to minimize the risk of market driven price changes in these commodities, we utilize hedging strategies to insulate us against price fluctuations of copper, the commodity most used in our manufacturing processes. We currently do not use hedging strategies to minimize the risk of price fluctuations on other commodity-based raw materials; however, we continue to review such strategies to hedge market risk in the future.
For additional discussion on our market risk, see Notes 2 and 3 to the Consolidated Financial Statements in Item 8 of this Form 10-K.

46
Item 8. Financial Statements and Supplementary Data
REPORT OF INDEPENDENT REGISTERED PUBLIC ACCOUNTING FIRM
The Board of Directors and Shareholders of Rogers Corporation
We have audited the accompanying consolidated statements of financial position of Rogers Corporation as of December 31, 2012 and 2011, and the related consolidated statements of income (loss), shareholders' equity, comprehensive income (loss) and cash flows for each of the three years in the period ended December 31, 2012. Our audits also included the financial statement schedule listed in the Index at Item 15(a). These financial statements and schedule are the responsibility of the Company's management. Our responsibility is to express an opinion on these financial statements and schedule based on our audits.
We conducted our audits in accordance with the standards of the Public Company Accounting Oversight Board (United States). Those standards require that we plan and perform the audit to obtain reasonable assurance about whether the financial statements are free of material misstatement. An audit includes examining, on a test basis, evidence supporting the amounts and disclosures in the financial statements. An audit also includes assessing the accounting principles used and significant estimates made by management, as well as evaluating the overall financial statement presentation. We believe that our audits provide a reasonable basis for our opinion.
In our opinion, the financial statements referred to above present fairly, in all material respects, the consolidated financial position of Rogers Corporation at December 31, 2012 and 2011, and the consolidated results of its operations and its cash flows for each of the three years in the period ended December 31, 2012, in conformity with U.S. generally accepted accounting principles. Also, in our opinion, the related financial statement schedule, when considered in relation to the basic financial statements taken as a whole, presents fairly, in all material respects, the information set forth therein.
We also have audited, in accordance with the standards of the Public Company Accounting Oversight Board (United States), Rogers Corporation's internal control over financial reporting as of December 31, 2012, based on criteria established in Internal Control - Integrated Framework issued by the Committee of Sponsoring Organizations of the Treadway Commission and our report dated February 20, 2013 expressed an unqualified opinion thereon.
/s/ Ernst & Young LLP
Providence, Rhode IslandFebruary 20, 2013

The accompanying notes are an integral part of the consolidated financial statements.47
ROGERS CORPORATIONCONSOLIDATED STATEMENTS OF FINANCIAL POSITION(Dollars in thousands, except for share amounts)
December 31, 2012 December 31, 2011Assets
Current assetsCash and cash equivalents $ 114,863 $ 79,728Restricted Cash 950 —Accounts receivable, less allowance for doubtful accounts of $1,773 and $1,040 78,788 77,286Accounts receivable from joint ventures 2,142 1,640Accounts receivable, other 2,297 3,807Taxes receivable 5,079 2,713Inventories 73,178 77,935Prepaid income taxes 4,914 4,315Deferred income taxes 7,225 2,146Asbestos-related insurance receivables 8,195 6,459Other current assets 8,559 7,360Assets held for sale — 1,400Assets of discontinued operations 746 843
Total current assets 306,936 265,632
Property, plant and equipment, net of accumulated depreciation of $205,575 and $193,721 149,017 148,182Investments in unconsolidated joint ventures 21,171 23,868Deferred income taxes 71,439 20,117Goodwill 105,041 102,178Other intangible assets 53,288 56,449Asbestos-related insurance receivables 40,067 21,943Investments, other 5,000 5,000Other long-term assets 8,065 8,299Long-term marketable securities — 25,960
Total assets $ 760,024 $ 677,628
Liabilities and Shareholders’ Equity Current liabilities
Accounts payable $ 16,730 $ 15,731Accrued employee benefits and compensation 23,156 30,130Accrued income taxes payable 3,135 1,799Current portion of lease obligation 1,423 1,596Current portion of long term debt 20,500 7,500Asbestos-related liabilities 8,195 6,459Other accrued liabilities 11,363 15,343Liabilities of discontinued operations 3 239
Total current liabilities 84,505 78,797
Long term debt 77,500 115,000Long term lease obligation 6,942 7,610Pension liability 65,942 68,871Retiree health care and life insurance benefits 10,654 9,486Asbestos-related liabilities 43,222 22,326Non-current income tax 19,300 17,588Deferred income taxes 17,545 19,259Other long-term liabilities 262 435
Shareholders’ Equity Capital Stock - $1 par value; 50,000,000 authorized shares; 16,904,441 and 16,220,648 shares
outstanding 16,904 16,221Additional paid-in capital 74,272 52,738Retained earnings 400,784 332,099Accumulated other comprehensive income (loss) (57,808) (62,802)
Total shareholders' equity 434,152 338,256Total liabilities and shareholders' equity $ 760,024 $ 677,628

The accompanying notes are an integral part of the consolidated financial statements.48
CONSOLIDATED STATEMENTS OF INCOME (LOSS)For each of the fiscal years in the three-year period ended December 31, 2012(Dollars in thousands, except per share amounts)
2012 2011 2010Net sales $ 498,761 $ 548,341 $ 373,230Cost of sales 340,015 369,356 236,281Gross margin 158,746 178,985 136,949
Selling and administrative expenses 99,689 103,532 87,620Research and development expenses 19,311 21,530 17,754Restructuring and impairment charges 14,082 441 —Operating income (loss) 25,664 53,482 31,575
Equity income in unconsolidated joint ventures 4,743 5,451 8,658Other income (expense), net (208) 1,942 1,364Realized investment gain (loss):
Increase (decrease) in fair value of investments (522) (14) 1,271Less: Portion reclassified to/from other comprehensive income 2,723 182 1,824Net realized gain (loss) (3,245) (196) (553)
Interest income (expense), net (4,304) (4,911) 184Gain on acquisition or disposal — — 3,173Income (loss) before income tax expense (benefit) 22,650 55,768 44,401
Income tax expense (benefit) (46,484) 11,518 5,850Income (loss) from continuing operations 69,134 44,250 38,551
Income (loss) from discontinued operations, net of income taxes (449) (7,195) (3,980)Net income (loss) $ 68,685 $ 37,055 $ 34,571
Basic net income (loss) per share: Income (loss) from continuing operations $ 4.21 $ 2.76 $ 2.44Income (loss) from discontinued operations (0.03) (0.45) (0.25)Net income (loss) $ 4.18 $ 2.31 $ 2.19
Diluted net income (loss) per share: Income (loss) from continuing operations $ 4.07 $ 2.64 $ 2.41Income (loss) from discontinued operations (0.03) (0.43) (0.25)Net income (loss) $ 4.04 $ 2.21 $ 2.16
Shares used in computing: Basic net income per share 16,426,209 16,035,882 15,800,913Diluted net income per share 16,991,158 16,737,711 16,005,662

The accompanying notes are an integral part of the consolidated financial statements.49
CONSOLIDATED STATEMENTS OF SHAREHOLDERS EQUITY(Dollars in thousands)
Capital Stock
Additional Paid-In Capital
Retained Earnings
Accumulated Other
Comprehensive Income (Loss)
TotalShareholders’
EquityBalance at December 31, 2009 $ 15,743 $ 25,160 $ 260,473 $ (8,426) $ 292,950
Net income (loss): — — 34,571 — 34,571Other comprehensive income (loss): (5,121) (5,121)Stock options exercised 26 764 — — 790Stock issued to directors 38 (10) — — 28Shares issued for employees stock purchase plan 34 652 — — 686Stock-based compensation expense — 6,628 — — 6,628Balance at December 31, 2010 15,841 33,194 295,044 (13,547) 330,532
Net income (loss): — — 37,055 — 37,055Other comprehensive income (loss): (49,255) (49,255)Stock options exercised 330 10,741 — — 11,071Stock issued to directors 22 (21) — — 1Shares issued for employees stock purchase plan 28 728 — — 756Stock-based compensation expense — 8,096 — — 8,096Balance at December 31, 2011 16,221 52,738 332,099 (62,802) 338,256
Net income (loss): — — 68,685 — 68,685Other comprehensive income (loss): 4,994 4,994Stock options exercised 603 16,404 — — 17,007Stock issued to directors 15 (15) — — —Shares issued for employees stock purchase plan 27 782 — — 809Shares issued for restricted stock 38 (790) — — (752)Stock-based compensation expense — 5,153 — — 5,153Balance at December 31, 2012 $ 16,904 $ 74,272 $ 400,784 $ (57,808) $ 434,152

The accompanying notes are an integral part of the consolidated financial statements.50
CONSOLIDATED STATEMENTS OF COMPREHENSIVE INCOME (LOSS)(Dollars in thousands)
2012 2011 2010Income (loss) from continuing operations, net of tax $ 69,134 $ 44,250 $ 38,551
Foreign currency translation adjustment 6,710 (6,632) (4,588)Net unrealized gains (losses) on securities:
Net unrealized gain (loss) (net of taxes of $1,555 in 2012, $292 in 2011 and $212 in2010) on marketable securities. 1,168 (110) 1,611
Derivative instruments designated as cash flow hedges:Unrealized gain (loss) on derivative instruments held at year end (net of taxes of$127 in 2012) (235) (270) —Unrealized gain (loss) reclassified into earnings 270 — 142
Accumulated other comprehensive income (loss) pension and post retirement benefits: Actuarial net gain (loss) incurred in fiscal year (6,687) (44,964) (4,413) Amortization of gain (loss) 3,760 2,752 2,153 Amortization of prior service credit (cost) 8 (31) (26)
Other comprehensive income (loss) 4,994 (49,255) (5,121)Comprehensive income (loss) from continuing operations 74,128 (5,005) 33,430Income (loss) from discontinued operations, net of income taxes (449) (7,195) (3,980)Comprehensive income (loss) $ 73,679 $ (12,200) $ 29,450

The accompanying notes are an integral part of the consolidated financial statements.51
CONSOLIDATED STATEMENTS OF CASH FLOWS For each of the fiscal years in the three-year period ended December 31, 2012(Dollars in thousands)
December 31,2012
December 31,2011
December 31,2010
Operating Activities: Net income (loss) $ 68,685 $ 37,055 $ 34,571Loss (earnings) from discontinued operations 449 7,195 3,980
Adjustments to reconcile net income to cash provided by (used in) operating activities: Depreciation and amortization 27,130 26,308 15,700Stock-based compensation expense 5,153 8,096 6,628Loss from long-term investments 3,245 — —Deferred income taxes (58,253) (2,725) (8,381)Equity in undistributed income of unconsolidated joint ventures, net (4,743) (5,451) (8,658)Dividends received from unconsolidated joint ventures 6,553 7,637 10,329Pension and postretirement benefits 13,579 5,902 5,838Gain from the sale of property, plant and equipment (1,404) (2,800) (3,173)Impairment of assets 539 441 —Amortization of inventory fair value — 1,805 —
Changes in operating assets and liabilities excluding effects of acquisition and disposition of businesses:
Accounts receivable (2,333) (5,051) (15,694)Accounts receivable, joint ventures (502) (302) (537)Inventories 5,873 (20,628) (10,752)Pension contribution (23,518) (5,904) (6,409)Other current assets (1,497) (1,336) (1,566)Accounts payable and other accrued expenses (3,461) (27,229) 21,314Other, net 4,872 (929) 6,163
Net cash provided by (used in) operating activities of continuing operations 40,367 22,084 49,353Net cash provided by (used in) operating activities of discontinued operations (328) (5,223) (3,588)Net cash provided by (used in) operating activities 40,039 16,861 45,765
Investing Activities: Capital expenditures (23,774) (21,316) (12,241)Proceeds from the sale of property, plant and equipment, net 2,804 7,500 —Return of investment in unconsolidated joint ventures — — 919Proceeds from disposition of an unconsolidated joint venture — — 9,272Redemptions of long-term investments 25,438 7,805 5,800Acquisition of business, net of cash received (3,100) (139,825) (25,908)
Net cash provided by (used in) investing activities of continuing operations 1,368 (145,836) (22,158)Net cash provided by (used in) investing activities of discontinued operations — (158) (366)Net cash provided by (used in) investing activities 1,368 (145,994) (22,524)
Financing Activities: Proceeds from long term borrowings — 145,000 —Repayment of debt principal and long term lease obligation (25,519) (22,500) —Payment of long term borrowings acquired through acquisition — (6,061) —Proceeds from sale of capital stock, net 17,007 11,071 790

The accompanying notes are an integral part of the consolidated financial statements.52
Issuance of restricted stock (752) — —Proceeds from issuance of shares to employee stock purchase plan 809 756 686
Net cash provided by (used in) financing activities of continuing operations (8,455) 128,266 1,476
Effect of exchange rate fluctuations on cash 2,183 460 (2,320)
Net increase (decrease) in cash and cash equivalents 35,135 (407) 22,397Cash and cash equivalents at beginning of year 79,728 80,135 57,738Cash and cash equivalents at end of year $ 114,863 $ 79,728 $ 80,135
Supplemental disclosure of noncash investing and financing activities Capital lease obligation acquired through acquisition $ — $ 9,206 $ —
Deferred purchase price for acquisition of business — — 2,910

53
ROGERS CORPORATION
NOTES TO CONSOLIDATED FINANCIAL STATEMENTS
NOTE 1 ORGANIZATION AND SUMMARY OF SIGNIFICANT ACCOUNTING POLICIES
Organization
Our reporting structure is comprised of the following operating segments: High Performance Foams, Printed Circuit Materials, Curamik Electronics Solutions and Power Distribution Systems and the Other reportable segment. The “Power Electronics Solutions” core strategic category is comprised of two operating segments - Curamik Electronics Solutions and Power Distribution Systems.
Segment StructureCore Strategic
High Performance FoamsPrinted Circuit MaterialsPower Electronics Solutions
Curamik Electronics SolutionsPower Distribution Systems
Other
Core Strategic
• High Performance Foams: This operating segment consists of polyurethane and silicone foam products, and includes two joint ventures that manufacture products consisting primarily of high performance urethane foams. These foams are designed to perform to predetermined specifications where combinations of properties are needed to satisfy rigorous mechanical and environmental requirements. These materials are sold primarily to fabricators and OEMs on a worldwide basis.
• Printed Circuit Materials: This operating segment includes printed circuit board laminate products for high frequency, high performance applications. These products tend to be proprietary materials that provide highly specialized electrical and mechanical properties to meet the demands of increasing speed, complexity, and power in analog, digital, and microwave equipment. These materials are fabricated, coated and/or customized as necessary to meet customer demands and are sold worldwide.
• Power Electronics Solutions: This reporting category includes Curamik Electronics Solutions and Power Distribution Systems. We now separately report the results of operations for both of these operating segments.
• Curamik Electronics Solutions
We acquired Curamik in the first quarter of 2011. Founded in 1983 and headquartered in Eschenbach, Germany, Curamik is a manufacturer of direct copper bonded (DCB) ceramic substrate products used in the design of intelligent power management devices, such as insulated gate bipolar transistor (IGBT) modules. These devices enable a wide range of products including highly efficient industrial motor drives, wind and solar converters and electric and hybrid electric vehicle drive systems. Most of Curamik’s products are manufactured using state-of-the-art automated processes in its facility in Germany.
• Power Distribution Systems
The PDS operating segment manufactures busbar power distribution products in Ghent, Belgium and Suzhou, China under the RO-LINX POWERCIRCUIT® trade name. We sell these RO-LINX POWERCIRCUIT products to manufacturers of high power electrical inverter and converter systems for use in mass transit (e.g. high speed trains) and clean technology applications (e.g. wind turbines, solar farms and electric vehicles). In the industrial application area, our RO-LINX POWERCIRCUIT products are utilized in a large variety of variable frequency drives for high to mid power applications.

54
Other
The Other reportable segment consists of elastomer rollers, floats and inverter distribution activities.
Elastomer components are sold to OEMs for applications in ground transportation, office equipment, consumer and other markets. Trade names for our elastomer components include: NITROPHYL® floats for level sensing in fuel tanks, motors, and storage tanks and ENDUR® elastomer rollers and belts for document handling in copiers, printers, mail sorting machines and automated teller machines.
Our inverters are sold primarily to OEMs and fabricators that in turn sell to various other third parties that primarily serve the portable communication and automotive markets. Prior to 2011, this segment included sales of our electroluminescent lamp products, which came to end of life and are no longer produced.
Principles of Consolidation
The consolidated financial statements include the accounts of the Company and our subsidiaries, after elimination of intercompany accounts and transactions.
For all periods and amounts presented, reclassifications have been made for discontinued operations. In the fourth quarter of 2011, operations of the Thermal Management Solutions operating segment ended and the segment qualified as a discontinued operation at that time. Also, in the fourth quarter of 2012, the operations of the non-woven composite materials operating segment (aggregated in the Other reportable segment) ended and the segment qualified as a discontinued operations. See “Note 17 - Discontinued Operations” for further discussion.
Cash Equivalents
Highly liquid investments with original maturities of three months or less are considered cash equivalents. These investments are stated at cost, which approximates fair value.
Marketable Securities
We determine the appropriate classification of debt securities at the time of purchase and reevaluate such designation as of each balance sheet date. Debt securities are classified as held-to-maturity when we have the positive intent and ability to hold the securities to maturity. Marketable equity securities and debt securities not classified as held-to-maturity are classified as available-for-sale. Available-for-sale securities are carried at fair value with interest on such securities included in “Interest income” on our consolidated statements of income (loss). If the market values of individual securities are determined to be “other than temporarily” impaired, the carrying amount of such investments are written down to market value through “Net realized gain (loss)” in our consolidated statements of income (loss). Except for amounts recorded related to the auction rate securities, we have not recorded any such write down in 2012, 2011 or 2010, respectively. See “Note 2 - Fair Value Measurements” for further discussion on the auction rate securities.
Investments in Unconsolidated Joint Ventures
We account for our investments in and advances to unconsolidated joint ventures, all of which are 50% owned, using the equity method of accounting.
Foreign Currency
All balance sheet accounts of foreign subsidiaries are translated or remeasured at exchange rates in effect at each year end, and income statement items are translated at the average exchange rates for the year. Resulting translation adjustments for those entities that operate under the local currency are made directly to a separate component of shareholders' equity, while remeasurement adjustments for those entities that operate under the parent's functional currency are made to the income statement as a component of “Other income, net”. Currency transaction adjustments are reported as income or expense in the consolidated income statement as a component of "Other income, net". Such adjustments resulted in a loss of $0.8 million in 2012, a gain of $0.6 million in 2011, and a gain of $1.3 million in 2010.

55
Allowance for Doubtful Accounts
The allowance for doubtful accounts is determined based on a variety of factors that affect the potential collectability of the related receivables, including the length of time receivables are past due, customer credit ratings, financial stability of customers, specific one-time events and past customer history. In addition, in circumstances where we are made aware of a specific customer's inability to meet its financial obligations, a specific allowance is established. The majority of accounts are individually evaluated on a regular basis and appropriate reserves are established as deemed appropriate based on the criteria previously mentioned. The remainder of the reserve is based on management's estimates and takes into consideration historical trends, market conditions and the composition of our customer base.
Inventories
Inventories are valued at the lower of cost or market. Certain inventories, amounting to $17.1 million and $14.9 million at December 31, 2012 and 2011, respectively, are valued by the (LIFO) method. These inventories accounted for 27% of total gross inventory in 2012 and 23% of total gross inventory in 2011. The cost of the remaining portion of the inventories was determined principally on the basis of actual first-in, first-out (FIFO) costs.
If the inventories valued using the LIFO method had been valued at FIFO costs, their value would have increased by approximately $6.5 million and $5.9 million at December 31, 2012 and 2011, respectively.
Inventories consist of the following:
(Dollars in thousands) December 31, 2012 December 31, 2011
Raw materials $ 29,064 $ 30,513
Work-in-process 13,154 14,664
Finished goods 30,960 32,758
Total Inventory $ 73,178 $ 77,935
Property, Plant and Equipment
Property, plant and equipment are stated on the basis of cost. For financial reporting purposes, provisions for depreciation are calculated on a basis over the following estimated useful lives of the underlying assets:
Years
Buildings and improvements 10-15
Machinery and equipment 5-15
Office equipment 3-10
Goodwill and Intangible Assets
Intangible assets are classified into three categories: (1) intangible assets with definite lives subject to amortization; (2) intangible assets with indefinite lives not subject to amortization; and (3) goodwill. We review goodwill, which has an indefinite life, and intangible assets with indefinite lives for impairment annually and/or if events or changes in circumstances indicate the carrying value of an asset may have been impaired. We review intangible assets with definite lives for impairment whenever conditions exist that indicate the carrying value may not be recoverable, such as economic downturn in a market or a change in the assessment of future operations.
Goodwill and indefinite lived intangible assets are assessed for impairment by comparing the net book value of a reporting unit to its estimated fair value. Fair values are typically established using a discounted cash flow methodology. The determination of discounted cash flows is based on the reporting unit's strategic plans and long-term operating forecasts. The revenue growth rates included in the plans are management's best estimates based on current and forecasted market conditions, and the profit margin assumptions are projected by each segment based on the current cost structure and anticipated changes in that structure.
Purchased or acquired patents, covenants-not-to-compete, customer relationships and licensed technology are capitalized and amortized on a straight-line or accelerated basis over their estimated useful lives.

56
Environmental and Product Liabilities
We accrue for our environmental investigation, remediation, operating and maintenance costs when it is probable that a liability has been incurred and the amount can be reasonably estimated. For environmental matters, the most likely cost to be incurred is accrued based on an evaluation of currently available facts with respect to each individual site, including existing technology, current laws and regulations and prior remediation experience. For sites with multiple potential responsible parties (PRPs), we consider our likely proportionate share of the anticipated remediation costs and the ability of the other parties to fulfill their obligations in establishing a provision for those costs. When no amount within a range of estimates is more likely to occur than another, we accrue to the low end of the range. When future liabilities are determined to be reimbursable by insurance coverage, an accrual is recorded for the potential liability and a receivable is recorded for the estimated insurance reimbursement amount. We are exposed to the uncertain nature inherent in such remediation and the possibility that initial estimates will not reflect the final outcome of a matter.
In late 2004, we determined that it was reasonably prudent, based on facts and circumstances known to us at that time, to perform a formal analysis to determine our potential future liability and related insurance coverage for asbestos-related matters. The determination to perform this study was made based on several factors, including the growing number of asbestos-related claims and recent settlement history. Projecting future asbestos costs is subject to numerous variables that are extremely difficult to predict, including the number of claims that might be received, the type and severity of the disease alleged by each claimant, the long latency period associated with asbestos exposure, dismissal rates, costs of medical treatment, the financial resources of other companies that are co-defendants in claims, uncertainties surrounding the litigation process from jurisdiction to jurisdiction and from case to case, and the impact of potential changes in legislative or judicial standards, including potential tort reform. Furthermore, any predictions with respect to these variables are subject to even greater uncertainty as the projection period lengthens.
The models developed for determining the potential exposure and related insurance coverage were developed by outside consultants deemed to be experts in their respective fields with the forecast for asbestos related liabilities generated by National Economic Research Associates, Inc. (NERA) and the related insurance receivable projections developed by Marsh Risk Consulting (Marsh). The models contain numerous assumptions that significantly impact the results generated by the models. We believe the assumptions made are reasonable at the present time, but are subject to uncertainty based on the actual future outcome of our asbestos litigation. Historically , due to the inherent uncertainties of the forecast process and our limited amount of settlement and claims history, we utilized a forecast period of five years, which we concluded was the most reasonable period for recognizing a reserve for projected asbestos liabilities, and that costs that might be incurred after that period were not reasonably estimable at this time. In 2012, we reviewed this assumption and determined that it was appropriate to extend the forecast period from five years to ten years. We reached this conclusion due to the fact that we now have considerably more experience in addressing asbestos related lawsuits and have a longer history of activity to use as a baseline to more accurately project the liability over a longer period than previously disclosed. Further, settlement trends have become more consistent in recent years and we believe that we now have a more meaningful history of data on which to base our projections. Further, we determined that a 10 year projection period is now appropriate as, although we have a longer and more consistent history of data over the last few years, we do not believe we have sufficient data to justify a longer projection period at this time. As of December 31, 2012, the estimated liability and estimated insurance recovery for the ten-year period through 2022 was $51.4 million and $48.3 million, resulting in an additional charge of $2.9 million recognized in the fourth quarter of 2012 ($0.2 million was previously recognized throughout 2012). For sensitivity purposes, if the forecast period was decreased to five years, the projected liability and related insurance recovery would be $30.1 million and $29.2 million, respectively. Also, if the forecast period was increased to fifteen years, the projected liability and related insurance recovery would be $67.9 million and $63.3 million, respectively.
Given the inherent uncertainty in making future projections, we plan to have the projections of current and future asbestos claims periodically re-examined, and we will update them further if needed based on our experience, changes in the underlying assumptions that formed the basis for NERA's and Marsh's models, and other relevant factors, such as changes in the tort system. There can be no assurance that our accrued asbestos liabilities will approximate our actual asbestos-related settlement and defense costs, or that our accrued insurance recoveries will be realized. We believe that it is reasonably possible that we will incur additional charges for our asbestos liabilities and defense costs in the future, which could exceed existing reserves, but cannot reasonably estimate such excess amounts at this time.
Fair Value of Financial Instruments
Management believes that the carrying values of financial instruments, including cash and cash equivalents, short-term investments, accounts receivable, long-term marketable securities, accounts payable, accrued liabilities and debt approximate fair value based on the maturities of these instruments.

57
Concentration of Credit and Investment Risk
We extend credit on an uncollateralized basis to almost all customers. Concentration of credit and geographic risk with respect to accounts receivable is limited due to the large number and general dispersion of accounts that constitute our customer base. We routinely perform credit evaluations on our customers. At December 31, 2012 and 2011, there were no customers that individually accounted for more than ten percent of total accounts receivable. We did not experience significant credit losses on customers' accounts in 2012, 2011, or 2010.
We invest excess cash principally in investment grade government and corporate debt securities. We have established guidelines relative to diversification and maturities in order to maintain safety and liquidity. These guidelines are periodically reviewed and modified to reflect changes in market conditions.
Income Taxes
The objective of accounting for income taxes is to recognize the amount of taxes payable or refundable for the current year and the deferred tax liabilities and assets for the future tax consequences of events that have been recognized in the entity's financial statements. We are subject to income taxes in the United States and in numerous foreign jurisdictions. No provision is made for U.S. income taxes on the undistributed earnings of our wholly-owned foreign subsidiaries because substantially all such earnings are indefinitely reinvested in those companies. If circumstances change and it becomes apparent that some or all of the undistributed earnings of our wholly-owned foreign subsidiaries will not be indefinitely reinvested, provision for the tax consequences, if any, will be recorded in the period circumstances change.
We have provided for potential liabilities due in various jurisdictions. In the ordinary course of global business, there are many transactions and calculations where the ultimate tax outcome is uncertain. Some of these uncertainties arise as a consequence of cost reimbursement arrangements among related entities. Although we believe our estimates are reasonable, no assurance can be given that the final tax outcome of these matters will not be different than that which is reflected in the historical income tax provisions and accruals. Such differences could have a material impact on our income tax provision and operating results in the period in which such determination is made.
Revenue Recognition
Revenue from product sales to customers is recognized when title passes to the customer, when persuasive evidence of an arrangement exists, the price is fixed or determinable, and collection is reasonably assured.
Shipping and Handling Charges
Costs that we incur for shipping and handling charges are charged to “Cost of sales” and payments received from our customers for shipping and handling charges are included in “Net sales” on our consolidated statements of income (loss).
Pension and Retiree Health care and Life Insurance Benefits
We provide various defined benefit pension plans for our U.S. employees and we sponsor multiple fully insured or self-funded medical plans and a fully insured life insurance plan for retirees. The costs and obligations associated with these plans are dependent upon various actuarial assumptions used in calculating such amounts. These assumptions include discount rates, salary growth, long-term rate of return on plan assets, mortality rates, and other factors. The assumptions used in these models are determined as follows: (i) the discount rate used is based on comparisons to the Citigroup index, (ii) the salary growth is based on our historical and projected level of salary increases; (iii) the long-term rate of return on plan assets is determined based on historical portfolio results, market results and our expectations of future returns, as well as current market assumptions related to long-term return rates; and (iv) the mortality rate is based on a mortality projection that estimates current longevity rates and their impact on the long-term plan obligations. We review these assumptions periodically throughout the year and update as necessary.

58
Earnings Per Share
The following table sets forth the computation of basic and diluted earnings per share:
(In thousands, except per share amounts) 2012 2011 2010Numerator:
Net income (loss) $ 69,134 $ 44,250 $ 38,551Denominator:
Denominator for basic earnings per share - Weighted-average shares 16,426,209 16,035,882 15,800,913
Effect of dilutive stock options 564,949 701,829 204,749Denominator for diluted earnings per share - Adjusted weighted-average shares and assumed conversions 16,991,158 16,737,711 16,005,662Basic income (loss) per share: $ 4.21 $ 2.76 $ 2.44Diluted income (loss) per share: 4.07 2.64 2.41
Certain potential ordinary shares were excluded from the calculation of diluted weighted-average shares outstanding because they would have an anti-dilutive effect on net income per share.
2012 2011 2010Anti-dilutive shares excluded 774,878 879,604 1,407,865
Use of Estimates
The preparation of financial statements, in conformity with U.S. generally accepted accounting principles, requires management to make estimates and assumptions that affect the amounts reported in the financial statements and accompanying notes. Actual results could differ from those estimates.
Hedging Activity
We use derivative instruments to manage certain foreign currency exposures. Derivative instruments are viewed as risk management tools and are not used for trading or speculative purposes. Derivatives used for hedging purposes must be designated and deemed effective as a hedge of the identified underlying risk exposure at the inception of the contract. Accordingly, changes in fair value of the derivative contract must be highly correlated with changes in the fair value of the underlying hedged item at inception of the hedge and over the life of the hedge contract.
Derivatives used to hedge forecasted cash flows associated with foreign currency commitments or forecasted commodity purchases are accounted for as cash flow hedges. For those derivative instruments that qualify for hedge accounting treatment, gains and losses are recorded in other comprehensive income and reclassified to earnings in a manner that matches the timing of the earnings impact of the hedged transactions. The ineffective portion of all hedges, if any, is recognized currently in earnings. For those derivative instruments that do not qualify for hedge accounting treatment, any related gains and losses are recognized in the consolidated income statement as a component of "Other income/expense".
Advertising Costs
Advertising is expensed as incurred and amounted to $2.0 million for 2012, $3.0 million for 2011 and $1.4 million for 2010.
Equity Compensation
Stock-based compensation is comprised of stock options and restricted stock. Stock options are measured at the grant date, based on the grant-date fair value of the awards ultimately expected to vest and, in most cases, is recognized as an expense on a straight-line basis over the vesting period, which is typically four years. A provision in our stock option agreements requires us to accelerate the expense for retirement eligible employees, as any unvested options would immediately vest upon retirement for such employees. We develop estimates used in calculating the grant-date fair value of stock options to determine the amount of stock-based compensation to be recorded. We calculate the grant-date fair value using the Black-Scholes valuation model. The use of this

59
valuation model requires estimates of assumptions such as expected volatility, expected term, risk-free interest rate, expected dividend yield and forfeiture rates.
Performance-based restricted stock compensation expense is based on achievement of certain performance and service conditions. The fair value of the awards is determined based on the market value of the underlying stock price at the grant date and marked to market over the vesting period based on projections of the underlying performance measures.
Time-based restricted stock compensation awards are expensed over the vesting period, which is typically three years. The fair value of the awards is determined based on the market value of the underlying stock price at the grant date.
NOTE 2 – FAIR VALUE MEASURMENTS
The accounting guidance for fair value measurements establishes a three-tier fair value hierarchy, which prioritizes the inputs used in measuring fair value.
• Level 1 – Quoted prices in active markets for identical assets or liabilities.• Level 2 – Inputs other than Level 1 that are observable, either directly or indirectly, such as quoted prices for similar
assets or liabilities; quoted prices in markets that are not active; or other inputs that are observable or can be corroborated by observable market data for substantially the full term of the assets or liabilities.
• Level 3 – Unobservable inputs that are supported by little or no market activity and that are significant to the fair value of the assets or liabilities.
From time to time we enter into various instruments that require fair value measurement, including foreign currency option contracts, interest rate swaps and copper derivative contracts. Assets measured at fair value on a recurring basis, categorized by the level of inputs used in the valuation, include:
(Dollars in thousands)Carrying amount as of
December 31, 2012 Level 1 Level 2 Level 3
Pension assets $ 143,540 $ 98,269 $ 29,869 $ 15,402
Foreign currency option contracts 15 — 15 —
Copper derivative contracts 267 — 267 —
Interest rate swap (361) — (361) —
(Dollars in thousands)Carrying amount as of
December 31, 2011 Level 1 Level 2 Level 3
Auction rate securities $ 25,960 $ — $ — $ 25,960
Pension assets 120,565 75,227 32,072 13,266
Foreign currency option contracts 68 — 68 —
Copper derivative contracts (377) — (377) —
The following table presents information about our assets and liabilities measured at fair value on a non-recurring basis as of December 31, 2011, aggregated by the level in the fair value hierarchy within which those measurements fall. This asset represents the facility in Richmond, Virginia for which we signed an agreement to sell in the first quarter of 2012. We had written this asset down to the agreed upon sale price less costs to sell during the fourth quarter of 2011.
(Dollars in thousands)Carrying amount as ofDecember 31, 2011 Level 1 Level 2 Level 3
Asset held for sale $ 1,400 $ — $ 1,400 $ —

60
Auction Rate Securities
Prior to the first quarter of 2008, our available-for-sale auction rate securities were recorded at fair value as determined in the active market at the time. However, due to events in the credit markets, the auctions failed during the first quarter of 2008 for the auction rate securities that we held at the end of the first quarter of 2008, and all of our auction rate securities had been in a loss position since that time until we redeemed them in the first quarter of 2012. Given the lack of unobservable inputs in the auction markets since the first quarter of 2008, such securities were considered Level 3 securities.
During 2011, we performed a fair value assessment of these securities based on a discounted cash flow model, utilizing various assumptions that included estimated interest rates, probabilities of successful auctions, the timing of cash flows, and the quality and level of collateral of the securities. These inputs were chosen based on our understanding of the expectations of the market and are consistent with the assumptions utilized during our assessment of these securities at year end 2011.
Prior to the first quarter of 2012, we had recognized an other–than-temporary impairment (OTTI) on these securities. An OTTI is recognized in earnings for a security in an unrealized loss position when an entity either (a) has the intent to sell the security or (b) more likely than not will be required to sell the security before its anticipated recovery.
When an OTTI of a security occurs, the amount of the OTTI recognized in earnings depends on whether the security holder intended to sell the security or it is more likely than not that the holder would be required to sell the security before recovery of its cost basis. If the holder does not intend to sell the security and it is not more likely than not that the holder would be required to sell the security before the recovery of its cost basis, the other-than-temporary loss would be separated into (i) the amount representing the credit loss and (ii) the amount related to all other factors. The credit loss is primarily based on the underlying ratings of the securities. The amount representing the credit loss would be recognized in earnings, and the remaining amount would be recorded in other comprehensive income. This is the approach we used to recognize the OTTI taken prior to liquidation in the first quarter of 2012. The amount representing the credit loss was recognized in earnings, and since the factors above were not present, the remaining amount was recorded in other comprehensive income.
Due to our belief that it would have taken more than twelve months for the auction rate securities market to recover, these securities were classified as long-term assets, except for those that were scheduled to be redeemed within a twelve month period, which were classified as short-term investments.
During the first quarter of 2012, we liquidated our auction rate security portfolio, receiving net proceeds of $25.4 million on a stated par value of $29.5 million. As a result of this liquidation, we recognized a loss on the discount of the securities of $3.2 million (the remaining difference between the liquidation and par value of $0.9 million had previously been recognized as an impairment loss) in our earnings. Since the markets for these securities failed in the first quarter of 2008, we had redeemed $24.9 million of these securities, mostly at par prior to the liquidation in the first quarter of 2012. Since par value redemptions had recently slowed quarters with no clear path for full redemption over the next several years and the rate of return on these securities being very low, management determined that a discounted redemption in the first quarter of 2012 was in the best interests of the Company as the related cash could be better utilized for other purposes going forward.
The reconciliation of our assets measured at fair value on a recurring basis using unobservable inputs (Level 3) is as follows:
(Dollars in thousands)Auction Rate
SecuritiesBalance at December 31, 2011 $ 25,960Cash received for redemptions below par (25,438)Reclassified from other comprehensive income 2,723Reported in earnings (3,245)Balance at December 31, 2012 $ —
There were no credit losses recognized for the year ended December 31, 2012. Below is a roll forward of credit losses recognized in earnings for the year ended December 31, 2010 and December 31, 2011.
(Dollars in thousands) Credit LossesBalance at December 31, 2009 $ 364Credit losses recorded 633Reduction in credit losses due to redemptions (80)Balance at December 31, 2010 $ 917

61
(Dollars in thousands) Credit LossesBalance at December 31, 2010 $ 917Credit losses recorded 278Reduction in credit losses due to redemptions (82)Balance at December 31, 2011 $ 1,113
Derivatives Contracts
We are exposed to certain risks relating to our ongoing business operations. The primary risks being managed through the use of derivative instruments are interest rate risk, foreign currency exchange rate risk and commodity pricing risk, particularly related to copper.
Foreign Currency - The fair value of any foreign currency option derivatives is based upon valuation models applied to current market information such as strike price, spot rate, maturity date and volatility, and by reference to market values resulting from an over-the-counter market or obtaining market data for similar instruments with similar characteristics.
Commodity (Copper) - The fair value of copper derivatives is computed using a combination of intrinsic and time value valuation models. The intrinsic valuation model reflects the difference between the strike price of the underlying copper derivative instrument and the current prevailing copper prices in an over-the-counter market at period end. The time value valuation model incorporates the constant changes in the price of the underlying copper derivative instrument, the time value of money, the underlying copper derivative instrument's strike price and the remaining time to the underlying copper derivative instrument's expiration date from the period end date. Overall, fair value is a function of five primary variables: price of the underlying instrument, time to expiration, strike price, interest rate, and volatility.
Interest Rates - The fair value of our interest rate swap instruments is derived by comparing the present value of the interest rate forward curve against the present value of the swap rate, relative to the notional amount of the swap. The net value represents the estimated amount we would receive or pay to terminate the agreements. Settlement amounts for an "in the money" swap would be adjusted down to compensate the counterparty for cost of funds, and the adjustment is directly related to the counterparties' credit ratings.
We do not use derivative financial instruments for trading or speculation purposes.
For further discussion on our derivative contracts, see Note 3 - "Hedging Transactions and Derivative Financial Instruments" below.
Pension Assets
As further discussed in Note 9 “Pension Benefits and Retirement Health and Life Insurance Benefits”, our pension assets are stated at fair value. There are categories of assets in Level 1, 2 and 3 of the fair value hierarchy.
NOTE 3 – HEDGING TRANSACTIONS AND DERIVATIVE FINANCIAL INSTRUMENTS
The guidance for the accounting and disclosure of derivatives and hedging transactions requires companies to recognize all of their derivative instruments as either assets or liabilities at fair value in the consolidated statements of financial position. The accounting for changes in the fair value (i.e., gains or losses) of a derivative instrument depends on whether it has been designated and qualifies for special hedge accounting treatment as defined under the applicable accounting guidance. For derivative instruments that are designated and qualify for cash flow hedge accounting treatment (i.e., hedging the exposure to variability in expected future cash flows that is attributable to a particular risk), the effective portion of the gain or loss on the derivative instrument is reported as a component of other comprehensive income (loss). This gain or loss is reclassified into earnings in the same line item of the consolidated statements of income (loss) associated with the forecasted transaction and in the same period or periods during which the hedged transaction affects earnings. The remaining gain or loss on the derivative instrument in excess of the cumulative change in the present value of the future cash flows of the hedged item (i.e., the ineffective portion) if any, is recognized in the earnings during the current period. There was no material ineffectiveness for the year ended December 31, 2012 or 2011.
We currently have two outstanding contracts to hedge our exposure related to the purchase of copper. These contracts are held with financial institutions and minimize our risk associated with a potential rise in copper prices. These contracts were entered into in the second half of 2012, covers our 2013 monthly copper exposure and does not qualify for hedge accounting treatment; therefore, any mark-to-market adjustment on these contracts are recorded in the "Other income, net" line item in our consolidated statements of income (loss).

62
In the third quarter of 2012, we entered into Euro currency forward contracts. We entered into these foreign currency forward contracts to mitigate our exposure in the U.S. for pending Euro-denominated purchases. These contracts do not qualify for hedge accounting treatment.
In the third quarter of 2012, we entered into an interest rate swap derivative instrument to hedge the LIBOR portion of the interest rate on 65% of the term loan debt then outstanding, effective July 2013. This transaction has been designated as a cash flow hedge and qualifies for hedge accounting treatment. At December 31, 2012, the term loan debt represents $90.0 million of our total outstanding debt of $98.0 million. At December 31, 2012, the rate charged on this debt is the 1 month LIBOR at 0.25% plus a spread of 2.25%.
Notional Value of Copper DerivativesCopper 95 metric tons per month
Notional Values of Foreign Currency DerivativesEuro €1,290,000
(Dollars in thousands)The Effect of Current Derivative Instruments on the Financial
Statements for the year ended December 31, 2012
Fair Values ofDerivative
Instruments as ofDecember 31, 2012
Foreign Exchange Option Contracts Location of gain (loss)
Amount ofgain (loss)
Other Assets(Liabilities)
Contracts not designated as hedging instruments Other income, net $ 342 $ 15
Copper Derivative Instruments
Contracts not designated as hedging instruments Other income, net (366) 267
Interest Rate Swap Instrument
Contracts designated as hedging instruments Other comprehensive income (loss) (361) (361)
Concentration of Credit Risk
By using derivative instruments, we are subject to credit and market risk. If a counterparty fails to fulfill its performance obligations under a derivative contract, our credit risk will equal the fair value of the derivative instrument. Generally, when the fair value of a derivative contract is positive, the counterparty owes the Company, thus creating a receivable risk for the Company. We minimize counterparty credit (or repayment) risk by entering into derivative transactions with major financial institutions with investment grade credit ratings.
NOTE 4 – ACQUISITION OF A BUSINESS
Curamik Electronics GmbH
On January 4, 2011, we acquired Curamik Electronics GmbH (Curamik), a manufacturer of power electronic substrate products headquartered in Eschenbach, Germany. The aggregate purchase price was $151.1 million, which reflects post-closing adjustments.
Curamik, founded in 1983, is the worldwide leader for the development and production of direct bonded copper ceramic substrate products. These products are used primarily in the design of intelligent power management devices, such as IGBT (insulated gate bipolar transistor) modules, that enable a wide range of products, including high efficiency industrial motor drives, wind and solar energy converters and electrical systems in automobiles. Most of Curamik’s products are manufactured using state of the art automated processes in its facility located in Eschenbach.

63
The acquisition has been accounted for in accordance with applicable purchase accounting guidance. The following table represents the fair market value assigned to the acquired assets and liabilities in the transaction.
(Dollars in thousands) Assets:
Cash $ 11,256Accounts receivable 11,876Other current assets 1,386Inventory 12,259Property, plant & equipment 32,312Other non-current assets 2,276Intangible assets 52,354Goodwill 79,837Total assets 203,556
Liabilities Accounts payable 6,053Other current liabilities 20,427Deferred tax liability 9,329Other long-term liabilities 16,666Total liabilities 52,475
Fair value of net assets acquired $ 151,081
Total costs incurred related to the acquisition were approximately $3.4 million, of which $1.3 million were incurred in the first quarter of 2011 and $2.1 million in the fourth quarter of 2010. They are included in “Selling and administrative expenses” on our consolidated statements of income (loss).
NOTE 5 - PROPERTY, PLANT AND EQUIPMENT
(Dollars in thousands)December 31,
2012December 31,
2011Land $ 15,394 $ 15,453Buildings and improvements 132,673 132,739Machinery and equipment 151,023 153,076Office equipment 34,300 26,825Equipment in process 21,202 13,810
354,592 341,903Accumulated depreciation (205,575) (193,721)Total property, plant and equipment $ 149,017 $ 148,182
Depreciation expense was $22.7 million in 2012, $20.8 million in 2011, and $14.6 million in 2010. As part of the acquisition of Curamik in 2011, we acquired a capital lease on its facility in Eschenbach, Germany. At December 31, 2011 this capital lease was recorded in Property, plant and equipment in our consolidated statements of financial position for $12.1 million, net of accumulated depreciation. The total obligation recorded for the lease as of December 31, 2012 and 2011 was $8.4 million and $9.2 million, respectively. Depreciation expense related to the capital lease was $0.4 million for each of the years ending December 31, 2012 and 2011. Accumulated depreciation for the capital lease for the years ended December 31, 2012 and 2011 was $0.8 million and $0.4 million, respectively.

64
NOTE 6 – GOODWILL AND INTANGIBLE ASSETS
Definite Lived Intangible Assets
(Dollars in thousands) December 31, 2012 December 31, 2011
Gross Carrying Amount
Accumulated Amortization
Net Carrying Amount
Gross Carrying Amount
AccumulatedAmortization
Net Carrying Amount
Trademarks and patents $ 6,283 $ 227 $ 6,056 $ 6,118 $ 140 $ 5,978Technology 36,479 8,394 $ 28,085 35,769 4,655 31,114Covenant-not-to-compete 1,042 358 $ 684 956 135 821Customer relationships 20,529 2,066 $ 18,463 19,851 1,315 18,536Total other intangible assets $ 64,333 $ 11,045 $ 53,288 $ 62,694 $ 6,245 $ 56,449
In the table above, gross carrying amounts and accumulated amortization may differ from prior periods due to foreign exchange rate fluctuations.
Amortization expense was approximately $4.4 million, $5.4 million and $1.1 million in 2012, 2011 and 2010, respectively. The estimated annual future amortization expense is $5.9 million, $6.0 million, $5.7 million, $5.3 million and $4.8 million in 2013, 2014, 2015, 2016 and 2017, respectively. These amounts could vary based on changes in foreign currency exchange rates.
The weighted average amortization period as of December 31, 2012, by intangible asset class, is presented in the table below:
Intangible Asset Class Weighted Average Amortization PeriodTrademarks and patents 6.3Technology 9.3Covenant not-to-compete 3.9Customer relationships 9.4Total other intangible assets 7.6
On January 4, 2011 we acquired Curamik, which contributed $52.4 million of intangible assets and $79.8 million of goodwill. The intangible assets are comprised of trademarks, technology, and customer relationships and include approximately $5.3 million of indefinite-lived intangible assets comprised of trademarks, which are assessed for impairment annually or when changes in circumstances indicate that the carrying values may not be recoverable. The definite-lived intangible assets are amortized using a fair value methodology that is based on the projected economic use of the related underlying asset.
Goodwill
The changes in the carrying amount of goodwill for the period ending December 31, 2012, by reportable segment, are as follows:
(Dollars in thousands)
High Performance
FoamsPrinted Circuit
Materials
Curamik Electronics Solutions
Power Distribution
Systems Other TotalDecember 31, 2011 $ 22,597 $ — $ 77,357 $ — $ 2,224 $ 102,178Foreign currency translationadjustment 1,376 — 1,487 — — 2,863December 31, 2012 $ 23,973 $ — $ 78,844 $ — $ 2,224 $ 105,041
Annual Impairment Testing
We perform our annual goodwill impairment testing in the fourth quarter of the year. However, since the Curamik Electronics Solutions operating segment (also a reporting unit as defined for this test) results declined substantially in 2012 as compared to 2011, we determined that this decline was an indicator of impairment and performed an interim impairment test as of September 30, 2012. In accordance with applicable accounting guidance, we chose to perform Step 1 of the goodwill impairment test, which compared the fair value of the Curamik Electronics Solutions operating segment to its carrying amount (including goodwill and definite and indefinite-lived intangible assets). The fair value of the operating segment was determined using a discounted cash flow model based on our most recent forecasts of the business, taking into consideration macro-economic and other market trends
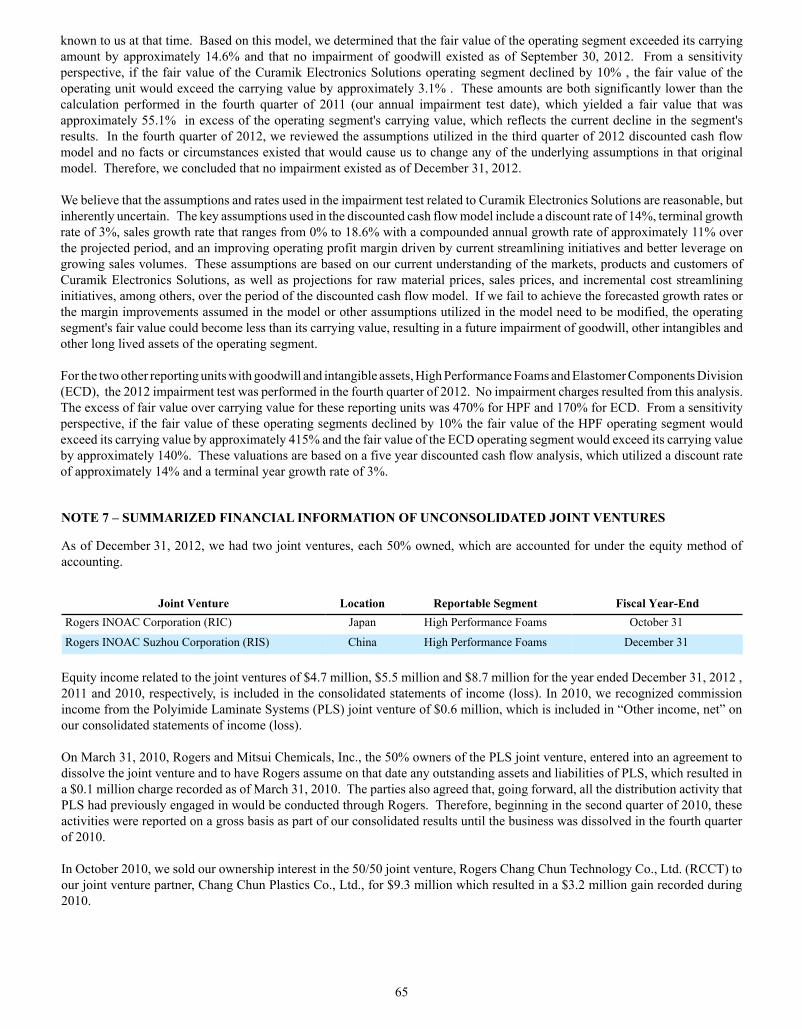
65
known to us at that time. Based on this model, we determined that the fair value of the operating segment exceeded its carrying amount by approximately 14.6% and that no impairment of goodwill existed as of September 30, 2012. From a sensitivity perspective, if the fair value of the Curamik Electronics Solutions operating segment declined by 10% , the fair value of the operating unit would exceed the carrying value by approximately 3.1% . These amounts are both significantly lower than the calculation performed in the fourth quarter of 2011 (our annual impairment test date), which yielded a fair value that was approximately 55.1% in excess of the operating segment's carrying value, which reflects the current decline in the segment's results. In the fourth quarter of 2012, we reviewed the assumptions utilized in the third quarter of 2012 discounted cash flow model and no facts or circumstances existed that would cause us to change any of the underlying assumptions in that original model. Therefore, we concluded that no impairment existed as of December 31, 2012.
We believe that the assumptions and rates used in the impairment test related to Curamik Electronics Solutions are reasonable, but inherently uncertain. The key assumptions used in the discounted cash flow model include a discount rate of 14%, terminal growth rate of 3%, sales growth rate that ranges from 0% to 18.6% with a compounded annual growth rate of approximately 11% over the projected period, and an improving operating profit margin driven by current streamlining initiatives and better leverage on growing sales volumes. These assumptions are based on our current understanding of the markets, products and customers of Curamik Electronics Solutions, as well as projections for raw material prices, sales prices, and incremental cost streamlining initiatives, among others, over the period of the discounted cash flow model. If we fail to achieve the forecasted growth rates or the margin improvements assumed in the model or other assumptions utilized in the model need to be modified, the operating segment's fair value could become less than its carrying value, resulting in a future impairment of goodwill, other intangibles and other long lived assets of the operating segment.
For the two other reporting units with goodwill and intangible assets, High Performance Foams and Elastomer Components Division (ECD), the 2012 impairment test was performed in the fourth quarter of 2012. No impairment charges resulted from this analysis. The excess of fair value over carrying value for these reporting units was 470% for HPF and 170% for ECD. From a sensitivity perspective, if the fair value of these operating segments declined by 10% the fair value of the HPF operating segment would exceed its carrying value by approximately 415% and the fair value of the ECD operating segment would exceed its carrying value by approximately 140%. These valuations are based on a five year discounted cash flow analysis, which utilized a discount rate of approximately 14% and a terminal year growth rate of 3%.
NOTE 7 – SUMMARIZED FINANCIAL INFORMATION OF UNCONSOLIDATED JOINT VENTURES
As of December 31, 2012, we had two joint ventures, each 50% owned, which are accounted for under the equity method of accounting.
Joint Venture Location Reportable Segment Fiscal Year-EndRogers INOAC Corporation (RIC) Japan High Performance Foams October 31
Rogers INOAC Suzhou Corporation (RIS) China High Performance Foams December 31
Equity income related to the joint ventures of $4.7 million, $5.5 million and $8.7 million for the year ended December 31, 2012 , 2011 and 2010, respectively, is included in the consolidated statements of income (loss). In 2010, we recognized commission income from the Polyimide Laminate Systems (PLS) joint venture of $0.6 million, which is included in “Other income, net” on our consolidated statements of income (loss).
On March 31, 2010, Rogers and Mitsui Chemicals, Inc., the 50% owners of the PLS joint venture, entered into an agreement to dissolve the joint venture and to have Rogers assume on that date any outstanding assets and liabilities of PLS, which resulted in a $0.1 million charge recorded as of March 31, 2010. The parties also agreed that, going forward, all the distribution activity that PLS had previously engaged in would be conducted through Rogers. Therefore, beginning in the second quarter of 2010, these activities were reported on a gross basis as part of our consolidated results until the business was dissolved in the fourth quarter of 2010.
In October 2010, we sold our ownership interest in the 50/50 joint venture, Rogers Chang Chun Technology Co., Ltd. (RCCT) to our joint venture partner, Chang Chun Plastics Co., Ltd., for $9.3 million which resulted in a $3.2 million gain recorded during 2010.

66
The summarized financial information for the joint ventures for the periods indicated is as follows:
(Dollars in thousands) December 31, 2012 December 31, 2011Current assets $ 40,721 $ 38,314Noncurrent assets 13,629 17,988Current liabilities 12,008 8,566Shareholders' equity 42,342 47,736
(Dollars in thousands) For the years then ended:
December 31,
2012December 31,
2011December 31,
2010Net sales $ 63,297 $ 70,368 $ 104,570Gross profit (loss) 11,512 13,638 21,302Net income (loss) 9,486 10,902 17,316
The effect of transactions between us and our unconsolidated joint ventures was accounted for on a consolidated basis. Receivables from and payables to joint ventures arise during the normal course of business from transactions between us and the joint ventures, typically from the joint venture purchasing raw materials from us to produce end products, which are sold to third parties, or from us purchasing finished goods from our joint ventures, which are then sold to third parties.
NOTE 8 - INVESTMENT
In the third quarter of 2009, we made a strategic investment of $5.0 million in Solicore, Inc., headquartered in Lakeland, Florida. Solicore is the world leader for embedded power solutions, offering its patented Flexicon advanced ultra-thin, flexible, lithium polymer batteries for smart cards, controlled access cards, RFID tags, and medical devices. Our investment, part of a total of $13.3 million raised by Solicore in that financing round, provides us with a minority equity stake in Solicore and representation on Solicore's Board of Directors. We account for this investment under the cost method as we cannot exert significant influence over the business. We also entered into a joint development agreement with Solicore to develop the next generation of power solution products using screen printing technology. If this technology is adopted, we will have the option to manufacture a significant portion of the products that result from this collaboration.
NOTE 9 – PENSION BENEFITS AND RETIREMENT HEALTH AND LIFE INSURANCE BENEFITS
We have two qualified noncontributory defined benefit pension plans. One plan covers our U.S. unionized hourly employees and the other plan covers all other U.S. employees hired through December 30, 2007. We also have established a nonqualified unfunded noncontributory defined benefit pension plan to restore certain retirement benefits that might otherwise be lost due to limitations imposed by federal law on qualified pension plans, as well as to provide supplemental retirement benefits, for certain senior executives of the Company.
In addition, we sponsor multiple fully insured or self-funded medical plans and a fully insured life insurance plan for retirees. The measurement date for all plans is December 31 for each respective plan year.
We are required, as an employer, to: (a) recognize in our statement of financial position an asset for a plan's overfunded status or a liability for a plan's underfunded status; (b) measure a plan's assets and our obligations that determine our funded status as of the end of the fiscal year; and (c) recognize changes in the funded status of a defined benefit postretirement plan in the year in which the changes occur and report these changes in accumulated other comprehensive income. In addition, actuarial gains and losses that are not immediately recognized as net periodic pension cost are recognized as a component of accumulated other comprehensive income and amortized into net periodic pension cost in future periods.
Defined Benefit Pension Plan and Retiree Medical Plan Amendments
On July 16, 2007, we announced to our employees and retirees that the defined benefit pension plan for non-union employees and the retiree medical plans would be amended effective January 1, 2008. As of January 1, 2008, newly hired and rehired employees were no longer eligible to participate in the defined benefit pension plan. However, the amendment to the defined benefit pension plan did not impact the benefits to existing plan participants as of December 30, 2007. The amendment to the retiree medical plan

67
did not impact the benefits for employees who were age 50 or older as of December 30, 2007, as long as they met certain eligibility requirements. However, employees who were less than age 50 as of December 30, 2007 were no longer eligible to participate in the retiree medical plan. This plan amendment resulted in a reduction to the accumulated benefit obligation, which is accounted for as a reduction to prior service cost based on a plan amendment and amortized over the expected remaining service period of the ongoing active plan participants until they became fully eligible, beginning in the third quarter of 2007.
Obligations and Funded Status
(Dollars in thousands) Pension BenefitsRetirement Health and Life
Insurance Benefits
Change in benefit obligation: 2012 2011 2012 2011
Benefit obligation at beginning of year $ 193,715 $ 157,340 $ 10,495 $ 9,149Service cost 4,596 3,922 630 693Interest cost 8,420 8,535 364 413Actuarial (gain) loss 16,636 30,616 (395) 1,117Benefit payments (6,800) (6,874) (795) (877)Settlement charge (6,723) — — —Special termination benefit — 176 1,592 —Benefit obligation at end of year $ 209,844 $ 193,715 $ 11,891 $ 10,495
Change in plan assets:
Fair value of plan assets at the beginning of the year $ 120,565 $ 125,261 $ — $ —
Actual return on plan assets 13,775 (2,849) — —
Employer contributions 22,723 5,027 795 877
Benefit payments (6,800) (6,874) (795) (877)
Settlement charge (6,723) — — —
Fair value of plan assets at the end of the year 143,540 120,565 — —
Funded status $ (66,304) $ (73,150) $ (11,891) $ (10,495)
Amounts recognized in the consolidated balance sheet consist of:
(Dollars in thousands) Pension BenefitsRetirement Health and Life
Insurance Benefits
2012 2011 2012 2011
Noncurrent assets $ — $ — $ — $ —
Current liabilities (362) (4,279) (1,237) (1,009)
Noncurrent liabilities (65,942) (68,871) (10,654) (9,486)
Net amount recognized at end of year $ (66,304) $ (73,150) $ (11,891) $ (10,495)
(Dollars in thousands) Pension BenefitsRetirement Health andLife Insurance Benefits
2012 2012
Net actuarial loss $ 87,911 $ 3,187
Prior service cost 1,660 (229)
Net amount recognized at end of year $ 89,571 $ 2,958
The projected benefit obligation, accumulated benefit obligation, and fair value of plan assets for the pension plans with an accumulated benefit obligation in excess of plan assets were $209.8 million, $186.1 million and $143.5 million, respectively, as of December 31, 2012 and $193.7 million, $172.4 million and $120.6 million, respectively, as of December 31, 2011.

68
Components of Net Periodic Benefit Cost
(Dollars in thousands) Pension BenefitsPostretirement Health and Life Insurance
Benefits
2012 2011 2010 2012 2011 2010
Service cost $ 4,596 $ 3,922 $ 3,563 $ 630 $ 693 $ 661
Interest cost 8,420 8,535 8,345 364 413 398
Expected return of plan assets (9,892) (10,559) (9,628) — — —
Amortization of prior service cost 463 597 600 (451) (627) (626)
Amortization of net loss 5,471 2,331 1,824 313 421 329
Settlement charge/(credit) 2,073 — 372 — — —
Special termination benefit — 176 — 1,592 — —
Net periodic benefit cost $ 11,131 $ 5,002 $ 5,076 $ 2,448 $ 900 $ 762
In the first quarter of 2012, we implemented an early retirement program for certain eligible employees. As a result of this program, we incurred $1.6 million in charges in 2012 related to a special termination benefit associated with the retirement health and life insurance benefits program, as we extended eligibility benefits to certain individuals who chose to participate in the program.
Early in the third quarter of 2012, we made a one-time cash payment to our former President and Chief Executive Officer of approximately $6.3 million in accordance with the provisions of his retirement contract as part of his Pension Restoration Plan. This payment resulted in a settlement charge of approximately $2.1 million, which was recognized in the third quarter of 2012.
The estimated net loss and prior service cost for the defined benefit pension plans that will be amortized from other comprehensive income into net periodic benefit cost over the next fiscal year is $5.9 million and $0.4 million, respectively. The estimated net loss (gain) and prior service cost for the defined benefit postretirement plans that will be amortized from other comprehensive income into net periodic benefit cost over the next fiscal year are $0.5 million and $(0.5) million.
Weighted-average assumptions used to determine benefit obligations at December 31:
Pension BenefitsRetirement Health and Life
Insurance Benefits2012 2011 2012 2011
Discount rate 4.00% 4.50% 2.50% 3.50%Rate of compensation increase 4.00% 4.00% — —
Expected long-term rate of return on plan assets 7.50% 7.75% — —
Weighted-average assumptions used to determine net benefit cost for the years ended:
Pension BenefitsRetirement Health and Life
Insurance Benefits2012 2011 2012 2011
Discount rate 4.50% 5.50% 3.50% 4.50%Expected long-term rate of return on plan assets 7.75% 8.50% — —Rate of compensation increase 4.00% 4.00% — —
Long-term rate of return on assets - To determine the expected long-term rate of return on plan assets, we review historical and projected portfolio performance, the historical long-term rate of return, and how any change in the allocation of the assets could affect the anticipated returns. Adjustments are made to the projected rate of return if it is deemed necessary based on those factors and other current market trends.
Discount rate - To determine the discount rate, we review current market indices, particularly the Citigroup bond index, to ensure that the rate used in our calculations is consistent and within an acceptable range based on these indices, which reflect current market conditions. At December 31, 2012, this analysis resulted in a 50 basis point decrease to the discount rate from 4.5% at December 31, 2011 to 4.0% at December 31, 2012.

69
Health care cost trend rates - For measurement purposes as of December 31, 2012, we assumed annual health care cost trend rates of 8.0% and 7.5% for covered health care benefits for retirees pre-age 65 and post-age 65, respectively. The rates were assumed to decrease gradually to 5.0% and 5.5%, respectively, in 2015 and remain at those levels thereafter. For measurement purposes as of December 31, 2011, we assumed annual health care cost trend rates of 7.0% and 8.5% for covered health care benefits for retirees pre-age 65 and post-age 65, respectively. Assumed health care cost trend rates have a significant effect on the amounts reported for the health care plans. A one-percentage point change in assumed health care cost trend rates would have the following effects:
(Dollars in thousands) One Percentage PointIncrease Decrease
Effect on total service and interest cost $ 82 $ (70)Effect on other postretirement benefit obligations 695 (647)
Plan Assets
Our defined benefit pension assets are invested with the objective of achieving a total rate of return over the long-term that is sufficient to fund future pension obligations. In managing these assets and our investment strategy, we take into consideration future cash contributions to the plans, as well as the potential of the portfolio underperforming the market, which is partially mitigated by maintaining a diversified portfolio of assets.
In order to meet our investment objectives, we set asset allocation target ranges based on current funding status and future projections in order to mitigate the risk in the plan while maintaining its funded status. At December 31, 2012, we held approximately 57% equity securities and 43% debt securities in our portfolio, which is consistent with our allocation targets. In order to further mitigate risk, in the future we plan to migrate to a portfolio more heavily weighted toward debt securities as our plan assets approach the projected benefit obligation.
In determining our investment strategy and calculating our plan liability and related expense, we utilize an expected long-term rate of return on plan assets. This rate is developed based on several factors, including the plans' asset allocation targets, the historical and projected performance on those asset classes, and on the plans' current asset composition. To justify our assumptions, we analyze certain data points related to portfolio performance. For example, we analyze the actual historical performance of our total plan assets, which has generated a return of approximately 8.6% over the past 16 year period (earliest data available for our analysis was 1996). Also, we analyze hypothetical rates of return for plan assets based on our current asset allocation mix, which we estimate would have generated a return of approximately 10.2% over the last 30 years, 8.1% over the last 20 years, and 8.0% over the last 10 years. Further, based on the hypothetical historic returns, we estimated the potential return associated with the plan asset portfolio over the next 10 to 15 year period based on the portfolio mix, which we determined to be approximately 7.3% to 7.8% (approximately 9.5% to 11.0% on equity securities and 3.50% to 4.50% on fixed income securities).
Investments are stated at fair value. Fair value is defined as the price that would be received to sell an asset or paid to transfer a liability in an orderly transaction between market participants at the measurement date (an exit price).
Securities traded on a national securities exchange are valued at the last reported sales price on the last business day of the plan year. The fair value of the guaranteed deposit account is determined through discounting expected future investment cash flow from both investment income and repayment of principal for each investment purchased.
The estimated fair values of the participation units owned by the Plan in pooled separate accounts are based on quoted redemption values and adjusted for management fees and asset charges, as determined by the record keeper, on the last business day of the Plan year. Pooled separate accounts are accounts established solely for the purpose of investing the assets of one or more plans. Funds in a separate account are not commingled with other assets of the Company for investment purposes.

70
The following table presents the fair value of the net assets by asset category at December 31, 2012 and 2011:
(Dollars in thousands) 2012 2011
Pooled separate accounts $ 29,869 $ 32,072Mutual funds 98,269 47,255Common stock — 27,804Guaranteed deposit account 15,402 13,266Interest bearing cash — 168Total investments at fair value $ 143,540 $ 120,565
The following tables set forth by level, within the fair value hierarchy, the assets carried at fair value as of December 31, 2012 and 2011.
Assets at Fair Value as of December 31, 2012(Dollars in thousands) Level 1 Level 2 Level 3 TotalPooled separate accounts $ — $ 29,869 $ — $ 29,869Mutual funds 98,269 — — 98,269Common stock — — — —Guaranteed deposit account — — 15,402 15,402Interest bearing cash — — — —Total assets at fair value $ 98,269 $ 29,869 $ 15,402 $ 143,540
Assets at Fair Value as of December 31, 2011(Dollars in thousands) Level 1 Level 2 Level 3 TotalPooled separate accounts $ — $ 32,072 $ — $ 32,072Mutual funds 47,255 — — 47,255Common stock 27,804 — — 27,804Guaranteed deposit account — — 13,266 13,266Interest bearing cash 168 — — 168Total assets at fair value $ 75,227 $ 32,072 $ 13,266 $ 120,565
The table below sets forth a summary of changes in the fair value of the guaranteed deposit account's Level 3 assets for the year ended December 31, 2012.
(Dollars in thousands)Guaranteed Deposit
Account
Balance at beginning of year $ 13,266Realized gains (losses) —Unrealized gains relating to instruments still held at the reporting date 1,256Purchases, sales, issuances and settlements (net) 880Transfers in and/or out of Level 3 —Balance at end of year $ 15,402
Cash Flows
Contributions
At December 31, 2012, we have met the minimum funding requirements for our qualified defined benefit pension plans and were therefore not required to make a contribution to the plans in 2012 for any past years. In 2012 and 2011, we made voluntary contributions of $16.0 million and $5.0 million, respectively. As there is no funding requirement for the nonqualified defined benefit pension plans and the Retiree Health and Life Insurance benefit plans, we fund the amount of benefit payments made

71
during the year, which is consistent with past practices. We currently estimate that we will make voluntary contributions of approximately $13.0 million in 2013 towards our qualified defined benefit pension plans.
Estimated Future Payments
The following pension benefit payments, which reflect expected future employee service, as appropriate, are expected to be paid through the utilization of plan assets for the funded plans and from operating cash flows for the unfunded plans. The Retiree Health and Life Insurance benefits, for which no funding has been made, are expected to be paid from operating cash flows. The benefit payments are based on the same assumptions used to measure our benefit obligation at the end of fiscal 2012.
Pension BenefitsRetiree Health and Life
Insurance Benefits
2013 $ 7,687 $ 1,2382014 7,467 1,2292015 7,753 1,2182016 8,060 1,1832017 8,548 1,1182018-2022 52,571 6,155
NOTE 10 EMPLOYEE SAVINGS AND INVESTMENT PLAN
We sponsor the Rogers Employee Savings and Investment Plan (RESIP), a 401(k) plan for domestic employees. Employees can defer an amount they choose, up to the yearly IRS limit of $17,500 in 2013 and $17,000 in 2012. Certain eligible participants are also allowed to contribute the maximum catch-up contribution per IRS regulations. Our matching contribution is 6% of an eligible employee’s annual pre-tax contribution at a rate of 100% for the first 1% and 50% for the next 5% for a total match of 3.5%. Unless otherwise indicated by the participant, the matching dollars are invested in the same funds as the participant’s contributions. RESIP related expense amounted to $1.7 million in 2012, $1.7 million in 2011, and $1.5 million in 2010, which related solely to our matching contributions.
NOTE 11 - DEBT
On July 13, 2011, we entered into an amended and restated $265 million secured five year credit agreement. This credit agreement (“Amended Credit Agreement”) is with (i) JPMorgan Chase Bank, N.A., as administrative agent; (ii) HSBC Bank USA, National Association; (iii) RBS Citizens, National Association; (iv) Fifth Third Bank; and (v) Citibank, N.A. JPMorgan Securities LLC and HSBC Bank USA, National Association acted as joint book runners and joint lead arrangers; HSBC Bank USA, National Association and RBS Citizens, National Association acted as co-syndication agents; and Fifth Third Bank and Citibank, N.A. acted as co-documentation agents. The Amended Credit Agreement amends and restates the credit agreement signed between the Company and the same banks on November 23, 2010 and increased our borrowing capacity from $165.0 million under the original agreement to $265.0 million under the Amended Credit Agreement.
Key features of the Amended Credit Agreement, as compared to the November 23, 2010 credit agreement, include an increase in credit from $165.0 million to $265.0 million with the addition of a $100.0 million term loan; the extension of maturity from November 23, 2014 to July 13, 2016; a 25 basis point reduction in interest costs; an increase in the size of permitted acquisitions from $25.0 million to $100.0 million; and an increase in permitted additional indebtedness from $20.0 million to $120.0 million.
The Amended Credit Agreement provided for the extension of credit in the form of a $100.0 million term loan (which refinanced outstanding borrowings in the amount of $100.0 million from the existing revolving credit line), as further described below; and up to $165.0 million of revolving loans, in multiple currencies, at any time and from time to time until the maturity of the Amended Credit Agreement on July 13, 2016. We may borrow, pre-pay and re-borrow amounts under the $165.0 million revolving portion of the Amended Credit Agreement; however, with respect to the $100.0 million term loan portion, any principal amounts re-paid may not be re-borrowed. Borrowings may be used to finance working capital needs, for letters of credit and for general corporate purposes in the ordinary course of business, including the financing of permitted acquisitions (as defined in the Amended Credit Agreement).
Borrowings under the Amended Credit Agreement bear interest based on one of two options. Alternate base rate loans bear interest that includes a base reference rate plus a spread of 75 - 150 basis points, depending on our leverage ratio. The base reference rate is the greater of the prime rate; federal funds effective rate plus 50 basis points; and adjusted London interbank offered (“LIBO”)

72
rate plus 100 basis points. Eurocurrency loans bear interest based on the adjusted LIBO rate plus a spread of 175 - 250 basis points, depending on our leverage ratio.
In addition to interest payable on the principal amount of indebtedness outstanding from time to time under the Amended Credit Agreement, the Company is required to pay a quarterly fee of 0.20% to 0.35% (based upon its leverage ratio) on the unused amount of the lenders’ commitments under the Amended Credit Agreement.
In connection with the Amended Credit Agreement, we transferred borrowings in the amount of $100.0 million from the revolving credit line under the November 23, 2010 credit agreement to the term loan under the Amended Credit Agreement. The Amended Credit Agreement requires the mandatory quarterly repayment of principal on amounts borrowed under such term loan. Payments commenced on September 30, 2011, and are scheduled to be completed on June 30, 2016. The aggregate mandatory principle payments due are as follows:
2011 $2.5 million2012 $7.5 million2013 $12.5 million2014 $17.5 million2015 $35.0 million2016 $25.0 million
The Amended Credit Agreement is secured by many of the assets of Rogers and our World Properties, Inc, subsidiary, including but not limited to, receivables, equipment, intellectual property, inventory, stock in certain subsidiaries and real property.
As part of the Amended Credit Agreement, we are restricted in our ability to perform certain actions, including, but not limited to, our ability to pay dividends, incur additional debt, sell certain assets, and make capital expenditures, with certain exceptions. Further, we are required to maintain certain financial covenant ratios, including a leverage ratio of no more than 3.0 to 1.0 and a minimum fixed charge coverage ratio (FCCR) of 1.25 to 1.0. This ratio measures the Company's ability to cover its fixed charge obligations. The key components of fixed charges are capital expenditures, scheduled debt payments, capital lease payments, income taxes paid in cash, rent and interest expenses.
In the first quarter of 2012, through an amendment to the Amended Credit Agreement, the FCCR was modified from 2.50 to 1.25 of Adjusted Earnings Before Interest, Taxes, Depreciation and Amortization (EBITDA). Several factors contributed to the need for an amendment to this covenant. The 2.50 ratio was based on a more robust set of financial projections, and these have moderated to some extent with the recent events in the marketplace and the overall global economy, particularly in Europe and China. Additionally, there were no mandatory term loan payments when the original ratio was determined, which would further stress the ratio. Finally, we forecasted an increase in planned capital investment to support certain strategic initiatives, which added additional pressure to the ratio.
Relevant Fixed Charge metrics are detailed in the table below:
Periods Q4 2011 Q1 2012 Q2 2012 Q3 2012 Q4 2012
Covenant Limit (minimum) 2.50 1.25 1.25 1.25 1.25
Actual FCCR 2.60 2.27 2.09 1.93 2.18
As of December 31, 2012, we were in compliance with all of our covenants, as we achieved actual ratios of approximately 1.35 on the leverage ratio and 2.18 on the fixed charge coverage ratio.
If an event of default occurs, the lenders may, among other things, terminate their commitments and declare all outstanding borrowings to be immediately due and payable together with accrued interest and fees.
In connection with the establishment of the initial credit agreement in 2010, we capitalized approximately $2.3 million of debt issuance costs and, in connection with the Amended Credit Agreement, as amended, we capitalized an additional $0.1 million of debt issuance costs in 2012. These costs will be amortized over the life of the Amended Credit Agreement, as amended, which will terminate in June 2016. We incurred amortization expense of $0.5 million for the years ended 2012 and 2011, respectively. At December 31, 2012, we have approximately $1.8 million of credit facility costs remaining to be amortized.
In the first quarter of 2011, we made an initial draw on the line of credit of $145.0 million to fund the acquisition of Curamik. During 2012 and 2011, we made principal payments of $24.5 million and $22.5 million, respectively, on the outstanding debt. We are obligated to pay $12.5 million on this debt obligation in 2013 and intend to pay an additional $8.0 million of discretionary revolver payments in 2013. As of December 31, 2012, the outstanding debt related to the Amended Credit Agreement, as amended, consists of $90.0 million of term loan debt and $8.0 million on the revolving line of credit. We have the option to pay part of or the entire

73
amount at any time over the remaining life of the Amended Credit Agreement, as amended, with any balance due and payable at the agreement's expiration.
In addition, as of December 31, 2012, we had the following standby letter of credit (LOC) and guarantees that were backed by the Amended Credit Agreement, as amended:
• $1.4 million letter of credit to guarantee Rogers workers compensation plan;• $0.1 million letter guarantee to guarantee a payable obligation for a Chinese subsidiary (Rogers Suzhou);• $0.1 million letter guarantee to guarantee a payable obligation for a Chinese subsidiary (Rogers Suzhou).
No amounts were owed on the standby LOC or guarantees as of December 31, 2012 or December 31, 2011.
Capital Lease
During the first quarter of 2011, we recorded a capital lease obligation related to the acquisition of Curamik for its primary manufacturing facility in Eschenbach, Germany. Per the lease agreement, we have the option to purchase the property in either 2013 or upon the expiration of the lease in 2021 at a price which is the greater of (i) the then-current market value or (ii) the residual book value of the land including the buildings and installations thereon. The total obligation recorded for the lease as of December 31, 2012 and 2011 was $8.4 million and $9.2 million, respectively. Depreciation expense related to the capital lease was $0.4 million for the years ending December 31, 2012 and 2011, respectively. Accumulated depreciation for the years ended December 31, 2012 and 2011 was $0.8 million and $0.4 million.
These expenses are included as depreciation expense in Cost of Sales on our consolidated statements of income (loss). Interest expense related to the debt recorded on the capital lease is included in interest expense on the consolidated statements of income (loss). See “Interest” section below for further discussion.
Interest
We incurred interest expense on our outstanding debt of $2.9 million and $3.8 million for the years ended December 31, 2012 and 2011, respectively. We incurred an unused commitment fee of approximately $0.4 million and $0.2 million for the years ended December 31, 2012 and 2011, respectively. In July 2012, we entered into an interest rate swap to hedge the variable interest rate on 65% of the term loan debt, then outstanding, effective through July 2013. At December 31, 2012, the term loan debt amounted to $90.0 million of our total outstanding debt of $98.0 million At December 31, 2012, the rate charged on this debt is the 1 month LIBOR at 0.25% plus a spread of 2.25%.
We also incurred interest expense on the capital lease of $0.6 million and $1.0 million for the years ended December 31, 2012 and 2011, respectively. Cash paid for interest was $4.0 million for 2012.
Restriction on Payment of Dividends
Pursuant to the Amended Credit Agreement, as amended, we cannot make a cash dividend payment if a default or event of default has occurred and is continuing or shall result from the cash dividend payment.
NOTE 12 – INCOME TAXES
Consolidated income (loss) from continuing operations before income taxes consists of:
(Dollars in thousands) 2012 2011 2010Domestic $ 6,260 $ 9,285 $ 6,121International 16,390 46,483 38,280 Total $ 22,650 $ 55,768 $ 44,401

74
The income tax expense (benefit) in the consolidated statements of income (loss) consists of:
(Dollars in thousands) Current Deferred Total2012 Domestic $ 3,651 $ (59,414) $ (55,763) International 8,118 1,161 9,279 Total $ 11,769 $ (58,253) $ (46,484)
2011 Domestic $ 2,173 $ (828) $ 1,345 International 12,070 (1,897) 10,173 Total $ 14,243 $ (2,725) $ 11,518
2010 Domestic $ 8,032 $ (9,528) $ (1,496) International 6,199 1,147 7,346 Total $ 14,231 $ (8,381) $ 5,850
Deferred tax assets and liabilities as of December 31, 2012 and 2011, are comprised of the following:
(Dollars in thousands)2012 2011
Deferred tax assets Accrued employee benefits and compensation $ 10,591 $ 13,124 Postretirement benefit obligations 23,066 28,923 Tax credit carryforwards 18,574 16,142 Reserves and accruals 6,014 4,097 Depreciation and amortization 19,134 17,276 Other 1,751 2,143Total deferred tax assets 79,130 81,705Less deferred tax asset valuation allowance (466) (59.442)Total deferred tax assets, net of valuation allowance 78,664 22.263Deferred tax liabilities Investment in joint ventures, net 1,559 2,265 Depreciation and amortization 15,654 16,614 Other 332 380Total deferred tax liabilities 17,545 19,259Net deferred tax asset $ 61,119 $ 3,004
We currently have approximately $20.4 million of foreign tax credits that begin to expire in 2021, $3.2 million of research and development credits that begin to expire in 2026, and $0.1 million of minimum tax credits that can be carried forward indefinitely. We also have a $2.0 million net operating loss carryforward for German income tax purposes which will not expire. In addition, we have a $1.0 million net operating loss carryforward in China which will expire in 2017. Accordingly, we have not recorded any deferred tax assets related to such items on our consolidated statement of financial position for the years ended December 31, 2012 and 2011. We have state net operating loss and tax credit carryforwards in certain jurisdictions. As we continually generate credits in excess of our current year tax liability in these jurisdictions, we believe that it is remote that we will ever benefit from these tax attributes. Accordingly, we have not recorded any deferred tax assets related to such items on our consolidated statement of financial position for the years ended December 31, 2012 and 2011.
As a result of certain realization requirements, the table of deferred tax assets and liabilities shown above does not include certain deferred tax assets as of December 31, 2012 that the use of which was postponed by tax deductions related to equity compensation in excess of compensation recognized for financial reporting. Those deferred tax assets include foreign tax credits of $3.9 million,

75
research and development credits of $1.2 million and minimum tax credits of $0.4 million. Equity will be increased by $5.5 million if and when such deferred tax assets are ultimately realized.
We had a valuation allowance of $0.5 million and $59.4 million, at December 31, 2012 and December 31, 2011, respectively, against certain of U.S. deferred tax assets. The decrease in the valuation allowance in 2012 is primarily due to reversal of the majority of the valuation allowance against the US deferred tax assets. A valuation allowance for deferred tax assets is recorded to the extent we cannot determine that the ultimate realization of a deferred tax assets is more likely than not. In determining the need for a valuation allowance, we assess the available positive and negative evidence as well as consider available tax planning strategies. In 2009, we established a valuation allowance against substantially all of our U.S. deferred tax assets as we concluded that we did not have sufficient evidence to support the position that these assets would be utilized in the future. This conclusion was reached primarily due to the presence of recent cumulative losses in the US and upon consideration of all other available evidence, both positive and negative, using a “more likely than not standard” in accordance with applicable accounting guidance. At the end of the third quarter of 2012, we concluded that a valuation allowance against these assets is no longer necessary as we are no longer in, nor are we expecting to be in, a cumulative loss in the forseeable future. Also, in appropriate circumstances we have the opportunity to undertake a tax planning strategy to ensure that our tax credit carryforwards do not expire unutilized. This strategy is based upon our ability to make a tax election to capitalize certain expenses that will result in generating taxable income to allow us to utilize our tax credit carryforwards before they expire. We would undertake such a strategy to realize these tax credit carryforwards prior to expiration as it is reasonable, prudent, and feasible. This, along with other positive evidence, such as our recent history of positive taxable income, led us to conclude in 2012 that it is more likely than not that we will ultimately be able to realize our deferred tax assets.
Also in 2012, we realized a capital loss on the sale of the auction rate securities. As we do not have the ability to generate capital gains in the near future, we have established a valuation allowance against this deferred tax asset.
Income tax expense differs from the amount computed by applying the United States federal statutory income tax rate to income before income taxes. The reasons for this difference are as follows:
(Dollars in thousands) 2012 2011 2010
Tax expense at Federal statutory income tax rate $ 7,928 $ 19,518 $ 15,540International tax rate differential (209) (4,627) (4,672)Foreign source income, net of tax credits (3,428) (1,021) 3,487Unrecognized tax benefits 1,604 272 16General business credits — (831) (775)Valuation allowance change (52,650) (1,989) (8,916)Acquisition related expenses — — 974Other 271 196 196Income tax expense (benefit) $ (46,484) $ 11,518 $ 5,850
Our tax holiday on the earnings of our subsidiaries in China expired at the end of 2011. Under the business license agreement granted to Rogers Technologies (Suzhou) Company (RSZ), a wholly-owned subsidiary of ours, the first two years of cumulatively profitable operations were taxed at a 0% tax rate followed by a reduced tax rate in subsequent years that gradually increased to the 25% full rate of tax beginning in 2012. In 2011, RSZ reported pretax income of $17.9 million, which was subject to a tax rate of 24%. In 2010, RSZ reported pretax income of $18.1 million, which was subject to a tax rate of 22%. Under the business license agreement granted to Rogers (Shanghai) International Trading Company Ltd. (RSH), also a wholly-owned subsidiary of ours, RSH was subject to a reduced rate of tax that gradually increased to the 25% full rate of tax beginning in 2012. In 2011, RSH reported pretax income of $2.4 million which was subject to a tax rate of 24%. In 2010, RSH reported pretax income of $4.8 million which was subject to a tax rate of 22%.
The objective of accounting for income taxes is to recognize the amount of taxes payable or refundable for the current year and the deferred tax liabilities and assets for the future tax consequence of events that have been recognized in the entity's financial statements. We are subject to income taxes in the United States and in numerous foreign jurisdictions. No provision is made for U.S. income taxes on the undistributed earnings of substantially all of our wholly-owned foreign subsidiaries because such earnings are indefinitely reinvested in those companies. If circumstances change and it becomes apparent that all or some of the undistributed earnings of our wholly-owned foreign subsidiaries will not be indefinitely reinvested, a provision for the tax consequence, if any, will be recorded in the period circumstances change. At December 31, 2012, we have not accrued U.S. income taxes on approximately $130.9 million of unremitted earnings.

76
Income taxes paid, net of refunds, were $11.6 million, $17.1 million, and $4.6 million, in 2012, 2011, and 2010, respectively.
A reconciliation of unrecognized tax benefits, excluding potential interest and penalties, for the years ending December 31, 2012 and December 31, 2011, is as follows:
(Dollars in thousands)2012 2011
Beginning balance $ 16,133 $ 14,331Gross increases - current period tax positions 1,929 1,458Acquisitions/disposals — 1,942Foreign currency exchange 37 (50)Lapse of statute of limitations (766) (1,548)Ending balance $ 17,333 $ 16,133
If the December 31, 2012 balance of $17.3 million is recognized, approximately $10.3 million would decrease the effective tax rate in the period in which each of the benefits is recognized. The remaining amount would be offset by the reversal of related deferred tax assets. Excluded from the balance above is $0.7 million at both December 31, 2012 and 2011, which were presented in the balance sheet as a direct offset to the corresponding deferred tax asset. At December 31, 2012 and 2011, we had accrued potential interest and penalties of approximately $2.0 million and $1.5 million, respectively. The potential interest and penalties are included as a component of income tax expense. It is reasonably possible that between $2.5 million and $3.5 million of our currently unrecognized tax benefits may be recognized within 12 months as a result of projected resolutions of worldwide tax disputes or the expiration of the statute of limitations.
We are subject to taxation in the U.S. and various state and foreign jurisdictions. Our tax years from 2009 through 2012 are subject to examination by the tax authorities. With few exceptions, we are no longer subject to U.S. federal, state, local and foreign examinations by tax authorities for the years before 2009.
NOTE 13 - SHAREHOLDERS' EQUITY AND STOCK OPTIONS
Accumulated Other Comprehensive Income (Loss)
The components of accumulated other comprehensive income (loss) at December 31, 2012 and December 31, 2011 were as follows:
(Dollars in thousands)December 31,
2012December 31,
2011Foreign currency translation adjustments $ 12,585 $ 5,875Funded status of pension plans and other postretirement benefits, net of tax of $22,371 and $20,799. (70,158) (67,239)Unrealized gain (loss) on derivative instruments, net of tax of $127 and $0 (235) (270)Unrealized gain (loss) on marketable securities, net of tax of $0 and $1,555 — (1,168)Accumulated other comprehensive income (loss) $ (57,808) $ (62,802)
Capital Stock and Equity Compensation Awards
Under the Rogers Corporation 2009 Long-Term Equity Compensation Plan, we may grant stock options to officers, directors, and other key employees at exercise prices that are at least equal to the fair market value of our stock on the date of grant. Under our older plans, stock options to officers, directors, and other key employees could be granted at exercise prices that were as low as 50% of the fair market value of our stock as of the date of grant. However, in terms of these older plans, virtually all such options were granted at exercise prices equal to the fair market value of our stock as of the date of grant. With shareholder approval of the Rogers Corporation 2009 Long-Term Equity Compensation Plan, no new equity awards will be granted from our older plans. Regular options granted to employees in the United States generally become exercisable over a four-year period from the grant date and expire ten years after such grant. Stock option grants were also made under the older plans to non-management directors, on a semi-annual basis, with the last of such grants being made in June 2008.
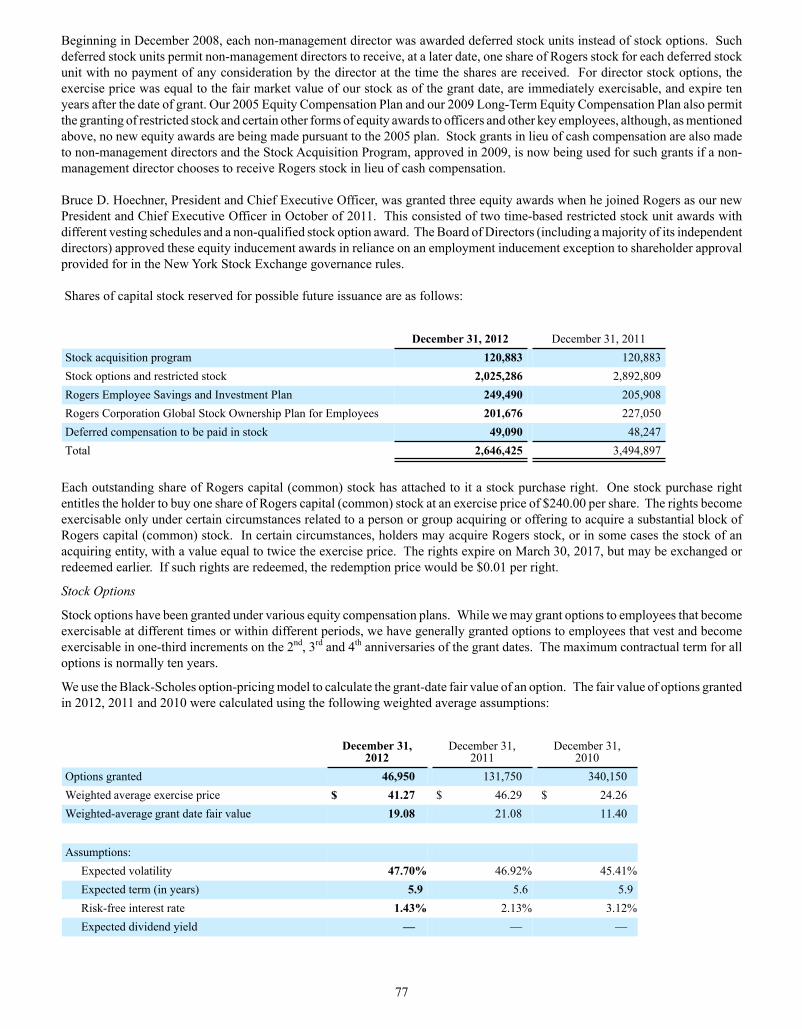
77
Beginning in December 2008, each non-management director was awarded deferred stock units instead of stock options. Such deferred stock units permit non-management directors to receive, at a later date, one share of Rogers stock for each deferred stock unit with no payment of any consideration by the director at the time the shares are received. For director stock options, the exercise price was equal to the fair market value of our stock as of the grant date, are immediately exercisable, and expire ten years after the date of grant. Our 2005 Equity Compensation Plan and our 2009 Long-Term Equity Compensation Plan also permit the granting of restricted stock and certain other forms of equity awards to officers and other key employees, although, as mentioned above, no new equity awards are being made pursuant to the 2005 plan. Stock grants in lieu of cash compensation are also made to non-management directors and the Stock Acquisition Program, approved in 2009, is now being used for such grants if a non-management director chooses to receive Rogers stock in lieu of cash compensation.
Bruce D. Hoechner, President and Chief Executive Officer, was granted three equity awards when he joined Rogers as our new President and Chief Executive Officer in October of 2011. This consisted of two time-based restricted stock unit awards with different vesting schedules and a non-qualified stock option award. The Board of Directors (including a majority of its independent directors) approved these equity inducement awards in reliance on an employment inducement exception to shareholder approval provided for in the New York Stock Exchange governance rules.
Shares of capital stock reserved for possible future issuance are as follows:
December 31, 2012 December 31, 2011Stock acquisition program 120,883 120,883Stock options and restricted stock 2,025,286 2,892,809Rogers Employee Savings and Investment Plan 249,490 205,908Rogers Corporation Global Stock Ownership Plan for Employees 201,676 227,050Deferred compensation to be paid in stock 49,090 48,247Total 2,646,425 3,494,897
Each outstanding share of Rogers capital (common) stock has attached to it a stock purchase right. One stock purchase right entitles the holder to buy one share of Rogers capital (common) stock at an exercise price of $240.00 per share. The rights become exercisable only under certain circumstances related to a person or group acquiring or offering to acquire a substantial block of Rogers capital (common) stock. In certain circumstances, holders may acquire Rogers stock, or in some cases the stock of an acquiring entity, with a value equal to twice the exercise price. The rights expire on March 30, 2017, but may be exchanged or redeemed earlier. If such rights are redeemed, the redemption price would be $0.01 per right.
Stock Options
Stock options have been granted under various equity compensation plans. While we may grant options to employees that become exercisable at different times or within different periods, we have generally granted options to employees that vest and become exercisable in one-third increments on the 2nd, 3rd and 4th anniversaries of the grant dates. The maximum contractual term for all options is normally ten years.
We use the Black-Scholes option-pricing model to calculate the grant-date fair value of an option. The fair value of options granted in 2012, 2011 and 2010 were calculated using the following weighted average assumptions:
December 31,
2012December 31,
2011December 31,
2010Options granted 46,950 131,750 340,150Weighted average exercise price $ 41.27 $ 46.29 $ 24.26Weighted-average grant date fair value 19.08 21.08 11.40
Assumptions: Expected volatility 47.70% 46.92% 45.41%Expected term (in years) 5.9 5.6 5.9Risk-free interest rate 1.43% 2.13% 3.12%Expected dividend yield — — —

78
Expected volatility – In determining expected volatility, we have considered a number of factors, including historical volatility and implied volatility.
Expected term – We use historical employee exercise data to estimate the expected term assumption for the Black-Scholes valuation.
Risk-free interest rate – We use the yield on zero-coupon U.S. Treasury securities for a period commensurate with the expected term assumption as the risk-free interest rate.
Expected dividend yield – We do not currently pay dividends on our common stock; therefore, a dividend yield of 0% was used in the Black-Scholes model.
In most cases, we recognize expense using the straight-line attribution method for stock option grants. The amount of stock-based compensation recognized during a period is based on the value of the portion of the awards that are ultimately expected to vest. Forfeitures are required to be estimated at the time of grant and revised, if necessary, in subsequent periods if actual forfeitures differ from those estimates. The term “forfeitures” is distinct from “cancellations” or “expirations” and represents only the unvested portion of the surrendered option. We currently expect, based on an analysis of our historical forfeitures, an annual forfeiture rate of approximately 3% and applied that rate to the grants issued. This assumption will be reviewed periodically and the rate will be adjusted as necessary based on these reviews. Ultimately, the actual expense recognized over the vesting period will only be for those options that vest.
Our employee stock option agreements contain a retirement provision, which results in the vesting of any unvested options immediately upon retirement. This provision affects the timing of option expense recognition for options meeting the criteria for retirement. We recognize compensation expense over the period from the date of grant to the date retirement eligibility is met, if it is shorter than the required service period, or upon grant if the employee is eligible for retirement on that date.
A summary of the activity under our stock option plans as of December 31, 2012 and changes during the year then ended, is presented below:
Options
Outstanding
Weighted- AverageExercise Price Per
Share
Weighted-AverageRemaining
Contractual Life inYears
Aggregate IntrinsicValue
Options outstanding at December 31, 2011 2,401,809 $ 37.54 5.0 12,195,931Options granted 46,950 41.27 Options exercised (614,263) 42.97 Options cancelled (68,549) 43.57
Options outstanding at December 31, 2012 1,765,947 40.58 1.3 19,557,233Options exercisable at December 31, 2012 1,274,340 43.61 3.2 11,230,647Options vested or expected to vest at December 31, 2012* 1,751,199 40.64 4.2 19,307,435
* In addition to the vested options, we expect a portion of the unvested options to vest at some point in the future. Options expected to vest are calculated by applying an estimated forfeiture rate to the unvested options.
During the years ended December 31, 2012 and 2011, the total intrinsic value of options exercised (i.e. the difference between the market price at time of exercise and the price paid by the individual to exercise the options) was $8.9 million and $4.1 million, respectively. The total amount of cash received from the exercise of these options was $17.0 million and $11.1 million, respectively. The total grant-date fair value of stock options that vested during the years ended December 31, 2012 and 2011 was approximately $2.0 million and $3.6 million, respectively.
As of December 31, 2012, there was $1.5 million of total unrecognized compensation cost related to unvested stock option awards. That cost is expected to be recognized over a weighted-average period of 1.5 years.
We recognized $2.0 million, $3.6 million and $4.0 million of compensation expense related to stock options for the years ended December 31, 2012, 2011 and 2010, respectively.
A summary of the activity under our stock option plans as for the fiscal years ended 2012, 2011 and 2010, is presented below:

79
2012 2011 2010
OptionsOutstanding
Weighted-AverageExercise
PricePer Share
OptionsOutstanding
Weighted-Average
Exercise PricePer Share
OptionsOutstanding
Weighted-Average
Exercise PricePer Share
Outstanding at beginning of year 2,401,809 $ 37.54 2,626,371 $ 36.63 2,401,318 $ 38.40Options granted 46,950 41.27 131,750 46.29 340,150 24.26Options exercised (614,263) 42.97 (329,964) 33.61 (30,675) 31.33Options cancelled (68,549) 43.57 (26,348) 30.77 (84,422) 38.92
Outstanding at year-end 1,765,947 40.58 2,401,809 37.54 2,626.371 36.63Options exercisable at year-end 1,274,340 1,609,982 1,674,979
Performance-Based Restricted Stock
In 2006, we began granting performance-based restricted stock grants to certain key executives. These grants cliff vest at the end of a 3 year measurement period, except for grants to those individuals who are retirement eligible during the grant period as such awards are subject to accelerated vesting as the grant is earned over the course of the vesting period (i.e. a pro-rata payout occurs based on the retirement date). Participants are eligible to be awarded shares ranging from 0% to 200% of the original award amount, based on certain defined performance measures. Compensation expense is recognized ratably over the vesting period, unless the employee has an accelerated vesting schedule. Additionally, compensation expense is increased or decreased based on changes in the estimated pay out percentages each quarter. The fair value of the award is determined based on the market value of the underlying stock price at the grant date.
Actual performance during the relevant period for the 2010 grant, which vested as of December 31, 2012, met the target performance criteria and shares will be paid out at 200% of target during the first quarter of 2013.
A summary of activity under the performance-based restricted stock plans for the fiscal years ended 2012, 2011 and 2010 is presented below:
2012 2011 2010
AwardsOutstanding
Weighted-Average
Grant DateFair Value
AwardsOutstanding
Weighted-Average
Grant DateFair Value
AwardsOutstanding
Weighted-Average
Grant DateFair Value
Non-vested awards outstanding atbeginning of year 101,730 $ 31.19 115,250 $ 27.09 98,400 $ 32.29
Awards granted 22,120 41.27 20,630 47.89 37,350 27.43Stock issued (43,750) 23.86 — — — —Awards forfeited or expired (6,642) 37.67 (34,150) 27.43 (20,500) 52.66
Non-vested awards outstanding atend of year 73,458 38.01 101,730 31.19 115,250 27.09
We recognized $0.5 million, $1.7 million and $1.4 million of compensation expense related to performance-based restricted stock grants for the years ended December 31, 2012, 2011 and 2010, respectively. The 2012 expense represents a 200% projected payout for the 2010 performance-based grants, and a projected payout of 100% for the performance-based awards granted in 2011 and 2012, respectively. The 2011 expense represented a 97.4% actual payout for the 2009 performance-based grants, and a projected payout of 200% for the performance-based awards granted in 2010 and 2011, respectively. The 2010 expense represented no projected payout for the 2008 performance-based grants, and a projected payout of 67% and 200% for the performance-based awards granted in 2009 and 2010, respectively.
As of December 31, 2012, there was $0.9 million of total unrecognized compensation cost related to unvested performance-based restricted stock. That cost is expected to be recognized over a weighted-average period of 1.3 years.

80
Time-Based Restricted Stock
In 2011, we began granting time-based restricted stock awards to certain key executives and other key members of the Company’s management team. Time-based restricted stock grants typically cliff vest at the end of the 3 year vesting period, and we recognize compensation expense on these awards ratably over the vesting period. The fair value of the award is determined based on the market value of the underlying stock price at the grant date.
2012 2011 2010
AwardsOutstanding
Weighted-Average
Grant DateFair Value
AwardsOutstanding
Weighted-Average
Grant DateFair Value
AwardsOutstanding
Weighted-Average
Grant DateFair Value
Non-vested awards outstanding atbeginning of year 86,707 $ 44.55 2,500 $ 20.01 2,500 $ 20.01
Awards granted 51,790 40.99 84,667 45.29 — —Stock issued (16,620) 41.64 — — — —Awards forfeited or expired (6,738) 46.21 (460) 47.89 — —
Non-vested awards outstanding atend of year 115,139 43.27 86,707 44.55 2,500 $ 20.01
We recognized $1.6 million, $1.6 million and a minimal amount of compensation expense related to time-based restricted stock for years ended December 31, 2012, 2011 and 2010, respectively. As of December 31, 2012, there was $2.6 million of total unrecognized compensation cost related to unvested time-based restricted stock. That cost is expected to be recognized over a weighted-average period of 1.5 years.
Deferred Stock Units
We grant deferred stock units to non-management directors. These awards are fully vested on the date of grant and the related shares are generally issued on the 13th month anniversary of the grant date unless the individual elects to defer the receipt of these shares. Each deferred stock unit results in the issuance of one share of Rogers’ stock. The grant of deferred stock units is typically done annually in the second quarter of each year. The fair value of the award is determined based on the market value of the underlying stock price at the grant date.
2012 2011 2010
AwardsOutstanding
Weighted-Average
Grant DateFair Value
AwardsOutstanding
Weighted-Average
Grant DateFair Value
AwardsOutstanding
Weighted-Average
Grant DateFair Value
Non-vested awards outstanding atbeginning of year 27,350 $ 28.80 30,250 $ 28.98 41,200 $ 24.76
Awards granted 17,600 38.64 16,650 45.95 25,100 29.85Stock issued (14,800) 45.95 (19,550) 43.69 (36,050) 24.76
Non-vested awards outstanding atend of year 30,150 26.13 27,350 28.80 30,250 28.98
We recognized compensation expense related to deferred stock units of $0.7 million, $0.7 million, and $0.7 million for the years ended December 31, 2012, 2011 and 2010, respectively.
Employee Stock Purchase Plan
We have an employee stock purchase plan (ESPP) that allows eligible employees to purchase, through payroll deductions, shares of our common stock at a discount to fair market value. The ESPP has two 6 month offering periods each year, the first beginning in January and ending in June and the second beginning in July and ending in December. The ESPP contains a look-back feature that allows the employee to acquire stock at a 15% discount from the underlying market price at the beginning or end of the applicable period, whichever is lower. We recognize compensation expense on this plan ratably over the offering period based on the fair value of the anticipated number of shares that will be issued at the end of each offering period. Compensation expense is adjusted at the end of each offering period for the actual number of shares issued. Fair value is determined based on two factors: (i) the 15% discount amount on the underlying stock’s market value on the first day of the applicable offering period, and (ii) the

81
fair value of the look-back feature determined by using the Black-Scholes model. We recognized approximately $0.5 million of compensation expense associated with the plan for the year ended December 31, 2012 and $0.5 million for the year ended December 31, 2011 and $0.5 million for the year ended December 31, 2010.
NOTE 14 – COMMITMENTS AND CONTINGENCIES
Leases
Our principal noncancellable operating lease obligations are for building space and vehicles. The leases generally provide that we pay maintenance costs. The lease periods typically range from one to five years and include purchase or renewal provisions. We have leases that are cancellable with minimal notice. Additionally, we have a capital lease on our manufacturing facility in Eschenbach, Germany, which was entered into in 2011.
(Dollars in thousands) 2012 2011 2010Operating lease expense $ 2,655 $ 3,137 $ 3,102Capital lease payments 1,627 1,627 —
(Dollars in thousands) Future minimum lease payments2013 2014 2015 2016 2017
Operating leases $ 2,457 $ 1,186 $ 747 $ 642 $ 266Capital lease 1,422 808 808 808 808
(Dollars in thousands) Operating Leases Capital LeaseTotal future minimum lease payments $ 5,739 $ 7,484
We are currently engaged in the following environmental and legal proceedings:
Superfund Sites
We are currently involved as a potentially responsible party (PRP) in one active case involving a waste disposal site, the Chatham Superfund Site. The costs incurred since inception for this claim have been immaterial and have been primarily covered by insurance policies, for both legal and remediation costs. In this matter we have been assessed a cost sharing percentage of approximately 2% in relation to the range for estimated total cleanup costs of $17.0 million to $24.0 million. We believe we have sufficient insurance coverage to fully cover this liability and have recorded a liability and related insurance receivable of approximately $0.3 million as of December 31, 2012, which approximates our share of the low end of the estimated range. We believe we are a de minimis participant at this site and, as such, have been allocated an insignificant percentage of the total PRP cost sharing responsibility. Based on facts presently known to us, we believe that the potential for the final results of this case having a material adverse effect on our results of operations, financial position or cash flows is remote. This case has been ongoing for many years and we believe that it will continue on for the indefinite future. No time frame for completion can be estimated at the present time.
In the fourth quarter of 2011, the United States Environmental Protection Agency (EPA) notified us that we were a PRP for the cleanup of the Omega Chemical Corporation Superfund Site in Los Angeles County, California. In the first quarter of 2012, we were notified that we were no longer a PRP related to this superfund site.
PCB Contamination
We have been working with the Connecticut Department of Energy and Environmental Protection (CT DEEP) and the EPA, Region I, in connection with certain polychlorinated biphenyl (PCB) contamination at our facility in Woodstock, Connecticut. The issue was originally discovered in the soil at the facility in the late 1990s, and this initial issue was remediated in 2000. Further contamination was later found in the surrounding groundwater, which was addressed in 2011 with the installation of a pump and treat system. To date, we have spent approximately $2.5 million in remediation and monitoring costs related to these issues and expect to incur future costs related primarily to the maintenance of the pump and treat system now in place at the site to be de minimis.

82
As we were remediating the groundwater contamination issue, we discovered additional PCB contamination in the building at this facility during the first quarter of 2010. Remediation costs related to this contamination are expected to approximate $1.0 million, which was recorded as our original liability during 2010. To date, we have incurred $0.7 million in remediation costs related to this issue and anticipate that the remaining reserve of $0.3 million will be adequate to cover the remaining remediation work related to this issue.
We believe that these efforts will continue for several more years and no time frame for completion can be estimated at the present time.
Asbestos LitigationA significant number of asbestos-related product liability claims have been brought against numerous United States industrial companies where the third-party plaintiffs allege personal injury from exposure to asbestos-containing products. We have been named, along with hundreds of other companies, as a defendant in some of these claims. In virtually all of these claims filed against us, the plaintiffs are seeking unspecified damages, or, if an amount is specified, such amount merely represents a jurisdictional amount. However, occasionally specific damages are alleged and in such situations, plaintiffs' lawyers often sue dozens of defendants, frequently without factual basis or support. As a result, even when a specific amount of damages is alleged, such action can be arbitrary, both as to the amount being sought and the defendant being charged with such damages.
We did not mine, mill, manufacture or market asbestos; rather we made a limited number of products which contained encapsulated asbestos. Such products were provided to industrial users. We stopped manufacturing these products in the late 1980s.
• Claims
We have been named in asbestos litigation primarily in Illinois, Pennsylvania and Mississippi. As of December 31, 2012, there were 319 pending claims compared to 242 pending claims at December 31, 2011. The number of pending claims at a particular time can fluctuate significantly from period to period depending on how successful we have been in getting these cases dismissed or settled. Some jurisdictions prohibit specifying alleged damages in personal injury tort cases such as these, other than a minimum jurisdictional amount which may be required for such reasons as allowing the case to be litigated in a jury trial (which the plaintiffs believe will be more favorable to them than if heard only before a judge) or allowing the case to be litigated in federal court. This is in contrast to commercial litigation, in which specific alleged damage claims are often permitted. The prohibition on specifying alleged damages sometimes applies not only to the suit when filed but also during the trial – in some jurisdictions the plaintiff is not actually permitted to specify to the jury during the course of the trial the amount of alleged damages the plaintiff is claiming. Further, in those jurisdictions in which plaintiffs are permitted to claim specific alleged damages, many plaintiffs nonetheless still choose not to do so. In those cases in which plaintiffs are permitted to and choose to assert specific dollar amounts in their complaints, we believe the amounts claimed are typically not meaningful as an indicator of a company’s potential liability. This is because (1) the amounts claimed may bear no relation to the level of the plaintiff’s injury and are often used as part of the plaintiff’s litigation strategy, (2) the complaints typically assert claims against numerous defendants, and often the alleged damages are not allocated against specific defendants, but rather the broad claim is made against all of the defendants as a group, making it impossible for a particular defendant to quantify the alleged damages that are being specifically claimed against it and therefore its potential liability, and (3) many cases are brought on behalf of plaintiffs who have not suffered any medical injury, and ultimately are resolved without any payment or payment of a small fraction of the damages initially claimed. Of the 319 claims pending as of December 31, 2012, 72 claims do not specify the amount of damages sought, 245 claims cite jurisdictional amounts, and only two (2) claims (less than 1.0% of the total pending claims) specify the amount of damages sought not based on jurisdictional requirements. Of these two (2) claims, one (1) claim alleges compensatory and punitive damages of $20 million each and one (1) claim alleges compensatory damages of $65 million and punitive damages of $60 million. These two (2) claims name between ten (10) and 21 defendants. However, for the reasons cited above, we do not believe that this data allows for an accurate assessment of the relation that the amount of alleged damages claimed might bear to the ultimate disposition of these cases.
We believe the rate at which plaintiffs filed asbestos-related suits against us increased in 2001, 2002, 2003 and 2004 because of increased activity on the part of plaintiffs to identify those companies that sold asbestos-containing products, but which did not directly mine, mill or market asbestos. A significant increase in the volume of asbestos-related bodily injury cases arose in Mississippi in 2002. This increase in the volume of claims in Mississippi was apparently due to the passage of tort reform legislation (applicable to asbestos-related injuries), which became effective on September 1, 2003 and which resulted in a higher than average number of claims being filed in Mississippi by plaintiffs seeking to ensure their claims would be governed by the law in effect prior to the passage of tort reform. The number of asbestos related suits filed against us decreased slightly in 2005 and 2006, but increased slightly in 2007, declined in 2008 and increased again in 2009 and 2010. The number of lawsuits filed against us in 2011 and 2012 was significantly higher than in 2010. These new lawsuits are reflected on the NERA and Marsh reports. (See "Impact of Financials Statements" section below.)

83
• Defenses
In many cases, plaintiffs are unable to demonstrate that they have suffered any compensable loss as a result of exposure to our asbestos-containing products. We continue to believe that a majority of the claimants in pending cases will not be able to demonstrate exposure or loss. This belief is based in large part on the limited number of asbestos-related products manufactured and sold by us and the fact that the asbestos was encapsulated in such products. In addition, even at sites where the presence of an alleged injured party can be verified during the same period those products were used, our liability cannot be presumed because even if an individual contracted an asbestos-related disease, not everyone who was employed at a site was exposed to the asbestos containing products that we manufactured. Based on these and other factors, we have and will continue to vigorously defend ourselves in asbestos-related matters.
• Dismissals and Settlements
Cases involving us typically name 50-300 defendants, although some cases have had as few as one (1) and as many as 833 defendants. We have obtained dismissals of many of these claims. For the year ended December 31, 2012, we were able to have 93 claims dismissed and settled sixteen (16) claims. For the year ended December 31, 2011, 120 claims were dismissed and eight (8) were settled. The majority of costs have been paid by our insurance carriers, including the costs associated with the small number of cases that have been settled. Such settlements totaled approximately $6.3 million for the year ended December 31, 2012, compared to $8.1 million for the year ended 2011 and such settlement amounts were paid by our insurance carriers. Although these figures provide some insight into our experience with asbestos litigation, no guarantee can be made as to the dismissal and settlement rates that we will experience in the future.
Settlements are made without any admission of liability. Settlement amounts may vary depending upon a number of factors, including the jurisdiction where the action was brought, the nature and extent of the disease alleged and the associated medical evidence, the age and occupation of the claimant, the existence or absence of other possible causes of the alleged illness of the alleged injured party and the availability of legal defenses, as well as whether the action is brought alone or as part of a group of claimants. To date, we have been successful in obtaining dismissals for many of the claims and have settled only a limited number. The majority of settled claims were settled for immaterial amounts, and the majority of such costs have been paid by our insurance carriers. In addition, to date, we have not been required to pay any punitive damage awards.
• Potential Liability
National Economic Research Associates, Inc. (NERA), a consulting firm with expertise in the field of evaluating mass tort litigation asbestos bodily-injury claims, has historically been engaged to assist us in projecting our future asbestos-related liabilities and defense costs with regard to pending claims and future unasserted claims. Projecting future asbestos costs is subject to numerous variables that are extremely difficult to predict, including the number of claims that might be received, the type and severity of the disease alleged by each claimant, the long latency period associated with asbestos exposure, dismissal rates, costs of medical treatment, the financial resources of other companies that are co-defendants in claims, uncertainties surrounding the litigation process from jurisdiction to jurisdiction and from case to case and the impact of potential changes in legislative or judicial standards, including potential tort reform. Furthermore, any predictions with respect to these variables are subject to even greater uncertainty as the projection period lengthens. In light of these inherent uncertainties, the variability of our claims history and consultations with NERA, we currently believe that ten years is the most reasonable period for recognizing a reserve for future costs, and that costs that might be incurred after that period are not reasonably estimable at this time. As a result, we also believe that our ultimate asbestos-related contingent liability (i.e., our indemnity or other claim disposition costs plus related legal fees) cannot be estimated with certainty. (See "Impact of Financials Statements" section below for further discussion.)
• Insurance Coverage
Our applicable insurance policies generally provide coverage for asbestos liability costs, including coverage for both resolution and defense costs. Following the initiation of asbestos litigation, an effort was made to identify all of our primary, umbrella and excess level insurance carriers that provided applicable coverage beginning in the 1950s through the mid-1980s. Where appropriate, carriers were put on notice of the litigation. Marsh USA, Inc., also known as Marsh Risk Consulting (Marsh), a consulting firm with expertise in the field of evaluating insurance coverage and the likelihood of recovery for asbestos-related claims, has historically been engaged to work with us to project our insurance coverage for asbestos-related claims. Marsh’s conclusions are based primarily on a review of our coverage history, application of reasonable assumptions on the allocation of coverage consistent with certain industry practices, an assessment of the creditworthiness of the insurance carriers, analysis of applicable deductibles, retentions and policy limits, the experience of NERA and a review of NERA’s reports.
• Cost Sharing Agreement
To date, our insurance carriers have paid for substantially all of the settlement and defense costs associated with our asbestos-related claims. The current cost sharing agreement between us and such insurance carriers is primarily designed to facilitate the

84
ongoing administration and payment of such claims by the carriers until the applicable insurance coverage is exhausted. This four year agreement expires on January 25, 2015 and replaced an older agreement that had expired.
In 2012, the primary layer insurance policies providing coverage for the January 1, 1967 to June 30, 1969 period exhausted. The cost sharing agreement contemplates that any excess carrier over exhausted primary layer carriers will become a party to the cost sharing agreement, replacing the coverage provided by the exhausted primary policies if the carrier providing such excess coverage is not already a party to the cost sharing agreement. The excess carrier providing coverage for the period set forth above is not already a party to the cost sharing agreement. Such excess carrier has been notified of the exhaustion and is reviewing the cost sharing agreement at this time, but is currently providing applicable insurance coverage.
• Impact on Financial Statements
The models developed for determining the potential exposure and related insurance coverage were developed by outside consultants deemed to be experts in their respective fields with the forecast for asbestos related liabilities generated by NERA and the related insurance receivable projections developed by Marsh. The models contain numerous assumptions that significantly impact the results generated by the models. We believe the assumptions made are reasonable at the present time, but are subject to uncertainty based on the actual future outcome of our asbestos litigation. Historically, due to the inherent uncertainties of the forecast process and our limited amount of settlement and claims history, we utilized a forecast period of five years, which we concluded was the most reasonable period for recognizing a reserve for projected asbestos liabilities, and that costs that might be incurred after that period were not reasonably estimable at that time. In 2012, we reviewed this assumption and determined that it was appropriate to extend the forecast period from 5 years to 10 years. We reached this conclusion due to the fact that we now have considerably more experience in addressing asbestos related lawsuits and have a longer history of activity to use as a baseline to more accurately project the liability over a longer period than previously disclosed. Further, settlement trends have become more meaningful in recent years and we believe that we now have a more meaningful history of data on which to base our projections. Further, we determined that a 10 year projection period is now appropriate as, although we have a longer and more consistent history of data over the last few years, we do not believe we have sufficient data to justify a longer projection period at this time. As of December 31, 2012, the estimated liability and estimated insurance recovery for the ten-year period through 2022 was $51.4 million and $48.3 million, resulting in an additional charge of $2.9 million recognized in the fourth quarter of 2012 ($0.2 million was previously recognized throughout 2012). For sensitivity purposes, if the forecast period was decreased to five years, the projected liability and related insurance recovery would be $30.1 million and $29.2 million, respectively. Also, if the forecast period was increased to fifteen years, the projected liability and related insurance recovery would be $67.9 million and $63.3 million, respectively.Further, we determined that a 10 year projection period is now appropriate as, although we have a longer and more meaningful history of data over the last few years, we do not believe we have sufficient data to justify a longer projection period at this time.
The amounts recorded for the asbestos-related liability and the related insurance receivables described above were based on facts known at the time and a number of assumptions. However, projecting future events, such as the number of new claims to be filed each year, the average cost of disposing of such claims, the length of time it takes to dispose of such claims, coverage issues among insurers and the continuing solvency of various insurance companies, as well as the numerous uncertainties surrounding asbestos litigation in the United States could cause the actual liability and insurance recoveries for us to be higher or lower than those projected or recorded.
There can be no assurance that our accrued asbestos liabilities will approximate our actual asbestos-related settlement and defense costs, or that our accrued insurance recoveries will be realized. We believe that it is reasonably possible that we will incur additional charges for our asbestos liabilities and defense costs in the future, which could exceed existing reserves, but such excess amount cannot be reasonably estimated at this time. We will continue to vigorously defend ourselves and believe we have substantial unutilized insurance coverage to mitigate future costs related to this matter.
Other Environmental and General Litigation
• In the second quarter of 2010, the CT DEEP contacted us to discuss a disposal site in Killingly, Connecticut. We are currently in the very early stages of evaluating this matter and have initiated internal due diligence work related to the site to better understand the issue and our alleged involvement. Currently, we do not know the nature and extent of any alleged contamination at the site, how many parties could be potentially involved in any remediation, if necessary, or the extent to which we could be deemed a potentially responsible party. CT DEEP has not made any assessment of the nature of any potential remediation work that may be done, nor have they made any indication of any potential costs associated with such remediation. Therefore, based on the facts and circumstances known to us at the present time, we are not able to estimate the probability of incurring a contingent liability related to this site, nor are we able to reasonably estimate any potential range of exposure at this time. As such, no reserve has been established for this matter at this time. We continually monitor this situation and are in correspondence with the CT DEEP as appropriate. When and if facts and circumstances related to this mater change, we will review our

85
position and our ability to estimate the probability of any potential loss contingencies, as well as the range of any such potential exposure.
• The Rogers Corporate Headquarters located in Rogers, Connecticut is part of the Connecticut Voluntary Corrective Action Program (VCAP). As part of this program, we have started conversations with the CT DEEP to begin to determine if any corrective actions need to be taken at the site related to any potential contamination issues. We are currently in the very early stages of evaluating this matter and have initiated internal due diligence work related to the site to better understand any potential issues. However, at this time, it is currently unknown what the nature and extent of any potential contamination is at the site, nor what any potential remediation or associated costs would be if any such issues were found. Therefore, based on the facts and circumstances known to us at the present time, we are unable to estimate the probability of incurring a contingent liability related to this site, nor are we able to reasonably estimate any potential range of exposure at this time. As such, no reserve has been established for this matter at this time.
In addition to the above issues, the nature and scope of our business brings us in regular contact with the general public and a variety of businesses and government agencies. Such activities inherently subject us to the possibility of litigation, including environmental and product liability matters that are defended and handled in the ordinary course of business. We have established accruals for matters for which management considers a loss to be probable and reasonably estimable. Environmental remediation costs are recorded in "Selling and administrative expenses" on our consolidated statements of income (loss). It is the opinion of management that facts known at the present time do not indicate that such litigation, after taking into account insurance coverage and the aforementioned accruals, will have a material adverse impact on our results of operations, financial position, or cash flows.
NOTE 15 – BUSINESS SEGMENT AND GEOGRAPHIC INFORMATION
Our reporting structure is comprised of the following operating segments: High Performance Foams, Printed Circuit Materials, Curamik Electronics Solutions and Power Distribution Systems and the Other reportable segment. The “Power Electronics Solutions” core strategic category is comprised of two operating segments – Curamik Electronics Solutions and Power Distribution Systems.
Segment StructureCore Strategic
High Performance FoamsPrinted Circuit MaterialsPower Electronics Solutions
Curamik Electronics SolutionsPower Distribution Systems
Other
Core Strategic
• High Performance Foams: This operating segment consists of polyurethane and silicone foam products, and includes two joint ventures that manufacture products consisting primarily of high performance urethane foams. These foams are designed to perform to predetermined specifications where combinations of properties are needed to satisfy rigorous mechanical and environmental requirements. These materials are sold primarily to fabricators and OEMs on a worldwide basis.
• Printed Circuit Materials: This operating segment includes printed circuit board laminate products for high frequency, high performance applications. These products tend to be proprietary materials that provide highly specialized electrical and mechanical properties to meet the demands of increasing speed, complexity, and power in analog, digital, and microwave equipment. These materials are fabricated, coated and/or customized as necessary to meet customer demands and are sold worldwide.
• Power Electronics Solutions: This reporting category includes Curamik Electronics Solutions and Power Distribution Systems. We now separately report the results of operations for both of these operating segments.

86
• Curamik Electronics Solutions
We acquired Curamik in the first quarter of 2011. Founded in 1983 and headquartered in Eschenbach, Germany, Curamik is a manufacturer of direct copper bonded (DCB) ceramic substrate products used in the design of intelligent power management devices, such as insulated gate bipolar transistor (IGBT) modules. These devices enable a wide range of products including highly efficient industrial motor drives, wind and solar converters and hybrid electric vehicle drive systems. Most of Curamik’s products are manufactured using state-of-the-art automated processes in its facility in Eschenbach.
• Power Distribution Systems
The PDS operating segment manufactures busbar power distribution products in Ghent, Belgium and Suzhou, China, under the RO-LINX POWERCIRCUIT® trade name. We sell these RO-LINX POWERCIRCUIT products to manufacturers of high power electrical inverter and converter systems for use in mass transit (e.g. high speed trains) and clean technology applications (e.g. wind turbines, solar farms and electric vehicles). In the industrial application area, our RO-LINX POWERCIRCUIT® products are utilized in a large variety of variable frequency drives for high to mid power applications.
Other
The Other reportable segment consists of elastomer rollers, floats and inverter distribution activities.
Elastomer components are sold to OEMs for applications in ground transportation, office equipment, consumer and other markets. Trade names for our elastomer components include: NITROPHYL® floats for level sensing in fuel tanks, motors, and storage tanks and ENDUR® elastomer rollers and belts for document handling in copiers, printers, mail sorting machines and automated teller machines.
Our inverters are sold primarily to OEMs and fabricators that in turn sell to various other third parties that primarily serve the portable communication and automotive markets. Prior to 2011, this segment included sales of our electroluminescent lamp products, which came to end of life and are no longer produced.

87
The following table sets forth the information about our reportable segments for the periods indicated:
(Dollars in thousands) HighPerformance
Foams
PrintedCircuit
Materials
CuramikElectronicsSolutions
PowerDistribution
Systems Other Total2012
Net sales $ 179,421 $ 161,893 $ 92,361 $ 41,918 $ 23,168 $ 498,761Operating income (loss) 25,730 8,170 (11,666) (356) 3,786 25,664Total assets 233,401 156,103 262,039 82,974 24,761 759,278Capital expenditures 4,947 12,849 5,170 576 232 23,774Depreciation & amortization 7,947 7,172 8,807 2,276 928 27,130Investment in unconsolidated joint ventures 21,171 — — — — 21,171Equity income (loss) in unconsolidatedjoint ventures 4,743 — — — — 4,743
2011Net sales $ 177,645 $ 166,424 $ 132,891 $ 47,343 $ 24,038 $ 548,341Operating income (loss) 28,280 11,127 7,842 3,478 2,755 53,482Total assets 192,829 123,883 265,346 73,072 21,655 676,785Capital expenditures 5,325 5,901 7,018 2,344 728 21,316Depreciation & amortization 7,873 6,348 9,126 1,863 1,098 26,308Investment in unconsolidated joint ventures 23,868 — — — — 23,868Equity income (loss) in unconsolidated jointventures 5,451 — — — — 5,451
2010Net sales $ 149,671 $ 141,055 $ — $ 42,059 $ 40,445 $ 373,230Operating income (loss) 17,378 10,951 — 2,873 373 31,575Total assets 217,335 140,667 — 80,894 43,702 482,598Capital expenditures 3,679 5,825 — 1,605 1,132 12,241Depreciation & amortization 6,705 2,793 — 5,301 901 15,700Investment in unconsolidated joint ventures 25,452 — — — — 25,452Equity income (loss) in unconsolidated jointventures 7,746 — — — 912 8,658
Inter-segment sales have been eliminated from the sales data in the preceding table.
The following table sets forth the operating income (loss) reconciliation to the consolidated statements of income (loss) for the periods indicated:
2012 2011 2010Operating income (loss) $ 25,664 $ 53,482 $ 31,575
Equity income in unconsolidated joint ventures 4,743 5,451 8,658Other income (expense), net (208) 1,942 1,364Net realized investment gain (loss) (3,245) (196) (553)Interest income (expense), net (4,304) (4,911) 184Gain on acquisition or disposal — — 3,173Income (loss) before income tax expense (benefit) $ 22,650 $ 55,768 $ 44,401

88
Information relating to our operations by geographic area is as follows:
Net Sales (1) Long-lived Assets (2)(Dollars in thousands) 2012 2011 2010 2012 2011
United States $ 115,035 $ 109,581 $ 108,330 $ 64,845 $ 65,432Asia 250,682 271,132 179,456 69,830 64,181Europe 123,040 154,423 71,255 172,671 177,196Other 10,004 13,205 14,189 — —Total $ 498,761 $ 548,341 $ 373,230 $ 307,346 $ 306,809
(1) Net sales are allocated to countries based on the location of the customer.(2) Long-lived assets are based on the location of the asset and are comprised of goodwill and other intangibles and property, plant and equipment.
NOTE 16 – RESTRUCTURING AND IMPAIRMENT CHARGES
In 2012, we began several initiatives to streamline our organization and rationalize our cost structure in order to better position the Company for profitable growth in the future. The goal of these initiatives is to become a more streamlined organization both from an organizational and cost perspective, with efficient manufacturing capabilities that are focused on meeting our customers' needs.
During 2012, we recorded approximately $15.9 million in restructuring and impairment charges (of which $1.8 million was recorded in “Cost of Sales” and $14.1 million was recorded in “Restructuring and impairment expense” on our consolidated statement of income (loss)). These charges were comprised of the following:
• $7.1 million severance and related costs associated with streamlining initiatives, including an early retirement program for certain eligible individuals. As a result of the early retirement program, we incurred $1.6 million in charges in 2012 related to a special termination benefit associated with the retirement health and life insurance benefits program, as we extended eligibility benefits to certain individuals who chose to participate in the program. We incurred $5.5 million of severance charges related primarily to the early retirement program.
• $3.8 million severance and related costs associated with moving the Curamik inspection process from Germany to Hungary; • $3.3 million related to the shut-down of the High Performance Foams manufacturing facility in Bremen, Germany. This
charge includes approximately $1.4 million of shut-down related costs, $0.9 million of severance charges, $0.8 million of accelerated depreciation on certain assets, and $0.2 million of inventory related charges;
• $0.5 million of charges related to the shut-down of Power Distribution Systems startup operations in North America for accelerated depreciation on certain assets, along with $0.1 million of other costs associated with the shut-down;
• Other charges included, $0.4 million of accelerated depreciation of certain assets of Curamik, $0.3 million impairment charge relate to an investment related receivable, and a $0.4 million impairment charge on a license agreement.
High Performance Foams
In the second quarter of 2012, we announced the shut-down of the High Performance Foams manufacturing facility in Bremen, Germany (to be completed in the first quarter of 2013). The manufacture of certain silicone foam materials produced in the Bremen facility was consolidated into our existing silicone foam manufacturing facility in Carol Stream, Illinois, while certain product lines were discontinued. Charges related to the shut-down of the facility include the following: $0.9 million of severance charges related to the termination of certain employees, $0.8 million of accelerated depreciation expense on certain assets that were no longer to be used in production, $0.2 million of inventory related charges and $0.1 million related to a fixed asset disposal. We also incurred an additional $1.4 million in costs related to the shut-down of the facility and other costs to remove and transport certain equipment to Carol Stream.
The HPF operating segment also recognized $2.2 million in allocated severance and related costs associated with the streamlining initiatives and early retirement program.
Printed Circuit Materials
The PCM operating segment recognized $2.9 million in allocated severance and related costs associated with the streamlining initiatives and early retirement program.

89
Curamik Electronics Solutions
In the third quarter of 2012, we announced a plan to move the final inspection stage of the manufacturing operations of the Curamik Electronics Solutions operating segment from its manufacturing site in Eschenbach, Germany to Hungary. The move is expected to enable more cost effective performance of the inspection operation and is expected to be complete in 2013. We recognized approximately $3.8 million in severance charges related to the separation from employment of certain employees at Curamik's facility in Germany. We also recorded $0.4 million of accelerated depreciation related to certain assets.
The CES operating segment also recognized $1.4 million in allocated severance and related costs associated with the streamlining initiatives and early retirement program.
Power Distribution Systems
We incurred $0.5 million in accelerated depreciation associated with the shut-down of the Power Distribution Systems startup operation in North America, along with $0.1 million of other costs associated with the shut-down. We also incurred $0.3 million in expense related to the impairment of an investment receivable.
The PDS operating segment recognized $0.0 million in allocated severance and related costs associated with the streamlining activities and early retirement program.
Other
We incurred a charge of $0.4 million related to the write off of a license agreement formerly associated with the discontinued Thermal Management Solutions operating segment.
We also recognized $0.3 million in allocated severance and related costs associated with the streamlining activities and early retirement program.

90
The following table summarizes the restructuring and impairment charges related to these activities recorded in our operating results in 2012.
(Dollars in thousands)December 31,
2012December 31,
2011December 31,
2010Cost of Sales
High Performance Foams Accelerated depreciation expense related to Bremen shut-down $ 764 $ — $ —Inventory impairment related to Bremen shut-down 191 — —
Curamik Electronics Solutions Accelerated depreciation related to certain assets 393 — —Power Distribution Systems
Accelerated depreciation expense related to U.S. shut-down 499 — —Total charges for Cost of Sales $ 1,847 $ — $ —
Restructuring and Impairment
High Performance Foams Fixed asset disposal (1) $ 79 $ 441 $ —Severance related to Bremen shut-down 861 — —Bremen shut down-costs 1,442 — —Allocated severance and related costs 2,188 — —
Printed Circuit Materials Allocated severance and related costs 2,915 — —
Curamik Electronics Solutions Severance related to Hungary relocation 3,774 — —Allocated severance and related costs 1,376 — —
Power Distribution Systems Impairment of investment related receivable 264 — —PDS North America shut-down costs 149 — —Allocated severance and related costs 423 — —
Other License agreement expense 356 — —Allocated severance and related costs 255 — —
Total charges for Restructuring and Impairment $ 14,082 $ 441 $ —
(1) In the first quarter of 2012, we signed an agreement to sell our facility in Richmond, Virginia for $1.5 million. This facility had a book value of approximately $1.8 million prior to the signing of the agreement, and we recorded an impairment charge of approximately $0.4 million as of December 31, 2011, which represents the write down to the selling price less approximately $0.1 million of estimated selling costs. The transaction closed in the second quarter of 2012.

91
The following table summarizes charges in the severance accrual from January 1, 2012 through December 31, 2012:
(Dollars in thousands) Streamlining and restructuring related
activitiesBremen facility shut
down
Curamik finishing operations relocation
to Hungary TotalBalance at January 1, 2012 $ — $ — $ — $ —Provisions 5,445 861 3,774 10,080Payments (3,998) (861) — (4,859)Balance at December 31, 2012 $ 1,447 $ — $ 3,774 $ 5,221
NOTE 17 – DISCONTINUED OPERATIONS
In the fourth quarter of 2011, we made the strategic decision to end the operations of our TMS operating segment. We had invested in its operations for the last few years, but had difficulty gaining traction in the market and working through issues in the manufacturing process. Therefore, we determined that we would not achieve future success in this operation and chose to shut down operations rather than invest further. For the years ended December 31, 2012, 2011 and 2010, operating losses of $0.1 million, $6.8 million and $3.8 million, net of tax, respectively, were reflected as discontinued operations in the accompanying consolidated statements of income (loss). Net sales associated with the discontinued operations for the years ended December 31, 2012, 2011 and 2010 were $0.1 million, $0.9 million and $1.0 million, respectively. The tax related to the discontinued operations was immaterial for 2012 and was $0.1 million and $0.1 million of tax expense for December 31, 2011 and 2010, respectively.
In the second quarter of 2012, we decided to cease production of our non-woven composite materials operating segment located in Rogers, Connecticut in an effort to redeploy resources to focus more on our Core Strategic operations. Sales of non-woven products have been steadily declining for several years and totaled approximately $5.3 million for the year ended December 31, 2012 and $4.8 million for the year ended December 31, 2011 and $5.0 million for the year ended December 31, 2010. Manufacturing operations were complete by the end of 2012 and last sales out of inventory are expected to end in the first quarter of 2013. For the year ended December 31, 2012, operating loss of $0.1 million and for the year ended December 31, 2011 and 2010, operating losses of $0.4 million and $0.2 million, net of tax, respectively, were reflected as discontinued operations in the accompanying consolidated statements of income (loss). The tax related to the discontinued operations was $0.1 million , $0.2 million and $0.1 million of tax expense for December 31, 2012, 2011 and 2010, respectively.
NOTE 18 - QUARTERLY RESULTS OF OPERATIONS
(Dollars in thousands, except per share amounts) 2012First
QuarterSecondQuarter
ThirdQuarter
FourthQuarter
Net sales $ 120,155 $ 125,296 $ 129,134 $ 124,176Gross Margin 36,404 36,654 42,977 42,711Income (loss) from continuing operations (1,586) 6,417 59,124 5,179
Net income per share: Basic $ (0.10) $ 0.40 $ 3.60 $ 0.31 Diluted (0.10) 0.39 3.48 0.30
(Dollars in thousands, except per share amounts) 2011First
QuarterSecondQuarter
ThirdQuarter
FourthQuarter
Net sales $ 134,628 $ 142,167 $ 146,295 $ 125,251Gross Margin 42,453 48,452 50,906 37,174Income (loss) from continuing operations 11,118 13,488 15,904 3,740
Net income per share: Basic $ 0.70 $ 0.85 $ 0.98 $ 0.23 Diluted 0.67 0.81 0.94 0.22

92
NOTE 19 - RECENT ACCOUNTING STANDARDSIntangibles - Goodwill and OtherIn July 2012, the FASB issued ASU No. 2012-02 , Intangibles - Goodwill and Other (ASC Topic 350) Testing Indefinite-Lived Intangible Assets for Impairment (ASU No. 2012-02). ASU No. 2012-02 permits an entity to first assess qualitative factors to determine whether it is more likely than not that an indefinite-lived intangible asset is impaired as a basis for determining whether it is necessary to perform the quantitative impairment test in accordance with Subtopic 350-30, Intangibles-Goodwill and Other-General Intangibles Other than Goodwill. ASU No. 2012-02 is effective for fiscal years that begin after September 15, 2012, however early adoption is permitted. The adoption of this standard did not materially impact our financial condition or results of operations.
Balance SheetIn December 2011, the FASB issued ASU No. 2011-11, Disclosures about Offsetting Assets and Liabilities (ASU No. 2011-11). ASU No. 2011-11 amended ASC 210, Balance Sheet, to converge the presentation of offsetting assets and liabilities between U.S. Generally Accepted Accounting Principles (GAAP) and International Financial Reporting Standards (IFRS). ASU No. 2011-11 requires that entities disclose both gross information and net information about both instruments and transactions eligible for offset in the statement of financial position and instruments and transactions subject to an agreement similar to a master netting arrangement. ASU No. 2011-11 is effective for fiscal years, and interim periods within those years, beginning after January 1, 2013. The adoption of ASU No. 2011-11 will require additional disclosures related to offsetting assets and liabilities but will not materially impact our financial condition or results of operations.
Comprehensive IncomeIn June 2011, the FASB issued ASU No. 2011-05, Presentation of Comprehensive Income (ASU No. 2011-05). ASU No. 2011-05 amended ASC 220, Comprehensive Income, to converge the presentation of comprehensive income between U.S. GAAP and IFRS. ASU No. 2011-05 requires that all non-owner changes in stockholders' equity be presented in either a single continuous statement of comprehensive income or in two separate but consecutive statements and requires reclassification adjustments for items that are reclassified from other comprehensive income to net income in the statements where the components of net income and the components of other comprehensive income are presented. ASU No. 2011-05 eliminates the option to present the components of other comprehensive income as part of the statement in changes of stockholders' equity. ASU No. 2011-05 is effective for fiscal years, and interim periods within those years, beginning after December 15, 2011, which is the Company's fiscal year 2012. Subsequently, in December 2011, the FASB issued ASU No. 2011-12, Deferral of the Effective Date for Amendments to the Presentation of Reclassifications of Items Out of Accumulated Other Comprehensive Income in Accounting Standards Update No. 2011-05 (ASU No. 2011-12), which defers only those changes in ASU No. 2011-05 that relate to the presentation of reclassification adjustments but does not affect all other requirements in ASU No. 2011-05. The adoption of ASU No. 2011-05 and ASU No. 2011-12 affects the presentation of comprehensive income but did not impact our financial condition or results of operations.
NOTE 20 - SUBSEQUENT EVENTS
There were no events subsequent to December 31, 2012 that we believe could have a material effect on our financial statements as of December 31, 2012, or are of such significance that would require mention as a subsequent event in order to make the financial statements not misleading.

93
SCHEDULE II
Valuation and Qualifying Accounts
Allowance for Doubtful Accounts(Dollars in thousands)
Balance atBeginning of
Period
Charged to(Reduction of)
Costs andExpenses
Taken AgainstAllowance
Other(Deductions)Recoveries
Balance at Endof Period
December 31, 2012 $ 1,040 $ 1,253 $ (520) $ — $ 1,773December 31, 2011 1,630 680 (1,270) — 1,040December 31, 2010 4,867 (66) (3,355) 184 1,630

94
Item 9. Changes in and Disagreements with Accountants on Accounting and Financial Disclosure
None.
Item 9A. Controls and Procedures
EVALUATION OF DISCLOSURE CONTROLS AND PROCEDURES
The Company, with the participation of our Chief Executive Officer and Chief Financial Officer, conducted an evaluation of the design and operation of our disclosure controls and procedures, as defined in Rule 13a-15(e) under the Securities Exchange Act of 1934, as amended (the 'Exchange Act”), as of December 31, 2012. The Company's disclosure controls and procedures are designed (i) to ensure that information required to be disclosed by it in the reports that it files or submits under the Exchange Act is recorded, processed, summarized and reported within the time periods specified in the SEC's rules and forms and (ii) to ensure that information required to be disclosed in the reports the Company files or submits under the Exchange Act is accumulated and communicated to its management, including its Chief Executive Officer and Chief Financial Officer, as appropriate to allow timely decisions regarding required disclosure. Based on their evaluation, our Chief Executive Officer and Chief Financial Officer have concluded that the Company's disclosure controls and procedures were effective as of December 31, 2012.
MANAGEMENT'S REPORT ON INTERNAL CONTROL OVER FINANCIAL REPORTING
The management of the Company is responsible for establishing and maintaining adequate internal control over financial reporting as defined in Exchange Act Rule 13a-15(f). The Company's internal control system was designed to provide reasonable assurance to the Company's management, Board of Directors and shareholders regarding the preparation and fair presentation of the Company's published financial statements in accordance with generally accepted accounting principles. Our internal control over financial reporting includes those policies and procedures that:
- pertain to the maintenance of records that, in reasonable detail, accurately and fairly reflect the transactions and dispositions of our assets;
- provide reasonable assurance that transactions are recorded as necessary to permit preparation of financial statements in accordance with generally accepted accounting principles, and that receipts and expenditures are being made only in accordance with authorizations of our management and directors; and
- provide reasonable assurance regarding prevention or timely detection of unauthorized acquisition, use or disposition of our assets that could have a material effect on the financial statements.
All internal control systems, no matter how well designed, have inherent limitations. Therefore, even those systems determined to be effective can provide only reasonable assurance with respect to financial statement preparation and presentation.
Management assessed the effectiveness of the Company's internal control over financial reporting as of December 31, 2012. In making its assessment of internal control over financial reporting, management used the criteria issued by the Committee of Sponsoring Organizations of the Treadway Commission (COSO) in Internal Control-Integrated Framework. Based on the results of this assessment, management, including our Chief Executive Officer and our Chief Financial Officer, has concluded that, as of December 31, 2012, our internal control over financial reporting was effective.
The Company's independent registered public accounting firm, Ernst & Young LLP, has also issued an audit report on the Company's internal control over financial reporting, which report appears herein below.
CHANGES IN INTERNAL CONTROL OVER FINANCIAL REPORTING
There were no changes in the Company's internal control over financial reporting during the fourth quarter of the fiscal year ended December 31, 2012 that have materially affected or are reasonably likely to materially affect its internal control over financial reporting, as defined in Rule 13a-15(f) under the Exchange Act.

95
REPORT OF INDEPENDENT REGISTERED PUBLIC ACCOUNTING FIRM
The Board of Directors and Shareholders of Rogers Corporation
We have audited Rogers Corporation's internal control over financial reporting as of December 31, 2012, based on criteria established in Internal Control-Integrated Framework issued by the Committee of Sponsoring Organizations of the Treadway Commission (the COSO criteria). Rogers Corporation's management is responsible for maintaining effective internal control over financial reporting, and for its assessment of the effectiveness of internal control over financial reporting included in the accompanying management's report on internal control over financial reporting. Our responsibility is to express an opinion on the Company's internal control over financial reporting based on our audit.
We conducted our audit in accordance with the standards of the Public Company Accounting Oversight Board (United States). Those standards require that we plan and perform the audit to obtain reasonable assurance about whether effective internal control over financial reporting was maintained in all material respects. Our audit included obtaining an understanding of internal control over financial reporting, assessing the risk that a material weakness exists, testing and evaluating the design and operating effectiveness of internal control based on the assessed risk, and performing such other procedures as we considered necessary in the circumstances. We believe that our audit provides a reasonable basis for our opinion.
A company's internal control over financial reporting is a process designed to provide reasonable assurance regarding the reliability of financial reporting and the preparation of financial statements for external purposes in accordance with generally accepted accounting principles. A company's internal control over financial reporting includes those policies and procedures that (1) pertain to the maintenance of records that, in reasonable detail, accurately and fairly reflect the transactions and dispositions of the assets of the company; (2) provide reasonable assurance that transactions are recorded as necessary to permit preparation of financial statements in accordance with generally accepted accounting principles, and that receipts and expenditures of the company are being made only in accordance with authorizations of management and directors of the company; and (3) provide reasonable assurance regarding prevention or timely detection of unauthorized acquisition, use, or disposition of the company's assets that could have a material effect on the financial statements.
Because of its inherent limitations, internal control over financial reporting may not prevent or detect misstatements. Also, projections of any evaluation of effectiveness to future periods are subject to the risk that controls may become inadequate because of changes in conditions, or that the degree of compliance with the policies or procedures may deteriorate.
In our opinion, Rogers Corporation maintained, in all material respects, effective internal control over financial reporting as of December 31, 2012, based on the COSO criteria.
We also have audited, in accordance with the standards of the Public Company Accounting Oversight Board (United States), the consolidated statements of financial position of Rogers Corporation as of December 31, 2012 and 2011, and the related consolidated statements of income (loss), shareholders' equity, comprehensive income (loss) and cash flows for each of the three years in the period ended December 31, 2012 of Rogers Corporation and our report dated February 20, 2013 expressed an unqualified opinion thereon.
/s/ Ernst & Young LLP
Providence, Rhode IslandFebruary 20, 2013

96
Item 9B. Other Information
None.
Part III
Item 10. Directors, Executive Officers and Corporate Governance
Pursuant to General Instruction G to Form 10-K, there is hereby incorporated by this reference the information with respect to the Directors, Executive Officers and Corporate Governance set forth under the captions “Nominees for Director”, “Director Qualifications and Experience”, “Section 16(a) Beneficial Ownership Reporting Compliance” and “Board of Directors - Meetings of Certain Committees” in our Definitive Proxy Statement for our 2013 Annual Meeting of Shareholders that will be filed within 120 days after the end of our fiscal year pursuant to Section 14(a) of the Exchange Act. Information with respect to Executive Officers of the Company is presented in Part I, Item 1 of this report and is hereby incorporated into this Item 10 by reference.
Code of Ethics
We have adopted a code of business conduct and ethics, which applies to all employees, officers and directors of Rogers. The code of business conduct and ethics is posted on our website at http://www.rogerscorp.com. We intend to satisfy the disclosure requirements regarding any amendment to, or waiver of, a provision of the code of business conduct and ethics for the Chief Executive Officer, Principal Financial Officer and Principal Accounting Officer (or others performing similar functions) by posting such information on our website. Our website is not incorporated into or a part of this Form 10-K.
Item 11. Executive Compensation
Pursuant to General Instruction G to Form 10-K, there is hereby incorporated by this reference the information with respect to Executive Compensation set forth under the captions “Board of Directors - Directors' Compensation”, “Board of Directors - Meetings of Certain Committees”, “Compensation Discussion and Analysis”, “Compensation and Organization Committee Report” and "Executive Compensation" in our Definitive Proxy Statement for our 2013 Annual Meeting of Shareholders that will be filed within 120 days after the end of our fiscal year pursuant to Section 14(a) of the Exchange Act.
Item 12. Security Ownership of Certain Beneficial Owners and Management and Related Stockholder Matters
EQUITY COMPENSATION PLAN INFORMATION
The table and footnotes below describe those equity compensation plans approved and not approved by security holders of Rogers Corporation as of December 31, 2012, the end of the Company's fiscal year.

97
EQUITY COMPENSATION PLANS AS OF DECEMBER 31, 2012
(a) (b) (c)
Plan Category
Number ofsecurities to be
issued uponexercise ofoutstanding
options, warrantsand rights (5)
Weighted averageexercise price of
outstandingoptions, warrants
and rights (5)
Number ofsecuritiesremaining
available forfuture issuance
under each equitycompensationplan excluding
securitiesreferenced in
column (a) (6)
Equity Compensation Plans Approved by Security HoldersRogers Corporation 1988 Stock Option Plan 32,457 $54.33 —Rogers Corporation 1994 Stock Compensation Plan 12,042 53.75 —Rogers Corporation 1998 Stock Incentive Plan 168,801 41.65 —Rogers Corporation 2005 Equity Compensation Plan 631,924 43.28 —Rogers Corporation 2009 Long-Term Equity Compensation Plan 518,738 29.93 659,292Rogers Corporation Global Stock Ownership Plan For Employees (1) — — 201,676
Equity Compensation Plans Not Approved by Security HoldersRogers Corporation 1990 Stock Option Plan (2) 380,910 48.16 —Rogers Corporation Stock Acquisition Program (3) — — 120,883Inducement Awards for the CEO when he joined Rogers (4) 23,200 37.05 —Total (5) 1,768,072 $40.45 981,851
(1) This is an employee stock purchase plan within the meaning of Section 432(b) of the Internal Revenue Code of 1986, as amended.
(2) The Rogers Corporation 1990 Stock Option Plan was adopted in 1990 to award certain key employees of Rogers with stock option grants. Under this plan, options generally have an exercise price equal to at least the fair market value of Rogers' stock as of the date of grant. Regular options generally have a ten-year life and generally vest in one-third increments on the second, third and fourth anniversary dates of the grant, except for the grants made to most employees in 2004 and 2005. Such 2004 and 2005 stock options were immediately vested upon grant, but any shares acquired upon option exercise during the first four years after the grant date could not be sold during the four year period if the individual was still actively employed at Rogers. Termination of employment because of retirement, or for certain other reasons, may shorten the vesting schedule, the expiration date or eliminate the aforementioned sales restriction.
(3) The purpose of the Stock Acquisition Program is to enable non-management directors and executive officers to acquire shares of Rogers' common stock in lieu of cash compensation at the then current fair market value of such common stock.
(4) Bruce D. Hoechner was granted three equity awards when he joined Rogers Corporation as its new President and Chief Executive Officer in October of 2011. This consisted of two time-based restricted stock unit awards with different vesting schedules and the non-qualified stock option, shown in the table above. The Board of Directors (including a majority of its independent directors) approved these equity inducement awards in reliance on an employment inducement exception to shareholder approval provided for in the New York Stock Exchange governance rules.
(5) Does not include deferred stock units, restricted stock or phantom stock units. As of 12/31/2012, 30,150 shares were reserved for deferred stock unit awards, 257,214 shares were reserved for restricted stock awards and 18,940 shares were reserved for phantom stock units related to the deferral of compensation ultimately to be paid in Rogers stock.
(6) On May 7, 2009, shareholders approved the Rogers Corporation 2009 Long-Term Equity Compensation Plan and as of that date no further equity awards will be made pursuant to the provisions of the Rogers Corporation (i)1988 Stock Option Plan, (ii) 1994 Stock Compensation Plan, (iii) 1998 Stock Incentive Plan, (iv) 2005 Equity Compensation Plan and (v) 1990 Stock Option Plan. For this reason a zero (i.e. a dash) appears in the applicable rows of this column. The number for the 2009 Long-Term Equity Compensation Plan has been reduced by shares reserved for restricted stock awards and deferred stock units.

98
Pursuant to General Instruction G to Form 10-K, there is hereby incorporated by this reference the information with respect to Security Ownership of Certain Beneficial Owners and Management and Related Stockholder Matters set forth under the captions “Stock Ownership of Management” and “Beneficial Ownership of More Than Five Percent of Rogers Stock” in our Definitive Proxy Statement for our 2013 Annual Meeting of Shareholders that will be filed within 120 days after the end of our fiscal year pursuant to Section 14(a) of the Exchange Act.
Item 13. Certain Relationships and Related Transactions, and Director Independence
Pursuant to General Instruction G to Form 10-K, there is hereby incorporated by this reference the information with respect to Certain Relationships and Related Transactions and Director Independence as set forth under the captions “Related Party Transactions” and “Board of Directors-Director Independence” in our Definitive Proxy Statement for our 2012 Annual Meeting of Shareholders that will be filed within 120 days after the end of our fiscal year pursuant to Section 14(a) of the Exchange Act.
Item 14. Principal Accountant Fees and Services
Pursuant to General Instruction G to Form 10-K, there is hereby incorporated by this reference the information with respect to Accountant Fees and Services set forth under the caption “Fees of Independent Registered Public Accounting Firm” in our Definitive Proxy Statement for our 2012 Annual Meeting of Shareholders that will be filed within 120 days after the end of our fiscal year pursuant to Section 14(a) of the Exchange Act.
Part IV
Item 15. Exhibits, Financial Statement Schedules (a)
(1) and (2) Financial Statements and Schedules - See Item 8.
The following consolidated financial statements of the Company are included in Item 8 of this Form 10-K:
Report of Independent Registered Public Accounting FirmConsolidated Statements of Financial PositionConsolidated Statements of Income (Loss)Consolidated Statements of Shareholders' EquityConsolidated Statements of Comprehensive Income (Loss)Consolidated Statements of Cash FlowsNotes to Consolidated Financial Statements
Schedule II- Valuation and Qualifying Accounts
(2) Financial Statement Schedules.
Other than as set forth above, schedules are omitted because they are not applicable, or are not required, or because the information is included in the consolidated financial statements and notes thereto.
(3) Exhibits.
The following list of exhibits includes exhibits submitted with this Form 10-K as filed with the SEC and those incorporated by reference to other filings.
2.1 Asset Purchase Agreement, dated as of March 23, 2009, by and among the Registrant, MTI Global Inc., MTI Specialty Silicones Inc., and MTI Leewood Germany GmbH, filed as Exhibit 2.1 to the Registrant's Form 10-Q filed on May 5, 2009*+.

99
2.1.1 Amendment to Asset Purchase Agreement, dated as of April 30, 2009, by and among the Registrant, MTI Global Inc. and its wholly-owned subsidiaries, MTI Specialty Silicones Inc., and MTI Leewood Germany GmbH, filed as Exhibit 2.1 to the Registrant's Quarterly Report on Form 10-Q filed on August 4, 2009*+.
2.2 Acquisition Agreement, dated as of March 23, 2010, by and among the Registrant, SK Chemicals Co., Ltd. and SK Utis Co., Ltd., filed as Exhibit 10.1 to the Registrant's Quarterly Report on Form 10-Q filed on May 4, 2010*.
2.3 Share Purchase and Transfer Agreement, dated December 31, 2010, among the Registrant, Electrovac Curamik GmbH, Curamik Electronics GmbH, and DZ Equity Partner GmbH, filed as Exhibit 2.1 to the Registrant's Current Report on Form 8-K filed on January 10, 2011*.
3.1 Restated Articles of Organization of Rogers Corporation, as amended, filed as Exhibit 3a to the Registrant's Annual Report on Form 10-K for the fiscal year ended December 31, 2006 (the 2006 Form 10-K)*.
3.2 Amended and Restated Bylaws of Rogers Corporation, effective October 2, 2008, filed as Exhibit 3.2 to the Registrant's Current Report on Form 8-K filed on October 7, 2008*.
4.1 Shareholder Rights Agreement, dated as of February 22, 2007, between the Registrant and Registrar and Transfer Company, as Rights Agent, filed as Exhibit 4.1 to the Registrant's registration statement on form 8-A filed on February 23, 2007*.
10.1 Rogers Corporation Annual Incentive Compensation Plan (as amended)**, filed as Exhibit II to the Registrant's Definitive Proxy Statement filed on March 20, 2009*. Second Amendment to Rogers Corporation Annual Incentive Compensation Plan, filed as Exhibit 10.2 to the Registrant's Current Report on Form 8-K filed on February 17, 2010*. Third Amendment to Rogers Corporation Annual Incentive Compensation Plan, filed as Exhibit 10.1 to the Registrant's Current Report on Form 8-K filed on February 14, 2011*. Fourth Amendment to Rogers Corporation Annual Incentive Compensation Plan, filed as Exhibit 10.1 to the Registrant's Current Report on Form 8-K filed on May 18, 2011*.
10.2 Rogers Corporation 1988 Stock Option Plan, as restated September 14, 1989 (the 1988 Plan)** (as amended October 23, 1996, April 18, 2000, June 21, 2001, August 22, 2002, December 5, 2002 and October 27, 2006). The 1988 Plan was filed as Exhibit 10d to the Registrant's Annual Report on Form 10-K for the fiscal year ended January 1, 1995 (the 1994 Form 10-K)*. The October 23, 1996 amendment was filed as Exhibit 10d to the Registrant's Annual Report on Form 10-K for the fiscal year ended December 29, 1996 (the 1996 Form 10-K)*. The April 18, 2000, June 21, 2001, August 22, 2002 and December 5, 2002 amendments were filed as Exhibit 10d to the Registrant's Annual Report on Form 10-K for the fiscal year ended December 28, 2003 (the 2003 Form 10-K)*. The October 27, 2006 amendment was filed as Exhibit 10aab to the 2006 Form 10-K*.
10.3 The Restated Rogers Corporation 1990 Stock Option Plan (the 1990 Plan)** (as amended December 21, 1999, April 18, 2000, June 21, 2001, August 22, 2002, October 7, 2002, December 5, 2002 and October 27, 2006) was filed as Exhibit 99.1 to Registration Statement on Form S-8 (No. 333-14419) dated October 18, 1996*. The December 21, 1999 amendment was filed as Exhibit 10e to the Registrant's Annual Report on Form 10-K for the fiscal year ended January 2, 2000 (the 1999 Form 10-K)*. The October 7, 2002 amendment was filed as Exhibit 10e to the Registrant's Annual Report on Form 10-K for the fiscal year ended December 29, 2002 (the 2002 Form 10-K)*. The April 18, 2000, June 21, 2001, August 22, 2002 and December 5, 2002 amendments were filed as Exhibit 10e to the Registrant's 2003 Form 10-K*. The October 27, 2006 amendment was filed as Exhibit 10aab to the 2006 Form 10-K*.
10.4 The Amended and Restated Rogers Corporation Voluntary Deferred Compensation Plan for Non-Management Directors**, filed as Exhibit 10i to the Registrant's Quarterly Report on Form 10-Q filed November 8, 2007*. First Amendment to the Amended and Restated Rogers Corporation Voluntary Deferred Compensation Plan for Non-Management Directors, filed as Exhibit 10.5 to the Registrant's Quarterly Report on Form 10-Q filed November 3, 2009*. Second Amendment to the Amended and Restated Rogers Corporation Voluntary Deferred Compensation Plan for Non-Management Directors, filed as Exhibit 10.5 to the Registrant's Annual Report on Form 10-K for the fiscal year ended December 31, 2010 (the 2010 Form 10-K)*.
10.5 The Amended and Restated Rogers Corporation Voluntary Deferred Compensation Plan for Key Employees**, filed as Exhibit 10j to the Registrant's Quarterly Report on Form 10-Q filed November 8, 2007*. First Amendment to the Amended and Restated Rogers Corporation Voluntary Deferred Compensation Plan for Key Employees, filed as Exhibit 10j to the Registrant's Quarterly Report on Form 10-Q filed August 7, 2008*. Second Amendment to the Amended and Restated Rogers Corporation Voluntary Deferred Compensation Plan for Key Employees, filed as Exhibit 10.6 to the Registrant's Quarterly Report on Form 10-Q filed November 3, 2009*. Third Amendment to the Amended and Restated Rogers Corporation Voluntary Deferred Compensation Plan for Key Employees, filed as Exhibit 10.4 to the Registrant's Current
100
Report on Form 8-K filed February 17, 2010*. Fourth Amendment to the Amended and Restated Rogers Corporation Voluntary Deferred Compensation Plan for Key Employees, filed as Exhibit 10.6 to the 2010 Form 10-K*.
10.6 Rogers Corporation 1998 Stock Incentive Plan (the 1998 Plan)** (as amended September 9, 1999, December 21, 1999, April 18, 2000, June 21, 2001, October 10, 2001, August 22, 2002, November 7, 2002, December 5, 2002, February 19, 2004, and October 27, 2006). The 1998 Plan was filed as Exhibit A to the Definitive Proxy Statement dated March 17, 1998*. The September 9, 1999 and December 21, 1999 amendments were filed as Exhibit 10l to the 1999 Form 10-K*. The October 10, 2001 and November 7, 2002 amendments were filed as Exhibit 10l to the 2002 Form 10-K*. The April 18, 2000, June 21, 2001, August 22, 2002, December 5, 2002 and February 19, 2004 amendments were filed as Exhibit 10l to the 2003 Form 10-K*. The April 28, 2005 amendment was filed as Exhibit 10.8 to the Registrant's Current Report on Form 8-K filed on May 2, 2005*. The October 27, 2006 amendment was filed as Exhibit 10aab to the 2006 Form 10-K*.
10.7 Rogers Corporation Amended and Restated Pension Restoration Plan**, filed as Exhibit 10.1 to the Registrant's Current Report on Form 8-K filed December 17, 2008*. First Amendment to the Rogers Corporation Amended and Restated Pension Restoration Plan, filed as Exhibit 10.4 to the Registrant's Quarterly Report on Form 10-Q filed November 3, 2009*. Second Amendment to the Rogers Corporation Amended and Restated Pension Restoration Plan, filed as Exhibit 10.10 to the 2010 Form 10-K*.
10.8 Form of 1991 Special Severance Agreement**, filed as Exhibit 10s to the Registrant's Annual Report on Form 10-K for the fiscal year ended January 2, 2005 (the 2004 Form 10-K)*.
10.9 Form of Indemnification Agreement between the Registrant and each of its executive officers**, filed as Exhibit 99.2 to the Registrant's Current Report on Form 8-K on December 14, 2004*.
10.10 Form of Indemnification Agreement between the Registrant and each of its Directors**, filed as Exhibit 99.1 to the Registrant's Current Report on Form 8-K on December 14, 2004*.
10.11 Change in Control Severance Agreement**, dated March 3, 2004, by and between the Registrant and Robert C. Daigle, filed as Exhibit 10y to the 2004 Form 10-K*.
10.12 Amended and Restated Officer Special Severance Agreement between the Registrant and Dennis M. Loughran**, filed as Exhibit 10.2 to the Registrant's Current Report on Form 8-K filed on December 23, 2008*.
10.13 Amended and Restated Officer Special Severance Agreement with Robert D. Wachob**, filed as Exhibit 10.1 to the Registrant's Current Report on Form 8-K filed on December 23, 2008*.
10.14 Officer Special Severance Agreement between the Registrant and Jeffrey M. Grudzien**, dated December 17, 2008, filed herewith.
10.15 Rogers Compensation Recovery Policy**, filed as Exhibit 10.1 to the Registrant's Current Report on Form 8-K filed October 19, 2009*.
10.16 Amended Rogers Corporation 2009 Long-Term Equity Compensation Plan**, filed as Exhibit 10.1 to the Registrant's Registration Statement on Form S-8 (File No. 333-181199) filed May 7, 2012*.
10.17 Form of Performance-Based Restricted Stock Award Agreement under the 2009 Plan**, filed as Exhibit 10.4 to the Registrant's Quarterly Report on Form 10-Q filed August 2, 2011*.
10.18 Form of Performance-Based Restricted Stock Award Agreement under the 2009 Plan**, filed as Exhibit 10.2 to the Registrant's Quarterly Report on Form 10-Q filed May 2, 2012*.
10.19 Form of Basic Time-Based Restricted Stock Unit Award Agreement under the 2009 Plan**, filed as Exhibit 10.3 to the Registrant's Quarterly Report on Form 10-Q filed August 2, 2011*.
10.20 Form of Non-Qualified Stock Option Agreement (For Officers and Employees) under the 2009 Plan**, filed as Exhibit 10.6 to the Registrant's Quarterly Report on Form 10-Q filed August 4, 2009*.
10.21 Form of Non-Qualified Stock Option Agreement (For Officers and Employees) under the 2009 Plan**, filed as Exhibit 10.1 to the Registrant's Quarterly Report on Form 10-Q filed November 3, 2009*.

101
10.22 Form of Performance-Based Restricted Stock Award Agreement under the 2009 Plan**, filed as Exhibit 10.2 to the Registrant's Quarterly Report on Form 10-Q filed November 3, 2009*.
10.23 Form of Restricted Stock Agreement under the 2009 Plan**, filed as Exhibit 10.3 to the Registrant's Quarterly Report on Form 10-Q filed November 3, 2009*.
10.24 Amended and Restated Credit Agreement, dated as of July 13, 2011, by and among the Registrant, JPMorgan Chase Bank, N.A., as a lender and administrative agent, HSBC Bank USA, National Association and RBS Citizens, National Association, as lenders and co-syndication agents, and Fifth Third Bank and Citibank, N.A., as lenders and co-documentation agents, filed as Exhibit 10.1 to the Registrant's Quarterly Report on Form 10-Q filed November 1, 2011*. Amendment No. 1, dated as of March 30, 2012, to the Amended and Restated Credit Agreement, by and among the Registrant, JPMorgan Chase Bank, N.A., as a lender and administrative agent; HSBC Bank USA, National Association, RBS Citizens, National Association, Fifth Third Bank, and Citibank, N.A., as lenders, filed as Exhibit 10.1 to the Registrant's Current Report on Form 8-K filed April 5, 2012*.
10.25 Pledge and Security Agreement, dated as of November 23, 2010, by and among the Registrant, World Properties, Inc. and JPMorgan Chase Bank, N.A., as administrative agent, filed as Exhibit 10.74 to the 2010 Form 10-K*.
10.26 Guaranty Agreement, dated as of November 23, 2010, by and among World Properties, Inc. in favor of JPMorgan Chase Bank, N.A., as administrative agent, filed as Exhibit 10.75 to the 2010 Form 10-K*.
10.27 Executive Transition Agreement by and between the Registrant and Robert D. Wachob, dated August 5, 2011**, filed as Exhibit 10.1 to the Registrant's Current Report on Form 8-K filed August 5, 2011*. Amendment to the Executive Transition Agreement by and between the Registrant and Robert D. Wachob, dated September 21, 2011**, filed as Exhibit 10.3 to the Registrant's Current Report on Form 8-K filed September 26, 2011*.
10.28 Letter Agreement between the Registrant and Bruce D. Hoechner, dated September 15, 2011 and accepted on September 20, 2011**, filed as Exhibit 10.1 to the Registrant's Current Report on Form 8-K filed September 26, 2011*.
10.29 Non-Qualified Stock Option Agreement between the Registrant and Bruce D. Hoechner**, filed as Exhibit 10.2 to the Registrant's Registration Statement on Form S-8 (File No. 333-181199) filed May 7, 2012*.
10.30 Time-Based Restricted Stock Unit Award Agreement between the Registrant and Bruce D. Hoechner**, filed as Exhibit 10.3 to the Registrant's Registration Statement on Form S-8 (File No. 333-181199) filed May 7, 2012*.
10.31 Time-Based Restricted Stock Unit Award Agreement (4 Year Cliff Vested) between the Registrant and Bruce D. Hoechner**, filed as Exhibit 10.4 to the Registrant's Registration Statement on Form S-8 (File No. 333-181199) filed May 7, 2012*.
10.32 General Release and Settlement Agreement with Peter G. Kaczmarek (with attachment)**, filed as Exhibit 10.1 to the Registrant's Current Report on Form 8-K filed on April 13, 2012*.
10.33 General Release and Settlement Agreement with Michael D. Bessette (with attachment)**, filed as Exhibit 10.3 to the Registrant's Quarterly Report on Form 10-Q filed August 1, 2012*.
10.34 Employment Contract between Mektron N.V., predecessor to Rogers BVBA, a wholly owned subsidiary of the Registrant, and Luc Van Eenaeme dated August 10, 1984, filed herewith.
10.35 Service Agreement between Curamik Electronics GmbH, a wholly owned subsidiary of the Registrant, and Luc Van Eenaeme dated May 1, 2012, filed herewith.
10.36 Guarantee Agreement between the Registrant and Luc Van Eenaeme dated January 23, 2013, filed herewith.
21 Subsidiaries of the Registrant, filed herewith.
23.1 Consent of Marsh U.S.A., Inc., filed herewith.
23.2 Consent of National Economic Research Associates, Inc., filed herewith.

102
23.3 Consent of Ernst & Young LLP, Independent Registered Public Accounting Firm, filed herewith.
31.1 Certification of President and Chief Executive Officer Pursuant to Rule 13a-14(a) of the Securities Exchange Act of 1934, as Adopted Pursuant to Section 302 of the Sarbanes-Oxley Act of 2002, filed herewith.
31.2 Certification of Vice President, Finance and Chief Financial Officer Pursuant to Rule 13a-14(a) of the Securities Exchange Act of 1934, as Adopted Pursuant to Section 302 of the Sarbanes-Oxley Act of 2002, filed herewith.
32 Certification of President and Chief Executive Officer and Vice President, Finance and Chief Financial Officer Pursuant to Rule 13a-14(b) of the Securities Exchange Act of 1934 and 18 U.S.C. Section 1350, as Adopted Pursuant to Section 906 of the Sarbanes-Oxley Act of 2002, filed herewith.
101 The following materials from Rogers Corporation's Annual Report on Form 10-K for the fiscal year ended December 31, 2012, formatted in XBRL (eXtensible Business Reporting Language): (i) Consolidated Statements of Financial Position for the fiscal years ended December 31, 2012 and 2011; (ii) Consolidated Statements of Operations for the fiscal years ended December 31, 2012, 2011 and 2010; (iii) Consolidated Statements of Shareholders' Equity for the fiscal years ended December 31, 2012, 2011 and 2010; and (iv) Consolidated Statements of Cash Flows for the fiscal years ended December 31, 2012, 2011 and 2010; and (v) Notes to Consolidated Financial Statements++.
* In accordance with Rule 12b-32 under the Securities Exchange Act of 1934, as amended, references are made to the indicated documents previously filed with the SEC, which documents are hereby incorporated by reference.
** Management contract or compensatory plan or arrangement.
+ Confidential Treatment granted for the deleted portion of this Exhibit.
++ Pursuant to Rule 406T of Regulation S-T, the Interactive Data Files on Exhibit 101 hereto are deemed not filed or part of a registration statement or prospectus for purposes of Sections 11 or 12 of the Securities Act of 1933, as amended, are deemed not filed for purposes of Section 18 of the Securities and Exchange Act of 1934, as amended, and otherwise are not subject to liability under those sections.

103
Signatures
Pursuant to the requirements of Section 13 or 15(d) of the Securities Exchange Act of 1934, the Registrant has duly caused this report to be signed on its behalf by the undersigned, thereunto duly authorized.
ROGERS CORPORATION(Registrant)/s/ Bruce D. HoechnerBruce D. HoechnerPresident and Chief Executive OfficerPrincipal Executive Officer
Dated: February 20, 2013
Pursuant to the requirements of the Securities Exchange Act of 1934, this report has been signed below on February 20, 2013, by the following persons on behalf of the Registrant and in the capacities indicated.
/s/ Bruce D. HoechnerBruce D. Hoechner President and Chief Executive OfficerDirectorPrincipal Executive Officer
J. Carl HsuDirector
/s/ Dennis M. Loughran /s/ Carol R. JensenDennis M. Loughran Vice President, Finance, Chief Financial Officer and Principal Financial Officer
Carol R. JensenDirector
/s/ Ronald J. Pelletier /s/ William E. MitchellRonald J. PelletierCorporate Controller and Principal Accounting Officer
William E. MitchellDirector
/s/ Michael F. Barry /s/ Robert G. PaulMichael F. Barry Director
Robert G. PaulDirector
/s/ Charles M. Brennan, III /s/ Peter C. WallaceCharles M. Brennan, IIIDirector
Peter C. WallaceDirector
/s/ Gregory B. HoweyGregory B. HoweyDirector

Board of Directors
Michael F. Barry 1, 3 Audit Committee Financial ExpertQuaker Chemical CorporationChairman, President and Chief Executive Officer
Charles M. Brennan, III 1*, 3Audit Committee Financial ExpertMYR Group Inc.Retired Chairman and Chief Executive Officer
Bruce D. HoechnerRogers CorporationPresident and Chief Executive Officer
Gregory B. Howey 2, 3Okay Industries, Inc.Chairman
J. Carl Hsu 2, 3Bell Labs Asia Pacific & ChinaRetired President and Chief Executive Officer
Carol R. Jensen 1, 2Lightning Ranch GroupPresident and Principal Partner Dow Chemical CompanyFormer Vice President Performance Chemicals
William E. Mitchell 1 Lead Director/Audit Committee Financial ExpertSequel Capital Management, LLCFounding and Managing PartnerArrow Electronics, Inc.Retired Chairman and Chief Executive Officer
Robert G. Paul 1, 2*Audit Committee Financial ExpertAllen Telecom Inc.Retired President and Chief Executive Officer
Peter C. Wallace 2, 3*Robbins & Myers Inc.President and Chief Executive Officer
Committees of the Board of Directors1 Audit Committee2 Compensation and Organization Committee3 Nominating and Governance Committee* Denotes Chairperson of the Committee
Global Locations
Corporate HeadquartersRogers, Connecticut, USA
Manufacturing
United States Chandler, ArizonaRogers, ConnecticutWoodstock, ConnecticutCarol Stream, Illinois
EuropeEvergem, BelgiumGent, BelgiumEschenbach, Germany
AsiaSuzhou, ChinaAnsan, South Korea
Sales Offices
AsiaBeijing, ChinaShanghai, ChinaShenzhen, ChinaWanchai, Hong KongTokyo, JapanAnyang, South KoreaHwasung City, Korea SingaporeTaipei, Taiwan
Joint Ventures
Rogers INOAC CorporationTaketoyo and Mie, JapanJoint venture partner: INOAC Corporation
Rogers INOAC Suzhou CorporationSuzhou, ChinaJoint venture partner: INOAC Corporation
Note: For a listing of Rogers Corporation subsidiaries, reference the Exhibits section in the 2012 10-K.
It is the policy of Rogers Corporation to provide equal employment opportunity to all persons regardless of age, race, color, religion, national origin, gender, sexual orientation, gender identity and/or expression, marital status, veteran status, or status as an individual with a disability, or any other characteristic protected by federal, state or local law, and to provide a work environment free of bias based on such categories. This policy applies to every phase of our operation, including recruitment, hiring, promotion, training, development, reclassification, transfer, compensation, benefits, termination, layoff and return from layoff, social and recreational programs, and any other aspect of employment.
Senior Management
Bruce D. HoechnerPresident and Chief Executive Officer
Robert C. DaigleSenior Vice President and Chief Technology Officer
Gary M. GlandonVice President andChief Human Resources Officer
Dennis M. Loughran Vice President, Finance andChief Financial Officer
Marc J. BeulqueVice President,Power Distribution Systems
Betsy A. GaucherVice President, Process Excellence and Supply Chain
Debra J. GrangerVice President, Corporate Compliance and Controls
Jeffrey M. GrudzienVice President, Advanced Circuit Materials Division
Jianjun LiuVice President, Asia Marketing
Terrence W. MahoneyVice President andGeneral Counsel
W. David SmithVice President and General Manager, High Performance Foams
Robert M. SofferVice President and Secretary
Luc Van EenaemeVice President, Europe
Helen ZhangVice President andPresident of Rogers Asia
Paul B. MiddletonCorporate Treasurer
Ronald J. PelletierCorporate Controller andPrincipal Accounting Officer

Conference CallsRogers Corporation conducts quarterly conference calls to discuss financial performance and other issues of importance to investors. To learn about scheduled calls, or access archived copies of previous calls, or listen in to live webcasts, visit the website at www.rogerscorp.com
Published Financial ReportsThe 2012 Form 10-K filed with the Securities and Exchange Commission (“SEC”) and other published financial reports are accessible through the EDGAR database of the SEC website or without charge, upon request to:Rogers CorporationOne Technology DriveP.O. Box 188Rogers, Connecticut 06263-0188Attn: Vice President and Secretary
Investor InformationThe Investor Relations section of Rogers’ corporate website (www.rogerscorp.com) contains a wealth of valuable information ranging from financial news releases to archived (audio) copies of investor conference calls. For additional information, or to obtain copies of printed investor materials, please contact:William J. TryonDirector of Investor and Public RelationsPhone: (860) 779-4037Email: [email protected]
Capital Stock Market PricesThe Company’s capital stock is traded on the New York Stock Exchange. The following table sets forth the high and low prices during each quarter of the last two years on a per share basis:
BISCO, CONDUX PLUS, COOLSPAN, curamik, DermaBak, DFLX, DURA-SHAPE, DUREL, DUROID, E/bak, ENDUR, eSorba, eSorba FRIKON, INDUFLEX, IRSM-35, LOPRO, LO-PRO, MAGNIFOAM, MF SILTEC, MF1, MPC, NITROPHYL, PERMAFRESH, POLARXSTREAM, PORON, PORON MEDICAL, PORON XRD, PROTOLIGHT, ProZorb, R/bak, R/flex, R/flex JADE, R/Stik, RO2800, RO3000, RO4000, RO4003, RO4233, RO-LINX, RO-LINX POWERCIRCUIT, RT/duroid, RX, SHIPGRIPS, SHOCKSEAL, SILFX, SLIMGRIP, SYRON, THETA, THINSTIK, TMM, ULTRALAM, VIVE, XRD, XT/duroid, The world runs better with Rogers., and the R logo are licensed trademarks of Rogers Corporation.
ROGERS EXPRESS is a licensed service mark of Rogers Corporation.
Corporate HeadquartersOne Technology DriveP.O. Box 188Rogers, Connecticut 06263-0188Phone: (860) 774-9605 Other InformationCompany founded – 1832Incorporated in Massachusetts – 1927The Company’s press releases, annual report, and other information can be accessed through its home page at http://www.rogerscorp.com
Annual Meeting The annual meeting of shareholders of the Company will be held at 10:30 a.m. on May 3, 2013, at the Hyatt Harborside Hotel at Boston’s Logan International Airport, 101 Harborside Drive, Boston, Massachusetts 02128
Transfer Agent and RegistrarShareholders with questions concerning the transfer of shares, lost certificates, changes of address, or other issues should contact Rogers’ transfer agent and registrar:Registrar and Transfer Company10 Commerce DriveCranford, New Jersey 07016-3572Phone: 800.368.5948www.rtco.com
Dividend and Market InformationRogers Corporation stock trades on the New York Stock Exchange under the ticker symbol ROG.Rogers does not currently pay a dividend.
Independent Registered Public Accounting Firm Ernst & Young LLP40 Westminster StreetProvidence, Rhode Island 02903
2012 2011HIGH LOW HIGH LOW
Fourth $50.09 $38.39 $45.33 $36.39Third 44.55 34.61 52.44 38.39Second 41.24 35.87 48.00 39.96First 42.29 32.19 47.99 38.91

One Technology DriveP.O. Box 188Rogers, Connecticut 06263-0188PHONE: 860.774.9605WEBSITE: www.rogerscorp.com
© 2013 Rogers Corporation | Printed in USA | March 2013