Concept, design and energy simulation of a Net Zero Energy ...
Upload
khangminh22Category
view
0download
0
POWERING COMMUNITIES TO NET ZEROOur Business Plan for RIIO-ED2 2023-2028

Glasgow
Inverness
Perth
Aberdeen
Dundee
SouthamptonBournemouthBournemouth
Reading
OxfordOxford
London
ABOUT US
We are the electricity Distribution Network Operator (DNO) responsible for delivering power to 3.8 million homes and businesses across central southern England and the north of Scotland. We serve some of the most diverse and unique geographies across the UK, and keep customers and communities connected whilst developing the flexible electricity network vital to achieving net zero.
Our network serves some of the UK’s most remote communities and also some of the most densely populated. Our two networks cover the greatest land mass of any of the UK’s DNOs, covering 72 local authority areas and 75,000km2 of extremely diverse terrain.
Our 130,000km of overhead lines and underground cables, and 106,000 substations, are managed by more than 3,700 direct employees including skilled engineers, customer service teams and future energy experts, many of whom live and work in the communities they serve.
By enabling a smarter, more resilient electricity network, we’re ensuring local communities from west London to Aberdeen continue to receive the reliable power they need. The five years from 2023 will be transformative for the UK’s energy sector, and we’re committing to an ambitious work programme that will deliver real and valued benefits during and beyond RIIO-ED2.
130,000km of overhead lines and underground cables
Over 3.8 million homes and businesses served by our networks
106,000 substations
Over 3,700 employees across the country
100+ subsea cables powering island communities
More than 770,000 customers on our Priority Services Register

Contents
CONTENTS
1 A Message From Our Managing Director
4 Executive Summary
20 SECTION A: INTRODUCING OUR NETWORKS, TRACK RECORD AND ENHANCED ENGAGEMENT
21 Chapter 1: Our Communities
22 Chapter 2: Track Record
31 Chapter 3: Enhanced Engagement
43 SECTION B: A VALUED AND TRUSTED SERVICE FOR OUR CUSTOMERS AND COMMUNITIES
44 Chapter 4: A Valued and Trusted Service for Our Customers and Communities
57 Chapter 5: IT and Digitalisation
67 SECTION C: A SAFE, RESILIENT AND RESPONSIVE NETWORK
68 Chapter 6: Safety and Compliance
76 Chapter 7: Maintaining a Resilient Network
87 Chapter 8: Supporting the Scottish Islands
93 SECTION D: ACCELERATED PROGRESS TOWARDS A NET ZERO WORLD
94 Chapter 9: Our Forecasting and Future Energy Scenarios
99 Chapter 10: Our Network as a Net Zero Enabler
112 Chapter 11: Distribution System Operation
124 Chapter 12: Whole Systems
132 Chapter 13: Environmentally Sustainable Network
141 SECTION E: INNOVATION, DELIVERABILITY AND COST EFFICIENCY
142 Chapter 14: Innovation
150 Chapter 15: Cost Efficiency
159 Chapter 16: Ensuring Deliverability and a Resilient Workforce
166 Chapter 17: Uncertainty Mechanisms
170 Chapter 18: Competition
173 SECTION F: FINANCE AND FINANCEABILITY
The costs included in the chapters and summary financial tables use £millions to one decimal place, unless otherwise stated (i.e. £7.4m). The rounding process may affect the representation of total numbers across the plan, although complete and detailed costs are available in the 44 annexes listed with the chapters, the 148 EJPs and the 105 CBAs, submitted along with our plan.

1 | A Message From Our Managing Director
The RIIO-ED2 price control comes at a critical juncture for our sector and for society, as the way we use, manage and even think about energy evolves and adapts.
Action to address the climate emergency is increasing in priority and pace, from the high-profile negotiations in Glasgow for COP26, to the recent publication of the UK Government’s Net Zero Strategy, which provided non-negotiable timescales on the delivery of decarbonisation. With aggressive pathways now set to deliver a net zero energy system by 2035, we must prepare for a rapid acceleration of renewable and distributed energy solutions, millions of new electric vehicles on our roads, a revolution in the way we heat our homes and a radical transformation in customer behaviour.
This accelerated transition will place additional requirements on our energy systems, particularly at a local level. Distribution network operators (DNOs), like SSEN, are taking on new system operation roles to facilitate the new technologies and emerging markets that best utilise our infrastructure, all while electricity demand grows rapidly. In addition, these changes will create new customer challenges and vulnerabilities that need to be both understood and addressed. We are already at the leading edge of this system change and are determined, as the pace accelerates, to ensure that our networks are an enabler for a smart, equitable transition to net zero, rather than a constraint.
Our five-year RIIO-ED2 business plan reconciles this need for network investment to power communities to net zero while ensuring efficiency and affordability for all. In planning our flexibility and network investment to meet generation and demand needs, we have proposed baseline funding consistent with a net zero trajectory in the first two years of the price control, taking a more conservative approach in the final three years, supplemented with uncertainty mechanisms in place to adjust spend as system demand becomes clearer. We believe this approach, led by our stakeholders, is both appropriate and responsible, giving confidence to our customers and allowing our supply chain and business to efficiently prepare, while not foreclosing future changes in trajectory.
Crucially, our plan also proposes enhancements to our core services, so that we retain our clear focus on reliability and customer service while we accelerate to net zero, protecting those most vulnerable.
A strong voice for our customers and stakeholders
Over the past two years, our plan has been shaped by those who matter most; our customers and stakeholders. We have listened to over 25,000 diverse voices, seeking their views on every aspect of our plans and proposals, shaping 64 outputs, and engaging at a scale and depth far beyond anything we have conducted before.
Our plan is far richer for this engagement; from the co-design of our strategic outcomes, to exploring new trends, understanding views on future requirements, and managing the impact of Covid-19, rising energy costs, and other drivers – engagement is intrinsic within our business and has changed how we plan our network and serve our customers.
Since our draft plan, we have engaged even further, testing our proposals and inviting rigorous critique from our customers and stakeholders to ensure that our plan is both robust and ambitious in equal measure. This has added even more value and helped us be more tailored and specific in our plans with clear justification.
I’d like to extend my thanks to our Customer Engagement Group (CEG) for their role in this process. The CEG’s expert scrutiny has provided real challenge and oversight to the development of our plan, often acting as a critical friend, and I look forward to their continuing role in RIIO-ED2 as we look to exceed our customers’ expectations.
AN AMBITIOUS AND BALANCED PLAN TO POWER COMMUNITIES TO NET ZERO A MESSAGE FROM OUR MANAGING DIRECTOR
Six stakeholder-led goals, delivering positive impact
Our plan demonstrates our commitment to deliver better services and greater value for our customers and communities than ever before. Our six clear goals, built around our strategic outcomes and shaped by our extensive engagement, provide stretching targets across each part of our business that we will deliver by 2028.
They are consistent with our core purpose, powering communities to thrive today and create a net zero tomorrow, and will be delivered through our ambitious vision – to power change with every connection.
Create a foundation for net zero by investing £1bn in strategic resilience
A SAFE, RESILIENT AND RESPONSIVE NETWORK
Achieve customer satisfaction of 9.2 or above in every contact area
A VALUED AND TRUSTED SERVICE FOR OUR CUSTOMERS AND COMMUNITIES
Facilitate 1.3 million electric vehicles and 800,000 heat pumps on our network
ACCELERATED PROGRESS TOWARDS A NET ZERO WORLD
Reduce the frequency and duration of power interruptions by 20%
Support 200,000 customers in fuel poverty with targeted support and energy efficiency measures
Cut our business carbon footprint by at least 35% aligned to 1.5°C science-based target
MAKE A POSITIVE IMPACT ON SOCIETY

2 | A Message From Our Managing Director
All our stakeholder-led goals, and the outputs that flow from them, are clearly set out and evidenced in our plan so that customers and stakeholders know and understand how we will deliver on their needs and, crucially, are able to track their delivery.
I am proud of the level of ambition shown in our plan, from demonstrating leadership on sustainability by becoming the first DNO to be accredited on a 1.5°C science-based target pathway, now recognised as essential in response to the climate crisis, to the extensive work to develop five Consumer Value Propositions (CVPs) that will deliver significant benefit to our society. Focused on sustainability, vulnerability, energy efficiency and whole system support, our innovative and collaborative CVPs demonstrate the areas where our customers and stakeholders have said we should go above and beyond.
An efficient and affordable plan
We recognise that to deliver the real step change required for a net zero energy system, an increase in investment is inevitable, but it is vital this expenditure is measured, timely and appropriate. Our plan proposes a total RIIO-ED2 base expenditure of £3.99bn, reduced from £4.14bn in our draft plan, and represents a 32% increase over an equivalent timeframe in RIIO-ED1. This reflects the additional requirements we must deliver for customers over the five years to 2028.
We are acutely aware that our investments are funded through consumers’ bills and that it is our responsibility to always provide excellent value for money. That is why we will deliver more output for our customers and communities for less money, with no proposed increases in the distribution costs on customer bills as part of our plan1.
This will be delivered through embedded efficiency and a proposed 0.7% year-on-year efficiency gain in RIIO-ED2, alongside changes to financial parameters that will extend the cost recovery period for assets and reduce the return available to our shareholders.
While we are confident our base plan will provide the improved network, enhanced service and progress to net zero our customers expect, we know that uncertainties remain in terms of timing and scale of demand change in the later years of the plan. We have therefore proposed nine regulatory uncertainty mechanisms to help protect customers and provide the necessary flexibility, both upwards and downwards, as positions and policy evolves.
Supporting a just and fair transition
We fully understand the challenge ahead, but success in reaching net zero will only be truly achieved if we make it a reality for all our customers. Enabling net zero only for the few, for the early adopters, for the socially mobile and for big business is not an acceptable outcome.
Our plan therefore includes significant actions to actively promote inclusive service provision across our networks and protect our most vulnerable customers, particularly important at a time of rising energy prices. We want our plan to support sustainable growth of the economy, help consumers participate in the energy transition and create opportunities for people from all communities.
This includes building and developing the workforce required for the challenge ahead. At SSEN, we have always been proud of our role as a responsible employer and our RIIO-ED2 plan will create over 850 skilled roles, attracting people from across our regions, including those reskilling from other industries, to join a purpose-led company in a growing sector.
I am excited to present our final RIIO-ED2 business plan for the five-year period from 2023-2028, and I’m confident that, through our enhanced engagement programme, we have focused our plan on the right priorities and have appropriately balanced the need to tackle the climate emergency with the urgency it requires, while delivering an efficient value proposition for our customers.
Our mandate to power communities to net zero has never been clearer and we look forward to continued collaboration with the customers and communities we serve, as we plot the best course to make our shared vision a reality.
CHRIS BURCHELL
Managing DirectorSSEN Distribution
1 Calculated using industry standard 8-year RIIO-ED1 average and 5-year RIIO-ED2 average.

3 | Characteristics of Our Plan
CHARACTERISTICS OF OUR PLAN
Decarbonisation will change how energy is used at a societal and individual level. This will sometimes be within our control, and in many cases it will not. Evolution in policy, regulation and consumer behaviour will impact how we invest in our network and support our communities. This includes changes in the role that we and others have in enabling new markets, facilitating connections to our network and providing flexible products and tariffs.
Our plan includes a commitment to continually engage with our customers and communities, as well as engaging with government, regulator and other interested parties across the energy system. Our business needs to be agile to respond to future developments, but we must also provide certainty to our customers, supply chain and employees. Our plan is carefully calibrated to strike this balance.
We have worked with stakeholders and customers to identify the key external drivers – economic, social, environmental and technological – that must be addressed as we develop our network, manage our organisation and serve our customers. In this final version of our plan, we have ensured that the characteristics that matter most to our customers and communities are present throughout all our investments and planned actions. The table below provides the eight characteristics that describe how customers’ needs and preferences have been realised in our RIIO-ED2 business plan.
STAKEHOLDER-LED
All aspects of our plan embody the extensive engagement with our customers, communities and local and national
policy makers across our regions, with ongoing collaboration key to our approach.
NET ZERO-READY
The UK and Scottish governments have committed to reaching net zero by 2050 and 2045 respectively, with the energy system
targeted for earlier decarbonisation by 2035.
Our plan is built upon a core pathway to net zero, enabling us to respond to the climate emergency by connecting low carbon
technologies as they are needed, and optimising utilisation of our network through flexibility services.
FLEXIBLE AND ADAPTABLE
The communities we serve are diverse and each face different challenges. Our plan provides flexibility to adapt our proposals
and activities to meet local needs.
Our plan also combines credible and robust growth scenarios with flexible uncertainty mechanisms, so as to not foreclose
options to further accelerate decarbonisation.
CUSTOMER-FOCUSED
Our plan commits us to measurable and stretching outputs and performance levels that our customers value, with transparency
so we can be held to account for delivery.
Our plans for digitalisation will deliver a deeper understanding of our network and our customers. This means we can provide tailored services, including options for self-service, as well as
improved customer experience across all contact points.
SAFE AND RESILIENT
Climate change is normalising previously exceptional weather events that test network resilience. Cybercrime is growing and
our increasingly digitally-enabled assets must be protected. Our plan provides investment to ensure our customers benefit from improved levels of resilience that are critical as electricity plays an increasingly important role in transport and heating.
We will deliver all this while ensuring our network remains safe for our customers and employees.
EFFICIENT AND AFFORDABLE
We recognise there are existing and future pressures on affordability and we cannot deliver net zero at any cost. Through continued innovation, efficiency, balanced decision-making and
stakeholder support, our plans keep bills affordable, while implementing the scale of change and investment required
for net zero.
Our plan is fully costed following a robust and rigorous cost assessment with stretching efficiency targets, delivering no
expected increase on consumer bills.2
FAIR AND INCLUSIVE
Our plan proposes tailored investment to meet the needs
of communities, with a core focus on supporting those most vulnerable through a just and equitable transition to net zero.
The social and economic impact of the Covid-19 pandemic is expected to be felt into RIIO-ED2. We will continue to plan and respond appropriately, particularly in our services for the most vulnerable, and by ensuring we continue to support a
green recovery.
FINANCEABLE AND DELIVERABLE
Our plan is financially sustainable in the short and long-term, protecting the interests of current and future customers.
Our plans deliver a transformation within our business to ‘work smarter’ by building and enhancing new workforce capabilities and technology while improving our carbon footprint and the sustainability of our supply chain.
2 Calculated using industry standard 8-year RIIO-ED1 average and 5-year RIIO-ED2 average.

NETWORKS IN A NET ZERO WORLD
The climate crisis is driving unprecedented levels of change which requires an unprecedented pace and scale of response. Meaningful actions across the energy system are urgently needed to mitigate the impacts of climate change and make net zero a reality for our communities.
Climate change is a global challenge that requires local solutions, and our role as an energy network must be to enable local, tailored solutions for customers and communities that combine to deliver meaningful outcomes for the energy system and society. As a provider of critical national infrastructure, we play a stewardship role in accelerating the transition to a net zero world at a national and local level. We understand the responsibility we hold and are committed to being at the forefront of driving change.
The journey to net zero will involve a rapid acceleration in the deployment of distributed energy resources bringing millions of new electric vehicles onto our roads and a transformation in the way we heat our homes. Networks must deliver substantially greater volumes of electricity in a resilient way whilst enabling customers and communities to choose their net zero journey. It’s our role to ensure customers have access to solutions that lower the energy costs for electric vehicles. We must also ensure they have the opportunity to utilise their own and community assets to decarbonise their heating and benefit financially from new markets and products.
As we look ahead towards the new 2035 target for a net zero energy system, we are now seeing an exponential rise in the uptake of new technology, the scale of new markets and in the ambition within government policy, particularly around the electrification of transport and heat.
The pathway to 2035 is already accelerating at pace, as is demonstrated by policy changes since draft plan submission:
Realising this vision requires us to take a greater role in coordinating and optimising energy use, attracting and connecting low carbon solutions and educating and empowering customers, communities and local authorities. Utilising innovation that accelerates decarbonisation at the lowest cost and digitalising our energy system to improve collaboration, participation and understanding is central to this. We have proactively invested in our ability to deliver this promise and have planned to sustain this investment to underpin continuous improvement and efficiency. We will also ensure our networks are responsive and resilient to the challenges that the energy transition and climate change brings.
All communities face unique challenges and opportunities, and these vary enormously across and within our north of Scotland and central southern England regions. As we move towards net zero, we have an essential role in supporting and enabling the same opportunities for all customers, especially those who may experience aspects of vulnerability. This includes those who are vulnerable today, but also those who may experience new or existing characteristics of vulnerability in the future.
In our north of Scotland region, we are a key part of the UK’s renewable economy. Our network is part of the critical infrastructure enabling environmental and economic benefits to Scotland, our customers and across the UK. The north of Scotland has some of the most remote communities and vulnerable customers with some of the highest levels of fuel poverty in the UK. For these customers, the resilience and cost-efficiency of our network is vital to them and their communities. It’s for these reasons our investment over the RIIO-ED2 period must ensure that the decarbonisation of heating and transport in Scotland progresses at a pace similar to anywhere else in the UK. We must also enable communities in the north of Scotland to maximise and preserve the enormous natural capital of the region, without burdening them with unsustainable energy bills.
Our central southern England region has the highest concentration of headquarters of global companies outside of London. It’s one of the most culturally diverse areas in the UK with over 150 languages spoken and considerable population growth is predicted over the next 15 years. Our modelling forecasts the second highest deployment of district heating, electric vehicles and heat pumps of any region by 2035, changing what our customers require from the network to connect and realise the benefits of these technologies. It is critical that our network and the services we provide evolve at a rate to enable and not hinder the net zero journey in this vital region for our economy.
4 | Executive Summary
EXECUTIVE SUMMARY
1
HEATHeat and Building Strategies from the UK and Scottish Governments set accelerated targets for heat pump deployment including consumer grant schemes and funding to reduce costs.
TRANSPORTUK Government announced a further £620m of support for EV charge point rollout and mandated charge point installations at all new properties from 2022.
RENEWABLES AND FLEXIBILITYSmart systems and flexibility plans called for 13GW of flexibility on the system by 2030. Scottish Government accelerating local renewables and plan for six net zero islands by 2040.
NET ZERO POLICYThe UK Government Net Zero Strategy sets an accelerated target to decarbonise the electricity sector by 2035, and align pathways to the 6th Carbon Budget recommendations.

5 | Executive Summary
As we deliver for each region individually, we strive to be a force for good in the communities we serve.
We are an active contributor to the local economies where we are a major employer in our two regions. This contribution will continue as we plan to grow our business by a further 850 jobs by 2028 and create sustainable opportunities across our supply chain.
We are committed to making a societal impact beyond simply providing power to our communities, extending ourselves to restoring habitats, increasing biodiversity and designing our business so that it is sustainable, all while helping make net zero a reality.
We’re powering change with every connectionOur plan has been developed with our customers and communities to reflect and deliver their ambitions and provide them with the broadest set of options for realising their net zero future. It reflects the different requirements of our two distribution networks, while being responsive to the uncertainties and opportunities that will emerge. Our plan is centred around key consumer-led strategic outcomes, which have driven and influenced the direction of our wider business strategy, recognising the need for alignment and integration between our RIIO-ED2 business plan and the way we develop and transform our current business to deliver it. Having received feedback that our former outlook was too insular and lacked customer focus, we undertook an extensive co-creation programme with our customers, stakeholders and colleagues on our strategic approach, and subsequently redefined our company purpose and vision.
Our new purpose – we power communities to thrive today and create a net zero tomorrow – sets out our dual aim to support the communities we serve, beyond keeping the lights on, and work collaboratively with them to reach their net zero carbon goals.
Our new action-led vision – powering change with every connection – places the importance of service and engagement right at the heart of our business and makes clear that every connection we make, be it an infrastructure asset or connection with a customer, stakeholder or colleague, matters.
Our new purpose and vision will be delivered through four clear priorities directly linked to our strategic RIIO-ED2 outcomes. This means our short- and long-term decision-making is focused on the requirements of our RIIO-ED2 plan and what needs to be achieved for our customers.
2035 IN CENTRAL SOUTHERN ENGLAND 2035 IN NORTH OF SCOTLAND REGION
• c.318,000 new houses and 8.3 million square metres of non-domestic floor space that will need heating
• Over 665 MW of electricity demand from known new data centre sites coming online by the mid 2020s
• Between 1.4m and 3.8m electric vehicles will be on the road
• c.1.2m domestic properties and c.91,000 non-domestic properties operating a type of heat pump
• Energy efficiency measures in homes and businesses reduce baseload electricity consumption by c.23%
• Collectively, distribution network connected solar and wind generation capacity in the licence area increases by over 122% from c.2.4 GW in 2019 to c.5.3 GW in 2035
• c.63,000 new houses and 10.3 million square metres of non-domestic floor space will need heating
• The capacity of hydrogen electrolysers connected to the distribution network reaches 43 MW
• Between 259,000 and 711,000 electric vehicles will be on the road
• c.438,000 domestic and c.39,000 non-domestic properties installing heat pumps
• Energy efficiency measures in homes and businesses reduces electricity consumption by c.22% mitigating the increased demand from electric vehicles and heat pumps
• Collectively distribution network connected solar, wind, hydro and marine generation in the licence area increases by 116% from over 3.0 GW in 2019 to c.6.5 GW in 2035
OUR COMMUNITIES IN 2035
Delivering a safe, resilient and responsive network
We power communities to thrive today and create a net zero tomorrow
We’re powering change with every connection
Providing a valued and trusted service for
customers and communities
Accelerating progress towards a net zero world
Making a positive impact on society
OUR FOUR PRIORITIES
OUR PURPOSE OUR VISION
SEPD
SHEPD

6 | Executive Summary
Deliver a safe and resilient network that meets our customers’ needs and that supports the greater electrification of heat and transport by investing in the infrastructure and technology that provides a platform for the future. We recognise that consumer energy use will change in different ways, over different timescales across different regions. Our plans are based on a requirement that our network be responsive to this variety and uncertainty. We will reduce the frequency and duration of customer interruptions and will invest in ensuring our network is resilient to climate change and ageing assets.
Provide a high quality, value-creating and trusted service for our customers and communities that evolves with their needs and expectations. We will empower our customers with intelligent, self-service digital solutions designed to be inclusive and offer tailored support. We will make sure that net zero is available for all, whether communities want to support tourism through deployment of public rapid EV charging, individuals want to decarbonise their heating or if new businesses or local authorities require bespoke energy solutions. We will provide high quality customer experiences that enable their ambitions and deepen trust, and expand our services, reducing the impacts of fuel poverty and improving energy efficiency for customers in vulnerable situations.
Accelerate the progress toward, and enable all customers to participate in, a net zero world. It is essential that we demonstrate that markets and the role of flexibility will mean different things in different communities. However, they must be operated in a fair and transparent way that benefit consumers. We will do this by applying whole system thinking in a highly collaborative way to create and enable smart, flexible, local energy networks. This includes acting as a neutral market facilitator with the highest levels of transparency.
We will make a positive impact on society by doing even more for our communities and environment. We will expand and increase the diversity of our workforce to not just deliver the scale of activity we need to undertake, but also create economic and wider societal benefits in the communities within which we operate. We will increase our workforce by 20% adding over 850 jobs within SSEN and many more through our supply chain. This will be delivered by increasing our use of apprenticeships, graduate schemes, and trainee engineer programmes.
What this means for our customers and communities
Our plan delivers value to the communities we serve, and society as a whole. It reflects a wide range of customers’ and stakeholders’ views of what is important now and in the future. It also recognises the key role we have to play in helping all of our customers and communities reach net zero and realise the benefits of doing so.
We are committed to delivering a positive impact and our will plan will ensure that:
All of our customers can choose their path to net zero and connect low carbon technologies whenever and wherever
Customers and communities have access to enhanced services, with extra support to those most vulnerable
We will provide simple self-service opportunities
We will take an inclusive approach to local area energy planning
We will increase the reliability of our network
We will provide targeted support for those in fuel poverty
Our services are tailored to specific local needs, and enabling new business models and markets, and that benefit our customers and communities
Our actions will drive long-term employment opportunities and sustainable economic growth in the regions we operate
We will create new community flexibility markets
We will enable the renewable ambitions of individual communities
We are creating over 850 sustainable career opportunities
We are enhancing our community funding and partnerships

7 | Executive Summary
A fair and flexible transition to net zero
There are a range of pathways to net zero, and our plan keeps all options open. We explored a range of potential future scenarios specific to our regions with stakeholders, including both national Governments, National Grid ESO, over 70 local authorities and 200 community groups. This work identified what is common and what is different across these pathways and the steps needed to ensure we do not foreclose options.
These pathways identify where we must make firm decisions on the level of investment to meet load growth and changes in demand profiles, and where we must proactively manage risk to keep options open. They inform where we need to invest to deliver a more responsive network, and provide requirements of how we must mature our ability to take on the role of Distribution System Operation (DSO). These decisions must be made while recognising that there is an immediate and future cost to consumers that must be considered and managed.
Our central planning scenario is based on a System Transformation pathway combined with future proofing investment based on the first two years of Consumer Transformation pathway. Combined, this defines the core of our baseline revenue request.
Based on our research and engagement, we believe Consumer Transformation is the likely outcome, but suitable protections for customers are required alongside reflecting the ambition and delivery commitment, consistent with our stakeholders’ and communities’ expectations.
Our approach is in line with Ofgem’s minimum requirements and steer that DNOs should maximise the use of uncertainty mechanisms in order to protect customers from forecasting uncertainties.
Sp
en
d (£
m)
Year 1 Year 2 Year 3 Year 4 Year 5
100
200
300
400
500
600
0
Our likely requirement based on Consumer Transformation throughout the ED2 period
Our additional HV/LV highly certain expenditure
Future proofing expenditure - Consumer Transformation requirements for Year 1 and Year 2
Minimum requirements based on System Transformation
Our total requirement, baseline + uncertainty
The proportion of ex-ante baseline funding request that is not required under ST but ensures that we can meet longer term needs of CT
The additional requirement if CT arises - funded by UM
Total expected funding - £538m - if CT materialises throughout RIIO-ED2
The highly likely additional spending for HV/LV in years 3-5 not requested in the baseline - funded through UM
Total baseline funding request, £298m
Expected totex requirement £350m
We are confident that our plan strikes the right balance between the baseline funding and the use of uncertainty mechanisms, and serves to protect customers from an unnecessarily high baseline plan in a number of areas where there is significant uncertainty that is out of our control. Our baseline plan is based on robust evidence and designed to ensure that we, together with our supply chain, are able to plan and scale activity in the most efficient manner for the customer.
Importantly, our load baseline plan is specifically designed to ensure we do not foreclose any outcomes, in line with Ofgem’s business plan guidance, but delivers the strategic investment that is essential in order to ensure we are capable of meeting expected demand growth in RIIO-ED2 and future price control periods.
We consulted extensively with our customers and other stakeholders to seek their views on what basis we should develop our RIIO-ED2 plan. They were very clear that we must enable net zero in a safe, reliable and resilient way, whilst also effectively managing future uncertainties. This includes changes in consumer electric vehicle behaviour and also uncertainty over approaches to decarbonise heating. Our stakeholders want us to actively enable decarbonisation, but they were also clear that our plan must be affordable and support the most vulnerable.
CT: Consumer Transformation
ST: System Transformation
UM: Uncertainty Mechanism
RANGE OF POTENTIAL LOAD RELATED EXPENDITURE IN RIIO-ED2

ENGAGEMENT AT A GLANCE
Stakeholders engaged
Total
25,181
Synthesised stakeholder evidence points
Total
4,719
Methods used
Total
18
Engagement events
including over 30 regional events
150
Our final plan demonstrates how stakeholder and consumer insights have driven our business more than ever before, not only in the number and breadth of stakeholders engaged but through direct impact on our business plan strategies and outputs. Each of our strategies and outputs has a ‘golden thread’, mapping these to actionable insights gained from enhanced engagement and triangulated by senior leaders.
Our enhanced engagement programme has included four phases, with the testing and acceptance phase driving further refinements between submission of our draft business plan and this final version. In the last phase of the programme we had a significant focus on the cost of our plans, with each of our engagements in this phase displaying both the granular cost of our proposals alongside what this means in terms of pounds and pence on customers’ bills. This included a targeted consultation and series of stakeholder events on our draft business plan outputs and costs.
8 | Executive Summary
Open Discovery
Co-creation
Business Plan Refinement
Testing and Acceptance
To August 2020
Aug 20 – Feb 21
Feb 21 – Jun 21
Jun 21 – Dec 21
ENSURING A STRONG VOICE FOR OUR CUSTOMERS AND STAKEHOLDERS
The voice of our customers and stakeholders has been at the very heart of our plan. Our approach to enhanced engagement has evolved significantly through RIIO-ED1 and again through our RIIO-ED2 business plan process, driven by improvements to our strategy and processes, and our response to the challenging circumstances our customers and stakeholders experienced as a result of Covid-19.
We have adapted our approach to include online methods to be as accessible as possible recognising that local restrictions and personal preferences are a potential barrier to engagement. Wherever possible, we have adopted a co-creation approach, an advanced form of interaction with stakeholders which goes beyond traditional transactional approach and co-designing solutions. We have also been careful to fully recognise the differences between our two licence areas, tailoring our approach to address regional specific issues.
A further innovation was thematic consumer research on topics identified as important to our stakeholders, including a deep dive into how we better support ‘worst served’ customers and a joint design process of a new connections journey. Addressing areas of importance and interest, we held a Citizens’ Jury that gave consumers a role in shaping our final proposals for our innovation and sustainability plans through deliberative workshops and inputs.
2
Our plan asks for £3.99bn to invest in our two regions for the five-year RIIO-ED2 period. Our plan is adaptable to multiple pathways but is affordable, recognising the challenges our customers face with increasing energy costs. Uncertainty mechanisms enable us to accommodate load growth above our baseline assumption, providing the right investment at the right time if it’s needed. We will also enhance our workforce skills and enabling technology, so that we are ‘working smarter’ to deliver a responsive network to meet more uncertain aspects of future load growth.
An integral part is the ongoing investment to expand our DSO role to make sure we are continually increasing our options to defer or avoid traditional network reinforcement. This allows us to make
greater use of funding through uncertainty mechanisms as the combination of available flexibility increases alongside our maturing DSO capabilities. At the same time, we’ve rigorously challenged ourselves on cost efficiency and to find cost efficiencies that underpin our plan. This has reduced our funding ask by £269m.
Together, this provides our business and customers greater certainty on what we will invest in our network and supporting capabilities, in a way that balances the priorities of our customers today and tomorrow.

Over 4,700 distinct feedback points were synthesised and built into the development of our draft plan and, through a two-stage triangulation process, 51 key refinements were made to strategies and proposals to better meet stakeholder needs. This included developing five new business plan outputs and refining the ambition for a further two outputs following the Phase 4 programme of events.
The strength and focus of our plan, and our engagement programme, has been improved by our Customer Engagement Group (CEG), established in 2019 as part of enhanced engagement requirements for RIIO-ED2. The group, chaired by Tracey Matthews and supported by ten members with expertise from across sectors and segments, has been a valuable critical friend providing scrutiny and challenge to all aspects of our plan and approach. Through 21 formal meetings, the group has been given regular access to the RIIO-ED2 project team and senior leaders, as well as three formal opportunities for engagement with our Board. This constructive dialogue has made our business plan even more reflective of stakeholder and consumer needs and a stronger and improved plan as a result.
It’s our intention that the CEG will have an enduring role in our strategy for continued enhanced engagement during the RIIO-ED2 period, which is detailed in Future Stakeholder Engagement Strategy (Annex 3.2). This strategy captures the improvements we will make in the next price control to further understand the needs of our stakeholder and customer base and conduct meaningful and innovative engagement. Key to our approach is to apply the learnings of the RIIO-ED2 business plan engagement process and ensure our engagement is built around delivery of our business plan outputs, while remaining responsive to changing stakeholder needs.
ACCEPTABILITY TESTING
We tested our final plan with consumers through a two-stage acceptability testing programme, using both qualitative and quantitative methods. For the qualitative phase in September 2021, we identified fuel poor customers, vulnerable customers, and future customers, as well as business customers, as we particularly wanted to understand the views of seldom heard groups.
Based on their feedback, we made 21 refinements and enhancements to our final plan.
A large quantitative survey of customers and business was conducted in October 2021, showing high acceptability of our final plan expenditure and outputs of 78% with a small minority of 4% saying it was unacceptable. Of respondents who told us the plan was neither acceptable nor unacceptable, we identified that concern about their electricity bills in the context of rising prices was likely driving this result with 77% telling us it impacted their response. This is also reflected in an overall affordability score of 77%. However, when respondents considered the plan without reference to their own circumstances, over 86% rated the plan as value for money.
We have performed well against our outputs and delivered significant improvement levels for customers. Our achievements include:
Delivering this level of performance, while managing some of the unforeseen challenges in RIIO-ED1, such as a requirement to replace strategic subsea cables, means that, at the time of publication, we are forecast to overspend our allowances by 3.4%. This additional investment has helped us deliver our outputs in RIIO-ED1 and has also seen enhancements in IT, systems and people which are helping to set us up for the start of RIIO-ED2.
Improved customer satisfaction scores by 6% since 2015/16. Both our networks outperformed Ofgem’s complaints related targets.
We have increased customer satisfaction for connections by 9% while managing a surge of connection requests (particularly in the south) and broadly meeting Ofgem’s Time to Connect targets.
Reduced average customer interruptions (CI) by 17% and average customer minutes lost (CML) by 25% since 2012/13 for unplanned interruptions.
Made significant advances in our approach to supporting vulnerable customers. We have supported 7,500 customers with fuel poverty measures since 2016/17. This scaling up of activities was recognised through the Stakeholder Engagement and Customer Vulnerability incentive where we were the second place DNO in 2020/21 for the customer vulnerability element.
Became the first DNO to commit to a 1.5°C Science based Target.
Continue to have a strong safety record, building on our previous strong performance.
On track to deliver £89m in customer benefit through innovation and flexibility, maintaining our leadership position.
OUR RIIO-ED1 JOURNEY
Our plan for RIIO-ED1 set ambitious targets to deliver improvements in customer service and safety performance, to reduce service interruptions and our business carbon footprint (BCF), and to connect more customers to our networks, more efficiently and with increased customer satisfaction.
There have been a number of challenges and opportunities across the RIIO-ED1 period – the Covid-19 pandemic, Brexit, the increasing impact of climate change, advances in battery technology, cybersecurity threats and a growing ability to process and manage ‘big data’. Many of these were unimaginable when we developed our RIIO-ED1 plan back in 2013/14. As a business, we have risen to, and adapted to, these challenges which have in some cases led to us choosing to invest more of our shareholders money in order to deliver on our priorities, deliver high class customer service and start to lay the foundations for delivering net zero.
3
9 | Executive Summary
A SUMMARY OF OUR BUSINESS PLAN4
10 | Executive Summary
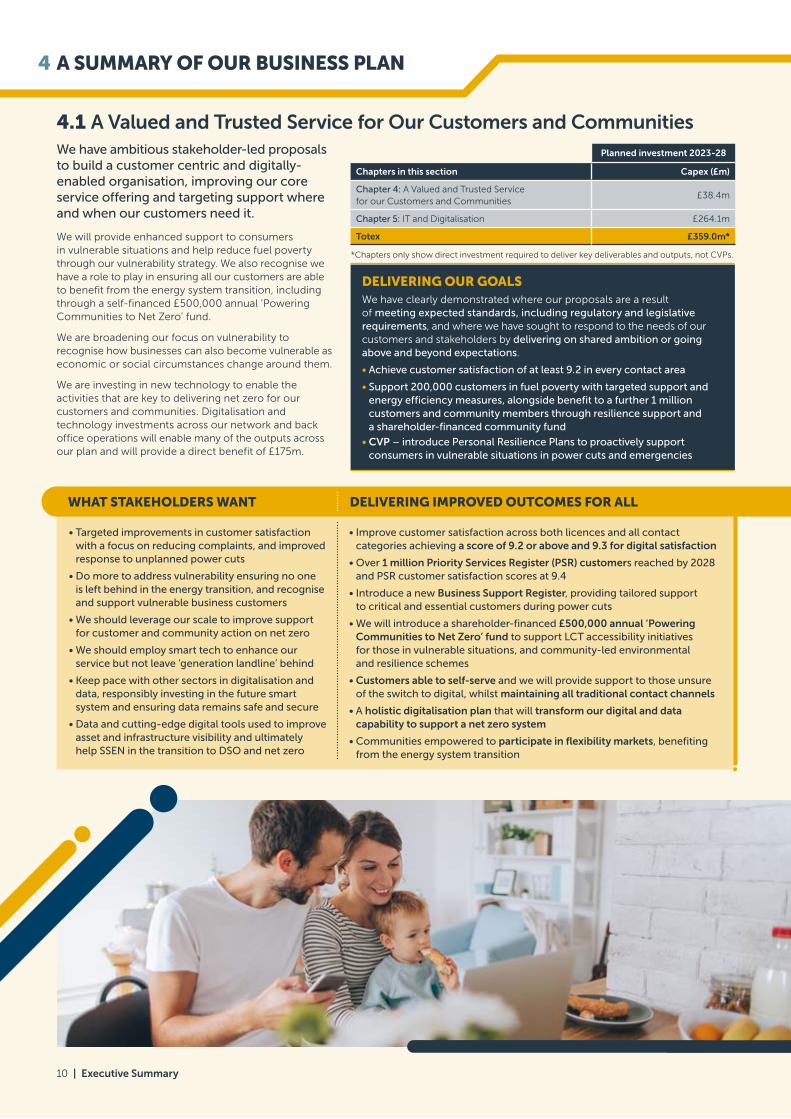
4.1 A Valued and Trusted Service for Our Customers and Communities We have ambitious stakeholder-led proposals to build a customer centric and digitally- enabled organisation, improving our core service offering and targeting support where and when our customers need it.
We will provide enhanced support to consumers in vulnerable situations and help reduce fuel poverty through our vulnerability strategy. We also recognise we have a role to play in ensuring all our customers are able to benefit from the energy system transition, including through a self-financed £500,000 annual ‘Powering Communities to Net Zero’ fund.
We are broadening our focus on vulnerability to recognise how businesses can also become vulnerable as economic or social circumstances change around them.
We are investing in new technology to enable the activities that are key to delivering net zero for our customers and communities. Digitalisation and technology investments across our network and back office operations will enable many of the outputs across our plan and will provide a direct benefit of £175m.
WHAT STAKEHOLDERS WANT DELIVERING IMPROVED OUTCOMES FOR ALL
• Targeted improvements in customer satisfaction with a focus on reducing complaints, and improved response to unplanned power cuts
• Do more to address vulnerability ensuring no one is left behind in the energy transition, and recognise and support vulnerable business customers
• We should leverage our scale to improve support for customer and community action on net zero
• We should employ smart tech to enhance our service but not leave ‘generation landline’ behind
• Keep pace with other sectors in digitalisation and data, responsibly investing in the future smart system and ensuring data remains safe and secure
• Data and cutting-edge digital tools used to improve asset and infrastructure visibility and ultimately help SSEN in the transition to DSO and net zero
• Improve customer satisfaction across both licences and all contact categories achieving a score of 9.2 or above and 9.3 for digital satisfaction
• Over 1 million Priority Services Register (PSR) customers reached by 2028 and PSR customer satisfaction scores at 9.4
• Introduce a new Business Support Register, providing tailored support to critical and essential customers during power cuts
• We will introduce a shareholder-financed £500,000 annual ‘Powering Communities to Net Zero’ fund to support LCT accessibility initiatives for those in vulnerable situations, and community-led environmental and resilience schemes
• Customers able to self-serve and we will provide support to those unsure of the switch to digital, whilst maintaining all traditional contact channels
• A holistic digitalisation plan that will transform our digital and data capability to support a net zero system
• Communities empowered to participate in flexibility markets, benefiting from the energy system transition
Planned investment 2023-28
Chapters in this section Capex (£m)
Chapter 4: A Valued and Trusted Service for our Customers and Communities
£38.4m
Chapter 5: IT and Digitalisation £264.1m
Totex £359.0m*
DELIVERING OUR GOALSWe have clearly demonstrated where our proposals are a result of meeting expected standards, including regulatory and legislative requirements, and where we have sought to respond to the needs of our customers and stakeholders by delivering on shared ambition or going above and beyond expectations.
• Achieve customer satisfaction of at least 9.2 in every contact area
• Support 200,000 customers in fuel poverty with targeted support and energy efficiency measures, alongside benefit to a further 1 million customers and community members through resilience support and a shareholder-financed community fund
• CVP – introduce Personal Resilience Plans to proactively support consumers in vulnerable situations in power cuts and emergencies
*Chapters only show direct investment required to deliver key deliverables and outputs, not CVPs.

11 | Executive Summary
A robust, resilient and reliable network is the bedrock of our plan to deliver the necessary improvements for net zero, in particular in the context of climate change and increased reliance on electricity.
We are realising customer benefits by prioritising investment to create the network our customers need today and, in the future, meeting compliance and legislative requirements and improving network and public safety.
Our two licence areas are dramatically different; climate, population density, infrastructure and the natural environment all factor in how we maintain service for customers. Our plan works as hard for some of the UK’s most remote communities as it does for customers living in the more populated south.
4.2 A Safe, Resilient and Responsive Network
WHAT STAKEHOLDERS WANT DELIVERING IMPROVED OUTCOMES FOR ALL
• Customers want a safe network, resilient to threats and ready for net zero
• Reliability is more important than ever as work/life patterns change in response to Covid-19, and heat and transport become electrified. But customers and communities have mixed views – it shouldn’t come at any cost
• We should invest now to replace assets and avoid loading costs onto future consumers, prioritising assets with high likelihood of failure
• Network reliability is vital for our remote islands communities: stakeholders urged prioritisation of subsea cable replacement and want a low carbon whole system solution to ensure reliability in our transition to net zero
• We will reduce the average duration of unplanned power cuts by 20%, for example through automation to over 620 circuits, also lowering long-term costs
• Over 250,000 fewer customers experiencing a power cut in RIIO-ED2
• We will reduce customers classified as ‘worst served’ by 75%, focusing our investments where it will have the highest impact, and using consumer vulnerability as a criteria for prioritisation
• Our core asset heath and reliability investments of £683.7m will improve strategic resilience
• Target investment of £329m to reduce faults and improve reliability for island communities, including on 18 subsea cables and all seven island-based power stations
• Keep the public safe, deploying new technology to better target key activities such as tree-cutting and overhead line clearances
• Build on our extensive RIIO-ED1 safety engagement programme, reaching 50,000 partners and members of our communities by 2028
Planned investment 2023-28
Chapters in this section Capex (£m)
Chapter 6: Safety and Compliance £408.2m
Chapter 7: Maintaining a Resilient Network £1,174.6m
Chapter 8: Supporting the Scottish Islands £329.2m
Totex £2,212m*
DELIVERING OUR GOALSWe have clearly demonstrated where our proposals are a result of meeting expected standards, including regulatory and legislative requirement, and where we have sought to respond to the needs of our customers and stakeholders by delivering on shared ambition or going above and beyond expectations.
• Create a net zero foundation by investing £1bn in strategic resilience
• Invest £296.2m in keeping the public safe, in line with our obligations
*Chapters only show direct investment required to deliver key deliverables and outputs, not CVPs.

12 | Executive Summary
4.3 Accelerated Progress to Net Zero
WHAT STAKEHOLDERS WANT DELIVERING IMPROVED OUTCOMES FOR ALL
• We should support the substantial growth in electric vehicles and heat pumps with no delays and simple connections processes
• Be an enabler for the net zero transition, working with local partners and across the ‘whole system’ to ensure pace and efficiency
• Prioritise early investment in the network for long term benefit using robust data and stakeholder insights
• Lead by example and reduce our carbon footprint aligned with recognised climate targets
• Work with communities to ensure that local renewables, flexibility and energy efficiency potential can be realised
• Develop DSO services that are transparent, data-driven and will deliver flexibility at scale
• We will invest at least £350m to support network capacity growth over RIIO-ED2, with further funding to be provided through an agile and stakeholder led approach to uncertainty
• We will provide dedicated support to develop Local Area Energy Plans for local authorities and key groups, and set up an Information, Advisory and Whole Systems Liaison Service to support local authorities achieve their net zero ambitions
• We will introduce a self-serve process for domestic LCT and minor connections customers, improving the customer experience and facilitating the significant increase in connections
• Through our DSO strategy we will act as a neutral market facilitator, strengthening our approach to governance in RIIO-ED2. We will use flexibility services to deliver benefits across our plan
• At least 35% reduction in our Business Carbon Footprint (BCF) by 2028 in line with 1.5°C science-based target, and reduced reliance on diesel generation
We have worked alongside stakeholders to design and calibrate our plan for future changes in system operation and the pathway for net zero. We have built in the necessary flexibility to ensure we are future-proofed for changes but without imposing unnecessary costs on today’s or future customers.
We will achieve this by investing over £500m on out network, taking a flexibility first approach to defer up to £46m and £417m of traditional investment through flexibility and flexible connections. Our plan is fully aligned to a 1.5°C Science Based Target (SBT) and will deliver at least a 35% reduction in our business carbon footprint (BCF) by 2028 from a 2020 base. Expected growth in flexible connections will offset a further 1.8 mtCO2 by 2028.
We are stepping up to address our impact on the natural environment by delivering a £26.4m biodiversity net gain programme through local afforestation and programmes and solutions that will reduce our impact.
Planned investment 2023-28
Chapters in this section Capex (£m)
Chapter 9: Our Forecasting and Future Energy Scenarios N/A
Chapter 10: Our Network as a Net Zero Enabler £510.2m
Chapter 11: Distribution System Operation £73.1m
Chapter 12: Whole Systems N/A
Chapter 13: Environmentally Sustainable Network £172.3m
Totex £1,039m*
DELIVERING OUR GOALSWe have clearly demonstrated where our proposals are a result of meeting expected standards, including regulatory and legislative requirement, and where we have sought to respond to the needs of our customers and stakeholders by delivering on shared ambition or going above and beyond expectations.
• CVPs – our whole systems CVPs will provide dedicated in-house support to empower local communities in net zero, and lead the way in infrastructure sharing to enable our most remote communities to benefit from digitalisation
• CVPs – our DSO CVPs will facilitate broad and diverse flexibility market participation, and accelerate the use of energy efficiency as a tool to reduce network constraints and customer bills
*Chapters only show direct investment required to deliver key deliverables and outputs, not CVPs.

13 | Executive Summary
4.4 Delivering an Efficient, Innovative and Financeable PlanOur plan is ambitious, and at every stage we have considered its deliverability; to understand the implications for our workforce, skills base, infrastructure and cost.
We have taken a balanced approach towards innovation, conducting research on new technologies and thinking to shape the networks of the future, alongside practical trials that will have timely application into business as usual, delivering benefits for customers now.
Stakeholders have urged us to improve transparency around procurement and our supply chain, and our RIIO-ED2 Commercial and Deliverability Strategy approach focuses less on simple unit cost reductions to explore wider efficiencies available during the whole purchasing process. This will drive efficiencies through our contracting strategies and strategic relationships with our supply chain partners.
Understanding where we have opportunities to improve our efficiency as we approach the end of RIIO-ED1 allows us to target further improvement over the final years of this price control and into RIIO-ED2. In total, we have identified £269m of additional bottom-up efficiency savings which we have embedded into our baseline plan. In addition, we have committed an 0.7% annual efficiency ambition, which will reduce costs by a further £141m over RIIO-ED2.
We have also embedded and enhanced competition within our regulated activities and have introduced new mechanisms that will further enable innovation, flexibility and cost efficiency. We have not proposed any projects that meet Ofgem’s threshold for late or early competition. In many instances, projects have been consolidated to enable the use of native competition to drive efficiency.
Deliverability of our plan is underpinned by a robust workforce resilience strategy. Stakeholders recognise that our people strategy
will need to evolve so we can deliver the outputs they have asked for. We’re forecasting a 20% growth to our direct workforce and will improve diversity by proactively targeting the segments of the UK workforce who do not traditionally apply to work in our sector and will extend our mental health and wellbeing initiatives to help support employee confidence.
Proposed expenditure in RIIO-ED2
Our business plan proposes a total base RIIO-ED2 investment of £3.99bn, to deliver a resilient network for the future and a service that customers and consumers can continue to depend on today. This is our current view of the most efficient costs necessary to meet the expectations of our customers and Ofgem and deliver our plan.
Across most of our network activities, we forecast expenditure will continue at levels equivalent to the current price control, securing existing high levels of service. In key areas, we will invest more to ensure safe network operations, address specific areas of environmental and reliability risk, and provide a network capable of connecting the volumes of low-carbon technology that a net zero future requires.
This targeted investment increases expenditure by £0.96bn on an equivalent five-year period in RIIO-ED1. Details of our £3.99bn investment proposals are fully outlined in each chapter and our supporting documents.
Our individual investments create benefits for stakeholders across a wide range of areas aligned around our three strategic outcomes.
Breakdown of our RIIO-ED2 investment plans (£m, 20/21 price base)
Totex by Plan section and Ofgem categories
Valued and trusted service Safe and resilient network
Accelerated progress to net zero Our RIIO-ED2 Plan
Load Related 0 0 528 528
Non-Load Capex 0 1,096 211 1,308
Non-Op Capex 0 42 42 83
IT/OT 199 0 53 252
Network Op Costs
0 735 0 735
Capitalised 160 339 206 705
Subtotal 359 2,212 1,039 3,611
+ General running costs 525
- less efficiency -141
RIIO-ED2 totex 3,994
In addition, we need the support of a skilled and professional workforce to deliver these strategic outcomes. General running costs are the cost of our back office functions and other general expenditure which do not easily align with one of our three strategic outcomes, but which benefit them all.
Valued and trusted service: investing in our IT and telephony capability to give customers the choice over when and how they want to interact with us and enable us to meet their needs first time.
Safe and resilient network: continued core expenditure to ensure safety of our customers and staff as well as maintaining network resilience and reliability. Targeted investment to address areas of increasing faults and strategic importance of our network to communities.
Accelerated progress to net zero: developing Distribution System Operator capabilities to manage a step change in network capacity and complexity, enabling benefits from flexible solutions including quicker connections at lower cost.
TOTALBASELINE
INVESTMENT£3,994m
GeneralRunning Costs
£525m
ValuedService£359m
Safe and Resilient£2,212m
Net Zero£1,039m
E�ciency Savings – £141m

14 | Executive Summary
Uncertainty mechanisms which allow for extra costs to be added to base costs in a range of circumstances, such as rapid load growth associated with decarbonisation, mean that the final bill reductions are likely to be smaller than these base numbers. In our central southern England licence area, even in the unlikely event of all the uncertainty mechanisms triggering to their full extent, the distribution element of bills will still remain at RIIO-ED1 levels. In our north of Scotland licence area, only in the most extreme circumstances relating to unavoidable subsea expenditure, do we see bills rise, with a high probability that the distribution element of bills will remain flat over the period. A detailed breakdown of bills can be found in Chapter 19, Finance and Financeability.
Managing risk and uncertainty in the round
Our baseline funding requirement is proposed using a forecast of the latest robust and credible evidence available today. It meets Ofgem minimum requirements on needs case certainty and is inclusive of our ambitious efficiency savings. RIIO-ED2 will, however, be unprecedented as we deliver net zero against the backdrop of economic uncertainty. We must be balanced, yet agile in managing plan delivery and navigating changes which cause us to shift course.
Fundamentally we are required to manage both diversifiable and non-diversifiable risks and uncertainties. Non-diversifiable risks are correlated with the wider economy. They are managed through agreeing an efficient cost of capital, specifically setting the asset beta. Section F includes our proposals for financing parameters.
Diversifiable risks and uncertainties are specific to SSEN or our sector and our starting point is always that we should not seek to diversify all risks and uncertainties we face. We draw an important distinction between internal risks and external uncertainties. Internal risks need to be managed and mitigated by DNOs, such as supply chain delays due to Covid-19 and this will be managed in our approach to deliverability of our plan, detailed in Ensuring Deliverability and a Resilient Workforce (Chapter 16). Internal risks matter because they encourage innovation and further efficiencies which can benefit consumers as savings are shared as defined in the price control.
External uncertainties are ‘known unknowns’ outside our direct control, which drive a significant change in investment scale. These uncertainties are dependent on policy, market, or stakeholder needs evolving. An example is decisions on net zero, which will lead to increased electric vehicle uptake. We manage external uncertainties through Uncertainty Mechanisms (UMs) which adjust specific investment areas (both up and down) triggered by distinct external shifts. In Uncertainty Mechanisms (Chapter 17), we set out our proposals for nine additional UMs, building on the confirmed common UMs Ofgem will apply across the sector. Our UMs retain optionality and agility to deliver net zero and stakeholders’ evolving expectations. They are targeted at areas where need has a high probability of changing and the variance is significant. They are not designed to be a disincentive to finding efficiencies or managing risks we should otherwise absorb as internal risks – rather they protect customers from having to pay in advance for something that is not yet certain.
However, with UMs there remains a ‘regulatory process and administration agility risk’ with their use. It is important Ofgem supports the speed our stakeholders drive us to deliver net zero. This means Ofgem must prioritise resources to administer UMs and they need efficient approval processes. In Uncertainty Mechanisms (Annex 17.1) we outline further details of changes required.
Uncertainty Mechanisms proposed in our plan
Strategic investment
Distributed generation monitoring
Shetland
Subsea cables
Hebrides and Orkney whole systems
Ash dieback removal
Wayleaves and diversions
Polychlorinated Biphenyls
Opex adjustor
120.0
100.0
80.0
60.0
98.0
-4.4
9.24.5
3.5
-7.5-5.0 -2.4
-3.3
2.1 94.6 0.5 2.8 98.0
SE
PD
Do
me
stic
Bil
l Mo
vem
en
ts £
Impact on consumer bills
We recover our allowed revenue from customers through distribution use of system (DUoS) charges, with tariffs calculated using industry standard charging methodologies. The average domestic DUoS charges for the eight years of RIIO-ED1 are £98 for SEPD (our central southern England network) and £160 for SHEPD (our north of Scotland network). DUoS charges are just one part of the overall electricity bill paid by homes and businesses. The electricity bill comprises wholesale, network, environmental, operating and other costs and is typically around £575 for an average home of which 16% is DUoS.
Delivering this step change in customer and net zero outcomes and associated increase in baseline investment, does not, result in higher costs for our consumers in the RIIO-ED2 period.
In the same five-year period, using Ofgem’s financial parameters set out in its guidance and taking account of our base cost proposals, average bills would fall by £9.70 and £3.30 per annum for SEPD and SHEPD respectively.
This is due to a combination of factors within our control – including increased efficiency and innovation – coupled with changes made by the regulator to the underlying financial framework, including an extension to asset lives in the treatment of capital depreciation and proposed changes to cost of capital. A combination of all these factors leads to this forecast reduction in the average domestic bill in RIIO-ED2 compared to RIIO-ED1 even allowing for significantly higher investment3. A breakdown of these factors, for our SEPD region, is displayed below.
3 Calculated using industry standard 8-year RIIO-ED1 average and 5-year RIIO-ED2 average.
RIIO-ED1 Average Bill
Incentives/Legacy DPCR4 Losses
Increase Totex (Fast)
Capitalisation Rate
Increase In RAV
Rate of Return Change in Asset Life
Passthrough/ Other
Ongoing Efficiency
RPE RIIO-ED2 + OE + RPE
CVP UMs RIIO-ED2 + UMS + CVP
SEPD Domestic bill movements (£ in 2020/21 prices)

15 | Executive Summary
5.2 Consumer Value Propositions
OUTPUTS AND CONSUMER VALUE PROPOSITIONS (CVP)
Our plan contains 64 outputs including five Consumer Value Propositions (CVPs), distributed across the chapters in Sections B to E of our plan.
5.1 OutputsAlongside our business plan goals, our outputs represent the ambition we share with our communities and have co-created with our stakeholders, responding to the opportunities and challenges driven by external factors including net zero and the climate emergency. They are aligned to the requirements of the regulatory framework and the obligations we hold under our licence.
The outputs are listed at the beginning of each chapter where they apply. In each case, we have identified the output category, cost of delivery, and what we will achieve for consumers and customers.
All of our outputs and our level of ambition will continue to be tested via our extensive and ongoing enhanced engagement programme.
We have applied the DNO joint social value framework and associated Social Return on Investment (SROI) model to quantify the consumer benefits of our five CVPs and 14 additional outputs. Our assessments have been independently measured and verified, providing assurance and confidence that the values presented are conservative, comparable and consistent with the industry standard approach.
5
OUR STRATEGIC OUTCOMES
OFGEM CVP PRIORITY AREA
OUR CVP PACKAGE
WHOLE SYSTEM DSO ENVIRONMENT VULNERABLE CUSTOMERS
Energy efficiency accelerator and local and
community flexibility market stimulation
Protecting marine biodiversity:
life below water
Personal Resilience Plans
Supporting broadband to island communities
through our assets
Embedded whole systems support services for local
authorities
£7.1m Net Consumer Benefit
£3.9m Net Consumer Benefit
£4m Net Consumer Benefit
£27m Net Consumer Benefit
£11.2m Net Consumer Benefit
£53M POSITIVE IMPACT ON SOCIETY
The current pandemic, climate crisis and outcome of COP26 have reinforced the urgent need to act. Our holistic package of CVPs is designed to bridge the gap between words and action, by going the extra mile to deliver value to consumers and wider society before it’s too late.
These proposals have been developed and tested with our stakeholders and customers and are collectively designed to drive complementary value across different parts of our plan. We have established why, as a DNO, we are best placed to undertake these activities and how consumers will benefit.
Overall, our package of proposals will deliver over £50m in net consumer benefits and wider public value, from enabling those in vulnerable situations to better prepare and cope with unforeseen events, through to restoring ancient seagrass beds and biodiversity under the seas, and delivering a truly whole systems solution to bridging the digital divide.
Our proposals align with Ofgem’s CVP categories of vulnerability, DSO, whole systems and environment. All of our CVPs meet Ofgem’s requirements to deliver at least £3m in net consumer value, as outlined in the table below.
Further information on our proposals is available in relevant chapters and in our CVP annex, which also details our extensive stakeholder engagement and robust Social Return on Investment analysis.

16 | Executive Summary
Consumer Value Proposition Chapter Proposition Aspiration
Costs £m
Gross Consumer
Value, PV £m
Net Consumer
Value, PV £m
Embedded whole systems support services for local authorities
Whole Systems
Providing embedded support and resource to enable 72 Local Authorities and up to 200 Community Groups to optimise their use of the electricity network and plan whole system opportunities to facilitate the net zero transition.
Deliver net zero capabilities at pace, helping build capabilities beyond SSEN and embed skills for societal benefit. Enable more efficient siting of infrastructure, such as Electric Vehicle charging hubs and heat pump trials, reducing long-term costs.
12.3 22.9 11.2
Energy efficiency accelerator for smarter networks and local and community flexibility market stimulation (combined)
DSO
Partnering to deliver energy efficiency at targeted points on our network supporting a reduction in bills and providing direct energy efficiency improvements to 112,000 households.
Facilitate up to 7,000 LCT installations as part of Market Flex Stimulation, supporting 50 Constraint Managed Zones across RIIO-ED2.
Reduce costs to customers by partnering to deploy energy efficiency measures where these are likely to have the most significant benefit on alleviation of network constraints, prioritising areas with high levels of vulnerability or fuel poverty.
Ensure all customers are able to access and benefit from the future energy system, including participating in flexibility markets, and benefiting from them.
36.8 40.9 7.1
Protecting marine biodiversity: life below water
EAP
Plant up to 17 hectares of seagrass meadows during RIIO-ED2, aiding biodiversity recovery, supporting climate adaptation pathways, and provide carbon sequestration as an alternative to offsetting.
Contribute to a 1.5°C Science Based Target pathway and recognise our role in supporting biodiversity and delivering wider societal benefits. Encourage other DNOs and large corporations in the UK to look at our waters as key environmental protection zones.
2.6 5.8 3.4
Supporting broadband to island communities through our assets
Whole System
Support the delivery of broadband services to 14 remote communities through a whole systems solution to utilise the fibre in our subsea cables, creating significant wider societal benefits.
Challenge typical limitations and look for lowest whole systems solutions, using our asset base for public good. Encourage wider customer benefits through using the fibre network to share data and enable systems, such as future flexibility markets. Empower customers to participate in the energy transition and make more informed decisions as the future market opportunities develop.
8.0 34.5 27.0
Personal Resilience Plans
Vulnerability
Targeted, personalised and proactive personal resilience support to a total of 420,000 new and existing PSR customers, providing up to 21,000 battery packs to new and existing PSR1+ customers.
Aspiration for all PSR customers to have a PRP. We want to help all customers with personalised advice relevant to them about what to do if there is an interruption or emergency situation. New base level PSR offering in RIIO-ED3.
7.3 10.7 3.9
TOTAL 67.0 114.7 52.6
Overview of our CVP package (net benefits)

17 | Executive Summary
KEY CHANGES SINCE DRAFT AND OUR UNDERLYING ASSUMPTIONS
Our draft plan has continued to evolve in response to feedback from our stakeholders and the further refinement of our analysis and evidence-base. We provide an overview of changes since our draft plan in the remainder of this section and outline the key assumptions which underpin our proposals.
6
Overarching Plan Changes
Overall reduction in our baseline ask
• By refining our analysis, we have reduced our baseline ask by overall £151m. While in some areas we have increased our ask, for example in relation to PCBs, we have identified further savings and efficiencies elsewhere.
• As part of this, we have also considered the balance of costs funded through our baseline vs uncertainty mechanisms. In line with regulatory engagement, we have identified further discrete spend which can be funded through uncertainty mechanisms.
Efficiencies
• While we consider a 0.5% p.a. ongoing efficiency target to be appropriate for the sector for the reason outlined in our draft business plan, we recognise that our current efficiency performance requires improvement. As such, we are proposing a more aggressive stretch ongoing efficiency assumption of 0.7% p.a., equating to £141m.
• We have developed an efficiency trace showing the detailed breakdown of efficiencies mapped to cost categories, which also shows cost avoidance and Closely Associated Indirect relationships. This totals £269m of cost reductions.
CVPs• We have further developed and refined our CVP proposals, in collaboration with our stakeholders. Our business plan now
includes a fully-costed package of CVPs, supported by robust analysis on Social Return on Investment (SROI).
Incentives• Ofgem has yet to define key incentives such as the Strategy Delivery Incentives (SDIs). Recognising that final incentive design
will need to be consulted on at the very latest as part of draft determinations, we have proposed our own detailed design for these incentives in our business plan.
Key changes since draft plan Business plan assumptions
Vulnerability• We have increased our ambition in this space and provided
more detail on key activities to support fuel poor customers and those in vulnerable situations as we transition to net zero.
• Our business plan assumes a growing role for DNOs in supporting their communities as we transition to net zero, in line with Ofgem’s Business Plan Guidance.
Digitalisation
• Our IT, OT and digitalisation activities are central to delivering key outputs and consumer benefits across our plan. We have therefore clarified how our digital investments support our strategic outcomes and the outputs and activities we have co-created and/or tested through our enhanced engagement processes.
• Our business plan is designed to ensure that we place digitalisation at the heart of our activities, from how we manage our assets to the services we provide to our customers.
Key changes since draft plan Business plan assumptions
Deliverability assessment and efficiencies
• We have reduced specific work volumes based on a more detailed deliverability assessment and applied efficiencies of £184m in areas where we recognise there is more we can do to drive down cost.
• n/a
Investment justification• We have improved the justification for our baseline investments
based on feedback from our stakeholders, and provided greater transparency on how activities compare to RIIO-ED1.
• n/a
Supporting the Scottish Islands
• We have refined our strategy to ensure a reliable and sustainable service to the islands with a strong focus on identifying whole systems solutions.
• Our business plan includes projects in the baseline, as it is vital we are able to upgrade our fleet of subsea cables in a timely manner where a whole systems solution cannot be identified, therefore ensuring customers and communities continue to receive a high-level of service.
Improving reliability
• We have carried out a detailed assessment of the activities required to improve reliability for our customers and meet our Interruptions Incentive Scheme (IIS) targets. Our plan includes targeted investment supported by robust cost-benefit-analysis (CBA).
• Incentive targets should always be set in such a way that drives efficient behaviour. The cost of meeting targets should not exceed the value to consumers. We have based our choice of investments in our plan on this principle.
Section B: A Valued and Trusted Service for Our Customers and Communities
Section C: A Safe, Resilient and Responsive Network
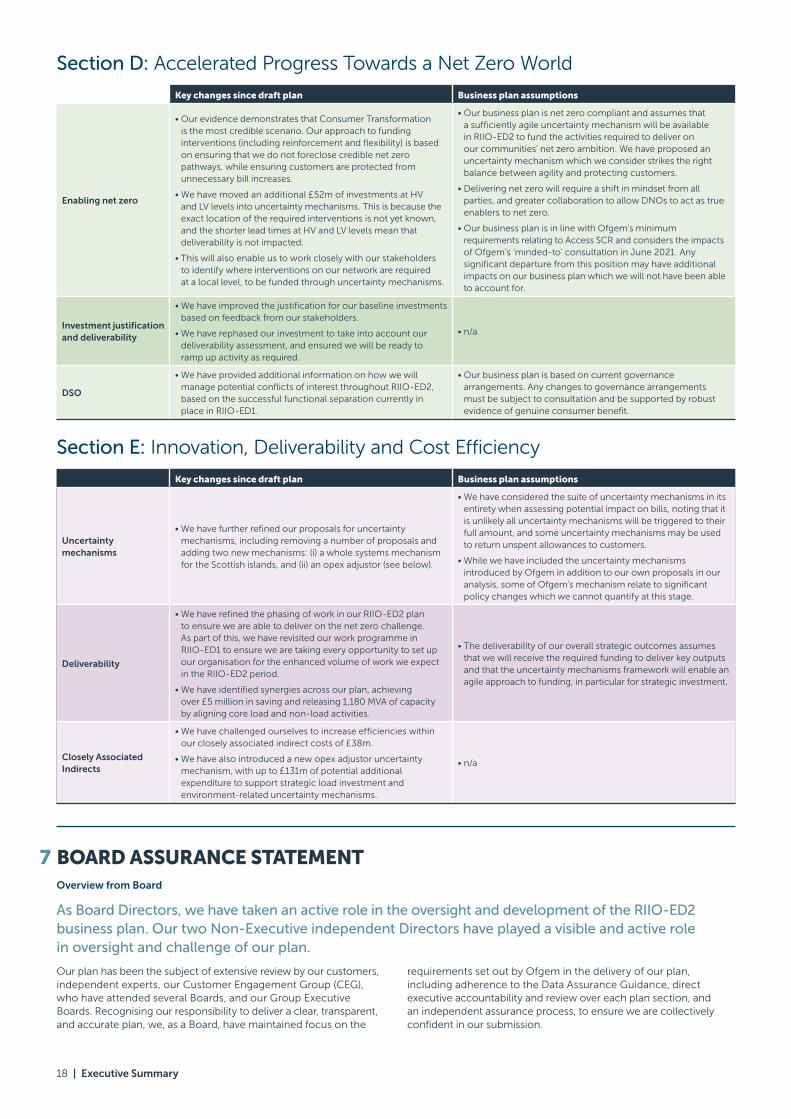
18 | Executive Summary
Key changes since draft plan Business plan assumptions
Uncertainty mechanisms
• We have further refined our proposals for uncertainty mechanisms, including removing a number of proposals and adding two new mechanisms: (i) a whole systems mechanism for the Scottish islands, and (ii) an opex adjustor (see below).
• We have considered the suite of uncertainty mechanisms in its entirety when assessing potential impact on bills, noting that it is unlikely all uncertainty mechanisms will be triggered to their full amount, and some uncertainty mechanisms may be used to return unspent allowances to customers.
• While we have included the uncertainty mechanisms introduced by Ofgem in addition to our own proposals in our analysis, some of Ofgem’s mechanism relate to significant policy changes which we cannot quantify at this stage.
Deliverability
• We have refined the phasing of work in our RIIO-ED2 plan to ensure we are able to deliver on the net zero challenge. As part of this, we have revisited our work programme in RIIO-ED1 to ensure we are taking every opportunity to set up our organisation for the enhanced volume of work we expect in the RIIO-ED2 period.
• We have identified synergies across our plan, achieving over £5 million in saving and releasing 1,180 MVA of capacity by aligning core load and non-load activities.
• The deliverability of our overall strategic outcomes assumes that we will receive the required funding to deliver key outputs and that the uncertainty mechanisms framework will enable an agile approach to funding, in particular for strategic investment.
Closely Associated Indirects
• We have challenged ourselves to increase efficiencies within our closely associated indirect costs of £38m.
• We have also introduced a new opex adjustor uncertainty mechanism, with up to £131m of potential additional expenditure to support strategic load investment and environment-related uncertainty mechanisms.
• n/a
Section E: Innovation, Deliverability and Cost Efficiency
BOARD ASSURANCE STATEMENT Overview from Board
As Board Directors, we have taken an active role in the oversight and development of the RIIO-ED2 business plan. Our two Non-Executive independent Directors have played a visible and active role in oversight and challenge of our plan.
Our plan has been the subject of extensive review by our customers, independent experts, our Customer Engagement Group (CEG), who have attended several Boards, and our Group Executive Boards. Recognising our responsibility to deliver a clear, transparent, and accurate plan, we, as a Board, have maintained focus on the
requirements set out by Ofgem in the delivery of our plan, including adherence to the Data Assurance Guidance, direct executive accountability and review over each plan section, and an independent assurance process, to ensure we are collectively confident in our submission.
7
Key changes since draft plan Business plan assumptions
Enabling net zero
• Our evidence demonstrates that Consumer Transformation is the most credible scenario. Our approach to funding interventions (including reinforcement and flexibility) is based on ensuring that we do not foreclose credible net zero pathways, while ensuring customers are protected from unnecessary bill increases.
• We have moved an additional £52m of investments at HV and LV levels into uncertainty mechanisms. This is because the exact location of the required interventions is not yet known, and the shorter lead times at HV and LV levels mean that deliverability is not impacted.
• This will also enable us to work closely with our stakeholders to identify where interventions on our network are required at a local level, to be funded through uncertainty mechanisms.
• Our business plan is net zero compliant and assumes that a sufficiently agile uncertainty mechanism will be available in RIIO-ED2 to fund the activities required to deliver on our communities’ net zero ambition. We have proposed an uncertainty mechanism which we consider strikes the right balance between agility and protecting customers.
• Delivering net zero will require a shift in mindset from all parties, and greater collaboration to allow DNOs to act as true enablers to net zero.
• Our business plan is in line with Ofgem’s minimum requirements relating to Access SCR and considers the impacts of Ofgem’s ‘minded-to’ consultation in June 2021. Any significant departure from this position may have additional impacts on our business plan which we will not have been able to account for.
Investment justification and deliverability
• We have improved the justification for our baseline investments based on feedback from our stakeholders.
• We have rephased our investment to take into account our deliverability assessment, and ensured we will be ready to ramp up activity as required.
• n/a
DSO
• We have provided additional information on how we will manage potential conflicts of interest throughout RIIO-ED2, based on the successful functional separation currently in place in RIIO-ED1.
• Our business plan is based on current governance arrangements. Any changes to governance arrangements must be subject to consultation and be supported by robust evidence of genuine consumer benefit.
Section D: Accelerated Progress Towards a Net Zero World

19 | Executive Summary
We have taken a risk-based approach to our assurance framework based on best practice, adopting a ‘three-lines of defence model’. This model provides a flexible and iterative view that allows us to adapt as our business plan develops.
We, as a Board, have considered the financeability of our RIIO-ED2 plan and are satisfied that the licencee is technically financeable on both a notional and actual capital structure, and that all applicable measures to aid financeability have been considered, including supporting evidence and justification, in support of this submission of our final plan. We do however see adverse impacts on credit financeability in RIIO-ED2 as a result of Ofgem’s proposed Cost of Equity, which should be addressed in Ofgem’s Determinations.
Governance arrangements for developing our plan
Good governance and dedicated resource have been a cornerstone of our plan development. A RIIO-ED2 Executive Sub-committee comprised of our executive directors, each of whom has direct accountability for individual plan components, was established early in the process. This committee oversees the strategic direction, progress, management of risk, and assurance of our business plan. Reporting into this board is a team of experienced senior staff who have been dedicated to the development of our plan since early 2020, working in partnership with colleagues across the business to maintain a clear focus on accurate and robust proposals, a smooth transition from RIIO-ED1 into an ambitious RIIO-ED2 period, and to ensure our proposals are deliverable and meet the needs of consumers.
In addition to the RIIO-ED2 Sub-committee, our RIIO-ED2 leadership team has maintained regular engagement throughout the development of the plan with our Chief Executive in a dedicated RIIO-ED2 executive forum, as well as regular engagements with our PLC Board and Executive Committee. These additional governance forums have carried out deep-dive reviews on our plan alongside key areas of strategy, customer feedback, bill impact and financeability.
Our approach to assurance
We recognise the importance of a robust assurance process to drive confidence that our plan is accurate, efficient, and one that shows ambition in meeting the needs of our stakeholders. Our business has a clear internal controls framework that was augmented for our business plan in an industry recognised ‘three lines of defence approach’. We, as a Board, have maintained oversight of the assurance process, from its development for RIIO-ED2 through to its application for our draft and final submission. We also recognise the input of our Customer Engagement Group in their review, challenge and input into our assurance process.
Independent assurance and specialist insight in our plan has been an essential ingredient in producing an accurate, efficient plan that meets the needs of stakeholders. We have engaged independent assurance reviews in these key areas to provide a robust assessment in how we have addressed stakeholder feedback, provide assurance on the clarity, transparency and robustness of our investment proposals and accompanying justifications, assurance that our IT portfolio is based on a fair and reasonable cost profile, and assurance that our governance and controls are appropriate and in compliance with the requirements of Ofgem’s Data Assurance Guidance (DAG).
Board assurance of our business plan
We, as a Board, have maintained clear and regular oversight in the development, assurance and submission of our RIIO-ED2 business plan. The RIIO-ED2 team provided a detailed overview of the content of the final RIIO-ED2 business plan submission at a series of meetings in October and November 2021.
Members of the Board acknowledged and confirmed that the plan properly set out the level of assurance that has been provided by the directors, in terms of being satisfied that the associated costs have been tested for accuracy, ambition and efficiency, all in compliance with the Ofgem Business Plan Guidance for this submission of the RIIO-ED2 business plan.
The Board also acknowledged and confirmed that the Directors are satisfied that the licencee is technically financeable, but consider that Ofgem’s proposed Cost of Equity shows an adverse impact on credit financeability. Members of the Board recognise that to ensure credit financeabiity over the short and long term will need to be addressed as part of Ofgem’s Determinations, in order to support the significant investment needed to transition to net zero.
The Board acknowledged and confirmed that they were satisfied that the directors had provided the level of assurance required by and in compliance with the terms of the Ofgem Business Plan Guidance, and were satisfied that the accuracy and quality assurance processes in place ensures that the Board has had the opportunity for oversight and input throughout the development of the RIIO-ED2 business plan and that it is in the best interests of existing and future consumers.
“Our ongoing engagement with the RIIO-ED2 project team provides me with confidence that our ambitious business plan has been built to deliver on the needs of our customers and stakeholders and allows us to take a leading role in delivering a sustainable net zero carbon future. I am confident we have produced a strong, financeable plan that our management team will successfully deliver in the years to come.“
DAVID RUTHERFORD Senior Independent Director, SSEPD Board
“The plan is founded on a robust governance framework with a comprehensive assurance programme around its accuracy, ambition and efficiency. As a Board, we have had close engagement with the RIIO-ED2 project team and are satisfied that the plan has been extensively challenged and reviewed. I particularly welcomed the input of the Customer Engagement Group and their regular interactions with the Board.”
GARY STEEL Senior Independent Director, SSEPD Board

20 | Section A: Introducing our Networks, Track Record and Enhanced Engagement
SECTION A: INTRODUCING OUR NETWORKS, TRACK RECORD AND ENHANCED ENGAGEMENT
We own and operate the electricity networks that serve communities from the Highlands of Scotland to the south coast of England. We’re proud of the service we’ve delivered during RIIO-ED1 and have worked extensively with customers, communities and stakeholders to make the right changes to our business that will prepare us for the significant energy system transformation expected over the next decade.
Our Track Record chapter includes a number of successful projects that demonstrate our commitment to whole system delivery, and how local solutions, co-created with stakeholders, have fully informed our approach in RIIO-ED2.
We engaged with over 25,000 stakeholders, to listen to their concerns and capture their priorities, and for them to challenge us and our approach to managing the networks over the next five years and beyond. This is the deepest, most comprehensive consultation we have ever undertaken and our commitment to continuing enhanced engagement will help deliver further improvements in RIIO-ED1 so that we enter RIIO-ED2 from a position of strength, agility and efficiency.
Chapters in this section
Chapter 1: Our Communities
Chapter 2: Track Record
Chapter 3: Enhanced Engagement

South East
Ridgeway
Wessex
Thames Valley
Weymouth
Poole
Reading
Swindon
Oxford
Abingdon
Bracknell
Bicester
Wareham
Dorchester
Bournemouth
Winchester
Alton
Henley
AldershotBasingstoke
Newbury
Lyndhurst
Newport
Christchurch
Salisbury
Andover
High Wycombe
ChiswickChippenham
Marlborough
Slough
Egham
Fareham
SouthamptonYeovil
Portsmouth
Chichester
Shaftesbury
Trowbridge
Cirencester
Chobham
Frome
Southern Electric Power Distribution (SEPD)Over 7 million people live and work in our central southern England network, which serves 3.1 million homes and businesses and has the highest concentration of UK headquarters of global companies outside of London. This region is one of the most culturally diverse areas in the UK, with over 150 languages spoken and considerable population growth anticipated over the coming decade.
Aberdeen
DundeeCrianlarich
Fort William
Mallaig
Stornoway
Wick
Inverness
Kirkwall
Lerwick
Shetland Islands
Thurso
Kyle ofLochalsh
PerthOban
Highlands and Islands
South Caledonia
North Caledonia
21 | Section A: Chapter One: Our Communities
CHAPTER ONE: OUR COMMUNITIES
UNDERSTANDING OUR NETWORK AREAS
The diverse demographics and unique geographies of our central southern England and north of Scotland licence areas are already experiencing changing network demands, new environmental factors and evolving customer expectations in different ways. This requires us to be agile in our approach to investment and service provision for the communities we serve.
Scottish Hydro Electric Power Distribution (SHEPD)Our north of Scotland network is a key part of the UK’s renewable economy and our infrastructure provides essential services, as well as critical environmental and economic benefits to Scotland and its communities. This network covers some of the most remote and sparsely populated areas of Great Britain, with roughly 14 customers per square km, and experiences some of the highest levels of fuel poverty, with 28.3% of customers considered to be fuel-poor.
ssen.co.uk/WhereWeOperate/
SUPPORTING DOCUMENTS
780,000 customers (2% of UK population) living in 25% of the land mass
28.3% customers in fuel poverty
156,938 PSR customers (20% of customer base)
13 local authority areas, of which 64% have declared a climate emergency
49,152km of overhead lines and underground cables with 59 island communities supplied via 110 subsea cables totalling 454km
44% of properties off-gas grid, the highest proportion in the UK
69% increase in solar, wind, hydro and marine generation anticipated between 2019 and 2030
Customer base profile
Emerging factors
Network characteristics
7 million people across 3.1m homes and businesses
9.3% customers in fuel poverty
617,803 PSR customers (20% of customer base)
59 local authority areas, of which 78% have declared a climate emergency
Electric vehicle (EV) take-up above GB average and trajectory expected to remain until late 2020s
13 proposed new data centres totalling 665MW during 2020s, representing significant new demand
Increased risk of flooding, extreme heat and longer growing seasons are likely to impact our network
Customer base profile
Emerging factors
Network characteristics

SSEN
Business Plan commitments Output Measure
2015 /16
2016 /17
2017 /18
2018 /19
2019 /20
2020 /21
Reliability and Availability
Number of Interruptions (CI)
Number of Minutes Lost (CMLs)
Environment
BCF (excl. losses)
SF6
Fluid-filled cable leakage
ConnectionsTime to Quote and Time to Connect
Connections GSoPs
Customer ServiceCustomer Satisfaction
Complaints Metric
Social Obligations Stakeholder Engagement and Customer Vulnerability
Safety Total Recordable Incident Rate
22 | Section A: Chapter Two: Track Record
CHAPTER TWO: TRACK RECORD
INTRODUCTION
We are proud of the service we have delivered to our customers during RIIO-ED1. We’ve made changes to our business to help improve performance for our customers and prepare for the significant energy system transformation we will experience over the next decade.
Our main focus has been threefold: 1) deliver a step-change improvement in our customer service 2) start the investment needed to build the capabilities needed to deliver net zero and 3) maintain our leading safety record and reduce our own business carbon footprint.
There have been a number of challenges and opportunities across the RIIO-ED1 period – the Covid-19 pandemic, Brexit, the increasing impact of climate change, advances in battery technology, cyber security threats and a growing ability to process and manage ‘big data’. Many of these were unimaginable when we developed our
RIIO-ED1 plan back in 2013/14. As a business, we have risen to and adapted to these challenges. In some cases, they have led to us choosing to invest more of our shareholders’ money in order to deliver on our priorities and the excellent, world-class service that customers and society expect.
The next decade will bring significant change. We’re preparing for RIIO-ED2 by investing in our digital capabilities and expanding our data-driven decision-making processes. We will continue to deliver further improvements in RIIO-ED1 so that we enter RIIO-ED2 from a position of strength, agility and efficiency.
DELIVERING OUR OUTPUTS
We are performing well against most of our outputs to date, delivering significant improvements in service levels for our customers. We recognise that in some areas, particularly environment, our performance still needs to improve, and we face specific challenges in SHEPD, where diesel generation continues to play a key role in security of supply.
In this chapter, we have shown performance based on Ofgem’s Electricity Distribution annual reports1, annual Business Plan Commitment report,2 and other regulatory reporting to Ofgem. Information on how we compare against our peers is also available on Ofgem’s website. Typically, we have used 2019/20 data as this is the last complete data set available and the last year for which an Ofgem annual report is available. Where updated 2020/21 information is available, we have provided additional information in the relevant chapters.
Figure 2.1 below provides an overview of how we have performed against key outputs3. We explain our performance below the table, along with how our performance links to our proposed activities in RIIO-ED2 throughout our business plan.
1
OVERVIEW OF OUR PERFORMANCE AGAINST KEY OUTPUTS
1 https://www.ofgem.gov.uk/publications/riio-1-electricity-distribution-annual-report-2019-20 2 https://www.ssen.co.uk/DistributionPriceControlReview/ 3 The RAG status is based on Ofgem’s assessment in the Electricity Distribution Annual Reports: https://www.ofgem.gov.uk/publications/riio-1-electricity-distribution-annual-report-2019-20.
This does not provide an assessment for Environment or Safety, so we have used our self-assessment: Green shows met target, amber if up to 20% exceeded and red above 20%.

23 | Section A: Chapter Two: Track Record
1.1 Customer satisfaction 1.1.1 Overview of performance
1.2 Connections 1.2.1 Overview of performance
Figure 2.1: Overview of RIIO-ED1 Customer Satisfaction performance
Figure 2.2: Time to Quote (TTQ) and Time to Connect (TTC) for connection activities relating to no more than four domestic premises or one-off industrial and commercial work (LVSSA/LVSSB)
Customer satisfaction has been a key business focus in RIIO-ED1 and we have improved our performance, with satisfaction levels increasing from 84.5% at the start of RIIO-ED1 to 89.2% in March 2021 across both our networks – well above the Ofgem target of 82%. We are proud of this improvement, which has improved our relative performance compared to other DNOs.
Our strong performance in RIIO-ED1 is due to the implementation of a regional operating model which has allowed us to get closer to our customers and communities. This allows bespoke engagement with our customers and a more tailored customer service experience on the back of that engagement. This has worked particularly well in SHEPD, where we have consistently ranked in the top five across all DNOs, but has taken longer to embed in SEPD.
We have performed consistently well under the Complaints Metric, and since 2016/17 we have met our RIIO-ED1 commitment of resolving over 70% of complaints within one day.
1.1.2 What this means for RIIO-ED2
While we have delivered good performance overall, and we have consistently achieved industry-leading scores in SHEPD, we want to do more to meet our customers’ expectations in our SEPD network. We have put in place a programme of activities to ensure we can deliver similar levels of satisfaction across our entire network. We detail our approach to improving our performance in IT and Digitalisation (Chapter 5).
Building on our broader customer-focused approach, we have recorded an 9% increase in our connections’ customer satisfaction (as shown in Figure 2.1). We have made a suite of investments in people and systems to improve our connections performance. This has allowed us to deliver close to 50% outperformance against our targets in our time to quote, with similar performance on Time to Connect in SHEPD. However, in SEPD we have seen a significant increase in connection requests. The investments and process changes we have made have allowed us meet our Time to Connect targets in most years. However, our ambition was to deliver the same type of improvements as in SHEPD. To do this we are planning additional investment in the remainder of RIIO-ED1, including developing a self-serve connections platform for our customers to use.
1.2.2 What this means for RIIO-ED2
The sharp rise in connections we have seen in SEPD has given us some insights into the type of challenges we are likely to face in RIIO-ED2. We are making investments and changes in processes in RIIO-ED1 and this will need to continue into RIIO-ED2, particularly resourcing up teams to manage a higher volume of design work, with a focus on quicker initial job assessments, and improved wayleaves management to secure consents faster and more proactive communication with customers.
SSEN2015/
162016/
172017/
182018/
192019/
202020/
21
Interruptions 8.73 8.93 8.99 8.99 8.95 8.91
Connections 8.22 8.32 8.35 8.69 8.90 8.93
General Enquiries 8.63 8.80 8.64 8.83 8.97 8.90
Overall 8.45 8.60 8.60 8.81 8.93 8.92
Ofgem Target 8.20 8.20 8.20 8.20 8.20 8.20
Targets for 2015/16 to
2018/19 2015/16 2016/17 2017/18 2018/19
Targets for 2019/20 to
2022/23 2019/20 2020/21
SHEPD
LVSSATTQ 8.21 2.5 3.6 4.22 2.86 4.84 3.26 3.79
TTC 42.08 31.5 30 27.84 22.1 39.28 17.13 19.51
LVSSBTTQ 11.73 5.1 7.2 9.02 5.34 7.84 4.13 4.46
TTC 52.7 40 40.4 28.76 27.8 47.94 21.11 24.68
SEPD
LVSSATTQ 8.21 2.7 2.7 3.41 3.11 4.84 3.01 3.56
TTC 42.08 33.2 44.3 45.71 31.84 39.28 29.29 41.99
LVSSBTTQ 11.73 6.9 7.2 9.28 8.65 7.84 4.53 5.47
TTC 52.7 45 63.7 64.01 40.29 47.94 34.87 54.35
SSEN
LVSSATTQ 8.21 2.60 3.15 3.82 2.99 4.84 3.14 3.68
TTC 42.08 32.35 37.15 36.78 26.97 39.28 23.21 30.75
LVSSBTTQ 11.73 6.00 7.20 9.15 7.00 7.84 4.33 4.97
TTC 52.7 42.50 52.05 46.39 34.05 47.94 27.99 39.52

24 | Section A: Chapter Two: Track Record
As illustrated in Figure 2.3, historically, our performance on the SECV incentive has not been as strong as our peers’. We have clearly acknowledged our underperformance in this area and in 2018-19, we introduced a dedicated improvement plan. This had the objective of expanding our engagement with both vulnerable customers and stakeholders who work closely with vulnerable customers. This led to a rapid expansion of our Priority Services Register and a significant increase in the number of vulnerable or at-risk customers we support.
Our Priority Services Register (PSR) now captures 770,000 households who we provide additional support to. Separately,
Our reliability targets for RIIO-ED1 have been challenging, particularly in our SHEPD area where we cover large remote areas and island communities. Despite this, Figure 2.4 shows that, on the whole we have met our output targets. When compared to the last price control (DPCR 5), this represents a significant improvement for customers. Unplanned customer interruptions have fallen by 17% and customer minutes lost (CML) by 25% since 2012/13. These improvements have been driven by increased automation equipment (Adaptive Power Restoration System – APRS) being installed on key circuits along with the roll-out of automatic fuse replacement (Bidoyngs) which have helped to avoid over 2,300 supply interruptions. These investments have allowed us to stay broadly in line with Ofgem’s challenging reliability targets in RIIO-ED1.
We also committed to reducing the number of our worst-served customers (who suffer at least three unplanned supply interruptions within 12 months) by 30%. To date we have delivered a 66% reduction in SHEPD and 76% reduction in SEPD, and we are continuing with our programme.
We have used the RIIO-ED1 period to vastly improve the quality of our asset data. This has led to a more data-driven, risk-based approach to our asset management. Consequently, we are forecasting to deliver on our asset risk-reduction target in both networks (109% in SHEPD and 102% in SEPD).
1.4.2 What this means for RIIO-ED2
Throughout the Covid-19 pandemic and as we transition to RIIO-ED2, customers are becoming increasingly reliant on our services. We are focused on setting ourselves up for success during the remainder of RIIO-ED1, for example learning from others by deploying greater automation on our network. Our business plan will build on this approach further as explained in Maintaining a Resilient Network (Chapter 7), with a strong focus on well-justified investments and recognising that the cost of continued service improvements may outweigh the benefits to consumers. We also face specific challenges in our most remote communities, where it may not be possible or cost-efficient to restore supplies as fast as in other parts of the country. Please see Supporting the Scottish Islands (Chapter 8).
1.4 Reliability and availability 1.4.1 Overview of reliability and asset risk-reduction performance
UNPLANNED CUSTOMER INTERRUPTION PERFORMANCE
2015/16 2016/17 2017/18 2018/19 2019/20 2020/21
Performance Target Performance Target Performance Target Performance Target Performance Target Performance Target
SHEPD 63.62 66.90 62.59 66.60 51.91 66.20 65.07 65.90 59.58 65.30 60.65 64.10
SEPD 46.21 60.30 46.10 59.40 53.47 58.60 50.64 57.67 45.55 57.40 47.17 57.10
UNPLANNED CUSTOMER MINUTES LOST PERFORMANCE
2015/16 2016/17 2017/18 2018/19 2019/20 2020/21
Performance Target Performance Target Performance Target Performance Target Performance Target Performance Target
SHEPD 49.58 53.90 48.12 52.80 42.98 51.60 49.76 50.46 47.77 49.20 49.78 47.70
SEPD 38.12 48.10 39.20 47.10 44.27 46.20 46.26 45.27 42.27 44.40 41.73 43.50
Figure 2.4: Interruptions Incentive Scheme (IIS) performance for planned and unplanned interruptions
1.3 Social obligations 1.3.1 Overview of performance
Figure 2.3: Stakeholder Engagement and Customer Vulnerability (SECV) performance
DNO group2015/
162016/
172017/
182018/
192019/
202020/
21
ENWL 6.90 6.38 5.75 4.54 6.03 6.61
NPg 6.50 6.50 7.50 7.01 6.71 5.01
WPD 8.75 8.53 8.75 8.35 – –
UKPN 7.53 7.53 7.25 7.95 8.30 8.01
SPEN 6.78 6.28 6.35 6.71 6.85 7.08
SSEN 5.73 5.23 5.50 3.95 5.54 6.20
Target for reward 4.00 4.00 4.00 4.00 4.00 4.00
we have delivered extra support to 1,214 customers through our first-of-its-kind partnership with Citizens Advice Scotland. We are taking a leading role in working with the Centre for Sustainable Energy (CSE) on developing a Smart and Fair energy network. This has included commissioning surveys on fuel poverty levels to understand where to best target our efforts. Our approach to supporting customers in matters of fuel poverty has resulted in over 7,500 customers receiving direct support since 2016-17. We tailored our support for customers around the Covid-19 pandemic, providing targeted support to customers on their own.
As a result of these changes, we have seen significant increases in our SECV incentive performance for two years running. In 2019/20 and in 2020/21, we were the second-place DNO for the consumer vulnerability element. We are committed to continuously improving, and we carry out an annual independent assessment against the AA1000 Stakeholder Engagement Standard. In 2020-21, we undertook the full AA1000SES Health Check and were pleased to achieve a rating of ‘Accomplished’ on the maturity ladder. We are looking to build on this improvement for the remaining years of RIIO-ED1.
1.3.2 What this means for RIIO-ED2
The improvements we have made in our approach and process have been embedded. The new insights and stakeholder relationships which we have gained over the last few years have led to the successful co-creation of our business plan with our stakeholders to ensure that it delivers on their ambitions. Our Vulnerability Strategy builds on our flagship RIIO-ED1 activities, ensuring that all our customers benefit from services that meet their needs and are supported in the transition to net zero. Please see A Valued and Trusted Service for Customers and Communities (Chapter 4) for further information.

25 | Section A: Chapter Two: Track Record
1.5 Environment 1.5.1 Overview of RIIO-ED1 performance
1.6 Safety 1.6.1 Overview of RIIO-ED1 performance
Safety is our number one priority. Our ‘Safety Family’ culture empowers all our employees to apply our ‘if it’s not safe, we don’t do it’ philosophy, which we embed through training across our organisation. We monitor performance to ensure we maintain a downward trend in recordable injuries and continuously strive towards the goal of 100% of our employees going home safely every day. This downward trend is clearly shown in Figure 2.6 below and this performance comes on top of an already strong track record.
We have worked hard to develop and implement asset- management systems, policies and information to better understand our assets and their environments. These significant investments support and demonstrate our commitment to ensuring the integrity of our assets in the public domain. We have sharpened our focus on reducing damage from third parties and have increased our engagement with at-risk groups, such as farmers and agricultural workers, to raise awareness of the associated dangers of unintended damage to our network. We have seen a downward trend in reported incidents from the at-risk groups following our ‘Look Out, Look Up’ educational campaign, aligned with the introduction of the 105 national Network Operator contact number. We continue to apply our incident data and other intelligence to identify and promote safety to emerging at-risk groups.
During RIIO-ED1, our focus has been on better understanding our environmental impact and responding with appropriate mitigating actions. We have set ourselves a challenging target of a 15% reduction in our Business Carbon Footprint (BCF) (compared to 2012/13) and we are generally making progress towards this. We face unique challenges in the context of our SHEPD network, where diesel generation still plays a key role in ensuring security of supply. Last year we had a number of subsea cable faults which meant that we were reliant on those back up diesel plants. This caused us to miss our BCF target in that year.
Our SF6 targets are equally stretching, and we recognise that we are behind on them (as indicated in Outputs summary). However, we are starting to see the benefits come through from our switchgear replacement programme (implemented in 2019/20). We have more to do this in this area and will continue to build on our current activities and while still above target we are starting to see SF6 levels fall. If we continue to make the same progress, we will meet our target at the end of RIIO-ED1. We also continue to make progress on fluid-filled cables. Existing fluid-filled cables have been fitted with a tracer to allow us to efficiently locate and repair leaks. For new cables or asset replacement, we no longer install fluid-filled cables on our network.
We recognise the role we can play in reducing our emissions to help deliver net zero. As a sign of our ambition, we have been the first UK DNO to set 1.5°C-aligned targets validated by the Science- based Targets initiative, ensuring our actions and ambitions align with the latest climate science via a globally recognised and trusted platform.
1.5.2 What this means for RIIO-ED2
We will need to continue with our asset-replacement programmes in RIIO-ED2 to reduce our SF6 emissions and oil leakage, and this is a key focus of our RIIO-ED2 plan. We are also already looking at less carbon-intensive ways to maintain security of supply on the Scottish Islands. We are tendering for solutions which leverage battery technology and heat storage in order to reduce emissions and these are central to our RIIO-ED2 plan for an integrated energy solution for Shetland.
Figure 2.5: Business Carbon Footprint
90,000
80,000
70,000
60,000
50,000
40,000
30,000
20,000
10,000
2015/16 2018/192016/17 2019/202017/18 2020/21
Annual OutputRIIO-ED1 target
0
DNO group2015/
162016/
172017/
182018/
192019/
202020/
21
Total Recordable Incident Rate
0.31 0.25 0.17 0.22 0.27 0.14
HSE Reportable 6 7 6 4 6 6
Lost Time Injuries 2 3 1 1 1 0
Medical Treatment Injuries
20 11 7 12 12 6
Road Traffic Collisions
44 63 68 42 49 48
Figure 2.6: Health and safety incidents in RIIO-ED1
Figure 2.6: Health and safety incidents

26 | Section A: Chapter Two: Track Record
DELIVERING EFFICIENTLY AND INVESTING IN STRONG FOUNDATIONS
We are currently forecasting to overspend our RIIO-ED1 allowances by 3.4% across both our networks. In SEPD we are forecasting to overspend by 3.0% and 4.3% in SHEPD.
This is being driven by a need to invest in our people, systems and processes to deliver against our challenging RIIO-ED1 commitments and ensure that we are ready for RIIO-ED2. We have chosen to invest more in our people (business support costs), our processes (closely associated indirects), IT and systems. These investments have helped deliver our improvements in customer satisfaction and keep pace with a surge in connection requests on network. We have also found some areas where we have underspent against our allowances. For example, load on the network has not risen by as much as envisaged
in our business plan, so we have not had to provide as much additional capacity as forecast. Equally, our data-led approach to asset management is enabling us to meet our risk-reduction targets at lower cost. Finally, we are rolling out learning from innovation projects (some funded in the previous price control) and this has allowed us to deliver savings against our business plan.
Figure 2.7 below provides a summary of our forecast spend4 in RIIO-ED1 against our allowances. We provide more detail against each of the key areas of spend below.
2.1 Business Support Costs (BSCs)
These costs relate to our people and the internal IT systems to support our day-to-day work and managing our properties.
We are forecasting to overspend by 17% across licence areas. This is driven by:
• Additional resources driven by the move to a regional operating model: In RIIO-ED1 we have chosen to move to a regional operating model. This model has implemented separate regional call centres, more regional customer operations and regional stakeholder engagement teams. This move has helped improve our performance around customer satisfaction and stakeholder engagement, particularly in SHEPD. However, the resource costs associated with implementing this model have been higher than forecast, which has contributed to our forecast overspend;
• Business support costs relating to IT: We have made a number of IT investments to upgrade our systems and improve our data processing and management (see below for more details). This has required more licences and support to deliver our wider change programme. During 2020, we also rolled out IT changes to enable colleagues to work from home during the pandemic, and this workforce shift is expected to endure in the longer term to some extent.
What this means for RIIO-ED2
We believe that investing in these areas was the right thing to do for our customers – supported by our performance against our customer satisfaction outputs. It has demonstrated that as we enter RIIO-ED2, we will need to continue investment in many of these areas to manage the greater workload around connections and reinforcement as well as engaging at a local level to understand how best we can support our communities. As we transition into RIIO-ED2, we are assessing our workforce and deliverability needs, to ensure that we are in a position to support net zero and the transition to DSO roles and capabilities. We are also preparing for a step-change in activities, and our IT investment will be central to delivering efficiencies and supporting our workforce. More information can be found in Ensuring Deliverability and a Resilient Workforce (Chapter 16).
2
Figure 2.7: Summary of RIIO-ED1 allowances vs. forecast price base
RIIO- ED1 Totex Forecast
5,000
6,000
4,000
3,000
2,000
1,000
0
4,583
4 NOCs and Load show forecast spend without innovation savings.
IT
72
NOCs
80
CAI
176
BSC
81
Other
14
Load
-75
Non-Load
-107
Allowance
4,431
Innovation savings
-89
£m

27 | Section A: Chapter Two: Track Record
2.2 Closely associated indirects These costs cover vehicles and transport, the indirect costs of delivering capital programmes, wayleaves, and operational training.
We are forecasting to overspend these costs in both licence areas by 20% across both licensees.
• Additional engineers and system planners: Due to the increase in connection applications (particularly in SEPD), we have had to invest in more network-design engineers to deliver design schemes in quotes for customers. These additional resources have been needed to drive improvements around time to quote and to ensure that we can broadly meet our time to connect targets.
• Significant increases in wayleave costs: Over the course of RIIO-ED1, we have seen wayleaves become more difficult to secure. This has coincided with the need to deliver more capital programmes – mainly through connections’ activity. To meet this challenge, we have had to pay out more to property owners to secure wayleaves, recruit more staff who are trained in managing wayleaves and roll out training to upskill our existing staff. These needs were not envisaged at the time our RIIO-ED1 business plan was developed.
• Increased business separation around connections: During RIIO-ED1, we took the decision to have clear business separation between our connections team which interfaces with a competitive market vs. our connections team which provides non-contestable services. This ensures that our core non-contestable connections team treats all competitors in the same way it treats our in-house contestable connections team. We believe that it was right to implement this model as it has alleviated stakeholder concerns around facilitating competition in connections and contributed to our significantly improved performance under connections’ customer satisfaction. However, it was not envisaged in our RIIO-ED1 business plan and it has compounded the issues around increased system design costs as it requires two sets of design teams (one in the contestable team and one in the non-contestable team) to review the same connection schemes.
2.3 Information Technology and Operational Technology (IT and OT)
IT and OT costs cover the systems and technology which supports us in our activities.
We are forecast to overspend in this area in both licences by 69% across both licence areas. This is due to changing requirements and the need to improve the way we utilise asset data. We have run a significant IT Transformation programme in RIIO-ED1 which has been designed to address the lack of historic investment in previous price controls, while having an eye to RIIO-ED2 and ensuring a joined-up digital approach to how we manage and process data. In addition, we have risen to the new challenges around cyber security and made the investment to keep our network protected. The level of sophistication required of cyber security was not envisaged when RIIO-ED1 business plans were developed.
Our IT programmes will deliver significant benefits to customers today and tomorrow. For example, our investment in Geographic Information System (GIS) will deliver £12.9m of benefits in RIIO-ED1, with a further £18m of benefits in RIIO-ED2, against a cost of £17.6m as set out in IT and Digitalisation (Chapter 5).
What this means for RIIO-ED2
As we take greater steps towards full digitalisation and open data, we will need to continue investing in those systems that will support the delivery of net zero. IT and Digitalisation (Chapter 5) provides an overview of our investment proposals and how these will support the delivery of stakeholder priorities and cocreated outputs across our plan.
2.4 Network Operating CostsThis covers the costs of undertaking inspections and maintenance on our assets, managing and repairing faults, as well as activities to keep the network operating safely such as tree-cutting and overhead line clearances.
We are forecasting to overspend against our network operating costs. In RIIO-ED1, we have experienced some faults on key subsea cables connecting the Scottish Islands. We have had to replace these cables – at a cost of around £60m – and these costs were not included in our RIIO-ED1 business plan as our evidence at that time was that the cables were generally healthy. We also incurred costs of running diesel power stations to maintain security of supply on the islands. We have also incurred considerably higher costs around overhead line clearances (around £40m) than envisaged in our RIIO-ED1 business plan.
We have had no choice but to fund these activities in order to keep customers on supply and our network operating safely. This has led to overspend of 5% against our RIIO-ED1 allowances, which would have risen to 9% (£79m) had it not been for savings driven by our innovation portfolio – see Section 2.5 below.
What this means for RIIO-ED2
We will continue to look for innovative efficiency savings around our network operating costs, and the use of LiDAR to manage our overhead line network will drive significant efficiencies as highlighted in Safety and Compliance (Chapter 6). The RIIO-ED1 period has highlighted that this is an area where we did not have sufficient allowances and our RIIO-ED2 plan is more aligned with actual spend over the last 6 years.
2.5 Delivering savings to customers through innovation
Given our overspend in a number of areas we have leveraged our innovation programme to access where successful innovation can be deployed to deliver savings to customers.
We have a diverse and successful programme of innovation activities stemming from DPCR5 and continuing into RIIO-ED1. Accelerating some of these programmes is enabling us to deliver £89m of benefits by 2023, with further benefits forecast in RIIO-ED2. This includes ground-breaking projects like Local Energy Oxfordshire (LEO), one of the most ambitious, wide-ranging, innovative, and holistic smart-grid trials ever conducted in the UK. We have also successfully delivered two of the most innovative Network Innovation Competition (NIC) projects through TRANSITION and RaaS. These have provided valuable learning which has informed our approach to RIIO-ED2, particularly around our DSO plan, digitalisation and whole system activities.
Our business plan sets out our overarching innovation strategy for the period and how we will deploy existing innovations in RIIO-ED2. We are continuing with our approach of using innovation funding to incubate new ideas and, if they are successful, to deploy them into the business and scale up fast. Innovation will play a central role in enabling us to efficiently deliver the required step-change, supporting all our customers, including the most vulnerable. More information on RIIO-ED1 innovation and how we will innovate in RIIO-ED2 is available in Innovation (Chapter 14).

28 | Section A: Chapter Two: Track Record
2.6 Load-related expenditure
This covers the costs of accommodating load growth on our network (outside of that funded by connecting customers). These costs are incurred when we need to intervene due to the peak load on an asset exceeding (or due to exceed) its capacity. This can be triggered by load or generation increases on our network.
We are forecasting to spend 71% or more (accounting for innovative solutions) of our load-related allowance across SHEPD and SEPD. There are two main factors which have driven this:
• Peak load has been lower than anticipated: Peak demand on many of our assets is lower than was forecast in our RIIO-ED1 business plan. This means that we have had to make fewer interventions than forecast. This has been driven by a range of factors:
• We have seen slower than forecast economic growth, which combined with the Covid-19 pandemic has reduced peak demand in some areas of the network (particularly industrial areas);
• At a domestic level, the continued roll-out of energy efficiency measures has helped to curb the impact of peak load increases; and
• We have seen more Distributed Generation connect to our network (4GW in RIIO-ED1). For much of the price control period, the Transmission use of system-charging arrangements meant that suppliers were offered DG-strong incentives to generate at times of peak load (embedded benefits).5 This has the effect of netting off-peak demand on our assets.
The combined impact of these developments can be seen in Figure 2.8 and Figure 2.9 below; we have a number of assets on our network which are heavily loaded but have not exceeded capacity ratings (100%) and therefore required intervention. For example, in this year we have just 5% of our secondary transformers in SHEPD and 8% in SEPD, with a peak load which is at 100%+ of rated capacity. However, we have 14% of our transformers in SHEPD and 23% in SEPD which are above 60%-99% utilised. In RIIO-ED2, our Consumer Transformation scenario indicates that many of the assets in the 60-80% utilisation band will require interventions due to increased load growth.
5 This was recognised by Ofgem in its decision on CUSC modification CMP264 and CMP265: https://www.ofgem.gov.uk/publications/embedded-benefits-impact-assessment-and-decision-industry-proposals-cmp264-and-cmp265-change-electricity-transmission-charging-arrangements-embedded-generators
No. of Assets % of assets
1_0_19%_Loaded 8,318 18%
2_20_39%_Loaded 12,482 27%
3_40_59%_Loaded 11,414 24%
4_60_79%_Loaded 7,145 15%
5_80_99%_Loaded 3,684 8%
6_100_119%_Loaded 1,694 4%
7_120_149%_Loaded 1,092 2%
8_150%_Plus_Loaded 854 2%
Total 46,683 100%
Figure 2.8: Secondary Network utilisation in SHEPD and SEPD, based on best available data
No. of Assets % of assets
1_0_19%_Loaded 14,295 34%
2_20_39%_Loaded 12,431 30%
3_40_59%_Loaded 6,796 16%
4_60_79%_Loaded 3,713 9%
5_80_99%_Loaded 1,887 5%
6_100_119%_Loaded 879 2%
7_120_149%_Loaded 588 1%
8_150%_Plus_Loaded 1,089 3%
Total 41,678 100%
Equally, we have a similar story on our primary network, where we currently have few assets currently requiring intervention but substantially more which are 85% utilised or above.
LOAD DISTRIBUTION OF PRIMARY SITES IN 2021
Figure 2.9: Primary substation loading across SHEPD and SEPD
0
10
20
30
40
50
60
70
80
90
25-3
0%
35-4
0%
45-50
%
55-6
0%
65-70
%
75-8
0%
85-90%
95-10
0%
105-
110%
115-
120%
125-
130%
Assets to right ofhere beyond
nameplate capacity
DELIVERING A SMART ENERGY SYSTEM
FLEXIBILITY SOLUTIONS
We have introduced Constraint Managed Zones (CMZs), using flexibility to managed network constraints. Our first 6MW of live contracts were placed in Islay in our SHEPD region in October 2019. In the first year of operation, these contracts delivered £245k of benefits against traditional network support/restoration, and we secured over 5GWhs of energy from renewable sources as opposed to using diesel alternatives, offsetting c.2,500tCO2. We have now placed new contracts across 12 zones in both licence areas, totalling 446MW of live services. We also expect to release in the region of 40 new zones in the next financial year and are actively engaging to understand the flexibility that will be available in RIIO-ED2 across both our licence areas.
Our Network as a Net Zero Enabler (Chapter 10) and Distribution System Operation (Chapter 11) provide further information on how we will significantly scale up our activities in this space, taking a flexibility first approach to enabling the net zero transition.
WHOLE SYSTEMS SOLUTIONS
We have led the way in developing whole systems solutions, from our South West Active Network Project (SWAN) saving customers in excess of £500m in deferred transmission reinforcement through to the new energy solution for Shetland. Further information can be found in Whole Systems (Chapter 12).
LV MONITORING AND NETWORK VISIBILITY
Building on our New Thames Valley Vision innovation project, we have installed 340 LV substation monitors across our networks to date and procured over 700 monitors to be deployed in the remainder of the period. We are proposing a significant ramp-up in LV monitoring in RIIO-ED2. Our network visibility strategy will ensure we leverage all sources of available data, including LV monitoring, to understand power flows across our entire network.
SEPD 2021
SHEPD 2021

£105
£160
29 | Section A: Chapter Two: Track Record
2.7 Non-load related expenditure
This covers network resilience and asset replacement. Expenditure in this area is central to building strong foundations, to deliver net zero and climate change resilience. In RIIO-ED1 we are forecast to spend 92% of our allowances in this area.
This underspend has been driven by a data-led approach which has allowed us to deliver on our asset risk-reduction target more efficiently. We have also assessed where our programmes can deliver the best value to our customers. This had led to some specific replacement and refurbishment schemes which we have reprioritised based on the value they provided to customers.
What this means for RIIO-ED2
We are building on our revised approach in RIIO-ED1 and further improving our approach to managing subsea cables, so that we can increase resilience for our most remote communities.
Based on our risk-based approach, we have reprioritised some activities around refurbishment, repair and risking and lateral mains.
As can be seen from both graphs in Figure 2.10 above, the distribution component of the average domestic bill has been reducing since the beginning of RIIO-ED1.
We note that in our SHEPD region, bill impact is varied and this is partly as a result of the Hydro Benefit Replacement Scheme, which recognises the high cost associated with distributing electricity in the region.
This is due to continued efficiencies and innovation, as well as sector-wide movements directed by Ofgem, in financial parameters such as reduced cost of equity and extension of depreciation lives.
BILL IMPACT3SEPD COMPONENT OF RIIO-ED1 DOMESTIC BILL SHEPD COMPONENT OF RIIO-ED1 DOMESTIC BILL
SE
PD
Do
me
stic
Bil
l £ p
er
mp
an
SH
EP
D D
om
est
ic B
ill £
/mp
an
£70 £130
£85
£120
£75
£80
£90
£95
£140
£100
£150
£110
£170
£115£180
£190
15/16 16/17 17/18 18/19 19/20 20/21 21/22 22/23 15/16 16/17 17/18 18/19 19/20 20/21 21/22 22/23
Figure 2.10: SSEN component of RIIO-ED1 domestic bill (2020/21 price base)
Bill component General trend Bill component General trend
• Deploying innovative solutions: Where we have needed to intervene on assets, we have been able to use innovative solutions such as flexibility and Active Network Management (ANM) schemes to reduce the costs of managing load and generation increases. These solutions provide incremental capacity which allows the need for more expensive asset solutions to be deferred. Overall, we have delivered savings of around £60m in deferred reinforcement through our Constraint Manage Zones (flexibility procurement) and ANM schemes. These are included in the innovation savings quoted above.
What this means for RIIO-ED2
• The trends we have seen around connections and electric vehicle uptake look likely to accelerate in RIIO-ED2. The government’s heating and building’s strategy could also see heat pump uptake increase. Our Forecasting and Future Energy Scenarios (Chapter 9) describes the expected increase in LCTs on our network under various Distribution Future Energy Scenarios (DFES).
• We will scale up our use of innovative solutions, taking a Flexibility First approach to market-test all our load-related needs before we commit to asset solutions. This will help reduce costs and keep options open where there is uncertainty over the level of future load growth. It will also act as a catalyst for wider flexibility markets, helping to make flexible technologies (particularly at domestic level) more commercially viable. Distribution System Operation (Chapter 11) describes our approach to flexibility and DSO roles and capabilities.
• We are expanding our LV monitoring to cover 19% of our network, as part of our network visibility strategy, which will also make extensive use of data and digitalisation to understand power flows across our network, driving efficient decision- making. Please see Distribution System Operation (Chapter 11) for further details.

-2.0%
30 | Section A: Chapter Two: Track Record
INCENTIVE PERFORMANCE
As can be seen from Figure 2.11, we have performed well across incentives, in particular under the Broad Measure of Customer Satisfaction and the Time to Connect incentives.
Our customer service performance and associated reward has increased over the RIIO-ED1 period, almost doubling over that time in financial terms. Our performance under Time to Connect has remained at a similarly high level throughout. While we have continued to outperform our reliability targets, our incentive revenue dipped after the first two years in RIIO-ED1, reflecting an increase in faults relating to subsea and underground cables, and particularly bad weather. Investment in our network has had a positive effect on performance over the last two years against ever-tightening performance targets.
We also received a reward under the losses discretionary reward in 2017 and 2018.
4
Figure 2.11: Incentive performance (2020/21 prices)
Figure 2.12: Return on Regulatory Equity
£30
9.0%
8.0%
£25
7.0%
6.0%
£20
5.0%
4.0%
£15
3.0%
2.0%
£10
1.0%
0.0%
£5
-1.0%
2016 20192017 20202018 2022
SHEPD SEPD SSEN
Broad Measure of Customer Service
Financing and tax
Time to Connect
Totex performance
Interruptions Incentive Scheme
Allowed Equity Return
Discretionary Reward
Incentives
£0
RETURN ON REGULATORY EQUITY
We are forecasting a RORE performance of 6.5% at the end of RIIO-ED1.
This reflects our totex forecast exceeding our regulatory allowance and a predicted incentive performance adding 1.2% above the allowed equity return level. This is at the lower end of the regulatory range. Information on dividend pay can be found in Finance and Financeability Strategy (Annex 19.1)
5

31 | Section A: Chapter Three: Enhanced Engagement
CHAPTER THREE: ENHANCED ENGAGEMENT
CUSTOMERS AND COMMUNITIES AT THE HEART OF OUR PLAN
This chapter sets out our approach and framework for enhanced engagement, which has underpinned our RIIO-ED2 business plan. Throughout the RIIO-ED2 business planning process we have integrated broader, deeper and more meaningful stakeholder engagement, building on our existing business as usual approach.
Our objective has been to improve our consumer and stakeholder engagement continually throughout the programme so that it:
• consistently influences business decision making and planning
• links directly to what we do or have changed in the way our business operates.
Throughout the process, we listened to what our customers, consumers and stakeholders told us they want and need, and have collaborated with them in business planning and refining our final RIIO-ED2 business plan.
Thank you to all who participated, providing valuable feedback and sharing creative ideas. They, along with our Customer Engagement Group’s (CEG) keen and thoughtful oversight, have been instrumental in producing our RIIO-ED2 Business Plan.
We intend to continue enhancing the quality and robustness of our ongoing stakeholder engagement programme, further details of which are provided in Section 3 and in Future Stakeholder Engagement Strategy (Annex 3.2).
The impact of Covid-19 and emerging events on enhanced engagement
The Covid-19 restrictions, starting on 23 March 2020, and applying across our two licence areas, impacted our Enhanced Engagement programme in three key ways:
• Engagement moved online or over the phone: Benefits included being accessible to those who could not attend face-to-face events. However, informal networking conversations were reduced and some SMEs were hard to reach or lacked capacity to engage as they focused on keeping their businesses going. We also made available phone services for those who preferred that option
• Customers’ needs and priorities changed as they and their families ‘stayed home’ for work, education and leisure. Some businesses closed, and there were adverse financial impacts coupled with rises in heating and food bills
• Colleagues faced new challenges as they combined working from home with home schooling and, in some cases, were unable to work as planned due to illness from Covid-19 or the side-effects of vaccinations
Further details about the impact of Covid-19 on our engagement are described in Enhanced Engagement Strategy (Annex 3.1).
Emerging impact of rising wholesale costs and energy supplier failures
Wholesale energy prices have risen significantly over the course of this year leading to over 20 energy supplier failures, with customers either joining Ofgem’s Supplier of Last Resort mechanism or a special administration scheme. Ofgem has called the situation ‘unprecedented’, warning there will be ‘significant rise’ in the Energy Price Cap in April 2022.
Following intensive media interest, concern for rising prices started to impact public consciousness during September. As the majority of Phase 4 engagement was conducted before this point, the impact on our engagement programme has been limited with the exception of Acceptability Testing which took place between September to November. In both the qualitative and quantitative research, respondents cited uncertainty around energy prices as a factor with 75% saying the energy crisis impacted their survey choices in some way.
Alongside progressing measures to enhance our support for customers in vulnerable situations in the short-term, we will continue to consider the impact of the energy supplier situation through the plan determination process and beyond, including close liaison with Ofgem on the role DNOs can play in managing impact to consumers.
SUPPORTING DOCUMENTS
Enhanced Engagement Strategy (Annex 3.1)
Future Stakeholder Engagement Strategy (Annex 3.2)
Business Plan Testing and Acceptance Results (Annex 3.3)
ENGAGEMENT AT A GLANCE
Stakeholders engaged
Total
25,181
Synthesised stakeholder evidence points
Total
4,719
Methods used
Total
18
Engagement events
including over 30 regional events
150

32 | Section A: Chapter Three: Enhanced Engagement
KEY ENHANCEMENTS TO OUR BUSINESS PLANNING PROCESS – STAKEHOLDERS INFORMING AND SHAPING OUR STRATEGY AND OUTPUTS
To enable and support our communities to deliver their net zero ambitions, we recognised that our services needed to change to meet the evolving ways our network is being used.
To meet this challenge, we improved how we engaged with stakeholders. In 2019, we undertook a review of our stakeholder engagement activities, set up our Customer Engagement Group (CEG) and implemented a continuous improvement programme, enhancing our strategy and governance, and embedding new tools and processes.
2
‘GOLDEN THREAD’ – ENGAGEMENT INFORMING OUR RIIO-ED2 BUSINESS PLAN
The structure of our business plan provides a clear line of sight from our stakeholder and customer engagement to our strategies and outputs.
Our business plan chapters summarise how enhanced engagement has underpinned that chapter’s strategy and outputs. Further detail is set out in the corresponding annex, demonstrating the evidence triangulation process involving the evaluation of trade-offs in feasibility, costs to customers and stakeholder and customer insights. Actionable stakeholder insights are drawn from ‘synthesis reports’, where feedback was collated during each phase of the enhanced engagement programme.
The process by which enhanced engagement has informed our business plan is shown in Figure 3.1.
1
A valued and trusted service for our customers
and communities
Business plan
Customer experience
strategy annex
A safe, resilient and responsive network
Safe and resilient strategy annex
Accelerated progress towards a net zero world
Load- related plan
and build strategy annex
DSO strategy annex
Supply chain strategy annex
Consumer vulnerability
strategy annex
Reliability strategy annex
Whole systems strategy annex
Workforce resilience strategy annex
Digital investment plan annex
Scottish Islands strategy annex
Connections strategy annex
Value for money for customers
Innovation strategy annex
Environmental Action Plan
annex
UM strategy annex
Figure 3.1: How our business plan structure traces the ‘golden thread’ running from stakeholder views to outputs
Synthesising feedback Decision-making and communicationTriangulation –
how we weighted feedback
1. Synthesis report for each phase of engagement
4. Triangulation decision (Annex)
3. Summary and weighting of evidence sources (Appendix)
2. Golden thread template (Appendix)
5. Summary of Engagement’s influence on the plan (Chapter)
Summarise and group stakeholder feedback from all engagement events into a report, allowing business leads to evaluate the key insights from each stakeholder segment for each area of our business plan.
Analyse the engagement event methodologies and feedback to determine a weighting on the trust and usefulness of each event. This helps decision-makers determine what feedback to trust and utilise for their plan.
Key insights are considered and educate the outputs in each area for ED2. The triangulation process evaluates the trade-offs between the feasibility of the request, the cost to customers and stakeholder views. The outcome is summarised in the Enhanced Engagement overview section of each chapter and further details in the Annexes.
2.1 Our engagement mission, objectives and principles Our starting point for Enhanced Engagement was to develop a compelling mission shared by the Board, senior managers and all staff, and to make enhanced engagement a strategic activity across the organisation. Our mission for engagement is:
To deliver engagement that is purposeful, accessible, and dynamic, using insight and collaborative partnerships to achieve positive and tangible outcomes for customers, stakeholders, and society.

33 | Section A: Chapter Three: Enhanced Engagement
We further set the bar high by giving ourselves three aligned objectives:
1) To develop a business plan that is focused on, created with and, ultimately, trusted by our customers and stakeholders
2) To ensure the plan is rigorously tested by a wide range of stakeholders so that it meets customer needs, especially the most vulnerable, delivers value for money for consumers and a social return for communities and wider society
3) To create a robust, ambitious and deliverable stakeholder engagement strategy for RIIO-ED2 that is fully informed by customer and stakeholder input and is flexible to the needs of consumers in the energy transition
To support these objectives, following extensive deliberation across the organisation, we chose four principles to define how we engage that have been applied to our enhanced engagement activities:
• Inclusive: We have been careful to gather the views of all stakeholder segments across both of our regions, including ‘seldom heard’ voices and others with whom we have not engaged before
• Insightful: We have conducted thorough engagement in a way that generates meaningful discussion and debate that led to actionable insight
• Impactful: Participants can clearly trace the ‘golden thread’ of genuine influence from their input and challenge to our business plan
• Iterative: We have evolved the way in which we’ve engaged with stakeholders by incorporating learning and new best practice throughout the process
a) Ensuring our engagement was inclusive
Stakeholder mapping and segmentation To achieve our aim of engaging with a comprehensive, diverse and representative range of stakeholders, we developed a segmentation consisting of six high-level stakeholder groups and 44 segments, as shown in Figure 3.2. This was refined based on feedback from within our business and the CEG.
Mapping our stakeholder database using the segmentation tool helped us to identify gaps, for example, amongst local authorities, which we filled using purchased data. We will keep cleansing and adding to the data regularly.
The segmentation also ensured we systematically engaged stakeholders from each segment and on appropriate topics. This gives us confidence that feedback from engagement is representative of all the communities we serve. Further details on how we used stakeholder segmentation in engagement planning is detailed in Enhanced Engagement Strategy (Annex 3.1).
Our regional approach During RIIO-ED1, we recognised that our traditional, cross-licence areas engagement approach did not reflect the distinct preferences of our two network regions, which meant that these were not necessarily being captured in our business planning and delivery. From 2019, we tailored the content of our annual stakeholder workshops to address region-specific issues and tracked the number of events held in each region to ensure consistency. We have added ‘Licence Area’ as a further segmentation dimension to our stakeholder database.
We also engaged on three unique challenges faced by remote communities: distributed embedded generation; areas supplied by subsea cables; and security of supply on Shetland. We held bespoke events on issues specific to these network areas which are reflected in our business plan.
For example, we made a step change in our Supporting the Scottish Islands strategy after collaborating with stakeholders. By factoring the impact on generation and demand side customers into our investment decisions, alongside enhanced, multi-factor risk assessments of which assets are most likely to fail, our solution will deliver greater reliability, more renewable generation, and reduced emissions. We further refined our approach for the final plan after testing our strategy with stakeholders.
Figure 3.2: Our stakeholder segmentation
Domestic customers
Distributed generation customers
Government
Local authorities
Vulnerable customer representatives
DNOs
ICPs
Current and future employees
Customers in vulnerable situations
Builders and developers
Research bodies, policy forums and think tanks
Charities
LEPs
Transmission
Consultants
Contractors
Transient customers
Community Energy Schemes
Media
Academic institutions
Emergency response
GDNs
Energy suppliers
Service partners
Next generation bill payers
Landowners/farmers
Consumer groups
Housing associations
Healthcare
Water
EV charging
Shareholders
SMEs
Regulators
Community interest bodies
Telecoms
Other supply chain
Investors
Major energy users
IDNOs
Storage and renewable providers/installers
Business advisors
Transport and Highway agencies
Trade Unions
Customers
Policy makers and influencers
Consumers
Communities and local decision-makers
Wider industry and value chain
Partners and enablers

34 | Section A: Chapter Three: Enhanced Engagement
Hard-to-reach stakeholders We set ourselves the goal of engaging with seldom-heard customers, who are typically underrepresented. These include future consumers and community energy organisations; and those who have limited capacity, appetite, or awareness of our business, including those who do not think their participation will make a difference. Our strategy was to work with organisations who have expert knowledge and are trusted by such groups.
As well as engaging with existing partners, such as National Energy Action, Energy Action Scotland, Citizens Advice and Citizens Advice Scotland, we held bilaterals with faith groups, the debt charity StepChange, Deaf Scotland and NHS telecare, and engaged with six partners who we have not worked with before as part of our bespoke engagement on customers in vulnerable situations. We intend to grow the number of partners we work with during RIIO-ED2.
Customers for future services Our CEG asked us to consider ‘Customers for Future Services’. Increasingly we will be providing emerging services to customers, such as electric vehicles (EV) chargepoints, low-carbon technologies’ (LCT) connections and digital services.
Therefore, we engaged ‘future services’ customers at our thematic connections events, where they co-created a digital portal for managing their connection orders. This was followed by targeted communication to this segment as part of the consultation on costs and outputs conducted in September as part of Phase 4 engagement.
b) Ensuring our engagement was insightful
To identify actionable insights, we improved how we captured feedback from our engagements.
In our experience, the single biggest factor in feedback quality is whether a stakeholder’s level of knowledge about a topic is sufficient for the topic’s complexity. We tailored the content of each engagement to address this concern and used appropriate methods, such as using app-based pre-tasks for consumer events to help participants better understand our role as a DNO. We also modified our approach if it emerged during engagement on technical issues that stakeholders did not have the right level of knowledge. For example, we initially engaged with stakeholders on totex optimisation but they told us they were not suitably qualified on the topic. We engaged instead with academic stakeholders who were more familiar with the subject matter and will use these findings as we develop our approach for our final plan. Detail on how we selected appropriate content and methods can be found in Enhanced Engagement Strategy (Annex 3.1).
To facilitate the process of planning engagements and capturing feedback, we introduced a standardised feedback form, which minimised subjectivity. These were embedded across the workstreams and ensured that a ‘golden thread’ connected stakeholder evidence to decision making. More information is available in Enhanced Engagement Strategy (Annex 3.1).
c) Ensuring our engagement was iterative
We have adapted our engagement approach throughout our planning process by incorporating lessons learnt about the effectiveness of our methodology and insights about how it could be improved.
Managing stakeholder event evaluation After each phase of business planning, we reviewed the outcome of stakeholders’ evaluations of engagement events and identified opportunities for improvement. For example, after Phase 1, we updated our explanation of the role of the DNO and “Who is SSEN?” in response to consumers not knowing about our role and what we did. We revised the scripts to introduce the topics more clearly and without jargon; and ensured that one of our engagement experts was present at consumer events to clarify any points.
Customer Engagement Group challenges to our Enhanced Engagement We also adapted our engagement approach ‘in flight’ in response to challenges from our CEG. For example, when designing engagement mechanisms in Phase 2, we better clarified which level of co-creation was appropriate for the event. In Phase 4, following CEG feedback, we ensured each of our workshops and engagements clearly detailed the respective cost and bill impact of proposals.
HOW WE ENGAGED FUEL-POOR CUSTOMERS
Our CEG members gave us consistent guidance and advice that we should actively seek first-hand engagement with fuel-poor customers. In response we have included ‘Fuel Poor’ as a specific segment in our consumer research activities. Such participants were identified sensitively and respectfully using the following script during qualitative research events:
“ These days a lot of people are struggling to pay their household bills. Which of the following best describes how affordable you find your electricity bill and other fuel bills? Please remember, this research is entirely confidential and that it is only by talking to people in debt, or struggling to pay their bills, that change can be influenced.”
We successfully recruited six fuel-poor customers to the sample of 36 domestic consumers for our supply interruptions event, and three out of 20 for our vulnerability in-depth interviews. We heard that fuel-poor have fewer options than other customers when there is a power cut because they can’t afford to go out to eat or keep warm in a cafe or pub. In Phase 4, where we tested our business plan strategies, outputs and costs, we again recruited
fuel-poor customers, future customers and vulnerable customers to understand their views about our plan. Overall, these customers were supportive of the ambition and direction of the plan but told us they were concerned about the impact on bills. As a result, for our final business plan we have increased the number of households we will help with fuel poverty advice, and energy efficiency measures and referrals.
Option Recruitment quota
I always pay my electricity bill, and other household bills, on time N/A
I always pay my electricity bill on time, but sometimes struggle, or am late, paying other bills Struggling
I sometimes pay my electricity bill late Struggling
I often find it difficult to pay my electricity bill on time In debt
I am rarely, or never, able to pay my electricity bill on time In debt
Prefer not to answer N/A

35 | Section A: Chapter Three: Enhanced Engagement
d) Ensuring our engagement was impactful
Triangulation Inevitably, the robustness of engagement events varied – in terms of relevance, methodology, how rigorously it was gathered and how credible/independently interpreted it was. We therefore created a triangulation process to score the robustness of each event, which allowed output owners to trade off dissenting views and ensured that the most robust feedback had the greatest impact on the
content of the business plan. Our triangulation process ensured that we had senior level buy-in, as each of the triangulation meetings was attended by directors, the business team and stakeholder engagement specialists.
Our four-step triangulation methodology was guided by the Magenta Book published by HM Treasury1 and other best practice:
The process was applied at the end of Phases 2 and 3, and 4. Further details are set out in Enhanced Engagement Strategy (Annex 3.1).
The two-stage triangulation process underpinned changes to our business plan strategies and outputs. At Phase 3, for the draft plan, 32 areas were refined to better reflect the most robust source of stakeholder feedback, after the triangulation process. For example, during engagement on the Environmental Action Plan, stakeholders told us that they want us to remove carbon we cannot abate, through natural capital and biodiversity investment. As a result, we transformed the scope of our Environmental Action Plan to deliver this, providing local air quality and habitat improvements within the communities we serve, and creating a legitimate and transparent record of carbon abatement. The CEG further challenged us to ensure customers supported this increase in ambition and the associated cost and bill impact. See Section 2.2 for a case study on using a Citizens’ Jury in Phase 4 to test the ambition and cost of the EAP.
In six areas, triangulation identified that our proposed approach did not accord exactly with the most robust source of stakeholder feedback and we have been transparent in why we have diverged from stakeholder views.
For example, customers in vulnerable situations told us that in the event of a power cut, they would like us to contact them proactively within 15 minutes. We do not currently have the technical systems capability to notify us of faults within this time frame and it will not be possible to implement this within the new price control period. However, we are heavily investing in systems that use Smart Meter data to help us identify power cuts sooner, and will aim to include this standard in our future plans.
Phase 4 triangulation resulted in further refinements and enhancements in our strategies and outputs. We have clearly signposted the resultant changes from Phase 3 triangulation and between our draft and final business plan as a result of Phase 4 triangulation in the Enhanced Engagement section of each annex and the Enhanced Engagement tables in chapters. Where there has been a change in ambition between draft and final plan this has been signposted in the relevant strategy annex as an ‘Enhanced’ or ‘Refined’ output. Additional outputs for the final plan are signposted as ‘New’. As a result of Phase 4 triangulation, we have made 19 enhancements to our Business Plan outputs or strategies; developed five new outputs and refined the ambition for two outputs, including CVPs.
Figure 3.3: Our triangulation process
Communicate and test findings
Gather evidence (Synthesis)
Assess evidence source and assign weight
Triangulation
The proposed action for each output is developed based on triangulation decision before testing with stakeholders and the CEG.
Workstreams assess stakeholder feedback and engagement robustness to inform proposals.
Each event is scored using a system that assesses the robustness of the engagement activity and feedback
gathered.
Feedback from all RIIO-ED2 engagement events is consolidated in a master feedback
repository and summarised into Synthesis Reports covering all topics.
4 1
23
1 https://www.gov.uk/government/publications/the-magenta-book

36 | Section A: Chapter Three: Enhanced Engagement
2.2 Engagement phases Our Enhanced Engagement programme had four phases, as shown in Figure 3.4. We started with broad exploration to establish high-level priorities, then focused on stakeholder and customer perspectives on trade-offs of services and costs, before undertaking final testing with a broad range of stakeholders and customers of our business plan in the round and on individual outputs and the associated costs and bill impacts.
The objectives for each phase, the engagement methods used, the stakeholder groups we engaged, and the results gathered are set out in detail in the Engagement Phases section of Enhanced Engagement Strategy (Annex 3.1).
Co-creating the plan with our stakeholders We designed the events in Phase 2 using a range of methods on the co-creation scale as shown in Figure 3.5. The aim was to transform our contact with stakeholders, customers and consumers from transactional to a joint experience.
Not every event was at the ‘Collaborating’ at the end of the scale; sometimes the technical nature of the solution, regulatory constraints, the complexity of the topic or unavoidable limits to customers’ knowledge of our operations mean that other approaches will lead to more actionable solutions. We have listed examples of our engagement events for each of the co-creation scales in Figure.3.5 and provided co-creation case studies below which illustrate application of different points on the co-creation scale.
Phase 2: Co-creation case studies
Collaborating to transform our connections processes By early 2021, our existing connections processes faced two major challenges. First, they were confusing for many customers and resource-intensive for us; and second, the volume of minor low carbon technology connections that will be needed to enable net zero will increase substantially over RIIO-ED2, estimated to be by more than 3,900% for EV connections alone. To address both of these challenges, our processes needed to be transformed and digitalised so that customers could self-serve as much as possible.
We engaged with recent and prospective connections’ customers to co-create new processes from scratch, starting with understanding their needs and expectations of what ‘best in class’ would look like. Above all, they told us that they wanted customer-centric service design: this meant signposting according to the type of connection they wanted (e.g. EV chargepoint, heat pump, new build or building extension, microgeneration) rather than by the design of work involved.
Together, we shaped ideal customer journeys, which we used as the blueprint for our future service design, assessing each insight using a ‘you said-we did’ approach to drive business improvement for the remainder of the current price control and throughout the next.
Modifying resilience options for worst-served customers Based on our cost-benefit analysis, we planned to improve supply reliability for at least 75% of our current worst-served customers (WSCs) in both of our licence areas.
After receiving feedback from a customer representative stakeholder, we investigated modifying this strategy and approach to improve supply reliability for 100% of WSCs.
Over the course of two reconvened discussion groups and deep-dive interviews, we were surprised how resilient domestic WSCs already were. Many didn’t feel there was a problem with their service as they didn’t remember all of the power cuts they had experienced, adding that short duration cuts were only minor inconveniences. They would like a more reliable service, but not at any cost. Some who lived in the north of Scotland felt that cuts,
Figure 3.4: Our four-phase enhanced engagement approach
Phase 1: Open Discovery Phase 2: Co-creation Phase 3: Business Plan Refinement
Phase 4: Testing and Acceptance
To August 2020 Aug 20 – Feb 21 Feb 21 – Jun 21 Jun 21 – Dec 21
Figure 3.5: Co-creation scale (after ‘Customer co-creation: A typology and research agenda’, Matthew S. O’Hern, Aric Rindfleisch, 2010)
Description The DNO asks stakeholders to answer predetermined
questions and decides which ones to consider
Stakeholders propose modifications to an existing
service based on criteria
The DNO puts forward several options for a new service and a large selection of stakeholders
choose the best option
Stakeholders collectively develop ideas for a new service or improvements to an existing
service without any criteria
Content contribution
Fixed Open Fixed Open
Content Selection DNO DNO Stakeholders Stakeholders
Example Local Network Plans Worst Served CustomersScience-based
target alignmentThe new connections process
Value creation All Domestic customers All Small and domestic customers
Audience research Modification Co-designing CollaboratingCo-Creation Scale

37 | Section A: Chapter Three: Enhanced Engagement
especially those caused by bird strikes from migrating geese, were ‘par for the course’ when living in a remote community and could not be avoided.
These insights, alongside cost-benefit research, confirmed our planned output of reducing the number of WSCs by at least 75%.
Audience research on Distribution Future Energy Scenarios Every local authority (LA) has unique characteristics in terms of their commitments and capabilities to deliver net zero policies and we expect that this will change over time. In the context of meeting net zero by 2050, each LA will be on a different journey which will impact the specific demand in their localities for LCTs EV chargepoints, heat pump photovoltaic (PV) adoption, and battery storage. To agree a credible baseline scenario for our load development plans, we worked with our delivery partner, Regen, to forecast modifications for each of these four LCTs that could be applied to each of the National Grid ESO’s Distribution Future Energy Scenarios (DFES).
We further developed an engagement plan for each LA in both licence areas to obtain specific evidence on LCT plans which could then be applied to the adjusted DFES. This identified large variations in the capability and capacity of LAs to co-create robust, forward-looking scenarios with us. Our learnings and experience from this engagement program has informed our proposed Consumer Value Propositions (CVP) and future-looking stakeholder engagement with LAs, which is set out in our 2023-2028 Enhanced Engagement Strategy in Section 3 and Future Stakeholder Engagement Strategy (Annex 3.2).
Using the evidence received we were able to select Consumer Transformation as the baseline scenario for our Local Network Plans and representing most stakeholder needs.
Thematic consumer engagement
DNO engagement with consumers has often been limited to very specific activities which are largely quantitative, such as our annual PSR and Willingness-to-Pay surveys, and conducted with members of market research panels.
We have made a step change for our business planning by creating a programme of thematic consumer engagement events to co-create key areas of our business plans that directly impact domestic and SME customers – the people and organisations who pay for our services through their bills.
We used a mix of primarily qualitative methods including online focus groups incorporating reconvened groups, 1-1 depth interviews (conducted by phone and online) and ethnographic, app-based pre-tasks as well as surveys. The thematic topics covered included:
• Connections
• The future of vulnerability
• Supply interruptions
• Worst-served customers
• Behavioural barriers to implementing energy efficiency
We took the novel approach of using our Customer Contact Centre records to recruit highly relevant participants to event, for example:
• consumers who had reported a power cut and are supplied by a worst-served circuit for our worst-served customers engagement
• digitally-excluded customers for supply interruption customer service
• vulnerable customers with health related and/or financial challenges
The feedback was based on genuine, personal experience rather than imagined scenarios.
Phase 3: Refinement case study
Phase 3 of our Enhanced Engagement program was an opportunity to refine the draft business plan strategy, output and costs with our stakeholders and customers.
We used a Citizens’ Jury in Phase 3 to test our Environmental Action Plan (EAP) and innovation strategy with customers. We chose this mechanism because it enables in-depth engagement with customers. Our experience has told us that engaging with customers on energy network topics can be challenging because they need sufficient information and explanation in order to give fully informed views. Citizens’ Juries enable exploration of customers’ considered views and aspirations.
We opted for a Citizens’ Jury for the EAP because this part of the plan was a step up in ambition in terms of scope and cost and we wanted to ensure customers’ understanding and acceptance. Similarly, customer representatives had challenged us on making the benefits of innovation spending transparent to customers.
Two Juries were recruited to reflect demographics of our two licence areas, 18 from Central Southern England and 16 from Northern Scotland and the Islands.
Participants understood the benefits that could be delivered by spending on innovation but told us that these hadn’t been clear to them before the engagement. As a direct result of this feedback, we have committed to publish an annual report to improve the transparency of the benefits of our innovation programme. See Innovation (Chapter 14) for more on this.
The Juries told us it is incredibly important that we take action to mitigate against climate change. This gave us confidence that our proposed expanded environmental scope, for example, investing in natural capital, was supported by customers. Participants did raise the issue of affordability and wanted to see support for customers in vulnerable situations. As a result, we have increased our plans for these customers, details of which are in A Valued and Trusted Service for Customers and Communities (Chapter 4). Environmentally Sustainable Network (Chapter 13) sets out our EAP.
Phase 4: Testing and Acceptance case studies
Costs and Outputs workshops and consultation
Our Consolidate Costs and Outputs events provided us with valuable insights into stakeholders’ views on the acceptability of our draft plan strategy, its outputs and customer bill impacts. The consultation involved two online workshops, including plenary sessions and focused discussion groups on key parts of our business plan attended by 110 stakeholders from 83 organisations. In addition, we published a consultation document to provide an accessible summary of our business plan strategy and outputs and associated costs and bill impacts. We received 22 written responses to our consultation document.
Refinements driven by this engagement include quantifying our support for distributed energy resources to deliver net zero in a new output. As set out above, our Phase 4 Testing and Acceptance engagement resulted in 19 enhanced outputs, five new outputs and two refined outputs. These engagement drivers and resultant changes between draft and final plan are clearly signposted in relevant Enhanced Engagement sections of chapters and annexes.

38 | Section A: Chapter Three: Enhanced Engagement
Phase 4: Acceptability testing
We tested our final plan with consumers through a two-stage acceptability testing programme, using both qualitative and quantitative methods. For the qualitative phase in September 2021, we identified fuel poor customers; vulnerable customers; and future customers as well as business customers as we particularly wanted to understand the views of seldom heard groups. A large quantitative survey of customers and business was conducted in October 2021, showing overall high acceptability of our final plan expenditure and outputs of 78% with a small minority of 4% saying it was unacceptable. Of respondents who told us the plan was neither acceptable, nor unacceptable we identified that concern about their electricity bills in the context of rising final bills was likely driving this result with 77% telling us it impacted their response. This is also reflected in an overall affordability score of 77%. However, when respondents considered the plan without reference to their own circumstances, 86% rated the plan as value for money. Business Plan Testing and Acceptance Results (Annex 3.3) contains detailed results of Acceptability Testing with customers.
2.3 Evidence assurance process To ensure our business plan truly reflects stakeholder sentiment, we engaged an external agency to audit the robustness and coverage of our evidence and how well it aligned to the plan’s strategies and outputs, using a rigorous, transparent, impartial and best practice assurance process.
The audit provided detailed recommendations to improve the thread between stakeholder evidence and our levels of ambition.
The process was first conducted before the Draft submission and provided valuable guidance on how to improve our business plan between draft and final. The process was conducted again before submitting the Final Plan and demonstrated the improvements made.
Full details of the evidence assurance process can be found in Enhanced Engagement Strategy (Annex 3.1).
2.4 Senior level buy-in Directors have played an integral role in shaping our business plan, providing governance and ensuring that consumer and stakeholder views are reflected in the strategies and outputs.
Development phase
• A sponsoring director was appointed for each of the RIIO-ED2 workstreams
• These directors formed a Steering Committee which met monthly to review progress in detail
• Directors attended CEG sessions
• Workshops and regular meetings were held with directors and their workstream’s lead/s, to provide strategic direction on shaping their parts of the plan, ensuring that decisions were well-justified by stakeholder evidence and CEG feedback was incorporated
• Directors attended multiple stakeholder engagement events to present, listen to stakeholder views first-hand, and to be available to answer stakeholders’ questions
Triangulation and sign-off
• Prior to draft plan, directors participated in two triangulation meetings and made assessments on whether consumer and stakeholder engagement feedback was reflected in the business plan strategies and outputs. Any differences between our decisions and stakeholder feedback were documented
• Following testing of our draft plan strategies, outputs and costs, feedback was shared with directors at the regular meetings enabling debate and discussion on what refinements and enhancements should be made for the final plan. Where these changes have been made are clearly set out in our chapters
2.5 How we embedded our enhanced engagement approach We developed tutor-led stakeholder engagement training courses, which were launched before the co-creation phase of engagement (see Section 2.2) began. Topics covered included:
• What stakeholder engagement is and why we need to be good at it
• Our Stakeholder Engagement strategy
• Types of co-creation
• Essential stakeholder techniques: identification, analysis and assessment, understanding and using knowledge levels, prioritisation, engagement tactics
• How to optimise two-way stakeholder communications
• How to build trusted relationships with stakeholders
• Dealing with difficult stakeholder situations and behaviours
137 colleagues took the one-day course, with a further 40 stakeholder-facing colleagues (such as regional customer relationship managers) following a two-day advanced course. 12 members of the Distribution Executive Committee and other senior leaders attended an overview session. We followed up the training with individual coaching sessions and co-creation masterclasses to help key individuals in the business plan workstreams turn the theory into action.
The training course has been added to new joiners’ (including apprentices and graduate trainees) induction, helping to ensure stakeholder engagement will continue to be at the core of business decision making. We plan to introduce regular stakeholder engagement drop-in surgeries and add a self-service training module to our Learning Management System.
“The new stakeholder engagement training program demonstrates a strong commitment to continuous learning and improvement.” – AccountAbility AA1000 Stakeholder Engagement Healthcheck, March 2021

39 | Section A: Chapter Three: Enhanced Engagement
2.6 How we transformed our engagement approach Our aim has been to imbed authentic engagement throughout the business. This has been informed by the review we undertook in 2019 and also Ofgem’s responses to SECV submissions, the AccountAbility AA1000 Stakeholder Engagement Standard, and best practice identified from PR19 and RIIO-GD2 submissions.
Our transformed approach identifies eight steps to how we engage with stakeholders, grouped into three stages (Figure 3.6). We applied
these activities in each of the four phases of our enhanced engagement (Section 2.2), ensuring that we delivered on our engagement objectives for our business plan’s development. All staff receive ongoing training to ensure that we have effectively embedded this approach and its guiding principles. More detail about what each step entails is in Enhanced Engagement Strategy (Annex 3.1).
Figure 3.6: Our RIIO-ED2 Enhanced Engagement approach
Engagement planning Feedback management Synthesis and decision making
Independent scrutiny and challenge
Refine proposals
8. Act on learning
7. Co-determine and prioritise
actions
6. Capture and assess feedback
5. Engage with purpose
4. Tailor engagement
3. Identify and segment
stakeholders
2. Define purpose
1. Independent scrutiny and challenge
Our RIIO-ED1 stakeholder engagement team subsequently drew on this to enhance their approach, breaking some of these eight steps into sub-steps to create a 12-step approach designed specifically for delivering BAU engagement. We will continue to adapt our process in line with our experience.
Enhancements
One significant new element in the ‘Engage with purpose’ step of our approach was co-creation. This involves allowed stakeholders to go beyond simply feeding back on pre-defined options by genuinely collaborating with us in designing aspects of the business plan. Further information about the scale of co-creation we used can be found at Section 2.2.
We also enhanced our approach to ‘Co-determining and prioritising actions’ by adding two further interlocking engagement elements to the qualitative feedback and traditional Willingness-to-Pay assessment to produce our consumer benefit valuation. The first of these used an industry-wide measure of social value – Social Return on Investment (SROI) – which we established in collaboration with other DNOs. SROI allowed us to identify the relative priorities of different options. We also recruited a Citizens’ Jury for in-depth, higher value deliberation on our Environmental Action Plan and our Innovation Plan which has resulted in some changes to our strategies in these areas, detailed in the respective chapters.
Figure 3.7: Our Consumer Benefit Valuation approach
1.
2.
Building an in-depth understanding of what consumers value most
Prioritising the value consumers place on di�erent areas across our business plan
3. Measuring the wider impact of our actions on society
4. Exploring consumers’ views on key strategies, outputs and costs in depth
SROI
QUALITATIVE
WTP
DELIBERATING AND TESTING
4
1
2
3
FEEDBACK
We set out below how our Customer Benefit Valuation was applied to the development of our Environmental Action Plan:

40 | Section A: Chapter Three: Enhanced Engagement
2.7 Our Customer Engagement Group (CEG) The establishment of an independent CEG by each DNO was one of the innovations that Ofgem introduced for RIIO-ED2 engagement. Our CEG has helped us to create a higher quality plan that more fully reflects customer and stakeholder needs and preferences by providing us with independent and robust challenge. Our single CEG covers both of our licensed areas, with the ability to split if necessary to focus on regional differences. Our CEG operates in line with Ofgem’s Enhanced Engagement Guidance2.
2.7.1 Recruiting our CEG
We recruited our CEG Chair during summer 2019, appointing Tracey Matthews from a shortlist of six. Tracey is an independent consultant specialising in business transformation in the energy, transport and utility sectors for blue chip organisations, and was previously the Independent Chair of SSEN Transmission’s RIIO-T2 User Group, scrutinising and challenging plans for the future of the North of Scotland Electricity Transmission system.
Tracey supported the onward recruitment of CEG members, building a team that represents network stakeholders, consumers, energy users and those with a specialist interest in the development and transition of the electricity distribution networks covering all our territories. Members represent a broad range of disciplines and specialisms, ensuring a relevant external lens is applied to all parts of the plan.
We established a business lead to manage the interface between the CEG and the business to ensure all CEG requirements are met. We allocated ownership across all business plan topics, with one CEG member and one business contact assigned to each one. Our member recruitment strategy also reflected the need for appropriate North and South regional representation. Two members have significant experience in our northern region.
Qualitative feedback
Stakeholders in general agree that sustainability and protecting the environment is a key part of our operations, and many want us to exceed Ofgem’s minima across all 15 areas of our new Environmental Action Plan. However, there is a variety of perspectives on the priorities within this space, as well as the trade-offs between network reliability, consumer cost and the protection of the environment.
Willingness to pay
Increasing our ambition for the amount we reduce our business carbon footprint by 2028 was in the top four priorities (out of 15 tested) for domestic and non-household customers in both regions, and was the top priority for non-households in the south. Increasing the amount of oil-filled cable we replace by 2028 from 52km to 92km was the fourth priority for SME customers in both regions, and the sixth for non-households.
SROISix of our Business Carbon Footprint outputs were tested through social value measurement and will provide a total financial benefit of £1.8m and a societal benefit of £57.1m.
Citizens’ Jury
In-depth testing of outputs and deliberation of complex issues including the balance between the ambition, cost and appropriateness to our role as a DNO of our Environmental Action Plan was undertaken during Phase 4. On the basis of what we discussed and heard, we are confident that customers want us to pursue an ambitious Environmental Action Plan and to be transparent about our progress.
2 https://www.ssen.co.uk/WhereWeOperate/3 https://www.ssen-ceg.co.uk/
The 10 members of our CEG are listed below, indicating area of expertise and the specific policy areas they are aligned with:
Name Experience
Tracey Matthews (Chair) Utilities and infrastructure
Helen Fleming Civil service, competition and sustainability
Tamar Bourne Smart grids and local renewables
Gareth Spinner Engineering, construction and connections
Ian Pashley Energy system
Chris Watts Energy and regulation
Maxine Frerk Energy, regulation and sustainability
David Coan Energy and civil service
Geoff Aitkenhead Asset management
Andrew McMunnigall Infrastructure, local government and policy
Barbara Atterson Fuel poverty charity (resigned prior to final Submission)
Lauren Snoxell Consumer advocacy
More information on our CEG members is available on our dedicated Customer Engagement Group website3.
CEG subgroups and member utilisation
Our CEG set up three subgroups aligned to key business plan topics, as shown in Figure 3.2. These enabled members to dedicate more time to scrutinising different areas and digest topic-specific
background documents, business plan appendices, regulator documents and other content-rich materials. The three subgroup leads support the Chair in assessing options and decisions with consideration to regional differences, and with generating the interim and the final CEG report.

41 | Section A: Chapter Three: Enhanced Engagement
2.7.3 Providing challenge to the business
At each CEG meeting, our CEG has provided us with feedback including actions and challenges. The CEG has issued 18 challenges and 29 questions which are detailed alongside their report posted on the CEG website, published January 2022.
Their challenges and questions have been instrumental in sharpening our business plan. For example:
A valued and trusted service for our customers and communities The CEG usefully challenged us on our proposed approach to customer service benchmarking and we responded and successfully resolved this challenge by taking a different approach as outlined in A Valued and Trusted Service for Customers and Communities (Chapter 4).
Accelerated progress towards a net zero world In response to the CEG’s challenge about the level of customisation in our initial Local Network Plan approach, we tested our original ambition to collect information at a local level to use in load forecasts, and discovered that resources at the local government level require support to meet this need were inconsistent. This learning has informed our Whole System CVP and our ongoing engagement strategy. We also reframed the “Accelerated Progress Towards a Net Zero World” strategic outcome to reflect the CEG’s view that we take a leadership position in this area.
On achieving accelerated progress to net zero by going beyond supporting or facilitating this. This is reflected in our highly ambitious EAP which goes beyond the traditional role of a DNO in addressing environmental issues including carbon abatement and biodiversity. Our plan involves a substantial increase in innovation funding to address net zero.
We developed a Low Voltage Network Strategy as a result of the CEG’s challenge in which they noted that the majority of load expenditure during RIIO-ED2 will be on the LV network. This is detailed in Our Network as a Net Zero Enabler (Chapter 10).
Strategic topics The CEG challenged us on the use of a Citizens’ Jury, and we were able to justify our use of this innovative method because it is particularly well suited to complex topics such as our Environmental Action Plan where the quality of the engagement is dependent upon how well-informed customers are on complex topic.
The CEG also asked us to explain the evolution of our thinking about the strategic ambition of our Business Plan and Target Operating Model for RIIO-ED2. We have closed out the first part of this challenge on the strategic ambition through Phase 4 of our Enhanced Engagement programme where we presented our plan in the whole and strategic priorities to stakeholders and customers.
Deliverability of our business plan is a key focus for the Group, who challenged us to further outline our plans to scale up the business to achieve the extended programme of work. Targeted sessions and 1-2-1s with leads have taken place to further understand our plans in this area as we enter the determination phase.
2.7.4 Next steps
The CEG Chair and sub-group leads will continue to support the open hearing process and determinations and the CEG will submit a report at following final business plan submissions. These will be published on the CEG’s website.
We propose an enduring role for the CEG in our 2023-28 Stakeholder Engagement Strategy. More details are provided in Annex 3.2.
Andrew McMunnigall
1. Customer/consumer/stakeholder engagement and requirements
Business plan
Chris Watts
2. BAU Network mgmt. and asset mgmt., including expenditure/DSO
Maxine Frerk
3. Sustainability/environment including enhanced drive to net zero
Figure 3.8: CEG sub-groups and leads

42 | Section A: Chapter Three: Enhanced Engagement
Figure 3.9: How our enhanced engagement principles supported our objectives for RIIO-ED2 business planning
Inclusive Insightful Impactful Iterative
• New formats for engagement
• Reaching ‘seldom heard’ voices
• Generating meaningful discussion and debate
• Capturing clear and unambiguous feedback
• Linking feedback to insights and actions
• Transparent – ‘golden thread’ from input and challenge to our annual delivery plan
• Engagement in line with best practice and continuous improvement
• Incorporating learnings throughout the process
Our principles
OUR COMMITMENT TO CONTINUED ENHANCED ENGAGEMENT
Enhanced engagement is a fundamental element of our RIIO-ED2 planning process, and has enabled stakeholders and consumers to influence and provide inputs to our plans for developing and operating our network.
Each of our strategies and outputs are directly linked to stakeholder and consumer engagement co-creation and insights, which is evidenced in the business plan chapters and annexes.
The mission and principles set out in Section 2.2 have guided us through all aspects of the enhanced engagement process by defining how we engage and supporting our objectives. They have provided clarity for everyone in SSEN and shaped our business development and how we set priorities and strategies.
3
Key enhancements during the business planning process
Figure 3.10: Step changes made in our stakeholder engagement approach for RIIO-ED2 business planning
Reach and diversity of stakeholders
Broader engagement methods
Innovation – consolidated feedback
Actionable outputs
During the RIIO-ED2 business planning process, we have significantly increased the number and segments of stakeholders engaged. Key metadata about each source has been collected and included in a database.
During the RIIO-ED2 business planning process, we have significantly broadened the methods engagement we used, including an increased focus on quantitative methods and qualitative consumer research.
We have created a relational database and that provides a consolidated source of insights.
‘Synthesis’ reports – actionable insights that inform our decision making creating a clear link between engagement and actions.
BAU engagement has centred around:• Bilateral meetings.• Customer satisfaction.• Complaints.• Annual workshops.• Stakeholder Advisory Panel.For RIIO-ED2 we introduced new, targeted engagement by business plan topic.
New methods include thematic consumer research driven by stakeholder priorities. We have also implemented an engagement plan across all local governments in our licence areas to deliver on public policy goals to deliver net zero.
The consolidated resource provides a ‘single source of truth’ for all the feedback we obtain from our stakeholders and consumers. It enables us to analyse feedback by: engagement type; region; and stakeholder.
Synthesis reports, obtained by analysis of the feedback and transforming the feedback into ‘insights’, which can be directly used by the business to act upon. Undertaken at phase of RIIO-ED2 engagement and directly linked to our business plan outputs, demonstrating a ‘golden thread’.

43 | Section B: A Valued and Trusted Service for Our Customers and Communities
SECTION B: A VALUED AND TRUSTED SERVICE FOR OUR CUSTOMERS AND COMMUNITIES
Core challenges for RIIO-ED2The world of customer service is constantly evolving. We must maintain higher levels of performance, using smart IT investments to extend our capabilities for all customers. The volume of customers in vulnerable situations is expected to grow, requiring a doubling of our efforts to ensure no one is left behind or excluded from the opportunity to benefit from the transition to net zero.
EXECUTIVE COMMITMENT TO OUR PLAN
“We are committed to taking a customer-first approach, ensuring our decision making is driven, first and foremost, by the needs of those we serve. We’re recognising and responding to external forces by investing to maintain world class service for customers. Doing this has resulted in a customer and digital plan that is ambitious, deliverable and, most importantly, will power the changes our customers have told us they value most.”
ELIANE ALGAARD Operations Director, South
WHAT STAKEHOLDERS WANT DELIVERING IMPROVED OUTCOMES FOR ALL
• Targeted improvements in customer satisfaction with a focus on reducing complaints, and improved response to unplanned power cuts
• Do more to address vulnerability ensuring no one is left behind in the energy transition, and recognise and support vulnerable business customers
• We should leverage our scale to improve support for customer and community action on net zero
• We should employ smart tech to enhance our service but not leave ‘generation landline’ behind
• Keep pace with other sectors in digitalisation and data, responsibly investing in the future smart system and ensuring data remains safe and secure
• Data and cutting-edge digital tools used to improve asset and infrastructure visibility and ultimately help SSEN in the transition to DSO and net zero
• Improve customer satisfaction across both licences and all contact categories achieving a score of 9.2 or above and 9.3 for digital satisfaction
• Over 1 million Priority Services Register (PSR) customers reached by 2028 and PSR customer satisfaction scores at 9.4
• Introduce a new Business Support Register, providing tailored support to critical and essential customers during power cuts
• We will introduce a shareholder-financed £500,000 annual ‘Powering Communities to Net Zero’ fund to support low-carbon technology-accessibility initiatives for those in vulnerable situations, and community-led environmental and resilience schemes
• Customers able to self-serve and we will provide support to those unsure of the switch to digital, whilst maintaining all traditional contact channels
• A holistic digitalisation plan that will transform our digital and data capability to support a net zero system
• Communities empowered to participate in flexibility markets, benefiting from the energy system transition
Changing customers’ needs: Improved technology, greater dependency on their electricity supply and experiences from other service providers are driving higher expectations of our performance from customers.
Growth in vulnerability: A rise in the number of customers in vulnerable situations, due to the impact of Covid-19 or other changed economic or social circumstances, must be matched by an increase in the resources and focus we apply. We expect more customers to experience temporary vulnerability and we must be alert to their changed needs.
Affordability for consumers: An expected increase in consumed energy costs will lead to higher bills for many customers. We must do everything possible to improve our service levels but not increase network costs for customers.
Digitalisation and open data: Moving from DNO to DSO will require open data and shared platforms that remain secure, agile and adaptable and that integrate across whole system participants.
We have ambitious stakeholder-led proposals to build a customer centric and digitally- enabled organisation, improving our core service offering and targeting support where and when our customers need it.
We will provide enhanced support to consumers in vulnerable situations and help reduce fuel poverty through our vulnerability strategy. We also recognise we have a role to play in ensuring all our customers are able to benefit from the energy system transition, including through a self-financed £500,000 annual ‘Powering Communities to Net Zero’ fund.
We are broadening our focus on vulnerability to recognise how businesses can also become vulnerable as economic or social circumstances change around them.
We are investing in new technology to enable the activities that are key to delivering net zero for our customers and communities. Digitalisation and technology investments across our network and back office operations will enable many of the outputs across our plan and will provide a direct benefit of £175m.
Planned investment 2023-28
Chapters in this section Capex (£m)
Chapter 4: A Valued and Trusted Service for our Customers and Communities
£38.4m
Chapter 5: IT and Digitalisation £264.1m
Totex £359.0m*
DELIVERING OUR GOALSWe have clearly demonstrated where our proposals are a result of meeting expected standards, including regulatory and legislative requirements, and where we have sought to respond to the needs of our customers and stakeholders by delivering on shared ambition or going above and beyond expectations.
• Achieve customer satisfaction of at least 9.2 in every contact area
• Support 200,000 customers in fuel poverty with targeted support and energy efficiency measures, alongside benefit to a further 1 million customers and community members through resilience support and a shareholder-financed community fund
• CVP – introduce Personal Resilience Plans to proactively support consumers in vulnerable situations in power cuts and emergencies
*Chapters only show direct investment required to deliver key deliverables and outputs, not CVPs.

44 | Section B: Chapter Four: A Valued and Trusted Service for Our Customers and Communities
CHAPTER FOUR: A VALUED AND TRUSTED SERVICE FOR OUR CUSTOMERS AND COMMUNITIES
Our plan reflects the changing needs and priorities of our customers. It delivers relevant, valued and trusted services which fully support customers with their transition to net zero, such as our proposed Powering Communities to Net Zero Fund.
The Covid-19 pandemic has brought additional challenges, with many more customers experiencing temporary forms of vulnerability. Fuel poverty on our network is expected to grow, with 9.3% of our customers in our southern and 28.3% in our Scottish network areas already considered fuel poor. Many more customers now work from home and are more dependent on their electricity supply. Affordability remains a high priority and we must ensure no one is left behind on the energy transformation journey.
Our ambitious plan aims to deliver industry-leading performance across both our north and south networks. We propose investing £24.9m during RIIO-ED2 to deliver benefits across 16 targeted outputs in our Customer Service and Consumer Vulnerability Activity Plan. This is further supported by an additional £20.2m investment in IT and Digitalisation that will enable the customer value embedded in the outputs within this chapter, set out in the IT and Digitalisation (Chapter 5). This is the first time we have created a dedicated budget for customer service activities, providing greater clarity and accountability on our commitment to customers and our performance. Our investment in this chapter will deliver two of our six stakeholder led goals:
Achieve a customer satisfaction of 9.2 or above in every contact area.
Support 200,000 customers in fuel poverty with targeted support and energy efficiency measures, alongside benefit to a further 1 million customers and community members through resilience support and a shareholder-financed community fund1 (see Section 7 within this chapter).
Our Vulnerability Strategy includes a more ambitious proposal to support fuel poverty directly through our plan and represents an additional Consumer Value Proposition (CVP) worth £3.9m in net customer benefits.
Our Customer Experience Strategy and dedicated Vulnerability Strategy ambition is to build a customer-driven, digitally empowered and highly innovative organisation that is committed to building a better world for the diverse communities who depend on us to power their lives.
We fully set out how we will achieve this in our Customer Experience Strategy (Annex 4.1) and our Vulnerability Strategy (Annex 4.2) sets out a clear framework of activities designed to ensure we treat all customers fairly, with a strong focus on vulnerability during loss of supply events, fuel poverty and participation in the energy transition.
SUPPORTING DOCUMENTS
Customer Experience Strategy (Annex 4.1)
Vulnerability Strategy (Annex 4.2)
Total investment in this chapter Comparison to RIIO-ED12 Business Plan Data Tables
£26.1m to improve customer service No dedicated funding in RIIO-ED1 Included in C4
£12.3m to improve services for consumers in vulnerable situations
£4m (as of 2020/21) Included in C4
£7.3m additional funding for our Personal Resilience Plan CVP
n/a new for RIIO-ED2Not included in baseline plan, in line with Ofgem guidance
The investments above will be supported by £20.2m of enabling IT investments which are captured in IT and Digitalisation (Chapter 5).
1 When discussing our outputs for Consumer Vulnerability, stakeholders were confused about the number of customers supported by our activities. SSEN quotes the number of households supported, rather than number of individuals. The 50,000 figure used in our plan is made up of approx. 30,000 households in our SEPD licence area and 20,000 households in our SHEPD licence area. ONS data shows an average of 2.4 customers per household in England and 2.1 customers per household in Scotland. We used these averages to calculate how many individual customers will be supported with activities detailed within our Vulnerability Strategy. The combined total for both network areas comes to 114,000 customers.
2 Comparison is to the last five years of RIIO-ED1. 2020/21 prices.
Our £5.2m investment will support 50,000 households with fuel poverty in addition to new initiatives providing education, digital support, personal and social support packs and an Energy Efficiency Enabling Fund supporting customers in the transition to net zero. Our investment will create £23m of financial and societal benefits, and £3.9m financial and social benefit value from Personal Resilience Plans CVP.

45 | Section B: Chapter Four: A Valued and Trusted Service for Our Customers and Communities
ENHANCED ENGAGEMENT OVERVIEW
We engaged with 19,046 stakeholders across 58 events on Customer Service and Customers in Vulnerable situations and they identified the following RIIO-ED2 priorities.
1
TOP STAKEHOLDER PRIORITIES
KEY STAKEHOLDER INSIGHTS
Improve response to unplanned power cuts reflecting customers increased dependency on electricity
Enhance digital contact and self-service options while strengthening services for ‘Generation Landline’
Ensure customers in vulnerable situations are not left behind in energy transition, including those temporarily vulnerable
Deepen the support services for domestic Priority Service Register (PSR) customers, as well as recognise and assist vulnerable Small and Medium Enterprises (SMEs)
Support community action on net zero, including advice on Low Carbon Technologies (LCTs) and new low carbon connections
HOW WE RESPONDED TO FEEDBACK
Communication preferences: Customers indicated that they would like to be contacted in different ways based on their communication preferences, so we developed a customer services strategy that offers opportunities for self-service as well as traditional phone channels.
Customer Standards of Service: Stakeholders don’t understand who we are or our role, and that we should have a dedicated plan demonstrating care and commitment. To improve in this area, we will create a Customer Focus Group with domestic, SME and customers in vulnerable situations to review our approach and strategies for customer service.
Customer Satisfaction: It was determined as a medium priority that improvement should be targeted for these scores, including the rebalancing of scores across regions, which is why we increased our ambition to 9.2 to reflect stakeholder views and balance ambition with cost. (Acceptability – 77%)
Digital satisfaction score: Maintain/improve our industry-leading 9.3 digital satisfaction score. (Acceptability – 79%)
Response times: Customers across both regions wanted to see us improve social media response times to 5 minutes as a high priority and SME’s reciprocated this sentiment for calls during power cuts. We have thus committed to improving our speed and response through a full package of investment. (Acceptability – 86%)
Complaints: Stakeholders gave a medium priority to increasing the percentage of complaints solved within a day to 90%, and so we have changed our target to reflect that ambition, as well as establishing a partnership with an independent complaint platform to simplify raising and tracking complaints. (Acceptability – 83%)
*Enhanced Output* Overall Customer Vulnerability Strategy: We have developed a more comprehensive strategy to meet the key needs raised by stakeholders around the awareness of current services, better utilisation of data, improving partnerships as well as communication to customers in vulnerable situations during power cuts. (Acceptability – 77%)
PSR Signups: Domestic customers placed a high priority on us increasing PSR registrations and delivering more PSR services. Target increased from 770,844 to 1million, focusing on areas of high eligibility but low registrations. (Acceptability – 73%)
PSR Customer Satisfaction: WTP feedback showed low support for a 9.5 score so we’ve maintained a 9.4 target, with a focus on improving staff training. (Acceptability – 79%)
*Enhanced Output* Fuel Poverty Training: Helping fuel poor customers is a high priority and our social value research suggested it can deliver significant impact so we increased our plan’s ambition from 25,000 to 50,000 households. (Acceptability – 79%) We have also added three *New Outputs* to further
Open discovery
• Supporting customers in vulnerable situations is a top priority for domestic and SME customers. Identifying and educating customers on the PSR and net zero is viewed as a key enabler to deliver on our strategic outcome in this area
• While broadly satisfied with customer service and power cut communication, some wanted to see further improvement around informing customers during power cuts
Co-creation
• Co-creation events encouraged a focus on increasing support for customers in vulnerable situations, including the suggestion to provide Personal Resilience Plans for those on the PSR
• Affordability was a key for all stakeholders, notably since the pandemic
• Partnerships could enable us to better serve PSR customers, through improved communication and extending benefits to more PSR customers
Business Plan refinement
• All stakeholder groups ranked this area high during the Willingness-To-Pay (WTP) event, including ‘helping fuel poor customers’ being the highest priority for both domestic and non-domestic customers
• PSR awareness was low and stakeholders strongly encouraged to pursue dedicated bespoke fuel poverty and energy advice training for our employees to better serve those on the PSR
• Stakeholders agreed with the Personal Resilience Plans but were concerned about the cost-effectiveness
Testing and acceptance
• The majority of stakeholders agreed that our outputs were ambitious, comprehensive enough and represented good value for money for customers
• Helping those in fuel poverty was seen to have the highest impact and suggesting we could do more in this area, as well as addressing key barriers to LCT uptake
to August 2020
Aug 20 – Feb 21
Feb 21 – Jun 21
Jun 21 – Dec 21
54

46 | Section B: Chapter Four: A Valued and Trusted Service for Our Customers and Communities
2
Output Type Target Consumer benefitCosts in our baseline plan
CUSTOMER SERVICE, COMPLAINTS, AND BUSINESS SUPPORT
Customer Satisfaction Survey
ODI-FMeet our targets through our plan and strive to achieve a score of at least 9.2 across all categories • Improved service for all our customers
across a number of different channels, including diversified self-serve options alongside traditional means of communication £26.1m
Digital Satisfaction ODI-FMaintain/improve our industry leading 9.3 digital satisfaction score
Average speed of response
SSEN AimImprove average speed of response to 20 seconds on the telephone for power cuts and to five minutes on social media
Resolving complaints and simplifying our processes
ODI-F
Meet our targets through our plan and further strive to reduce complaints by 5%, resolve 75% of complaints at 1st contact, 90% within 1 day and 99% within 1 month by 2028
• Simplified processes and quicker resolution of complaints
VULNERABILITY STRATEGY
Vulnerability strategy LO/ODI-F
Meet our obligations to treat all customers fairly, including those in vulnerable situations. Put in place a vulnerability strategy, to be reviewed and refreshed annually and our performance incentivised
• Our data-driven approach will help target our activities and register more customers who will benefit from our services
• Improved support delivered through our partnership approach as required
• £17.2m financial benefits delivered through targeted fuel poverty support and energy efficiency measures
• £3.7m societal benefits delivered through quality-of-life improvements, health benefits and carbon emission reductions
£12.3m
PSR gap analysisPart of
strategyReach over 1 million PSR customers by 2028, refreshing our data every 24 months
PSR customer satisfaction
Part of strategy
Improve PSR customer satisfaction scores to 9.4
Fuel povertyPart of
strategy
By 2028 support 50,000 households (equivalent to 114,000 customers) with fuel poverty
Training and development
Part of strategy
Train 30 employees to the City & Guilds energy efficiency qualification and introduce 200 vulnerability champions across the business from the start of RIIO-ED2
Training and development
Part of strategy
Deliver education on LCTs to the most vulnerable and hard to reach through partners
Educating on the benefits of energy efficiency and Low Carbon Technology, tackling digital exclusion.
Part of strategy
Deliver a programme of targeted interventions to prepare future customers (39,000 children) whilst supporting existing customers with learning difficulties (2,400 adults) with education on fuel poverty, energy efficiency and LCTs, and upskill digitally-excluded customers (35,000) in using online services
• Equipping future customers with the right tools and knowledge to lessen the likelihood of falling into fuel poverty
• Targeted support to adults with learning difficulties ensuring they have the help and support they need
• Providing access to digital upskilling to ensure customers are not left behind in the digital age
• £1.4m benefits delivered to customers in vulnerable situations
OUTPUTS AND AIMS
77% ACCEPTABILITY FOR ‘A VALUED AND TRUSTED SERVICE FOR OUR CUSTOMERS AND COMMUNITIES’
increase support to cover energy efficiency and digital upskilling, reduce barriers to the installation of energy efficiency measures and creating Personal and Social Support packs. (Acceptability – 83%, 77%, 76%)
Energy efficiency training: We were encouraged to source fuel poverty and energy advice training for our employees so specialised training for 30 employees and enhanced training for 200 vulnerability champions will be established across the business to provide timely advice and support to better serve our customers. (Acceptability – 73%)
LCT education: Identifying and counteracting barriers to customers in the smart energy transition was a priority for stakeholders thus we will partner and deliver education to the most vulnerable and hard to reach. (Acceptability – 76%)
*Enhanced Output* ‘Powering Communities to Net Zero’ fund: Funding is the key barrier to LCT uptake with vulnerable customers, to reflect stakeholder feedback we have doubled our fund size to £500,000 and will focus on community infrastructure rather than on individuals. This will be a shareholder-financed fund. (Acceptability – 76%)
*Enhanced Output* Business Support Register: SMEs told us they need extra support during power cuts so we will establish a new register by 2023. (Acceptability – 78% amongst SME customers)
*Enhanced CVP* Personal Resilience Plans (CVP): We will proactively offer tailored additional support for new and existing PSR customers in our CVP. (Acceptability – 83%)
*Enhanced Output* – This denotes a change in ambition or scope in the output between our draft and final plan.*New Output* – This denotes an addition of a new outputs between draft and final plan.*Enhanced CVP* – This denotes a change in ambition or scope in the Consumer Value Proposition between draft and final plan.

47 | Section B: Chapter Four: A Valued and Trusted Service for Our Customers and Communities
LO: Licence Obligation; PCD: Price Control Deliverable; ODI: Output Delivery Incentive (F: Financial, R: Reputational), CVP: Consumer Value Proposition; SSEN Aim: Company Goal
Output Performance RAG
Customer Satisfaction Survey (CSS)
We have improved customer satisfaction levels from 8.16/10 in 2015 to 8.58/10 in 2021 in SEPD, and 8.74 to 9.25 in SHEPD. Our northern network has consistently ranked in the top five for performance across all 14 DNOs.
Complaints MetricBoth networks have consistently performed well. In 2020/21 SEPD outperformed the Ofgem target by 61% and SHEPD by 72%. Since 2016/17, we have met our RIIO-ED1 commitment of resolving over 70% of complaints within Day +1.
Stakeholder Engagement and Consumer Vulnerability (SECV)
Our SECV performance has improved in recent years. In 2018/19 we introduced a dedicated improvement plan, resulting in significant improvement in our 2019/20 and 2020/21 scores. In 2020/21 we ranked second out of six DNOs for the consumer vulnerability component of the incentive.
TRACK RECORD
3.1 Outputs performance We have performed well during RIIO-ED1 to date across key customer service metrics such as the Customer Satisfaction Survey and complaints metric. While we have not historically performed as strongly as our peers under SECV, our performance has improved significantly, and we rank well on the consumer vulnerability component.
3
Please see Track Record (Chapter 2) for an overview of our RIIO-ED1 performance across key areas.
Output Type Target Consumer benefit Costs in our baseline plan
VULNERABILITY STRATEGY (CONTINUED)
Energy Efficiency Enablement Fund
Part of strategy
Work with partners to reduce barriers to the installation of energy efficiency measures by 440 households in vulnerable situations
• The fund enables customers to access the help they would otherwise be excluded from. Through bridging the gap customers will be able to install energy efficiency measures
• £0.25m benefits delivered to customers in vulnerable situations
Personal and Social Support Packs
Part of strategy
By 2028, deliver 5,000 energy efficiency packs to fuel-poor households, and 5,000 power cut resilience packs to PSR customers, tailored to their needs
• Improving the resilience for customers during a power cut, and through the use of energy efficiency measures driving financial benefits
• £0.5m benefits delivered to customers in vulnerable situations
Meeting the needs of small/medium businesses
SSEN Aim Introduce a Business Support Register
• Reduce the impact from supply interruptions: SMES will receive extra support to ensure better resilience and communication to cope in power cuts
Personal Resilience Plans
CVP
Proactively provide PSR customers with Personal Resilience Plans containing specific advice tailored to a customer’s individual needs, helping them know what to do during power cuts
• Increased service to customers in vulnerable situations through bespoke Personal Resilience Plans, providing £3.9m net consumer benefits
£7.3m
Shareholder Fund SSEN Aim
Introduce a shareholder-financed £500,000 annual 'Powering Communities to Net Zero' fund to support LCT accessibility initiatives for those in vulnerable situations, and community-led environmental and resilience schemes
• £8.2m financial benefits and £1.4m societal benefits enabled by ensuring customers in vulnerable situations can access energy transition benefits
£2.5m (shareholder
funded)

KEEPING THE LIGHTS ONExtreme weather responseSSEN goes out and fixes the disrupted cables or any other faults to get electricity back on.Planned power cuts for maintenance workWhen power needs to be temporarily cut due to maintenance work, customers in the planned area are informed well in advance.
CONNECTING TO OUR NETWORKConnec�onsSSEN helps to connect homes or developments to electricity, or increase supply to exis�ng connec�ons.
TOWARDS A NET ZERO FUTURESSSEN facilitates the connec�on of low carbon technologies to the electricity network. We operate a flexible network of distribu�on grids to meet the future energy demands with the increase of services such as electric car charging and low carbon products.
SUPPORTING OUR CUSTOMERSMaintenance servicesSSEN offer free of charge maintenance and safety services.Priority servicesSSEN proac�vely reach out to vulnerable customers to ensure they have the right support.
Community EngagementOur Community-based Customer and Community Advisors proac�vely engage with local community groups, parish, and district councils as well as local residents to offer advice and guidance. SSEN also provides face-to-face informa�on and additonal support during power cuts.
48 | Section B: Chapter Four: A Valued and Trusted Service for Our Customers and Communities
3.2 Transitioning to RIIO-ED2 While customer satisfaction remains high, in particular when compared to other industries, our customer satisfaction survey performance in SEPD is not as strong that of other DNOs. To ensure continuous momentum towards our aim of delivering industry-leading performance for all our customers in RIIO-ED2 we have created a seven-year Customer Experience Strategy (Annex 4.1) which will support our successful transition from RIIO-ED1 to RIIO-ED2.
The strategy complements our dedicated vulnerability strategy and focuses on three key phases that will strengthen our ability to put customers at the heart of everything we do and ensure successful delivery through RIIO-ED2.
Improving service touchpoints for customers
We have created a series of personas that reflect real world behaviours and characteristics, representing a significant portion of our customers. The personas help us empathise with different customers so that we can create tailored experiences and services for individual needs and avoid a one size fits all approach. Please see our Customer Experience Strategy (Annex 4.1) for further details.
Our strategy is designed around four service touchpoints that leverage the benefits of digital technology and a customer driven culture. They are:
1) Keeping the lights on: improving our response to unplanned power interruptions, weather events that affect our network, safety critical emergencies, damage to equipment by third parties.
2) Connecting to our network: providing new connections to our networks, installing the infrastructure to support the transition to Net Zero, such as electric charging points
3) Supporting our customers: engagements with our teams working in the local community, sharing SSEN’s vision and reviewing customer and stakeholder responses, creating a collaborative approach to how we do business.
4) Toward a net zero world: providing support and advice on LCT opportunities such as EVs and ground source heat pumps
The strategy encompasses digital and customer experience improvements with a strong focus on designing and implementing a customer data strategy, delivering a new marketing strategy that focuses on our role in local communities, and embedding organisational and cultural change.
Output
2021 – 2023
Embedding the foundations
2023 – 2026
Evolving our services
2026 – 2028
Service of the future
As we finish our current price control, it’s important the foundations of brilliant
service are embedded within our business
Moving into a new price control won’t change our service standards overnight, but within the first three years, we plan
to evolve our services to meet our customers growing needs
and expectations
The past 7 years has taught us that the services we offer to customers are
transforming at a rapid pace, and as this pace accelerates, we need to be ready
for the service of the future
Our commitment
We will ensure our processes are fit for purpose, our people are trained to provide
an excellent standard of service and our customer-facing digital services serve
the needs of customers
We will invest in our technology solutions to evolve the standard of service provided, continue to develop our people’s skillset
and enhance service offerings we provide
Our customer journeys will be fit for the future, and serve the growing needs of our current and future consumer base
SERVICE TOUCHPOINTS
How we will interact and provide services to our customers now and in the future.

49 | Section B: Chapter Four: A Valued and Trusted Service for Our Customers and Communities
IMPROVING OUR CUSTOMERS’ EXPERIENCE
Our plan is designed to respond flexibly to our customers’ evolving needs and expectations, against a backdrop of wider societal and network change. Our extensive stakeholder engagement gives us confidence that our plan will deliver industry-leading and value for money services for all our customers.
We have co-created with stakeholders six customer service promises.
Our outputs and activities will drive the delivery of stakeholder and customer priorities across both our licence areas, meeting our targets under the Customer Satisfaction Survey and Interruptions, General Enquiries and Connections metric. We are targeting a 9.2 customer satisfaction score across general enquiries, complaints, and connections. For further information on our proposals to improve our customer connection services, please see Our Network as a Net Zero Enabler (Chapter 10). Our proposals in Environmentally Sustainable Network (Chapter 13) and Maintaining a Resilient Network (Chapter 7), will also play a key role in delivering on our ‘safety’ and ‘greener world’ promises.
Embedding a strong customer centric culture
We will continue to develop and implement our cultural transformation programme, making sure our employees have the right skills and tools to deliver our commitments. We have developed a strong campaign approach to heighten awareness among our people of their role in our customers lives. Campaign messages and straplines employ passionate language that’s designed to be noticed and discussed, such as ‘customer-obsessed, digitally-empowered and relentlessly-innovative’.
We will provide tailored and enhanced customer service and consumer vulnerability skills for above 3,700 employees through our ongoing Empowered to Care programme. 900 of our employees will gain further customer service accreditations with the Institute of Customer Service, reflecting our commitment to invest in providing service excellence. In addition, we will be training 30 employees as subject matter experts in energy efficiency to City & Guilds standard and embedding 200 vulnerability champions throughout all areas of our business. By combining cultural change and targeted IT investment, we can deliver a step-change in improvements across both our network areas.
4
PROVIDE A VALUED AND TRUSTED SERVICE FOR OUR CUSTOMERS AND COMMUNITIES
Be there for our customers
Keeping people safe Greener worldRelentless
improvementShaping
our servicesActing
responsibly
We will treat customers as individuals, shaping our services to meet
their needs
We will be relentless in finding new innovative
ways to improve our services
We will stop at nothing to keep our customers
and employees safe
We will act respon-sibly, being aware of the wider society we
serve
We will be there for our customers when
they need us
We will continue to build a greener world
for our customers
OUR CUSTOMER PROMISES
Figure 4.1: Our Customer Experience Strategy delivers the 6 customers promises we co-created with stakeholders
Our cultural initiatives: Through cultural initiatives and staff training…
…we inspire staff and change mindset…
…which delivers service customer-led services.
Employee Volunteering – Be The Difference days
Employee Skills-based pay
Customer Standards of Service
Empowered to Care Culture Change Programme
Business Support Register
Personal Resilience Planning (CVP)

50 | Section B: Chapter Four: A Valued and Trusted Service for Our Customers and Communities
4.1 Delivering at an efficient cost
Breakdown costs enabling Customer outputs
All employee costs £2.5m
Employee training costs £0.9m
Customer focus group £0.1m
Resolver Complaint Management Partnership £0.4m
Customer Discovery £2m
Total £5.9m
Our three service horizons outlined within our Customer Experience Strategy, helped us to identified where new roles, employee upskilling and external partnerships would be required to deliver on our plan. This includes increasing the number of dedicated
Customer Service Advisors to support customers when they need us most, and investment in a partnership to provide an easy to access, transparent complaint tracking portal for customers, whilst also providing clear guidance on their consumer rights.
Keeping up with the pace of change is important, whether that be customer expectations, advancing technology or revisions to net zero and related policy. We have defined a Customer Discovery Budget which will enable us to research, test and respond flexibly to these changing needs. This reinforces our commitment to keep our customers at the forefront of our plans by establishing a dedicated budget for our customer focus group to ensure their input and suggestions are enduring throughout RIIO-ED2. Our Customer Discovery investment is described fully in the Customer Experience Strategy (Annex 4.1).
Promoting a range of channels and services that meet the needs of all our customers
Our plan recognises the need to offer support through multiple channels, with information being presented in a clear and meaningful way to ensure that all our customers are able to communicate with us in a way that best suits their needs.
• We will maintain or improve our industry leading Digital Customer Satisfaction Score at 9.3
• We will promote our digital channels as a preferred contact increasing uptake of social media to 60%
• We will improve our average speed to answer the telephone for power cuts to 20 seconds, and improve our social media response time to 5 minutes
Through the introduction of Educational Liaison officers, we plan to create free educational materials and interactive workshops to support new and existing digital customers, or customers who want to learn how to self-serve. Stakeholders have also reminded us that some customers may find it difficult to engage with us through digital channels, underlining the importance of maintaining a quality service through more traditional channels.
All customers are vulnerable to scams and we are committed to becoming part of Utilities Against Scams3. We will provide online advice about how to become scam aware, delivering training to our front-line employees and making sure when we approach a customer or speak to them on the phone, they feel safe and we can validate who we are.
Improving complaints performance
• We will develop and improve our complaints system with the introduction of pre-defined algorithms which will support the identification of customers who may be vulnerable so that we can offer dedicated support
• We will introduce an enhanced customer complaints system and provide a range of easy-to-use, interactive platforms for our customers
• As a result, we aim to resolve 75% of complaints at first contact, 90% of complaints within a day, and 99% of complaints within a month. We aim to reduce complaints by 5% each year, with no Ombudsman complaints upheld
Continuing to evolve our services: our customer service roadmap
• We will establish a Customer Focus Group to challenge and inform us as we continue to shape our service offering
• We will introduce a skilled team dedicated to identifying, testing and implementing new and innovative customer service technology and processes, ensuring we are always at the forefront of new developments throughout RIIO-ED2
Our customer service improvements are instrumental in delivering benefits across key areas of our plans. We will create a standalone road map that sits alongside our Customer Experience Strategy, which will detail our aims and objectives and what we will do to achieve them. The road map will be refreshed annually, to ensure it keeps pace with customers’ changing needs and expectations, reflecting the shared and individual challenges such as net zero and vulnerability through changed circumstances.
The road map will be customer and stakeholder led, which is why we will engage continuously on our proposed commitments and service offerings to ensure they meet the needs now and in the future. Our Customer Focus Group will play a key role in the creation of the plan, providing input and guidance, whilst reviewing what we have committed to so far and reviewing our progress.
Providing timely and accurate information during power cuts
We recognise the importance our customers place on this, with speed of notification and opportunities for live tracking identified as priorities. Our speed of response depends in part on the nature of the fault.
• We will introduce two-way advance notification of planned outages and will move to an open data operating model
• We will provide tailored updates during a power cut by the preferred channel at a frequency agreed with the customer
4.2 Outputs
3 Utilities Against Scams is part of the National Trading Standards ‘Friends Against Scams’ initiative, to raise consumer awareness around scams: https://www.friendsagainstscams.org.uk/UAS

51 | Section B: Chapter Four: A Valued and Trusted Service for Our Customers and Communities
SUPPORTING CONSUMERS IN VULNERABLE SITUATIONS
Our plan ensures that we will treat all customers fairly, leaving no customer behind, supporting and safeguarding those in vulnerable situations and those who need us most. We will evolve to meet changing needs and to serve them as they have come to expect from their other customer experiences.
Through our 3 tiers of dedicated initiatives we will support 1.3m customers with fuel poverty, personal resilience, energy efficiency measures, whilst also providing additional opportunities to access low carbon technology. We will continually measure our performance against our outputs. We will create a yearly customer service and vulnerability action plan mapping out any actions required to drive performance as identified through continued stakeholder engagement.
5
We have worked with customers and stakeholders to update our vulnerability strategy goals and to better understand what the transition to low carbon technologies means for those in more vulnerable situations. Our consumer vulnerability fifth promise, as set out in the Figure 4.3, is that we ‘Drive fairness in the transition to low carbon technologies’ fully reflects our commitment to support all customers in the energy transition.
Section 4 of our Vulnerability Strategy explains how our vulnerability goals map to Ofgem’s minimum requirements.
Figure 4.2: The table shows how many customers are supported by our Vulnerability Strategy initiatives
Figure 4.3: Our 5 consumer vulnerability promises delivered through our vulnerability strategy
PROVIDE A VALUED AND TRUSTED SERVICE FOR OUR CUSTOMERS AND COMMUNITIES
Evolving our partnerships
PSR provision and promotion
Inclusive and accessible services
Supporting fuel poverty
Fairness in low carbon technology
Expand on fuel poverty and energy effi-
ciency activities
Widen our partnership network and collaborative activities
Drive fairness in the transition to low carbon technologies
Ensure our services are inclusive and accessi-
ble now and in the future
Drive forward Priority Services
Register provision and promotion
PROMISING MORE FOR THOSE IN VULNERABLE SITUATIONS
Initiative Description of activityCustomers Supported
OUR BASELINE ACTIVITIES TO SUPPORT CUSTOMERS IN VULNERABLE SITUATIONS INCLUDES;
Tier 1
Referrals and outreach Using our engagement to identify referral opportunities to our partners for further support.
200,000
Energy Efficiency Enablement Fund Enabling fund to allow customers access to energy efficiency measures.
Personal and Social Support Packs Providing energy efficiency packs to support customers and achieve our net zero goals.
Digital AmbassadorsThe upskilled Digital Ambassadors will complement our other educational initiatives to deliver sessions in local community centres providing training to help bridge the digital gap which will also include how to access our online portal, power track as well as learning basic digital skills.
Educational Initiatives Proactively engage with school children on energy usage, energy efficiency measures and the be benefits of LCT, extending this education through bespoke workshops for adults with learning difficulties.
WITH THE ADDITIONAL COMMITMENT TO SUPPORT THROUGH A;
Tier 2Powering Communities to Net Zero Fund
A shareholder financed £500,000 annual ‘Powering Communities to Net Zero’ fund to support LCT accessibility initiatives for those in vulnerable situations, and community-led environmental and resilience schemes.
640,000
WE HAVE ALSO PROPOSED TWO CONSUMER VALUE PROPOSITIONS (CVPs) WHICH WILL;
Tier 3
Personal Resilience PlansSupporting PSR customers with a tailored personal resilience plan, with provision of battery back up for PSR 1+ customers.
470,000
Energy EfficiencyUsing EE measures at targeted network locations, we believe we can save domestic customers money on their own bills and help resolve wider network constraints.
THROUGH OUR 3 TIERS OF DEDICATED ACTIVITIES FOR OUR CUSTOMERS IN VULNERABLE SITUATIONS, WE WILL AIM TO SUPPORT: 1.3m

52 | Section B: Chapter Four: A Valued and Trusted Service for Our Customers and Communities
5.1 Our vulnerability strategy Our Vulnerability Strategy details our approach to safeguarding customers in vulnerable situations with a strong focus on:
5.2 Outputs Taking a sophisticated approach to the management, promotion and maintenance of a PSR register
Our understanding of vulnerability is continuously evolving. We know from stakeholder feedback that we need to adapt and enhance our services, providing tailored support to all our customers, including the temporarily vulnerable. Our PSR is the fundamental tool we use to do this, and it is critical that we continuously improve the quality and accuracy of our PSR data.
We have been working with Centre for Sustainable Energy (CSE) to better understand how the number of customers in vulnerable situations might evolve and the implications for closing our PSR gap. In 2019/20 our PSR gap was 34.2%. We reduced this to 31.5% in 2020/21. By being more strategic in using the data we hold we aim to reduce the PSR gap to 28% in RIIO-ED2.We will continue to use our customer mapping tool to raise awareness of our services and target reductions in our PSR gap.
We are committing to maintaining our Inclusive Service Provision accreditation (BS18477:2010) throughout RIIO-ED2. Our webpages meet all accessibility requirements and have been independently
ranked best in class for accessibility by Sitemorse. We also offer a wide range of accessible formats.
Our Priority Services team are available 24/7 to provide dedicated support. In particular we provide a range of services to safeguard those in vulnerable circumstances during a power cut. This includes welfare support including charging for mobile devices, hot food and drinks, and Just Eat food vouchers. Our PSR customer survey is a key tool in understanding how we are performing and how we can continuously improve our services. Our Personal Resilience Plan CVP is designed to provide above and beyond support prior to and during power cuts.
Our PSR is made up of 29 categories, enabling us understand customer needs and effectively target support. We have introduced bespoke needs codes, for example for residential care homes which have large numbers of people in vulnerable situations, or for those customers who are at high risk and shielding or who have Covid-19. We also have the facility to increase the priority of a customer, who may not have medical equipment but who may still be extremely vulnerable for example to loss of power, with the use of a high priority needs code. We categorise these needs into 4 priorities, PSR1+, 1, 2 and 3. We classify those customers dependent on electricity for medical support and those customers at highest risk of detriment from power cuts as highest priority.
5.1.1 Delivering at an efficient cost
Our overall Vulnerability Strategy will be delivered at a cost of £12.3m, with a £2.5m shareholder contribution. This excludes our CVP proposal.
We consider that our strategy represents value for money and will deliver significant benefits. We have assessed a number of key initiatives through SROI, including support for 50,000 households with fuel poverty, new initiatives providing education, personal and social support packs and an Energy Efficiency Enabling Fund supporting customers in the transition to net zero. Combined, these will deliver over £23m in consumer benefits over RIIO-ED2.
Breakdown of investment in our Vulnerability Strategy
All employee costs 4.7m
Support for customers – welfare packs 0.4m
Fuel Poverty 4m
Additional activities supporting fuel poverty and low carbon technologies 1.2m
Employee training cost 0.1m
Partnership fund 1m
Digital Ambassadors 0.2m
Partnership to support Business Support Register 0.8m
Total 12.3m
SSEN SHAREHOLDER FUNDED ACTIVITIES
Powering Communities to Net Zero Fund 2.5m
Total overall 14.8m
INNOVATING TO SUPPORT THOSE IN VULNERABLE SITUATIONS
Since 2019 we have supported the Centre for Sustainable Energy’s innovative Smart and Fair? programme of work. Phase One successfully informed and moved forward the debate about how the transition to a smarter energy system can achieve fair outcomes and ensure that no one is left behind. By developing more comprehensive analytical techniques and contributing new insights, the programme’s work has already improved understanding amongst stakeholders and policymakers of the challenges and opportunities which need to be addressed as the system develops. Building on the success of the first phase, Phase Two will focus on; (a) extending and validating the data analytics to cover all our licence areas and enhance the reliability and accuracy of its predictive capability; and (b) providing tailored strategic and operational inputs to relevant Business Plan outputs.
In RIIO-ED2 we will build on our existing innovations and use innovation funding to promote a just and fair transition, improving our understanding of customers’ changing needs, and develop new services and solutions to meet these.
ENSURING ALL CUSTOMERS CAN BENEFIT FROM THE NET ZERO
TRANSITION
VULNERABILITY DURING A LOSS OF SUPPLY
FUEL POVERTY

53 | Section B: Chapter Four: A Valued and Trusted Service for Our Customers and Communities
KEY OUTPUTS
• Reach over 1 million registered for Priority Services in RIIO-ED2
• Work with other utilities to create a ‘one-stop-shop’ so customers only need to register once on the PSR
• Proactively contact all PSR customers to cleanse their data every 2 years
• Improve PSR satisfaction to 9.4 in RIIO-ED2
Supporting consumers in vulnerable situations through the smart use of data
Vulnerability mapping is at the heart of our activities to inform the development of our services and partnerships, targeting our activities at those who need it the most. We are using this data to understand our PSR gaps, priorities in each of our regions, and new or emerging trends. This is particularly key in the current context, with the effects of the Covid-19 pandemic further exacerbated by the rise in energy prices.
During RIIO-ED1 we led the industry with data driven analysis of PSR. Using the most credible, publicly available social data, from national charities and Government department we overlaid statistics of registered customers and households to see the true level of PSR registrations. From this we have found our top five PSR gaps and engaged with stakeholders to reduce the gaps. This best practice we have developed is being used to benchmark the industry moving forward into RIIO-ED2. Once datasets are agreed across all the DNOs this methodology will allow a consistent process for the industry to assess areas of success and where extra effort is required.
A new Business Support Register to recognise small businesses experiencing vulnerability
Recognising the negative impact of power cuts on Small to Medium Enterprises (SMEs), we will:
• Proactively engage to understand how we can work with SMEs to cause the least disruption
• Provide advanced warning of any Planned Supply Interruption with at least 30 days’ notice
• Offer free tailored support on resilience planning as well as access to a wide range of coaching and advice though a partnership with Be the Business
Our system will be updated to reflect membership of our Business Support Register and our staff are trained to identify business who may be eligible.
“ SSEN is an important supporter of Be the Business’ mission to improve the productivity and performance of UK SMEs. UK productivity continues to lag behind that of our international peers, and low productivity is a major drag on economic growth. The recent past has shown us how important it is for businesses to build resilience into their business models. SSEN is working with Be the Business to help small businesses across the UK access much needed resources to become more productive, resilient, and better equipped to meet the challenges of the future.”
Anthony Impey, CEO of Be the Business
Understanding new forms of vulnerability, and enabling participation in a smart flexible energy system
Partnership workingWe will continue to build and extensive network of partnerships throughout RIIO-ED2, supported by a proposed partnership fund of £1m. We will look to support key partners in developing their resilience, recognising that some organisation will have faced tough challenges in the pandemic. We will measure the outcomes and benefits of our strategy, including through Social Return on Investment (SROI). We will carry out regular surveys to ensure partnerships are strong and meaningful.
Addressing fuel poverty and supporting customers with specific needs There is a direct link between fuel poverty and people with mental health problems. A study by the National Centre for Social Research4 showed that even after controlling for financial circumstances, people living in cold homes were more likely to have anxiety and depression. The study found that around 28% of young people experiencing fuel poverty were at risk of mental health issues compared to just 4% of those living in a warm home.
Millions of people with mental health problems struggle to use essential services because of difficulties making phone calls, opening post or filling in complex forms. We will partner with organisations to further understand the link between mental health and fuel poverty and improve our services to help them.
We will continue to engage and hold focus groups with partners such as National Energy Action, Energy Action Scotland, Citizens Advice and Citizens Advice Scotland. We will work with other organisations such as Step Change, Home Energy Scotland, Centre for Sustainable Energy and Yes Energy Solutions to signpost and refer customers to help lift people out of fuel poverty.
TURNING INSIGHTS INTO ACTION FOR SMES
Our small and medium-sized enterprise (SMEs) stakeholders, including owners of cafes, hairdressers and holiday-let landlords, told us about how power cuts harm their businesses through immediate loss of revenue and longer-term reputational harm. This makes them temporarily vulnerable as the impact of the power cuts puts added strain on efforts to recover from the effects of the pandemic. In addition to this we also understand that businesses such as Residential/Care homes may need additional help in supporting the customers they look after who are most vulnerable. They have requested a “business equivalent of the PSR” to deliver tailored support and accurate, timely information on power cuts. This was a fresh insight which we have embraced by committing to create a Business Support Register. This will enhance our services to businesses and ensure they receive more updates, proactive communications and access to resilience planning support to help them to cope if they do experience a power cut. We are also committing to offering further support to local businesses in our communities through a partnership with Be the Business, a charity organisation focused on coaching, developing and providing enhanced support for small to medium businesses.
WHOLE SYSTEMS AND VULNERABILITY – JOINING FORCES ON A SCOTLAND-WIDE PSR
In March 2021, we invited SP Energy Networks and Scottish Water to join us and launch Priority Services Register (PSR)
Scotland, an innovative partnership to inform customers of the free support available to those most in need. Customers across Scotland now have a single point of access to learn more about the free help available in their individual area, with links to the relevant pages on each company’s website to simplify the registration process.
4 https://www.natcen.ac.uk/

54 | Section B: Chapter Four: A Valued and Trusted Service for Our Customers and Communities
We are focused on improved collaboration with councils, local resilience groups and other organisations who are also working hard to tackle fuel poverty. These organisations can reach people, especially those hard to engage, that we would not normally reach through the traditional methods. Our energy efficiency partnerships will be complemented by our Energy Efficiency CVP proposal which will focus on proactive work with Local Authorities and partners to identify and implement energy efficiency measures across our customer base, utilising our customer mapping tool to target those communities with higher levels of fuel poverty and/or consumer vulnerability.
A NEW NEEDS CODE FOR FINANCIAL VULNERABILITY
Engagement with Step Change indicated that we should consider doing more to identify customers who would benefit from financial assistance therefore we are going to introduce a new needs code for financial vulnerability. We understand that we may be the first DNO to commit to introducing this at the start of RIIO-ED2. We will be able to overlay this with our current data on our Customer Mapping Tool to allow us to better identify areas of high fuel poverty or low income families, against our PSR to prioritise and target our engagement. This will include using our 30 trained employees in City and Guilds, current fuel poverty partners and any new partnerships we form in RIIO-ED2.
We will encourage this be introduced as an industry standard needs code which help support energy suppliers in identifying more customers who would benefit from support if they are struggling to pay their energy bills.
Embedding our approach to protecting consumers in vulnerable situations in our operations
RE-AFFIRMING OUR APPROACH TO ADOPTING WHOLE SYSTEM WORKING FOR OUR CUSTOMERS
Our Whole Systems strategy outlines our overarching approach to whole systems. To further support customers in vulnerable situations, we are working with and learning from others in different sectors:
• Sharing information and data with water companies on PSR customers to enable more effective targeting of support across sectors. In RIIO-ED2 we are expanding our Whole System working to support customers in vulnerable situations, including the introduction of PSR Scotland
• Sharing best practice and resources with water companies. This includes advice on extending needs codes for vulnerability, details around our welfare van operations, welcome letter templates and communication strategies for engaging with PSR customers
• Working with local authorities, resilience groups and businesses on an ongoing basis to better understand how we can support them, including during network upgrades and power cuts
• Leveraging community partnerships to connect with hard-to-reach customers
• Sharing best practice and learning from others through membership of the Institute of Customer Service. This gives us access to other utility companies, as well as highly regarded organisations from the banking, retail and public sectors which we can learn from to deliver exceptional customer service, particularly for those experiencing vulnerability
Driving awareness and support for those in vulnerable situations is a priority for our business. We have processes in places for embedding our commitments in this space, with a strong focus on high quality training and vulnerability champions.
In addition, we will continue to work with our expert panels and introduce a new Customer Focus Group, to ensure we are continuing challenging our thinking and approach to supporting those in vulnerable situations.
Driving fairness in the energy transition
We are committed to supporting the communities we serve in making informed decisions about their net zero journey. 51% of people in our most recent PSR survey said they would consider installing at least one low carbon technology.
We will develop educational materials explaining the benefits of LCTs and outlining available support. We will work with charities and local community groups to ensure inclusivity, collaborating to ensure we proactively reach those who need it most.
This will be supported by a £2.5m Powering Communities to Net Zero shareholder fund, which will have a strong community focus. We will work with Local Authorities, Parish Councils and local heat groups to provide financial assistance with the installation of new LCTs. But our fund will also take a holistic approach, by seeking to improve ecosystems, increasing climate resilience, and contributing to local carbon removal.
To further support the activities outlined here, we are embedding vulnerability as a key theme in our Innovation Strategy (Annex 14.1), building on the success of our industry-leading Equal EV projects, which explores EV accessibility for people with disabilities. We will focus on the following innovation opportunities:
KEY OUTPUTS
• Help 50,000 households, equivalent to 114,000 customers, with fuel poverty
• Increase annual savings for customers through energy efficiency partnerships to £23m through energy efficiency and five new initiatives providing education, personal and social support packs and an Energy Efficiency Enabling Fund
KEY OUTPUTS
• Have in place a vulnerability champion at board level supported by 200 dedicated vulnerability champions throughout all areas of our business
• Train 30 employees to the City & Guilds energy efficiency qualification
KEY OUTPUTS
• Expand our partnerships in local communities to support a wide range of differing customer needs
• A shareholder funded £2.5m Powering Communities to Net Zero fund available in RIIO-2
• Partner and deliver education on LCTs to all customers, including the most vulnerable and hard to reach
• Educating on the benefits of energy efficiency and Low Carbon Technology, tackling digital exclusion

55 | Section B: Chapter Four: A Valued and Trusted Service for Our Customers and Communities
INVESTING IN OUR TEAMS, SYSTEMS AND PROCESSES TO MEET CUSTOMER NEEDS AND EXPECTATIONS
In total we propose spending £24.9m during RIIO-ED2, which includes ongoing running and operational costs, new investment aligned to outputs in this chapter, and £20.2m in enabling IT and digital costs, to deliver benefits across six Customer Service and five Vulnerability Promises.
We have undertaken detailed deliverability assessments since our Draft Plan submission, to ensure that our anticipated people investment reflects the requirement driven by our outputs. It is important for us to demonstrate how we intend to scope out new roles, enhance new and existing skills required, supported by an operating model that complements our plan.
We recognise that delivering our newly created Vulnerability Strategy requires governance, accountability and dedicated focus. We will introduce a Vulnerability business sponsor at board level and we are proposing to create the new role of Head of Consumer Vulnerability. It’s clear that Partnerships are key in the successful delivery of our planned activity and we are also proposing to create the new role of Partnership Manager to identify, implement and manage new partnerships between SSEN and specialist 3rd parties. Further details on our planned improvements to team structures and skills are provided in the Customer Experience Strategy (Annex 4.1).
Our proposal includes £2m investment in our Empowered to Care programme, £2m in a RIIO-ED2 Discovery Budget, to continually review, test and implement new technologies to allow us to keep pace with the changing customer needs over RIIO-ED2, and a further £8.4m to create new roles and new skills to support the delivery of our outputs. We are proposing £12.3m to deliver key vulnerability initiatives, including £5m on vulnerability funds, schemes and partnerships. An additional £2.5m from shareholders (not included in our Business Plan cost proposal) will be used for the Powering Communities to Net Zero Fund.
In order to deliver the improvements required to meet our customers’ needs and expectations, and ensure our systems and processes are fit for the future, we are proposing targeted investments of £20.2m in our systems to support Customer Service and Consumer Vulnerability. These are outlined below, with further information on our approach to digitalisation and IT, including breakdown of costs, available in IT and Digitalisation (Chapter 5), where our IT investments and benefits are mapped to each of our strategic objectives.
6.1 Enabling customer service excellence through IT and digital application
We will deliver four additional, customer driven IT and digital initiatives in RIIO-ED2 including significant investment in our IT and telephony infrastructure. These proposed improvements in our telephony and investments in digital technology will not only support our customer service offering during interruptions, or general enquiries, but also customers seeking to connect to our network or upgrade their connection, as detailed in Our Network as a Net Zero Enabler (Chapter 10). Elements of this investment will be key enablers for our Vulnerability Strategy (Annex 4.2), ensuring customers in vulnerable situations can engage and interact with us in their preferred way. The investments outlined will provide a platform on which we can continue to enhance our service offerings. As new innovative channels are identified we will have the technology infrastructure in place that will allow us to expand and adapt to these changes in line with customer preference. Our Customer Experience Roadmap will also continually review our service offerings against customer needs to ensure that we are getting the most form the technology we are investing in.
6
OUR DIGITAL AMBASSADORS PROGRAMME FOR RIIO-ED2
Through our extensive engagement, we know that digital exclusion is a real concern, especially as the transition to net zero introduces increased use of smart technology.
Our RIIO-ED2 business plan sets out our commitment to a new Digital Ambassador programme. We will train 25 employees each year of RIIO-ED2 to offer advice, hints and tips to customers at risk of being unable to capitalise on opportunities through their lack of digital knowhow. By the end of RIIO-ED2 we will have established a customer digital support team of 125 ambassadors to advise and support our customers who may need a little extra help accessing our online services.
A number of our Digital Ambassadors will also be embedded in the communities we serve, to offering free digital upskilling workshops to interested customers.
PERSONAL RESILIENCE PLANS
Being without power can be a stressful experience for customers and changed circumstances may cause them to become vulnerable. We offer a range of support to safeguard our customers and make sure we look after their individual needs in a power cut (refer to strategy).
We are committing to provide Personal Resilience Plans (PRP) for all new Priority Services Registrations (PSR) and ensure that all our existing customers are aware of how to receive a plan. Our PRP will provide customers with simple tailored advice on what they should do in a power cut based on their personal circumstances. It will include contact details for SSEN, emergency services, fuel poverty support and the option to add family members. It will also
provide information on what the Priority Services Register can do for them, such as power cut advice and preparing for a power cut.
Our proposal also extends to ensuring that those dependant on powered medical equipment and who may be eligible for battery packs, with provision for up to an estimated 20,000 packs over the five years.
We have engaged extensively with key stakeholders in designing and testing our proposal, including with customers in vulnerable situations, charities and NHS Scotland. We also conducted successful live battery pack testing trials with customers.
This CVP proposal will cost £7.3m and result in a net benefit of £3.9m.
Please see Consumer Value Propositions (Annex S3) for details.
5.2 CVP

56 | Section B: Chapter Four: A Valued and Trusted Service for Our Customers and Communities
6.1.1 Customer Omni-Channel Strategy
We will modernise our telephony system with a cloud-based telephony and omnichannel customer management system and replace our On-Premise software legacy with an Enterprise data lake which enables predictive automation of communication.
Modernisation will enable us to deliver an integrated customer experience, treat customers as individuals, increase ease of contact, remove silos and system inefficiencies, and enable integrated Virtual Assistants. We will be able to support customers much more quickly and efficiently throughout adverse weather periods (as a consequence of our changing climate) where we anticipate calls to continue to rise. For example, since its introduction, the ‘105’ emergency number receives on average 50% of calls a day, but on a high-volume day that figure can increase to 70%. Creating flexibility and self-serve options will allow us to re-deploy more employees into our communities during peak storm periods to help those customers in most need in their homes.
Telephony modernisation will enable improved customer service through provision of faster notifications to more customers affected by network issues, particularly in periods of exceptional events. Currently our Customer Contact Centres receive on average around 1,400 calls each day. Of these, c.1,100 result in human interaction with Call Agents and the remaining c.300 are dealt with via Interactive Voice Response, making our cost to serve relatively high. At periods of high call volume in the future, we will have the capability to offer inbound callers the option to select a date and time to be contacted, instead of them waiting in a queue.
Through this investment in technology we will also increase the ability to proactively contact customers through automation to provide updates on faults, warnings of approaching weather events that may impact the network and also information on the progress of planned works where we have notified we are carrying out essential maintenance. This enables us to deliver this proactive approach which could only be provided by a large increase of staff to manual complete these updates via telephone calls and text messages. We recognise that in RIIO-ED2 we will be increasing our work volumes and thereby intervening on the network more often. However, through our Deliverability Strategy (Annex 16.1) we detail the planning processes, tools and systems we will have in place in RIIO-ED2 to minimise disruption and customer impact.
6.1.2 Workforce Management System
A new system will support improvements to how we manage employee scheduling, forecast call volumes and actively manage larger volumes of calls during adverse weather conditions. This will benefit customers through a reduction in our average speed of answer, especially during high demand periods, such as during power outages. Our new system will drive improved efficiencies and help keep costs low for customers, while delivering an improved service.
6.1.3 Enterprise Data Lake
A data lake system helps extract data into a self-serve tool that will allow customers to improve their interactions with us relating to interruptions PSR general enquires and connections. It pulls information from multiple systems across our business into a single view platform. Customers will be able to access all information held by SSEN and view every interaction that has occurred to ensure accuracy, historical contact, preferred contact methods for further engagement, any vulnerability support required and at what preferred point of a journey or interaction.
6.1.4 Automation and robotics
Enhanced systems applying sophisticated algorithms will allow customers using telephony, website or social media channels to have a choice around the way in which information is presented back to them such as text, social media bots, email, calls etc. This facility meets the requirements of customers who wish to self-serve or require instant information and updates on interruptions or complaints. It will also create availability within our call centres for our advisors to spend more time with customers in vulnerable situations who have more support requirements and often specialised needs.

Digitalisation is key to delivering net zero for our customers and communities. It is a critical enabler of the activities underpinning the outputs across our plan that will deliver value and customer benefit as defined by stakeholders. Our investment plan for IT, OT, and digitalisation is designed to ensure the continuity of reliable service and to facilitate our core strategic ambitions around DSO, net zero, improved performance and efficiency.
As such, our IT, OT and digitalisation investments directly or indirectly support the six goals co-created with our stakeholders for RIIO-ED2 and key outputs across all areas of our plan:
• Create a foundation for net zero by investing £1bn in strategic resilience
• Reduce the frequency and duration of power interruptions by 20%
• Achieve customer satisfaction of 9.2 or above in every contact area
• Support 200,000 customers with fuel poverty, personal resilience or energy efficiency measures
• Facilitate 1.3 million electric vehicles and 800,000 heat pumps on our network
• Cut our business carbon footprint by at least 35% aligned to 1.5°C science-based target
Throughout the plan, we have indicated where IT and OT investments have contributed to the specific activities and outputs relating to these goals. We have provided a reference table at the end of this chapter to aid cross-referral.
57 | Section B: Chapter Five: IT and Digitalisation
CHAPTER FIVE: IT AND DIGITALISATION
Figure 5.1: Supporting the delivery of our four strategic outcomes
SUPPORTING DOCUMENTS
Digitalisation Investment Plan (Annex 5.1)1
Digital Strategy and Action Plan (DSAP) (Annex 5.2)2
Total investment in this chapter
Comparison to RIIO-ED14
Business Plan Data Tables
£264.1m £174.6m C4, CV11, CV7, CV12
We propose to invest £264.1m across 28 IT, OT and telecoms projects, providing a whole life benefit of £245.4m. Our plan contributes to far wider societal benefits driven by flexibility, estimated by Carbon Trust/Imperial College London to be worth up to £40bn3 by 2050 when compared against electricity systems that do not deploy additional flexibility technologies. The most direct consumer benefit is the reduced need for expensive infrastructure growth (which would lead to higher customer bills), that without flexibility would be necessary to reinforce the network in order to meet the expected significant growth in energy demand.
This is a significantly higher investment in IT, OT and digital than our RIIO-ED1 plan, reflecting the considerable number of applications and functions that are increasingly and critically dependent on IT to enable their capability and customer value. Our plan also recognises the resourcing challenge, where a diminishing skill pool of qualified IT and digital engineers and programmers is becoming increasingly expensive to attract and retain.
Our proposals are supported by a suite of Investment Decision Packs (IDPs), Engineering Justification Papers (EJPs) and associated cost benefit analyses (CBAs).
Our strategy is explained further in Section 6 of this chapter.
Our strategy and investment will deliver value for money in delivering against our plan’s strategic outcomes:
Personalising customer propositions Driving Efficiency
• Connection+
• Open Door
• Tailored Insights
• Digital Workplace
• Capital Investment
Enabling Flexibility
• Advanced Distribution Management System
• Connectivity++
• DSO Management
• Commercial Optimisation
Taking care of our assets
• Digital Comms
• Linear Assets
• Master Data Management, Data Lake & Analytics
Providing a valued and trusted service
for our customers and communities
Delivering a safe, resilient and responsive
network for all our customers
Accelerat-ing progress towards a net
zero world
Making a posi-tive and lasting impact on our society
1 Digitalisation Investment Plan (Annex 5.1) – Description and justification of our RIIO-ED2 IT, OT and Digital investments. 2 Annex 5.2 – Digital Strategy – our customer-centric strategy view of digital services and data Digital Action Plan – our short-term actions and progress of projects we are going to achieve our Digital Strategy. 3 An analysis of electricity flexibility for Great Britain, Carbon Trust/Imperial College London 2016. The EDTF estimated £2bn cost savings by 2030. 4 Comparison is to the last five years of RIIO-ED1. 2020/21 prices.

58 | Section B: Chapter Five: IT and Digitalisation
ENHANCED ENGAGEMENT OVERVIEW
Section 2 of our Digitalisation Strategy explains the methodologies we employed to identify and engage with stakeholders to understand their data and digitalisation needs, such as developing customer personas. Our comprehensive engagement approach has ensured our Digital Strategy has met the minimum requirement under Stage 1 of the Business Plan Incentive.4
Our Digitalisation Strategy and IT/OT investments have been shaped by the extensive enhanced engagement we carried out across key areas of our plan.
1
4 Ofgem Business Plan Guidance, paras 4.5 & 4.6, February 2021.
Enhanced engagement overview
Based on engagement with 1,836 stakeholders across 14 events on the Digital Investment Plan, they identified their top priorities for RIIO-ED2:
TOP STAKEHOLDER PRIORITIES
Data privacy is of extreme importance. Data should be safe and secure
Data sharing, including navigating data privacy barriers, could unlock more efficient services and partnerships
Utilising digital technologies will help in the transition to DSO and net zero
HOW WE RESPONDED TO FEEDBACK
Use of data: Stakeholders had concerns about data privacy concerning data-sharing, so we have increased our focus on creating a specific investment programme that ensures we have robust data governance and principles to manage all types of data.
Open data and digital services: Some stakeholders wanted personalised services rather than just access to data and so we adapted our strategy to provide two separate services to respond to the differing technical understanding and needs of our stakeholders.
‘Generation Landline’: Some stakeholders prefer to contact us by phone so as to avoid digital exclusion. We developed a Customer Omnichannel Platform capability to allow a seamless transition between interaction channels in the customer contact centre rather than separate channel ‘silos’.
KEY STAKEHOLDER INSIGHTS
Open discovery
• While stakeholders were concerned about data privacy and security, it was also seen as a potential blocker for increased collaboration between organisations. SSEN should be at the forefront of overcoming these barriers
• It was suggested that innovative digital technology and data sharing could improve the identification of customers in vulnerable situations and improve customer service
Co-creation
• The Digitalisation strategy workshop brought several key insights including the need for collaboration to improve digital initiatives, to share best practices across the industry
• Stakeholders also wanted to see SSEN’s data-sharing capabilities improve, especially around the ease of use and personalisation of data for different applications
Business Plan refinement
• Data sharing and communication through digital technology and apps were noted as important for improved customer service as well as applications in reliability
• Not all stakeholders and customers will be comfortable with digital technology or communication and this needs to be considered in the strategy
• SSEN should be a data-led organisation and maximising the amount of asset-monitoring data available will ensure that the monetised-risk strategy is a success
Testing and acceptance
• Stakeholders wanted to see the use of data and cutting -edge digital tools to improve asset and infrastructure visibility and ultimately help SSEN in the transition to DSO and net zero
• Utilising digital technology around enhanced power cut information was also suggested
• 33% of stakeholders thought the existing products and services were the right ones to deliver benefits to them
to August 2020
Aug 20 – Feb 21
Feb 21 – Jun 21
Jun 21 – Dec 21

59 | Section B: Chapter Five: IT and Digitalisation
OUTPUTS AND AIMS
Our IT and OT investment will be central to the delivery of outputs across all areas of our plan. The table below focuses specifically on those outputs that are directly linked to data and digitalisation.
2
LO: Licence Obligation; PCD: Price Control Deliverable; ODI: Output Delivery Incentive (F: Financial, R: Reputational), CVP: Consumer Value Proposition; SSEN Aim: Company Goal
INFORMATION TECHNOLOGY (IT)
Our vision for IT is to enable the business to realise its strategic outcomes by delivering secure information, insight and automation where and when required. The strategy is built around three key themes: Strengthening the Core, Creating Value and Ways of Working. Our alignment with the SSE Group approach has facilitated access to well-developed central infrastructure such as the Data Analytics Platform and access to the Data Governance Centre of Excellence to support our digitalisation journey.
OPERATIONAL TECHNOLOGY (OT)
OT consists of the control, telecommunication and monitoring systems that we use to operate and manage our primary assets. OT facilitates data collection, automatic operation from protection or software and manual action from an operator. It includes all software and hardware between screens and keyboards of engineers to the terminals of the switch or device on the Low Voltage (LV), High Voltage (HV) or Extra-High Voltage (EHV) network. We manage the resilience, reliability and security of our OT to ensure availability of our assets.
STRENGTHENING THE CORE
• Addressing obsolescence risks
• Security capabilities and architecture
• Infrastructure and Platform as a Service
• IT Automation and Self Service
CREATING VALUE
• Data and Analytics
• Advancing Data Science
• Enable Digital platforms
• Automation and Optimisation
• Transformation
WAYS OF WORKING
• Simple and effective governance
• Flexible delivery models
• Agility and tooling
• ‘Right size/cost’ approaches
Figure 5.2: Our IT Strategy 3 key themes
Output Type Target Consumer benefit
DIGITALISATION
Data Best Practice Guidance
LO
• Continue to meet our obligations and align with best practice
• In meeting these obligations, enable digitalisation across our plan
• Use data in a way that meets the expectations and intent of the Data Best Practice Guidance
• Publish and regularly review our Digitalisation Strategy and Action Plan
• Communities empowered to participate in flexibility markets, benefiting from the energy system transition
• Digitalisation and IT/OT investments are a key enabler for many of the outputs across the plans we have co-created with our customers and stakeholders
• A direct benefit of £175mDigitalisation Strategy and Action Plan
LO

60 | Section B: Chapter Five: IT and Digitalisation
OUR TRACK RECORD
RIIO-ED1 has been a period of significant transformation for our business. The initial investments we’ve made in IT have delivered the backbone of our digital infrastructure, enabling new customer-focused products and progress towards modernising energy data.
We have invested in our Distribution System Operator (DSO) functionality, cyber security and connections, primarily to deliver rapid deployment of key systems required for our net zero journey and have published our initial Digitalisation Strategy and Action Plan (DSAP) in December 2019. We update our Action Plan every six months and the last Strategy was published June 2021. Current and historical updates are available at ssen.co.uk/DigitalStrategy/.
Customer benefits have included more tailored frontline services and improvements in network reliability, enhanced digital capabilities that enable real-time network management, and a new Customer Relationship Management system for improved customer experience.
By the end of RIIO-ED1 we expect to have invested £174.6m in our IT transformation, against an original allowance of £103.1m. Successful delivery of this programme has provided a solid base for RIIO-ED2.
The specific additional investments focused on four key areas:
1) Improve customer experience, such as new apps and addressing open data needs
2) Overhaul aspects of our asset management, such as better mastery of our assets, initiating our end-to-end connectivity capabilities
3) Respond to regulatory changes, for example from competition in connection, faster switching, GDPR and cyber security
4) Improve the integration of our core systems by starting the integration of the Common Information Model into our system architecture
3
3.1 Delivering benefits through IT investment
Our investment in RIIO-ED1 will deliver significant customer benefits in the longer term. We have invested in a number of our key systems including our Outage Management System (OMS), Customer Relationship Management (CRM), website, Geographic Information (GIS), and Active Network Management (ANM) Centralisation.
For a collective investment in these initiatives of £50m, we estimate cashable benefits of over £16m in RIIO-ED1 (incorporated into our unit rates for the start of RIIO-ED2) and over £50m in RIIO-ED2, which have been baked into our totex ask through reduced CAIs.
Cost £m Cashable Benefits
Projects At Go Live RIIO-ED1 RIIO-ED2
OMS £14.8m £1.5m £12.1m
CRM £14.9m £0.5m £14.0m
Website refresh £1.0m £1.1m £5.7m
GIS £17.6m £12.9m £18.0m
ANM Centralisation
£1.4m £0.9m £0.9m

61 | Section B: Chapter Five: IT and Digitalisation
3.2 Transition to RIIO-ED2
Ofgem’s Data Best Practice Guidance and the Energy Networks Association (ENA) cross-sector Digitalisation and Data Steering Group have helped facilitate a collaborative whole system approach to data and digitalisation that supports the delivery of the Energy Data Taskforce’s (EDTF) 5 recommendations. Our DSAP demonstrates how we either are or intend to comply with the 11 best practice principles in Ofgem’s draft Data Best Practice Guidance.
Data Best Practice Mapping Table
Data Best Practice Principle Key Investments
1. Identify the roles of stakeholders of Data Assets In RIIO-ED1 our work in Personas and customer journeys help inform this.
In RIIO-ED2, Master Data Management, Data Lake & Analytics and Tailored Insights help us take this even further, with anticipated go-live of Q2 2024 and Q2 2026 respectively.
2. Use common terms within Data Assets, Metadata and supporting information
In RIIO-ED1, our implementation of Informatica Axon gives us the core tooling. In RIIO-ED2 this is expanded and maintained through Master Data Management, Data Lake & Analytics while Tailored Insights supported the integration (with anticipated go live of Q2 2024 and Q2 2026 respectively) and coordination with other industry actors and the wider digital ecosystem.
3. Describe data accurately using industry standard Metadata
In RIIO-ED1, our implementation of Informatica Axon gives us the core tooling. In RIIO-ED2, this is expanded and maintained through Master Data Management, Data Lake & Analytics, with an expected go-live Q2 2024.
4. Enable potential Data Users to understand Data Assets by providing supporting information
In RIIO-ED1 this is largely done manually. In RIIO-ED2 this is automated and expanded through Tailored Insights with an expected go-live Q2 2026.
5. Make Data Assets discoverable for potential Data Users
In RIIO-ED1, we use our website and data portal from NeRDA along with various manually set-up APIs. In RIIO-ED2, we expand, automate and ensure complete coverage through Open Door for raw data and Tailored Insights for automated and personalised data, with anticipated go-live of Q1 2025 and Q2 2026 respectively.
6. Learn and deliver to the needs of current and prospective Data Users
In RIIO-ED1 this is carried out manually through stakeholder events. In RIIO-ED2, we will continue with stakeholder events; however the two-way functionality of Tailored Insights expands this to individual interactions of data, with an expected go-live Q2 2026.
7. Ensure data quality maintenance and improvement is prioritised by Data User needs
In RIIO-ED1, our implementation of Informatica Axon gives us the core tooling. In RIIO-ED2 this is expanded and maintained through Master Data Management, Data Lake & Analytics, with an expected go-live Q2 2024.
8. Ensure Data Assets are interoperable with Data Assets from other data and digital services
In RIIO-ED1, our implementation of Informatica Axon gives us the core tooling along with collaborations with the Digitalisation and Data Steering Group and Open Energy. In RIIO-ED2, collaborations at set to continue but the Master Data Management, Data Lake & Analytics (go-live Q2 2024) improving our core tooling and key projects for building our data models like Advanced Distribution Management System (Go-live Q2 2025) and Connectivity++ (go-live Q1 2025), interoperability will be built in.
9. Protect Data Assets and systems in accordance with Security, Privacy and Resilience best practice
In RIIO-ED1, our implementation of Informatica Axon gives us the core tooling and the implementation of our Open Data Triage process embeds this within our organisation. In RIIO-ED2 this is expanded and maintained through Master Data Management, Data Lake & Analytics, with an expected go live Q2 2024.
10. Store, archive and provide access to Data Assets in ways that ensure sustained benefits
In RIIO-ED1, implementation of Informatica Axon gives us the core tooling and our collaborations and partnerships with third parties are driving this forward. In RIIO-ED2 this is taken further through Open Door and Tailored Insights and is supported by the continuation of two-way engagement with our stakeholders, with anticipated go live of Q1 2025 and Q2 2026 respectively.
11. Treat all Data Assets, their associated Metadata and software scripts used to process Data Assets as Presumed Open
In RIIO-ED1, implementation of Informatica Axon gives us the core tooling and Open Data Triage process and culture change initiatives have been embedded open and shared data within SSEN. In RIIO-ED2 this is taken further through Open Door and Tailored Insights and is supported by the extended functionality and culture changes implemented within Master Data Management, Data Lake & Analytics with anticipated go live of Q1 2025, Q2 2026 and Q2 2024 respectively.
Figure 5.3: Mapping of Best Practice Guidelines
REVISING OUR SELF-SERVE PROPOSAL FOR MINOR CONNECTIONS PROJECTS
We currently provide customers with an initial high-level budget estimate for minor connections projects, followed by a fully costed firm quote that the customer can accept. Creating the estimate and quote is a time-consuming process as it is done manually.
In order to scale up the process to meet increasing demand, we had initially planned to automate both elements. Calculating the stage one estimate is relatively straightforward and could quickly automate part of the process.
However, engagement revealed that the budget estimates are of little value to stakeholders, who told us that their priority is to get the firm quote as soon as possible. As a result, we changed our plan, and have now committed to automating the full quotation process for minor connections, removing the interim budget estimate stage and allowing customers to self-serve the part of the process of most value to them.

62 | Section B: Chapter Five: IT and Digitalisation
OUR DIGITALISATION STRATEGY
Our aim is to be at the forefront of the future energy system transformation, driving efficiency in our operations, improving asset health and providing customer services which have real value. Our digital transformation will achieve this, supporting the delivery of DSO functions and the transition to net zero.
Our strategy and investment will make a positive impact on society and deliver against our Plan’s three strategic outcomes:
Net zero will be supported by Advanced Distribution Management System+ (ADMS+) and Connectivity++ to further improve our understanding of our network, especially at LV level. A suite of projects will enable flexibility, including DSO Management and Commercial Optimisation. Other OT projects will enhance our Network Visibility, improving our management of our network and enable capture of detailed information from our network.
We will deliver a trusted and valued service, through digital customer propositions such as automated and slicker connections in Connections+. Open Door and Tailored Insights will underpin our ‘open-by-default’ approach, providing far better insight and a personalised experience.
We will maintain a safe, resilient and responsive network with investment in Digital Communications and Linear Assets that will enable us to take better care of our assets, supported by better Master Data Management (MDM) and using a centralised Data Lake & Analytics.
We will have a positive impact on society by driving improved efficiency across all our activities, and investments in Digital
Workplace and Capital Investment to improve how our entire workforce make decisions.
The activities and deliverables are listed under each strategic outcome at Figure 5.3 above.
Digitalisation of the energy system will provide opportunities to create value beyond our sector. Through collaboration with government and other parties, we are improving our understanding of how it can help contribute real societal and economic benefits. For example, there is considerable potential for policy makers, academia and innovators to use energy data to improve society. Stakeholders also pointed to the wider societal benefits of digitalisation, using the examples of reduced transport and carbon emissions, more streamlined workloads, and better health and safety.5
INVESTING FOR A DIGITAL FUTURE: OUR DIGITAL INVESTMENT PLAN
Our Digital Investment Plan proposes £264.1m across 28 IT, OT and Telecoms projects that will transform how we operate and significantly improve our digital maturity. These capabilities will provide a whole life benefit of £245.4m and facilitate far greater societal benefits by 2050. Our key IT investments will drive benefits across all of our strategic outcomes, by embedding efficiency, improving resilience and delivering personalised customer propositions.
We have carefully considered the dependencies for the IT and OT activities and how the individual investments support other parts of our Business Plan. The table below outlines the digital programme interdependencies, but in summary:
• Advanced Distribution Management System, Connectivity++ and Master Data Management, Data Lake & Analytics are Key Enabler Projects and underpin a significant number of the other investments by providing the core capabilities and data that are necessary to deliver the other projects.
• All of the DSO-related investments (DSO ANM, DSO Enablement, DSO Management, Flexibility Contracting, Power System Analysis, Commercial Optimisation and Investment Optimisation, but equally LCT Analytics) are all highly interdependent. They provide the full capabilities required to deliver DSO, so delays would significantly hamper our ability to provide an appropriate service to our customers.
• Smart Meters+ and Marketwide Half Hourly Settlements are critical to a number for other projects spanning customer service, climate adaptability, safety and Whole System
• Both Open Door and Tailored Insights are required to effectively address our open data requirements and ambitions
4
5
Publishing our DSAP is a new licence obligation in RIIO-ED2. We will keep the Action Plan under continuous review as a dynamic log of our digital activities. We will run an annual action plan checkpoint to confirm our direction of travel and integrate any stakeholder-driven changes to the plan. We will update our Action Plan on a six-monthly basis, providing the latest information on our deliverables and timing. This relatively short cadence also allows us to reflect new developments in a fast-moving area of our industry. Our Digitalisation Strategy, which outlines our longer-term goals and strategic direction, will be updated every two years in accordance with the requirements of the proposed licence condition. Our Digitalisation Strategy is in line with Ofgem’s minimum requirements as set out in Digitalisation Strategy and Action Plan (DSAP) (Annex 5.2).
5 See our Digitalisation Investment Plan (Annex 5.1).

Project Cu
sto
me
r
Dig
ital
Saf
ety
Saf
e &
re
sili
en
t
Re
liab
le
Cli
mat
e
Cyb
er
Re
mo
te
Co
mm
un
itie
s
Lo
ad &
C
on
ne
ctio
ns
DS
O
Wh
ole
Sys
En
viro
nm
en
t
Inn
ova
tio
n
Connections+ Y Y Y Y Y Y Y
Customer Omnichannel Platform Y Y Y Y
Open Door Y Y Y Y Y Y Y
Outage Notifications Y Y Y Y Y Y Y
Tailored Insights Y Y Y Y Y Y Y
Advanced Distribution Management System
Y Y Y Y Y Y Y Y Y Y Y Y Y
Connectivity++ Y Y Y Y Y Y Y Y Y Y Y
EnviroTrack Y Y Y Y
DSO ANM Y Y Y Y Y Y
DSO Enablement (Orchestrator) Y Y Y Y Y Y
DSO Management (Optimiser) Y Y Y Y Y Y
Flexibility Contracting Y Y Y Y Y Y
LCT Analytics Y Y Y Y Y Y
Power System Analysis Y Y Y Y Y Y
Commercial Optimisation Y Y Y Y Y Y
Smart Meters+ Y Y Y Y Y Y Y Y
Marketwide Half Hourly Settlements Y Y Y Y Y
Digital Workplace Y Y Y
Work Management 2 Y Y Y Y Y Y Y Y Y
Capital Investment Y Y Y
Digital Comms Y Y Y Y Y Y Y Y Y
Investment Optimisation Y Y Y Y Y Y Y Y
Linear Assets Y Y Y Y Y Y Y Y Y Y
Master Data Management, Data Lake & Analytics
Y Y Y Y Y Y Y Y Y Y Y Y Y
63 | Section B: Chapter Five: IT and Digitalisation
Figure 5.4: Interdependencies between our IT and Digital investments and activities in our plan
Our IT and OT investment will be a key enabler in driving efficiency in RIIO-ED2 and ensure we remain aligned with and focused on sharing data for stakeholders’ needs. Our proposal also ensures we are able to meet Ofgem’s Modernising Energy Data Best Practice requirements.
We have applied the most appropriate technology, making use of tried and tested tools successfully deployed by similar organisations, alongside using the latest technology where that is beneficial. However, IT is a rapidly developing area, so we will continue to review our plans throughout RIIO-ED2, and update these where new technology provides better solutions. To validate our approach and estimating, Gartner, who are world leaders in benchmarking IT solutions, audited our draft submission. They found our approach and solutions were in line with other electricity network companies worldwide, and our estimated costs were at a median value for such projects.
We expect the majority of RIIO-ED2 IT projects to use Agile or other iterative methodologies. This will maximise the opportunities to adapt to the latest needs, change the focus where necessary to deliver maximum value and reduce risk. We are also exploring new approaches, such as the concept of “Data Partnerships” closing the loop and applying digital principles to the way we deliver digital services. We discuss the new skills needed to deliver our Digital Investment Plan and how we intend to attract and develop the right people in Ensuring Deliverability and a Resilient Workforce (Chapter 16) and Workforce Resilience Strategy (Annex 16.3).

64 | Section B: Chapter Five: IT and Digitalisation
5.1 IT investments enabling customer value throughout our plan
The table below lists the four delivery workstreams identified in Figure 5.4 above and the total costs broken down by CV category and benefit value. This is followed by a description of the benefits achieved through the proposed investment under each workstream and the list of activities driving the benefits. Figure 5.5 below illustrates how these investments are critical to enabling projects and activities throughout our Business Plan.
Positive Impact on Society
Increasing the efficiency of our workforce making use of the most up-to-date technologies available to us whilst also ensuring that employee information, materials and logistical elements are centrally held to improve decision making. This ensures that we can more easily service our customers and make time-saving decisions in the field. It also enables the right equipment and work to be optimised, saving time, disputation and money for consumers.
5.2 Digital investment delivery workstreams
Valued and Trusted Service for our Customers and Communities
Improving how we interact with customers, where they have requested improvements or new facilities, include unified communication using their preferred methodology, self-service connection quoting, Open Data, and information tailored to their specific needs. These refreshed capabilities help us interact with our customers in a seamless way through a wide array of methods. They serve up more automated and rapid options along with much-improved personalisation for customers, while making it more efficient for us to cope with the substantial uplift in customer interactions predicted in RIIO-ED2.
Figure 5.5: Digital Investment Plan, Summary by Workstream The Benefit and NPV totals take into account both capex and opex
Where IT/OT and Digitalisation is enabling outputs and activity across our Plan Chapter reference
Digital Workplace Ch 6 and Ch 16
Work Management 2 Ch 7
Capital Investments Ch 16
Where IT/OT and Digitalisation is enabling outputs and activity across our Plan Chapter reference
Connections + Ch 4 and Ch 10
Customer Omnichannel Platform Ch 4
Open Door Ch 5
Outage Notifications Ch 4 and Ch 7
Tailored Insights Ch 4
Delivery Workstream (£m)
BPDT
Total
Whole-life
Benefit Post
go-live5 Year
NPV45 Year
NPVC4 CV11 CV7b CV12
Positive Impact on Society - - - - - - - -
Valued and Trusted Service for our Customers and Communities - - - - - - - -
Safe, Resilient and Responsive Network for our Customers and Communities
- - - - - - - -
Progress to Net Zero - - - - - - - -
RIIO-ED2 OT Telecoms and Scada (10-year benefit) - - - - - - - -
SUBTOTAL - - - - - - - -
Cyber Security on existing Applications - - - - - - - -
TOTAL 137.7 114.6 6.2 5.6 264.1 245.4 -51.7 -149.3

65 | Section B: Chapter Five: IT and Digitalisation
Safe, Resilient and Responsive Network for our Customers and Communities
Foundational improvements to our information assets, and a base warehouse for Open Data and analytics. Improves projects using Business Information Modelling and provides the tools to value investments, balancing flexibility and reinforcement. It also ensures our offices are equipped with suitable communications for our digital future. These improvements digitalise our key decision-making capabilities so we can make more enlightened choices when planning and caring for our assets.
Progress to Net Zero
Deliver the DSO function and enable the Flexibility Market. Foundational tools include major updates to our Advanced Distribution Management System, customer-centric connectivity model, and to manage our environmental drivers. DSO projects include packages to facilitate the market, tools to forecast, manage load risk and coordinate the market, systems to manage contracts and payments, extensions to ANM and systems to provide insights on the market to stakeholders. These projects help to facilitate and grow flexibility markets and cope with the transformational changes of achieving net zero.
Full details of our investment proposals are provided in Digital Investment Plan (Annex 5.1).
Where IT/OT and Digitalisation is enabling outputs and activity across our Plan Chapter reference
Digital Comms Ch 7
Investment Optimisation Ch 7, 10 and 11
Linear Assets Ch 6 and 7
Master Data Management, Data Lake & Analytics
Ch 5
Personnel Voice Communications Ch 5 and 7
Substation SCADA Ch 5 and 7
Where IT/OT and Digitalisation is enabling outputs and activity across our Plan Chapter reference
Advanced Distribution Management System
Ch 6, 7, 10 and 11
Connectivity ++ Ch 6, 7, 10 and 11
EnviroTrack Ch 13
DSO ANM CH 11
DSO Enablement (Orchestrator) Ch 11
DSO Management (Optimiser) Ch 11
Flexibility Contracting Ch 11
LCT Analytics Ch 10 and 11
Power System Analysis Ch 11
Commercial Optimisation Ch 11
Smart Meters + Ch 10 and 11
Marketwide Half-Hourly Settlements
Ch 5
LV System Monitoring Ch 5, 10 and 11
OTN Rollout Ch 5, 10 and 11

66 | Section B: Chapter Five: IT and Digitalisation
DELIVERABILITY AND EFFICIENCY Delivering Efficiencies and Value to Consumers
We will continue to roll out digital innovations developed in RIIO-ED1 (such as our mobile device and its underlying service deployment) which supports our workforce to deliver our services in the most efficient way possible. We have avoided costs of over £64.3m to deliver the RIIO-ED2 outputs and services our customers and stakeholders have asked for, as a result of avoided headcount increases that would be required if our planned IT and digital capabilities are not delivered.
Our RIIO-ED2 IT and OT investments are however, largely driven by external factors, such as the changes required to deliver net zero (e.g. a massive increase of Low-Carbon Technology connections, enabling the flexibility market). The investments are therefore targeted to manage these changes in the most efficient way. Our historic and planned IT investments (such as Connectivity+ in RIIO-ED1 followed by Connectivity++ in RIIO-ED2) also support our ambitions to deliver value to consumers by intimately understanding the relationship of the network to them and their connected equipment and therefore they are able to derive far more granular insight and meaningful action.
Our whole systems strategy sets out how we will work with a broad range of stakeholders to deliver cross-sector solutions (to be underpinned by Tailored Insights) to deliver the best value to consumers. We are also transforming our commercial and supply chain strategy to meet the step-change in performance required to deliver RIIO-ED2. Through using investments including Commercial Optimisation, we are more effectively managing our procured equipment while selecting the optimal solutions. Collectively, these investments and strategic changes will allow support our delivery of ongoing efficiencies throughout RIIO-ED2 (our stretch target of 0.7% per annum, as set out in Costs and Efficiency (Chapter 15).
Deliverability of our plan
Our RIIO-ED2 Digital Investment Plan provides the platform for digital transformation, enabling an integrated approach to our Customer Operations and Asset Management functions by investing in best practice tools and systems providing us the ability to collaborate with our partners and efficiently deliver the increased work volumes required. We also detail investments critical to developing new capabilities and improving our existing IT systems to move to a fully digitised business – see Digital Strategy and Action Plan (Annex 5.2) for the betterment of our commercial and domestic customers. Without such investments we risk our deliverability and lessening customer experience.
Significant increases of LCTs leading to a predicted need of flexibility increase by a factor three to five times compared to the end of RIIO-ED1. Our Ensuring Deliverability and a Resilient Workforce (Chapter 16) describes our approach to evidencing the deliverability of our overall plan both as a package and its individual components, to ensure that we can demonstrate a credible plan to move from our performance in RIIO-ED1 to our target RIIO-ED2 scale of delivery and efficiency. We are working with our supply chain to test and refine our ongoing contracting strategy to deliver RIIO-ED2 most efficiently and to ensure both our internal and contractor workforce have the skills and scale to deliver our plan as detailed further in our Supply Chain Strategy (Annex 16.2) and Workforce Resilience Strategy (Annex 16.3). This is further supported through innovative commercial arrangements such as Data Partnerships to enable quicker and more agile deployments of digital capabilities in a cost-effective and mutually beneficial way.
All our supporting description of our investments which underpin our digital plan have explicitly considered deliverability in their assessment of the options and preferred solutions to specific elements of our draft investment plan. Through our commercial strategy, we have also identified opportunities to optimise and streamline our delivery approach across different investment drivers and the requirements of our workforce and supply chain, as well as reducing disruption for consumers. In particular several of our digital deployments facilitate more efficient deployments and optionality to other parts of our plan.
6

67 | Section C: A Safe, Resilient and Responsive Network
SECTION C: A SAFE, RESILIENT AND RESPONSIVE NETWORK
Core challenges for RIIO-ED2The highest levels of safety, resilience and reliability are the constant expectations of our customers. We’re not going to let them down: We will address the real challenges that reflect environmental, social and technological change in the years ahead.
Address customers with poorest reliability: Some of our customers experience levels of reliability that are worse than average. We have over 17,000 customers recognised as ‘worst served’, often due to circuits in the system that are beyond their asset working lifespan.
Recognise unique needs of island communities: Local generation customers want to shift away from fossil fuel to low carbon sources, and communities want improved reliability of supply
Manage the growing resilience risk from climate and cyber: Our changing climate impacts many environmental and social factors. The cyber threat is ever evolving. In both cases, failing to keep up with changes puts supply at risk.
Strike the right balance between costs today and tomorrow: We will use new technology to help us target our activities more efficiently, only investing where longer-term benefit and savings are clear.
EXECUTIVE COMMITMENT TO OUR PLAN
“Our plan will deliver a safer, more resilient network, providing a solid foundation for net zero and greater reliability for customers. It will level-up service and reliability by dramatically improving performance for 75% of our worst served customers. We have taken a holistic approach, managing the risks associated with climate change and external threats, and are confident our proposals meet the needs of the changing energy system and evolving customer expectations.”
CHRIS BRATT Director of Asset Management
WHAT STAKEHOLDERS WANT DELIVERING IMPROVED OUTCOMES FOR ALL
• Customers want a safe network, resilient to threats and ready for net zero
• Reliability is more important than ever as work/life patterns change in response to Covid-19, and heat and transport become electrified. But customers and communities have mixed views – it shouldn’t come at any cost
• We should invest now to replace assets and avoid loading costs onto future consumers, prioritising assets with high likelihood of failure
• Network reliability is vital for our remote islands communities: stakeholders urged prioritisation of subsea cable replacement and want a low carbon whole system solution to ensure reliability in our transition to net zero
• We will reduce the average duration of unplanned power cuts by 20%, for example through automation to over 620 circuits, also lowering long-term costs
• Over 250,000 fewer customers experiencing a power cut in RIIO-ED2
• We will reduce customers classified as ‘worst served’ by 75%, focusing our investments where it will have the highest impact, and using consumer vulnerability as a criteria for prioritisation
• Our core asset heath and reliability investments of £683.7m will improve strategic resilience
• Target investment of £329m to reduce faults and improve reliability for island communities, including on 18 subsea cables and all seven island-based power stations
• Keep the public safe, deploying new technology to better target key activities such as tree-cutting and overhead line clearances
• Build on our extensive RIIO-ED1 safety engagement programme, reaching 50,000 partners and members of our communities by 2028
A robust, resilient and reliable network is the bedrock of our plan to deliver the necessary improvements for net zero, in particular in the context of climate change and increased reliance on electricity.
We are realising customer benefits by prioritising investment to create the network our customers need today and, in the future, meeting compliance and legislative requirements and improving network and public safety.
Our two licence areas are dramatically different; climate, population density, infrastructure and the natural environment all factor in how we maintain service for customers. Our plan works as hard for some of the UK’s most remote communities as it does for customers living in the more populated south.
Planned investment 2023-28
Chapters in this section Capex (£m)
Chapter 6: Safety and Compliance £408.2m
Chapter 7: Maintaining a Resilient Network £1,174.6m
Chapter 8: Supporting the Scottish Islands £329.2m
Totex £2,212m*
DELIVERING OUR GOALSWe have clearly demonstrated where our proposals are a result of meeting expected standards, including regulatory and legislative requirement, and where we have sought to respond to the needs of our customers and stakeholders by delivering on shared ambition or going above and beyond expectations.
• Create a net zero foundation by investing £1bn in strategic resilience
• Invest £296.2m in keeping the public safe, in line with our obligations
*Chapters only show direct investment required to deliver key deliverables and outputs, not CVPs.

68 | Section C: Chapter Six: Safety and Compliance
CHAPTER SIX: SAFETY AND COMPLIANCE
Safety is part of our DNA – if it’s not safe, we don’t do it. Safety is a key driver of investment and it is vital we maintain compliance with our safety obligations to protect the public, our colleagues and
partners from the risks posed by electricity. We will continue to deliver the safe and resilient network that meets our customers’ needs and that supports the greater electrification of heat and transport and the delivery of low-carbon electricity to power homes and businesses to net zero.
The activities in this chapter are broadly split into three categories. Firstly, some of our investments are driven by safety regulations and the need to keep our colleagues, partners and the wider public safe. These include tree cutting and overhead line clearances. Secondly, we also need to comply with other legal requirements, in particular in relation to land access agreements (referred to here as wayleaves and landrights). Because these activities are based on existing formal obligations, we have not proposed additional outputs. Finally, our Plan will continue to build on our excellent safety record and our successful programme of safety engagement, working with our local communities to keep them safe. We have identified two outputs in this space.
SUPPORTING DOCUMENTS
Safe and Resilient Network (Annex 7.1)
1 Comparison in this table and other tables in this chapter is to the last five years of RIIO-ED1. 2020/21 prices.
Total investment in this chapter Comparison to RIIO-ED11 Business Plan Data Tables
£296.2m to meet our safety obligations (£210.9m SEPD, £85.2m SHEPD)
£164.8m to meet our safety obligations (£117.4m SEPD, £47.4m SHEPD)
CV14, CV17, CV18, CV29, CV32
£112.0m for wayleaves and landrights, and diversions (£96.7m SEPD, £15.3m SHEPD)
£88.7m for wayleaves and landrights (£75.7m SEPD, £13.0m SHEPD)
CV5, CV6
Our focus is primarily on managing and mitigating the safety risk to members of the public, our contract partners and our colleagues when they are in proximity to our network. We have used the latest information and carried out risk assessments to determine the activities required to achieve this goal, ensuring efficiency and deliverability, but without compromise to safety integrity.
In RIIO-ED2 we will be making greater use of new technology and data, which will enable us to better target safety-related activities, such as tree cutting and overhead line clearances, and coordinate our activities to touch the network efficiently. Our choice of intervention is in each case carefully assessed, with a focus on selecting options that will deliver the greatest long-term value at an efficient cost.
SAFETY AS A DRIVER OF INVESTMENT
Safety is a key driver of investment for us and a cornerstone of ensuring our network is safe and resilient today and in the future. We must comply with Health and Safety Executive (HSE) requirements such as the Electricity Safety, Quality and Continuity Regulations (ESQCR), which cover a number of areas, including:
1) Tree cutting: Tree and vegetation growth represent a real risk to the safety and reliability of our network and must be managed effectively. This is necessary to ensure that our overhead line network remains compliant with statutory safety clearance requirements
2) Overhead line clearances (OHL): we make sure the distance from our overhead lines to the ground and nearby buildings meets statutory guidelines, ensuring that we are maintaining the required level of public safety
3) Risks prioritised by the HSE: such as particular occurrences of Rising Lateral Mains (RLMs – the electrical assets in multi-occupancy buildings such as flats or office blocks) and link boxes (low voltage underground assets installed under pavements and roads)
As the main driver of investment is safety, these mandatory activities do not lend themselves to traditional benefits quantification, through Cost Benefit Analysis (CBAs) for example. The main unquantified benefit is a clear reduction in particular known safety risks.
There are also other legal requirements we must comply with as a DNO. Wayleaves are the payments we make to landowners for allowing us to use their land to host our assets under the Electricity Act 1989, typically overhead lines. In some cases, we will also incur costs for removing or diverting these assets where landowners no longer wish to host them. Wayleaves and diversions continue to be a growing challenge across our industry.

69 | Section C: Chapter Six: Safety and Compliance
ENHANCED ENGAGEMENT OVERVIEW
We engaged with 2,684 stakeholders across 15 events on Safety and Compliance, and they identified the following RIIO-ED2 priorities:
1
HOW WE RESPONDED TO FEEDBACK
Prioritising network assets: Stakeholders across both of our regions strongly supported our proposed strategy of targeting assets with the highest probability of failure first to avoid catastrophic failures and improve safety.
Undergrounding lines: Some stated that undergrounding overhead lines could mitigate the safety risks with asset failures. To limit the high expense of undergrounding on customer bills, we will only do this where economically viable driven by visual amenity and stakeholder support.
Engagement on asset safety: It was noted that some wanted further engagement on safety from us. All stakeholder segments believed our proposed output addressing this was acceptable and affordable. (Acceptability – 74%)
Removing redundant assets: Stakeholders had a range of ambition expectations on removing redundant assets from unoccupied sites. All redundant assets are made secure against public access, and given the nature of our assets, we consider 3 months to be a pragmatic solution for removal. (Acceptability – 80%)
TOP STAKEHOLDER PRIORITIES
KEY STAKEHOLDER INSIGHTS
Ensuring the safety of the public, our partners and our staff should be our utmost priority
Engagement with key stakeholders around safety could be improved
Utilise cutting-edge technology, such as LiDAR, to improve the efficiency of tree-cutting operations
79% CONSUMER ACCEPTABILITY FOR A SAFE, RESILIENT AND RESPONSIVE NETWORK
Open discovery
• Stakeholders and customers were concerned about the safety of both the public and our staff, although not as important as maintaining a reliable supply
• A small proportion of customers wanted to receive safety advice on what to do in an accident and general safety around our assets, but interest was relatively low
Co-creation
• Employees felt that one of SSEN’s strengths was ensuring staff safety
• Some stakeholders felt that safety and resilience should be higher priorities, whilst others thought safety should be a guarantee of any network company
• 89% of those contacted by us during a power cut felt they received adequate information on staying safe, and 79% of those contacted by us during bad weather
Business Plan refinement
• Safety campaigns and awareness were discussed at length during Phase 3, including during a farm safety event. It was noted that a range of communication channels should be utilised as farmers of varying ages would consume the material from different sources
• Key stakeholders, including the emergency services and housing developers, felt that the threats to the electricity system coupled with a rise in society’s increasing dependency meant that the safety and security of assets is a primary concern
• The removal of equipment from unoccupied sites was also discussed at length with a variety of expected ambition levels
• The tree-felling workshop noted that transparency and communication needed to be improved around the application process, the timelines and financial implications of outages as well as utilising new technology such as LiDAR systems to improve safety
Testing and acceptance
• Most stakeholders felt the outputs in this area were sufficiently ambitious and comprehensive to provide good value for money to customers
• 83% of stakeholders deemed targeting assets of highest probability of failure first as a high or medium priority
• Meeting all safety-related legal requirements was a high priority for ~59% of stakeholders
• The engagement on safety output was deemed a high priority by ~40% of respondents
• Removing redundant equipment from unoccupied sites within 3 months was a high priority for ~48% of respondents
to August 2020
Aug 20 – Feb 21
Feb 21 – Jun 21
Jun 21 – Dec 21

70 | Section C: Chapter Six: Safety and Compliance
OUTPUTS AND AIMSMost activities in this chapter are driven by the need to ensure our network is safe. Because these activities are based on existing formal obligations, we have not proposed individual outputs. The total cost of safety-related investments is included under our ‘meet our safety obligations’ outputs.
2
Output Type Target Consumer benefitCosts in our baseline plan
Meet our safety obligations
LO Continue to meet all safety-related legal requirements
A safe and compliant network for our colleagues, partners and the wider public
£294m
Safety engagement SSEN Aim
Extend our engagement on safety around our assets, reaching 50,000 partners and members of our communities by 2028
Increased awareness and reduced accidents £1.2m
Keeping the public safe around our assets
SSEN Aim
Aim to remove redundant equipment from our unoccupied sites within 3 months to prevent risk to the public from the start of RIIO-ED2
Reduced accidents and increased network safety
£2.2m
LO: Licence Obligation; PCD: Price Control Deliverable; ODI: Output Delivery Incentive (F: Financial, R: Reputational), CVP: Consumer Value Proposition, SSEN Aim: Company Goal
Output Performance RAG
Safety Our Total Recordable Incident Rate (TRIR) has more than halved since the start of RIIO-ED1. In the remainder of this chapter, we set out our RIIO-ED1 spend position against each relevant activity.
TRACK RECORD
3.1 Outputs performance Overall, we have performed well on safety, and we are proud of our track record and the success of our activities with the wider public and our contractors in this space.
KEEPING OUR COMMUNITIES SAFE
3.2 Costs performance Our Track Record (Chapter 2) provides full details of performance against key RIIO-ED1 outputs and cost categories. In the remainder of this chapter, we provide detailed information on how our proposals for RIIO-ED2 compare to our RIIO-ED1 spend, and reasons for any step-changes.
We’ll continue to work with our local communities to deliver training and to drive safety awareness and a better understanding of the dangers of electricity. We’ll build on successful campaigns like our Look out, Look up! campaign, targeted at our agricultural communities. We aim to engage 50,000 stakeholders in key risk groups throughout RIIO-ED2.
3
4
Investment in our RIIO-ED2 plan Comparison to RIIO-ED1 Relevant CV tables
£1.2m for safety engagementNo dedicated funding in RIIO-ED1 funded as part of wider stakeholder engagement
C9
£2.2m for removal of redundant equipment £0.2m CV32

71 | Section C: Chapter Six: Safety and Compliance
Our £2.2m RIIO-ED2 investment for dismantlement targets redundant sites that pose a significant safety risk. Often equipment is left on abandoned industrial sites and substations where it is not always practical or efficient to check that the location remains secure. These sites run the risk of trespassing, vandalism and unauthorised interference. We carry out a risk assessment to determine the reason for disuse and the likelihood of return to service before proposing which sites are more effective to dismantle and remove. Our commitment is to remove redundant equipment from our unoccupied sites within three months, to prevent risk to the public.
Tree and vegetation growth represent a real risk to the safety of the electricity distribution network and must be managed effectively. We have over 60,000km of OHL network across both our regions, and unmanaged tree and vegetation growth can pose a serious safety risk to the public, our employees, and partners and cause significant damage to our network.
Our proposed investment will support cutting of approximately 465,000 spans of overhead line across all voltage levels over RIIO-ED2 and is based on a three-year cycle in SEPD and a four-year cycle in SHEPD. It also includes all cost associated with carrying out LiDAR surveys for both SEPD and SHEPD once every four years, to quickly and accurately determine exactly where trees impact our overhead lines to guide an efficient tree cutting delivery programme.
An effective tree cutting programme will contribute to wider benefits such as reliability improvements. Further details on our approach can be found in Maintaining a Resilient Network (Chapter 7). We also recognise that tree-cutting can have an environmental impact. Our Environmental Action Plan (Annex 13.1) sets out various initiatives to offset the environmental impact of our activities, including that associated with tree cutting.
Investment in our RIIO-ED2 plan Comparison to RIIO-ED1 Business Plan Data Tables
£189.6m (£140.3m SEPD and £49.4m SHEPD)
£136.2m (£40m SSEH and £96.2m SSES)
CV29
KEY SAFETY AND COMPLIANCE ACTIVITIES IN RIIO-ED2
5.1 Tree cutting
5
ENGAGING KEY STAKEHOLDERS ON SAFETY
Operating an electricity supply network in the public domain brings inherent risk due to lack of knowledge and understanding by those most likely to come into contact with it. We continue to engage with high-risk groups, focusing on schools, agriculture, construction and domestic environments. Our dedicated employee-led Powerpack Pals programme has been used to engage with over 44,000 7–11-year-old students, helping to educate on the dangers of electrical equipment and strengthen our bond with the local community.
Moving away from traditional communication methods was the request from stakeholder engagement carried out with farmers in our licence areas. A revised Look out, Look up campaign with shorter, clearer messaging was launched using Farmer Jim, a celebrity in the agricultural community. The revised campaign, supported by vehicle sticker and information packs, was one of our most successful with over 300,000 people reached.
We lent our support to the Scottish Association of Young Farmers (SAYF) and developed a partnership to help educate young people as they begin their careers in agriculture. Critical safety advice was delivered through social media channels which included Keeping safe on the farm and what to do if you strike an overhead line. Incident reporting data shows that these messages are being used by farmers to improve their knowledge and this is helping to reduce incidents involving electrical equipment. Our aim is to engage with new and used farm machinery suppliers to encourage the inclusion of electrical safety information with agricultural machines throughout their lifespan and we have engaged with suppliers of used machinery in our areas.
Our data identified an emerging risk for tradespeople and homeowners working within the domestic environment and being unaware of the presence of utility assets. A campaign Watch out, cables about, involved our engagement with these groups at garden centres and tool hire stations to provide guidance and advice on safe digging practices and highlighted a cable trace service to help avoid contact with underground cables. This supported a wider campaign through the Energy Networks Association.

72 | Section C: Chapter Six: Safety and Compliance
DEPLOYING LIDAR TO SUPPORT KEY ACTIVITIES
We are deploying an innovative solution from RIIO-ED1 into RIIO-ED2 Business as Usual (BAU). We have been using Light Detection and Ranging technology (LiDAR) to improve our understanding of our overhead line network, helping to more efficiently manage our assets and target activities such as tree cutting, reducing overall costs to customers. LiDAR is a high-definition network mapping tool from light aircraft used to assess the impact of vegetation and clearance of our assets to buildings and the ground. LiDAR provides more accurate clearance data and understanding of the affection rate per span (volumes of trees), shortening the inspection cycle and enabling us to focus our framework contracts on the delivery of the volumes required while monitoring delivery of spans cut. It provides an overall snapshot of our network in a single flight, avoiding the need to carry out manual inspections over several years to achieve the same outcome.
LiDAR is a key tool in particular in our SEPD region, where tree cutting costs are higher as a result of vegetation density and growth rates. We therefore flew LiDAR in SEPD 2020/21 as a priority and we are updating our SHEPD LiDAR data from 2017/18 now with the results being available in March/April 2022.
Our LiDAR assessment, independently verified by Airbus, has revealed in our southern region an emergent need for a very substantial programme of tree cutting to maintain public safety and improve the resilience and reliability of our assets.
We estimate that by using LiDAR data, we will be saving customers around £20m in manual inspections over RIIO-ED2 (including the costs of LiDAR surveys). Using LiDAR also enables us to more effectively manage our network, enabling us to better coordinate activities across different investment drivers, and to touch the network efficiently, while allowing a better prioritisation of any issues.
5.1.1 Tree cutting in SHEPD
The volumes of work proposed are based on a cycle of four-year tree cutting which considers the growth rate of vegetation across our SHEPD area and the mandatory safety requirements associated with the ESQCR. Northern Scotland is the most densely commercial afforested region in the UK. Analysis by the National Forest Inventory indicates that SHEPD has approximately 4,946km of 11kV and 1,791km of 33kV of overhead line network within falling distance of trees. These tree crops are harvested regularly, often in close proximity to the electricity network. The innovative live line harvester method has allowed tree cutting to be carried out without planned interruptions. We’ve also been using forestry mulchers, specialised machines designed to clear small trees and shrubs underneath overhead lines, instead of manual hand felling. Both technologies are in use in our northern network as they’re limited by site access restrictions and tackle very specific vegetation issues. Their use has saved customers over £7.5m to date in RIIO-ED1.
5.1.2 Tree cutting in SEPD
We face a number of challenges in our SEPD region. Rates of growth measured by USD2 can vary significantly from one DNO region to the next. An independent assessment undertaken by ADAS, the Agricultural Development and Advisory Service has confirmed our SEPD region exhibits one of the fastest rates of tree growth and highest levels of tree density in the UK, see Safe and Resilient (Annex 7.1). We also know that climate change is likely to exacerbate tree growth rates, and our climate resilience strategy identifies prolonged growing periods as one of 15 key risks, in particular in SEPD. For further details please see Maintaining a Resilient Network (Chapter 7) and our Climate Resilience Strategy (Annex 7.3).
The volumes of work proposed are based on a three-year cycle of tree cutting which considers the growth rate of vegetation across our SEPD area and the mandatory safety requirements associated with ESQCR. This compares to a four-year cycle in our SHEPD region. We are also looking to deploy other technologies such as insulated conductor solutions and tree guards (at LV level), removing the requirement to cut trees on a three-year cycle in SEPD.
Landowner cooperation is essential and our tree-cutting activities in particular in SEPD are impacted by the need to negotiate access rights with domestic landowners. In some cases, domestic landowners may also refuse to allow a full vegetation cut, meaning more frequent visits will be required. While it may be possible for us to take legal action, this is not usually our preferred route, and we also look to deploy alternative solutions where possible, for example through the use of shrouding, or by diverting lines.
Finally, we have included over £24m of efficiencies through reduced tree cutting unit rates, reflecting the fact that we introduced significant changes to our tree-cutting activities in 2017/18. Our focus has been on increased productivity and reducing overall unit rates through external tendering exercises, combined with focused internal work planning and delivery. Please see Costs and Efficiency (Chapter 15).
5.1.3 Ash dieback
Ash dieback is a chronic disease of ash trees that has spread across Europe and one of a number of specific challenges we face in our SEPD network in particular. The disease is affecting all areas of the UK and is now classed as an epidemic, with some predictions estimating that 94% of the UK’s ash trees could be lost. The ADAS independent report has confirmed that our SEPD region has the highest prevalence of Ash trees in the UK making SEPD particularly exposed to this risk.
During storms these diseased trees threaten both the safety and reliability of the overhead line network. It is unsafe to operate on trees in later stages of the disease, as their structural integrity becomes compromised, and requires the use of machinery. As a result, ash dieback requires a proactive management strategy and cutting affected trees is more expensive.
There is currently significant uncertainty around the scale of activities required to manage ash dieback on our network. Using the results of our LiDAR survey, we will identify spans of our overhead line network that are affected by trees within falling distance. We will build on this data by carrying out additional manual expectations, to better understand exactly where diseased affected trees are located and how advanced the disease is to determine the need for intervention. While we propose to fund the survey through our RIIO-ED2 business plan at a cost of £6.5m, we have included an uncertainty mechanism to account for the incremental costs associated with the management of diseased ash. This approach means that customers are protected from unnecessary costs. Please see Uncertainty Mechanisms (Chapter 17) for further details.
2 USD refers to utility space degradation, a measurement that assesses the impact of growth rates on the encroachment of overhead power lines by vegetation.

73 | Section C: Chapter Six: Safety and Compliance
We are required to ensure a safe level of clearance from ground and buildings across our overhead line network, in line with ESQC requirements. Through the deployment of LiDAR technology, we are deepening our understanding of our OHL network, especially at low voltage, and have identified a higher number of interventions required than previously thought. As noted in Track Record (Chapter 2), we overspent against our allowances in the first two years of RIIO-ED1. Having moved our focus to deploying LiDAR since then, work will be ramping up into RIIO-ED2.
We will take a risk-based approach, focusing on high and very high-risk sites and utilising our LiDAR data. This enables us to effectively prioritise activities where a substantial safety risk exists, and protect customer from unnecessarily high costs.
This approach is further detailed in our deliverability strategy, whereby we will continue to reprioritise our workbanks based on the latest data available and coordination across different investment drivers Deliverability Strategy (Annex 16.1).
Based on our approach, we will address over 13,000 Overhead Line low clearances in SHEPD and over 14,000 OHL low clearances in SEPD. We will use a variety of solutions to address OHL clearance issues, including re-tensioning and increasing pole height. Rather than taking a one-size-fits-all approach, we will choose the most cost-effective and enduring approach to mitigating risks depending on the circumstances.
RLMs are the electrical assets in multi-occupancy buildings (MOB). In response to the Grenfell tower block fire in London in 2017 there has been an increased focus on the safety of tower blocks to ensure that no buildings are at risk due to faulty or poor condition assets. The HSE and utilities companies are reviewing the arrangements for all utility services in these buildings.
We have recently completed a statistically significant sampling exercise of MOBs across SEPD and SHEPD, which has been used to develop our RLM strategic plan. We will continue to develop our modelling as more information becomes available. Our inspection programme for RLMs spans three regulatory periods, with a target conclusion date of 2038, and is designed to balance RLM risk reduction with efficient workflow management and deliverability,
also minimising costs to customers by prioritising activities required in each period.
Our approach in RIIO-ED2 focuses on high-risk buildings as a priority, including higher multi-storey buildings which house the most assets, and where our condition-based risk modelling indicated higher risks. We are targeting the inspection of over 79,000 buildings, equating to over a third of our RLM asset base.
We are proposing £29.3m to manage RLMs during the RIIO-ED2 period. This includes just over £21m for replacement works driven by safety, asset condition and compliance, as well as £8m for inspection and maintenance activities.
5.2 Overhead Line (OHL) clearances
5.3 Rising and lateral mains (RLM)
Investment in our RIIO-ED2 plan Comparison to RIIO-ED1 Business Plan Data Tables
£60.5m (34.3m SEPD, £26.2m SHEPD)
£6.7m (£5.8m SEPD, £0.8m SHEPD)
CV18
Investment in our RIIO-ED2 plan Comparison to RIIO-ED1 Business Plan Data Tables
£29.3m (£23.8m SEPD, £5.5m SHEPD)
£1.7m (£0.9m SEPD, £0.8m SHEPD)
CV17
In recent years, there has been an industry-wide rise in the number of link box incidents reported via the ESQCR Regulations. Although evidence indicates that only a very small proportion of these result in a disruptive failure, we have experienced a number of link box incidents in recent years which can have serious safety consequences. The primary investment driver for link boxes is to minimise the safety risk to members of the public and electricity company staff at the most economic cost.
Therefore, it is critical that we maintain the condition of this asset category. We are using electronic mobile collection devices (CHiME) to generate a robust assessment of condition across our network and determine the scale of intervention required, including for example fitting protective safety blankets to link boxes. We are proposing £18.7m to manage safety risks associated with link boxes during the RIIO-ED2 period.
5.4 Link boxes
Investment in our RIIO-ED2 plan Comparison to RIIO-ED1 Business Plan Data Tables
£18.7m for asset replacement (£18.6m SEPD, £0.1m SHEPD)
£3.2m (£3.1m SEPD, £0.1m SHEPD)
CV7a
5.5 Wayleaves and land rights
Investment in our RIIO-ED2 plan Comparison to RIIO-ED1 Business Plan Data Tables
£64.7m in payment for wayleaves, easements/ servitudes and injurious affection (£52m SEPD, £12.7m SHEPD)
£63.1m (£52m SEPD, £11.1m SHEPD)
CV5, CV6£45.8m in associated physical diversions CV5, CV6 (£43.8m SEPD, £2.1m SHEPD)
£25.1m (£23.3.m SEPD, £1.8m SHEPD) This includes CV6 diversion cost of £9.9m
£1.5m in highways related diversions (£1m SEPD, £0.5m SHEPD)
£0.5m (£0.4m SEPD, £0.1m SHEPD)

74 | Section C: Chapter Six: Safety and Compliance
5.5.1 Wayleaves and land rights
Our approach to managing land rights related claims is designed to achieve the best outcome for consumers.
The two primary forms of land access agreements used are wayleave agreements and easements (also known as deeds of servitude in Scotland). Wayleave agreements are personal agreements between the network operator and the grantor, in return for an annual rental or one-off commuted payment. Wayleaves are a terminable agreement and grantors can seek removal of assets or a diversion of apparatus. By contrast, easement agreements are permanent rights that form a burden on the property title, and they therefore run with the property and are binding on successors in title. As a result, these are a non-terminable agreements. Gaining an agreement for a wayleave is cheaper and quicker and more likely to result in an agreement with the landowner. An easement takes more time and is more difficult to obtain.
In addition, landowners can claim compensation based on the reduction in the value of their land and property as a result of the presence of our network assets. These claims are known as injurious affections.
Figure 6.1 illustrates the increase in claims and payments we have experienced in RIIO-ED1 and our forecast in RIIO-ED2. This increase is in part due to urban expansion which brings developments into contention with our assets, but also as a result of landowners and their representatives being more willing to test their rights and ours. We are seeing claiming agents develop business models focused on the pursuit of claims on behalf of property owners on a high volume – low return basis, contributing to this increase in claims. We expect this trend will continue into RIIO-ED2 and be a significant limiting factor for decarbonisation.
Any significant activity increases relating to these often complex injurious affections claims will require us to build internal capacity in RIIO-ED2. As a general rule, we do not automatically pay out compensation for injurious affections claims. While this may result in disputes being taken to court and taking longer to resolve, it protects customers from unnecessary payments.
We have included £64.7m in payments related to wayleaves, easements or servitudes and injurious affections in RIIO-ED2 as part of our business plan. Our proposal for RIIO-ED2 is to base our business plan on the average number of claims for last five years for RIIO-ED1, as shown in Figure 6.1. This is due to the uncertainty of the volume of claims submitted to SEPD and SHEPD, and reflected in our proposal for an uncertainty mechanism as described opposite.
Figure 6.1: Total expenditure for injurious affections, wayleaves terminations and diversions due to highways
TOTAL SSEN EXPENDITURE – WAYLEAVES AND LAND RIGHTS (£m)
£120
£100
£80
£60
£40
£20
0DP CR5 RIIO-ED1 RIIO-ED2
Injurious Affection) Wayleave Terminations Diversions due to Highways
5.5.2. Diversions
When landowners no longer wish to host our assets and terminate a wayleave, we need to reconfigure the network (diversions). These costs can vary greatly and lead to significant uncertainty. Throughout RIIO-ED1, we have found that the annual cost of diversions has fluctuated significantly, due to volatility in the volume and average cost of works: costs will vary significantly depending on the number of assets involved and nature of these assets (e.g. voltage levels). This makes it challenging for us to accurately forecast diversions costs for RIIO-ED2.
POTENTIAL DIVERSION FOR NETWORK RAIL
Whilst not strictly a wayleave termination, SSEN has a Master Wayleave Agreement with Network Rail covering our overhead lines and underground cables crossing Network Rail property. Under the terms of the agreement Network Rail can serve a notice requesting us to remove or relocate our assets crossing its property. We are currently engaging with Network Rail and other parties regarding plans for a rail electrification programme in the north of Scotland. Whilst we have an indication of the routes being considered for electrification, we have not yet received the detailed information required to define the extent of diversion works required.
We are also yet to receive detailed information on either the proposed phasing of the works, or on the distribution of funding across customer bases (with a potential for financial contribution from rail customers). As a result, we cannot currently forecast the potential costs associated with this programme. In relation to the SEPD licence area, we are not aware of any planned rail electrification programmes over RIIO-ED2, and note that Ofgem have introduced a reopener for this. We will continue to work proactively with Network Rail on their proposed programme but at this time we simply do not have any level of certainty of what will be required from us and when.

75 | Section C: Chapter Six: Safety and Compliance
5.5.3 Managing uncertainty
A LAND RIGHTS REGIME FIT FOR NET ZERO
The current regime was established by the Electricity Act 1989 and enables landowners and occupiers to claim for demonstrable losses as a result of having our assets on or over their land.
As we transition to net zero, we will need the ability to intervene proactively and with agility on our network. This will not be possible unless our ability to access land and secure wayleaves quickly and at an affordable price is addressed. This is a high priority, as lead times and costs are likely to grow exponentially to unsustainable levels, delaying net zero and increasing costs borne by consumers.
We are therefore in the process of engaging with government, devolved administrations, other DNOs and other stakeholders through the ENA Estates and Wayleaves forum (EWF) to look at options for legislative reform that are fit-for-purpose in a net zero world.
Given the significant uncertainty associated with wayleaves, injurious affections and diversions, we are proposing a baseline allowance for our current view of the costs combined with an uncertainty mechanism to allow for us either to recover any additional efficient costs or for the return of unspent allowances to consumers. Our proposed mechanism has two components: (i) a re-opener for additional physical diversions spend; (ii) a close out mechanism for injurious affection spend. For further information, please see Uncertainty Mechanisms (Chapter 17).
The investment in this category covers a variety of legal and safety costs relating to site security, asbestos management and operational restrictions (ORs) which mean we cannot operate an asset as designed. ORs in particular may mean that assets can only safely be operated remotely. While assets can sometimes be fixed, others will be subject to ORs until they are replaced at the end of their life. Information on these assets is shared by DNOs and manufacturers through the National Defect Equipment Reporting Scheme (NEDeR).
The dismantlement category targets redundant sites and assets, such as those on abandoned industrial sites, that pose a significant safety risk. Substations must be secure against trespass and potential theft which can result in serious harm to members of the public. We carry out a risk assessment to determine the reason for disuse and the likelihood of return to service and propose which sites are more effective to remove.
5.6 Legal and Safety, Dismantlement
Investment in our RIIO-ED2 plan Comparison to RIIO-ED1 Relevant CV tables
£14.5m for other legal and safety activities (£10.5m SEPD, £4m SHEPD)
£20.1m for other legal and safety activities (£14.5m SEPD, £5.6m SHEPD)
CV14
£2.2m for dismantlement £0.2m for dismantlement CV32

76 | Section C: Chapter Seven: Maintaining a Resilient Network
CHAPTER SEVEN: MAINTAINING A RESILIENT NETWORK
We are proposing to invest over £1.1bn to build the strong foundations required to support the transition to net zero and deliver high levels of reliability for our customers, now and in the future. Tackling climate change is the most important challenge facing society and we will continue to deliver a safe and resilient network that meets our customers’ needs while supporting the greater electrification of heat and transport.
Our investment is focused around four core areas outlined below and supported by a number of outputs in key areas, reflecting the benefits we will deliver for our customers.
We will reduce the average duration of unplanned power cuts by 20% by 2028
We will improve network performance for at least 75% of customers deemed worst-served across both our networks
SUPPORTING DOCUMENTS
Safe and Resilient (Annex 7.1)
Reliability Strategy (Annex 7.2)
Climate Resilience Strategy (Annex 7.3)
Cyber Resilience IT Plan (Annex 7.4)
Cyber Resilience OT Plan (Annex 7.5)
Total investment in this chapter Comparison to RIIO-ED11 Business Plan Data Tables
£634.4m to manage our assets and improve longer-term resilience
£557m CV7a, CV7b, CV7c, CV8, CV9, CV10
£49.3m to improve reliability and services to worst-served customers
£70.8m CV152, CV19
£336.6m to respond to faults and severe weather events
£329.3mm CV26, CV27, CV28
£154.3m for inspections, repairs, maintenance and reactive work
£92.6m CV30, CV31
We are always looking for ways to drive efficiency. We know that there are opportunities to improve our asset replacement unit costs. We have therefore built in a 5% and 2.5% efficiency improvement in SEPD and SHEPD respectively, saving customers £25m over RIIO-ED2. We have identified and implemented a further £46m in efficiencies in other unit rates across a number of areas including LV cables and polychlorinated biphenyls (PCBs, covered in Environmentally Sustainable Network (Chapter 13). We have also embedded over £5m of efficiencies into our plan through our optimisation across different investment drivers. Please see Costs and Efficiency (Chapter 15) for details.
INNOVATION: ON LOAD TAP CHANGERS WITH MONITORING
We are looking to deploy an innovation originally tested by another DNO through innovation projects: LV On Load Tap Changers (LV OLTC). These new transformers replace conventional fixed tap 6.6kV/11kV ground-mounted transformers. However, LV OLTCs can respond automatically in real time to changes in demand and generation across the HV and LV network. This allows DNOs to implement a technique known as Conservation Voltage Reduction (CVR) to reduce the energy consumed by the customers fed by each HV transformer. When combined with LV network monitoring, LV OLTCs can provide significant savings for customers.
These novel technology HV/LV ground-mounted transformers will be deployed in a pilot scheme as part of our asset replacement investment portfolio. We are ramping-up investment in these units in a controlled manner to support installation and commissioning of these new transformer types. We will monitor performance and confirm customer benefits before extending to all of our transformer installations (load and non-load) as we move into RIIO-ED3.
1 Comparison in this table and other tables in this chapter is to the last five years of RIIO-ED1. 2020/21 prices.2 CV15 also includes cost-related to remote generation which are not included here. Please see Supporting the Scottish Islands (Chapter 8) for further details).

77 | Section C: Chapter Seven: Maintaining a Resilient Network
ENHANCED ENGAGEMENT OVERVIEW
Based on engagement with 8,483 stakeholders across 41 events on Responding to a Resilient Network, they identified their top priorities for RIIO-ED2:
1
HOW WE RESPONDED TO FEEDBACK
Reduce power cuts: The vast majority of stakeholders wanted to see a reduction in unplanned power cuts. Our plan is designed to reduce the frequency and duration of unplanned interruptions by 20% in RIIO-ED2. (Acceptability – 79%)
Network performance for Worst Served Customers (WSC): Stakeholders believed that the level of service experienced by WSCs is unacceptable and we should do all we can to improve reliability. This influenced and led us to select an ambitious target of at least 75% to be remediated during RIIO-ED2. We will also prioritise schemes based on the number of WSC and customers in vulnerable situations benefiting from each project. (Acceptability – 83%)
Prioritising network assets: Stakeholders across both of our regions strongly supported our proposed strategy of targeting assets with the highest probability of failure first.
Climate Resilience: Stakeholders wanted us to consider the impacts of climate change on our network, which we’ll analyse and communicate in our Climate Resilience Strategy.
TOP STAKEHOLDER PRIORITIES
KEY STAKEHOLDER INSIGHTS
Ensuring a reliable network was one of the stakeholders’ highest priorities across the plan, particularly with society’s increasing dependence on electricity
Target assets with the highest probability of failure first to improve network reliability
Stakeholders want to see an improved service to worst served customers, particularly from stakeholders in the north
Climate resilience will become more important and costly in future and early preparation is necessary
79% CONSUMER ACCEPTABILITY FOR A SAFE, RESILIENT AND RESPONSIVE NETWORK
Open discovery
• Reliability was the highest priority for expert stakeholders relating to the energy trilemma
• Customers ranked the network’s reliability as the second-highest priority, behind only the plan’s value for money
• The growing dependency of consumers and businesses on a consistent electricity supply means that network reliability as well as quickly restoring electricity after a power cut was stakeholders’ highest priorities
Co-creation
• Reliability will become increasingly important with the growing use of electricity and thus network investments should continue, even if outages are currently less frequent
• Improved service to worst served customers was deemed important, but there was no consensus on strategies to address this, other than to provide additional support to those customers
• Climate resilience was noted as a key area of focus, as the network needs to be prepared for new challenges such as the increased risk of flooding
Business Plan refinement
• Stakeholders’ willingness to pay differed greatly between the two regions and stakeholders. Customers in the south placed higher importance on improving power cuts generally, while stakeholders in the north place more emphasis on protecting and improving services to the worst served customers.
• Stakeholders suggested several criteria for prioritising schemes: total number of customers; the number of vulnerable customers or businesses; level and duration of outages; rural areas; islands; potential LCT take-up
Testing and acceptance
• Most stakeholders believed the outputs were sufficiently ambitious, comprehensive and represented good value for money for customers.
• 90% of stakeholders in the north and 89% in the south said that network reliability and reducing unplanned outages were of high or medium priority and our most important job.
• 77% of stakeholders in the north and 87% from the south thought it was a high or medium priority to improve service to worst served customers.
• 83% of stakeholders deemed targeting assets of highest probability of failure first as a high or medium priority
• Key areas of investment highlighted were around the automation of the network to reduce power interruptions as well as ensuring we meet the GSOP obligations
• Stakeholders placed a medium priority on an annual Climate Resilience Strategy and highlighted the likely increasing cost of climate change impact mitigation in the future
to August 2020
Aug 20 – Feb 21
Feb 21 – Jun 21
Jun 21 – Dec 21
4

78 | Section C: Chapter Seven: Maintaining a Resilient Network
OUTPUTS AND AIMS2
Output Type Target Consumer benefitCosts in our baseline plan
RESILIENCE AND RELIABILITY
Climate Resilience Strategy
LOProduce and report annually on our Climate Resilience Strategy
Reliability of service Incremental
Network Asset Risk Metric
PCD/ODI-F
Intervene in our network assets with the highest probability of failure, reducing longer-term risk by just over 14% relative to a future without intervention
Improved resilience in the longer term, and improvements to shorter-term reliability. Greater ability of our assets to withstand climate shocks and support the transition to net zero
£338m
Interruptions Incentive Scheme
ODI-F
Meet our targets and reduce the average frequency and duration of unplanned power interruptions affecting our customers by 20% by 2028
£24.2m
Guaranteed Standards of Performance (quality of supply)
LOMeet our obligations under GSOPs and minimise the number of customers experiencing an outage greater than 12 hours
Reduced inconvenience caused by power outages
Incremental
Worst-served customers
PCDBy 2028 improve the network performance for at least 75% of worst-served customers
More reliable supplies for customers.
Reduced carbon emissions (from backup generators)
£25.2m
CYBER RESILIENCE
Cyber resilience IT/OT PCD
Deliver our Cyber Resilience IT and OT strategy and continually monitor success of our delivery. We will refresh plans annually in line with identified risks and opportunities
Improved resilience to external threats and greater reliability
Confidential
LO: Licence Obligation; PCD: Price Control Deliverable; ODI: Output Delivery Incentive (F: Financial, R: Reputational), CVP: Consumer Value Proposition, SSEN Aim: Company Goal
Output Performance RAG
Network Asset Secondary Deliverables (NASD)
We are currently forecasting to deliver our RIIO-ED1 NASD targets by 109% and 102% in SHEPD and SEPD respectively, with no deferral of risk reduction into RIIO-ED2. Our asset replacement management strategy has focused on making better use of intervention data to efficiently target activities that will deliver maximum benefits to our customers. Ofgem, our regulator, will review our performance at the end of RIIO-ED1
Interruptions Incentive Scheme (IIS)
We are meeting our RIIO-ED1 commitment to reduce the number of unplanned supply interruptions (Customer Interruptions – CI) by 5% and their duration (Customer Minutes Lost – CML) by 25% compared to 2012/13. However, we have not consistently performed as well as our peers and have underperformed against unplanned interruptions CML targets on a small number of occasions. We have consistently met our CI targets
Worst-Served Customers (WSC)
We committed to reducing the number of our worst served customers (who suffer at least 3 unplanned supply interruptions within 12 months) by 30%. To date we have delivered a 66% reduction in SHEPD and 76% reduction in SEPD. We are continuing with our programme
TRACK RECORD: RELIABILITY AND RESILIENCE
3.1 Outputs performance Throughout RIIO-ED1, we have continued to improve the overall levels of reliability experienced by our customers. Overall, we are performing against our outputs, and are on track to meet our targets for reducing risk on the network under Network Asset Secondary Deliverables (NASD).
3
DEPLOYING INNOVATION TO HELP IMPROVE RELIABILITY
We have deployed advanced monitoring (Bidoyngs) on selected Low Voltage circuits. This allows us to gather higher resolution data from our cables and to identify the location of developing faults, before the fault has occurred. This has enabled us to avoid an average of 65,113 customer interruptions and 9.02m CMLs each year. This have an annual value of £3.85m.

79 | Section C: Chapter Seven: Maintaining a Resilient Network
Cost area Forecast position at end of RIIO-ED1
Reliability
In RIIO-ED1, companies were not provided with a specific allowance to meet our targets under the IIS. Instead, activities are funded through incentive rewards. We have used innovation to improve our performance and spent £14.1m to deploy advanced monitoring and thermal cameras on selected low voltage circuits. We estimate this has saved £15.8m in gross avoided costs to date, avoiding over 390,000 CIs and 56m CMLs.
Asset replacement and refurbishment
We were provided a £650.7m allowance in SEPD and a £306.3m allowance in SHEPD for all our asset replacement and refurbishment activities. We are forecasting to spend £539.5 in SEPD and £270.9m in SHEPD by the end of the period.
Not all of this asset replacement and refurbishment spend contributes to meeting our NASD outputs. We are currently forecasting to spend £412.7m in SEPD and £207.1m in SHEPD, specifically to deliver our NASD targets.
WSCWe were also allocated £9m for WSC in SEPD and £21.9m in SHEPD. We are forecasting to spend a total of £3.6m in SEPD and £11.5m in SHEPD. This is the result of updated analysis and a reduction in scope to ensure schemes deliver benefits at an efficient cost.
3.2 Costs performance Our Track Record (Chapter 3) provides full details of performance against key RIIO-ED1 outputs and cost categories. The table below summarises how we have spent those allowances linked with the outputs described above. In the remainder of this chapter, we provide detailed information on how our proposals for RIIO-ED2 compare to our RIIO-ED1 spend, and reasons for any step-changes.
3.3 Transitioning to RIIO-ED2 We recognise that there is more we can do to further improve our reliability performance. In preparing for RIIO-ED2, we are continuing to build on our existing strategy, using analytics to target investment and scaling up the level of automation on the network to reduce customer interruptions and restore supplies faster. We face specific challenges in SHEPD, which may make it inefficient to achieve higher levels of reliability.
Following a comprehensive review of our IIS performance in 2020, we set-up a wide-reaching strategic improvement programme, named ‘Project Impact’ to drive improved network performance and overall customer service. This programme covers the end-to-end processes across asset management and customer operations and aims to deliver a step change in performance leading into 2023 and provide a solid platform for improvement performance into RIIO-ED2.
PROJECT IMPACT
Our activity carried out under Project Impact, combined with our existing and planned investments for the remainder of RIIO-ED1, will quickly lead to a range of CI and CML improvements which are expected to contribute to performance in the first year of RIIO-ED2. Actions we are taking now include:
• installing an additional 100 protection and automation schemes on spur lines
• prioritising our tree cutting programme using Lidar tree proximity data
• reviewing our fault restoration processes on the high voltage network
• recruiting additional ‘retained switchers’ in SHEPD who live in difficult to reach areas
• improving our restoration times on LV underground cable faults
• using improved fault location techniques, such as acoustic fault location and thermal cameras
• reducing the number of faults by using a data analytics platform that integrates multiple data sources
• replacing our legacy Outage Management and enabling field operatives with full access to up-to-date information about any outage
Figure 7.4 and Figure 7.5 in Section 5.2 explain how Project Impact is contributing to the improvements in performance required as we transition to RIIO-ED2.

80 | Section C: Chapter Seven: Maintaining a Resilient Network
UNDERSTANDING CLIMATE CHANGE AND ITS IMPACT ON OUR NETWORK
Climate change will continue to test the reliability and resilience of our network on a day-to-day basis.
Our Climate Resilience Strategy (Annex 7.3) is based on the UK Climate Projects 2018 (UKCP18), which is the latest generation of climate change information for the UK, and reflects scientists’ best understanding of how the climate system operates and might evolve in the future. Our approach for effectively managing climate resilience and adaptation is in line with the ISO 14090: 2019 Adaptation to climate change – Principles, requirements and guidelines.
4
4.1 Climate change in our regions Based on our analysis we have identified a number of changes in our climate which could lead to more extreme weather events. More detail is available in our Climate Resilience Strategy (Annex 7.3).
4.2 Identifying risks on our network Our Climate Resilience Strategy identifies 15 potential direct risks and impacts of climate change on our network, with our SEPD network in particular expected to experience hazardous increases in heat.
Figure 7.1: UKCP Climate Change Projections for 2040-2050
Figure 7.2: Direct risks and impacts of climate change on our network
2030-2040 Northern Scotland South England
Hottest summer day +2.1C +2.5C
Hottest winter day +0.7C +0.6C
Annual days above 2.5C +1 day +5 day
Rainy days per month (summer)
No change -1 day
Rainy days per month (winter)
No change No change
Wettest summer day +3mm +5mm
Wettest winter day No change +6mm
Risk Description 2020 2050 Trend
AR1 Overhead line conductors affected by temperature rise, reducing rating and ground clearance 9 12
AR2 Overhead line structures affected by summer drought and consequent ground movement 2 4
AR3 Overhead lines affected by interference from vegetation due to prolonged growing season 9 9
AR4 Underground cable systems affected by increase in ground temperature, reducing ratings 10 10
AR5 Underground cable systems affected by summer drought and consequent ground movement, leading to mechanical damage
1 2
AR6 Substation and network earthing systems adversely affected by summer drought conditions, reducing the effectiveness of the earthing systems
6 6
AR7 Transformers affected by temperature rise, reducing rating 6 4
AR8 Transformers affected by urban heat islands and coincident air conditioning demand leading to overload in summer months
4 4
AR9 Switchgear affected by temperature rise, reducing rating 8 6
AR10 Substations affected by river flooding due to increased winter rainfall 20 20
AR11 Substations affected by pluvial (flash) flooding due to increased rainstorms in summer and winter 20 20
AR12 Substations affected by sea flooding due to increased sea levels and/or tidal surges 20 20
AR13 Substations affected by water flood wave from dam burst 5 5
AR14 Overhead lines and transformers affected by increasing lightning activity 6 6
AR15 Overhead lines and underground cables affected by extreme heat and fire smoke damage 9 12

Inspecting our assets We use this to understand asset condition and to keep our colleagues, partners and the public safe.
Maintaining our assets We use inspection information to assess and score the overall health of our assets, so we know where maintenance, repairs or refurbishment may be required.
Replacing our assets Inspection data and analysis also allows us to manage assets over the long-term, and decide when asset replacement is necessary, or a better option than repairing and maintaining assets.
Fixing our assets On the occasions that our assets do fail, we minimise the impact to our customers by undertaking immediate repairs and strengthening our equipment for the future.
81 | Section C: Chapter Seven: Maintaining a Resilient Network
1
2
3
4
Where appropriate, we have considered these climate risks as a factor in our investment and our Climate Resilience Strategy (Annex 7.3) includes a more detailed action plan. We have included detailed proposals relating to flood mitigation, which can be found in Environmentally Sustainable Network (Chapter 13).
This is the first step in embedding climate risk and resilience into our decision-making. Our understanding of climate adaptation is constantly evolving, and we will continue to assess climate change impacts and develop our adaptation planning. We will work with industry and wider stakeholders, including to understand the specific risks customers and communities in vulnerable circumstances face. We are committed to transparently monitor and report on our progress in this space.
INVESTING IN STRATEGIC RESILIENCE IN RIIO-ED2
We will invest £1.1bn in strategic resilience. As part of that, we are proposing to invest £683.7m in core resilience and reliability activities in RIIO-ED2.
This investment covers a range of activities including the replacement and refurbishment of assets, and targeted reliability improvements, including for worst-served customers. This is slightly more than the £630m we are forecasting to spend in the last five years of RIIO-ED1 for the same core activities. In addition, we are proposing to spend just over £490m on responding to faults and severe weather events, and carrying out inspections, maintenance, repair and reactive works.
Our ambition to reduce the number of customers experiencing worse than average levels of reliability by 75% will deliver significant additional benefits, in particular for those customers in vulnerable circumstances.
Much of our network’s assets are managed with a specific focus on balancing the reliability benefits of proactive replacement of assets before failure, versus the affordability considerations of early replacement of assets which might, if left in service, continue to operate reliably for a further period of time. We have a systematic approach based on industry best practice to strike that balance and to identify which assets we should replace before failure based on the consideration of the likelihood of failure (or Asset Health) and the Criticality of Failure (i.e. impact on our customers). This approach is further explained in our NARMs guidance document in Appendix B to Safe and Resilient Network (Annex 7.1).
Improving asset replacement efficiency
Understanding where we may have opportunities to improve on our efficiency as we approach the end of RIIO-ED1 allows us to target improvements.
Based on analysis carried out by Oxera [Annex 20] we have identified an efficiency opportunity, which we are looking to close by committing to a 5% and 2.5% unit cost improve in SEPD and SHEPD respectively. This flows through to a direct cost reduction of £25m. We have additionally identified £32m in further efficiency savings on other non-load unit rates, which we have embedded into our cost proposals through reductions in forecast unit rates. These savings are attributable to our commercial strategy and outlined in more detail in Costs and Efficiency (Chapter 16) and ability to drive better value for money for our customers as a result of increased volumes. These savings will be realised through the rates we forecast for LV cables, HV poles and PCB replacements. Please see Environmentally Sustainable Network (Chapter 13) for details of our PCB programme.
Finally, we have also embedded over £5m of efficiencies into our plan through our optimisation across different investment drivers, as well as creating 1,180MVA of additional capacity through our non-load investments, where this supports our load forecasts, see our Cost Efficiency (Annex 15.1). Our non-load and Worst Served Customer investments also account for avoiding 2,388tCO2e through reduced losses within the RIIO-ED2 period (as further detailed in our Environmentally Sustainable Network (Chapter 13)).
5
Investment in our RIIO-ED2 plan Comparison to RIIO-ED1 Business Plan Data Tables
£338m on replacing and refurbishing assets under the NARM framework (£208.9m SEPD, £129.1m SHEPD)
£430.4m (£280.3m SEPD, £150.1m SHEPD)
CV7a, CV9
£296.4m on replacing and refurbishing other assets (£204.5m SEPD, £91.9m SHEPD)
£126.5m (£86.9m SEPD, £39.7m SHEPD)
CV7b, CV7c, CV8, CV10
5.1 Managing risk on our network We will intervene in our network assets with the highest probability of failure, reducing longer-term risk by 14.5% on both network areas, relative to a future without intervention.
Careful stewardship of our network is key to managing risk and ensuring our network is resilient to longer-term threats, building strong foundations for net zero. Our rigorous programme of asset management allows us to optimise our investments and minimise costs for customers. We focus on four key areas to ensure we efficiently respond to faults and target proactive intervention only where the likelihood and impact of failure are highest:

82 | Section C: Chapter Seven: Maintaining a Resilient Network
5.1.1 Investing under the Network Asset Risk Metric (NARM) framework
For the majority of our assets, we prioritise investment based on asset health and condition, the probability and impact of failure and how critical the asset is to the safety and reliability of our network (accounting for customer numbers, safety and environmental impacts). This is in line with the industry standard developed and agreed with Ofgem, and the Network Asset Risk Metric (NARM) framework. We have implemented a Condition Based Risk Management (CBRM) standard underpinning our risk-based asset management approach, which assesses the probability of failure and the consequences of such failure to calculate an overall risk score (monetised risk) for each applicable asset type. We will reduce risk by replacing or refurbishing those assets that are categorized as the highest probability of failure whilst being mindful of the criticality of the asset on the network, ensuring interventions are efficient and in customers’ interest.
We are proposing to invest £338m to replace and refurbish assets under the NARM framework in RIIO-ED2. Figure 7.1 below shows how this planned investment will remove our highest risk assets from the network, and increase the number of assets with a low probability of failure.
Risk will go up and down over time, depending on how a network develops. See Safe and Resilient (Annex 7.1) for further detail. As the assets age and their condition deteriorates, most assets are expected to increase in risk before intervention becomes necessary or justified. As such, pursuing reductions in risk is not always appropriate and could result in unnecessarily high costs for customers for no material resilience benefit.
However, our approach will mean that overall monetised risk on our network will increase, when compared with no intervention. By intervening on those assets we will be reducing risk by just over 14% based on our current programme of investment. We believe our approach focuses on the right trade-off between increasing costs and maintaining reliability and resilience, in line with stakeholder priorities.
Our investment, outlined in Figure 7.3, will deliver significant benefits to customers by targeting those assets most likely to fail disruptively. We have taken a more risk-based approach to our asset management, whilst still managing our network well within our tolerance levels.
5.1.2 Investing outside of the NARMs framework
We propose to spend £296.4m during RIIO-ED2 for the replacement and refurbishment of assets that do not currently fall under the NARM framework. For these assets, we rely on other information in addition to inspection and condition, for example performance indicators like fault history, to identify the need for intervention.
LV and HV underground cablesA key component of our investment programme involves the replacement and refurbishment of LV and HV underground cables. Like all our assets, LV and HV cables will deteriorate with time. While LV cables connect directly to our customers, HV cable failure can create significant customer disruption. As such both will play a central role in enabling the delivery of net zero at a local level.
Our fleet of LV cables is now reaching end of life and this presents increasing challenges to our customers in terms of supply interruption risk. Through our fault analysis and supported by increased LV monitoring we have further developed our understanding of these cables. Our climate resilience analysis has also highlighted the increased risk of underground cable failure associated with increased heat in particular. A detailed analysis of LV cable faults over RIIO-ED1, including forecast analysis to 2030, is provided in 311_SSEPD_NLR_LV_Underground_Mains_and_Service (EJP) and 312_SSEPD_NLR_HV_Underground_Cables (EJP) along with a detailed description of the eight options we have considered.
We face similar challenges with our HV cables. Without intervention on our HV cables in RIIO-ED2 we expect an increase in costly cable failures, which will significantly impact both network reliability and affordability. Detailed analysis can be found in our EJP, 6.6kV/11kV Underground Cables.
Given the strategic importance of these cables, we are proposing to invest £131.6m to resolve increases in faults and ensure resilience to climate change. This represents a step-up from our RIIO-ED1 spend of £40.2m, reflecting that these cables are reaching or approaching their end of life. With this funding, we will replace 514km of LV cables, and 295km of HV cables. This well help to avoid cable faults over the RIIO-ED2 period, improve reliability, contribute to net zero goals. We expect our programme of LV and HV cable replacement will continue into RIIO-ED3. While we recognise that this constitutes a significant increase in activity compared to RIIO-ED1, we have carried out a detailed deliverability assessment to ensure the volumes we propose in RIIO-ED2 are deliverable. We have phased volumes in such a way as to enable us to ramp up activities throughout the period.
Our investment programme also includes the replacement of substation fences, doors and roofs, known as “civils”. These activities can be the result of other asset replacement, or can be driven by the condition of the civils themselves. The main risks in respect to these civils assets have been identified and considered and remain unchanged from RIIO-ED1, using condition-based assessments.
We are proposing to invest £28.5m in these assets in RIIO-ED2 and our approach remains unchanged from RIIO-ED1.
£3,000m
£2,000m
£2,500m
North South
£1,500m
£1,000m
£500m
£m
£4,000m
£3,500m
Start of RIIO-ED2 (forecast, with intervention) End of RIIO-ED2, no intervention End of RIIO-ED2, with intervention
Figure 7.3: NARMs risk with and without intervention

83 | Section C: Chapter Seven: Maintaining a Resilient Network
Investment in our RIIO-ED2 plan Comparison to RIIO-ED1 Business Plan Data Tables
£24.1m on automation for 620 circuits and lightning protection (£17.6m SEPD and £6.5m SHEPD)
£57m (£20.1m SEPD, £36.9m SHEPD)
CV15
5.2 Targeted investment to improve reliability
We will meet our targets under the Interruptions Incentive Scheme and reduce the average frequency and duration of unplanned power cuts by 20% by 2028.
We are committing to improve our GSOP for network performance by reducing the number of customers per annum that experience power outages of more than 12 hours.
Ofgem measure and incentivise our performance under the Interruptions Incentive Scheme (IIS), to improve the overall reliability of networks. The scheme covers all interruptions that are three minutes or longer and includes any planned interruptions necessary for us to safely complete work on the network. It sets the level of performance expected for unplanned and planned Customer Interruptions (CIs) and Customer Minutes Lost (CMLs) in both of our licence areas.
The unique remote geography of our northern network in the highlands and islands makes responding to faults more challenging when compared with other DNOs. Our island communities are vulnerable to weather events; off the gas grid; remote (it can take time for support to get to them especially in bad weather), and back-up solutions can be carbon intensive. Care needs to be taken to ensure that targets for reducing the duration of unplanned interruptions (CMLs) in particular do not result in inefficient high costs, which exceed the value customers place on reducing the number and length of interruptions.
Our baseline plan includes a number of activities which will have a positive impact on levels of reliability even though this may not be the primary investment driver, as shown in figures 7.4 and 7.5 below. These include safety-related investment such as tree-cutting (see our Safety and Compliance (Chapter 6)), as well as asset replacement activities discussed earlier on in this chapter. We have also identified improving reliability as one of our key RIIO-ED2 innovation themes. (See Section 5.4 of our Innovation Strategy (Annex 14.1)). Individual deployments will be determined on a case-by-case basis depending on CBA, and will include thermal cameras, LV automation, phase identifiers, acoustic technologies, and advanced lightning protection.
RIIO-ED1 Investments
4.2
2.3
RIIO-ED1 Project Impact
RIIO-ED2 Operational IT and Telecoms
RIIO-ED2 Safety and Asset Interventions
RIIO-ED2 CML Gap RIIO-ED2 Improvement
16
14
12
10
8
6
4
2
0
Figure 7.4: SHEPD – CML improvement through baseline plan
(14.9)
RIIO-ED1 Investments
1.1
2.5
RIIO-ED1 Project Impact
RIIO-ED2 Operational IT and Telecoms
RIIO-ED2 Safety and Asset Interventions
RIIO-ED2 CML Gap RIIO-ED2 Improvement
14
12
10
8
6
4
2
0
Figure 7.5: SEPD – CML improvement through baseline plan
(13.1)
3.4
3.5
1.5
3.4
3.6
2.5

84 | Section C: Chapter Seven: Maintaining a Resilient Network
We are therefore proposing £24.1m of targeted investments that will help reduce the number and length of interruptions experienced by our customers, primarily on automation and lightning protection. In selecting investments, we have been careful to balance cost against overall benefit. Our automation methodology, in conjunction with a CBA, determines the need for investment into automation across the network. The methodology calculates the benefits of automation by using historic fault trends, network connectivity, number of customers supplied and total cost of installation. Full details can be found in 397_SSEPD_NLR_HV_Automation (EJP).
Planned outages – We will be coordinating and managing work on our assets in a way that minimises impacts of customers from planned outages. We will group activities to reduce disruption and use flexibility products where appropriate as a tool to minimising impacts. Further information is available in Ensuring Deliverability and a Resilient Workforce (Chapter 16).
Short interruptions – Ofgem are exploring a new minimum standard for short interruptions (less than three minutes). We think that proposals have not been sufficiently developed at this stage, and further careful consideration is required to test the potential benefits, customer impacts including costs and interactions with other standards and incentives.
In our engagement, some domestic customers felt that multiple short interruptions would not register as significant, though one local authority stakeholder acknowledged that short power interruptions may have more impact on those in vulnerable situations. In the next section, we explain how our worst-served customers proposals will also help support those in vulnerable situations.
5.2.1 IIS targets in RIIO-ED2
We will not have visibility of our targets under the IIS until these are formally set by Ofgem in 2022. However, we have carried out analysis using industry performance to date and published information on Ofgem’s methodology.
Our analysis shows that a significant step-change in performance will be required across most of industry between the end of RIIO-ED1 and the start of RIIO-ED2, and continuing into RIIO-ED2, in order to meet targets. This is of particular concern in the context of CML targets. While Ofgem has stated in previous documents that DNOs will be funded through their baseline business plan to meet their targets, we have concerns that Ofgem’s methodology could lead to DNOs spending more to avoid penalties in a way that exceeds value to consumers. Our full analysis is available in Reliability Strategy (Annex 7.2).
We have therefore only included investments to improve reliability in our business plan where these are supported by a robust cost-benefit analysis. This is based on the assumption that Ofgem will set targets that reflect consumer benefits and drive efficient behaviours, and that we will receive full allowances for all relevant activities included in our business plan. Consequently, our business plan will need revisiting should the methodology require additional investment otherwise not supported by CBA or allowed in our final business plan.
We also note that the RIIO-ED1 fast-tracking process will have an impact on how targets are set in RIIO-ED2. It creates an uneven playing field between companies, as targets take into account both a DNO’s own performance and benchmarked industry performance.
Some stakeholders raised concerns that targets in RIIO-ED1 were set on the basis of outdated performance information. We note that Ofgem have already stated that it will use the latest information available to set targets and will therefore not set these prior to draft and final determinations.
We know that some of our customers experience levels of reliability that are worse than average. These customers are referred to as “worst-served” customers (WSC) in the regulatory framework and include all customers experiencing on average at least four higher voltage interruptions per year, over a three-year period (i.e. 12 or more interruptions over three years, with a minimum of two interruptions per year). Using our most recent performance figures (2019/20), we have calculated that SHEPD have 11,740 customers and SEPD have 5,436 customers that meet this WSC criteria. This is based on Ofgem’s definition for RIIO-ED2.
Investment in our RIIO-ED2 plan Comparison to RIIO-ED1 Business Plan Data Tables
£25.2m (£3.3m SEPD, £21.8m SHEPD)
£13.8m (£2.6m SEPD, £11.2m SHEPD)
CV15, CV19
5.3 Supporting Worst-served customers
By 2028 we will improve the network performance for at least 75% of customers3 that are deemed worst served.
3 Based on 2019/20 fault data and investing to remove 75% of those customers who remain WSC at the start of RIIO-ED2.
ENGAGEMENT HIGHLIGHT
Our stakeholder engagement suggests that customers in vulnerable circumstances and/or on the PSR register are particularly impacted by worst-served circuits and should be prioritised. This was a highlight of our WSC focused engagement event held on the 27th January 2021. The following list summarise the key insights relating to WSCs:
• Stakeholders were concerned about the impact of power cuts on customers in vulnerable situations, and on this basis supported a focus on investment to reduce the number of worst-served vulnerable customers.
• There was no consensus on whether investment in worst-served circuits should be prioritized according to: number of WSCs; number of interruptions; level of customer vulnerability; or potential of low-carbon technology (LCT) take-up.
• Stakeholders suggested that investment for the WSCs on the remote Scottish islands should be a priority, as it will potentially take far longer to restore power there compared to mainland areas.
• The interruption duration which is currently not considered in Ofgem’s WSC definition is recognized as an important factor by our stakeholders.
• Stakeholders suggested that an annual WSC report would be welcome and would raise the profile of the issue but might give the incorrect impression that these are the areas where there will be investment.
• Some stakeholders were concerned about the impact of worst-served circuits on generation as well as supply customers.

85 | Section C: Chapter Seven: Maintaining a Resilient Network
Using our engagement with stakeholders and customers we have developed investment plans and dedicated schemes that by 2028 will improve the network performance for at least 75% of customers that are currently deemed worst served, removing them from our WSC lists. Our activities will focus on circuits with the highest number of customers and vulnerability levels.
This ambitious target represents all circuits where investment is justified by robust cost-benefit analysis, helping ensure we maximise the benefit for customers and society, including for those in vulnerable circumstances.
Due to the topology of the SHEPD licence area the typical WSC are within the Islands and Highlands and as such costs are significantly higher than in our Southern area and require their own EJP’s. In each case, we have proposed the most economic and efficient solution, having applied the optioneering process to look at multiple alternatives. These options are explored in detail in the relevant EJPs. The CBA provides the comparative results of all the options considered and sets out the rationale and justification for the preferred solution. The 32 schemes proposed for SEPD are covered by a single EJP.
Investment in our RIIO-ED2 plan Comparison to RIIO-ED1 Business Plan Data Tables
£269.7m to respond to faults, £19.2m for severe weather events and £47.7m for other faults. (£259.7m SEPD, £76.8m SHEPD)
£329.3m for faults4 (£244.7m SEPD, £84.7m SHEPD)
CV26, CV27, CV28
£154.3m for inspections, repairs, maintenance and reactive works (£102.5m SEPD, £51.8m SHEPD)
£140.4m (£109m SEPD, £31.4m SHEPD)
CV30, CV31
5.4 Responding to faults and maintaining our network
14 schemes, improving network performance for 7,139 customers and for an estimated cost of £21.9m
32 schemes, improving network performance for 4,122 customers and for an estimated cost of £3.3m
SHEPD: SEPD:
5.4.1 Responding to faults
Not all faults are within our control, and it would not be cost effective to stop all faults from occurring. We propose to invest £269.7m during RIIO-ED2 to manage faults on the network. We have carefully calibrated our proactive asset investment proposals described earlier on in this chapter with the need for reactive fault response, to ensure our plan meets customers’ expectations in a cost-efficient way. In predicting faults, we have used existing datasets using RIIO-ED1 and National Fault and Interruption Reporting System (NAFIRS) data.
We also know that climate change, as highlighted, is likely to have some impact on fault levels. We expect to experience more severe weather events. These cause significant damage to the distribution network. This includes high winds reaching in excess of 120mph, lightning strikes, snowstorms and ice loading. Our SHEPD area has experienced two of these events in the last 10 years, further exacerbated by the local geography and associated logistical challenges. While we have not experienced any such events in the past two price control in SEPD, we consider this to be a significant risk, in particular in light of the emerging patterns of extreme heat and rainfall extremes highlighted in our Climate Resilience Strategy (Annex 7.3). We are therefore including £19.2m as a use-it or lose-it allowance in our plan to help manage the fall-out of any such event, and the impact on our customers.
Our proposals also include £47.7m to respond to street lighting faults and other reactive work that has to be resolved quickly, in line with RIIO-ED1 activity levels.
5.4.2 Reactive works, inspections, repairs, and maintenance
Inspections are essential to ensure that plant and equipment is operating correctly and safely. We are proposing £41.5m for inspection activities. Our inspections programme also provides us with additional high-quality data and a continually improving understanding of our assets, feeding into our decision-making and prioritisation of interventions.
Maintenance activities help to ensure an asset will reliably perform its function throughout its time in service and to ensure the safety of our staff and the public. We propose to spend £112.8m carrying out repair and maintenance activities on our assets.
DATA-DRIVEN ASSET MANAGEMENT
High-quality asset data is critical to ensuring we make the right decisions. We have invested in our business and IT transformation to improve our systems, processes and associated asset data.
In RIIO-ED2, we are further developing our data capabilities: our IT investment plan will enable us to treat our data as an asset and better optimise our interventions based on an in-depth understanding of our network. Appendix A of our Safe and Resilient (Annex 7.1) provides further information on our asset data strategy.
4 CV27 Severe Weather 1 in 20 not in place in RIIO-ED1.

86 | Section C: Chapter Seven: Maintaining a Resilient Network
CYBER RESILIENCE AND PHYSICAL SECURITY
6.1 Cyber-resilience
Information Technology (IT) and Operational Technology (OT) assets underpin the reliability and resilience of our distribution networks, and the safety of the public and our employees.
Our proposals meet Ofgem’s RIIO-ED2 Cyber Resilience Guidelines and relevant regulations and provide detailed solutions that will strengthen cyber resilience on our networks and its control systems. The nature of their content makes our plans confidential and stakeholders have not been engaged with their development in the usual way.
Our cyber resilience IT and OT plans uses the National Cyber Security Centre (NCSC) CAF (Cyber Assessment Framework) and the National Institute of Standards and Technology (NIST) Control Families as the basis for identifying improvement actions. We have developed security strategies for IT and OT that provide a common framework for the governance of cyber risk management. These deliver value to our stakeholders through measurable risk reduction, assurance and optimisation of our applications, projects and systems.
We have developed a risk-based approach building on our extensive experience of risk as an investor in network assets and as part of SSE plc. Through this process key cyber security and resilience risks have been identified for both IT and OT systems. These include the introduction of malware to our information systems, session hijacking, impact of Critical National Infrastructure (CNI) disruption, impact of loss of sensitive data and impact of phishing.
Ofgem has introduced a mid-period reopener mechanism to deal with uncertainty covering new cyber resilience activities, new risks or threats, as well as new statutory or regulatory requirements. We currently expect to bring forward a number of IT and OT cyber resilience projects in this mid-period re-opener. These potential projects are discussed in more detail in our confidential Cyber Resilience IT and OT Plans (Annex 7.4 and 7.5).
6
6.2 Physical security The safety of the distribution network for both the public and our employees is of the utmost priority. Whilst no further work is required on our CNI sites during RIIO-ED2, we must continue to ensure that all our substations are secure against trespass, theft, terrorism and cyber-attacks. This is captured through our safety activities described in Safety and Compliance (Chapter 6). We note Ofgem has introduced an uncertainty mechanism for CNI. As noted, we do not anticipate any further work on this in RIIO-ED2. Similarly, Ofgem has introduced an uncertainty mechanism for electricity system restoration in the event of a full or partial shutdown of the electricity system. We have captured costs for this activity in Uncertainty Mechanisms (Chapter 17).
6.3 Investing in control rooms of the future We are proposing to invest £44m across both our networks to ensure our control rooms are fit for the purpose for the future (£29.1m in SEPD and £14.9m in SHEPD). This includes ensuring our control centres are in line with best practice and requirements associated with cyber-safety, while enabling us to deliver on an increasing range of roles and responsibilities as we play our role in net zero.
We have looked at a number of options including refurbishing existing sites, co-locating with our SHE Transmission control room and building totally new sites. We have identified the redevelopment of existing SSEN property as the most cost-effective solution. Further information is available in 326_SSEPD_NLR_PROPERTY (EJP).

Scottish Islands (Annex 8.1)
Uncertainty Mechanisms (Annex 17.1)
87 | Section C: Chapter Eight: Supporting the Scottish Islands
CHAPTER EIGHT: SUPPORTING THE SCOTTISH ISLANDS
THE SCOTTISH ISLAND COMMUNITIES WE SERVE
Our North of Scotland licence area (SHEPD) covers 25% of the UK land mass but is the most sparsely populated Distribution Network Operator (DNO) area in Great Britain, with roughly 14 customers per square km. It includes 59 remote island communities supplied and interconnected through 110 subsea cables with a combined length of 454km. We currently own and operate seven Distributed Embedded Generation (DEG) sites which provide continuity of service if the cables supplying the islands are on outage or have faulted.
These remote island communities are also key green energy hubs which help enable the UK to meet its carbon targets. Our investment decisions today can help unlock that potential.
The current diesel generation solutions that secure supply for today’s customers are the largest source of controllable carbon emissions on our system. Changing these network solutions can eliminate these emissions for future generations.
Reliable electricity supply will increasingly become more critical for remote communities as we move to alternative low-carbon technologies. Our Plan recognises this need and is designed to secure the reliable future our customers expect.
Our baseline investment proposal is £329.2m which will cover three specific and unique aspects of our SHEPD licence area: Subsea cables; Distributed Embedded Generation, and electrically islanded’ Shetland. Our aim by the end of the RIIO-ED2 period is to have a sustainable long-term solution in place to ensure that the island communities that we serve have a stable energy system that meets the needs of our demand and renewable generation customers.
Specific and significant regional factors require investments in this chapter to be considered differently from the rest of our RIIO-ED2 Plan. They are unique to us amongst our DNO peers and cannot be considered within the standard cost assessment and cross-DNO benchmarking process administered by Ofgem for RIIO-ED2.
We have also proposed two uncertainty mechanisms (UM): The Hebrides and Orkney Whole System (HOWS) UM that prepares us for the opportunity to develop integrated whole-system energy solutions in parallel with the needs of other vectors serving these communities, and an uncertainty mechanism to respond to unforeseen subsea network failures and ensure that replacement is rapid and efficient.
In Whole Systems (Chapter 12) we also propose a CVP looking at utilising our subsea cable infrastructure to provide wider societal benefits by facilitating a whole-systems broadband solution for remote island communities.
SUPPORTING DOCUMENTS
Aberdeen
Perth
Dundee
Inverness
Glasgow
Kirkwall
Arnish
Battery Point
Barra
LochCarnan
Tiree
Bowmore
LerwickPower Station
Shetland Islands
Total investment in this chapter** Comparison to RIIO-ED11 Business Plan Data Tables
£184.5m for subsea cable investments £122.6m CV7, CV30, CV26, CV31, C5, HVP, C7
£42.5m for remote generation £41.5m CV15/C8
£99.8m for Shetland* £114.3m C25
1 Comparison is to the last five years of RIIO-ED1. 2020/21 prices.
* The £99.8m does not include the approx. £241m contribution to the Transmission link which will be an adjustment during RIIO-ED2.** Figures for remote generation quoted in this chapter will include the impact of energy sales as appropriate.

88 | Section C: Chapter Eight: Supporting the Scottish Islands
ENHANCED ENGAGEMENT OVERVIEW
We engaged with 358 stakeholders across 14 events on Supporting the Scottish Islands, and they identified the following RIIO-ED2 priorities:
1
TOP STAKEHOLDER PRIORITIES
Reliability is the highest priority for stakeholders which translates into increased investment into subsea cables to improve the condition of existing links as well as provide additional links
Ensuring reliability of supply utilising a low-carbon whole-system solution in our transition to net zero
Generation customers wanted increased grid capacity and improved resilience to facilitate renewable generation potential on island networks
HOW WE RESPONDED TO FEEDBACK
Subsea cables: Stakeholders noted that the lack of reliability has a high impact on both demand and generation customers so we’ll commit to invest strategically to enable the low-carbon potential of the islands which is critical to achieving net zero.
*Enhanced Strategy* Project Prioritisation: Stakeholders urged prioritisation of subsea cable replacement based on the impact on communities, generators and environment of a cable failure. Our asset strategy has thus been enhanced from RIIO-ED1 to be a more proactive, impact-based approach and expenditure will also be supported by a subsea cable replacement Uncertainty Mechanism.
*Enhanced Strategy* Capacity for Generation: As a response to feedback from generation customers, we will invest in two major projects subject to whole-system principles, including assessing relative export capacity needs from these major islands groups.
Reliability on Shetland: Retaining a reliable supply was a top priority for Shetland stakeholders, so a robust standby solution is essential in the event of a subsea cable outage. Due to the low appetite to invest in new diesel generation and the benefits of reusing current assets we have decided to retain Lerwick Power Station but add supplementary low-carbon solutions to limit thermal generation and avoid blackouts in future. We will continue to engage with the Shetland Islands Council to align our vision for a low-carbon future.
*New Strategy* HOWS Mechanism: Given the range of challenges faced in this area, stakeholders believed like-for-like replacement was not sufficient for strategic cables servicing large island communities. We have introduced a UM to develop a flexible whole-system solution with our partners.
79% CONSUMER ACCEPTABILITY FOR A SAFE, RESILIENT AND RESPONSIVE NETWORK
KEY STAKEHOLDER INSIGHTS
Open discovery
• Stakeholders noted the importance of having detailed targets specific to each island group and its unique challenges, especially around network reinforcement for additional generation connections
• Investments should be undertaken to ensure there is sufficient network capacity to connect new renewables generation
Co-creation
• The differences in geographies and issues between each island and the impact of lack of resilience necessitates a tailored approach to asset strategy and investment for each island
• All stakeholders were interested in how we plan to decarbonise the diesel-powered backup generation on the islands whilst maintaining a reliable supply
• Subsea cable replacement should be prioritised based on the impact of a cable failure on communities, generators and the environment
• Removing reliance on single subsea cables should reduce current constraints for local generation on the islands, as well as support progress towards net zero.
• Technology can be applied to monitor the condition of subsea cables
Business Plan refinement
• Stakeholders were keen to see an increase in storage and demanded flexibility on the islands to make the best use of local renewable generation, while also reducing the need for network reinforcement and improving the reliability of supply
• Stakeholders were highly encouraged with our increased investment in subsea connectivity between islands and mainland
Testing and acceptance
• Stakeholders thought the ambition and comprehensiveness of the Supporting the Scottish Islands strategy and outputs had built on the lessons from RIIO-ED1 and represented value for money
• Stakeholders would like enhanced engagement on future network capacity and resilience of supply options to ensure that local communities are part of the consultation process, including on innovation opportunities for reducing costs and replacing diesel generation
• Uncertainty Mechanism to apply to RIIO-ED2 expenditure supported and represented value for money. Sought further clarity on how the mechanism would apply, suggesting criteria could include cost-benefit and net zero Impacts
to August 2020
Feb 21 – Jun 21
Aug 20 – Feb 21 Jun 21
– Dec 21
*Enhanced Strategy* – This denotes a change in ambition or scope in the output between our draft and final plan. *New Strategy* – This denotes the addition of a new output between our draft and final plan.

89 | Section C: Chapter Eight: Supporting the Scottish Islands
OVERVIEW OF OUR RIIO-ED2 PROPOSALS AND CONSUMER BENEFITS
To ensure customers are protected, we have attached PCDs to some of the core deliverables in this chapter.
2
Output Type Target Consumer benefitCosts in our baseline plan
SUBSEA CABLES
Subsea cables – targeted intervention
PCD Replacement or augmentation of 15 cables with the greatest needs case
• Improved reliability and resilience in the longer term
• Contribution to risk reduction on our network (see Maintaining a resilient network, Chapter 7)
• Increased capacity to enable renewable generation to connect
• Condition driven replacement to avoid supply failure and improvement of network for capacity reasons
• Enables a whole-system approach to these communities. Needs case development during RIIO-ED2.
£63.5m
Subsea cables strategic upgrades
PCD2 Three new cables between Skye and Uist and Pentland Firth West to Orkney
£83.9m
ISLAND GENERATION
Distributed Embedded Generation
PCD Maintaining and operating standby generation for island communities at our seven island power stations
• Improved reliability of distributed generation reduces risk of loss of supply for customers
• Increased efficiency results in lower emissions and running costs.
£42.5m (remote generation)
SHETLAND SECURITY OF SUPPLY
Shetland LO Continued running of Lerwick Power Station to 2025 and then successful transition to standby status
• Extended operational life until 2035 as a standby generator to ensure continuity of supply for island customers.
£99.8m
LO: Licence Obligation; PCD: Price Control Deliverable; ODI: Output Delivery Incentive (F: Financial, R: Reputational), CVP: Consumer Value Proposition, SSEN Aim: Company Goal
TRACK RECORD
In RIIO-ED1, we moved from a reactive approach to subsea cable management to become more proactive and replace assets before they fail, based on age, condition and criticality. We also moved to a more proactive and data-driven inspection programme under a new inspection policy, based on the number of customers connected, seabed conditions and other factors.
Inspection of subsea cable assets in RIIO-ED1 identified a need to replace a number of cables. Working with Ofgem, we provided updated plans under the 2019 subsea cable protection reopener, to replace those cables identified as being most at risk. To date we have replaced seven cables (69.8km) and are on track to replace four more by the end of RIIO-ED1, bringing our total to 100.3km. We have experienced 16 subsea cable faults so far in RIIO-ED1, giving an annual fault rate of approximately 2.7 faults per annum, slightly higher than the average of 2.2 faults per annum we expected at the start of RIIO-ED1.
3
2 The subsea cable PCD is only applicable to the investments that are related to the HOWS UM for whole system opportunity development. Please see Uncertainty Mechanisms (Annex 17.1) for full detail and explanation about our approach to protect customers from unnecessary expenditure.
OUR PROPOSALS FOR RIIO-ED2
Our proposed investment of £329.2m is broken down into three core areas:
Subsea cables: We’re proposing £63.5m for intervention on subsea cables via replacement or augmentation of 15 cables with the greatest needs case of proactive work to avoid faults. A further £83.9m is proposed for augmenting three further cables identified as critical components of our whole-system approach during RIIO-ED2. Finally, £37m is proposed as ancillary costs for cables such as inspections and maintenance.
Distributed diesel generation: We have included £42.5m for maintaining and operating standby diesel generation for island communities at seven sites. This includes replacing the end of life engines at Battery Point on the Isle of Lewis to maintain security of
supply while also reducing its environmental impact and to improve its environmental impact and to uprate the capacity of Bowmore Power Station on Islay.
Shetland: The third area of specific investment for the islands is a proposed £99.8m for Shetland. This will cover operation and maintenance of Lerwick Power Station to ensure reliability of supplies until the new transmission link is constructed and connected to the distribution network; a new fault ride through system once that connection is made, and the continued maintenance of Lerwick Power Station to ensure its operational life until 2035 as a standby generator.
4

90 | Section C: Chapter Eight: Supporting the Scottish Islands
4.1 Subsea cables investment
Subsea cables are a critical strategic lifeline for the island communities. They also enable a vital fiscal stimulus to the area by allowing growing volumes of renewable island generation to access the British energy markets.
4.1.1 Data-led focus identifies cables with the highest risk of failure
Our RIIO-ED2 plan will take a balanced approach to risk and the impact of failures with proactive replacement of the poorest condition and highest risk of failure cables. Where certainty of need is lower today, but unforeseen events occur, we will adopt a fix-or-fail approach supported by our proposed reactive replacement uncertainty mechanisms (UMs). This does not negate our need for an ongoing inspection programme and remedial repairs to prevent faults.
We have included more real-time subsea cable condition monitoring in our plans, extending the rollout of SUBsense, our new Network Innovation Allowance (NIA) funded real time monitoring system for subsea cables. If unforeseen faults do occur, our proposed uncertainty mechanisms will ensure we can react efficiently.
This approach will help to extend the useable life of subsea cables through use of real-time data and alerts to inform proactive intervention before faults occur. We are proposing the planned replacement of 15 cables where the certainty of need is highest, driven by high probability and impact of failure in RIIO-ED2.
Our intervention proposals have optimised the benefits of investment by prioritising reduced consumer impact (lower interruptions and minutes lost) and are meeting the needs of local communities and stakeholders, including considering the impacts of constrained generation. Figure 8.1 summarises these benefits showing how, through our interventions, we will reduce valued risk by £32m across our subsea cable portfolio, keeping it at a comparable level to today. Taking this approach will ultimately reduce the number of faults the islands experience and decrease the environmental impact of running standby generation.
Our Plan also includes ongoing costs for routine inspections, cable repairs in the event of a fault and strategic spares.
An additional three projects meet the threshold for High Value Projects (HVPs) and are treated differently, in accordance with Ofgem guidance. These three cables that are critical components of our proposed whole system approach during RIIO-ED2. The work will allow us to continue a whole system assessment in RIIO-ED2, including assessing relative export capacity needs from these major island groups.
The proposal is to install 36km of cable between the mainland and Orkney, and to replace the existing cable between Skye and South Uist and in the process add an additional cable between Skye and North Uist.
As an example of need, local authority and community energy representatives have urged sufficient capacity on the two subsea cables to Uist to facilitate community and local renewables. We will continue to work with industry stakeholders and the Transmission Owner to evaluate this and other needs cases and identify the most economic and efficient investments, including wider assessments of future demand and export requirements relating to the islands. The proposed allowances for RIIO-ED2 ensure we can progress this whole-system development and pre-construction work.
Through the RIIO-ED2 period we will continue to take a whole-system view to the development of these assets including wider assessments of future demand on the islands. Ultimately, even without whole-system value these cables will increase redundancy and load capacity to the islands as well as provide greener alternative backup generation in the event of faults.
We have commenced a study of whole system options to respond to broader island community needs, which also considers additional network resilience for Lewis and Harris. The report demonstrates the need to explore and test the value of all options to pursue the greatest opportunities for consumer benefit. The initial report from our consultants is in Scottish Islands Strategy (Annex 8.1).
Start of RIIO-ED2 long-term risk
£m
End of RIIO-ED2 long-term risk
(without investment)
End of RIIO-ED2 long-term risk
(with investment)
Improvement from investment in
RIIO-ED2
250
200
150
100
50
0
£32m
Figure 8.1: Improvement in monetised risk from RIIO-ED2 Subsea Cable Replacement

4.2 Distributed Embedded Generation
Our diesel-powered Distributed Embedded Generation (DEG) units were established in the 1950s before the use of subsea cables as the main source of electricity to some island communities. Over time DEG units have evolved to be used as an essential alternative supply to subsea cables when on outage and following faults, especially to island communities.
In RIIO-ED2 we propose to spend a total of £42.5m on standby generation for island communities, across our seven DEGs sites. Without wider network reinforcement or smart-system solutions it is essential we maintain these power plants to provide a vital service ensuring continuity of security of supply in the event of outages on subsea cables.
As part of our HOWS mechanism in early RIIO-ED2 our focus will be on identifying market-based solutions that can provide the necessary standby or network response that would remove the need for DEG and the CO2 they produce. This fully supports our commitment to the 1.5°C target as set out in Environmentally Sustainable Network (Chapter 13). These alternative solutions also have the real potential to provide supply security at a lower marginal cost to customers.
The bulk of the baseline investment in our Plan will be for operational and maintenance costs, as set out in figure 8.2. Other work includes the replacement of two engines at Battery Point with more efficient plant and the procurement of reconditioned generation equipment to provide additional capacity and avoid the cost of mobile generation during RIIO-ED2 at Bowmore.
Figure 8.2: Breakdown of our proposed Distributed Embedded Generation allowances for SHEPD in RIIO-ED2
91 | Section C: Chapter Eight: Supporting the Scottish Islands
4.1.2 Applying an uncertainty mechanism to protect customers and extend value
We are proposing an uncertainty mechanism with three different components to provide flexible adjustment of cost allowances over RIIO-ED2 for unpredictable fault volumes and remediation of subsea cables. The mechanism includes:
• A volume driver to cover reactive replacement works required following cable faults.
• A closely related reopener to cover additional efficiency costs associated with providing remote power generation (and backup power supply) for communities during cable faults, where this is required.
• A reopener to cover cable decommissioning requirements initiated by Marine Scotland which could include cable inspections and partial or full cable removals.
Taken collectively, our proposed uncertainty mechanism for reactive replacement together with the remote generation reopener aim to ensure that cable damage is addressed promptly and efficiently.
4.1.3 The HOWS Mechanism
The UMs above are focused on the response to subsea cable events. They are separate from our whole-system mechanism, Hebrides and Orkney Whole System (HOWS), which enables investment in proactive, integrated, multi-party solutions and will allow us to leverage baseline totex and achieve greater customer value. We expect HOWS to address multiple and wider customer needs, including load growth, emissions reductions to meet Science-Based Targets pathways, existing condition programmes, new renewable generation export routes and reliance on standby stations plus benefits to local communities and other energy sectors. The mechanism builds on the whole-system solution agreed for Shetland by Ofgem which has demonstrated the value embedded in whole-system solutions for consumers.
Our HOWS UM will create the framework through which we can explore whole-system solutions in response to wider assessments of future demand, transmission network interactions, local community economic development, as well as government auction and leasing rounds. We have demonstrated the ability to identify, develop and deploy large-scale whole-system solutions and expect similar opportunity to be present in the Hebrides and Orkney zones during RIIO-ED2. For more information see Uncertainty Mechanisms (Chapter 17).
REMOTE GENERATION INVESTMENT IN RIIO-ED2
Operations & maintenance
costs
Other capex Battery Point (replace engine)
Total
50
25
35
40
45
30
20
15
5
10
0
£m

92 | Section C: Chapter Eight: Supporting the Scottish Islands
ENSURING SECURITY OF SUPPLY FOR SHETLAND CONSUMERS
We operate and maintain power supplies on Shetland, 170km north of mainland Scotland. Shetland is ‘electrically islanded’ which means that there is no direct connection to the wider National Grid and must therefore generate its electricity locally. The island is currently supplied by our power station in Lerwick, with support from local third-party contracts. The costs of maintaining these supply sources fluctuates year-on-year, linked to third-party commercial drivers and market values for fuel prices outside our direct control.
This position will change in 2025 with the construction of a new transmission link to Shetland that will connect to the local distribution networks, providing our customers with an enduring supply solution and substantially reducing Shetland’s reliance on remote fossil-fuel generation.
To secure Shetland’s future energy needs, in RIIO-ED1 we developed a whole-system solution which proposed a financial contribution towards a transmission link to Shetland, based on the value of services the link would provide to the local distribution network. The contribution value is materially lower than the next viable alternative solution to secure energy security on Shetland (c. £400m) and therefore represented a material saving to all GB consumers. Following extensive consultation, this contribution has been approved by Ofgem3 with the final contribution value to be determined based on the final link cost. The distribution connection to the transmission link is expected to become operational in 2025 through a new grid supply point.
It is vital that we continue to provide security of supply to Shetland until the new link is constructed and to provide backup when it is on outage. Our RIIO-ED2 investments maintain Lerwick Power Station for back up purposes and also create innovative fault ride through capability so we can maintain uninterrupted supply in the first hour post-fault whilst the station warms up. We are working closely with Ofgem to establish enduring standby arrangements and submitted updated proposals in December 2020. Our proposals align with this engagement and are based on detailed Cost Benefit Analysis. Figure 8.3 summarises our investment proposals for Shetland, highlighting the decreasing costs of running Lerwick Power Station post 2025.
We have included an uncertainty mechanism (UM) to manage the unknown costs separate to our £99.8m baseline proposal, associated with providing the supply in Shetland pre and post-construction of the transmission link, as previously agreed with Ofgem. This is required as there remain uncertain costs in RIIO-ED2 as the enduring supply arrangement is put in place which SHEPD needs to account and prepare for. The UM will provide flexibility to allow SHEPD to ensure all appropriate efficient cost variances are covered. For more information see Uncertainty Mechanisms (Annex 17.1).
5
Figure 8.3: Shetland cost breakdown over RIIO-ED2
2024-2025 2026 2027 2028
90
80
70
60
50
40
30
20
10
0
Post transition link from
2025
Enduring One-off
3 Decision on Scottish Hydro Electric Power Distribution’s proposals to contribute towards proposed electricity transmission links to Shetland, Western Isles and Orkney. https://www.ofgem.gov.uk/publications/decision-scottish-hydro-electric-power-distributions-proposals-contribute-towards-proposed-electricity-transmission-links-shetland-western-isles-and-orkney

93 | Section D: Accelerated Progress Towards A Net Zero World
SECTION D: ACCELERATED PROGRESS TOWARDS A NET ZERO WORLD
Core challenges for RIIO-ED2The pathway to net zero will be driven by technical changes and new customer behaviours, but understanding the future requirement is complex and ambiguous. Robust and comprehensive analysis that informs the right processes, structures and plans today will be critical to meeting future demand, affordability and society’s carbon reduction goals.
DSO and whole system working: Enhancing our DSO capabilities will require fundamental technological and cultural change that will enable the energy sector to successful understand, interact with and advance net zero with transport, industry and other key sectors of the economy.
A local and just transition: Communities across our two license areas have varied needs and will transition to net zero at different paces. We recognise one size does not fit all and will build in the required system flexibility to accommodate all customers and ensure no one gets left behind.
Decarbonising our network: We must build a sustainable, green network that benefits everyone and supports the decarbonisation of the wider economy. That will require replacing industry standard processes and materials, such as SF6 and PCBs, with innovative and creative solutions that maintain and enhance service while removing toxins and CO2 from operations.
EXECUTIVE COMMITMENT TO OUR PLAN
“We are committed to significant reductions in our carbon footprint over RIIO-ED2 and to develop and deliver flexible services in line with customer and stakeholder expectations. We will do this in collaboration with whole system partners, supporting local authorities and other customers on their pathways to net zero. Our plan is ambitious and reflects our company wide commitment to take a leading role in the decarbonisation of the energy system and reduce our own impact on the environment.”
ANDY HUTHWAITE RIIO-ED2 Director
WHAT STAKEHOLDERS WANT DELIVERING IMPROVED OUTCOMES FOR ALL
• We should support the substantial growth in EVs and heat pumps with no delays and simple connections processes
• Be an enabler for the net zero transition, working with local partners and across the ‘whole system’ to ensure pace and efficiency
• Prioritise early investment in the network for long term benefit using robust data and stakeholder insights
• Lead by example and reduce our carbon footprint aligned with recognised climate targets
• Work with communities to ensure that local renewables, flexibility and energy efficiency potential can be realised
• Develop DSO services that are transparent, data-driven and will deliver flexibility at scale
• We will invest at least £350m to support network capacity growth over RIIO-ED2, with further funding to be provided through an agile and stakeholder led approach to uncertainty
• We will provide dedicated support to develop Local Area Energy Plans for local authorities and key groups, and set up an Information, Advisory and Whole Systems Liaison Service to support local authorities achieve their net zero ambitions
• We will introduce a self-serve process for domestic LCT and minor connections customers, improving the customer experience and facilitating the significant increase in connections
• Through our DSO strategy we will act as a neutral market facilitator, strengthening our approach to governance in RIIO-ED2. We will use flexibility services to deliver benefits across our plan
• At least 35% reduction in our Business Carbon Footprint (BCF) by 2028 in line with 1.5°C science-based target, and reduced reliance on diesel generation
We have worked alongside stakeholders to design and calibrate our plan for future changes in system operation and the pathway for net zero. We have built in the necessary flexibility to ensure we are future-proofed for changes but without imposing unnecessary costs on today’s or future customers.
We will achieve this by investing over £500m on out network, taking a flexibility first approach to defer up to £46m and £417m of traditional investment through flexibility and flexible connections. Our plan is fully aligned to a 1.5°C Science Based Target (SBT) and will deliver at least a 35% reduction in our business carbon footprint (BCF) by 2028 from a 2020 base. Expected growth in flexible connections will offset a further 1.8 mtCO2 by 2028.
We are stepping up to address our impact on the natural environment by delivering a £26.4m biodiversity net gain programme through local afforestation and programmes and solutions that will reduce our impact.
Planned investment 2023-28
Chapters in this section Capex (£m)
Chapter 9: Our Forecasting and Future Energy Scenarios N/A
Chapter 10: Our Network as a Net Zero Enabler £510.2m
Chapter 11: Distribution System Operation £73.1m
Chapter 12: Whole Systems N/A
Chapter 13: Environmentally Sustainable Network £172.3m
Totex £1,039m*
DELIVERING OUR GOALSWe have clearly demonstrated where our proposals are a result of meeting expected standards, including regulatory and legislative requirement, and where we have sought to respond to the needs of our customers and stakeholders by delivering on shared ambition or going above and beyond expectations.
• CVPs – our whole systems CVPs will provide dedicated in-house support to empower local communities in net zero, and lead the way in infrastructure sharing to enable our most remote communities to benefit from digitalisation
• CVPs – our DSO CVPs will facilitate broad and diverse flexibility market participation, and accelerate the use of energy efficiency as a tool to reduce network constraints and customer bills
*Chapters only show direct investment required to deliver key deliverables and outputs, not CVPs.

94 | Section D: Chapter Nine: Our Forecasting and Future Energy Scenarios
CHAPTER NINE: OUR FORECASTING AND FUTURE ENERGY SCENARIOS
Meeting the UK and Scottish Government’s net zero targets will have profound implications for DNOs.
As a DNO, we are integral to enabling our local communities’ and wider governmental ambitions, by facilitating the decarbonisation of heat and transport, and enabling the connection of low carbon renewable generation. Forecasting the future load requirement – the required balance of supply and demand at any given time – is complex and we have looked at a number of alternative scenarios and sources to guide our investment plan.
We will facilitate 1.3 million electric vehicles and 800,000 heat pumps on our network, as well as 8GW of distributed generation and storage1.
The Electricity System Operator’s (ESO) Future Energy Scenarios (FES) all forecast a continued increase in distributed generation and extensive take-up of low carbon technologies (LCTs). We have used the FES pathways to develop our own evidence-based Distribution Future Energy Scenarios (DFES), taking into account the needs of local authorities and other relevant stakeholders shared with us during the development of Local Network Plans (LNP). We have studied network conditions across all scenarios in RIIO-ED2 to identify when and where network capacity constraints will occur.
Our latest DFES was completed in December 2020 and the reports can be found here2. It is discussed in more detail in our Load Related Plan Build and Strategy (Annex 10.1). The DFES projections at all voltage levels are based on the same four scenarios as the FES (see Figure 9.1). Our Load Annex also provides more information on how our DFES meets Ofgem’s minimum requirements.
SUPPORTING DOCUMENTS
Load Related Plan Build and Strategy (Annex 10.1)
Connections Strategy (Annex 10.2)
ESO FES 2020
SSEN DFES 2020
FORECASTING’S CRITICAL ROLE ACROSS OUR PLAN
The impact of our forecasting and DFES is felt across the whole of our RIIO-ED2 Business Plan, driving our load related investments set out in Our Network as a Net Zero Enabler (Chapter 10) and helping to inform our DSO (Chapter 11). These investments will support the increases in demand we have identified as highly likely and will help ensure we do not foreclose future pathways yet to emerge.
The role of forecasting and our load related expenditure also relates to, and has interdependences with, the following Business Plan Annexes:
• DSO Strategy (Annex 11.1)
• Connections Strategy (Annex 10.2)
• Whole Systems (Annex 12.1)
• Uncertainty Mechanisms (Annex 17.1)
1 Numbers are cumulative to 31 Dec 2028.2 https://www.ssen.co.uk/SmarterElectricity/ under Your future electricity grid.3 RIIO-ED2 Business Plan Guidance, pages 37 to 43. Ofgem, February 2021.
OUR DISTRIBUTION FUTURE ENERGY SCENARIOS (DFES)
1.1 Approach
Our industry’s conventional, historic-driven forecasts are not suitable for the level of uptake of electric vehicles (EVs), heat pumps and other (LCTs) we are seeing now. Early on we recognised the benefit of moving towards a scenario-based forecasting methodology. These are known as our DFES.
Augmenting the FES 2020 pathways, the DFES analysis uses specific regional and local demographic attributes, geographical characteristics and natural resources to determine projected growth for each scenario.
This ensures that each licence area’s scenarios can be tailored to its local authorities, stakeholders, government targets and consumers as required by Ofgem’s minimum requirements3. The four areas we address under our DFES methodology are:
• The technologies that are in the scope of the future scenario analysis (i.e. those technologies and load sources that directly connect to SSEN’s networks)
• The scenario framework that is being used to frame the societal, technological and economic ‘worlds’ that the projections sit within
• The analysis stages that are applied to each technology when modelling scenarios
• The geographical distribution of the projections down to sub-regional or local levels
1

95 | Section D: Chapter Nine: Our Forecasting and Future Energy Scenarios
Understanding the impact of future technology
Our annual DFES analysis follows a four-stage process where each of the technologies in scope undergoes four levels of scrutiny, to:
1) Determine the historic deployment and establish the existing baseline of operational or connected projects
2) Assess the near-term development pipeline, recording and reviewing projects with connection offers or planning applications
3) Develop medium- and long-term projections out to 2050
4) Geographically distribute these annual, scenario-specific projections across the licence areas
To further our understanding we have developed a new process, our Local Network Plans (LNP), to help local authorities and local enterprise partnerships understand the uptake of LCTs in their areas. More importantly, the LNPs provide the local distribution network with network constraints and capacity information to aid Local authorities as they develop their Local Area Energy Plans (LAEPs) and Local Heat and Energy Efficiency Strategies (LHEES), which they have told us they value.
We approached local authorities (LA) with the results of the DFES to create a modified baseline scenario. The relevant data for each LA was provided with a request for LAs to self-select the scenario which best represents the local view of the projection, for four of the most impactful low carbon technologies. All LAs have been asked to evidence their selection, with each being assessed in accordance with an open and transparent evidence assessment framework (provided in Whole Systems (Annex 12.1, Appendix B).
All stakeholders were strongly in favour of LNPs being localised by incorporating local policies, geography, social factors, and electrical and other infrastructure, as well as projected growth in local demand and generation under the DFES.
Through our DFES and LNP engagement, we will continue to work closely with our stakeholders to understand how we can continue to facilitate their net zero ambitions throughout the RIIO-ED2 period. This will help us understand additional activities above and beyond our baseline plan, to be funded through our proposed agile and flexible uncertainty mechanism. Please see Our Network as a Net Zero Enabler (Chapter 10). Our work with local authorities will be further supported by our whole systems proposals outlined in Whole Systems (Chapter 12).
1.2 Co-creating our DFES The scenarios produced by the ESO are set at the national level for the whole of Great Britain. Whilst a top-level view of generation and demand by DNO licence area is provided, it is necessary to create a more detailed bottom-up view. This includes local intelligence and reflects relevant planning and development activities in our licence areas. For this purpose, we have produced a set of DFES using the same scenario framework as the ESO FES.
• Steady Progression: Slowest credible decarbonisation of all the scenarios with minimal behavioural change of consumers. Decarbonisation of power and transport but not in heat by 2050. It doesn’t achieve net zero by 2050 target
• System Transformation: Meets net zero by 2050 but with consumers less inclined to change behaviour and lower uptakes of energy efficiency compared to the other net zero complaint scenario. Supply side flexibility is prominent as is hydrogen for heating
• Consumer Transformation: Meets net zero by 2050 but with shifts in consumer behaviour driving high uptakes of energy efficiency and demand side flexibility and electrified heating
• Leading the Way: The fastest credible decarbonisation pathway. Centred on significant lifestyle changes for consumers and a mixture of hydrogen and electrification for heating
Figure 9.1: Source National Grid ESO Future Energy Scenarios 2020, link
SLOW FASTSPEED OF DECARBONISATION
STEADYPROGRESSION
SYSTEMTRANSFORMATION
CONSUMERTRANSFORMATION
LEADINGTHE WAY
LOW
HIG
HL
EV
EL
OF
SO
CIE
TA
L C
HA
NG
E
NET ZEROBY 2050
UNDERSTANDING DFES
Over the near term the DFES projections are heavily influenced by the pipeline of projects and new developments that can be identified in the planning system, our connection database and by direct discussion with developers and stakeholders. Over the medium and longer term the projections will tend to reflect the underlying scenario assumptions and degrees of certainty supported by regional and national policies.
The DFES assessment is a locally driven and evidenced-based analysis of the future energy scenario outcomes for a specific region. Stakeholder engagement and consultation is therefore
critically important to inform the scenario modelling and test the future assumptions that have been made for the various building block technologies. Through engaging and consulting with a wide range of organisations and representatives we have been able to seek views and evidence in the following areas:
• individual project development plans and timescales
• regional considerations for the potential uptake of specific technologies
• specific regional policy, regulation and other decision making

96 | Section D: Chapter Nine: Our Forecasting and Future Energy Scenarios
1.2.1 Our DFES are co-created with our stakeholders each year
The choice of scenario assumptions is defined with input from our stakeholders to represent a credible baseline trajectory of supply and demand change over RIIO-ED2. This in turn drives our network needs and investment proposals.
The DFES assessment is a locally-driven and evidenced-based analysis of the future energy scenario outcomes for a specific region. Stakeholder engagement and consultation is therefore critically important to inform the scenario modelling and test the future assumptions that have been made for the various building-block technologies.
1.2.2 Alignment with Government policies
We’ve carried out a detailed analysis of UK and Scottish Government energy and net zero policies to understand the likely impact of these on our network.
Based on the information currently available to us, policy interventions support a range of potential DFES outcomes. However, the policies that are expected to have the most significant impact on the energy system during RIIO-ED2 are most closely aligned to the Consumer Transformation DFES. These include:
• The decision to bring forward the ban of the sale of new petrol and diesel vehicles to 2030 in England and 2032 in Scotland
• Significant funding to accelerate uptake of EVs: £1.3bn to accelerate the rollout of charge points and £582m in grants for those buying ultra-low emission vehicles
• The UK Government’s commitment to install 600,000 heat pumps a year by 2028
• The Scottish Government’s commitment to heat at least 50% of Scotland’s building stock using zero emission systems by 2030
We asked stakeholders to self-select the scenario which best represents their view of the projection for four of the most impactful technologies. Their evidence underpins our selected baseline scenario which is representative of most stakeholder needs. Key findings from this engagement and how it helped us select a baseline scenario are included in the table below.
Key themes from our customers and stakeholders
We should support the substantial growth in EVs and heat pumps with no delays and simple connections processes
Be an enabler for the net zero transition, working with local partners and across the ‘whole system’ to ensure pace and efficiency
Work with communities to ensure that local renewables, flexibility and energy efficiency potential can be realised
Engagement detail Insights derived
Scottish Government (Energy and Climate Change Directorate)
Believe SSEN has a substantial role in supporting their statutory targets
The Consumer Transformation DFES scenario is most closely aligned with the Scottish pathway to net zero
The future pathway best supporting expected EV uptake is between the Consumer Transformation and Leading the Way
The Consumer Transformation scenario is closest to the ambition for decarbonised heat, although it is likely that we will need to go further and faster than this
Renewable generation capacity is projected to be between Consumer Transformation and Leading the Way
Local Authorities (LAs)
The majority of LAs (75%) who responded selected Consumer Transformation or Leading the Way scenarios
Some LAs are working in regional groups on their climate change response, for example, Oxford city, Vale of White Horse, West Oxfordshire and South Oxfordshire; BCP Council (Bournemouth, Christchurch, and Poole) is producing a single plan with Dorset Council.
The Isle of Wight local authority has asked that we work closely together to understand how net zero will affect our network on the island. Our business plan is just the first step in our planned ongoing engagement with local authorities throughout RIIO-ED2. We have also proposed a distinct net zero islands study in the Isle of Wight in early 2022 to gain a more granular understanding of potential generation in the area, working with the council, developer community and local stakeholders, to understand what activities will be funded through our uncertainty mechanism
Local/community energy schemes, Consultants/Contractors, LAs
SSEN needs to inform on requirements to meet 1.5°C targets then understand what can be done locally to achieve this
SSEN should engage with LAs, local energy agencies, local developers, and should look at Local Energy Plans
75% of LA reps agreed with our approach of using a credible ‘base’ scenario for demand on the network and modifying where there is strong local evidence
TURNING INSIGHTS INTO ACTION ON NET ZERO
By understanding how the four scenarios align with national and local targets we are using our DFES forecasts to support informed decision making relating to net zero delivery, and to identify and target necessary investment.
We held a series of meetings with the Energy and Climate Change Directorate of the Scottish Government, giving them the opportunity to contribute to our DFES development. Following the meetings they wrote to ask that we “treat Consumer Transformation as the central pathway that is most closely aligned with the Scottish pathway to net zero.” Our Business Plan is developed to reflect that request and to support turning this and other valuable insights into action.

97 | Section D: Chapter Nine: Our Forecasting and Future Energy Scenarios
1.3 Variations between North and South areas Our licence areas represent two ends of the spectrum in terms of population density and electricity demand per square km of land area. It was therefore vital that we accurately represented the views of stakeholders from the offset and brought evidence of local plans into the DFES.
There are a number of important trends and features in the North and South that we have analysed and considered for RIIO-ED2. A selection of factors relevant to scenario planning for the pathway to net zero in our North and South areas are listed in the table below:
North South
Onshore wind: an established and strong presence; a large pipeline of viable projects; an excellent amount of wind resource, easy upgradability of existing wind assets to increase efficiency and capacity
Large scale solar PV: some of the highest levels of largescale solar PV deployment in the UK are located here, thanks to high levels of irradiance relative to the rest of the country
Hydropower: a large proportion of the UK’s current and potential future distributed hydropower capacity
Gas fired generation: currently ~550 MW of decentralised natural gas fired generation connected capacity and ~419 MW of potential new natural gas generation sites in the pipeline reflecting a strong gas network coverage in the area
Electricity storage: a significant near-term pipeline of 668 MW, up from 1.2 MW today
Electricity storage: a significant pipeline of 736 MW connected battery storage capacity building on the relatively small 3.2 MW today. Considerable MW capacity required in all scenarios by 2050
Electric Vehicles: approximately 0.7% of all vehicles in the North of Scotland area are EVs (or hybrids), similar to other predominantly rural regions in GB. Scottish Government’s ambition for transport decarbonisation is expected to see North of Scotland uptake improve by the mid-2020s
Electric vehicles: approximately 1.1% of all vehicles in the Southern area are EVs, slightly above the GB average. Forecasted uptake is expected to remain ahead of the GB average until the late 2020s at which point uptake becomes ubiquitous
Electric vehicle chargers: installation of public EV chargers is significantly above the GB average per EV vehicle
Heat pumps and direct electric heating: rapid heat pump rollout expected in the near and medium term, reflecting high levels of ambition to decarbonise off-gas and on-gas homes in Scotland. At 44% the North has the highest proportion of off-gas grid homes in the UK
Heat pumps and direct electric heating: 23% of houses in the area are not connected to the gas network (national average of 15%) so heat pump uptake will need to exceed the national trajectory to stay aligned with government targets. Direct electric heating is compliant with net zero emissions targets but is expensive. It is installed in around 50% of commercial buildings and in some new-build homes
Small scale solar PV: high levels of uptake, despite the lower levels of irradiance compared to the rest of the country, driven by particularly high rates in the early years of the Feed-in Tariff
Small scale solar: take up of domestic-scale solar PV is in line with the national average and expected uptake remains in line national trends.
Data centres: there are 13 proposed data centres totalling 665MW in the area, representing significant new demand in the South in the 2020s. Data centres could also provide battery storage, DSR flexibility and sources of heat for heat networks
UNDERSTANDING THE IMPACT OF ENERGY EFFICIENCY ON OUR SCENARIOS
We have been exploring ways in which our DFES can capture the potential benefits of energy efficiency. This will help us target our energy efficiency activities more effectively and better understand the potential network planning impacts. Our joint project with REGEN has looked at:
• How energy efficiency can reduce the underlying demand for end-use energy for domestic, commercial and industrial consumers
• How the impact of energy efficiency might be distributed across the network
• How efficiency savings might change the demand profile (time of energy use) for consumers
Our reports highlight the scale of the opportunity from increased energy efficiency and are available online4.
We will continue to build on this approach as we further develop our forecasting capabilities into RIIO-ED2, and our understanding of the impact of energy efficiency measures on our network.
Energy efficiency already forms part of our flexibility tools, and we are proposing to further explore opportunities for energy efficiency deployment through our proposed Energy Efficiency accelerator CVP. Further information on energy efficiency is available in DSO (Chapter 11).
LOW CARBON TECHNOLOGIES AT THE HV AND LV LEVELS
For the forecasts used to access the high voltage (HV) and low voltage (LV) networks, the scenario projections for LCTs have been developed with a higher degree of granularity, down to the level of secondary (11kV/LV) transformer, or to individual LV feeder lines which serve individual or small groups of consumers. This level of detailed analysis corresponds approximately to postcode or street level analysis and has enabled us to view the potential impact of demand and technology changes on the LV network, and to understand the scale and range of network reinforcement that will be required.
4 SSEN Southern: https://www.ssen.co.uk/WorkArea/DownloadAsset.aspx?id=20282 SSEN North: https://www.ssen.co.uk/WorkArea/DownloadAsset.aspx?id=20283

A CREDIBLE SCENARIO FOR RIIO-ED2
Based on our in-depth analysis, robust engagement, and overall policy direction, we are confident that the Consumer Transformation scenario represents a credible scenario for our RIIO-ED2 Business Plan.
We believe this scenario has the necessary policy ambition, financial support, and delivery commitment, which is consistent with our stakeholder community, especially the democratically elected bodies in our area. Our view that CT is the most credible scenario is based on the following:
• It is net zero compliant, reconciling with national targets
• It aligns best with UK and Scottish Government policy and direction of travel
• It is the scenario selected by the majority of local authority respondents
• It is underpinned by lower assumptions on low carbon technology take-up than CCC5 scenarios
Furthermore, CT supports high levels of electric heating and energy efficiency, supports a moderate assumed speed of decarbonisation and is coupled with an assumption that customers are willing to change behaviour, including high levels of demand-side response and flexibility6. Figure 9.2 shows the expected growth in number of LCTs we expect to see under CT.
98 | Section D: Chapter Nine: Our Forecasting and Future Energy Scenarios
2
To measure alignment between our DFES envelope and the national FES we have compared our data on key demand growth technologies for the ED2 period, namely EVs and Heat Pumps, to a disaggregated view of the National FES from data sets published on the ESO website by DNOs. Further information is available in our Load Related Plan Build and Strategy (Annex 10.1).
5 This represents a more conservative approach to the risk associated with ex-ante baseline funding.6 See Figure 9.1.
Figure 9.2: Growth in LCT units in SSEN area in the RIIO-ED2 period (Consumer Transformation Scenario)
1,400,000
1,200,000
1,000,000
800,000
600,000
400,000
200,000
02023
Heat Pumps
2024 2025 2026 2027 2028
EVs
EFFICIENTLY FUNDING THE PLANBecause of the inherent uncertainty associated with the actual pathway to net zero, we’re being more prudent in regard to which scenario is used as the basis for baseline funding of our load investment during RIIO-ED2. Whilst we believe the CT scenario provides a credible forward projection for RIIO-ED2, particularly given the strong evidence of support from our stakeholders, we feel that in terms of efficient funding, our baseline allowance should not simply be based on CT for the entire RIIO-ED2 period.
We have therefore primarily based our RIIO-ED2 business plan baseline on System Transformation (ST), with additional expenditure based on CT to ensure that we are ready to deliver on all possible credible net zero pathways. We break this down further in Our Network as a Net Zero Enabler (Chapter 10).
Any adjustments over and above our proposed baseline will be provided via the uncertainty mechanism. We would still anticipate an appropriate uncertainty mechanism operating for the full five-year period. This is discussed in more detail in DSO (Chapter 11) and in our Load Related Plan Build and Strategy (Annex 10.1).
Uncertainty of future energy scenarios
Questions have been raised by stakeholders around the level of uncertainty in our DFES. When assessing the uncertainty of future energy scenarios, some key underlying assumptions can still be made with confidence. These are discussed in more detail in our DSO Strategy (Annex 11.1) and supporting documents. The underlying assumptions include, for example, the understanding that renewable energy generation is likely to increase significantly in all scenarios and that the electrification of heat will increase, although there remains a key uncertainty over the role hydrogen boilers could play.
3 INSIGHTS FROM COP26
SSEN hosted a number of participative events during November’s COP26 conference in Glasgow where we had an opportunity to listen directly to stakeholders and customers concerns relating to the energy transformation for net zero. Their comments illustrate the challenges of forecasting and highlight the critical role of consumers and their behaviour in the energy transformation. While the selection of their insights listed below do not form part of our formal stakeholder engagement underpinning our RIIO-ED2 Business Plan, we do believe they are a valuable reminder of the dependencies our plan has on consumers’ ability, willingness and appetite for the changes ahead. They said:
• We need to understand what people are comfortable with and what they are worried about. Smart meters were cited as an example of where expected take-up wasn’t met because of people’s concerns
• Fairness, vulnerability and the need to ‘get it right’ were discussed, otherwise people will ‘get fed up’. We need to be careful we don’t create new vulnerable groups and switch people off
• People won’t do things if they ‘perceive’ them to be difficult, so we need to understand what causes anxiety and what the barriers are
• Recognise that motivations in terms of EV ownership will differ depending on circumstances. What are the barriers to uptake?
• Consumer behaviour will continue to evolve in a way that is difficult to predict and will require further analysis

99 | Section D: Chapter Ten: Our Network as a Net Zero Enabler
CHAPTER TEN: OUR NETWORK AS A NET ZERO ENABLER
During the next decade, our electricity network will undergo its most significant structural change since the formation of the National Grid. This will require a total transformation of the way we use electricity in our everyday lives.
Our network is integral to enabling our local communities’ and wider governmental ambitions, by facilitating the decarbonisation of heat and transport and enabling the connection of low-carbon technologies (LCTs).
SUPPORTING DOCUMENTS
Load Related Plan Build and Strategy (Annex 10.1)
Connections Strategy (Annex 10.2)
DSO Strategy (Annex 11.1)
The uptake of LCTs to meet net zero could almost treble the demand on electricity networks by 2050.
Based on our DFES projections, we expect our RIIO-ED2 Business Plan will enable the timely connection of c.1.3m EVs and c.800,000 heat pumps, as well as 8GW of distributed generation and storage1, funded through baseline and uncertainty mechanisms. This will deliver £110m carbon benefits and £120m customer financial benefits, enabled by ensuring LCT customers are able to connect on time.
We know that customer expectations are constantly evolving and we will continue to provide services which customers value, expanding our digital offering to meet customers’ changing needs. We will simplify our processes to reduce the time it takes for customers to connect to our network and improve customer satisfaction.
We will scale up new and flexible approaches tested in RIIO-ED1 to connect customers and new LCTs to our network. We expect to save customers between £18.3m and £46.3m through deferred reinforcement in RIIO-ED2 and to grow flexible connections to 3.7GW of capacity across 35 zones, helping customers avoid £417.6m of reinforcement cost and offsetting 1.8mtCO2.3
Making capacity available to ensure that our network can facilitate and support net zero in a timely and efficient manner is more critical than ever. However, uncertainty regarding where and when growth will occur is likely to persist. Our plan ensures that we are fully prepared for the changes anticipated in RIIO-ED2 and beyond, remaining agile and protecting customers from unnecessary investment. We expect to fund an additional £292m through our proposed uncertainty mechanism. We are committed to working closely with our stakeholders to understand where and when to intervene on our network, enabling our communities to achieve their net zero ambitions.
87% of local authorities in our network areas have declared a climate emergency and it is vital that we support our local communities in realising their ambitions
Total investment in this chapter
Comparison to RIIO-ED12
Business Plan Data Tables
£297.9m for load-related investment on our baseline plan
£158.2mCV1, CV2, CV3, CV4, CV25
£212.3m for new connections-related reinforcement
£65.3m C2
1 Numbers are cumulative to 31 Dec 2028. 2 Comparison is to the last five years of RIIO-ED1. 2020/21 prices. 3 Includes connection-related reinforcement.
A HOLISTIC APPROACH TO ENABLING NET ZERO
Activities in this chapter interact with many other strategies and areas of our plan, as shown in Figure 10.1.
By leveraging our DSO capabilities, and exploring whole-systems solutions, we will find new ways of delivering for customers. Our load investment plans will also help avoid 6659 tCO2e through losses reduction. Our IT investment will underpin flexibility solutions, and enable us to meet changing customer expectations.
Finally, we have embedded over £11m of efficiencies into our plan through reduced asset unit rates, including savings of £5m through our optimisation across different investment drivers, creating 1,180MVA of additional capacity through our resilience activities.
Figure 10.1
OUR NETWORKAS A NET ZERO
ENABLER
StrategicInvestmentUncertaintyMechanism
Optimisationwith asset
replacement
Customerservice and IT/OT investment
DSO Flexibilityand network
visibility
WholeSystems
Sustainability

100 | Section D: Chapter Ten: Our Network as a Net Zero Enabler
ENHANCED ENGAGEMENT OVERVIEW
We engaged with 3,995 stakeholders across 63 events on Our Network as a Net Zero Enabler, and they identified the following RIIO-ED2 priorities:
1
HOW WE RESPONDED TO FEEDBACK
Facilitating EVs and Heat Pumps: Stakeholders widely recognised the importance of EV charging and heat pumps. We consider ‘Consumer Transformation’ DFES as the most credible scenario based on stakeholder discussions, with the ability to adapt our plans to deliver alternative net zero pathways. (Acceptability – 76%)
Ongoing local network plan engagement: Recognising stakeholder concerns regarding the uncertainty of future scenarios, we will ensure enhanced engagement plays a central role as our plan adapts to deliver net zero through an agile uncertainty mechanism, working closely with local communities to design local network plans.
*Enhanced Output* Distributed Generation: Network support is needed for renewable generation as well as the demand recognised in output LC1. Therefore we’ve captured this in a specific output capturing our network plans for distributed generation. (Acceptability – 83%)
End-to-end Connections Process: Stakeholders want a self-service portal to complete the whole connections process. We will integrate our CRM system with our website to deliver this.
Major Connections Customer Satisfaction: A key ask during our Connections Co-creation event was to improve access to data, which we’ll provide through our ‘Open Door and Connections+’ IT projects. Clearer capacity data and real-time updates will improve the quality of service.
Customer Satisfaction: Customers of all sizes want the best quality of service. Additional automation of the process and customer service training will contribute to increased small connection customer satisfaction.
TOP STAKEHOLDER PRIORITIES
KEY STAKEHOLDER INSIGHTS
Facilitate decarbonisation through ambitious EV and heat pump connections targets
Improve the simplicity, self-service options and the cost of the connections process
Collaborate in local area planning for net zero and adapting our DFES scenarios to local needs
79% CONSUMER ACCEPTABILITY FOR ACCELERATED PROGRESS TOWARDS A NET ZERO WORLD
Open discovery
• Several large connections customers expressed that the current application process should be simplified and made more affordable to facilitate more renewable generation connections
• Stakeholders felt that enabling net zero should be focused on providing charging points for EV rollout and enabling local communities to reach their targets
• Decarbonising heat was less of priority for RIIO-ED2 but stakeholders wanted this to be addressed
Co-creation
• Stakeholders discussed the barriers and limitations of the current connections process as well as co-created suggested improvements for RIIO-ED2, both for Major and domestic connections customers
• Local Network Plans workshops revealed a need for us to collaborate further with local energy agencies, local developers and local authorities to help develop local area energy plans
• Targeting the barriers and communication around LCTs was a key focus for stakeholders
• Government and local authorities believed consumer transformation was likely the most appropriate DFES scenario for us to adopt as our baseline
Business Plan refinement
• The WTP results showed that among customers who had interacted with the connections process, there was a high appetite for improving the process. In particular, improvements should focus on more automation, more access to data and a reduced wait time
• Increasing the new EV connections from 675,000 to 1.3m was a high priority for stakeholders in the south, and a medium priority for those in the north
• Increasing the new heat pump connections from 235,000 to 800,000 was a high priority for all customer segments, and very high for non-domestic customers in the south
Testing and acceptance
• Stakeholders widely recognised the importance of EV charging, and supported our output
• Network support is needed for renewable generation as well as the demand already recognised
• Community energy and interest groups were pleased that engaging with local groups was part of the strategy to establish local network plans to deliver a sustainable and inclusive network
• Making the connections process easier and providing a full-function, self-service process was a high priority for over a third of stakeholders
to August 2020
Feb 21 – Jun 21
Aug 20 – Feb 21
Jun 21 – Dec 21
*Enhanced Output* – This denotes a change in ambition or scope in the output between our draft and final plan.

101 | Section D: Chapter Ten: Our Network as a Net Zero Enabler
OUTPUTS AND AIMS2
Output Type Target Consumer benefitCosts in our baseline plan
OVERARCHING AMBITION
Enabling LCT connections
SSEN AimReady the network for net zero, consistent with up to 1.3m electric vehicles and up to 800,000 heat pumps connecting by 2028.
£100m carbon benefits and £112m customer financial benefits over RIIO-ED2, enabled by ensuring LCT customers are able to connect on time.
£510.2m baseline load and connections-driven reinforcements with additional uncertainty mechanism funding in period*
Enabling LCT connections
SSEN Aim
Ready the network for net zero, consistent with a total of 8GW of distributed energy resource (including windfarms, solar, and energy storage) connecting by 2028.
CONNECTIONS
Improving our connections process
SSEN Aim
Improve the end-to-end process (application, design, quote and connection) for all our connections and introduce automated quotation services for domestic LCT and minor connections customers by 2025.
Our Open Door and Connections+ IT projects will provide more granular detail on our available capacity and real-time updates on network load.
£4.6m cost efficiency benefits delivered over RIIO-ED2.
£3.8m additional societal benefits delivered to connections customers through saved time and increased satisfaction. These benefits are attributable to the last 2 years of RIIO-ED2 once the improved process is in place. We expect these benefits to be ongoing beyond RIIO-ED2.
£10.8m
Major connections strategy
LO, ODI-F
Deliver high quality services to our major connections customers, achieving a customer satisfaction of 9/10 or above by the end of RIIO-ED2.
Major connection customers provided with tailored services thanks to more flexible connection options and enhanced communication throughout the connections process.
Customer satisfaction survey (minor connections)
ODI-FAchieve an average customer satisfaction score for connections of at least 9.2.
Improved customer service and satisfaction.
Connections Time to Quote and to Connect (minor connections)
ODI-FBy 2028 meet our targets and further reduce average Time to Connect by 1 day in SHEPD and 2 days in SEPD compared to 2019/20.
Faster access to LCT. Incremental
Connections Guaranteed Standards of Performance (GSOP)
LOMeet our obligations under GSOPs for connections on an ongoing basis and aim to reduce the number of failures over the period.
Customers receive guaranteed levels of performance for connections services.
n/a
LO: Licence Obligation; PCD: Price Control Deliverable; ODI: Output Delivery Incentive (F: Financial, R: Reputational), CVP: Consumer Value Proposition; SSEN Aim: Company Goal
TAKING A FLEXIBILITY FIRST APPROACH
By taking a flexibility first approach, we will be able to accommodate the growth in LCTs and support the changing way our customers use our network, with our retained focus on efficiently delivering the pathway to net zero.
Procuring flexibility services is a smart way to manage network capacity, by allowing us to delay investment decisions in reinforcement to meet demand. This provides the benefit of deferred capital expenditure and it allows us to wait for more certainty of the need for network capacity before investing in reinforcement, thereby reducing the risk of long-life stranded assets. Flexibility also enables us to improve the efficiency of the existing network through increased levels of utilisation.
We expect to save customers between £18.3m and £46.3m by using flexibility markets to address Constrained Managed Zones (CMZ). We plan to grow flexible connections to 3.7GW of capacity across 35 zones, helping customers avoid £417.6m of reinforcement cost and offsetting 1.8mtCO2e.
* This forms part of our ex-ante baseline funding request and includes £212m of connections-related reinforcement in Business Plan Data Table C2. UM funding is expected to be required for delivery of the outputs.

102 | Section D: Chapter Ten: Our Network as a Net Zero Enabler
OUR INVESTMENT PLAN FOR NET ZERO
3.1 Overview
We have primarily based our RIIO-ED2 business plan baseline on System Transformation, with additional expenditure based on Consumer Transformation to ensure that we are ready to deliver on all possible credible net zero pathways. Figure 10.2 below explains what this means in practice for our Business Plan.
Our total baseline ask of £298m is made up of:
• EHV expenditure required under System Transformation for the full five years
• HV and LV expenditure required under System Transformation for the first two years
• Futureproofing spend, ensuring we do not foreclose any credible net zero pathways, based on Consumer Transformation for the first two years (EHV, HV and LV)
Uncertainty mechanisms will enable us to align our investment with Consumer Transformation, our most credible scenario, by funding:
• HV and LV expenditure required for the last three years of RIIO-ED2, recognising significant uncertainty in the exact location of investments and shorter lead times associated with HV and LV activities
• Additional expenditure required to deliver Consumer Transformation (or any other credible alternative net zero pathway) in years three to five
Our approach is in line with Ofgem’s minimum requirements and steer that DNOs should maximise the use of uncertainty mechanisms in order to protect customers from forecasting uncertainties.
3S
pe
nd
(£m
)
0
100
Year 1 Year 2 Year 3 Year 4 Year 5
200
300
400
500
600
Our likely requirement based on Consumer Transformation throughout the ED2 period
Our additional HV/LV highly certain expenditure
Future proofing expenditure - Consumer Transformation requirements for Year 1 and Year 2
Minimum requirements based on System Transformation
Our total requirement, baseline + uncertainty
The proportion of ex-ante baseline funding request that is not required under ST but ensures that we can meet longer term needs of CT
The additional requirement if CT arises - funded by UM
Total expected funding - £538m - if CT materialises throughout RIIO-ED2
The highly likely additional spending for HV/LV in years 3-5 not requested in the baseline - funded through UM
Total ex-ante baseline funding request, £298m
Expected Totex requirement £350m
Figure 10.2
TYPES OF LOAD-RELATED INVESTMENT:
• Primary network interventions – resolving capacity constraints at 33kV and above, i.e. Extra High Voltage (EHV).
• Secondary network interventions – resolving capacity constraints at Low Voltage (LV) and High Voltage (HV).
• Fault-level interventions – replace equipment when the rated fault level they can withstand is no longer adequate.
• New transmission capacity charges – increased capacity at transmission connection points or new connections.
CT: Consumer Transformation
ST: System Transformation
UM: Uncertainty Mechanism
RANGE OF POTENTIAL LOAD RELATED EXPENDITURE IN RIIO-ED2

103 | Section D: Chapter Ten: Our Network as a Net Zero Enabler
3.2 Track record
Our Track Record (Chapter 2) provides full details of performance against key RIIO-ED1 outputs and cost categories, including additional detail on our load-related spend.
3.2.1 Transitioning to RIIO-ED2
We have seen an increase in recent years in the number of LCTs connecting to our network. As highlighted in Our Forecasting and Future Energy Scenarios (Chapter 9), our DFES demonstrates that this trend will continue into RIIO-ED2 and beyond, with the pace and scale of change only set to accelerate in the context of our governments’ net zero targets and COP26.
a. Understanding peak demandWe are seeing an increase in customers seeking to connect to our network. This is changing our networks’ peak demand requirements and we expect this trend to continue. Figure 10.3 below shows our forward view of combined ‘network-wide’ peak demand across SEPD and SHEPD for all four DFES scenarios in 2020 and 2021, and also for a relevant Committee on Climate Change (CCC) scenario.
Our analysis shows that the peak demand at the end of RIIO-ED2 – even in the most aggressive scenario shown (CCC Widespread Engagement) – is realised by the most conservative scenario (DFES 2021 System Transformation) before the end of RIIO-ED3. It is, therefore, more a case of when the demand will be met, rather than if it will be met.
Investments in RIIO-ED2 are at a very low risk of being stranded for the foreseeable future, with LCT uptake under all credible scenarios expected to deliver the demand levels currently anticipated in the network planning time horizon. Moreover, if we are to ensure that we can facilitate credible net zero pathways it is both prudent and efficient for us to plan and invest now for this projected outcome.
DEPLOYING FLEXIBILITY IN RIIO-ED1
During RIIO-ED1, we achieved significant benefits for our customers through flexibility solutions such as Active Network Management (ANM) and Constraint Managed Zones (CMZ). Overall, we have delivered savings of around £60m in deferred reinforcement through our CMZ (flexibility procurement) and ANM schemes:
• We have contracted in excess of 468MW of flexibility services delivering an operational saving of £251k and avoiding 3,250tCO2e.
• The use of flexible connections (ANM) has enabled 679GWhr of renewable energy onto the network and avoided £58m of network reinforcement, saving customers 90.6 years of connections delays.
These benefits have been predominantly focused on the connection of generation, but it is already becoming clear that flexible connections for LCTs, such as public EV charging infrastructure, will be even more valuable.
Cost area Forecast position at end of RIIO-ED1
Load-related expenditure
We are forecasting to spend 71% or more of our load-related allowance across SHEPD and SEPD as a result of three key factors:
• Lower than anticipated peak load: driven by slower economic growth, the roll-out of domestic energy efficiency, offsetting of demand by distributed generation (DG).
• Innovative solution: we have been able to use innovative solutions such as flexibility and Active Network Management (ANM) schemes to reduce the costs of managing load and generation increases (see below).
• Lower than anticipated transmission reinforcement: very little transmission reinforcement has been triggered by our DG connections and we have used ANM schemes to help mitigate constraint costs for customers.
Figure 10.3: Forward view of network-wide peak demand (SEPD and SHEPD)
DFES 2021 figures are preliminary; final numbers are due January 2022
7,500
8.500
9,500
10,500
11,500
12,500
13,500
14,500
15,500
2021 2022 2023 2024 2025 2026 2027 2028 2029 2030 2031 2032 2033
MW
2020 Consumer Transformation 2020 Leading the Way 2020 Steady Progression 2020 System Transformation 2020 CCC Widespread Engagement
2021 Consumer Transformation 2021 Leading the Way 2021 Steady Progression 2021 System Transformation
RIIO-ED2 RIIO-ED3

104 | Section D: Chapter Ten: Our Network as a Net Zero Enabler
Network-wide peak demand is measured at the Grid Supply Point (GSP) level. While this may provide some indication of overall demand at the highest voltage levels in our network, it does not correlate strongly with the overall capacity needs and, therefore, the load-related expenditure requirement, of our network. This is particularly the case at the lower-voltage levels (e.g. HV and LV) where we are anticipating significant increase in the number of LCT connections – both distributed generation and demand. This ‘disconnect’ between GSP maximum demand and capacity needs of the lower voltage networks, will continue to diverge as we move towards DSO, more distributed generation and local balancing of generation and demand.
b. Utilisation on our network at the start of RIIO-ED1 and implications for our RIIO-ED2 planNetwork utilisation helps us understand how our network is performing for consumers. It is a measure of peak loading on assets. Low levels of network utilisation might suggest that the network can be used more efficiently, whereas high levels of network utilisation can indicate that the network may not be able to meet demand, with increased risks of faults and impact on reliability. It is important to know that there are different drivers of intervention:
constraints on networks can be driven by other factors like fault level and voltage issues that mean circuits and substations may require additional capacity to remain compliant.
When demand increases we will, in the first instance, make greater use of our existing assets by procuring flexibility services. This will increase capacity utilisation and ensure that a greater percentage of our assets will be more fully utilised on the network.
Figures 10.4 and 10.5 below illustrate our current network utilisation at primary and secondary network levels, and how utilisation is likely to evolve with and without intervention during RIIO-ED2. This is based on our baseline plan and we will use our proposed uncertainty mechanisms to address residual overloads on our network.
At primary network level, we use the existing Load Index framework to assess loading. At secondary level, we use a combination of analytics and LV monitoring to determine utilisation. Our Network Visibility Strategy underpins our approach to ensuring 100% visibility of power flows on all levels of our network, through a combination of LV monitoring, smart meter data and data analytics. More information on our utilisation analysis is available in our Load Related Plan Build and Strategy (Annex 10.1).
Figure 10.4: Number of primary sites in each of the load index ranking groups before and after intervention
Figure 10.5: Utilisation of secondary assets with and without intervention
10
20
30
40
50
60
70
80
25-3
0%
35-4
0%
45-50
%
55-6
0%
65-70
%
75-8
0%
85-90%
95-10
0%
105-
110%
115-
120%
125-
130%
LOAD DISTRIBUTION OF PRIMARY SITES IN 2028 WITH INTERVENTION
0
10
20
30
40
50
60
70
80
90
25-3
0%
35-4
0%
45-50
%
55-6
0%
65-70
%
75-8
0%
85-90%
95-10
0%
105-
110%
115-
120%
125-
130%
LOAD DISTRIBUTION OF PRIMARY SITES IN 2021
LOAD DISTRIBUTION OF PRIMARY SITES IN 2028, NO INTERVENTION
Assets to right ofhere beyond
nameplate capacity
0
Increasedutilisation ofexisting sites
10
20
30
40
50
60
70
80
25-3
0%
35-4
0%
45-50
%
55-6
0%
65-70
%
75-8
0%
85-90%
95-10
0%
105-
110%
115-
120%
125-
130%
0
Lower countsof extremeoverloads
5,000
10,000
15,000
20,000
25,000
0-20%
20-4
0%
40-60%
60-80%
80-100%
100-1
20%
>120
%
LOAD DISTRIBUTION OFSECONDARY SITES IN 2021
Lower countsof extremeoverloads
0
5,000
10,000
15,000
20,000
25,000
0-20%
20-4
0%
40-60%
60-80%
80-100%
100-1
20%
>120
%
LOAD DISTRIBUTION OF SECONDARYSITES IN 2028, NO INTERVENTION
0
Increased utilisation of existing sites
5,000
10,000
15,000
20,000
25,000
0-20%
20-4
0%
40-60%
60-80%
80-100%
100-1
20%
>120
%
LOAD DISTRIBUTION OF SECONDARYSITES IN 2028 WITH INTERVENTION
0
Lower countsof extremeoverloads
3.3 Our overarching approach to planning load-related investment for RIIO-ED2
We have followed a robust four-step process to develop our load-related investment plan, shown below. This is consistent with the approach outlined by Ofgem for use across all network companies.
INDUSTRY PLANNING & DESIGN STANDARDS P2/7, ESQCR, G99, G100
STAKEHOLDERS’ VIEWS AND PRIORITIES
RIIO-ED2 BUSINESS PLANNING GUIDANCE
CODES AND REGULATIONS – GRID CODE, LICENCE CONDITIONS
LOCAL AND NATIONAL GOVERNMENT POLICY
Co-creating scenarios with stakeholders
Generating network requirements and options
Optioneering for an efficient plan
Efficiently funding the plan

105 | Section D: Chapter Ten: Our Network as a Net Zero Enabler
3.3.1 Generating network requirements and options
A comprehensive understanding of constraints on the network driven by changes in the peak is critical to making the right investments and allows us to set out options to manage through CBA analysis.
The process of identifying constraints involves a significant number of power system studies and detailed analysis from our machine learning insights. We must study customer needs today and consider their future requirements and ensure no adverse impacts on network reliability or asset health. We must also ensure our compliance with industry security planning standard P2/7 and other related regulations.
We have undertaken detailed scenario-based load-flow modelling for all identified constraints on our primary (EHV) network. This enables us to check for compliance with planning security standards. We modelled scenarios over multiple years to understand how the constraints and solution costs change over time.
The vast number of assets on the secondary network makes it inefficient to measure and monitor all parts of the network using the same approach we take on the higher-voltage primary network,
nor to undertake detailed individual power flow studies. Instead, we have used a data-led ‘hotspot’ technique which compares an analytically derived peak demand with the asset-rated capacity. For HV feeders, this has enabled identification of assets requiring a more detailed load flow study. For LV circuits and transformers, this has allowed us to identify candidates for asset replacement.
Figures 10.7 and 10.8 show the total occurrences of constraints on our network for all four DFES scenarios across our networks over RIIO-ED2. These show potential issues arising for each scenario, although the more aggressive demand growth in Consumer Transformation (CT) and Leading the Way (LtW) means they have more additional issues in the later years than Steady Progress (SP) and System Transformation (ST). However, these scenarios would likely encounter the same constraints as demand growth accelerates in the 2030s. These constraints were then subject to engineering analysis and optioneering (see Optioneering for an efficient plan below) including the application of flexibility and RIIO-ED1 innovations to ensure that the requirement for intervention was robustly understood and fulfilled.
3.3.2 Optioneering for an efficient plan
It is important to undertake in-depth consideration of the various alternatives and options to find the best solution for customers. We call this process ‘optioneering’. Without optioneering, the costs to consumers of managing constraints would be high. Figure 10.9 shows how we have been able to reduce these costs significantly (by c.43%) through optioneering and moving some of the costs to uncertainty mechanisms. Cost Benefit Analysis (CBA) sits at the centre of our optioneering process, and we have made use of Ofgem and ENA standard models for this. At secondary voltages and where the highest investments option assessed did not exceed £2m we have used other optioneering techniques as outlined in our Load Related Plan Build and Strategy (Annex 10.1) and in line with Ofgem’s guidance documents.
The Ofgem CBA model and CEM toolFor the purpose of investment justification, two standard industry tools have been used to ensure a consistent approach and alignment of our submission with other DNOs. The use of standard tools also provides confidence that the underlying economic assumptions are reasonable and robust.
We use two models when assessing use of flexibility in our plan. We firstly assess all conventional (constructed) solutions using Ofgem’s standard RIIO-ED2 cost-benefit analysis (CBA) template.
Figure 10.7: Build-up of primary constraints on our networks
BUILD UP OF PRIMARY CONSTRAINTS
RIIO-ED2 Year
2024 2025 2026 2027 20280
5
10
15
20
25
30
35
40
45
50
Nu
mb
er
of
con
stra
ints
ide
nti
fie
d
SP ST CT LTW
Figure 10.8: Build-up of secondary constraints on our networks
BUILD UP OF SECONDARY CONSTRAINTS
0
400
350
300
250
200
150
100
50
Scenario
Co
nst
rain
ed c
ircu
it (k
m)
SP STCT LTW
0
700
600
500
400
300
200
100
Co
st (£
m)
Optioneered Baseline planCT – first pass view
Primary Secondary Fault Level NTCC
Figure 10.9: Comparison between our optioneered plan and our baseline plan
OPTIONEERED PLAN VS FIRST PASS VIEW

106 | Section D: Chapter Ten: Our Network as a Net Zero Enabler
CBAs are a key tool for building efficiency into our plan; they demonstrate that multiple options have been considered, and that the selected option drives the most value for consumers through the benefits it delivers against the cost incurred. The CBA tool monetises relevant benefits, nets them against investment costs, and appropriately amortises and discounts the cost and benefit streams to arrive at a Net Present Value (NPV) of each solution.
Alongside using Ofgem’s CBA tool we have applied the Common Evaluation Methodology (CEM) tool developed through the Electricity Networks Association (ENA) for making decisions about employing flexibility on our network.
Sensitivity analysis Growth in LCT is a key assumption underpinning our plan, but it is impossible to know for certain the volume of LCTs we will experience over RIIO-ED2. Sensitivity analyses demonstrate how significantly our plan would change if we altered some of our underpinning assumptions and help stakeholders understand the different futures that could result from different scenarios.
We have tested the impact and investment needed across our secondary network with significantly higher and lower assumed volumes of LCT using assumptions which are consistent with ‘Widespread Engagement’, the most ambitious CCC scenario this decade.
Under Widespread Engagement, demand growth on an LV feeder could rise by 16% in 2028, with 75% of homes charging an EV and 50% using a heat pump. This compares to 25% of homes using an EV in 2028 under our chosen DFES scenario Consumer Transformation. This is illustrated in Figure 10.11 below. If Widespread Engagement becomes reality, this would result in a 36% increase in costs on our secondary network, as illustrated in Figure 10.12 below. The chart also shows the reduced cost impact of 11% fewer EVs than anticipated in the Consumer Transformation scenario. We describe the full suite of sensitivity analysis undertaken in our Load Related Plan Build and Strategy (Annex 10.1).
The most economic conventional solution is identified and then compared to a flexibility option using the CEM, which is used to capture and assess the potential value generated from flexibility. The CEM tool is a standard approach to making decisions about the use of flexibility to defer capital expenditure. Full guidance on the tool and how it calculates benefits is available at the ENA website.4
THE ENA CEM
To standardise our approach and embed consistency and transparency, SSEN utilises the Common Evaluation Methodology (CEM) to complete analysis and justification between flexibility and conventional reinforcement. The CEM is a product of the Open Networks Project, designed specifically to assess the optimum deployment of flexibility and conventional reinforcement through the modelling and evaluation of a range of options.
The tool is based on Ofgem’s RIIO ED1 Cost Benefit Analysis and allows DNOs to use the same tool in identifying the most cost-effective solution to network growth scenarios. The Open Networks project continues to refine and expand the CEM tool in RIIO-ED1 with newer iterations expected to better model the value of optionality as well as expanding the options/scenarios which can be modelled.
Figure 10.10: Hybrid CBA-CEM approach to compare flexibility to conventional solutions
Our methodology to calculate the benefits of flexibility at HV and LV analyses the LCT and consequent peak-demand growth from each DFES scenario. For each of our LV/HV assets, we assess the network utilisation over time and analyse the potential peak demand reduction from LV and HV flexibility across five different sources (smart charging, Vehicle to Grid, flexible heat pumps, ToU tariffs and energy efficiency interventions).
ASSESS ALL NON-FLEXIBILITY OPTIONS WITHIN RIIO-ED2 CBA TEMPLATE, IN LINE WITH BUSINESS PLANNING GUIDANCE
TAKE BEST CONVENTIONAL OPTION (HIGHEST NPV UNLESS EJP DETAILS RATIONALE BEHIND DEVIATING)
ANALYSE FLEXIBILITY OPTIONS AGAINST THIS CONVENTIONAL OPTION TO DETERMINE HOW MUCH VALUE IS AVAILABLE FROM DEFERRAL USING COMMON
EVALUATION METHODOLOGY TOOL
USING FLEXIBILITY TO ADDRESS LOAD-MANAGED AREAS (LMA)
LMA is a legacy system used to manage network capacity in the SHEPD licence area. LMAs reduce the maximum demand on circuits and at substations by controlling customer space heating and water heating load at different times during the day and night via Long Wave Radio Tele-Switching (RTS). LMAs cover approximately 93,000 customers in rural areas. They were historically introduced as an alternative to traditional reinforcement in rural parts of the network where costs are prohibitively expensive.
Our approach in RIIO-ED2 will be to use market flexibility services to replace LMA-mandated switching patterns – including activities to define, develop and stimulate the market – alongside, and in accordance with, development and facilitation of flexibility markets to support DSO.
Solutions to provide additional capacity to support the uptake of LCT will be co-optimised with those to remove LMA restrictions – using the principle of ‘flexibility first’ We will also ensure that other reinforcement or flexibility procurement for other (non-LCT) needs or requirements provides for LMA removal, as a matter of course.
It is anticipated that the load-related investment in RIIO-ED2 will ease or lift around 30% of the LMA restrictions by the end of the RIIO-ED2 period, with the potential for up to 50% of restrictions lifted if higher levels of LCT materialise. The aim is to remove all remaining LMA restrictions during the RIIO-ED3 period.
More detail on our proposed approach to removal of LMA restrictions is provided in Load Related Plan Build and Strategy (Appendix C of Annex 10.1).
4 https://www.energynetworks.org/industry-hub/resource-library/?search=Common+evaluation+methodology&id=267

107 | Section D: Chapter Ten: Our Network as a Net Zero Enabler
Figure 10.11: Sensitivity analysis results
AN LV FEEDER WITH HIGH LCT PENETRATION EQUIVALENT TO WIDESPREAD ENGAGEMENT
0
1 4 7 10 13 16 19 22 25 28 31 34 37 40 43 46
10
20
30
40
50
60
Load
ing
(kW
)
Base EVs, 3 in 4 houses
CT peakHPs, 1 in 2 houses
Clustering of technologies on feeders leads to a 16% increase in the peak over CT
Figure 10.12: Secondary network impact sensitivities
SECONDARY ASSET MONETISED IMPACT SENSITIVITIES
Co
st (£
m)
Scenario
-10% LCT Impact on Consumer
Transformation
Consumer Transformation
Widespread Engagement
0
20
40
60
80
100
140
120
160 +36%-11%
3.3.4 Efficiently funding our load-related plan
Our proposed load-related expenditure is captured in the following three categories5 as a means of describing our proposal for efficient funding:
These different categories are illustrated in Figure 10.13.
Category Description Baseline plan UM-funded
CATEGORY 1 – BUSINESS AS USUAL SPEND
Category 1aEHV schemes required under System Transformation
HV and LV schemes required under System Transformation in first two years of RIIO-ED2
Category 1bHV and LV schemes required under System Transformation in remaining three years of RIIO-ED2, due to uncertainty of exact location and shorter lead times
CATEGORY 2 – ENSURING NO FUTURE PATHWAY IS FORECLOSED
Category 2Expenditure required under Consumer Transformation for the first two years of RIIO-ED2 to ensure we do not foreclose credible net zero pathways
CATEGORY 3 – EXPENDITURE LIKELY TO BE REQUIRED UNDER CREDIBLE SCENARIOS
Category 3Expenditure which will most likely be needed if our forecasts for a credible Consumer Transformation scenario materialise
600
500
400
300
200
100
Sp
en
d (£
m)
Spend categories
0
5 The three categories of load-related expenditure have been set out as a requirement by Ofgem.
Figure 10.13: Categories of load-related expenditure
Category 1a
Our ex-ante request
Category 1b
our highly certain requirement
Category 2
CT spend (Baseline) in ED2 which is above
lower bound
Category 3
Additional spending we’d need to meet
upper bound
Total
Which sums back to overall baseline
request
Category 1a and 2 sum to our ex-ante baseline allowance, £297.9m

AN AGILE AND STAKEHOLDER-LED APPROACH TO UNCERTAINTY MECHANISMS
Our assumptions can quickly change, driven by policy developments, market conditions, consumer behaviour and technological advances. It is therefore vital to have an agile and adaptive regulatory framework which can adjust the level of total expenditure in RIIO-ED2 to accommodate changes in external influencing factors.
During RIIO-ED1, the Green Recovery mechanism demonstrated the benefits of an agile and stakeholder-led approach to funding net zero.6 The ever-increasing pace of change and the risks slowing down net zero mean Ofgem, our regulator, needs to take a different approach, allowing networks to act as enabler.
Learning from this experience, for RIIO-ED2, we have developed an automatic uncertainty mechanism designed to enable net zero investment in our network, including investing proactively where this is supported by robust evidence, while protecting customers from unnecessary cost increases.
Our detailed proposals are available in Load Related Plan Build and Strategy (Annex 10.1), and include a strong focus on robust and stakeholder-driven decision-making:
108 | Section D: Chapter Ten: Our Network as a Net Zero Enabler
Clear robust and transparent methodologies underpinning
our decision-making processes, which can be challenged by Ofgem and our stakeholders
Highly accurate unit costs agreed upfront for all types
of intervention
Investing at the right time based on evidence and
credible lead times
Deploying the right solutions to address requirements,
prioritising flexibility, whole-systems and innovation
where appropriate
Stakeholder-led process to update our best view of
future requirements
Iterative scenario analysis to understand how changes
in our best view impact the network
FACILITATING TIMELY CONNECTIONS TO OUR NETWORK
The need for additional capacity on our network to support net zero over the next decade is inherently linked to greater use of existing connections and an increase in the number of new connections.
The connections pipeline forms part of the planning cycle which triggers the Strategic Investment UM; this ensures adequate network capacity can be created by flexibility support for these connections.
For example, between now and 2028 we could see a significant increase in the number of connection applications for domestic EV chargers. This step-change in customer need requires a clear and ambitious approach to delivering connections. We will find new ways of connecting customers faster and at lower costs. Flexible solutions such as Active Network Management (ANM) will drive significant benefits. Our plan is to grow flexible connections to 3.7GW of capacity across 35 zones helping customers avoid £417.6m of reinforcement cost and offsetting 1.8mtCO2.
4.1 Track record4.1.1 Outputs performance
We have performed well overall against our connections outputs, recognising the additional challenges brought by the Covid-19 pandemic.
4
6 https://www.ofgem.gov.uk/publications/decision-riio-ed1-green-recovery-scheme
Output Performance Status rating
Time to Quote/ Time to Connect
We have delivered a 9% improvement in our Customer Satisfaction Survey score for connections, a 0.5% increase in Time to Quote and a 6% reduction in Time to Connect.
ICE Over the RIIO-ED1 period, we have met the requirements of ICE, and have not received any penalty during the period. In 2020/21, we delivered on 27 commitments which focused on information provision, application and quote acceptance, competition in connections, delivery and collaboration and engagement.
Connections Guaranteed Standards of Performance
We have performed well under Connections Guaranteed Standards of Performance through the RIIO-ED1 period, with less than 1% of standards not being met in most years. This increased slightly in 2018/19, however an initiative set-up to target a backlog of unmetered faults and repairs in SSES in 2018/19 resulted in a substantial reduction in failures the following year.

109 | Section D: Chapter Ten: Our Network as a Net Zero Enabler
4.1.2 Transitioning to RIIO-ED2
We will continue building on our strong foundations, noting that Covid-19 may have a short-lived impact on levels of performance. We know that customer needs and expectations are changing as more customers interact with our network in different ways.
Our Business Plan ensures we are ready for this step-change. Our approach to improving our customers’ connection experience should be understood in the wider context of the changes we are bringing in for RIIO-ED2. As already noted, our overarching customer strategy will help deliver significant improvement in
the customer journey, while our approach to enhancing our digital offering is in line with our digitalisation strategy. Our strategy will also be underpinned by targeted IT investment in key systems, which are further explained in IT and Digitalisation (Chapter 5).
We will use both enhanced data provision and innovative solutions where possible to help our customers connect more quickly and cost-effectively, and to reduce the amount of reinforcement required on our network.
4.2 Our strategy for minor connections
Minor connections can include up to four new domestic connections, alterations to existing connections, as well as smaller commercial connections. For example, customers seeking to connect a new EV or heat pump will typically be classified as a minor connection. Our detailed minor connections strategy is in our Connections Strategy (Annex 10.2).
Our Customer Experience Strategy (Annex 4.1), will be central to improving our customers’ connection journey. We will introduce new minor connections hubs to provide a more tailored and localised service, from design through to on-going support and delivery. We recognise that many customers will be new and less familiar with our processes. We will also enhance our digital services, in direct response to customer and stakeholder feedback, and in line with the overall direction as set out in our digitalisation strategy. We will build on the improvements and enhancements made to our services to date.
In particular, our Connections+ project will provide an enhanced connections process through our web portal, from application through to payment and completion of works survey. For example, we will introduce:
• A new website with improved functionality and user interfaces
• Clear and simple videos, flow-charts and FAQ documents that clearly set out the customer journey for each type of connection
• Estimated project timelines, major milestones and automatic notification of progress updates
Our strategy for RIIO-ED2 will help ensure we provide enhanced levels of services which meet customers’ changing needs and expectations. We are targeting improvements to our average Time to Connect of 1-2 days, and an average customer satisfaction score for connections of at least 9.2. These improvements will require a combination of incremental changes to our existing processes and targeted IT investment as part of our overall customer strategy, as outlined in our Connections Strategy (Annex 10.2). They will deliver £4.6m cost efficiency benefits and £3.8m additional societal benefits delivered through saved time and increased satisfaction. These benefits are attributable to the last two years of RIIO-ED2 once the improved process is in place. We expect these benefits to be ongoing beyond RIIO-ED2.
USING INNOVATIVE SOLUTIONS TO HELP CUSTOMERS CONNECT FASTER
Our South West Active Network Project (SWAN) is an example of whole-system working, where we are delivering a solution to a transmission constraint, enabling the rapid connection of renewable generation to the network using flexibility.
National Grid Electricity Transmission has confirmed an ANM is the only viable solution to meet the requirements of any additional generation connections over 1MW. The alternative transmission reinforcement would cost electricity customers in excess of £500m, against our budget of £5.2m for our investment and (current) customer contributions for the ANM scheme.
We will develop our suite of flexible connections offerings throughout RIIO-ED2 to extend these options to more customers.
ENGAGEMENT, FEEDBACK, ACTION
Domestic and microgeneration customers told us our existing connections processes felt ‘pre-digital’ and unlikely to be adequate for the expected surge in EV and LCT connection numbers.
Based on their wider experience of customer service solutions, such as home insurance claims, their ‘default’ expectation was that they wanted a self-service portal in which they could register their project and get an instant reference number, upload necessary documents, access real-time assessments of the local infrastructure and track progress. In addition to these needs, installers also want to see all of their applications in one place.
This detailed feedback underpins our commitment to Connections+, a project that will enable customers to request various types of small connections (including domestic EV charge points and domestic heat pumps) via an online portal. Developed through RIIO-ED2, Connections+ will eventually provide a seamless route from design to payment for the majority of the increased volume of straightforward connections expected.

110 | Section D: Chapter Ten: Our Network as a Net Zero Enabler
4.3 Our strategy for major connections
Our major connections strategy is based around three key principles and designed to drive improvements in our services to meet the specific needs of our major connections customers. Our full strategy and further information on how we will improve our services for major customers is available in our Connections Strategy (Annex 10.2). Our strategy has been co-created with customers and stakeholders and meets Ofgem minimum requirements.
4.4 Enabling investments
Based on current charging rules, we are proposing £212.3m to enable specific new customer connections and increases in demand from existing customers over RIIO-ED2, after customer contributions and adjustments have been taken into account (£53m in the north and £159.3m in the south). Without any customer contributions, this would amount to a total cost of £288.5m (£81.3m in the north and £207.3m in the south).
In line with discussions with Ofgem and other DNOs, we are proposing to socialise the costs associated with all works required to enable domestic load increases for existing connections, for example EVs and heat pumps. This approach increases the cost in activities funded by the wider customer base of approximately £22m.
Principle What customers have asked for What we will deliver
PRINCIPLE 1
Support connection stakeholders prior to making a connections application by providing accurate, comprehensive and user-friendly information
Our customers have asked for enhanced information that will empower them to make informed decisions about their connection and understand what is expected of them throughout the process.
• Clear and simple guidance on our connections processes with enhanced availability of network data and information to allow more informed decisions
• Continued stakeholder and customer engagement and help through a number of support channels
• Improved information on the costs associated with each type of connections offer and the impact that any changes may have
PRINCIPLE 2
Deliver value for customers by ensuring simplicity and transparency through the applications process
Our customers have asked for better information and communications, and a streamlined process for receiving updates.
• Online applications for all types of connections
• Improved website and customer portals that allow payments, project tracking and fully digital quotation information
• Increased flexible connection options and improved guidance throughout the design process of how customers can amend their application to reduce the time and cost to connect
• Improved Time to Quote timescales for all Major Connections Customer segments
PRINCIPLE 3
Facilitate the delivery of timely and economical connections that meet customers’ needs
Our customers have asked for single points of contact in the delivery teams, better communication and project updates, timely project closure and cost reconciliation, and better management of contracted capacity
• Improved website and customer portals that allow automated notification and easy access to project updates
• Single points of contact within our delivery teams
• Communicate at an early stage any cost implications of customer change requests
• Timely project closure and any cost reconciliations
• Implementation of improved queue management processes to release capacity not being used
IMPACT OF ACCESS SCR
Earlier this year, Ofgem consulted on changes to charging rules, referred to as the Access Significant Code Review (Access SCR).
They explored several changes that will have a significant impact on how we recover costs for work undertaken in RIIO-ED2. For example, one proposal reduces the proportion of costs borne by connecting customers. These costs would be socialised across our wider customer base rather than picked up by individual connecting customers, changing what is known as the connections boundary.
Ofgem has yet to reach a decision on Access SCR. As such, and in line with guidance, we have not reflected cost impacts in our business plan baseline. Appendix E in our Connections Strategy (Annex 10.2), includes further details on how we have modelled the potential impact. Due to the uncertainty around the impacts on customer behaviour, we have modelled in our best view only on the change in connection boundary. Our high-impact view considers this to be one of the regulatory changes required to meet net zero targets. The exact impact of any future decision on customer behaviours and costs will remain uncertain for some time and reinforces the need for an agile and flexible approach to funding activities.

111 | Section D: Chapter Ten: Our Network as a Net Zero Enabler
DELIVERABILITY
Ensuring our network will be ready for net zero requires a step change in our approach to deliverability.
5.1 Flexibility
Flexibility will play a key role. Having assessed the options available to address network constraints we will prioritise flexibility as a means to defer the investment and reduce costs to consumers during the period. Flexibility delivers wider value by enabling customers to connect more quickly and reduce carbon emissions. Even in cases where the outcome of a CBA suggests construction, we will use Flexibility First where appropriate. This enables a balancing (smoothing) of the capital delivery profile for our major project portfolio which will realise efficiencies in the cost of delivery.
We estimate that the additional cost of flexibility to achieve this will be compensated for by benefits associated with the avoidance of a peak capital workload in the first years of RIIO-ED2. This additional flexibility cost is therefore excluded from proposed load-related schemes costs and from the proposed Business Plan entirely. Using flexibility in this way will also deliver optionality (‘wait and see’) benefits. Details of where this flexible approach has been applied are provided in individual Engineering Justification Papers (EJP), and our overall delivery profile reflects where we have used flexibility in this way.
5.2 Digitalisation
We expect to see significant increases in the number of connections coming forward as greater numbers of customers seek to connect their LCTs. Our IT and Digitalisation (Chapter 5), will be instrumental in ensuring we are able to manage increases in connection requests while continuing to deliver excellent levels of service that meet customer expectations.
5.3 Managing project delivery lead times
A key characteristic of our strategic approach is that investment is only triggered when delivery lead times make commencement of the work critical to delivering a solution at the time needed; or when advancing the work can realise an efficiency gain, or avoid the added cost of a delivery constraint. Figure 10.14 shows the importance of project delivery lead times in the context of addressing network needs.
5
Figure 10.14: The relationship between delivery lead times and investment decision-making. Please see Deliverability Strategy (Annex 16.1)
PLANNING YEAR1 YEAR AHEAD
2 YEARS AHEAD
3 YEARS AHEAD
4 YEARS + AHEAD
We are transforming our commercial and supply-chain strategy to deliver the step-change in performance required. We will be accommodating forecast connections and load-related volumes in our workbank programmes to optimise delivery across investment drivers, minimising disruption to consumers and to ensure we have contracting strategies with the flexibility to efficiently support delivery. Collectively, these investments and strategic changes will allow us to deliver ongoing stretch efficiencies throughout RIIO-ED2 of 0.7% per annum (as set out in Costs and Efficiency (Chapter 15). We have incorporated efficiencies of £11m into our load-unit rates, similar to the asset replacement efficiencies we have applied to our non-load plan.
Ensuring Deliverability and a Resilient Workforce (Chapter 16) describes our approach to evidencing the deliverability and credibility of our overall plan, as a package and as its individual components. We are working with our supply chain to test and refine our ongoing contracting strategy to deliver our plan most efficiently and to ensure
both our internal and contractor workforce have the skills and scale necessary to deliver our baseline plan and the volumes that sit within Uncertainty Mechanisms (Supply Chain Strategy (Annex 16.2) and Workforce Resilience Strategy (Annex 16.3)).
All our supporting EJPs underpinning our investment plan have explicitly considered deliverability in their assessment of the options and preferred solutions to specific elements of our draft investment plan.
Using the latest DFES, and data from operating our network, the load-related network needs are identified
HV/LV PROJECTS 1-year delivery
lead time
EHV PROJECTS 2-year delivery
lead time
132kV PROJECTS 3-year delivery
lead time
1-year lead time
1-year lead time
1-year lead time
1-year lead time
1-year lead time
1-year lead time
1-year lead time
2-year lead time
2-year lead time
2-year lead time
3-year lead time
2-year lead time
2-year lead time
2-year lead time
3-year lead time
2-year lead time
3-year lead time
For these projects, we will ‘wait and see’ until the next planning cycle, or we will
start projects where there is the prospect of either (1) a future deliverability
constraint; or (2) an efficiency gain
We must progress these projects to ensure we can address all credible network needs

112 | Section D: Chapter Eleven: Distribution System Operation
CHAPTER ELEVEN: DISTRIBUTION SYSTEM OPERATION
The local distribution networks are key to unlocking the benefits of the low-carbon transition. Creating opportunities for consumers to generate and sell electricity and provide network flexibility services is crucial to cost effectively delivering net zero at pace.1 Electricity networks will need to be capable of delivering at least twice the amount of energy by 2035 to meet the government net zero plan.
SUPPORTING DOCUMENTS
DSO Strategy (Annex 11.1) including;
• DSO Operating Model • DSO Action Plan • Investment Decision Pack• Network Visibility Strategy
Digital Strategy and Action Plan (DSAP) (Annex 5.1)
Supporting a Smarter Electricity System
Delivering DSO: A Progress Update
Our RIIO-ED2 plan puts us on a trajectory to do this at the most efficient cost for customers by investing once at the right time in the right part of the whole-system. We expect to save customers up to £46.3m through deferring reinforcement and avoiding capital expenditure during RIIO-ED2. We will deliver efficient, effective and resilient network operation that accommodates the increasing proportion of Distributed Energy Resources (DER) in the energy mix and reduces the potential for conflict through network visibility and coordination with the ESO.
Embedding DSO (distribution system operation) roles, capabilities and responsibilities will enable us to play a full role in the transition towards a smarter, more sustainable net zero energy model. We will deliver additional data, monitoring and systems at the local network level to enable energy to flow in all directions creating an active network – a ‘smart grid’. We will build on our existing mitigation measures, to ensure we address concerns around the risk of potential conflicts of interest, building confidence in our ability to align our activities with consumer interest and deliver public value.
As DSO we will fully embrace and deliver the integration of high volumes of renewable energy sources and accelerate the decarbonisation of the economy. We will:
Grow our flexible connections to 3.7GW of capacity across 35 zones, avoiding £417.6m of reinforcement cost and offsetting 1.8mtCO2 by enabling low-carbon technologies to connect
Procure at least 5GW flexibility service deferring up to £46.3m of reinforcement, and create new markets with maximum participation from innovators and community groups
Deliver wider benefits including improved market liquidity for the ESO, and by supporting third-party initiatives that deliver a broad range of wider economic and societal benefits for our communities
* Comparison is to the last five years of RIIO-ED1. 2020/21 prices
Our vision for DSO is to make the best use of our electricity networks, data and emerging technology to facilitate the decarbonisation of transport and heat at maximum pace, and at minimal cost to consumers.
Total investment in this chapter Comparison to RIIO-ED1* Business Plan Data Tables
£73.1m to manage our assets and improve longer-term resilience
£20m supported by £160m investment in pre-requisitioning foundational systems
CV11, C4, C9, C12, C13 and M19
£36.8m for our CVP proposals n/aNot included in baseline plan, in line with Ofgem guidance
1 UK Government has committed to reaching net zero by 2050 and accepted the advice of its independent Climate Change Committee (CCC) to adopt an emissions cut of 78% by 2035 compared with a 1990 baseline. The Scottish Government has committed to reaching net zero by 2045 and reduce emissions by 75% by 2030 compared with a 1990 baseline.

113 | Section D: Chapter Eleven: Distribution System Operation
ENHANCED ENGAGEMENT OVERVIEW
We engaged with 5,250 stakeholders across 22 events on DSO and they identified the following RIIO-ED2 priorities.
1
CO-CREATING DSO METRICS
Feedback on the ENA’s Open Networks project, received from the broad range of stakeholders attending our annual stakeholder workshops in September 2020, laid the foundations for our DSO strategy. Stakeholders strongly encouraged us to follow the project’s detailed recommendations, with many highlighting the critical value of using its expert evidence base and collaborative approach.
As a result, the Open Networks recommendations directly
influenced our proposals. These were subsequently verified by
stakeholders in each of our regions through our DSO-specific
engagement: 80% of stakeholders at our DSO Metrics event
supported, or strongly supported, our principles for metric design.
We then co-designed metrics with these stakeholders, who told
us that the three most valuable metric areas are data transparency
and accuracy (valuable for 67% of those present), facilitating
participation/market making (47%) and forecasting (40%).
HOW WE RESPONDED TO FEEDBACK
Overall DSO strategy: Stakeholders were optimistic about our plans for the shift to DSO, however wanted clear metrics to measure our performance. 3 DSO metrics form part of an ODI to measure performance which has been prioritised by stakeholders and includes the communication of customer benefits.
Flexibility providers forum: We will establish an annual forum to discuss stakeholder barriers to flex markets participation, the outputs of which will be submitted to the Stakeholder Board to monitor conflicts of interest.
DSO data: Around a quarter of stakeholders saw data transparency as a high priority especially around sharing with others in the industry, so we have included a ‘Network Visibility Strategy’ as part of the DSO Strategy.
Flexibility market forecast: Stakeholders wanted accurate flexibility requirement forecasts to be a key metric in DSO evaluation.
Ambition around flexibility: Ambition around flexibility was deemed impressive and thus we have maintained our target of 5GW of Constrained Management Services in RIIO-ED2, in particular, to address both local and prohibitively expensive transmission constraints and support local arrangements. (Acceptability – 79%)
Energy efficiency CVP: Better home energy efficiency could release network capacity, and we will be targeting vulnerable and fuel poor customers first. In response to stakeholder feedback we have determined that we will combine our energy efficiency and flexibility CVPs together for the final plan as this will reduce cost and maximise stakeholder benefit, while maintaining the individual merits and targets for each.
Encouraging flexibility CVP: We should have a central role in encouraging customers to participate in flexibility markets, which we’ll do through a dedicated team focused on wide-ranging engagement.
2 Overview of the ENA’s Open Networks Project is available on the ENA’s web site: https://www.energynetworks.org/creating-tomorrows-networks/open-networks/
TOP STAKEHOLDER PRIORITIES
KEY STAKEHOLDER INSIGHTS
Communicate and educate all stakeholders to enable them to participate in the flexibility markets
Establish clear and measurable metrics to assess DSO performance
Collaborate and coordinate with Local Authorities and community energy groups to assist them in local area planning and to reach their net zero ambitions
79% CONSUMER ACCEPTABILITY FOR ACCELERATED PROGRESS TOWARDS A NET ZERO WORLD
Open discovery
• Discussion around the transparency of the DSO functions and its neutrality in the new market structure
• Stakeholders encouraged SSEN to establish a roadmap for the DSO transition, while also building in some flexibility to adapt to the changing energy landscape
Co-creation
• The majority of stakeholders agreed with SSEN’s DSO principles framework
• Co-creation workshop suggested the two most valuable DSO measuring metrics were ‘data transparency and accuracy’ and ‘facilitating participation/market making’
• Lack of awareness and understanding of the opportunities in flexibility for all stakeholders
• Suggestions that analysis on appetite for lifestyle changes would provide insight for the tendency for participating in flexibility
Business Plan refinement
• Stakeholders were interested to understand the investments in DSO, especially around spending optimisation and regulatory processes, in order to ensure maximum benefit for the end customer
Testing and acceptance
• Stakeholders were optimistic about the shift to DSO, especially in the net zero context
• The metrics to measure DSO performance were a key topic of discussion across events
• Communication and education of vulnerable and fuel poor customers is a crucial step to enabling their participation in flexibility markets, alongside overcoming the cost barrier
to August 2020
Aug 20 – Feb 21
Feb 21 – Jun 21
Jun 21 – Dec 21

114 | Section D: Chapter Eleven: Distribution System Operation
OUTPUTS AND AIMS2
LO: Licence Obligation; PCD: Price Control Deliverable; ODI: Output Delivery Incentive (F: Financial, R: Reputational), CVP: Consumer Value Proposition, SSEN Aim: Company Goal
Output Type Target Consumer benefitCosts in our baseline plan
DSO Strategy
DSO StrategyLO ODI-F
Define a DSO strategy that will be reviewed and refreshed annually with an action plan to deliver against it, including changes to IT systems, processes, and people.
Our DSO strategy will provide significant benefits across our plan:
• Through flexible connections saving £417.6m in reinforcement costs, offsetting 1.8mtCO2.
• Deferred reinforcement and avoided capital expenditure saving customers up to £46.3m.
£73.1m
Facilitating participation in flexibility markets
LO ODI-F
Set up an annual flexibility providers forum and survey enabling regular feedback.
Transparency of informationLO ODI-F
Provide timely, accurate and accessible DSO data across all DSO roles.
Improving provision of forecasting information
LO ODI-F
Continually improve the provision of forecast information for both new and existing flexibility markets.
Deploying flexible solutionsSSEN Aim
Target 5GW of Constraint Managed Zone services across multiple service types and grow our flexible connections to 3.7GW of capacity across 35 zones by 2028.
CVPs
Energy efficiency accelerator for smarter networks
CVP
Proactively work with Local Authorities and partners to identify and implement energy efficiency measures across our customer base that can release network capacity, with an aim to prioritise fuel poor customers and those in vulnerable circumstances.
• £7.1m net positive value and an SROI of £0.21 benefit delivered in excess of every £ spent.
• Supporting all our customers in the energy transition.
• Our blended CVP approach will actively promote a localised, balanced energy system, with wider societal benefits (e.g. carbon savings).
• Communities will be empowered to participate in flexibility markets, benefiting from the energy system transition, and resulting in lower customer bills through the reduced need for reinforcement and energy efficiency.
• Support the fair distribution of benefits from smart technology.
£36.8m
Local and community flexibility market stimulation
CVP
Partner with local organisations, aggregators and energy suppliers and other relevant organisations to actively promote recruitment of flexibility in areas of low market growth.
DEPLOYING FLEXIBILITY FOR WIDER SOCIAL BENEFIT
Our approach to flexibility goes beyond deferring network reinforcement. We will use it to support reducing carbon emissions from our diesel generation serving our islands communities and to deliver wider operational efficiencies.
All of our flexibility service requirements are technology-agnostic. Providers of storage, generation, demand-side response or energy efficiency services can respond to tenders either directly or through an aggregator utilising technological, behavioural or whole-system solutions.
Our Flexibility Providers Forum, which will meet twice a year, will help us act on feedback and continually improve our stakeholders’ experience. In addition, our two proposed Consumer Value Propositions (CVPs) will provide significant additional benefits to customers by exploring opportunities to deploy energy efficiency measures and creating new opportunities for flexibility market participation for our local communities.

115 | Section D: Chapter Eleven: Distribution System Operation
TRACK RECORD
During RIIO-ED1 we have made significant progress towards modernising our core systems to enable the move to open data sharing, digitalisation and the DSO function.
We have pioneered the smart grid in action, delivering Project Local Energy Oxfordshire (LEO), one of the most innovative and wide-ranging smart-grid trials ever conducted in the UK. And we have built foundational systems, such as asset data mapping systems
and active network management at grid substation level to deliver the necessary data for analysis and automation of DSO functions. These achievements will ensure we are ready for the step change needed in RIIO-ED2 to enable the transition to net zero.
By the end of RIIO-ED1 we will have invested over £160m, which includes a significant investment in setting up the pre-requisite foundational systems on which we will build scalable DSO capabilities that will not need to be repeated in RIIO-ED2, helping to reduce costs and increase pace of our DSO transformation in
RIIO-ED2 and beyond. This includes a new Asset Management System, integrated operational technology and a core Active Network Management (ANM) system to support the flexibility required to grow clean energy generation and deliver net zero.
Our achievements to date illustrate the significant opportunity for enhanced benefits DSO will bring for customers in RIIO-ED2.
• We have contracted in excess of 468MW of flexibility services delivering an operational saving of £251k and avoiding 3,250tCO2e.
• Our ANM schemes in the Western Isles and the Isle of Wight alone have saved customers £58m through deferred reinforcement and across our portfolio we have saved customers 90.6 years of connections delays.
Please see Track Record (Chapter 2) for an overview of our RIIO-ED1 performance across key areas.
3
DELIVERING PUBLIC VALUE
Building on from the experience of our RIIO-ED1 TRANSITION, LEO and SAVE innovation projects,
our Business Plan will continue to facilitate new market models that deliver wider societal value, such as peer-to-peer trading.
In Orkney, we have already extended the capabilities of our Active Network Management system to enable third-party peer-to-peer trading behind a network constraint. Our SAVE project gives us insight into energy efficiency working with local authorities (LAs) and local partners. We collaborated with LAs and local partners to deliver energy efficiency measures (such as LED lighting) that ultimately benefit customers through either reduced costs or reduced CO2.
INVESTING AND PREPARING FOR DSO
COLLABORATING ON FLEXIBILITY
We are one of five DNOs collaborating on the Flexible Power platform, a direct response to customer feedback calling for a simpler way to engage in the flexibility market.
The platform enables a direct path for flexibility providers to participate in flexibility on multiple networks. It enables the DNOs to signpost and operate all of their flexibility requirements, with providers able to view flexibility locations, requirement data, procurement notices and documentation on a single, joint website. The DNOs have committed to working together to further develop the Flexible Power brand and the platform’s functionality to enable it to interface with other flexibility platforms and offer wider market participation options.
Asset Management
Systems (£90m)
OperationalTechnology review
(£35m)
ANM centralisation(£10m)
Open Networks, DSO trials, studies and investments
(£15m)
EV Readiness (£12m)
Fig 11.1: Investing and preparing for DSO

Operating flexibility efficiently and effectively
alongside our other network solutions
116 | Section D: Chapter Eleven: Distribution System Operation
3.1 Transitioning to RIIO-ED2
Our focus during RIIO-ED1 has been on learning by doing and through innovation projects. RIIO-ED2 provides the opportunity to significantly scale up our activities and extend benefits to customers. An increase in low-carbon distributed generation, electric vehicles, demand side response and energy storage is already starting to transform our networks, driving the changes in our systems that will give customers access to new and innovative products and services.
At the end of RIIO-ED1 we will have almost a third of our planned RIIO-ED2 workforce in place for DSO. This workforce is already utilising legacy and innovation systems to realise commercial, environmental and network resilience benefits as part of our commitment to Flexibility First. Prioritising this approach ensures our customers and service providers see the benefit of a secure, sustainable and economically viable flexibility services market.
Through the transition to RIIO-ED2 and beyond, we intend to use flexibility intelligently to both manage uncertainty and enable efficient programmes of network investment, building our capability accordingly as the opportunities to defer or avoid reinforcement increase with a developing flexibility market.
We have actively sought to collaborate with other DNOs during RIIO-ED1 to provide an aligned flexibility process and to drive efficiency. We intend to maintain this approach in RIIO-ED2.
4.1 DSO Operating ModelOur DSO Operating Model combines our innovation and stakeholder engagement, collaboration with the other networks to inform the design of our DSO Strategy and DSO Operating Model, with policy direction from Ofgem and the minimum requirements we must meet.
OUR DSO STRATEGY
Our strategy for developing our RIIO-ED2 DSO capabilities builds on our experience to date through co-creation within our innovation programme and direct stakeholder engagement.
Through our role in the ENA’s Open Networks project and in other activities, our stakeholders have asked us to deliver three core functions, identified in Figure 11.2. These three functions are aligned with the roles set out in Ofgem’s RIIO-ED2 framework:
The process by which we have aligned those inputs (i.e. policy, stakeholder feedback, ‘learning by doing’) and ensured our DSO Operating Model for RIIO-ED2 delivers against those minimum requirements is shown in Figure 11.3 below.
The intelligent use of flexibility in RIIO-ED1 has already delivered real benefits to customers and illustrates the positive impact of successful DSO management. Developing these DSO capabilities to allow operation at scale will enable the use of more flexibility to operate and manage our network more efficiently, either in terms of investment planning or optionality, as we deliver the capacity necessary to help decarbonise the energy system.
4
Securing flexibility
Operating flexibility
DSO
Forecasting requirements &
evaluating network solutions
Figure 11.2: Core DSO roles and responsibilities
DSO Strategy
Realising the benefits of Flexibility
Building the DSO Capability
Clear DSO Operating Model & Action Plan
'Learning by doing' (Projects LEO &
TRANSITION) and stakeholder engagement
Open Networks direction of travel – ESO & DNO
Joint Coordination
DSO Operating Model that meets the minimum requirements – Planning &
Network Development, Network Operation, Market Development
Policy
SSEN
Collaboration
RIIO-ED1 RIIO-ED2TODAY
Smart Systems and Flexibility Plan
(Ofgem/BEIS)
Baseline expectations for DSO in RIIO-ED2
Figure 11.3: DSO Operating Model in RIIO-ED2
Forecastingnetwork
requirements & evaluating
network solutions
Securing flexibility
as an alternative to reinforcement from the external
market

4.1.2 Measuring our effectiveness
To enable stakeholders and Ofgem to evaluate our progress during RIIO-ED2 against delivering our DSO Strategy, we have set out a proposal for the high-level design of our three DSO performance metrics. Together these performance metrics form the DSO Output Delivery Incentive (ODI):
• Metric 1 – Data accuracy, accessibility and timeliness: we will evaluate our performance in publishing timely, accurate and accessible DSO data.
• Metric 2 – Facilitating participation: we will measure our success in facilitating participation in the flexibility markets we operate.
• Metric 3 – Forecasting provision improvement: we will enable stakeholders to measure our improvement in providing forecast information about the flexibility markets we operate.
Our DSO strategy (Annex 11.1) describes our process used to develop these metrics, including our engagement with stakeholders and our collaborative and iterative work with industry.
We recognise that the final design of the incentive will be set by Ofgem through the DSO Strategy Delivery Incentive ODI. Our proposal reflects our view of how the ODI could function to effectively incentivise performance in this space.
117 | Section D: Chapter Eleven: Distribution System Operation
Our DSO Action Plan (Appendix B of Annex 11.1) supports our DSO Operating Model and will implement the significant programme of change required to further develop our DSO capabilities. The Action Plan provides a clear and transparent pathway to the implement of DSO functionality and is an input to the ENA Open Networks project’s wider DSO Roadmap and Implementation Plan.3
4.1.1 Core DSO Functions
We explain how our three functions align with Ofgem’s view of DSO roles below. Full details of how our DSO Strategy aligns with Ofgem’s baseline expectations can be found in (Appendix A of Annex 11.1). This includes timings for implementation of key deliverables and details of activities already being delivered in RIIO-ED1.
Through our DSO Strategy we are committing to:
• Aligning our flexibility activities with those of other DNOs and the ESO through the Open Networks project to provide a consistent process across GB.
• Implementing systems that provide real-time visibility of constraints on the system and provide constraint forecasts.
• Providing the appropriate data exchanges and digital handshakes to allow the facilitation of peer-to-peer trading in a standard manner defined by learning from peer-to-peer trials.
• Actively providing projections of expected flexibility needs, including quantity, location, profiles and duration of the requirements based on our DFES best fit scenario.
Ofgem roles SSEN DSO Functions Overview of key activities
Planning and Network Development
Forecasting requirements and evaluating network solutions
Using our DFES as a starting point, we will continue to develop enhanced forecasting capabilities, working closely with our local stakeholders. Our Network Visibility Strategy explains how we will use smart meter data, LV monitoring and enhanced analytics to improve our forecasting.
This will be complemented by an open and transparent approach to sharing data, building on our Network Capacity portal and further collaboration with the ESO and other DNOs.
We already use tools such as the Open Networks Common Evaluation Methodology when assessing solutions to network needs. We will take a transparent approach to reporting, through our annual Distribution Network Options Assessment (NOA), and are committed to the principles of open and transparent procurement, visibility and accessibility.
Network operation Operating flexibility
We will promote operational network visibility and data availability. We are already working with the ESO and other DNOs to better facilitate operational data exchange, including improving Distributed Energy Resources (DER) visibility and monitoring. This will be supported by our Network Visibility Strategy, and we will also make operational data publicly available through our existing websites and upcoming Distribution NOA publications.
We will facilitate the efficient dispatch of flexibility services and adhere to the ENA Open Networks (ONP) Flexibility Commitment on Fairness and Clarity in Dispatch, supported by a robust decision-making framework. We are further investigating ways in which we can facilitate local energy trading/exchanging of capacity and curtailment obligations by 2023.
Market development Securing flexibility
Through our dedicated webpages4 we already collate and publish accurate, use-friendly, and comprehensive market information. We will highlight flexibility opportunities and provide regular and transparent reporting, including through our published Flexibility Statement.5 We have already adopted the ENA good practice of signposting anticipated procurement requirements for flexibility services. We will continue to work with industry to improve and align information we make available.
This work will be supported by our Digitalisation Strategy and Digitalisation Strategy and Action Plan,6 which has been developed in collaboration with our stakeholders and recognises that different stakeholders will have varying and unique information requirements which we will need to cater for.
We have adopted standardised Flexibility Services Standard agreements and the ENA ONP’s good practice in a number of areas including flexibility procurement and information sharing. We are working with the ENA ONP to adopt common baseline methodologies for flexibility services, covering market support services, coordination of distribution and ESO flexibility services.
As noted above, we will be open and transparent when deciding how and why services have been sourced from different solutions in order to meet network needs, and have put in place measures to mitigate potential conflicts of interest, detailed later on in this chapter.
3 https://public.tableau.com/profile/open.networks#!/vizhome/RM-2021_118032021_16171879437980/Roadmap4 https://www.ssen.co.uk/FlexibleConnections/ and https://www.ssen.co.uk/SmarterElectricity/Flex/ 5 https://www.ssen.co.uk/WorkArea/DownloadAsset.aspx?id=20662 6 https://ssenfuture.co.uk/wp-content/uploads/2021/07/A_04a_Digital-Action-Plan.pdf

118 | Section D: Chapter Eleven: Distribution System Operation
DELIVERING DSO ROLES AND RESPONSIBILITIES ACROSS DIFFERENT REGIONS
The geographical considerations of our two distinct networks are a fundamental factor in influencing our ambitions for RIIO-ED2. Our DSO Strategy is key to ensuring we can support local ambitions through our business plan:
Distribution Future Energy Scenarios (DFES) – the scenarios forecast demand growth and the uptake of low-carbon technology and renewables at a substation or even LV busbar level, reflecting local
environmental influences, the existing network infrastructure, and societal influences. These ensure our approach is tailored not only to our licence areas but also to the local community. See Forecasting and Scenarios (Chapter 9).
Local Area Energy Plans – these reflect local policy ambitions where they can be supported by clear evidence of achievability. An example is the aggregated approach for Scotland which reflects the Scottish
Government’s more ambitious climate targets for 2030 and net zero. In addition, we are working with local authorities and Local Enterprise Partnerships to help inform their net zero strategies. See Our Network as a Net Zero Enabler (Chapter 10).
Innovation – our innovation portfolio is managed to ensure our learning by doing approach addresses the entire topology of our network and local insights can be applied in comparable areas. For example, our
ANM experience and learning in the Scottish islands is currently being utilised on the Isle of Wight; our Solent SAVE project has informed our Energy Efficiency CVP for RIIO-ED2, and Project LEO is providing insights for other urban metropolitan zones in our licence areas. See Innovation (Chapter 14).
Regional Development Plans – we are working with the ESO and SHE Transmission in Scotland to identify parts of our licence areas where solutions on the distribution network can support transmission
constraints now and into RIIO-ED2. This is particularly relevant in our Scottish licence area due to existing constraints, the unique topology and the different voltage control boundaries compared to England. We currently have three live projects that we are pursuing, each with unique local characteristics.
4.2 Managing potential conflicts of interest
To enable the net zero transition, DNOs must act as neutral facilitators of the market and remove the risks associated with potential conflicts of interest in delivering DSO roles and responsibilities.
In our energy future, where high dependency is placed on micro generation facilitated through flexibility, there is a perceived tension between the role of the network infrastructure company, with its opportunity to increase capacity by investing in new infrastructure (thus attracting higher earnings), and the entity that determines how the system is operated, with its goal to reduce capital investment through facilitating a neutral flexibility market. As a DSO, with both those functions, it is important that we have robust structures in place to ensure we remove any potential associated conflicts.
Our strategy will ensure perceived and actual conflicts of interests are mitigated at the least overall cost to customers by operating in a transparent manner, enabling competition and providing appropriate separation so benefits enable delivery of net zero at pace and outweigh costs in a fledgling market. We will invest £1.0m to further develop our layered approach to mitigating conflicts of interest and our role as a neutral market facilitator.
DSO OPPORTUNITIES IN THE NORTH OF SCOTLAND
Developing and embedding DSO capabilities will provide significant opportunities to deliver benefits for some of our most remote communities in the north of Scotland.
As a DSO we will play a central role in facilitating the connection and export of low-carbon generation in new ways, which will contribute to our governments’ net zero targets. Beyond that, DSO functionalities can support our communities’ net zero ambitions, by contributing to potential alternative solutions to back-up diesel generation.
We also operate a number of Load Managed Areas (LMAs), originally introduced to enable the connection of large amounts of space and water heating without costly network reinforcement. The transition to net zero means LMAs are no longer a viable long-term solution. In RIIO-ED2, we’ll start to use market flexibility services to replace LMA mandated switching patterns. Please see our DSO Strategy (Annex 11.1) for further information.

119 | Section D: Chapter Eleven: Distribution System Operation
4.2.1 Our current approach to managing conflict
Since 2019 we have made a Flexibility First commitment to government to openly test the market for flexibility services as an alternative to significant reinforcement. Our DSO Strategy sets out to act as a neutral market facilitator and to not compete in the market for provision of ancillary (flexibility) services to avoid conflicts of interest.
We established a separate DSO function in 2019, with its own Directorate reporting to the SSEN Distribution Executive Committee. Its three roles are fully align with those set out in Ofgem’s RIIO-ED2 framework, as set out in section 6 above.
The Asset Management and Delivery functions of the traditional DNO are in separate Directorates to DSO. This level of separation of DNO and DSO capabilities is encouraged in the baseline requirements for DSO in Ofgem’s Business Plan Guidance as well as the Smart Systems and Flexibility Plan jointly issued by BEIS and Ofgem.
This structure is not unfamiliar to us, with parallels to how we have operated business separation from the non-regulated business within SSE plc, our parent entity, for many years. The mitigation measures already in place include:
• Education – e.g. what perceived conflicts are and the need for neutrality and reducing decision-making bias
• Directorate business separation for DSO functions
• Processes, including CBA assessment of different solutions
• Transparency, e.g. publishing processes and outcomes from flexibility contracts
These measures are set out in Figure 11.4, below. We also expect our CEG to take an active interest in this area going forwards.
We have considered the recent Ofgem Review of GB Energy System Operation7 which explored three potential biases: a lack of independent advice; bias in network development (capacity provision) and bias in facilitating competition.
In order to address these areas, as we move into RIIO-ED2 our existing layers of mitigation will be supplemented by audit functions and a stakeholder governance board (Figure 11.4), to provide input on evolving requirements and to review our progress. Our robust mitigation measures can provide confidence to stakeholders that decisions are being made in the best interests of consumers and net zero.
We have also identified the opportunity to strengthen conflict mitigation measures by separating out flexible from traditional network solutions from the team driving the long-term strategy and CBA decisions within DSO. This ensures independence of strategy and solution choice for provision of capacity from those providing different solution options (whole-system/flexibility/ traditional assets).
We have been testing our conflict-of-interest mitigation measures since 2019, including on projects such as LEO, and understanding the DSO interfaces with the DNO Asset Management business. We will continue to build a clear governance framework between our DNO business and our DSO capabilities that addresses conflicts of interest as part of a multi-layered approach based on the following principles:
• An absolute commitment to neutral decision-making
• A clear focus on delivering net zero
• Supporting regulatory/policy decisions that deliver the greatest consumer benefit
Further information on how we manage DSO-related conflicts of interest can be found in DSO Strategy (Annex 11.1, Section 4.3).
4.2.2 Strengthening our measures for RIIO-ED2
Figure 11.4: Conflict mitigation measures
7 https://www.ofgem.gov.uk/publications/review-gb-energy-system-operation
ED
UC
AT
ION • Assess Conflicts of
Interest (COI)
• Challenge Perceived COls
• Assess Regulation
BU
SIN
ES
S
SE
PA
RA
TIO
N • DSO Directorate separate to DNO
• Asset Totex Plan
• Allocated Cost
• Baseline Requirements
CL
EA
R P
RO
CE
SS
A
ND
CR
ITE
RIA
FO
R
DE
CIS
ION
S
• Built on CEM
• Utilise Frontier Input
TR
AN
SP
AR
EN
CY
• Published Processes
• Published Outcomes
NE
W F
OR
RII
O-E
D2
A
UD
IT • Independent Auditor
• Stakeholder Governance Board
CLASS
The Customer Load Active System Services (CLASS) innovation, funded through the Low-Carbon Network Fund (LCNF) and delivered by ENWL demonstrated that by remotely managing transformer tap changers and circuit breakers at primary substations to regulate voltage, DNOs can reduce or increase effective demand and absorb reactive power.
The changes in voltage were shown to be imperceptible to consumers but could be used to provide a degree of control to help manage peak demand constraints on a DNO’s network and provide the ESO with balancing services.
We believe CLASS can provide significant benefits to consumers by reducing costs for the ESO and consumers. However, we note that Ofgem has yet to provide clarity on the regulatory treatment of CLASS. We have therefore not included CLASS as part of our RIIO-ED2 business plan. We are looking to update our business plan at a later stage, once a decision has been reached on regulatory treatment.
We have included initial cost estimates for CLASS in our DSO Strategy (Annex 11.1) totalling £16.1m, which will need to be confirmed via a more detailed study. Due to the diverse nature of our network, there are many locations where existing limitations will prevent CLASS from being effective e.g. high volumes of embedded generation, long rural feeders currently utilising the full available voltage range. We would not intend to utilise CLASS on Primary Substations which are not already providing a CLASS service to the ESO without first calling on the marketplace for flexible solutions to allow a comparison against our stated costs for CLASS deployment.
CLASS is separate to our programme for the installation of low voltage control on our local distribution transformers included in our base plan. For information on on-load tap changers (OLTC) please see Maintaining a Resilient Network (Chapter 7).

120 | Section D: Chapter Eleven: Distribution System Operation
4.3 Network visibility
Network visibility is fundamental to the delivery of our RIIO-ED2 plan and the delivery of our communities’ net zero ambitions.
Our approach will give us 100% visibility of power flows on all asset levels of our network, through the installation of LV monitoring, direct embedded measurement of selected plant, modelling and analytics. We have utilised analytics to identify the optimal volume of direct network LV monitoring. This modelling has shown that we will need to monitor 19,000 Secondary Substations (19% of our fleet) in order provide enhanced visibility of those assets at risk during RIIO-ED2 and early ED3 under our adopted load growth scenarios.
Improved visibility of our network allows us, and third parties, to offer new services and support to customers and stakeholders. Examples include:
• Rapid digital self service connection and additional load quotations
• Tools to allow domestic customers to participate in the flexibility services market
• Tools for stakeholders to identify the optimal location for public charging infrastructure
• Local community energy exchange markets
• Tools to predict faults and reduce interruptions
Our Network Visibility is supported by a number of enablers and investments which are detailed in our DSO Strategy (Annex 11.1 Appendix H).
VISIBILITY STRATEGY OUTPUTSENABLERS
• Third party services
• Network Operation improvements
• Customer interruption improvements
• Accelerated connection processes
• Cable Health monitoring
• Just in time reinforcement
• Flexibility Service Operations
• Losses visibility
• Smart Meter Data
• LV Monitoring data
• Connectivity Model
• Data sharing Platform
• Data Lake
• Smart Meter Plus
• Pre-fault detection algorithms
• Power Quality Monitoring
A targeted-led blend of LV monitoring, smart meter data and external data sets consolidated around a connectivity model.
Figure 11.5: Our Network Visibility Strategy – Summary
SMART METERING DATA
At the end of 2021, smart metering penetration is less than 30% in our licence areas, but the forecast of supplier installation rates predict it will be 80% by early 2024.
Smart meter data can be leveraged against LV monitoring data with the combination of the two sources providing a level of visibility and accuracy greater than the sum of the parts. The data can assist with load profile modelling on our LV network to make better informed decision on network investment. We expect to further improve LV network load forecasting by incorporating data from smart meters and an enlarged LV monitoring fleet. We have demonstrated how machine learning and advanced analytics can be used to develop the Load Model and smart meter data is a key component of this, with half hourly consumption, maximum demand and voltage data helping us to better understand the load profiles and load growth on individual assets on the LV network.
Voltage alerts sent by smart meters can be used in real-time to respond to network issues or analysed as part of a customer voltage enquiry. We will be using voltage data to enhance customer service when dealing with voltage enquires and integration into our OMS so we can respond 24/7 to genuine network voltage issues.
Alerts relating to peak demand, voltage drops, pre-faults and outages are already being utilised from some sources of data (i.e. smart meters) and are being established for others (i.e. LV monitoring), with the integration of LV monitoring data into our Control Rooms to support rapid dispatch of fault restoration teams. The increase and improvement in network visibility will allow reporting to be produced and provided to internal teams and external stakeholders, supporting investment decisions and community/customer plans. For example, this improved visibility will facilitate proactive assistance for vulnerable customers on circuits which have been identified as having symptoms of a pre-fault.
Work is already underway in our Smart Phase 2 project to enable us to poll smart meters for key information at scale and create the pipelines for this data to feed into our Data & Analytics platform. Once complete, this will allow the incorporation of regularly updated smart meter data into our load model and provide accurate and regularly updated views of load on every aspect of our network. This will enhance the local low voltage networks in particular, which we forecast will be most susceptible to early constraints as a result of LCT growth and clustering.

4.4 The role of DSO in delivering net zero4.4.1 Flexibility
The deployment of flexibility services enabled by DSO is core to the delivery of net zero. While flexibility can be supplied from a number of sources, including embedded diesel generation, we commit to considering the carbon intensity/environmental cost of the service as part of our assessment criteria (through our procurement process) for contracting and dispatching flexibility services in support of decarbonisation.
Our Flexibility First commitment underpins our plan and we have carried out flexibility assessments for all our named load investment schemes. In RIIO-ED2 we intend to contract at least 5GW of flexibility services across all our voltages including the Low Voltage (LV) network. The combined savings from deferring reinforcement and avoiding capital expenditure in RIIO-ED2 range from £18.3m to £46.3m (dependent on market liquidity8) under our assumed Consumer Transformation scenario. This scenario tends towards reinforcement because of the rapid uptake of low-carbon technology, indicating this range of benefits could be at the lowest end of the potential benefits for flexibility in RIIO-ED2. In addition, we plan to grow our flexible connections to 3.7GW of capacity across 35 zones helping customers avoid £417.6m of reinforcement cost and offsetting 1.8mtCO2.
Please see Our Network as a Net Zero Enabler (Chapter 10) for further information on our approach to load forecasting and investment and the impacts of Access SCR.
4.4.2 Whole-systems and DSO
Working in a whole-systems way – across the different sectors, such as electricity, gas, heat and transport – requires local communities and authorities to collaborate with organisations in energy, transport, telecoms, water and other sectors. For example, the decarbonisation of heat, with a range of alternative solutions (hydrogen, electric heat pumps and district heating) requires cross sector collaboration and whole-system thinking to optimise costs and investment while meeting environmental commitments.
We have a strong track record of working in this way across a number of discrete initiatives during RIIO-ED1 and our strategy for RIIO-ED2 will embed the new ways of working across our business. For example, this will include sharing our data to help other parties to deliver projects and meet their objectives in line with our Digital Strategy.
Our Whole Systems (Chapter 12) and the supporting Whole Systems (Annex 12.1) detail how we are building on our experience working on whole-system projects in RIIO-ED1 to embed a whole-systems approach across our business from now and into RIIO-ED2 and beyond.
For our DSO Strategy, whole-systems working presents significant opportunities in RIIO-ED2 to deliver our plan and support the transition to net zero. Key elements of our DSO Strategy enabled through whole-system workings include:
• DNO/ESO Coordination: we already co-ordinate with the ESO across many of our functions. We believe that to enable the DSO transition, we will need to extend these relationships and create new co-ordinating functions with the ESO. Ofgem’s baseline expectations for DSO introduced three principal roles which are broadly aligned with the three ESO roles in the areas of development, markets, and operations. We believe that co-ordination will be needed across all three areas and that there will be multiple interactions which are captured in our Operational Plan.
• Whole-systems Flexibility: flexibility on the electricity system does not have to come solely from electrical solutions. Other vectors could contribute significant benefits to the network in the form of district heating schemes, hydrogen networks, energy efficiency, building quality, and integrated transport approaches for example. On that basis our flexibility first approach is open to whole-system flexibility solutions and energy efficiency. In turn, DER on the network may be able to support other vectors.
121 | Section D: Chapter Eleven: Distribution System Operation
8 These figures assume a flexibility services availability payment of £300 and £75 respectively. Our current payment of £150 delivers £32m of savings in RIIO-ED2.

122 | Section D: Chapter Eleven: Distribution System Operation
In response to stakeholder feedback, we have explored the benefits of merging both our energy efficiency and flexibility market stimulation CVPs together and have calculated the benefits to consumers of this combined approach.
We believe both CVPs have individual merit and remain strongly supported, but in combining them we are acknowledging that as separate CVPs there are elements of cross over and a potential for duplication. The improved efficiencies gained from the combined approach introduce an efficiency saving of 25%. The new combined cost, with that efficiency factored in, is £36.8m with an NPV of £7.1m and an SROI of £0.21 benefit delivered in excess of every £ spent.
We've engaged extensively with customers and key stakeholders such as local authorities and community groups, including through an energy efficiency survey. This has helped us refine our proposals and understand how to best target activities to drive genuine value for our customers and communities.
Energy efficiency support for smarter networks
Building on the successes of our Solent Achieving Value from Efficiency (SAVE) innovation project, we are exploring a programme of targeted energy efficiency engagement focusing on areas that will provide the greatest synergy with our network needs and the needs of our local communities, including those in vulnerable circumstances. This CVP will include energy efficiency engagement both directly and via partners and efficiency deployments through intermediaries and partners. It will also include a degree of match-funding based on the value of the efficiency in terms of network investment deferment or avoidance. Savings facilitated by energy efficiency deferring reinforcement will be used to 'top-up' the fund, enabling more interventions during RIIO-ED2.
We will target areas with high proportions of vulnerable and fuel poor first, and consider expanding our criteria to include other customers potentially ‘excluded’ from the energy transition due to other reasons (e.g. building constraints).
Consumer benefits include:
• a reduction in household energy bills due to greater energy efficiency measures and reduced need for traditional reinforcement
• fair distribution of benefits from smart technology, ensuring vulnerable customers are not left behind
• investment savings for local authorities
• ecosystem benefits (including carbon savings) from a more flexible network
Local and community flexibility market stimulation
We will stimulate community flexibility markets, building on specific experience gained from projects such as NTVV and LEO where coordinated engagement and funding through Local Authorities and Community Groups has been successful in supporting LCT growth and market opportunities. We will increase local flexibility market participation by empowering communities we serve – including those in vulnerable circumstances – to participate in the provision of system services.
To successfully unlock the potential of flexibility, support throughout the engagement will be necessary. This engagement, with Local Authorities and key local organisations, could include publications and information drops, walk in centres and RTB sessions with key industry partners and technical experts.
Utilising the learnings from our Northern Isles New Energy Solutions (NINES) innovation project and our work on a ‘Smart and Fair’ transition, we are exploring opportunities to stimulate community flexibility markets. We will establish a programme targeted at areas where the need for flexibility is high, but the uptake is low. We will do this by partnering with aggregators and energy suppliers to actively target recruitment of flexibility by providing awareness training and funding to bridge the initial feasibility and mobilisation barriers with a focus on new participants such as local authorities, social landlords and community groups.
We will provide incentives and support, partnering with local partners, suppliers and consultancies to provide financial incentives for the installation of LCTs that could participate in flexibility markets, with a focus on particularly difficult activities, such as energy demand management for buildings.
Broadly, the benefits from local market stimulation are:
• a localised, balanced energy system
• ecosystem benefits from a more flexible network
• reduced inequalities from affordable energy to meet the needs of all consumers
Please see our Consumer Value Propositions (Annex S.3) for details of all our CVPs.
4.4.3 CVPs

123 | Section D: Chapter Eleven: Distribution System Operation
INVESTING FOR DSO
DSO is a significant programme of change which will require an efficient investment in people, systems, data and external relationships.
Our investment for RIIO-ED2 focuses on scalability, putting in place the systems necessary to minimise market and process friction and provide the necessary coordination with the ESO, flex providers and other key actors. This means developing operational and procurement flexibility, requirements forecasting, and assessing network solutions.
The provision of open data will be a catalyst for change, empowering customers and service providers to develop flexibility markets. Delivering our DSO capability is a key enabler for these markets, providing essential information about our networks, their operation and constraints. Full details of our DSO Strategy can be found in (Annex 11.1) and further information on our Digital Strategy can be found in IT and Digitalisation (Chapter 5), and Digital Strategy and Action Plan (Annex 5.2).
Our plan proposes to invest £73.1m to deliver the DSO capabilities that will deliver this flexibility and meet the minimum requirements laid out by Ofgem:
• We will invest £27.1m to scale up our workforce capabilities through our Workforce Resilience Strategy (Annex 16.3)
• We will invest a further £45.0m in the Information Technology (IT) and Operational Technology (OT) projects that will underpin our ability to deliver the primary DSO roles. These projects and associated spend are discussed in IT and Digitalisation (Chapter 5)
We will also spend £1.0m to extend our layered approach to mitigating conflicts of interest and our role as a neutral market facilitator.
This investment will help ensure we meet the demands of net zero and are able to support our communities in delivering their ambitions. The DSO Investment Decision Pack (IDP) is focused on building the workforce capability that can deploy the IT/OT investment outlined in IT and Digitalisation (Chapter 5) that we are making for RIIO-ED2.
5
DSO will also play a key role in supporting deliverability.
DSO-enabled flexibility services (supporting pre/post faults and outage scenarios as well as deferring capital expenditure) also allow us to better align our work on the network to our workforce capacity, therefore allowing us to deliver more efficiently. Our CMZ Secure and CMZ Dynamic flexibility products will also support us mitigating the impact on customers of planned maintenance and planned outages, which will be particularly important in RIIO-ED2 where we are delivering significantly higher volumes of work.
Flexibility enables us to streamline load-related expenditure through the levelling out of delivery requirements and the reduction of unit costs by removing the pressure on contractor demand. It also helps us to manage load growth uncertainty, with capex deferral allowing us the time to ramp up and train our workforce in line with our plans.
Our Ensuring Deliverability and a Resilient Workforce (Chapter 16) describes our approach to evidencing the deliverability of our overall plan, both as a package and its individual components, to ensure that we can demonstrate a credible plan to move from SSEN’s RIIO-ED1 performance to our target RIIO-ED2 scale of delivery and efficiency.
Delivering a DSO capability in RIIO-ED2 will have significant positive impact across multiple workstreams in our Business Plan, including:
• Within our IT and Digitalisation (Chapter 5): our road map for the £45.0m IT investment for RIIO-ED2 that underpins the network visibility and system coordination required by DSO
• Workforce Resilience Strategy (Annex 16.3): the new skills we will be bringing into the business and how we intend to attract and develop the right people from the diverse labour market
• Our Network as a Net Zero Enabler (Chapter 10): the impact that flexibility levels and market liquidity will have on expenditure
• Whole Systems (Chapter 12): how DSO capabilities enable whole-system benefits
• Reliability Strategy (Annex 7.2): the use of flexibility for emergency response
AVOIDING OR DEFERRING COSTLY REINFORCEMENT
PROVIDING OPTIONALITY
SUPPORTING DELIVERABILITY
REDUCING CO2
INCREASING SYSTEM RESILIENCE
CMZ SUSTAIN – used to defer or avoid network reinforcement by peak lopping1
CMZ SECURE – used to support the network during planned maintenance work 2
CMZ DYNAMIC – used to support the network during fault conditions while there are planned outages3
CMZ RESTORE – used to support the network during network faults4

124 | Section D: Chapter Twelve: Whole Systems
CHAPTER TWELVE: WHOLE SYSTEMS
A WHOLE-SYSTEMS APPROACH TO THE ENERGY TRANSFORMATION
The energy sector will play a crucial role in meeting the UK and Scottish Government’s net zero targets in 2050 and 2045. The transition to net zero energy will blur the boundaries between electricity, gas and transport and other sectors, and create interdependencies that necessitate a coordinated, or whole-systems approach.
Delivering a whole-systems approach will require continuous collaboration with local communities and authorities, alongside organisations in the energy, transport, telecoms, water and other sectors. For example, the decarbonisation of heat, through a range of alternative solutions (hydrogen, electric heat pumps and district heating), requires cross-sector collaboration and whole-systems thinking to optimise costs and investments while meeting environmental commitments.
SUPPORTING DOCUMENTS
Whole Systems (Annex 12.1)
Consumer Value Propositions (Annex S3)
ENHANCED ENGAGEMENT OVERVIEW
We engaged with 3,314 stakeholders across 18 events on Whole Systems, and they identified the following RIIO-ED2 priorities.
1
TOP STAKEHOLDER PRIORITIES
KEY STAKEHOLDER INSIGHTS
Collaborate with the whole industry to share best practice and resources
Facilitate access to network data and industry data sharing
Facilitate local stakeholders to achieve their net zero ambitions, especially through local representation
Open discovery
• Endorsed SSEN’s collaboration with ENA for enabling whole system solutions
• Stakeholders urged us to adopt a whole-systems approach, especially through collaboration with other DNOs, GDNs, TOs and suppliers to share data and standardise processes, thus providing the best outcomes for industry and customers
Co-creation
• 91% of attendees agreed with SSEN’s vision for whole-systems and the majority also agreed with the proposed actions to support whole-systems
• ‘Open data’ and ‘collaboration’ were noted as the most important enablers for whole-systems success
• The three initiatives believed to bring the greatest value were having DNO representation in local whole system initiatives, regional network constraint studies and a dedicated whole-systems liaison officer
Business Plan refinement
• The whole-systems approach should facilitate access to network data (including LV data and provision of interactive network impact assessment), flexibility as well as EV and LCT growth
• SSEN should be part of regional development and should have a local point of contact
Testing and acceptance
• Stakeholders were broadly positive about the strategy and package of outputs for whole-systems, they considered it ambitious and comprehensive to meet customer needs
• Believed the most effective way to move to a whole-systems approach is through facilitating access to network data
• Stakeholders supported the Whole Systems Support CVP’s ability to help stakeholders deliver their net zero ambitions and whole system projects, but emphasised that it should have community and local input in how the CVP is delivered and evolves.
• Stakeholders supported the proactive engagement proposed by our CVP to build a more integrated local energy system with community groups and the ability to engage more than once a year with local authorities
• 83% of stakeholders in the north and 70% in the south designated the broadband CVP as either high or medium priority
to August 2020
Aug 20 – Feb 21
Feb 21 – Jun 21
Jun 21 – Dec 21

125 | Section D: Chapter Twelve: Whole Systems
HOW WE RESPONDED TO FEEDBACK
Stakeholder feedback: We believe stakeholder feedback should be part of the whole-systems process and will conduct an annual survey to collect quantitative and qualitative feedback on project development.
*Enhanced Output* Supporting Local Authorities: Stakeholders wanted us to collaborate with local authorities on regional network constraints and issues. It was explicitly mentioned that we should engage more than once a year. We will learn lessons from RIIO-ED1 (e.g. project LEO) and better facilitate access to network data through our regionally-based whole-systems co-ordinators.
*Refined CVP* Whole System Support CVP: We should be part of regional development and will enhance our collaboration and support of infrastructure plans and effective Local Area Energy Plans. The CVP will provide bespoke additional local support and technical expertise beyond our baseline RIIO-ED2 strategy.
Broadband CVP: Feedback from domestic customers, the Scottish Government and local authorities have been supportive of installing fibre cables alongside our assets to bring benefit to our customers beyond our traditional activities as a DNO.
79% CONSUMER ACCEPTABILITY FOR ACCELERATED PROGRESS TOWARDS A NET ZERO WORLD
*Enhanced Output* – This denotes a change in ambition or scope in the output between our draft and final plan.*Refined CVP* – This demotes an adjustment and refinement of the CVP between draft and final plan.
1.1 Our whole-systems strategy Stakeholders have given feedback on what it’s like working with us and on opportunities for whole-systems collaboration. Full details of our activities can be found in Consumer Value Propositions (Annex S3).
Our engagement has led to the co-creation of our whole-systems long term vision and transition plan, and has identified the following priorities:
• Stakeholders see developing a whole-systems approach as a priority, with a strong focus on data sharing and through more effective communication with GDNs, TOs and other DNOs
• Some local authorities require additional support to engage meaningfully, and stakeholders welcomed that engaging with community groups was part of the strategy. They suggested more proactive approaches, such as roundtable discussions with stakeholders to build a more integrated local energy system, and engaging more than once a year with local authorities
We have established regular forums to bring together electricity and gas networks to share best practice. For example, we engage with Scotia Gas Networks, SSEN Transmission, National Grid Electricity Transmission, National Grid ESO and Scottish Power Energy Networks through the Whole Systems Energy Network Charter work and bilateral engagement. And our extensive local authority engagement to develop Local Network Plans will also help inform Local Area Energy Plans (LAEPs).
ENGAGEMENT HIGHLIGHT
In our engagements relating to whole-systems, stakeholders emphasise the critical role of open data in developing and delivering effective whole-systems solutions. While recognising that sharing data can be challenging, stakeholders are clear of the potential benefits; leading to slicker, real-time systems, visualisation and new routes to innovation. Above all, as one stakeholder said, it is needed because “no one person is smarter than everyone”.
As a result of this feedback, we have put data-sharing initiatives at the core of our digital strategy for whole systems. We are committing to systematically review our datasets against stakeholder data requests and the data triage process as defined through the ENA Data Working Group, with a view to making the data available digitally. We will develop APIs that will enable secure data exchange for customer-facing processes such as service checks for LCT connections.
OUTPUTS AND AIMSOur whole systems definition:
We have worked with stakeholders to develop our definition of whole-systems working: coordination or cooperation between energy sectors and other sectors with the aim of an overall enhancement in quantifiable consumer benefits and/or societal outcomes.
Our whole system vision:
Our long-term vision is for continuous collaboration with stakeholders; where we play an active role in joint planning, addressing our and others’ challenges, and the delivery and execution of solutions.
2

126 | Section D: Chapter Twelve: Whole Systems
SSEN AND WHOLE SYSTEM ACTIVITY WITH THE TRANSPORT SECTOR IN RIIO-ED1
Electric Vehicles (EV) Strategic Partnership: A joint initiative led by the Scottish Government to deliver a coordinated investment approach for EV charging infrastructure. SSEN delivered expert resource to the project to improve technical and network reviews of optimum charger locations.
OZEV1 collaboration to inform the creation of the Automated and Electric Vehicles (AEV) Act 2018, the legislation that mandated the UK’s smart requirements for all EV chargers sold, helping to ensure grid stability for DNOs in the future.
Data sharing with LUAR and NUAR2: A pilot data-sharing scheme between 12 local authorities and 35 other organisations focused on underground piping and assets. Now in planning to roll out on a nationwide scale.
Riding Sunbeams: Supporting Rail Network operators aspirations to install solar PV and storage at key locations to reduce electricity consumption from networks and achieve net zero objectives.
LOCAL COMMUNITY PARTICIPATION
Project LEO is a smart grid trial involving partners from across
academia, industry (including the ESO), local councils and community
groups in the Oxfordshire area
Collaboration across electricity and gas networks supporting the Heat
Electrification Partnership, a Scottish Government-led initiative focused
on decarbonising heat
SHARED INFRASTRUCTURE
Working with SSEN Transmission and the ESO to develop a shared
transmission/distribution connection for the Shetland Islands
Coordination with government and public sector stakeholders working
on the EV Strategic Partnership (led by the Scottish Government) to deliver a coordinated investment approach
for EV charging infrastructure
Regular and structured engagement, and targeted project-based whole-systems engagement, for example
through seconding system planners to assist with the A9 Electrification and E-tourism projects in Scotland
and the Isle of Wight
DATA SHARING
The London Underground Asset Register (LUAR) – focused on sharing
data on underground piping and assets between 12 local authorities
and 35 other organisations
TRACK RECORD – RIIO-ED1 HIGHLIGHTS We have been collaborating and engaging with third parties throughout RIIO-ED1. We are delivering innovative pilots, such as Project LEO (Local Energy Oxfordshire), that are giving us valuable insights into how to work effectively with stakeholders and other networks to maximise benefits. We have used our experience,
and the lessons learned, as the foundations for our transition to a more systematic, company-wide whole system way of working.
Our approach has been to design and test solutions to specific electricity distribution-related problems. The range of initiatives we have been involved in reflects the broad scope of opportunity for whole-systems working, including:
3
1 The Office for Zero Emission Vehicles.2 The London Underground Asset Register and National Underground Asset Register.
Our Track Record (Chapter 2) provides more detail on our performance against key RIIO-ED1 performance metrics and incentives.
LO: Licence Obligation; PCD: Price Control Deliverable; ODI: Output Delivery Incentive (F: Financial, R: Reputational), CVP: Consumer Value Proposition, SSEN Aim: Company Goal
Output Type Target Consumer benefitCosts in our baseline plan
WHOLE SYSTEMS
Whole Systems feedback survey
LO/CVPTrack key stakeholder feedback on an annual basis through a qualitative and quantitative survey
Effective whole-systems solutions delivered aligned with stakeholder needs
Incremental
Whole systems engagement for local authorities
SSEN Aim
Support local authorities’ energy and heat strategy development through provision of relevant data sets and annual engagement on our DFES scenarios
Local authorities are aware of our services and how we can support them in their decarbonisation plans
£2.4m
Embedded whole systems support services for local authorities and community groups
CVP
Provide enhanced support to 72 local authorities and up to 200 community groups using people within our business and apply our capabilities to assist communities develop and deliver viable effective whole system and net zero initiatives that have an interaction with our network
Our proposal will deliver net customer benefits of £11.2m by helping to lower long-term costs for customers and local net zero and whole system initiatives through more efficient siting and use of infrastructure
£12.3m
Supporting broadband to island communities through our assets
CVP
Go beyond our traditional activities as a DNO, enabling communities to access and benefit from fibres where we they are installed in our assets
Our proposal will deliver net customer benefits of £27m by enabling a range of benefits across island communities, including sustainable economic development, education, healthcare, and addressing depopulation through access to good quality digital infrastructure
£8.0m

127 | Section D: Chapter Twelve: Whole Systems
Engagement on discrete projects for
solving SSEN problems
Continuous stakeholder engagement
Deliver Engage
Co-create
DesignFund
Deliver
Electricity networks
Water, Gas, Telecom
Property development
Customer community local auth.
All electricity
sector
Customers
ESO
Transport
DesignFund
Ongoing stakeholder engagement and new whole system engagement coordinators
Reflect Embed
Review & integrate
SSEN digital strategy (including data sharing)
Figure 12.1: Our Whole Systems approach and transition plan
TRANSITIONING TO RIIO-ED2 We have developed a long-term vision for whole-systems working and our transition plan (Figure 12.1) sets out how we will progress towards that vision for RIIO-ED2, focusing on:
• Reflecting on progress and lessons learned, including working with third parties to review current whole-systems working and identify opportunities for improvement
• Reviewing internal processes and resource requirements to embed and promote whole-systems solution-delivery, including a review of operations and ways of working to raise awareness of whole-systems solutions
• Embedding whole-systems thinking into decision-making, including processes to identify, prioritise and assess potential whole-systems solutions, and using tools such as the Energy Networks Association Whole Systems Cost Benefit Analysis, to inform decision making.
As more stakeholders become engaged with their own plans to deliver net zero, we will need to prioritise and manage the potential increase in our workload – and, importantly, the associated costs for electricity consumers. Ultimately, given the nature of whole systems, our transition will be necessarily dependent on third parties and their
ability to work with us in new ways. We will have to develop processes that differentiate activities and ensure electricity consumers are not paying for commercial services that should be paid for by the third parties benefiting from them.
4
LOCAL ENERGY OXFORD: WHOLE SYSTEMS PROJECT LEO
We are working with Innovate UK on Project Local Energy Oxfordshire (LEO), one of the most ambitious, wide-ranging, innovative, and holistic smart grid trials ever conducted in the UK. Its purpose is to understand how the whole energy system needs to adapt and change and to enable technologies for a net zero world. Critically, it will improve our understanding of how opportunities can be maximised and unlocked from the transition to a smarter, flexible electricity system.
LEO combines the markets and technology aspects of the future network, as well as the necessary collaboration and consumer elements of a socio-technical system. We have brought together partners from across the energy system, academia, industry and local communities to collaborate on developing a ‘whole-systems’ approach. The project is delivering a series of end-to-end trials of flexibility on the electricity network that are going to take place at the local and domestic levels, and we are embedding the principles of how to measure large system change into other countrywide projects.
A core objective of LEO is to learn from the communities in Oxfordshire, ensuring that we find ways to meet the UK’s energy needs in a manner that is good for people and good for the planet. This is critical for us to build the networks of the future and deliver a fair and accessible transition to net zero. The Project is supporting diverse low-carbon technologies and solutions, including roof-top solar photovoltaic (PV) arrays, small hydro stations on the river Thames, behind-the-meter battery capability, vehicle-to-grid infrastructure (V2G) and demand response from large buildings. For further information, please see Whole Systems (Annex 12.1).
EMBEDDING DSO AND WHOLE SYSTEM READY INFRASTRUCTURE
The South West Active Network (SWAN) Project has installed a new ICCP link (T-D Interface) and network management system enabling real-time data exchange with the ESO and NGET to optimise Whole System operations across our SEPD networks. Through this project SSEN, the ESO and NGET have agreed data exchanges in real time to release significant generation capacity across our southern licence area and have implemented new
interfaces and supporting systems. As a result, we have been able to avoid and manage conflicts across the whole electricity system from the increase of DER while future-proofing our system against further development of flexibility in RIIO-ED2. The increased data flows will inform the development of data visualisation tools in RIIO-ED2, with projects feeding into the Open Data initiative and our DSO transition.

128 | Section D: Chapter Twelve: Whole Systems
5
1
2
3
4
3 The ENA has worked with Ofgem and the sector to develop guidance and templates to undertake whole systems Cost Benefit Analysis (CBA) to be used consistently across the energy sector.
5
OUR RIIO-ED2 WHOLE-SYSTEMS STRATEGY Our whole-systems approach has been co-created with our stakeholders to enhance consumer benefits and societal outcomes by:
• increasing efficiency for our own business and in how we deliver for other stakeholders, leading to savings for customers;
• enabling an effective and efficient roll-out of low-carbon technologies, realising ambition and where possible avoiding unnecessary customer and societal costs; and
• gaining a better understanding of what our customers and stakeholders need from us as part of the wider interconnected and interdependent system
We will be offering all local authorities one whole-systems support workshop per year and access to data sharing as standard within our baseline plan. This will be complemented by additional services set out in our CVP.
Our proposed CVP to provide our remote communities with access to digital infrastructure is a prime example of whole-systems working to deliver public value.
Our approach is underpinned by our commitment to drive cultural change within our own business, embedding whole-systems in everything we do. As part of our commitment, we will implement annual surveys of our stakeholders alongside annual reporting through SLC7A and our CVP that will ensure we receive regular feedback and are able to report transparently on our progress.
Our proposal is in line with business plan minimum requirements and our obligations under the Whole Electricity System Licence Condition. Please see Whole Systems (Annex 12.1) for further details.
5.1 Delivering Public ValueOur whole-systems approach is rooted in the belief that we have a key role to play in delivering public value. Our proposed stakeholder support is designed to help communities meet their net zero ambitions and our focus on cross sector collaboration will identify new ways to maximise our assets, such as by exploring opportunities to provide digital infrastructure to remote communities.
We will embed the necessary thinking, culture and decision-making processes to drive a whole-systems approach across our business, maximising the benefits for customers and broader society and supporting delivery of our long-term vision.
Several of our business plan strategies, particularly our DSO, Digital and Innovation strategies, will enable and support this transition to whole-systems working. For example, we will work with stakeholders to deliver cross-sector solutions for flexibility and energy efficiency, or on implementing data sharing platforms and tools so stakeholders have access to data we hold to improve collaboration. Our whole system approach will provide a framework for engagement, co-creation and to deliver initiatives with other organisations, such as though our Heat and Sustainability strategies. Throughout our business plan we provide examples of how each strategy reflects and relates to whole-systems working.
5.2 Embedding our whole system vision
Our long-term whole system vision has five component parts:
Engage – through formal forums and strategies, we will communicate on a regular and frequent basis with our stakeholders. This will facilitate the identification of issues
and challenges we can address together, including those associated with ownership, operation and maintenance of our own distribution network, and those faced by other network businesses, wider external stakeholders, and in other sectors.
Co-create – collaboration in planning and co-creating solutions, not in delivery alone. This allows us to have a greater level of involvement in developing solutions for
challenges faced by others. It also supports the early sharing of expertise, experience and knowledge.
Design – working with stakeholders to develop solutions and select the mutually preferred option. It involves sharing knowledge and insight at critical stages of the solution
development process. This will include assessment of the solution options using the industry-developed whole-systems cost benefit analysis (CBA) tool3.
Fund – working with stakeholders to source and agree appropriate funding to deliver solutions. As we continue to identify whole-systems solutions over RIIO-ED2, we
will work with our stakeholders to explore the availability of external funding sources (e.g. NIA), internal funding sources and use of the coordinated adjustment mechanism (CAM) to appropriately allocate costs between energy sector stakeholders. How and when we will use the CAM remains uncertain and dependent on suitable projects emerging. Please see Uncertainty Mechanisms (Chapter 17) for an overview of uncertainty mechanisms in RIIO-ED2.
Deliver – working with stakeholders to implement solutions. Building on our experience of delivering whole-systems initiatives in RIIO-ED1 – such as Project LEO
and RESOP – the types of activity captured here include establishing joint program governance structures and project-specific ways of working and processes to share outputs and learnings with stakeholders.
It will take time to fully embed and normalise whole systems working throughout our business. With that in mind, we have prioritised activities where we can start having an immediate impact and which will help us manage the increase in resources required for whole systems working. Our experience from our RIIO-ED1 pilot projects has shown that whole system working is more resource-intensive than historic ways of working: Once stakeholders have started thinking about how we can support them with their objectives, they have high expectations of our involvement. And the pilot projects have required us to consider a wider range of issues and solutions to problems that we may not have considered if we were operating in isolation as a DNO.
We will create a new Whole Systems Engagement Coordinator role in each of our seven regions. These coordinators will have both technical and engagement experience which will facilitate an improved understanding of local considerations and support the increased collaboration necessary for a whole systems approach. The coordinators will act as a dedicated primary point of contact for local and regional stakeholders, providing a defined level of support to our communities. We will ensure clear lines of responsibility between activities where it is appropriate for electricity customers to pay, and those activities which are more appropriately funded by other stakeholders.

129 | Section D: Chapter Twelve: Whole Systems
DELIVERING EFFICIENCY IN OPERATIONS THROUGH WHOLE SYSTEM COLLABORATION
As part of StreetWorks UK and the HAUC UK Group, we’re developing processes to enable a collaborative approach to street works and excavations. We are engaging with local authorities, property developers and other utilities (e.g. water companies) to align on timing for works to be completed, to minimise disruption to customers and costs associated with multiple site excavations. This initiative enables multiple Utilities and Highway Authorities, including third-party contractors, to better coordinate street works planning and where possible, collaborate on delivery while maintaining our core commitment to safety. The benefits of collaboration include:
• The ability to reduce the duration and impact of noise pollution, delays and other aspects of street works on the highway and minimise the inconvenience to road users and pedestrians
• Encourages shared space in the highway through ducts and a single excavation and reinstatement as opposed to numerous works from different utilities. This reduces cable strikes and consequential damage to the highway
• Reducing costs and timescales for businesses by a reduction in permit fees, materials, reinstatement and traffic management charges
In the last 12 months, SSEN has actively collaborated on 141 separate operational sites, from planning of works across third parties, sharing traffic management equipment and 18 examples including sharing trench works with other organisations. From 2022 and into RIIO-ED2 we will explore process improvements to give confidence in our approach, understand cost allocation and responsibilities, and to build a register of other organisations who may benefit from this initiative and to maximise participation and amplify benefits for our stakeholders.
WHOLE SYSTEM SOLUTION FOR SKYE GENERATION CONNECTIONS
Whole System outputs have already been delivered in investment schemes, such as the Edinbane-Dunvegan project where over £2m of savings were achieved through Whole System collaboration. A number of generation connection acceptances to the 33kV network at Dunvegan on the Isle of Skye has driven the need for SHE Transmission to offer SHEPD a new 120 MVA transformer: while this was the best solution at the time it caused an issue with distribution circuit routing, conflicting with the proposed 132kV transmission circuit.
By working between both Transmission and Distribution options, engaging stakeholders and exploring their priorities – in this case cost and speed of connection, a Whole System solution was identified that presented a cost-effective alternative for both network operators/owners and our stakeholders.
The preferred solution will minimise the disruption to landowners with cabling and overhead line works reduced significantly, and while some existing agreements will need to be changed to reflect the new cabling arrangements all other impacts in terms of works, costs and inconvenience are reduced. The option will result in much lower costs for the developer’s enabling works, as all circuit routes will be much shorter. The reduced works required make it much more likely that the whole system solution will achieve consent, reducing the chance of delays to the customers. Further details are available in Whole Systems (Annex 12.1 in case study 7).
5.3 Opportunities for whole system solutions for Scottish island communities We are investing in RIIO-ED2 to maintain security of supply and meet the increased needs of customers across our Scotland Island networks. Within the same timeframe, other parties in the energy and wider sectors are considering making strategic and material investment in infrastructure in the same geographic locations. A significant proportion of our investment will be in close proximity to and even overlap with other potentially material energy investment decisions.
In our RIIO-ED1 Shetland whole system solution, we realised over £100m of customer value. We believe similar material value is possible during RIIO-ED2 for stakeholders if we can develop integrated whole system energy solutions in parallel with the needs of other vectors.
Our Hebrides and Orkney Whole System uncertainty mechanism (UM) recognises that these events in the wider energy industry and beyond represent opportunities for integrated solutions that meet the needs of a wider range of stakeholders and represent better overall present value. By integrating multiple solutions to individual needs, we believe a better value overall outcome is possible and we see multiple potential ways this could be realised in our island and remote communities during RIIO-ED2.
We have already initiated the discovery phase of this work and have included early conclusions within our business plan. We will use the remainder of RIIO-ED1 to work with all stakeholders to evaluate potential whole system outcomes, align decision making with external timelines and be ready to submit amended allowances and output deliverables to Ofgem early in RIIO-ED2. Further detail on our whole system UM for the Hebrides and Orkney is available in Uncertainty Mechanisms (Chapter 17).

130 | Section D: Chapter Twelve: Whole Systems
5.4.1 Supporting broadband to island communities through our assets
Our programme of work around subsea cables has strong potential for whole systems collaboration. Following a successful trial in Shetland, we are engaging with local authorities and broadband providers to investigate opportunities to include fibre and other communications assets in subsea cables to some of the 59 Scottish island communities served by our SHEPD network. The fibre optic within our subsea cable assets provides an opportunity to enable additional broadband capability for many island communities which are digitally-poor. Our proposal is intended to connect these island communities with fibre optic broadband for the very first time.
As a proof of concept, we successfully worked together with Shetland Island Council to ensure high-capacity resilient connectivity for Yell and Unst which supported the delivery of:
• 95% Next Generation Broadband across Shetland by 2019 and 100% by 2021
• Minimum of 100Mbps connectivity for Mid Yell and Baltasound Junior High and 10Mbps for all primary schools
• Provided public access to high-speed broadband in all council premises in Yell and Unst by 2020
• Enabled high speed broadband and mobile coverage in all NHS locations across Yell and Unst by 2020
• Enabled benefits to be delivered to Fetlar in a further phase
This is a genuine whole systems opportunity to work with the telecoms sector and deliver benefits to customers on the Scottish islands. We have identified 14 islands where we can provide this increased level of service and will proactively work with island Councils and communities to improve their connectivity. We have assessed the potential project coverage, inclusive of location, population and likely costs as part of the CVP preparation as well as completing Social Return on Investment (SROI) calculations on the benefits. We will prioritise the delivery of this whole systems solution early in RIIO-ED2. Further detail is provided in our Scottish Islands (Annex 8.1) and our Consumer Value Propositions (Annex S3) in our business plan.
Further detail is provided in our Scottish Islands (Annex 8.1) and our Consumer Value Propositions (Annex S3) in our business plan.
5.4.2 Embedded whole systems support for local authorities
We propose an above-and-beyond ‘Information, Advisory and Whole Systems Liaison Service’ to enhance the support we provide locally and to help unlock sources of financial support for net zero-driven projects and trials. This will enable smarter, local decision-making and will help to identify and design more whole systems opportunities to maximise overall societal benefits.
LAs rely heavily on our experience and on detailed and technical information from our systems. Our involvement can be significant, but where we provide that support, in the form of bespoke data, planning services and other information requests, it has a material positive impact on their submissions.
Historically, we have been able to support a maximum of two significant whole systems projects concurrently, but as the net zero transition picks up pace, we expect to see an increase in projects, plans and initiatives across our local authority areas, in our two licence areas. Our CVP proposes four services, offered individually or combined, from project to project, dependent on stakeholder needs:
• Local Information Package: Tailored data sets, network insights and expert guidance
• Whole Systems Opportunity Advisory Package: Resources to help improve the design and selection of schemes which are directly or indirectly related to the energy system
• Pre-funding bid support package: Help for more LAs and community groups to improve the quality of project funding submissions to improve their chance of success
• Technical delivery support package: Ongoing SSEN support during the delivery phase for large complex projects
We have tested our approach and the type of support we could provide with LAs, community groups, storage and renewables providers.
Our whole systems CVP proposal results in a net consumer benefit of £11.2m. For further information, please see our Whole Systems (Annex 12.1).
In a letter to Andy Huthwaite, SSEN’s Director of ED2, the Scottish Government confirmed its support for our business plan, recognising the potential for CVPs as a means of creating the right framework to underpin transformation in areas of the energy system that might not otherwise happen4. The letter referenced our proposed whole system support for local authorities, acknowledging its potential to provide a valuable resource for local authorities acting on their own decarbonisation ambitions. The letter also stated that “Plans for improving islands connectivity and resilience can help to significantly reduce the significant impact of sub-sea cable outages and reliance on stand-by diesel generation.”
5.4 Our whole system CVPs
A. Establish a Whole Systems Change Management team in 2021/22, to drive the organisational change required to transition to whole systems working. This includes raising the profile of Whole Systems within SSEN, external reporting on our Whole Systems progress and delivering our RIIO-ED2 transition pathway.
B. Redefine our internal processes to reflect whole systems thinking. Key activities include:
• At regular intervals on our whole systems projects and activities we will host structured lessons-learned sessions with all stakeholders involved
• Maintain a lessons-learned log, capturing key learnings from whole systems working to date, kept regularly updated as new project learnings are revealed. This log will be open and accessible to all our staff and will be shared with external parties on request.
• Host a quarterly whole systems review session with senior internal stakeholders, to complement broader external stakeholder engagement activity
• Publish a whole systems Annual Report to include metrics on our whole systems implementation (including stakeholder feedback captured through CVP surveys), and the action plan for the following year, as well as including the integration of learning from the previous year’s activity and engagement
ACTION PLAN6
4 Letter dated 22 November 2021, from the Scottish Government’s Energy and Climate Change Directorate, Head of Electricity Networks and Regulation.

131 | Section D: Chapter Twelve: Whole Systems
C. Engaging with stakeholders to develop whole systems approaches: Including working with our partners – the ENA-led Open Networks project, Energy Innovation Centre (EIC) which also includes water companies, Power Networks Demonstration Centre (PNDC), Whole Systems Development Forum, Whole Electricity System Joint Forum with National Grid ESO, Whole Systems Energy Sector Charter and the EV strategic Partnership with Scottish partners. We will also continue engaging with, and learning from, our SSEN Transmission colleagues on their progress in embedding Whole Systems.
D. Develop and deliver a training programme for all SSEN decision makers to ensure whole systems thinking is embedded in the organisation, starting in RIIO-ED1. We will deliver training sessions for all business unit leads on a) what whole systems is, including examples from across the business; b) how teams and individuals can adopt whole systems approaches and thinking in their teams; and c) share lessons learned from whole systems working to date. This training programme will be co-ordinated by our Whole Systems Change Management team. involved.
E. Establish a set of whole systems metrics to track the success of our integration of Whole Systems thinking and approaches into our business, and report using a combination of SLC 7A’s Whole System register and an annual report on the outputs of our Whole System Support CVP. From this we will develop a set of stakeholder informed metrics to measure the effectiveness of our Whole Systems activities.
F. Continue to review all our RIIO-ED2 load investments for whole systems solutions and for those with a value greater than £2m undertaking a quantified assessment. This will be done alongside assessing for flexibility options. We will continue to work with the ENA, other DNOs and the wider energy sector to test use cases for the Whole Systems CBA as a decision-making tool on an ongoing basis.
G. Draw-on investment in Open Data as defined in our Digital Strategy to provide a purpose-made data portal that can be used by local authorities, community groups and other utilities to enable whole systems collaboration. We will prioritise key datasets identified by stakeholders and develop an interactive tool (most likely via a data partnership) developed collaboratively with our customers and stakeholders.
H. Offer annual engagement on our DFES scenarios alongside Open Data to all local authorities in our areas to support the production of effective Local Energy Action Plans (LEAPs) and Local Heat and Energy Efficiency Strategies (LHEES). We propose to support local authorities to deliver their net zero ambitions through our baseline commitment of data sharing and DFES collaboration, reflecting the diversity of the regions in which we operate and the needs and ambitions of our different stakeholders. Local Network Plans will continue to form the basis for our annual system planning demand forecasts throughout RIIO-ED2, supported by 7 newly created Whole System Coordination roles that will ensure our data supports LEAPs and LHEES and that forecasting through our DFES accurately reflects local aspirations. involved.
I. Provide above and beyond support to 200 community groups and 72 local authorities to help them transition to net zero, including the production of area specific information and providing bespoke services as part of our proposed CVP. Above and beyond services we will provide to these groups include: tailored local information packages and guidance and interpretation of the data, scenario and output modelling, advisory support to assist groups to identify, scope and improve the design of Whole Systems opportunities, support with applications for funding for projects, and ongoing technical support during delivery to manage interdependencies with the SSEN network and other work.
DELIVERABILITY Given the interdependencies at the heart of a whole systems approach, the success of our transition to fully embedding the new ways of working depends on our stakeholders providing sufficient time and resource to engage with us. We are also required to operate within the existing framework of regulation and industry codes, which we expect will need to evolve to support these new ways of working.
Whole systems working will mean we can better access resources, knowledge and support from other organisations to deliver benefits to our customers, but it will also be more resource intensive. In some cases the benefits from our efforts to work in a whole systems way may accrue unequally to the parties involved – for example there may be some instances where we provide support to a third party that enables them to do things better, but there could be little benefit to our customers or ourselves from this (and a cost would be incurred to provide the support).
As we have finite resources available to respond to requests for support through our whole systems engagement coordinators, in some cases we may not be able to provide the full extent of support others expect to receive. To manage this, we will identify priorities and seek to minimise the impact where it may not be possible to provide all the support requested. Through our regular surveys and reporting, we will remain accountable to deliver a positive experience to all our stakeholders.
We recognise there is uncertainty relating to the potential uptake of the whole systems support we are offering to stakeholders, primarily linked to the level of ambition from stakeholder groups and local authorities to take a proactive role in reducing carbon emissions. As such, we will consider how to use the proposed Ofgem net zero reopener to manage this uncertainty and should uptake exceed our expectations, seek additional funding to allow us to continue our proactive support for net zero and maximise the benefits to society by taking a whole systems approach.
7

132 | Section D: Chapter Thirteen: Environmentally Sustainable Network
CHAPTER THIRTEEN: ENVIRONMENTALLY SUSTAINABLE NETWORK
We are proposing to invest £172.3m to reduce our environmental impact during RIIO-ED2, building a sustainable, green electricity network that benefits everyone and supports the decarbonisation of the wider economy. This now includes £41.5m to remove Polychlorinated Biphenyl (PCB) compounds by 31 December 2025 as required under recent UK legislation.
Our commitment to an accredited Science-Based Target (SBT)1 for greenhouse gas emission reduction underpins our ambitious programme of activities to drive down our Business Carbon Footprint (BCF) and support others as they reduce theirs.
Demonstrating our climate leadership
We are the first UK DNO to set an SBT in line with a 1.5°C pathway in October 2021. Our proposed 1.5°C target is aligned with current climate science, going a step further than the original Paris Agreement2, and will include electrical losses in line with the greenhouse gases protocol. This will require at least a 35% reduction in our combined Scope 1 & 2 emissions by 2028, 55% reduction by 2033 and an ambition of meeting net zero by 2045 in a credible and transparent way.
We are also working with our supply chain and have set a voluntary target to support 35% of our suppliers to set their own SBT by 2026.
SUPPORTING DOCUMENTS
Environmental Action Plan (Annex 13.1)
Sustainability Strategy (Annex 13.2)
Total investment in this chapter Comparison to RIIO-ED13 Business Plan Data Tables
£161.3m in our Environmental Action Plan (including £41.5m for PCB removal)
No direct comparison available4 C4, C5, C6, CV15, CV21, CV22, CV16
£11m for visual amenity £7.1m to date CV20
£2.6m funding for our Life Below Water Consumer Value Proposition
New for RIIO-ED2 Not included in baseline plan, in line with Ofgem guidance
1 https://sciencebasedtargets.org/2 The Paris Agreement is a legally binding international agreement on climate change. It was adopted by 196 Parties at COP21 in Paris, on 12 December 2015.3 Comparison is to the last five years of RIIO-ED1. 2020/21 prices.4 Environmental costs were split across several cost categories in RIIO-ED1.
BALANCING THE ENERGY TRILEMMA
The energy trilemma describes the balance between secure energy supplies, social impact and environmental sensitivity.
We know that climate change is generally expected to disproportionally affect low-income and vulnerable customers. Action must be taken on decarbonisation and security of supply, but measures cannot be considered in isolation and those selected must be cost-effective, particularly in light of the current energy crisis.
Our Environmental Action Plan (EAP) demonstrates how our business activities and practices will deliver value to our customers and the communities we serve during RIIO-ED2. Our aim is to ensure that no one is left behind as we transition to net zero.
SECURE AND RELIABLE
AFF
OR
DA
BLE
& A
VA
ILA
BLE
GR
EEN A
ND
CLEA
N
£Secure and reliable – the reliability of energy infrastructure and the ability to meet current and future energy demands.
Green and clean – development of energy supplies from renewable sources and other low-carbon sources. Use of low-carbon technologies.
Affordable and available – accessibility and affordability of energy supply.

133 | Section D: Chapter Thirteen: Environmentally Sustainable Network
ENHANCED ENGAGEMENT OVERVIEW
Based on engagement with 9,475 stakeholders across 37 events on Environmentally Sustainable Network, and they identified the following RIIO-ED2 priorities:
1
TOP STAKEHOLDER PRIORITIES
KEY STAKEHOLDER INSIGHTS
We should set ambitious targets to reduce our operational emissions
Collaborate with our supply chain to help them reduce their emissions
Reduce our environmental impact by removing potentially harmful cables and reducing visual pollution
Improve the biodiversity in our service areas and increase natural capital for long-term emission removal
Open discovery
• Around half of our customers in the Priorities Survey stated that progressing the network towards a more sustainable future was important to them and should be a focus for us.
• We should prioritise climate change both through the mitigation of its effects, reduction of our emissions and by reinforcing infrastructure.
• We should work to reduce our emissions as well as assist others to do the same
Co-creation
• The consensus during the sustainability co-creation workshop was that the targets should be ambitious, especially around the reduction of our carbon footprint
• Science-based targets (SBT) were noted to be utilised across industries as best practice, and that we should set targets to align with limiting warming to 1.5°C.
• We shouldn’t only focus on carbon. Our environmental action plan (EAP) should also include reducing fuel consumption, biodiversity and natural capital and our supply chain
Business Plan refinement
• Reducing our BCF was given one of the highest priorities during the willingness to pay (WTP) surveys, particularly for southern domestic customers
• Starting the SBT accreditation process was welcomed but targets should be ambitious
• Despite the removal of incentives to reduce Scope 2 emissions-related to losses, we should still aim to improve
• Offsetting emissions was deemed transparent although shouldn’t replace abatement
Testing and acceptance
• There was widespread support for our EAP and ambition towards reducing our carbon footprint, with stakeholders pleased with our commitment to set SBT and tackle scope 3 emissions
• Stakeholders focused on the importance of improved biodiversity and natural capital, particularly when looking at long-term carbon removal
• Some questions remained about how we would demonstrate accountability for meeting targets with stakeholders
to August 2020
Aug 20 – Feb 21
Feb 21 – Jun 21
Jun 21 – Dec 21
4
HOW WE RESPONDED TO FEEDBACK
*Enhanced Output* Annual Environmental Action Plan (EAP): Stakeholders wanted us to have ambitious targets and programs. We shall be reporting annually on all of our targets through our Annual Environmental Report, so we stay accountable. When the strategy and associated costs were tested with stakeholders, they were supported as sufficiently ambitious and comprehensive while being affordable.
*Enhanced Output* 1.5°C SBT: Prioritisation of a large reduction in our business carbon footprint in the WTP research has led us to be the first UK DNO to set SBTs that align with a 1.5°C trajectory, going well beyond original minimum requirements. (Acceptability – 79%)
*Enhanced Output* SF6 emissions: Stakeholders mentioned the importance to manage SF6 on our network, which we’re addressing through our Enhanced SF6 leakage reduction strategy and emissions target which will drive alternatives.
*Enhanced Output* Network Losses: To address stakeholder concerns, we will classify losses as a Scope 2 emission as well as acting to efficiently manage and reduce actual losses.
*Enhanced Output* Reducing diesel generation: Diesel-embedded generation was recognised as a key barrier to carbon-emission reduction, so we’ve committed to producing a diesel strategy to transition away from carbon-intensive fuels on the Scottish Islands, while also balancing the cost to consumers.
*Enhanced Output* Local Flexibility Solutions: To support reducing our reliance on diesel backup generation, stakeholders wanted us to explore local solutions and flexibility to help solve the issue.
*Enhanced Output* Biodiversity improvement: Where we can’t abate carbon, stakeholders want us to remove it through natural capital and biodiversity improvements in the communities we serve. (Acceptability – 79%)
*Enhanced Output* Pollution Prevention: Stakeholders want to see us reduce the environmental impact of operations to prevent pollution risk. We have increased our ambitions to 1) replace fluid-filled cables 2) improve bunds surrounding oil containing equipment and 3) continue to underground overhead lines to improve visual amenity.
Electrify Fleet: A key area of focus for stakeholders to reduce operational emissions. (Acceptability – 75%)
Supply Chain: We have committed to a voluntary SBT – “35% of our supply chain will have set their own SBT by 2026”. We have also launched a ‘Supply Chain Sustainability School’ to help them to understand SBTs and other aspects of sustainability to assist them on their net zero journey. (Acceptability – 76%)
79% CONSUMER ACCEPTABILITY FOR ACCELERATED PROGRESS TOWARDS A NET ZERO WORLD
* Enhanced Output* – This denotes a change in ambition or scope in the output between our draft and final plan.

134 | Section D: Chapter Thirteen: Environmentally Sustainable Network
OUTPUTS AND AIMS2
Output Type Target Consumer benefitCosts in our baseline plan
ENVIRONMENTAL ACTION PLAN
Environmental Action Plan (EAP)
LO/ODI-F Produce and report annually on an Environmental Action Plan (EAP)
• We will decarbonise and improve the environmental performance of our network and the wider community
• Improved air quality, reduced carbon emissions and net zero
£172.3*m
Set Science-Based Targets, accredited with the SBTi
Part of EAP Set an ambitious 1.5°C SBT (including losses) requiring at least a 35% reduction in our carbon footprint by 2028
• Reduced carbon emissions
• Targeting embodied carbon through supply chain
Part of EAP
Reduce SF6 emissions from our assets
PCD/ Part of EAP
Reduce emissions from our assets by a minimum of 35%, and begin reducing our holdings
• Reduction in the amount of toxic gas emitted by our assets, in line with our 1.5°C SBT
• £2.5m societal benefits delivered by reduction in carbon emissions
Part of EAP (£5.6m)
Manage losses on our network
Part of EAP
Implement a strategy to efficiently manage losses on our network in the long term
Reclassify losses as a Scope 2 emission and act to reduce actual losses
• Reduced transformer losses by up to 30% through our TASS project
• Substation Energy Efficiency improvements
• Manage significant losses incrementally across our network by applying loss reduction tech first
• £36m societal benefits delivered by energy savings and lower carbon emissions as a result of reduced losses
Part of EAP (£4.9m)
Reduce emissions from mobile diesel generation during interruptions
SSEN Aim/ Part of EAP
Reduce emissions by replacing mobile generators wherever possible with lower-carbon alternatives or by using alternative lower carbon fuel types by 2028
• £1.4m financial benefits delivered by cheaper fuel costs
• £1.5m societal benefits delivered by a reduction in carbon emissions and improved air quality
Part of EAP (£2.2m)
Reduce the reliance on our back up embedded diesel generation on our islands
SSEN Aim/ Part of EAP
Reduce reliance on diesel back-up generation, exploring local solutions and flexibility opportunities from the start of RIIO-ED2
• £0.4m financial benefits delivered by cheaper fuel costs
• £0.2m societal benefits delivered by a reduction in carbon emissions
Part of EAP (£9.5m)
Nature-Based Solutions for Carbon Removal
PCD/ Part of EAP
Plant 2,000 hectares of native woodland and restore 1,200 hectares of peatland in our licence areas, which are expected to remove up to 300,000 tonnes of CO2e by 2045, and provide 3000 biodiversity units by 2045
• Biodiversity baselining
• A transformational and longer-term approach for net zero, that provides a legitimate and transparent record of carbon abatement
• Improved air quality and local habitats
Part of EAP (£26.4m)
Polychlorinated Biphenyl (PCB) compounds
PCD/ Part of EAP
Removal of all PCB-contaminated assets from our network by 31 December 2025
• Compliance with new legislative requirement to remove PCB across all DNOs
• Transparency on the volume of PCB contaminated equipment on the network (through our AER)
Part of EAP (£41.5m)
Reduce leakage from fluid-filled cables
PCD/ Part of EAP
Replace 72km of fluid-filled cable and reduce oil leakage by 20% relative to 2019/20
• £15m societal benefit delivered by reducing oil leakage
Part of EAP (£37.3m)
Complete flood-related activities in compliance with obligations
PCD/LO/ Part of EAP
Complete works at c.73 sites across our network in line with Engineering Technical Report 138
• Reduced impact of flooding on our network leading to improved resilience to climate change
Part of EAP (£24.2m)
Sustainability supplier code
SSEN Aim/ Part of EAP
Sign up 80% of our supply chain (by value) by 2028 to our Sustainable Supplier Code
• Contribution to lower emissions across multiple companies in our supply chain
Incremental
Reducing travel-related emissions
SSEN Aim/ Part of EAP
Electrify 80% of our core vehicle fleet by 2028, reduce our average road mileage by 15% (from pre-covid levels) and limit air travel where possible
• £1.9m societal benefits delivered by reduction in carbon emissions
Incremental
OTHER ACTIVITIES
Undergrounding in Areas of Outstanding Natural Beauty (AONBs) and National Parks (NPs)
Use it or lose it Underground up to 83km of lines • Improved visual amenity of lines in National
Parks and Areas of Outstanding Natural Beauty
Part of EAP (£11.0m)
Protecting marine biodiversity: Life below water
CVP Explore opportunities to improve our marine environment
• Restoring ancient seagrass beds that have been destroyed by seabed activity provides carbon sequestration rates three times higher than on-land planting
• improving natural habitats and protecting against coastal erosion
• £3.4m net benefit to the environment
£2.6m
LO: Licence Obligation; PCD: Price Control Deliverable; ODI: Output Delivery Incentive (F: Financial, R: Reputational), CVP: Consumer Value Proposition, SSEN Aim: Company Goal
* This cost includes the outputs set out here plus further commitments, which are set out in Environmental Action Plan (Annex 13.1).

135 | Section D: Chapter Thirteen: Environmentally Sustainable Network
Output Performance RAG
Environmental performance
Overall, we have improved our BCF reduction performance since the start of RIIO-ED1 and are making good progress towards our challenging target of 15% reduction by the end of the period. We face unique challenges in the context of our SHEPD network, where diesel generation still plays a key role in ensuring security of supply
We no longer install fluid-filled cables on our networks, and we continue to tag our existing cables with a tracer oil to efficiently locate and repair leaks. Our strategy to minimise SF6 leakage from our switchgear, implemented in 2019/20, focuses on using updated data to improve our understanding of our SF6 assets. We had an ambitious RIIO-ED1 target on both our networks to reduce SF6 by 15% and although we are currently behind, we are seeing benefits from the strategy and expect continued improvement of our performance in the final years of this price control
TRACK RECORD
3.1 Outputs performance We have experienced some challenges in RIIO-ED1 in particular due to the characteristics of our SHEPD network and the challenging nature of the targets we set ourselves at RIIO-ED1.
3
TAKING A LEADERSHIP POSITION AND IMPROVING TRANSPARENCY
In October 2021, we were the first UK DNO to set SBTs in line with a 1.50C pathway that were accredited by the Science-Based Target initiative. Using SBTs gives stakeholders and customer assurance that we are being transparent in our efforts to reduce our BCF, that we are making a valid contribution to minimise the risks associated with climate change, and that we are on a credible pathway towards achieving net zero.
In November 2017, we committed to meeting the Task Force on Climate-related Financial Disclosures (TCFD) recommendations. We report on risks to our network and business performance that are driven by climate change. For example, implementing mitigation measures against the increased risk of flooding, or the risks to our assets due to hotter temperatures, causing potential wildfires and droughts. We also review opportunities created by decarbonisation, including the electrification to heat and transport, and what that means to our business now and in the future.
3.2 Transitioning to RIIO-ED2 We have carried out benchmarking on our RIIO-ED1 performance – in 2019/20 we were ranked 14th and 8th for SSEH and SSES respectively. We understand that a considerable step-change in our approach to the environment is required if we are to contribute to and deliver on climate change legislation relating to net zero. A credible SBT will provide clarity on the task, which is significant, and assurance to our customers, other stakeholders and Ofgem that we are on a credible carbon-reduction pathway.
We have learnt significant lessons in RIIO-ED1, particularly the importance of the environment and sustainability as a key driver across the whole of our business:
• We are changing our approach in RIIO-ED2 and have already embedded a dedicated team tasked with achieving an independent ISO accreditation by the end of RIIO-ED1. Currently we sit under our Group EMS. This will underpin our Environmental Action Plan activities
• We are taking a strategic approach to key environmental issues across our plan, proposing PCDs to demonstrate our commitment to reducing our impact in a number of key areas, and delivering against stakeholder expectations. Our use of innovation in RIIO-ED1 has provided valuable insight and learning
• We will take the learning from network innovation projects and convert that learning into business as usual
• We face specific challenges in the island communities we serve, where diesel generation still plays an important role in ensuring a reliable supply of electricity
• We are committed to exploring alternative solutions through our RIIO-ED2 plan, with a strong focus on whole system and innovation
INNOVATION AS BUSINESS AS USUAL
The Transformer Auto Stop Start (TASS) method helps reduce electrical losses on the 33kV and 11kV networks. It involves switching off one in a pair of transformers in selected substations to reduce fixed losses.
We first tested and deployed this approach as part of our Low-Energy Automated Networks (LEAN) project, and it will be central to effectively managing losses on our network in RIIO-ED2.

136 | Section D: Chapter Thirteen: Environmentally Sustainable Network
We contributed £1,006m to the UK GDP over the 2019-2020 financial year and supported 9,710 jobs across the UK
DELIVERING SUSTAINABILITY IN RIIO-ED2 We are committed to the principles of a just transition which will support our shift out of a high-carbon world and into a net zero world. Our work with the Centre for Sustainable Energy explores social justice in the future energy system and examines how the transition to a net zero energy system can be both smart and fair. This work has identified those who are likely to be unfairly disadvantaged, and the next phase will develop mitigation strategies to ensure a net zero transition that benefits everyone.
As part of building our own SSEN Distribution sustainability identity and our commitment to accountability we have developed a governance route to our Scottish & Southern Energy Power Distribution (SSEPD) Board – see Section 5 of our EAP (Annex 13.1) for more details. To ensure transparency and develop trust, we will commit to public disclosure and reporting annually on our progress relating to climate action and environmental management through our Annual Environmental Report (AER) for stakeholders, and other regulatory reporting.
Our ambition will be supported by our commitment to drive cultural change and encourage colleagues to make conscious decisions that align with our stakeholders’ sustainability priorities.
Our vision is to act as a key enabler for the energy transition and lead by example in reducing our own impact on the environment.
As part of SSE plc, we’ve committed to fair and transparent tax practices supporting the services society needs to thrive. We were the first FTSE 100 company to receive the independent Fair Tax Mark and have been reaccredited every year since 2014. We’re proud to take a leading role in championing Fair Tax practices and want to work with our energy networks peers to ensure standards of transparency, like the Fair Tax Mark criteria, are widely adopted across the industry.
Over the past year, we’ve also actively committed to accelerating network investment to support a green economic recovery and the creation of jobs and skillsets to put us on the path to net zero.
The United Nations Sustainable Development Goals (SDGs) are a collection of 17 global goals introduced in 2015. They are a global framework, aimed at policymakers to ensure a sustainable world. They target the three pillars of Sustainable Development – Economic, Social and Environmental issues.
We have used the SDGs as the foundation for our Sustainability Strategy, linking our sustainability ambitions and commitments directly to the relevant SDG to make it easy to understand the areas we hope to impact with the activities we propose.
By founding our sustainability ambitions on the UN SDGs our stakeholders and consumers can trust that our initiatives are driven by legitimate, credible, global expertise, enabling us to guide our communities to a decarbonised future in a fair and inclusive way.
4
4.1 A global framework driving local change Our stakeholder have told us they prioritise the following SDGs:
4.2 Our sustainability ambitions Our sustainability ambitions aim to create a fair and just decarbonised electricity network for the future, which will bring societal value during RIIO-ED2.
We are proud of how we have developed our strategy together with our stakeholders and our wider business. An extract of our overall five sustainability ambitions can be seen below in Figure 13.1. Following consultation with our stakeholders our strategy has been refined and launched on our website.5 it can be read in full in our Sustainability Strategy (Annex 13.2).
5 https://www.ssen.co.uk/sustainability/

137 | Section D: Chapter Thirteen: Environmentally Sustainable Network
Figure 13.1: Our sustainability ambitions
1. SERVING THE THE PUBLIC INTEREST
2. THE NET ZERO TRANSITION
3. ENHANCING OUR LOCAL ENVIRONMENT
5. INVESTING IN PEOPLE
4. INCLUSIVE SERVICE PROVISION
We will work collaboratively to build trust and ensure legitimacy in everything that we do, for the greater good of our local communities and GB.
We will support the global drive to net zero by committing to a climate science backed net zero goal, which is also considerate of wider societal impact.
We will ensure a net positive impact to environments we disrupt and commit to no further degradation to our local environments.
We will operate in a manner that is inclusive, fair and provides for the needs of all customers and communities we serve.
Act
ion
Pla
n
Monitoring & Reporting
Feed
bac
k &
Rev
iew
Governance & Organisation
SUST
AIN
AB
ILIT
Y C
OM
MIT
MEN
TS
REL
AT
ED S
DG
S
We’ll build a more inclusive and diverse workplace where people can thrive, be themselves, contribute to SSEN Dsitribution being a great place to work and make a positive impact on society:
BAU Reliable Network
Decent Work and Economic Growth
A Climate Resilient Decarbonised Network
Future Connections and Low-Carbon Technology (LCT) supply
Supply Chain Collaboration
1.1
1.2
1.3
1.4
1.5
2.1
2.2
2.3
2.4
2.5
3.1
3.2
3.3
3.4
3.5
3.6
3.7
3.8
3.9
3.10
4.1
4.2
4.3
4.4
4.5
5.1
5.2
5.3
Whole System Approach
Smart and Flexible Markets
Decarbonisation of Transport and Heat
Innovation for The net zero Transition
Science-Based Targets
Reduce SSEN Distribution Carbon Footprint
Reduce Electricity Distribution Losses
Hexafluoride (SF6)
Reduce Embodied Carbon
Sustainable Supply Chain
Reduce Resource Consumption
Enhancing Biodiversity and Natural Capital
Fluid Filled Cables
Minimise Noise Pollution
Develop a Stakeholder Engagement Strategy
Include Data and Other Feedback into Measurable Outcomes
Customers at the Heart
Support Customers in Vulnerable Situations
Maintain Strong and Strategic Partnerships
Invest in Workforce Resilience to ensure we have a modern, high-quality, well-trained workforce with the skills fit for the net zero Transition
Enabling Inclusive and Accessible Workplaces
Enabling Inclusive and Accessible Products and Services
Our EAP sits under sustainability theme 3: enhancing our local environment. Here we commit to ensuring a net positive impact to environments we disrupt and commit to no further degradation to our local environments. The actions required to meet these commitments are discussed below.
STAKEHOLDER INSIGHTS: PEATLAND RESTORATION
During engagement, stakeholder support for the removal of carbon through natural capital and biodiversity investment was strong across different groups. In particular, environmental groups welcomed our proposals for a natural capital output but felt it should include peatland restoration, not least as it would go some way in mitigating the impact of previous activity.
Community interest groups felt that tree planting where there hadn’t been trees before had questionable value but suggested “a better idea is to restore peatland and salt marshes in the relevant areas”.
Participating government agency representatives also saw great opportunities for peatland restorations, referencing the ‘Peatland ACTION Project’ and how they are looking for massive private investment to restore 60%+ of the 20% of Scotland’s land that is peatland for carbon storage.
In its January 2020 report on land use, the Committee on Climate Change argues that “Restoring at least 50% of upland peat and 25% of lowland peat would reduce peatland emissions by 5MtCO2e by 2050” and says that there is a “high risk that degraded peatlands will be lost due to hotter and drier conditions in the changing climate unless they are restored”.
OUR ENVIRONMENTAL ACTION PLAN
By delivering an environmentally sustainable network we are committing to tackling the challenge of climate change head-on for our customers, stakeholders and local communities, in a transparent and ethical way, aligned with the latest climate science and government policy.
We also commit to stating our targets as clearly as possible to enable our stakeholders to track progress and hold us to account. Our full EAP can be found at (Annex 13.1). It ensures environmental considerations are embedded into our network investment decisions and operational activities and that these are based on the latest climate science and net zero targets. It has been designed to be dynamic to cater for the changing needs of stakeholders, society and in the environmental policy landscape.
Our stakeholders have been consistent in their support of setting a science-based target that will achieve a 1.5°C trajectory and our plan is fully aligned to that.
Figure 13.2 below provides an overview of the key investments in our EAP. These are supported by a set of robust Engineering Justification Papers (EJPs).
5

138 | Section D: Chapter Thirteen: Environmentally Sustainable Network
COST WHEEL WITH DIESEL
• 1.5°C meaning a 35% reduction in our BCF in RIIO-ED2, including SF6
• Targeted actual Scope 2 losses emissions
• Improved Natural Capital & Biodiversity through restoration of peatland and woodland
• 71.9km replacement programme to reduce oil pollution risk from oil filled cables
• Restoring natural beauty of our environment for stakeholders in key areas
• EV100 commitment meaning 80% of our operational fleet (<3.5t) will be EV by 2028 and 100% by 2030
• Securing a sustainable supply chain and targeting embodied carbon
• Exploration and implementation of diesel alternatives across our standby generation fleet
• Transparent Waste Disposal
• Removing polychlorinated biphenyls (PCBs) in line with legislation
Figure 13.2: Our Environmental Action Plan key investments
Restoration of our environmental beauty through Visual Amenity
Climate Adaptation through protecting our network from flooding risk
Pollution Prevention and Legislation Compliance – Removal of Polychlorinated biphenyls (PCBs) Pollution
Prevention – Removal of Fluid
Filled Cables (FFCs) and prevention of oil leaks
Delivering a responsible Net Zero through accountability, transparent
targets, clear reporting and green restoration
£58.3
£37.4
£41.5
£172.3m
£24.2
£11.0
5.1 Our proposed programme of activity to reduce our Business Carbon Footprint
Science-based targets Our targets are in line with the level of decarbonisation required to meet the most ambitious goal of the Paris Agreement – to limit global warming to 1.5°C above pre-industrial levels. Verified by the Science-Based Targets initiative (SBTi), we’re cutting emissions further and faster by:
• Committing to reduce our combined Scope 1 and 2 emissions by 55% by 2033 from a 2020 baseline
• Setting a voluntary target and committing to working closely with our supply chain so that 35% of our suppliers will set science-based targets by 2026
We are seeing increasing support from key stakeholders, consumers and policy makers that any targets set must align with net zero and thus adopt a 1.5°C trajectory.
Our targets include losses as a scope 2 emission in line with GHG protocol; we are serious about doing everything we can to address the issue of losses. We also want to be open, transparent and held accountable on our other areas of material impact, to ensure they get the focus they deserve. For that reason, we will report on these areas separately where appropriate. We have also set a voluntary target on emissions from purchased goods and services, and capital goods. This is our first step in our plan to reduce our embodied carbon. Following on from our supply chain engagement, we have set a target to have 35% of our supply chain also having set a science-based targets by 2026.
In line with the SBTi policy publication on Net Zero in October 2021, we believe that setting a credible net zero target allows us to create a longer-term accountable solution that provides consequential benefits to our communities with benefits through air quality and habitat improvements. A credible net zero cannot rely on abatement alone – we must have some form of carbon removal. Our plan includes for targeted natural capital investment to achieve this over the RIIO-ED2 period.
BA
SE
LIN
E Y
EA
R 2
02
0
EN
D O
F R
IIO
- E
D2
20
28
DE
LIV
ER
Y Y
EA
R 2
03
3
COMMIT to a 35% reduction
in Scope 1 & 2 emissions by 2028
COMMIT to a 55% reduction
in Scope 1 & 2 emissions by 2033
OPTIONAL Commit to a 35% of our supply chain having set
SBTs by 2026
OPTIONAL Commit to a 55% of our supply chain having set
SBTs by 2033
1.5°CScience-Based Target

139 | Section D: Chapter Thirteen: Environmentally Sustainable Network
LossesWe will invest at least £4.9m through our EAP, and in addition there is significant incremental investment included in other areas of the plan to effectively manage and reduce actual losses. We are fully committed to addressing the issue and amongst the first to have included losses as Scope 2 in line with GHG Protocol. This means that we will include them in our SBTs and demonstrate their overall contribution to our net zero journey for complete transparency.
Our losses reduction strategy will set minimal cable sizing and specify loss reduction equipment as a first choice for our specifications. We will target substation energy efficiencies and apply learnings from our innovation project to maximise impact. We will improve our understanding of our network, particularly at LV level.
Moving through the energy transition and adopting a flexibility first principle could drive losses up. We will use data to understand and identify where losses occur and further inform our investment decisions.
Our losses reduction strategy will deliver £36m of societal benefits through energy savings and lower carbon emissions.
SF6 We will reduce SF6 emissions from our assets by a min of 35% by 2028 (from 2019/20 levels), in line with our 1.5°C trajectory. We propose to introduce a Price Control Deliverable to demonstrate our commitment to delivering for our customers and stakeholders. We have developed a programme to target and remove the SF6 equipment with the highest leakage rates and improve the management of SF6 assets. For every replacement identified we will explore alternatives through innovation and with our supply chain.
As well as managing down leakage rates, we will commence our programme of reducing our overall SF6 asset bank. We will not add any new installations of SF6 at 132kv unless absolutely necessary, noting even “green gas” equivalents include some levels of SF6.
We will target a reduction in SF6 emissions of at least 93.5kg which equates to 2312.2 tCO2e during RIIO-ED2.
Our SF6 strategy will deliver £2.5m of societal benefits delivered by reduction in carbon emissions.
Diesel Consumption We will invest £11.7m to reduce diesel consumption, with a strong focus on reducing our reliance on all types of back-up generation. We will deliver a strengthened Reliability Strategy (Annex 7.2), and transition to greater utilisation of hybrid mobile generators across both our license areas. In the Scottish Islands we are looking to improve the efficiency of the current arrangements and commit to exploring local solutions throughout RIIO-ED2 to reduce our reliance on these assets and transition away from them in full where possible by the end of RIIO-ED3. This is an issue that is specific to our Scottish network and reflects the remote nature of some of our communities. We will be exploring whole-system and flexibility solutions, learning through innovation projects like RaaS (Resilience as a Service) to develop local solutions to reduce our island diesel consumption. We have added our Hebrides and Orkney Whole System Uncertainty Mechanism (HOWS) to support our future diesel reduction. This is set out in our Diesel Strategy that we will implement ahead of RIIO-ED2.
Our proposals will produce financial benefits of £1.8m and wider societal benefits of £1.7m.
Reducing travel-related emissions and building energy use We will lead by example in decarbonising our fleet. As a signatory to the EV100 commitment we will transition 100% of all vehicles up to 3.5t, and 50% of fleet vehicles above that weight by 2030. By the end of RIIO-ED2 we will have achieved 80% and 40% respectively. By reducing our travel-related emissions we will deliver £1.9m of societal benefits.
We will invest £5m to implement low-carbon technology and energy efficiency drives in our offices and depots, where we can, targeting a minimum 5% reduction in energy use.
5.2 Reducing our wider environmental impact and managing flooding Removal of fluid-filled cables and reducing oil leakage We plan to remove 72km of fluid-filled cables from our network by 2028; and reduce leakages by a minimum of 20%. To do this we plan to invest £37.4m and producing £6m of societal benefits.
Removal of Polychlorinated Biphenyl (PCB) contaminated assets Historically, Polychlorinated Biphenyl (PCB) compounds were used as an insulating material and coolant in transformers and other electrical equipment, However, they are an organic compound resistant to environmental degradation and have now been classified as Persistent Organic Pollutants.
UK legislation previously allowed transformers with PCB to remain in service until the end of their operational life but there is now a change in the legislation which requires their removal by 31 December 2025. Through the ENA, the DNOs have agreed a programme of replacing all contaminated transformers across the industry by the legislative deadline. We are proposing £41.5m of baseline expenditure to ensure all PCB-contaminated assets are removed from our network by the deadline, along with an uncertainty mechanism that will provide the flexibility to ensure funding is available once further information on volumes is available. We have also embedded over £14m of efficiencies into our plan through reduced asset unit rates.
Further information can be found in the EAP (Annex 13.1) and our Uncertainty Mechanisms (Annex 17.1). We continue to discuss RIIO-ED1 funding with Ofgem to enable us to meet legislative changes.
Nature-Based Solutions for Carbon Removal We are proposing significant investment in natural capital to achieve the carbon removal required to improve our local ecosystems and habitats as well as helping us to meet our net zero goal. We could choose to offset but believe that nature-based solutions provide more value and will deliver more longer-term benefits for our customers and the communities we serve. This is the option most supported by our stakeholders.
We will invest £25.7m in both reforestation and peatland restoration activity to mitigate our wider impact on the environment. This will contribute to the mitigation of our tree cutting operations, and we will work to understand and reduce the impact this has. We will also engage our workforce in related activity as part of our programme of responsible citizenship. Working on our own or with trusted partners, we can ensure the credibility of carbon sequestration rates, and improve air quality and natural habitats in the longer-term for our local communities. Acting now means we can build a sustainable carbon sequestration resource in time to meet net zero goals. We will develop a tool to baseline our existing natural capital portfolio, and to monitor the provision of ecosystem services from our sites. We will work collaboratively with other DNOs and the TOs to develop this tool. This will provide us with a baseline where we can ensure the impact of future projects are mitigated.

140 | Section D: Chapter Thirteen: Environmentally Sustainable Network
TURNING INSIGHTS INTO ACTION
When we engaged with stakeholders in January 2021 to co-create our approach to biodiversity, we shared our plans to research and implement new ways to achieve ‘no net loss’ of biodiversity on new projects in RIIO-ED2. Although the stakeholders – who represented a range of segments, including consultants, environmental groups and community energy groups – were positive about this approach they challenged us to go further and adopt a policy of biodiversity ‘net gain’.
When we discussed with them about what this might involve, they noted that as we hold a substantial area of land, we should consider using this to rewild the local environment by creating new woods of indigenous tree species (as opposed to simply planting timber forests that would be harvested in the medium term). Once established, these would deliver long-term carbon sequestration to help mitigate climate change.
Stakeholders encouraged us to work with partners such as the RSPB and wildlife trusts to maximise these as wildlife habitats too.
As a result, we have committed to create a long-term solution to ensuring that biodiversity ‘net gain’ becomes a reality by investing in targeted reforestation and peatland restoration and replanting initiatives across both of our licence areas.
PROTECTING MARINE BIODIVERSITY: LIFE BELOW WATER CVP
We are proposing to improve biodiversity in the seas around our island communities, in locations at or close to our subsea cables. We are exploring opportunities to restore seagrass beds in both our licence areas which have not already been initiated by existing marine conservation initiatives. Seagrasses support marine food webs and provide essential habitats for many coastal species, playing a critical role in the equilibrium of coastal ecosystems. Despite their importance, seagrasses are disappearing from threats such as pollution, decreased water clarity, and physical disturbance. Over the last century, 92% of the UK’s seagrass has disappeared.
We want to undertake an ambitious programme of targeted seagrass meadow planting in and around the communities we serve. Our proposal is ambitious in scale, with only 3 hectares having been restored to date, through this CVP we propose to deliver up to an additional 17 hectares of seagrass beds at a cost of £2.6m, with an estimated net benefit of £3.4m and social return on investment of £1.37 on every £ spent.
This initiative will help restore the health of our oceans and delivering improvements to customers through improved water quality, increased carbon sequestration, reduced coastal erosion and increasing biodiversity in our coastal waters.
Please see Consumer Value Propositions (Annex S3) for further details.
Supply chain management We will implement a Sustainable Supplier Code and commit to 80% of our supply chain (by value) signed up by the end of RIIO-ED2, with an aspiration to achieve 90%. We will report on progress through our Annual Environment Report (AER).
Embodied carbon We propose to develop and implement a tool that allows us to calculate our embodied carbon from manufacture to implementation for projects starting in RIIO-ED2. We aim to achieve a 5 to 10% reduction in embodied carbon by 2033.
Resource use and waste We are committing to zero waste to landfill, excluding compliance waste, by the end of RIIO-ED2. In addition, we will achieve a recycling, recovery and re-use rate of 90% or more across our waste streams by the end of RIIO-ED2. We will do this at no additional cost to our customers.
Flooding Severe historical flood events have demonstrated the need to understand and improve the resilience of substations to flooding and led to the publication of Engineering Technical Report 138 –
Resilience to Flooding of Grid and Primary Substations (ETR 138). ETR 138 addresses the risk management of flooding at grid and primary substations in England, Scotland and Wales and outlines a systematic approach and requirement to protect against coastal, river and surface water flooding.
In RIIO-ED2, we will continue our work on flood defences, completing works on 61 substation sites across our two networks at a cost of £24.2m. We will review our plans annually using ongoing site survey information.
5.2.1 Other activities
Our EAP also covers carrying out bundling on existing assets containing more than 200 litres of oil where this poses significant risk, in line with the Oil Storage Regulations and at a cost of £9.5m. Finally, we are proposing £11m across our two network areas for undergrounding in Areas of Outstanding Natural Beauty (AONB) and National Parks.
MANAGING UNCERTAINTY We experienced several significant environmental developments in RIIO-ED1 that have impacted our networks. It is highly likely that there will be further changes in environmental legislation over the next period.
For example, the European Commission (EC) has an ongoing review of the F-gas Regulation 517/2014, which is considering alternatives to SF6 filled switchgear. The Department for Business, Energy and Industrial Strategy (BEIS) will be initiating a project for Climate Services with the overall aim to ensure that BEIS policies and priorities are informed by up-to-date policy-relevant evidence and scientific advice.
The RIIO-ED2 framework includes a reopener mechanism to respond to environmental legislation that would require any material change in our activities. We will continue to work closely with other DNOs and wider industry to determine the impact and materiality of any changes and approaches to implementation.
In addition to net zero targets, such developments have included new requirements on persistent organic pollutants, accelerated PCB removal and the introduction of Ultra-Low Emissions Zones in urban areas. There has also been increasing public awareness of the impact business activity has on the environment and the climate. We discuss our proposal for a targeted funding mechanism in Uncertainty Mechanisms (Chapter 17).
6

141 | Section E: Innovation, Deliverability and Cost Efficiency
SECTION E: INNOVATION, DELIVERABILITY AND COST EFFICIENCY
Scottish and Westminster parliaments are supporting an increasingly aggressive path to deliver net zero, responding to clear evidence of climate change and public demand. Our challenge is to transform our network, at pace, in line with stakeholder demand, whilst balancing the tensions between affordability, deliverability and sustainability.
Our business plan will deliver efficiencies of more than £400m over RIIO-ED2 on a proposed totex of £3.994bn, an increase of £0.96bn when compared with the last five years of RIIO-ED1. Our overall investment proposal, with its built-in efficiency, innovation and uncertainty mechanisms, will ensure our plan reduces our portion of the bill on both our networks. We have built in synergies to deliver cost savings for customers and support deliverability across all areas.
This approach is central to ensuring we have the capabilities required to deliver our own and our communities’ net zero ambitions. We will grow our workforce by 20%, ensuring we have the talent, skills and diversity necessary to connect with customers and manage the step-change needed to deliver the network of the future, without compromise for customers today.
Core challenges for RIIO-ED2We are committed to delivering our business plan; always with an eye on value for consumers and their communities, and with a relentless focus on efficiency. That means overcoming the considerable complexity involved in system transformation, and the constraints that are likely to develop within the supply chain and our ability to grow our workforce and embed the skills required.
WHAT STAKEHOLDERS WANT DELIVERING IMPROVED OUTCOMES FOR ALL
EXECUTIVE COMMITMENT TO OUR PLAN
“We are proposing significant changes to our commercial strategies and ambitious efficiency targets that will ensure a highly cost-effective programme of work. We recognise the increased levels of activity compared with RIIO-ED1 and will strengthen our work force, partnerships and our supply chain to deliver our plan without reductions in reliability or performance for customers. We will future-proof the network for whole system and other net zero opportunities, using uncertainty mechanisms to give customers confidence in our ability to address future risk and the unknowns ahead.”
BRIAN MCLAREN Director of Change And Performance
• Create cost-efficiency opportunities through improved supply chain engagement, process simplification and alternative contract and delivery models
• Growth in skilled talent and more training for current staff
• Provide support for supply chain to adapt and comply with sustainability requirements
• Drive efficiency through innovation and reduce customer bills
• Use partnerships across industry to understand and share best practices and ideas
• We will keep costs down using innovation, competition and annual efficiency commitments, resulting in over £400m of cost savings for customers
• We will publish an annual Innovation Deployment Customer Report to improve the transparency of the benefits delivered from our innovation programme
• We have shifted focus towards wider efficiencies through our Strategic Portfolio Deliverability approach in partnership with our supply chain
• We’re proposing nine additional uncertainty mechanisms to protect customers from unnecessary expenditure, and to fully support whole system opportunities yet to materialise
• We will build a more inclusive and diverse workforce, reflecting our communities and improving our understanding of customer needs
Chapters in this section
Chapter 14: Innovation
Chapter 15: Costs and Efficiency
Chapter 16: Ensuring Deliverability and a Resilient Workforce
Chapter 17: Uncertainty Mechanisms
Chapter 18: Competition
STRONG BUILDING BLOCKS TO DELIVER RIIO-ED2Our proposals will improve on RIIO-ED1 and deliver the building blocks that will accelerate the transition to a smart, flexible network, providing benefits and positive outcomes for everyone.
• A 0.7% per annum ongoing stretch efficiency ambition will save customers £141m
• We will increase our workforce to over 4,800 compared to around 3,900 at the end of RIIO-ED1
• Over £120m invested in proven innovation across our business plan, delivering over £175m of benefits and saving over 125ktCO2e
• We are only proposing baseline investment with high certainty of need, aligned with Ofgem guidance and to protect customers from unjustified bill increases
Affordability for consumers: Investment is necessary to deliver a resilient network for the future, but innovation, partnerships and fully optimised cost management will minimise the impact on current and future customer bills.
A resilient workforce: Delivering the increase in planned work volumes will require more people with different skills. We can develop skills in house, or partner to obtain the right skills. That would give us immediate access, but at a cost. Our workforce resilience strategy is designed to optimise the balance.
A step-change from RIIO-ED1: Delivering on our governments’ and communities’ net zero ambitions requires a step-change in our capital delivery compared to RIIO-ED1. We will need to accelerate investment in low carbon technologies (LCT), encourage the switch to electric vehicles (EV) and develop our flexibility services.
Innovating to deliver: Innovation will play a central role, either RIIO-ED1 innovation embedded as BAU, or new innovation that will drive performance in the future. But we will only invest where longer-term benefit and savings are clear.

142 | Section E: Chapter Fourteen: Innovation
CHAPTER FOURTEEN: INNOVATION
Innovation will be essential in supporting the transition to net zero, delivering more for less, and enabling all our customers, including those in vulnerable situations, to benefit from a greener world. Embedding a culture of innovation will be key to delivering our four strategic outcomes.
During RIIO-ED2 we will continue to embed more innovation solutions into our Business as Usual (BaU) operations. In preparing our RIIO-ED2 Business Plan, we have undertaken a systematic review of our existing innovation portfolio, and those of all other electricity licencees, to identify opportunities for deployment which will bring benefits for our customers.
A review of our RIIO-ED1 experience and feedback received from our stakeholders has identified five key principles to drive our innovation strategy in RIIO-ED2:
• Collaborative and open – collaborating and co-creating with stakeholders, our peers and the supply chain
• Agile – adapting fast through learning by doing
• Relevant – connected to what our stakeholders and business need
• Data-driven – securely using data and analytics to support our findings
• Innovation culture – further developing our culture to ensure that we achieve optimum value from our innovation work
We are proposing to invest over £120m for the deployment of proven innovation in RIIO-ED2 across our business plan, which will deliver over £175m of benefits in the long term, avoiding over 125,000 tonnes of CO2.
We are also seeking a Network Innovation Allowance (NIA) of £17.5m, increased with our own 10% contribution to create a total fund of £19.3m. This will allow us to maintain the momentum and pace of our RIIO-ED1 progress; and at least £14.5m of this will be allocated to third parties.
We will continue to invest in innovation to drive efficiency across the business and help meet our core strategic outcomes. In RIIO-ED2 we will deliver a BaU funded programme of up to £10m of our own innovation activity to identify, trial and verify new innovative solutions for deployment in RIIO-ED2 and beyond. This programme will be driven by the priorities of the business and will contribute to our overall stretch efficiency target of 0.7% identified in Costs and Efficiency (Chapter 15). Our planned innovation deployments are also an enabler to our RIIO-ED2 headcount efficiencies, as detailed in Ensuring Deliverability and a Resilient Workforce (Chapter 16).
In RIIO-ED2, we will enhance and develop our already strong innovation culture. We will focus on maintaining a healthy and open environment for co-creative innovation alongside a strong drive for deployment.
Combined, this will bring benefits for customers, through the realisation of new efficiencies, reliability, facilitating a fair and just transition to net zero, and enabling the delivery of our four strategic outcomes.
We will continue to work with Gas Distribution Networks, Distribution Network Owners (DNOs), with the Electricity System Operator and the three Transmission Owners, to fully embrace the whole systems opportunity. We will also seek to build on existing partnerships, and create new ones, to increase the range and scope of innovation in our industry and beyond.
To further expand the reach of our innovation activities, we are committing to long-term membership of the Energy Innovation Centre (EIC)1 which also includes transmission, gas and water licencees within the partnership. The EIC has a key focus of engaging and supporting third-party innovators and has a membership of over 8,000 innovators across the globe.
SUPPORTING DOCUMENTS
Innovation Strategy (Annex 14.1)
Proven Innovation not yet deployed from SSEN and other DNOs.
Deployment supported by individual CBA based Business Case
SSEN BaU funded innovation to meet ED2 efficiency challenge
The Cost and Benefits are already influenced in the ED1 Outcomes Innovation Projects which
produce wider stakeholder, environmental or societal benefit. Focused on Energy System Transition, Whole System and Consumer Vulnerability funded by Network Innovation Allowance (NIA)
RIIO-ED2-FUNDED DEPLOYMENT RIIO-ED2
NIA-FUNDED RIIO-ED2 BAU-FUNDED EFFICIENCY INNOVATION
A valued and trusted service for our customers
and communities
A safe, resilient and responsive
network
Accelerated pro-gress towards
a net zero world
CO2
Positive impact on
society
1 The EIC is a not-for-profit organisation that seeks to bring industry and innovators together to achieve a safe, affordable, net zero future for everyone.
RIIO-ED1-FUNDED DEPLOYMENT

143 | Section E: Chapter Fourteen: Innovation
ENHANCED ENGAGEMENT OVERVIEW
We engaged with 1,791 stakeholders across 12 events on innovation and they identified the following RIIO-ED2 priorities.
1
TOP STAKEHOLDER PRIORITIES
Remove barriers to the decarbonisation of the network and enable customers to reach their net zero ambitions using a whole systems approach
Innovate to drive efficiency of our operations and reduce customer bills, as well as communicating these benefits effectively for customers
Harness partnerships across industry and internationally, to understand best practices and share ideas to reduce the overall cost and ensure the impact of innovation meets customer and network needs
HOW WE RESPONDED TO FEEDBACK
Stakeholders were strongly supportive of our innovation approach and strategy, the core of which was developed between phases 1 and 3, but highlighted key areas to improve our innovation programme:
*New Output* Publish annual innovation deployment report: Stakeholders agreed with our innovation approach but wanted more clarity and communication on new innovation project deployment and the associated benefits, which we will complete through an annual deployment report. (Acceptability – 73%)
*Enhanced Strategy* Decarbonising the Scottish Islands: Stakeholders noted the potential for innovation to improve efficiency on the Scottish Islands, especially facilitating net zero through reducing the use of diesel backup generators. We modified our strategy to focus on innovation projects which can contribute to decarbonisation on the Scottish Islands, which is an integral part of meeting our business carbon footprint target.
KEY STAKEHOLDER INSIGHTS
Open discovery
• Innovation should be utilised to make the current network more efficient and improve our service to vulnerable customers
• We should endeavour to learn from others both nationally and internationally
• Stakeholders were pleased with the track record of innovation at SSEN
Co-creation
• 92% agreed with SSEN’s five innovation principles
• Net zero and low carbon technologies are considered the most important focus for innovation
Business Plan refinement
• Stakeholders want more visibility on the progress of current and future innovation projects
• Innovation should aim to reduce costs and the bill impact for vulnerable customers
• Innovation should be directed to facilitate more renewable generation connections
Testing and acceptance
• Key role for innovation is to facilitate net zero, particularly in the Scottish islands to reduce the use of diesel generators
• Innovation could also play a role in cost-cutting and improving the maintenance of subsea cables to the Scottish Islands
• Global collaboration is essential for success, including with customers and communities
• Stakeholders wanted more clarity on the benefits of innovation, especially for the impact on consumers in vulnerable situations, as well as for enabling renewable generation
to August 2020
Aug 20 – Feb 21
Feb 21 – Jun 21
Jun 21 – Dec 21
*Enhanced Output* – This denotes a change in ambition or scope in the output between our draft and final plan. *New Output* – This denotes the addition of a new output between our draft and final plan.

144 | Section E: Chapter Fourteen: Innovation
OUTPUTS AND AIMS
TRACK RECORD
We have a strong track record of delivering benefits from innovation. To date, in RIIO-ED1 we have invested over £150m to successfully roll out innovative solutions, including deployment of new smart options such as Constraint Managed Zones and Active Network Management, alongside thermal cameras which have reduced the impact of LV faults on our customers.
We have also rolled out innovations such as Light Detecting Aerial Radar (LiDAR) and LV Automation, which were initially demonstrated by other licensees from across the energy sector. Further information on LV Automation and LiDAR can be found in Distribution System Operation (Chapter 11) and Safety and Compliance (Chapter 6).
We are forecasting at least £19m of benefits to customers in RIIO-ED2 from our RIIO-ED1 innovation investments, predominantly through reliability improvements (LV automation and live line tree felling) and reduced inspections and maintenance costs through LiDAR deployment. These savings have been accounted for in our unit rates from the start of RIIO-ED2.
To date, we have produced benefits for consumers of over £80m, through improved reliability, enhanced customer service and reduced costs. This figure includes £59m of deferred network reinforcement through using smart solutions. By the end of RIIO-ED1 we anticipate the total benefits from innovation already be at least £89m.
We have developed and implemented new geographic information and asset management systems, deployed new active solutions to provide more flexible connection options and invested in a Dynamic Procurement System which has over 470MW of flexibility assets registered.
In addition, we have shared our knowledge and learning extensively across the industry with a wide range of stakeholders.
Network Innovation Allowance (NIA)
The NIA has been a crucial funding stream, allowing us to take projects from initial concept right through to deployment as business as usual (BAU). Our RIIO-ED1 NIA portfolio spans 55 innovation projects, the vast majority of which have involved collaboration and co-creation with other networks, stakeholders or the supply chain.
To date, the maximum available funding for NIA was approximately £26.4m, of which we have forecast to spend around £16.1m to the end of the 2020/21 financial year. We have spent less than originally anticipated because we have been efficient and prudent in delivering quality outputs.
Network Innovation Competition (NIC)
Our NIC projects are discussed in our Innovation Strategy (Annex 14.1). We have led the industry with ground-breaking projects like Project LEO2 (Local Energy Oxfordshire) – one of the most ambitious, wide-ranging, innovative, and holistic smart grid trials ever conducted in the UK and a key enabler for the Distribution System Operator (DSO) function and whole system solutions in RIIO-ED2. The NIC-funded TRANSITION project is central to the delivery of Project LEO.
During RIIO-ED2 we must plan for the wider electrification of heat and transport. Our industry will need to manage significant challenges and opportunities in this transition, and we firmly believe applying insight from earlier activities such as Project LEO will provide the building blocks for a progressive future.
Full details on our RIIO-ED1 programme of innovations can be found in our Innovation Strategy (Annex 14.1). Please see Track Record (Chapter 2) for an overview of our RIIO-ED1 performance across key areas.
We’ve accessed £4.5m of external funding for projects, helping us to become the most successful DNO in accessing third party funding from sources including Innovate UK and BEIS.3
We’ve demonstrated in RIIO-ED1 that innovation pays for itself and brings benefits to consumers and the wider society we serve.
2
3
Output Type Target Consumer benefitCosts included in our baseline plan
Innovation Reporting
SSEN Aim
Publish an annual Innovation Deployment Customer Report to improve the transparency of the benefits delivered from our innovation programme
• Our stakeholders demand better communication and understanding of the benefit accrued from the deployment of innovation
• Collaboration with a range of stakeholders was listed as a key facilitator for good innovation, especially learning from others’ mistakes
Incremental
2 https://project-leo.co.uk/about/ 3 Department for Business, Energy & Industrial Strategy.

145 | Section E: Chapter Fourteen: Innovation
MERLIN – Our ongoing NIA project – Modelling the Economic Reaction Linking Individual Networks (MERLIN) seeks to solve the problem of managing the variable value of services in a smarter energy system and has received approximately £1m funding from BEIS’ Power Forward Challenge. The project brings together industry specialist Opus One Solutions, Open Grid Systems, University of Cambridge and Hydro Ottawa. The outputs from the project will be important to help DNOs better manage emerging commercial risks from the widespread adoption of flexibility services.
INVESTING IN INNOVATION FOR RIIO-ED24
Net Zero/LCTs
Whole
System
Co
nsu
mer
Vu
lnerib
ility
DSO
&
Flex
ibili
ty
Data and
DigitalisationSustainability
Connections
Cu
sto
mer
Se
rvic
eO
pera
tions
Asset
Management
OUR
THEMES INNOVATION
The breadth of our proposed innovation activity in RIIO-ED2 will identify opportunities across all areas of our business, helping to deliver our strategic outcomes and have a positive societal impact. Our objectives delivered through innovation in RIIO-ED2 include:
• improving network reliability and resilience
• reducing the impact of outages on our customers
• improving the efficiency of our operations
• better understanding and managing our assets
• enhancing our digital capabilities
• delivering our DSO capabilities
• enabling the take up of low carbon technologies
• reducing our carbon footprint through targeted innovation
• delivering our consumer vulnerability ambitions
• improving our customer service
4.1 Approach
Our approach to innovation is highly collaborative and open.
We not only engage with the stakeholders who participate in our innovation projects, but also with the innovation community in its broadest sense. In RIIO-ED2 we believe that effective innovation will require an even more collaborative approach to deliver solutions to the complex challenges that the industry and wider society will face as we transition to net zero.
4.2 How we will innovate in RIIO-ED2
We have implemented a process which allows us to assess the potential for delivered benefits at each stage of the innovation cycle, from initial idea through to implementation, and maximise the benefits for our consumers.
All projects will be under constant review to ensure that they are still relevant, likely to deliver benefits and are meeting the needs of our stakeholders and our business. This means we will have opportunities to amend and refine project scope or even cancel projects, to avoid wasted time and effort.
Innovation proposals will only progress beyond the ideas stages after being subject to rigorous assessment. This process will confirm a proposal meets our business case requirements, helps meet our strategic outcomes, and are aligned with our key innovation principles. This will ensure we do the right thing as a business and for our customers.
IDEA GENERATION
OPPORTUNITY ASSESSMENT
PROJECT INITIATION
PROJECT DELIVERY
DEPLOYMENT PREPARATION
• Innovation challenges through the Energy Networks Association or our partnership with Energy Innovation Centre (EIC)
• Stakeholder co-creation
• Lessons learned from projects, internal experience
• Fast follow through learning from other innovation projects
• Stakeholder engagement to understand and confirm the need
• Scoping
• Understanding benefits to create value and ensure future savings
• Planning and budgeting
• Assessing vulnerability impacts to ensure a just and fair transition
• Senior Management and Business Sponsor project approval
• Contract commitment
• Stage gates to make sure the project is still delivering value, suitable for our stakeholder needs
• Trial deployment Trialling new tools, techniques, systems and methods of work with project partners
• Lessons learned Capturing and sharing findings
• Business case validation
• Deployment plan
• Benefits measurement and tracking
Lessons learned

146 | Section E: Chapter Fourteen: Innovation
4.3 Learning by doing
We have learnt from our RIIO-ED1 innovation portfolio and used the experience to inform and define our outputs and thinking for RIIO-ED2. For example, the roll-out of Project LEAN (Low Energy Automated Networks), which reduces costly network losses by switching off lightly loaded transformers during periods of low demand, has been included within our Environmental Action Plan.
Learning from other projects, such as TRANSITION4, which is demonstrating the operation of a local energy system in Oxfordshire, and RaaS5 which uses a new approach to network management to improve resilience in remote locations, has helped inform the development of our RIIO-ED2 DSO strategy. Similarly, our ground-breaking work on connecting previously constrained renewable generation using Active Network Management has been important in shaping our Connections Strategy going in to RIIO-ED2.
We will embed more of our existing innovation solutions into our BAU operations and bring forward new deployments from our own and other DNOs’ portfolios of projects. This continued commitment to ‘learning by doing’, using our RIIO-ED1 experience, underpins our strategy for delivering innovation in RIIO-ED2 and is based on five key principles:
4.4 Our investment proposals
Through applying our five key principles we will develop a balanced innovation portfolio that delivers these objectives. The portfolio will meet the needs of all customers by being just and fair, inclusive and collaborative. We will undertake a consumer vulnerability impact assessment on all our innovation projects (following the principles developed by Energy Networks Association), along with a carbon assessment as appropriate.
To achieve our RIIO-ED2 outcomes we will:
• continue the use of innovative solutions deployed in RIIO-ED1
• apply additional innovations that are fully costed and justified
• deliver a high-quality NIA portfolio and look to actively participate in future Strategic Innovation Fund competitions (which replace the RIIO-ED1 Network Innovation Competitions)
• invest in further innovation to improve efficiency.
These four elements are shown below and discussed in detail in our Innovation Strategy (Annex 14.1).
1. Collaborative & open
Working with the supply chain and
peers, to facilitate the innovative aspirations
of our stakeholders
2. Agile
Setting the standard, fast to follow, quick
to learn through learning by doing
3. Relevant
Relevant and con-nected to what our
stakeholders and consumers need,
co-creating with our stakeholders
4. Data-driven
Securely using data and analytics to find
opportunities, making sure our networks are ready to enable
net zero
5. Innovation cul-ture
Evolving our culture to achieve maximum value in an equitable
way for our customers through learning
by doing
Learning by doing
4 https://ssen-transition.com/ 5 Resilience as a Service.
Inn
ova
tio
n d
eplo
ymen
t Deliverin
g R
IIO-E
D2
strateg
ic ou
tcom
es
Proven innovation not yet deployed from SSEN and other network operators. Deployment supported by individual CBA based business case
SSEN-funded innovation to meet RIIO-ED2 efficiency chal-lenge
The cost and benefits are already influenced in the RIIO-ED1 outcomes
Innovation projects which produce wider stakeholder environmental or societal benefit. Focused on net zero, whole system and consumer vulnerability funded by Network Innovation Allowance
RIIO-ED1-FUNDED DE-PLOYMENT
RIIO-ED2-FUNDED DE-PLOYMENT RIIO-ED2 NIA-FUNDED
RIIO-ED2 BAU-FUNDED
Figure 14.1: Innovation funding in RIIO-ED2

Our balanced and fair approach to funding innovation in RIIO-ED2 appropriately shares the costs to reflect the risks and benefits from its successful delivery. It facilitates the transition to net zero, supports our stakeholders’ ambitions, and retains our focus on delivering efficiency within our business.
We will continue to innovate in areas which don’t necessarily require new technology or equipment, such as talent, skills development and commercial models. As an example, we are beginning to explore innovative commercial models with suppliers and the wider innovation community (as discussed in our Supply Chain Strategy (Annex 16.2).
Across all our activities we will actively track progress and benefits from our projects, both during the innovation stage and in any subsequent deployment.
147 | Section E: Chapter Fourteen: Innovation
INNOVATING FOR NET ZERO AND THE ENVIRONMENT
We are the first DNO to commit to a 1.5oC Science-Based Target, validated by the Science Based Targets initiative. Our Environmental Action Plan (EAP) (Annex 13.1) sets out how we will set ourselves up to successfully deliver on our targets throughout RIIO-ED2.
Innovation will play a central role, from the deployment of technology that help reduce losses through to exploring innovative solutions to address the unique challenges we face in our SHEPD region, where diesel generation still plays a key role in ensuring security of supply.
4.4.1 RIIO-ED2-funded innovation deployment
We propose to expand and develop our innovation roll-out by bringing through new deployments from our existing portfolio of innovation projects or from innovation activities undertaken in RIIO-ED1 by other DNOs, as well as those delivered by Transmission and Gas licensees.
This includes the roll-out of On-Load Tap Changers, which were first funded and tested through innovation projects and we are rolling-out as part of our asset management strategy. Please see Maintaining a Resilient Network (Chapter 7).
As part of our RIIO-ED2 preparations we have undertaken a systematic three-stage assessment methodology of the available innovations from our own portfolio and those of other licencees to ensure that we identify those innovations with the greatest potential to bring benefits in RIIO-ED2.
Through this process (described further in our Innovation Strategy (Annex 14.1) we are proposing to invest over £120m for the deployment of proven innovation in RIIO-ED2, which will deliver over £175m of benefits in the long term, avoiding over 125,000 tonnes of CO2.
Identify opportu-nities for deployment
Prioritise deploy-ment opportunities
SSEN portfolio
Other GB DNO innovations deployments
Transmission and gas companies plus wider supply chain engagement
Identify deployment opportunities
Estimate potential benefits – financial, customer service, carbon and societal
CBA developed
Deliverability assessment
Select deploymentsSelect deployment
Figure 14.2: Three stage innovation deployment assessment process
INNOVATION DEPLOYMENT COSTS (£m)
RESILIENCEEnhanced lightning protection
£1.6m
ASSET MANAGEMENT
On-load tap change transformers
£6.5m
SUSTAINABILITYAdditional hybrid generators
£2.2m
SUSTAINABILITYTransformers auto stop-start
£2.2m
RESILIENCE Sub Sense £1.4m
NET ZERO LV monitoring £27.8m
NET ZERO DSO readiness/flexibility £78.9m
Total cost £120.6m
Benefits (£m)
Deferred capex £36.4m
Efficiency improvements – Connections £1m
Reliability improvements £1m
Customer bill reduction £119m
Losses reduction £5.6m
Carbon benefits £14.2m
Total benefit £177.2m
Full information on these projects can be found in the relevant chapters and annexes of our Business Plan, along with the accompanying investment decision packs (EJPs and associated Cost Benefit Analyses); the cost for the deployments has been incorporated within the Business Plan data templates for each relevant deployment. These are summarised in our Innovation Strategy (Annex 14.1).

148 | Section E: Chapter Fourteen: Innovation
4.4.2 RIIO-ED2 NIA funding
We are requesting an NIA allowance of £17.5m for RIIO-ED2 and at least £14.5m of this will be allocated to third parties.
This is an 8.7% increase on our pro rata RIIO-ED1 NIA spend of £16.1m. With this, we will deliver a high-quality portfolio of projects supporting the energy system transition and delivering value for vulnerable customers. We will use NIA funding for projects where the benefits are more likely to accrue to wider stakeholders, delivering environmental or societal benefits. We will contribute an additional 10% (£1.8m) to our proposed NIA funding to support innovation through RIIO-ED2.
AreaNIA funding request £m
Match/ Collaborative funding £m
Total investment £m
Energy system transition (incl. whole system)
14 1.4 15.4
Consumer vulnerability
3.5 0.4 3.9
Total funding 17.5 1.8 19.3
RIIO-ED2 NIA funding with matched SSEN contribution
We will seek additional third-party funding to sit alongside the NIA funding, continuing the approach we took in obtaining such funding in RIIO-ED1. Our NIA projects will continue to be highly collaborative, will be co-created with our stakeholders and will be focused in the following areas:
ENABLING THIRD-PARTY PARTICIPATION THROUGH THE EIC
We recognise the real benefits that can arise out of finding new ways to partner with third-party innovators, from co-creation opportunities to a greater variety of ideas and learning opportunities. As a member of the Energy Innovation Centre (EIC), we are able to tap in to and support, a broad community of innovators. More generally, we will take an agile approach and work closely with partner organisations to explore multi-organisational delivery approaches where appropriate.
In most cases the outcomes from projects under these themes will not deliver direct benefits to our network, but instead produce wider and enduring societal benefits during and beyond RIIO-ED2. The level of risk involved in these projects, the uncertainty involved in their outcomes and the fact that benefits are not necessarily realised by us, makes it inappropriate for them to be funded from our Business Plan allowances. We believe that the NIA is the most appropriate mechanism for the delivery of these projects and, as in RIIO-ED1, we will share our learning across the DNO community so that all consumers benefit.
THE
SYSTEMENERGY
TRANSITIONNet Zero
Consumer Vulneribility
WholeSystem
Whole system – with the increasing interaction between sectors beyond electricity, such as gas and transport, as we move to net zero there will be a need for further whole system innovation
Net zero – including electrification of transport, low carbon heat, distributed generation, energy storage and energy e�ciency
Consumer vulnerability – we will create solutions for consumers in vulnerable situations and support for communities and vulnerable consumers to ensure a just transition to net zero

149 | Section E: Chapter Fourteen: Innovation
4.4.3 BAU-funded innovation in RIIO-ED2
To meet our strategic outcomes, we will continue to invest in innovation to drive efficiency across the business. In RIIO-ED2 we will deliver a BAU-funded programme of up to £10m of innovation activity to identify, trial and verify new innovative solutions for deployment in RIIO-ED2 and beyond.
This programme will be driven by the priorities of the business and will be a significant contributor to the overall efficiency targets identified in our Costs and Efficiency (Chapter 15). It is likely that the work will focus on areas such as:
• Process to focus on efficiency improvements and operations
• Network resilience and supply restoration
• Network reliability, asset management and inspection
For this area of our innovation programme, we have not sought specific allowances within our RIIO-ED2 plan. Instead, it will be funded at our risk, with the prospect of a return through existing regulatory incentive mechanisms should the programme prove effective. Similarly, we have not sought any specific allowances for subsequent deployment of these innovations, each will be driven by a specific business case with the traditional option being used as a counterfactual.
4.5 Driving efficiency through our innovation investment
We are forecasting at least £19m of benefits to customers in RIIO-ED2 from our RIIO-ED1 innovation investments, with reliability improvements accruing through the use of thermal cameras and increased LV automation, and efficiency benefits arising from reduced outages through the use of live line tree felling and reduced inspection costs through the use of LiDAR.
These innovation investments will also support our delivery of ongoing efficiencies throughout RIIO-ED2 (our stretch target of 0.7% per annum, as set out in Costs and Efficiency (Chapter 15)), as well as supporting the step change in performance required to deliver the increase in volumes for RIIO-ED2 at the lowest possible cost and to develop the new capabilities required to deliver RIIO-ED2.
BUILDING OUR INNOVATION CULTURE TO ACHIEVE DELIVERABILITY
Our analysis has shown that we could achieve even more by further nurturing a culture of innovation at all levels in our business. A strong culture of innovation fundamentally requires three things:
• The drive to innovate and improve even where that innovation takes an individual or an organisation out of their comfort zone
• The time, space, and funding for effective innovation
• The ability to turn viable innovation into deployments and ultimately achieve benefit realisation
Our proposals for building a more innovative culture are included in Innovation Strategy (Annex 14.1).
Our process for managing innovation is based on our proven five-stage process from initial idea, through discovery, approval and initiation, to project delivery and deployment. Ideas will be sourced from internal campaigns to capture ideas from employees, existing partnerships, ongoing stakeholder engagement, supply chain, industry and academia.
In many cases, we will use a process of innovation calls facilitated by the EIC to better engage the innovation community in delivering solutions. This open approach to innovation allows us to fully consider a wider range on new options and also gives opportunities for cocreation.
Following the successful delivery of our RIIO-ED1 innovation portfolio, we will formalise the introduction of value reviews at regular intervals in the delivery of our innovation projects to identify any early outcomes that can be deployed, or if the project has been overtaken or proven unviable. Tracking the benefits from innovation are important to ensure that they are fully embedded within our business and to help better inform the development of future projects.
5

150 | Section E: Chapter Fifteen: Cost Efficiency
CHAPTER FIFTEEN: COST EFFICIENCY
INTRODUCTION
In line with our strategic outcomes, which we have developed and agreed with our stakeholders, our ambition is to efficiently invest to improve our services to customers, deliver a safe and resilient network and accelerate progress to a net zero energy future. We believe a baseline expenditure of £3,994m is required to achieve those outcomes. We are committed to deliver this efficiently with our plan setting out the measures we have identified to reduce costs to customers by £410m. It should be recognised that our SHEPD area has a number of atypical factors that have a material impact on our costs.
Risk to consumers around our future workload and costs is managed using both ex-ante and ex-post regulatory mechanisms. In this chapter, we focus on the required ex-ante allowances that provide a baseline for the necessary activities we need to undertake during the RIIO-ED2 period. Where there is significant and material uncertainty in future workloads, we have proposed that these activities are addressed using ex-post mechanisms – in Uncertainty Mechanisms (Chapter 17), we discuss where we plan to adopt such uncertainty mechanisms.
In the following sections, we provide the evidence that our current costs and volumes are efficient compared to our peers, and outline the steps we have taken to ensure we continue to deliver frontier efficient outcomes. Our plan is built on robust transparent costing evidenced by traceable cost-books which the regulator can rely on to derive a high level of confidence in our forecast expenditure.
SUPPORTING DOCUMENTS
Cost Efficiency (Annex 15.1)
ENA Ongoing Efficiency Report (Annex 15.2)
Cost Confidence Assessment (Annex 15.3)
SEPD CV Analysis (Annex 15.3.1)
SHEPD CV Analysis (Annex 15.3.2)
Establishing an Appropriate Efficiency Challenge (Annex 15.4)
Price Effects for the RIIO-ED2 Price Control Review (Annex 15.5)
Operating Business Costs (Annex 15.6)
Company-Specific and Regional Factors for RIIO-ED2 (Annex 15.7)
BPDT Commentary (Annex 15.9)
TOTALINVESTMENT
£3,994m
GeneralRunning Costs
£525m
ValuedService£359m
Safe and Resilient£2,212m
Net Zero£1,039m
E�ciency Savings – £141m
OVERVIEW – RIIO-ED2 EXPENDITURE AND BILL IMPACT 1
Table and Figure 15.1: Breakdown of our RIIO-ED2 investment plans (£m, 20/21 price base)
Totexby plan section and Ofgem categories
Valued and trusted
service
Safe and resilient network
Accelerated progress to
net zero
Our RIIO-ED2
plan
Load Related 0 0 510 510
Non-Load Capex 0 1,096 211 1,308
Non-Op Capex 0 42 42 83
IT/OT 199 0 53 252
Network Op Costs 0 735 0 735
Capitalised Overheads 160 339 206 705
Innovation 0 0 18 18
Subtotal 359 2,212 1,039 3,611
+ General running costs 525
- less ongoing efficiency -141
RIIO-ED2 Totex 3,994
Costs in RIIO-ED2 can be compared to RIIO-ED1 using two methods: the RIIO-ED1 eight-year average and the last five years. When comparing individual areas of cost, we are using the last five years of RIIO-ED1, as these are more reflective of the cost drivers we will experience during RIIO-ED2.
Delivering the step change in net zero outcomes in RIIO-ED2 necessitates increased investment of £961m. In the same five-year period, using Ofgem’s financial parameters, average bills would fall by £3.30 and £9.70 for SEPD and SHEPD respectively. Using our justified financial parameters, average bills will be broadly flat. Our Finance and Financeability (Chapter 19), highlights our concerns with Ofgem’s own parameters and the robust evidence underlying our proposed approach. The combination of factors within our
control – increased efficiency and innovation – coupled with Ofgem’s underlying financial framework assumptions (e.g. asset lives and cost of capital) leads to this reduction in the average domestic bill in RIIO-ED2 compared to RIIO-ED1.1
Further details underpinning our cost proposals are provided in Cost Efficiency (Annex 15.1), Investment Decision Packs (Engineering Justification Papers (EJPs) and Cost Benefit Analysis), Operating Business Costs (Annex 15.6) and our Business Plan Data Table commentary. We have considerably refined our plans since the draft submission of July of this year, reducing our totex ask by £151m, embedding further efficiencies within our plan, in spite of additional cost pressures identified in large connection projects, and specific non-load activity.
1 Calculated using industry standard 8-year RIIO-ED1 average and 5-year RIIO-ED2 average.

151 | Section E: Chapter Fifteen: Cost Efficiency
CREATING AN EFFICIENT BASE
We have confidence that our RIIO-ED2 expenditure proposals represent value for money for our customers because our future costs are built on an efficient starting-cost base. The diagram to the right summarises the key components of our RIIO-ED2 cost information and where the evidence supporting this can be found in our plan. It should be recognised that our SHEPD area has a number of atypical factors that have a material impact on our costs.
Later in this chapter, we demonstrate that stakeholders can have confidence in our costing data. Forecast costs are predominately derived from our RIIO-ED1 outturn as reported to Ofgem, supplemented by industry benchmarks and recent tender events. We are then able to show that these RIIO-ED1 outturn costs are themselves efficient when compared to our peers.
Specific cost factors which impact our networks
Our Communities (Chapter 1), describes some of the factors which differentiate our north and south networks, both from one another and our peers. These differences can contribute to material differences in the costs a network faces in meeting the needs of its customers. It’s important to identify and adjust for any material cost variations in order that subsequent cost comparisons across regions are fair and representative of costs which the network can control. These costs variations are often referred to as company-specific or regional factors.
The impact of regional or company-specific factors will be captured by the final design of Ofgem’s cost assessment models, the final design of which will become apparent in the coming months, as the industry working groups progress and Ofgem decides on its cost assessment process. Some factors may become more relevant in RIIO-ED2 compared to previous price controls, and therefore forecast data is needed to assess whether these are sufficiently captured in the modelling or need additional adjustments.
We commissioned Oxera to undertake an assessment of the regional and company-specific factors identified within our business, and recommend how impacts from these factors should be addressed within the cost assessment models, please see Company-Specific and Regional Factors (Annex 15.7). Oxera have followed Ofgem’s guidelines in identifying and then quantifying relevant factors. Some of the most significant factors are listed below, for the remainder please refer to its report which we have also published.
• Submarine cables – We serve 59 inhabited islands in SHEPD and the Isle of Wight in SEPD using over 110 subsea cables stretching more than 500km. Serving islands off the GB mainland gives rise to atypical additional costs, and associated risks. The most significant of these are installing, inspecting and maintaining, and repairing submarine cables.
• Serving islands – SHEPD is geographically the largest of the 14 GB licence areas, but with the smallest population it incurs materially higher costs as it provides a full range of network operational activities to the multiple islands communities it serves. No other DNO materially has similar islanded and remote networks or the cost pressures and risks this creates. These costs include capital and operating costs of island diesel stations, additional staff, and vehicle costs, as well as specific travel costs for helicopters and ferries.
• Sparsity/density/topography – Operating in particularly sparse or dense areas causes additional costs, for example, additional staff, travel, depot costs compared to a network with average sparsity/density.
• Regional wage differences – Updating Ofgem’s RIIO-ED1 index with the most recent data shows that wages in Scotland are closely aligned with those in the south east category and around 7% above the remaining GB regions.
The graphic below summarises our proposals for how these costs should be treated by Ofgem through its cost assessment approach.
2
Figure 15.2: Costing approach to our RIIO-ED2 investment plans
Adjust for changes in workload (+/-)
RIIO-ED1 actual costs
Apply RIIO-ED1 efficiency
Apply RIIO-ED2 efficiency
Activity specific adjustments
This chapter & cost book
Annexes & EJPs
Annexes & EJPs
This chapter & annex
This chapter & annex

152 | Section E: Chapter Fifteen: Cost Efficiency
FACTOR QUANTIFICATION (5Y RIIO-ED2) PROPOSED TREATMENT
Submarine cables £184.5m Exclude from models
Sparsity/density/topography £74.6m Pre-regression adjustment
Subsea Programme Team £7.5m Exclude from models
Regional wage differences £40m Pre-regression adjustment
Serving islands £37.6m Exclude from models
Shetland £99.8m Exclude from models
We have used the identified company-specific or regional factor results in analysing our current levels of efficiency at the start of RIIO-ED2.
Understanding our current efficiency
We have benchmarked our current level of efficiency across all GB networks using the first six years of RIIO-ED1. Industry experts, Cost of Debt and Financeability (Annex 19.2), assessed the relative efficiency of our cost base against the other DNOs using outturn costs to 2021. It relied on industry standard cost drivers and replicated the cost assessment approach adopted for the RIIO-ED1 price control by Ofgem. This includes both top down and disaggregated bottom-up analysis of totex.
Oxera conclude that based on these results, SHEPD is the most efficient company, while SEPD has an estimated inefficiency gap of 2.0%, or approximately £7m p.a. in totex terms.
We have used these results to establish a solid foundation for RIIO-ED2 cost forecasts. This assessment allows us to quantify the level of catch-up efficiency required as we start the RIIO-ED2 price control period.
• It confirms that SHEPD has no catch-up efficiency gap to close at the start of RIIO-ED2
• It enables us to build targeted reductions in costs within SEPD in preparation for RIIO-ED2
This analysis provides a solid foundation on which to build our plan forecast totex. It reveals that Ofgem’s approach for assessing cost efficiency will need to adapt as we understand levels the sector will invest towards net zero during RIIO-ED2. We also invite Ofgem to consider the extent to which the RIIO-ED1 fast-tracking process has created an uneven playing field amongst DNOs, as well as creating issues with benchmarking models previously relied on. The development of benchmarks to evaluate future comparative efficiency will become even more challenging as different companies face divergent future cost drivers. We see this across our networks, with high levels of low-carbon technology demand in the south and high renewable technology in the north. We will work with Ofgem and the industry to contribute to the development of its cost assessment proposals for RIIO-ED2 draft determinations.
SUMMARY OF OXERA FINDINGS
Oxera examined the suitability of recent proposed changes to the regulatory cost assessment models. It suggested limited justified revisions which more closely reflect real life operational and network characteristics. For example, it challenged whether affording increased weighting to customer numbers within assessment models (24%) can be justified given the proportion of network activity and costs directly attributable to customer populations (8% for our DNOs). Placing such a weight on customer numbers could lead to allowances becoming reflective of actual costs, as the cost models previously used become less effective. Other recommendations can be found in the Oxera report which has been published with our plan.
Oxera combine the results from the totex (top down) and disaggregated cost (bottom up) modelling, an approach which has been common to all recent price control cost assessment processes.
This assessment ranks SHEPD and SEPD as first and sixth most efficient respectively of the 14 DNOs, with relative efficiency gaps to the industry upper quartile level of -5.2% and 2.0% respectively. In these results the most efficient 25% of DNOs, when ranked by efficiency score, will lie below the upper quartile level and the remaining networks above.

153 | Section E: Chapter Fifteen: Cost Efficiency
CONTINUING EFFICIENT INVESTMENT IN RIIO-ED2Efficiency of our operating model
RIIO-ED2 provides us with a wide range of different challenges as we seek to meet our customers’ needs and deliver what our stakeholders require. We are already planning for this rapidly changing future, and in particular, how we deliver on our commitments while managing costs, and therefore keeping bills down. Our approach to managing our workforce, assets, supply chain, as well as utilising innovation, digitalisation and competition provide this foundation to delivering efficiency.
Our workforce strategy
The step change required in the electrification of heat and transport facing industry and society in RIIO-ED2 will challenge our business and our workforce as never before. In RIIO-ED2, we will be proposing a workforce increase of 20% to support our business plan. Our Workforce Resilience strategy outlines how we will keep people safe and well, highly skilled and productive in order to meet our stakeholders’ expectations and provide value for our customers and communities. We are blending our sourcing strategies to ensure we can meet the need for workforce growth. Our insourcing/outsourcing model is based on where we want to keep our core competencies in-house and where we will get best efficiencies by outsourcing work. More detail can be found in Workforce Resilience Strategy (Annex 16.3).
Our risk and asset management strategy
Asset management is an integral part of everything we do at SSEN. We recognise the importance of our networks’ infrastructure in the context of the wellbeing of all who use it. A defined and integrated risk-based asset management system incorporating strategic targeted improvements in asset data, leads to efficient, cost-effective network solutions which ensure that we meet our asset management objectives. Good stewardship of the whole lifecycle of our asset base delivers long term value for our customers.
Our supply chain strategy
Our supply chain strategy has been designed to ensure we have the ability to optimise and find synergies across our work bank and deliver our programme efficiently. We will continue to build on the key RIIO-ED1 Improvements such as category management, batching of requirements and optimising commercial management.
Our Supply Chain strategy will drive benefits and efficiency through:
• A range of contracting strategies to support a flexible, effective and optimized approach to ̀ touch the network efficiently’ principle.
• Refinement of procurement strategy models and delivery of further efficiencies through long-term commitments and earlier contractor involvement.
• More collaborative longer-term strategic relationships with supply chain.
• Regional and local supply chain strategies.
• Providing the supply chain with greater visibility, certainty and continuity of work to support skills development and increase efficiency.
You can find further detail in our Supply Chain Strategy (Annex 16.2).
Our deliverability strategy
Assessing deliverability has been a core activity of our business planning process for RIIO-ED2, ensuring that our ambition can be translated into a deliverable programme of work that will be a true enabler for net zero.
Effective work allocation models which enable early contractor involvement and visibility of work banks are critical to drive value for money for our customers and develop a pipeline of the necessary skills. Further details are included in our Deliverability Strategy (Annex 16.1).
Harnessing innovation
As detailed in the Innovation Strategy (Annex 14.1), we have demonstrated genuine leadership in the innovation space and delivered significant benefits for customers. We will expand our innovation roll out with new deployments from our existing portfolio of innovation projects or from innovation activities undertaken in RIIO-ED1 by other energy networks. As part of our RIIO-ED2 preparations, we have undertaken a systematic three stage assessment methodology of the available innovations from our own portfolio and those of other licensees to ensure that we identify those innovations with the greatest potential to bring benefits in RIIO-ED2. We have included £17.6m of NIA funding for Energy System Transition, and Consumer Vulnerability in our plan. Additionally, we will deliver at least £10m of business as usual funded innovation activities, not part of our totex ask, and from which we expect to deliver at least £10m of efficiency benefits. This innovation investment will support our delivery of our ambitious ongoing efficiency target of 0.7% per annum throughout RIIO-ED2. Further information is provided in our Innovation Strategy and a full justification for each project can be found in the relevant chapters and annexes.
Digitalising our business and engagement
We have invested in digital infrastructure during RIIO-ED1 to provide us with the solid foundational IT systems and data sets necessary to meet the challenges of the net zero transition. To meet our RIIO-ED2 strategic outcomes, and continue to drive efficiency, we will continue to invest in the digitalisation of our business. This will become even more critical under the future energy scenarios as connections volumes and network interactions rapidly increase, including enabling greater deployment of flexible solutions. Our IT and OT Investment Decision Packs demonstrate these benefits as well as the benefit of avoiding material increases in the cost of overheads which would otherwise be required to meet our targets.
Optimising native competition
We have developed our competition strategy to ensure that we are able to utilise native competition where there is opportunity. Throughout RIIO-ED1, we have introduced new mechanisms that will further enable supplier innovation, flexibility, and cost efficiency across our business plan throughout RIIO-ED2. Full details of how we will use native competition to drive positive outcomes are included in our Supply Chain Strategy (Annex 16.2).
3

154 | Section E: Chapter Fifteen: Cost Efficiency
AN EFFICIENT START TO RIIO-ED2
Understanding where we have opportunities to improve our efficiency as we approach the end of RIIO-ED1, allows us to target further improvement over the final years of this price control. We have included this targeted efficiency improvement in our RIIO-ED2 plan and it creates a robust foundation on which to forecast our RIIO-ED2 investment programme and outputs. In addition to the top-down ongoing efficiency assumptions which we have applied to our overall totex, worth £141m, we have identified £269m of additional bottom-up efficiency savings embedded in our plan.
These embedded savings are made up of:
A) Stretching reductions in unit costs that we expect to achieve during the remainder of RIIO-ED1
During the remainder of RIIO-ED1, we are targeting stretching efficiencies arising from lower unit costs aligned with our increased activity. Through our commercial strategy, we will continue to drive value for money through the prices we negotiate with third parties. Savings of £38m are planned across the activities of Load, Asset Replacement and tree cutting.
B) Totex benefits associated with our RIIO-ED2 investment decisions
Across our investment plan we have taken decisions that seek to maximise the net benefits for our stakeholders. Our CBAs detail the associated costs and benefits of our plans.
Through these decisions we achieved direct reductions in totex of £47m during RIIO-ED2. These savings include:
• directly cashable savings of £44m against our historic actual costs through IT investment; and
• cost savings of £3m arising from the adoption of flexibility to improve our deliverability, therefore not requiring the use of premium unit rates in Load.
In addition, our decisions have resulted in £80m of avoided costs that would otherwise be incurred. We do not illustrate these benefits in the waterfall above, as these benefits materialise beyond the RIIO-ED2 timeframe. These avoided costs relate to:
• investment in IT systems to avoid otherwise required spend increases of £64m; and
• deferment of Load investment that our scenario modelling would expect us to need of £16m due to the use of flexibility schemes.
C) Stretching reduction in unit costs which we are targeting during RIIO-ED2
We have identified unit cost savings of £184m to target more stretching rates to reduce our overall totex, embedding greater efficiency within our base costs. We summarise these below:
• Asset Replacement efficiency (unit costs). We know from standard peer to peer unit cost comparison, and the results of Oxera’s cost efficiency report, (Establishing an Appropriate Efficiency Challenge, Annex 15.4), that our performance in asset replacement costs could continue to improve. As part of the targeted cost improvement that brings SEPD to upper quartile, we have targeted a 5% efficiency improvement in RIIO-ED1 delivered unit rates. To ensure we continue to challenge ourselves we have also targeted improvement in SHEPD, which is already at the efficient frontier, through a 2.5%-unit cost improvement. This flows directly into a reduction in RIIO-ED2 forecast totex of £25m.
• Load expenditure. We also apply these same asset replacement unit rates to our load projects. This along with optimisation across different investment drivers, reduces our load expenditure by £11m.
• Network Diversions. We are experiencing continued increase in injurious affection claims across our networks. Each individual claim value is determined by the individual circumstances. However, as the volume of workload increases materially, we are able to realise economies of scale in legal and land agents’ costs. We have reduced the forecast costs of our claims in RIIO-ED2 by £14m to reflect this.
• Network Operating Costs economies of scale. We are proposing reduced unit rates within our tree cutting activity in SEPD compared to our six-year average, causing an efficiency improvement of £24m compared to RIIO-ED1 actual performance. Furthermore, with an increase in repairs and maintenance activity aligned to forming a safe and resilient network, we are predicting efficiencies of £17m across both regions.
4
Figure 15.3: Efficiency Impacts
3,900
3,700
4,100
4,500
4,700
4,300
3,500
3,300
3,100
2,900
2,700
Totex Increase
RIIO-ED1 first 5yr Avg
Unit Cost Efficiency
RIIO-ED1 last 5yr Avg
RIIO-ED2 Pre Efficiencies
RIIO-ED1 Stretch Efficiency
Ongoing Efficiencies
IT Projects(CBA)
RIIO-ED1 Totex Increase
RIIO-ED2 Post Efficiencies
2,851
-38
219 3,033
1,334 4,367
-47
-184
-141
3,994
2,500A
E
E
B
C
D

155 | Section E: Chapter Fifteen: Cost Efficiency
• PCB unit cost targeted stretch. We have additionally identified £14m in efficiency savings on unit rates which we apply for the transformer replacement and refurbishment due to PCBs. We have embedded lower unit cost into our proposals through reductions in forecast unit rates.
• Productivity and economies of scale. Across the rest of our plan we have identified an additional £79m of savings arising from unit cost reductions due to increased productivity across our people, processes, and systems, as well as benefits from increased economies of scale as our activity volumes rise.
D) Ongoing efficiencies through RIIO-ED2
We expect to identify ways of improving our productivity and efficiency on an ongoing basis. Our ongoing efficiency expectations reflect the degree to which we, as an efficient firm, can reduce costs through technological and process change over time. We have built in additional efficiency savings to our plan that are based on the level of efficiency frontier movement we believe is justified by market evidence.
We have relied on independent third-party advice to examine the evidence for what is a stable level of ongoing productivity improvements in our sector. Our proposals have been developed using two third party reports.
• ‘Ongoing Efficiency Improvement at RIIO-ED2’ prepared by NERA for the ENA
• ‘Establishing an appropriate efficiency challenge’ prepared for us by Oxera, Cost of Debt and Financeability (Annex 19.2)
Both NERA and Oxera studies reviewed various benchmarks of productivity improvements. NERA conclude that 0.3% is the appropriate ongoing efficiency assumption, whilst Oxera conclude it should be a maximum of 0.6%.
Alongside the overall findings of the ENA ongoing efficiency report, we have considered NERA’s analysis on totex productivity driven by MEAV (Modern Equivalent Asset Value). It is based upon actuals over DPCR5 and RIIO-ED1 and the maximum ongoing efficiency improvement over the course of a 10-year period is 5%. This equates to approximately 0.5% per annum.
Having taken account of the evidence on relevant benchmarks from our external advisors and our own analysis, we have decided to adopt an even more stretching ongoing efficiency assumption at 0.7% per annum, providing greater ambition compared to the industry-wide position of 0.5% per annum. This reflects the benefits we expect from our IT investments, embedding innovation into BAU, continuous improvement and our supply chain strategy.
Over the five years of RIIO-ED2, customers will benefit by over £141m through reduced totex allowances, delivering ambitious efficiency stretch throughout RIIO-ED2.
E) Increased activity in the latter part of RIIO-ED1, and continued through RIIO-ED2 period
The above items have driven efficiency underpinning our plans. We also highlight the increase in activity in RIIO-ED1 and RIIO-ED2 which drives an increase in our overall totex.
i) RIIO-ED1; increases in connections and associated reinforcement, diversion and asset replacement, IT and OT, environmental, tree cutting over the latter part of RIIO-ED1 have also necessitated increased levels of engineering support and project management costs, and provide a more realistic comparative position for RIIO-ED2. We summarise these impacts in the table below.
ii) RIIO-ED2 continued activity; Section 5 below, RIIO-ED2 COST DRIVERS provides further detail into the continued increasing workload, including digitalisation, safety and security and support required on the path to net zero.
Having applied these adjustments, we are confident that our cost base is efficient as we enter RIIO-ED2. Our activity during RIIO-ED2 aims to continue that trend and improve further, adopting the operating model strategies, discussed above, that drive efficient management of the network. By driving efficient capital delivery; whole of life focus on touching the network; scale economies from increased activity; and better ways of working with our work force, we will achieve value for money for our customers.
Figure 15.4: RIIO-ED1 First 5 years v Last 5 years comparison
£m SSEN
Category Totex Changes RIIO-ED1 first 5 years RIIO-ED1 final 5 years Increase/(decrease)
LoadConnections 37 65 29
Reinforcement 99 149 50
Non LoadDiversions/ IA 61 79 18
Asset Replacement & refurb 477 536 59
NOCsFaults 271 282 11
Treecutting 128 136 9
CAI Total 634 682 48
BSC IT 147 192 45
Non Op Capex Total 65 42 (23)
High Value Projects 37 9 (28)
TOTAL 219

156 | Section E: Chapter Fifteen: Cost Efficiency
RIIO-ED2 COST DRIVERS
RIIO-ED2 represents a step change in the level of network workload, complexity and outputs. This means that direct cost comparisons are often no longer valid. RIIO-ED2 will see new drivers of network costs and witness the expansion of many others.
The incremental components of our cost base have a range of cost drivers. In this section we summarise key drivers of increased investment proposed in RIIO-ED2, split by key areas of our plan. These costs incorporate the embedded efficiencies we discuss above. These are individually explained, evidenced, and justified within our Investment Decision Packs and accompanying plan annex documents.
Improving our IT systems (excluding DSO-related) – £137m: Many of our IT systems, and much of our IT architecture and telecoms infrastructure are not fit for the challenges that RIIO-ED2 brings. Our RIIO-ED1 investment has created a solid platform on which we can build the DSO capabilities, open data, digitalisation, efficiencies and scalability needed for the future. In RIIO-ED2, we are now building those capabilities and aim to complete digitalisation of our IT systems during this price control. The scale and pace of change in RIIO-ED2 drives a commensurate increase in our IT investment. The individual justification for each component of our IT strategy is contained within our Investment Decision Packs. To ensure that our proposed RIIO-ED2 IT investments represent value, we appointed Gartner UK Limited to carry out a benchmarking exercise against its database of similar deployments. Our investment proposals are within Gartner’s benchmarked ranges. This includes associated license, workforce and cloud support costs.
Customer and vulnerability – £25m: Our vulnerability strategy (£13m) for RIIO-ED2 provides Fuel Poverty and Partnership funding, an award-winning enabling fund, a proactive educational programme and increases our workforce capability to provide industry standard support for our Priority Services Register customers in line with the baseline requirements set by Ofgem. Our customer strategy (£12m) is designed to meet changing customer needs and includes additional customer service advisors, and the required training and support costs to deliver our customer focused IT projects. This will enhance our online support, customer discovery and our complaints management platform.
During RIIO-ED2, our underlying core safety and resilience programme expenditure remains broadly consistent with previous controls. We face incremental costs in a small number of areas through a combination of network and third-party drivers. Our expenditure increases between price controls by £384m (after efficiency) as a result of continued high levels of injurious affection activity and receipt of new data on overhead line clearances.
Overhead line clearances – £54m: Throughout RIIO-ED1, we have undertaken overhead line inspections that record the location code, associated risk and the height of the lowest point of the conductor to ground/object across the network. More recently, to drive efficiencies and improve overall accuracy of the inspection data, we have deployed airborne Light Detection and Ranging (LiDAR) systems to assess the entire overhead network. The LiDAR survey process has highlighted an increase in future clearance volume workloads.2 We are proposing to spend £61m across both our networks on addressing clearances. We set out our approach in more detail in Maintaining a Resilient Network (Chapter 7) and Safe and Resilient (Annex 7.1).
Tree cutting – £53m: We manage the tree population adjacent to our network to maximise benefit in terms of network safety and quality of supply. The introduction of LiDAR surveys (innovation) is now providing us with materially improved quality and detail of overhead line data. To remain compliant with ESQCR we are required to resolve, where possible, all conductors below statutory limits. Our LiDAR assessment, which has been independently verified by Airbus for our southern region, has confirmed a significant state of tree intrusion on our southern region’s LV to 132kV overhead lines. This represents a mandatory driver for a substantial programme of tree cutting to maintain public safety and the resilience and the reliability of our overhead line assets.
LiDAR has also identified significant vegetation growth around LV bare-wire conductor. To manage vegetation near our overhead electrical equipment, in addition to addressing an unprecedentedly high volume of tree cutting activity (as indicated above) we are proposing to replace over 1,000km (equivalent to 25,000 spans) with ABC insulated conductor, tree-guards and another insulated conductor solution (Insuline). Our assessment indicates that the investment will remove the requirement to cut trees on a three-year cycle and instead revert to every 14 years when the tree-guard will itself require replacement.
SEPD/SHEPD underground cables – £44m: Our ageing fleet of cables is increasingly impacting customers through the number of faults and interruptions to supply. To offset this progressive deterioration in the cable asset category we have identified the need to undertake a substantial programme of LV cable and associated service cable replacement as well as proportionate intervention in the HV cable fleet in RIIO-ED2. We expect this need to continue into RIIO-ED3 reflecting the age profile of our cables.
5
Figure 15.5: RIIO-ED1 to RIIO-ED2 Expenditure
4,500
4,000
3,500
3,000
2,500
RIIO-ED1 5 Year Valued Service Safe & Resilient Net Zero Ongoing Efficiency RIIO-ED2 Total
£3,033m£162m
£384m
£556m£3,994m
(£141m)
2,000
A VALUED AND TRUSTED SERVICE FOR OUR CUSTOMERS AND COMMUNITIES (SECTION B)
A SAFE, RESILIENT AND RESPONSIVE NETWORK (SECTION C)
2 Track Record (Chapter 2) explains that over the eight-year period we have also incurred considerably higher costs around overhead line clearances (around £40m) than envisaged in our RIIO-ED1 business plan in the first few years of RIIO-ED1. Our focus since then has been on deploying LiDAR to enable a more efficient approach to managing our overhead line network.

157 | Section E: Chapter Fifteen: Cost Efficiency
SHEPD subsea cables – £131m: We have identified the need for a more proactive, extensive and strategic subsea cable replacement programme. We are seeking to minimise costly reactive replacements by targeting assets at the end of their operational life and with material cost impacts should they fail while in service. The programme also recognises the strategic importance of our larger cables supporting demand and generation customers on Orkney and Uist. Further detail is contained in our Scottish Islands (Annex 8.1).
Wayleaves and injurious affection – £33m: Wayleaves are the payments we make to landowners for allowing us to use their land to ‘host’ our assets, typically overhead line towers. Compensation covers the payments we make where landowners can evidence that the presence of our assets has a negative financial impact on them. Compensation claim costs will increase as our network continues to grow. However, the primary driver of the forecast higher costs in RIIO-ED2, relate to the rapid growth in compensation claims submitted in RIIO-ED1, which we expect to continue to grow in RIIO-ED2. Our proposals include plans for Injurious Affection claims to be treated as an end of RIIO-ED2 period close out mechanism.
In RIIO-ED2, we are forecasting to spend £97m and £15m in our SEPD and SHEPD networks respectively compared to £66m and £13m respectively in RIIO-ED1. We have included savings through economies of scale arising from increased regular use of land agents and legal support. We set out our justification in Safe and Resilient (Annex 7.1).
Other – £70m: These are increases across non-operational capex, property and tools (£21m); maintenance and inspections (£36m); and associated indirect costs to facilitate increased activity in RIIO-ED2 (£28m) offset by Shetland reduction of £14m. More details of these costs are contained in our Cost Efficiency (Annex 15.1).
Our plan is fundamental to delivering our stakeholders’ net zero ambitions which are aligned with legally binding government targets. Where we have confidence in the activities and costs underpinning our proposals, we have included these in our plans for base allowances. Where activities are less certain in terms of volume or costs, we propose that these are captured by uncertainty mechanisms. This will help ensure customers are protected.
The net zero investments in our base plan are driven by:
• Load-related investment required to support the uptake of consumer demand for low-carbon technologies;
• investments required to enable our transition to DSO;
• investment in IT systems required to support net zero ambitions;
• investment in control rooms that will enable great operability of the network required under net zero;
• investments required for us to achieve mandatory environment requirements driven by net zero targets; and
• increased investment offset by removal of NIC funding (£15m).
Load-related investment – £309m: The primary driver for net zero expenditure relates to load-related capex (£287m), IT Connections+ project (£10m) and indirect costs (£12m) to support the increase deliverables. The drivers for this investment increase can be represented by the following metrics which emerge from the forecast energy scenarios.
• 1,660MW of EV chargers connect to our network at the end of RIIO-ED1, rising to over 6,500MW by the end of RIIO-ED2;
• 245k EVs in our network areas at the end of RIIO-ED1, rising to 1.3m by the end of the RIIO-ED2 period; and
• 208k heat pumps in our network areas at the end of RIIO-ED1, rising to over 800k by the end of RIIO-ED2.
We are adopting a flexibility first approach, but even with our ambition to expand network services we will face a material drive for increased load investment in the RIIO-ED2 period and beyond.
DSO related investment – £73m: Our role as a DSO is to enable the technologies, markets and solutions which are required for an efficient and effective transition to net zero. Expanding our DSO capabilities will enable this by facilitating the uptake of flexibility, low-carbon technologies and market development, as well as allowing us to deliver our flexibility first commitment when selecting appropriate interventions to meet network demands. The scale of the low-carbon technology drivers noted above, and the need to secure flexibility solutions as efficiently as possible, demonstrate why the drive to implement DSO capabilities is also as strong.
Environmental requirements – £145m: As part of the legislative environment requirements aligned with net zero, we have included incremental expenditure of £122m across a number of activities in our core plan where we are clear on need, volume and timing. We anticipate needing to spend £42m on transformer replacement and refurbishment as a result of the PCB environmental requirements. This also includes £10m of non-load capex that is required to deliver storage solutions on our Battery Point (Stornoway) and Bowmore power stations. £5m in non-operational capex is for substation efficiencies and hybrid mobile generators, with £8m indirect support costs to enable the business to deliver on these environmental requirements.
Control room – £44m: Control rooms are the nerve centre of network and energy system operation. Rapid expansion of network operations associated with delivery of new connections and network capacity as well as the increased complexity of the system creates a significant pinch point in our RIIO-ED2 delivery plans to keep us, and our customers, on a pathway to net zero. The volume, complexity and interconnectedness of these changes will require new capabilities and greater capacity while remaining compliant with the security levels associated with Critical National Infrastructures and the SSEN Business Continuity Plan. We have managed to avert any additional costs for customers in respect of our two control rooms (south/north) in recent price controls. The scale of change in RIIO-ED2 requires us now to make that step change in scale and security.
ACCELERATED PROGRESS TOWARDS A NET ZERO WORLD (SECTION D)

158 | Section E: Chapter Fifteen: Cost Efficiency
CONFIDENCE IN OUR COST DATA UNDERPINNING OUR RIIO-ED2 FORECAST
Ofgem will assess our business plan using its range of cost assessment tools. In that process, it is seeking assurance that the cost information being used is robust, reliable and independent from our cost forecast.
Our cost forecasts have been derived using evidence from a combination of sources and the information included within accompanying cost books and cost confidence tables. This evidence includes:
• RIIO-ED1 actual costs;
• cost information sourced from competitive tendering process; and
• market cost data, where this better reflect the future costs for carrying out the work.
We are clear where and when we have overlaid further efficiency stretches or specific rate improvement and the justification for doing so. This allows Ofgem to trace our cost forecast back to reported or independent data. It enables Ofgem to independently assess and verify where any adjustments have been made to actual outturn costs.
This costing methodology provides confidence in the accuracy, consistency and integrity of our costs. In our Cost Confidence Assessment (Annex 15.3), we have provided detail on the classification of cost confidence with a detailed cost book and other supporting documents to provide transparency around our costing methodologies.
Our assessment is that 95% of our totex forecast costs can be attributed to Ofgem’s criteria for high-cost confidence, with 5% of our forecast costs for which we have yet to secure the relevant independent data source. This would produce a blended sharing factor of 48.3%.
6
REAL PRICE EFFECTS
Differences between the growth rate of DNO input prices and general inflation on a CPIH basis are known as Real Price Effects.
For RIIO-ED2, Ofgem proposes to adjust for that potential difference between input prices and general inflation by indexing benchmarked input price indices annually.
To consider the selection and application of indices, the Energy Networks Association commissioned NERA Economic Consulting (NERA) to advise on Real Price Effects. This report is included with our plan see Price Effects for the RIIO-ED2 Price Control Review (Annex 15.5). This includes the categories general labour, specialist labour, materials capex, materials opex, plant and equipment and transport, and indexation for this price movement.
Given that the macroeconomic outlook for the UK economy is currently highly uncertain, with significant pressures on input prices, supply chains and general inflation, we have considered RPEs as an uncertainty mechanism in our plan, with further careful consideration required by Ofgem prior to final allowance setting.
We have forecast that RPEs will increase our RIIO-ED2 position by £235m over the five-year period.
OUR RIIO-ED2 COST
The following is a high-level summary of our RIIO-ED2 forecast totex. More detailed tables by network and activity can be found in the industry standard Business Plan Data tables which we have provided extracts from along with our business plan.
7
8
Total SSEN Distribution (£m)
RIIO-ED1 Last 5 years 2023/24 2024/25 2025/26 2026/27 2027/28
Total RIIO-ED2 Spend
Load 224 125 116 130 83 57 510
Non-Load Asset Replacement 757 169 195 223 244 218 1,050
IT 122 36 59 54 55 48 252
Environmental 35 34 37 32 29 25 158
Non-Op Capex 42 13 14 18 19 19 83
NOCs 629 141 149 144 139 161 735
CAIs 682 150 155 159 159 159 781
BSC 381 84 87 91 92 94 448
Other (inc Shetland) 162 31 60 10 9 7 117
Totex (Before OE & RPE) 3,033 784 874 861 829 788 4,135
Ongoing Efficiency (OE) 0 -16 -24 -30 -34 -37 -141
Totex (Before RPE) 3,033 768 849 831 795 750 3,994
Real Price Effects (RPE) 0 27 40 49 57 63 235
Totex 3,033 795 889 880 852 813 4,229
Figure 15.6: RIIO-ED1 Last 5 Years vs RIIO-ED2 Comparison

159 | Section E: Chapter Sixteen: Ensuring Deliverability and a Resilient Workforce
CHAPTER SIXTEEN: ENSURING DELIVERABILITY AND A RESILIENT WORKFORCE
Our RIIO-ED2 proposals are underpinned by a robust deliverability strategy, embedded throughout the Business Plan, and supported by supply chain and workforce resilience strategies. Together, these are central to ensuring we have the capabilities required to deliver both our own and our communities’ net zero ambitions.
In this chapter we explain our overarching Deliverability Strategy (Annex 16.1), including our Supply Chain Strategy (Annex 16.2) and Workforce Resilience Strategy (Annex 16.3). We provide confidence that we will be able to efficiently deliver our Business Plan and drive value for consumers and the communities we serve.
We understand the challenges within our industry and the constraints that are likely to develop both within the supply chain and our ability to ramp up our workforce and skills at the required rate to deliver our plan.
We are confident in our ability to deliver a business plan which will act as an enabler to the net zero transition. Our deliverability strategy is focused on maximising synergies across different activities, enabling us to touch the network efficiently and minimise disruption for customers and communities. It is underpinned by robust commercial and supply strategies, and has been validated through extensive supply chain engagement and independent assessments, as shown in Figure 16.2. Our workforce resilience strategy focuses on developing the skills we will need as we take on greater DSO roles and responsibilities, and to reflect the diverse nature of the communities we serve.
Scale of the challenge
Delivering on our governments’ and communities’ net zero ambitions requires a step change in our capital delivery compared to RIIO-ED1. We will need to accelerate investment in low carbon technologies (LCT), encourage the switch to electric vehicles (EV) and develop our flexibility services. Our delivery model has been designed with this in mind.
We have developed a robust delivery approach with consideration of our plan as a whole and its key component parts. We have used established capital delivery methods across key infrastructure sectors. We have externally tested our approach (for the delivery of both our baseline plan and our proposed uncertainty mechanisms) with a diverse range of stakeholders, using their challenge, feedback and input to refine and mould our approach with consideration of our customer journey and our local communities. The reason for our change is driven by the need to deliver improvements, greater volumes of work and network interventions whilst minimising disruption to our domestic and commercial customers.
SUPPORTING DOCUMENTS
Deliverability Strategy (Annex 16.1)
Supply Chain Strategy (Annex 16.2)
Workforce Resilience Strategy (Annex 16.3)
Operating Business Costs (Annex 15.6)
To deliver our RIIO-ED2 business plan, we will increase our workforce to over 4,800 compared to around 3,950 at the end of RIIO-ED1. A more inclusive and diverse workforce will give us an opportunity to demonstrate how we can better participate in the post Covid-19 ‘green recovery’ and be part of the UK Government’s Build Back Better plan for growth that aims to deliver holistic benefits for individuals, communities and society on the road to net zero.
We have assessed the synergies between our planned load, non-load, and environmental investments to plan the scheduling of work most efficiently and minimise disruption to customers. We have embedded efficiencies into our plan by optimising activities across investment drivers. Please see Costs and Efficiency (Chapter 16) for further details.

160 | Section E: Chapter Sixteen: Ensuring Deliverability and a Resilient Workforce
ENHANCED ENGAGEMENT OVERVIEW
We engaged with 7,575 stakeholders across 36 events on deliverability, supply chain and workforce resilience, and they identified the following RIIO-ED2 priorities:
1
TOP STAKEHOLDER PRIORITIES
Attracting skilled talent and more training for current staff to prepare for the new workforce demands in RIIO-ED2
Work with stakeholders to improve programme visibility and maximise cost-efficiency opportunities
Provide adequate support for supply chain stakeholders to adapt and comply with sustainability requirements
HOW WE RESPONDED TO FEEDBACK
Supply Chain Resources & Skills Development: Contractors and other stakeholders noted the industry-wide skills shortage. As outlined in our supply chain strategy, we are supporting our contract partners by building committed volume partnerships and ensuring advance planning of long-term programmes of work to book capacity in the supply chain in order to recruit, develop a pipeline of skills and retain key resources.
Cost-efficiency opportunities: There are cost-efficiency opportunities via our deliverability approach which engages our suppliers earlier and provides visibility of our pipeline. Incorporating this and other supply chain feedback in our strategies, enhances our approach and moves away from a single focus on unit cost reductions.
Value improvement: As a result of feedback from supply chain stakeholders, collaboration around safety, design, deliverability, sustainability and IT/OT underpins our supply chain strategy.
Sustainability: In collaboration with our supply chain, we’ve developed a draft Sustainable Suppliers Code that incorporates 16 sustainability themes. We’ll work with stakeholders to help them meet the code, understand any challenges they may face and make sure small suppliers are not unfairly impacted.
*Refined Output* Workforce Resilience: We have developed a comprehensive strategy with workforce resilience metrics that address Ofgem’s recommended focus areas using feedback gathered and compared from a range of stakeholders, both internal and external. These views have helped us to build data- informed plans which will enable us to meet the net zero challenge, including addressing diversity, inclusion and equality.
*Enhanced Output* Recruitment: Attracting and retaining staff was highlighted as a challenge for us in RIIO-ED2. We are focusing our efforts on attracting new entrants to the industry, growing skills through internal reward and progression models and increasing opportunities for social mobility and wider inclusion and diversity.
KEY STAKEHOLDER INSIGHTS
Open discovery
• Maintaining a skilled workforce was identified as an important challenge for us in RIIO-ED2
• Engagement with youth and attracting them into the energy industry was recommended as a way to pursue a sustainable skilled workforce in the future
• We should work towards fairer pay and reducing gender inequalities
• Collaborating with the supply chain is important to ensure they are ethical and sustainable
Co-creation
• Lack of sufficient workforce resources and skillset could be a barrier to our RIIO-ED2 ambitions
• Increasing the visibility of our projects as well as supporting innovation and new capabilities were deemed the top cost-efficiency opportunities
• Most suppliers in the Supply Chain Sustainability event were unfamiliar with the Science-Based Targets (SBT) and thus noted that we must support them to meet obligations
Business Plan refinement
• Attracting skilled talent and addressing key skill gaps (both by training internally and more competitive recruitment) was a key area of concern
• Engaging and attracting more new entrants, as well as being more inclusive and diverse, were key long-term strategies noted for a resilient and sustainable workforce
• Assisting supply chain stakeholders towards net zero will be fundamental to help us reach our SBT
Testing and acceptance
• Providing the opportunities for new entrants as well as upskilling current staff were both key priorities in improving workforce resilience during RIIO-ED2
• Supply chain stakeholders noted the opportunities for cost efficiencies both through innovation and better strategic programme clarity and approach
• 35% of domestic customers in the South and 35% in the North said that signing up 80% of our supply chain (by value) by 2028 to our Sustainable Supplier code was a high priority
to August 2020
Aug 20 – Feb 21
Feb 21 – Jun 21
Jun 21 – Dec 21
*Enhanced Output* – This denotes a change in ambition or scope in the output between our draft and final plan. *Refined Output* – This denotes a change in ambition or scope in the output between our draft and final plan.

161 | Section E: Chapter Sixteen: Ensuring Deliverability and a Resilient Workforce
OUR DELIVERABILITY STRATEGY FOR RIIO-ED2
Assessing deliverability has been a core activity of our business planning process for RIIO-ED2, ensuring that our ambition can be translated into a deliverable programme of work that will be a true enabler for net zero.
The increased volume of work required to deliver net zero will require a change in the way capital expenditure is delivered. We will do this by maximising synergies within our network and collaborating with our suppliers, other utilities and beyond to minimise disruption to customers. A flexible delivery model will be essential, one that
balances insourcing and outsourcing opportunities and works in partnership with the supply chain.
We recognise that with such significant change comes risk and have considered and developed response plans as we start to prepare for RIIO-ED2.
2
2.1 Evolving our delivery model
Effective work allocation models which enable early contractor involvement and visibility of work banks are critical to drive value for money for our customers and develop a pipeline of the necessary skills.
Our Grid Supply Points (GSPs) will act as common denominators to create geographically concentrated work banks across our regions, allowing us to capitalise on economies of scale within the supply chain. This approach will enable visibility of our work in the short, medium, and long term, allowing early engagement with and creating opportunities to collaborate with Local Authorities and other utilities in delivering our plan. Please see Whole Systems (Chapter 12) for further details.
Recognising the multidisciplinary nature of work, we have created four programmes of work within a given GSP, outlined in figure 16.1.
We recognise not everything falls into the GSP model, and have therefore created Programme 5, addressing targeted issues, for example, a dedicated team and supplier to deliver Rising and Lateral Mains (RLMs) or PCBs.
Our approach will capitalise on synergies between often reactive new connections work and strategically planned load and non-load work, whereby the associated downstream work from a substation will maximise outage utilisation, enabling the programme to touch the network in an efficient and controlled manner. We utilise our system planning function to influence the planning and phasing of work within a given programme. This will allow us to understand where work can be completed in parallel without putting the network and customers at unnecessary risk or disruption. This will enable us to create a forward-looking plan that can be continually refined but importantly allows us to provide visibility to our customers of planned work or disruptions.
GRID SUPPLY POINT (GSP)
Programme 1
Load – Primary Reinforcement Load – Secondary Reinforcement
Programme 2
Non-Load Non-Load
Substations which are driven by primary reinforcement, and associated non-load work, to be awarded to the supply chain.
Substations which are driven by secondary reinforcement, and associated non-load work, to be awarded to the supply chain.
Programme 3 Programme 4
Non-Load Non-Load
Specific work types by asset class that are a proportion of volumes in Programme 4 to be awarded to the Supply Chain.
Substations which are driven by non-load work only, to be insourced.
Programme 5
Non-Load
Specific work types by asset class for which the total volume of work will be awarded to the supply chain.
Figure 16.1: Work Allocation Model
Figure 16.2: Testing our delivery model
VALIDATING OUR DELIVERABILITY MODEL
We have validated our delivery model through extensive supply chain engagement to ensure its attractiveness to the marketplace (see (Annex 16.2) for more details). Having also stress-tested our model with industry leaders across key infrastructure sectors, we have integrated feedback and will continue to refine this ahead of RIIO-ED2.
• Successful validation of asset management practices (ISO5500)
• Engagement with over 100 suppliers
• Operational strategic review, challenging, refining and endorsing our GSP approach
• Further testing and exploration of value levers
• Sustainability focus, informing our Sustainable Supplier Code
• Peer-to-peer review highlighting cultural shift required to enable collaborative working
• Evaluation of our project, programme and portfolio management capability. Key change drivers to improve maturity identified
• Independent assessment of prospective commercial and incentivisation models
External asset management review
External capital SME embedded
Supply chain engagement phase 1
External commercial model review
External project, programme and portfolio management assessment
External peer-to-peer review
Supply chain engagement phase 2

162 | Section E: Chapter Sixteen: Ensuring Deliverability and a Resilient Workforce
2.2 A robust commercial strategy An effective work allocation model requires a corresponding, robust, commercial strategy that incentivises the supply chain for better delivery, safety, and sustainable performance.
We have developed partnership models for our work programmes which provide delivery capacity and capability for our RIIO-ED2 plans. And recognising the flexible and diverse need for different types of work, we have allocated bespoke commercial strategies associated with each package of work.
We will become more intelligent in our risk apportionment using a common approach with our supply chain, ensuring the best party is placed to control or manage the risk. For example, as we develop new contracting strategies, we have adopted ‘design and delivery by the same’ principles. This acts as both an incentive mechanism to reduce any overengineering and removes the need to transfer design liability or manage interfacing contracts.
2.3 Insource/outsource mix We have identified our core internal skills for RIIO-ED2 measured against existing and future capacity and have evaluated our sourcing mix to assess opportunities to alleviate any constraints through outsourcing. We have considered the insource vs. outsource delivered unit cost information to inform our mix, recognising the level of in house resource required for reactive and critical activities to ensure capacity for severe weather events and return to service performance.
Recognising the need to mobilise time-bound activities, such as removal of PCB1-contaminated pole-mounted transformers, we have established dedicated end to end delivery teams. We have also considered the benefits delivered through insourcing initiatives from our Capital Efficiency Programme. We have refined our in house workforce capacity and skills constraints based on our planned recruitment and training profile and planned sourcing mix as well as the efficiencies we have built into our Business Plan. Finally, we have also considered the diverse skillset required to manage our outsourced programmes of work, in particular strong project management and commercial management competences. We have aligned ourselves to the relevant professional bodies to ensure we have both the competences required and a clear development pathway.
2.4 Mobilising for RIIO-ED2 We recognise the level of business change required to support more collaborative working, including the cultural and behavioural change required by us. We firmly believe this will provide the best outcomes for our consumers and communities evidenced by our supply chain insights, wider consultations, and cross-sector case studies.
We need to start the transition now and we have already established a mobilisation programme to prioritise improvements and activities for the start of RIIO-ED2. We have identified champions for all new approaches to be delivered, including personas and practices. We have reviewed our process and procedures, tools and systems to facilitate improved outcomes for our customers. Our investment in new tools and systems as part of our digital strategy provides the foundation for collaborative working and planning of our programmes – see our Digital Strategy and Action Plan (Annex 5.2).
It is essential that we have the right competence to manage such a diverse range of programmes projects, and our workforce resilience strategy is designed to achieve this.
Our two regulated businesses operate in different landscapes with unique delivery challenges, and one size does not fit all. In the north of Scotland, we will continue to deliver more work through our inhouse delivery teams and use our supply chain partners to smooth delivery peaks. For our atypical asset interventions, such as subsea cable renewals we will establish standalone programmes of work with incentivised commercial models for effective delivery. Where applicable, we will adopt the most appropriate principles, programmes and commercial strategies considering the specific needs of our licence areas.
We have considered complexity and risk factors, such as long lead times for consenting and wayleaves, to influence our load and non-load phasing to ensure our plan is deliverable, as well as applying our ‘flexibility first’ approach to smooth the profile of work, as set out in Distribution System Operation (Chapter 11). We have also considered the balance of activities to be funded directly through our plan and separately through uncertainty mechanisms. We will continuously monitor and reassess requirements as our confidence in the work mix matures. In Our Network as a Net Zero Enabler (Chapter 10), we explain how we have assessed lead times and impact on deliverability. Finally, in Whole Systems (Chapter 12), we explain how we will work across utilities to minimise the impact of works on our customers and communities.
Our RIIO-ED2 Digital Investment Plan (Annex 5.1) provides the platform for digital transformation, enabling an integrated approach to our Customer Operations and Asset Management functions by investing in best practice tools and systems, providing us with the ability to collaborate with our partners. We also detail investments critical to developing new capabilities, and improving our existing IT systems to move to a fully digitalised business for the betterment of our commercial and domestic customers. Without such investments we risk our deliverability of the overall Business Plan and lessening customer experience.
1 Polychlorinated biphenyl, a highly toxic industrial product once commonly used as an insulating layer in transformers

163 | Section E: Chapter Sixteen: Ensuring Deliverability and a Resilient Workforce
OUR SUPPLY CHAIN STRATEGY FOR RIIO-ED2
We are setting up longer term strategic relationships with our supply chain partners to ensure we can secure key resources and provide supply security for our customers to deliver the step change in volume from RIIO-ED1 to RIIO-ED2.
Our supply chain strategy is aligned with the core principles of:
Our supply chain strategy has been designed in parallel with our deliverability and workforce strategies to ensure we have the ability to optimise and find synergies across our work bank and deliver our programme efficiently. It will continue to build on the key RIIO-ED1 improvements such as category management, batching of requirements and optimising commercial management, whilst having fully considered the risks and opportunities of local customer/consumer network and supply chain.
Moving to a more long-term collaborative relationships, we considered cross-sector delivery models in other key infrastructure sectors such as rail, water, and aviation industries that have achieved step change increase in volume delivery efficiently and effectively. For example, we have considered publications by the Infrastructure Project Authority, in particular the Transforming Infrastructure Performance: Roadmap to 2030 – drawing on the key transformations for the built environment to drive a step change in infrastructure performance.
Our supply chain strategy will drive benefits through:
• A range of contracting strategies that support a flexible, effective, sector leading, optimised approach to support the ‘Touch the Network Efficiently’ delivery concept providing for geographic variables, as yet unknown requirements, internal resource availability, together with tiers, core competencies and capability of the supply chain
• Refinement of procurement strategy models and delivery of further efficiencies through long-term commitments, earlier contractor involvement, clear risk ownership and cost reduction synergies between ourselves and our supply chain
• More collaborative longer-term strategic relationships to support our requirements in the areas of enduring safety, innovation, cost reduction initiatives and increasing skills and resource development.
• Review of our regional and local supply chain strategies to ensure they meet the needs of our customers and their requirements in RIIO-ED2
• Providing the supply chain with greater visibility, certainty, and continuity of work to support skills and resource development and increased efficiency
• Collaboratively developing a robust, aspirational, and deliverable sustainable supplier code
3
Being open and accessible in our activity and engagement
VALUE FOR MONEY INNOVATION TRANSPARENCY
Focusing on flexibility, efficiency and creating value for customers
and communities
Embracing new ways of doing things for the benefit of customers
and communities
A SUSTAINABLE SUPPLIER CODE
We have developed a draft Sustainable Supplier Code which is to be finalised and implemented in time for the commencement of RIIO-ED2.
Supply chain maturity assessment: 16 SDG-related key themes
Using the UN’s key Sustainable Development Goals (SDGs) most relevant to supply chain activities as our starting point, we have based the development of our sustainable procurement approach on the 16 key themes associated with the Key SDGs; all of which fall under the 3 pillars of Sustainability; namely Environmental, Social and Economic. Our code is detailed in our Supply Chain Strategy (Annex 16.2) and aligns with our Sustainability Strategy (Annex 13.2).
ENVIRONMENTAL MANAGEMENT SYSTEM (EMS):
POLICY
MODERN SLAVERY HIGH
MEDIUM
LOW
EMS: ISO14001 ACCREDITATION
SOCIAL VALUE: EQUALITY & DIVERSITY
SOCIAL VALUE: SOURCING
LOCALLYLIVING WAGE
SOCIAL VALUE: COMMUNITY
SUPPORTSUSTAINABLE SOURCING: SELECTION
CRITERIA
CARBON: DISCLOSING
CARBON DATA
ENERGY REDUCTION
CARBON: MEASURING
CARBON FOOTPRINT
SOCIAL VALUE: TARGETS IN CONTRACTS
CARBON: DEVELOPING
SCIENCE BASED TARGETS
WASTE REDUCTION
BIODIVERSITYWATER
REDUCTION
Targets and measures are embedded. Reporting mechanisms are robust.
Value and positive outcomes can be demonstrated. Active programmes are in place.
Commitment has been confirmed and strategy has been developed. Progress has been made but targets and measures are yet to be embedded. Reporting is inconsistent.
No strategic commitment has been made. An aspiration at best. Concepts and feasibility are under review.

164 | Section E: Chapter Sixteen: Ensuring Deliverability and a Resilient Workforce
OUR WORKFORCE RESILIENCE STRATEGY FOR RIIO-ED2
Our workforce resilience strategy reflects the step-change in the level of activity we will see in RIIO-ED2. Our workforce will be delivering more work on average each year compared to RIIO-ED1 and this will require growth in its size, skillset and diversity. Our people will play a key role in working with our customers and the communities we serve to deliver our net zero ambitions.
We have engaged with a wide range of stakeholders to support the development of our workforce resilience strategy, including trade unions and our employees through local authorities and various customer groups, to industry bodies including Energy & Utility Skills (EUSkills) and other Distribution Network Operators (DNOs). Increasing the size, skills and diversity of our workforce is critical to deliverability of our plan’s strategic outcomes and essential for the transition to net zero.
Our workforce resilience strategy priorities support Ofgem’s Minimum Requirements for workforce resilience as outlined in the diagram below. This will be the vehicle for delivery of our strategy.
4
Figure 16.3: Alignment between our Workforce Reliance Strategy and Ofgem’s Minimum Requirements
4.1 Our six focus areas Our workforce resilience strategy has six focus areas:
Improving inclusion, diversity and equality A step change in diversity across our business will improve its resilience and ability to innovate when these attributes
are most needed to meet the challenge of a net zero future. Creating true workforce diversity will reflect the society we serve, and represent our customers, bringing understanding of their needs. We’ll bring greater social inclusion, building the attraction of the industry overall for new entrants, particularly those from less well-represented groups.
Less well-represented groups include women, people from minority ethnic backgrounds, people with disabilities, LGBTQ+, and also those who are disadvantaged socially by lack of opportunity. We know that we’ve so much more to do to create a diversity transformation in RIIO-ED2; we need to create an organisation in which everyone can, and wants to, thrive and belong. This is where value lies for our employees and our business; and for the customers and communities we serve.
We’ve also signed up to Equal by 30, which commits organisations to work towards equal pay, equal leadership and equal opportunities for women in the clean energy sector by 2030 as part of our 2030 commitment to the decent work and economic growth Sustainable Development Goal.
We remain committed to closing the gender pay gap to mirror our success in closing the equal pay gap
Improving workforce satisfaction We’ll continue listening to and valuing the voices of our employees, through our engagement surveys, unions,
employee-led forums, and the feedback of our independent Engagement Director. Their feedback and suggestions will drive changes to our people strategies and ensure we’re delivering what employees tell us they need. Creating and maintaining a great place to work will reduce churn, help retain talented people and will promote a culture which delivers excellent business outcomes for our customers.
Improving workforce motivation and productivity To ensure operational excellence we’re optimising working patterns to fit the needs of our customers and aligning the
workforce skills to drive a better experience, whilst safeguarding our safety standards and increasing productivity. We’re offering flexible working opportunities, attractive benefits and modernising our pay progression model to reward the development of new capabilities needed in net zero. We’re investing in our leadership capability through our leadership development programme, so managers are aware of their impact and the role they play in developing additional skills in our people to deliver more effectively.
OUR DIVERSITY TARGETS
1) 40% of females in Middle Management by 2030
2) 30% of Executive Board Positions to be female by 2030 (includes Non-Exec Directors)
3) 30% of Executive Board Directors positions occupied by women (excludes Non-Exec Directors)
4) ‘One by 2021’ – At Least 1 director from an ethnic minority background on main Board
1
2
3
INCLUSION AND DIVERSITY
Providing focus and energy to create a flexible workforce reflective of our communities
HEALTH AND WELLBEING
Caring for our mental and physical health by improving our service provision
ORGANISATIONAL CAPABILITY AND LEARNING
Invest in our business and people capabilities to meet customer requirements
INSPIRING LEADERSHIP
Accountable and empowering leaders, building and sustaining trust and engagement
MODERNISING EMPLOYEE RELATIONS
Partnering and problem solving to support a safe, inclusive and productive work environment
REWARD
Fair pay and benefits, relevant to market that attracts, retains and rewards
STRATEGIC WORKFORCE PLANNING
Right number Right people
Right structure Right place
Improving inclusion, diversity and equality
Improving workforce satisfaction
Improving workforce motivation and productivity
Attracting people to the energy sector and developing the skills needed to a
technology-driven, low carbon energy system
Upskilling and multi-skilling the existing workforce

165 | Section E: Chapter Sixteen: Ensuring Deliverability and a Resilient Workforce
Attracting people to the energy sector and developing the skills needed for a technology-driven, low carbon energy system Increasing our learner pipeline through apprentices,
graduates and trainee engineers, we’ll be working with other DNOs to build our profile as an industry with an exciting focus on a better, greener future for everyone. We’ll extend our attraction campaigns to those moving out of the high carbon energy sectors with transferable skills, or those with Science, Technology, Engineering and Mathematics (STEM) qualifications returning to the workplace.
Upskilling and multiskilling the existing workforce Using our Ofsted-accredited internal training schools to increase the training of our existing workforce, we’re giving them the skills and competencies needed for a low-carbon
technology future, as well as rewarding and motivating career development through our pay progression model.
Ensuring the health, safety and mental well-being of the workforce Our priority is to ensure that we all get home safe. Our people strategies focus on a safe working environment;
mental and physical health and wellbeing; fair and transparent pay; attractive benefits; work-life balance; flexible working opportunities and by creating an inclusive, engaging workplace where everyone can be themselves, and be everything they are.
Delivering on the six focus areas that make up our workforce resilience strategy will ensure we have a diverse, skilled, motivated and productive workforce to deliver a safe, resilient and reliable network for our customers.
4
5
6
WORKFORCE RESILIENCE METRICS
We have been working with other DNOs to discuss ideas/best practice and to identify a suite of metrics to measure our workforce resilience, and continually improve the quality and visibility of our data to inform industry-wide decision making. We have agreed common metrics in the five key areas which are priorities for RIIO-ED2:
• Gender pay gap
• Increasing gender, ethnicity and disability workforce diversity
• Increase workforce diversity in STEM-related and leadership roles
• Improving workforce satisfaction to help deliver a better service for customers and an improved employee experience
• Improve employee well-being and targeted support measures for mental health
We will report annually on these metrics and use the ENA’s Diversity, Equality and Inclusion Committee to agree common definitions of metrics and as a forum for ongoing collaboration. We are committed to the National Skills Academy for Power (NSAP) pilot to develop a set of common metrics for workforce resilience capturing attraction, skills development and retention, in collaboration with EUSkills. We are also enhancing other metrics including around sickness absence and mental health in the workplace.
4.2 Workforce requirements for RIIO-ED2 By the end of RIIO-ED1, our workforce is predicted to exceed 3,950. In RIIO-ED2 we are proposing to increase our workforce to 4,839 to deliver our Business Plan. This increase in our workforce will ensure not only that we can continue to deliver our commitments safely, efficiently and to our customers’ expectations, but also enable the transition to net zero.
The growth in our workforce, by directorate, is summarised in detail in our Workforce Resilience Strategy (Annex 16.3).
Key activity areas Growth Role mix Driver
NON-OPERATIONAL 556
Asset Management 114Design engineers, portfolio investment engineers, land consents specialists and asset data analysts
Increased volumes, innovation, sustainability and whole system
Connections 100 Project Delivery, designers and quotersConsumer Transformation, anticipated demand for EV connections
Project and programme management
174Commercial project and programme management, construction management and commissioning engineers, protection engineers and senior authorised persons
Safety and operational efficiency, capital project delivery, IP connectivity and active network management
Performance 28Data scientists and analysts, digital transformation and change specialists, and support for our enhanced regulatory environment
Supporting transformational change, regulation, and knowledge and information management
System Operations 140 System and outage planning engineers, control engineersFlexibility, increased need for system and outage planning; whole systems solutions, control room growth and new reporting requirements
OPERATIONAL FRONTLINE ROLES
290
Frontline roles 290Frontline craft roles, LV operations and maintenance, vulnerable customer contact centre staff
Increased volumes, enhanced vulnerability commitments, avoiding excessive overtime
TRAINEES 57
Trainees 57 Apprentices, trainee engineers and graduatesSupporting growth with increased entry level roles over and above RIIO-ED1 levels. New pipelines for data and digital skills apprenticeships
SUBTOTAL 903
Less the redeployment of RIIO-ED2 business plan team
-38
TOTAL 865
We understand that there is considerable competition for skilled resource, and this creates risks to our workforce resilience in resourcing, training and retaining staff, and ensuring their safe and healthy working patterns. We have worked with EUSkills to provide a role by role, region by region risk assessment mapping each role and skill requirement with a strategy for delivery.
Our workforce resilience strategy complements our deliverability and supply chain strategies. Our workforce combined with our supply chain will enable us to successfully deliver our Business Plan.
Figure 16.4: RIIO-ED2 workforce requirement by key activity areas

166 | Section E: Chapter Seventeen: Uncertainty Mechanisms
CHAPTER SEVENTEEN: UNCERTAINTY MECHANISMS
MANAGING UNCERTAINTY IN RIIO-ED2
Our RIIO-ED2 Business Plan is based on the latest robust and credible evidence and information available today. However, we understand that needs can change, meaning further investment during RIIO-ED2 will likely be required; and it is possible in some cases, investments may also not materialise as originally anticipated. Our plan includes a set of options for managing the known unknowns (uncertainties) we face in RIIO-ED2.
We firstly draw an important distinction between internal risks and external uncertainties. Internal risks are challenges to be actively managed and mitigated by DNOs on a continuous basis. An example is supply chain delays due to Covid-19.
External uncertainties are known unknowns that fall outside DNOs’ direct control, which can drive a significant scale of change in investment requirements. By their nature, these uncertainties are dependent on policy, market, or stakeholder needs evolving. Key examples include decisions on net zero, which will likely lead to increased electric vehicle uptake.
A key tool for managing uncertainties, is Uncertainty Mechanisms (UMs). UMs offer the opportunity to adjust investment (both up and down) to better reflect services needed by stakeholders over RIIO-ED2, triggered by distinct shifts in external policy, economic, and market evolution. This is especially important given the pace of change required to deliver net zero.
Our balanced, yet agile approach to managing uncertainty has been woven throughout our plan. We are only proposing baseline investment with high certainty of need, aligned with Ofgem guidance and the need to protect customers from unjustified bill increases. Our proposed UMs are targeted towards genuine, specific, and measurable areas where need has a high probability of changing and the impact of variance is significant, rather than being used as a ‘catch-all’ or an insurance policy. They are not designed to act as a disincentive to finding efficiencies through delivery or managing risks we should otherwise absorb in RIIO-ED2, a point we have tested carefully.
As set out through the plan Executive Summary our UMs form part of our balanced, yet agile approach to managing uncertainty and risk in the round, taking account of anticipatory need appropriately. Alongside our baseline investment, deliverability, and financeability plans they ensure we can credibly deliver for customer’s and society’s evolving needs.
SUPPORTING DOCUMENTS
Uncertainty Mechanism (Annex 17.1)
Design of a Strategic Investment Uncertainty Mechanism (Annex 17.1.1)
HOW WE HAVE PRESENTED OUR UNCERTAINTY MECHANISM PROPOSALS ACROSS THE RIIO-ED2 BUSINESS PLAN
In the RIIO-ED2 Sector Specific Methodology Decision (SSMD), Ofgem set out its proposals for a series of common UMs. The SSMD also allows DNOs to propose additional UMs.
In this chapter, we focus on our additional UM proposals, describing the process we have followed to develop these and their rationale. We also analyse the overall financial impacts of UMs (inclusive of Ofgem’s common UMs), assessing their materiality relative to our baseline plan. Not all uncertainty mechanisms introduced by Ofgem are likely to be triggered
in RIIO-ED2. Some of these are in place to deal with potential future changes in government policy, the impact of which cannot currently be forecast. As an example, the net zero mechanism can only be triggered by Ofgem and as such we are not able to assess its likely impact during RIIO-ED2.
This chapter is supported by Uncertainty Mechanisms (Annex 17.1), which provides greater detail on UM designs including how we meet Ofgem’s minimum requirements for our proposals.

167 | Section E: Chapter Seventeen: Uncertainty Mechanisms
OUR APPROACH TO DEVELOPING UNCERTAINTY MECHANISM PROPOSALS
Our four-step framework for UM development.
To form our UM proposals, we have applied the four-step framework shown in Figure 17.1 below.
1
Figure 17.1: Framework for developing additional UMs
Figure 17.2: Our additional UM proposals in summary (SSEN-proposed and Ofgem- common UMs)
IDENTIFY UNCERTAINTIES
• Identify cost issues outside of SSEN management control
• Initial assessment of UM viability, informed by expert input
QUANTIFY UNCERTAINTY RANGES
• Collate and benchmark data which shows the bounds of uncertainty by area
• Assess stakeholder needs relative to the qualification
DESIGN MECHANISMS
• Determine which type of UM (re-opener, volume driver etc.) would be appropriate for each uncertainty
• Use data to determine appropriate parameter values (e.g. unit cost for volume driver)
TEST MECHANISMS
• Examine designs against Ofgem criteria for UMs as set-out within the Business Plan guidance
• Test designs to ensure consumer protection and avoid stranded assets
OUR PROPOSED RIIO-ED2 UNCERTAINTY MECHANISMS
We are proposing nine UMs in addition to Ofgem’s common set.
These have been developed following our four-step framework. It should be noted that some of our additional UMs (e.g. for subsea cables) include multiple UM types. Figure 17.2 below summarises alongside the Ofgem common UMs.
Figure 17.3 provides detail on each of our proposed additional UMs, explaining scope and the estimated cost uncertainty range presented relative to the level of baseline subject to UM. Given the inherent uncertainty it is highly unlikely that the total upward cost impact, as presented, will occur for all UMs and the true impact is likely to fall within the ranges.
2
UM name Type of UM Applicable to…
SSEN-PROPOSED ADDITIONAL UMS
Wayleaves and Diversions Re-opener Potentially all DNOs
Shetland Re-opener & Pass- through SHEPD only
Subsea Cables Volume driver & Re-openers SHEPD and SEPD
Distributed Generation Monitoring Re-opener Potentially all DNOs
Polychlorinated Biphenyls Volume driver Potentially all DNOs
Ash dieback removal Re-opener Potentially all DNOs
Hebrides and Orkney Whole Systems Re-opener SHEPD only
Opex Adjustor Automatic cost adjustment Potentially all DNOs
Strategic Investment Volume driver Potentially all DNOs
CONFIRMED OFGEM – COMMON UMS
Smart Meter Interventions Volume driver All DNOs
Cyber Resilience Re-opener All DNOs
Electricity System Restoration Re-opener All DNOs
Environmental Legislation Re-opener All DNOs
Street works Re-opener All DNOs
Rail Electrification Re-opener All DNOs
Net zero Re-opener All DNOs
Coordinated Adjustment Mechanism Re-opener All DNOs
Enhanced Physical Site Security Re-opener All DNOs
N.B. there are several Ofgem proposed finance UMs (e.g. indexation) discussed separately in Finance and Financeability (Chapter 19) of our business plan
1 2 3 4

168 | Section E: Chapter Seventeen: Uncertainty Mechanisms
UM name Description
SSEN-PROPOSED UMS
Wayleaves and Diversions (See also CH6: Safety and Compliance)
What does the UM cover? This UM covers uncertain costs required to divert our network assets post land access wayleave termination. We also propose a close out true-up for Injurious Affection claims.
Why do we need it? The volume and average annual cost of terminations is volatile and challenging to forecast, creating a risk of material variance against baseline allowances.
Why is the UM in consumers’ interests? The UM will better align allowances to diversion works delivered; providing the flexibility to complete additional work efficiently. Equally, it will provide for reimbursement to consumers should costs be lower than forecast.
Estimated cost uncertainty range: -£9m to +£35m (SEPD baseline £45m); -£1m to +£1m (SHEPD baseline £3m)
Shetland (See also: CH8: Supporting the Scottish Islands)
What does the UM cover? This UM covers uncertain costs associated with providing the supply in Shetland pre- and post-construction of the transmission link, as previously agreed with Ofgem.
Why do we need it? There remain uncertain costs in RIIO-ED2 as the enduring supply arrangement is put in place which SHEPD needs to account and prepare for.
Why is the UM in consumers’ interests? This UM will provide flexibility to allow SHEPD to ensure all appropriate efficient costs variances are covered.
Estimated cost uncertainty range: -£13m to +£14m (SHEPD baseline £100m)
Subsea Cables (See also: CH8: Supporting the Scottish Islands)
What does the UM cover? This UM covers uncertain costs associated with subsea cables: (a) reactive replacement; (b) backup generation; and (c) cable decommissioning.
Why do we need it? The UM will provide an efficient funding route to replace vital cables following unforeseeable failure events, along with the costs of additional backup power to restore interim supply. The cable decommissioning UM covers a potential future need to remove end-of-life cables which could be imposed by Marine Scotland during RIIO-ED2.
Why is the UM in consumers’ interests? Our UM provides the flexibility needed for reactive replacement works in RIIO-ED2 recognising their unpredictability. The UM strongly incentivises cost efficiency through our broader RIIO-ED2 approach, which emphasises more cost-effective proactive works. Our UM also ensures customers will only fund additional costs (e.g. decommissioning costs) where they are truly needed.
Estimated cost uncertainty range: £0 to +£76m (SHEPD baseline £0m (UM for replacement post-fault not proactive replacement investment as set out in Supporting the Scottish Islands (Chapter 8))
Hebrides & Orkney Whole Systems (See also: CH8: Supporting the Scottish Islands)
What does the UM cover? This UM covers uncertain SHEPD cost adjustments associated with the outcome of further whole-system analysis related to our investments in the Scottish Islands.
Why do we need it? There remains near term uncertainty in public policy and the plans of others in the region; and the optimal type of solution required to meet consumer needs. Without the UM we would not have the ability to play a full role in a whole-system analysis which is required to assess changes and; we would have limited flexibility to adjust our baseline to contribute to the optimal outcome for consumers.
Why is the UM in consumers’ interests? Consumers need to have the optimal solution which maximises socio-economic welfare for the region. Until uncertainty is resolved this is hard to determine. The UM gives consumers optionality to find this solution recognising the uncertain market, and policy landscape specific to the region.
Estimated cost uncertainty range: -£151m to +£275m (SHEPD baseline £151m)
Distributed Generation (DG) Monitoring (See also CH11: Distribution System Operation)
What does the UM cover? This UM covers uncertain costs associated with increased monitoring of distributed generation assets on our network.
Why do we need it? Ofgem and DNOs are currently undertaking a review of DG monitoring across the sector, and any resulting policy decisions is expected after submission of the final business plan. Ofgem may require DNOs to fund increased DG monitoring activity over RIIO-ED2 as a result.
Why is the UM in consumers’ interests? Our UM provides the flexibility to fund increased DG monitoring if recommended by Ofgem, avoiding the need for speculative baseline funding, and recognising the policy uncertainty over who should pay for this investment.
Estimated cost uncertainty range: £0 to +£24m (SEPD baseline £0m); £0 to +£17m (SHEPD baseline £0m)
Polychlorinated Biphenyls (See also CH13: Environmentally Sustainable Network)
What does the UM cover? This UM provides flexibility to fund the replacement of assets containing Polychlorinated Biphenyls (PCBs), based on volume uncertainty.
Why do we need it? By law all assets containing PCB must be removed by end of 2025. We will continue to survey our assets for PCB into RIIO-ED2 and this UM provides flexibility to remove additional assets once better information is available on PCB volumes on our network.
Why is the UM in customers’ interests? The UM ensures the funding is based on the most accurate data (gathered through ongoing sample testing), rather than a speculative large baseline with consumers over-paying.
Estimated cost uncertainty range: £0 to +£16m (SEPD baseline £28m); £0 to +£20m (SHEPD baseline £13m)
Ash dieback removal (See also CH6: Safety and Compliance)
What does the UM cover? Our UM provides the flexibility to fund removal of diseased trees at risk of falling into contact with our network because of Ash dieback intrusion.
Why do we need it? The need to protect safety and security of supply is clear. However, there is a cost and volume uncertainty, with more survey data required on risk proximity to our assets.
Why is the UM in customers’ interests? The UM ensures consumers only pay once SSEN have better information on the extent of diseased trees in proximity to our network and the cost for removal. Costs are significantly greater than routine vegetation management due to the lower structural integrity of diseased trees and the need for complete removal rather than trimming.
Estimated cost uncertainty range: £0 to +£38m (SEPD baseline £0m); £0 to +£10m (SHEPD baseline £0m)

THE FINANCIAL IMPACTS OF OUR UNCERTAINTY MECHANISM PROPOSALS
Figure 17.4 presents aggregate cost uncertainty ranges at the licence area level (SEPD and SHEPD) and at the combined SSEN level relative to our total baseline plan, noting that not all the baseline plan is subject to UMs.
The aggregate ranges include Ofgem confirmed common UMs, but do not incorporate those related to financeability e.g. indexation for the cost of capital.
Figure 17.4 shows that whilst there is potential for both downward and upward cost impacts from UMs. Our aggregate cost uncertainty ranges are tilted towards upward cost impacts, with a downward impact at -5.5% of totex and an upward impact at +22.5% of totex. Key drivers of the tilt in impacts include Strategic (load-related) Investment and Hebrides and Orkney Whole Systems, both of which have substantial uncertainty ranges linked to net zero-related demand pressures on our network.
The tilted distribution of cost impacts reflects how we have developed an efficient investment programme for RIIO-ED2, which includes costs in baseline allowances only where it is highly likely or certain that investment is needed. Our proposed UMs provide the flexibility for additional investment should this be required to meet consumers’ needs, and many of our UMs also allow for downward allowance adjustments (thereby reimbursing customers) should outturn costs end up lower than forecast. Whilst it is informative to show the combined cost impacts of our UMs, it is highly unlikely that the maximum upward cost impact will be simultaneously realised across all UMs included in Figure 17.4, and the true cost impact is likely to fall within the ranges shown.
169 | Section E: Chapter Seventeen: Uncertainty Mechanisms
UM name Description
SSEN-PROPOSED UMS CONTINUED
Opex Adjustor (See also CH16: Ensuring Deliverability and a Resilient Network)
What does the UM cover? Our UM provides the flexibility to adjust certain operating costs (opex) linked to the requirements to spend specific additional capex through UMs.
Why do we need it? Our baseline plan is based on an efficient capex to opex ratio, including efficiency improvements from RIIO-ED1 and without ‘head room’ included. Some of our additional capex UMs will require additional associated opex requirements to deliver them efficiently. This UM gives ability to provide the additional opex requirements in an efficient manner.
Why is the UM in consumers’ interests? This UM will ensure the efficient delivery of additional capex requirements which ensures consumers receive maximum value from them across our plan.
Estimated cost uncertainty range: -£9 to +£96m (SEPD baseline £502m); -£3 to +£35m (SHEPD baseline £279m)
Strategic Investment (See also CH10: Responding to the net zero challenge)
What does the UM cover? This UM covers uncertain costs associated with the scale up of load-related investment to meet increasing electricity demand and support the transition to net zero.
Why do we need it? Whilst we have a good understanding of the unit costs required for different load-related investment projects, there is uncertainty, especially in the latter half of RIIO-ED2 over which specific projects will be required, where and precisely when.
Why is the UM in consumers’ interests? We agree with Ofgem that a UM is in customers’ interests, as it will better align our load-related investment to the needs of current and future customers. Our proposals recognise the important balance between supporting future demand growth and maintaining bill affordability.
How has our proposal been shaped by stakeholders? Stakeholders have shown support for a UM and have highlighted the need for anticipatory investment. However, stakeholders have also expressed concerns that a capacity-based volume driver could lead to bill volatility and stranded assets if not designed carefully, given the significant level of investment required. In response we have employed detailed econometric modelling to design a robust and resilient UM proposals as set out in Annex 17.1.1.
Estimated cost uncertainty range: -£21m to +£182m (SEPD baseline £227m); -£9m to +£58m (SHEPD baseline £71m)
Figure 17.3: Our additional UM proposals in detail (SSEN-proposed)
Figure 17.4: Aggregate cost uncertainty ranges for SEPD, SHEPD and SSEN (£m)
ED2 – BASELINE TOTEX VS. SSEN PROPOSED UMS (£m)
0
1,000
2,000
3,000
4,000
5,000
6,000
Totex (SEPD)
Totex (SHEPD)
UMs (SEPD)
UMs (SHEPD)
UMs (SSEN)
Totex (SSEN)
Baseline UM Low UM High
3

170 | Section E: Chapter Eighteen: Competition
CHAPTER EIGHTEEN: COMPETITION
Competition is playing an increasingly valuable role within our business and across our supply chain. Throughout RIIO-ED1 we have embedded and enhanced competition within our regulated activities and have introduced new mechanisms that will further enable innovation, flexibility and cost efficiency across our business throughout RIIO-ED2.
Native competition occurs within the price control framework operating under the Totex Incentive Mechanism and is one of the strongest levers we use to drive efficiencies within our operations. Full details of how we will use native competition to drive positive outcomes are included in our Supply Chain Strategy (Annex 16.2).
SUPPORTING DOCUMENTS
Supply Chain Strategy (Annex 16.2)
DSO Strategy (Annex 11.1)
NATIVE COMPETITION AND OUR DSO ROLES AND RESPONSIBILITIES
Our strategic approach and plans for developing Distribution System Operator (DSO) capabilities are critical to supporting the transition to net zero. Unlocking flexibility opportunities across our distribution network is a key pillar in the development of our DSO capability.
As a DSO, we will optimise the use of infrastructure and services in a way that encourages competition and maintains network reliability at least cost to consumers today and tomorrow. Further information on how we intend to run competitive processes to procure flexibility is set out in detail in Distribution System Operator (Chapter 11).
To fully realise the value of our DSO capabilities we will leverage competition markets to optimise our use of infrastructure and services. The intended outcome for consumers will be increased network reliability and improved network access at a lower cost when compared to traditional infrastructure only solutions.
We intend to further develop existing and form new types of partnerships to help us deliver our DSO and Open Data commitments efficiently. Specific areas of focus include further developing our relationship with other DNOs as we utilise the Flexible Power Platform, which you can read more about in Distribution System Operator (Chapter 11).
We will continue to work with providers of Low Voltage (LV) monitoring equipment and services to accelerate the rollout of LV monitoring and maximise the value derived from the resulting data. Our existing partnerships that were established in projects LEO and TRANSITION (see Innovation (Chapter 14) will continue and be further refined to provide the blueprint for similar partnerships as the scale of our DSO activity increases.
We have already implemented measures to promote native competition, transparency and market access for flexibility providers and the Electricity System Operator (ESO). Live activity and initiatives already delivered or underway include:
LATE COMPETITION
We have assessed our full programme of RIIO-ED2 system needs, projects and investments (including anticipated new connection projects) against Ofgem’s criteria for late competition1.
This assessment has been conducted for all investments over £10m, acknowledging that the Ofgem criteria is set at £100m. This helps provide confidence that we have not missed any projects which could come close to the threshold.
Of the projects assessed none have been identified which fulfil the relevant criteria or fail in only one area but have a compelling justification in other areas. Figure 18.1 shows the late competition assessment for our highest expenditure RIIO-ED2 projects.
We have not identified any projects with a value greater than the £100m threshold for late competition. No projects with values potentially greater than £100m have been split into smaller, lower value projects.
1
2
The UK’s first implementation of Constraint Managed Zones, resulting in savings for customers and significant carbon reductions
£162m investment to improving visibility of flexibility opportunities through comprehensive IT systems and core communication networks upgrades
238MW of live contracts with savings to date of £251k in operational costs on Islay and the Western Isles
Dynamic purchasing system for procuring flexibility
1 Late competition is where bidders compete to deliver and own a specific project that has already been designed.

171 | Section E: Chapter Eighteen: Competition
EARLY COMPETITION
We have assessed our full programme of RIIO-ED2 system needs, projects and investments (including anticipated new connection projects) against Ofgem’s criteria for early competition2. Our assessment has been conducted for all investments over £10m, acknowledging that Ofgem’s criteria is set at £50m.
This helps provide confidence that we have not missed any projects which could come close to the threshold. We have placed a specific focus on assessing our subsea cable investment.
Of the projects assessed none have been identified which fulfil the relevant criteria or fail in only one area but have a compelling justification in other areas. Figure 18.1 includes the early competition assessment for our highest expenditure RIIO-ED2 projects.
We have identified one project with a value greater than the £50m threshold for early competition (Fleet- Bramley £54.24m, see Figure 18.1). However, it does not meet Ofgem’s competition criteria for contestability, separability and opportunity for bundling.
No projects with values potentially greater than £50m have been split into smaller, lower value projects. Please see specifically our commentary on the two Skye-South Uist cable projects at Figure 18.1.
3
OUTPUTS OF OUR ASSESSMENT AGAINST COMPETITION CRITERIA
We have assessed all projects over £10m against the Ofgem criteria for early and late competition models, acknowledging that the Ofgem criteria is set at £100m for late competition and £50m for early competition. The outcome of our assessment is shown in Figure 18.1.
Based on our current assessment, except for Fleet-Bramley, our proposed investment portfolio includes projects that are well below the materiality threshold and not separable from our core activities.
4
Figure 18.1: Assessment Against Competition Criteria
Notes
1. Fleet-Bramley: Whilst the project costs are above the £50m early competition threshold the project does not meet the other competition criteria. Our assessment of alternative solutions has identified a whole system transmission option that may increase network resilience but at high cost. Working closely with the ESO we will keep this whole system option under review. Further details of the project and its assessment under Ofgem’s competition criteria can be found in the Investment Decision Pack (44/SEPD/LRE/SCO).
2. Skye-South Uist cables: Following further assessment since our draft business plan the phasing of the two cables will be very different, with the South cable being delivered in year 2 of RIIO-ED2 and the North cable in year 5. We have therefore produced two Investment Decision Packs as detailed in Figure 18.1 above. Notwithstanding this, neither project meets Ofgem’s criteria for early or late competition.
IDP Ref Investment
Competition criteria
>£10m Contestable SeparableOpportunity for bundling
Candidate for Early Competition separable
Candidate for Late Competition separable
44/SEPD/LRE/SCOSCO in Fleet-Bramley ring/132kV Circuit
£54.24 No1 No1 No1 No1 No1
458/SHEPD/SUBSEA/ SKY/S_UIST (South route)
EHV Skye-South Uist: Cable 1
£31.87 No No No No2 No
328/SHEPD/SUBSEA/ SKY/S_UIST (north route)
EHV Skye-South Uist: Cable 2
£25.87 No No No No2 No
329/SHEPD/SUBSEA/PFW
EHV Pentland Firth West £26.15 No No No No No
60/SEPD/LRE/IVER
Iver 132 kV Bus-Section Circuit Breaker installation (P)/132kV Fault Level
£22.68 No No No No No
58/SEPD/LRE/ALTON Alton – Fernhurst 132 kV Network Reinforcement
£13.80 No No No No No
66/SEPD/LRE/Upton Upton BSP – ERN401 £10.45 No No No No No
2 Early competition is where a competitive tender that takes place ahead of detailed design work.

172 | Section E: Chapter Eighteen: Competition
We have outlined our assessment of our RIIO-ED2 investments against current Ofgem guidance. We have also challenged ourselves to consider if any lower value projects would fall within Ofgem’s competition criteria. We believe competition to be of most value to consumers when realised in a way that avoids unnecessary complexity and enables the timely delivery of network projects; delivery of net zero; and the protection of wider security of supply, reliability, and safety.
Any future expansion of competition models should not delay projects from maximising their benefits, and tendering should not create net costs to consumers rather than net benefits. Further, the benefits of new alternative solutions to those identified by DNOs should be reasonably developed from a capital and whole system operating cost perspective before entering a tender. We propose that any competition model is subject to the Utilities Contracts Regulations 2016 SI 274, as amended by The Public Procurement (Amendment etc.) (EU Exit) Regulations 2020 SI 1319 and The Utilities Contracts (Scotland) Regulations 2016 SSI 49, as amended by The Public Procurement etc (EU Exit) (Scotland) (Amendment)
Regulations 2020 SSI 468. This is necessary to ensure that all entities, including the Procurement Body and third-party bidders are held to the same standards/obligations and undertake a fair and transparent process in the execution of works, the supply of goods or the provision of services.
More broadly, we already derive considerable value from native competition, and we will continue to do so. During RIIO-ED2, we will continue to mature our supply chain capability and expand the opportunity for native competition across our supply chain to create benefits for customers.

173 | Section F: Chapter Nineteen: Finance and Financeability
OVERVIEW OF THIS SECTION
We are committed to achieving three strategic outcomes in RIIO-ED2 and through these make a positive impact on society. In delivering these outcomes responsibly and efficiently, we will ensure an enduring positive impact on society.
In order to achieve these goals, continued significant investment is required in the distribution systems we operate and maintain. We have considered the impact that this necessary RIIO-ED2 investment has on the revenue we need to recover from customers through network charges.
This chapter explains how we seek to efficiently finance our business and what the customer bill effect will be. We separate this into five key sections:
A summary of the total expenditure under the baseline totex set out in the previous sections. We make a comparison with equivalent expenditure during the RIIO-ED1 period and explain the main reason for changes.
An overview of the impact of total expenditure under the baseline totex and Uncertainty Mechanisms (UMs) for the average GB household bill. This is presented using Ofgem’s Working Assumptions (WAs) for financing our plan.
An explanation of the approach we take to making dividend payments to our shareholder, and the approach we take to remunerating our employees.
The financial parameters that are relevant to the efficient financing of our business plan. We highlight the differences between Ofgem’s assumptions and our evidence-based proposals and provide the detailed underlying information in our Finance and Financeability Strategy (Annex 19.1).
A summary of the financeability assessment we have undertaken to ensure our network remains financeable during the RIIO-ED2 period. In presenting this assessment, we have closely followed the Guidance set out by Ofgem.
This section of our business plan should be read in parallel with the Finance and Financeability Strategy (Annex 19.1) and the associated independent consultants’ reports.
Throughout this section, we refer to:
The Guidance being RIIO-ED2 Business Plan Guidance, Ofgem, 22 April 2021. Available at https://www.ofgem.gov.uk/publications-and-updates/riio-ed2-business-plan-guidance
The SSMD being the RIIO-ED2 Methodology Decision: Overview, Ofgem, 17 December 2020. Available at https://www.ofgem.gov.uk/publications-and-updates/riio-ed2-sector-specific-methodology-decision
The SSMD – F being the RIIO-ED2 Sector Specific Methodology Decision: Annex 3 Finance, Ofgem,. 11 March 2021. Available at https://www.ofgem.gov.uk/publications-and-updates/riio-ed2-sector-specific-methodology-decision
The Financeability Guidance sets out the requirements for undertaking a financeability assessment of our business plan RIIO-ED2. We note that this was repeated in the SSMD-F above and is broadly consistent in approach to the financeability assessment required under RIIO-GD2 and RIIO-T2.1
In accordance with our stakeholder engagement commitments, we will continue to engage with Stakeholders in relation to the financing of our plan.
1 The Financeability Guidance being Financeability Assessment for RIIO-2: Further Information, Ofgem, 26 March 2019. Available at: https://www.ofgem.gov.uk/publications/financeability-assessment-riio-2-further-information
SECTION F: CHAPTER NINETEEN FINANCE AND FINANCEABILITY
To deliver a safe, resilient and responsive network for all our customers.
To provide a valued and trusted service for our customers and communities as needs evolve.
To play our part in combating climate change and accelerate progress towards a net zero world.

174 | Section F: Chapter Nineteen: Finance and Financeability
ALLOWED REVENUE AND CUSTOMERS’ BILLS
Allowed revenue is a key aspect of a price control whereby Ofgem set the amount of money (allowed revenue) that can be earned by Distribution Network Operators (DNOs) within that period which is subsequently recovered through charges to suppliers and in turn customers. Our allowed revenue is calculated using a regulated financial framework which is common to all distribution licensees and is prepared on a “notional company basis” – that is, it assumes that we are funded in line with what Ofgem believes to be efficient.
Ofgem operates a Price Control Financial Model (PCFM) to undertake this calculation of allowed revenue. By inputting our total expenditure forecast into the model containing pre-populated financial parameters we can extract the base revenue which we are allowed to charge each year.
Our allowed revenue is made up of the following key components:
• Return on Regulated Asset Value (RAV), being the proportion of our expenditure that is capitalised (“slow money”) that is added to the RAV each year. The return is determined using the allowed Cost of Capital
• Depreciation of the RAV, spread over the lifetime of the assets
• In year expenditure (“fast money”), on which there is no return element
• Efficient expenditure on things outwith our control, such as business rates, and an allowance for tax and pensions
• Payments (positive or negative) due under regulatory performance incentive or uncertainty mechanisms
We have submitted Ofgem’s RIIO-ED2 PCFM model, which has been completed in line with their guidance. The Ofgem PCFM forms the basis of our revenue in this chapter. Although the PCFM has a proxy calculation for the impact on customer bills from our RIIO-ED2 plan, we have used a more detailed and robust methodology to convert revenue into customer bills.
Forecast allowed revenue
Figure 19.1 shows our forecast of allowed revenue for the RIIO-ED2 period for the baseline totex of allowed expenditure (including Real Price Effects (RPE) & Consumer Value Proposition (CVP) expenditure), based on Ofgem’s assumptions for financial parameters.
In Finance and Financeability Strategy (Annex 19.1), we set out the evidence for our proposed financial parameters. Using these parameters, the average annual allowed revenue is higher than under Ofgem’s working assumptions however, it shows broadly that customer bills will remain relatively flat. As we have set out in
Finance and Financeability Strategy (Annex 19.1) as well as later in this Chapter, our proposed financial parameters ensure we remain financeable and we can deliver our RIIO-ED2 business plan. The difference between our financial parameters and Ofgem’s Working Assumptions is primarily due to the Cost of Equity and definition of the notional company. We have set out in Finance and Financeability Strategy (Annex 19.1), why our Cost of Equity (CoE) proposal is necessary to maintain the long term financeability of our business within RIIO-ED2.
We have used the average allowed revenue over RIIO-ED1 as per industry standard, we show that there is still reduction in revenue from RIIO-ED1 to RIIO-ED2. Allowed revenue received in the last year of RIIO-ED1 is expected to be significantly higher than earlier years of the price control due to recovery of revenues previously under-recovered in year 20/21 resulting from the Covid-19 pandemic. The changes in revenue are primarily driven by the reduction in the cost of capital between price controls, the change in inflation from RPI to CPIH, and the extension of asset lives to 45 years (i.e. slower regulatory depreciation) for all new capital investment which increases additions to our RAV. This is set out in more detail in Figures 19.4 and 19.5 below.
Cost to customers
DNOs recover their allowed revenue from customers through distribution use of system (DUoS) charges. DNOs use the charging methodologies to calculate tariffs that end users pay towards the cost of the distribution system.
GB homes and businesses buy their electricity from the competitive retail supply market. Each supplier for whom we transport electricity through our distribution networks is liable for Distribution Use of System (DUoS) charges. DUoS charges recover the cost of installing and maintaining the local distribution systems.
DUoS charges are just one part of the overall electricity bill paid by homes and businesses. The electricity bill comprises wholesale, network, environmental, operating and other costs. In addition to DUoS, other network charges include the charge for Transmission Network Use of System (TNUoS) and the cost of the operation and balancing of the transmission system. Ofgem† estimates that the average GB household electricity bill is £575, of which 16% is due to DUoS.
The revenue that we are allowed to recover under the price control is paid by all GB electricity network customers (households, businesses and generators). Ofgem’s PCFM contains a calculation of customer bill impact which uses the last four years of RIIO-ED1 to produce a revenue to bill ratio which is then applied to RIIO-ED2 calculated revenue to determine RIIO-ED2 bills. Ofgem guidance states that DNOs are required to report figures using this methodology in the Strategic Summary however individual companies can adopt their own methodology and narrative in the business plan. We believe this approach is arbitrary, comparisons regarding the cost to customers should be made by comparing predicted RIIO-ED2 bills with average consumer bills for the entirety of RIIO-ED1. Adopting this approach, we used the following process to determine the impact on customer bills.
The RIIO-ED2 bills have been calculated using the latest Annual Review Pack (ARP) Model which is the tariff model that all DNOs use for Use of System tariff forecasting. The ARP was populated with the 2022/23 tariff workings and has been used to calculate the RIIO-ED2 Tariff for comparison purposes. Only data in the General Input sheet was adjusted from 2022/23 data for RIIO-ED2 tariff calculations. For all other sheets, for example, Customer Type, Network Level and Fixed Input, of the 2022/23 tariff data has been used to allow comparability over the RIIO-ED2 period.
Entries made to the 2022/23 ARP Tariff model are set out below for completeness:
i. CDCM Target Revenue:
a. RIIO-ED2 Revenue for each scenario.
b. Over/Under recovery – no over or under recovery assumptions have been included in RIIO-ED2.
1
† Understand your gas and electricity bills, Ofgem, 2019. Available at: www.ofgem.gov.uk/consumers/household-gas-and-electricity-guide/understand-your-gas-and-electricity-bill
Figure 19.1: Forecast Allowed Revenue (£m, 2020/21 prices)
Mar-24
100.0
0
200.0
300.0
400.0
500.0
600.0
700.0
Mar-25 Mar-26 Mar-27 Mar-28
SHEPD SEPD

175 | Section F: Chapter Nineteen: Finance and Financeability
The step changes that impact on customer bills has been broken down in Figures 19.4 and 19.5 below. This is intended to illustrate how customer bills change as a result of the change in expenditure, rates of return, and other elements between RIIO-ED1 and RIIO-ED2.
This shows that after adjusting for legacy items and incentives in RIIO-ED1, the primary drivers for reduction in customer bills includes the drop in the rate of return from RIIO-ED1 to RIIO-ED2, the change or lengthening of asset lives, other adjustments (pass-through costs and ongoing efficiency reductions). The elements driving bill increases relates the significant increase in totex expenditure and the associated increase in RAV. The impact of the marginal change in capitalisation rate is a factor of totex expenditure and therefore should be considered as part of that change in customer bills.
Figure 19.2: SEPD RIIO-ED1 average bill vs estimated RIIO-ED2 bill (£ in 2020/21 prices)
120.0
100.0
80.0
60.0
40.0
20.0
RIIO-ED1 RIIO-ED2 + OE + RPE
RIIO-ED2 + OE + RPE
+ CVP + UMsRIIO-ED2 + CVP RIIO-ED2 + UMs
98.0
-3.3
94.6 0.5 95.1 2.8 98.0
0
Figure 19.3: SHEPD RIIO-ED1 average bill vs estimated RIIO-ED2 bill (£ in 2020/21 prices)
180.0
160.0
140.0
120.0
100.0
80.0
60.0
40.0
20.0
RIIO-ED1 RIIO-ED2 + OE + RPE
RIIO-ED2 + OE + RPE
+ CVP RIIO-ED2 + CVP
+ Shetland Link*
RIIO-ED2 + Shetland Link*
+ UMs RIIO-ED2 + UMs
159.4
-9.7
150.0 1.4
-4.4
151.416.1
147.0
163.0
0
c. SHEPD only – Assistance for Areas with High Electricity Distribution Costs (Hydro Benefit) for all years in RIIO-ED2. Shetland Subsidy assumed in year 1 of ED2 only.
d. Incentives – no incentive income or penalty assumptions included in RIIO-ED2 in line with Ofgem’s Guidance.
e. Revenue raised outside of CDCM – ratio of EDCM income vs Total Revenue for Use of System Charges was calculated using the 2022/23 tariff data. This ratio was applied to calculate the ED2 inputs for this entry (in line with existing forecasting practice).
ii. Financial and general assumptions: Real post-tax cost of capital input in line with Ofgem’s Working Assumptions for RIIO-ED2.
iii. Transmission Exit Charges (TEC): The TEC are 2022/23 inputs in line with the RIIO-ED2 totex forecast updated with the revised Rate of Return and rebased to 2020/21 price base.
iv. Other expenditure:
a. CDCM Indirect and Direct inputs calculated applying existing process using RIIO-ED2 totex forecast.
b. Business Rates – 2020/21 actual rates have been used with increases assumed to continue to be inflationary in nature.
v. All other sections remain in line with the 2022/23 tariff model.
The ARP model was run for each year of RIIO-ED2 per DNO. The RIIO-ED2 average bill was calculated as an average of the five-year outputs from the ARP model for Domestic (Domestic Aggregated with Residual) tariffs. The average annual bill for SEPD and SHEPD in RIIO-ED2 is less than RIIO-ED1 by approximately 3% (Figure 19.3) and 5% (Figure 19.3) respectively on our baseline totex expenditure and includes the Outperformance Wedge adjustment of 0.25% as set out in Ofgem’s Working Assumptions. In addition, SHEPD receives a RAV transfer during RIIO-ED2 from SHE-Transmission for its contribution to the Shetland link project2. After discussions with Ofgem it has been agreed that this transfer be treated as totex for the purposes of bill calculations, the impact being a further 3% reduction in SHEPD bills versus RIIO-ED1 due to the impact on taxation allowances offsetting the increase in RAV related charges (i.e. return and asset depreciation).
Figures 19.2 and 19.3 also highlight the impact uncertainty mechanisms would have on customer bills, with SEPD bills remaining flat from RIIO-ED1 and SHEPD increasing by 2%. This illustrates the complete impact on bills during RIIO-ED2 compared to RIIO-ED1. The role of Ongoing Efficiency (OE) is that it reduces our totex expenditure on an annualised basis assuming some form of productivity and efficiency gains. This is not attributed to a specific factor and is based on an economic assumption over a period of time.
2 Shetland transmission project: Decision on Final Needs Case and Delivery Model | Ofgem, July 2020.

176 | Section F: Chapter Nineteen: Finance and Financeability
The composition of a customer bill
We summarised the components that comprise a customer’s bill from the electricity distribution element only over the RIIO-ED2 period on the baseline totex and Ofgem’s working assumptions. This is illustrated in Figure 19.6 below covering the split of operating costs, capital investment, and business rates and taxation costs, equity issuance costs, interest costs, and the remaining component that constitutes the available return to shareholders.
Figure 19.6 shows that 66% of a customer’s bill contributes to the operating and capital costs incurred by SSEN Distribution over RIIO-ED2. A further 17% relates to direct payment of business rates and corporation taxes as well as other pass-through costs i.e. costs which are directly incurred and passed to customers exactly and relate to items that are treated differently from totex expenditure.
A further 7% of a customer’s bill funds interest costs incurred by SSEN Distribution which relates to debt raised to finance the capital investment in the network covering existing and new network assets. A further 1% has constitutes costs incurred for issuing equity to shareholders or investors to support capital investment over the RIIO-ED1 period. Therefore overall, 9% of a customer’s bill is used to pay directly for costs incurred by SSEN Distribution. The remaining 9% of a customer’s bill would be available for shareholders on an average annual basis. This equates to approximately £8.51 and £13.50 of a customer’s average bill for SEPD and SHEPD respectively.
It is worth noting that a large proportion if not all of the return available to shareholders will need to be reinvested in additional capital investment over and above the contribution from customers. This is particularly the case when capital investment is a more significant than the component of revenue or customer bills that contributes to a more steady state investment period which we have seen in some previous price control periods. In turn, this informs the dividends we pay in each year. As noted in the financeability section later, on Ofgem’s working assumptions shareholders will need to invest more than they will receive in any dividend payments over the RIIO-ED2 period. This is set out in more detail later in this chapter.
Figure 19.6: Composition of Customers Bills on average over RIIO-ED2 (% allocation of revenue)
Operating costs
Capital investment costs
Business Rates and other pass-through costs
Equity Issuance costs
Interest costs
Corporation tax costs
Return available to shareholders
1%
13%
32%
34%7%
4%
9%
Figure 19.4: SEPD Domestic bill movements (£ in 2020/21 prices)
Figure 19.5: SHEPD Domestic bill movements (£ in 2020/21 prices)
120.0
200.0
100.0
180.0
160.0
80.0
140.0
120.0
60.0
100.0
80.0
40.0
60.0
40.0
20.0
20.0
RIIO-ED1 Average Bill
RIIO-ED1 Average Bill
Incentives/Legacy DPCR4 Losses
Incentives/Legacy DPCR4 Losses
Increase Totex (Fast)
Increase Totex (Fast)
Capitalisation Rate
Capitalisation Rate
Increase In RAV
Increase In RAV
Rate of Return
Rate of Return
Change in Asset Life
Change in Asset Life
Passthrough/Other
Passthrough/Other
Ongoing Efficiency
Ongoing Efficiency
RPE
RPE
RIIO-ED2 + OE + RPE
RIIO-ED2 + OE + RPE
CVP
CVP
UMs
UMsShetland Link
RIIO-ED2 + UMs
RIIO-ED2 + UMs
98.0
159.7
-4.4
-2.5
9.2
15.7
4.5
-4.1
3.5
8.6
-7.5
-12.2
-5.0
-5.5
-2.4
-7.8
-3.3
-5.2
2.1
3.3
94.6
150.0
0.5
1.4
2.8
-4.4
16.1
98.0
163.0
0
0
SE
PD
Do
me
stic
Bill
Mo
vem
en
ts £
SH
EP
D D
om
est
ic B
ill M
ove
me
nts
£

177 | Section F: Chapter Nineteen: Finance and Financeability
SHAREHOLDER RETURNS AND PAY
Our sole shareholder is the SSE plc Group, a UK-listed company based in Perth, Scotland. SSE is committed to the highest standards of corporate governance, which is the best way to ensure SSE is a consistently successful, well-run and responsible business. SSE’s approach to making dividend and remunerating its employees is described below.
RIIO-ED2 dividend policy
Our dividend policy is based on a range of factors considered by the Board of Directors including delivering our business plan, maintaining our investment grade credit rating and providing an appropriate rate of return to shareholders. Given the significant capital investment over the past decade and planned in this RIIO-ED2 business plan, our dividend policy has to have the capability to flex with these requirements such that shareholders will see cash dividends over the period in line with their required rate of return. The effect of this is that some years, we many pay relatively low or zero dividends, and in other years we might pay higher dividends in line with standard treasury and cash flow management practices. Each year we will consider our commitments to deliver our business plan while ensuring we comply with our licence requirements to maintain an investment grade credit rating and for Availability of Resources. Under our dividend policy, we consider the following factors on an annual basis prior to declaring a dividend:
• Availability of Resources for operating in the coming 12 months
• Company Viability over the forthcoming three years in line with the UK Corporate Governance Code
• Maintaining investment grade credit rating including raising external borrowings at an appropriate credit rating
• Planned and committed capital investment
• Financial performance and the required return by shareholders
• The impact on customers of a dividend being paid including attracting and retaining investment to deliver our business plan
The dividend policy for the RIIO-ED2 period does not deviate significantly from our historic approach.
Historical returns
Our Return on Regulatory Equity (RoRE) for the RIIO-ED1 period is forecast at 6.4%3 presented in our 2021 RFPR submission. This includes forecast performance in 2021/22 and 2022/23, and regulatory mechanisms subject to adjustment at the end of the price control period. This is 0.4% above the Cost of Equity set for RIIO-ED1 on an RPI stripped basis. The Return on Capital Employed (ROCE) is 3.5%4. This is the equivalent to the amount charged for use of the electricity distribution network as it is based on the value of the RAV.
RIIO-ED2 equity issuance policy
Our equity issuance policy is to only consider equity investment under certain circumstances where alternative means of funding are considered inappropriate. This includes options to manage annual cash flows, adjust actual borrowings (including short-and long-term debt) and restricting dividends where appropriate.
Our licence requires us to annually inform our Ultimate Controller (SSE plc) of its obligations to the company. Under this obligation, if equity investment is required then we would request this from our Ultimate Controller including the cost of raising equity for investment.
The regulatory cost allowance for issuing equity in RIIO-ED1 is 5% and Ofgem propose to retain that value in RIIO-ED2 as they have done for RIIO-GD2 and T2. We do not propose any alternative values but will continue to review market evidence up to RIIO-ED2 Final Determinations in late 2022. We noted that Ofgem’s PCFM
has applied a gearing threshold of 5% prior to triggering the equity issuance requirement i.e. gearing has to increase to 65% which is materially above the 60% notional gearing. We note this was not applied in GD2 and T2 and see no rationale of why it has been retained for RIIO-ED2. We have also assessed the financeability impact of this gearing threshold in this chapter and in Finance and Financeability Strategy (Annex 19.1).
Pay and Performance
The SSE plc Group’s Remuneration Committee is responsible for setting pay for members of the Group Executive Committee (GEC) and reviewing the remuneration arrangements for all employees across the Group. The GEC includes the Managing Director of Networks and the Managing Director of Transmission.
The details of how the Remuneration Committee operates is disclosed in the Directors’ Remuneration Report in the SSE plc Group Accounts5.
The Remuneration Committee has responsibility for overseeing pay in both Southern Electric Power Distribution and Scottish Hydro Electric Power Distribution. Pay and remuneration is based on the following elements:
• The senior management population participate in annual and long-term incentive arrangements. In line with Executive Directors’ arrangements, incentives for senior management have an emphasis on share awards
• All employees have the opportunity to be share owners through the Share Incentive Plan and the Sharesave Plan and those participating are able to express their views in the same way as other shareholders
• Pension planning is an important part of SSE’s reward strategy for all employees because it is consistent with the long-term goals and horizons of the business, an approach it has been practising for a number of years. The terms of the funded final salary pension schemes apply equally to all members
• As part of its Employee Engagement Survey (“Great Place to Work”) SSE invites all employees to provide a view on the benefits and pay that it provides
The Remuneration Committee keeps these arrangements under constant review. In March 2019, SSE’s Remuneration Committee took the decision that from 2019/20 onwards, 20% of the total Annual Incentive Plan (AIP) for Executive Directors would be determined by the progress made in meeting SSE’s four 2030 Business Goals which are focused on addressing the challenge of climate change. For SSE Distribution, there is close alignment with the long-term goals of SSE: supporting renewable output, accommodating electric vehicles and championing fair tax and the real Living Wage. Individual performance in Distribution is measured against these goals along with other factors such as health and safety, licence compliance, business plan outputs and stakeholder engagement.
The Remuneration Committee appreciates the importance of an appropriate relationship between the remuneration levels of the Executive Directors, senior executives, managers and other employees within SSE, although comparison metrics are not used to determine pay policy. Remuneration at all levels is designed to be consistent with the Group’s core remuneration principles, long-term business strategy and, for Distribution, the goals set out in our business plan. This is summarised in Figure 19.7 below.
2
3 This is based on an RPI real estimate and compares to a cost of equity of 6% for the RIIO-ED1 period.4 ROCE is a more appropriate measure of financial returns as it incorporates the amount paid for borrowing costs.5 https://www.sse.com/media/rwhbww02/sse-annual-report-2021.pdf
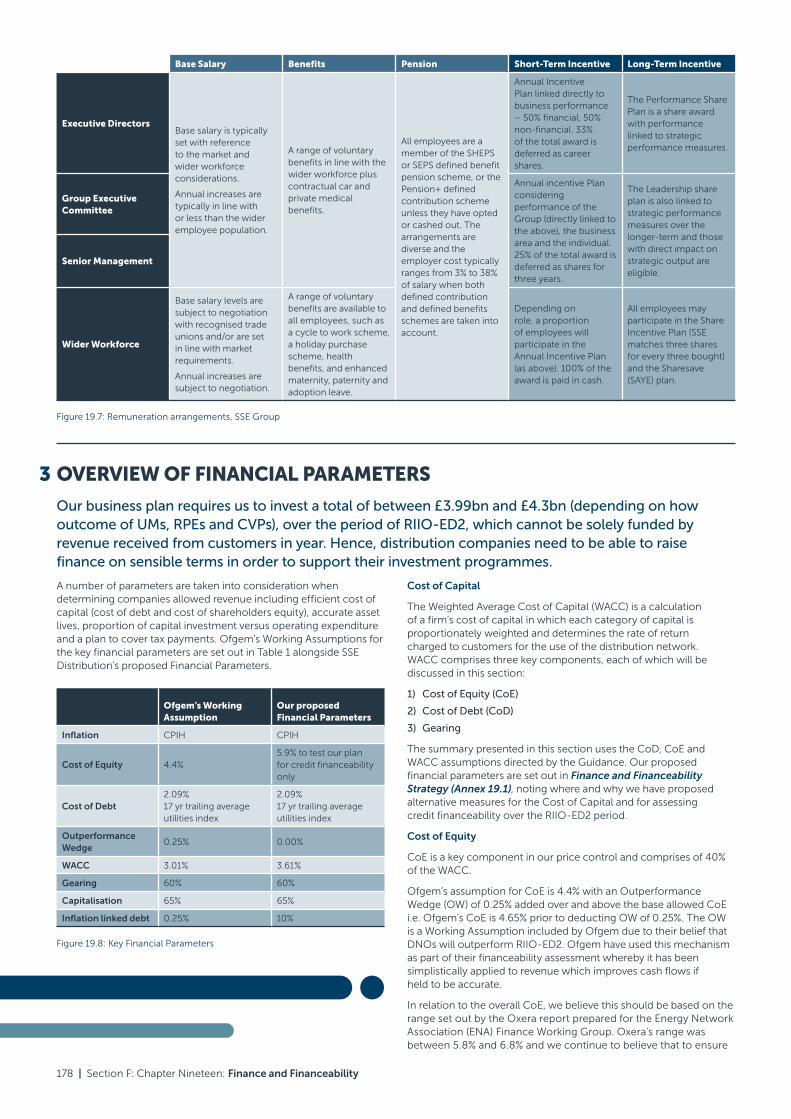
178 | Section F: Chapter Nineteen: Finance and Financeability
Base Salary Benefits Pension Short-Term Incentive Long-Term Incentive
Executive DirectorsBase salary is typically set with reference to the market and wider workforce considerations.
Annual increases are typically in line with or less than the wider employee population.
A range of voluntary benefits in line with the wider workforce plus contractual car and private medical benefits.
All employees are a member of the SHEPS or SEPS defined benefit pension scheme, or the Pension+ defined contribution scheme unless they have opted or cashed out. The arrangements are diverse and the employer cost typically ranges from 3% to 38% of salary when both defined contribution and defined benefits schemes are taken into account.
Annual Incentive Plan linked directly to business performance – 50% financial, 50% non-financial. 33% of the total award is deferred as career shares.
The Performance Share Plan is a share award with performance linked to strategic performance measures.
Group Executive Committee
Annual incentive Plan considering performance of the Group (directly linked to the above), the business area and the individual. 25% of the total award is deferred as shares for three years.
The Leadership share plan is also linked to strategic performance measures over the longer-term and those with direct impact on strategic output are eligible.
Senior Management
Wider Workforce
Base salary levels are subject to negotiation with recognised trade unions and/or are set in line with market requirements.
Annual increases are subject to negotiation.
A range of voluntary benefits are available to all employees, such as a cycle to work scheme, a holiday purchase scheme, health benefits, and enhanced maternity, paternity and adoption leave.
Depending on role, a proportion of employees will participate in the Annual Incentive Plan (as above). 100% of the award is paid in cash.
All employees may participate in the Share Incentive Plan (SSE matches three shares for every three bought) and the Sharesave (SAYE) plan.
Figure 19.7: Remuneration arrangements, SSE Group
OVERVIEW OF FINANCIAL PARAMETERS
Our business plan requires us to invest a total of between £3.99bn and £4.3bn (depending on how outcome of UMs, RPEs and CVPs), over the period of RIIO-ED2, which cannot be solely funded by revenue received from customers in year. Hence, distribution companies need to be able to raise finance on sensible terms in order to support their investment programmes.
A number of parameters are taken into consideration when determining companies allowed revenue including efficient cost of capital (cost of debt and cost of shareholders equity), accurate asset lives, proportion of capital investment versus operating expenditure and a plan to cover tax payments. Ofgem’s Working Assumptions for the key financial parameters are set out in Table 1 alongside SSE Distribution’s proposed Financial Parameters.
Cost of Capital
The Weighted Average Cost of Capital (WACC) is a calculation of a firm’s cost of capital in which each category of capital is proportionately weighted and determines the rate of return charged to customers for the use of the distribution network. WACC comprises three key components, each of which will be discussed in this section:
1) Cost of Equity (CoE)
2) Cost of Debt (CoD)
3) Gearing
The summary presented in this section uses the CoD, CoE and WACC assumptions directed by the Guidance. Our proposed financial parameters are set out in Finance and Financeability Strategy (Annex 19.1), noting where and why we have proposed alternative measures for the Cost of Capital and for assessing credit financeability over the RIIO-ED2 period.
Cost of Equity
CoE is a key component in our price control and comprises of 40% of the WACC.
Ofgem’s assumption for CoE is 4.4% with an Outperformance Wedge (OW) of 0.25% added over and above the base allowed CoE i.e. Ofgem’s CoE is 4.65% prior to deducting OW of 0.25%. The OW is a Working Assumption included by Ofgem due to their belief that DNOs will outperform RIIO-ED2. Ofgem have used this mechanism as part of their financeability assessment whereby it has been simplistically applied to revenue which improves cash flows if held to be accurate.
In relation to the overall CoE, we believe this should be based on the range set out by the Oxera report prepared for the Energy Network Association (ENA) Finance Working Group. Oxera’s range was between 5.8% and 6.8% and we continue to believe that to ensure
3
Figure 19.8: Key Financial Parameters
Ofgem’s Working Assumption
Our proposed Financial Parameters
Inflation CPIH CPIH
Cost of Equity 4.4%5.9% to test our plan for credit financeability only
Cost of Debt2.09% 17 yr trailing average utilities index
2.09% 17 yr trailing average utilities index
Outperformance Wedge
0.25% 0.00%
WACC 3.01% 3.61%
Gearing 60% 60%
Capitalisation 65% 65%
Inflation linked debt 0.25% 10%

179 | Section F: Chapter Nineteen: Finance and Financeability
investment is made to the benefit of consumers, Ofgem should aim up in that range6. It is well supported by substantial academic evidence and several previous regulatory decisions including that of the Competition and Markets Authority (CMA) on PR19 appeals. Setting a higher CoE avoids the adverse consequences and material consumer harm caused by under investment in the RIIO-ED2 period. Given the priority for delivering net zero to 2050 (and 2045 in Scotland), we believe it would be erroneous not to aim up in RIIO-ED2 given the material harm it will cause consumers.
Ofgem’s range and point estimate for the CoE has been set too low whereby Ofgem use the OW and an incorrect definition for the notional company to incorrectly overstate key credit metrics to for strong investment grade credit rating. We have therefore tested for financeability after adjusting for Ofgem’s errors by excluding the OW of 0.25% and changing the assumption for Index Linked Debt (ILDs) to 10% of the debt held by the notional company, in line with the industry average and median, rather than 25%. We find that after removing the OW and adjusting for the ILDs proportion, key credit ratios fall significantly below the threshold for strong investment grade credit rating. Credit financeability is only alleviated when the CoE is set at 5.9%. Therefore, the CoE of 5.9% is the absolute minimum for credit financeability at the target strong investment grade. This is set out in more detail in the financeability section of this chapter.
Outperformance Wedge
We disagree with Ofgem’s proposed OW mechanism and Ofgem’s inclusion of the OW is inconsistent with the CMA decision on RIIO-T2 and GD27. The CMA refer concluded the following in relation to the OW:
“Our view is that GEMA has not demonstrated sufficiently why the extensive set of tools it used for RIIO-2 should be regarded as providing insufficient protection for customers. Based on the evidence provided to us, we have found that:
a) There were a number of errors in GEMA’s analysis of the extent to which operational outperformance in RIIO-2 should be viewed as probable;
b) Even if GEMA’s concerns about the likelihood of operational outperformance had been substantiated, the outperformance wedge would be a poorly designed mechanism to address these concerns; and
c) Given the problems identified in (a) and (b), there was a realistic possibility that the outperformance wedge, if introduced, might also undermine broader regulatory certainty which could result in increased costs to consumers over time.
We have therefore determined that GEMA was wrong and have upheld this ground of appeal. We have ordered that the decision to introduce the outperformance wedge should be quashed and substituted with our decision to remove the outperformance wedge and associated backstop.
The CMA’s conclusion on why the OW mechanism is “poorly designed” also reflects the fact it is unnecessary as there are sufficient regulatory tools, many of which are being deployed in RIIO-ED2, which address Outperformance at source rather than as an arbitrary adjustment. As confirmed by the CMA decision, the arbitrary nature of the OW risks undermining broader regulatory certainty which would result in increased costs to consumers over time. Ofgem should focus on these regulatory tools and remove the OW which will stifle efficiency and innovation which will lead to higher costs for consumers. Outperformance within a price control is something that should be encouraged and incentivised rather than incorrectly characterised as damaging for consumers. Ofgem failed to set out sufficient or robust evidence during the RIIO-ED2 price controls or during the CMA appeal as to why outperformance cannot be controlled at source, why incentives and outperformance
is damaging to consumers and that the OW mechanism was an appropriately targeted mechanism superior to existing regulatory tools. We have set out further detail of our view of the OW in our Finance Annex (Annex 19.1).
Cost of Debt
The remaining 60% of the WACC relates to CoD and is based on appropriate market rate for borrowing capital to invest in the electricity network.
Ofgem’s Working Assumption for the CoD is a 17-year trailing average utilities index. We have undertaken an assessment of Ofgem’s proposals with Oxera8. In our assessment the calibration of the CoD mechanism has the potential to underfund efficient financing costs if interest rates rise. This is particularly worse when considering the Additional Costs of Borrowing which Ofgem has understated based on evidence. We reviewed the Additional Borrowing Costs as part of the Energy Network Association (ENA) Finance Working Group. The additional costs of borrowing as set out by NERA9 and in Finance and Financeability Strategy (Annex 19.1), shows that there are material costs well in excess of Ofgem’s proposed 25bps in the SSMD-F. NERA identified that the costs of borrowing ranged between 38-48bps excluding a small company premium. We also note that Ofgem allowed a small company premium in Final Determinations for RIIO-ED2, and we believe that also holds true for SHEPD which is of a similar size and an infrequent issuer of debt. This is estimated at between 9bps and 17.5bps and should be added to the company debt allowance in RIIO-ED2.
Ofgem have elected to use a much lower Cost of Borrowing assumption in RIIO-ED2 than identified by NERA for the ENA. We believe based on evidence that Ofgem’s assumption on the additional cost of borrowing is too low and therefore there is a greater probability of underfunding efficient financing costs using Ofgem’s trailing average proposal for RIIO-ED2. We therefore recommend that this is increased to ensure underfunding of debt costs is not a material risk during RIIO-ED2 particularly during a period where investment has increased significantly.
As a result, Ofgem’s proposal is the lowest possible calibration for debt financing including additional borrowing costs. We will continue to monitor capital markets in advance of our final business plan submission and re-evaluate the cost of debt calibration. At this stage, for simplicity, we have used Ofgem’s assumption on the CoD mechanism in our main business plan. We have set out in more detail in Finance and Financeability Strategy (Annex 19.1), why we believe there is a material risk of underfunding efficient financing costs over RIIO-ED2 based on market evidence.
Gearing
Ofgem’s proposed parameters result in a 5% reduction in notional gearing versus RIIO-ED1 from 65% to 60% (i.e. reduce the balance of debt to equity in the notional company). In line with Guidance this de-gearing must be achieved by then end of the first year in RIIO-ED2 and results to equity issues costs being incurred. We have evaluated our credit financeability in a later section of our business plan with supporting evidence by Oxera10. It is worth emphasising that in our assessment, the reducing in gearing improves credit metrics compared to if 65% is used as in RIIO-ED1.
We also note that the industry average gearing over RIIO-ED1 and most recently based on company Regulatory Financial Reporting Packs (RFPRs) is around 65% overall11. We believe this change in regulatory gearing is a means to improve short term credit metrics in RIIO-ED2 to support a CoE that has been set too low. We also note that Oxera identified that the industry average Index Linked Debt (ILD) is materially lower than the 25% assumption stated by Ofgem in their definition of the notional company. When excluding material outliers that sit outside the Electricity Distribution sector, the average ILD is 10% which reduces credit ratios as noted in the Financeability section of our business plan.
6 Oxera, RIIO-2, Cost of Equity prepared for the ENA, Jun 2021.7 Para 28 and 29, CMA Summary of Final Decision, RIIO-2 Energy Licence Modification Appeals, 28 October 2021 Summary of final determination (publishing.service.gov.uk).8 Oxera, RIIO-ED2 Cost of Debt and Financeability, Nov 2021.9 NERA, Additional Costs of Borrowing and Small Company Premium at RIIO-ED2, 15 June 2021.10 Oxera, RIIO-ED2 Cost of Debt and Financeability, Nov 2021.11 DNOs RFPR packs published across their websites as of 31 July 2021 for the year ended 31 March 2021.

180 | Section F: Chapter Nineteen: Finance and Financeability
We also set out in Finance and Financeability Strategy (Annex 19.1), that when correcting for Ofgem’s definition of the notional company (in particular the assumption for ILDs and the OW) that credit ratios come under significant pressure and are significantly below the target credit rating of BBB+ or Baa1. When correcting for the CoE this credit pressure is removed and ratios are more in line with the target credit rating as well as the robust market evidence underpinning the CoE.
Asset lives
The electricity distribution network has been established using robust, long-lasting infrastructure capable of operating efficiently for a significant period. In order to ensure current customers are not disproportionately charged for goods/services received by future customers it is important that the costs of building, operating and maintaining the network be spread fairly across the asset’s useful life. As part of the RIIO-ED1 price control settlement, Ofgem determined that asset lives should transition to 45 years from 20 years. This was in order that regulatory asset lives better reflected the estimated useful economic lives of network assets.
We have tested, with reference to managing financial risk and our financeability assessment, a range of assumptions for asset lives in RIIO-ED2 (Figure 19.9). In doing so we have considered the impact on cashflow in the short and long term and considered the inter-generational impact of changing asset lives. Our analysis demonstrates that consumers between generations will be adversely impacted by significant changes in asset lives. We believe that the most appropriate asset life profile is 45 years which spreads the cost of investment over the anticipated period assets will last while keeping charges lower when compared to other options available. After consulting with stakeholders, we received no compelling evidence that would indicate an alternative proposal would be better for consumers over the long term. Any shift in asset lives would shift charges between generations of consumer and we have elected not to change the asset lives assumptions for RIIO-ED2 at this stage. For example, an acceleration of asset lives would increase charges in RIIO-ED2 and RIIO-ED3 but reduce charges over future generations of consumers. It may be worth reconsidering the asset lives position for RIIO-ED2 prior to Final Determination and at the RIIO-ED3 price control depending on what analysis and evidence is developed on the balance and fairness of charges across generations of consumers.
Given the assets will be spread evenly over 45 years, any changes would need to be significant to shift the gradient of the curve over the period. There is a risk that this would inadvertently increase charges for the transition to net zero at a time where other costs to consumers such as transport costs are still predominantly carbon-based.
Capitalisation rates
Capitalisation rates are the proportion of the total expenditure that is for capital investment. Ofgem proposes that the capitalisation rate be the natural rate for the price control based on statutory accounting treatment and any other measures such as tax treatment. During RIIO-ED1 the capitalisation rate was 70% for SSEN Distribution when excluding the Shetland Uncertain Energy Costs. Shetland Uncertain
Energy Costs are designated primarily as operating cost meaning the natural capitalisation rate was much lower for SHEPD only i.e. around 62% rather than 70%.
Figure 19.10 sets our analysis of capitalisation rates based on the natural rate as defined by accounting and tax treatment of Baseline Totex expenditure. In our evaluation of our Baseline Totex we have identified that the average capitalisation rate over the period is more in line with 65% rather than 70% or 62% for SEPD and SHEPD respectively from RIIO-ED1. During RIIO-ED1 the actual capitalisation rate was more aligned with 65% due to higher operating costs than expected in SEPD and larger capital investment in SHEPD (primarily driven by submarine cables investment over the RIIO-ED2 period). We have proposed a separate capitalisation rate for the transfer of the Shetland Link contribution to support the transition of the asset at that time while supporting in-year cash flow requirements i.e. financeability needs.
Treatment of tax
As SSEN Transmission set out in their business plan for RIIO-T2, and the fact we continue to be part of the SSE Group, we continue to believe that fair tax is the right thing for consumers and society. As a result, we believe that licensees should be fully funded for their actual tax costs and that consumers only pay for those actual tax costs rather than a notional tax calculation. We also believe that, as regulated networks, adopting some form of accreditation for transparency on tax would be a positive step for consumers. Thus, taxation should be treated as a pass-through cost if licensees can demonstrate compliance (or a demonstrable equivalent level of compliance) with a tax accreditation standard. We are accredited under the Fair Tax Mark. It is also worth emphasising that the recent introduction of the super tax deduction for capital investment in the HMT Budget in March 2021 has caused material regulatory burden as the industry has sought to handle changes to notional tax calculations. This would not be necessary if tax was designated as pass-through and similar to Business Rates, companies acted similar to responsible unregulated sectors in calculating these taxes.
We note that Ofgem has continued to refuse any form of accreditation and instead has adopted a more detailed approach to tax reporting. This also includes introducing a mechanism which allows Ofgem or Licensees to re-open taxation allowances if there is a material divergence between notional allowances and actual costs. We believe this is a complicated mechanism and unnecessary regulatory burden on companies and Ofgem. However, we believe if applied correctly alongside the flexibility to adjust tax pool allowances on an annual basis in line with what is allowed in RIIO-T2 and GD2 will ensure what consumers and companies pay are consistently close.
12 Includes Shetland Project.
1,200.0
600.0
800.0
1,000.0
1,400.0
1,600.0
1,800.0
2014 2032 2040 2048 2056 2064
45 years 32.5 years for RIIO-ED2 only
25 years for RIIO-ED2 only
Figure 19.9: Revenue profiles for different asset lives assumptions
Figure 19.10: Analysis of Capitalisation Rates
RIIO-ED1 RIIO-ED2
Price Control Capitalisation
RateActual
Capitalisation
Price Control Capitalisation
Rate
SHEPD 62%12 65% 65%
SEPD 70% 66% 65%

181 | Section F: Chapter Nineteen: Finance and Financeability
FINANCEABILITY ASSESSMENT AND MANAGING FINANCIAL RISK
Price Control Financial Model
Ofgem issued a final revised Price Control Financial Model (PCFM) on the 5th of November 2021.
The Guidance requires us to obtain Board assurance on financeability matters, and there is a requirement to comply with established regulatory best practice in doing so. The Assurance Annex sets out the governance and assurance that has been applied to this business plan.
We have relied upon our internal financial model as well as Ofgem’s PCFM to undertake our financeability assessment, and obtain independent assurance. From this, we are confident that our business plan complies with Ofgem’s Guidance and our licence obligations.
Target credit rating
Network operators are required under licence to maintain an investment grade credit rating as part of demonstrating they are financeable. Ofgem’s target investment grade credit rating (as set out in the SSMD-F) is Baa1 or BBB+. This rating is consistent with our current and target investment grade credit rating for both the RIIO-ED1 and RIIO-ED2 periods. Figure 19.11 below summarises the key credit ratios which each credit rating agency consider for the target investment grade noting the thresholds required to be exceeded in order to achieve the designated rating.
To ensure our business plan is financeable, we have undertaken an assessment of our credit rating ratios in line with the expectations of the Credit Rating Agencies. We have commissioned Oxera to independently evaluate our business plan for financeability, as well as consider Ofgem’s approach to financeability.
This evaluation allows us to test both our proposed financial parameters (as set out in Finance and Financeability Strategy (Annex 19.1)), but primarily Ofgem’s Working Assumptions. This analysis has supported our assurance process. It has also allowed us to evaluate what adjustments would be required to ensure we maintain the target credit rating between 1 April 2023 and 31 March 2028 as stipulated by Ofgem.
Ofgem require us to state that our business plan is financeable on their Working Assumptions and as we have set out in this section and in Finance and Financeability Strategy (Annex 19.1), our business plan is technically credit financeable on Ofgem’s Working Assumptions. However, as we have stated clearly, when correcting for Ofgem errors in defining the notional company, Ofgem’s Working Assumptions are inappropriate to maintain the appropriate level of credit financeability. Our Finance and Financeability Strategy (Annex 19.1) sets out why we disagree with this approach and why we believe our proposed financial parameters are more appropriate than any short-term measures.
4
FINANCEABILITY ASSESSMENT AND MANAGING FINANCIAL RISK
The following pages are a summary of our financeability assessment of this RIIO-ED2 business plan based on Ofgem’s assumptions and the Guidance. We set out the analysis required by the SSMD-F and also the criteria set out in the Financeability Guidance. In doing so, we are confident that we have adhered, in full, to the regulatory requirements for this business plan. The contents of this section are:
• Price Control Financial Model
• Target credit rating
• Notional and actual company financeability
• Financeability assessment of totex expenditure scenarios
• Managing financial risk and mitigating actions
• Board and independent assurance
These pages should be read with Finance and Financeability Strategy (Annex 19.1).
Figure 19.11: Credit rating agency thresholds, source: Oxera
Ratio13 Fitch14 Moody’s Standard & Poor’s15
Debt metrics A BBB A Baa A BBB
Net debt/RAV (%) 60 70 45–60 60–75 <70 >70
FFO interest cover, including accretion (i.e. total interest expense) (x)*
4.5 3.5 4–5.5 2.8–4
FFO interest cover, excluding accretion16 (i.e. cash interest) (x)*
>3.5 2.5–3.5
AICR (x)* 1.75 1.5 1.6–1.84 1.2–1.417
Nominal PMICR (x)*18
FFO (cash interest)/net debt (%)*
18–26 11–18 >12 8-12
RCF/net debt (%) 14– 21 7–14
13 Note: * Ofgem’s key credit metrics as per the Finance Annex of the SSMD. The ratios are calculated using credit rating agency formulas. 14 Fitch also considers other financial ratios, including lease-adjusted FFO/debt and lease-adjusted FFO/net debt. These measures have not been explicitly highlighted by Ofgem as measures of interest when assessing financeability. 15 Unlike Moody’s and Fitch, S&P does not provide indicative ranges. The ranges interact with additional considerations such as the business risk profile and industry risk. See Standard & Poor’s (2013), ‘Criteria | Corporates | General: Corporate Methodology’, tables 3, 17–19. We have reported the indicative ranges provided by Ofgem during the RIIO-1 period. See Ofgem (2011), ‘Decision on strategy for the next transmission and gas distribution price controls – RIIO-T1 and GD1 Financial issues’, 31 March, p. 40. 16 Moody’s subtracts inflation accretion from FFO and the interest expense to the extent that it is included. Ofgem’s approach, which is the same used by S&P, includes inflation accretion in the denominator of the FFO interest cover ratio. 17 Moody’s guidance minimum rating for a Baa2 rating (1.2), Baa1 rating (1.4), A3 rating (1.6), and A2 rating (1.8) from 29 May 2019 commentary. Moody’s does not provide a guidance figure for a Baa3 rating. 18 Nominal PMICR is a metric estimated by Ofgem and is not used by the credit rating agencies.
Source: Fitch (2018), ‘Corporate rating criteria Sector Navigators’, p. 165; Moody’s (2017), ‘Rating Methodology Regulated Electric and Gas Networks, 16 March, p. 19; Moody’s (2018), ‘Regulated electric and gas networks – UK. Risks are rising, but regulatory fundamentals still intact’, 29 May, p. 4; Ofgem (2011), ‘Decision on strategy for the next transmission and gas distribution price controls – RIIO-T1 and GD1 Financial issues’, 31 March, p. 40.

182 | Section F: Chapter Nineteen: Finance and Financeability
Notional and Actual company financeability
The Financeability metrics for the notional and actual company for SEPD and SHEPD is set out in Tables 4 to 11 in the Finance and Financeability Strategy (Annex 19.1), and is based on using Ofgem’s Working Assumptions for the baseline totex and for our Uncertainty Mechanism scenarios. The tables include the financial scenarios stipulated in the SSMD-F as well as an additional scenario for 10% ILDs. Although there are several credit and equity ratios, we have focused on the key elements we consider paramount to maintaining a strong investment grade in line with the target credit rating. Additionally, we have also considered the impact of the key equity ratios including the value of equity issuance required to sustain these credit and equity ratios.
The key credit ratios we consider of most relevant based on credit rating agency methodologies is the Adjusted Interest Cover Ratio or AICR and the Funds from Operations (FFO) to Net Debt. The AICR calculates how much cash resources are available to pay cash interest costs after investing in maintenance-related capital investment. In this case the maintenance-related capital investment is assumed to be equal to the RAV depreciation in a given year.
It is typically viewed that an AICR above 1.4x is the minimum level to obtain a credit rating of BBB+ or Baa1. However, as noted by Ofgem in their Final Determination on RIIO-T2 and GD2, they have an outcome in excess of least 1.5x19 which is a more appropriate level as it provides protection during periods of large capital investment.
This is balanced against other credit metrics, and an assessment of risks including any downside risks which could materially reduce credit ratios below an acceptable threshold. When reviewing the base case using Ofgem’s Cost of Equity of 4.4% plus 0.25% outperformance adjustment, the AICR is below the absolute minimum threshold of 1.4x as defined by credit rating agencies for both SHEPD and SEPD as set out in Figures 19.12 and 19.13 below. As we have stated in this chapter, the assumptions for the notional company are incorrect as they rely on including the OW which is a “poorly designed mechanism” as noted by the CMA, and the incorrect inclusion of ILDs as 25% of DNOs’ debt book. When correcting for both of these errors in the notional company definition, the AICR ratio for SEPD and SHEPD deteriorates significantly down to around 1.2x as illustrated in Figures 19.12 and 19.13 below.
19 Ofgem Final Determinations for RIIO-T2 and GD2, Finance Annex, Tables 14 and 34. 20 CMA decision on PR19.
Figure 19.12: SEPD AICR analysis, source: Oxera
1.60
1.40
1.20
1.00
0.80
0.60
0.40
0.20
Notional Company + 25bps
25bps outperformance
Notional Company + ILD 10% 5.9% CoENotional Company at 10% ILD
Final AICR
1.33
-0.03
1.30
-0.10
1.20
0.23 1.43
0
Figure 19.13: SHEPD AICR analysis, source: Oxera
1.60
1.40
1.20
1.00
0.80
0.60
0.40
0.20
Notional Company + 25bps
25bps outperformance
Notional Company + ILD 10% 5.9% CoENotional Company at 10% ILD
Final AICR
1.33
-0.04
1.29
-0.10
1.19
0.25 1.44
0
SEPD and SHEPD do not have 25% of index linked Debt (ILDs) and in fact only have around 10% on average over the period due to RPI linked bonds issued several years prior to the price control. When considering this or indeed a lower proportion of ILDs the ratio falls significantly below 1.4x. Additionally, once the outperformance wedge is removed from the cash income, this falls further and leaves both SHEPD and SEPD well below the target credit rating. When considering the other scenarios Ofgem sets out, without knowing the extent of asymmetry in incentive rates or cost allowances for RIIO-ED2, the ratios move in line with expectations. For example, a degree of outperformance or underperformance either strengthens or weakens credit ratios. We however note that it is
regulatory precedents20 have not undertaken credit financeability assuming out or underperformance within the price control.
As shown in the graphs, when setting a CoE at 5.9%, which is the bottom of the Oxera range based on robust market evidence, the AICR goes above 1.4x which is more appropriate. However, this is only for credit financeability and still falls below the 1.5x rate Ofgem used for RIIO-T2 and GD2 Final Determinations. Additionally, the CoE should be set above the mid-point of a range to protect consumer welfare by retaining and attracting equity investment into the sector during a period of significant investment. The CMA acknowledges this in their determination on PR19, where aiming up is seen as appropriate for the water sector which has a significantly

183 | Section F: Chapter Nineteen: Finance and Financeability
lower investment requirement in absolute or relative terms to electricity networks. Although the CMA decided not to determine whether Ofgem should have aimed up for the RIIO-ED2 appeals, we believe there is a strong case and evidence-base that requires this to be reconsidered by Ofgem. The absence of the decision on the RIIO-ED2 appeals by the CMA, does not change the most recent CMA precedent that decided rightly, in favour of protecting consumers, by aiming up on the CoE. None of the evidence presented by Ofgem during the appeal, changes the evidence-base that aiming up is in the best interest of consumers. Given the material societal and welfare cost of delayed or cancelled investment, particularly given the climate change imperative, cannot and should not be ignored by Ofgem.
Equity Issued and Dividends
Ofgem have set the Dividend Yield assumption of 3% in cash terms over RIIO-ED2. They have also de-geared the notional company by 5% from 65% to 60% to support financeability metrics. As a result, to sustain a dividend yield of 3% plus gearing of around 60%, a significant amount of equity will need to be secured from investors over the RIIO-ED2 period. Under Ofgem’s Working Assumptions, SHEPD and SEPD would need to raise £291m and £338m (nominal prices) over RIIO-ED2. This results in a net negative cash yield to investors of (4.3%) and (1.8%) for SHEPD and SEPD respectively.
This illustrates that under different scenarios investors would receive materially less in cash terms than dividend yield assumed by Ofgem. This material error in the price control is thereby creating negative pressure on retaining the required investment grade credit rating while also deterring equity investors. We do not believe it is conducive to an attractive environment for investors during a period in which failure to deliver net zero will cause significant consumer detriment.
Additionally, Oxera have undertaken analysis of credit and equity ratios based on the same scenarios stipulated by Ofgem. They also conclude that when adjusting for the incorrect definitions for the notional company, the key credit ratios weaken significantly below the target ratio. They also note that the average gearing of the sector is higher than 60% and when gearing is reset back to 65%, credit ratios fall further across SEPD and SHEPD. We believe that this demonstrates that Ofgem has incorrectly set the Cost of Equity and utilised an inaccurate definition of the notional company to inflate credit metrics artificially. We do not believe there are any short-term actions that will support financeability other than increasing the Cost of Equity. We note in Finance and Financeability Strategy (Annex 19.1) and also in this chapter, that customer bills are still relatively flat even if the CoE was increased to 5.9% despite the significant capital investment over the RIIO-ED2 period. Therefore, a change in the CoE can maintain financeability while securing the necessary investment to ensure we deliver our business plan capital investment without increasing costs to consumers from RIIO-ED1 into RIIO-ED2.
Financeability of Uncertainty Mechanism scenarios
When we factor in expenditure on Uncertainty Mechanisms over SHEPD and SEPD over the RIIO-ED2 period, we note that credit ratios do not improve. When evaluating this expenditure against the different Ofgem scenarios, it creates larger variations in the key credit ratios. The material risk is if these UMs were to be realised during the RIIO-ED2 period and Ofgem disallowed the mechanisms altogether or provided a different cost allowance to the expenditure level (i.e. lower than proposed cost allowances). In that event, the credit ratios of over and underspend capture the impact albeit this is constrained to 10% when the UM forecast indicates expenditure of 20% above the baseline totex.
Managing Financial Risk and mitigating actions
Ofgem has proposed short term measures to address financeability problems during the RIIO-ED2 period, as its concern is only financeability within the price control period (see paragraph 4.27 of SSMD-F). The measures proposed by Ofgem in the SSMD-F are to make changes to actual or notional gearing, regulatory asset lives, and capitalisation rates.
In considering financial risks and mitigating actions we believe there are limited options available to SSEN Distribution. Typical options such as changing asset lives (which will not improve credit ratios in the short term and will distort charges to consumers over generations), or increasing the fast money i.e. reducing capitalisation rates below their natural level, are both short term and damaging to consumers. Both of these measures have the adverse impact of increasing costs to consumers in the short term while simultaneously masking a financeability problem which would re-appear in the longer term. The only other measure would be to reduce the gearing even further from 60% which again, is already below the industries actual gearing levels. These measures do not address the credit ratios or dividend yield concerns we have set out in our business plan and further illustrate that Ofgem has set the Cost of Equity too low.
The only measure we believe is worthy of consideration relate to price control specific factors such as the transfer of the RAV proportion from SSEN Transmission for the Shetland Link to SHEPD in financial year 2025/26. This RAV transfer is to allocate the costs of the new Shetland Link connecting Shetland to the mainland, as set out by Ofgem’s direction for the Shetland Link. At that time, given the significant equity issuance required and drop in credit ratios, we have included a fast money proportion as this is a one-off transaction. We have included this as totex within the Shetland link transfer on the basis of it being transferred RAV/totex subject to the statutory accounting and taxation treatment being finalised after consultation with our auditors and tax advisors. This has been included in our business plan PCFM on the basis of a separate capitalisation rate.
Conclusion
In accordance with Ofgem’s business plan Guidance, we have set out the impact on consumer bills of our business plan, and the key financial parameters that underpin the costs to consumers. We have also set out the impact on credit financeability while noting the pressures on issuing equity and paying a reasonable dividend to equity investors/shareholders.
We as a Board, have considered the financeability of our RIIO-ED2 plan and are satisfied that the licencee is technically financeable on both a notional and actual capital structure and that all applicable measures to aid financeability have been considered, including supporting evidence and justification, in support of this submission of our final plan. We do however see adverse impacts on credit financeability in RIIO-ED2 as a result of Ofgem’s proposed Cost of Equity, which should be addressed in Ofgem’s determinations.
Members of the Board recognise that to ensure credit financeability over the short and long term will need to be addressed as part of Ofgem’s determinations, in order to support the significant investment needed to transition to net zero. This concern is amplified when errors in Ofgem’s notional company definition are corrected, and true credit metrics are evaluated. These errors include the assumption, inconsistent with evidence, of DNOs having ILD of around 25% of their total debt book. Evidence shows this is around 10% and Ofgem’s assumption artificially inflates the key credit ratio of AICR. Secondly, Ofgem has retained the OW mechanism in RIIO-ED2 at this stage despite the CMA quashing this mechanism for RIIO-T2 and GD2 on the basis it is a “poorly designed mechanism”. When correcting these errors, i.e. removing the OW and setting the ILDs at 10%, key credit ratios fall materially below the required threshold to maintain a strong investment grade.
We also note that the extent of equity injection required from shareholders will convert the dividend yield of 3% into a negative cash yield to shareholders of 4.3% and 1.8% for SHEPD and SEPD respectively. When increasing the CoE to 5.9%, the key credit ratios increase above the threshold marginally, but leaves minimal headroom during a period of significant investment. At this CoE, the impact on consumer bills would remain relatively flat when moving from RIIO-ED1 to RIIO-ED2 while supporting credit financeability over a period where there is significant investment required to deliver the transition to net zero.

Southern Electricity Networks is a trading name of: Scottish and Southern Energy Power Distribution Limited Registered in Scotland No. SC213459; Scottish Hydro Electric Transmission plc Registered in Scotland No. SC213461; Scottish Hydro Electric Power Distribution plc Registered in Scotland No. SC213460; (all having their Registered Offices at Inveralmond House 200 Dunkeld Road Perth PH1 3AQ); and Southern Electric Power Distribution plc Registered in England & Wales No. 04094290 having their Registered Office at No.1 Forbury Place 43 Forbury Road Reading RG1 3JH which are members of the SSE Group
ssen.co.uk
Website
ssen.co.uk
@ssencommunity
/ssencommunity
/ssencommunity
FOLLOW US
Copyright © 2022 FDOKUMEN