
Powering the UK - Energy UK
48
Brochure title panel Subtitle Ilis et volorepro quia simustis estias explanda dolupti, toptum dessequam Ilis Month Year Powering the UK Empowering UK growth, jobs and energy users through continued investment 2015
-
Upload
khangminh22 -
Category
Documents
-
view
2 -
download
0
Transcript of Powering the UK - Energy UK

Brochure title panelSubtitle Ilis et volorepro quia simustis estias explanda dolupti, toptum dessequam IlisMonth Year
Powering the UKEmpowering UK growth, jobs and energy users through continued investment
2015

Powering the UK 2015ii
ForewordIt’s always there at the touch of a switch. But this ease disguises the huge scale of the contribution Britain’s energy industry makes to our national life and the innovation and investment which keeps light and power flowing to millions of homes and businesses all over Britain.
The industry provides life-long, quality employment for more than 1 in 50 people in the UK and is committed to the development of the next generation of energy leaders. At a time when some industries have contracted and others struggled to cement the economic recovery, the many and diverse members of Energy UK continue to work the length and breadth of the country, providing jobs in the North, South, East and West.
Our members also continue to underpin massive national infrastructure programmes, investing £15.1b in 2014 alone. And they pay their way in tax, rates and wages, contributing £6b to the Exchequer last year.
Energy UK is the voice of the whole industry, speaking up for the broad spread of companies we represent — from smaller generators to the major companies, from household names to emerging suppliers.
It is vital for our future, and the future of our children, to use that voice to work with policymakers and regulators to tackle the challenges we face.
Even our politics are changing, with a distinctly different House of Commons returned after this year’s General Election. The country is at a cross-roads.
Britain cannot duck the need to reform — in this, our collective and individual response to the outcome of the CMA review of the energy industry will be crucial. It will set the tone and pace of the way forward.
With a focus on affordability, the Government is scrutinising all costs and developing new policies to meet environmental targets. With industry looking to commit billions of pounds of investment over the next decade, we must have a robust policy framework that will continue to support the massive investment needed.
The energy sector is pledged to work constructively with all policymakers — across the UK and in Europe. I firmly believe this must not be an adversarial relationship but a true partnership.
There are no simple solutions. But I am sure, by pulling together, Britain’s energy industry can continue investing in cleaner technology and deliver affordable power — keeping people warm this and every winter — while playing a pivotal role in the continuing economic recovery of the country.
Lawrence Slade Chief Executive, Energy UK

Powering the UK: At a glance
Powering the UK 2015 iii
ForewordPowering the UK 2015at a glance
This activity supports
619,000jobs acrossthe country
In 2014, energy firms contributed
£83b in GVA to the UK economy,equal toabout ...
The sector needs to
decarbonisewhilst maintaining secure andaffordablesupplies of energy. This transition involves a set of complex choices.
Implementation ofEMR appears to have provided some
regulatory stability.However, recent policy changes have eroded some of this progress.
Record number of firms serving the domestic marketpoints to the investment the sector has madeto increase choice for consumers.
Firms are also investing in their
workforcehelping to create greater choice for people considering pursuing a career in energy.
Choices around our generation mix —
today and over time — will require
both sustained investment
and a focus on innovation.
In 2014, the sector invested a record
£15.1bin infrastructure.
an amount equivalent to
£560 for every household
in the UK.
In addition, the energy sector contributed around
£6.0bEquivalent to
1 in every48 jobs
in the UK. ... in taxesto the UK Exchequer.5%
GDP
Powering the UK sets out the energy sector’s contribution to the UK economy. Powering the UK shows how the energy sector creates jobs, both directly and through the supply chain. How energy is engaged in huge investment. And how energy takes its responsibilities to business, communities and individuals seriously. This report makes it clear that energy is a large and consistent contributor to the UK.

p12
Jobs supported by the energy sector
p04
Executive summary
Cont
ents
p06
The economic contribution of the energy sector
Powering the UK 20152

p18
Investment
p32
Consumers
Foreword ii
Executive summary 4
1 The economic contribution of the energy sector 6
2 Jobs supported by the energy sector 12
3 Investment 18
4 Consumers 32
Glossary 38
Powering the UK 2015 3

Powering the UK 20154
The importance of the energy sector in driving the growth and prosperity of the UK economy can often be underestimated. The work of energy firms to generate, transport and supply energy is not only a key enabler of the activities of all homes and businesses across the country but also creates significant economic value in its own right.
In 2014, energy firms directly contributed £23 billion to the UK economy in terms of gross value added (GVA) and an additional £60 billion of economic value generated elsewhere in the economy. This means that the sector — which ranks as one of the most productive in the economy — contributed a total of £83 billion in GVA in 2014, which is equal to about 5% of total UK gross domestic product (GDP).
This activity supports a large number of jobs across all regions of the country. In 2014, the sector supported around 619,000 jobs within energy firms and across the supply chain, which means that 1 in every 48 jobs in the UK was related to the energy sector. The energy sector also makes a significant contribution to the UK Exchequer. We estimate that the sector contributed around £6 billion in direct and indirect taxes in 2014, as well as substantial sums paid to local authorities through property rates.
While energy firms continue to make a significant contribution to the UK economy, it is clear that the sector is in a period of transition. Over the recent past, we have seen the emergence of a range of new and disruptive trends — for example, in terms of energy policy and technology — that have challenged conventional business models within the sector. In this report, we set out some of the ways in which the sector is adapting and innovating in response.
Perhaps the most significant of these trends is the need to decarbonise the energy sector in line with the UK’s greenhouse gas (GHG) reduction targets. In delivering this objective — alongside the other pillars of UK energy policy, maintaining secure and affordable supplies of energy — the energy sector faces a range of choices around the precise timing and pathway of the transition.
These choices are not straightforward, particularly given the existence of tensions between different policy objectives. For example, gas generation offers a relatively low-cost and secure means of generating electricity, but the emissions generated during the combustion of the fuel will mean that gas plants will increasingly have to run as ‘backup’ to low-carbon sources if the UK is to meet its GHG targets. Low-carbon generation — such as renewable energy and nuclear — provide options for reducing the carbon intensity of the generation mix but currently rely on some form of support, which puts pressure on energy prices.
What is clear is that the choices that need to be made around our generation mix — both for today and over time — are complex and will require both sustained investment and a focus on innovation and research and development (R&D). What is also clear is that the energy sector is rising to this challenge, both in terms of the level of investment being made and the range of technologies being developed and deployed.
In 2014, the sector invested £15.1 billion in new generation, network and supply infrastructure. This means that energy firms invested an amount equivalent to £560 for every household in the UK, which represents a record level of energy sector investment. Moreover, a re-examination of the latest investment data for 2013 suggests that investment was higher than previously thought. Rather than the ‘plateauing’ evident at the time of Powering the UK 2014, what we are seeing is a level of capital investment that has continued growing year-on-year.Ex
ecut
ive
sum
mar
y

Powering the UK 2015 5
Whether investment continues to increase further towards a pathway consistent with meeting our energy objectives will depend to a large extent on the stability of the regulatory and policy landscape. In 2014, we saw the first round of allocation for both the Contract for Difference and the Capacity Market mechanism, which are the key pillars of the Government’s Electricity Market Reform (EMR) framework to incentivise investment in low-carbon and conventional generation capacity. These policies were designed to allow a greater role for the market in setting the energy mix and to create greater choice and certainty for energy firms and investors.
In Powering the UK 2014, we posed the question in the context of EMR of whether the Government would ‘hold its nerve and allow markets to adjust, learn and deliver’ in order to create the conditions for investor certainty. The implementation of EMR does appear to have provided a measure of regulatory stability, and the first round of auctions has suggested that EMR policies can help to deliver investment at a relatively low cost to consumers. However, recent government actions and proposals to adjust the rules for a range of low-carbon policies have brought the issue of policy certainty back into sharp focus. Given the importance to investors of a stable and predictable policy framework, these changes could serve to erode some of the progress made through EMR and potentially undermine efforts to transform the sector.
Over the past year, we have also seen clear signs of the investment that energy firms have made to increase the level of choice for consumers with regard to purchasing, managing and generating energy. New entrants to the industry mean that customers have a growing number of options as to where they purchase their electricity and gas, and we are also seeing the emergence of more bespoke energy tariffs designed to appeal to specific segments of consumers. We would expect this trend to continue over the coming years as the rollout of smart meters gathers pace and if, as expected, the constraints imposed by the regulator around the number of tariffs suppliers are able to offer are eased as a result of the investigation by the Competition and Markets Authority (CMA).
The ability of energy firms to continue the current transformation in the way that energy is generated and consumed will depend in part on the sector’s ability to attract and retain a highly skilled workforce. In Powering the UK 2014, we presented the results of a survey that suggested that firms faced a range of recruitment challenges associated with the evolving requirements of the industry and that this was exacerbated by the expected number of retirees across the sector in the near future.
It is clear that firms are taking action on a number of fronts to address this issue. For example, through initiatives such as mentoring schemes, apprenticeships and professional networks, firms are helping to create greater choice for people considering pursuing a career in energy. Furthermore, the focus of many of these activities on groups that have typically been under-represented within energy firms should help to ensure that the sector draws on the best talents from across society to create a workforce that is better equipped to tackle the challenges ahead.
6 Powering the UK 2015
The economic contribution of the energy sectorEvery day, the energy sector provides a secure and increasingly sustainable supply of electricity and gas to millions of homes and businesses across the country. This service is fundamental to driving the growth and prosperity of the UK economy.

7Powering the UK 2015
In 2014, the activities of firms in the energy sector directly contributed £23 billion in GVA to the UK economy.1 Beyond this ‘direct’ effect, energy firms generate an additional ‘second-round’ contribution elsewhere in the economy through their supply chains (i.e., the range of goods and services they purchase from other sectors to support and enable their own activities), as well as through the wages that are paid to energy sector employees.
The contribution of the energy sector to the UK economy is shown in Figure 1, which demonstrates that the £23 billion of GVA directly contributed by energy firms generated an additional £60 billion of GVA elsewhere in the economy. This means that the sector contributed a combined £83 billion to the UK economy in 2014, equivalent to 5% of GDP.
Figure 1: Contribution of the energy sector to the economy
Direct
0102030405060708090
Second round Total
GV
A (£
b, 2
014
pric
es)
Source: EY analysis, ONS
These estimates are based on an assessment of the contribution of the firms that the Office of National Statistics (ONS) records as being involved in the generation, transmission and supply of electricity and gas. This is essentially a rather narrow definition of the energy sector and suggests that the true contribution of the sector to the UK economy extends well beyond the estimates that are presented in this report (see Box 1 for further details). 1 GVA is a measure of the economic contribution of an industry or sector. It is calculated
as the difference between the value of outputs and the cost of inputs required to produce those outputs. The GVA of all sectors adds up, with some adjustments, to the GDP of the economy.

Powering the UK 2015
While these estimates point to a modest fall in the direct contribution of the energy sector from 2013 to 2014, it is clear that the sector continues to have a substantial positive impact on the prosperity of the UK economy.2 It is also clear that the sector is in a period of evolution, with a range of potentially disruptive trends — such as the increasing focus on energy efficiency as a means of managing demand, and the rise in the number of businesses and communities that are choosing to meet their energy needs through distributed generation — beginning to challenge traditional business models within the energy sector.
In sections 2, 3 and 4, we will explore some of the ways in which the energy sector is responding to these trends. This includes the maintenance and development of its workforce, industry-led innovations in energy production and transportation, and strategies for interacting with consumers.
2 While our estimates do suggest a fall in the overall economic contribution of the sector between 2013 and 2014, the main driver of the fall is in fact the updating of the ONS supply and use tables that were used for the analysis in Powering the UK 2014. These tables, describing the economic relationships between the different sectors of the economy, are the basis for the modelling in this report.
Box 1: The broader impact of the energy sectorThe analysis we have used to assess the economic contribution of the energy sector is based on ONS data on the economic output of firms involved in the supply of electricity, gas, steam and air conditioning (category D in the ONS Standard Industrial Classification). While this definition represents the core activities that are associated with the supply of energy to homes and businesses, it is clear that it excludes some areas that could reasonably be considered part of the energy sector. For example, the broader energy activities that make a contribution to the UK economy include:
► Agriculture — e.g., the production of energy crops for generation
► Engineering and science — e.g., research and development activities associated with the transition to low-carbon electricity
► Manufacturing — e.g., manufacture of electricity generating, metering and transmission equipment
► Construction — e.g., insulation, nuclear decommissioning
► Professional services — e.g., energy service companies providing energy efficiency services
The economic contribution of these activities to the UK is likely to be substantial and growing. As such, the estimated GVA shown in this report represents a conservative estimate of the economic contribution of energy to UK PLC.
Source: EY analysis, ONS
8

9Powering the UK 2015
The productivity of energy sector firms The energy sector not only contributes a substantial proportion of UK GDP, but it is also one of the most productive sectors in the economy. Figure 2 demonstrates both of these points, with GVA per head for firms in the energy sector reaching £183,000 in 2014. This is in large part because the sector is highly capital-intensive.
Figure 2: Comparison of productivity between sectors
Output by industry, 2014 (£m) Annual GVA/employee (£)
Agriculture, forestryand fishing
Transport and storage
Construction
Professional, scientificand technical
Manufacturing
Real estate activities
Information andcommunication
Water and waste
Energy
Mining and quarrying
0 100,000 200,000 300,000 400,000 500,000 600,000
In 2015, the Government sought views on the potential to cut ‘red tape’ in a number of industries, including the energy sector.3 This type of review offers the opportunity to examine the impact of regulation on energy companies and will potentially help to unlock further productivity gains within the sector.
3 This review covers the entire energy sector apart from retail markets (which are being reviewed by the Competition and Markets Authority’s energy investigation). See: https://cutting-red-tape.cabinetoffice.gov.uk/energy/.

The contribution of the energy sector to the ExchequerThe sector also makes a large and consistent contribution to the UK Exchequer. In 2014, the sector contributed £6 billion in direct and indirect taxes to the Government, which represents an increase of 14% on 2013. Figure 3 shows how this breaks down across tax types.
A significant part of this increase was due to higher revenues from the Carbon Price Support (CPS) and Climate Change Levy (CCL), which are taxes on fossil fuel generation. The increase was largely due to the rise in the level of the CPS in 2014. We expect that the level of tax paid by the energy sector through these instruments will increase further in future, not least because of the announcement in the 2015 Budget that the Government intends to remove the CCL exemption for renewable electricity. It estimates that the removal of this exemption will earn the Exchequer an additional £450 million in 2015–16, rising to £910 million per year in 2020–21.
The increase in CCL and CPS revenues was partly offset by a reduction in corporation tax revenues. The amount of corporation tax revenue paid by the sector fell by about £0.36 billion compared with the previous year, which is due in part to a reduction in the rate of corporation tax.
Figure 3: Tax receipts from the direct activities of the energy sector in 2014
Source: EY analysis, ONS
Income tax£0.7b
CPS and CCL£1.4b Employer NI
contributions£0.5b
Employee NIcontributions£0.5b
Corporation tax£0.9b
VAT − sales of electricityand natural gas£2.0b
10 Powering the UK 2015

11
In addition to these taxes, the energy sector also contributed to the Exchequer through the purchase of EU Emission Trading Scheme (EU ETS) allowances. The EU ETS is a ‘cap-and-trade’ scheme for reducing GHG emissions in the electricity and energy-intensive sectors. Companies that are part of the scheme are required to surrender one EU Allowance (EUA) for every tonne of carbon dioxide (CO2) they emit. Electricity generators tend to purchase the majority of their EUAs through government-run auctions. In 2014, the Exchequer received about £300 million through the sale of EUAs, a large proportion of which is likely to have come from electricity generators.
Energy firms also make a substantial contribution through local taxes. Since many energy firms own large capital assets, they tend to pay significant amounts to local authorities through property rates.

12 Powering the UK 2015
Jobs supported by the energy sector The economic activity generated by the energy sector supports a significant number of jobs across the country.

13Powering the UK 2015
As shown in Figure 4, energy firms employed around 133,000 people in 2014, as well as supporting an additional 486,000 jobs elsewhere in the economy. This implies that 1 in every 48 jobs in the UK was related to energy. As was noted in the previous section, this is likely to be a conservative estimate, as it does not capture the contribution of some broader energy-related activities (e.g., R&D and some aspects of construction and manufacturing).
Figure 4: Employment in the energy sector in 2014
Source: EY analysis, ONS
0
100,000
200,000
300,000
400,000
500,000
600,000
700,000
Direct Second round Total
Empl
oym
ent s
uppo
rted
by
the
ener
gy s
ecto
r

14 Powering the UK 2015
Figure 5 shows how the jobs directly supported by the energy sector are spread across different regions. What is clear is that the pattern of employment in the energy sector is structurally different from what we would observe in many other sectors. Indeed, energy is a significant employer across all regions of the country, with only about 15% of total direct energy sector jobs in London and the South East.
Figure 5: Distribution of direct energy employment across the UK (000s)
Scotland 18.7
North East 8.8
London 6.6
South East 14.3
East 5.5
South West 11.0
Wales 7.7
North West 18.7
Yorkshire and Humber 13.2
West Midlands 14.3
East Midlands 14.3
Source: EY analysis; ONS

15Powering the UK 2015
Building the skills base to support future growthThe energy sector has always required a broad range of highly skilled employees to support its activities across the value chain. In last year’s Powering the UK, we presented the results of a survey conducted to understand the perspectives of energy firms with respect to their workforce. The survey suggested that energy firms were facing a number of recruitment challenges associated with the evolving requirements of the industry (e.g., the continuing shift to low carbon and the employment requirements resulting from the imminent rollout of smart meters). Furthermore, these challenges are likely to be exacerbated by the expected number of retirees across the industry over the next few years.
Further evidence of these challenges was highlighted in the 2015 report by the UK Commission for Employment and Skills, which focused on the skills challenges facing the sector.4 In particular, the report highlighted the difficulty the sector faces in attracting the limited pool of science, technology, engineering and mathematics (STEM) graduates in the face of competition from other sectors and from employers abroad.
Creating greater choice for current and future employees
One of the ways in which firms are looking to address this challenge is through initiatives to encourage people from a broader range of backgrounds to pursue careers within the energy sector. We can point to activity across many firms: for example, the National Grid’s EmployAbility scheme (which offers internships to students with learning disabilities in order to give them an opportunity to develop skills and confidence in a business environment) and the work that British Gas is doing to broaden the diversity of staff in its HomeCare operations (see Box 2 for further details).
Box 2: Broadening the diversity of the HomeCare workforceOver the past year, British Gas has been working to increase the awareness of diversity throughout the organisation and, specifically, to improve the gender balance within its HomeCare operations business (its gas and electric repair and maintenance business — a typically male-dominated part of the industry).
British Gas has focused on attracting, retaining and developing women for its field workforce. For example, it has created a women’s network for field engineers and set up a mentoring programme to support their development. By exploring different ways to attract women, it has seen an increase in female applicants for its engineering apprenticeship scheme move from 4% in 2014 to 7% in 2015.
The story of Hanna Hughes, one of the recent graduates of the British Gas apprenticeship scheme, highlights some of the progress that is being made. Hanna is a recently qualified HomeCare engineer who completed her apprenticeship at the British Gas training academy in Berkshire. She had always been interested in a career in plumbing — attracted particularly by the practical aspects of the job — and found that the British Gas apprenticeship offered her a route into the industry. While Hanna was aware that, as a woman, she would be in the minority, it would be fair to say that she has been pleasantly surprised by her time in the industry so far. In her own words:
“I had a few retail and hospitality jobs before applying for my apprenticeship. Then I started work at a British Gas contact centre in Cardiff. Speaking to customers every day, I realised that an apprenticeship was something I really wanted to do. I was really excited about being out in the community and helping the people I had been speaking to every day.
“I wanted to fight the stereotype of engineering as a male-dominated role and prove that women are just as capable as men in the industry.
“The facilities and instructors at the academy were amazing: not only in giving apprentices the practical skills to do the job, but also in focusing on getting engineers ready for the day-to-day challenges of going into customers’ homes and dealing with a different situation every day.
“If I had any concerns about being a female and going into the academy, they quickly disappeared. In my group, there were almost as many females as there were males, and all of us were treated exactly the same.
“I think that apprenticeships are a brilliant option for young people. They provide a practical profession, life skills and a truly broad set of experiences you might not get if you go down the university route.”
Hanna Hughes, HomeCare Engineer
Source: British Gas4 UKCES, Sector insights: skills and performance challenges in the energy
sector, 2015
Hanna Hughes British Gas

16 Powering the UK 2015
Energy firms are also making a concerted effort to attract young talent into the industry. For example, the Trailblazer scheme, which is an initiative funded jointly by the Government and the energy sector, provides a platform for employers to attract more young people into the sector through the development of new apprenticeship standards.
The Energy and Efficiency Industrial Partnership (EEIP) — an organisation made up of a coalition of firms in the energy, water and waste management sectors — is tasked with developing new approaches to recruitment and skills in the sector. The partnership acknowledges that parts of the energy sector have a poor image, which has led to a lack of diverse applicants, and has committed to a three-year goal of creating at least 5,500 apprenticeships and at least 7,700 traineeships or Youth Entrant programmes.
The energy sector is also actively seeking to increase retention of current employees by broadening the opportunities for advancement. These initiatives — which tend to focus on a range of activities, such as mentoring schemes, professional networks and recognising talent — are perhaps most important where they are targeted at groups that are under-represented within the sector. Some notable examples of such initiatives include:
► Women in Nuclear (WiN): WiN was formed in early 2014 to improve diversity and increase the skills base in the nuclear industry by encouraging gender balance. It is focused on three key objectives: attraction, retention and dialogue. The aim is to encourage younger women into the nuclear industry through engagement with schools and universities; to support those already in the sector with career progression through mentoring and networking; and to ensure broader engagement on diversity within the sector and attract women outside the industry to the debate on nuclear energy. The organisation has gone from strength to strength in its first year and now has more than 750 members.
► Young Energy Professionals (YEP): Energy UK’s YEP network provides a forum for the next generation of energy professionals to network and discuss topical issues that are challenging the industry. The organisation also holds an annual awards ceremony to recognise the outstanding contributions that have been made by younger people within the industry (an example of this is set out in Box 3).
These types of recruitment and retention initiatives are helping to create greater choices, both for those considering careers in energy and those currently working in the sector. In doing this, the sector is looking to build a more inclusive and representative workforce that draws on the best talent from across society. This should help ensure that the sector is able to draw on new perspectives in developing innovative solutions to the challenges ahead, as well as helping ensure that energy firms are better aligned with the attitudes and needs of their customer base.

Box 3: Building trust through customer serviceEnergy UK hosted the inaugural YEP Awards in London in June 2015. The awards were established to recognise some of the best young people working in the energy sector. One of the winners was Elizabeth Garber, who works as a Customer Experience Manager in EDF Energy’s retail business. Elizabeth won the Customer Focus Award for her work in improving the way Energy interacts with its customers.
Elizabeth is part of the marketing team of EDF Energy’s Customers business. She manages multimillion-pound operational and capital expenditure budgets and is accountable for the regulatory compliance of EDF Energy’s customer bills and statements.
On joining the company, Elizabeth’s challenge was to improve one of the most complex and important interactions with EDF Energy’s customers, the energy bill. This work was a key part of the company’s wider priority to be the best and most trusted supplier.
Making changes to the energy bills that customers receive is a complex process with dependencies right across the business, multiple stakeholders to manage, system intricacies to unravel and a very public output result. However, Elizabeth’s colleagues at EDF Energy acknowledge that she rose to this challenge, winning respect internally for delivering change and externally for the final ‘better bill’ format. As a result of this work, EDF Energy saw a significant reduction in bill-related complaints, and the bills were named the best in the industry by Which?.
Since then, Elizabeth has continued to drive customer-focused change, designing a customer engagement programme, securing customer advocates and achieving significant savings through an ongoing Customer Services project to invest in digital technologies.
In making the award, the YEP steering group was impressed with the way that Elizabeth had made a real impact within EDF Energy through her determination to create winning customer experiences.
Source: EDF Energy
17Powering the UK 2015
Clare Duffy (ESB) and Elizabeth Garber (EDF Energy)

18 Powering the UK 2015
The investment choices facing the energy sectorThe UK’s binding targets for reducing GHG emissions and increasing the use of energy from renewable sources have set the economy on a decarbonisation pathway in line with the long-term objective to reduce carbon emissions by 80% from 1990 levels by 2050.

19Powering the UK 2015
There are a number of ways in which the country could meet its climate and energy objectives. This means there is a range of choices facing the Government with regard to setting the energy policy framework, as well as choices for energy firms and investors in how to respond to those policies. For example, what will the future mix of low-carbon and conventional generation capacity be? What role will new and disruptive technologies and fuels play (e.g., shale, clean coal and demand-side)? How big a role will the heating and transport sectors play in meeting the GHG and renewable energy targets?
The policy choices that the Government may take in meeting its objectives are not straightforward, particularly given the tensions and trade-offs between the high-level policy objectives of reducing GHG emissions, maintaining secure supplies and ensuring that energy bills are affordable for consumers. For example:
► Gas power stations offer a relatively low-cost and secure option for generating electricity. However, the emissions generated during combustion of the fuel mean that gas-fired plants will increasingly have to serve as backup for renewable generators if the UK is to meet its GHG targets.
► Low-carbon generation (such as nuclear and renewables) reduces carbon emissions and creates green jobs but currently relies on some form of support, which puts pressure on energy prices. However, several types of low-carbon generation are becoming more competitive over time, compared with conventional generation, as costs fall with greater deployment. Furthermore, this trend will be reinforced if there is a concerted effort at the EU or international level to increase the cost of carbon to be paid by fossil generators.
► A greater reliance on generating electricity from intermittent renewable sources can create challenges to the system. These can be addressed through investment in flexible generating capacity as well as other forms of capacity, such as interconnectors, storage and demand-side response.
► Mature low-carbon technologies (including onshore wind, solar and large-scale nuclear) provide lower-cost opportunities for decarbonisation over the short term, while emerging technologies (including offshore wind, storage, carbon capture and storage [CCS] and marine energy) require greater support today but offer the potential for greater innovation and learning, which could help to reduce costs in the future.
These examples illustrate some of the complexities that the sector needs to manage as it continues to transform the way in which electricity is generated. What is immediately clear is that finding an appropriate generation mix — both for today and over time — is not straightforward, and that successfully meeting the three high-level policy objectives is likely to require a balance of different technologies. This is further illustrated in Box 4.

Box 4: Decarbonisation pathwaysNational Grid gathers views each year from a wide range of stakeholders to produce its publication on Future Energy Scenarios.
These are four credible future energy scenarios that reflect a range of technology and policy choices, as well as potential scenarios for economic growth and commodity prices. The main differences in the four scenarios reflect the level of ambition to reduce carbon emissions (Green Ambition) and the affordability constraints on bringing forward new technologies (Prosperity).
The range of technologies deployed under the different Future Energy Scenarios is illustrative of the choices and trade-offs facing the energy sector:
► Security of supply: this can be understood both as having sufficient generating capacity to keep the lights on and not being heavily reliant on energy imports to provide fuel for power plants. A high level of investment is needed in UK generation to maintain generation adequacy, with the rapid closure of old existing plants. Investment in domestic shale gas production provides an alternative choice to help reduce fuel imports. Low-carbon technologies offer another way to reduce dependence on gas imports although renewables, such as wind and solar, are intermittent and therefore require investment in additional flexible capacity to balance the system. There is a range of proven choices for managing the intermittency of renewable output, from investment in interconnection to energy storage and demand-management technologies.
► Decarbonisation: there is a range of technologies available for decarbonising the power sector, including a mix of energy efficiency measures to reduce demand and the use of renewables, nuclear or CCS. Emissions can also be reduced in other sectors of the economy instead of power (such as heat and transport). However, meeting the ambitious target to reduce GHG emissions by 80% by 2050 will likely require investment in many different technologies and effort from all sectors of the economy.
► Affordability: a slower trajectory for decarbonisation can reduce costs today but will increase the cost and scale of measures needed in the future. There is also a trade-off between mature technologies, such as solar photo-voltaic (PV), nuclear and onshore wind, and those innovative technologies that may be more expensive today but whose cost may come down over time, such as offshore wind, marine energy or CCS. An increase in energy efficiency and demand-side management will help to mitigate the affordability challenges for households.
Source: National Grid, EY
20 Powering the UK 2015
.
d
Source: National Grid
Gone GreenGone Green is a world where green ambition is not restrained by financial limitations. New technologies are introduced and embraced by society, enabling all carbon and renewable targets to be met on time.
Slow ProgressionSlow Progression is a world where slower economic growth restricts market conditions. Money that is available is spent focusing on low-cost long-term solutions to achieve decarbonisation, albeit later than the target dates.
Consumer PowerConsumer Power is a world of relative wealth, fast-paced R&D and spending. Innovation is focused on meeting the needs of consumers, who focus on improving their quality of life.
No ProgressionNo Progression is a world focused on achieving security of supply at the lowest possible cost. With low economic growth, traditional sources of gas and electricity dominate, and there is limited innovation changing how we use energy.
+
-
Pros
perit
y
Green Ambition +-

21Powering the UK 2015
Investing for a secure and low-carbon electricity futureDelivering these fundamental changes in the UK energy system will require substantial and ongoing investments in new infrastructure across the value chain. This must take place against the background of an ageing generation fleet (some of which is coming to the end of its life) and a system in a period of transition. Hence, energy firms and investors face a range of choices of which technologies they will invest in.
For example, improvements in energy efficiency and the continued rise of distributed generation have resulted in a decline in demand for electricity — both final demand and demand over the National Grid transmission system — over recent years. By way of illustration, final consumption of electricity fell by 4.3% from 2013 to 2014 to the lowest annual level since 1995, and recent statistics show a likely continuation of the downward trend in electricity demand on the transmission system into 2015. While change from one year to the next tends to be modest, the cumulative impact of these trends in the way electricity is produced and consumed will increasingly impact on the type of investment that will be required, with investment choices becoming less about replacing ‘like for like’.
In addition, volatility in the energy policy landscape over recent years has contributed to increased challenges in attracting private sector finance, particularly as investors need to be able to recover capital costs over a long period.
However, the sector is rising to this challenge, not only in the level of new investment being brought forward but also in terms of the range of technologies that are being developed and deployed.
In 2014, the sector invested £15.1 billion in new generation, networks and supply infrastructure. This is a record level of investment, equivalent to around £560 per household in the UK, and represents an increase of 4% on what was invested in 2013.5
Major projects under way in 2014 include the following:
► The 389MW West of Duddon Sands offshore wind farm, costing £1.6 billion, was commissioned in October 2014, following a decision to invest in June 2011.
► The largest section of the new Beauly to Denny transmission line in Scotland was completed in 2014. The project is estimated to have cost £600 million.
► Construction is continuing on ESB’s 880MW new combined cycle gas turbine (CCGT) plant in Carrington, scheduled to commission in 2016.
The consistently high level of investment within the UK energy sector places the industry amongst the leading sectors with respect to private sector investment (as is shown in Figure 6). In 2014, only the real estate sector invested more than energy.
Figure 6: Private sector investment by industry
0 5 10 15 20 25 30
Health andsocial work
Other services
Hospitality
Agriculture
Finance
Education
Mining
Transport
ICT
Energy
Real estate
Source: ONS
£b private sector investment in 2014
5 We have revisited the estimate for 2013 investment on the basis of new and finalised UK Government economic data that has become available. It suggests that the estimate presented in Powering the UK 2014 underestimated the true level of activity. The estimate of the equivalent investment per household is based on the ONS estimate of 26.7 million households in the UK in 2014 (see: http://www.ons.gov.uk/ons/rel/family-demography/families-and-households/2014/families-and-households-in-the-uk--2014.html).

The following sections show how this investment breaks down across the different parts of the energy value chain and discuss some of the challenges and choices facing energy firms and investors.
Conventional generation
Investment in new conventional generation remained at £200 million in 2014, reflecting the cost of ongoing construction of the 880MW new CCGT plant in Carrington.
This type of investment in new CCGT will play an important role in maintaining secure supplies of electricity in the future. However, it is clear that firms across the energy sector are also exploring a broader set of technological solutions — such as storage, interconnection and demand-side response — to create capacity and flexibility within the electricity system. In addition, firms are also considering how existing infrastructure can be adapted to the requirements of energy policy (as demonstrated by the conversion of the Drax coal-fired station to burn biomass, described further in Box 5).
The future outlook for investment in conventional generation is likely to be increasingly determined through the Capacity Market, which is the Government’s main policy for encouraging investment in generating capacity (as well as other types of capacity, such as storage, interconnectors and demand-side response). This is in line with the Government’s expectation that up to 16GW of new gas plant will be needed between now and 2030.
Box 5: Decarbonising DraxAs the largest power station in the country (currently generating 7%–8% of the UK’s energy supply), Drax is an important asset in the UK power industry. As such, the work that Drax is undertaking to convert half of its generating units to sustainable biomass is highly significant in contributing to the UK’s decarbonisation objectives whilst maintaining secure and affordable supplies of energy.
In two years, Drax has successfully converted two of its six generating units from coal to biomass and modified a third unit to run predominantly on biomass. Using sustainable biomass allows Drax to generate cost-effective, low-carbon electricity whenever it is needed. Furthermore, this transformation, a first by any power generator in the world, has been achieved without interruption to the electricity supplied by the power station.
Sustainable biomass produces less harmful emissions than coal and, even when emissions from the supply chain are factored in, the GHG saving compared with coal is more than 80%. The biomass pellets used by Drax are made from a mix of ‘thinnings’ (i.e., trees that are removed from the forest as a normal part of good forestry management), misshapen and diseased trees not suitable for any other use, tree tops, limbs and sawmill residues. Drax ensures biomass sustainability criteria are written into every supplier contract, and information, including place of origin, is made publicly available.
The conversion of the power station is already delivering significant carbon savings. With three units fully converted, Drax estimates that it will reduce its carbon emissions by some 12 million tonnes a year, equivalent to taking three million cars off the road.
Furthermore, the investment in converting to sustainable biomass has not only protected jobs (the Drax Group has 1,400 employees, with 850 based in Selby, North Yorkshire), but has created them. For example, the investment has provided about 200 jobs at the ports where wood pellets arrive in the UK before starting their rail journey to the power station.
Source: Drax
22 Powering the UK 2015

Decisions to invest in new gas plants and retire existing plants have historically been largely market-driven. However, the introduction of the Capacity Market has meant that investment decisions in future will partly be made following the outcome of annual capacity auctions in which new-build projects compete against existing plant for capacity agreements (through which the generator receives a regular payment in return for committing to provide electricity at times of system stress). Some existing coal plants have also had the option to ‘opt out’ of the Capacity Market when they are converting capacity to biomass generation.
The first capacity auction was held in December 2014 and led to more than 2.8GW of new generating capacity receiving agreements. This includes a 1.9GW new CCGT project at Trafford, led by Wainstones Energy Limited, as well as 0.9 GW of new small-scale gas ‘peaking plants’ situated on more than 50 sites spread across the distribution networks. All the new-build projects that won capacity agreements are expected to make a financial investment by July 2016 and to have been commissioned by October 2018. There is still a risk that some of these projects may not materialise, although the investors and developers will need to decide rapidly to secure their capacity agreements.
In addition to new build, 3.1GW of existing coal plants were awarded three-year agreements after committing to a total of at least £400 million in plant refurbishments. At the same time, the new build brought on by the Capacity Market is displacing older existing plants. Indeed, 8.5GW of existing plant that was not successful in the first auction will now face the choice of closing plants that aren’t able to cover their costs. For instance, since the auction result, SSE has confirmed the closure of the Ferrybridge plant’s remaining 1GW of coal-fired generating capacity by March 2016; Scottish Power has announced the closure of the 2.4GW coal plant at Longannet in March 2016, and EPH has confirmed that the 2GW plant at Eggborough will close. While the closure of these coal plants can be seen as part of the move towards a low-carbon future, the experience of Ferrybridge, Longannet and Eggborough shows that the transition will not be without cost, given that each of these power stations is a significant employer.
The Capacity Market is one of the main policy instruments brought in under the Government’s EMR programme. The high-level objective of EMR was to facilitate the transition to secure and low-carbon generation by encouraging cost-effective investment from a diverse range of sources. With the first round of auctions now completed, we can make a tentative assessment of the extent to which the Capacity Market is meeting these objectives (see Box 6).
Box 6: Capacity Market scorecardOur assessment of the initial Capacity Market auction against a range of metrics is set out in the table below. It suggests that:
► The first capacity auction was successful in bringing forward significant potential investment in new-build and plant refurbishment.
► The auction was also highly competitive, leading to a clearing price set significantly below the expectations of the Government and many market participants.
► The capacity auction was successful in drawing a diverse range of investors, with the majority of the bids coming from independent investors.
Metric 2014 Capacity Market auction
Competition The first auction was highly subscribed, with a total of 65.7GW of capacity prequalified for the 2014 T-4 auction, including more than 10GW of new capacity. This was 17GW more than the target level of capacity, meaning there was competition between capacity providers to win agreements in the auction.
New build More than 2.8GW of new generating capacity won agreements, despite the clearing price falling significantly below the Government’s estimated net cost of new entry of £49/KW/year.
Technologies brought on
New technologies that were awarded contracts included one large CCGT project and over 50 small-scale peaking plants situated on the distribution network. No storage projects were successful. There was limited demand-side response in the first auction, although the Government expects these types of project to participate primarily in the next auction, to be held at the end of 2017.
Cost The auction cleared at a price of £19.40/kW year, less than half the price expected by the Department of Energy and Climate Change (DECC). The auction also managed to attract new build at this price, 60% lower than the Government’s estimate of the cost of new entry at £49/kW year.
Type of investor
The auction attracted a range of new or small investors to the market, with independent investors (i.e., outside the largest six energy suppliers) providing 80% of the new-build capacity offered into the auction and all of the new capacity that was successful in the auction.
Judged on these criteria, the first Capacity Market has been a success. However, the long-term success of the scheme will depend on future auctions and, crucially, on how well it delivers the required physical capacity. For instance, the new-build projects that were successful in the auction need to proceed to the final investment decision, and subsequent auctions (which will be run each December) will also need to remain competitive as existing plant that was unsuccessful in the first auction is retired.
Source: Ofgem, National Grid & EY
23Powering the UK 2015

24 Powering the UK 2015
Renewable electricity
Investment in renewable electricity generation assets was over £9 billion in 2014, which represents a 6% increase on the level of investment in 2013.
However, while overall renewables investment increased, the picture across different technology types varies substantially. For example, while investment in wind generation increased by 35% in 2014 (compared with 2013), investment in solar PV saw a 15% drop, reflecting a reduction in the level of support available for the technology. There is a strong possibility that onshore wind will now see a fall in investment following the Government’s decision to end the Renewables Obligation (RO) earlier than anticipated. The trend in investment for renewable generation and the breakdown across technology types is shown in Figure 7.
Figure 7: Investment trend in renewable generation
-
1,000
2,000
3,000
4,000
5,000
6,000
7,000
8,000
9,000
10,000
2006
2007
2008
2009
2010
2011
2012
2013
2014
£m In
vest
men
t
Solar Small-scale solar Wind
Biomass and waste Other (e.g., marine, biofuels)
Source: BNEF
As a result of the consistently high level of investment over recent years, renewables accounted for 19.1% of all electricity generated in 2014, up from 14.8% in 2013. This rapid increase in renewable generation has helped the UK to progress towards meeting its ambitious 2020 renewable energy target. Delivering the target remains challenging, however — possibly requiring renewable generation to double to more than 35% by 2020 — although doing so will also create opportunities for significant new investment and employment opportunities in the sector.
In total, 3.6GW of renewable generation was commissioned in 2014. The biggest projects include:
► 645MW Drax unit biomass conversion
► 389MW West of Duddon Sands offshore wind farm, developed by Dong Energy and Scottish Power in a joint venture
► 136MW Harestanes onshore wind farm, developed by Scottish Power
Beyond 2015, it is expected that large renewables investments will be made on the back of allocation rounds for the Contract for Difference (CfD). The CfD, which is one of the main pillars of the Government’s EMR programme alongside the Capacity Market, provides renewable generators with a guaranteed ‘strike price’ for electricity generated (where the price of the contracts is set through a competitive auction).
The first CfD auction was held over 2014 and 2015 and allocated approximately £325 million in support of 2.1GW of renewable electricity capacity divided over 25 projects. Wind power was the main ‘winner’ in the auction, with 1.2GW of offshore wind and 0.75GW of onshore wind contracted. The full list of projects that were successful in the first CfD auction is set out in Figure 8. These projects are expected to become operational between April 2016 and March 2019.
However, future renewables investment is likely to be constrained by recent changes to the support regime for low-carbon technologies, the potential lack of budget for further CfD allocations to 2020 and the lack of visibility on the level of funding beyond 2020. We will return to the impact of rising uncertainty in the future budget for low-carbon electricity later in this section.

25Powering the UK 2015
Figure 8: Where are the CfD projects based?
Perthshire10MW
Rhondda Cynon Taf26 MW
Hampshire12 MW
Durham16.4 MW
Cambridgeshire18.15 MW
South Ayrshire20 MW
Yorkshire25 MW
West Midlands26 MW
Caithness29 MW
Aberdeenshire30 MW
Dunfries and Galloway37.5 MW
East Ayrshire37.5 MW
Nairnshire39.10 MW
East Anglia714 MW
Fife448 MW
Swansea40 MW
Herefordshire49 MW
Kent59.67 MW
Denbighshire141 MW
South Lanarkshire164 MW
Moray177 MW
Solar PV Onshore wind Offshore wind Advanced conversion technology
Figure 8 shows how the renewable projects allocated CfDs through the first auction are spread across different counties within the UK, as well as the technology type for projects in each county. In total 25 projects were awarded CfDs, representing 2.1 GW of renewable capacity, with the largest successful projects being the offshore windfarms situated off the coasts of Fife and East Anglia.

26 Powering the UK 2015
As with the Capacity Market, we have made a tentative assessment of the first round of CfD auctions to understand the extent to which the policy is delivering on the EMR objectives of facilitating an efficient transition to a secure and low-carbon generation mix (see Box 7).
Box 7: Contract for Difference scorecardOur assessment of the CfD against a range of metrics is set out in the table below. It suggests that the first CfD auction succeeded in achieving significant cost reductions over the ‘administrative strike prices’ estimated by the Government. This demonstrates the benefits to consumers from competitive auctions to drive down the cost of renewables and may also reflect investor confidence in the new CfD mechanism.
Metric 2014 Capacity Market auction
Competition The first CfD auction was fiercely competitive, as shown by the auction clearing at prices significantly below the Government’s estimate (see ‘Cost’ below).
New build brought on
2,100MW of new capacity won CfD contracts.
Technologies brought on
Wind power won the majority of CfD contracts, with offshore wind getting 55% of contracts and onshore wind getting 36% of contracts (by installed capacity).
Cost Strike prices resulting from the auction were on average 15% lower than the Government’s expected prices (the administrative strike price, or ASP).However, in two cases, participants bid a low price and were then unable to deliver the projects: two solar PV projects (totaling 32MW) won contracts in the auction at £50/MWh, far below the £120/MWh ASP, but then declined to sign contracts.
Type of investor
The vast majority of capacity brought on was by independent investors (i.e., outside the largest six energy supply companies).
However, the success of future CfD auctions will depend on developers being able to bring more projects to market. The Government now faces choices about how much support to make available through this policy. It is currently not known what level of funding will be made available in the Levy Control Framework (LCF) beyond 2020–21, when a second CfD allocation might be held, or which technologies will be able to participate. This increases investor cost and uncertainty and creates challenges for maintaining the UK supply chain to deliver future investment. Developers also face difficult choices about whether to bring projects to market, given policy uncertainty around the Government’s intentions for decarbonising the power sector.
Source: LCCC CfD register; EY
27Powering the UK 2015
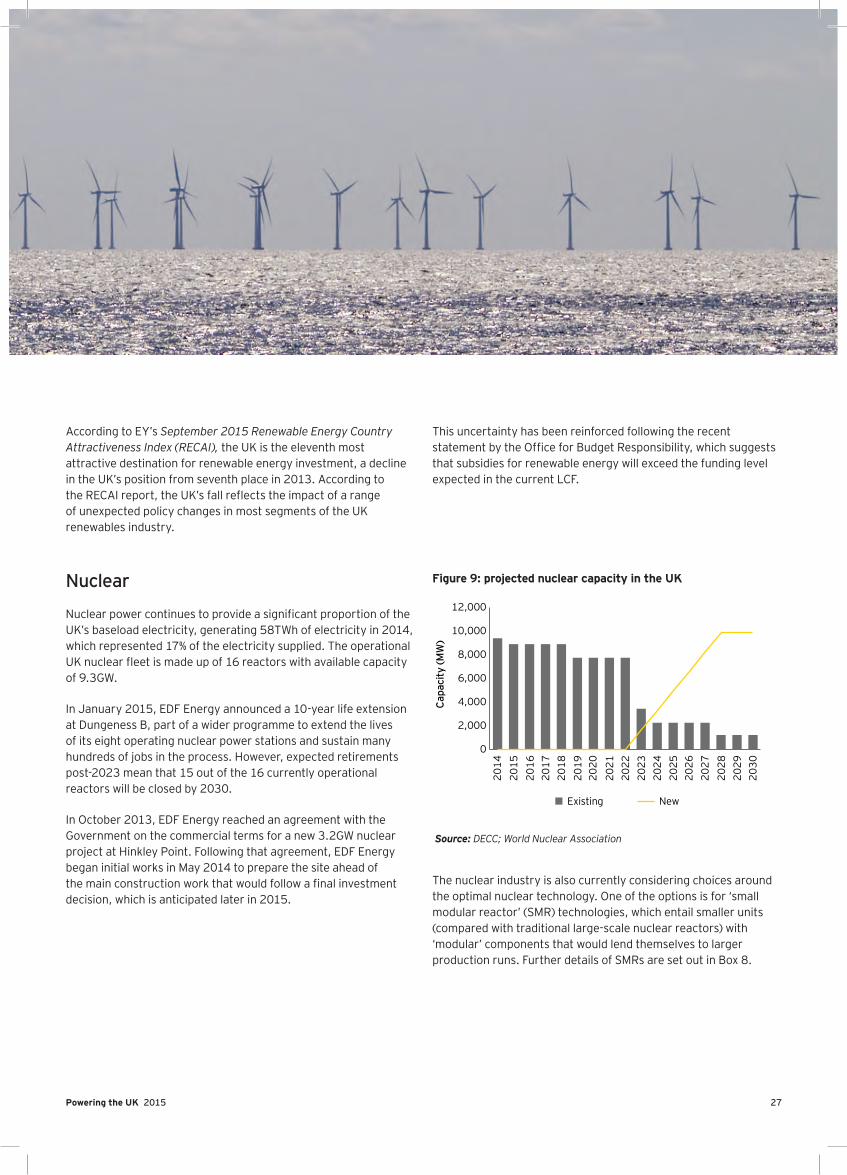
According to EY’s September 2015 Renewable Energy Country Attractiveness Index (RECAI), the UK is the eleventh most attractive destination for renewable energy investment, a decline in the UK’s position from seventh place in 2013. According to the RECAI report, the UK’s fall reflects the impact of a range of unexpected policy changes in most segments of the UK renewables industry.
This uncertainty has been reinforced following the recent statement by the Office for Budget Responsibility, which suggests that subsidies for renewable energy will exceed the funding level expected in the current LCF.
Nuclear
Nuclear power continues to provide a significant proportion of the UK’s baseload electricity, generating 58TWh of electricity in 2014, which represented 17% of the electricity supplied. The operational UK nuclear fleet is made up of 16 reactors with available capacity of 9.3GW.
In January 2015, EDF Energy announced a 10-year life extension at Dungeness B, part of a wider programme to extend the lives of its eight operating nuclear power stations and sustain many hundreds of jobs in the process. However, expected retirements post-2023 mean that 15 out of the 16 currently operational reactors will be closed by 2030.
In October 2013, EDF Energy reached an agreement with the Government on the commercial terms for a new 3.2GW nuclear project at Hinkley Point. Following that agreement, EDF Energy began initial works in May 2014 to prepare the site ahead of the main construction work that would follow a final investment decision, which is anticipated later in 2015.
Figure 9: projected nuclear capacity in the UK
0
2,000
4,000
6,000
8,000
10,000
12,000
Existing New
Capa
city
(MW
)
2016
2017
2018
2019
2020
2021
2022
2023
2024
2025
2026
2027
2028
2030
2029
2014
2015
Source: DECC; World Nuclear Association
The nuclear industry is also currently considering choices around the optimal nuclear technology. One of the options is for ‘small modular reactor’ (SMR) technologies, which entail smaller units (compared with traditional large-scale nuclear reactors) with ‘modular’ components that would lend themselves to larger production runs. Further details of SMRs are set out in Box 8.

28 Powering the UK 2015
Box 8: Small modular reactorsDECC has commissioned a study of the use of SMRs to collect industry views and evidence on the viability of the small-scale nuclear generation technologies and the role they can play in the UK’s generation mix.
The first phase of this review highlighted a number of potential benefits from SMRs, including the following:
► It may be easier to raise project finance due to smaller project size, making it easier for companies to finance investment projects due to shorter construction periods.
► There is greater potential for costs to come down over time, due to the lower requirement for on-site assembly, with production being more modular and factory-produced, enabling a manufacturing environment where cost reductions are more likely to be delivered.
While SMRs offer an exciting opportunity for future cost reduction and innovation, the benefits need to be weighed against the immaturity of the technology and the likelihood that initial projects may not be competitive against more conventional large-scale technologies.
Source: DECC, EY
Interconnectors
Interconnectors to other markets provide an important option for the UK to manage the challenge of intermittent power supply created by decarbonisation, reducing the need to invest in domestic backup generation as well as allowing for greater exports of excess power. The value of interconnection to security of supply has been recognised within the Capacity Market, with interconnectors eligible to participate and to compete against thermal generation in auctions from 2015.
However, integrating new interconnectors into the UK energy system is not straightforward. In particular, enabling a level playing field between interconnectors and domestic generation is important but is complicated by a number of differences in how domestic and imported generation are treated under existing regulation.
The Office of Gas and Electricity Markets (Ofgem) has sought to reduce the investment risk for interconnector projects through the ‘cap and floor’ regulatory regime while also preventing potential for interconnectors to earn excess profits. This inevitably increases the role of the regulator in how much investment is made to interconnection. In 2014, Ofgem agreed to the design of the cap and floor regulatory regime for the Nemo Link interconnector to Belgium, while also shortlisting five new electricity interconnectors for inclusion within that regime.
While investment in new interconnection remained at very low levels in 2014, greater investment is expected to begin soon:
► The 1GW ElecLink interconnector to France (due to commission in 2016) has been exempt from certain aspects of European legislation, enabling the project to proceed without a cap and floor arrangement.
► Nemo Link awarded contracts valued at about £350 million for construction of the converter stations and cable laying for the proposed 1GW interconnector to Belgium. Nemo Link is the joint venture between National Grid and Elia, the Belgian transmission system operator; it is anticipated to go into commercial operation in 2019.
► The 1.4GW interconnector to Norway, known as the NSN Link, recently awarded contracts to three companies valued at over £1 billion. This project is a joint venture between National Grid and Statnett SF, the Norwegian transmission system operator, and is expected to commission in 2021.

29Powering the UK 2015
Transmission and distribution
The gas and electricity networks saw investment of £5.2 billion in 2014, equal to about one-third of total investment in the energy sector in that year. Most of the investment in networks comes from replacing or upgrading the existing electricity and gas networks. However, this is an area where the application of emerging technologies is helping to drive a more efficient approach (Box 9 sets out an example of the sort of innovative solution currently being tested by National Grid).
There is also a range of substantial ongoing new projects. For example, work on the £600 million Beauly to Denny connection continued in 2014. The final stage of work was completed in July 2015, and the 137-mile project is on target to ‘energise’ later this year. Other major projects include the building of the first-of-a-kind high voltage direct current 2GW Western Link electricity connection between Scotland and Wales, being developed through a joint venture between Scottish Power and National Grid, and the £1 billion London Power Tunnels project to rewire the capital’s transmission network.
The transition of the energy sector towards low-carbon generation and the increasing significance of distributed generation are creating some challenges for traditional models of transmission and distribution. For example, the increase in conventional and renewable embedded generation has increased the proportion of generating capacity on the distribution network (rather than the transmission network, as tends to be the case for larger-scale generation plants) from 14% to 19% over the past two years, placing greater strain on the network.
The move to a more disparate and distributed system of electricity generation creates challenges for the system operator in ensuring system reliability at a reasonable cost. To minimise the level of expensive grid reinforcements required, it is likely that networks will have to evolve from their traditional use. The sector is looking to address this challenge, in part by making smarter use of the distribution networks (as an alternative to reinforcing the network). For example, Ofgem established the Low Carbon Networks Fund (LCNF) to help distribution network operators (DNOs) understand how they can facilitate the take-up of low-carbon and energy-saving initiatives, and investigate the opportunities that smart meter rollout provides to network companies. This programme allowed up to £500 million in support of projects for DNOs to try out new technology, operating and commercial arrangements.
Box 9: A new solution to an old problemNational Grid is modernising the way it repairs the UK’s ageing gas distribution network. In a partnership with four other businesses (Balfour Beatty, 3M, PMP and SHUR), National Grid is turning an innovative idea into reality to reduce disruption to homeowners when gas mains are being replaced, with live trials taking place during 2015.
Pipe replacement in situ manufacturing (PRISM) technology is a remedy to problems associated with the traditional method of replacing gas mains, where the pipe is dug up at each home or business to access the service pipes into the properties. Property owners then have to deal with access disruption while excavated waste is generated from each hole in the street.
PRISM revolutionises this process. Pipes can now be replaced using just two excavation sites — a launch and a receive pit — situated at each end of the street. A resin is introduced into a vortex of air that carries it down the pipe and applies it evenly to the inside walls. It quickly cures to a hard and durable finish before the air is purged, and the gas can start flowing again. The new pipe will last for the next 50 years.
PRISM allows up to 100 metres of pipework to be replaced each day, which would typically have taken an entire week. This not only reduces the disruption to property owners and road users, but also reduces the cost of the work and saves money for gas customers.
Source: National Grid

Powering the UK 2015
Smart technologies
The sector invested over £400 million in smart technologies in 2014. This investment was mostly on R&D but also included initial deployment of smart energy technologies, including smart meters, digital energy, smart grids (as well as other emerging technologies, such as power storage, hydrogen and fuel cells). A significant development in engaging customers with the use of smart technologies was in the promotion of smart thermostats, including Hive by British Gas, HeatSmart by EDF Energy, Connect by Scottish Power and Nest by npower, which allow users to control their heating remotely using smart phone apps.
Investment in smart energy technologies is expected to accelerate in coming years as the smart meter programme enters the mass rollout phase.
30

31Powering the UK 2015
Future prospects for investmentIn Powering the UK 2014, we discussed the significance of the policy and regulatory framework in incentivising the level of capital investment that will be required to hit the UK’s climate and energy targets and, in particular, whether the nascent EMR policies would deliver the policy certainty that was being demanded by both energy firms and investors.
As this section sets out, there are many trade-offs between generation technologies in terms of affordability, security of supply and decarbonisation. The Government’s EMR framework has been designed to give the market a greater role in establishing the energy mix, with technologies competing to win capacity contracts and CfDs. This has the potential to create greater choice and certainty for energy firms and investors.
One year on, and having been through the first round of allocation for both CfD and the Capacity Market, it is possible to make a tentative assessment of whether and how the regulatory framework has helped to bring on new investment, reduce risk and promote competition.
The figures for total investment in 2014 point to a strong year. Furthermore, a re-examination of the latest data for 2013 shows that investment in that year was higher than previously thought. Rather than the ‘plateauing’ described in Powering the UK 2014, what we have actually seen is the level of capital investment growing year on year.
Almost all of the investment that took place over recent years has been in regulated or semi-regulated parts of the sector or where support mechanisms are pivotal, particularly in networks and renewable energy projects. A key challenge for the sector will be attracting investment to areas that bear greater market risk, such as new gas build, where the role of the capacity market will be critical.
While the implementation of EMR does appear to have provided a measure of regulatory certainty, and the first round of EMR auctions demonstrated that competition can help deliver necessary investment at lower cost to consumers, a number of recent announcements have acted to reintroduce regulatory uncertainty, particularly with respect to low-carbon technologies.
For example, over the past year, the Government has made announcements on:
► Introducing primary legislation to close the RO scheme to new onshore wind projects
► Consulting on removing the process of pre-accreditation for the Feed-in Tariff (FiT) scheme
► Consulting on closing the RO scheme to new solar projects over 5MW
► Removing CCL exemptions for renewable generation
► Confirming the removal of grandfathering measures for biomass and co-firing projects
► Consulting on a review of FiTs for small-scale renewable technologies
Whilst understandable in the context of putting downward pressure on bills and removing subsidies where they are no longer necessary, the increased uncertainty around the regulatory framework has had the effect of reducing the predictability and transparency around the long-term direction of policy and, in some cases, has created something of a ‘boom and bust’ pattern of investment.
For example, we have seen a flurry of solar projects racing to commission in early 2015, prior to the cut-off for large-scale solar projects to qualify for the RO, and it is expected that there will be another rush for new projects to commission in the first quarter of 2016, before the RO is closed to smaller solar farms and proposed changes to the rules around access to the FiT are introduced.
Alongside changes to particular regulatory measures, there are also continuing doubts about the Government’s ambition for decarbonisation and about the level of funding for the LCF beyond 2020–21. All of these factors are contributing to ongoing regulatory uncertainty and potentially making the UK a less attractive destination for low-carbon investment; they may also act to discourage developers from bringing new low-carbon projects to market.
It is unlikely that we will see an immediate impact of policy uncertainty across all the types of assets that are being developed. Just as the current record levels of investment are a result of decisions that were made by firms and investors two to three years ago, it is likely to be some time before we see the impact of shifting policy priorities on the level and type of investment brought forward by the industry.

32 Powering the UK 2015
ConsumersRecent years have seen the energy retail sector continue to evolve in response to changes in energy markets, customer needs and technology.

33Powering the UK 2015
Choice of tariff and supplierIt is clear that consumers are being offered a growing number of options with regard to where they purchase their electricity and gas. A 2015 report by Cornwall Energy shows that the number of suppliers serving the domestic market is at an all-time high. The report revealed that early 2015 saw the ‘independent’ share of the energy market (i.e., the market share of the firms outside the six largest energy supply companies) exceeding 10% for the first time, with 29 suppliers operating in the domestic energy market.
Consumers also have a choice with respect to their energy tariff. While energy companies currently face limits on the number of tariffs they are permitted to offer to customers, the recently published provisional findings of the Competition and Markets Authority investigation into the energy market proposed that the limits should be relaxed (see Box 10 for further details). It is therefore possible that consumers will soon be able to choose from a wider variety of tariffs.
Furthermore, the process of switching suppliers has become faster and more streamlined. In 2014, the energy regulator approved proposals developed by Energy UK and its members to cut the time it takes a customer to switch to just two and a half weeks (up until that point, the process could take up to five weeks).
This evolution is opening up a greater range of choice for consumers in terms of the way they purchase and manage the energy they use. The following sections set out some of the trends and innovations currently taking place in this space.

34 Powering the UK 2015
This increased choice for customers can be seen in the recent statistics on customers switching energy supplier. More than three million customers switched their energy supplier in 2014 (which continues to position the UK market as one of the most active in terms of switching activity), with 4 out of 10 of all switchers moving to a smaller supplier (see Figure 10). Indeed, these figures do not account for the many instances where customers switch to a different tariff or payment method with their existing supplier, so they may underestimate the number of consumers who are exercising a choice about where to purchase their energy.
Figure 10: Number of customers switching energy supplier in 2014
0
50,000
100,000
150,000
200,000
250,000
300,000
350,000
400,000N
umbe
r of s
witc
hers
All switchers Number of switchers who moved to a small supplier
Jan-
14
Feb-
14
Mar
-14
Apr
-14
May
-14
Jun-
14
Jul-1
4
Aug
-14
Sep-
14
Oct
-14
Nov
-14
Dec-
14
Source: ElectraLink
A 2015 survey of 2,000 UK consumers conducted for EY reveals a range of factors driving the observed level and pattern of switching behaviour. For example:
► 81% of the households surveyed that had switched in the past year said they would consider switching again in the near future. This suggests that, for many households, switching was a positive experience that was worth repeating.
► Respondents stated that the most important factor in choosing a new supplier was price (78%), followed by customer service (9%) and brand (6%).
► Over one-third of respondents (37%) who were considering a switch said they were most likely to choose a new entrant, with about one-quarter (24%) likely to switch to a larger supplier. However, the largest share of respondents (39%) said they were undecided.
Box 10: The initial findings of the Competition and Markets AuthorityThe review of the energy sector by the CMA, which commenced in 2014, is investigating the operation of the market to assess whether changes are required for it to operate more effectively. The CMA published its provisional findings and proposed remedies in July 2015.
As expected, there was no evidence of collusion between energy companies, nor to support the ‘theories of harm’ around vertical integration or lack of competition in wholesale markets. However, one of the main findings of the report was that there was ‘weak customer response’ amongst a segment of consumers — in other words, many energy consumers have failed to engage with the market, even though the gains from switching can often be substantial.
While the CMA argued that there was a range of reasons for this lack of engagement, one of the key findings was that previous decisions to limit the number of tariffs suppliers were able to offer was actually restricting competition.
The restrictions on tariffs had originally been put in place by Ofgem through its ‘simpler choices’ initiative. The rationale for the policy was to reduce the number of options to consider when switching supplier and therefore make it simpler for consumers to identify the best tariff for them. Ofgem saw this as a temporary measure that would eventually be relaxed once a greater proportion of consumers were engaging with the market.
However, the CMA argued that not only was there no evidence that the tariff restrictions had resulted in any increase in the level of customer switching, but also that the restrictions were likely to have restricted innovation and the ability for suppliers to offer new and innovative products.
Source: CMA; EY

35Powering the UK 2015
The results of this survey emphasise the opportunity that small suppliers have to attract new customers. However, the results also highlight the incentive facing larger companies to find new ways to engage with customers in order to attract and retain the large group of undecided consumers.
Indeed, large and small suppliers are working on a number of fronts to broaden the choices they offer customers in terms of purchasing energy. In spite of the current tariff restrictions, a number of suppliers are providing bespoke tariffs designed to appeal to a particular segment of customers. Some recent examples include:
► Smart ‘pay as you go’ (PAYG) tariffs — a number of suppliers have begun to offer tariffs that give customers greater flexibility in how they pay for their energy (see Box 11 for further details)
► Single-rate tariffs — Ebico and SSE’s EquiGas and EquiPower offer customers a tariff based on a single price for every unit of energy consumed, with no standing charge. This particularly simple offering allows customers to understand the costs of their energy usage easily (and creates clear incentives to conserve energy).
Naturally, we would expect the number and range of these bespoke tariffs to increase over time, given the recommendations of the CMA on tariff restrictions.
Box 11: Helping customers manage their energy consumptionE.ON launched its Smart Pay As You Go tariff pilot in 2015. The tariff looks to build on the benefits of smart meters by offering customers the ability to top up their account anywhere and at any time through an app, online or by phone. The tariff also gives customers increased financial control and flexibility — for example, by being able to view their current account balance in a number of ways, transfer credit between gas and electricity meters, and be alerted when they need to top up, which helps to prevent customers from running out of energy unexpectedly at inconvenient times.
Launching Smart Pay As You Go meant that E.ON levelled the playing field for prepayment meter customers, giving them access to its cheapest prices, which were previously offered only to customers who chose to pay by fixed monthly direct debit.
Smart PAYG builds on the existing work that E.ON has undertaken to help its customers to understand and manage their energy consumption. For example, in 2013, E.ON teamed up with Opower — a company specialising in cloud-based software for the utility industry — to launch the Saving Energy Toolkit, which is an online tool to help customers gain better insight into their home energy use.
Launched as part of E.ON’s commitment to helping its customers use and pay for no more energy than they need, the Saving Energy Toolkit provides customers with personalised insights and tips on the actions they can take to save energy around the home, such as unplugging unused devices, setting thermostats more wisely and turning off unused lights. More than one million customers have now signed up for the Saving Energy Toolkit.
Source: E.ON

Powering the UK 201536
Greater choice in the consumption and generation of energyEnergy firms are also working across a number of areas to improve the choices for consumers in managing and consuming energy. For example, in 2014, energy companies supported more than 600,000 households in reducing their energy requirement through improved energy efficiency: suppliers delivered about three-quarters of a million major insulation measures and efficient boilers in homes across the country under the Energy Company Obligation. Such energy efficiency improvements remain amongst the most cost-effective ways to help households make substantial and sustained reductions in their energy consumption.
Many suppliers are working to improve the way they communicate information about prices, usage and bills to their customers, and are also developing technological solutions that offer consumers greater flexibility in the way they use energy within the home.
For example:
► The collaboration between E.ON and Opower to develop the Energy Saving Toolkit (described in Box 11) shows how data analytics can be used to engage better with customers and incentivise the sorts of behavioural change that can offer a win-win for both customer and supplier.
► The NEST Learning Thermostat — offered in the UK by npower — helps to give consumers greater control over their energy usage (e.g., by allowing consumers to control their heating remotely) and also assists households in using energy more efficiently. For example, the system ‘learns’ the heating regime that the householder likes and will control the heating system in an efficient way to achieve the preferred temperature.
This type of sophisticated offering, which helps the household understand and control its energy usage, is likely to become increasingly common as a greater number of households are fitted with smart meters. The combination of the smart meter and the associated real-time display will provide the household and the energy supplier with more accurate information about energy consumption. It should open up a whole range of benefits, including more accurate billing and lower ‘cost to serve’, and could create a market for new energy services and tariff offerings, such as time-of-use tariffs.
In addition, energy firms are working to support consumers who are choosing to generate some or all of the energy they use. In last year’s Powering the UK, we discussed how the level of on-site generation within the industrial and commercial sectors has increased rapidly over recent years. Alongside this, we have seen an increasing number of

Box 12: Supporting consumers in generating and purchasing renewable energySince it was founded, Good Energy has shown a real commitment to the decarbonisation of the UK energy sector. Good Energy believes that the transition to a renewable energy future — which will rely on decarbonising all sources of energy and also making more efficient use of the energy consumed — would be facilitated if more households and communities were able to generate more of their own energy.
The Good Energy HomeGen and SmartGen schemes — which provided the blueprint for aspects of the Government’s FiT scheme — incentivise the generation of local renewable electricity by paying households and communities for all of the electricity they generate, as well as any electricity that is exported back to the grid. These payments provide a financial incentive that helps households and communities to finance the up-front installation cost associated with micro-generation.
Good Energy has also been working to create a mechanism to make it easier for buyers and sellers of renewable energy to interact. Through a partnership with tech start-up Open Utility, Good Energy has created an online peer-to-peer energy trading marketplace, named Piclo, which means that people will be able to buy and sell 100% renewable power directly at prices they agree for the first time in the UK.
Piclo allows ‘half-hourly’ consumers to know their energy supply chain and track every kWh back to the generator. This can benefit consumers in a number of ways, including:
► Receiving 100% renewable power for carbon reporting
► Being able to measure, track and avoid peak grid charges
► Benefiting from discounted electricity from local generators
► Being able, through their purchases, to support local generators who share their values
This innovative service gives consumers unprecedented transparency and control over their energy. Good Energy believes that Piclo is the first step towards a more decentralised electricity market, which will be key to unlocking the potential of renewables in the UK.
Source: Good Energy
37Powering the UK 2015
households and communities embracing auto-generation as a means of meeting their energy needs. By way of illustration, since the start of 2010, more than 700,000 renewable micro-generation technologies (e.g., solar PV, wind and anaerobic digestion) have been installed by households and communities through the Government’s FiT scheme. Box 12 provides the example of an energy firm that is assisting consumers in making the switch to renewable micro-generation.
In this section, we have seen the trends and innovations — in competition, tariffs, billing, efficiency and generation — that are transforming the retail energy sector. We can see clear signs of this transformation in the broader choices available to consumers in the ways they purchase, consume and generate energy. These trends are likely to continue, and even accelerate, over the coming years as firms across the energy sector explore new options to engage and interact with their customers.

GlossaryCap and floor Regulatory regime for interconnector investment that limits risk for developers and
consumers by setting upper and lower boundaries for the level of revenue that the developer may earn
Capacity Market Support mechanism for power plants, demand response and interconnectors (excluding plants in low-carbon support mechanisms) that provides a stable monthly payment, set through annual auctions, for plant to be available
CPS Carbon Price Support —a UK tax on the use of fossil fuels for production of electricity, whose level is set to top up the price for carbon set through the EU ETS
CCS Carbon capture and storage — a greenhouse gas mitigation technology which, for biofuels, produces negative carbon emissions
CfD Contracts for Difference — the support mechanism for new low-carbon power plants that provides a top-up on the wholesale power price up to a predefined strike price. The CfD replaces the RO mechanism for new build from 2016
CCL Climate Change Levy — a tax on energy delivered to non-domestic users in the UK
CMA Competition and Markets Authority — the UK’s primary competition authority. The CMA is currently carrying out an investigation into the energy market
Direct impact Value added directly by a sector
Demand-side response A service provided by energy customers or embedded generators to lower or shift their use of electricity imported from the National Grid
DNOs Distribution network operators — companies that own and operate the distribution network of cables and towers that bring electricity from the national transmission system to homes and businesses
EMR Electricity Market Reform — UK programme for decarbonising the UK power sector at least cost while maintaining security of supply. The key policy planks of EMR are the introduction of the CfD and Capacity Market
ETS Emissions Trading Scheme — the EU mechanism for incentivising measures to reduce carbon. The ETS sets a cap on greenhouse gas emissions across participating installations, with emission ’allowances’ then auctioned or allocated, and subsequently able to be traded
38 Powering the UK 2015

FiT Feed-in Tariff — UK Government scheme to incentivise investment in small-scale renewables by requiring suppliers to make tariff payments on the generation and export of eligible renewable electricity
Grandfathering A clause in new regulation that provides exemptions from the application of the regulation to certain parties. In the context of renewable support schemes, it refers to exemptions from policy changes to allow existing plants to continue to receive the subsidy levels they were previously eligible for
GVA Gross value added — an indicator of economic wealth. It measures the difference between the total pre-tax revenue of a sector or economy and its total bought-in costs (i.e., costs excluding wages and salaries), adjusted for any changes in stocks. The change in GVA over time can be used to measure the growth of a sector or economy
Half-hourly consumers Consumers equipped with a ‘half-hourly’ meter which records energy consumption every half-hour and passes that information to the energy supplier
Pre-accreditation Also known as preliminary accreditation — allows prospective renewable plants, at the planning stage, to receive automatic accreditation under certain circumstances. It gives applicants greater certainty about future RO accreditation and the level at which ROCs might be issued
RO Renewables Obligation — an obligation on energy suppliers in the UK to source an increasing level of the electricity they supply from renewable sources
ROCs Renewables Obligation Certificates — issued to operators of accredited renewable generators for the eligible generation they produce. These can be traded with other parties, including suppliers, who use the ROCs to demonstrate they have met their obligations under the RO
Smart grid An electricity network that uses a range of measures, including smart meters, embedded generation and demand-side management resources, to detect and respond to local changes in usage
SMR Small modular reactors — nuclear power plants that are smaller in size than current-generation nuclear plants. SMR designs involve smaller and more compact reactors that can be produced in factories and transported to a nuclear power site
Value added The difference between the value of outputs and the costs of inputs for a company, industry or economy
39Powering the UK 2015

40 Powering the UK 2015
Energy UK commissioned EY to update the previous Powering the UK reports published in 2011, 2012, 2013 and 2014, incorporating the most recently published data and covering the sector’s total economic, investment and employment contribution to the UK.
In this report, unless otherwise stated, the term ‘energy sector’ is used to cover the power and gas sector as defined in previous versions of the report, including:
► In the electricity sector — generation, transmission, distribution and supply (retail)
► In the gas sector — transmission, distribution, storage and supply (i.e., the downstream activities)
► Other associated services — e.g., energy services, such as central heating, air conditioning and steam
It does not include the upstream oil and gas or mining sectors (i.e., exploration, extraction and processing).
The report examines the energy sector by comparing it with other sectors in the UK economy and by looking at how the contribution of the sector to the economy has changed over time. The data used in the report is taken from publicly available sources.
Marketing enquiries:Kevin Corcoran Marketing Associate Director - Energy, EY [email protected]
Media enquiriesKonstantinos Makrygiannis Media Relations Manager, EY [email protected]
Additional information:
EY Energy Hub ey.com/uk/energy
EY Power & Utilities ey.com/uk/powerandutilities
Authors
Tony Ward Partner Head of Power & Utilities UK&I Ernst & Young LLP UK
Tel: + 44 121 535 2921 Email: [email protected]
Jamie Torrens Assistant Director Economic Advisory Ernst & Young LLP UK
Tel: + 44 20 7951 2682 Email: [email protected]
Anthony Tricot Senior Executive Economic Advisory Ernst & Young LLP UK
Tel: + 44 20 7951 9978 Email: [email protected]
Follow us on twitter @EY_UK_Energy
About Energy UK
Energy UK is the trade association for the UK energy industry representing over 80 suppliers and generators of electricity and gas for domestic and business consumers. Our members represent the truly diverse nature of the UK’s energy industry - from the UK’s largest energy firms to new, growing suppliers and generators, now making up overhalf of our membership.
Our members turn renewable energy sources as well as nuclear, gas and coal into electricity for over 26 million homes and every business in Britain. Over 619,000 people in every corner of the country rely on the sector for their jobs with many of our members providing lifelong employment as well as quality apprenticeships and training for thosestarting their careers.
Generation
Our generation policy team covers issues across the field of electricity generation and gas markets including securing the role of thermal plant for the future, maintaining the position of renewable energy in our energy mix and ensuring we can do all this while protecting our environment and working within the planning regimes across the various administrations of the UK.
Economics and Strategy
Providing oversight of all high-level policy and producing analysis of a number of topical and recurring issues, the economics and strategy team brings all our policy work together to o�er a strategic view of the direction of the industry and how it can overcome the challenges ahead as well as looking at the numbers which make the industry tick.
Communications
Communicating our messages to the media, government and stakeholders comes in a variety of di�erent ways including briefings with journalists, press releases and campaigns on issues ranging from renewable energy to energy efficiency campaigns. Working with government and political stakeholders we provide a forum for the industry to provide its insight and information to policymakers in formulating policy.
Events and membership
In addition to the plethora of in-depth policy work Energy UK undertakes on behalf of its members, the organisation also provides a wealth of information, briefing material and other resources to firms. This ranges from issue-specific briefings, newsletters and activity updates to member-focussed briefing events and public conferences.
Retail
Covering all aspects of electricity and gas supply, the retail team leads on our work to develop the policy framework to ensure suppliers can provide the best service to the market, enhance customer-business relationships, secure simplicity and value for consumers and promote innovation and initiative in the retail space.
Contact usenergy-uk.org.uk @EnergyUKcomms www.energy-uk.org.uk

Authors
Tony Ward Partner Head of Power & Utilities UK&I Ernst & Young LLP UK
Tel: + 44 121 535 2921 Email: [email protected]
Jamie Torrens Assistant Director Economic Advisory Ernst & Young LLP UK
Tel: + 44 20 7951 2682 Email: [email protected]
Anthony Tricot Senior Executive Economic Advisory Ernst & Young LLP UK
Tel: + 44 20 7951 9978 Email: [email protected]
About Energy UK
Energy UK is the trade association for the UK energy industry representing over 80 suppliers and generators of electricity and gas for domestic and business consumers. Our members represent the truly diverse nature of the UK’s energy industry - from the UK’s largest energy firms to new, growing suppliers and generators, now making up overhalf of our membership.
Our members turn renewable energy sources as well as nuclear, gas and coal into electricity for over 26 million homes and every business in Britain. Over 619,000 people in every corner of the country rely on the sector for their jobs with many of our members providing lifelong employment as well as quality apprenticeships and training for thosestarting their careers.
Generation
Our generation policy team covers issues across the field of electricity generation and gas markets including securing the role of thermal plant for the future, maintaining the position of renewable energy in our energy mix and ensuring we can do all this while protecting our environment and working within the planning regimes across the various administrations of the UK.
Economics and Strategy
Providing oversight of all high-level policy and producing analysis of a number of topical and recurring issues, the economics and strategy team brings all our policy work together to o�er a strategic view of the direction of the industry and how it can overcome the challenges ahead as well as looking at the numbers which make the industry tick.
Communications
Communicating our messages to the media, government and stakeholders comes in a variety of di�erent ways including briefings with journalists, press releases and campaigns on issues ranging from renewable energy to energy efficiency campaigns. Working with government and political stakeholders we provide a forum for the industry to provide its insight and information to policymakers in formulating policy.
Events and membership
In addition to the plethora of in-depth policy work Energy UK undertakes on behalf of its members, the organisation also provides a wealth of information, briefing material and other resources to firms. This ranges from issue-specific briefings, newsletters and activity updates to member-focussed briefing events and public conferences.
Retail
Covering all aspects of electricity and gas supply, the retail team leads on our work to develop the policy framework to ensure suppliers can provide the best service to the market, enhance customer-business relationships, secure simplicity and value for consumers and promote innovation and initiative in the retail space.
Contact usenergy-uk.org.uk @EnergyUKcomms www.energy-uk.org.uk

42 Powering the UK 2015
Members of Energy UK
Chairman of the Board of Directors: Sir David ArculusChief Executive: Lawrence Slade
Corporate members
AES UK HQ Good Energy
Calon Energy Guernsey Electricity
Carron Energy Happy Energy
Centrica Energy InterGen
Corby Power Jersey Electricity
CRF Hydropower Lynemouth Power
Dong Energy Manx Utilities
Drax Group National Grid
► Drax Power Natural Power
► Drax Biomass Nuclear Decommissioning Authority
► Haven Power Optimum Energy
► White Rose Opus Energy
Ecotricity RES
E.ON UK RWE npower
EDF Energy Smartest Energy
ScottishPower Spark Energy
Eggborough Power SSE
ENGIE Statoil
ESB UK Power Reserve
First Utility Utilita Energy Limited
Flow Energy Utility Warehouse
Garbhaig Hydro Power Company Vitol
GB Energy Supply White Rose

Members of Energy UK
Corporate associate members
Allen and Overy GE
Alstom Power Service UK Green Frog Power
APX Group Henry Riley
Buglass Energy Advisory Honeywell
CGI Horizon Nuclear Power
China Light and Power IBM
Chubu Electric Power Co Interim Partners
Deloitte Local Waste Solutions
DLT Consulting Marsh UK
DNV KEMA Mott MacDonald
Doosan Babcock Energy Nord Pool
EDF Trading NorthConnect JV
Electroroute Osaka Gas
Elexon Pöyry Management Consulting (UK)
Energyhelpline PWC
Energylinx Ruddle Merz
ESCP Europe Sprue Safety Products
Fichtner Consulting Engineers Stag Energy
EY LLP Tokyo Electric Power Company
Energy Helpline Wood Mackenzie Global Consultants


EY | Assurance | Tax | Transactions | Advisory
About EYEY is a global leader in assurance, tax, transaction and advisory services. The insights and quality services we deliver help build trust and confidence in the capital markets and in economies the world over. We develop outstanding leaders who team to deliver on our promises to all of our stakeholders. In so doing, we play a critical role in building a better working world for our people, for our clients and for our communities.
EY refers to the global organization, and may refer to one or more, of the member firms of Ernst & Young Global Limited, each of which is a separate legal entity. Ernst & Young Global Limited, a UK company limited by guarantee, does not provide services to clients. For more information about our organization, please visit ey.com.
© 2015 EYGM Limited. All Rights Reserved.
EYG No. DX0353
17613.indd (UK) 09/15. Artwork by Creative Services Group Design.
ED None
In line with EY’s commitment to minimize its impact on the environment, this document has been printed on paper with a high recycled content.
This material has been prepared for general informational purposes only and is not intended to be relied upon as accounting, tax, or other professional advice. Please refer to your advisors for specific advice.
The views of third parties set out in this publication are not necessarily the views of the global EY organization or its member firms. Moreover, they should be seen in the context of the time they were made.
ey.com