Photocatalytic degradation and drug activity reduction of Chloramphenicol
Upload
khangminh22Category
view
0download
0
PHOTOCATALYTIC DEGRADATION OF PHENOLIC COMPOUNDS AND
ALGAL METABOLITES IN WATER
EMOMOTIMI EMILY BAMUZA-PEMU
A thesis submitted in fulfilment of requirements for the degree of
PHILOSOPHIAE DOCTOR (CHEMICAL TECHNOLOGY)
in the
FACULTY OF ENGINEERING, BUILT ENVIRONMENT AND
INFORMATION TECHNOLOGY
UNIVERSITY OF PRETORIA
2014
©© UUnniivveerrssiittyy ooff PPrreettoorriiaa

i
ABSTRACT
Title: Photocatalytic Degradation of Phenolic Compounds and Algal
Metabolites in Water
Author: Emomotimi E. Bamuza-Pemu
Supervisor: Professor Evans M.N. Chirwa
Department: Chemical Engineering
University: University of Pretoria
Degree: Philosophiae Doctor (Chemical Technology)
Algal infestation in water bodies causes the release of soluble organic compounds that impact
negatively on the taste and odour of the water. With increasing pollution in water bodies and
increasing nutrient loading from agricultural activities, most water reservoirs in South Africa
and around the world have become affected by this problem. In this study, an advanced
oxidation process (AOP), namely, photocatalysis was evaluated for its potential to degrade
aromatic compounds; and taste and odour causing bi-cyclic compounds originating from
algae.
Semiconductor photocatalysis is an environmentally friendly technology requiring no
chemical inputs which is capable of completely mineralising organic pollutants to CO2 and
H2O thereby eliminating production of unwanted by-products. Although processes involved
in the photo-degradation have been reported for a wide range of pollutants, the degradative
pathway in this process has not been fully established. In this study, compounds including
phenol, 2-chlorophenol, 4-chlorophenol and nitrophenol were successfully eliminated from
simulated wastewater. Degradation of geosmin at an environmentally significant initial
concentration of 220 ng/L to levels below the lowest detectable concentration was achieved
with an optimum catalyst concentration of 60 mg/L at a rate of 14.78 ng/L/min. Higher
catalysts loading above 60 mg/L resulted in a decrease in degradation rates. An increase in
initial geosmin concentration resulted in a decrease in rates.
©© UUnniivveerrssiittyy ooff PPrreettoorriiaa
ii
Ionic species commonly found in surface waters (HCO3-, and SO4
2-) significantly reduced the
efficiency of geosmin degradation. Degradation of geosmin produced acyclic intermediates
from ring fission tentatively identified as 3,5-dimethylhex-1-ene, 2,4-dimethylpentan-3-one,
2-methylethylpropanoate and 2-heptanal.
The results obtained indicate that the degradation of organic pollutants in aqueous solution is
as a result of synergic action from hydroxyl radicals, positive holes and direct photolysis by
UV radiation, though the predominant pathway of degradation is via hydroxyl radicals in
solution. Major aromatic intermediates of phenol degradation include catechol, resorcinol
and hydroquinone produced in the order catechol > resorcinol > hydroquinone. All three are
produced within 2 minutes of photocatalytic reaction of phenol and remain in solution until
all phenol is degraded in aerated systems. Production of resorcinol in non-aerated systems is
transient, further supporting the hydroxyl radical dominant reaction pathway.
©© UUnniivveerrssiittyy ooff PPrreettoorriiaa
iii
DECLARATION
I Emomotimi Emily Bamuza-Pemu, declare that the thesis which I hereby submit for a
Doctor of Philosophy in Chemical Technology degree at the University of Pretoria is my own
work and has not been previously submitted by me for any degree at this or other institutions.
Emomotimi Emily Bamuza-Pemu Date
©© UUnniivveerrssiittyy ooff PPrreettoorriiaa
iv
Dedicated to three generations of Pemus
Margaret Okpuma Pemu
A hardworking, loving, dedicated mother who raised such a wonderful man,
Al Pemu
my Sunshine,
and;
Okpuma, Tara and Daderhie Pemu
our three stars.
©© UUnniivveerrssiittyy ooff PPrreettoorriiaa
v
ACKNOWLEDGEMENTS
The author remains grateful for funding from the Water Research Commission (WRC) of
South Africa through the WRC Project No. K5/1717 awarded to Prof Evans M.N. Chirwa of
the University of Pretoria.
Sincere gratitude and appreciation is expressed to the study leader Prof Evans Chirwa for
giving me the opportunity to study in his research group, for his patience and direction and
for generously giving of his time.
The author is also grateful to members of the Reference Group for the WRC Project No.
K5/1717 for their helpful suggestions during the course of the study. To Alette Devega, for
attending to the needs around the lab beyond the call of duty; and to Prof Rohwer for giving
me access to his research team and facilities and for always giving a helping hand and advice
on all chromatographic related problems.
The author’s gratitude also goes to colleagues from the research group at Water Utilisation
and Environmental Division, of the Department of Chemical Engineering, University of
Pretoria including Billy, colleagues and friends from Ambrose Alli University, Ekpoma
especially Gina Ohenhen, Mercy Izomoh, Mark Azih, I.O. Asia, Larry, Uwa, Eunice and
Mike Osuide for their concern and interest in my progress.
The author is eternally grateful to late Kemi Udom for her encouragement and assistance with
settling into life at University of Pretoria; and to Uwem Udom and family for making SA
home from the start. My gratitude also goes to the Devega family for providing a second
home for me and my family in Pretoria and to Leanne De Jager and her Mum, Marion.
To darling my mother, Chief V.B. Bamuza-Mutu and my father, Chief A.E. Bamuza for the
love, guidance and support through the years. My sisters Ebi Umoetuk and Pade Bamuza-
Gbejewoh, thank you for always being there for me unconditionally; and to Peres Mutu for
assisting with the children on the home front. To other family members especially Chief W.
Pemu, Joe Penawou, Chief Broderick Bozimo and Florence Pemu – I will be forever grateful.
Al Pemu, thank you for everything, this would not have been achieved without you.
©© UUnniivveerrssiittyy ooff PPrreettoorriiaa

vi
TABLE OF CONTENTS
Page
TABLE OF CONTENTS………………………………………………….................... v
LIST OF FIGURES……………………………………………………………………. ix
LIST OF TABLES…………………………………………………………………….. xii
LIST OF ABBREVIATIONS…………………………………………………………. xiv
CHAPTER 1: INTRODUCTION: ………………………………………………......... 1
1.1 Background………………………………………………………………......... 1
1.2 Aims and Objectives…………………………………………………………... 2
1.3 Scope of Study………………………………………………………………… 3
1.4 Methodology…………………………………………………………………... 4
1.5 Organisation of Thesis…………………………………………………............ 5
CHAPTER 2: LITERATURE REVIEW……...…………………………………......... 7
2.1 Background………………………………………………………………......... 7
2.2 Geosmin and 2-MIB…………………………………………………………… 8
2.3 Phenol and its Derivatives……………………………………………………... 10
2.4 Water Treatment Processes……………………………………………………. 12
2.5 Advanced Oxidation Processes………………………………………………... 12
2.6 Semiconductor Photocatalysis…………………………………………………. 19
2.6.1 Photoelectronic Processes on Semiconductor Surface………………… 20
2.7 Semiconductor Photocatalysts…………………………………………………. 24
2.7.1 Titanium Dioxide (TiO2) Catalysts………………………………......... 26
2.7.2 Semiconductor Surface Modification…………………………….......... 26
2.7.3 Major Reactions during Photocatalysis in Water……………………… 27
2.7.4 Technological Installations…………………………………………….. 30
2.7.5 Light Sources…………………………………………………………... 34
2.7.6 Application of Semiconductor Photocatalysis…………………………. 36
2.7.7 Case Studies……………………………………………………………. 43
CHAPTER 3: MATERIALS AND METHODS…………………………..................... 46
3.1 Chemicals and Reagents………………………………………………….......... 46
3.2 Equipment……………………………………………………………………... 47
3.3 Properties of Experimental Reagents …………………………………..……... 47
©© UUnniivveerrssiittyy ooff PPrreettoorriiaa
vii
Table of contents continued
3.4 Batch Experimental Setup …………………………………………………….. 48
3.5 Reactor Startup …………………………………......................…………….. 51
3.6 Collection of Water Samples …………………………………...……………... 51
3.7 Analytical Methods………………………………………………………......... 52
3.7.1 Analysis of Phenolics……………………………………………….......... 52
3.7.2 Trace Analysis of Organic Compounds in Water …………..................... 53
3.7.3 Analyses of Taste and Odour Compounds………………….…….............. 53
3.7.4 Method Development for Headspace Extraction and GC/MS Analysis of
Taste and Odour Compounds……………...….......................................... 54
3.8 Identification and Quantification of Taste and Odour
Compounds…………….……………………………………………………… 60
3.8.1 Quantification of Geosmin and 2-MIB…………………………………….. 60
3.9 Characterisation of Anatase Titanium Dioxide Powder………………….......... 60
3.9.1 X-ray Diffractometry Analysis of Anatase Titanium Dioxide Powder…… 60
3.9.2 Surface Morphology of Anatase Titanium Dioxide Powder……………… 63
3.9.3 Actinometric Measurements…………………………................................. 64
CHAPTER 4: ASSESSING THE IMPACT OF ALGAL INFESTATION ON THE
ORGANIC COMPOUND MATRIX OF SOURCE WATER………….. 66
4.1 Evaluation of Natural Organic Matters in Source Waters……………..…......... 66
4.2 Predominant Organic Compounds Identified in Water Samples……………… 66
4.3 Classes of Compounds………………………………………………………… 68
4.4 Degradation Studies…………………………………………………………… 75
CHAPTER 5: PHOTOCATALYTIC AND PHOTOLYTIC DEGRADATION OF
PHENOL AND DERIVATIVES OF PHENOL……………………... 77
5.1 Motivation for Study of Phenolics……............................................................. 77
5.2 Photocatalytic Degradation of Phenol………………………............................ 78
5.3 Photocatalytic Degradation Efficiency of Phenol……………………............... 80
5.3.1 Degradation Efficiency of Phenol……………….….............................. 80
5.3.2 Effect of Initial Pollutant Concentration……………………................. 82
5.3.3 Effect of Titanium Dioxide Concentration…………………….............. 84
©© UUnniivveerrssiittyy ooff PPrreettoorriiaa
viii
Table of contents continued
5.4 Photolytic Degradation of Phenol…………………….….................................. 88
5.5 Effects of Aeration on Degradation Efficiency……………….......................... 90
5.6 Intermediates of Phenol Degradation…………………...................................... 92
5.6.1 Catechol…………………………...................……………………....... 93
5.6.2 Resorcinol………………………….................................................... 94
5.6.3 Hydroquinone…………………………............................................... 97
5.7 Photocatalytic Degradation of Mono-Substituted Derivatives of Phenol……... 98
5.8 Degradation of Mixed Phenolic Pollutants in Water………………………….. 100
5.9 Kinetics of Phenol Degradation…………………….......................................... 102
CHAPTER 6: DEGRADATION OF GEOSMIN OF TASTE AND ODOUR
COMPOUNDS-USING GEOSMIN AS A MODEL………………... 106
6.1 Rationale of Geosmin Study...………..................……………………............. 106
6.2 Methodology of Geosmin Study…………………………………………......... 106
6.3 Efficiency of Photocatalysis for Degradation Geosmin…………...................... 107
6.3.1 Effect of Catalyst Concentration on Degradation Efficiency…….......... 107
6.3.2 Effect of Pollutant Concentration on Degradation Rates…................... 109
6.3.3 Effect of Ionic Species on Degradation Kinetics of Geosmin…………. 110
6.4 Intermediates of Geosmin Degradation…………………………....................... 114
6.5 Degradation Pathway Analysis…………………………................................... 116
6.6 Photolytic Degradation Kinetics……………………......................................... 117
6.7 Photolytic Reaction with Particle Surface Catalysis…………........................... 118
CHAPTER 7: CONCLUSION AND RECOMMENDATIONS……………………… 123
7.1 Conclusion…………………………..................……………………................. 123
7.2 Recommendations…………………………..................…………………......... 124
REFERENCES …………………………..................…………………….................... 126
APPENDICES …………………………..................……………………...................... 144
©© UUnniivveerrssiittyy ooff PPrreettoorriiaa
ix
LIST OF FIGURES
Figure Figure Title Page
Figure 2.1 Structures of (a) geosmin and (b) MIB........................................................ 8
Figure 2.2 Structures of (a) Phenol (b) 2-chlorophenol (c) 4-chlorophenol and (d) 4-
nitrophenol.................................................................................................. 10
Figure 2.3 Classification of advanced oxidation processes.......................................... 13
Figure 2.4 Schematic of electron-hole pair formation over a semiconductor
particle......................................................................................................... 20
Figure 2.5 Schematics of major processes in semiconductor photocatalysis upon
ultra-band gap illumination......................................................................... 21
Figure 2.6 Schematic illustration of the energetics of semiconductor
photocatalysis.............................................................................................. 23
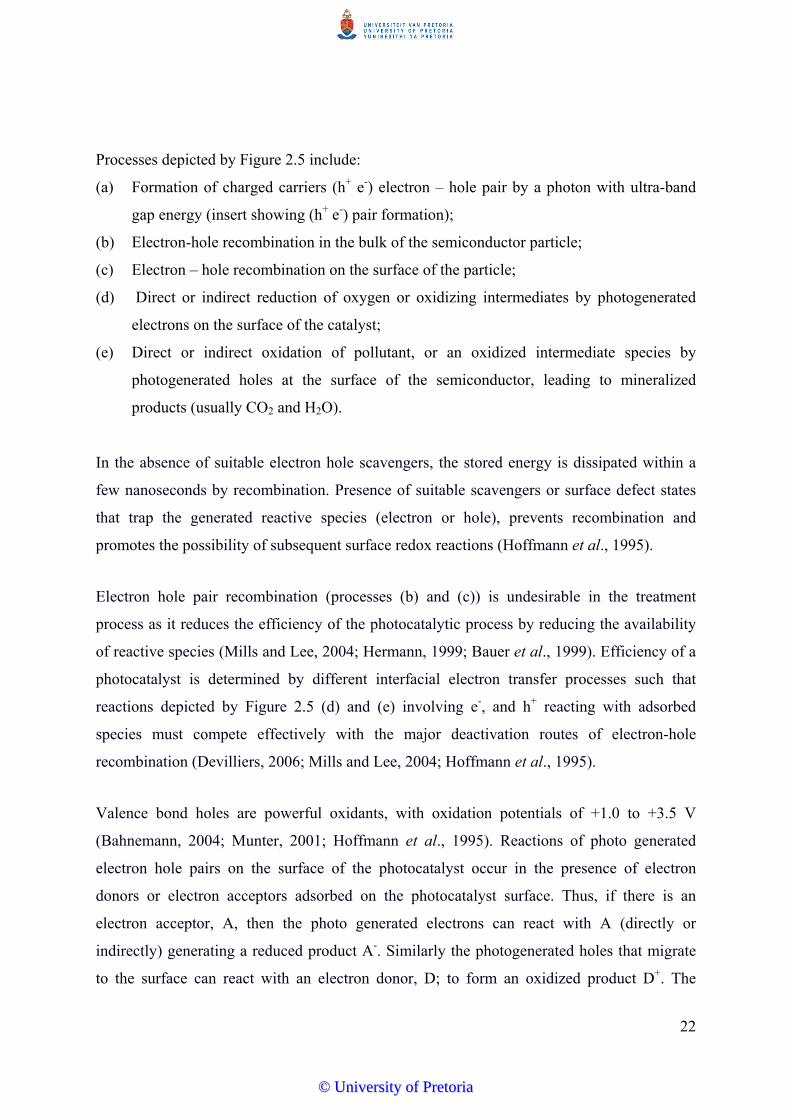
Figure 2.7 Band positions of common semiconductors used in photocatalysis and
the redox potential of the H2O/●OH and O2/HO●2 redox couples at pH =
0.................................................................................................................. 25
Figure 2.8 Basic photocatalytic DCR reactor designs: (a) side of reactor with
external illuminator; (b) side view of reactor with immersed lamp; (c)
top view of circular reactor with several lamps; and (d) annular reactor
(i.e., tubular reactor with negative illumination geometry.......................... 31
Figure 3.1 Schematics of experimental reactor setup - Configuration A and
configuration B............................................................................................ 50
Figure 3.2 X-ray diffraction pattern of anatase titanium dioxide powder.................... 62
Figure 3.3 SEM image of anatase TiO2 showing particle size distribution.................. 63
Figure 4.1 Effect of light intensity on the kinetics of geosmin degradation................. 76
Figure 5.1 Figure 5.1: Degradation Profile of phenol (30 mg/L), photocatalysis (UV
and TiO2) with catalyst concentration from 30 – 100 mg/L and a batch
with UV only as a photolytic control –(A) unaerated, (B) aerated………… 81
Figure 5.2 Percentages of phenol (10-30 mg/L) degraded by photocatalysis as a
function of time with 50 mg/LTiO2............................................................. 83
Figure 5.3 Photocatalytic degradation rates for phenol (10 mg/L) with TiO2
concentrations of 10-150 mg/L in a non-aerated system............................. 85
©© UUnniivveerrssiittyy ooff PPrreettoorriiaa
x
List of Figures continued
Figure Figure Title Page
Figure 5.4 Photocatalytic degradation rates for phenol (20 mg/L) with TiO2
concentrations of 30-150 mg/L............................................................ 86
Figure 5.5 Photocatalytic degradation rates for phenol (30 mg/L) with TiO2
concentrations of 30-100 mg/L............................................................ 87
Figure 5.6 Photolytic degradation profile of phenol (10-30 mg/L) without
aeration................................................................................................. 89
Figure 5.7 First order linear transforms of photolytic degradation profile of
phenol (10-30 mg/L) in Figure 5.6...................................................... 89
Figure 5.8 Effect of oxygen on the photolytic and photocatalytic degradation
rates of phenol (30 mg/L) with TiO2 concentrations of 30-90 mg/L...
91
Figure 5.9 Structures of catechol, resorcinol, hydroquinone and benzoquinone.. 92
Figure 5.10 Degradation profile of aromatic intermediates of phenol
photocatalysis, condition – TiO2 50 mg/L, UV 400W, air 10
mL/min................................................................................................. 93
Figure 5.11 Formation and disappearance profile of catechol from
photocatalysis of phenol (30 mg/L) with varied TiO2 concentrations
in an aerated system............................................................................. 94
Figure 5.12 Degradation profile of phenol and aromatic intermediates of phenol
photocatalysis, condition – TiO2 50 mg/L, UV 400W, air 10
mL/min................................................................................................ 95
Figure 5.13 Formation/disappearance profile of resorcinol from photocatalysis
of phenol (30 mg/L) with varied TiO2 concentrations......................... 96
Figure 5.14 Formation and disappearance profile of hydroquinone from
photocatalysis of phenol (30 mg/L) with varied TiO2 concentrations
in an aerated system........................................................................ 98
Figure 5.15 Degradation efficiency of individual phenolic compounds (30 mg/L)
photocatalysed with 50 mg/LTiO2.......................................................
100
Figure 5.16 Pollutant degradation profile of phenolic compounds in the mixture
photocatalysed with 50 ppm TiO2.......................................
102
Figure 5.17 First order linear transforms of ln Ct/Co for phenol (30 mg/L) with
TiO2 concentrations of 0-100 mg/L (non – aerated)...........................
104
©© UUnniivveerrssiittyy ooff PPrreettoorriiaa
xi
List of Figures continued
Figure 5.18 First order linear transforms of ln Ct/Co for phenol (30 mg/L) with
TiO2 concentrations of 0-100 mg/L (Aerated).........................................
104
Figure 6.1 Photolytic and photocatalytic degradation profiles of geosmin (220
ng/L) with TiO2 concentrations of 0-100 mg/L………………………...
108
Figure 6.2 Photolytic and photocatalytic degradation profiles of geosmin (440
ng/L) with TiO2 concentrations of 0-80 mg/L…………………….........
110
Figure 6.3 Degradation profile of geosmin in the presence of ionic species.
Conditions – geosmin 220 ng/L, TiO2 60 mg/L, UV 400 W, air – 10
mL/min...............................................................................................
111
Figure 6.4 Structures of geosmin and dehydration Products II and III……………. 113
Figure 6.5 Structures of some GC/MS identified intermediates from the
degradation of geosmin.....................................................................
114
Figure 6.6 Structure of geosmin and possible products from the elimination of
methane............................................................................................
115
Figure 6.7 Photocatalytic model for geosmin...................................................... 119
Figure 6.8 Photolytic model for geosmin............................................................ 120
Figure 6.9 Photocatalytic model for phenol and derivatives of phenol.................... 121
©© UUnniivveerrssiittyy ooff PPrreettoorriiaa

xii
LIST OF TABLES
Table Table Title Page
Table 2.1 Oxidation potentials of some commonly used oxidants………………… 14
Table 2.2 Primary processes and the associated timeframe for TiO2
photosensitized mineralization of organic pollutants……………………. 29
Table 2.3 Comparative features of dispersed and fixed-film reactors………........... 33
Table 2.4 List of classes of organic compounds photomineralised by TiO2
photocatalysis……………………………………………………………. 37
Table 2.5 List of some TiO2 sensitized photodegraded compounds and key
reaction conditions…………………………………………….………… 38
Table 2.6 TiO2 sensitized photosystems for the removal of toxic inorganic
compounds……………………………………………………………… 41
Table 3.1 Physicochemical properties of phenol, 2-chlorophenol, 4-chlorophenol
and 4-nitrophenol................................................................................ 48
Table 3.2 Physicochemical properties of taste and odour compounds…………….. 48
Table 3.3 Detection limits for phenolic compounds……………………………….. 53
Table 3.4 Headspace, GC and MS operating conditions for analysis of taste and
odour compounds with the Clarus 600T GC/MS system…….................. 57
Table 3.5 GC and MS operating conditions for analysis of taste and odour
compounds with Clarus 600T GC/MS system…………………………... 58
Table 3.6a Parameters for SIR scan functions in the MS for target analytes……….. 59
Table 3.6b Parameters for SIR scan functions in the MS for target analytes for
degradation studies of field samples...................................................... 59
Table 3.7 Physical and electrical properties of radiation sources............................ 64
Table 3.8 Radiation properties of light sources..................................................... 65
Table 4.1 List of environmentally significant organic compounds tentatively
identified in water samples from Rietvlei and Roodeplaat
dams.................................................................................................... 67
Table 4.2 Geosmin concentration in water samples from Rietvlei and Roodeplaat
water treatment plants………………………………………………….. 70
Table 4.3 2-MIB concentration in water samples from Rietvlei and Roodeplaat
water treatment plants....................................................................... 70
©© UUnniivveerrssiittyy ooff PPrreettoorriiaa
xiii
List of Tables continued
Table 5.1 Phenol and catalyst concentration combinations………………………. 79
Table 5.2 Phenol degradation efficiency under non-aerated batch conditions
tested at a constant initial phenol concentration of 10 mg/L…………... 85
Table 5.3 Photocatalytic/photolytic degradation rates of phenol (30 mg/L) for
aerated and non-aerated systems………………………………………. 88
Table 5.4 Photocatalytic degradation rates of phenol, 2-chlorphenol, 4-
chlorphenol and 4-nitrophenol…………………………………………. 101
Table 5.5 First order kinetic parameters for phenol (30 mg/L) degradation with
catalyst concentration of 0-150 mg/L in aerated and non-aerated
system……………………………………………………...................... 105
Table 6.1 Initial rates, rate constants, adsorption constant and photonic
efficiencies of the various systems for geosmin degradation………….. 109
Table 6.2 Impact of ionic species on degradation efficiency of geosmin………… 112
Table 6.3 GC/MS data of geosmin and some identified intermediate compounds
from photocatalytic degradation of geosmin…………………………... 114
Table 6.4 Geosmin degradation kinetics fitting the photolytic and surface
reaction model……………………………………………………......... 120
Table 6.5 Kinetics of degradation of phenolic compounds fitting the photolytic
and surface reaction model…………………………….......................... 121
©© UUnniivveerrssiittyy ooff PPrreettoorriiaa
xiv
LIST OF ABBREVIATIONS
AOP Advanced oxidation process
BET Brunauer–Emmett–Teller
BTEX Benzene, toluene, ethylbenzene and xylene
CB Conductance Band
CIS Cooled inlet system
CP Chlorophenol
CPCR Compound parabolic collecting reactor
CVD Chemical vapour deposition
DAFF Dissolved air floatation filters
DBBQ 2,5-Di-tert-butyl-1,4-benzoquinone
DCE Dichloroethane
DCM Dichloromethane
DCR Dispersed Catalyst Reactors
DDT Dichlorodiphenyltrichloroethane
DO Dissolved oxygen
DOC Dissolved organic carbon
DPB Disinfection by-product
DSSR Double skin sheet reactor
DWAF Department of Water and Forestry
DWQS Domestic water quality standards
e- Electron
Ebg Band gap energy
EDC Endocrine disrupting compound
EPA Environmental Protection Agency
FW Formula weight
GAC Granular activated carbon
GC/MS Gas chromatography/Mass spectrometry
HAAs Haloaceticacids
h+ Positive hole
h+ e- electron-hole pair
HP Hewlett Packard
©© UUnniivveerrssiittyy ooff PPrreettoorriiaa
xv
HPLC High performance liquid chromatography
hν Energy of a photon
IARC International Agency for Research on Cancer
IBMP 2-Isobutyl-3-methoxypyrazine
IPMP 2-Isopropyl-3-methoxypyrazine
MCL Maximum contaminant level
MCLG Maximum contaminant level goal
MDHP 2-methyl-2,2-dimethyl-1-[2-hydroxylmethyl]propylester
MDMP 2-methyl-1-[1,1-dimethyl]-2-methyl-3-propanediylester
MIB 2-methylisoborneol
MIT Measuring Instruments Technology
MLD Megalitres per day
NA Not available
NCD Not completely degraded
NHE Normal hydrogen electrode
NIST National Institute of Standards and Technology
NM Not mineralised
NOM Natural organic matter
NTU Nephelometric turbidity unit
PAC Powdered activated carbon
PAHs Polycyclic aromatic hydrocarbons
PDA Photo diode array
PE TMH Perkin Elmer Turbo Matrix Headspace
PFTBA Perfluorotributylamine
POP Persistant organic pollutants
PSDVB Polystyrenedivinylbenzene
PTC Parabolic trough concentrators
PTR Parabolic trough reactor
SA South Africa
SABC South African broadcasting corporation
SA DWQS South African domestic water quality standards
SC Semiconductor
SEM Scanning electron microscopy
©© UUnniivveerrssiittyy ooff PPrreettoorriiaa

xvi
SHE Standard hydrogen electrode
SIR Single ion recording
SPE Solid phase extraction
SPME Solid phase microextraction
SRB Sulphate reducing bacteria
SVOC Semi-volatile organic compound
TBT Tributyltin chloride
TBTO Bis(tributyltin) oxide
TCA 2,4,6-Trichloroanisole
TCE Trichloroethene
TDS Total dissolved solids
TFFBR Thin film fixed bed reactor
THM Tetrahalomethanes
TIC Total ion chromatogram
TOC Total organic carbon
TPA Terephthalic acid
tR Retention times
TSS Total suspended solids
UV Ultraviolet
VB Valence Band
VOC Volatile organic compound
VUV Vacuum Ultraviolet
WHO World Health Organisation
XRD x-ray diffractometry
©© UUnniivveerrssiittyy ooff PPrreettoorriiaa
1
CHAPTER ONE
INTRODUCTION
1.1 Background
Shortage of freshwater supply has been a global concern for over a decade. According to the
projection by the UN Environmental Program Report, two thirds of the world’s population
will be living under water stressed conditions by 2025 (UN Environmental Program report).
The reality is that over a third of the world’s population is water stressed. South Africa is a
semi-arid country with unpredictable rainfall pattern having an average rainfall 52% of the
global average (DWAF, 1996). Reports from sources within the Department of Water Affairs
and Forestry in South Africa indicate that the current water use practices will not be
sustainable beyond 2026 (DWAF, 1999). The problem is compounded by the increasing
demands on freshwater sources with rapid population, industrial and agricultural growth
leading to a decline in drinking water quality over the years (Jyoti and Pandit, 2001). Over
the past two to three decades, growing industrial activities have caused an increase in the
discharge of toxic organic pollutants into the environment.
With rapid population and industrial growth, there is increased pressure on fresh water
sources with a projected global water shortage. Conventional freshwater sources are failing to
meet the demand. The water industry is faced with the option of sourcing poorer quality
water to supplement freshwater sources. Available alternative sources include seawater,
industrial and municipal wastewater, eutrophic surface water (from dams), and filter
backwash water from water treatment plants and production plants. Wastewater according to
John Keys of US Bureau of Reclamation “is the last river to tap”; but to tap this river, water
treatment technologies capable of producing water of quality to meet the current stringent
conditions is required.
The available alternative sources are plagued by the presence of several undesirable
substances, some of which are highly toxic; often refractory to microorganisms and have
shown to survive conventional state-of-the-art wastewater treatment processes (Doan et al.,
2009, Alvarez et al., 2005). Other substances render the water unpalatable and therefore not
useable by consumers. The transition from availability to usability of an alternate water
©© UUnniivveerrssiittyy ooff PPrreettoorriiaa
2
source depends on the ease and effectiveness of treatment to convert water from these
alternative sources to potable quality.
To meet the UN Millennium Development Target 10 of Goal 7 which aims “to half by 2015,
the proportion of people without sustainable access to safe drinking water and basic
sanitation” (UN, 2005), alternative treatment technologies have to be developed or adopted to
handle the growing list of water pollutants in water. The search for more efficient and cleaner
technologies to tackle the ever increasing threat of future water security has led to the
advancement of some new methods of treatment. The most promising of these new methods
in the context of pollutant abatement in water are collectively referred to as advanced
oxidation processes (AOPs) (Chirwa and Bamuza-Pemu, 2010; Comninellis et al., 2008;
Stasinakis 2008; Modrzejewska et al., 2007; Ljubas, 2005). Advanced oxidation processes
are characterised by their catalytic, photochemical properties and oxidative degradation
reactions (Maciel et al., 2004).
Semiconductor photocatalysis is an environmentally friendly, advanced oxidation process
based on the generation of reactive electron hole pairs (h+ e-) by photoactivation of
semiconductor materials acting as catalysts, utilizing low energy ultraviolet (UV) light
(Simonsen et al., 2008; Mills and Lee, 2004). Photogenerated positive holes are powerful
oxidants while the negative electrons are very good reductants. Both reactive species can
either react directly with organic compounds or indirectly through the action of hydroxyl
radicals generated in-situ from reduction of oxygen on the surface of the catalyst
(Bahnemann, 2004; Munter, 2001), and the process often achieves complete mineralization of
the organic pollutants to carbon dioxide and water (Simonsen et al., 2008) thereby avoiding
the problem of unwanted by-products. This study employs semiconductor photocatalysis for
the elimination of two common classes of water pollutants.
1.2 Aims and Objectives
The major objective of the study was to investigate the potential of photocatalysis as a
treatment technology for degradation and mineralisation of recalcitrant organic pollutants in
water. To achieve this objective some specific aims set out as tasks were conducted. These
include:
©© UUnniivveerrssiittyy ooff PPrreettoorriiaa
3
Chemical characterisation of natural and anthropogenic organic pollutants in source
water at two treatment plants around Pretoria.
Evaluation of the performance of a laboratory scale treatment unit employing a chemical
free photocatalytic system for the degradation of environmentally significant levels of
geosmin and phenolic compounds to levels below detection limits.
Process optimisation and kinetic analysis of the photocatalytic degradation system taste
and odour causing compounds to obtain process parameters for laboratory photocatalytic
system.
Evaluation of the effect of ionic species on the performance of the laboratory scale
photocatalytic system during the degradation process.
Identification of the intermediates formed during the photocatalytic degradation and
determination of the fate of the formed intermediates.
Degradative pathway analysis for the two model compounds to have a better
understanding of the process.
1.3 Scope of Study
The current study investigates the feasibility of photocatalysis as a treatment technology for
the removal phenol and selected mono substituted derivatives of phenol including 2-
chlorophenol, 4-chlorophenol and nitrophenol; and geosmin (a taste and odour causing
compound) from water to levels below environmentally acceptable limits and below human
detection thresholds. Laboratory scale batch systems were employed to investigate key
aspects of photocatalytic and photolytic degradation processes. Titanium dioxide was utilised
as the preferred catalyst in its dispersed form.
Detailed quantitative study of the intermediates of phenol degradation was conducted and
formation/disappearance profiles of the major aromatic intermediates were obtained, which
gave a framework for degradative pathway analysis. For geosmin degradative pathway
analysis, a qualitative analysis of intermediates was performed and a quantitative analysis
was not performed mainly due to the very low levels of the compound(s).
©© UUnniivveerrssiittyy ooff PPrreettoorriiaa
4
1.4 Methodology
The feasibility of the photocatalytic process in treating organic pollutants commonly found in
natural waters was examined. The methodology employed to achieve the aims and objectives
of the study include:
a) A thorough literature study to evaluate a variety of advanced oxidation processes (AOPs)
for treating organic compounds in water, with a relative performance efficiency analysis
across the common technologies. Then a detailed literature survey of the photocatalytic
process to obtain a better understanding of the technical aspects of the process,
b) An analytical survey of source water of the two major treatment plants in Pretoria. Raw
water and backwash water from dissolved air flotation filters and sand/GAC filters from
Rietvlei and Roodeplaat Water Treatment Works were characterised to determine
common organic pollutants in the water. This was done in order to determine the
compounds on which to focus during the study,
c) Families of problematic organic species identified through the literature survey and the
scan of compounds (geosmin for taste and odour compounds and phenol for aromatic
compounds) were investigated further in batch reactors using titanium dioxide as the
photocatalyst,
d) Investigation of optimum reaction conditions for both compounds, including (1) the
amount of photocatalyst added to the reactor, (2) initial concentration of the pollutant, (3)
effect of aeration on pollutant removal rate, and (4) the effect of ionic species on geosmin
degradation,
e) Experiments to identify the intermediates formed during the process of photocatalytic
degradation for both geosmin and phenol and a degradative pathway analysis was
conducted, and
f) Simple kinetic analysis using first-order reaction kinetics and a particle surface analysis to
determine optimum reaction rate parameters under various pollutant concentrations.
©© UUnniivveerrssiittyy ooff PPrreettoorriiaa
5
The results were interpreted to determine the pathway of degradation and predominant
reaction mechanism during the photocatalytic process.
1.5 Organisation of Thesis
This thesis consists of the following chapters and appendices:
Chapter 1 presents an introduction to the study; it explains the motivation, main aims
and objectives and scope of the study, highlighting the importance of the research. It also
gives the organisational structure of the thesis.
Chapter 2 provides a detailed report of literature relevant to the present research, with
some technical information on the theoretical background of photocatalysis and some
examples of applications. This chapter also provides advances in photocatalytic research
and the status of the implementation of technology.
Chapter 3 presents technical details of the laboratory reaction setup, the materials used,
analytical equipment, experimental reactor-set up and reactions conditions, as well as
experimental methods, data collection and analytical methods employed during the
course of the study.
Chapter 4 presents results of the preliminary studies, including the organic composition
of the source water, a classification and discussion of the predominant organic
compounds identified. It also gives a characterisation of the titanium dioxide catalyst and
the irradiation source used for degradation studies.
Chapter 5 discusses the results of photolytic and photocatalytic degradation of phenol,
and the mono-substituted derivatives of phenol. The effects of parameters on the
degradation efficiency, the profiling of the aromatic intermediates, degradative pathway
analysis and some kinetic analysis of phenol degradation.
Chapter 6 discusses the results of photolytic and photocatalytic degradation of geosmin,
the effects of parameters on the degradation efficiency. It discusses the intermediates
©© UUnniivveerrssiittyy ooff PPrreettoorriiaa
6
produced and a detailed degradative pathway analysis and some kinetic analysis of
geosmin degradation.
Chapter 7 gives a summary of the key findings of the research and the conclusions
drawn from the findings, also included in this chapter are a few recommendations for
further studies.
A listing of all cited reference materials is included at the end of the report.
Appendices
©© UUnniivveerrssiittyy ooff PPrreettoorriiaa
7
CHAPTER TWO
LITERATURE REVIEW
2.1 Background
Improved analytical methods coupled with better understanding of the adverse effects of
organic pollutants in water have led to the enactment of more stringent drinking water
standards. The challenge that these standards place on the drinking water industry is
exacerbated by the rapidly dropping quality of source water due to pollution from agricultural
runoffs and wastewater from industrial and municipal sources. These pollutants have negative
impacts both on the ecosystems and on humans (toxicity, carcinogenic and mutagenic
properties) (Busca et al., 2008). Runoffs from agricultural land contains pesticides and
nutrients which cause imbalances in the ecosystem and may cause algal infestation waters
which leads to production of cyanobacterial toxins and taste and odour compounds (Jüttner
and Watson, 2007; Sung et al., 2005).
Another input of organic loading is the industrial and municipal wastes which introduce a
variety of chemical compounds (natural and synthetic) into the environment. Compounds
from household products for example cosmetics, personal care products and detergents, and
pharmaceutical products are often refractory to microorganisms and have shown to survive
conventional state-of-the-art wastewater treatment processes (Doan et al., 2009, Alvarez et
al., 2005). Some of these compounds inevitably find their way into surface and ground waters
used as supply sources. The majority of these compounds pose potential human and animal
health hazards as they are endocrine disrupting compounds (EDCs) (Watkinson et al., 2007),
EDCs disrupt the normal functioning of the endocrine system which regulates the immune
system, growth, development, reproduction and neuro system (Zala and Penn (2004).
Increasing levels of organic pollutants originating from anthropogenic sources such as
pesticides, aromatic compounds from industrial effluent, or pharmaceuticals; have been
detected in drinking water sources lately (Malato et al., 2009). Current drinking water
treatment technologies are inadequate to meet safety requirements with respect to this new
family of pollutants (Alvarez et al., 2005).
©© UUnniivveerrssiittyy ooff PPrreettoorriiaa

8
In addition to the anthropogenic aromatic compounds, vegetation and phytoplankton
contribute humic substances that mimic these compounds (Huang et al., 2006). Removal of
organic pollutants in water treatment has gained even greater significance with developments
establishing possible links between halogenated disinfection by-products (DBPs) and cancers
(Zhou and Smith, 2002). The need for improved pollutant removal technologies to deal with
the increasing complexity of pollutants and the strident standards placed have shifted research
efforts to finding improved alternative treatment technologies including advanced oxidation
enzymatic treatment, activated carbon adsorption and membrane separation with varying
degrees of success depending on the types and concentration of EDCs and the water matrix
(Kit Chan et al., 2012). Advanced oxidation processes especially semiconductor
photocatalysis been the subject of most active research efforts judging from the continual
increase in volume of research articles produced annually.
2.2 Geosmin and 2-MIB
Taste and odour compounds, trans-1,10-dimethyl-trans-9-decalol (geosmin) and 2-methyl-
isoborneol (MIB) (Figure 2.1), are volatile tertiary alcohols that are produced by secondary
metabolites of actinomycetes and cyanobacteria (Tran et al., 2008; Zaitlina and Watson,
2006; Sung et al., 2005 Watson et al., 2003). Geosmin and 2-MIB each exists as (+) and (-)
enantiomers, and odour outbreaks are caused by biological production of the naturally
occurring (-) enantiomers, which are about 10 times more potent than the (+) enantiomers
(Jüttner and Watson, 2007).
Figure 2.1: Structures of (a) geosmin and (b) MIB.
©© UUnniivveerrssiittyy ooff PPrreettoorriiaa
9
Geosmin and 2-MIB impart taste and odour in water thereby compromising the aesthetic
quality of the water (Peter and von Gunten, 2007). The presence of these compounds also
causes undesirable taint problems in the aquaculture industry. Geosmin is also produced by
Streptomyces and Myxobacteria and is responsible for the characteristic odour of freshly
turned earth (Cane et al., 2006) while 2-methyl-isoborneol (MIB) is produced from the blue-
green alga Oscillatoria perornata (Meepagala et al., 2005). Some soil bacteria are also
known to produce geosmin. The soil bacteria may be washed by rainfall runoff into nearby
streams where they further increase the prevalence of odour causing compounds in surface
waters. These compounds are responsible for the musty and earthy odours in drinking water
even at trace concentrations in the ng/L range. The human odour threshold is at
concentrations as low as 1.3 ng/L and 6.3 ng/L for geosmin and MIB, respectively (Young et
al., 1996; Lloyd et al., 1998).
Although there is no proven toxicity resulting from consumption of water contaminated with
geosmin and MIB, consumers judge the quality of the water primarily on the aesthetic
characteristics. Water that is not appealing in appearance, taste or odour, may result in
psychosomatic illnesses such as stomach upsets, headaches and stress (Lauderdale et al.,
2004).
Lately, a variety of physico-chemical treatment technologies such as adsorption on granular
activated carbon (GAC) or powder activated carbon (PAC) particles (Matsui, Y. et al., 2012;
Srinivasan and Sorial, 2011; Zoschke et al., 2011; Graham et al., 2000), oxidation by
ozonation (Schrader et al., 2010; Summerfelt et al., 2009) and biodegradation in biofilters
(Hoefel et al., 2009; Elhadi et al., 2004) have been employed in treating taste and odour
causing compounds. However, almost all of these technologies have been found lacking
either due to poor treatment efficiency or due to high capital and operational cost. So far,
adsorption on activated carbon has been used most widely in combination with sand media in
filters to control odour causing compounds such as geosmin. However, filtration does not
treat the contaminant as it only separates the contaminant from water with subsequent
retention on the filters. There is an additional need to backwash the filters and regenerate the
activated carbon. These processes generally dislodge all retained and trapped pollutants into
the backwash water stream which is discharged with recovery of the pollutants. At relatively
high pollutant concentrations, efficiency of adsorption drops with subsequent low
©© UUnniivveerrssiittyy ooff PPrreettoorriiaa
10
performance. As low as 69% efficiency has been reported of GAC adsorption for removal of
compounds with molecular structures similar to geosmin (Pham et al., 2012).
Due to their complex tertiary structure, both geosmin and MIB motifs (Figure 2.1) are
resistant to oxidation by ozone and other aquatic oxidants (Ho et al., 2002; 2006). They are
resistant to chlorination even at high chlorine dosages (Lalezary et al., 1986). For this reason,
the conventional physico-chemical processes have not been used successfully for treating
these compounds. Removal of geosmin and 2-methylisoborneol from drinking water has been
a matter of great interest since early 1990s especially as they are difficult to remove by
conventional water treatment methods such as coagulation-sedimentation and rapid sand
filtration (Saito et al., 1996).
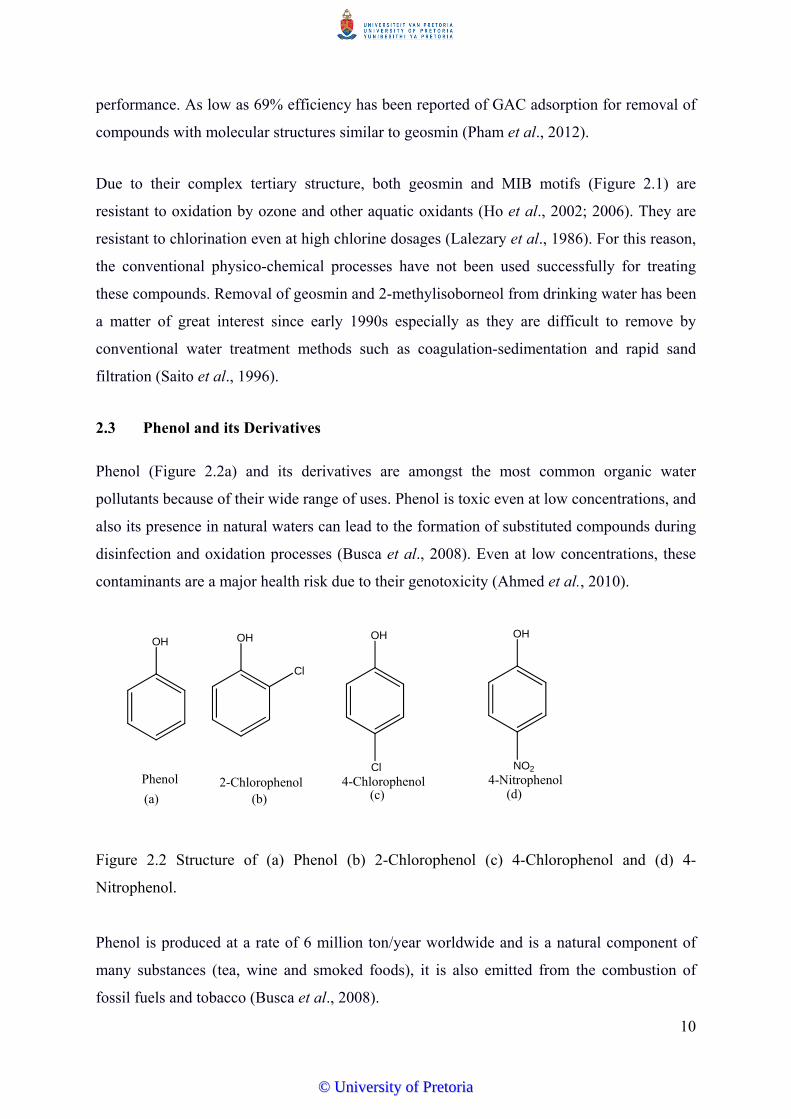
2.3 Phenol and its Derivatives
Phenol (Figure 2.2a) and its derivatives are amongst the most common organic water
pollutants because of their wide range of uses. Phenol is toxic even at low concentrations, and
also its presence in natural waters can lead to the formation of substituted compounds during
disinfection and oxidation processes (Busca et al., 2008). Even at low concentrations, these
contaminants are a major health risk due to their genotoxicity (Ahmed et al., 2010).
OH OH
Cl
OH OH
Cl NO2
2-Chlorophenol(b)
Phenol
(a)4-Chlorophenol
(c)4-Nitrophenol
(d)
Figure 5.4: Structure of (a) Phenol (b) 2-chlorophenol (c) 4-Chlorophenol and (d) 4-Nitrophenol
Figure 2.2 Structure of (a) Phenol (b) 2-Chlorophenol (c) 4-Chlorophenol and (d) 4-
Nitrophenol.
Phenol is produced at a rate of 6 million ton/year worldwide and is a natural component of
many substances (tea, wine and smoked foods), it is also emitted from the combustion of
fossil fuels and tobacco (Busca et al., 2008).
©© UUnniivveerrssiittyy ooff PPrreettoorriiaa
11
Two of phenol’s most common uses are in the production of phenolic resins, and in the
preparation of bisphenol A, which is a monomer for the production of epoxy-resins. Phenol in
its pure form is also used as a disinfectant and as an additive in the preparation of some
creams and shaving soap for its germicidal and anaesthetic properties. Phenol is a key
component in the production of several monomers for the production of nylon 6,
polyphenoxy and polysulphone polymers; polyester and polyester polyols. Medicinal uses
include use as an antiseptic and anaesthetic in veterinary medicine and its use in
pharmaceuticals as a building block for the synthesis of aspirin. Phenol is also used as a
peptizing agent in glue and as an extracting solvent in refinery and lubricant production. As a
reagent in chemical synthesis, it can be converted into a variety of organic compounds
including, xylenols, alkylphenols, aniline, and as an intermediate in the production of
surfactants, fertilizers, explosives, paints, textiles, plastic plasticizers (Busca et al., 2008)
derivatives of phenol and a host of other products.
Chlorophenols (Figure 2.2b & c) are water pollutants of moderate toxicity and are suspected
carcinogens. They originate from the natural degradation of chlorinated herbicides and
chlorination of phenolic substances during disinfection of water with chlorine. Nitrophenols
(Figure 2.2d) are water pollutants of high toxicity and they are released into the environment
from the synthesis and use of organo-phosphorous pesticides, azo dyes, plasticizers, solvents
(Lachheb et al., 2008) and some medical goods. Phenol and its derivatives (mostly the
chlorinated and nitro- derivatives) are discharged regularly into the natural and wastewater
streams from different process plants due to their wide use as raw materials in petrochemical,
chemical, and pharmaceutical industries (Barakat et al., 2005). Phenol is an intermediate
product in the oxidation of higher-molecular weight aromatic hydrocarbons.
Chlorophenols and phenols have been used as general purpose disinfectants and sometimes
are formed as degradation products of other chlorinated xenobiotics in the environment.
Biological treatment processes for the degradation of phenol and phenolic derivatives have
proved to be inefficient due to their refractory nature. Activated carbon is widely used for the
removal of phenolic pollutants from aqueous solutions, a process which does not actually
destroy the pollutants and produces contaminated spent carbon as a waste by-product (Akbal
and Onar, 2003). Due to their toxicity and genotoxicity, the degradation of these compounds
in water treatment system has become a matter of high priority (Bamuza-Pemu and Chirwa
2010a).
©© UUnniivveerrssiittyy ooff PPrreettoorriiaa

12
2.4 Water Treatment Processes
Conventional drinking water treatment processes involve aeration,
flocculation/sedimentation, filtration and disinfection. More recently, ion exchange and
adsorption have been incorporated into some water treatment trains (EPA, 1999). The
effectiveness of the conventional water treatment systems in removing volatile and semi-
volatile organic compounds is very limited (Zhou and Smith, 2002). This limitation has
spurred the search for more efficient and cleaner technologies to tackle the ever increasing
threat to future water security. This has led to the advancement of new methods and adoption
of improved methods for the removal of pollutants from water. Some promising new methods
in the context of pollutant abatement in water are collectively referred to as advanced
oxidation processes (AOPs) (Comninellis et al., 2008; Stasinakis 2008; Modrzejewska et al.,
2007; Ljubas, 2005). Recent research has demonstrated that advanced oxidation processes are
suited for the remediation of recalcitrant organic pollutants as they mineralise pollutants
completely to CO2 and H2O (Li et al., 2008; Auguglisto et al., 2006; Klán and Vavrik, 2006;
Bahnemann, 2004; von Gunten, 2003; Andreozzi et al., 2000; Zhou and Smith, 2002). The
immense interest in AOPs can be attributed to the diversity of technologies involved, the
level of success achieved by laboratory studies, and; the variety of areas of potential
application and for commercialisation. Advanced oxidation processes are characterised by
their catalytic, photochemical properties and oxidative degradation reactions (Maciel et al.,
2004).
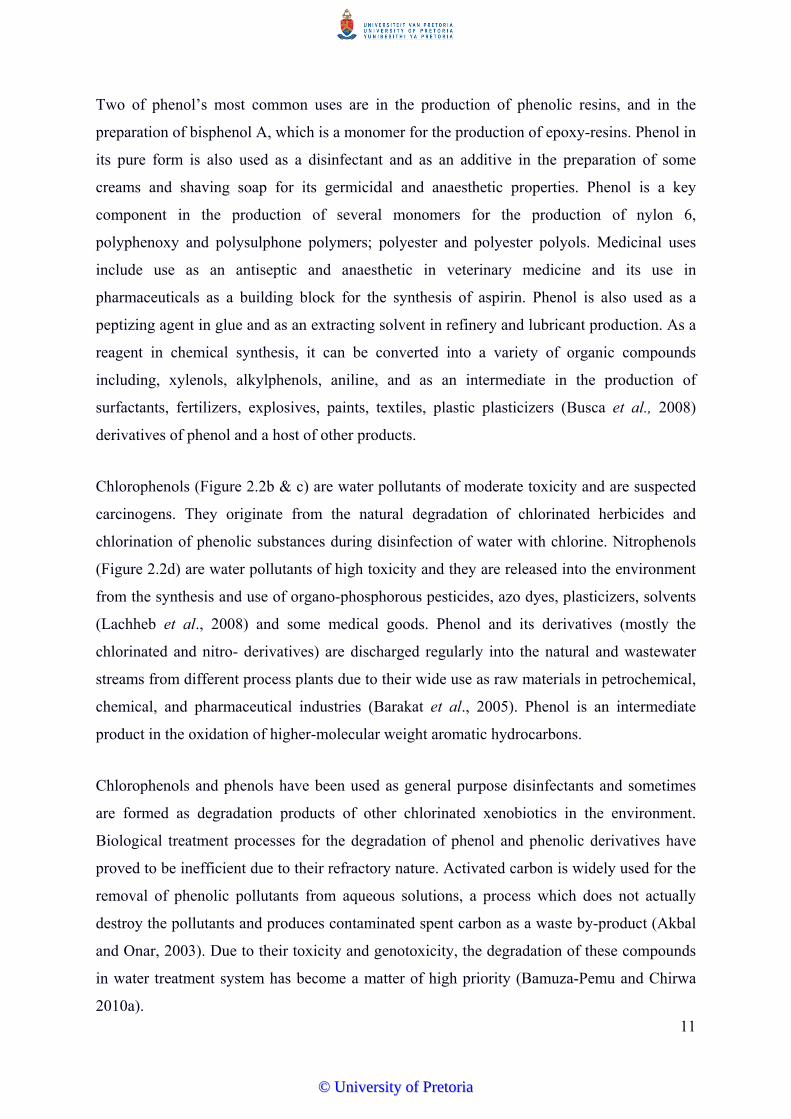
2.5 Advanced Oxidation Processes
Advanced oxidation processes encompass a wide range of methods all of which involve the
utilisation of the highly reactive hydroxyl radical for the oxidation of organic and inorganic
pollutants in water. A classification as presented in Figure 2.3 attempts to group these
processes primarily on the principles employed for hydroxyl radical generation. These classes
include: the photolytic systems (utilising only UV radiation), chemical systems,
photochemical systems (combination of UV radiation and chemical oxidants); and physical
systems (photocatalysis and cavitation).
©© UUnniivveerrssiittyy ooff PPrreettoorriiaa
13
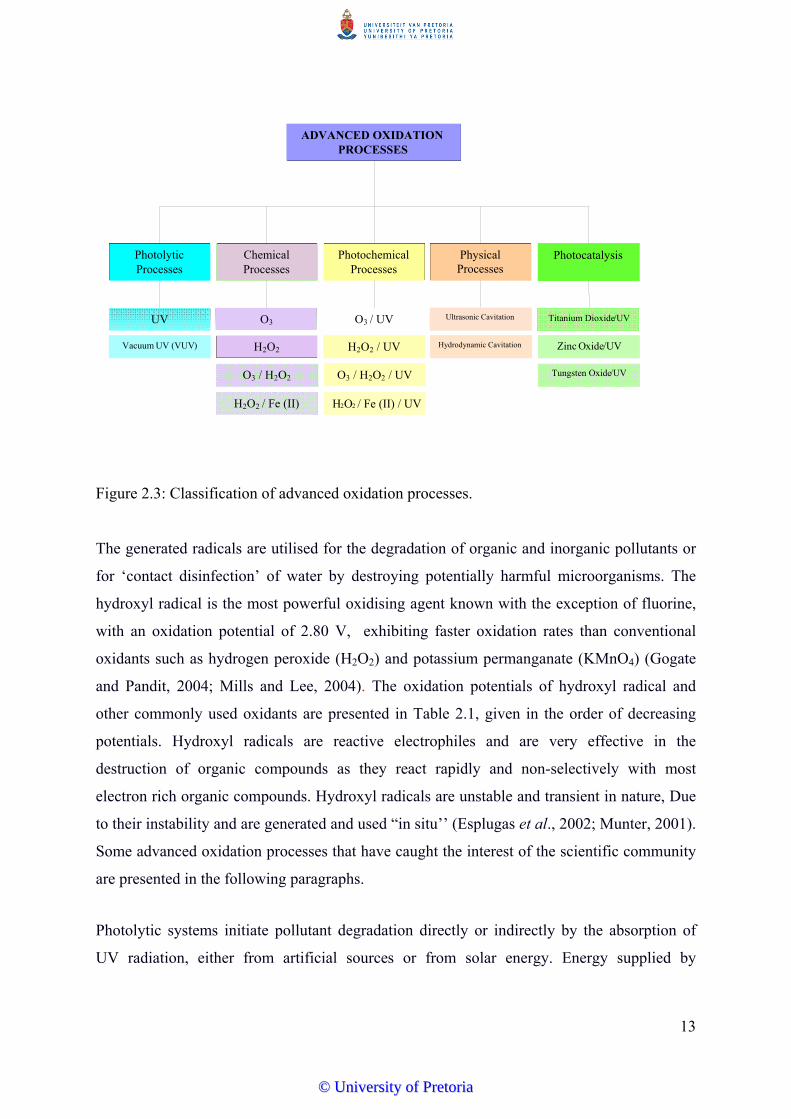
Figure 2.3: Classification of advanced oxidation processes.
The generated radicals are utilised for the degradation of organic and inorganic pollutants or
for ‘contact disinfection’ of water by destroying potentially harmful microorganisms. The
hydroxyl radical is the most powerful oxidising agent known with the exception of fluorine,
with an oxidation potential of 2.80 V, exhibiting faster oxidation rates than conventional
oxidants such as hydrogen peroxide (H2O2) and potassium permanganate (KMnO4) (Gogate
and Pandit, 2004; Mills and Lee, 2004). The oxidation potentials of hydroxyl radical and
other commonly used oxidants are presented in Table 2.1, given in the order of decreasing
potentials. Hydroxyl radicals are reactive electrophiles and are very effective in the
destruction of organic compounds as they react rapidly and non-selectively with most
electron rich organic compounds. Hydroxyl radicals are unstable and transient in nature, Due
to their instability and are generated and used “in situ’’ (Esplugas et al., 2002; Munter, 2001).
Some advanced oxidation processes that have caught the interest of the scientific community
are presented in the following paragraphs.
Photolytic systems initiate pollutant degradation directly or indirectly by the absorption of
UV radiation, either from artificial sources or from solar energy. Energy supplied by
ADVANCED OXIDATIONPROCESSES
Photolytic Processes
Chemical Processes
PhotochemicalProcesses
Physical Processes
Photocatalysis
UV O3
H2 O2
O3 / H 2 O2
H2 O 2 / Fe (II)
O3 / UV
H2O2 / UV
O3 / H2O2 / UV
H2O2 / Fe (II) / UV
Ultrasonic Cavitation
Hydrodynamic Cavitation
Titanium Dioxide/UV
Tungsten Oxide /UV
Zinc Oxide/UV V acuum UV (VUV)
©© UUnniivveerrssiittyy ooff PPrreettoorriiaa

14
absorbed photons of light enables excitation of reactant molecules to promote degradation
reactions (Parsons and Williams, 2004).
Table 2.1: Oxidation potentials of some commonly used oxidants.
Oxidant Oxidation Potential (V)
Fluorine (F2) 3.03
Hydroxyl Radical (OH) 2.80
Ozone (O3) 2.07
Hydrogen Peroxide (H2O2) 1.78
Potassium Permanganate (KMnO4) 1.68
Chlorine (Cl2) 1.36
Energy from absorbed photons in photolytic systems initiates pollutant degradation directly
or indirectly by enabling excitation of reactant molecules to promote degradation reactions
(Parsons and Williams, 2004). Direct photolysis of organic compounds by absorbed UV light
occurs with dissolved organic compounds reacting with constituents of water or by induced
self-decomposition. While indirect photolysis results in the photodegradation of organic
compounds by photosensitizers like oxygen, hydroxyl or peroxy radicals produced by the
photolysis of humic and inorganic substances (Giokas and Vlessidis, 2007). Sunlight induced
photochemical reactions are considered as the most important abiotic processes that
determine the fate of organic compounds in natural waters. Both direct and indirect photolytic
processes occur in the surface layers of aquatic systems (Giokas and Vlessidis, 2007).
Application of photolysis as a stand-alone method for recalcitrant organic pollutant
degradation has found limited application due to the lower efficiency of the photolytic
systems compared to other advanced oxidation processes. Another major drawback in the use
of photolysis for treating complex organic compounds is the production of intermediates that
could be potentially harmful; as complete mineralisation is often not achieved. Buchanan et
al., (2006) in their study of UV and VUV irradiation of natural organic matter; concluded that
UV or vacuum UV (VUV) photolysis cannot be used as stand-alone methods. Their
conclusion was based on the formation of potentially hazardous by-products due to UV
©© UUnniivveerrssiittyy ooff PPrreettoorriiaa
15
radiation. Zoh et al., (2009) in a separate study also concluded that UV photolysis alone was
not an effective system for triclosan degradation as harmful intermediates of the dioxin type
were produced. Both groups of researchers suggested the application of UV irradiation be
used as a pre-treatment to biological treatment. This suggestion was based on evidence of
appearance of breakdown compounds of lower molecular weight compounds (Buchanan,
2004).
Despite these short comings of the photolytic systems, the use of UV radiation for contact
disinfection is a trend that is gaining popularity especially in wastewater treatment industry as
it makes an excellent disinfectant especially in addition to chlorine disinfection. This has
been incorporated into the water treatment trains in some water treatment plants. The
Roodeplaat Water Treatment Plant, a 60 MGD plant has UV disinfection incorporated
between two chlorination stages as additional disinfection and for the removal of some
organics in water (Roodeplat Plant, 2007).
Ozone is a very reactive gas that is sparingly soluble in water (Zhou and Smith, 2002; Shin et
al., 1999). Ozonation is considered a promising alternative to chlorine disinfection. Its
mechanism of pollutant decontamination in water treatment involves direct reaction between
ozone and the dissolved organic species; by reaction between generated hydroxyl radicals and
the dissolved pollutants or by a combination of both (von Gunten, 2003, Shin et al., 1999;
Bühler et al., 1984; Staehelin et al., 1984; and Nadezhdin 1988). Direct reaction between
ozone and organic compound is selective; occurring at sites with high electron density.
Ozonation systems would therefore be more effective for the degradation of highly
unsaturated compounds with sites of high electron density, such as alkenes, alkynes and
amines. However, organic compounds such as aliphatic carbon chains, amides, and nitroso
compounds are not effectively oxidized by ozone. Oxidation of ozone-resistant compounds
can be improved by irradiation of the system with UV or addition of hydrogen peroxide,
which enhances OH production by accelerating ozone decomposition (Rosal et al., 2009;
Lee et al., 2007; Beltrán et al., 2002).
Major drawbacks with ozone as an oxidant include its low solubility in water, cost of
generation of ozone in sufficient quantities for use as an oxidant for the complete degradation
of organic compounds; mass transfer limitations and the potential hazards due to the
possibility of conversion of bromide ions in water to bromate (Michalski, 2003; Zhou and
©© UUnniivveerrssiittyy ooff PPrreettoorriiaa
16
Smith, 2002). The presence of bromate ions in water is as undesirable as the other
disinfectant bye-products (DBPs), tetrahalomethanes (THMs) and haloaceticacids (HAAs),
especially as bromate ions are not degraded by the biological filtration process (von Gunten,
2003). International Agency for Research on Cancer (IARC) classified bromate in group B-2
(as a “probable human carcinogen”) and established a drinking water maximum contaminant
level goal (MCLG) of zero; and MCL of 10 µg/L for bromate in drinking water (Michalski,
2003).
Engineering solutions to improve the mass transfer rates would further enhance ozone’s
effectiveness as an oxidant (von Gunten, 2003, Shin et al., 1999). Proposals to enhance the
potential viability of the system include the integration of ozonation and a biological (post
ozonation) system (Contreras et al., 2003). Research into the degradation of organic
compounds by ozone is a very active field and the ozonation of several organic compounds
has been studied with rate constants of over 500 compounds available in the literature (von
Gunten, 2003). Ozonation is one advanced oxidation method that has been widely applied in
water treatment or pre-treatment systems, and as at 2002; over 4000 ozonation plants were
already in operation globally (Zhou and Smith, 2002).
Hydrogen peroxide though a moderately strong oxidant; has limited application on its own as
an oxidant for the degradation of complex organic compounds. Though in the H2O2 process
there is ready availability of the oxidant specie in solution, its use alone is not effective due to
kinetic limitations at reasonable peroxide concentrations. On the other hand, aqueous
hydrogen peroxide decomposes over heterogeneous catalysts including metals (i.e., Fe, Cu,
Pt, Ti, and Ni) and metal oxides immobilized on various support materials such as sand,
silica, zeolites, and alumina (Kitis and Kaplan, 2007). Improvement of the oxidative capacity
of hydrogen peroxide can be achieved by combining hydrogen peroxide with ozone or with
UV radiation or some transition metal salts. These hybrid chemical systems exhibit better
oxidative properties due to the decomposition of hydrogen peroxide to release hydroxyl
radicals.
The ozone/hydrogen peroxide system generates hydroxyl radicals by a radical chain
mechanism resulting from interaction between ozone and hydrogen peroxide. The peroxone
system is much more efficient than using either ozone or hydrogen peroxide alone for the
removal of organic compounds from water, with better chances of complete mineralisation of
©© UUnniivveerrssiittyy ooff PPrreettoorriiaa
17
both target pollutant and degradation intermediates formed in solution (Rosa et al., 2009).
The efficiency of the peroxone system can be further improved by photolysis of peroxone by
incorporation of UV radiation source. The irradiation of O3/H2O2 by UV from solar light or
artificial light accelerates the decomposition of both ozone and hydrogen peroxide. The
synergic effects of ozone, hydrogen peroxide and UV irradiation makes the photo peroxone
system a very powerful method that allows fast and complete mineralization of pollutants. It
is considered to be the most effective treatment for highly polluted effluents (Esplugas et al.,
2002; Munter, 2001).
Fenton reagent is a catalytic oxidative mixture that contains an oxidant (usually hydrogen
peroxide) and a catalyst (a metal salt or oxide, usually ferrous salts) and the process is
increasingly used in the treatment of organics in water and soil. Decomposition of hydrogen
peroxide by Fe2+ ions in solution spontaneously produces extremely reactive and non-
selective hydroxyl radicals (Raj et al., 2005; Wadley and Waite, 2004; Munter, 2001). Fenton
process is often modified by the use of ferric ion, which acts as a catalyst in the
decomposition of H2O2 into H2O and O2; and its use could prevent accumulation of Fe (II)
ions in the reaction vessel. Fe (II) in this reagent can be replaced by other metal ions and their
complexes in the lower oxidation states. These metal ions have the oxidative features of the
Fenton reagent and are collectively called Fenton-like reagents. They include Cu(I), Cr(II),
CO(II) and Ti(III), although their application is limited due to the relative toxicity of some of
these metal ions (Wadley and Waite, 2004).
The main advantages of the Fenton include: (i) the relative very low cost of the key reagents
(hydrogen peroxide and iron salts). Iron is highly abundant and non-toxic and dilute solution
of hydrogen peroxide is easy to handle and environmentally friendly (Momani et al; 2004,
Wadley and Waite, 2004); and (ii) the relative simplicity of the process, requiring neither
special reagents nor apparatus (Andreozzi et al., 1999). The use of Fenton system in water
treatment is limited by its narrow pH range of efficient application (pH 2-4 best at 2.8);
which is outside the pH range of natural water. There is the tendency of ferric hydroxide
precipitation at pH > 3, this can be controlled by the addition of some organic ligands to
complex Fe(III) to enable the process to be carried out at higher pH values (Wadley and
Waite, 2004 and references therein). As discussed in the peroxone system, efficiency of the
Fenton process is improved by irradiation with UV light. Photolysis of the Fenton system
leads to the formation of additional hydroxyl radicals and recycling of ferrous catalyst by the
©© UUnniivveerrssiittyy ooff PPrreettoorriiaa
18
reduction of Fe(II). The increased efficiency of this process is mainly attributed to the photo
reduction of ferric ion (Momani et al., 2004).
With the emergence of the green revolution and the collective consciousness of pollutant
abatement with reduced impact; research in advanced oxidation is tending towards methods
that involve the generation of the hydroxyl radicals without the addition of chemical reagents.
These methods are the physical methods that include cavitation and photocatalysis.
The use of cavitation in water and wastewater treatment is a concept that is relatively new
and still under investigation. Cavitation is the formation, growth and implosion of
microbubbles or gaseous cavities within a liquid also called “nucleation of bubbles” (Dupree
et al., 1998). Cavitation is accompanied by adiabatic heating of the vapour phase inside the
bubbles resulting in very high local temperatures and pressures in millions of such locations
within the reactor. The effective local temperature and pressure at these transient “hot spots”
in water may exceed 5000K and 50 atm, respectively (Hassoon et al., 2004; Chen et al.,
2006). The violent collapse of cavities results in the formation of reactive hydrogen atoms
and hydroxyl radicals, which combine to form hydrogen peroxide to some extent and are
responsible for promoting oxidation reactions in water (Mason and Pétrier, 2004; Gogate et
al., 2003; Findik et al., 2006). Cavitation can also lead to cellular damage in microorganisms
(Jyoti and Pandit; 2001). Cavitationally induced metal corrosion may be a major factor that
would limit the wide application of cavitation for water treatment, as it presents an
engineering challenge during reactor design (Chen et al., 2006). Cavitation in a liquid can be
brought about by the application of ultrasonic waves or by hydrodynamic means.
Ultrasonically induced cavitation also called acoustic cavitation is the formation, growth, and
collapse of gaseous or vaporous bubbles under the influence of ultrasound (Liang et al.,
2006). High frequency sound waves, in the range of 16 kHz-100 MHz are often required to
bring about cavitational inception. Alternate compression and rarefaction cycles of sound
waves result in generation of the bubble cavity, bubble growth, and finally bubble collapse
phases releasing large amounts of local energy. The oxidation of contaminants by acoustic
cavitation is thought to progress via free radical attack and pyrolysis mechanisms (Gogate
and Pandit, 2004; and references therein). During acoustic cavitation pyrolysis of water
produces H and OH and in most cases, the reaction pathways observed for ultrasonic-
©© UUnniivveerrssiittyy ooff PPrreettoorriiaa
19
induced degradation of dissolved organic compounds in aqueous media involve hydroxyl
radical oxidation, pyrolysis and supercritical oxidation (Song and O’shea, 2007).
Bubble creation and collapse in hydrodynamic cavitation is brought about by hydraulic
devices. In such systems cavitation is generated due to pressure variations in a flowing liquid
caused by changes in the geometry of the flow system (Gogate and Pandit, 2004; Jyoti and
Pandit, 2001). Pressure variations are created by the passage of the liquid through a
constriction such as valves and orifice plates. Intensity of cavitation generated by hydraulic
devices is lower than those from acoustic cavitation. On the other hand hydrodynamic
cavitation is believed to have higher efficiency and cavitational yields compared to acoustic
cavitation (Gogate and Pandit, 2001).
2.6 Semiconductor Photocatalysis
While investigating the photoelectrolysis of water, the discovery by Fujishima and Honda in
1972 of the photocatalytic splitting of water on n-type rutile titanium dioxide electrodes
opened the doors to numerous possibilities that the field of photocatalysis presents
(Hashimoto et al., 2005; Zhao and Yang, 2003; Linsebigler et al., 1995). In recent years,
research efforts in photocatalysis have been focused towards a better understanding of the
underlying principles of oxidative degradation of organic pollutants in aqueous phase. Some
areas that need better understanding include photodegradation pathway, as well as the
identification of intermediates produced. Semiconductor photocatalysis for pollutant
abatement in water and air has been the focus of immense research in the last two or three
decades because it offers a unique advantage over alternative treatment methods as it presents
a ‘green’ treatment approach, with the possibility of mineralisation, i.e., complete
mineralisation of toxic organic pollutants into H2O and CO2 using photonic energy (Ray et
al., 2009, Herrmann, 2005, Zhao and Yang, 2003). However, degradation of organic
compounds containing heteroatoms produces mineral acids of the heteroatom in the organic
pollutant.
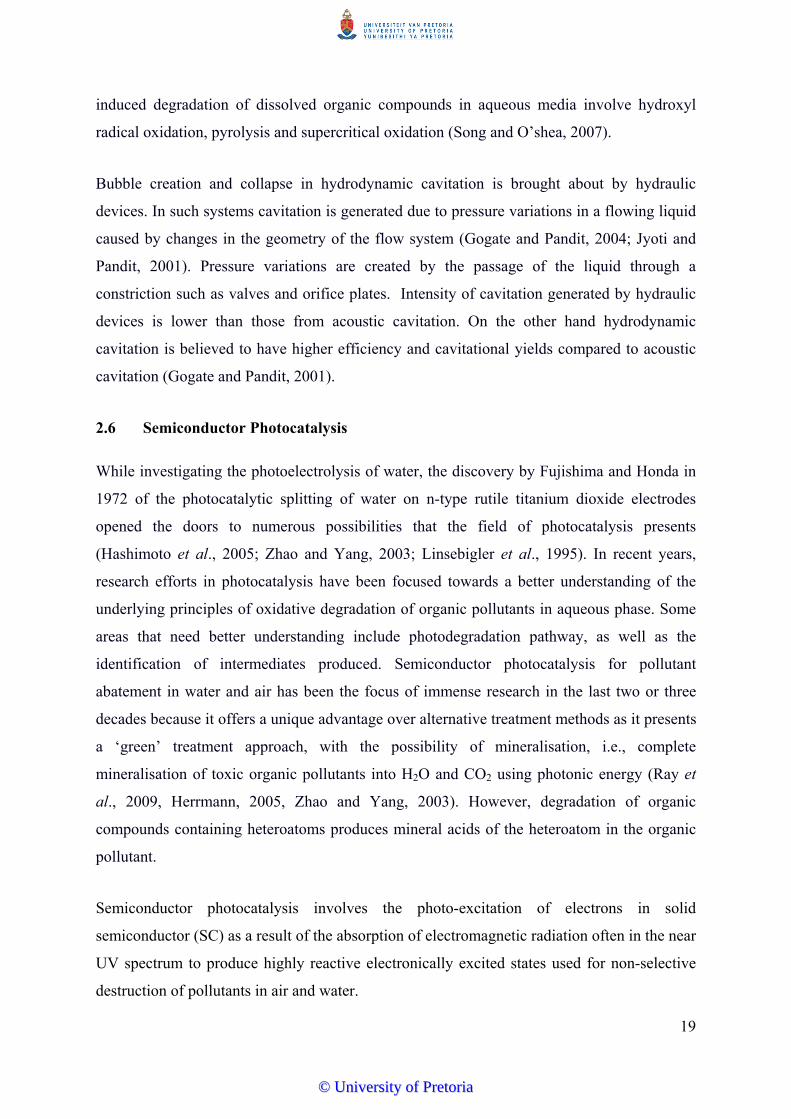
Semiconductor photocatalysis involves the photo-excitation of electrons in solid
semiconductor (SC) as a result of the absorption of electromagnetic radiation often in the near
UV spectrum to produce highly reactive electronically excited states used for non-selective
destruction of pollutants in air and water.
©© UUnniivveerrssiittyy ooff PPrreettoorriiaa

20
2.6.1 Photoelectronic processes on semiconductor surface
Solid materials contain a very large number of atoms in constant interaction. Corresponding
energy levels are so close together that they form energy bands with each band. At the atomic
levels electrons fill the energy levels from the lowest energy level upward. The highest
energy band containing electrons is the valence band (VB) and the next band immediately
higher in energy than the VB is the conduction band (CB). The conduction band is the lowest
unoccupied energy level that is devoid of electrons.
Semiconductor materials possess a region that is void of energy bands, thereby creating an
energy space between the VB and the CB. This energy difference between the VB and the
CB is called the bandgap energy (Ebg) (Kondarides, 2005, Linsebiglier et al., 1995). In
semiconductor materials, unlike insulators (with much wider bandgaps); the bandgap is small
enough (usually less than 4 eV) such that it can be bridged by the application of external
stimuli such as heat or light. Absorption of a photon (hv) of ultra-bandgap energy results in
the promotion of an electron, e-, from the valence band into the conduction band with the
generation of an electron deficient positive hole (h+), in the valence band thus forming an
electron-hole pair (h+ e-) (Kondarides, 2005) (Bahnemann, 2004; Mills and Lee 2004, Sumita
et al., 2001). The photoexcitation process and electron hole pair formation is depicted by the
band diagram in Figure 2.4.
UV (λ ≤ 400)
Ebg
h+
e-,
Valence band
Conduction band
Semiconductor particle
Figure 2.4: Schematic of electron-hole pair formation over a semiconductor particle.
(≥400nm)
©© UUnniivveerrssiittyy ooff PPrreettoorriiaa
21
The fate of photoelectronically excited conduction band electrons and valence band holes
depends on the de-excitation electronic pathway followed by the particular species. These
pathways include:
Recombination either at the surface, or in the bulk of the semiconductor material and
dissipation of the input energy to liberate heat (Δ);
Entrapment into metastable surface states; or
Migration separately to the surface of the semiconductor material to react directly or
indirectly with electron donors and electron acceptors adsorbed on the semiconductor
surface, or within the surrounding electrical double layer of the charged particles.
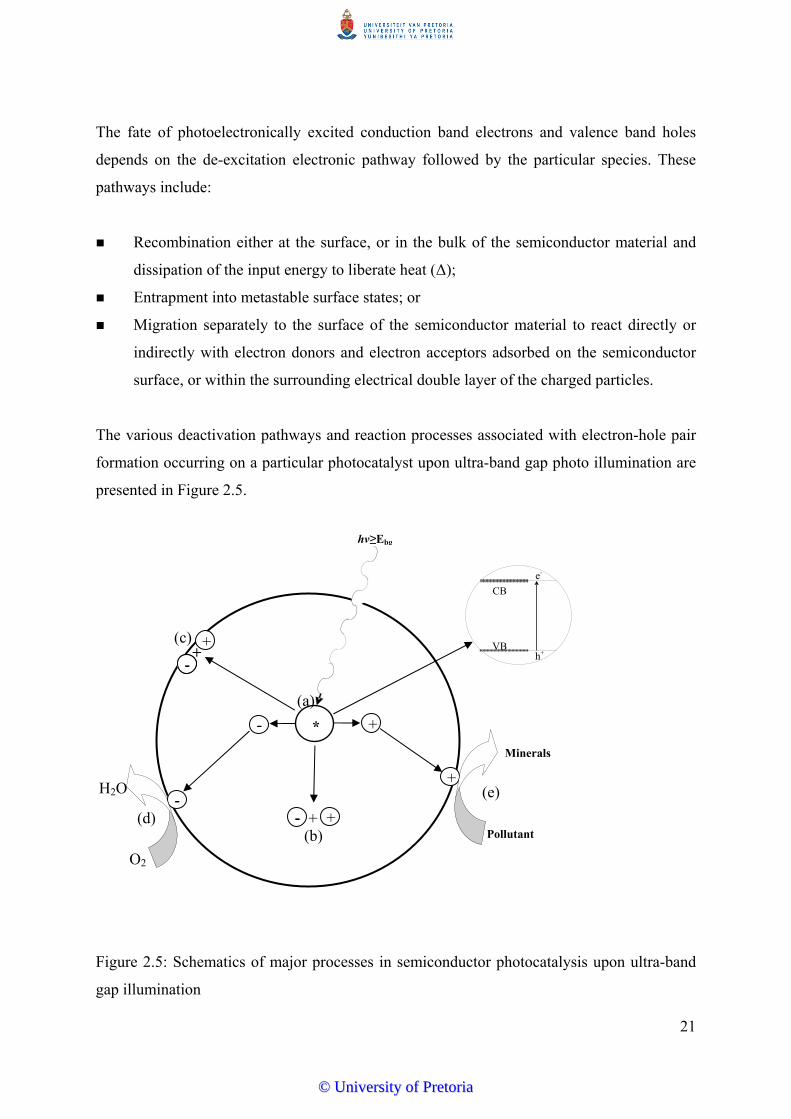
The various deactivation pathways and reaction processes associated with electron-hole pair
formation occurring on a particular photocatalyst upon ultra-band gap photo illumination are
presented in Figure 2.5.
Figure 2.5: Schematics of major processes in semiconductor photocatalysis upon ultra-band
gap illumination
* +- -
- -
+
- - + +
- -
+ +
- - h+
e-
VB
CB
Pollutant
Minerals
hv≥Ebg
(c)
(a)
(b)
(e)
(d)
H2O
O2
©© UUnniivveerrssiittyy ooff PPrreettoorriiaa
22
Processes depicted by Figure 2.5 include:
(a) Formation of charged carriers (h+ e-) electron – hole pair by a photon with ultra-band
gap energy (insert showing (h+ e-) pair formation);
(b) Electron-hole recombination in the bulk of the semiconductor particle;
(c) Electron – hole recombination on the surface of the particle;
(d) Direct or indirect reduction of oxygen or oxidizing intermediates by photogenerated
electrons on the surface of the catalyst;
(e) Direct or indirect oxidation of pollutant, or an oxidized intermediate species by
photogenerated holes at the surface of the semiconductor, leading to mineralized
products (usually CO2 and H2O).
In the absence of suitable electron hole scavengers, the stored energy is dissipated within a
few nanoseconds by recombination. Presence of suitable scavengers or surface defect states
that trap the generated reactive species (electron or hole), prevents recombination and
promotes the possibility of subsequent surface redox reactions (Hoffmann et al., 1995).
Electron hole pair recombination (processes (b) and (c)) is undesirable in the treatment
process as it reduces the efficiency of the photocatalytic process by reducing the availability
of reactive species (Mills and Lee, 2004; Hermann, 1999; Bauer et al., 1999). Efficiency of a
photocatalyst is determined by different interfacial electron transfer processes such that
reactions depicted by Figure 2.5 (d) and (e) involving e-, and h+ reacting with adsorbed
species must compete effectively with the major deactivation routes of electron-hole
recombination (Devilliers, 2006; Mills and Lee, 2004; Hoffmann et al., 1995).
Valence bond holes are powerful oxidants, with oxidation potentials of +1.0 to +3.5 V
(Bahnemann, 2004; Munter, 2001; Hoffmann et al., 1995). Reactions of photo generated
electron hole pairs on the surface of the photocatalyst occur in the presence of electron
donors or electron acceptors adsorbed on the photocatalyst surface. Thus, if there is an
electron acceptor, A, then the photo generated electrons can react with A (directly or
indirectly) generating a reduced product A-. Similarly the photogenerated holes that migrate
to the surface can react with an electron donor, D; to form an oxidized product D+. The
©© UUnniivveerrssiittyy ooff PPrreettoorriiaa

23
oxidation and reduction reactions on the surface are summarized in Equation 2.1 and
illustrated in Figure 2.6.
DA D A -)(otr semiconduc bgEhv (2.1)
where: A = electron acceptor, A = reduced product, D = electron donor and D+ = oxidised
product.
hv≥ Ebg
CB
VB
Δ
SC
+
-
E
lect
ron
En
ergy
D
D+
A-
A
Solution
hv≥ Ebg
CB
VB
Δ
SC
+
-
E
lect
ron
En
ergy
D
A-
A
Figure 2.6: Schematic illustration of the energetics of semiconductor photocatalysis.
In water purification, the electron acceptor (A) is usually oxygen in aerated systems, and the
electron donor (D) is the pollutant. The overall process is the photocatalytic oxidation of the
pollutant by dissolved oxygen as represented by Equation 2.2:
Organic pollutant + O2 )(tor semiconduc bgE hv CO2 + H2O + Mineral acids (2.2)
The presence of an external electron acceptor in a photocatalytic system leads to
improvement of the system by reducing the available conduction band electrons, thereby
reducing the possibility of electron–hole recombination; increasing the concentration of
©© UUnniivveerrssiittyy ooff PPrreettoorriiaa

24
reactive species in solution (hydroxyl radicals) and other oxidising species in solution
(Ahmed et al., 2010)
2.7 Semiconductor Photocatalysts
The search for the perfect semiconductor material for photocatalysis has been a major focus
in the field of photocatalysis. Various metal oxides including titanium dioxide (TiO2), zinc
oxide (ZnO), molybdenum trioxide (MoO3), ceric dioxide (CeO2), zirconium dioxide (ZrO2),
tungsten trioxide (WO3), ferric oxide (Fe2O3), stannic dioxide (SnO2); and metal
chalcogenides including zinc sulphide (ZnS), cadmium sulphide (CdS), cadmium selenide
(CdSe), tungsten disulphide (WS2) and molybdenum disulphide (MoS2) have been tested and
used as photocatalysts (Hoffmann et al., 1995; Gogate and Pandit 2004; Devilliers, 2006).
Suitable photocatalyst must be:
Chemically and biologically inert;
Easy to produce, and use; and
Photostable.
Sensitization of a catalyst to drive the reaction in Equation 2.2 is only possible for
semiconductors with redox potentials of the photogenerated valence band hole that are
sufficiently positive to generate absorbed OH radicals, which in turn can oxidize organic
pollutants. In addition, the redox potential of the photogenerated conductance band electrons
must be sufficiently negative to reduce absorbed oxygen to superoxide (Mills et al., 1993).
No semiconductor available exhibits all of the above requirements. However, of all the
semiconductors tested in photocatalysis, titanium dioxide (TiO2) has proven to be the most
suitable for environmental purposes. Figure 2.7 shows some of the semiconductors that have
been employed for photocatalytic reactions in water and their associated band gap energies in
eV.
©© UUnniivveerrssiittyy ooff PPrreettoorriiaa
25
V vs NHE
CdS
CdSe
ZnO
ZnS
CdTe
SrTiO3
TiO2
WO3
E(O2/HO2)
3.6eV
0
E(H2O/OH·)
2.4eV
3.2eV
1.4eV
1.7eV
3.2eV
3.2eV
2.8eV
-1 -2 +1 +3 +2
Figure 2.7: Band positions of common semiconductors used in photocatalysis and the redox
potential of the H2O/●OH and O2/HO●2 redox couples at pH = 0 (Mills et al., 1993).
TiO2 has suitable bandgap energy; is biologically and chemically inert; is stable with respect
to photocorrosion and chemical corrosion; nontoxic, non-carcinogenic; insoluble under most
conditions and it is inexpensive. TiO2 does not present any significant fire hazards and
environmental risks. It has been widely reported to give the best catalytic performances and
degradation efficiencies especially in the anatase form (Malato et al., 2007; Hashmimoto et
al., 2005; Mills and Lee, 2004; Gogate and Pandit, 2004; Andreozzi et al., 1999, Mills et al.,
1993). Due to the above conditions TiO2 has become the semiconductor material of choice
for environmental photocatalytic processes.
Metal sulphide semiconductors are unsuitable photocatalysts as they undergo photoanodic
corrosion. The iron oxide polymorphs are also not suitable semiconductors since they readily
undergo photocathodic corrosion, even though they have nominally high bandgap energies
and are cheap (Hoffmann et al., 1995).
©© UUnniivveerrssiittyy ooff PPrreettoorriiaa

26
2.7.1 Titanium dioxide (TiO2) catalysts
Titanium dioxide exists in three crystalline forms, namely anatase, rutile and brookite, but
only the anatase and rutile forms are reported to exhibit efficient photocatalytic activities with
the anatase form being more efficient. The anatase form is also the easiest to produce and has
therefore become the photocatalyst of choice for photocatalytic purification of water.
The threshold wavelength of radiation depends on the band gap energy. TiO2 has large band
gap energy of 3.25-3.05 eV (anatase 3.25 eV and rutile 3.05 eV). It absorbs UV light in the
range of 380-405 nm, which represents a small fraction of the solar spectrum (approximately
6%). The energy input from the electromagnetic waves in this region is enough to drive the
photocatalytic process (Mills and Lee, 2004). The oxidation potential of the photogenerated
holes in the valence band of anatase attains a value of +2.9 eV vs Standard Hydrogen
Electrode (SHE)/pH 0), which is sufficient for the complete oxidative decomposition of most
of the organic molecules to carbon dioxide and water (Kluson et al., 2005).
Some highly efficient commercial forms of titanium dioxide are now available; the most
commonly used of these is the P25 Degussa TiO2, a non-porous 70:30% anatase to rutile
mixture with a specific Brunauer–Emmett–Teller surface area (BET) of 55 15 m2/g and
crystalline sizes of 30 nm in 0.1 μm diameter aggregates (Hoffmann et al., 1995; Doll and
Frimmel, 2005). Hombikat UV100 is another commercially available form of TiO2 frequently
used in photocatalytic degradation studies (Doll and Frimmel, 2005).
2.7.2 Semiconductor surface modification
It is has been established that morphological and structural characteristics of a semiconductor
material strongly affect the efficiency of its photocatalytic activity. The properties of a
particular semiconductor can be altered to overcome the limitations of its use for
photocatalytic activity and improve its performance. Such property alterations usually
involve some form of modification of the catalyst surface. Choice of modifications depends
on the expected benefit(s) which can arise from:
Bandgap reduction increases the wavelength range of the semiconductor and extends it
into the visible region of the spectrum for the beneficial use of visible light especially
solar power.
©© UUnniivveerrssiittyy ooff PPrreettoorriiaa
27
The inhibition of electron hole pair recombination by increasing the charge separation
(charge carrier trapping) and thereby increasing the efficiency of the system, and
Changing the selectivity or yield of a particular product (Linsebigler et al., 1995).
Modification strategies of semiconductor surface for enhanced performance include the
addition to the catalyst of noble/rare earth metals in a process called metal ion doping or
catalyst doping, surface sensitisation with chemisorption or physiosorption of dyes or by
coupling with other semiconductor materials to obtain a composite (coupled) semiconductor.
Another method employed to increase the photoefficiency of semiconductors is by the
addition of inorganic co-adsorbents to the photocatalyst, such as activated carbon, silica,
alumina, zeolites, clays (Matos et al., 2007)
2.7.3 Major reactions during photocatalysis in water
The major reactions involved in the photomineralisation of pollutants by photosensitized
TiO2 in aqueous media are presented in Equations 2.3 to 2.9:
TiO2 + hv TiO2 (e
CB + h+VB) (2.3)
TiO2(h+
VB) + H2Oad TiO2 + OHad + H+ (2.4)
TiO2(h+
VB) + OH TiO2 + OHad (2.5)
TiO2 (e
CB) + O2 TiO2 + O2 (2.6)
O2 + H+ HO2
(2.7)
TiO2(h+
VB) + R-H TiO2 + oxidized products. (2.8) OH + R-H oxidized products. (2.9)
In the photomineralisation of organic pollutants sensitized by TiO2 as represented by
Equation 2.2, the photogenerated electrons reduce oxygen to water (Equation 2.6), and the
photogenerated holes mineralize the pollutant (Equation 2.8). The mineralization process is
believed to involve the initial oxidation of surface hydroxyl groups (>TiIVOH) on the TiO2 to
hydroxyl radicals (>TiIV OH+), which oxidizes the pollutant and any intermediate(s). The
final product usually is the mineral form of the pollutant, typically carbon dioxide and water.
However, if there are heteroatoms present, then the mineral acid of the heteroatom is formed.
Other intermediate species formed include TiIII species (TiIIIOH) formed from the trapping of
the photogenerated electrons by surface sites (>TiIVOH). TiIIIOH reacts with dissolved
©© UUnniivveerrssiittyy ooff PPrreettoorriiaa
28
oxygen to form superoxide, O2¯, which can be further reduced to hydrogen peroxide (H2O2).
Hydrogen peroxide is also a possible source of hydroxyl radicals, which could be partly
responsible for some degree of the mineralization in reaction represented in Equation 2.2.
Primary processes and their associated characteristic time frames are presented in Table 2.2.
The dynamic equilibrium of Equation 2.12 represents a reversible trapping of a conduction
band electron in a shallow trap below the conduction band edge, thus a finite probability of
etr- transfer back into the conduction band at room temperature exists. From Equations 2.9-
2.16, two critical processes determine the overall quantum efficiency for interfacial charge
transfer. These processes are the competition between charge carrier trapping (Equations
2.10-2.12) and recombination (Equations 2.14 and 2.15) – picoseconds to nanoseconds. This
is followed by the competition between trapped carrier recombination and interfacial charge
transfer – microseconds to milliseconds. An increase in either the recombination lifetime of
charger carriers or the interfacial electron transfer rate constant is expected to result in higher
quantum efficiency of the steady state photocatalysis (Hoffmann et al., 1995).
©© UUnniivveerrssiittyy ooff PPrreettoorriiaa
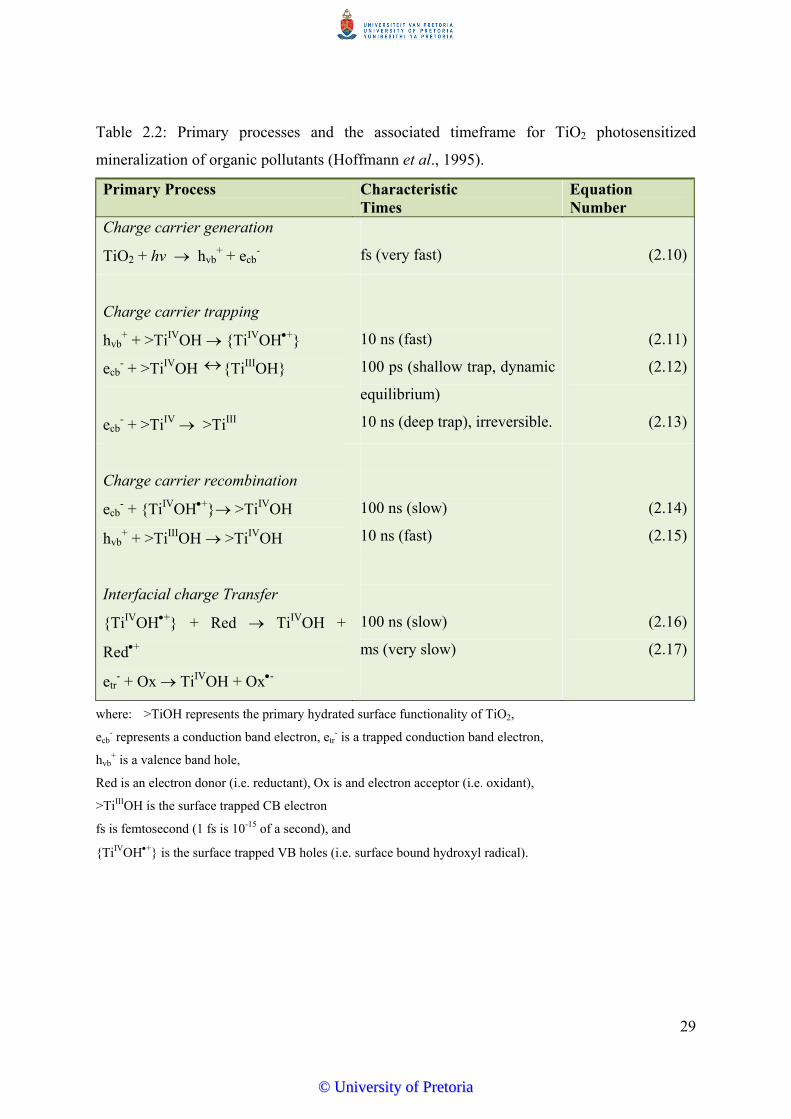
29
Table 2.2: Primary processes and the associated timeframe for TiO2 photosensitized
mineralization of organic pollutants (Hoffmann et al., 1995).
Primary Process Characteristic Times
Equation Number
Charge carrier generation
TiO2 + hv hvb+ + ecb
-
fs (very fast)
(2.10)
Charge carrier trapping
hvb+ + >TiIVOH {TiIVOH+}
ecb- + >TiIVOH {TiIIIOH}
ecb- + >TiIV >TiIII
10 ns (fast)
100 ps (shallow trap, dynamic
equilibrium)
10 ns (deep trap), irreversible.
(2.11)
(2.12)
(2.13)
Charge carrier recombination
ecb- + {TiIVOH+} >TiIVOH
hvb+ + >TiIIIOH >TiIVOH
100 ns (slow)
10 ns (fast)
(2.14)
(2.15)
Interfacial charge Transfer
{TiIVOH+} + Red TiIVOH +
Red+
etr- + Ox TiIVOH + Ox-
100 ns (slow)
ms (very slow)
(2.16)
(2.17)
where: >TiOH represents the primary hydrated surface functionality of TiO2,
ecb- represents a conduction band electron, etr
- is a trapped conduction band electron,
hvb+ is a valence band hole,
Red is an electron donor (i.e. reductant), Ox is and electron acceptor (i.e. oxidant),
>TiIIIOH is the surface trapped CB electron
fs is femtosecond (1 fs is 10-15 of a second), and
{TiIVOH+} is the surface trapped VB holes (i.e. surface bound hydroxyl radical).
©© UUnniivveerrssiittyy ooff PPrreettoorriiaa
30
2.7.4 Technological installations
A wide variety of reactor configurations have been used in photocatalytic degradation of
pollutants in water. The reactor configuration is often determined by the form in which the
catalyst is used and the mode of UV illumination. Reactors configurations include:
Dispersed catalyst reactors (DCR)
Fixed-bed reactors.
Dispersed catalyst reactors
In dispersed catalyst reactors, the semiconductor catalyst is dispersed in a powder form in the
reaction solution containing the pollutant. The apparatus consist of a mixing device, reactor
vessel and protected UV lamp; and may be purged with air or oxygen.
The reactor can be illuminated internally (immersion of the UV lamp in the solution) – Figure
2.8(b) or externally (irradiation of the solution from outside of the reactor, above or below the
reactor) – Figure 2.8(a) and (c). Another photo-reactor for semiconductor photocatalysis is
the annular system, in which the reactor solution passes along the reactor length one or more
times - Figure 2.8(d).
This reactor configuration is very popular in the water disinfection industry. The annular
system is a reverse of the externally illuminated system with multiple lamps arranged parallel
to the main axis of flow.
The DCR reactors are easy to scale up because additional photocatalyst preparation is not
required. However, a major disadvantage of these slurry reactors is the need for
semiconductor particles separation from the bulk fluid phase after treatment by filtration,
centrifugation or flocculation. These additional steps contribute various levels of complexity
to the overall treatment process and decrease the economic viability of the slurry reactors
(Hoffmann et al., 1995; Mills and Lee, 2004). Some simple commonly used slurry reactor
designs are presented in Figure 2.8.
©© UUnniivveerrssiittyy ooff PPrreettoorriiaa
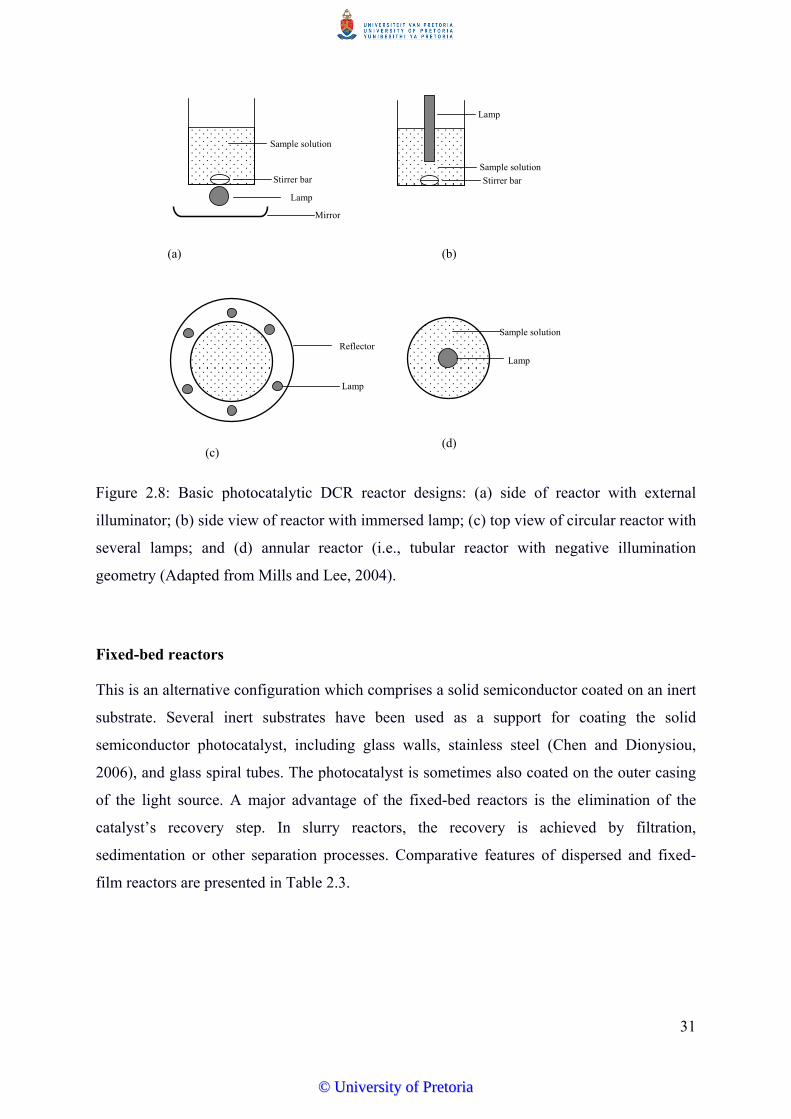
31
(a)
Sample solution
Stirrer bar
Lamp
Reflector
Lamp
Stirrer bar
Sample solution
Lamp
Mirror
Sample solution
Lamp
(b)
(c) (d)
Figure 2.8: Basic photocatalytic DCR reactor designs: (a) side of reactor with external
illuminator; (b) side view of reactor with immersed lamp; (c) top view of circular reactor with
several lamps; and (d) annular reactor (i.e., tubular reactor with negative illumination
geometry (Adapted from Mills and Lee, 2004).
Fixed-bed reactors
This is an alternative configuration which comprises a solid semiconductor coated on an inert
substrate. Several inert substrates have been used as a support for coating the solid
semiconductor photocatalyst, including glass walls, stainless steel (Chen and Dionysiou,
2006), and glass spiral tubes. The photocatalyst is sometimes also coated on the outer casing
of the light source. A major advantage of the fixed-bed reactors is the elimination of the
catalyst’s recovery step. In slurry reactors, the recovery is achieved by filtration,
sedimentation or other separation processes. Comparative features of dispersed and fixed-
film reactors are presented in Table 2.3.
©© UUnniivveerrssiittyy ooff PPrreettoorriiaa

32
The limitations of the fixed film reactors include:
Low surface area-to-volume ratios, as fixed bed have limited surface area of the
catalyst exposed to the irradiation source;
Reduction of reaction efficiency due to scattering of light by the reaction medium;
Poor mixing results in inefficient exposure of pollutant to catalyst surface.
Due to the low surface area to volume ratio, the fixed-bed photoreactors are usually operated
in a multipass (recycling mode) or series mode. Improvement of the surface area to reaction
volume ratio can be achieved by suspended media systems. Suspended media in common use
include alumina pellets, molecular sieve, glass beads, fibreglass, glass mesh or woven fibres.
©© UUnniivveerrssiittyy ooff PPrreettoorriiaa
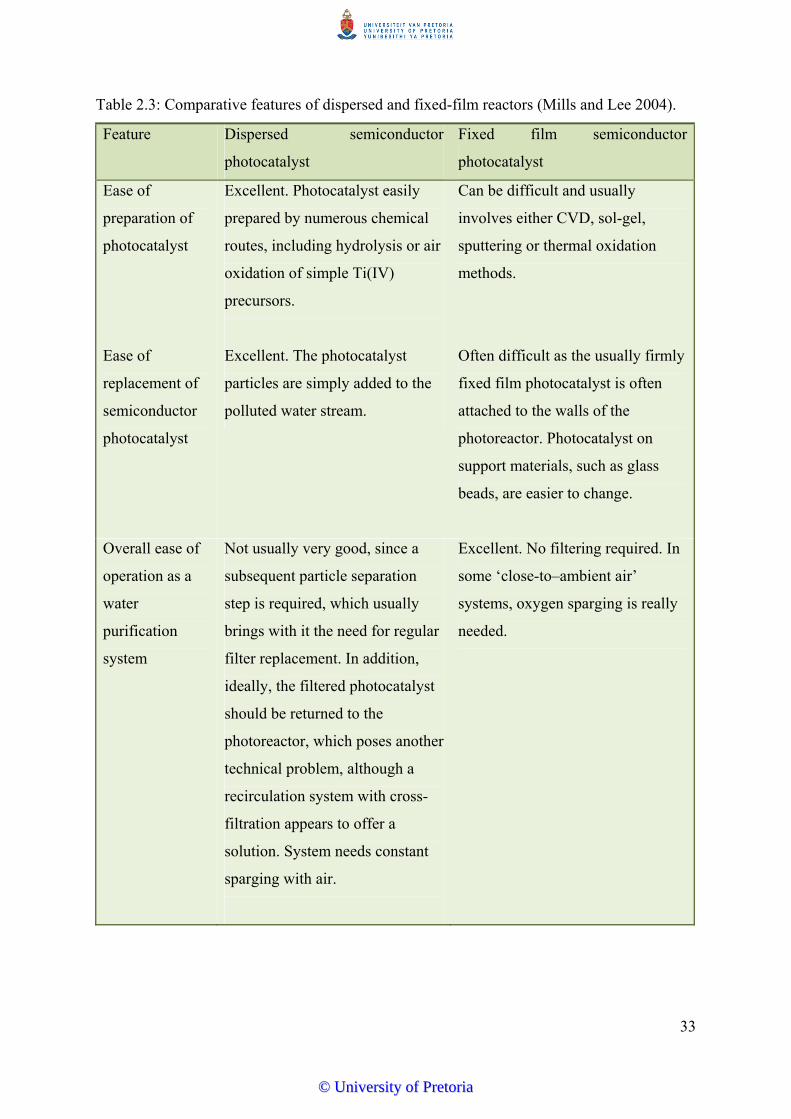
33
Table 2.3: Comparative features of dispersed and fixed-film reactors (Mills and Lee 2004).
Feature Dispersed semiconductor
photocatalyst
Fixed film semiconductor
photocatalyst
Ease of
preparation of
photocatalyst
Excellent. Photocatalyst easily
prepared by numerous chemical
routes, including hydrolysis or air
oxidation of simple Ti(IV)
precursors.
Can be difficult and usually
involves either CVD, sol-gel,
sputtering or thermal oxidation
methods.
Ease of
replacement of
semiconductor
photocatalyst
Excellent. The photocatalyst
particles are simply added to the
polluted water stream.
Often difficult as the usually firmly
fixed film photocatalyst is often
attached to the walls of the
photoreactor. Photocatalyst on
support materials, such as glass
beads, are easier to change.
Overall ease of
operation as a
water
purification
system
Not usually very good, since a
subsequent particle separation
step is required, which usually
brings with it the need for regular
filter replacement. In addition,
ideally, the filtered photocatalyst
should be returned to the
photoreactor, which poses another
technical problem, although a
recirculation system with cross-
filtration appears to offer a
solution. System needs constant
sparging with air.
Excellent. No filtering required. In
some ‘close-to–ambient air’
systems, oxygen sparging is really
needed.
©© UUnniivveerrssiittyy ooff PPrreettoorriiaa
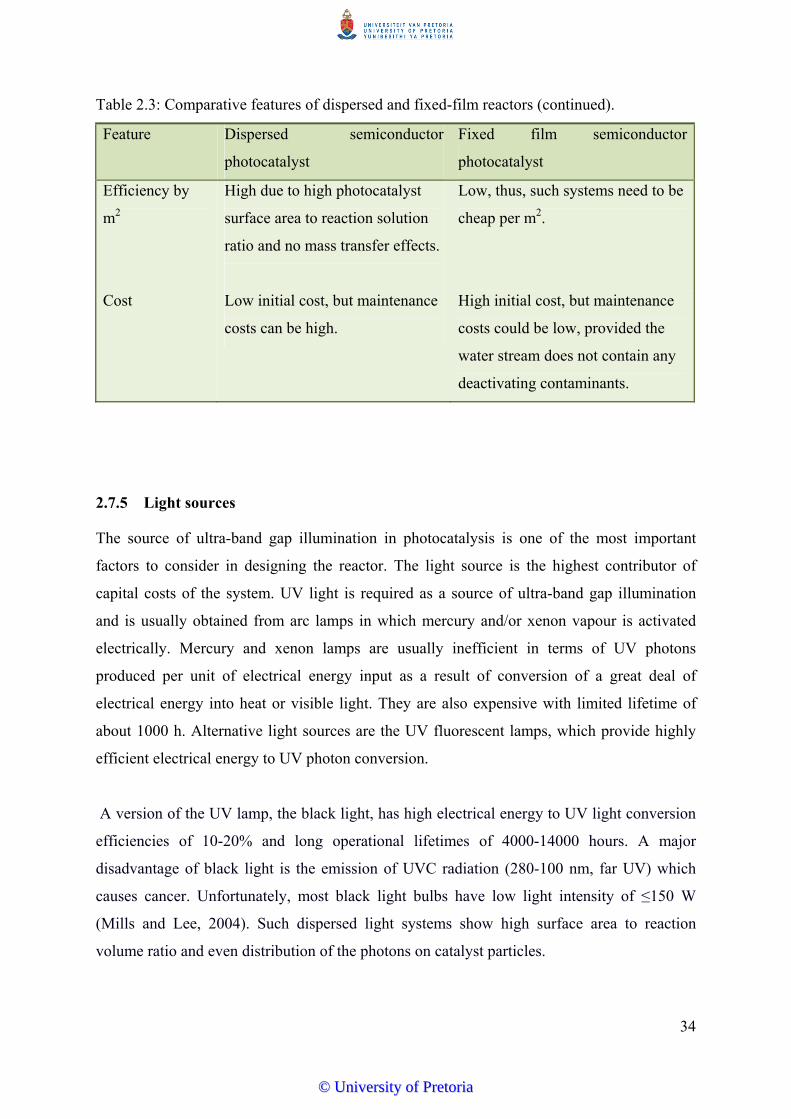
34
Table 2.3: Comparative features of dispersed and fixed-film reactors (continued).
Feature Dispersed semiconductor
photocatalyst
Fixed film semiconductor
photocatalyst
Efficiency by
m2
High due to high photocatalyst
surface area to reaction solution
ratio and no mass transfer effects.
Low, thus, such systems need to be
cheap per m2.
Cost Low initial cost, but maintenance
costs can be high.
High initial cost, but maintenance
costs could be low, provided the
water stream does not contain any
deactivating contaminants.
2.7.5 Light sources
The source of ultra-band gap illumination in photocatalysis is one of the most important
factors to consider in designing the reactor. The light source is the highest contributor of
capital costs of the system. UV light is required as a source of ultra-band gap illumination
and is usually obtained from arc lamps in which mercury and/or xenon vapour is activated
electrically. Mercury and xenon lamps are usually inefficient in terms of UV photons
produced per unit of electrical energy input as a result of conversion of a great deal of
electrical energy into heat or visible light. They are also expensive with limited lifetime of
about 1000 h. Alternative light sources are the UV fluorescent lamps, which provide highly
efficient electrical energy to UV photon conversion.
A version of the UV lamp, the black light, has high electrical energy to UV light conversion
efficiencies of 10-20% and long operational lifetimes of 4000-14000 hours. A major
disadvantage of black light is the emission of UVC radiation (280-100 nm, far UV) which
causes cancer. Unfortunately, most black light bulbs have low light intensity of ≤150 W
(Mills and Lee, 2004). Such dispersed light systems show high surface area to reaction
volume ratio and even distribution of the photons on catalyst particles.
©© UUnniivveerrssiittyy ooff PPrreettoorriiaa
35
UV lamps
One of the major problems in semiconductor photocatalysis is the achievement of an even
distribution of light in the photoreactor. Poor distribution of UV light in a semiconductor
reactor will lead to a low overall efficiency of operation. Rate of reaction is reported to be
directly proportional to the intensity of radiation (Equation 2.3). At low intensities a linear
relationship exists between reaction rate and intensity. At higher intensities, rates of reaction
are reported to show a square root dependence on intensity (Okimotoe et al., 1985; Ollis et
al., 1991 as reported by Gogate and Pandit, 2004). A novel system for distributing ultraband
gap light more evenly and efficiently has been used by Hoffstadler and co-workers. The
photocatalytic material in this system is dispersed throughout the photoreactor via a series of
light conductors, such as thin glass plates, rods, fibres of the hollow glass tubes (Mills and
Lee, 2004).
The threshold wavelength of radiation depends on the band gap energy. TiO2 has band gap
energy of 3.2-3.0 eV and absorbs UV light of 380-405 nm. The rutile form has band gap
energy of 3.05 eV, which would require 405 nm irradiation to generate an electron hole pair.
Anatase has band gap energy of 3.20 eV corresponding to 380 nm of radiation. Use of lamp
of the right wavelength is very important for an efficient system.
Solar source
The major component of operational cost in photocatalytic systems is associated with the
artificial generation of photons required for electron-hole pair formation. This cost can be
significantly reduced by the use of the “free” light source form solar energy (Esplugas et al.,
2002; Bahdalala et al., 2004; Bahnemann, 2004; Gogate and Pandit, 2004; Mills and Lee
2004; Ljubas, 2005; Malato et al., 2007). Using solar light source would have ecological
benefits as well as economic benefits. The sun has a typical UV-flux near the surface of the
earth of 20-30 W/m2; this translates to 0.2-0.4 mol photon m-2 h-1 available in the 300-400 nm
range (Bahnemann, 2004, Mills and Lee, 2004). This is estimated to be 25 times less than that
from an 8 W, UV fluorescent lamp (Mills and Lee, 2004). Tapping this free source would
translate into significant cost savings. Solar powered applications can only be used
beneficially in the parts of the world that receive enough sunlight. Fortunately, Africa is
geographically located to benefit from the use of such solar powered systems.
©© UUnniivveerrssiittyy ooff PPrreettoorriiaa
36
A number of solar powered photocatalytic systems are currently under test for various
applications. They use only high-energy short-wavelength photons, which can be collected by
conventional solar thermal collector designs, such as parabolic troughs and non-concentrating
collectors (which utilise direct or diffuse sunlight). Non-concentrating collectors are, in
principle, cheaper than parabolic trough concentrators (PTCs), as they have neither moving
parts nor solar tracking devices (Malato et al., 2007; Rodriguez et al., 1996). The most
commonly used solar reactor concepts are discussed in an excellent review of solar powered
systems by Bahnemann (Bahnemann, 2004).
2.7.6 Application of semiconductor photocatalysis
Toxic organic compound degradation
Research into semiconductor photocatalysis has largely focused on the removal of organic
pollutants from water, since a wide range of organic substrates can be completely mineralized
in the presence of dissolved oxygen, photosensitized by TiO2. One of the very attractive
features of semiconductor photocatalysis is its effectiveness against a broad range of
pollutants, including those that are recalcitrant to other water treatment processes. This makes
it ideal for treating hazardous refractory organics such as herbicides and aromatic compounds
(Mills and Lee, 2004). A non-exhaustive list of some classes of compounds mineralized by
TiO2 sensitized photocatalysis is presented in Table 2.4. Class of compounds of
environmental interest in Table 2.4 include haloalkanes, such as chloroform and
tetrachloromethane; halophenol; herbecides, especially dichlorodiphenyltrichloroethane
(DDT) which is in the U.S.EPA’s list of top priority persistant organic pollutants (POP). The
haloagenated compounds are disinfection by-products (DBPs) often found in small but
detectable quantities in drinking water disinfected by chlorination; and are known
carcinogens.
©© UUnniivveerrssiittyy ooff PPrreettoorriiaa

37
Table 2.4: List of classes of organic compounds photomineralised by TiO2 photocatalysis. Class of Organics Examples
Aliphatic alcohols Methanol, ethanol, propanol, glucose Aliphatic carboxylic acids Formic, ethanoic, propanoic, oxalic, butyric, malic
acids Alkanes Isobutane, pentane, heptane, cyclohexane, paraffins Alkenes Propene, cyclohexene Amides Benzamide Aromatic carboxylic acids Benzoic acid, 4-aminobenzoic, phthalic, salicylic, m-
and p-hydroxybenzoic acids, chlorohydroxybenzoic and chlorobenzoic acids
Aromatics Benzene, naphthalene Dyes methylene blue, rhodamine B, methyl orange and
fluorescein. Haloalkanes Mono-, di-, tri- and tetrachloromethane,
tribromoethane, 1,1,1-trifluoro-2,2,2 trichloroethane Haloalkenes 1,2-dichloroethylene, 1,1,2-trichloroethylene Haloaromatics Chlorobenzene, 1,2-dichlorobenzene Halophenols 2-, 3-, 4-chlorophenol, pentachlorophenol, 4-
fluorophenol Herbicides atrazine, prometron, propetryne, bentazon, 2-4 D,
monuron Nitrohaloaromatics Dichloronitrobenzene Pesticides DDT, parathion, lindane, tetrachlorvinphos,
phenitrothion. Phenolic compounds Phenol, hydroquinone, catechol, methylcatechol,
resorcinol, o- m-, p-cresol, nitrophenols Polymers Polyethylene, PVC Surfactants sodium dodecylsulphate, polyethylene glycol, sodium
dodecyl benzene sulphonate, trimethyl phosphate, tetrabutylammmonium phosphate
Some examples of application of TiO2 semiconductor photocatalysis in the destruction of
organic pollutant and the key reaction conditions are presented in Table 2.5. The list is far
from complete but careful choices of compounds have been made to include compounds from
a variety of classes; under a variety of operational conditions.
©© UUnniivveerrssiittyy ooff PPrreettoorriiaa
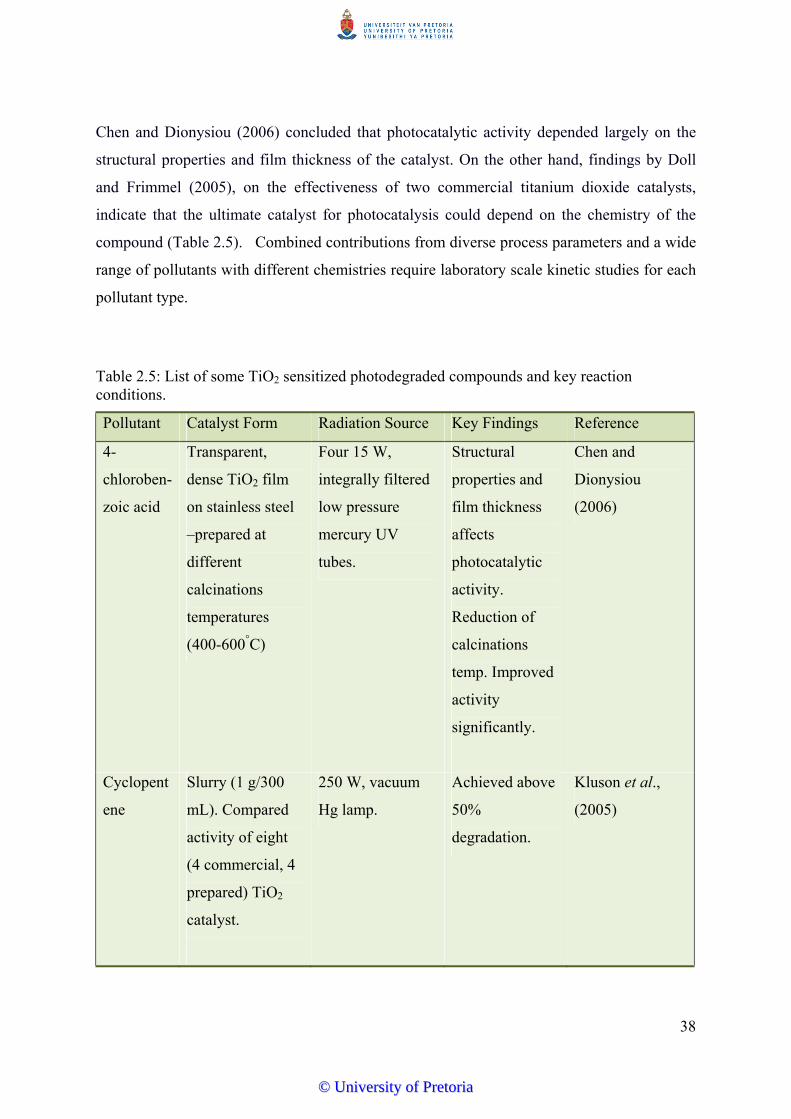
38
Chen and Dionysiou (2006) concluded that photocatalytic activity depended largely on the
structural properties and film thickness of the catalyst. On the other hand, findings by Doll
and Frimmel (2005), on the effectiveness of two commercial titanium dioxide catalysts,
indicate that the ultimate catalyst for photocatalysis could depend on the chemistry of the
compound (Table 2.5). Combined contributions from diverse process parameters and a wide
range of pollutants with different chemistries require laboratory scale kinetic studies for each
pollutant type.
Table 2.5: List of some TiO2 sensitized photodegraded compounds and key reaction conditions.
Pollutant Catalyst Form Radiation Source Key Findings Reference
4-
chloroben-
zoic acid
Transparent,
dense TiO2 film
on stainless steel
–prepared at
different
calcinations
temperatures
(400-600°C)
Four 15 W,
integrally filtered
low pressure
mercury UV
tubes.
Structural
properties and
film thickness
affects
photocatalytic
activity.
Reduction of
calcinations
temp. Improved
activity
significantly.
Chen and
Dionysiou
(2006)
Cyclopent
ene
Slurry (1 g/300
mL). Compared
activity of eight
(4 commercial, 4
prepared) TiO2
catalyst.
250 W, vacuum
Hg lamp.
Achieved above
50%
degradation.
Kluson et al.,
(2005)
©© UUnniivveerrssiittyy ooff PPrreettoorriiaa
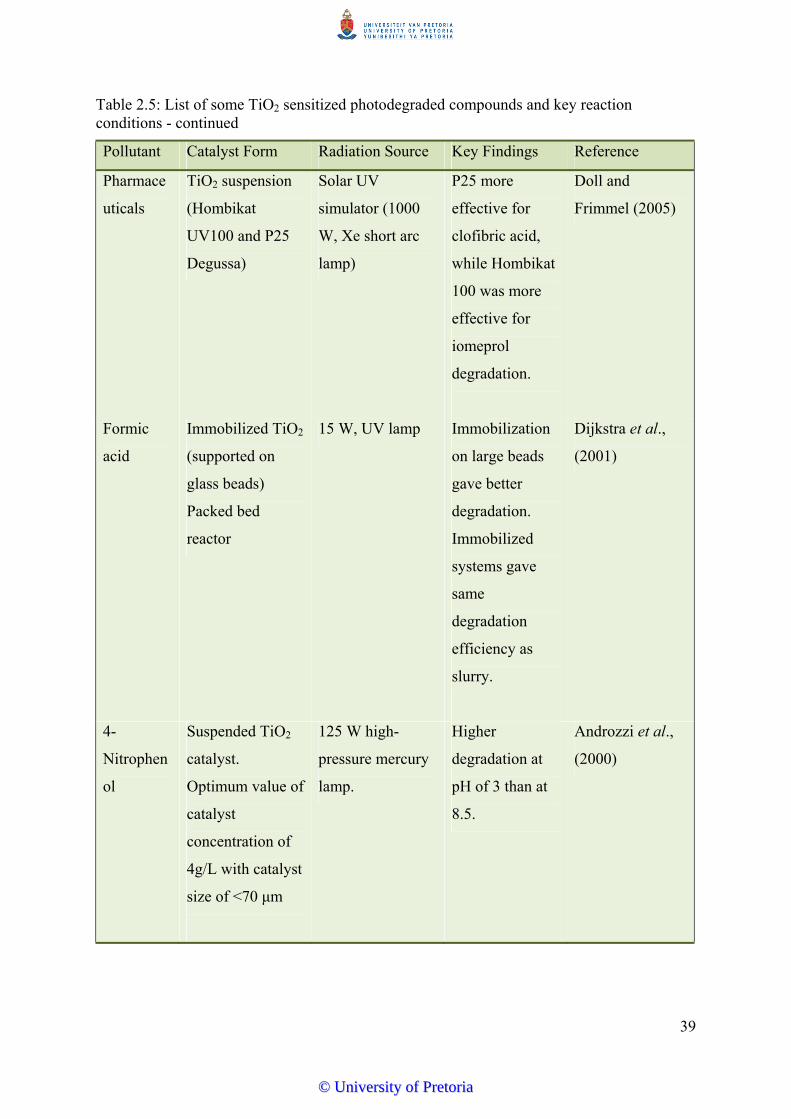
39
Table 2.5: List of some TiO2 sensitized photodegraded compounds and key reaction conditions - continued
Pollutant Catalyst Form Radiation Source Key Findings Reference
Pharmace
uticals
TiO2 suspension
(Hombikat
UV100 and P25
Degussa)
Solar UV
simulator (1000
W, Xe short arc
lamp)
P25 more
effective for
clofibric acid,
while Hombikat
100 was more
effective for
iomeprol
degradation.
Doll and
Frimmel (2005)
Formic
acid
Immobilized TiO2
(supported on
glass beads)
Packed bed
reactor
15 W, UV lamp Immobilization
on large beads
gave better
degradation.
Immobilized
systems gave
same
degradation
efficiency as
slurry.
Dijkstra et al.,
(2001)
4-
Nitrophen
ol
Suspended TiO2
catalyst.
Optimum value of
catalyst
concentration of
4g/L with catalyst
size of <70 μm
125 W high-
pressure mercury
lamp.
Higher
degradation at
pH of 3 than at
8.5.
Androzzi et al.,
(2000)
©© UUnniivveerrssiittyy ooff PPrreettoorriiaa
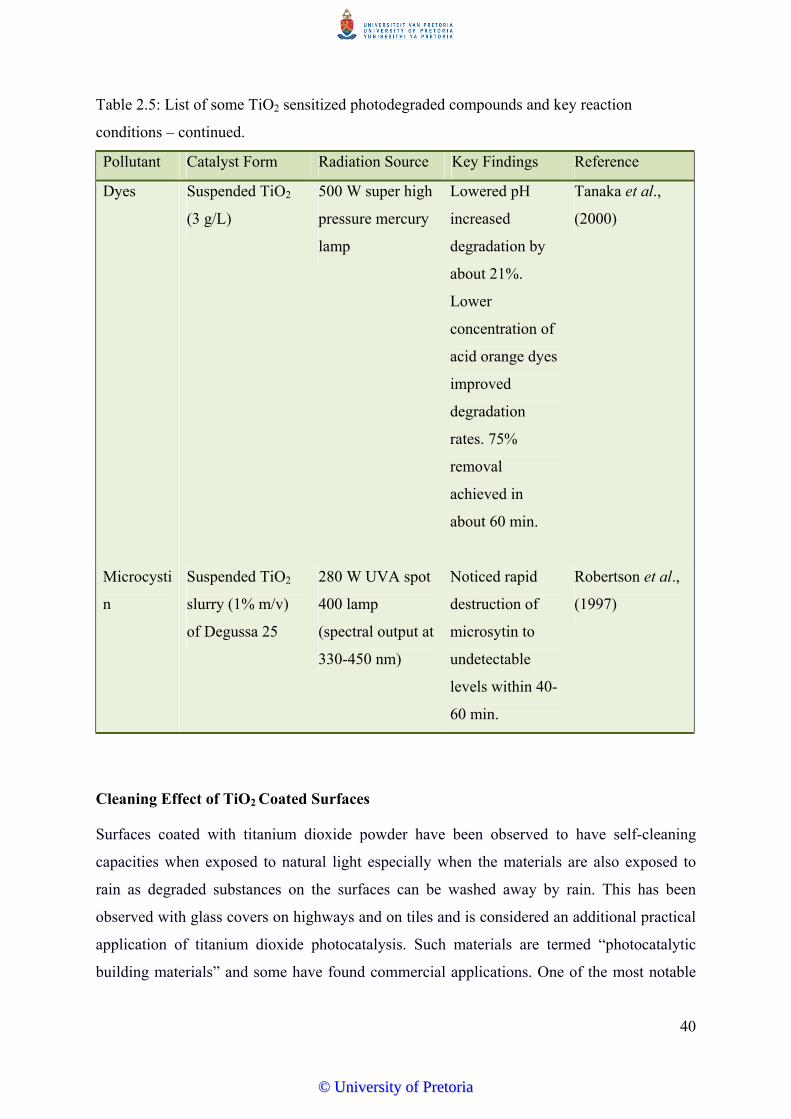
40
Table 2.5: List of some TiO2 sensitized photodegraded compounds and key reaction
conditions – continued.
Pollutant Catalyst Form Radiation Source Key Findings Reference
Dyes Suspended TiO2
(3 g/L)
500 W super high
pressure mercury
lamp
Lowered pH
increased
degradation by
about 21%.
Lower
concentration of
acid orange dyes
improved
degradation
rates. 75%
removal
achieved in
about 60 min.
Tanaka et al.,
(2000)
Microcysti
n
Suspended TiO2
slurry (1% m/v)
of Degussa 25
280 W UVA spot
400 lamp
(spectral output at
330-450 nm)
Noticed rapid
destruction of
microsytin to
undetectable
levels within 40-
60 min.
Robertson et al.,
(1997)
Cleaning Effect of TiO2 Coated Surfaces
Surfaces coated with titanium dioxide powder have been observed to have self-cleaning
capacities when exposed to natural light especially when the materials are also exposed to
rain as degraded substances on the surfaces can be washed away by rain. This has been
observed with glass covers on highways and on tiles and is considered an additional practical
application of titanium dioxide photocatalysis. Such materials are termed “photocatalytic
building materials” and some have found commercial applications. One of the most notable
©© UUnniivveerrssiittyy ooff PPrreettoorriiaa
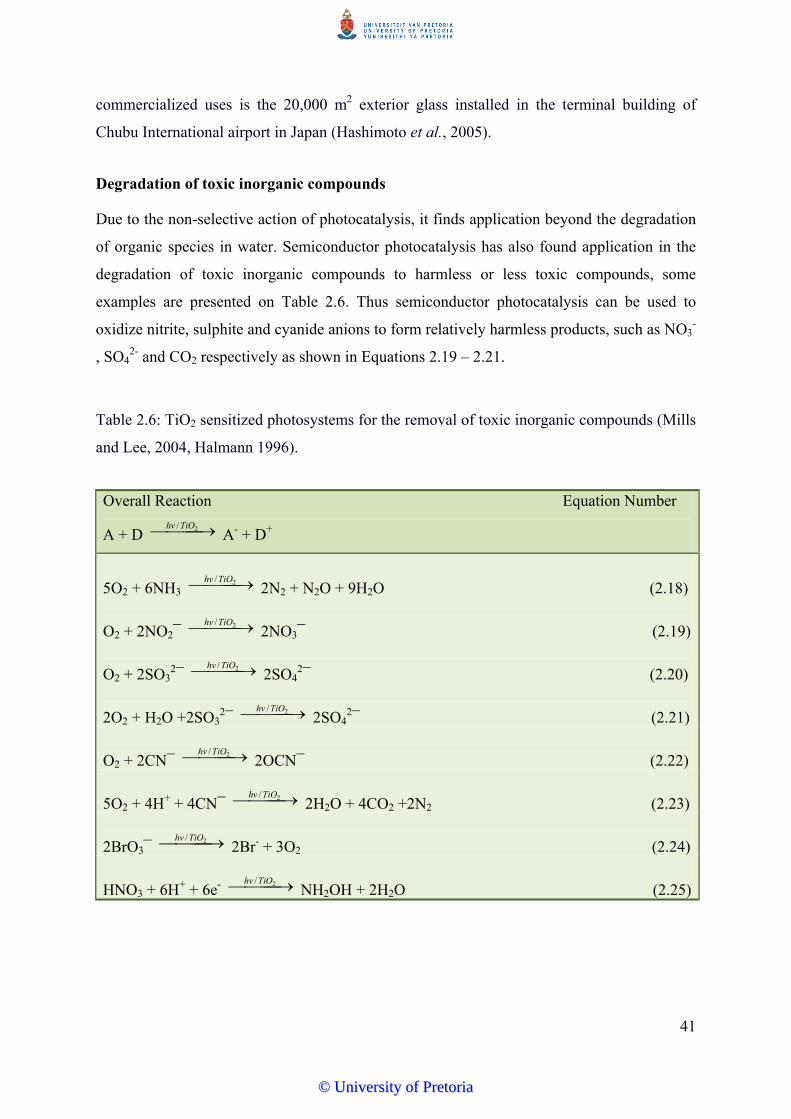
41
commercialized uses is the 20,000 m2 exterior glass installed in the terminal building of
Chubu International airport in Japan (Hashimoto et al., 2005).
Degradation of toxic inorganic compounds
Due to the non-selective action of photocatalysis, it finds application beyond the degradation
of organic species in water. Semiconductor photocatalysis has also found application in the
degradation of toxic inorganic compounds to harmless or less toxic compounds, some
examples are presented on Table 2.6. Thus semiconductor photocatalysis can be used to
oxidize nitrite, sulphite and cyanide anions to form relatively harmless products, such as NO3-
, SO42- and CO2 respectively as shown in Equations 2.19 – 2.21.
Table 2.6: TiO2 sensitized photosystems for the removal of toxic inorganic compounds (Mills
and Lee, 2004, Halmann 1996).
Overall Reaction Equation Number
A + D 2/TiOhv A- + D+
5O2 + 6NH3 2/TiOhv 2N2 + N2O + 9H2O (2.18)
O2 + 2NO2¯ 2/TiOhv 2NO3¯ (2.19)
O2 + 2SO32¯ 2/TiOhv
2SO42¯ (2.20)
2O2 + H2O +2SO32¯ 2/TiOhv
2SO42¯ (2.21)
O2 + 2CN¯ 2/TiOhv 2OCN¯ (2.22)
5O2 + 4H+ + 4CN¯ 2/TiOhv 2H2O + 4CO2 +2N2 (2.23)
2BrO3¯ 2/TiOhv 2Br- + 3O2 (2.24)
HNO3 + 6H+ + 6e- 2/TiOhv NH2OH + 2H2O (2.25)
©© UUnniivveerrssiittyy ooff PPrreettoorriiaa
42
Bromate formation during ozonation of compounds containing bromide ions in water is a
major concern with ozonation systems. With Titanium photocatalysis bromate ions in
solution are decomposed to bromide and oxygen. The reactions involved are presented in
Equation 2.24 (see Table 2.6). The ability to degrade bromate ions are of significant
environmental advantage; due to growing concerns over its detection at environmentally
significant levels in potable water that has been chlorinated (Mills and Lee, 2004).
Degradation of organo-metallic compounds
Semiconductor photocatalysis has also found application in the degradation of some organo-
metallic compounds of serious environmental concern. Serious environmental hazard of spills
of mercury and other heavy metals (particularly lead and cadmium) into natural waters is due
to the formation of organo-metallic derivatives of the metals. Some of these organo-metallic
compounds are extremely toxic. Examples of organo-metallic compounds that have been
successfully degraded by semiconductor photocatalysis include mercurochrome,
phenylmercury, tributyltin chloride (TBT), and bis(tributyltin) oxide (TBTO) amongst others
(Halmann, 1996).
Treatment of oil spills
Oil spills are a major source of natural water pollution in oil producing regions and during
transportation in high seas. Photocatalytic oxidation by sunlight of films of crude oil or of n-
octane on fresh and seawater can be achieved by spreading titanium dioxide coated oleophilic
glass microbubbles or beads on the polluted water surface. The possibility of a natural “self-
cleaning” process has been predicted on the discovery of the photocatalytic degradation of
crude oil residues in contact with beach sand on irradiation with a high-pressure mercury
lamp. Photocatalytic activity of the beach sand was ascribed to the catalytic properties of
magnetite and ilmenite contained in the beach sand (Halmann, 1996).
Destruction of biological species (bacteria and viruses)
In addition to the photomineralisation of organic, inorganic and organo-metallic compounds,
photosensitized TiO2 has also been effectively used for the destruction of microorganisms,
such as bacteria, viruses and moulds. The photocatalytic destruction of biological material
sensitized by semiconductor catalysts is generally referred to as photo-sterilization or
photodisinfection (Mills and Lee, 2004).
©© UUnniivveerrssiittyy ooff PPrreettoorriiaa
43
2.7.7 Case studies
Semiconductor photocatalysis is yet to make the full transition from laboratory and pilot scale
experiments to full scale application. The slow transition has limited the number of
companies promoting semiconductor photocatalytic products. A limited number of case
studies are available in literature compared to the volume of research that is being carried out.
Most attempts at pilot scale studies have been focused on the treatment of pollutants from
industrial effluents. There has been very limited application of photocatalysis in the treatment
of surface water contaminants and in the drinking water treatment industry.
With recorded success of photocatalysis for the degradation of a seemingly endless list of
recalcitrant organic compounds coupled with the ability to destroy microorganisms;
photocatalysis could emerge in the nearest future as one stop alternative to disinfectant /
treatment method in the potable water industry.
Despite its limited application outside laboratory studies, a few successes has been recorded
in the area of surface and ground water remediation with photocatalysis. These include:
Treatment of musty odour in Lake Biwa – Japan
Contaminated surface water – Ontario, Canada
Cleaning of groundwater contamination – Gainesville, Florida
Oil Spill Clean-up in Japan
Petrochemical waste site, Galveston, Texas, Texas
Treatment of musty odour in Lake Biwa – Japan
A flow through photoreactor packed with TiO2 coated glass beads under illumination with
black light at flow rates of 20-50 mL/min was developed in the laboratory to degrade 2-
methyisoborneol (MIB). Concentration of MIB decreased to half of its initial value of 1 000
ng/L within a minute. The process was developed to degrade musty odour in Lake Biwa,
Japan (Halmann, 1996).
©© UUnniivveerrssiittyy ooff PPrreettoorriiaa

44
Contaminated surface water – Ontario, Canada
The Photo-Cat system was installed to treat highly contaminated surface water with high
levels of oil and grease which discharges into the Thames River. The system was used to treat
136.38 KL from three wells continuously on a daily basis. Contaminants include
trichloroethene (TCE), dichloroethane (DCE), trichloroethane (TCE), vinylchloride, oil and
grease all present in the low mg/L range in two wells and >1000 mg/L range in the third
well. A low concentration of hydrogen peroxide was added as additional scavenger of
photogenerated electrons to enhance overall efficiency of the system. The system is reported
to have been operating since 1998 (Mills and Lee, 2004).
Cleaning of groundwater contamination – Gainesville, Florida
Clearwater Industries R2000 solar oxidation facility using a modular set of tilted flat-bed
solar photoreactors, with dispersed TiO2 photocatalyst was used to treat 500 gallons of
underground water aquifer contaminated with benzene, toluene, ethyl benzene and xylene
(BTEX). The R2000 system reduced BTEX to below the allowed level of 65 µg/L within 3
hours of use on a cloudy day (UV – light intensity 31 Wm-2). This was compared to the use
of activated carbon adsorption and trials with both systems showed that the R2000
photocatalytic system was significantly less expensive to install and operated at a fraction of
the cost of the activated carbon system (Mills and Lee, 2004).
Oil spill clean-up in Japan
Degradation of a thin film of crude oil spilled on seawater was achieved by photocatalytic
oxidation using TiO2 coated microbubbles of 80 µm average diameter and 0.37 cm-3 density.
The microbubbles stayed on the air-oil interface and promoted the initial very rapid
photodegradation process of the oil with air as the oxidant. The microbubbles absorbed the
oil forming oil-containing aggregates thereby leaving the water surface relatively clean. The
microbubbles were reported to promote complete mineralization with destruction of
intermediates at a weekly rate of about twice their weight of oil. Photoxidation eliminated
both aliphatic and aromatic compounds including polycyclic aromatics. The clean-up process
was reported to be accelerated by waves thereby proceeding even in high seas where
skimming of oil spills is not praticable (Halmann, 1996).
©© UUnniivveerrssiittyy ooff PPrreettoorriiaa
45
Petrochemical waste site-Galveston, Texas, Texas
A 19-kW Photo-Cat system was used to reduce groundwater contaminants from 200 mg/L to
5 µg/L, in the presence of 6 000 mg/L of chloride ion. The 19-kW system was used to reduce
the levels of 200 mg/L of bis(2-chloroethyl)ether to 20 µg/L. The unit was designed to
operate at 15-30 L/min in fully automated mode (Mills and Lee, 2004).
With the recorded success of photocatalysis for the degradation of a seemingly endless list of
recalcitrant organic compounds in the laboratory and the few reported cases for the treatment
of organic compounds in surface water and groundwater, it is becoming an attractive choice
for water treatment systems. The increased interest seems justified in light of enhanced
awareness of the environmental implications of non-green processes; and a subsequent global
shift to greener processes. This is in light of the fact that the photocatalytic process has the
added advantage of being the only AOP system that can be classified as a completely green
process. For the potable water industry, installation of a single system that could potentially
degrade recalcitrant organic compounds and act as a disinfectant for the microbial population
without the production of DBPs would be an added benefit.
©© UUnniivveerrssiittyy ooff PPrreettoorriiaa
46
CHAPTER THREE
MATERIALS AND METHODS
3.1 Chemicals and Reagents
All solvents used in this study were of either HPLC or GC grade. Acetonitrile (99.9% – BDH
HiperSolv), dichloromethane (99.9% – BDH HiperSolv), phenol reagent (99.5 % –
Saarchem, sodium chloride (99% – Saarchem); 2-chlorophenol (98% – Merck), 4-
chlorophenol (98% – Merck), 4-nitrophenol (99% – Merck); and tertiary butanol (99.5% –
Merck) were supplied by Merck, South Africa. Methanol (99.9% – HPLC grade) was
purchased either from Merck, South Africa or from Waters, South Africa. Hexane (99% –
Fluka) and phenol analytical standard (99.7% – Fluka) were purchased from Sigma Aldrich,
Germany. Acetone (99.5% – Merck) and glacial acetic acid (100% – Merck) were purchased
from Merck, Germany.
Taste and odour standards including, geosmin (99.8% – Supelco), 2-methylisoborneol (2-
MIB) (99.9% – Supelco), 2,4,6-trichloroanisole (TCA) (99.1% – Supelco), 2-isopropyl-3-
methoxypyrazine (IPMP) (99.9% – Supelco) and 2-isobutyl-3-methoxypyrazine (IBMP)
(99.5% – Supelco); sodium azide (99.5% - Sigma), benzoquinone (99.5%), hydroquinone
(99.5% ), resorcinol (99.5%), and cathecol (99.6%); were purchased from Sigma Aldrich,
Germany. Sodium chloride, sodium hydrogen carbonate (99% - UniVar, Saarchem), and
anhydrous sodium sulphate (99% - UniVar, Saarchem) were obtained from Merck, South
Africa. Taste and odour standards were purchased as 100 µg/mL solutions in methanol (1
mL). Anatase titanium dioxide powder (99.8% – Aldrich) was purchased from Sigma
Aldrich, Germany. Ultra high purity helium gas (99.99%) was purchased from Afrox, South
Africa.
All chemicals, with the exception of sodium chloride were used as received without further
purification. Sodium chloride was dried in the oven at 105ºC for 3 hours and calcined in a
muffle furnace at 540ºC for 12 hours, cooled to room temperature in a desiccator prior to use.
All samples were prepared using ultrapure water from Milipore DirectQ3 (0.05 µS/cm)
(Millipore, USA; supplied by Microsep, South Africa).
©© UUnniivveerrssiittyy ooff PPrreettoorriiaa

47
3.2 Equipment
Long-arc 400 W, (Philips HOK 4/120 SE), medium pressure, and 9 W low pressure (Philips
TUV PL-S 9W) UV lamps (Philips, Netherlands); were supplied by Technilamps, South
Africa. Goldilux UV Smart Meters (Model GRP-1) equipped with UV-A, UV-B and UV-C
probes (Goldilux, USA); were purchased from Measuring Instruments Technology (MIT),
South Africa. The UV Meter and probes were calibrated at the National Metrology Institute
of South Africa (NMISA). The crystallinity of anatase titanium dioxide powder was
examined by XRD with a PANalytical Xpert-Pro diffractometer system equipped with an
X’celerator detector (Netherlands). Surface morphology studies of titanium dioxide powders
were done with Zeiss Ultra Plus SECSEM Scanning electron miscroscope (Germany).
The pH of sample solutions and variations in the pH of the reactor solutions during
degradation were monitored with either an Orion3 Star portable pH Meter (Thermo Electron
Corporation, USA); or an HQ11p portable pH Meter equipped with a temperature probe
(HACH, USA, supplied by Aqualytic Environmental & Laboratory, South Africa). Dissolved
oxygen measurements were obtained with an HACH HQ30d portable DO Meter, also
equipped with a temperature probe (HACH, USA, supplied by Aqualytic Environmental &
Laboratory, South Africa). Homogeneity of reactor contents was obtained by mixing with
WiseStir MSH 30D magnetic stirrer (Wisd Laboratory Equipments, South Africa), equipped
with a temperature probe for on line temperature monitoring. Temperatures of the reactor
contents presented are average readings from the pH and DO meter readings. Air flow into
the reactor for experiments that required aeration was controlled and measured with an air
flow meter with capacity of 0-100 mL/min.
3.3 Properties of Experimental Reagents
Phenols are aromatic alcohols with an acidic proton. Phenol is very soluble in water making it
highly mobile in surface and ground waters. Phenol is the most soluble of the four phenolic
compounds under investigation and their relative decreasing order of solubility is phenol >>
4-chlorophenol (4-CP) >2-chlorophenol (2-CP) > 4-nitrophenol (4-NP). Some physical
properties of phenol, the chloro- and nitro-derivatives of phenol (McMurry, 2012) are
presented in Table 3.1
©© UUnniivveerrssiittyy ooff PPrreettoorriiaa
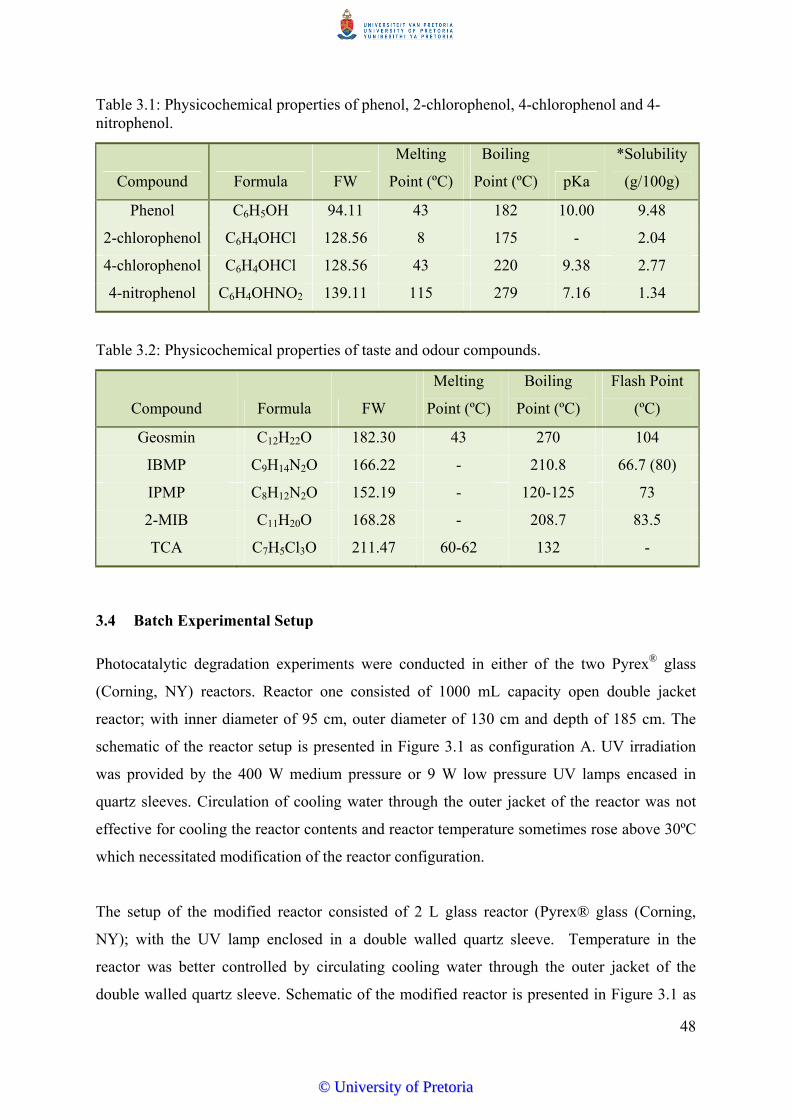
48
Table 3.1: Physicochemical properties of phenol, 2-chlorophenol, 4-chlorophenol and 4-nitrophenol.
Compound Formula FW
Melting
Point (ºC)
Boiling
Point (ºC) pKa
*Solubility
(g/100g)
Phenol C6H5OH 94.11 43 182 10.00 9.48
2-chlorophenol C6H4OHCl 128.56 8 175 - 2.04
4-chlorophenol C6H4OHCl 128.56 43 220 9.38 2.77
4-nitrophenol C6H4OHNO2 139.11 115 279 7.16 1.34
Table 3.2: Physicochemical properties of taste and odour compounds.
Compound Formula FW
Melting
Point (ºC)
Boiling
Point (ºC)
Flash Point
(ºC)
Geosmin C12H22O 182.30 43 270 104
IBMP C9H14N2O 166.22 - 210.8 66.7 (80)
IPMP C8H12N2O 152.19 - 120-125 73
2-MIB C11H20O 168.28 - 208.7 83.5
TCA C7H5Cl3O 211.47 60-62 132 -
3.4 Batch Experimental Setup
Photocatalytic degradation experiments were conducted in either of the two Pyrex® glass
(Corning, NY) reactors. Reactor one consisted of 1000 mL capacity open double jacket
reactor; with inner diameter of 95 cm, outer diameter of 130 cm and depth of 185 cm. The
schematic of the reactor setup is presented in Figure 3.1 as configuration A. UV irradiation
was provided by the 400 W medium pressure or 9 W low pressure UV lamps encased in
quartz sleeves. Circulation of cooling water through the outer jacket of the reactor was not
effective for cooling the reactor contents and reactor temperature sometimes rose above 30ºC
which necessitated modification of the reactor configuration.
The setup of the modified reactor consisted of 2 L glass reactor (Pyrex® glass (Corning,
NY); with the UV lamp enclosed in a double walled quartz sleeve. Temperature in the
reactor was better controlled by circulating cooling water through the outer jacket of the
double walled quartz sleeve. Schematic of the modified reactor is presented in Figure 3.1 as
©© UUnniivveerrssiittyy ooff PPrreettoorriiaa
49
configuration B. The reactor configuration was modified to improve temperature control in
the reactor. The reactor contents were continually aerated at a flow rate of 10 mL/min with an
air Flow Meter and a perforated quartz disc or a quartz rod. Dissolved oxygen (DO) was
measured with an HQ30d DO Meter. Mixing of reactor contents was achieved with a WisD
magnetic stirrer, stirring speed for all batches was set at 300 rpm.
©© UUnniivveerrssiittyy ooff PPrreettoorriiaa

50
Figure 3.1: Schematics of experimental reactor setup - Configuration A and configuration B.
Cooling water - in
Cooling water - out
UV Lamp LampSleeve
Reactor vessel with cooling jacket
Air - in
Air - diffuser
Air - in -
Cooling water - in
Coolingwater -out
Quartz sleeve
with cooling
jacket
Reactor vessel
Air diffuser
UV Lamp
(A)
( B)
Magnetic stirrer
Magnetic stirrer
©© UUnniivveerrssiittyy ooff PPrreettoorriiaa

51
3.5 Reactor Startup
The reactor contents are loaded into the reactor usually starting with the catalyst (for batches
containing the catalyst) and the pollutant solution. Air into the reactor is switched on after the
addition of 1000 mL pollutant solution in the required concentrations, the circulation pump
for the cooling water and the stirrer are switched on. The UV light and the timer are switched
on simultaneously, as the time for the switching on of the UV light is recorded as the start
time (time at zero minutes – To) of the each experimental batch. Some sets of reactions in
each group were conducted in duplicate to assess the reproducibility of the experiments.
3.6 Collection of Water Samples
Water samples were collected from the Water Treatment plant at Rietvlei. Duplicate samples
were collected at three sampling points, which are:
1. The inlet to the reservoir for source water from the dam;
2. The collection tank for filter backwash water from the DAFF filters and;
3. The collection tank for filter backwash water from the GAC filters.
Sampling was carried out between 12:30 and 13:00, immediately after the filters were
backwashed and the backwash water drained into the collection tanks. Water samples were
collected into 1 L Duran Schott short bottles that were filled without air space. Samples were
pre-treated on site with 0.02 mg/L sodium azide and 20 mL/L methanol. Addition of sodium
azide was to prevent microbial degradation of water samples during transportation to the
laboratory and during storage of samples. Temperature, pH and the turbidity of the water
were measured at the sampling site immediately after sample collection. Samples were
transported to the laboratory in a cooler box packed with ice for chromatographic analysis.
Raw water samples were collected at Roodeplaat Treatment plant at the raw water inlet; and
filter backwash water was collected at the outlet (point of discharge) of the filter backwash
from the rapid sand filters. Sampling was carried out immediately after the filters were
backwashed. On site pre-treatment with sodium azide and methanol as described earlier was
©© UUnniivveerrssiittyy ooff PPrreettoorriiaa
52
also done and samples were transported in ice cooled cooler boxes to the laboratory for
chromatographic analysis. Samples were analysed as described in Section 3.7.
3.7 Analytical Methods
Characterisation/identification of organic compounds of dam water and monitoring of
progress of degradation for goesmin was carried out by gas chromatographic analysis on a
Perkin Elmer Clarus 600T gas chromatogram/mass spectrometer equipped with headspace
sampler. The GC/MS comprised of Clarus 600T GC, Clarus 600T Mass spectrometer; and
Turbomatrix 40 trap headspace sampler equipped with a trap for on line extraction and
concentration of sample constituents.
Progress of degradation of phenol, 2-chlorophenol, 4-chlorophenol, 4-nitrophenol and the
degradation intermediates obtained from the degradation of phenol was monitored on a
Waters 2695Alliance high performance liquid chromatograph (HPLC). The Waters HPLC
system is equipped with an autosampler with a capacity for 120 samples. Mobile phase
system consists of a pump connected by four switching valves to four solvent reservoirs
enabling the simultaneous use of four solvents in isocratic or gradient mode.
Chromatographic separation of peaks was achieved on either Symmetry C18, 150 mm x 3.9
mm, 5 µm column (supplied by Separations Scientific, South Africa) or Synergi 4U-Fusion
RP Column. Separated peaks were detected on a photo diode array (Waters 2998 PDA)
detector and Empower software (Waters, USA) was used for data acquisition and analysis.
3.7.1 Analysis of phenolics
HPLC analysis of the synthetic polluted water containing phenol, 2-chlorophenol, 4-
chlorophenol or 4-nitrophenol as single pollutants in solution or as a mixture of pollutants;
and their degradation products in solution were performed using EPA Method 604 with a
Symmetry C18, 150 mm x 3.9 mm, 5 µm column. Sample constituent separation and elution
was achieved with a binary gradient mobile phase consisting of 1% acetic acid in water
(Solvent A) and 1% acetic acid in acetonitrile (Solvent B) at a constant flow rate of 1.2
mL/min.
The mobile phase gradient was from 70% of Solvent A, 30% Solvent B at time zero; to 0% of
Solvent A and 100% of Solvent B at 20 mins. Injection volume was 20 µL. Concentrations
©© UUnniivveerrssiittyy ooff PPrreettoorriiaa
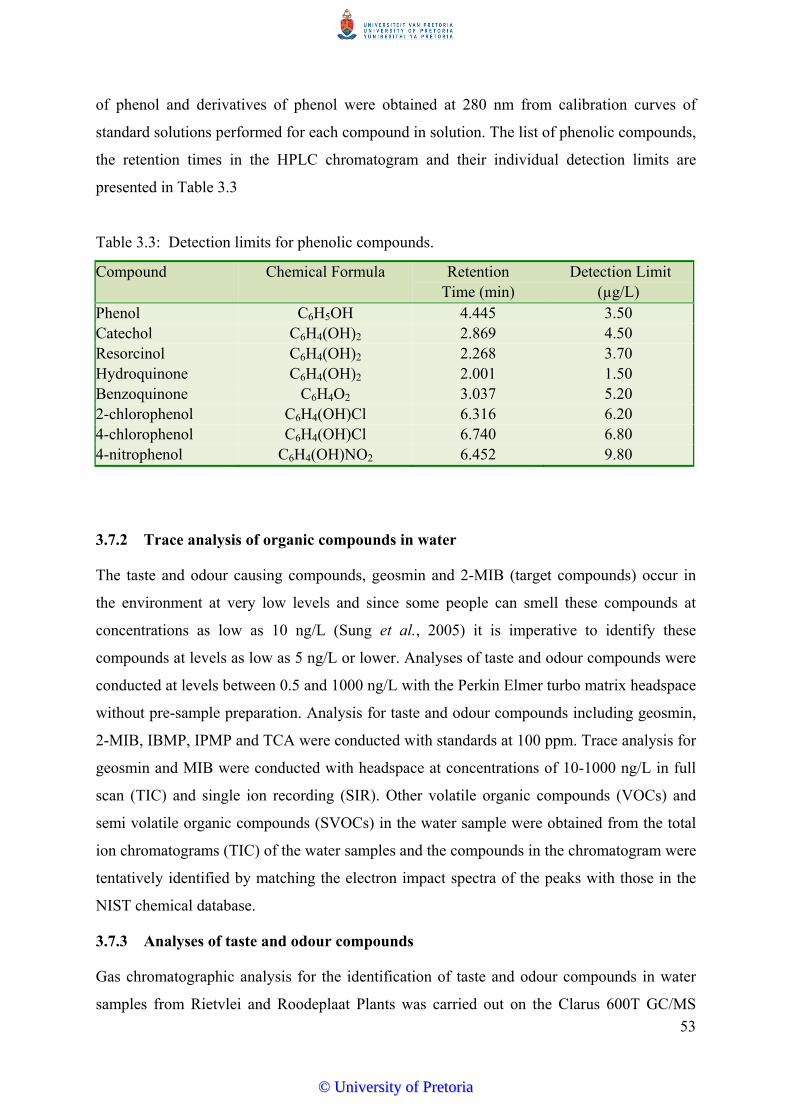
53
of phenol and derivatives of phenol were obtained at 280 nm from calibration curves of
standard solutions performed for each compound in solution. The list of phenolic compounds,
the retention times in the HPLC chromatogram and their individual detection limits are
presented in Table 3.3
Table 3.3: Detection limits for phenolic compounds.
Compound Chemical Formula Retention Time (min)
Detection Limit (µg/L)
Phenol C6H5OH 4.445 3.50 Catechol C6H4(OH)2 2.869 4.50 Resorcinol C6H4(OH)2 2.268 3.70 Hydroquinone C6H4(OH)2 2.001 1.50 Benzoquinone C6H4O2 3.037 5.20 2-chlorophenol C6H4(OH)Cl 6.316 6.20 4-chlorophenol C6H4(OH)Cl 6.740 6.80 4-nitrophenol C6H4(OH)NO2 6.452 9.80
3.7.2 Trace analysis of organic compounds in water
The taste and odour causing compounds, geosmin and 2-MIB (target compounds) occur in
the environment at very low levels and since some people can smell these compounds at
concentrations as low as 10 ng/L (Sung et al., 2005) it is imperative to identify these
compounds at levels as low as 5 ng/L or lower. Analyses of taste and odour compounds were
conducted at levels between 0.5 and 1000 ng/L with the Perkin Elmer turbo matrix headspace
without pre-sample preparation. Analysis for taste and odour compounds including geosmin,
2-MIB, IBMP, IPMP and TCA were conducted with standards at 100 ppm. Trace analysis for
geosmin and MIB were conducted with headspace at concentrations of 10-1000 ng/L in full
scan (TIC) and single ion recording (SIR). Other volatile organic compounds (VOCs) and
semi volatile organic compounds (SVOCs) in the water sample were obtained from the total
ion chromatograms (TIC) of the water samples and the compounds in the chromatogram were
tentatively identified by matching the electron impact spectra of the peaks with those in the
NIST chemical database.
3.7.3 Analyses of taste and odour compounds
Gas chromatographic analysis for the identification of taste and odour compounds in water
samples from Rietvlei and Roodeplaat Plants was carried out on the Clarus 600T GC/MS
©© UUnniivveerrssiittyy ooff PPrreettoorriiaa
54
from Perkin Elmer with modifications to methods reported by Sung and co-workers (Sung et
al., 2005); and Ikai and co-workers (Ikai et al., 2003).
Analysis of Standards
Taste and odour standard solutions (geosmin, 2-MIB, IPMP, IBMP and TCA) were injected
directly into the GC/MS as received without dilution or further treatment to obtain the
retention times and mass spectra of the individual standards as a guide to the development of
single ion recording (SIR) methods for subsequent trace analysis.
1 μL of each standard was introduced into the gas chromatograph by direct injection with the
auto sampler with injector temperature of 250°C, and separated on a Perkin Elmer Elite-5MS
capillary column (30 m x 0.25 mm, 0.5 μm film thickness). The oven was programmed at
40°C (3 min), 6°C /min to 150 (0 min), then 15°C/min to 250°C (0 min) with equilibration
time of 0.5 min using helium as carrier gas at a flow rate of 1 mL/min, split injection was
performed with a split ratio of 20:1.
A mass scan was performed in the mass range 35-350 amu, with PerkinElmer Clarus 600T
mass spectrometer with multiplier voltage of 1350 V, transfer line temperature was set at
250°C and source temperature at 180°C, and solvent delay at 3.5 min. Scans were acquired at
a scan time of 0.28 sec and inter-scan delay time of 0.02 sec, with an electron (trap) current
of 75 μA. Data acquisition and interpretation was performed with TurboMass 5.0 software.
The mass spectra of peaks of the standards were compared with the spectra of the compounds
in the mass spectral data of NIST library database in the software.
3.7.4 Method development for headspace extraction and GC/MS analysis
Low concentration of taste and odour compounds in water always necessitates extraction and
pre-concentration steps prior to gas chromatographic analysis. Extraction and pre-
concentration of taste and odour compounds at trace levels has been either by the use of solid
phase micro extraction (SPME) (Sung et al., 2005; Lawton et al., 2003; Bao et al., 1997); or
by solid phase extraction (SPE) (Ikai et al., 2003); prior to GC/MS analysis. In this study,
analyses of taste and odour compounds were conducted at levels between 0.5 and 1000 ng/L
with the Perkin Elmer Turbo Matrix Headspace (PE TMH) without SPE or SPME. The trap
in the PE TMH equipped with a purging device allows on-line extraction and concentration
©© UUnniivveerrssiittyy ooff PPrreettoorriiaa
55
of organic constituents thereby eliminating the need for offline SPME or SPE processes.
Trace analyses for geosmin and 2-MIB, were conducted with headspace at concentrations of
10-1000 ng/L in full scan mode; and 0.50-1000 ng/L, in single ion recording (SIR) mode.
Headspace extraction and sample introduction
Principles of Headspace Extraction
Dynamic headspace technique is a continuous method of extraction of volatile and semi
volatile organic components from a sample matrix by continuous flow of an inert gas, which
is coupled to a GC for automatic on line injection of extracted components onto the GC
column. The sample (gas, solid or liquid) is placed in a sealed airtight headspace vial (Perkin
Elmer, 2008) with sufficient gas volume above the sample matrix for equilibration of analyte
components between the two phases. Analyte extraction in headspace involves thermostatting
the sample matrix at a constant temperature until equilibrium of the two phases is achieved.
The purged volatiles in the gas phase are then adsorbed on a trap for subsequent desorption
onto a GC column (Kolb and Ettre, 2006). The Perkin Elmer HS 40/110 headspace sampler
allows for 1 – 4 repeat extraction steps (called trap repeat cycles) for maximised analyte
extraction onto the trap packing before desorption onto a GC column. Conditions during the
extraction and concentration processes have to be the same throughout for all samples during
a particular analysis for reproducibility of results especially for quantitative trace analysis.
Extraction Process
Sodium chloride was dried in the oven at 105°C for 3 hours, then baked in the furnace at
540°C for 12 hours; and cooled in a desiccator prior to use in head space vials to ensure
complete elimination of moisture and trace organic contaminants from the sodium chloride
salt. Solutions of the standards (0.5-1000 ng/L) were prepared in ultrapure water from the 100
mg/L standard of the taste and odour compounds. Ten millilitres (10 mL) of standard solution
of the required concentration was transferred into a headspace vial, 3 g of sodium chloride
was dissolved in the standard solution in the headspace vial; and the vials were sealed. The
sealed vials were placed into the headspace autosampler for on line extraction as described
below.
©© UUnniivveerrssiittyy ooff PPrreettoorriiaa

56
Key factors that affect the extraction efficiency of organic compounds in solution include:
Thermostat time
Oven temperature
Trap temperature.
The trap temperature was set at a temperature range of 40-280°C for all samples. Samples
were extracted at three different thermostat times with all other headspace conditions held at
a constant. Thermostat times were varied from 20-60 minutes (20, 40, and 60 minutes). The
effect of oven temperature on extraction efficiency was determined by extracting the sample
solutions under varied oven temperatures at constant thermostat time and pressure settings.
Oven temperature was set at 40, 60, 80 and 90°C.
Organic compounds in sealed headspace vials were extracted on the headspace with the
optimum conditions obtained and introduced into the GC/MS for analysis through a 0.32 mm
id. fused silica transfer line. Details of the optimum conditions obtained for headspace
extraction of the analytes in the compounds under analysis are presented in Table 3.4 and
details of the GC and MS conditions used for analysis are presented in Table 3.5.
©© UUnniivveerrssiittyy ooff PPrreettoorriiaa
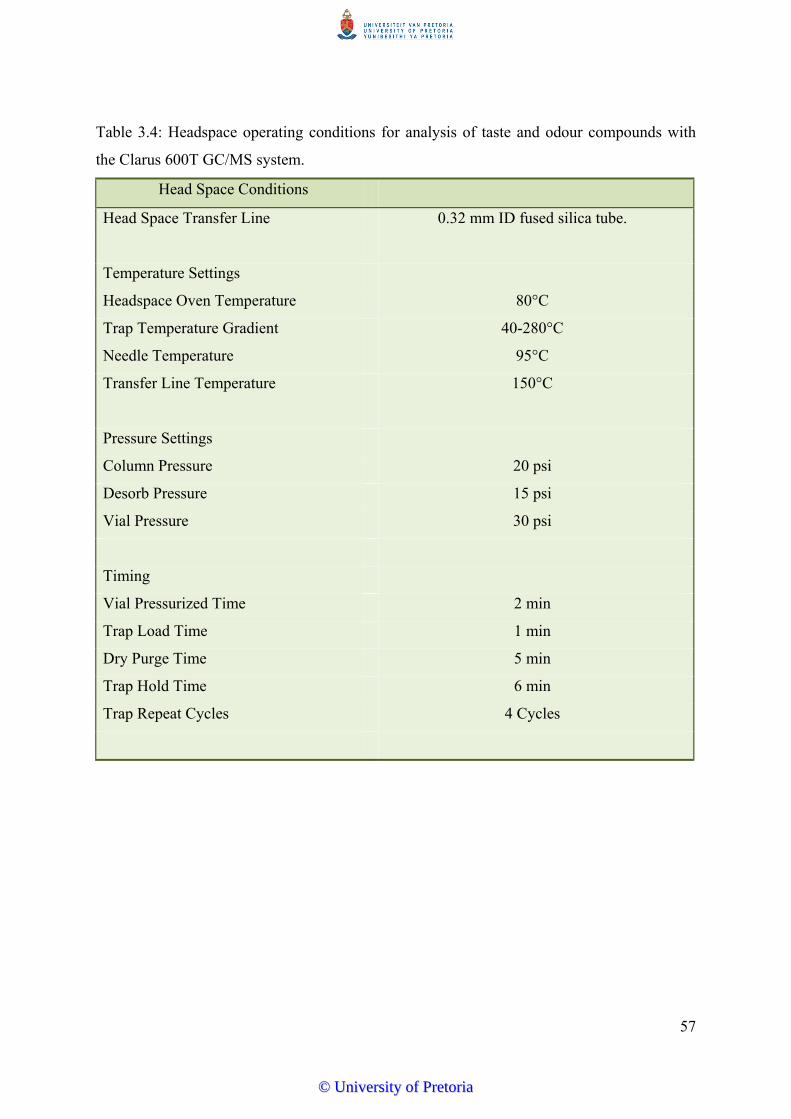
57
Table 3.4: Headspace operating conditions for analysis of taste and odour compounds with
the Clarus 600T GC/MS system.
Head Space Conditions
Head Space Transfer Line 0.32 mm ID fused silica tube.
Temperature Settings
Headspace Oven Temperature 80°C
Trap Temperature Gradient 40-280°C
Needle Temperature 95°C
Transfer Line Temperature 150°C
Pressure Settings
Column Pressure 20 psi
Desorb Pressure 15 psi
Vial Pressure 30 psi
Timing
Vial Pressurized Time 2 min
Trap Load Time 1 min
Dry Purge Time 5 min
Trap Hold Time 6 min
Trap Repeat Cycles 4 Cycles
©© UUnniivveerrssiittyy ooff PPrreettoorriiaa
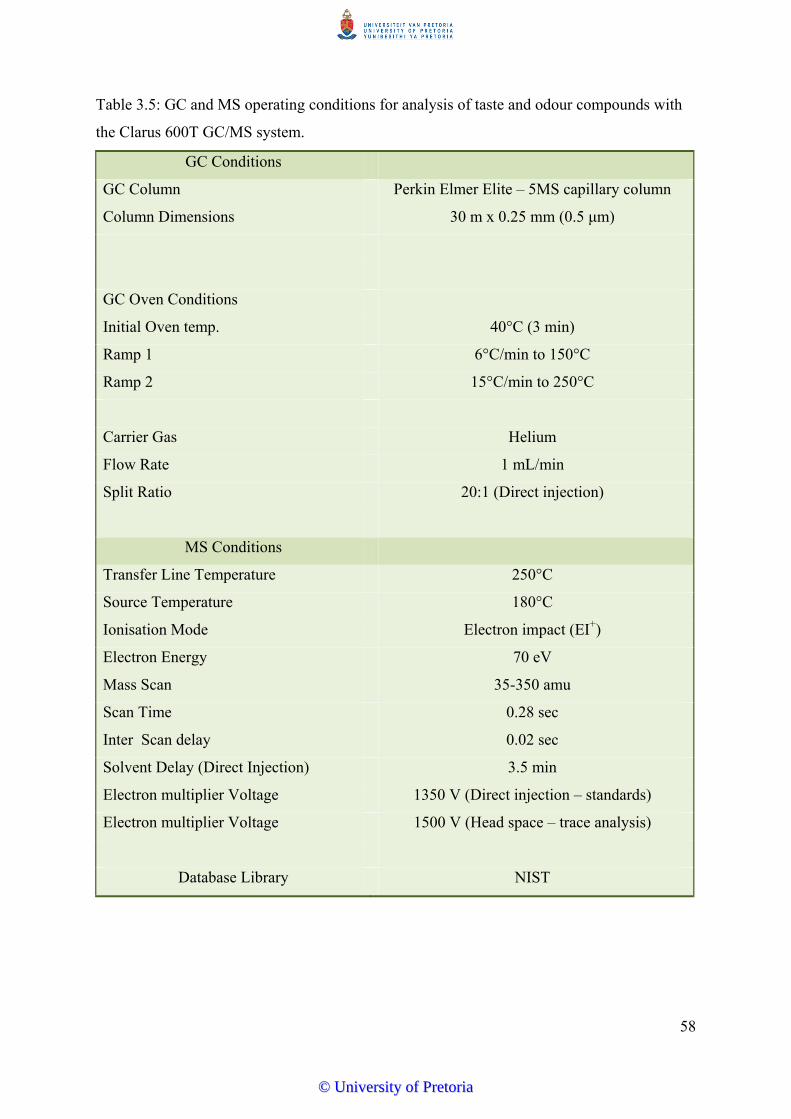
58
Table 3.5: GC and MS operating conditions for analysis of taste and odour compounds with
the Clarus 600T GC/MS system.
GC Conditions
GC Column Perkin Elmer Elite – 5MS capillary column
Column Dimensions 30 m x 0.25 mm (0.5 μm)
GC Oven Conditions
Initial Oven temp. 40°C (3 min)
Ramp 1 6°C/min to 150°C
Ramp 2 15°C/min to 250°C
Carrier Gas Helium
Flow Rate 1 mL/min
Split Ratio 20:1 (Direct injection)
MS Conditions
Transfer Line Temperature 250°C
Source Temperature 180°C
Ionisation Mode Electron impact (EI+)
Electron Energy 70 eV
Mass Scan 35-350 amu
Scan Time 0.28 sec
Inter Scan delay 0.02 sec
Solvent Delay (Direct Injection) 3.5 min
Electron multiplier Voltage 1350 V (Direct injection – standards)
Electron multiplier Voltage 1500 V (Head space – trace analysis)
Database Library NIST
©© UUnniivveerrssiittyy ooff PPrreettoorriiaa

59
The MS method for trace analysis of taste and odour compounds included five individual
functions for SIR scans for each the five compounds. This was done to obtain scans for each
compound in its own window without interference of peaks from other compounds. This
serves to improve the sensitivity for identification of trace amounts of the compounds. The
base peak and the next most prominent peak were chosen as qualifier ions for each
compound, which were used as identification ions in the SIR scans. SIR scan functions,
parameters and detection limits for each of the five taste and odour compounds are presented
in Table 3.6a.
Table 3.6a: Parameters for SIR scan functions in the MS for target analytes.
Compound Function
Number
Scan Time
Window
Quantifier
Ion
Qualifier Ions Detection
Limit (ng/L)
IPMP 2 12.0-14.0 137 124, 152 0.55
IBMP 3 14.0-16.0 124 94, 151 0.35
2-MIB 4 15.0-18.5 95 108, 110 0.30
TCA 5 18.5-20.5 195 169, 210 0.40
Geosmin 6 20.5-24 112 55, 125 (or 150) 0.15
Table 3.6b: Parameters for SIR scan functions in the MS for target analytes for degradation studies of field samples.
Compound Function
Number
Scan Time
Window
Quantifier Ion Qualifier Ions
2-MIB 2 14.5-17.0 95 108, 110
Geosmin 3 20.0-21.5 112 55, 125 (or 150)
Geosmin 4 20.0-21.5 112 111, 149
©© UUnniivveerrssiittyy ooff PPrreettoorriiaa
60
3.8 Identification and Quantification of Taste and Odour Compounds
Current data on the prevailing levels of taste and odour compounds in raw water sources in
Gauteng were not readily available. Screening of raw water sources to two major water
treatment plants (Rietvlei and Roodeplaat Plants) around Pretoria was conducted to obtain the
concentrations of geosmin and 2-MIB in the water sources. Screening was also conducted on
the filter backwash water from the treatment plants to determine the extent to which these
two compounds are retained by the filters. This would be a key factor in determining the
suitability of these secondary water sources for recycle purposes. Detailed quantitative
analysis of the taste and odour compounds gave an indication of the extent of retention of
target organic compounds by the different filter types in the Treatment Plants. Maximum
concentration of geosmin obtained from quantitative analyses was used as environmentally
significant concentration for subsequent laboratory photocatalytic degradation studies.
3.8.1 Quantification of geosmin and 2-MIB
Taste and odour compounds, geosmin and 2-MIB were positively identified and quantified
with analytic standards. Geosmin and 2-MIB were quantified by single ion recording (SIR)
scans from linear calibration curves of the individual environmental standards. The values
obtained for the geosmin and 2-MIB in the water samples from Rietvlei and Roodeplaat
treatment plants are presented in Tables 4.2 and 4.3 respectively.
3.9 Characterisation of Anatase Titanium Dioxide Powder
Anatase titanium dioxide powder used for photocatalytic degradation studies was
characterised by x-ray diffractometry (XRD) analysis; and by high resolution scanning
electron microscopy (SEM)
3.9.1 X-ray diffractometry analysis of anatase titanium dioxide powder
Crystallinity of anatase titanium dioxide powdered was examined by XRD with a
PANalytical Xpert-Pro diffractometer system equipped with an X’celerator detector; and
variable divergence and receiving slits with Fe filtered Co-Kα radiation. Anatase titanium
dioxide powder was prepared for XRD analysis using the back loading preparation method.
XRD analysis was performed with the detector in continuous scan mode operating at 35 kV
and 50 mA; and 2θ in the range of 5°-90°. The phases were identified using X’Pert Highscore
©© UUnniivveerrssiittyy ooff PPrreettoorriiaa
61
plus software. The semi quantitative phase amounts (as percentages by weight) were
estimated using the Reference Intensity Method in the X’Pert Highscore plus software.
Amorphous phases, if present, were not taken into account in the quantification. The x-ray
diffraction pattern of anatase titanium dioxide used for the study is presented in Figure 3.2.
X-ray diffraction patterns from Figure 3.2 show that the TiO2 powder has predominantly 94%
anatase phase and 6% rutile phase with no brookite present.
©© UUnniivveerrssiittyy ooff PPrreettoorriiaa
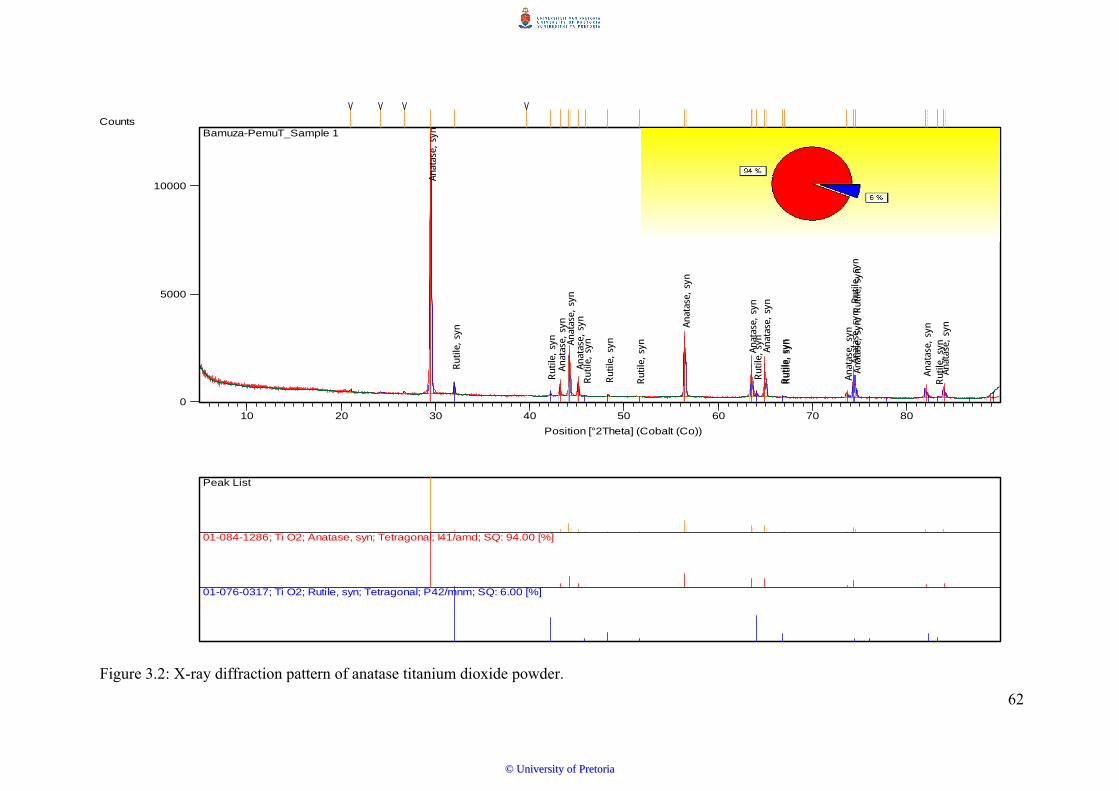
62
Position [°2Theta] (Cobalt (Co))
10 20 30 40 50 60 70 80
Counts
0
5000
10000
Anat
ase,
syn
Rut
ile, sy
n
Rut
ile, sy
nAn
atas
e, s
ynAn
atas
e, s
ynAn
atas
e, s
ynRut
ile, sy
n
Rut
ile, sy
n
Rut
ile, sy
n
Anat
ase,
syn
Anat
ase,
syn
Rut
ile, sy
nAn
atas
e, s
yn
Rut
ile, sy
nRut
ile, sy
n
Anat
ase,
syn
Anat
ase,
syn
; Rut
ile, sy
nAn
atas
e, s
yn; Rut
ile, sy
n
Anat
ase,
syn
Rut
ile, sy
nAn
atas
e, s
yn
Bamuza-PemuT_Sample 1
Peak List
01-084-1286; Ti O2; Anatase, syn; Tetragonal; I41/amd; SQ: 94.00 [%]
01-076-0317; Ti O2; Rutile, syn; Tetragonal; P42/mnm; SQ: 6.00 [%]
Figure 3.2: X-ray diffraction pattern of anatase titanium dioxide powder.
©© UUnniivveerrssiittyy ooff PPrreettoorriiaa
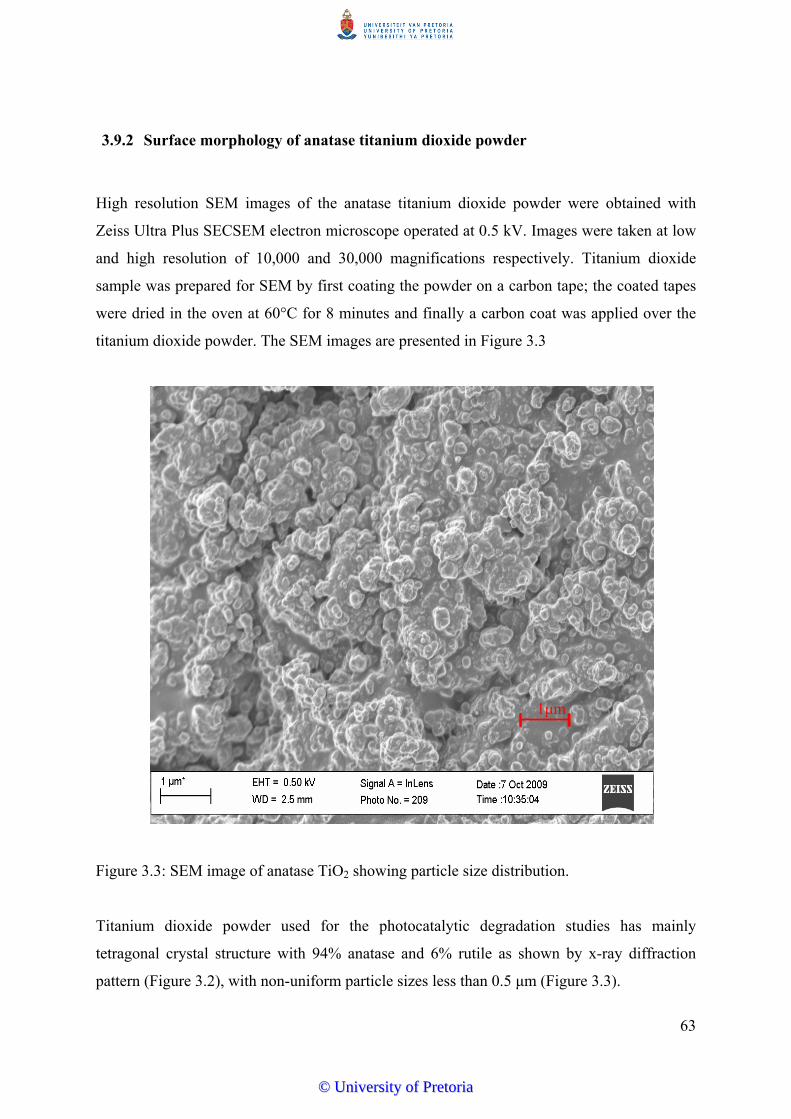
63
3.9.2 Surface morphology of anatase titanium dioxide powder
High resolution SEM images of the anatase titanium dioxide powder were obtained with
Zeiss Ultra Plus SECSEM electron microscope operated at 0.5 kV. Images were taken at low
and high resolution of 10,000 and 30,000 magnifications respectively. Titanium dioxide
sample was prepared for SEM by first coating the powder on a carbon tape; the coated tapes
were dried in the oven at 60°C for 8 minutes and finally a carbon coat was applied over the
titanium dioxide powder. The SEM images are presented in Figure 3.3
Figure 3.3: SEM image of anatase TiO2 showing particle size distribution.
Titanium dioxide powder used for the photocatalytic degradation studies has mainly
tetragonal crystal structure with 94% anatase and 6% rutile as shown by x-ray diffraction
pattern (Figure 3.2), with non-uniform particle sizes less than 0.5 μm (Figure 3.3).
1μm
©© UUnniivveerrssiittyy ooff PPrreettoorriiaa
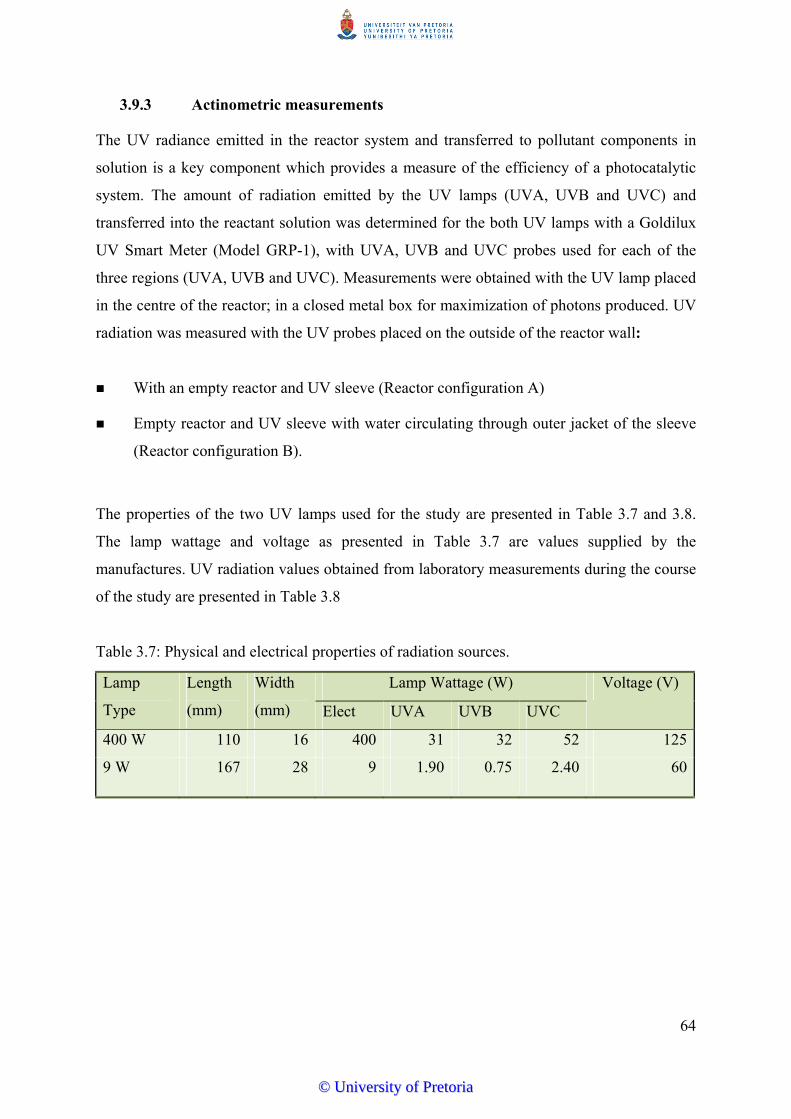
64
3.9.3 Actinometric measurements
The UV radiance emitted in the reactor system and transferred to pollutant components in
solution is a key component which provides a measure of the efficiency of a photocatalytic
system. The amount of radiation emitted by the UV lamps (UVA, UVB and UVC) and
transferred into the reactant solution was determined for the both UV lamps with a Goldilux
UV Smart Meter (Model GRP-1), with UVA, UVB and UVC probes used for each of the
three regions (UVA, UVB and UVC). Measurements were obtained with the UV lamp placed
in the centre of the reactor; in a closed metal box for maximization of photons produced. UV
radiation was measured with the UV probes placed on the outside of the reactor wall:
With an empty reactor and UV sleeve (Reactor configuration A)
Empty reactor and UV sleeve with water circulating through outer jacket of the sleeve
(Reactor configuration B).
The properties of the two UV lamps used for the study are presented in Table 3.7 and 3.8.
The lamp wattage and voltage as presented in Table 3.7 are values supplied by the
manufactures. UV radiation values obtained from laboratory measurements during the course
of the study are presented in Table 3.8
Table 3.7: Physical and electrical properties of radiation sources.
Lamp
Type
Length
(mm)
Width
(mm)
Lamp Wattage (W) Voltage (V)
Elect UVA UVB UVC
400 W 110 16 400 31 32 52 125
9 W 167 28 9 1.90 0.75 2.40 60
©© UUnniivveerrssiittyy ooff PPrreettoorriiaa
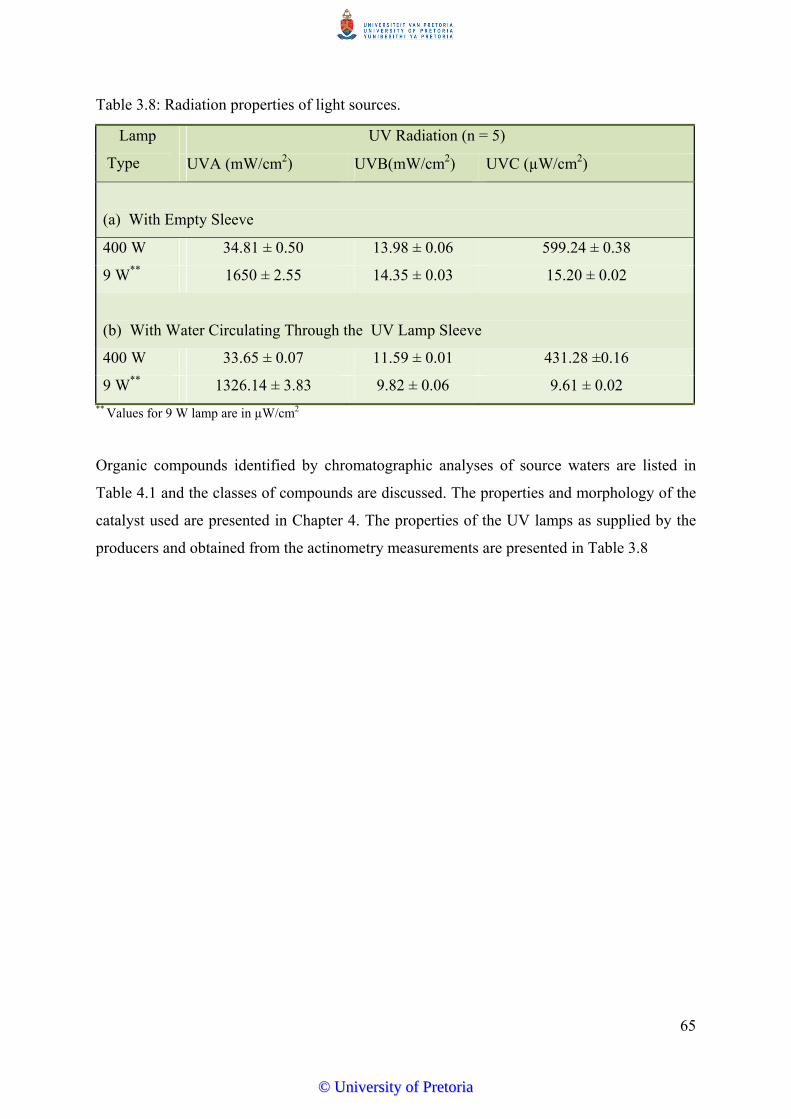
65
Table 3.8: Radiation properties of light sources.
Lamp
Type
UV Radiation (n = 5)
UVA (mW/cm2) UVB(mW/cm2) UVC (µW/cm2)
(a) With Empty Sleeve
400 W 34.81 ± 0.50 13.98 ± 0.06 599.24 ± 0.38
9 W** 1650 ± 2.55 14.35 ± 0.03 15.20 ± 0.02
(b) With Water Circulating Through the UV Lamp Sleeve
400 W 33.65 ± 0.07 11.59 ± 0.01 431.28 ±0.16
9 W** 1326.14 ± 3.83 9.82 ± 0.06 9.61 ± 0.02
** Values for 9 W lamp are in µW/cm2
Organic compounds identified by chromatographic analyses of source waters are listed in
Table 4.1 and the classes of compounds are discussed. The properties and morphology of the
catalyst used are presented in Chapter 4. The properties of the UV lamps as supplied by the
producers and obtained from the actinometry measurements are presented in Table 3.8
©© UUnniivveerrssiittyy ooff PPrreettoorriiaa
66
CHAPTER FOUR
ASSESSING THE IMPACT OF ALGAL INFESTATION ON THE ORGANIC
COMPOUND MATRIX OF SOURCE WATER
4.1 Evaluation of Natural Organic Matters in Source Waters
Suitability of a water source for potable use is usually judged based on its tactile quality (i.e.,
clarity, smell and taste). A common problem that has emerged in most water resources is the
increase in aromatic and polar organic compounds in source waters (Sproul and Ryckman,
1961; Sibali et al., 2010). This comes as a result of increasing pollution loading to water
bodies from industrial and agricultural sources (Griffini et al., 1999). Furthermore, large
nutrient inputs have been linked to algal infestation in natural water bodies resulting in high
incidence of offensive algal metabolites and humic substances. On the backdrop of the level
of algal infestation in dams in South Africa, an evaluation of source waters from Rietvlei and
Roodeplaat water treatment plants near Pretoria, South Africa; was conducted to qualitatively
characterise the organic compound matrix of the source waters and the filter backwash waters
from the treatment plants. Detailed gas chromatographic analysis was performed as described
in Sections 3.7.2 – 3.7.4 to identify the constituent organic pollutants in the water.
4.2 Predominant Organic Compounds Identified in Water Samples
Forty-two VOCs and SVOCs belonging to ten different classes of compounds were
qualitatively identified during GC/MS analysis of the water samples from filter backwash
water and source waters Rietvlei and Roodeplaat Water Treatment Works. The list of organic
compounds of environmental significance that were identified during the chromatographic
analysis is presented in Table 4.1; other organic compounds also identified are listed in Table
A1in Appendix A. Organic compounds in water samples were qualitatively identified by
mass spectral comparison with compounds in the spectral database in the Turbomass software
from the inbuilt library of chemical compounds. This was achieved by comparing the peak
distribution in the mass spectra of the unknown compounds in the water samples with the
peaks in the spectra of similar compounds in the NIST Library.
©© UUnniivveerrssiittyy ooff PPrreettoorriiaa
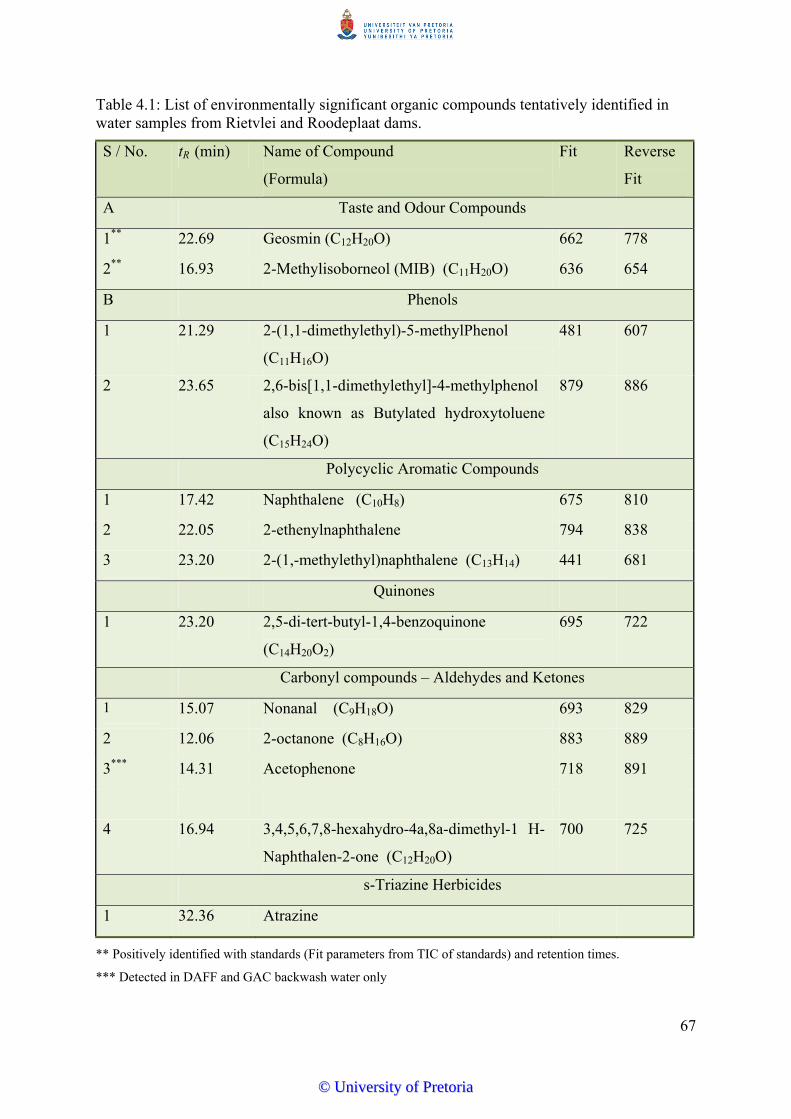
67
Table 4.1: List of environmentally significant organic compounds tentatively identified in water samples from Rietvlei and Roodeplaat dams.
S / No. tR (min) Name of Compound
(Formula)
Fit Reverse
Fit
A Taste and Odour Compounds
1** 22.69 Geosmin (C12H20O) 662 778
2** 16.93 2-Methylisoborneol (MIB) (C11H20O) 636 654
B Phenols
1 21.29 2-(1,1-dimethylethyl)-5-methylPhenol
(C11H16O)
481 607
2 23.65 2,6-bis[1,1-dimethylethyl]-4-methylphenol
also known as Butylated hydroxytoluene
(C15H24O)
879 886
Polycyclic Aromatic Compounds
1 17.42 Naphthalene (C10H8) 675 810
2 22.05 2-ethenylnaphthalene 794 838
3 23.20 2-(1,-methylethyl)naphthalene (C13H14) 441 681
Quinones
1 23.20 2,5-di-tert-butyl-1,4-benzoquinone
(C14H20O2)
695 722
Carbonyl compounds – Aldehydes and Ketones
1 15.07 Nonanal (C9H18O) 693 829
2 12.06 2-octanone (C8H16O) 883 889
3*** 14.31 Acetophenone 718 891
4 16.94 3,4,5,6,7,8-hexahydro-4a,8a-dimethyl-1 H-
Naphthalen-2-one (C12H20O)
700 725
s-Triazine Herbicides
1 32.36 Atrazine
** Positively identified with standards (Fit parameters from TIC of standards) and retention times.
*** Detected in DAFF and GAC backwash water only
©© UUnniivveerrssiittyy ooff PPrreettoorriiaa

68
The peak fitting by the software was conducted to obtain forward and reverse fit values (in a
scale of 1 to 1000). The most probable compound for each peak was chosen from the
generated list of likely compounds using both peak fit and reverse fit parameter of 500 and
above. The compounds, the individual retention times (tR) in the TIC and the NIST library
match parameters are presented in Table 4.1. The mass spectra of the analytes in the water
samples and the spectrum of the corresponding compounds from the NIST library match of
some selected compounds are presented as head to tail spectra in Appendix A. The identified
compounds are discussed grouped into the different classes of compounds and by known
applications.
4.3 Classes of Compounds
Compounds in Tables 4.1 and A1 are listed according to their different classes of organic
compounds into ten different types as follows:
Taste and odour compounds (Geosmin and 2-MIB)
Phenolic compounds (Phenols)
Polycyclic aromatic hydrocarbons (PAHs)
Quinones
Carbonyl compounds – ketones and aldehydes
s-triazine-ring herbicide
Acid esters
Indene
Alcohols
Hydrocarbons – alkanes and alkenes
4.3.1 Taste and odour compounds (geosmin and 2-MIB)
Taste and odour causing compounds when present in water even in very low concentrations
are considered offensive to the senses due to the low human threshold and are a source of
concern to the water industry. Five taste and odour causing compounds including geosmin, 2-
MIB, TCA, IBMP and IPMP; were tested for in the water samples as described in Section
3.7.4 with SIR scans using parameters listed in Table 3.5A. Only geosmin and 2-MIB of the
five taste and odour compounds tested were detected in the source water samples from
©© UUnniivveerrssiittyy ooff PPrreettoorriiaa
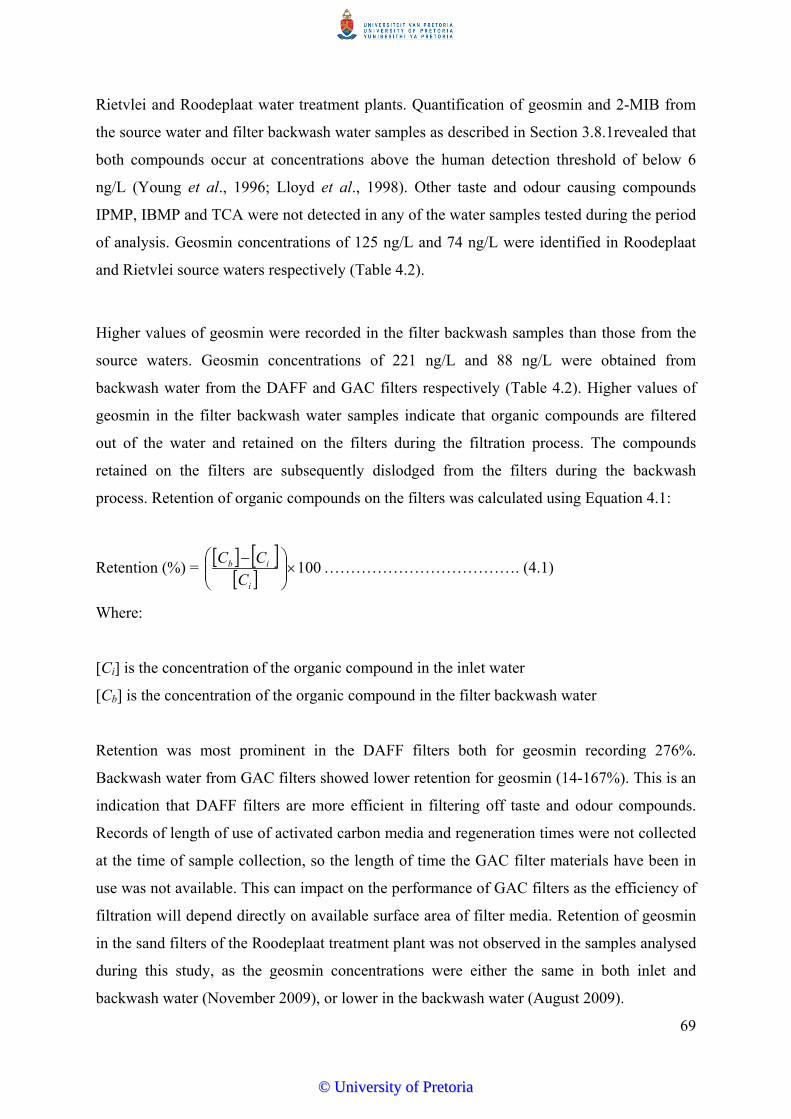
69
Rietvlei and Roodeplaat water treatment plants. Quantification of geosmin and 2-MIB from
the source water and filter backwash water samples as described in Section 3.8.1revealed that
both compounds occur at concentrations above the human detection threshold of below 6
ng/L (Young et al., 1996; Lloyd et al., 1998). Other taste and odour causing compounds
IPMP, IBMP and TCA were not detected in any of the water samples tested during the period
of analysis. Geosmin concentrations of 125 ng/L and 74 ng/L were identified in Roodeplaat
and Rietvlei source waters respectively (Table 4.2).
Higher values of geosmin were recorded in the filter backwash samples than those from the
source waters. Geosmin concentrations of 221 ng/L and 88 ng/L were obtained from
backwash water from the DAFF and GAC filters respectively (Table 4.2). Higher values of
geosmin in the filter backwash water samples indicate that organic compounds are filtered
out of the water and retained on the filters during the filtration process. The compounds
retained on the filters are subsequently dislodged from the filters during the backwash
process. Retention of organic compounds on the filters was calculated using Equation 4.1:
Retention (%) =
100
i
ib
C
CC………………………………. (4.1)
Where:
[Ci] is the concentration of the organic compound in the inlet water
[Cb] is the concentration of the organic compound in the filter backwash water
Retention was most prominent in the DAFF filters both for geosmin recording 276%.
Backwash water from GAC filters showed lower retention for geosmin (14-167%). This is an
indication that DAFF filters are more efficient in filtering off taste and odour compounds.
Records of length of use of activated carbon media and regeneration times were not collected
at the time of sample collection, so the length of time the GAC filter materials have been in
use was not available. This can impact on the performance of GAC filters as the efficiency of
filtration will depend directly on available surface area of filter media. Retention of geosmin
in the sand filters of the Roodeplaat treatment plant was not observed in the samples analysed
during this study, as the geosmin concentrations were either the same in both inlet and
backwash water (November 2009), or lower in the backwash water (August 2009).
©© UUnniivveerrssiittyy ooff PPrreettoorriiaa
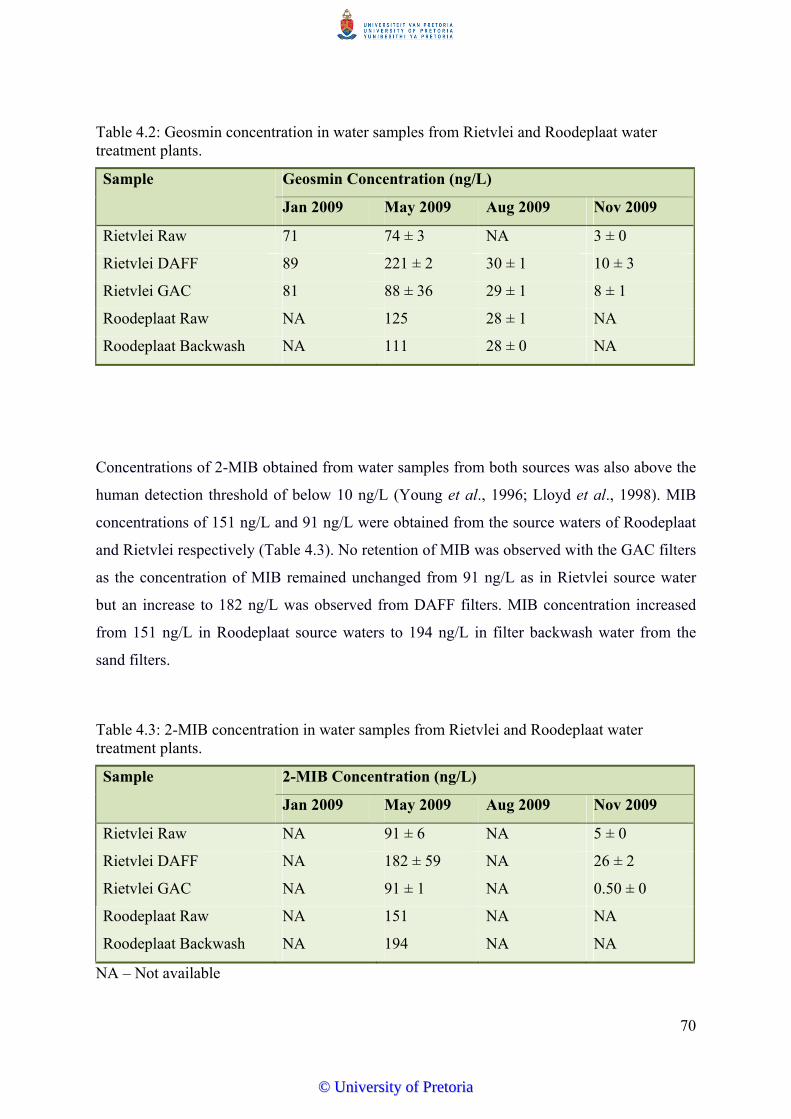
70
Table 4.2: Geosmin concentration in water samples from Rietvlei and Roodeplaat water treatment plants.
Sample Geosmin Concentration (ng/L)
Jan 2009 May 2009 Aug 2009 Nov 2009
Rietvlei Raw 71 74 ± 3 NA 3 ± 0
Rietvlei DAFF 89 221 ± 2 30 ± 1 10 ± 3
Rietvlei GAC 81 88 ± 36 29 ± 1 8 ± 1
Roodeplaat Raw NA 125 28 ± 1 NA
Roodeplaat Backwash NA 111 28 ± 0 NA
Concentrations of 2-MIB obtained from water samples from both sources was also above the
human detection threshold of below 10 ng/L (Young et al., 1996; Lloyd et al., 1998). MIB
concentrations of 151 ng/L and 91 ng/L were obtained from the source waters of Roodeplaat
and Rietvlei respectively (Table 4.3). No retention of MIB was observed with the GAC filters
as the concentration of MIB remained unchanged from 91 ng/L as in Rietvlei source water
but an increase to 182 ng/L was observed from DAFF filters. MIB concentration increased
from 151 ng/L in Roodeplaat source waters to 194 ng/L in filter backwash water from the
sand filters.
Table 4.3: 2-MIB concentration in water samples from Rietvlei and Roodeplaat water treatment plants.
Sample 2-MIB Concentration (ng/L)
Jan 2009 May 2009 Aug 2009 Nov 2009
Rietvlei Raw NA 91 ± 6 NA 5 ± 0
Rietvlei DAFF NA 182 ± 59 NA 26 ± 2
Rietvlei GAC NA 91 ± 1 NA 0.50 ± 0
Roodeplaat Raw NA 151 NA NA
Roodeplaat Backwash NA 194 NA NA
NA – Not available
©© UUnniivveerrssiittyy ooff PPrreettoorriiaa
71
South Africa has no clear sensory quality standards with regards to taste and odour; instead
the term “not objectionable” has been previously used (Pieterse, 1989; Le Roux, 1988).
Although South Africa has no clear sensory quality standards for taste and odour in potable
water, consumer complaints resulted in a survey of water bodies in South Africa in the early
1990’s. The survey conducted by Wnorowski (1992) on South African water bodies revealed
that 30% of the water bodies examined had odour problems and 50% of these problems were
attributed to geosmin. Odour problems in water in South Africa have not been completely
eliminated since the survey with recurring incidences especially in summer months. The
situation has grown worse over the years with one of the worst cases in recent years
experienced by Rand Water between September and November 2005, where high
cyanobacteria concentrations in the source water resulted in high concentrations of geosmin
in drinking water with a resultant consumer rejection (Swanepoel and Preez, 2006).
Various municipalities have on different occasions found the need to educate and placate the
consumers on the occurrence of taste and odour in their drinking water. The City of Tshwane
in its Water Quality document explained to the Residents of Pretoria North suburbs that taste
and odour problems in their tap water are due to the presence of geosmin formed due to an
increase in algal biomass in the Roodeplaat Dam. The water treatment plant has included a
treatment step to remove these odours and the levels are being continuously monitored. The
City of Cape Town had a widely reported (SABC News) case of taste and odour in the
drinking water during the weeks of February, 2012 due to blue-green algal bloom in both the
Theewaterskloof and Voёlvlei Dams. The City on its part sent out a detailed press release to
re-instil consumer confidence. Both the City of Cape Town and the City of Tshwane have
been reported to comply with the Blue Drop standards and are very highly rated.
4.3.2 Phenols
Two phenol derivatives; 2-(1,1-dimethylethyl)-5-methylphenol and 2,6-bis[1,1-
dimethylethyl]-4-methylphenol (butylated hydroxyltoluene) commonly used as preservatives
and antioxidants (Eriksson et al., 2003) were identified in water samples from the raw water
inlet and filter backwash water from both sources. Phenols are classified as water pollutants
with MCL of 0.5 μg/L set by the European Community Directive (1980), and a U.S.EPA
limit of 1 mg/L (U.S.EPA, 2009, Steiner et al., 2008) in drinking water. The ingestion of a
concentrated solution of phenol could cause severe pain and shock leading to renal damage,
©© UUnniivveerrssiittyy ooff PPrreettoorriiaa
72
circulatory collapse and eventual death. The fatal dose is of the order of 1500 mg (DWAF,
1996). Though specific limits are not stated in the South African domestic water quality
standards (SA DWQS), the range 0-1 mg/L is listed as suitable for long term intake (DWAF,
1996). Notably, the SA DWQS gives reference to the toxic concentration of 3 mg/L as
assigned for phenol by the World Health Organisation (WHO) in 1984.
The SA DWQS suggests oxidation for the treatment of phenols as they are not effectively
removed from water using conventional water treatment techniques, and discourages the use
of chlorine in treating water polluted with phenol due to the strong tendency of formation of
chlorophenols as disinfection by-products (DWAF, 1996). Additionally, phenols are prone to
partial degradation resulting in the formation of acetates and other short-chain fatty acids that
readily combine with chlorine to form haloacetic acids (HAAs) in water (Chirwa and
Bamuza-Pemu, 2010).
Butylated hydroxyltoluene can be classified as a phenol and a toluene. Potential health effects
from toluene ingestion include nervous system, kidney or liver problems and the U.S.EPA
has set the MCL and MCLG for toluene at 1 mg/L (U.S.EPA, 2009).
4.3.3 Polycyclic aromatic hydrocarbons
The data from source water samples from both Rietvlei and Roodeplaat show the presence of
at least three PAH compounds, i.e, naphthalene, 2-ethenylnaphthalene and 2-(1-methylethyl)
naphthalene. Potential health risks associated with PAHs include reproductive difficulties and
carcinogenity (U.S.EPA, 2009). PAHs are of serious environmental concern because they are
microbially recalcitrant and have high bioaccumulation potential (Martens and
Frankenberger, 1995); and are toxic, having mutagenic and carcinogenic properties (Maila
and Cloete 2002). PAHs are resistant to conventional oxidation and biodegrade slowly;
requiring 60 days for complete degradation of naphthalene under natural conditions. Up to
120 days may be required to achieve 5-87% degradation for higher molecular weight PAHs
(Ashok et al., 1995). Photocatalytic degradation is suggested as faster process for treatment
of such compounds to enhance their removal from water and reduce the chances of their build
up in the treatment train. Presence of PAHs in source waters could also result in the
formation DBPs from breakdown products on chlorination.
©© UUnniivveerrssiittyy ooff PPrreettoorriiaa
73
PAHs pollution is usually related to industrial sources and especially the petroleum and the
petrochemical industries and from vehicle exhaust fumes (Bacaloni et al., 2004; Maila and
Cloete, 2002). Their presence in source waters of the Rietvlei and Roodeplaat Water
Treatment Works cannot be attributed to boating activities Rietvlei dam is home to a sailing
club and use of motor boats is restricted to rescue operations only. It is suspected that their
presence is largely from PAHs in the air from coal burning and from heavy industrial
activities from the Kempton Park area.
4.3.4 Carbonyl Compounds
Carbonyl compounds may contribute to taste and odour problems in the water. Up to four
carbonyl compounds including 2-octanone and acetophenone (Table 4.1) were identified in
the source water samples. Accumulation of these compounds in the treatment train could
exercabate the problems caused by the taste and odour compounds such as geosmin and 2-
MIB as described earlier in this section. The South African DWAF has threshold
concentration of 0.5 mg/L for acetophenone for tainting of organism flesh in water (DWAF
1995). It is classified as a group D compound by the US Environmental Protection Agency
(U.S.EPA, 2000). Acetophenone was detected only in the backwash water from the DAFF
and GAC filters. This could be due to the retention and concentration of the compound in the
filters during the process of filtration.
3,4,5,6,7,8-hexahydro-4a,8a-dimethyl-1-H-naphthalen-2-one is often used as a precursor or
an intermediate in the laboratory preparation of geosmin (Saito et al., 1996, Hansson et al.,
1990) and might be a degradation product (intermediate) in the process of natural degradation
of geosmin in surface water samples.
4.3.5 Acid Esters
Four acid esters were identified in the water samples. These include three short chain acid
esters (C3 – C4) and one long chain fatty acid (C18). The short chain acid esters include
propanoic acid; 2-methyl-2,2-dimethyl-1-[2-hydroxylmethyl]propylester (MDHP), propanoic
acid, 2-methyl-1-[1,1-dimethyl]-2-methyl-3-propanediylester (MDMP) and butanoic acid,
methyl ester. The only long chain fatty acid identified in all the water samples is octadecanoic
acid, ethenylester.
©© UUnniivveerrssiittyy ooff PPrreettoorriiaa

74
Esters have distinctive fruit-like odours, and are commonly used in artificial flavourings and
fragrances; and widely used as chemical additives in plasticisers. Due to their various
applications they have been identified in diverse environmental samples including
groundwater, river water, drinking water, open ocean water, soil, lake and marine sediments
(Jianlong et al., 2004). Though methyl esters in the range of C8-C18 are believed to be non-
toxic, their presence in water could contribute to taste and odour in the water. Higher
molecular weight acid esters could be health hazards as recent research suggests that women
have a unique exposure profile to phthalates, which raises concern about the potential health
hazards posed by such exposures (Lovekamp-Swan and Davis, 2003).
4.3.6 s-Triazine-ring herbicide (Atrazine)
GC/MS analysis of SPE extracts of water samples from the Rietvlei Treatment Plant revealed
the presence of a very weak atrazine peak only in the raw water and the DAFF backwash
water samples. Atrazine was not detected in the GC spectrum of filter backwash water from
the GAC filters. This could be due to the adsorption of organic compounds on the surface of
activated carbon. Atrazine was not detected in samples analysed on the headspace GC/MS
system. This could be due either to its existence at concentrations close to the lower detection
limits, or due to the limitation of the use of headspace for the extraction of sufficiently
volatilisable compounds with boiling points below 280°C.
Atrazine is an s-triazine-ring herbicide commonly discharged in industrial effluents and as
runoff from agriculture land. The U.S.EPA has set a 3 µg/L limit for atrazine. Research has
linked abnormal sexual developments in frogs to exposure to atrazine (Sanders, 2002).
Though the use of atrazine on heavy clay soils was withdrawn in 1977 in South Africa and
the industrial use of atrazine was withdrawn on 31 March 1995, no strong measures have
been put in place to enforce the ban. In a study of residual amounts of atrazine, Tshipala
(2000) reported levels of 3-20 µg/L in South African surface waters and 0.29-4.36 µg/L in
ground waters indicating its continued use. The detection of atrazine in source water samples
from the Rietvlei dam indicates that it could be as a result of runoffs from farm lands around
the dam.
©© UUnniivveerrssiittyy ooff PPrreettoorriiaa
75
4.3.7 Alcohols and hydrocarbons
Alcohols identified in the samples include 2-propylcyclohexanol and 2,2,3,3-
tetramethylcyclopropanemethanol. A majority (20) of the compounds identified are straight
and branched chains hydrocarbons (paraffins) ranging from C6-C10 (Table A1). These are
major components of fractionation products of petrol and from burning of coal and are
common air pollutants. There is no reported health or environmental hazards associated with
alcohols and lower molecular weight hydrocarbons but their presence in water samples going
into the water treatment train could result in the formation of DBPs after chlorination.
4.4 Degradation Studies
Photocatalytic and photolytic studies were conducted on compounds chosen to represent
classes of organic compounds identified in source waters listed on Table 4.1. Phenol, a very
common water pollutant was chosen to represent aromatic compounds and geosmin was
chosen to represent volatile, common taste and odour causing compounds. Laboratory scale
experiments were conducted using these model compounds and the results obtained are
discussed in Chapter 5 for phenol and phenolic compounds and Chapter 6 for geosmin.
Preliminary studies were conducted to test the effect of light intensity on degradation
efficiency of geosmin by treating environmentally significant concentration of geosmin (220
ng/L) with both the low pressure 9 W UV lamp and the medium pressure 400 W UV lamp
using TiO2 concentration of 40 mg/L. Under these conditions, geosmin was rapidly degraded
by photocatalysis with the medium pressure lamp achieving 95.8% removal in 60 minutes.
The low pressure lamp under the same reaction conditions achieved only 49.6% removal after
60 minutes of treatment. Photocatalytic degradation results indicate a direct relationship
between the degradation rates and the UV light intensity with improved degradation on
increasing the photonic input from 1326 µW/cm2 (9 W UV lamp) to 33.65 mW/cm2 (400 W
UV lamp) (Figures 4.1).
©© UUnniivveerrssiittyy ooff PPrreettoorriiaa
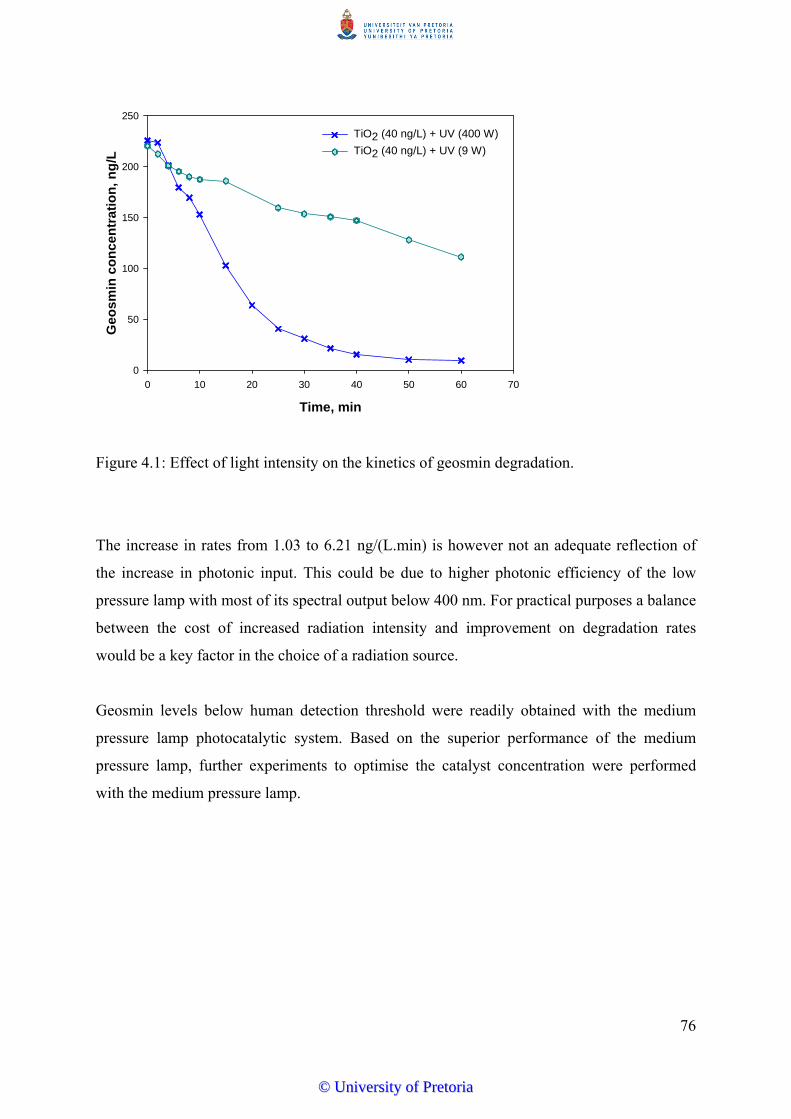
76
Time, min
0 10 20 30 40 50 60 70
Geo
smin
con
cent
ratio
n, n
g/L
0
50
100
150
200
250
TiO2 (40 ng/L) + UV (400 W)
TiO2 (40 ng/L) + UV (9 W)
Figure 4.1: Effect of light intensity on the kinetics of geosmin degradation.
The increase in rates from 1.03 to 6.21 ng/(L.min) is however not an adequate reflection of
the increase in photonic input. This could be due to higher photonic efficiency of the low
pressure lamp with most of its spectral output below 400 nm. For practical purposes a balance
between the cost of increased radiation intensity and improvement on degradation rates
would be a key factor in the choice of a radiation source.
Geosmin levels below human detection threshold were readily obtained with the medium
pressure lamp photocatalytic system. Based on the superior performance of the medium
pressure lamp, further experiments to optimise the catalyst concentration were performed
with the medium pressure lamp.
©© UUnniivveerrssiittyy ooff PPrreettoorriiaa
77
CHAPTER FIVE
PHOTOCATALYTIC AND PHOTOLYTIC DEGRADATION OF PHENOLIC
COMPOUNDS
5.1 Motivation for Study of Phenolics
Results from analysis of source waters from the treatment plants showed the presence of
several aromatic compounds including phenolic compounds and PAHs (Table 4.1). Among
the aromatic groups, the congeners of benzene and their oxidised and halogenated forms are
widely disposed to natural waters from agricultural and industrial sources (Barakat et al.,
2005). Due to a wide variety of uses of phenolic compounds, their incidence in source waters
is very common especially in areas near human settlements. Additionally, natural organic
materials (NOMs) such as humic acid and fulvic acid can degrade partially into phenolic and
aliphatic products, which readily form halogenated products such as chlorophenols (CPs),
haloacetic acids (HAAs) and trihalomethanes (THMs) during chlorination of the water
(Johnstone, 2009). Phenol was chosen as a model organic pollutant to represent the group of
aromatic organic compounds identified during chromatographic analysis for photocatalytic
study. Photocatalytic degradation of three derivatives of phenol (2-chlorophenol, 4-
chlorophenol and nitrophenol) was also studied to ascertain the effect of substituent groups
on degradation of aromatic compounds. Geosmin (cyanobacterial metabolite) was chosen as
a model compound to represent the taste and odour compounds as the levels of both geosmin
and 2-MIB obtained during analysis was higher than the human detection threshold (Table
4.2 and 4.3).
Research has shown the effectiveness of photocatalysis for the degradation (and sometimes
the mineralisation) of a variety of organic compounds. The chapter evaluates the
effectiveness of the photolytic and photocatalytic systems developed for degrading solutions
of phenol and three derivatives of phenol including nitrophenol, 2-chlorophenol and 4-
chlorophenol. The structures of the phenol and the chloro- and nitro derivatives of phenol are
presented in Figure 2.2.
©© UUnniivveerrssiittyy ooff PPrreettoorriiaa

78
Photolysis and photocatalysis of phenol was conducted without aeration and the effect of
oxygen on the system was evaluated by degradation studies in aerated systems. The fate of
major degradation intermediates formed during photocatalysis of phenol was also monitored
during the course of the study to give an insight into determining a degradation pathway.
Photocatalysis of the three derivatives of phenol as individual pollutants in solution; and as a
mixture (of phenol and all three derivatives) was conducted to better understand the
degradation behaviour of these compounds when pollutants compete in solution for reactive
species. Kinetic models for the various systems were developed to give valuable information
necessary for a better understanding of the photocatalytic system.
5.2 Photocatalytic Degradation of Phenol
Solutions of phenol of the desired concentrations were prepared by spiking ultrapure water
with the pre-determined and weighed amounts of phenol crystals. Photocatalytic degradation
experiments of phenol (10 mg/L) were carried out with the experimental setup configuration
A and experiments with phenol (20-30 mg/L) configuration B (Figure 3.1). One litre of the
prepared phenol solution was used for each batch of degradation studies and experiments
were conducted as described in Sections 3.4 and 3.5. Temperature control in the reactor was
not very effective with setup configuration A as temperature in the reactor sometimes varied
from 25oC to 40oC. Modification of reactor setup A to B with having a cooling sleeve in the
UV lamp jacket improved temperature control within the reactor and temperature were
maintained between 25-30oC.
The effect of initial pollutant concentration on the photocatalytic degradation efficiency of
phenol solutions was studied across three phenol concentrations (10, 20 and 30 mg/L) with
anatase titanium dioxide powder dispersed in solution exposed to UV irradiation (400 W).
These experimental batches were conducted without aeration of the batch systems.
Optimum catalyst concentration is a key factor in the performance of a photocatalytic system
as excess catalyst leads to decreased efficiencies due to UV photon screening effects (Chirwa
and Bamuza-Pemu, 2010; Ahmed et al., 2010; Černigoj et al., 2007; Gogate and Pandit,
2004; Herrmann, 1999). The amount of catalyst available is critical to the efficiency of a
photocatalytic system for pollutant degradation in environmental applications as there exists
©© UUnniivveerrssiittyy ooff PPrreettoorriiaa
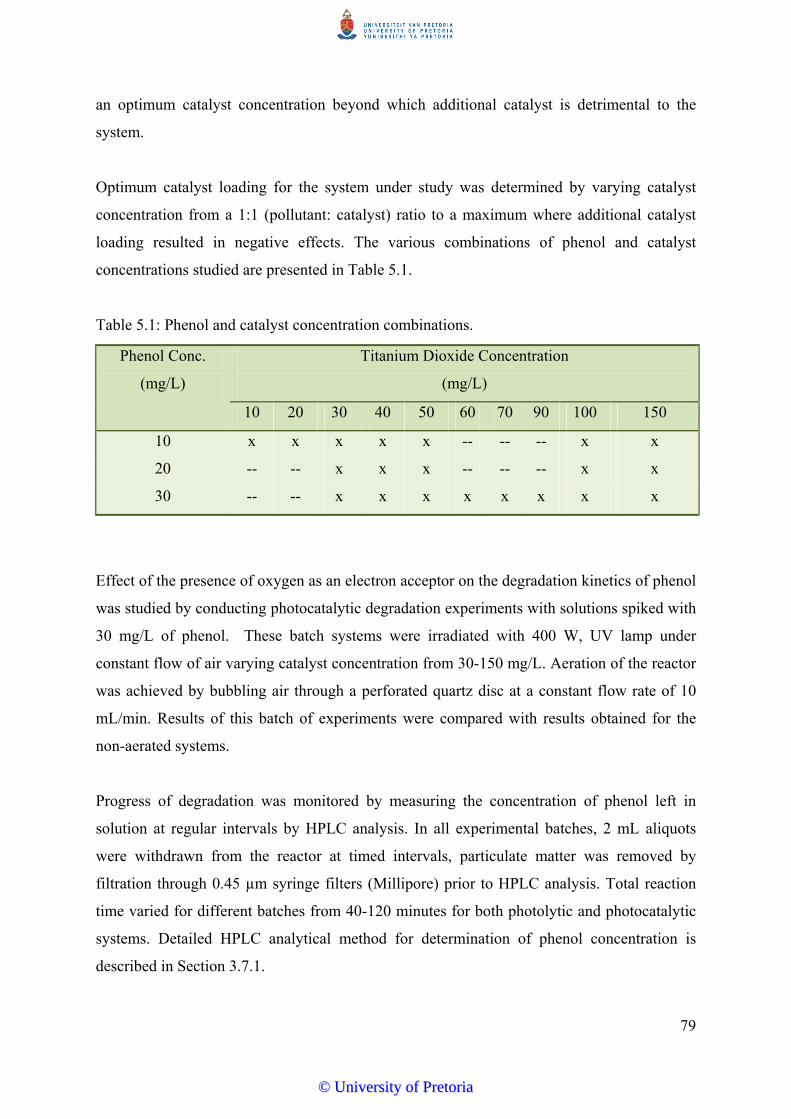
79
an optimum catalyst concentration beyond which additional catalyst is detrimental to the
system.
Optimum catalyst loading for the system under study was determined by varying catalyst
concentration from a 1:1 (pollutant: catalyst) ratio to a maximum where additional catalyst
loading resulted in negative effects. The various combinations of phenol and catalyst
concentrations studied are presented in Table 5.1.
Table 5.1: Phenol and catalyst concentration combinations.
Phenol Conc.
(mg/L)
Titanium Dioxide Concentration
(mg/L)
10 20 30 40 50 60 70 90 100 150
10 x x x x x -- -- -- x x
20 -- -- x x x -- -- -- x x
30 -- -- x x x x x x x x
Effect of the presence of oxygen as an electron acceptor on the degradation kinetics of phenol
was studied by conducting photocatalytic degradation experiments with solutions spiked with
30 mg/L of phenol. These batch systems were irradiated with 400 W, UV lamp under
constant flow of air varying catalyst concentration from 30-150 mg/L. Aeration of the reactor
was achieved by bubbling air through a perforated quartz disc at a constant flow rate of 10
mL/min. Results of this batch of experiments were compared with results obtained for the
non-aerated systems.
Progress of degradation was monitored by measuring the concentration of phenol left in
solution at regular intervals by HPLC analysis. In all experimental batches, 2 mL aliquots
were withdrawn from the reactor at timed intervals, particulate matter was removed by
filtration through 0.45 µm syringe filters (Millipore) prior to HPLC analysis. Total reaction
time varied for different batches from 40-120 minutes for both photolytic and photocatalytic
systems. Detailed HPLC analytical method for determination of phenol concentration is
described in Section 3.7.1.
©© UUnniivveerrssiittyy ooff PPrreettoorriiaa

80
5.3 Photocatalytic Degradation Efficiency of Phenol
Effective treatment and removal of phenol in solution by photocatalysis depended on phenol
concentration, catalyst concentration and aeration. The degradation efficiency of phenol is
discussed in Section 5.3.1, while effects of initial phenol concentration on degradation
efficiency and the effects of catalyst concentration are discussed in Sections 5.3.2 and 5.3.3
respectively.
5.3.1 Degradation efficiency of phenol
Figures 5.1(a) – (c) show the degradation profiles of experiments conducted at initial phenol
concentration of 10-30 mg/L, photolysed with UV radiation alone and photocatalysed with
UV/TiO2, varying catalyst concentration from 10-150 mg/L. Degradation of phenol below
detection limit was achieved at these concentrations after 15-35 minutes of treatment (for
initial phenol concentration of 10 mg/L), 60-100 minutes for initial phenol concentration of
20 mg/L and 120 minutes for solutions with initial phenol concentration of 30 mg/L.
©© UUnniivveerrssiittyy ooff PPrreettoorriiaa
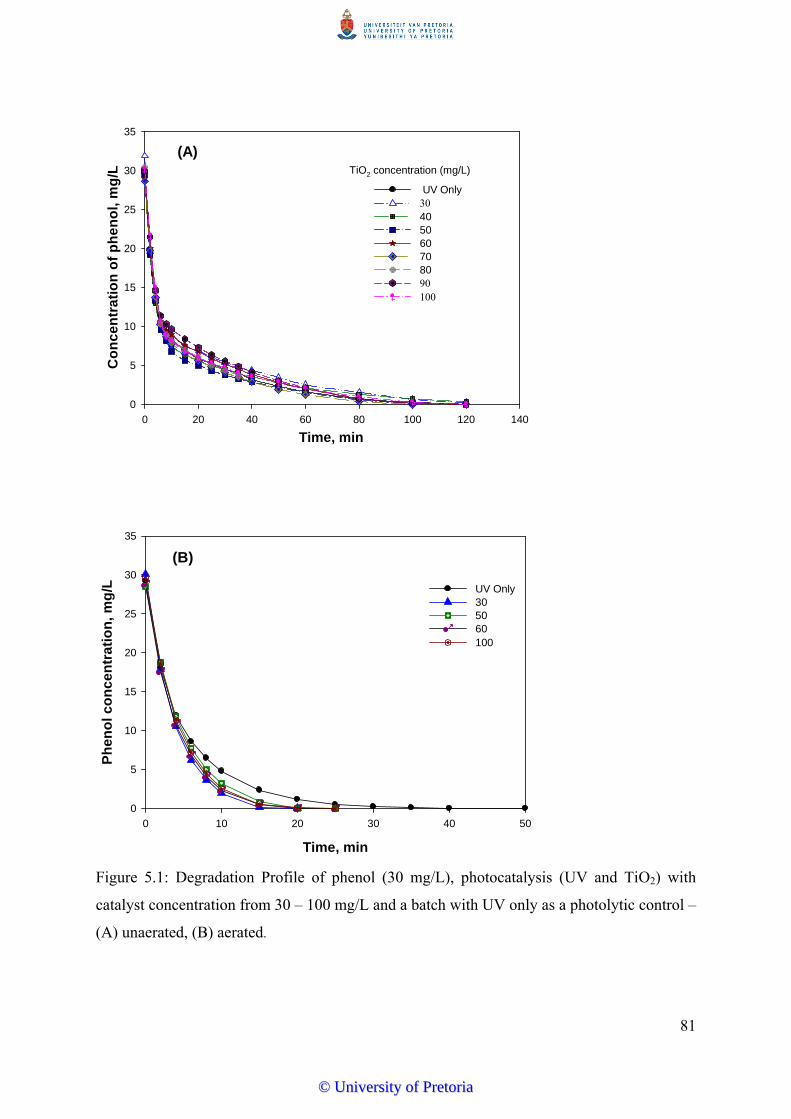
81
Time, min0 20 40 60 80 100 120 140
Con
cent
ratio
n of
phe
nol,
mg/
L
0
5
10
15
20
25
30
35
UV Only 30 40 5060708090100
TiO2 concentration (mg/L)
(A)
Time, min
0 10 20 30 40 50
Phen
ol c
once
ntra
tion,
mg/
L
0
5
10
15
20
25
30
35
UV Only 30 50 60 100
(B)
Figure 5.1: Degradation Profile of phenol (30 mg/L), photocatalysis (UV and TiO2) with
catalyst concentration from 30 – 100 mg/L and a batch with UV only as a photolytic control –
(A) unaerated, (B) aerated.
©© UUnniivveerrssiittyy ooff PPrreettoorriiaa
82
5.3.2 Effect of initial pollutant concentration
Degradation efficiency of phenol measured as degradation rates was calculated as the rates of
change in concentration of phenol as a function of time of reaction.
to
to
tt
CCR
][][
(5.1)
Where:
R = Rate of pollutant degradation (mg/(L. min)),
[C]o = initial concentration of pollutant (mg/L),
[C]t = concentration of pollutant at time t (mg/L),
to = time at concentration Co (minutes), and
tt = time at concentration Ct (minutes).
Degradation efficiency of phenol measured as degradation rates decreased with increasing
initial phenol concentration at constant titanium dioxide concentration in solution. Efficiency
of the photocatalytic system is measured as the quantum yield which is defined as “the rate at
which molecules undergo a given event per photons absorbed per unit time” (Serpone, 1997)
or “as the number of events occurring per photon absorbed” (Linsebingler et al., 1995).
In this study, highest degradation rates were obtained for solutions of phenol at concentration
of 10 mg/L (representing the lowest concentration of phenol studied) for the photolytic and
the photocatalytic systems across all TiO2 concentrations studied (Table 5.2). Increase in
initial phenol concentration from 10 mg/L to 20 mg/L resulted in a decrease in degradation
rates ranging between 30-51% (from 0.49 mg/(L.min) to 0.39 mg/(L.min)). Impact of a
further increase in the initial phenol concentration from 20 mg/L to 30 mg/L on degradation
rates ranged from 6% to 29%. However, an increase in phenol concentration from 20 to 30
mg/L at titanium dioxide concentrations of 30 and 100 mg/L resulted in a slight increase in
rates from 0.249 to 0.264 mg(L.min).
Degradation rates are governed by the availability and effective contact of reactive species
(hydroxyl radicals) in solution and (positive holes) on the catalyst surface with pollutant
©© UUnniivveerrssiittyy ooff PPrreettoorriiaa
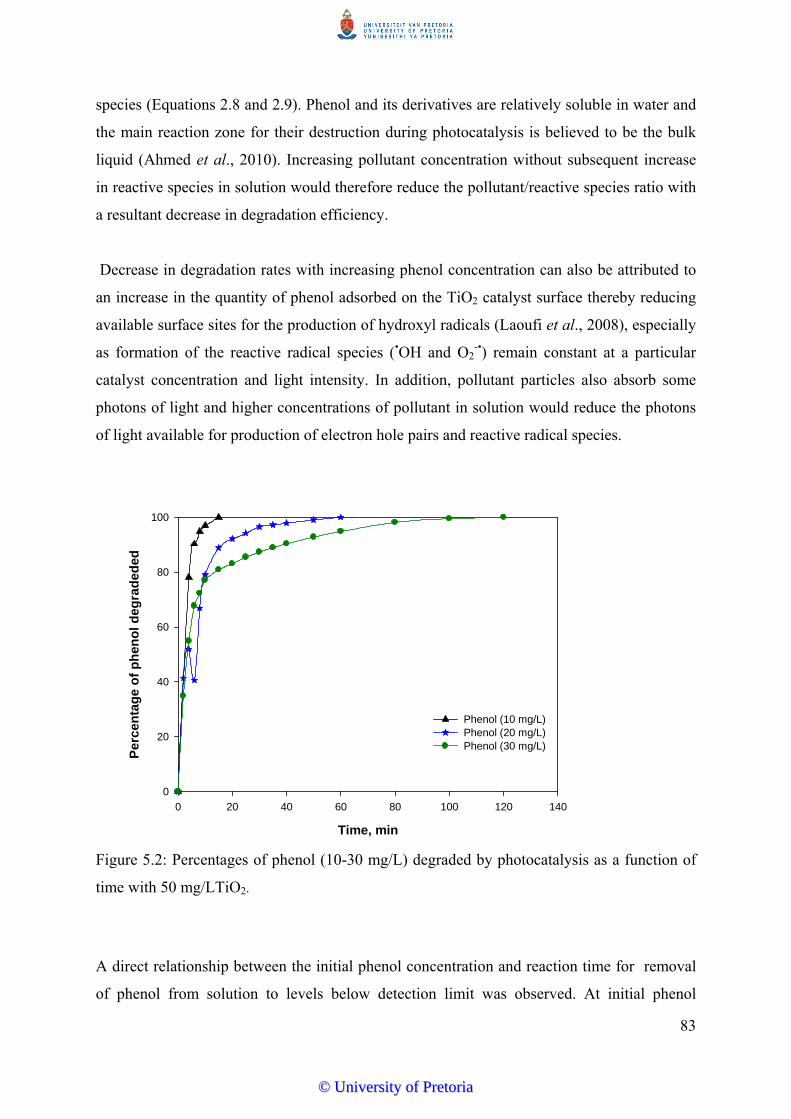
83
species (Equations 2.8 and 2.9). Phenol and its derivatives are relatively soluble in water and
the main reaction zone for their destruction during photocatalysis is believed to be the bulk
liquid (Ahmed et al., 2010). Increasing pollutant concentration without subsequent increase
in reactive species in solution would therefore reduce the pollutant/reactive species ratio with
a resultant decrease in degradation efficiency.
Decrease in degradation rates with increasing phenol concentration can also be attributed to
an increase in the quantity of phenol adsorbed on the TiO2 catalyst surface thereby reducing
available surface sites for the production of hydroxyl radicals (Laoufi et al., 2008), especially
as formation of the reactive radical species (•OH and O2-•) remain constant at a particular
catalyst concentration and light intensity. In addition, pollutant particles also absorb some
photons of light and higher concentrations of pollutant in solution would reduce the photons
of light available for production of electron hole pairs and reactive radical species.
Time, min
0 20 40 60 80 100 120 140
Perc
enta
ge o
f phe
nol d
egra
dede
d
0
20
40
60
80
100
Phenol (10 mg/L)Phenol (20 mg/L)Phenol (30 mg/L)
Figure 5.2: Percentages of phenol (10-30 mg/L) degraded by photocatalysis as a function of
time with 50 mg/LTiO2.
A direct relationship between the initial phenol concentration and reaction time for removal
of phenol from solution to levels below detection limit was observed. At initial phenol
©© UUnniivveerrssiittyy ooff PPrreettoorriiaa
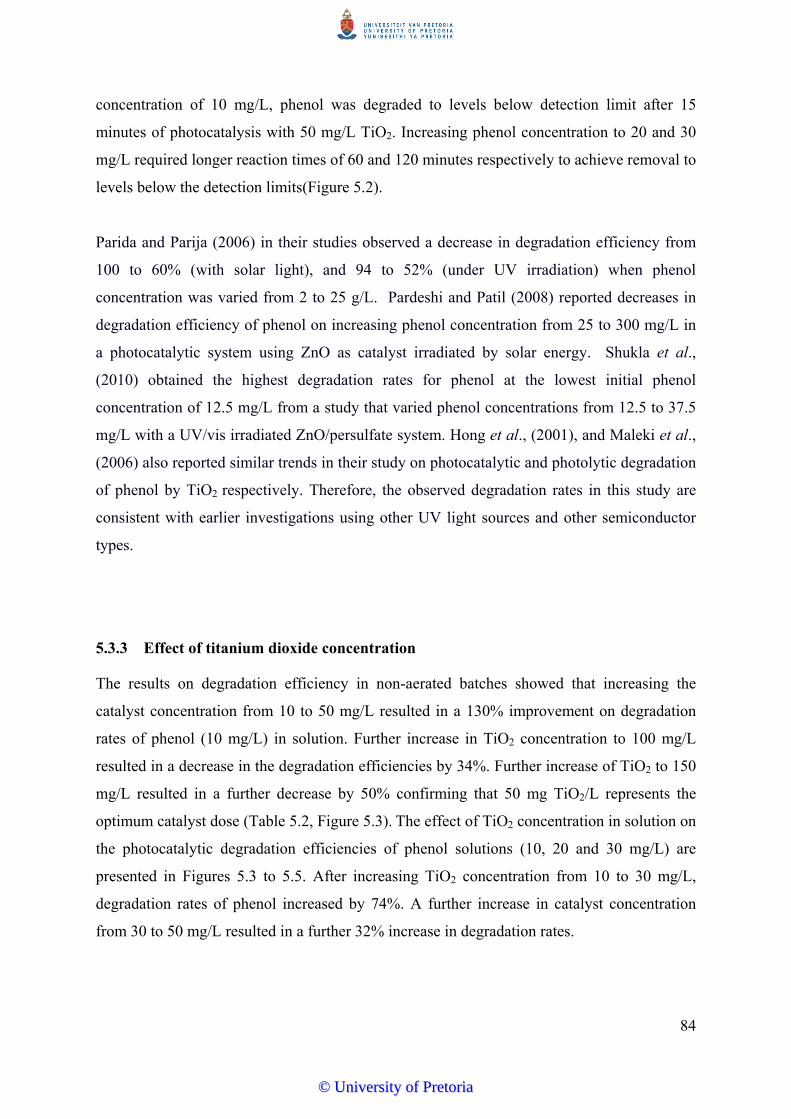
84
concentration of 10 mg/L, phenol was degraded to levels below detection limit after 15
minutes of photocatalysis with 50 mg/L TiO2. Increasing phenol concentration to 20 and 30
mg/L required longer reaction times of 60 and 120 minutes respectively to achieve removal to
levels below the detection limits(Figure 5.2).
Parida and Parija (2006) in their studies observed a decrease in degradation efficiency from
100 to 60% (with solar light), and 94 to 52% (under UV irradiation) when phenol
concentration was varied from 2 to 25 g/L. Pardeshi and Patil (2008) reported decreases in
degradation efficiency of phenol on increasing phenol concentration from 25 to 300 mg/L in
a photocatalytic system using ZnO as catalyst irradiated by solar energy. Shukla et al.,
(2010) obtained the highest degradation rates for phenol at the lowest initial phenol
concentration of 12.5 mg/L from a study that varied phenol concentrations from 12.5 to 37.5
mg/L with a UV/vis irradiated ZnO/persulfate system. Hong et al., (2001), and Maleki et al.,
(2006) also reported similar trends in their study on photocatalytic and photolytic degradation
of phenol by TiO2 respectively. Therefore, the observed degradation rates in this study are
consistent with earlier investigations using other UV light sources and other semiconductor
types.
5.3.3 Effect of titanium dioxide concentration
The results on degradation efficiency in non-aerated batches showed that increasing the
catalyst concentration from 10 to 50 mg/L resulted in a 130% improvement on degradation
rates of phenol (10 mg/L) in solution. Further increase in TiO2 concentration to 100 mg/L
resulted in a decrease in the degradation efficiencies by 34%. Further increase of TiO2 to 150
mg/L resulted in a further decrease by 50% confirming that 50 mg TiO2/L represents the
optimum catalyst dose (Table 5.2, Figure 5.3). The effect of TiO2 concentration in solution on
the photocatalytic degradation efficiencies of phenol solutions (10, 20 and 30 mg/L) are
presented in Figures 5.3 to 5.5. After increasing TiO2 concentration from 10 to 30 mg/L,
degradation rates of phenol increased by 74%. A further increase in catalyst concentration
from 30 to 50 mg/L resulted in a further 32% increase in degradation rates.
©© UUnniivveerrssiittyy ooff PPrreettoorriiaa
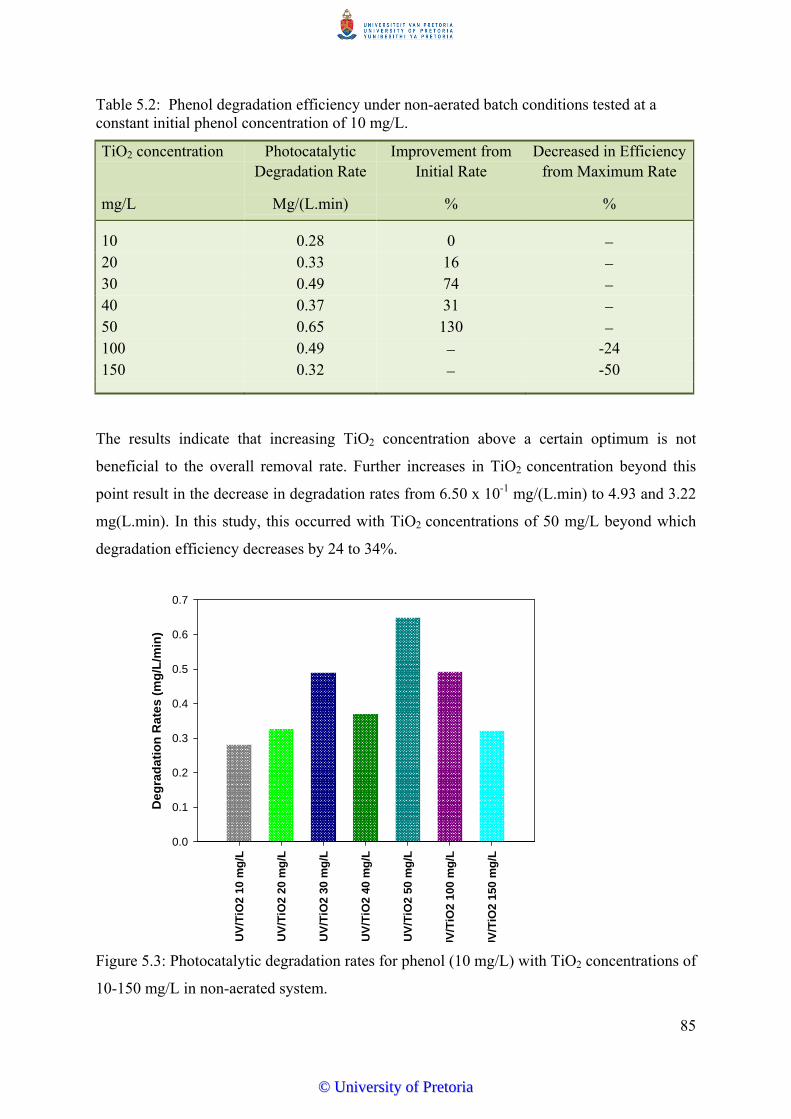
85
Table 5.2: Phenol degradation efficiency under non-aerated batch conditions tested at a constant initial phenol concentration of 10 mg/L.
TiO2 concentration
mg/L
Photocatalytic Degradation Rate
Mg/(L.min)
Improvement from Initial Rate
%
Decreased in Efficiency from Maximum Rate
%
10 0.28 0 20 0.33 16 30 0.49 74 40 0.37 31 50 0.65 130 100 0.49 -24 150 0.32 -50
The results indicate that increasing TiO2 concentration above a certain optimum is not
beneficial to the overall removal rate. Further increases in TiO2 concentration beyond this
point result in the decrease in degradation rates from 6.50 x 10⁻¹ mg/(L.min) to 4.93 and 3.22
mg(L.min). In this study, this occurred with TiO2 concentrations of 50 mg/L beyond which
degradation efficiency decreases by 24 to 34%.
UV/
TiO
2 10
mg/
L
UV/
TiO
2 20
mg/
L
UV/
TiO
2 30
mg/
L
UV/
TiO
2 40
mg/
L
UV/
TiO
2 50
mg/
L
UV/
TiO
2 10
0 m
g/L
UV/
TiO
2 15
0 m
g/L
Deg
rada
tion
Rat
es (m
g/L/
min
)
0.0
0.1
0.2
0.3
0.4
0.5
0.6
0.7
Figure 5.3: Photocatalytic degradation rates for phenol (10 mg/L) with TiO2 concentrations of
10-150 mg/L in non-aerated system.
©© UUnniivveerrssiittyy ooff PPrreettoorriiaa
86
Degradation rates for solutions of phenol at concentration of 20 mg/L also increased from
0.25 mg/(L.min) at TiO2 of 30 mg/L to a maximum of 0.35 mg/(L.min) at catalyst
concentration of 50 mg/L representing an increase of 40%, beyond which rates decreased to
0.24 mg/(L.min) (30%) and 0.19 mg/(L.min) (45%); at TiO2 concentrations of 100 and 150
mg/L respectively (Figure 5.4).
UV/
TiO
2 30
mg/
L
UV/
TiO
2 40
mg/
L
UV/
TiO
2 50
mg/
L
UV/
TiO
2 10
0 m
g/L
UV/
TiO
2 15
0 m
g/L
Deg
rada
tion
Rat
es, m
g/L/
min
0.0
0.1
0.2
0.3
0.4
Figure 5.4: Photocatalytic degradation rates for phenol (20 mg/L) with TiO2 concentrations of
30-150 mg/L.
These results indicate that at catalyst concentrations higher than 50 mg/L, there are reduced
active sites due to reduced UV light transmittance in solution. Factors contributing to
reduction in light transmittance include light scattering and screening effect of the UV
radiance by excess catalyst in solution (Chirwa and Bamuza-Pemu, 2010). Also, excess
catalyst particles in solution tend to agglomerate leading to reduced surface area for pollutant
adsorption (Ahmed et al., 2010). Light scattering and screening of light by excess catalyst
particles leads to a reduction in photonic events in the reactor including the reduction in
©© UUnniivveerrssiittyy ooff PPrreettoorriiaa
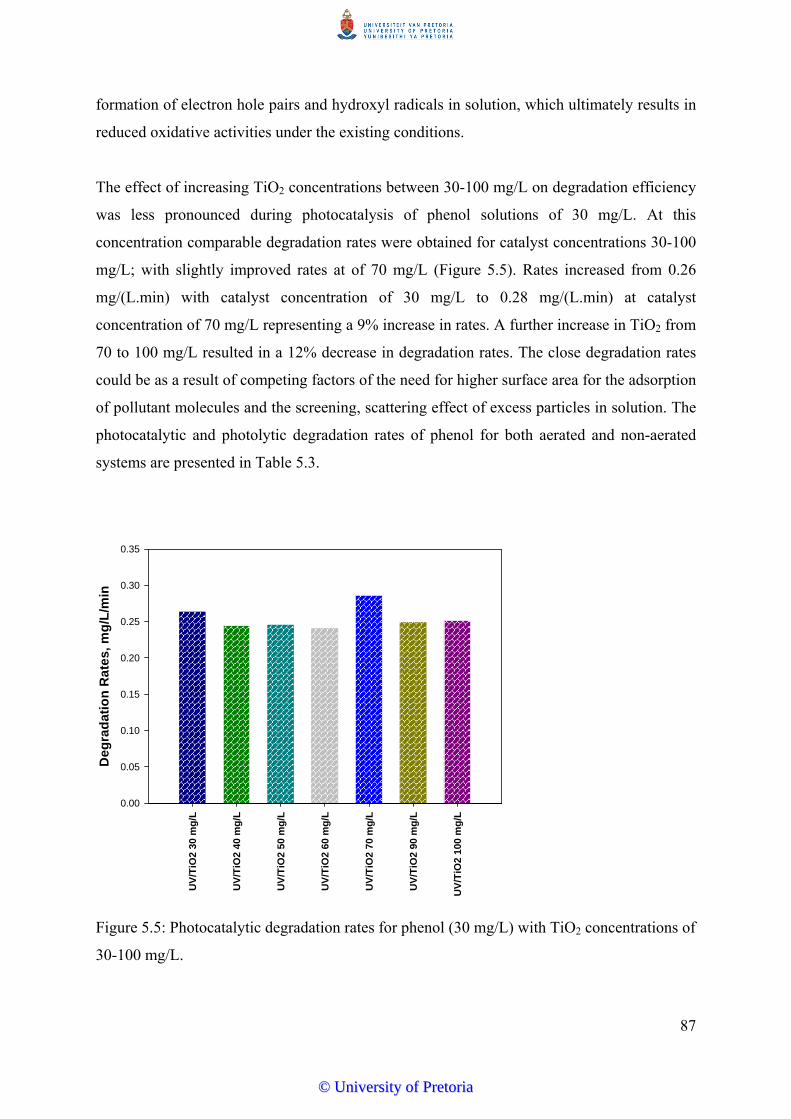
87
formation of electron hole pairs and hydroxyl radicals in solution, which ultimately results in
reduced oxidative activities under the existing conditions.
The effect of increasing TiO2 concentrations between 30-100 mg/L on degradation efficiency
was less pronounced during photocatalysis of phenol solutions of 30 mg/L. At this
concentration comparable degradation rates were obtained for catalyst concentrations 30-100
mg/L; with slightly improved rates at of 70 mg/L (Figure 5.5). Rates increased from 0.26
mg/(L.min) with catalyst concentration of 30 mg/L to 0.28 mg/(L.min) at catalyst
concentration of 70 mg/L representing a 9% increase in rates. A further increase in TiO2 from
70 to 100 mg/L resulted in a 12% decrease in degradation rates. The close degradation rates
could be as a result of competing factors of the need for higher surface area for the adsorption
of pollutant molecules and the screening, scattering effect of excess particles in solution. The
photocatalytic and photolytic degradation rates of phenol for both aerated and non-aerated
systems are presented in Table 5.3.
UV/
TiO
2 30
mg/
L
UV/
TiO
2 40
mg/
L
UV/
TiO
2 50
mg/
L
UV/
TiO
2 60
mg/
L
UV/
TiO
2 70
mg/
L
UV/
TiO
2 90
mg/
L
UV/
TiO
2 10
0 m
g/L
Deg
rada
tion
Rat
es, m
g/L/
min
0.00
0.05
0.10
0.15
0.20
0.25
0.30
0.35
Figure 5.5: Photocatalytic degradation rates for phenol (30 mg/L) with TiO2 concentrations of
30-100 mg/L.
©© UUnniivveerrssiittyy ooff PPrreettoorriiaa
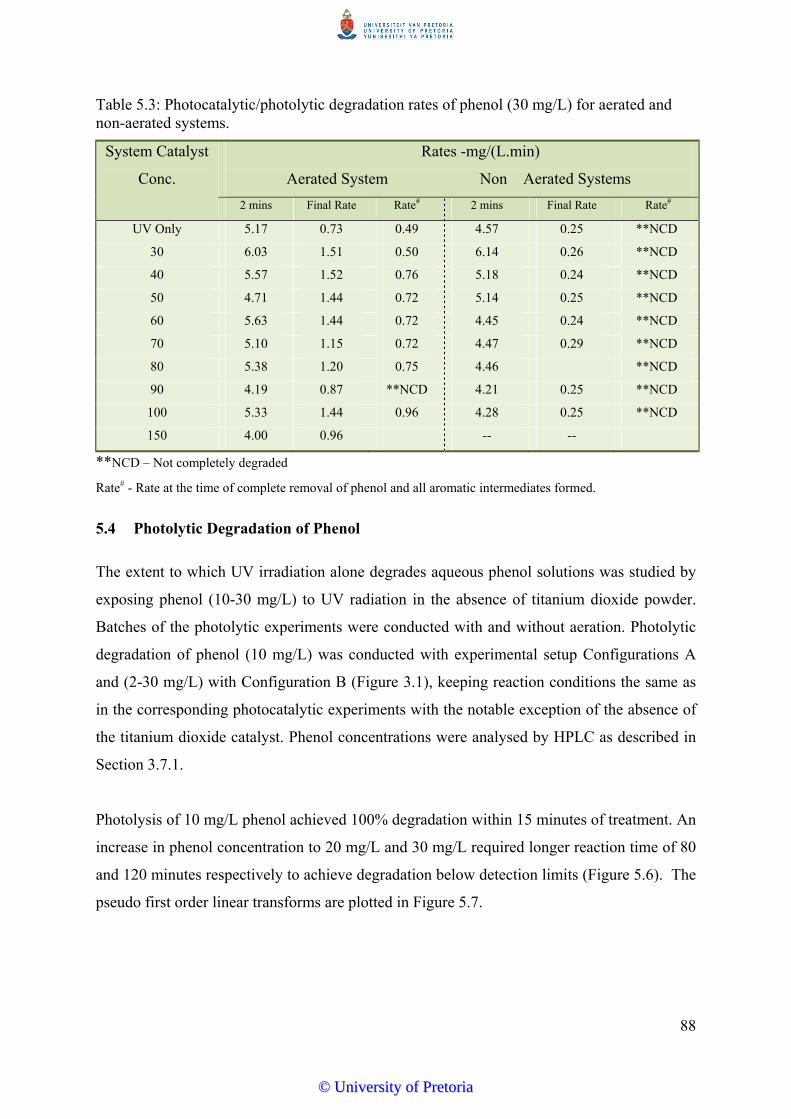
88
Table 5.3: Photocatalytic/photolytic degradation rates of phenol (30 mg/L) for aerated and non-aerated systems.
System Catalyst
Conc.
Rates -mg/(L.min)
Aerated System Non Aerated Systems
2 mins Final Rate Rate# 2 mins Final Rate Rate#
UV Only 5.17 0.73 0.49 4.57 0.25 **NCD
30 6.03 1.51 0.50 6.14 0.26 **NCD
40 5.57 1.52 0.76 5.18 0.24 **NCD
50 4.71 1.44 0.72 5.14 0.25 **NCD
60 5.63 1.44 0.72 4.45 0.24 **NCD
70 5.10 1.15 0.72 4.47 0.29 **NCD
80 5.38 1.20 0.75 4.46 **NCD
90 4.19 0.87 **NCD 4.21 0.25 **NCD
100 5.33 1.44 0.96 4.28 0.25 **NCD
150 4.00 0.96 -- --
**NCD – Not completely degraded
Rate# - Rate at the time of complete removal of phenol and all aromatic intermediates formed.
5.4 Photolytic Degradation of Phenol
The extent to which UV irradiation alone degrades aqueous phenol solutions was studied by
exposing phenol (10-30 mg/L) to UV radiation in the absence of titanium dioxide powder.
Batches of the photolytic experiments were conducted with and without aeration. Photolytic
degradation of phenol (10 mg/L) was conducted with experimental setup Configurations A
and (2-30 mg/L) with Configuration B (Figure 3.1), keeping reaction conditions the same as
in the corresponding photocatalytic experiments with the notable exception of the absence of
the titanium dioxide catalyst. Phenol concentrations were analysed by HPLC as described in
Section 3.7.1.
Photolysis of 10 mg/L phenol achieved 100% degradation within 15 minutes of treatment. An
increase in phenol concentration to 20 mg/L and 30 mg/L required longer reaction time of 80
and 120 minutes respectively to achieve degradation below detection limits (Figure 5.6). The
pseudo first order linear transforms are plotted in Figure 5.7.
©© UUnniivveerrssiittyy ooff PPrreettoorriiaa
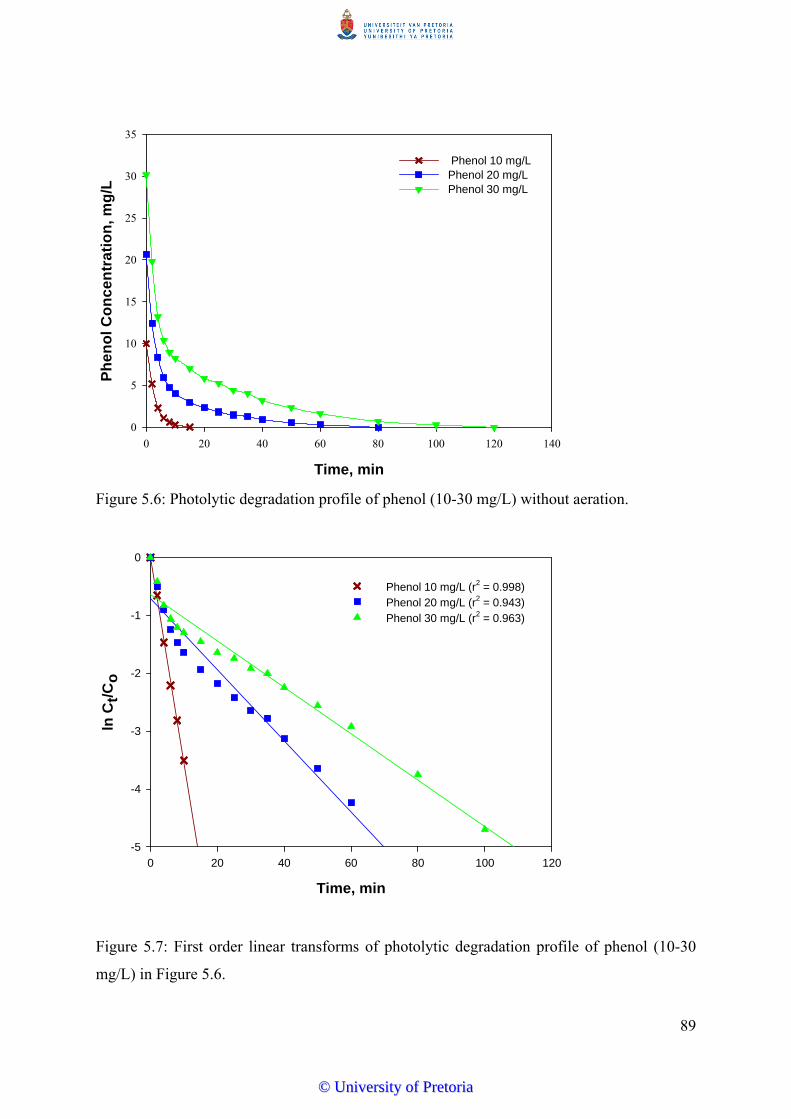
89
Time, min
0 20 40 60 80 100 120 140
Phen
ol C
once
ntra
tion,
mg/
L
0
5
10
15
20
25
30
35
Phenol 10 mg/L Phenol 20 mg/L Phenol 30 mg/L
Figure 5.6: Photolytic degradation profile of phenol (10-30 mg/L) without aeration.
Time, min
0 20 40 60 80 100 120
ln C
t/Co
-5
-4
-3
-2
-1
0
Phenol 10 mg/L (r2 = 0.998) Phenol 20 mg/L (r2 = 0.943)Phenol 30 mg/L (r2 = 0.963)
Figure 5.7: First order linear transforms of photolytic degradation profile of phenol (10-30
mg/L) in Figure 5.6.
©© UUnniivveerrssiittyy ooff PPrreettoorriiaa
90
5.5 Effects of Aeration on Degradation Efficiency
Availability of an electron acceptor is crucial to the efficiency of a photocatalytic system as
represented by Equation 2.2 and shown in Figure 2.5. In water purification the electron
acceptor is usually oxygen as formation of reactive radical species strongly depends on its
presence. The effect of oxygen on the degradation efficiency was studied for both photolytic
and photocatalytic systems at phenol solutions of concentration of 30 mg/L. Results were
compared with those obtained for the non-aerated system.
Photolytic and photocatalytic degradation rates for phenol (30 mg/L) in aerated and non-
aerated systems are presented in Figure 5.8. Aeration of the reactor contents significantly
improved degradation rates for both the photolytic and photocatalytic systems across all
catalyst concentrations studied resulting in removal of phenol to levels below detection limits
for the photocatalytic system at catalyst concentrations between 30-70 mg/L. Improvement in
degradation rates due to aeration was very significant with an increase in rates of one order of
magnitude. Time required for degradation of phenol to non-detectable levels improved from
100-120 minutes in the non-aerated to 20-35 minutes for the aerated photocatalytic systems;
and from 120 minutes to 40 minutes for the photolytic system. Aeration of the system
improved photocatalytic degradation rates of phenol by an average of 429% from a maximum
of 0.29 mg/(L.min) for the non-aerated photocatalytic systems to a maximum of 1.52
mg/(L.min) for the aerated system.
Degradation rates for photolytic and photocatalytic degradation of phenol for both the aerated
and non-aerated systems and the resultant percentage increases in rate are presented in Table
B3 in Appendix B. Results obtained for photolysis and photocatalysis of 30 mg/L solutions of
phenol show that photolytic degradation rate in the non-aerated system (0.25 mg(L.min)) was
comparable to those of the photocatalytic system (0.25 mg/(L.min) to 0.29 mg(L.min)). This
is an indication that in limited supply of oxygen, types and quantities of reactive species in
solution; predominant degradative pathways in both systems are similar. Degradation under
this condition might be due primarily to oxidation by reactive holes formed on the catalyst
surface and direct photolysis (Chirwa and Bamuza-Pemu, 2010). Khraisheh and co-workers
observed improvement in photocatalytic degradation rates of carbamazepine by a factor of
1.6 by varying dissolved oxygen concentration from 6 mg/L to 24 mg/L (Khraisheh et al.,
2013). Higher rates obtained on aeration could be attributed to the synergic effect of
©© UUnniivveerrssiittyy ooff PPrreettoorriiaa
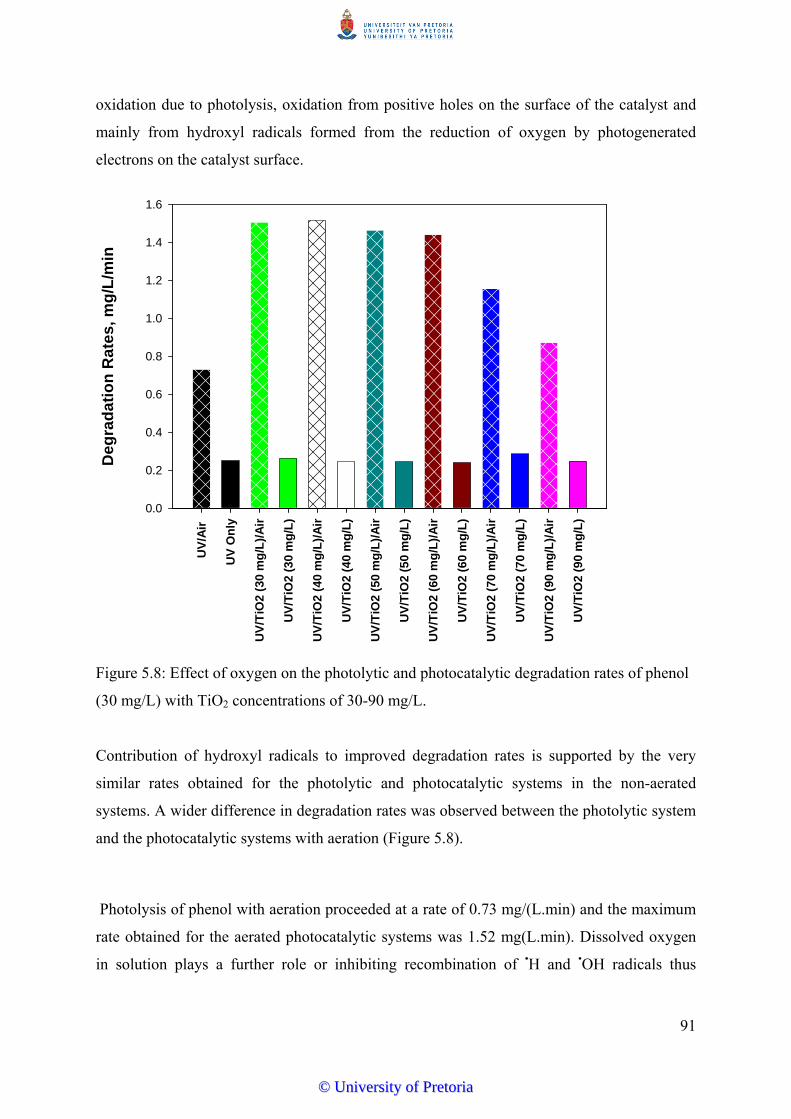
91
oxidation due to photolysis, oxidation from positive holes on the surface of the catalyst and
mainly from hydroxyl radicals formed from the reduction of oxygen by photogenerated
electrons on the catalyst surface.
UV/
Air
UV
Onl
y
UV/
TiO
2 (3
0 m
g/L)
/Air
UV/
TiO
2 (3
0 m
g/L)
UV/
TiO
2 (4
0 m
g/L)
/Air
UV/
TiO
2 (4
0 m
g/L)
UV/
TiO
2 (5
0 m
g/L)
/Air
UV/
TiO
2 (5
0 m
g/L)
UV/
TiO
2 (6
0 m
g/L)
/Air
UV/
TiO
2 (6
0 m
g/L)
UV/
TiO
2 (7
0 m
g/L)
/Air
UV/
TiO
2 (7
0 m
g/L)
UV/
TiO
2 (9
0 m
g/L)
/Air
UV/
TiO
2 (9
0 m
g/L)
Deg
rada
tion
Rat
es, m
g/L/
min
0.0
0.2
0.4
0.6
0.8
1.0
1.2
1.4
1.6
Figure 5.8: Effect of oxygen on the photolytic and photocatalytic degradation rates of phenol
(30 mg/L) with TiO2 concentrations of 30-90 mg/L.
Contribution of hydroxyl radicals to improved degradation rates is supported by the very
similar rates obtained for the photolytic and photocatalytic systems in the non-aerated
systems. A wider difference in degradation rates was observed between the photolytic system
and the photocatalytic systems with aeration (Figure 5.8).
Photolysis of phenol with aeration proceeded at a rate of 0.73 mg/(L.min) and the maximum
rate obtained for the aerated photocatalytic systems was 1.52 mg(L.min). Dissolved oxygen
in solution plays a further role or inhibiting recombination of •H and •OH radicals thus
©© UUnniivveerrssiittyy ooff PPrreettoorriiaa
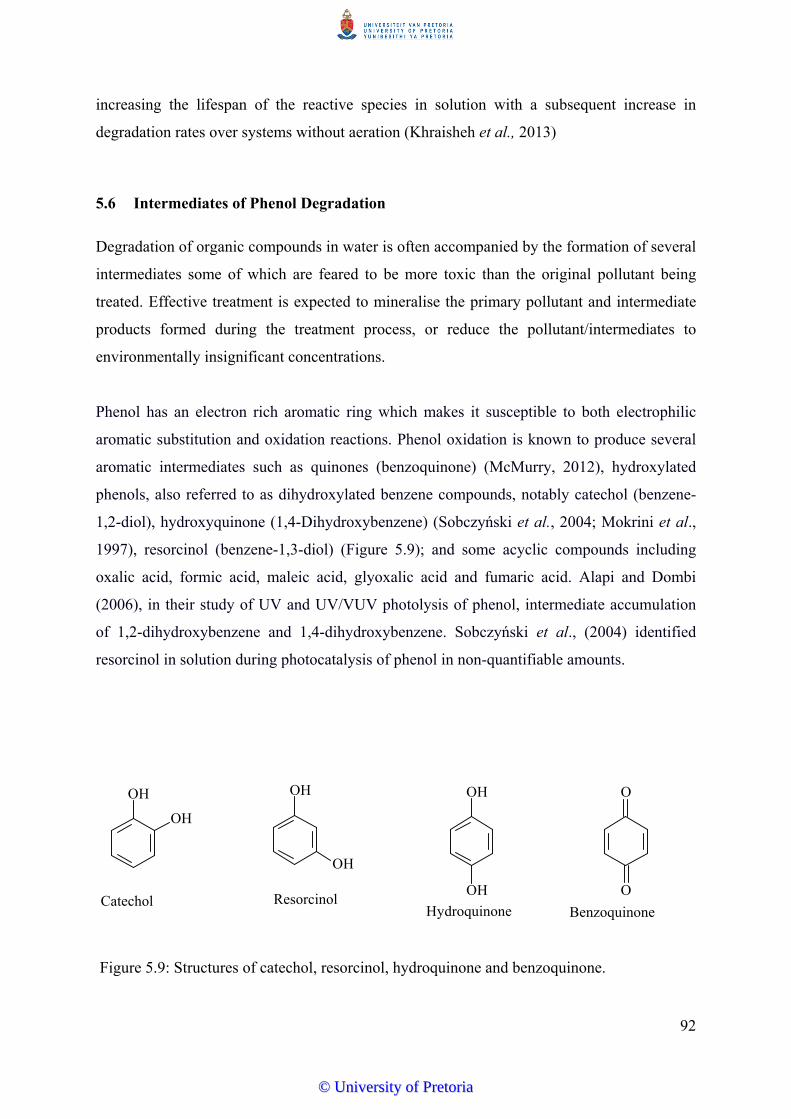
92
increasing the lifespan of the reactive species in solution with a subsequent increase in
degradation rates over systems without aeration (Khraisheh et al., 2013)
5.6 Intermediates of Phenol Degradation
Degradation of organic compounds in water is often accompanied by the formation of several
intermediates some of which are feared to be more toxic than the original pollutant being
treated. Effective treatment is expected to mineralise the primary pollutant and intermediate
products formed during the treatment process, or reduce the pollutant/intermediates to
environmentally insignificant concentrations.
Phenol has an electron rich aromatic ring which makes it susceptible to both electrophilic
aromatic substitution and oxidation reactions. Phenol oxidation is known to produce several
aromatic intermediates such as quinones (benzoquinone) (McMurry, 2012), hydroxylated
phenols, also referred to as dihydroxylated benzene compounds, notably catechol (benzene-
1,2-diol), hydroxyquinone (1,4-Dihydroxybenzene) (Sobczyński et al., 2004; Mokrini et al.,
1997), resorcinol (benzene-1,3-diol) (Figure 5.9); and some acyclic compounds including
oxalic acid, formic acid, maleic acid, glyoxalic acid and fumaric acid. Alapi and Dombi
(2006), in their study of UV and UV/VUV photolysis of phenol, intermediate accumulation
of 1,2-dihydroxybenzene and 1,4-dihydroxybenzene. Sobczyński et al., (2004) identified
resorcinol in solution during photocatalysis of phenol in non-quantifiable amounts.
OH
OH
Hydroquinone
OH
OH
OH
OH
O
OResorcinol Catechol
Benzoquinone
Figure 5.9: Structures of catechol, resorcinol, hydroquinone and benzoquinone.
©© UUnniivveerrssiittyy ooff PPrreettoorriiaa
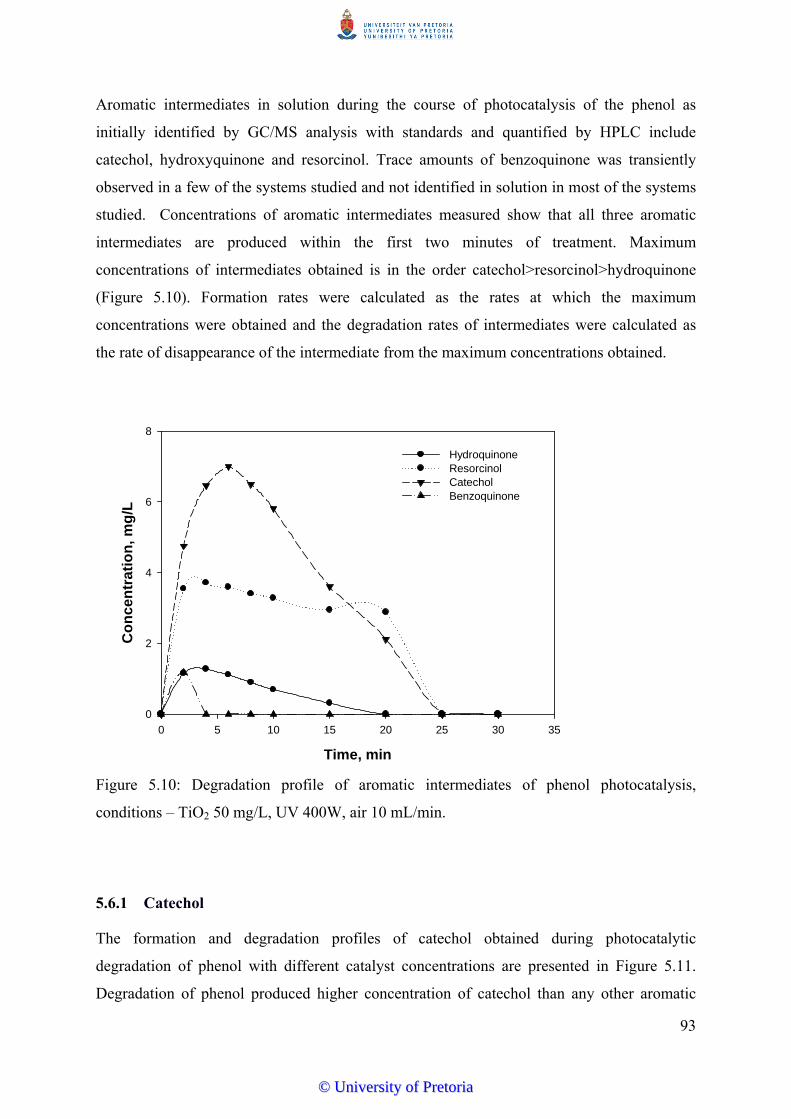
93
Aromatic intermediates in solution during the course of photocatalysis of the phenol as
initially identified by GC/MS analysis with standards and quantified by HPLC include
catechol, hydroxyquinone and resorcinol. Trace amounts of benzoquinone was transiently
observed in a few of the systems studied and not identified in solution in most of the systems
studied. Concentrations of aromatic intermediates measured show that all three aromatic
intermediates are produced within the first two minutes of treatment. Maximum
concentrations of intermediates obtained is in the order catechol>resorcinol>hydroquinone
(Figure 5.10). Formation rates were calculated as the rates at which the maximum
concentrations were obtained and the degradation rates of intermediates were calculated as
the rate of disappearance of the intermediate from the maximum concentrations obtained.
Time, min
0 5 10 15 20 25 30 35
Con
cent
ratio
n, m
g/L
0
2
4
6
8
HydroquinoneResorcinolCatecholBenzoquinone
Figure 5.10: Degradation profile of aromatic intermediates of phenol photocatalysis,
conditions – TiO2 50 mg/L, UV 400W, air 10 mL/min.
5.6.1 Catechol
The formation and degradation profiles of catechol obtained during photocatalytic
degradation of phenol with different catalyst concentrations are presented in Figure 5.11.
Degradation of phenol produced higher concentration of catechol than any other aromatic
©© UUnniivveerrssiittyy ooff PPrreettoorriiaa
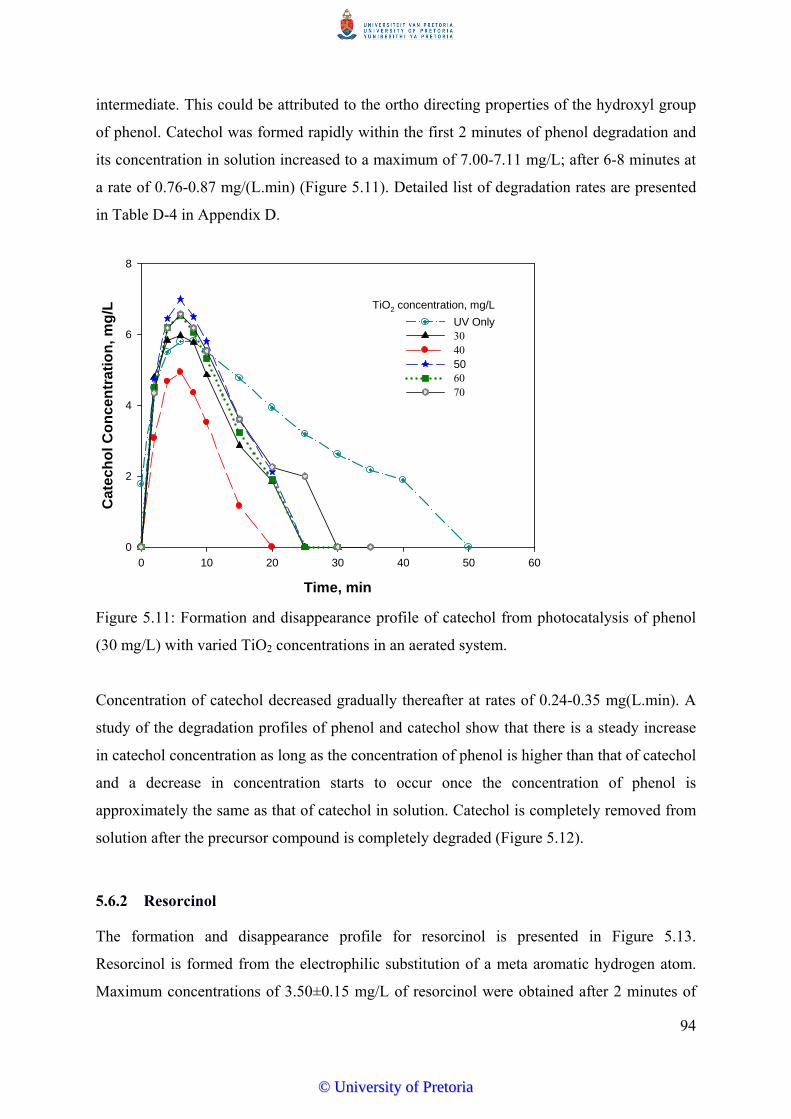
94
intermediate. This could be attributed to the ortho directing properties of the hydroxyl group
of phenol. Catechol was formed rapidly within the first 2 minutes of phenol degradation and
its concentration in solution increased to a maximum of 7.00-7.11 mg/L; after 6-8 minutes at
a rate of 0.76-0.87 mg/(L.min) (Figure 5.11). Detailed list of degradation rates are presented
in Table D-4 in Appendix D.
Time, min
0 10 20 30 40 50 60
Cat
echo
l Con
cent
ratio
n, m
g/L
0
2
4
6
8
UV Only3040506070
TiO2 concentration, mg/L
Figure 5.11: Formation and disappearance profile of catechol from photocatalysis of phenol
(30 mg/L) with varied TiO2 concentrations in an aerated system.
Concentration of catechol decreased gradually thereafter at rates of 0.24-0.35 mg(L.min). A
study of the degradation profiles of phenol and catechol show that there is a steady increase
in catechol concentration as long as the concentration of phenol is higher than that of catechol
and a decrease in concentration starts to occur once the concentration of phenol is
approximately the same as that of catechol in solution. Catechol is completely removed from
solution after the precursor compound is completely degraded (Figure 5.12).
5.6.2 Resorcinol
The formation and disappearance profile for resorcinol is presented in Figure 5.13.
Resorcinol is formed from the electrophilic substitution of a meta aromatic hydrogen atom.
Maximum concentrations of 3.50±0.15 mg/L of resorcinol were obtained after 2 minutes of
©© UUnniivveerrssiittyy ooff PPrreettoorriiaa

95
phenol photocatalysis with no appreciable change in its concentrations to the point of
disappearance of phenol from solution. The relatively unchanged concentration of resorcinol
in solution suggests that production of resorcinol in solution proceeds at approximately the
same rate as its removal from solution until all phenol is removed from solution (Figure
5.13). In non-aerated systems, resorcinol formation is transient as it is formed and completely
removed from solution within the first 10 minutes of phenol treatment (Figure 5.13b) even
though appreciable concentration of phenol is still in solution up to the 120th minute of
treatment. This is an indication that formation of dihydroxylated benzene compounds is
favoured at the ortho and para carbon positions and not the meta position.
Time, min
0 5 10 15 20 25 30 35
Con
cent
ratio
n, m
g/L
0
5
10
15
20
25
30
HydroquinoneResorcinolCatecholBenzoquinonePhenol
Figure 5.12: Degradation profile of phenol and aromatic intermediates of phenol
photocatalysis, condition – TiO2 50 mg/L, UV 400W, air 10 mL/min.
©© UUnniivveerrssiittyy ooff PPrreettoorriiaa
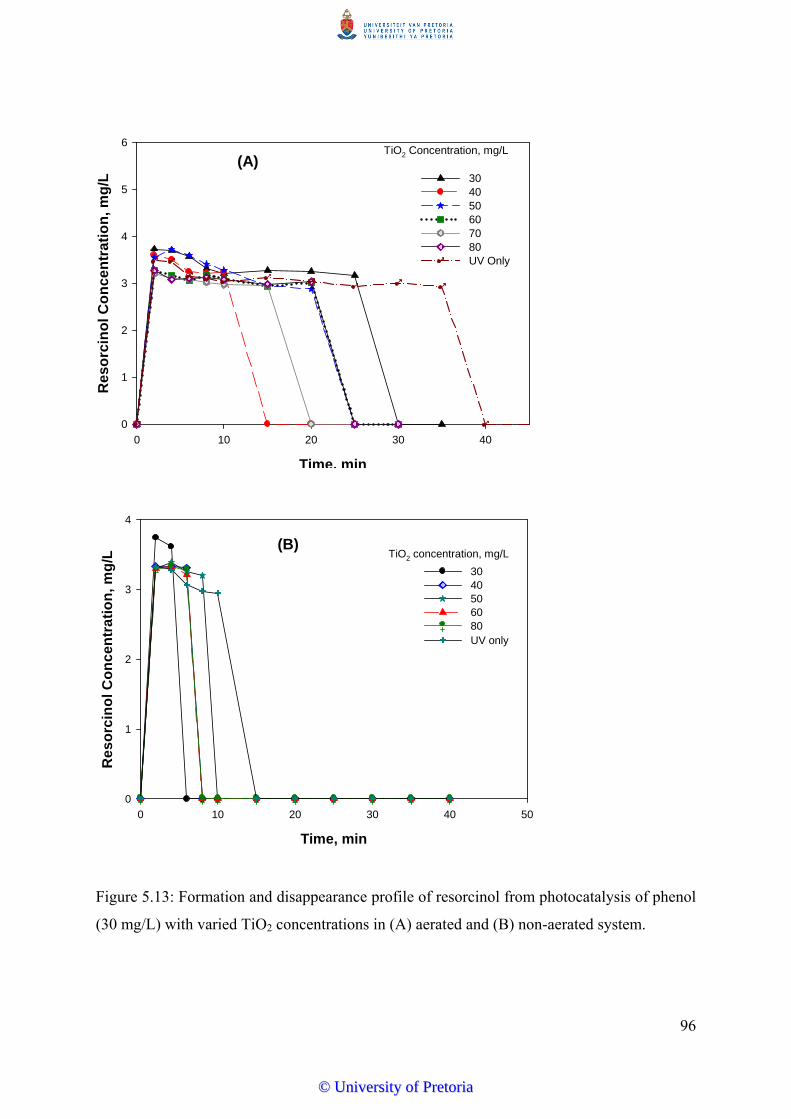
96
Time, min
0 10 20 30 40
Res
orci
nol C
once
ntra
tion,
mg/
L
0
1
2
3
4
5
6
30405060 7080UV Only
TiO2 Concentration, mg/L(A)
Time, min
0 10 20 30 40 50
Res
orci
nol C
once
ntra
tion,
mg/
L
0
1
2
3
4
3040506080UV only
TiO2 concentration, mg/L(B)
Figure 5.13: Formation and disappearance profile of resorcinol from photocatalysis of phenol
(30 mg/L) with varied TiO2 concentrations in (A) aerated and (B) non-aerated system.
©© UUnniivveerrssiittyy ooff PPrreettoorriiaa
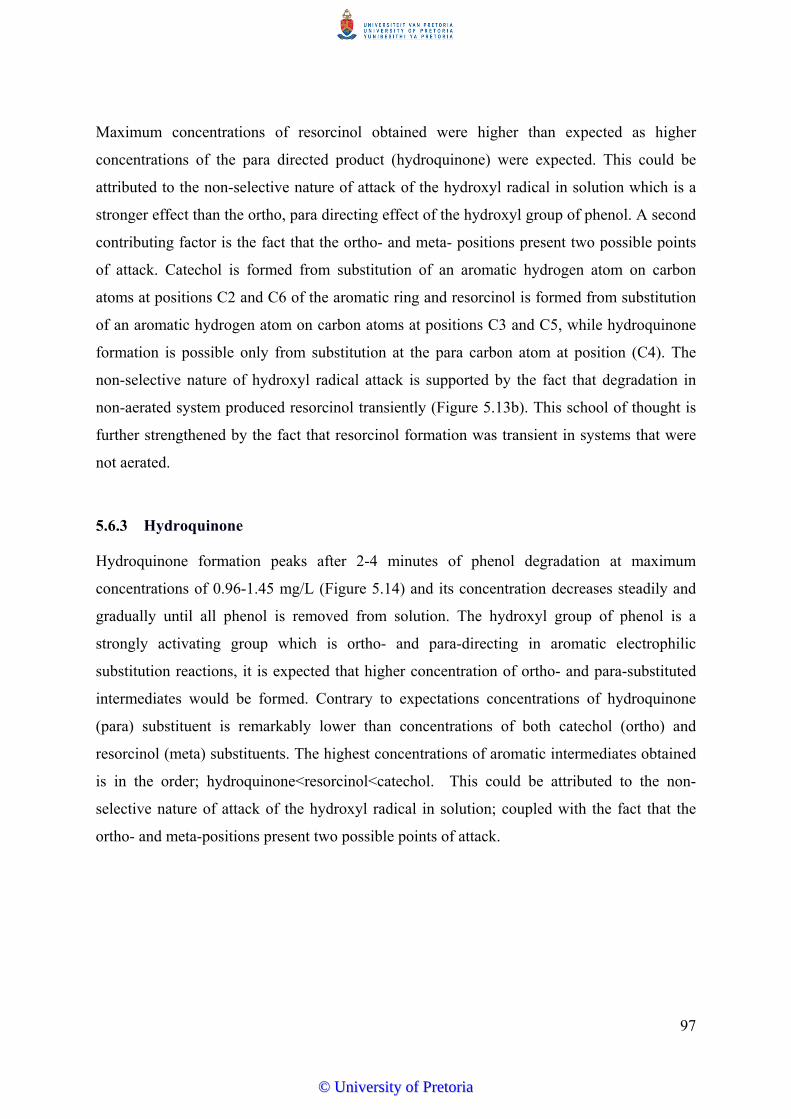
97
Maximum concentrations of resorcinol obtained were higher than expected as higher
concentrations of the para directed product (hydroquinone) were expected. This could be
attributed to the non-selective nature of attack of the hydroxyl radical in solution which is a
stronger effect than the ortho, para directing effect of the hydroxyl group of phenol. A second
contributing factor is the fact that the ortho- and meta- positions present two possible points
of attack. Catechol is formed from substitution of an aromatic hydrogen atom on carbon
atoms at positions C2 and C6 of the aromatic ring and resorcinol is formed from substitution
of an aromatic hydrogen atom on carbon atoms at positions C3 and C5, while hydroquinone
formation is possible only from substitution at the para carbon atom at position (C4). The
non-selective nature of hydroxyl radical attack is supported by the fact that degradation in
non-aerated system produced resorcinol transiently (Figure 5.13b). This school of thought is
further strengthened by the fact that resorcinol formation was transient in systems that were
not aerated.
5.6.3 Hydroquinone
Hydroquinone formation peaks after 2-4 minutes of phenol degradation at maximum
concentrations of 0.96-1.45 mg/L (Figure 5.14) and its concentration decreases steadily and
gradually until all phenol is removed from solution. The hydroxyl group of phenol is a
strongly activating group which is ortho- and para-directing in aromatic electrophilic
substitution reactions, it is expected that higher concentration of ortho- and para-substituted
intermediates would be formed. Contrary to expectations concentrations of hydroquinone
(para) substituent is remarkably lower than concentrations of both catechol (ortho) and
resorcinol (meta) substituents. The highest concentrations of aromatic intermediates obtained
is in the order; hydroquinone<resorcinol<catechol. This could be attributed to the non-
selective nature of attack of the hydroxyl radical in solution; coupled with the fact that the
ortho- and meta-positions present two possible points of attack.
©© UUnniivveerrssiittyy ooff PPrreettoorriiaa
98
Time, min
0 10 20 30 40
Con
cent
ratio
n of
hyd
roqu
inon
e, m
g/L
0.0
0.2
0.4
0.6
0.8
1.0
1.2
1.4
1.6
3040 50608070
TiO2 concentration, mg/L
Figure 5.14: Formation and disappearance profile of hydroquinone from photocatalysis of
phenol (30 mg/L) with varied TiO2 concentrations in an aerated system.
Catechol is formed from substitution of an aromatic hydrogen atom on carbon atoms at
positions C2 and C6 of the aromatic ring and resorcinol is formed from substitution of an
aromatic hydrogen atom on carbon atoms at positions C3 and C5, while hydroquinone
formation is possible only from substitution at the para carbon atom. The non-sustained
formation of resorcinol in the non-aerated systems further supports the presence and
dominance of hydroxyl radicals as the active specie in solution during photocatalytic
degradation of phenol.
5.7 Photocatalytic Degradation of Mono-substituted Derivatives of Phenol
Phenol often is released into the environment along with several of its derivatives, the most
common derivative being the chlorophenols and nitrophenol. The effective degradation of
derivatives of phenol was simulated by testing the degradation efficiency of chlorophenols
and nitrophenols. In this study, 2-chlorophenol (2-CP) and 4-chlorophenol (4-CP) were used
to evaluate the effect of halogenation of aromatic compounds on degradation rate. 4-
nitrophenol (4-NP) was used to test the effect of nitration on the degradation rate (Figure
©© UUnniivveerrssiittyy ooff PPrreettoorriiaa
99
5.15). Results show that the mono substituted derivatives (especially the chlorinated
derivatives) are more susceptible to photocatalysis than the parent phenol. Very rapid
degradation of the chlorophenols (2-chlorophenol and 4-chlorophenol) with 50 mg/L TiO2
under the reaction conditions was achieved. Degradation rates obtained were in the
decreasing order of 4-CP>>>2-CP>>4-NP>≈phenol. Removal of 4-CP from solution to
levels below the detection limit was obtained after just 2 minutes of degradation (Figure 5.15)
at a rate of 15.2 mg/L min-1, while 2-CP was degraded below detection limits after 8 minutes
of photocatalysis at a rate of 3.94 mg/(L.min).
The results in Figure 5.15 show that the dehalogenation of the phenol molecule was inversely
correlated to the distance of the halogen group from the hydroxyl group on the benzene ring.
The dehalogenation of 4-CP, and therefore its disappearance from solution, was much faster
than the rate of disappearance of 2-CP and phenol. This is governed by two opposing
electronic effects as 2-chlorophenol and 4-chlorophenol display negative inductive effect (-I)
and positive mesomeric effect (+M). The –I effect is more prominent at the ortho than at the
para position as it is an effect transmitted through the bonds and gets weaker with distance. It
is envisaged that the presence of the highly electronegative chloro group could facilitate the
deactivation of the conjugated pi system of the aromatic ring thereby enhancing degradability
of the compound. 4-nitrophenol exhibited similar degradability as phenol with degradation
below detection limits achieved after 20 minutes of reaction time (Figure 5.15).
©© UUnniivveerrssiittyy ooff PPrreettoorriiaa
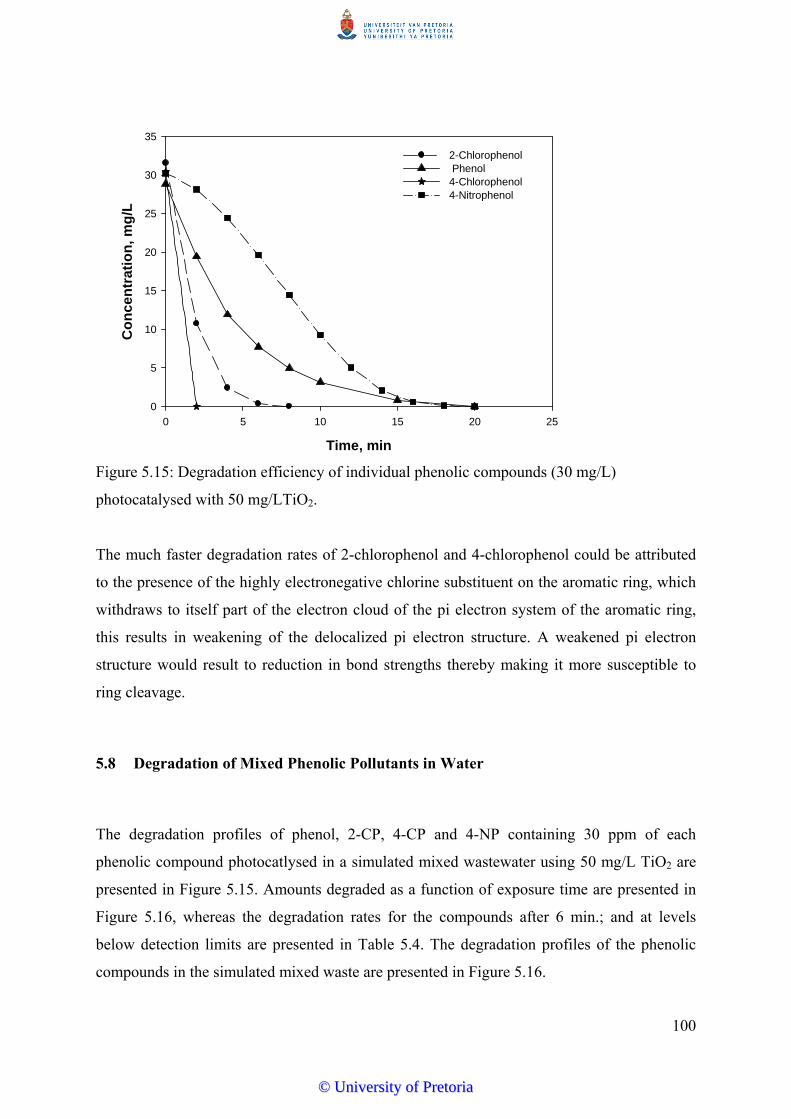
100
Time, min
0 5 10 15 20 25
Con
cent
ratio
n, m
g/L
0
5
10
15
20
25
30
35
2-Chlorophenol Phenol4-Chlorophenol4-Nitrophenol
Figure 5.15: Degradation efficiency of individual phenolic compounds (30 mg/L)
photocatalysed with 50 mg/LTiO2.
The much faster degradation rates of 2-chlorophenol and 4-chlorophenol could be attributed
to the presence of the highly electronegative chlorine substituent on the aromatic ring, which
withdraws to itself part of the electron cloud of the pi electron system of the aromatic ring,
this results in weakening of the delocalized pi electron structure. A weakened pi electron
structure would result to reduction in bond strengths thereby making it more susceptible to
ring cleavage.
5.8 Degradation of Mixed Phenolic Pollutants in Water
The degradation profiles of phenol, 2-CP, 4-CP and 4-NP containing 30 ppm of each
phenolic compound photocatlysed in a simulated mixed wastewater using 50 mg/L TiO2 are
presented in Figure 5.15. Amounts degraded as a function of exposure time are presented in
Figure 5.16, whereas the degradation rates for the compounds after 6 min.; and at levels
below detection limits are presented in Table 5.4. The degradation profiles of the phenolic
compounds in the simulated mixed waste are presented in Figure 5.16.
©© UUnniivveerrssiittyy ooff PPrreettoorriiaa
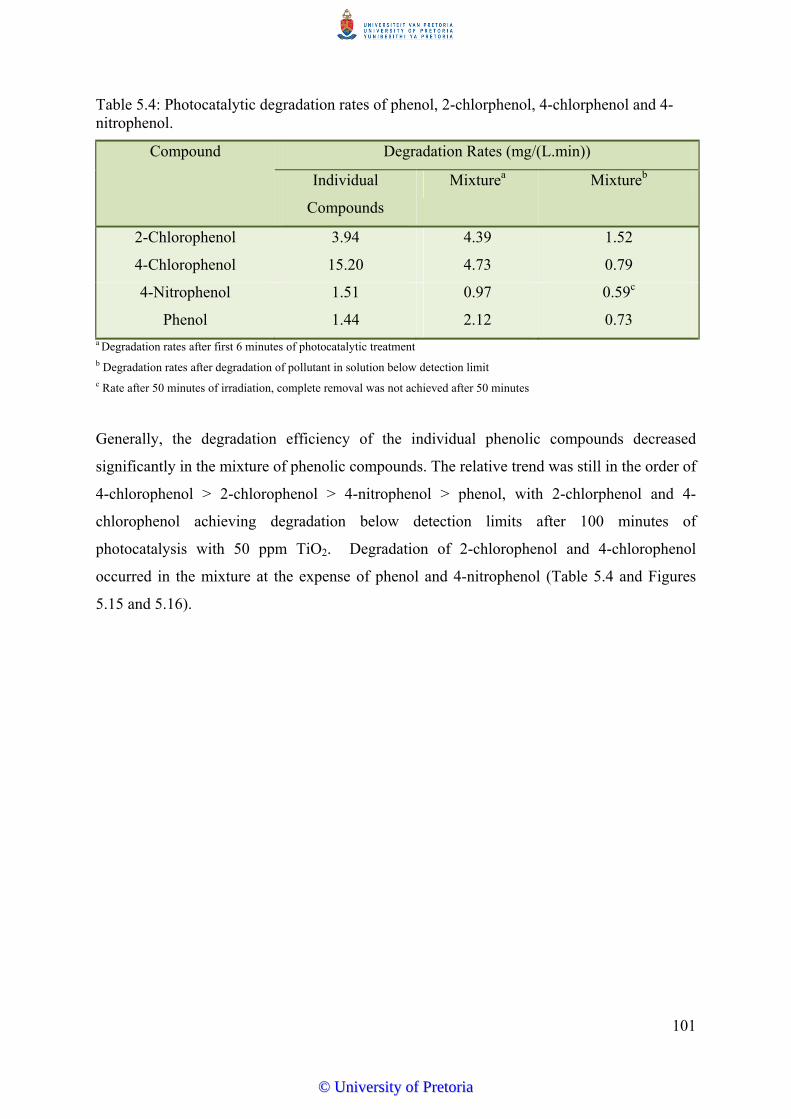
101
Table 5.4: Photocatalytic degradation rates of phenol, 2-chlorphenol, 4-chlorphenol and 4-nitrophenol.
Compound Degradation Rates (mg/(L.min))
Individual
Compounds
Mixturea Mixtureb
2-Chlorophenol 3.94 4.39 1.52
4-Chlorophenol 15.20 4.73 0.79
4-Nitrophenol 1.51 0.97 0.59c
Phenol 1.44 2.12 0.73 a Degradation rates after first 6 minutes of photocatalytic treatment b Degradation rates after degradation of pollutant in solution below detection limit c Rate after 50 minutes of irradiation, complete removal was not achieved after 50 minutes
Generally, the degradation efficiency of the individual phenolic compounds decreased
significantly in the mixture of phenolic compounds. The relative trend was still in the order of
4-chlorophenol > 2-chlorophenol > 4-nitrophenol > phenol, with 2-chlorphenol and 4-
chlorophenol achieving degradation below detection limits after 100 minutes of
photocatalysis with 50 ppm TiO2. Degradation of 2-chlorophenol and 4-chlorophenol
occurred in the mixture at the expense of phenol and 4-nitrophenol (Table 5.4 and Figures
5.15 and 5.16).
©© UUnniivveerrssiittyy ooff PPrreettoorriiaa
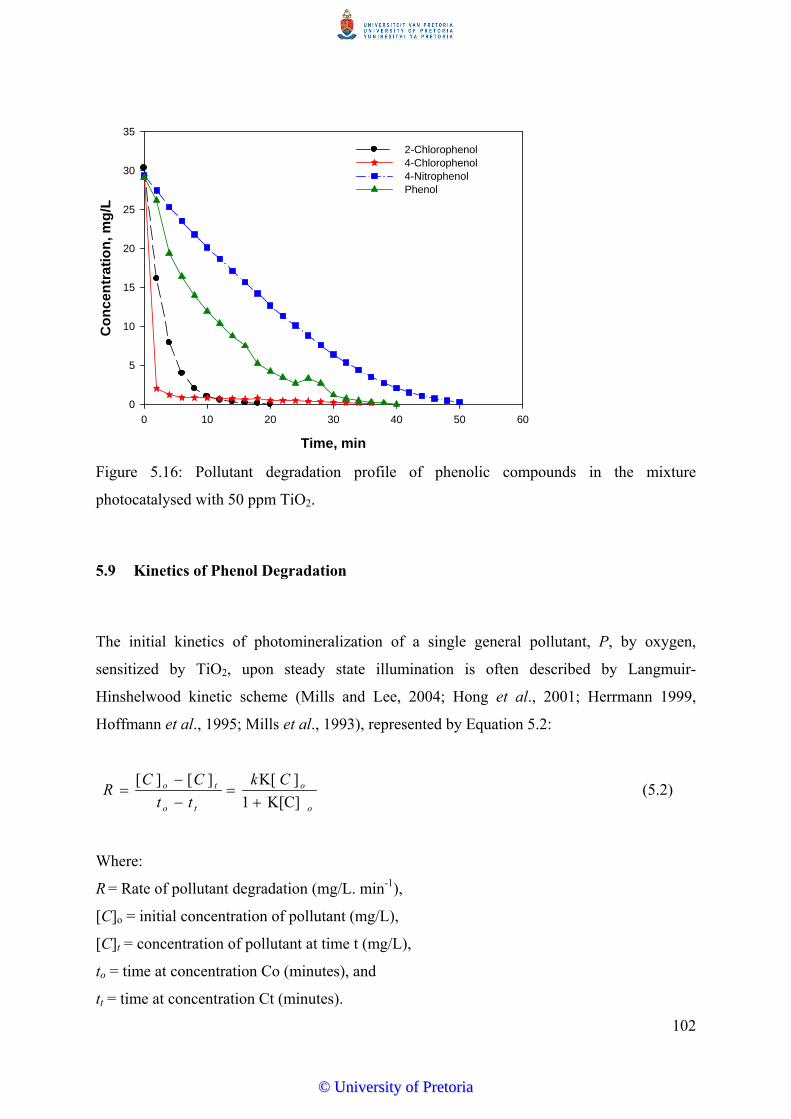
102
Time, min
0 10 20 30 40 50 60
Con
cent
ratio
n, m
g/L
0
5
10
15
20
25
30
35
2-Chlorophenol 4-Chlorophenol 4-Nitrophenol Phenol
Figure 5.16: Pollutant degradation profile of phenolic compounds in the mixture
photocatalysed with 50 ppm TiO2.
5.9 Kinetics of Phenol Degradation
The initial kinetics of photomineralization of a single general pollutant, P, by oxygen,
sensitized by TiO2, upon steady state illumination is often described by Langmuir-
Hinshelwood kinetic scheme (Mills and Lee, 2004; Hong et al., 2001; Herrmann 1999,
Hoffmann et al., 1995; Mills et al., 1993), represented by Equation 5.2:
o
o
to
to Ck
tt
CCR
K[C]1
]K[][][
(5.2)
Where:
R = Rate of pollutant degradation (mg/L. min-1),
[C]o = initial concentration of pollutant (mg/L),
[C]t = concentration of pollutant at time t (mg/L),
to = time at concentration Co (minutes), and
tt = time at concentration Ct (minutes).
©© UUnniivveerrssiittyy ooff PPrreettoorriiaa
103
K is equilibrium adsorption constant (mg/L- 1), and
k =pseudo first order reaction rate constant (min-1).
Rate constants for degradation of phenol in water was obtained from solutions of the
linearized rate equations for all concentrations ranges as presented in Equation 5.3
tkC
C
o
t
ln (5.3)
Where:
Co is the initial concentration of phenol at time t=0; and
Ct is the residual concentration of phenol left in solution at time t.
Plots of lnCt/Co as a function of time for solutions of phenol with varying catalyst
concentrations on sigmaplot gave linear curves, typical of pseudo first order kinetics of
photocatalytic systems. Pseudo first order rate constants were obtained from linear
transforms of the plot of lnCt/Co as a function of time from apparent first order kinetic
equation. The linear transform for phenol degradation for the degradation profile in Figure
5.17 (non-aerated) and 5.18 (aerated); and the kinetic parameters are presented in Table 5.5.
The good fit of the data to the first order plots at all catalyst concentrations studied, as
indicated by the high r2 is an indication that degradation of phenol can be adequately
described with first order kinetics.
©© UUnniivveerrssiittyy ooff PPrreettoorriiaa
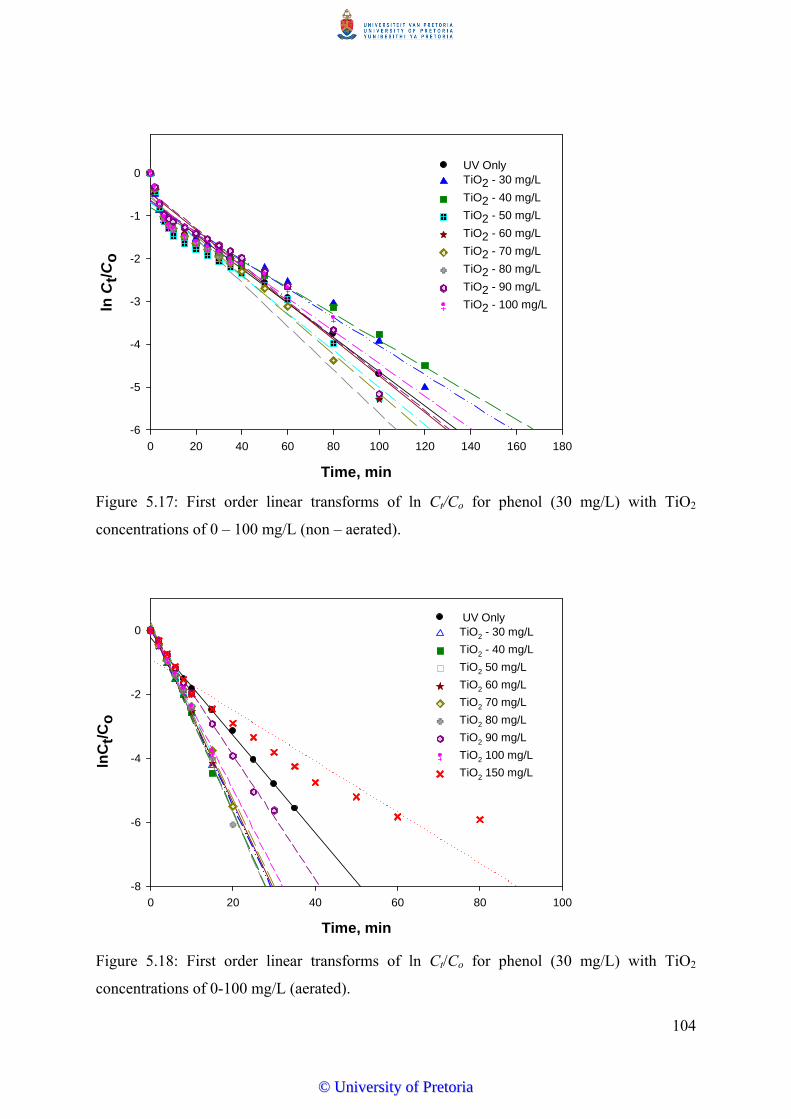
104
Time, min
0 20 40 60 80 100 120 140 160 180
ln C
t/ Co
-6
-5
-4
-3
-2
-1
0UV Only TiO2 - 30 mg/L
TiO2 - 40 mg/L
TiO2 - 50 mg/L
TiO2 - 60 mg/L
TiO2 - 70 mg/L
TiO2 - 80 mg/L
TiO2 - 90 mg/L
TiO2 - 100 mg/L
Figure 5.17: First order linear transforms of ln Ct/Co for phenol (30 mg/L) with TiO2
concentrations of 0 – 100 mg/L (non – aerated).
Time, min
0 20 40 60 80 100
lnC
t/Co
-8
-6
-4
-2
0 UV OnlyTiO2 - 30 mg/L
TiO2 - 40 mg/L
TiO2 50 mg/L
TiO2 60 mg/L
TiO2 70 mg/L
TiO2 80 mg/L
TiO2 90 mg/L
TiO2 100 mg/L
TiO2 150 mg/L
Figure 5.18: First order linear transforms of ln Ct/Co for phenol (30 mg/L) with TiO2
concentrations of 0-100 mg/L (aerated).
©© UUnniivveerrssiittyy ooff PPrreettoorriiaa
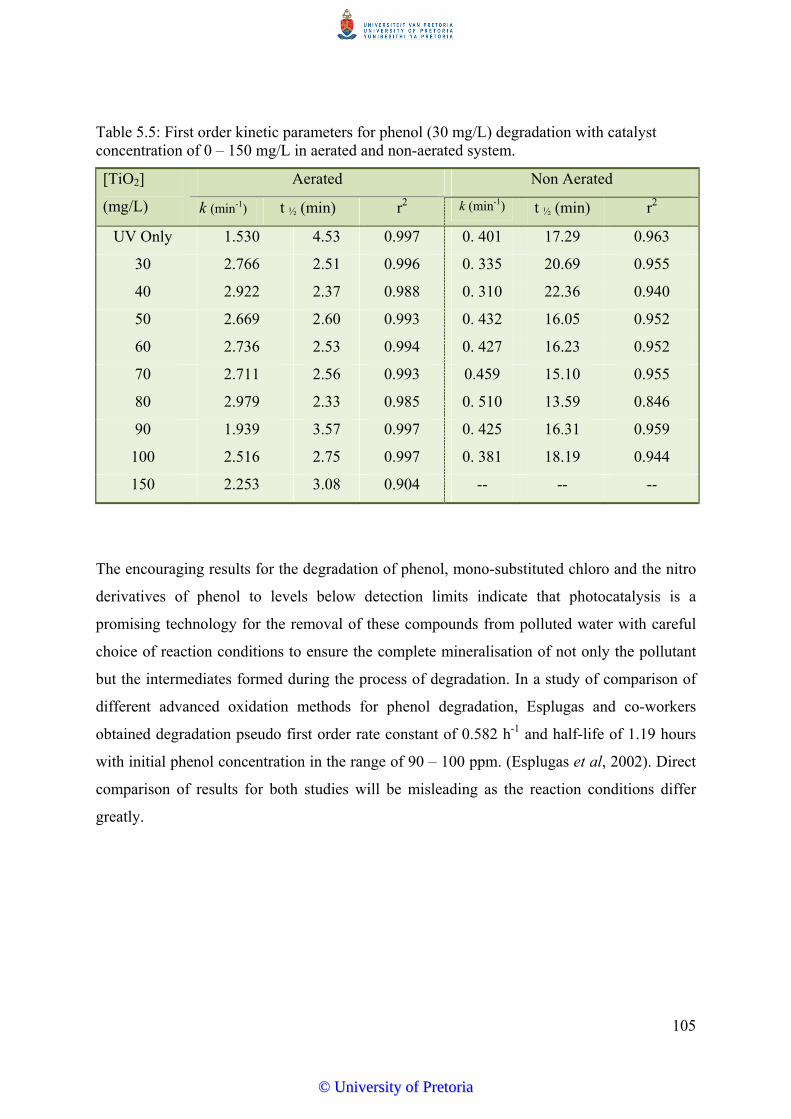
105
Table 5.5: First order kinetic parameters for phenol (30 mg/L) degradation with catalyst concentration of 0 – 150 mg/L in aerated and non-aerated system.
[TiO2]
(mg/L)
Aerated Non Aerated
k (min-1) t ½ (min) r2 k (min-1) t ½ (min) r2
UV Only 1.530 4.53 0.997 0. 401 17.29 0.963
30 2.766 2.51 0.996 0. 335 20.69 0.955
40 2.922 2.37 0.988 0. 310 22.36 0.940
50 2.669 2.60 0.993 0. 432 16.05 0.952
60 2.736 2.53 0.994 0. 427 16.23 0.952
70 2.711 2.56 0.993 0.459 15.10 0.955
80 2.979 2.33 0.985 0. 510 13.59 0.846
90 1.939 3.57 0.997 0. 425 16.31 0.959
100 2.516 2.75 0.997 0. 381 18.19 0.944
150 2.253 3.08 0.904 -- -- --
The encouraging results for the degradation of phenol, mono-substituted chloro and the nitro
derivatives of phenol to levels below detection limits indicate that photocatalysis is a
promising technology for the removal of these compounds from polluted water with careful
choice of reaction conditions to ensure the complete mineralisation of not only the pollutant
but the intermediates formed during the process of degradation. In a study of comparison of
different advanced oxidation methods for phenol degradation, Esplugas and co-workers
obtained degradation pseudo first order rate constant of 0.582 h-1 and half-life of 1.19 hours
with initial phenol concentration in the range of 90 – 100 ppm. (Esplugas et al, 2002). Direct
comparison of results for both studies will be misleading as the reaction conditions differ
greatly.
©© UUnniivveerrssiittyy ooff PPrreettoorriiaa
106
CHAPTER SIX
DEGRADATION OF TASTE AND ODOUR COMPOUNDS
— USING GEOSMIN AS A MODEL
6.1 Rationale of Geosmin Study
The enticing possibility of a greener solution of complete mineralisation of taste and odour
causing compounds in water makes photocatalysis a very interesting technology that could be
incorporated into the treatment train. The degradation process was studied in batch using
geosmin as the model compound. Photocatalytic degradation of geosmin was conducted
using reactor configuration B (Figure 3.1). Initial concentration of geosmin in the studies was
chosen based on levels detected in the environment. These were determined in source waters
at Rietvlei and Roodeplaat Water Treatment and were evaluated over an 11 months period
(Table 4.2).
Geosmin solutions were prepared in ultrapure water and geosmin photocatalytic degradation
was evaluated using 40 mg/L TiO2 using two light exposure conditions under a low pressure
lamp (9 W UV lamp) and medium pressure lamp (400 W UV lamp). The initial results
showed that the catalytic process performed best in the system irradiated using the medium
pressure (400 W) UV lamp. Titanium dioxide was then varied over a range of concentrations
(40-100 mg/L), irradiated with the medium pressure UV lamp; and with titanium dioxide
only in the absence of UV radiation – used as control.
6.2 Methodology of Geosmin Study
To obtain parameters for system optimization, studies were conducted to test the effects of
geosmin concentration, concentration of titanium dioxide catalyst, and the presence of ionic
species on the performance of photocatalytic degradation. Results of analysis of intermediates
formed during degradation gave an insight to the mode of fragmentation of the cyclic
compound in water which will form a framework for understanding of degradation pathways
in similar and more complex organic pollutants. The extent of contribution of reactive
©© UUnniivveerrssiittyy ooff PPrreettoorriiaa
107
hydroxyl radical specie (˙OH) to degradation was examined by conducting photocatalytic
experiments in the presence of radical scavenger, tertiary butanol (t-BuOH).
Slight modifications were made to the reactor configuration for more effective cooling of the
heat generated by the UV lamp. Photocatalytic degradation of geosmin was conducted in a
slightly modified reactor configuration. The setup consisted of 2 L glass reactor (Pyrex® glass
(Corning, NY); with the UV lamp enclosed in a double walled quartz sleeve. Temperature in
the reactor was controlled by circulating the cooling water through the outer jacket of the
double walled quartz sleeve. The schematic of the modified reactor is presented in Figure 3.1
as configuration B. The reactor contents were continually aerated at a flow rate of 10 mL/min
using an air Flow Meter and a perforated quartz disc or a quartz rod. Dissolved oxygen (DO)
was measured with an HQ30d DO Meter.
Aliquots (12 mL) were withdrawn from the reactor at predetermined intervals and filtered
through 0.22 µm syringe filters (Millipore). 10 mL of the filtered solution was analysed in the
GC/MS after the addition of 3 g of salt; and 0.5 mL of t-butanol. Tertiary butanol was added
as a radical scavenger to prevent further degradation by hydroxyl radicals in solution during
analysis. Total reaction time in all instances was 60 minutes. GC/MS conditions used to
monitor the progress of degradation of geosmin are listed in Table 3.4. The SIR scan
parameters used for this set of analysis are as presented in Table 3.6b.
6.3 Efficiency of Photocatalysis Degradation Geosmin
For practical application purposes, maximization of the photonic efficiency of a
photocatalytic system depends on optimized conditions in the photoreactor. One of the key
parameters is the catalyst concentration, since concentration strongly influences the photonic
efficiency of the lamp and subsequently the destruction rates (Lawton et al., 2003; Herrmann,
1999).
6.3.1 Effect of catalyst concentration on degradation efficiency
Rapid degradation was obtained at all catalyst concentrations studied after 40-60 minutes of
treatment. Degradation rates of geosmin increased with an increasing catalyst concentration
to an optimum of 60 ppm above which a reduction in rates was observed as shown in Table
©© UUnniivveerrssiittyy ooff PPrreettoorriiaa
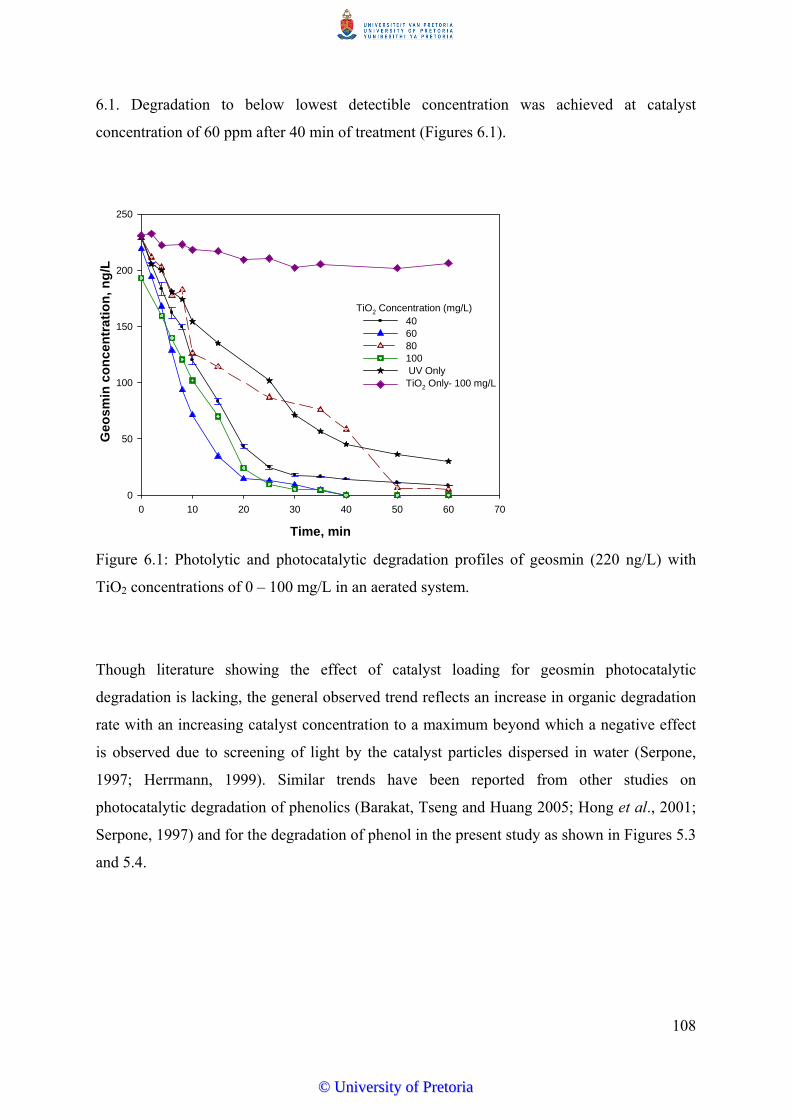
108
6.1. Degradation to below lowest detectible concentration was achieved at catalyst
concentration of 60 ppm after 40 min of treatment (Figures 6.1).
Time, min
0 10 20 30 40 50 60 70
Geo
smin
con
cent
ratio
n, n
g/L
0
50
100
150
200
250
406080100 UV Only TiO2 Only- 100 mg/L
TiO2 Concentration (mg/L)
Figure 6.1: Photolytic and photocatalytic degradation profiles of geosmin (220 ng/L) with
TiO2 concentrations of 0 – 100 mg/L in an aerated system.
Though literature showing the effect of catalyst loading for geosmin photocatalytic
degradation is lacking, the general observed trend reflects an increase in organic degradation
rate with an increasing catalyst concentration to a maximum beyond which a negative effect
is observed due to screening of light by the catalyst particles dispersed in water (Serpone,
1997; Herrmann, 1999). Similar trends have been reported from other studies on
photocatalytic degradation of phenolics (Barakat, Tseng and Huang 2005; Hong et al., 2001;
Serpone, 1997) and for the degradation of phenol in the present study as shown in Figures 5.3
and 5.4.
©© UUnniivveerrssiittyy ooff PPrreettoorriiaa

109
Table 6.1: Initial rates, rate constants, adsorption constant and photonic efficiencies of the various systems for geosmin degradation.
Reaction Conditions Ri
(ng/L min-1)
k x 10-2
(ng/L min-1)
R2 K x 10-3
(ng/L -1)
δ x 10-3
TiO2 40 mg/L /UV
– 9W
3.31 1.03 0.98 4.58 7.77 x10⁻³
TiO2 40 mg/L /UV
- 400W
7.26 6.21 0.97 4.47 1.85 x10⁻³
TiO2 60 mg/L /UV
- 400W
14.78 15.50 0.87 4.61 4.61 x10⁻³
TiO2 80 mg/L /UV
- 400W
10.27 5.80 0.84 4.39 1.72 x10⁻³
Treating geosmin with the catalyst alone (100 mg/L) in the dark achieved less than 8%
removal from solution (Figure 6.1) which gives a strong indication that the success of
degradation of the organic pollutants is dependent on the availability of reactive radical
species in solution and on the catalyst surface. Overall removal in the range of 92-100% was
observed in the batches spiked with 220 and 440 ng/L and 10 g/L (Figure 6.1, 6.2) with
photocatalysis. Treating geosmin at the same concentrations (220, 500 ng/L and 10 g/L)
with photolysis alone achieved 86% removal. Residual geosmin from solutions spiked with
220 ng/L after 60 min of treatment of 30 ng/L, was still significantly above the human
detection threshold. This implies that UV photolysis would not be an effective stand-alone
method for the degradation of geosmin.
6.3.2 Effect of Pollutant Concentration of Degradation Rates
Increasing geosmin concentration from 220 ng/L to 440 ng/L resulted in a decrease in the
efficiency of the photocatalytic system as degradation of geosmin below detection limit was
not achieved after 60 minutes of treatment (Figure 6.2) even with catalyst concentration of 60
mg/L which was determined to as an optimum catalyst concentration for geosmin degradation
with 220 ng/L. It is interesting to note that UV photolysis on geosmin with initial geosmin
concentration of 440 ng/L achieved 86% degradation as that with the initial geosmin
©© UUnniivveerrssiittyy ooff PPrreettoorriiaa

110
concentration of 220 ng/L. This might suggest that for geosmin photolytic degradation could
proceed at rates that are independent of initial geosmin concentration with the UV radiation
conditions used in the study.
Time, min
0 10 20 30 40 50 60 70
Con
cent
ratio
n of
geo
smin
, ng/
L
0
100
200
300
400
500
TiO2-40 mg/L
TiO2 -60 mg/L
TiO2 -80 mg/L
UV Only
Figure 6.2: Degradation profiles of geosmin (440 ng/L) with TiO2 concentrations of 0 – 80 mg/L.
Though photocatalysis achieved degradation for solutions of geosmin (220 ng/L) in 40
minutes of treatment with catalyst concentration of 60 mg/L to levels below the lowest
detectable concentrations, degradation of geosmin in solutions containing initial
concentration of 440 ng/L of geosmin achieved about 92% after 60 minutes of treatment.
6.3.3 Effect of Ionic Species on Degradation Kinetics of Geosmin
The presence of ionic species in water can affect the degradation efficiency of a
photocatalytic system positively or negatively depending on the type of ionic species present
and the type of interaction that occurs between the ionic species and reactive species in
solution, particularly their interaction with hydroxyl radicals in solution. Common ionic
species in water include CO32‒, HCO3
¯, Cl¯ and SO42‒. The effect of bicarbonate and sulphate
ions in solution on the degradation efficiency of geosmin was examined at geosmin
©© UUnniivveerrssiittyy ooff PPrreettoorriiaa
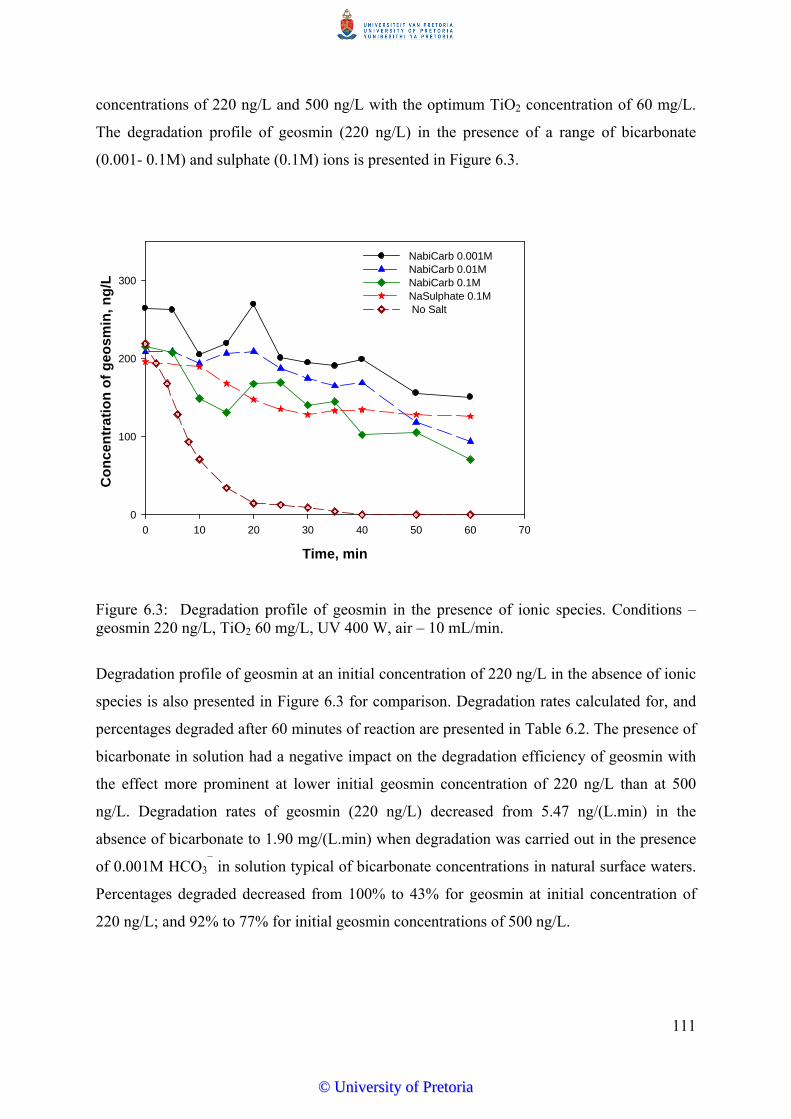
111
concentrations of 220 ng/L and 500 ng/L with the optimum TiO2 concentration of 60 mg/L.
The degradation profile of geosmin (220 ng/L) in the presence of a range of bicarbonate
(0.001- 0.1M) and sulphate (0.1M) ions is presented in Figure 6.3.
Time, min
0 10 20 30 40 50 60 70
Con
cent
ratio
n of
geo
smin
, ng/
L
0
100
200
300
NabiCarb 0.001M NabiCarb 0.01M NabiCarb 0.1M NaSulphate 0.1M No Salt
Figure 6.3: Degradation profile of geosmin in the presence of ionic species. Conditions – geosmin 220 ng/L, TiO2 60 mg/L, UV 400 W, air – 10 mL/min.
Degradation profile of geosmin at an initial concentration of 220 ng/L in the absence of ionic
species is also presented in Figure 6.3 for comparison. Degradation rates calculated for, and
percentages degraded after 60 minutes of reaction are presented in Table 6.2. The presence of
bicarbonate in solution had a negative impact on the degradation efficiency of geosmin with
the effect more prominent at lower initial geosmin concentration of 220 ng/L than at 500
ng/L. Degradation rates of geosmin (220 ng/L) decreased from 5.47 ng/(L.min) in the
absence of bicarbonate to 1.90 mg/(L.min) when degradation was carried out in the presence
of 0.001M HCO3¯ in solution typical of bicarbonate concentrations in natural surface waters.
Percentages degraded decreased from 100% to 43% for geosmin at initial concentration of
220 ng/L; and 92% to 77% for initial geosmin concentrations of 500 ng/L.
©© UUnniivveerrssiittyy ooff PPrreettoorriiaa
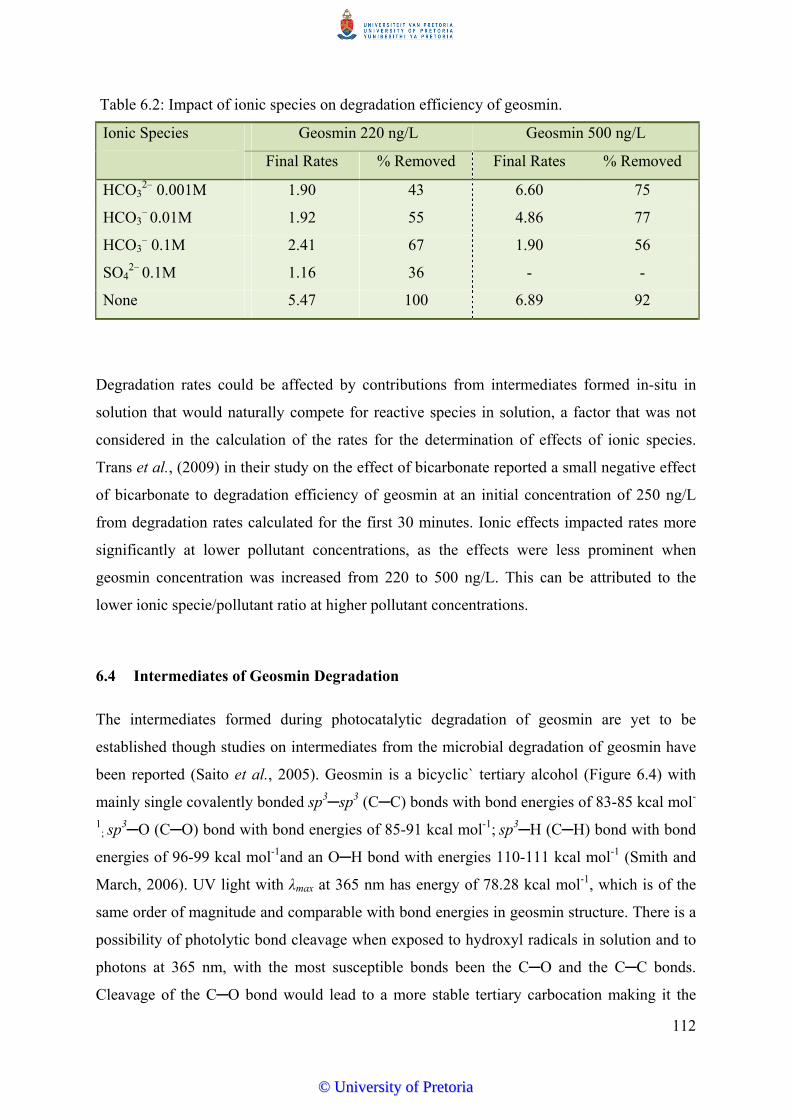
112
Table 6.2: Impact of ionic species on degradation efficiency of geosmin.
Ionic Species Geosmin 220 ng/L Geosmin 500 ng/L
Final Rates % Removed Final Rates % Removed
HCO32‒ 0.001M 1.90 43 6.60 75
HCO3‒ 0.01M 1.92 55 4.86 77
HCO3‒ 0.1M 2.41 67 1.90 56
SO42‒ 0.1M 1.16 36 - -
None 5.47 100 6.89 92
Degradation rates could be affected by contributions from intermediates formed in-situ in
solution that would naturally compete for reactive species in solution, a factor that was not
considered in the calculation of the rates for the determination of effects of ionic species.
Trans et al., (2009) in their study on the effect of bicarbonate reported a small negative effect
of bicarbonate to degradation efficiency of geosmin at an initial concentration of 250 ng/L
from degradation rates calculated for the first 30 minutes. Ionic effects impacted rates more
significantly at lower pollutant concentrations, as the effects were less prominent when
geosmin concentration was increased from 220 to 500 ng/L. This can be attributed to the
lower ionic specie/pollutant ratio at higher pollutant concentrations.
6.4 Intermediates of Geosmin Degradation
The intermediates formed during photocatalytic degradation of geosmin are yet to be
established though studies on intermediates from the microbial degradation of geosmin have
been reported (Saito et al., 2005). Geosmin is a bicyclic` tertiary alcohol (Figure 6.4) with
mainly single covalently bonded sp3─sp3 (C─C) bonds with bond energies of 83-85 kcal mol-
1; sp3─O (C─O) bond with bond energies of 85-91 kcal mol-1; sp3─H (C─H) bond with bond
energies of 96-99 kcal mol-1and an O─H bond with energies 110-111 kcal mol-1 (Smith and
March, 2006). UV light with λmax at 365 nm has energy of 78.28 kcal mol-1, which is of the
same order of magnitude and comparable with bond energies in geosmin structure. There is a
possibility of photolytic bond cleavage when exposed to hydroxyl radicals in solution and to
photons at 365 nm, with the most susceptible bonds been the C─O and the C─C bonds.
Cleavage of the C─O bond would lead to a more stable tertiary carbocation making it the
©© UUnniivveerrssiittyy ooff PPrreettoorriiaa
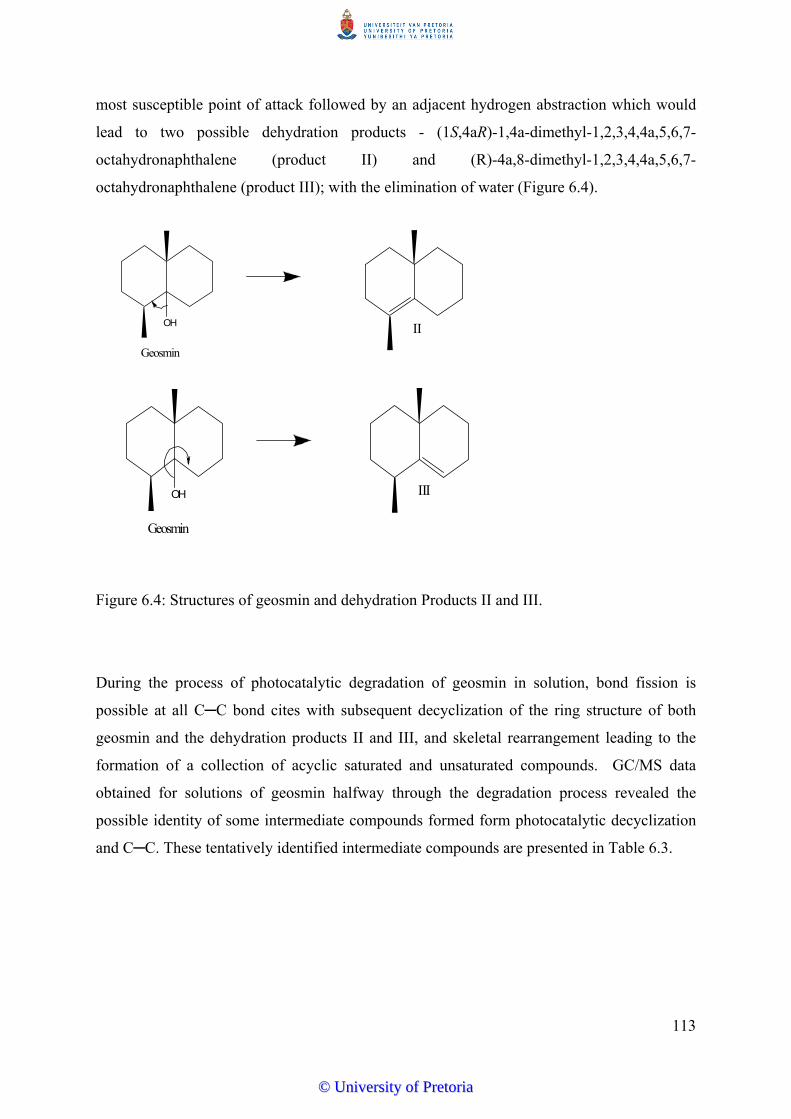
113
most susceptible point of attack followed by an adjacent hydrogen abstraction which would
lead to two possible dehydration products - (1S,4aR)-1,4a-dimethyl-1,2,3,4,4a,5,6,7-
octahydronaphthalene (product II) and (R)-4a,8-dimethyl-1,2,3,4,4a,5,6,7-
octahydronaphthalene (product III); with the elimination of water (Figure 6.4).
Figure 6.4: Structures of geosmin and dehydration Products II and III.
During the process of photocatalytic degradation of geosmin in solution, bond fission is
possible at all C─C bond cites with subsequent decyclization of the ring structure of both
geosmin and the dehydration products II and III, and skeletal rearrangement leading to the
formation of a collection of acyclic saturated and unsaturated compounds. GC/MS data
obtained for solutions of geosmin halfway through the degradation process revealed the
possible identity of some intermediate compounds formed form photocatalytic decyclization
and C─C. These tentatively identified intermediate compounds are presented in Table 6.3.
OH
Geosmin
II
IIIOH
Geosmin
©© UUnniivveerrssiittyy ooff PPrreettoorriiaa

114
Table 6.3: GC/MS data of geosmin and some tentatively identified intermediate compounds from photocatalytic degradation of geosmin.
Chemical formula Compound
No. in
Figure 6.5
Retention
Time
(Min)
Match Probability Major Ions for Identification
C12H22O(geosmin) 24.98 Standard 112,41,55,111,125,43,97
C8H16 V 15.64 824 41,31,55,57,70,83
C7H14O VI 24.06 759 43,71,56,55,41,39
C6H12O2 VII 24.06 766 43,71,55,41,39
C7H12O VIII 15.64 751 41,31,55,57,70,83
Degradation intermediates suggested from GC/MS analysis include 3,5-dimethlyhex-1-
ene(V), which would most likely be a product of ring fission at positions indicated in Figure
6.5 (IV). Other intermediate products suggested include 2,4-dimethlypentan-3-one (VI), 2-
methylethylpropanoate (VII), 2-heptanal (VIII) (Figure 6.5).
Figure 6.5: Structures of some GC/MS tentatively identified intermediates from the degradation of geosmin.
©© UUnniivveerrssiittyy ooff PPrreettoorriiaa
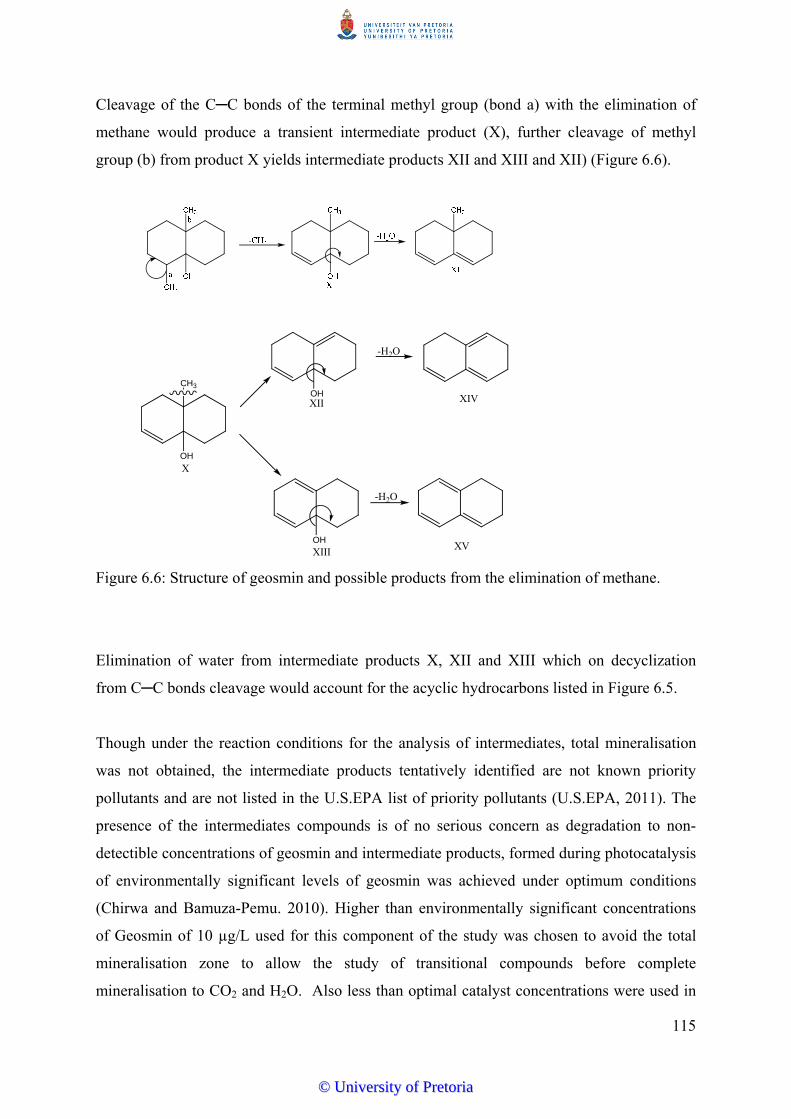
115
Cleavage of the C─C bonds of the terminal methyl group (bond a) with the elimination of
methane would produce a transient intermediate product (X), further cleavage of methyl
group (b) from product X yields intermediate products XII and XIII and XII) (Figure 6.6).
OH
CH3
OH
OHXII
XIII
XIV
XV
X
-H2O
-H2O
Figure 6.6: Structure of geosmin and possible products from the elimination of methane.
Elimination of water from intermediate products X, XII and XIII which on decyclization
from C─C bonds cleavage would account for the acyclic hydrocarbons listed in Figure 6.5.
Though under the reaction conditions for the analysis of intermediates, total mineralisation
was not obtained, the intermediate products tentatively identified are not known priority
pollutants and are not listed in the U.S.EPA list of priority pollutants (U.S.EPA, 2011). The
presence of the intermediates compounds is of no serious concern as degradation to non-
detectible concentrations of geosmin and intermediate products, formed during photocatalysis
of environmentally significant levels of geosmin was achieved under optimum conditions
(Chirwa and Bamuza-Pemu. 2010). Higher than environmentally significant concentrations
of Geosmin of 10 µg/L used for this component of the study was chosen to avoid the total
mineralisation zone to allow the study of transitional compounds before complete
mineralisation to CO2 and H2O. Also less than optimal catalyst concentrations were used in
©© UUnniivveerrssiittyy ooff PPrreettoorriiaa
116
the current study, reaction conditions were chosen to attempt the identification of
intermediates formed during degradation rather than achieving mineralisation during
degradation.
6.5 Degradation Pathway Analysis
Degradation of organic pollutants during photocatalysis is often attributed to the hydroxyl
radical oxidation. However, UV photolysis is also used as a stand-alone method for water
treatment and from the theory of photocatalysis, the positive holes generated are capable of
oxidation of organic compounds in water. The dominant of these degradation pathways is not
fully established. To obtain better understanding of the degradation pathway for geosmin,
degradation studies were conducted under three experimental conditions:
Photolysis – with UV irradiation with 400W UV lamp
Photocatalysis with 400W UV lamp and anatase TiO2 (40 mg/L); and
Photocatalysis with 400W UV lamp and anatase TiO2 (40 mg/L) in the presence of t-
butanol (a radical scavenger).
Degradation of organic compounds by photocatalysis is often attributed to reaction with
highly reactive hydroxyl radicals generated in solution (Lawton et al., 2003), the current
study indicates that there is synergic contribution of the three possible reactive paths leading
to the rapid degradation of geosmin in solution. This can be attributed to the significant level
of degradation achieved with UV radiation alone in the absence of the catalyst. However,
reaction rate constants obtained for the reactions where hydroxyl radicals in solution were
quenched by the introduction of tertiary butanol indicate that the dominant reactive pathway
is via oxidation by hydroxyl radicals in solution. This is consistent with findings by Trans et
al., (2009) in their study on the effect of ionic species on the photocatalytic degradation
efficiency of geosmin. This is due to the very high oxidative potential of hydroxyl radicals
(2.8 V), which is higher than most other oxidants with the exception of fluorine. The presence
of oxygenated degradation products (VI-VII) – Figure 6.5; rather than only products from
bond cleavage is also an indication of the presence of oxidative species in solution.
Control experiments with the catalyst only (100 mg/L) in the absence of UV radiation gave
no appreciable reduction in geosmin concentration (Figure 6.1), indicating that reduction in
©© UUnniivveerrssiittyy ooff PPrreettoorriiaa
117
geosmin concentration is due to the suggested reactive pathways and no significant losses
from evaporation and other unidentified sources occurred.
6.6 Photolytic Degradation Kinetics
The reactive component in the presence of UV light was earlier determined to be the
hydroxyl radicals (OH) generated from the splitting of water by electromagnetic waves
(Schwarzenbach et al., 2003). The rate of reaction of any compound will therefore be
dependent on the availability of reactive sites, i.e., a concentration will be reached when the
amount of reactant in the system exceeds the amount of hydroxyl radicals (OH) produced at
which point the amount of reactant supplied is at equilibrium with the amount of oxidant. The
saturation kinetics can thus be applied in a system with increasing reactant concentration as
follows:
CK
CkCv
C
OH (6.1)
where C = concentration of geosmin (ML-3) at time t, COH = concentration of hydroxyl
radicals (ML-3) generated at the given UV light intensity, v = geosmin oxidation rate (ML-3T-
1), k = reaction rate coefficient (T-1), and KC = half velocity concentration of geosmin (ML-3).
In the above equation, the multiple of the degradation rate coefficient (k) and the maximum
achievable hydroxyl radical concentration (COH) yields the maximum reaction rate
coefficient, vmax = k COH (ML-3T-1).
In this study, a much lower concentration of geosmin was evaluated in the ngL-1 range. Under
these conditions, geosmin concentration could be much lower than the half velocity
concentration, KC>>C, such that the group k COH/KC becomes constant and Equation 6.1 is
reduced to the first order form:
CK
Ckv
C
OH (6.2)
Equation 6.2 is evaluated using the experimental data by plotting ln(C/Co) versus t and the
slope is a constant k COH/KC represented by the pseudo constant k’ (T-1).
©© UUnniivveerrssiittyy ooff PPrreettoorriiaa
118
The data from three sets of experiments at initial concentrations 220 ng/L, 500 ng/L and 10
g/L was evaluated and the closeness of fit was demonstrated by the high values of
regression coefficient (r2) (Figure 6.8, Table 6.4). The model fitness confirms that indeed the
driving factor of photolytic degradation for geosmin is the hydroxyl radical. The results show
that the degradation rate coefficient k’ was relatively constant regardless of the initial
concentration of geosmin used in this range which further confirms the relevance of the
photolytic reaction via hydroxyl radical oxidation as represented by Equations 6.1 and 6.2
above.
6.7 Photolytic Reaction with Particle Surface Catalysis
Particles contribute to light attenuation in a water sample, both by light absorption and
scattering. Depending on which effect is predominant, the rate of direct photolysis of a
dissolved species in a given system may be decreased or enhanced (Schwarzenbach et al.,
2003). Experimental observations in the case of titanium dioxide (TiO2) showed a marked
increase in degradation of geosmin. The enhanced degradation in the presence of TiO2
particles was attributed to the possibility of extra oxidation reactions occurring near or at the
solid semiconductor surfaces. Preliminary inspection of degradation rate kinetics in the
presence of TiO2 showed that phenol degradation complied with and can be adequately
described by the first order reaction rate kinetics as shown by the linear plots of ln Ct/Co
(Figure 5.17 and 5.18) for the aerated and non-aerated systems. On the other hand, it is
apparent that geosmin degradation in the presence of the TiO2 particles did not comply
completely with the first-order reaction rate kinetics (data not shown) as indicated by low r2
values of 0.77-0.89. At the moment, the uncertainty on the amount of •OH generated affects
the reliability of the model. However, the stability in the parameter k’ could serve as an
indirect indicator of the stability in this parameter.
Since the observed increase in geosmin degradation was at best minimal, we assume reaction
rate limitation of the overall removal of geosmin associated with the particles. In other words,
the rate at which geosmin molecules reach the reaction sites superseded the rate of conversion
at the sites. A concurrent reaction analogous to the Langmuir equation (Equation 5.2) must
then occur at the particles as follows:
©© UUnniivveerrssiittyy ooff PPrreettoorriiaa
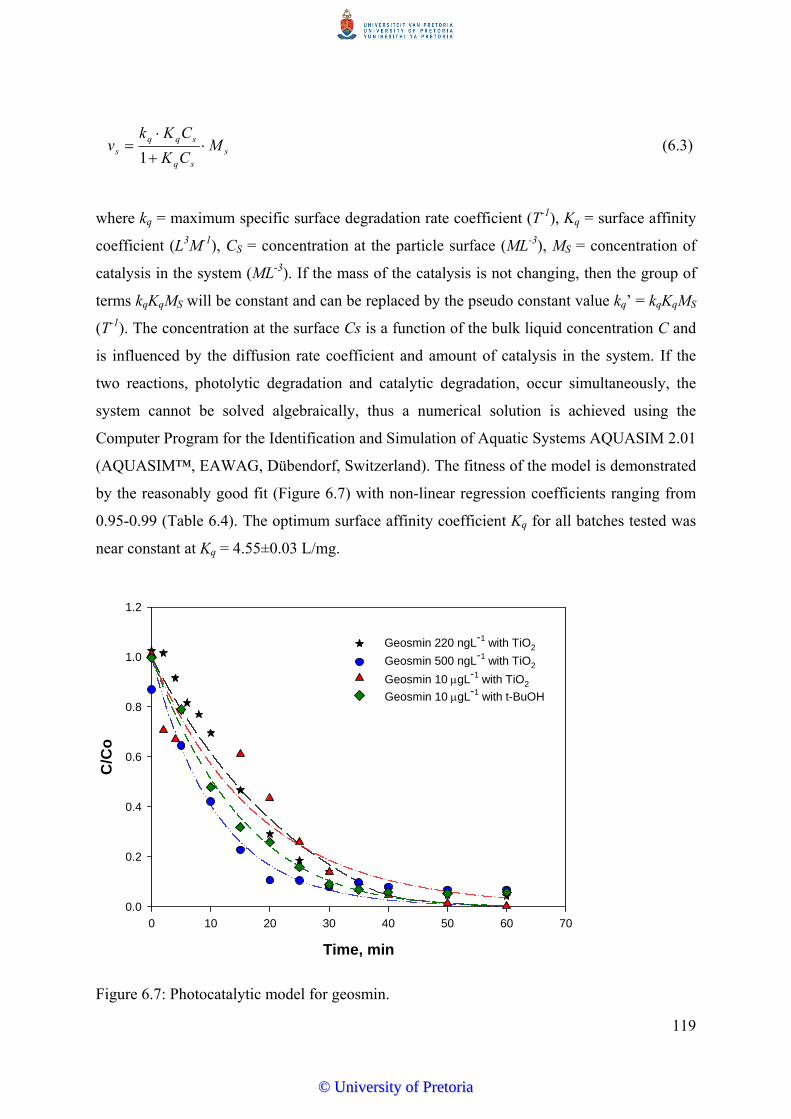
119
ssq
sqqs M
CK
CKkv
1 (6.3)
where kq = maximum specific surface degradation rate coefficient (T-1), Kq = surface affinity
coefficient (L3M-1), CS = concentration at the particle surface (ML-3), MS = concentration of
catalysis in the system (ML-3). If the mass of the catalysis is not changing, then the group of
terms kqKqMS will be constant and can be replaced by the pseudo constant value kq’ = kqKqMS
(T-1). The concentration at the surface Cs is a function of the bulk liquid concentration C and
is influenced by the diffusion rate coefficient and amount of catalysis in the system. If the
two reactions, photolytic degradation and catalytic degradation, occur simultaneously, the
system cannot be solved algebraically, thus a numerical solution is achieved using the
Computer Program for the Identification and Simulation of Aquatic Systems AQUASIM 2.01
(AQUASIM™, EAWAG, Dübendorf, Switzerland). The fitness of the model is demonstrated
by the reasonably good fit (Figure 6.7) with non-linear regression coefficients ranging from
0.95-0.99 (Table 6.4). The optimum surface affinity coefficient Kq for all batches tested was
near constant at Kq = 4.55±0.03 L/mg.
Time, min
0 10 20 30 40 50 60 70
C/C
o
0.0
0.2
0.4
0.6
0.8
1.0
1.2
Geosmin 220 ngL-1 with TiO2
Geosmin 500 ngL-1 with TiO2
Geosmin 10 gL-1 with TiO2
Geosmin 10 gL-1 with t-BuOH
Figure 6.7: Photocatalytic model for geosmin.
©© UUnniivveerrssiittyy ooff PPrreettoorriiaa
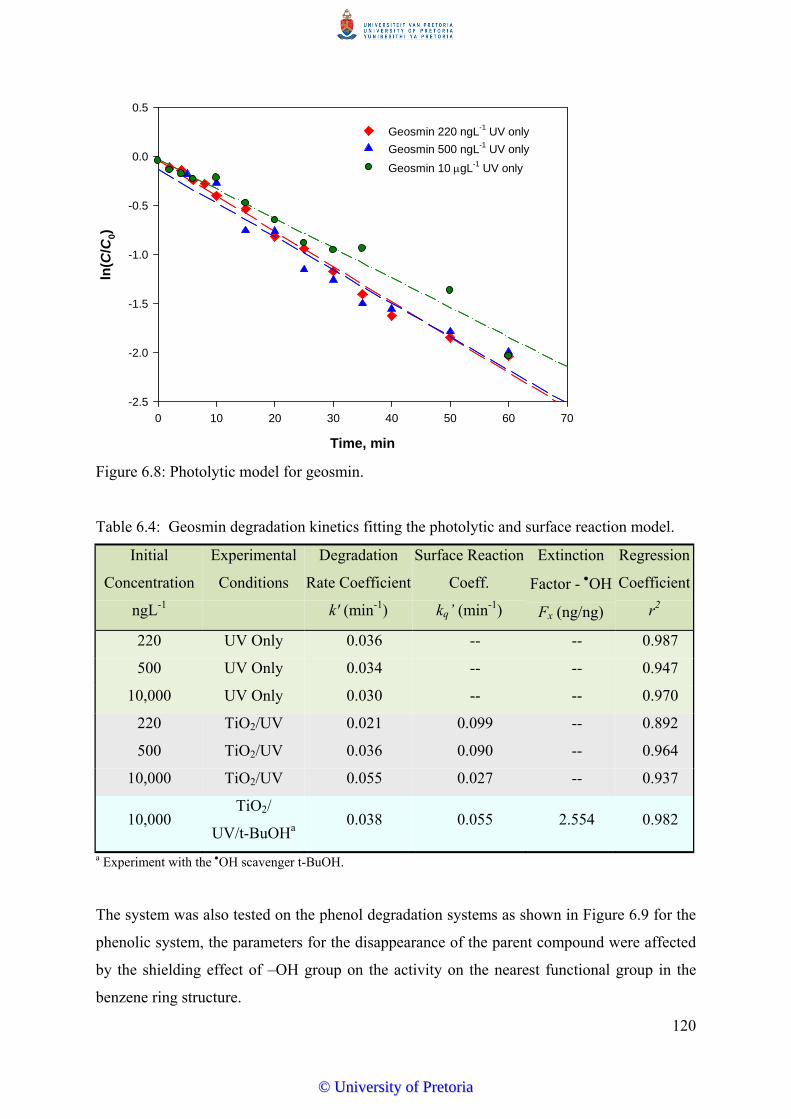
120
Time, min
0 10 20 30 40 50 60 70
ln( C
/ C0)
-2.5
-2.0
-1.5
-1.0
-0.5
0.0
0.5
Geosmin 220 ngL-1 UV only
Geosmin 500 ngL-1 UV only
Geosmin 10 gL-1 UV only
Figure 6.8: Photolytic model for geosmin.
Table 6.4: Geosmin degradation kinetics fitting the photolytic and surface reaction model.
Initial
Concentration
ngL-1
Experimental
Conditions
Degradation
Rate Coefficient
k' (min-1)
Surface Reaction
Coeff.
kq’ (min-1)
Extinction
Factor - OH
Fx (ng/ng)
Regression
Coefficient
r2
220 UV Only 0.036 -- -- 0.987
500 UV Only 0.034 -- -- 0.947
10,000 UV Only 0.030 -- -- 0.970
220 TiO2/UV 0.021 0.099 -- 0.892
500 TiO2/UV 0.036 0.090 -- 0.964
10,000 TiO2/UV 0.055 0.027 -- 0.937
10,000 TiO2/
UV/t-BuOHa 0.038 0.055 2.554 0.982
a Experiment with the OH scavenger t-BuOH.
The system was also tested on the phenol degradation systems as shown in Figure 6.9 for the
phenolic system, the parameters for the disappearance of the parent compound were affected
by the shielding effect of –OH group on the activity on the nearest functional group in the
benzene ring structure.
©© UUnniivveerrssiittyy ooff PPrreettoorriiaa
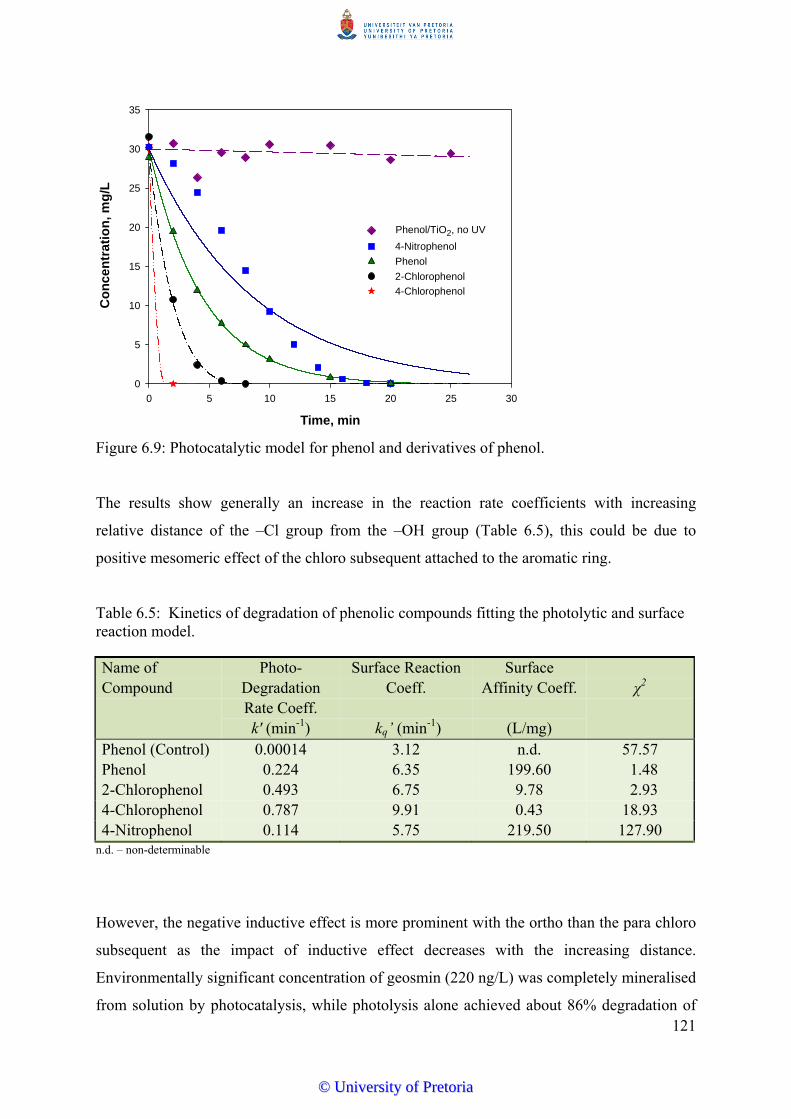
121
2-Chlorophenol
Phenol
4-Chlorophenol
4-Nitrophenol
Time, min
0 5 10 15 20 25 30
Con
cent
ratio
n, m
g/L
0
5
10
15
20
25
30
35
Phenol/TiO2, no UV
Figure 6.9: Photocatalytic model for phenol and derivatives of phenol.
The results show generally an increase in the reaction rate coefficients with increasing
relative distance of the –Cl group from the –OH group (Table 6.5), this could be due to
positive mesomeric effect of the chloro subsequent attached to the aromatic ring.
Table 6.5: Kinetics of degradation of phenolic compounds fitting the photolytic and surface reaction model.
Name of Compound
Photo-Degradation Rate Coeff. k' (min-1)
Surface Reaction Coeff.
kq’ (min-1)
Surface Affinity Coeff.
(L/mg)
χ2
Phenol (Control) 0.00014 3.12 n.d. 57.57 Phenol 0.224 6.35 199.60 1.48 2-Chlorophenol 0.493 6.75 9.78 2.93 4-Chlorophenol 0.787 9.91 0.43 18.93 4-Nitrophenol 0.114 5.75 219.50 127.90
n.d. – non-determinable
However, the negative inductive effect is more prominent with the ortho than the para chloro
subsequent as the impact of inductive effect decreases with the increasing distance.
Environmentally significant concentration of geosmin (220 ng/L) was completely mineralised
from solution by photocatalysis, while photolysis alone achieved about 86% degradation of
©© UUnniivveerrssiittyy ooff PPrreettoorriiaa
122
geosmin regardless of initial concentration of geosmin. Degradation in solution is attributed
to the synergic contribution from hydroxyl radicals (•OH), photolysis and reactive positive
holes though results from kinetic analysis suggest that hydroxyl radical (•OH) as the critical
reactant in the system. Thus engineering of the photolytic/photocatalytic system could focus
on maximising oxidative potential by enhancing the processes responsible for generating
•OH. Presence of ionic species reduces photocatalytic degradation efficiency of geosmin.
Kinetic parameters obtained from the photolytic and photocatalytic model for geosmin
obtained in this study could not be compared with other values in literature as no studies on
photolytic modelling on particle surface for geosmin were found in literature as at the time of
reporting these results.
©© UUnniivveerrssiittyy ooff PPrreettoorriiaa
123
CHAPTER SEVEN
CONCLUSION AND RECOMMENDATIONS
7.1 Conclusion
A study of the results from laboratory experiments obtained from both degradation studies of
phenol, mono substituted phenols and geosmin has led to the following conclusions and
recommendations.
1. The study shows that the degradation of phenol, chlorophenol and nitrophenol in the
photo-reactor followed first-order kinetics for photolytic reaction (UV only) and mixed-
order kinetics for the reaction catalysed by TiO2 semiconductor particles.
2. The trend of dehalogenation and its effects on degradation of phenol and its substituted
derivatives was determined. Presence of the highly electronegative chloro-group on
phenol greatly improves degradation rates of phenol.
3. Results from degradation of phenol suggest that catechol, resorcinol and hydroquinone
are the three main aromatic intermediates formed. Catechol, resorcinol and
hydroquinone are the aromatic intermediates formed from phenol degradation but are
completely removed from solution minutes after phenol is completely degraded in
solution.
4. Degradation of geosmin in the photo-reactor also followed first-order kinetics for
photolytic reaction (UV only) and mixed-order kinetics for the reaction catalysed by
TiO2 semiconductor particles.
5. Intermediate products obtained from rapid photolytic/photocatalytic degradation of
geosmin in solution were also tentatively identified.
6. The results show that geosmin undergoes rapid ring opening and subsequent bond
cleavage at multiple sites to produce acyclic saturated and unsaturated compounds
including some alkanones and esters.
7. Degradation below lowest detectible concentrations was achieved in batches operated at
low geosmin and phenol concentrations. Complete degradation of intermediates
accumulated at higher initial geosmin concentration could require longer reaction times
or additional stages if used in a continuous flow process.
©© UUnniivveerrssiittyy ooff PPrreettoorriiaa
124
8. The kinetic analysis results suggest the hydroxyl radical (•OH) as the critical reactant in
the system. Thus engineering of the photolytic/photocatalytic system could focus on
maximising oxidative potential by enhancing the processes responsible for generating
•OH. Degradation in solution is attributed to the synergic contribution from hydroxyl
radicals (•OH), photolysis and reactive positive holes.
9. Kinetic parameters obtained from the photolytic and photocatalytic model for geosmin
obtained in this study could not be compared with other values in literature as no studies
on photolytic modelling on particle surface for geosmin degradation were found in
literature as at the time of reporting these results.
10. Lessons learnt can be applied to the degradation of similar organic compounds of
environmental concern.
7.2 Recommendations
For practical purposes, the cost related to power input using electricity powered radiation
sources could be lowered by using solar energy (UV radiation from the sun) and engineering
effective plates to harness this readily available power source. Some configurations of solar
plates are now available commercially and can be tested for in replacement of the artificial
UV light sources.
The catalyst in the dispersed form presents the problems of separation of the catalyst from
solution and reduction in efficiency at high catalyst concentrations due to turbidity as a result
of screening effect of the photons of light by excess catalyst particles. Further research is
necessary to test the performance of the system with fixed phase catalyst, by exploring a
variety of substrates that can be used as support for the fixed phase. The catalyst in the fixed
phase has the additional advantage of the possibility of reuse of the fixed film. Focus in the
effort to obtain suitable fixed film configurations should be geared towards maximising
surface area of the catalyst available to photons of light and contact with pollutants in
solution.
Geosmin degradation intermediates formed in solution could be quantified for better
understanding of the formation and degradation pattern of the suggested intermediates in
solution. Verification and quantification of intermediates can be achieved by analysing varied
©© UUnniivveerrssiittyy ooff PPrreettoorriiaa
125
concentrations of standard solutions by GC/MS. Corresponding individual calibration graphs
can be obtained for each intermediate from which concentrations of intermediates formed in
solution can be obtained by analysing aliquots withdrawn from the reactor at regular time
intervals. This information can be pooled together to give a formation/ degradation profile for
each intermediate in solution.
Further studies could be conducted with the pollutants from actual polluted waste water
streams or source water to determine the effect of presence of other pollutant matrix on the
degradation efficiencies of the compounds under study
Total Organic Carbon (TOC), Chemical Oxygen Demand (COD) and Dissolved Organic
Compound (DOC) measurements during degradation studies will give conclusive information
as to the total mineralisation of parent pollutants and intermediate compounds formed during
degradation.
Profiling of the degradation intermediates of 2-chlorophenol, 4-chlorophenol and nitrophenol
should give vital information as to the effect of the presence of substituent groups on the
degradation rates of phenol. Information on the cleavage pattern of the chloro, nitro and
hydroxyl substituents on the benzene aromatic ring could provide relevant information that
can be used to predict degradation patterns of substituted aromatic compounds and the
relative effects of the presence of such substituents on the system.
Testing the system with a continuous flow configuration would be a step forward to bridging
the gap from the laboratory to the possibility of incorporation in the water treatment train as it
would give necessary kinetic parameters needed for s system scale-up.
©© UUnniivveerrssiittyy ooff PPrreettoorriiaa
126
REFERENCES
Abe K. and Tanaka K. (1997) Fe3+ and UV-enhanced ozonation of chlorophenolic compounds in aqueous medium. Chemosphere 35 2837-2847.
Ahmed S. Rasul M.G, Martens W.N., Brown R., Hashib M.A. (2010) Heterogeneous
photocatalytic degradation of phenols in wastewater: A review on current status and developments. Desalination 261 3-18.
Alapi T. and Dombi A. (2006) Comparative study of the UV and UV/VUV photolysis of
phenol in aqueous solution by using different types of low-pressure mercury lamps.
International Conferenceon Ozone and UV, Berlin, Germany.
Alnuaimi M.A., Rauf M.A. and Ashraf S.S. (2007) Comparative decolouration study of Neutral Red by different oxidative processes. Dyes and Pigment 72 (3) 367-371.
Alvarez D.A., Stackelberg P.E., Petty J.D., Huckins E.T., Furlong E.T., Zaugg S.D. and
Meyer M.T. (2005) Comparison of a novel passive sampler to standard water-column sampling for organic contaminants associated with wastewater effluents entering a New Jersey stream. Chemosphere 61, 610-622.
Andreozzi R., Caprio V. and Insola A. (1996) Kinetics and Mechanisms of
polyethyleneglycol fragmentation by ozone in aqueous solution. Water Research 30 2955 -2960.
Andreozzi R., Caprio V., Insola A. and Marotta R. (1999) Advanced oxidation processes
(AOP) for water purification and recovery. Catalysis Today 53 51-59. Andreozzi R., Caprio V., Insola A., Marotta R. and Sanchirico R. (2000) Advanced oxidation
processes for the treatment of mineral oil-contaminated wastewaters. Water Research 34 (2) 620-628.
Ashok B.T., Saxena S., Singh K.P. and Musarrat J. (1995) Biodegradation of polycyclic
aromatic hydrocarbons in soil around Mathura oil refinery, India. World Journal of Microbiology and Biotechnology 11 (6) 691-692.
Apha (1995) Standard methods for the examination of water and wastewater. 18th ed.
Washington D.C. American Public Health Association 1995.
©© UUnniivveerrssiittyy ooff PPrreettoorriiaa
127
Auguglisto V., Litter M., Palmisano l. and Soria J. (2006) The combination of heterogenous photocatalysis with chemical and physical operations: A tool for improving the photoprocess performance. Journal of Photochemistry and Photobiology C: 7 127-144.
Bacaloni A., Cafaro C., De Giorgi L., Ruocco R. and Zoccolillo L. (2004) Improved analysis of polycylic aromatic hydrocarbons in atmospheric particulate matter by HPLC-fluorescence. Annali di Chimica 94 (9-10) 751-759
Bahnemann D. (2004) Photocatalytic water treatment: solar energy applications. Solar
Energy 77 445-459. Baird, C. (2000) Environmental Chemistry. W.H. Freeman & Co., New York. Bamuza-Pemu E.E. and Chirwa E.M.N. (2012) Photocatalytic degradation of geosmin:
degradation pathway analysis. Water SA 38 (5) 689-696.
Bamuza-Pemu E.E. and Chirwa E.M.N. (2011) Photocatalytic degradation of geosmin:
intermediates and degradation pathway analysis. 10th International Conference on
Chemical and Process Engineering), 8-11May 2011, Florence, Italy.
Bamuza-Pemu E.E. and Chirwa E.M.N. (2010) Photocatalytic degradation of taste and odour
causing compounds in natural water sources. Chemical Engineering Transaction 23
387-392.
Banerjee A.N., Joo S.W., and Min B-K (2012) Photocatalytic degradation of organic dye by
sol-gel-derived gallium-doped anatase titanium oxide nanoparticles for environmental
remediation. Journal of Nanomaterials, Volume 2012, Article ID 201492, 14 pages.
doi:10.1155/2012/201492
Bao M-L, Barbieri K., Burrini D., Griffini O. and Pantani F. (1997) Determination of trace
levels of taste and odour compounds in water by microextraction and gas chromatography-ion-trap detection-mass spectrometry. Water Research 31 (7) 1719-1727.
Barakat M.A., Tseng J.M. and Huang C.P. (2005) Hydrogen peroxide-assisted photocatalytic
oxidation of phenolic compounds. Applied Catalysis B: Environmental 59 99-104.
©© UUnniivveerrssiittyy ooff PPrreettoorriiaa

128
Basson M.S., Van Niekerk P.H. and Van Rooyen J.A. (1997) Overview of water resources availability and utilisation in South Africa. Department of Water Affairs and Forestry, Pretoria.
Bauer R., Waldner G., Fallmann H., Hager S., Klare M., Krutzler T., Malato S. and Maletzk
P. (1999) The photo-Fenton reaction and the TiO2/UV process for wastewater treatment-novel developments. Catalysis Today 53 131-144.
Beltrán F.J., Rivas FJ and Montero-De-Espinosa R. ((2002) Catalytic ozonation of oxalic acid
in an aqueous TiO2 slurry reactor. Applied Catalysis B: Environmental 39 221-231. Bourgeois J.C., Walsh M.E. and Gagnon G.A. (2004) Treatment of drinking water residuals:
comparing sedimentation and dissolved air flotation performance with optimal cation ratios. Water Research 38 (5) 1173-1182.
Brugger A. (2000) Reuse of Filter backwash water using ultrafiltration technology. Filtration
Separation 37 (1) 22-26. Buchanan W., Roddick F. and Porter N. (2004) Enhanced biodegradability of UV and VUV
pre-treated natural organic matter. Water Science and Technology: Water Supply 4 (4) 103-111.
Buchanan W., Roddick .F and Porter N. (2006) Formation of hazardous by-products resulting
from the irradiation of natural organic matter: Comparison between UV and VUV irradiation. Chemosphere 63 1130-1141.
Busca G., Berardinelli S., Resini C., Arrighib L. (2008) Technologies for the removal of
phenol from fluid streams: A short review of recent developments. Journal of Hazardous Materials 160 265–288.
Carmichael W.W. (2001) Human fatalities from cyanobacteria: Chemical and Biological
cyanotoxins. Environmental Health Perspectives 109 663-668. Černigoj U., Štangar U.L. and Trebše P. (2007) Evaluation of a novel carberry type
photoreactor for the degradation of organic pollutants in water. Journal of
Photochemistry and Photobiology A: Chemistry 118 169-176.
Ceronio A.D., Basson N.D., Kruger M., Taljaard C., Bauman C.M. and Haarhoff J. (2002) The in-depth evaluation of three filtration facilities. Water SA Special Edition: WISA Proceedings 6-9.
©© UUnniivveerrssiittyy ooff PPrreettoorriiaa
129
Chang S.M., Hou C.Y., Lo P.H., Chang C.T. (2009) Preparation of phosphated Zr-doped
TiO2 exhibiting high photocatalytic activity through calcination of ligand-capped
nanocrystals. Applied Catalysis B: Environmental 90 233–241.
Chemspider http://www.chemspider.com/Chemical-Structure.20474023.html - Last accessed 10 May 2012.
Chen D., Weavers L.K. and Walker H.W. (2006) Ultrasonic control of ceramic membrane
fouling by particles: Effect of ultrasonic factors. Ultrasonics Sonochemistry 13 379–387.
Chen D., Weavers L.K. and Walker H.W. (2006) Ultrasonic control of ceramic membrane
fouling by particles: Effect of particle characteristics. Water Research 40 840-850. Chen Y. and Dionysiou D.D. (2006) Correlation of structural properties and film thickness to
photocatalytic activity of thick TiO2 films coated on stainless steel. Applied Catalysis B: Environmental 69 25-34.
Chirwa E.M.N. and Bamuza-Pemu E.E. (2010). Investigation of photocatalysis as an
alternative to other advanced oxidation processes for the treatment of filter backwash water. WRC Report No 1717/1/10, Water Research Commission, Gezina, South Africa. Available online at http://www.wrc.org.za/Pages/KnowledgeHub.aspx. Last accessed 29/12/2012, 19:00.
Collivignarelli C., Sorlini S. and Riganti V. (2002) Proceedings of VI Simpósio Ítalo
Brasileiro de Engenharia Sanitária e Ambiental. 1-10. Colón G., Maicu M., Hidalgo M.C. and Navío J.A. (2006) Cu-doped TiO2 systems with
improved photocatalytic activity. Applied Catalysis B: Environmental 67 41–51. Comninellis C., Kapalka A., Malato S., Parsons S.A., Poulios I. and Mantzavinos D. (2008)
Perspective – Advanced oxidation processes for water treatment: advances and trends for R&D. Journal of Chemical Technology and Biotechnology 83 769-776.
Contreras S., Rodriguez M., A.L. Momani F., Sans C. and Esplugas S. (2003) Contribution of
the ozonation pre-treatment to the biodegradation of aqueous solutions of 2,4-dichlorophenol. Water Research 37 3164-3171.
©© UUnniivveerrssiittyy ooff PPrreettoorriiaa
130
Daniel J.W., Green T. and Phillips P.J. (1973) Metabolism of the phenolic antioxidant 3,5-di-tert-butyl-4-hydroxanisole (Topanol 354). III. The metabolism in rats of the major autooxidation product, 2,5-di-tert-butyl-1,4-benzoquinone. Food and Cosmetic Toxicology 11 (5) 793-796.
Devilliers D. (2006) Semiconductor Photocatalysis: Still an active research area despite
barriers to commercialization. Energeia 17 (3), 1-6. Devries S.E., NamikoshI M., Galey F.D., Merrit J.E., Rinehart K.L. and Beasley V.R. (1993)
Chemical study of the hepatotoxins from microcystis aeruginosa collected in California. Journal of Veterinary Diagnostic Investigation 5 409-412.
Dijkstra M.F.J., Buwalda H., De Jong A.W.F., Michorius A., Winkelman J.G.M. and
Beenackers A.A.C.M. (2001) Experimental comparison of three reactor designs for photocatalytic water purification. Chemical Engineering Science 56 547-562.
Doan H.D., Weli A. and Wu J. (2009) A combined photocatalytic and electrochemical
treatment of wastewater containing propylene glycol methyl ether and metal ions. Chemical Engineering Journal 151 51–58.
Doll T.E. and Frimmel F.H. (2005) Removal of selected persistent organic pollutants by
heterogeneous photocatalysis in water. Catalysis Today 101 195-202. DWAF (1996) South African water quality guidelines. Volume 1: Domestic water use.
Pretoria, South Africa.
DWAF (1999) Gazette 20615 of 12th November of 1999, Pretoria, South Africa El-Bahy Z.M., Ismail A.A. and Mohamed R.M. (2009) Enhancement of titania by doping rare
earth for photodegradation of organic dye (Direct Blue). Journal of Hazardous
Materials 166 138–143.
EPA (1999), Drinking Water Treatment, EPA 810-F-99-013
Eriksson E., Auffarth K., Eilersen A-M, Henze M. and Ledin A. (2003) Household chemicals
and personal care products as sources for xenobiotic organic compounds in grey water. Water SA 29 (2) 135-146.
Esplugas S., Marco A. and Saum G.L. (1997) How and why combine chemical and biological
processes for wastewater treatment. Water Science and Technology 35 321-327.
©© UUnniivveerrssiittyy ooff PPrreettoorriiaa
131
Esplugas S., Gimenez J., Contretras S., Pascual E. and Rodriguez M. (2002) Comparison of
different advanced oxidation processes for phenol degradation. Water Research 36 1034-1042.
European Communities (1980) Drinking Water Directive 80/778/EEC, Commission of the
European Communities.
Fane J., Macintosh P. and Leslie G. (2006) Chapter 11: Water reclamation, remediation and
cleaner production with nanofiltration: in Nanofiltration- principles and application. Elsevier Limited, Oxford UK.
Fang H.H.P., Chen T., Li Y.Y. and Chui H.K. (1996) Degradation of phenol in wastewater in
an up flow anaerobic sludge blanket reactor. Water Research 30 1353-1360. Fiorentino G., Spaccini R. and Piccolo A. (2005) Separation of molecular constituents from a
humic acid by solid-phase extraction following a transesterification reaction. Talanta 68 (4) 1135–1142.
Freshour A.R., Mawhinney S. and Bhattacharyya D. (1996) Two-phase ozonation of
hazardous organics in single and multicomponent systems. Water Research 30 1949-1958.
Giokas D.L. and Vlessidis A.G. (2007) Application of a novel chemometric approach to the
determination of aqueous photolysis rates of organic compounds in natural waters. Talanta 71 288-295.
Gogate P.R., Mujumdar S., Pandit A.B. (2003) Sonochemical reactors for waste water
treatment: comparison using formic acid degradation as a model reaction. Advances in Environmental Research 7 283-299.
Gogate P.R. and Pandit A.B. (2004) A review of imperative technologies for wastewater
treatment I: Oxidation technologies at ambient conditions. Advances in Environmental Research 8 501-551.
Guidechem - Chemical properties- http://www.guidechem.com/reference/dic-21115.html#id2
– Last accessed 10 May 2012. Halmann M.M. (1996) Photodegradation of water pollutants. CRC Press Inc, New York,
254-255.
©© UUnniivveerrssiittyy ooff PPrreettoorriiaa
132
Hamoda M.F., Al-Ghusain I. and Al-Mutairi N.Z. (2004) Sand filtration of wastewater for tertiary treatment and water reuse. Desalination 16 203-211.
Han W., Zhu W., Zhang P., Zhang Y and Li L. (2004) Photocatalytic degradation of phenols
in aqueous solution under irradiation of 254 and 185 nm UV light. Catalysis Today 90 319-324.
Harding W.R. and Praxton B.R. (2001) Cyanobacteria in South Africa. Water Research
Commission WRC report noTT 153/01. Pretoria. Hassoon S., Bulatov V., Yasman Y. and Schechter I. (2004) Fluorescence monitoring pf
ultrasound degradation processes. Analytica Chimica Acta 512 125-132. Hansson L., Carlson R., and Sjöberg A-L (1990) Synthesis of (±)-geosmin. Part 1. On the
synthesis and epoxidation of 1,4a-dimethyl-4,4a,5,6,7,8-hexahydronaphthalen-2(3H)-one. Acta Chemica Scandinavica 44 1036-1041.
Health Canada (2004) Blue-Green algae (cyanobacteria) and their toxins. http://hc-
sc.gc.ca/ewh-semt/water-eau/drink-potable/cyanobateries-e.html Last accessed 15th September 2007.
Hernandez R., Zappi M., Colucci J. and Jones R. (2002) Comparing the performance of
various advanced oxidation processes for treatment of acetone contaminated water.” Journal of Hazardous Materials 92 33-50.
Herrmann J. (1999) Heterogeneous photocatalysis: fundamentals and applications to the
removal of various types of aqueous pollutants. Catalysis Today 53 115-129. Hidalgo M.C., Maicu M., Navío J.A. and Colón G. (2008) Study of the synergic effect of
sulphate pre-treatment and platinisation on the highly improved photocatalytic
activity of TiO2. Applied Catalysis B: Environmental 81 49–55.
Ho L., Newcombe G. and Croue´ J-P, (2002) Influence of the character of NOM on the
ozonation of MIB and geosmin. Water Research 36 511–518. Hoefel D., Ho L., Monis P.T., Newcombe G. and Saint C.P. (2009) Biodegradation of
geosmin by a novel Gram-negative bacterium; isolation, phylogenetic characterisation and degradation rate determination. Water Research 43 2927-2935
©© UUnniivveerrssiittyy ooff PPrreettoorriiaa

133
Ho L., Hoefel D., Bock F., Saint C.P. and Newcombe G. (2007) Biodegradation rates of 2-methylisoborneol (MIB) and geosmin through sand filters and in bioreactors. Chemosphere 66 (11) 2210-2218.
Hoffmann M.R., Martin S.T., Choi W., and Bahnemann D.W. (1995) Environmental
applications of semiconductor photocatalysis. Chemical Reviews 95 69-96. Hong S.S., Ju C.S., Lim C.G., Ahn B.H., Lim K.T. and Lee G.D. (2001) Photocatalytic
degradation of phenol over TiO2 prepared by sol-gel method. Journal of Industrial and Engineering Chemistry 7 (2) 99-104.
Huang W-J, Cheng B-L, Hu S-K and Chu C. (2006) Ozonation of algae and odour causing
substances in eutrophic waters. Journal of Environmental Science and Health Part A, 411587-1605.
Hynning P.A. (1996) Separation, Identification and quantification of components of
industrial effluents with bioconcentration potential. Water Research 30 1103 – 1108. Jianlong W., Xuan Z. and Weizhong W. (2004) Biodegradation of phthalic acid esters
(PAEs) in soil bioaugmented with acclimated activated sludge. Process Biochemistry 39 1837–1841.
Jüttner F. and Watson S.B. (2007) Biochemical and ecological control of geosmin and 2-
methylisoborneol in source waters. Applied and Environmental Microbiology 73 (14) 4395–4406.
Jyoti KK and Pandit AB (2001) Water disinfection by acoustic and hydrodynamic cavitation.
Biochemical Engineering Journal 7 201-212. Kasprzyk-Hordern B., Ziółek M. and Nawrocki J. (2003) Catalytic ozonation and methods of
enhancing molecular ozone reactions in water treatment. Applied Catalysis B: Environmental 46 639-669.
Khraisheh M., Kim J., Campos L., Al-Muhtaseb A.H., Al-Hawari A., Ghouti M.A. and
Walker G.M. (2013) Removal of pharmaceutical and personal care products (PPCPs) pollutants from water by novel TiO2–Coconut Shell Powder (TCNSP) composite. J. Ind. Eng. Chem. http://dx.doi.org/10.1016/j.jiec.2013.06.032.
Kitis M. and Kaplan S.S. (2007) Advanced oxidation of natural organic matter using
hydrogen peroxide and iron-coated pumice particles. Chemosphere 68 1846-1853.
©© UUnniivveerrssiittyy ooff PPrreettoorriiaa
134
Klán P. and Vavrik M. (2006) Non-catalytic remediation of aqueous solutions by microwave-assisted photolysis in the presence of H2O2. Journal of Photochemistry and Photobiology A: Chemistry 177 24-33.
Kluson P., Luskova H., Cerveny L., Klisakova J. and Catjthaml T. (2005) Partial
photocatalytic oxidation of cyclopentene over titanium (IV) oxide. Journal of Molecular Catalysis A: Chemical 242 62-67.
Kolb B. and Ettre L.S (2006) Static headspace-gas chromatography: Theory and practice.
John Wiley publishing, New Jersy, U.S.A. Kondarides D. (2005) Encyclopaedia of Life Support Systems (EOLSS).
www.eolss.net/Sample-Chapters/C06/E6-190-16-00.pdf Last accessed July, 18th 2012. Laoufi N.A., Tassalit D. and Bentahar F. (2008) The degradation of phenol in water solution
by TiO2 photocatalysis in a helical reactor. Global NEST Journal 10 (3) 404-418. Lawton L.A., Robertson P.K.J, Robertson R.F. and Bruce F.G. (2003) The destruction of 2-
methylisoborneol and geosmin using titanium dioxide photocatalysis. Applied Catalysis B: Environmental 44 9-13.
Lee C., Yoon J. and von Gunten U. (2007) Oxidative degradation of N-nitrosodimethylamine
by conventional ozonation and the advanced oxidation process ozone/hydrogen peroxide. Water Research 41 581-590.
Li S., MA Z., Zhang J., Wu Y. and Gong Y. (2008) A comparative study of photocatalytic
degradation of phenol of TiO2 and ZnO in the presence of manganese dioxides. Catalysis Today 139 109-112.
Liang Z., Zhou G., Lin S., Zhang Y. and Yang H. (2006) Study of low-frequency ultrasonic
cavitation fields based on spectral analysis technique. Ultrasonics 44 115-120. Linde J.J., Freese S.D. and Pieterse (2003) Evaluation of powdered activated carbon (PAC)
for the removal of taste and odour causing compounds from water and the
relationship between this phenomenon and the physic-chemical properties of the PAC
and the role of water quality. A Report for the Water Research Commission (WRC) of
South Africa – 2003.
Linsebigler A.L., Lu G., and Yates J.T., Jr. (1995). Photocatalysis on TiO2 surfaces: Principles, mechanisms, and selected results. Chemical Reviews 95 735-758.
©© UUnniivveerrssiittyy ooff PPrreettoorriiaa
135
Liu Y., Chen G., Zhou C., Hu Y., Fu D., Liu J. and Wang Q. (2011) Higher visible
photocatalytic activities of nitrogen doped In2TiO5 sensitized by carbon nitride.
Journal of Hazardous Materials 190 75–80.
Liu G., Wang X., Chen Z., Cheng H.M. and Lu G.Q. (2009) The role of crystal phase in
determining photocatalytic activity of nitrogen doped TiO2. Journal of Colloid and
Interface Science 329 331–338.
Liu L., Liu H., Zhao Y-P, Wang Y., Duan Y., Gao G., Ge M. and Chen W. (2008) Directed
synthesis of hierarchical nanostructured TiO2 catalysts and their morphology-
dependent photocalysis for phenol degradation. Environmental Science and
Technology 42 2342-2348.
Ljubas D. (2005) Solar photocatalysis – a possible step in drinking water treatment. Energy
30 1699-1710. Lovekamp-Swan T. and Davis B.J. (2003) Mechanisms of phthalate ester toxicity in the
female reproductive system. Environmental Health Perspectives 111 (2) 139-145. Maciel R and Sant’anna GL (Jr) and Dezotti M (2004) Phenol removal from high salinity
effluents using Fenton’s reagent and photo-Fenton reactions. Chemosphere 54 711-719.
Maleki A., Mahvi A.H., Alimohamadi M. and Ghasri A. (2006) Advanced oxidation of
phenol by ultraviolet irradiation in aqueous system. Pakistan Journal of Biological
Sciences 9 (12) 2338-2341.
Maila M.P. and Cloete T.E. (2002) Germination of Lepidium sativum as a method to evaluate
polycyclic aromatic hydrocarbons (PAHs) removal from contaminated soil. International Biodeterioration and Biodegradation 50 107-113.
Malato S., Fernández-Ibáñez P., Maldonado M.I., Blanco J. and Gernjak W. (2009)
Decontamination and disinfection of waterby solar photocatalytic: Recent overview and trends. Catalysis Today 147 1-59.
Malato S., Blanco J., Alarcón D.C., Maldonado M.I., Fernández-Ibáñez P. and Gernjak W.
(2007) Photocatalytic decontamination and disinfection of water with solar collectors. Catalysis Today 122 137-149.
©© UUnniivveerrssiittyy ooff PPrreettoorriiaa
136
Martens D.A. and Frankenberger Jr. W.T. (1995) Enhanced degradation of polycylic
aromatic hydrocarbons in soil treated with an advanced oxidation process – Fentons Reagent. Journal of Soil Contamination 4 (2) 175-190.
Matos J., Laine J., Herrmann J.-M., Uzcategui D. and Brito J.L. (2007) Influence of activated
carbon upon titania on aqueous photocatalytic consecutive runs of phenol photodegradation. Applied Catalysis B: Environmental 70 461–469.
Matsui, Y. Yoshida T., Nakao S., Knappe D.R.U and Matsushita T. (2012) Characteristics of
competitive adsorption between 2-methylisoborneol and natural organic matter on superfine and conventionally sized powdered activated carbons. Water Research 46 4741-4749.
McMurry J. (2012) Organic chemistry. Brooks/Cole Publishing Company, California, USA.
8th Ed.
Meepagala K.M., Schrader K.K., Wedge D.E. and Duke S.O. (2005) Algicidal and antifungal compounds from the roots of Ruta graveolens and synthesis of their analogs. Phytochemistry 66 2689–2695.
Metcalf and Eddy (2003) Wastewater Engineering. Treatment and reuse. McGraw Hill, 4th
Ed. Michalski R. (2003) Toxicity of bromate ions in drinking water and its determination using
ion chromatography with post column derivatisation. Polish Journal of Environmental Studies 12 (6) 727-734.
Mills A., Morris S. and Davies R. (1993) Photomineralisation of 4-chlorophenol sensitised by
titanium dioxide: a study of intermediates. Journal of Photochemistry and Photobiology A: Chemistry 70 183-191.
Mills A. and Lee S. (2004) Semiconductor photocatalysis. In: Advanced Oxidation Processes
for Water and Wastewater Treatment, Parsons S (ed) IWA Publishing, UK, pp 137-180.
Ministry of Health and Welfare Ordinance No.15 (2000) Ministry of Health and Welfare,
Tokyo, Japan.
http://www.jicwels.or.jp/water_supply/suido_kankyo_kanren/MHW_no15_020301.pdf
©© UUnniivveerrssiittyy ooff PPrreettoorriiaa
137
Misra V., Pandey S.D. and Viswanathan P.N. (1998) Chemical approach to study the environmental implications interaction of humic acid and gamma-HCH. Chemistry and Ecology 14 97-106.
Modrzejewska B., Guwy A.J., Dinsdale R. and Hawkes D.L. (2007) Measurement of
hydrogen peroxide in an advanced oxidation process using an automated biosensor. Water Research 41 260-268.
Momani F., Sans C. and Esplugas S. (2004) A comparative study of the advanced oxidation
of 2,4-dichlorophenol. Journal of Hazardous Material B107 123-129. Montgomery D.C. and Runger G.C. (1999) Applied statistics and probability for engineers.
Wiley, New York. 2nd Ed. Morais J.L. and Zamora P.P. (2005) Use of advanced oxidation processes to improve the
biodegradability of mature landfill leachates. Journal of Hazardous Material 181-186.
Mokrini A., Oussi D. and Esplugas S. (1997) Oxidation of aromatic compounds with UV
radiation/ozone/hydrogen peroxide. Water Science and Technology 35 (4) 95-102. Morrison A. (1995) Recovery and reuse of filter backwash water.
http://www.environment.gov.au/net/environet.html Last accessed 2nd October, 2006. Munter R (2001) Advanced oxidation processes – current status and prospects. Proceedings
of Estonian Academy Sciences: Chemistry 50 59-80. Nadezhdin AD (1988) Mechanism of ozone decomposition in water. The role of termination.
Indian Engineering Chemistry Research 27 548-550. Naude Y. (2002) The extraction of persistent organic pollutants from samples from selected
sites in South Africa. Poster Presentation at Analitika 2002, Stellenbosch, South Africa, December 2002.
Pan Pesticides Database - http://www.pesticideinfo.org/Detail_Chemical Last accessed 10th
Dec 2009. Pardeshi S.K. and Patil A.B. (2008) A simple route for photocatalytic degradation of phenol
in aqueous zinc oxide suspension using solar energy. Solar Energy 82 700-705.
©© UUnniivveerrssiittyy ooff PPrreettoorriiaa
138
Parida KM and Parija S (2006) Photocatalytic degradation of phenol under solar radiation
using microwave irradiation zinc oxide. Solar Energy 80 1048-1054.
Parsons S.A. and Williams M. (2004) Advanced oxidation processes for water and
wastewater treatment. IWA Publishing, UK. Perkin Elmer (2008) Turbomatrix headspace sampler and HS 40/110 trap – User’s guide,
Shelton, U.S.A.
Piccolo A., Conte P. and Tagliatesta P. (2005) Increased conformational rigidity of humic
substances by oxidative biomimetic catalysis. Biomacromolecules 6 351-358. Piccolo A., Conte P., Spaccini R. and Chiarella M. (2003) Effects of some dicarboxylic acids
on the association of dissolved humic substances. Biology and Fertility of Soils 37 255-259.
Plummer J.D. and Edzwald J.K. (1998) Effect of ozone on disinfection by-product formation
of algae. Water Science and Technology 37 (2) 49-55. Raj C.B.C. and Quen H.L. (2005) Advanced oxidation processes for wastewater treatment:
Optimization of UV/H2O2 process through a statistical technique. Chemical Engineering Science 60 5305-5311.
Rampaul A., Parkin I.P., O’Neill S.A., DeSouza J., Mills A. and Elliott N. (2003) Titania and
tungsten doped titania thin films on glass; active photocatalysts. Polyhedron 22 35-44.
Rand Water – Consumption Patterns.
http://www.randwater.co.za/WaterAndInfastructureManagement/Pages/ConsumptionPatterns.aspx
Reddy J.K., Durgakumari V., Subrahmanyam M. and Sreedhar B. (2009) Structure and
photocatalytic activity studies of TiO2-supported over Ce-modified Al-MCM-41.
Materials Research Bulletin 44 1540–1546.
Reynolds T.D. and Richards P.A. (1996) Unit operations and processes in environmental
engineering. PWS. 2nd Ed. Robertson P.K.J., Lawton L.A., Münch and Rouzade J. (1997) Destruction of cyanobacterial
toxins by semiconductor photocatalysis. Chemical Communications 3 393-394.
©© UUnniivveerrssiittyy ooff PPrreettoorriiaa
139
Rosal R., Rodríguez A., Perdigón-Melón J.A., Petre A. and García-Calvo E. (2009) Oxidation of dissolved organic matter in the effluent of a sewage treatment plant using ozone combined with hydrogen peroxide (O3/H2O2). Chemical Engineering Journal 149 311-318.
Saito A., Tanaka A. and Oritani T. (1996) A practical synthesis of enantiomerically pure (-)-
geosmin via highly diastereoselective reduction of (4aS, 8S)-4,4a,5,6,7,8-hexahydro-4a,8-dimethyl-2(3H)-naphthalenone. Tetrahedron: Assymmetry 7(10) 2923-2928.
Sanders R. (2002) University of California, Berkeley, Campus News, Media Relations, Press
Release, Popular weed killer demasculinizes frogs, disrupts their sexual development, UC Berkeley study shows, www.berkeley.edu/news/media/releases/2002/04/15_frogs.
Serpone N. (1997) Relative photonic efficiencies and quantum yield in heterogenous photocatalysis. Journal of Photochemistry and Photobiology A: Chemistry 104 1-12.
Shin W-T, Mirmiran A., Tiacoumi S. and Tsouris C. (1999) Ozonation using microbubbles
formed by electric fields. Separation and Purification Technology 15 217-282.
Shukla P.R., Wang S, Ang H.M. and Tade M.O. (2010) Photocatalytic oxidation of phenolic
compounds using zinc oxide and sulphate radicals under artificial solar light.
Separation and Purification Technology 70 338–344.
Silva A.M.T., Silva C.G., Joaquim G.D. and Faria L. (2009) Ce-doped TiO2 for
photocatalytic degradation of chlorophenol. Catalysis Today 144 13–18.
Simonsen M.E., Jensen H., Li Z. and Søgaard, E.G. (2008) Surface properties and
photocatalytic activity of nanocrystalline titania films. Journal of Photochemistry and
Photobiology A: Chemistry 200 (2-3) 192-200.
Smejkalova D. and Piccolo A. (2006) Rates of Oxidative Coupling of humic phenolic conomers catalyzed by a ciomimetic iron-porphyrin. Environmental Science and Technology 40 1644-1649.
Smejkalova D. and Piccolo A. (2005) Enhanced molecular dimension of a humic acid
induced by photooxidation catalyzed by biomimetic metalporphyrins. Biomacromolecules 6 2120-2125.
©© UUnniivveerrssiittyy ooff PPrreettoorriiaa
140
Smith M.B. and March J. (2006) March's Advanced Organic Chemistry: Reactions, Mechanisms, and Structure. Wiley, New York. 2357 pp.
Sobczyński A., Duczmal Ł. and Zmudziński W. (2004) Phenol destruction by photocatalysis
on TiO2: an attempt to solve the reaction mechanism. J of Molecular Catalysis A:
Chemical 213 225–230.
Son S., Ko G. and Zoh K-D. (2009) Kinetics and mechanism of photolysis and TiO2
photocatalysis of triclosan. Journal of Hazardous Materials 166 954-960. Song W. and O’Shea K.E. (2007) Ultrasonically induced degradation of 2-methylisoborneol
and geosmin. Water Research 41 (12) 2672-2678. Staehelin J. and Hoigné J. (1985) Decomposition of ozone in water in presence of organic
solutes acting as promotors and inhibitors of radical chain reactions. Environmental Science and Technology 19 120-126.
Stasinakis A.S. (2008) Use of selected advanced oxidation processes (AOPs) for wastewater
treatment – a mini review. GlobalNEST Journal 10 (3) 376-385.
Steiner F., Mcleod F., Rohrer J., Fabel S., Lang L., Qun X. and Jing C. (2008) Determination
of phenols in drinking and bottled mineral waters Uusing online solid-phase extraction followed by HPLC with UV detection. Dionex Product Notes.
Stocchi E. (1990) Industrial Chemistry Vol. I, Ellis Horwood (ed), New York, USA. Stockinger H., Kut O.M. and Heizle E. (1996) Ozonation of wastewater containing N-
methylmorpholine-N-Oxide. Water Research 30 1745-1748. Sumita T., Yamaki T., Yamamoto S. and Miyashita A. (2001) A new characterization method
for photocatalytic activity in semiconductor photocatalysis. Japanese Journal of Applied Physics 40 4007-4008.
Summerfelt, S.T., Sharrer, M.J., Tsukuda, S.M. and Gearheart, M., (2009) Process
requirements for achieving full-flow disinfection of recirculating water using ozonation and UV irradiation. Aquacultural Engineering 40 (1) 17-27.
Sung Yu-H, Li T.Y. and Huang S.D. (2005) Analysis of earthy and musty odours in water
samples by solid-phase micro-extraction coupled with gas chromatography/ion trap mass spectrometry. Talanta 65 518-524.
©© UUnniivveerrssiittyy ooff PPrreettoorriiaa
141
Swanepoel A. and D D Preez H. (2006). An Incident of High Cyanobacteria Concentrations,
Causing Large-Scale Problems in Water Purification. Proceedings Of the 2nd Water Research Showcase, University of Pretoria, Pretoria, October 2006.
Thoma G.J., Bowen M.L. and Hollensworth D. (1999) Dissolved air precipitation/solvent
sublation for oil-field produced water. Separation and Purification Technology 16 101-107.
Tran H., Evans G.M., Yan Y., and Nguyen A.V. (2009) Photocatalytic removal of taste and
odour compounds for drinking water treatment. Water Science and Technology: Water Supply 9 (5) 477-483.
Tran H., Evans G.M., Yan Y. and Nguyen, A.V. (2008) Photocatalytic removal of geosmin
and MIB and its potential applications for drinking water treatment. Proceedings of the Environment 08, 5-7 May, Melbourne, Australia.
Tshipala K.E. (2000) Implications of residual atrazine for wheat. Master’s Thesis submitted
to the University of Pretoria. UN (2005) Health, Dignity and Development: What will it Take? UN Millenium Project Task
Force on Water and Sanitation, Final Report, Abridged Edition. Stockholm International Water Institute (SIWI) and United Nations Millenium Project, New York, New York.
U.S.EPA (2009) National Drinking Water Regulations Handbook. EPA 816-F-09-004 U.S.EPA (2006) Disinfectant Byproducts: A Reference Resource.
http://www.epa.gov/environ/html/icr/gloss_dbp.html Last accessed 15th September
2007. U.S.EPA (2006) Polluted Runoff (Non point source pollution)”.
http://www.epa.gov/owow/nps/facts/point1.html. Last accessed 05/04/2006 U.S.EPA (2001) Parameters of water quality – Interpretation and Standards. U.S.EPA (2000) Hazard Summary – Created in April 1992.
http://www.epa.gov/ttn/atw/hlthef/acetophe.htm . Last accessed 9th December 2009. U.S.EPA (1997) Pollution Prevention as Defined Under the Pollution Prevention Act of
1990.
©© UUnniivveerrssiittyy ooff PPrreettoorriiaa
142
Von Gunten U. (2003) Ozonation of drinking water: Part I. Oxidation kinetics and product
formation. Water Research 37 1443-1467. Vu A.T., Nguyen Q.T., Bui T.H.L, Tran M.C., Dang T.P. and Tran T.K.H. (2010) Synthesis
and characterization of TiO2 photocatalyst doped by transition metal ions (Fe3+, Cr3+
and V5+). Advances in Natural Sciences: Nanoscience and Nanotechnology 1 015009
(4pp)
Wadley S. and Waite T.D. (2004) Fenton Processes: In: Advanced Oxidation Processes for
Water and Wastewater Treatment, Parsons S (ed) IWA Publishing, UK, pp 111-132. Watkinson A.J., Murby E.J. and Costanzo S.D. (2007) Removal of antibiotics in conventional
and advanced wastewater treatment: Implications for environmental discharge and wastewater recycling. Water Research 41 4164-4176.
Watson S.B., Brownlee B., Satchwill T. and Hargesheimer E.E. (2000) Quantitative analysis
of trace levels of geosmin and MIB in source and drinking water using headspace SPME. Water Research 341 (0) 2818-2828.
WHO (1971) International Standards for drinking water 3rd ed. Geneva. WHO (1999) Toxic Cyanobacteria in Water: A guide to their public health consequences,
monitoring and management. Wnorowski A.U. (1992) Taste and odour forming micro-organisms in South African Surface
waters. WRC Report No. 320/1/93 Young W.F., Horth H., Crane R., Ogden T. and Arnott M. (1996) Taste and odour threshold
concentrations of potential potable water contaminants. Water Research 30 (2) 331-340.
Zaitlin B. and Watson S.B. (2006) Actinomycetes in relation to taste and odour in drinking
water: Myths, tenets and truths. Water Research 40 1741-1753. Zala S.M. and Penn D.J. (2004) Abnormal behaviours induced by chemical pollution: a
review of the evidence and new challenges. Animal Behaviour 68 649-664.
©© UUnniivveerrssiittyy ooff PPrreettoorriiaa

143
Zaleska A., Grabowska E., Sobczak J.W., Gazda M. and Hupka J. (2009) Photocatalytic
activity of boron-modified TiO2 under visible light: The effect of boron content,
calcination temperature and TiO2 matrix. Applied Catalysis B: Environmental 89
469–475.
Zhou H. and Smith D.W. (2002) Advanced technologies in water and wastewater treatment.
Journal of Environmental and Engineering Sciences 1 247-264. Zhou J.L. and Rowland S.J. (1997) Evaluation of the interactions between hydrophobic
organic pollutants and suspended particles in estuarine Waters. Water Research 31 1708-1718.
Zoschke K. Engel C., Börnick H. and Worch E. (2011) Adsorption of geosmin and 2-
methylisoborneol onto powdered activated carbon at non-equilibrium conditions:
Influence of NOM and process modelling. Water Research 45 4544-4550.
©© UUnniivveerrssiittyy ooff PPrreettoorriiaa
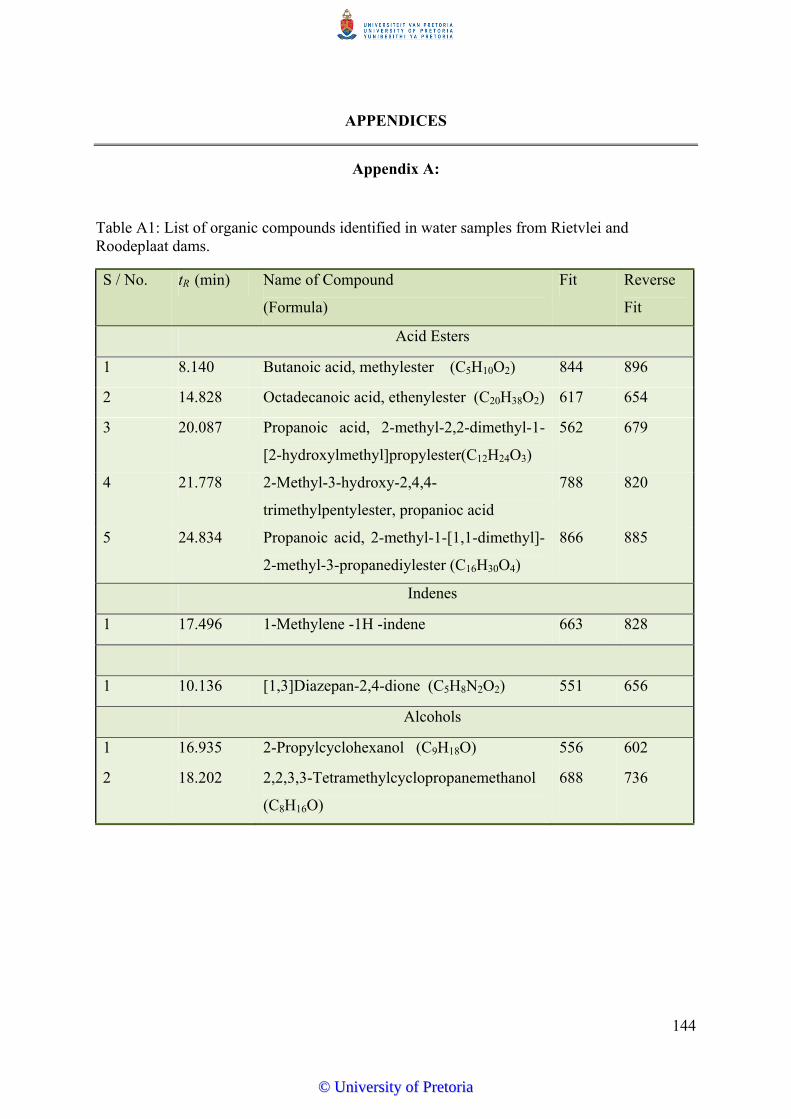
144
APPENDICES
Appendix A:
Table A1: List of organic compounds identified in water samples from Rietvlei and Roodeplaat dams.
S / No. tR (min) Name of Compound
(Formula)
Fit Reverse
Fit
Acid Esters
1 8.140 Butanoic acid, methylester (C5H10O2) 844 896
2 14.828 Octadecanoic acid, ethenylester (C20H38O2) 617 654
3 20.087 Propanoic acid, 2-methyl-2,2-dimethyl-1-
[2-hydroxylmethyl]propylester(C12H24O3)
562 679
4 21.778 2-Methyl-3-hydroxy-2,4,4-
trimethylpentylester, propanioc acid
788 820
5 24.834 Propanoic acid, 2-methyl-1-[1,1-dimethyl]-
2-methyl-3-propanediylester (C16H30O4)
866 885
Indenes
1 17.496 1-Methylene -1H -indene 663 828
1 10.136 [1,3]Diazepan-2,4-dione (C5H8N2O2) 551 656
Alcohols
1 16.935 2-Propylcyclohexanol (C9H18O) 556 602
2 18.202 2,2,3,3-Tetramethylcyclopropanemethanol
(C8H16O)
688 736
©© UUnniivveerrssiittyy ooff PPrreettoorriiaa
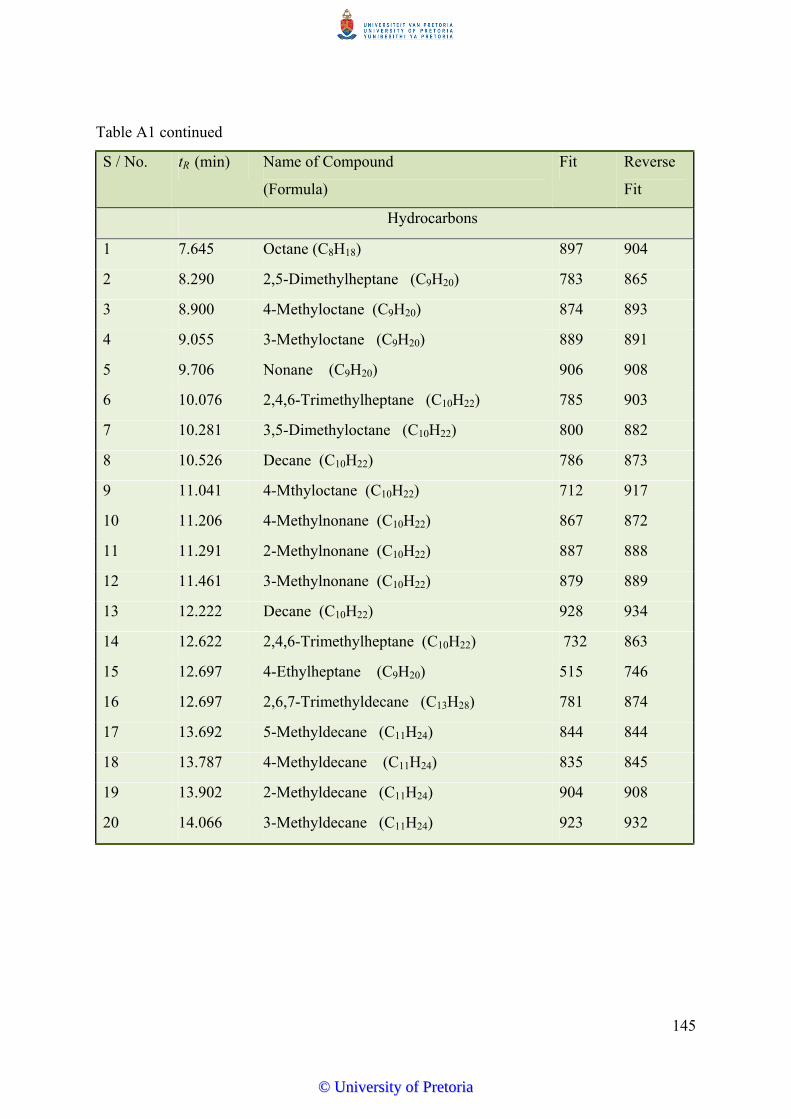
145
Table A1 continued
S / No. tR (min) Name of Compound
(Formula)
Fit Reverse
Fit
Hydrocarbons
1 7.645 Octane (C8H18) 897 904
2 8.290 2,5-Dimethylheptane (C9H20) 783 865
3 8.900 4-Methyloctane (C9H20) 874 893
4 9.055 3-Methyloctane (C9H20) 889 891
5 9.706 Nonane (C9H20) 906 908
6 10.076 2,4,6-Trimethylheptane (C10H22) 785 903
7 10.281 3,5-Dimethyloctane (C10H22) 800 882
8 10.526 Decane (C10H22) 786 873
9 11.041 4-Mthyloctane (C10H22) 712 917
10 11.206 4-Methylnonane (C10H22) 867 872
11 11.291 2-Methylnonane (C10H22) 887 888
12 11.461 3-Methylnonane (C10H22) 879 889
13 12.222 Decane (C10H22) 928 934
14 12.622 2,4,6-Trimethylheptane (C10H22) 732 863
15 12.697 4-Ethylheptane (C9H20) 515 746
16 12.697 2,6,7-Trimethyldecane (C13H28) 781 874
17 13.692 5-Methyldecane (C11H24) 844 844
18 13.787 4-Methyldecane (C11H24) 835 845
19 13.902 2-Methyldecane (C11H24) 904 908
20 14.066 3-Methyldecane (C11H24) 923 932
©© UUnniivveerrssiittyy ooff PPrreettoorriiaa

146
7.75 8.75 9.75 10.75 11.75 12.75 13.75 14.75 15.75 16.75 17.75 18.75 19.75 20.75 21.75 22.75 23.75 24.75 25.75Time0
100
%
0
100
%
0
100
%
0
100
%
0
100
%
Roodeplaat Backwash Filtered 260509 1: Scan EI+ TIC
5.77e821.75
717.6543
9.71438.91
43
21.2871
18.1897
12.234311.48
7117.66
3215.81281
15.0732
13.1843
20.5371
23.90205
23.33177
24.9371
Roodeplaat Raw Filtered 260509 1: Scan EI+ TIC
5.77e821.75
717.6543
9.7143
8.9143
12.2343
11.4871
21.2871
18.199715.81
28117.67
32
23.65205
23.2032
24.8771
Rietvlei GAC Filtered 260509 1: Scan EI+ TIC
5.77e821.77;71
7.6543
21.2871
9.7243
8.9243
18.199712.23
4311.4871
17.6743
15.81281
15.0841
13.1943
20.5471
23.65205
23.18177
24.8071
Rietvlei DAFF Filtered 260509 1: Scan EI+ TIC
5.77e8
21.76717.66
43
18.1997
9.7243
12.0743
15.81281
14.3067
15.0832
17.6732
21.2971
23.65205
23.2032
24.8171
Rietvlei Raw Filtered 260509 1: Scan EI+ TIC
5.77e8
7.6443 9.70
43
8.9043
21.757112.22
43
11.4771
18.1997
15.80281
17.6732
21.2971
23.6420523.18
3224.80
71
Rietvlei Raw Filtered
Rietvlei DAFF Filtered
Rietvlei Gac Filterd
Roodeplaat Raw Filtered
Roodeplaat Backwash Water Filtered
Figure A-1: Chromatogram of water samples from Rietvlei and Roodeplaat.
©© UUnniivveerrssiittyy ooff PPrreettoorriiaa
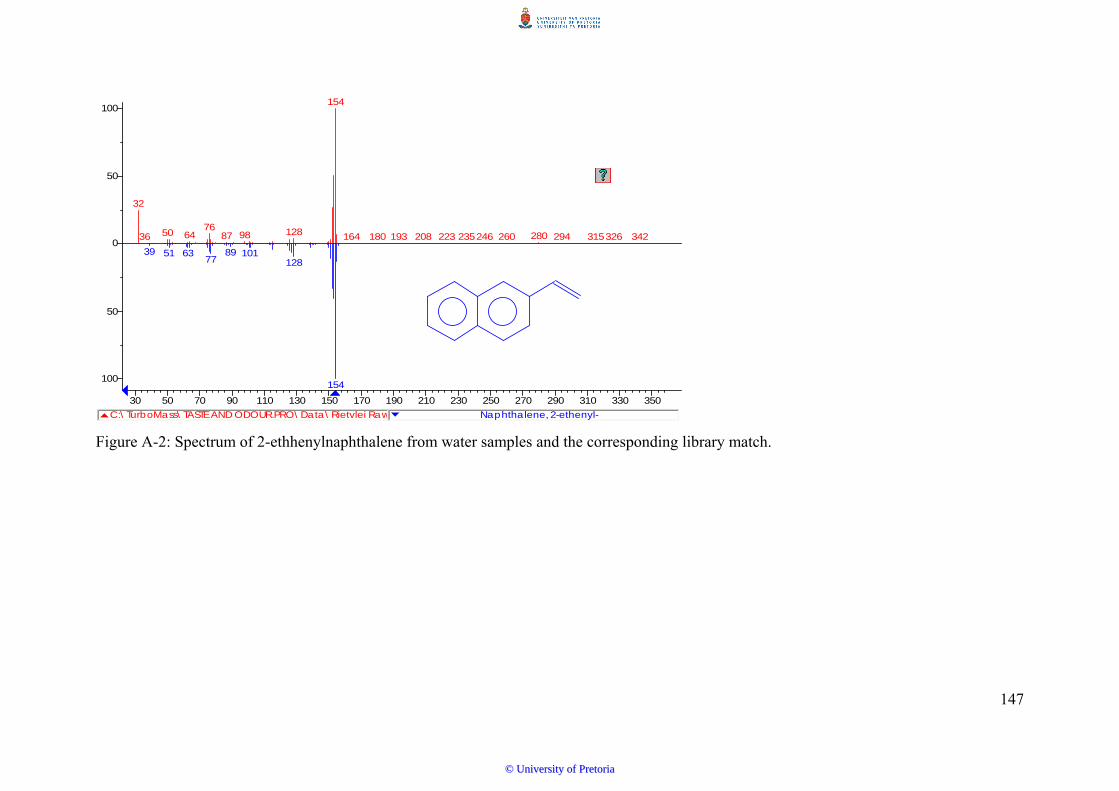
147
C:\ TurboMass\ TASTE AND ODOUR.PRO\ Data\ Rietvlei Raw Naphthalene, 2-ethenyl-
30 50 70 90 110 130 150 170 190 210 230 250 270 290 310 330 350
0
50
100
50
100
32
36
39
50
51 63
6476
77
87
89
98
101
128
128
154
154
164 180 193 208 223 235246 260 280 294 315326 342
Figure A-2: Spectrum of 2-ethhenylnaphthalene from water samples and the corresponding library match.
©© UUnniivveerrssiittyy ooff PPrreettoorriiaa
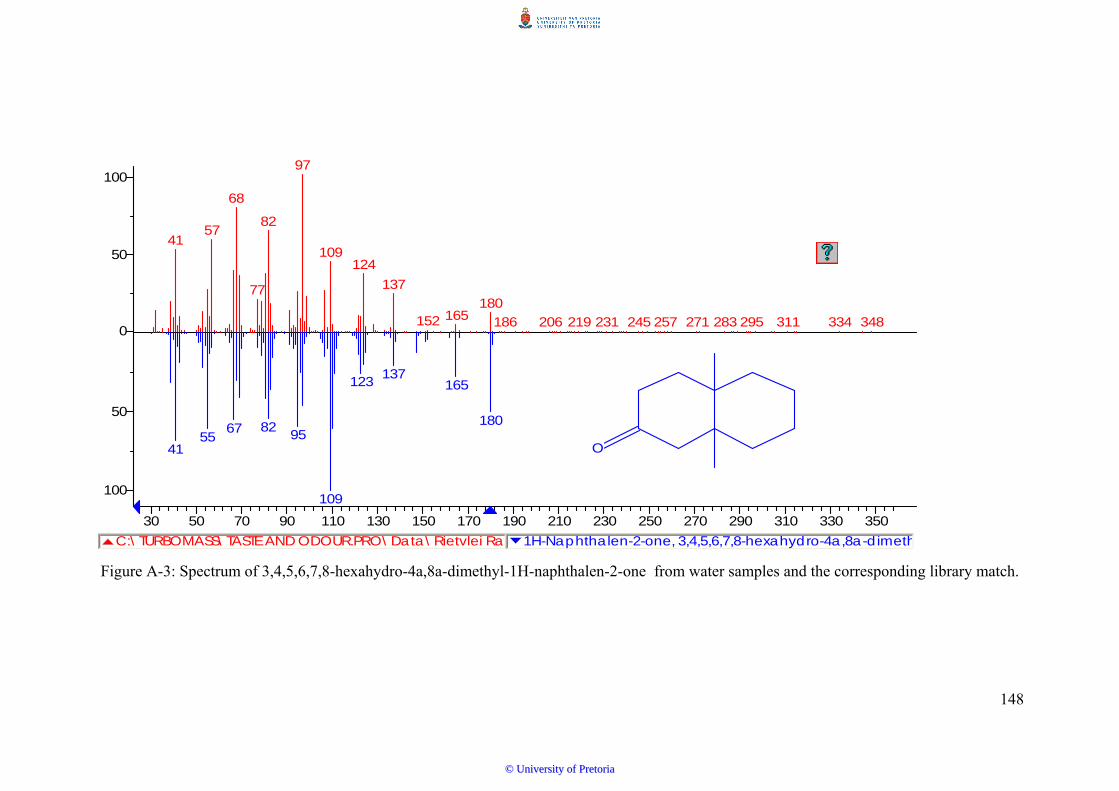
148
C:\ TURBOMASS\ TASTE AND ODOUR.PRO\ Data\ Rietvlei Ra 1H-Naphthalen-2-one, 3,4,5,6,7,8-hexahydro-4a,8a-d imeth
30 50 70 90 110 130 150 170 190 210 230 250 270 290 310 330 350
0
50
100
50
100
41
4155
57
67
68
77
82
8295
97
109
109
123
124
137
137
152 165
165
180
180
186 206 219 231 245 257 271 283 295 311 334 348
O
Figure A-3: Spectrum of 3,4,5,6,7,8-hexahydro-4a,8a-dimethyl-1H-naphthalen-2-one from water samples and the corresponding library match.
©© UUnniivveerrssiittyy ooff PPrreettoorriiaa
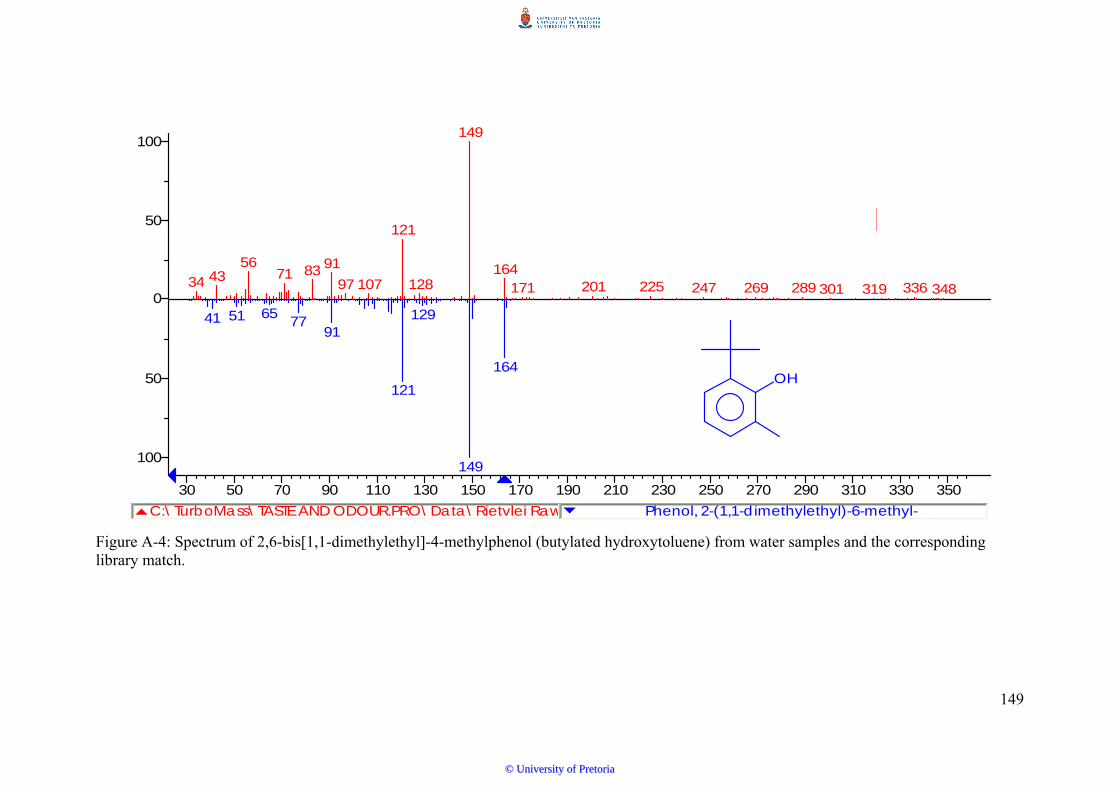
149
C:\ TurboMass\ TASTE AND ODOUR.PRO\ Data\ Rietvlei Raw Phenol, 2-(1,1-d imethylethyl)-6-methyl-
30 50 70 90 110 130 150 170 190 210 230 250 270 290 310 330 350
0
50
100
50
100
34
41
43
51
56
65
71
77
83 91
91
97 107
121
121
128
129
149
149
164
164
171 201 225 247 269 289 301 319 336 348
OH
Figure A-4: Spectrum of 2,6-bis[1,1-dimethylethyl]-4-methylphenol (butylated hydroxytoluene) from water samples and the corresponding library match.
©© UUnniivveerrssiittyy ooff PPrreettoorriiaa
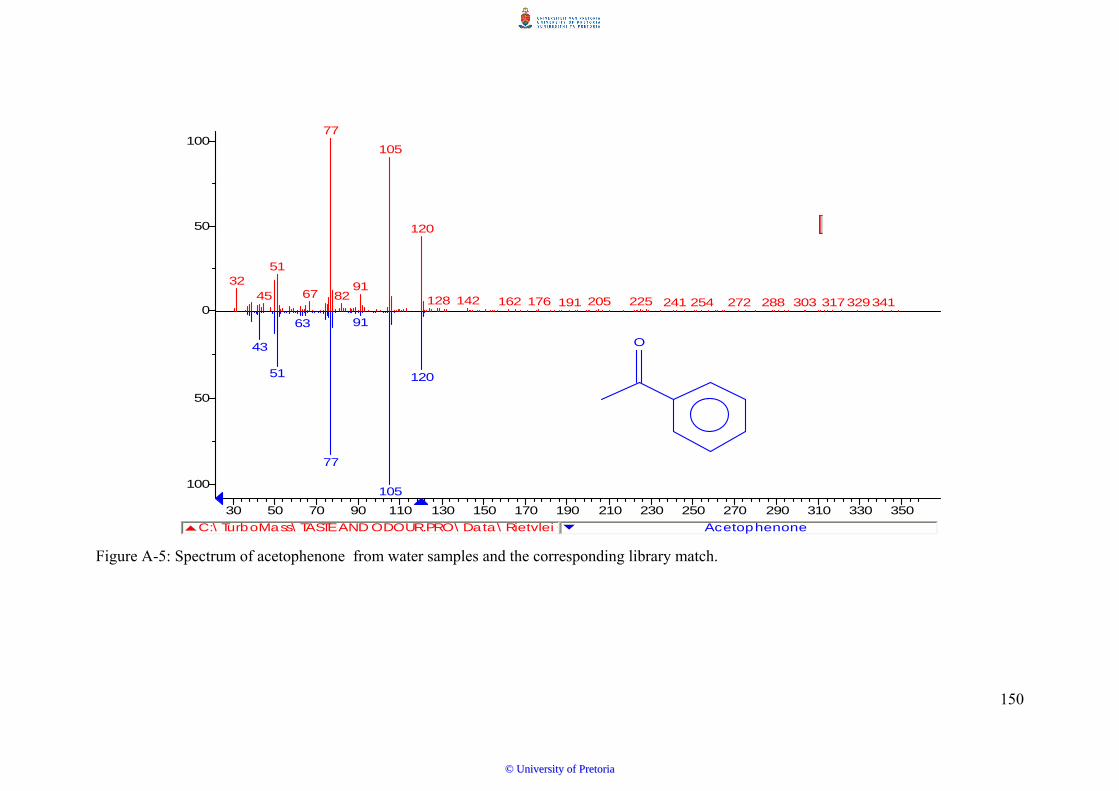
150
C:\ TurboMass\ TASTE AND ODOUR.PRO\ Data\ Rietvlei G Acetophenone
30 50 70 90 110 130 150 170 190 210 230 250 270 290 310 330 350
0
50
100
50
100
32
43
45
51
51
63
67
77
77
8291
91
105
105
120
120
128 142 162 176 191 205 225 241 254 272 288 303 317329341
O
Figure A-5: Spectrum of acetophenone from water samples and the corresponding library match.
©© UUnniivveerrssiittyy ooff PPrreettoorriiaa
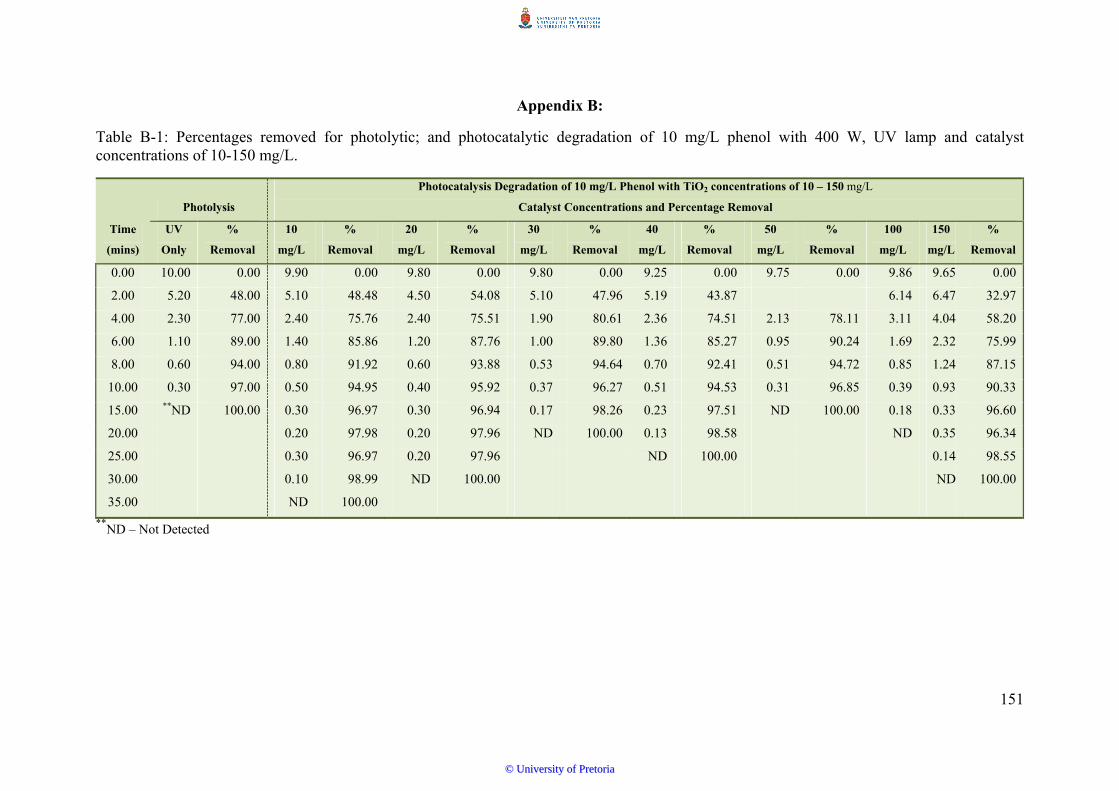
151
Appendix B:
Table B-1: Percentages removed for photolytic; and photocatalytic degradation of 10 mg/L phenol with 400 W, UV lamp and catalyst concentrations of 10-150 mg/L.
Time
(mins)
Photolysis
Photocatalysis Degradation of 10 mg/L Phenol with TiO2 concentrations of 10 – 150 mg/L
Catalyst Concentrations and Percentage Removal
UV
Only
%
Removal
10
mg/L
%
Removal
20
mg/L
%
Removal
30
mg/L
%
Removal
40
mg/L
%
Removal
50
mg/L
%
Removal
100
mg/L
150
mg/L
%
Removal
0.00 10.00 0.00 9.90 0.00 9.80 0.00 9.80 0.00 9.25 0.00 9.75 0.00 9.86 9.65 0.00
2.00 5.20 48.00 5.10 48.48 4.50 54.08 5.10 47.96 5.19 43.87 6.14 6.47 32.97
4.00 2.30 77.00 2.40 75.76 2.40 75.51 1.90 80.61 2.36 74.51 2.13 78.11 3.11 4.04 58.20
6.00 1.10 89.00 1.40 85.86 1.20 87.76 1.00 89.80 1.36 85.27 0.95 90.24 1.69 2.32 75.99
8.00 0.60 94.00 0.80 91.92 0.60 93.88 0.53 94.64 0.70 92.41 0.51 94.72 0.85 1.24 87.15
10.00 0.30 97.00 0.50 94.95 0.40 95.92 0.37 96.27 0.51 94.53 0.31 96.85 0.39 0.93 90.33
15.00 **ND 100.00 0.30 96.97 0.30 96.94 0.17 98.26 0.23 97.51 ND 100.00 0.18 0.33 96.60
20.00 0.20 97.98 0.20 97.96 ND 100.00 0.13 98.58 ND 0.35 96.34
25.00 0.30 96.97 0.20 97.96 ND 100.00 0.14 98.55
30.00 0.10 98.99 ND 100.00 ND 100.00
35.00 ND 100.00
**ND – Not Detected
©© UUnniivveerrssiittyy ooff PPrreettoorriiaa
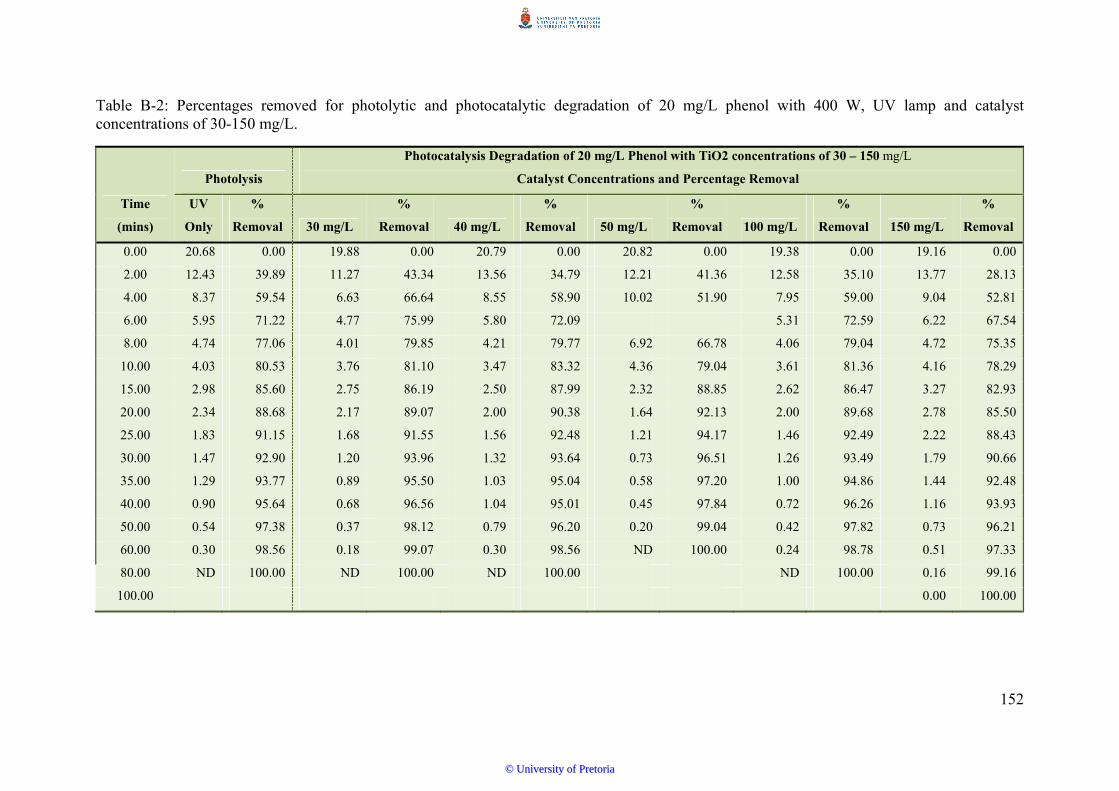
152
Table B-2: Percentages removed for photolytic and photocatalytic degradation of 20 mg/L phenol with 400 W, UV lamp and catalyst concentrations of 30-150 mg/L.
Time
(mins)
Photolysis
Photocatalysis Degradation of 20 mg/L Phenol with TiO2 concentrations of 30 – 150 mg/L
Catalyst Concentrations and Percentage Removal
UV
Only
%
Removal 30 mg/L
%
Removal 40 mg/L
%
Removal 50 mg/L
%
Removal 100 mg/L
%
Removal 150 mg/L
%
Removal
0.00 20.68 0.00 19.88 0.00 20.79 0.00 20.82 0.00 19.38 0.00 19.16 0.00
2.00 12.43 39.89 11.27 43.34 13.56 34.79 12.21 41.36 12.58 35.10 13.77 28.13
4.00 8.37 59.54 6.63 66.64 8.55 58.90 10.02 51.90 7.95 59.00 9.04 52.81
6.00 5.95 71.22 4.77 75.99 5.80 72.09 5.31 72.59 6.22 67.54
8.00 4.74 77.06 4.01 79.85 4.21 79.77 6.92 66.78 4.06 79.04 4.72 75.35
10.00 4.03 80.53 3.76 81.10 3.47 83.32 4.36 79.04 3.61 81.36 4.16 78.29
15.00 2.98 85.60 2.75 86.19 2.50 87.99 2.32 88.85 2.62 86.47 3.27 82.93
20.00 2.34 88.68 2.17 89.07 2.00 90.38 1.64 92.13 2.00 89.68 2.78 85.50
25.00 1.83 91.15 1.68 91.55 1.56 92.48 1.21 94.17 1.46 92.49 2.22 88.43
30.00 1.47 92.90 1.20 93.96 1.32 93.64 0.73 96.51 1.26 93.49 1.79 90.66
35.00 1.29 93.77 0.89 95.50 1.03 95.04 0.58 97.20 1.00 94.86 1.44 92.48
40.00 0.90 95.64 0.68 96.56 1.04 95.01 0.45 97.84 0.72 96.26 1.16 93.93
50.00 0.54 97.38 0.37 98.12 0.79 96.20 0.20 99.04 0.42 97.82 0.73 96.21
60.00 0.30 98.56 0.18 99.07 0.30 98.56 ND 100.00 0.24 98.78 0.51 97.33
80.00 ND 100.00 ND 100.00 ND 100.00 ND 100.00 0.16 99.16
100.00 0.00 100.00
©© UUnniivveerrssiittyy ooff PPrreettoorriiaa

153
Appendix C
2.01
7
Phe
nol -
4.4
45
4-N
itrop
heno
l - 5
.450
2-C
hlor
ophe
nol -
6.3
15
4-C
hlor
ophe
nol -
6.7
37
AU
0.00
0.05
0.10
0.15
0.20
Minutes
2.00 3.00 4.00 5.00 6.00 7.00 8.00 9.00 10.00
2.02
0
2.32
42.
582
2.73
82.
867
2.97
5
3.31
13.
488
3.76
93.
933
4.12
1 Phe
nol -
4.4
474.
637
4.73
24.
903
5.22
34-
Nitr
ophe
nol -
5.4
525.
703
5.86
1 2-C
hlor
ophe
nol -
6.3
16
4-C
hlor
ophe
nol -
6.7
406.
923
7.50
97.
670
AU
0.00
0.05
0.10
0.15
0.20
Minutes
2.00 3.00 4.00 5.00 6.00 7.00 8.00 9.00 10.00
2.02
1
2.30
92.
497
2.74
4 2.87
13.
037
3.32
03.
497
3.77
83.
944
4.12
6
Phe
nol -
4.4
534.
737 4-
Nitr
ophe
nol -
5.4
62
5.86
3
2-C
hlor
ophe
nol -
6.3
22
6.93
47.
097
7.51
97.
673
AU
0.00
0.05
0.10
0.15
0.20
Minutes
2.00 3.00 4.00 5.00 6.00 7.00 8.00 9.00 10.00
2.02
2
2.30
92.
493
2.74
5 2.87
3
3.32
1
3.65
13.
780
3.94
74.
131
Phe
nol -
4.4
56
4.74
0 4-N
itrop
heno
l - 5
.465
5.87
0
6.93
87.
100
7.52
17.
675
AU
0.00
0.05
0.10
0.15
0.20
Minutes
2.00 3.00 4.00 5.00 6.00 7.00 8.00 9.00 10.00
Figure C1: Chromatograms displaying phenol and its derivatives in the course of
photocatalysis in a Mixture containing 30 mg/L of each pollutant. Conditions: TiO2 50
mg/L – UV/Air after 0, 2, 16, and 20 minutes of treatment.
©© UUnniivveerrssiittyy ooff PPrreettoorriiaa
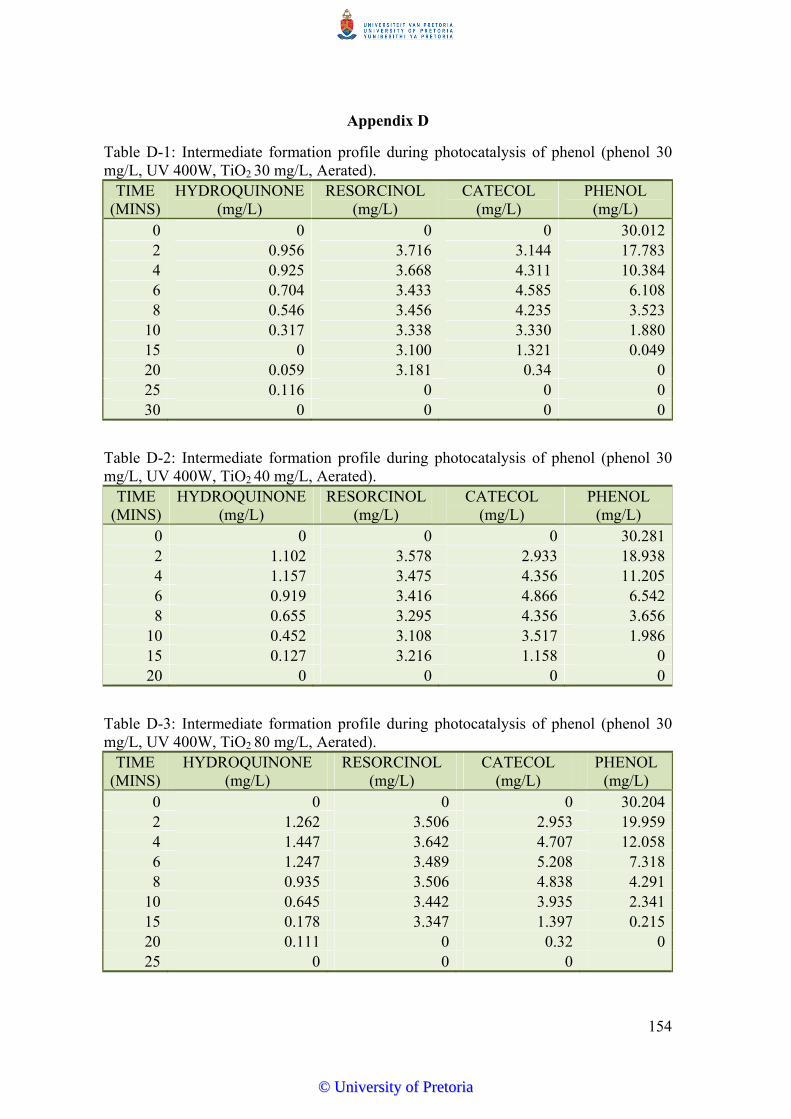
154
Appendix D
Table D-1: Intermediate formation profile during photocatalysis of phenol (phenol 30 mg/L, UV 400W, TiO2 30 mg/L, Aerated).
TIME (MINS)
HYDROQUINONE (mg/L)
RESORCINOL (mg/L)
CATECOL (mg/L)
PHENOL (mg/L)
0 0 0 0 30.0122 0.956 3.716 3.144 17.7834 0.925 3.668 4.311 10.3846 0.704 3.433 4.585 6.1088 0.546 3.456 4.235 3.523
10 0.317 3.338 3.330 1.88015 0 3.100 1.321 0.04920 0.059 3.181 0.34 025 0.116 0 0 030 0 0 0 0
Table D-2: Intermediate formation profile during photocatalysis of phenol (phenol 30 mg/L, UV 400W, TiO2 40 mg/L, Aerated).
TIME (MINS)
HYDROQUINONE (mg/L)
RESORCINOL (mg/L)
CATECOL (mg/L)
PHENOL (mg/L)
0 0 0 0 30.2812 1.102 3.578 2.933 18.9384 1.157 3.475 4.356 11.2056 0.919 3.416 4.866 6.5428 0.655 3.295 4.356 3.656
10 0.452 3.108 3.517 1.98615 0.127 3.216 1.158 020 0 0 0 0
Table D-3: Intermediate formation profile during photocatalysis of phenol (phenol 30 mg/L, UV 400W, TiO2 80 mg/L, Aerated).
TIME (MINS)
HYDROQUINONE (mg/L)
RESORCINOL (mg/L)
CATECOL (mg/L)
PHENOL (mg/L)
0 0 0 0 30.2042 1.262 3.506 2.953 19.9594 1.447 3.642 4.707 12.0586 1.247 3.489 5.208 7.3188 0.935 3.506 4.838 4.291
10 0.645 3.442 3.935 2.34115 0.178 3.347 1.397 0.21520 0.111 0 0.32 025 0 0 0
©© UUnniivveerrssiittyy ooff PPrreettoorriiaa

155
Table D-4: Catechol formation/degradation rates during photocatalysis of phenol at phenol/TiO2 concentrations.
Phenol Conc/TiO2 Conc
(mg/L)
Max. Conc
Obtained
(mg/L)
Time
(Mins)#
Formation
Rate
(mg(L.min))
Rate of
Disappearance
(mg(L.min))*
Phenol 10/ TiO2 40 3.197 6 0.5331 0.133
Phenol 10/ TiO2 50 3.280 4 0.8199 0.126
Phenol 10/ TiO2 100 4.580 4 1.1449 0.176
Phenol 10/ TiO2 150 3.422 6 0.2673 0.078
Phenol 20/ TiO2 30 4.794 4 1.1986 0.063
Phenol 20/ TiO2 40 4.969 6 0.8282 0.053
Phenol 20/ TiO2 50 4.553 4 0.7170 0.060
Phenol 20/ TiO2 100 5.050 6 0.4988 0.054
Phenol 20/ TiO2 150 5.297 8 0.6621 0.058
Phenol 30/ TiO2 30 6.946 8 1.1680 0.043
Phenol 30/ TiO2 40 7.109 6 1.1849 0.044
Phenol 30/ TiO2 50 6.890 8 0.8612 0.046
Phenol 30/ TiO2 60 6.251 6 1.0418 0.055
Phenol 30/ TiO2 70 6.140 8 0.7675 0.055
Phenol 30/ TiO2 80 6.472 8 0.8090 0.058
Phenol 30/ TiO2 90 6.395 8 0.7993 0.089
Phenol 30/ TiO2 100 4.216 8 0.5269 0.046
* - Disappearance rates calculated from time of maximum concentration in solution # -Time at which maximum concentrations were observed
©© UUnniivveerrssiittyy ooff PPrreettoorriiaa
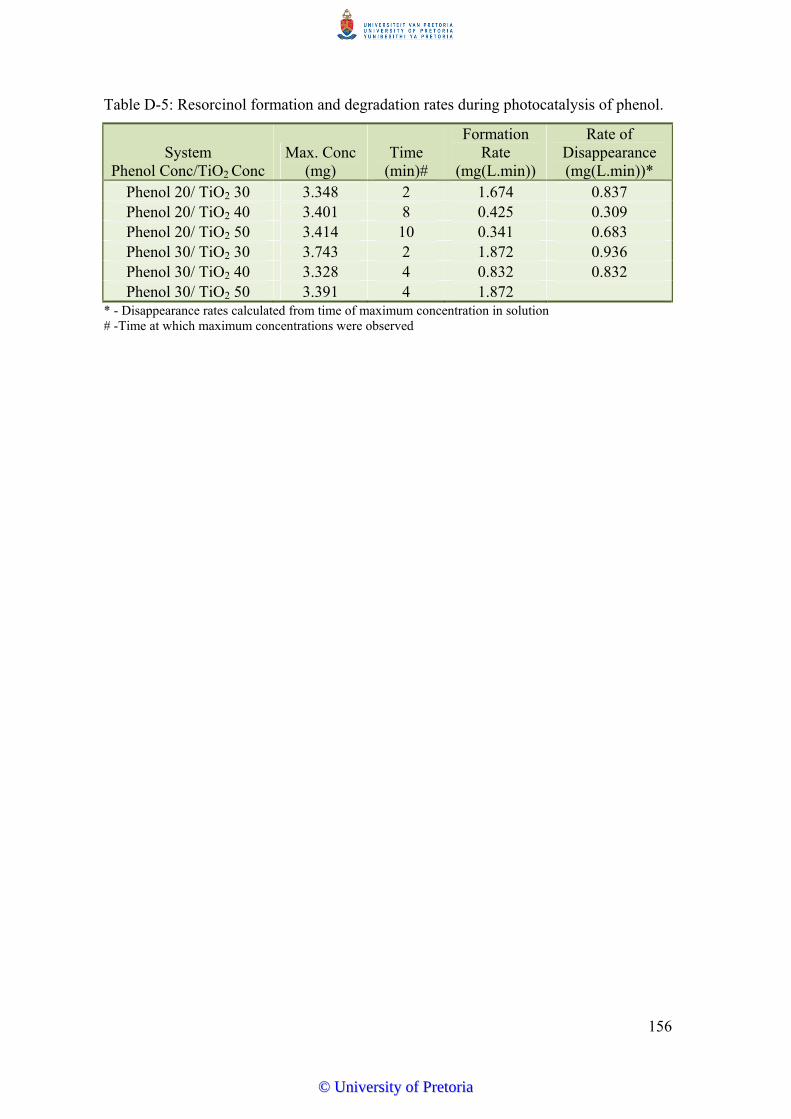
156
Table D-5: Resorcinol formation and degradation rates during photocatalysis of phenol.
System Phenol Conc/TiO2 Conc
Max. Conc (mg)
Time (min)#
Formation Rate
(mg(L.min))
Rate of Disappearance (mg(L.min))*
Phenol 20/ TiO2 30 3.348 2 1.674 0.837 Phenol 20/ TiO2 40 3.401 8 0.425 0.309 Phenol 20/ TiO2 50 3.414 10 0.341 0.683 Phenol 30/ TiO2 30 3.743 2 1.872 0.936 Phenol 30/ TiO2 40 3.328 4 0.832 0.832 Phenol 30/ TiO2 50 3.391 4 1.872
* - Disappearance rates calculated from time of maximum concentration in solution # -Time at which maximum concentrations were observed
©© UUnniivveerrssiittyy ooff PPrreettoorriiaa
Copyright © 2022 FDOKUMEN