Effect of Silver Impregnation on Efficiency of ZnO for Photocatalytic Degradation of Eosin Y
10
1 23 Proceedings of the National Academy of Sciences, India Section A: Physical Sciences ISSN 0369-8203 Volume 83 Number 1 Proc. Natl. Acad. Sci., India, Sect. A Phys. Sci. (2013) 83:7-14 DOI 10.1007/s40010-012-0063-3 Effect of Silver Impregnation on Efficiency of ZnO for Photocatalytic Degradation of Eosin Y S. Siva Kumar, V. Ranga Rao & G. Nageswara Rao
-
Upload
independent -
Category
Documents
-
view
1 -
download
0
Transcript of Effect of Silver Impregnation on Efficiency of ZnO for Photocatalytic Degradation of Eosin Y
1 23
Proceedings of the National Academyof Sciences, India Section A: PhysicalSciences ISSN 0369-8203Volume 83Number 1 Proc. Natl. Acad. Sci., India, Sect. A Phys.Sci. (2013) 83:7-14DOI 10.1007/s40010-012-0063-3
Effect of Silver Impregnation on Efficiencyof ZnO for Photocatalytic Degradation ofEosin Y
S. Siva Kumar, V. Ranga Rao &G. Nageswara Rao

1 23
Your article is protected by copyright and all
rights are held exclusively by The National
Academy of Sciences, India. This e-offprint
is for personal use only and shall not be self-
archived in electronic repositories. If you
wish to self-archive your work, please use the
accepted author’s version for posting to your
own website or your institution’s repository.
You may further deposit the accepted author’s
version on a funder’s repository at a funder’s
request, provided it is not made publicly
available until 12 months after publication.
RESEARCH ARTICLE
Effect of Silver Impregnation on Efficiency of ZnOfor Photocatalytic Degradation of Eosin Y
S. Siva Kumar • V. Ranga Rao • G. Nageswara Rao
Received: 10 July 2012 / Revised: 17 October 2012 / Accepted: 7 November 2012 / Published online: 12 February 2013
� The National Academy of Sciences, India 2013
Abstract The photocatalytic degradation of Eosin Y, a
xanthenes dye has been investigated under visible light
irradiation in the presence of aqueous suspension of ZnO
and silver impregnated ZnO at various conditions. ZnO
was impregnated with Ag of varying concentrations such as
0.5, 1.0, 1.5 at.% and the samples were calcined at various
temperatures for 2 h. The catalyst was characterized by
XRD, SEM and UV–Visible diffuse reflectance spectro-
scopic studies. The photocatalytic activity of ZnO was
found to be enhanced by silver impregnation and 1 at.% of
silver impregnated ZnO has high photocatalytic activity.
Calcinations of samples at higher temperature decreased
the photocatalytic activity. Effect of various parameters
such as catalyst loading, initial concentration of dye and
pH of the solution on dye degradation was also studied.
The kinetics of dye degradation showed that the data were
well fitted to pseudo-first order kinetic model.
Keywords Photocatalysis � Silver impregnated ZnO �Eosin Y � Dye degradation � Textile effluents
Introduction
Dyes are used in many industries like textile, paper, plastic,
leather, ceramic, cosmetics, ink and food processing. The
waste water from these industries contains large quantities of
residual dye effluents, which are toxic and non-biodegrad-
able [1]. These dyes create severe environmental pollution
problems by releasing toxic and potential carcinogenic
substances into the aqueous phase. Decolourisation of dye
effluents has therefore received increasing attention. Various
physical and chemical processes such as precipitation,
adsorption, flocculation, reverse osmosis and ultra filtration
can be used for colour removal from textile effluents [2–5].
However, these methods merely transfer dyes from the liquid
to the solid phase causing secondary pollution, which
requires further treatment [6, 7].
During the last two decades, advanced oxidation pro-
cesses (AOPs) have been proposed as an alternative way
for treating undesirable organic pollutants, including dye-
stuffs [8]. These methods were based on generation of
highly reactive species like hydroxyl radicals that oxidizes
a broad range of pollutants. Among AOPs, heterogeneous
photocatalysis includes a combination of semiconductors
and light that seems to be an attractive method for the
degradation of various organic pollutants [9–12]. The
reason for increased interest towards photocatalytic deg-
radation is that the process may use atmospheric oxygen as
the oxidant and can be carried out under ambient condi-
tions that lead to total mineralization of organics to CO2,
water and mineral acids.
Titanium dioxide (TiO2) is considered as one of the best
photocatalyst and has the ability to detoxify water from a
number of organic pollutants [13, 14]. However, the
shortcoming of TiO2 is that it absorbs only a small portion
of solar spectrum in the UV region. Hence interest has been
S. Siva Kumar
Department of Chemistry, Anil Neerukonda Institute of
Technology and Sciences, Sangivalasa,
Visakhapatnam 531162, India
V. Ranga Rao
Department of Chemistry, Government College (Autonomous),
Rajahmundry 533105, India
G. Nageswara Rao (&)
School of Chemistry, Andhra University,
Visakhapatnam 530003, India
e-mail: [email protected]
123
Proc. Natl. Acad. Sci., India, Sect. A Phys. Sci. (January–March 2013) 83(1):7–14
DOI 10.1007/s40010-012-0063-3
Author's personal copy
drawn towards the search for suitable alternatives to TiO2.
Many attempts have been made to study photocatalytic
activity of different semiconductors such as SnO2, ZrO2,
CdS and ZnO [15–17]. Lizama et al. [16] reported that ZnO
is a more efficient catalyst than TiO2 for degradation of
reactive blue 19. The advantage of ZnO is its absorption
over a larger fraction of solar spectrum than TiO2 [18]. For
this reason ZnO seems to be the most suitable catalyst for
photo degradation in the presence of sun light.
Eosin Y is the widely used counter stain in routine
staining of histological tissue sections (erythrocytes, col-
lagen, epithelial cells, etc.) [19, 20]. Biological stains such
as Eosin Y, Auramine O are used in biomedical research
laboratories and also for diagnostic purposes. These stains
are known to be toxic or mutagenic for human and animals
[21, 22]. High concentration of dye in stain solutions
results in the formation of waste waters of high toxicity. So
in the present study, the photocatalytic degradation of
Eosin Y in aqueous solutions under visible light irradiation
by using ZnO and Silver impregnated ZnO was investi-
gated. Effect of pH, initial dye concentration and photo-
catalyst doses on dye degradation was also reported.
Experimental
Materials
Zinc oxide and Eosin Y were obtained from Merck India.
All the solutions were prepared using double distilled
water. All the chemicals used in the study were of ana-
lytical reagent grade.
Preparation of Silver-Impregnated ZnO Photocatalyst
Silver impregnated ZnO containing 1 at.% of silver was
prepared by the following procedure. Silver nitrate solution
containing 105 mg in 100 ml was added to 5 g of ZnO and
the mixture was stirred for 4 h. The suspension was
allowed to stand for 24 h undisturbed and water was then
evaporated by heating at 100 �C for 16 h. The dried solid
was grounded to fine powder in an agate mortar and cal-
cined at 200, 400 and 600 �C for 2 h in muffle furnace.
Silver impregnated ZnO of 0.5 and 1.5 at.% were prepared
by taking 52.5 and 157.5 mg of silver nitrate and following
the same procedure.
Characterization
XRD and SEM
The catalysts were characterized for their structure and
morphology by XRD (X-ray diffraction) and SEM (scanning
electron microscopy). The XRD patterns of the powdered
samples were recorded by Bruker 8 D advanced X-ray dif-
fractometer and SEM images of the samples were taken by
using Philips XL 30 ESEM Scanning electron microscope.
UV–Vis Diffuse Reflectance Spectroscopy
UV–Vis spectroscopy was used to characterize the optical
absorption properties of ZnO and silver impregnated ZnO
(Ag–ZnO). The UV–Vis absorption spectra of the samples
were recorded in the wavelength range 200–800 nm using
Shimadzu UV 3600 UV–Vis–NIR spectrometer in diffuse
reflectance mode (DRS) using BaSO4 as reference. Spectra
were recorded at room temperature and the data were
transformed through Kubelka–Munk function.
20 40 60 80
0
500
1000In
ten
sity
/a.u
2 Theta/Degree
Undoped ZnO
0.5% Ag-ZnO
1.0% Ag-ZnO
1.5% Ag-ZnO
a
045303
0
600
12006000C
4000C
2000C
Inte
nsi
ty/a
.u
2 Theta/Degree
1000C
Ag
Ag
Ag
b
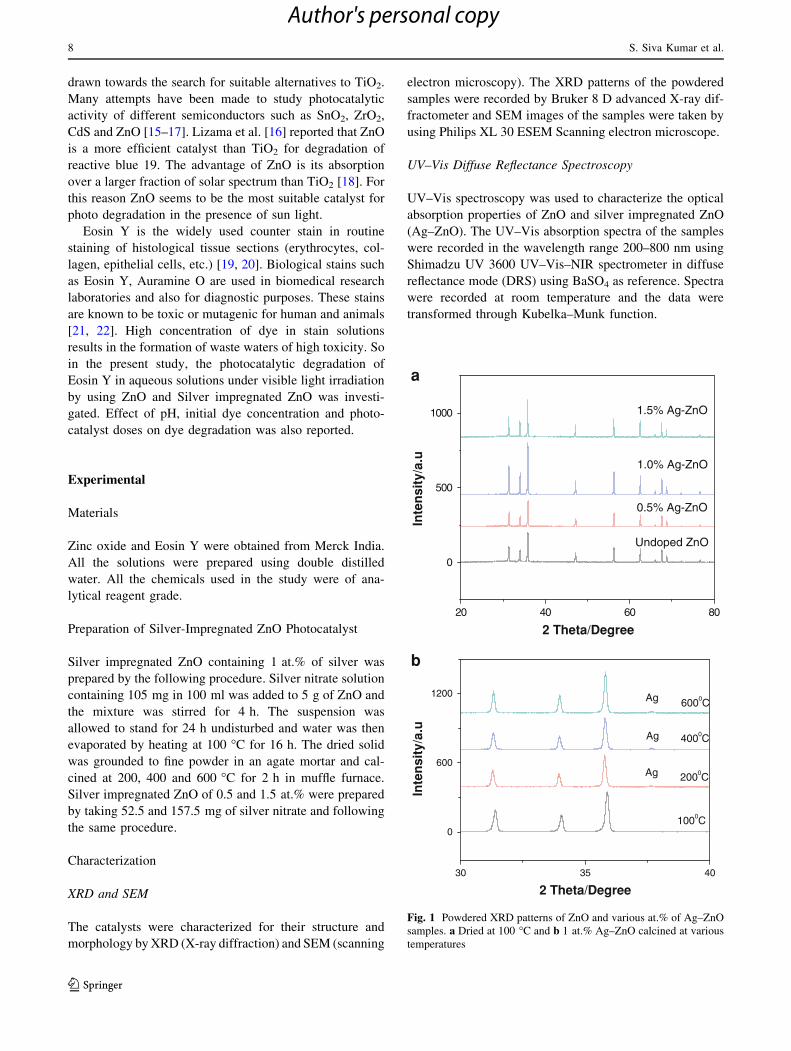
Fig. 1 Powdered XRD patterns of ZnO and various at.% of Ag–ZnO
samples. a Dried at 100 �C and b 1 at.% Ag–ZnO calcined at various
temperatures
8 S. Siva Kumar et al.
123
Author's personal copy
Photocatalytic Studies
The experimental setup for the photocatalytic degrada-
tion consisted of a 250 ml beaker with water circulation
outside. The beaker was placed on a magnetic stirrer;
above which high pressure mercury vapour lamp
(125 W, Philips) emitting visible light was placed.
100 ml of the dye solution was taken in the beaker and
ZnO or Ag–ZnO at a dose of 1 g l-1 was added to it.
The distance of the light source from the upper level of
dye solution in the beaker was 18 cm. The solution was
stirred in the dark for 5 min to establish the adsorption
equilibrium. The zero time reading was taken and the
solution was then irradiated. Aliquots were taken at
regular time intervals and centrifuged to analyze the
percent degradation of the dye.
Analysis
The percent degradation of Eosin Y was determined
spectrophotometrically by measuring absorbance of the
dye solution at kmax 518 nm. The decolourisation effi-
ciency (%) was calculated as:
Efficiency %ð Þ ¼ C0 � C
C0
� 100
where C0 is the initial concentration of dye and C is the
concentration of dye after irradiation. Similar experiments
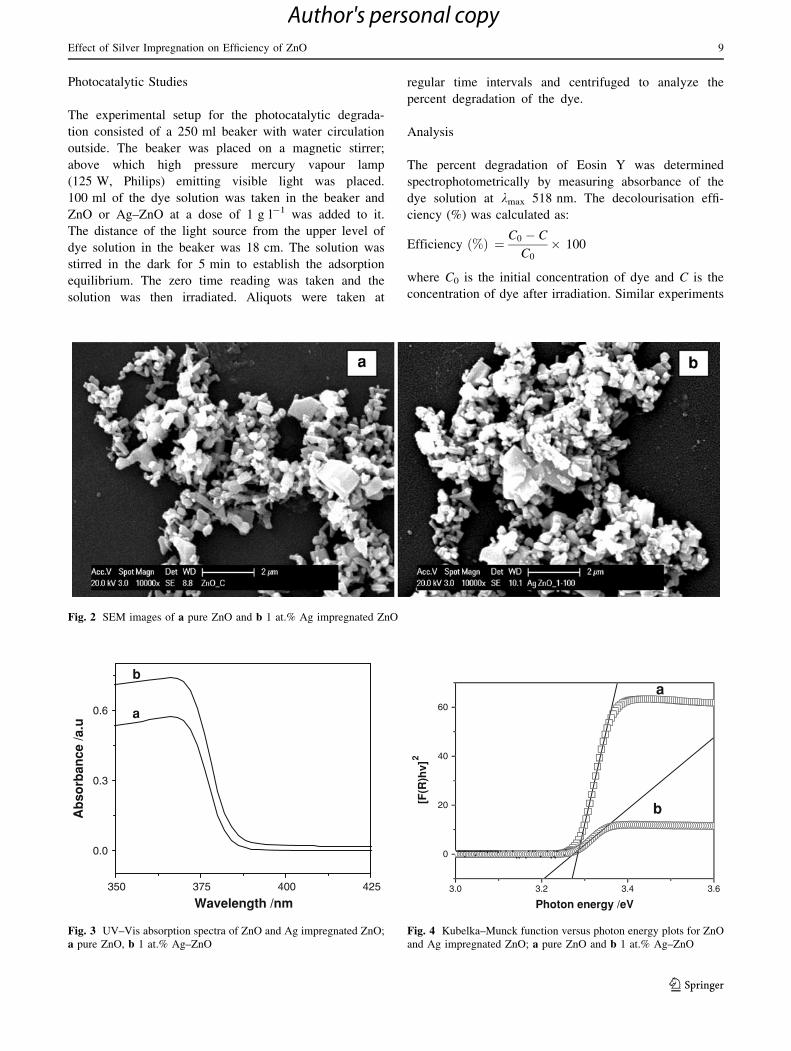
Fig. 2 SEM images of a pure ZnO and b 1 at.% Ag impregnated ZnO
350 375 400 425
0.0
0.3
0.6
b
Ab
sorb
ance
/a.u
Wavelength /nm
a
Fig. 3 UV–Vis absorption spectra of ZnO and Ag impregnated ZnO;
a pure ZnO, b 1 at.% Ag–ZnO
3.0 3.2 3.4 3.6
0
20
40
60
b
[F(R
)hv]
2
Photon energy /eV
a
Fig. 4 Kubelka–Munck function versus photon energy plots for ZnO
and Ag impregnated ZnO; a pure ZnO and b 1 at.% Ag–ZnO
Effect of Silver Impregnation on Efficiency of ZnO 9
123
Author's personal copy
were carried out by varying concentration of dye solution,
catalyst loading and pH of the solution.
Results and Discussion
Catalyst Characterization
XRD and SEM Analysis
The XRD patterns obtained for powdered ZnO and Ag–
ZnO of various concentrations of silver loading 0.5, 1.0 and
1.5 at.% dried at 100 �C are shown in Fig. 1a indicating
well indexed phases of ZnO wurtzite structure (JCPDS No.
36–1451). The intensity of XRD peaks increases with
increase in addition of silver up to 1 at.% indicating better
crystallinity of the samples and further addition of silver
again decreased the intensity. Impregnation of ZnO with
Ag? ions doesn’t show any change in crystal structure may
be due to low percent of silver loading and surface depo-
sition. Calcination of samples at 200, 400 and 600 �C
introduced a small extra peak in XRD pattern (Fig. 1b)
characteristic of metallic silver [23, 24]. The intensity of
the peak is very low due to lower percent of silver incor-
porated into ZnO crystal lattice.
Based on the photocatalytic degradation studies, further
characterization was done for 1 % Ag–ZnO, which exhibits
better photocatalytic activity.
The SEM images of ZnO and 1 % Ag–ZnO heated at
100 �C are given in Fig. 2, which shows that ZnO particles
are in different shapes and sizes and, silver doping does not
change the morphology of ZnO.
Diffuse Reflectance Analysis
Figure 3 shows UV–Vis absorption spectra of ZnO as well
as ZnO impregnated with 1.0 at.% of silver. Both the
samples have a strong absorbance below 400 nm. The
addition of silver caused a slight shift in absorption to
higher wavelength side (red shift). The band gap energies
of ZnO and 1 % Ag–ZnO samples were calculated by
extrapolating the linear portion of the plots of modified
Kubelka–Munk function, [F(R)hm]2 versus the photon
energy (hm) shown in Fig. 4 [25]. The band gap energies of
pure ZnO and 1 % silver impregnated ZnO samples were
found to be 3.28 and 3.27 eV respectively. The band gap
0 30 60 90 1200
25
50
75
100
% D
egra
dat
ion
Time/min
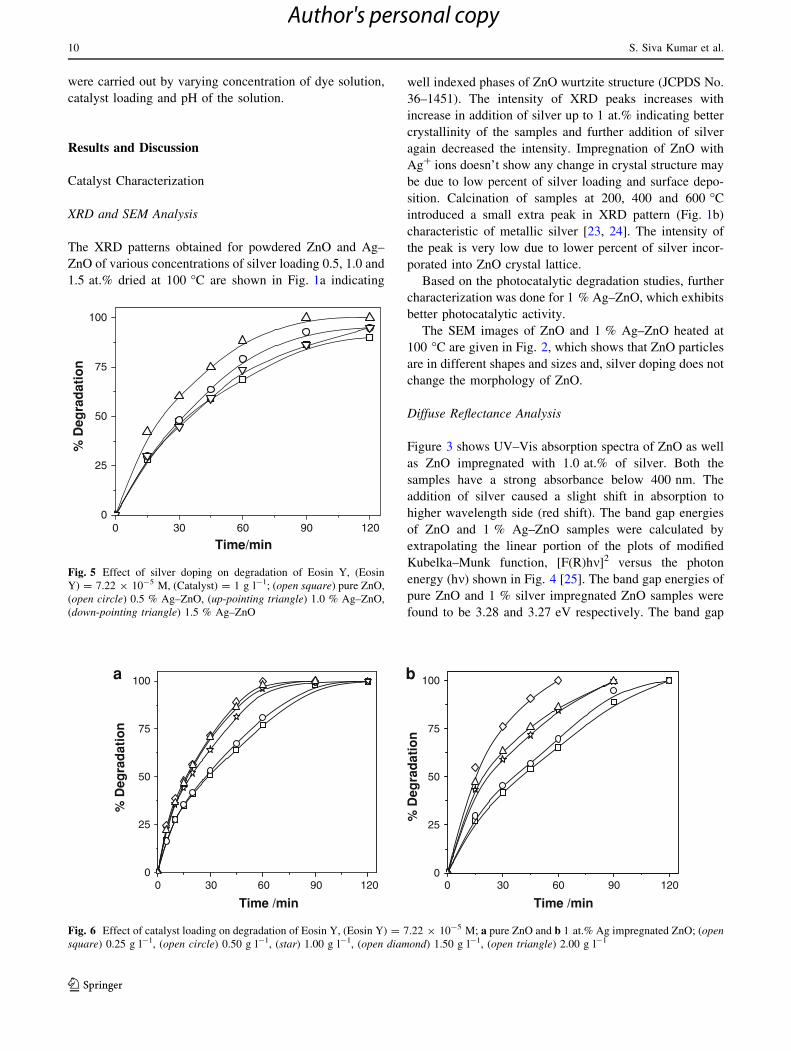
Fig. 5 Effect of silver doping on degradation of Eosin Y, (Eosin
Y) = 7.22 9 10-5 M, (Catalyst) = 1 g l-1; (open square) pure ZnO,
(open circle) 0.5 % Ag–ZnO, (up-pointing triangle) 1.0 % Ag–ZnO,
(down-pointing triangle) 1.5 % Ag–ZnO
0 30 60 90 1200
25
50
75
100
% D
egra
dat
ion
Time /min
a
0
25
50
75
100
% D
egra
dat
ion
Time /min
b
0 30 60 90 120
Fig. 6 Effect of catalyst loading on degradation of Eosin Y, (Eosin Y) = 7.22 9 10-5 M; a pure ZnO and b 1 at.% Ag impregnated ZnO; (opensquare) 0.25 g l-1, (open circle) 0.50 g l-1, (star) 1.00 g l-1, (open diamond) 1.50 g l-1, (open triangle) 2.00 g l-1
10 S. Siva Kumar et al.
123
Author's personal copy
energy is decreased slightly for 1 % Ag–ZnO compared to
pure ZnO, which supports the red shift in absorption
spectra.
Adsorption and Direct Photolysis
Aqueous solution of Eosin Y (7.22 9 10-5 M) mixed with
ZnO (1 g l-1) was stirred in dark to observe whether there
was any colour removal due to adsorption. There was no
observable adsorption on the surface of the photocatalyst
on magnetic stirring in dark for 1 h. Direct photolysis of
dye solution was also studied by irradiation in the absence
of the photocatalyst with magnetic stirring for 1 h. It
showed no observable degradation.
Photocatalytic Degradation
The aqueous solutions of Eosin Y (7.22 9 10-5 M) were
found to degrade up to 68 and 88 % on visible light irra-
diation for 1 h in the presence of ZnO (1 g l-1) and Ag–
ZnO (1 g l-1), respectively. The degradation efficiency of
Ag–ZnO was found to be higher than ZnO as shown in
Fig. 5.
The effect of calcination temperature of Ag–ZnO on
degradation of Eosin Y was also studied. The percent
degradation decreased with increase in calcination tem-
perature. Samples heated at 100 and 200 �C have high
activity than samples calcined at 400 and 600 �C for 2 h.
Higher temperature calcination has a negative effect on
photocatalytic activity because the presence of silver pro-
motes the densification and grain growth of ZnO at higher
temperatures by forming a silver island in the ZnO matrix.
This causes reduction in active surface sites of the photo-
catalyst for the adsorption of dye and light [26]. The
degradation efficiency also varied with concentration of
silver ion impregnation. With increase in silver loading
from 0.5 to 1.5 at.%, the degradation efficiency was found
to be maximum for 1 at.% of silver impregnation on ZnO.
This is the optimal concentration of Ag impregnation on
ZnO by this method.
The photocatalytic degradation of a dye in solution is
initiated by the photoexcitation of the semiconductor, fol-
lowed by the formation of electron-hole pair on the surface
of catalyst. The high oxidative potential of the hole in the
catalyst permits the direct oxidation of the dye to reactive
intermediates. Another reactive intermediate which is
responsible for the degradation is hydroxyl radical formed
by the decomposition of water or by reaction of hole with
OH-. The hydroxyl radical is an extremely strong non-
selective oxidant which leads to partial or complete min-
eralization of several organic chemicals [27]. The role of
reductive pathway in heterogeneous photocatalysis is very
little as compared to oxidation [28]. The enhancing effect
of Ag doping may be explained by its ability to trap
electrons and this process reduces the recombination of
charges and favours the oxidation of the substrate [29].
Higher concentrations of silver doping could be unfa-
vourable to photocatalytic efficiency. It is assumed that
silver doping below optimum value acts as electron-hole
separation center [30], where as above optimum value it
can also act as charge carrier recombination center [31].
Effect of Catalyst Concentration
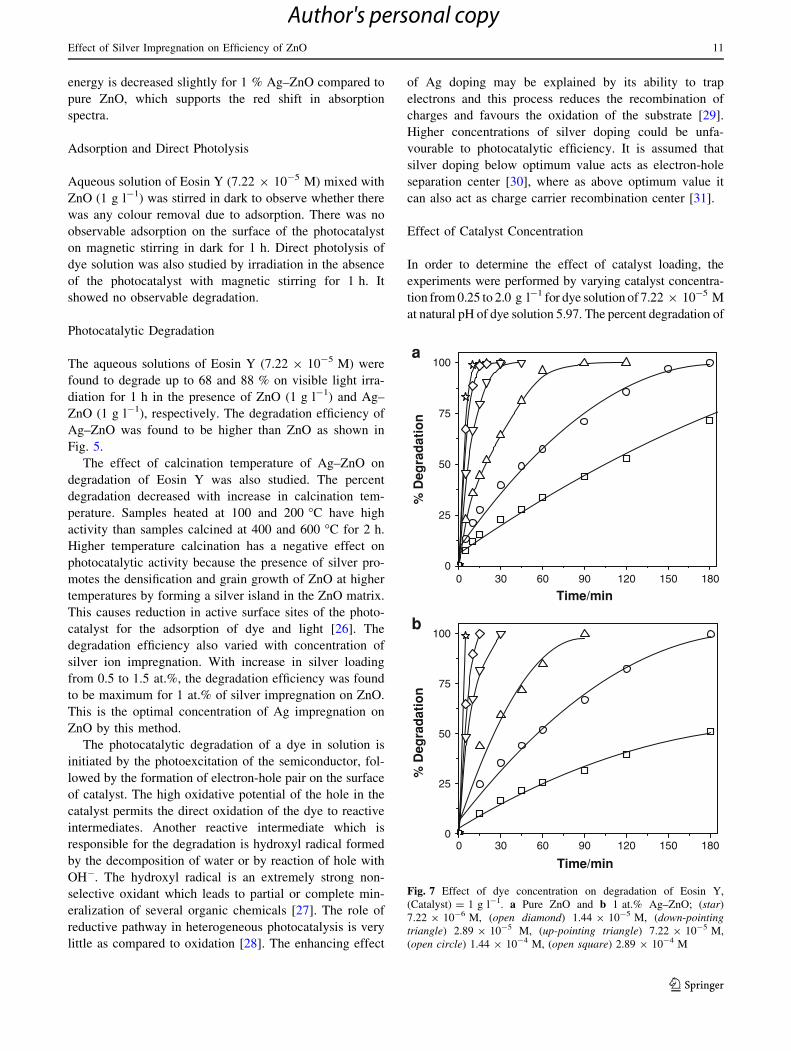
In order to determine the effect of catalyst loading, the
experiments were performed by varying catalyst concentra-
tion from 0.25 to 2.0 g l-1 for dye solution of 7.22 9 10-5 M
at natural pH of dye solution 5.97. The percent degradation of
0 30 60 90 120 150 180
0 30 60 90 120 150 180
0
25
50
75
100
% D
egra
dat
ion
Time/min
a
0
25
50
75
100
% D
egra
dat
ion
Time/min
b
Fig. 7 Effect of dye concentration on degradation of Eosin Y,
(Catalyst) = 1 g l-1. a Pure ZnO and b 1 at.% Ag–ZnO; (star)
7.22 9 10-6 M, (open diamond) 1.44 9 10-5 M, (down-pointingtriangle) 2.89 9 10-5 M, (up-pointing triangle) 7.22 9 10-5 M,
(open circle) 1.44 9 10-4 M, (open square) 2.89 9 10-4 M
Effect of Silver Impregnation on Efficiency of ZnO 11
123
Author's personal copy
Eosin Y for various doses of catalyst has been shown in Fig. 6.
The percent degradation increases with increase in catalyst
dose and higher concentrations of catalyst beyond 1.5 g l-1
does not have much effect on degradation. Similar trend was
observed in case of Ag–ZnO too. This can be explained on the
basis of increased total active surface area with the catalyst
dose and availability of more active sites on the surface. At the
same time due to increased turbidity of the suspension with
high dose of photocatalyst, penetration of light and photoac-
tivated volume of suspension decrease.
Effect of Dye Concentration
The effect of initial dye concentration on the photodegra-
dation of Eosin Y was studied at different concentrations in
the range of 7.22 9 10-6–2.89 9 10-4 M (Fig. 7). It was
observed that the percent degradation gradually decreased
with increase in initial dye concentration. As concentration
of dye solution increases, the photons get intercepted by
dye molecules before they reach the catalyst surface,
decreasing the absorption of photons by the catalyst.
Hence, the generation of relative amounts of OH� and O2�-
on the surface of the catalyst decreases. Thus the dye
degradation efficiency decreases as the dye concentration
increases [32].
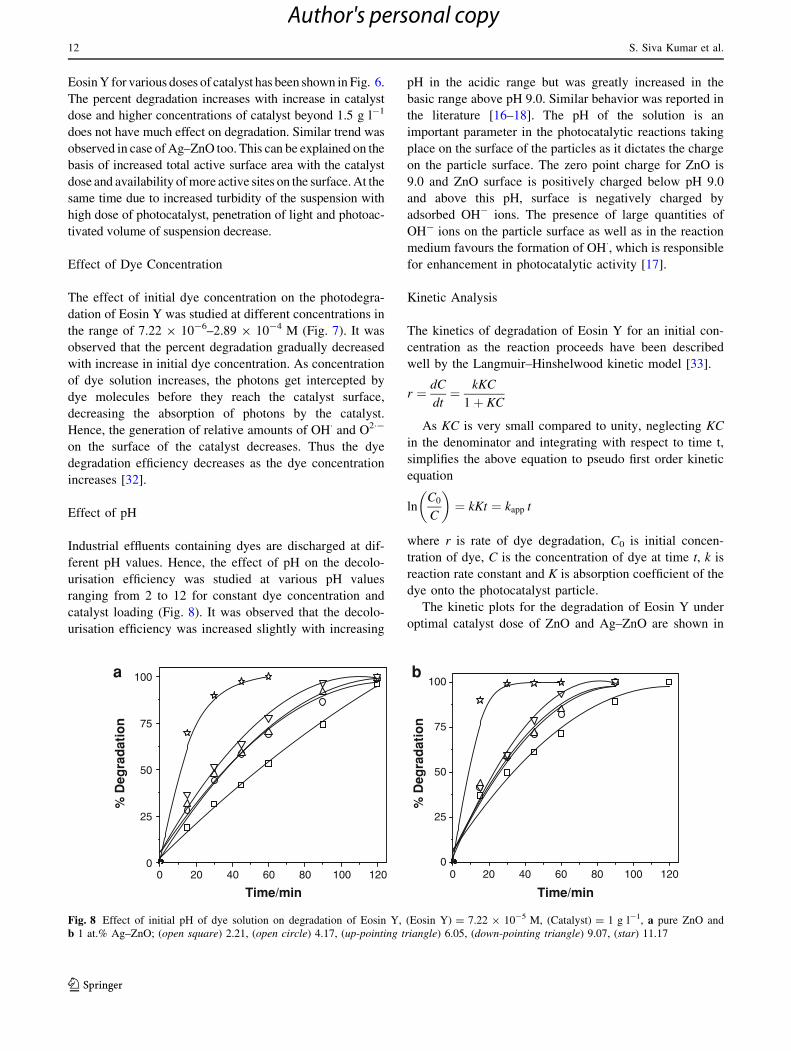
Effect of pH
Industrial effluents containing dyes are discharged at dif-
ferent pH values. Hence, the effect of pH on the decolo-
urisation efficiency was studied at various pH values
ranging from 2 to 12 for constant dye concentration and
catalyst loading (Fig. 8). It was observed that the decolo-
urisation efficiency was increased slightly with increasing
pH in the acidic range but was greatly increased in the
basic range above pH 9.0. Similar behavior was reported in
the literature [16–18]. The pH of the solution is an
important parameter in the photocatalytic reactions taking
place on the surface of the particles as it dictates the charge
on the particle surface. The zero point charge for ZnO is
9.0 and ZnO surface is positively charged below pH 9.0
and above this pH, surface is negatively charged by
adsorbed OH- ions. The presence of large quantities of
OH- ions on the particle surface as well as in the reaction
medium favours the formation of OH�, which is responsible
for enhancement in photocatalytic activity [17].
Kinetic Analysis
The kinetics of degradation of Eosin Y for an initial con-
centration as the reaction proceeds have been described
well by the Langmuir–Hinshelwood kinetic model [33].
r ¼ dC
dt¼ kKC
1þ KC
As KC is very small compared to unity, neglecting KC
in the denominator and integrating with respect to time t,
simplifies the above equation to pseudo first order kinetic
equation
lnC0
C
� �¼ kKt ¼ kapp t
where r is rate of dye degradation, C0 is initial concen-
tration of dye, C is the concentration of dye at time t, k is
reaction rate constant and K is absorption coefficient of the
dye onto the photocatalyst particle.
The kinetic plots for the degradation of Eosin Y under
optimal catalyst dose of ZnO and Ag–ZnO are shown in
0 20 40 60 80 100 1200
25
50
75
100
% D
egra
dat
ion
Time/min
a
0
25
50
75
100
% D
egra
dat
ion
Time/min
b
0 20 40 60 80 100 120
Fig. 8 Effect of initial pH of dye solution on degradation of Eosin Y, (Eosin Y) = 7.22 9 10-5 M, (Catalyst) = 1 g l-1, a pure ZnO and
b 1 at.% Ag–ZnO; (open square) 2.21, (open circle) 4.17, (up-pointing triangle) 6.05, (down-pointing triangle) 9.07, (star) 11.17
12 S. Siva Kumar et al.
123
Author's personal copy
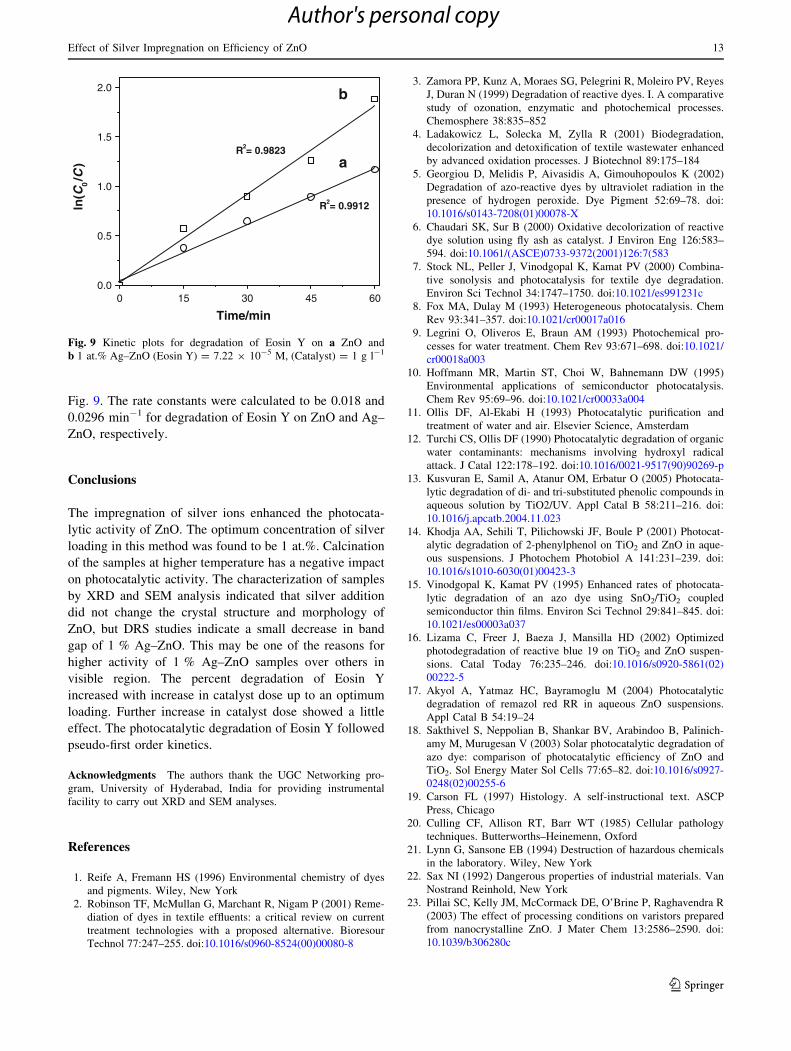
Fig. 9. The rate constants were calculated to be 0.018 and
0.0296 min-1 for degradation of Eosin Y on ZnO and Ag–
ZnO, respectively.
Conclusions
The impregnation of silver ions enhanced the photocata-
lytic activity of ZnO. The optimum concentration of silver
loading in this method was found to be 1 at.%. Calcination
of the samples at higher temperature has a negative impact
on photocatalytic activity. The characterization of samples
by XRD and SEM analysis indicated that silver addition
did not change the crystal structure and morphology of
ZnO, but DRS studies indicate a small decrease in band
gap of 1 % Ag–ZnO. This may be one of the reasons for
higher activity of 1 % Ag–ZnO samples over others in
visible region. The percent degradation of Eosin Y
increased with increase in catalyst dose up to an optimum
loading. Further increase in catalyst dose showed a little
effect. The photocatalytic degradation of Eosin Y followed
pseudo-first order kinetics.
Acknowledgments The authors thank the UGC Networking pro-
gram, University of Hyderabad, India for providing instrumental
facility to carry out XRD and SEM analyses.
References
1. Reife A, Fremann HS (1996) Environmental chemistry of dyes
and pigments. Wiley, New York
2. Robinson TF, McMullan G, Marchant R, Nigam P (2001) Reme-
diation of dyes in textile effluents: a critical review on current
treatment technologies with a proposed alternative. Bioresour
Technol 77:247–255. doi:10.1016/s0960-8524(00)00080-8
3. Zamora PP, Kunz A, Moraes SG, Pelegrini R, Moleiro PV, Reyes
J, Duran N (1999) Degradation of reactive dyes. I. A comparative
study of ozonation, enzymatic and photochemical processes.
Chemosphere 38:835–852
4. Ladakowicz L, Solecka M, Zylla R (2001) Biodegradation,
decolorization and detoxification of textile wastewater enhanced
by advanced oxidation processes. J Biotechnol 89:175–184
5. Georgiou D, Melidis P, Aivasidis A, Gimouhopoulos K (2002)
Degradation of azo-reactive dyes by ultraviolet radiation in the
presence of hydrogen peroxide. Dye Pigment 52:69–78. doi:
10.1016/s0143-7208(01)00078-X
6. Chaudari SK, Sur B (2000) Oxidative decolorization of reactive
dye solution using fly ash as catalyst. J Environ Eng 126:583–
594. doi:10.1061/(ASCE)0733-9372(2001)126:7(583
7. Stock NL, Peller J, Vinodgopal K, Kamat PV (2000) Combina-
tive sonolysis and photocatalysis for textile dye degradation.
Environ Sci Technol 34:1747–1750. doi:10.1021/es991231c
8. Fox MA, Dulay M (1993) Heterogeneous photocatalysis. Chem
Rev 93:341–357. doi:10.1021/cr00017a016
9. Legrini O, Oliveros E, Braun AM (1993) Photochemical pro-
cesses for water treatment. Chem Rev 93:671–698. doi:10.1021/
cr00018a003
10. Hoffmann MR, Martin ST, Choi W, Bahnemann DW (1995)
Environmental applications of semiconductor photocatalysis.
Chem Rev 95:69–96. doi:10.1021/cr00033a004
11. Ollis DF, Al-Ekabi H (1993) Photocatalytic purification and
treatment of water and air. Elsevier Science, Amsterdam
12. Turchi CS, Ollis DF (1990) Photocatalytic degradation of organic
water contaminants: mechanisms involving hydroxyl radical
attack. J Catal 122:178–192. doi:10.1016/0021-9517(90)90269-p
13. Kusvuran E, Samil A, Atanur OM, Erbatur O (2005) Photocata-
lytic degradation of di- and tri-substituted phenolic compounds in
aqueous solution by TiO2/UV. Appl Catal B 58:211–216. doi:
10.1016/j.apcatb.2004.11.023
14. Khodja AA, Sehili T, Pilichowski JF, Boule P (2001) Photocat-
alytic degradation of 2-phenylphenol on TiO2 and ZnO in aque-
ous suspensions. J Photochem Photobiol A 141:231–239. doi:
10.1016/s1010-6030(01)00423-3
15. Vinodgopal K, Kamat PV (1995) Enhanced rates of photocata-
lytic degradation of an azo dye using SnO2/TiO2 coupled
semiconductor thin films. Environ Sci Technol 29:841–845. doi:
10.1021/es00003a037
16. Lizama C, Freer J, Baeza J, Mansilla HD (2002) Optimized
photodegradation of reactive blue 19 on TiO2 and ZnO suspen-
sions. Catal Today 76:235–246. doi:10.1016/s0920-5861(02)
00222-5
17. Akyol A, Yatmaz HC, Bayramoglu M (2004) Photocatalytic
degradation of remazol red RR in aqueous ZnO suspensions.
Appl Catal B 54:19–24
18. Sakthivel S, Neppolian B, Shankar BV, Arabindoo B, Palinich-
amy M, Murugesan V (2003) Solar photocatalytic degradation of
azo dye: comparison of photocatalytic efficiency of ZnO and
TiO2. Sol Energy Mater Sol Cells 77:65–82. doi:10.1016/s0927-
0248(02)00255-6
19. Carson FL (1997) Histology. A self-instructional text. ASCP
Press, Chicago
20. Culling CF, Allison RT, Barr WT (1985) Cellular pathology
techniques. Butterworths–Heinemenn, Oxford
21. Lynn G, Sansone EB (1994) Destruction of hazardous chemicals
in the laboratory. Wiley, New York
22. Sax NI (1992) Dangerous properties of industrial materials. Van
Nostrand Reinhold, New York
23. Pillai SC, Kelly JM, McCormack DE, O’Brine P, Raghavendra R
(2003) The effect of processing conditions on varistors prepared
from nanocrystalline ZnO. J Mater Chem 13:2586–2590. doi:
10.1039/b306280c
0 15 30 45 600.0
0.5
1.0
1.5
2.0ln
(C0/C
)
Time/min
R2= 0.9912
R2= 0.9823a
b
Fig. 9 Kinetic plots for degradation of Eosin Y on a ZnO and
b 1 at.% Ag–ZnO (Eosin Y) = 7.22 9 10-5 M, (Catalyst) = 1 g l-1
Effect of Silver Impregnation on Efficiency of ZnO 13
123
Author's personal copy
24. Seery MK, George R, Floris P, Pillai SC (2007) Silver impreg-
nated titanium dioxide nanomaterials for enhanced visible light
photocatalysis. J Photochem Photobiol A 189:258–263
25. Cimitan S, Albonetti S, Forni L, Peri F, Lazzari D (2009)
Solvothermal synthesis and properties control of doped ZnO
nanoparticles. J Colloid Interface Sci 329:73–80. doi:10.1016/j.
jcis.2008.09.060
26. Georgekutty R, Seery MK, Pillai SC (2008) A highly efficient
Ag–ZnO photocatalyst: synthesis, properties and mechanism.
J Phys Chem C 112:13563–13570. doi:10.1021/jp802729a
27. Daneshvar N, Salari D, Khataee AR (2003) Photocatalytic deg-
radation of azo dye acid red 14 in water on ZnO and an alter-
native catalyst to TiO2. J Photochem Photobiol A 157:111–116.
doi:10.1016/s1010-6030(03)00378-2
28. Galindo C, Jacques P, Calt A (2001) Photo oxidation of pheny-
lazonaphthol AO20 on TiO2: kinetic and mechanistic investiga-
tions. Chemosphere 45:997–1005
29. Subbarao KV, Lavendrine B, Boule P (2003) Influence of
metallic species on TiO2 for the photocatalytic degradation of
dyes and dye intermediates. J Photochem Photobiol A 154:
189–193
30. Hermann JM, Disdier J, Pichat P (1986) Photoassisted platinum
deposition on TiO2 powder using various platinum complexes.
J Phys Chem 90:6028–6034. doi:10.1021/j100280a114
31. Scalafani A, Hermann JM (1998) Influence of metallic silver and
of platinum–silver bimetallic deposits on the photocatalytic
activity of Titania (anatase and rutile) in organic and aqueous
media. J Photochem Photobiol A 113:181–188. doi:10.1016/
s1010-6030(97)00319-5
32. Sahoo C, Gupta AK, Anjali Pal (2005) Photocatalytic degradation
of methyl red dye in aqueous solutions under UV irradiation
using Ag? doped TiO2. Desalination 181:91–100. doi:10.1016/
i.desal.2005.02.014
33. Ozkan A, Ozkan MH, Gurkan R, Akcay M, Sokmen M (2004)
Photocatalytic degradation of textile azo dye, sirius gelb GC on
TiO2 or Ag-TiO2 particles in the absence and presence of UV
irradiation: the effect of some inorganic anions on the photoca-
talysis. J Photochem Photobiol A 163:29–35. doi:10.1016/s1010-
6030(03)00426-x
14 S. Siva Kumar et al.
123
Author's personal copy