Tailoring the surface functionalities of titania nanotube arrays
Upload
khangminh22Category
view
0download
0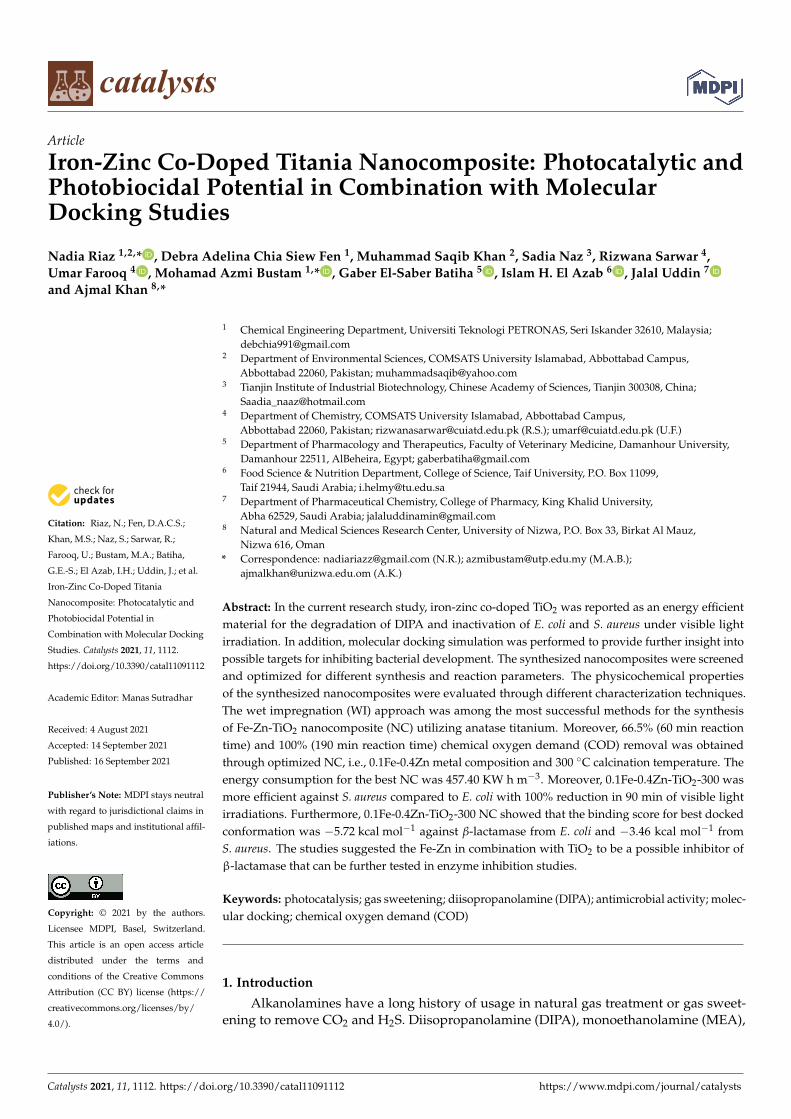
catalysts
Article
Iron-Zinc Co-Doped Titania Nanocomposite: Photocatalytic andPhotobiocidal Potential in Combination with MolecularDocking Studies
Nadia Riaz 1,2,* , Debra Adelina Chia Siew Fen 1, Muhammad Saqib Khan 2, Sadia Naz 3, Rizwana Sarwar 4,Umar Farooq 4 , Mohamad Azmi Bustam 1,* , Gaber El-Saber Batiha 5 , Islam H. El Azab 6 , Jalal Uddin 7
and Ajmal Khan 8,*
�����������������
Citation: Riaz, N.; Fen, D.A.C.S.;
Khan, M.S.; Naz, S.; Sarwar, R.;
Farooq, U.; Bustam, M.A.; Batiha,
G.E.-S.; El Azab, I.H.; Uddin, J.; et al.
Iron-Zinc Co-Doped Titania
Nanocomposite: Photocatalytic and
Photobiocidal Potential in
Combination with Molecular Docking
Studies. Catalysts 2021, 11, 1112.
https://doi.org/10.3390/catal11091112
Academic Editor: Manas Sutradhar
Received: 4 August 2021
Accepted: 14 September 2021
Published: 16 September 2021
Publisher’s Note: MDPI stays neutral
with regard to jurisdictional claims in
published maps and institutional affil-
iations.
Copyright: © 2021 by the authors.
Licensee MDPI, Basel, Switzerland.
This article is an open access article
distributed under the terms and
conditions of the Creative Commons
Attribution (CC BY) license (https://
creativecommons.org/licenses/by/
4.0/).
1 Chemical Engineering Department, Universiti Teknologi PETRONAS, Seri Iskander 32610, Malaysia;[email protected]
2 Department of Environmental Sciences, COMSATS University Islamabad, Abbottabad Campus,Abbottabad 22060, Pakistan; [email protected]
3 Tianjin Institute of Industrial Biotechnology, Chinese Academy of Sciences, Tianjin 300308, China;[email protected]
4 Department of Chemistry, COMSATS University Islamabad, Abbottabad Campus,Abbottabad 22060, Pakistan; [email protected] (R.S.); [email protected] (U.F.)
5 Department of Pharmacology and Therapeutics, Faculty of Veterinary Medicine, Damanhour University,Damanhour 22511, AlBeheira, Egypt; [email protected]
6 Food Science & Nutrition Department, College of Science, Taif University, P.O. Box 11099,Taif 21944, Saudi Arabia; [email protected]
7 Department of Pharmaceutical Chemistry, College of Pharmacy, King Khalid University,Abha 62529, Saudi Arabia; [email protected]
8 Natural and Medical Sciences Research Center, University of Nizwa, P.O. Box 33, Birkat Al Mauz,Nizwa 616, Oman
* Correspondence: [email protected] (N.R.); [email protected] (M.A.B.);[email protected] (A.K.)
Abstract: In the current research study, iron-zinc co-doped TiO2 was reported as an energy efficientmaterial for the degradation of DIPA and inactivation of E. coli and S. aureus under visible lightirradiation. In addition, molecular docking simulation was performed to provide further insight intopossible targets for inhibiting bacterial development. The synthesized nanocomposites were screenedand optimized for different synthesis and reaction parameters. The physicochemical propertiesof the synthesized nanocomposites were evaluated through different characterization techniques.The wet impregnation (WI) approach was among the most successful methods for the synthesisof Fe-Zn-TiO2 nanocomposite (NC) utilizing anatase titanium. Moreover, 66.5% (60 min reactiontime) and 100% (190 min reaction time) chemical oxygen demand (COD) removal was obtainedthrough optimized NC, i.e., 0.1Fe-0.4Zn metal composition and 300 ◦C calcination temperature. Theenergy consumption for the best NC was 457.40 KW h m−3. Moreover, 0.1Fe-0.4Zn-TiO2-300 wasmore efficient against S. aureus compared to E. coli with 100% reduction in 90 min of visible lightirradiations. Furthermore, 0.1Fe-0.4Zn-TiO2-300 NC showed that the binding score for best dockedconformation was −5.72 kcal mol−1 against β-lactamase from E. coli and −3.46 kcal mol−1 fromS. aureus. The studies suggested the Fe-Zn in combination with TiO2 to be a possible inhibitor ofβ-lactamase that can be further tested in enzyme inhibition studies.
Keywords: photocatalysis; gas sweetening; diisopropanolamine (DIPA); antimicrobial activity; molec-ular docking; chemical oxygen demand (COD)
1. Introduction
Alkanolamines have a long history of usage in natural gas treatment or gas sweet-ening to remove CO2 and H2S. Diisopropanolamine (DIPA), monoethanolamine (MEA),
Catalysts 2021, 11, 1112. https://doi.org/10.3390/catal11091112 https://www.mdpi.com/journal/catalysts
Catalysts 2021, 11, 1112 2 of 20
diethanolamine (DEA), and methyl diethanolamine (MDEA) are a few alkanolamines beingused for the removal of CO2 in the industry [1]. The application of different alkanolamineshas been reported in previous literature; for example, the Shell early gas treatment tech-nologies use DIPA (ADIP-D and ADIP-M), MDEA, and sulfinol-D to reduce CO2 [2].However, a problem arises when these chemicals are discharged unchecked into waterbodies, resulting in high COD. In terms of ecotoxicity and biodegradability, several spentamines showed toxicity, low biodegradability, and carcinogenic impacts [3–5]. A properand efficient management technology is required to reduce amine release due its toxicity.
In addition, researchers are prompted to develop new energy efficient methods andsynergistic materials in response to rising environmental contamination. Climate changeand water contamination caused by organic and biological pollution are among the mainenvironmental and public health threats, in addition to contamination caused by chemicalsin urbanization and industrialization [6]. Biological contamination has previously beenlisted as one of the top ten causes of death (1.4 million diarrhea-related deaths), with alarge proportion of children under the age of five (0.525 million) [7,8]. Water contaminatedwith E. coli is one of many biological and organic contaminants. E. coli is a serious publichealth threat that is spread to humans primarily through the ingestion of contaminatedwater or food [9].
The AOP is a synergistic process as it can degrade organic compounds while alsokilling microorganisms through the generation of nonselective OH radicals. TiO2, as aphotocatalyst, follows the AOP, and has been studied extensively in recent decades dueto its ability in eliminating toxic contaminants like alkanolamine and microorganismsin water [10–13]. Moreover, a higher sensitivity of Gram-positive bacteria towards thebactericidal effect of TiO2 nanoparticles has been reported as compared to Gram-negativebacteria in literature [14,15]. Textile wastewater is rich in organic entities, which can be usedby the microorganisms. These microorganisms cause serious health issues in humans whenthey enter the food chain. TiO2 NPs are reported to bind with the bacterial cell and damagethe cell wall, leading to cell release which eventually causes bacterial death [16,17]. Bacterialcell wall has complex multi-layer structure, namely inner layer, peptidoglycan layer, andouter membrane. TiO2 and doped-TiO2 nanoparticles involve either the formation ofreactive oxygen species (ROS) and free radicals or direct interaction with the cell surface.These ROS effectively transmit minerals and ions through cell membranes and lead celllysis [18]. Similarly, various proteins that are involved in biosynthetic cell wall pathwaysmay be an attractive target that could lead to bacterial death. β-lactamase is one of thoseproteins whose inhibition by NPs might lead to cell wall damage and bacterial cell death.Binding NPs into active β-lactamase pockets inhibits cell-wall synthesis [19]. Recently,various in silico and experimental studies demonstrated inhibition of various proteintargets by metal-doped transition metal NPs. Metal or nonmetal doping acts as phasestabilizers in TiO2; Hanaor et al. suggested that the anatase to rutile phase transformationis inhibited in a system with the dopants ranked F > Si > Fe > Al in order of anatasestabilization strength [20,21]. In addition, much focus is given on the bandgap narrowingand band engineering in recent years [22].
In this research work, Fe-Zn-TiO2 nanocomposites are reported for the degradationof DIPA and inactivation of biological contaminants. Moreover, energy efficiency wasachieved by shifting the absorption edge from UV to visible region. This research work shallnot only be significant for the degradation of organic pollutant (DIPA) from the wastewaterbut also for the inactivation of pathogens such as E. coli and S. aureus. In addition, thebacterial inactivation pathway was studied through molecular docking studies to gainmore insights into potential targets corresponding to the inactivation of bacteria.
Catalysts 2021, 11, 1112 3 of 20
2. Results and Discussion2.1. Synthesis Parameters Optimization2.1.1. Effect NC Synthesis Methods
The effects of different synthesis methods, including WI, co-precipitation (Co-P), andsol gel (SG) method, were evaluated for degradation of DIPA (percent COD removal)under visible light irradiation. Moreover, metal loading was 5% with variable Fe-Zn ratio(0, 0.1, 0.2, 0.3, 0.4, and 0.5) in each photocatalyst. However, the calcination temperature(300 ◦C) and pollutant concentration (300 mg L−1) were kept constant for each synthesizedphotocatalyst. The effect of these two variables were evaluated for best performing NCin the preceding section. Effect NC synthesis methods are depicted in Table 1. The NCsynthesized through the WI method showed better COD removal (66.5%) compared toCo–P (30.5%) and SG (21.8%) methods. In addition, 0.1Fe-0.4Zn-TiO2-300 synthesizedthrough the WI method was selected best among other ratios of Fe-Zn. Previous studiesreported that the higher zinc ratio in the NC leads to a large surface area which improvesthe photocatalytic activity [23].
Table 1. Effect of NC preparation methods with different Fe-Zn mass compositions.
Metal Composition Calcination (◦C)
% COD Removal
NC Preparation Methods
WI Co–P SG
0Fe-0.1Zn 300 21.70 20.60 18.960.1Fe-0.4Zn 300 66.50 30.49 21.840.2Fe-0.3Zn 300 21.57 18.54 18.960.3Fe-0.2Zn 300 20.60 21.70 21.700.4Fe-0.1Zn 300 22.80 22.66 22.120.5Fe-0Zn 300 24.73 28.43 27.20
2.1.2. Effect of Calcination Temperature
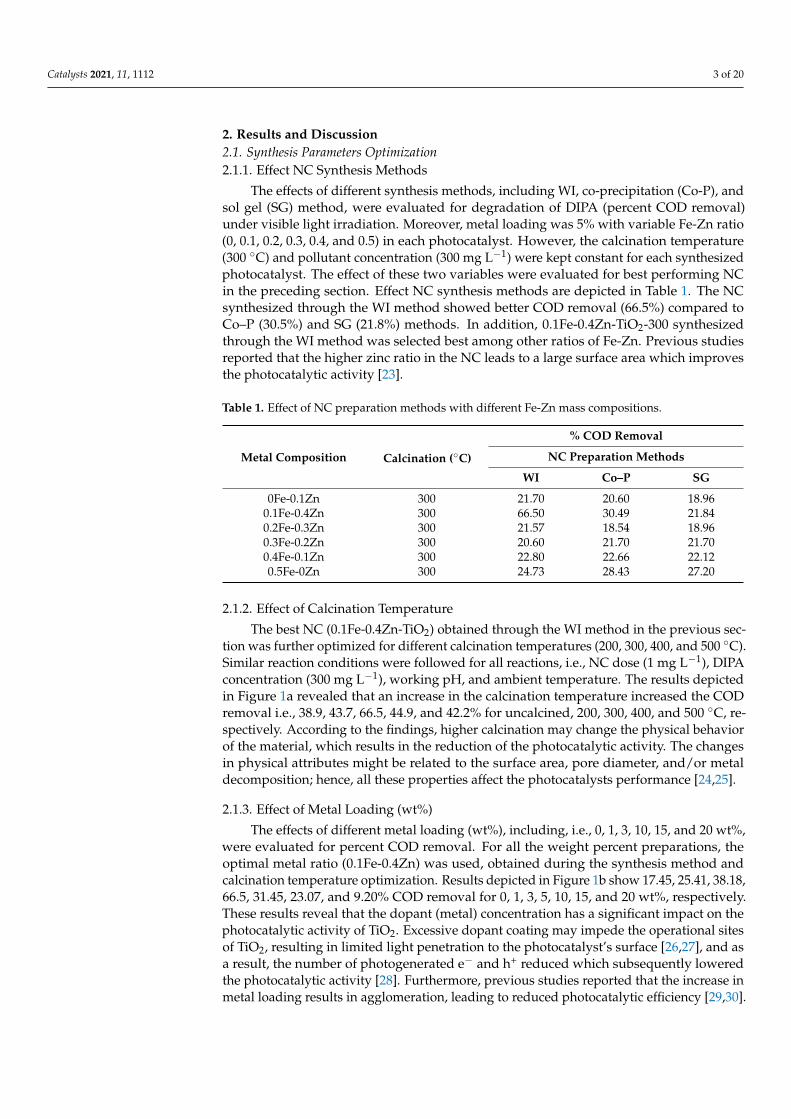
The best NC (0.1Fe-0.4Zn-TiO2) obtained through the WI method in the previous sec-tion was further optimized for different calcination temperatures (200, 300, 400, and 500 ◦C).Similar reaction conditions were followed for all reactions, i.e., NC dose (1 mg L−1), DIPAconcentration (300 mg L−1), working pH, and ambient temperature. The results depictedin Figure 1a revealed that an increase in the calcination temperature increased the CODremoval i.e., 38.9, 43.7, 66.5, 44.9, and 42.2% for uncalcined, 200, 300, 400, and 500 ◦C, re-spectively. According to the findings, higher calcination may change the physical behaviorof the material, which results in the reduction of the photocatalytic activity. The changesin physical attributes might be related to the surface area, pore diameter, and/or metaldecomposition; hence, all these properties affect the photocatalysts performance [24,25].
2.1.3. Effect of Metal Loading (wt%)
The effects of different metal loading (wt%), including, i.e., 0, 1, 3, 10, 15, and 20 wt%,were evaluated for percent COD removal. For all the weight percent preparations, theoptimal metal ratio (0.1Fe-0.4Zn) was used, obtained during the synthesis method andcalcination temperature optimization. Results depicted in Figure 1b show 17.45, 25.41, 38.18,66.5, 31.45, 23.07, and 9.20% COD removal for 0, 1, 3, 5, 10, 15, and 20 wt%, respectively.These results reveal that the dopant (metal) concentration has a significant impact on thephotocatalytic activity of TiO2. Excessive dopant coating may impede the operational sitesof TiO2, resulting in limited light penetration to the photocatalyst’s surface [26,27], and asa result, the number of photogenerated e− and h+ reduced which subsequently loweredthe photocatalytic activity [28]. Furthermore, previous studies reported that the increase inmetal loading results in agglomeration, leading to reduced photocatalytic efficiency [29,30].
Catalysts 2021, 11, 1112 4 of 20
2.1.4. Effect of Titania Phase
The effects of TiO2 phase i-e anatase (TA) and anatase-rutile mixture (TAR) wereevaluated for DIPA degradation (%COD removal) with the optimized synthesis method(WI), metal loading (5%), metal ratio (0.1Fe-0.4Zn), and calcination temperature (300 ◦C).Reaction studies were conducted with the same experimental condition reactions. i.e., NCdose (1 mg L−1), DIPA concentration (300 mg L−1), working pH, and ambient temperature.Results on the effect of TiO2 phase composition (anatase (TA), anatase and rutile (TAR))on % COD removal are presented in Figure 1c. Overall performance of TAR (mixture ofphases) was better compared to TA (single phase anatase); however, NC synthesized usinganatase phase (TA) and 5 wt% 0.1Fe-0.4Zn had significantly higher efficiency. Synthesisparameters optimization was concluded based on the best performing NC, i.e., 5 wt%metal loading for 0.1Fe-0.4Zn-TiO2-300 for the reaction optimization parameters. Ourresults are in agreement with previous studies, which showed that metals act as anatasestabilizers and cationic dopants like Fe and Cu are more stable in Ti substitutional latticepositions [20,21].
Catalysts 2021, 11, x FOR PEER REVIEW 4 of 21
that the increase in metal loading results in agglomeration, leading to reduced photocata‐
lytic efficiency [29,30].
2.1.4. Effect of Titania Phase
The effects of TiO2 phase i‐e anatase (TA) and anatase‐rutile mixture (TAR) were
evaluated for DIPA degradation (%COD removal) with the optimized synthesis method
(WI), metal loading (5%), metal ratio (0.1Fe‐0.4Zn), and calcination temperature (300 °C).
Reaction studies were conducted with the same experimental condition reactions. i.e., NC
dose (1 mg L−1), DIPA concentration (300 mg L−1), working pH, and ambient temperature.
Results on the effect of TiO2 phase composition (anatase (TA), anatase and rutile (TAR))
on % COD removal are presented in Figure 1c. Overall performance of TAR (mixture of
phases) was better compared to TA (single phase anatase); however, NC synthesized us‐
ing anatase phase (TA) and 5 wt% 0.1Fe‐0.4Zn had significantly higher efficiency. Synthe‐
sis parameters optimization was concluded based on the best performing NC, i.e., 5 wt%
metal loading for 0.1Fe‐0.4Zn‐TiO2‐300 for the reaction optimization parameters. Our re‐
sults are in agreement with previous studies, which showed that metals act as anatase
stabilizers and cationic dopants like Fe and Cu are more stable in Ti substitutional lattice
positions [20,21].
Figure 1. Effect of different parameters on NC synthesis (a) calcination temperature, (b) metal load‐
ing (wt%), and (c) TiO2 phase composition on % COD removal.
2.2. Reaction Parameters Optimization
The NC (0.1Fe‐0.4Zn‐TiO2‐300) optimized during synthesis optimization was further
evaluated for different reaction parameters such as NC dose, light intensity, initial DIPA
concentration, and irradiation duration to achieve the maximum efficiency against DIPA
degradation in terms of % COD removal.
2.2.1. Effect of NC Dose
Figure 2a shows that the gradual increment in NC dose led to higher % COD removal
of DIPA. The optimum NC dose was 1.0 g L−1 with 66.5% COD removal in 60 min; how‐
ever, further increase from 1.0 g L−1 decreased the % COD removal (20.6%). The increased
degradation ensued because of the higher number of available surface area that increased
photon absorption, which in turn resulted good photocatalytic behavior of the photocata‐
lyst. Nevertheless, increasing the NC amount (1.0 g L−1 to 5 g L−1 and above) might be
Figure 1. Effect of different parameters on NC synthesis (a) calcination temperature, (b) metal loading(wt%), and (c) TiO2 phase composition on % COD removal.
2.2. Reaction Parameters Optimization
The NC (0.1Fe-0.4Zn-TiO2-300) optimized during synthesis optimization was furtherevaluated for different reaction parameters such as NC dose, light intensity, initial DIPAconcentration, and irradiation duration to achieve the maximum efficiency against DIPAdegradation in terms of % COD removal.
2.2.1. Effect of NC Dose
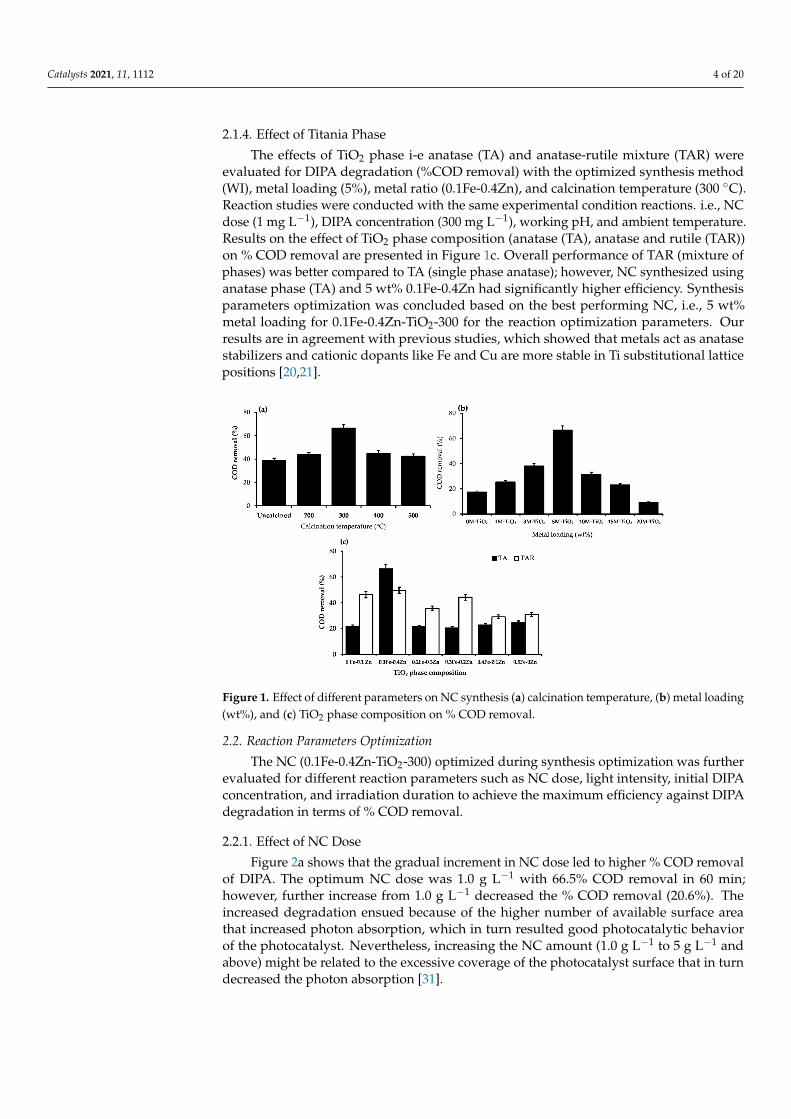
Figure 2a shows that the gradual increment in NC dose led to higher % COD removalof DIPA. The optimum NC dose was 1.0 g L−1 with 66.5% COD removal in 60 min;however, further increase from 1.0 g L−1 decreased the % COD removal (20.6%). Theincreased degradation ensued because of the higher number of available surface areathat increased photon absorption, which in turn resulted good photocatalytic behaviorof the photocatalyst. Nevertheless, increasing the NC amount (1.0 g L−1 to 5 g L−1 andabove) might be related to the excessive coverage of the photocatalyst surface that in turndecreased the photon absorption [31].
Catalysts 2021, 11, 1112 5 of 20
2.2.2. Effect of Light Intensity
Significant improvement in the photodegradation of DIPA (83.4%) was achieved withan increase in light intensity (300 and 500 W) as depicted in Figure 2b. Light intensity is oneof the important parameters in photocatalytic reactions as the light intensity influences theelectron transfer rate from valance band (VB) to conduction band (CB) and the formationrate of e−/h+ pair [32,33]. Previous studies with similar results reported that the reactionrate is directly associated with the light intensity; any increase or decrease in intensitydirectly influenced the reaction rate because of the generation of more photons, therebygenerating the e−/h+ pairs [33–36].
2.2.3. Effect of Irradiation Time
Other than light intensity, the exposure duration is among various significant param-eters responsible for better NC efficiency. Figure 2c shows photocatalytic degradationincreased with time; complete COD removal (100%) was achieved in 190 min. In addition,in control experiments, photolysis (without NC) and only NC (without light), marginalDIPA degradation was observed. It can be concluded that both the presence of an irradia-tion source and light intensity are crucial to better photocatalytic efficiency.
Catalysts 2021, 11, x FOR PEER REVIEW 5 of 21
related to the excessive coverage of the photocatalyst surface that in turn decreased the
photon absorption [31].
2.2.2. Effect of Light Intensity
Significant improvement in the photodegradation of DIPA (83.4%) was achieved
with an increase in light intensity (300 and 500 W) as depicted in Figure 2b. Light intensity
is one of the important parameters in photocatalytic reactions as the light intensity influ‐
ences the electron transfer rate from valance band (VB) to conduction band (CB) and the
formation rate of e−/h+ pair [32,33]. Previous studies with similar results reported that the
reaction rate is directly associated with the light intensity; any increase or decrease in in‐
tensity directly influenced the reaction rate because of the generation of more photons,
thereby generating the e−/h+ pairs [33–36].
2.2.3. Effect of Irradiation Time
Other than light intensity, the exposure duration is among various significant param‐
eters responsible for better NC efficiency. Figure 2c shows photocatalytic degradation in‐
creased with time; complete COD removal (100%) was achieved in 190 min. In addition,
in control experiments, photolysis (without NC) and only NC (without light), marginal
DIPA degradation was observed. It can be concluded that both the presence of an irradi‐
ation source and light intensity are crucial to better photocatalytic efficiency.
Figure 2. Effect of reaction parameters on COD removal (%) using 0.1Fe‐0.4Zn‐TiO2‐300, (a) NC
dose, (b) light intensity, (c) irradiation time, and (d) DIPA concentration.
2.3. Photodegradation Kinetics
The kinetics for the photodegradation of DIPA were studied using the optimized NC
(0.1Fe‐0.4Zn‐TiO2‐300) against different initial DIPA concentrations (10–500 mg L−1). The
reaction conditions were kept same for the experiments, including visible light irradiation
(300 W), 1.0 g L−1 NC dose, working pH, and ambient temperature (24 ± 2 °C). According
to the results depicted in Figures 2d and Figure S1 (supplementary materials) the COD
removal improved with time, but there was a declining trend when DIPA concentrations
Figure 2. Effect of reaction parameters on COD removal (%) using 0.1Fe-0.4Zn-TiO2-300, (a) NC dose,(b) light intensity, (c) irradiation time, and (d) DIPA concentration.
2.3. Photodegradation Kinetics
The kinetics for the photodegradation of DIPA were studied using the optimized NC(0.1Fe-0.4Zn-TiO2-300) against different initial DIPA concentrations (10–500 mg L−1). Thereaction conditions were kept same for the experiments, including visible light irradiation(300 W), 1.0 g L−1 NC dose, working pH, and ambient temperature (24 ± 2 ◦C). Accordingto the results depicted in Figure 2d and Figure S1 (supplementary materials) the CODremoval improved with time, but there was a declining trend when DIPA concentrationswere increased. In addition, a linear relationship was obtained by plotting ln (Co/Ct),therefore, photocatalytic degradation of DIPA followed the pseudo-first-order kinetics(Figure 3a). Kapp was obtained from the slope of linear regression.
Moreover, the Langmuir–Hinshelwood model [37] was used for quantitative evalua-tion of DIPA photodegradation using 0.1Fe-0.4Zn-TiO2-300 NC under visible light. TheL–H plot is depicted in Figure 3b. The KC and Kads were estimated from the plot of1/Kapp against [DIPA]o (inset Figure 3b), the value of KC and Kads were 7.3099 min−1 and3.5100 L mg−1, respectively, showing strong adsorption capacity. A stronger adsorptioncapacity is always the major factor contributing to the performance of photocatalyst [38].

Catalysts 2021, 11, 1112 6 of 20
Figure 3b depicts the relationship between the photocatalytic degradation rate of DIPA anddifferent initial concentrations of DIPA; the plot describes the fact that the photocatalyticdegradation rates increased with an increment in [DIPA]o. However, it became constantwith higher concentrations. Reports from previous studies have shown that the increasingquantity of adsorbed species (DIPA) on the photocatalyst surface could be a primary fac-tor for lower photodegradation rates with increased pollutant concentrations as reducednumber of photons would reach the NC surface [39,40].
Catalysts 2021, 11, x FOR PEER REVIEW 6 of 21
were increased. In addition, a linear relationship was obtained by plotting ln (Co/Ct), there‐
fore, photocatalytic degradation of DIPA followed the pseudo‐first‐order kinetics (Figure
3a). Kapp was obtained from the slope of linear regression.
Moreover, the Langmuir–Hinshelwood model [37] was used for quantitative evalu‐
ation of DIPA photodegradation using 0.1Fe‐0.4Zn‐TiO2‐300 NC under visible light. The
L–H plot is depicted in Figure 3b. The KC and Kads were estimated from the plot of 1/Kapp
against [DIPA]o (inset Figure 3b), the value of KC and Kads were 7.3099 min−1 and 3.5100 L
mg−1, respectively, showing strong adsorption capacity. A stronger adsorption capacity is
always the major factor contributing to the performance of photocatalyst [38]. Figure 3b
depicts the relationship between the photocatalytic degradation rate of DIPA and differ‐
ent initial concentrations of DIPA; the plot describes the fact that the photocatalytic deg‐
radation rates increased with an increment in [DIPA]o. However, it became constant with
higher concentrations. Reports from previous studies have shown that the increasing
quantity of adsorbed species (DIPA) on the photocatalyst surface could be a primary fac‐
tor for lower photodegradation rates with increased pollutant concentrations as reduced
number of photons would reach the NC surface [39,40].
Figure 3. Photocatalytic degradation of DIPA: (a) Pseudo‐first‐order reaction kinetics for DIPA over
Fe‐Zn/TiO2 NC; (b) rates of the photocatalytic degradation of DIPA as a function of initial DIPA
concentrations.
2.4. Photocatalytic Bactericidal Performance Evaluation
Figure 4a depicted the bactericidal performance of the control (without light), anatase
TiO2 (TA), 0.1Fe‐0.4Zn‐TiO2‐200, 0.1Fe‐0.4Zn‐TiO2‐300, and 0.1Fe‐0.4Zn‐TiO2‐400 against
selected pathogenic bacterial strains (E. coli and S. aureus). NC 0.1Fe‐0.4Zn‐TiO2‐300
showed 100% growth reduction against S. aureus compared to E. coli (81.0%) within 90
min of visible light irradiation. MRSA 252 responded more to the impact of 0.1Fe‐0.4Zn‐
TiO2‐200 (85%) and 0.1Fe‐0.4Zn‐TiO2‐400 (88%). In addition, the kill time required to com‐
pletely inactivate test bacterial strains was determined by measuring inactivation effi‐
ciency. Figure 4b represents the inactivation efficiency (kill time analysis) of 0.1Fe‐0.4Zn‐
TiO2‐300 against E. coli and S. aureus. After 180 min of kill time analysis, 100% growth
inhibition was observed against S. aureus, and 90.2% against E. coli.
Figure 3. Photocatalytic degradation of DIPA: (a) Pseudo-first-order reaction kinetics for DIPA over Fe-Zn/TiO2 NC; (b) rates of the photocatalytic degradation of DIPA as a function of initial DIPA concentrations.
2.4. Photocatalytic Bactericidal Performance Evaluation
Figure 4a depicted the bactericidal performance of the control (without light), anataseTiO2 (TA), 0.1Fe-0.4Zn-TiO2-200, 0.1Fe-0.4Zn-TiO2-300, and 0.1Fe-0.4Zn-TiO2-400 againstselected pathogenic bacterial strains (E. coli and S. aureus). NC 0.1Fe-0.4Zn-TiO2-300showed 100% growth reduction against S. aureus compared to E. coli (81.0%) within 90 minof visible light irradiation. MRSA 252 responded more to the impact of 0.1Fe-0.4Zn-TiO2-200 (85%) and 0.1Fe-0.4Zn-TiO2-400 (88%). In addition, the kill time required tocompletely inactivate test bacterial strains was determined by measuring inactivationefficiency. Figure 4b represents the inactivation efficiency (kill time analysis) of 0.1Fe-0.4Zn-TiO2-300 against E. coli and S. aureus. After 180 min of kill time analysis, 100% growthinhibition was observed against S. aureus, and 90.2% against E. coli.
Catalysts 2021, 11, x FOR PEER REVIEW 7 of 21
Figure 4. Photocatalytic bactericidal performance of control (C), TiO2 (T), 0.1Fe‐0.4Zn‐TiO2 NC calcined at 200, 300, and
400 °C against E. coli and S. aureus: (a) % reduction in 90 min, (b) inactivation efficiency (CFU) against S. aureus, and (c)
inactivation efficiency (CFU) against E. coli.
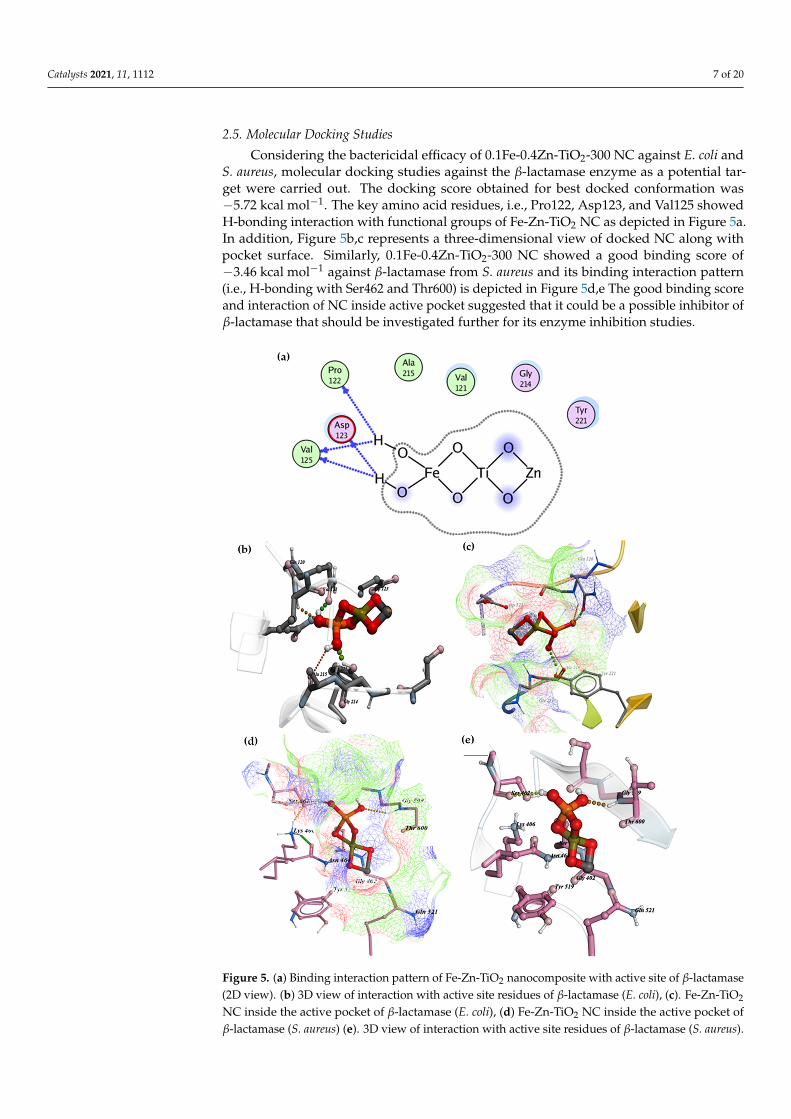
2.5. Molecular Docking Studies
Considering the bactericidal efficacy of 0.1Fe‐0.4Zn‐TiO2‐300 NC against E. coli and
S. aureus, molecular docking studies against the β‐lactamase enzyme as a potential target
were carried out. The docking score obtained for best docked conformation was −5.72 kcal
mol−1. The key amino acid residues, i.e., Pro122, Asp123, and Val125 showed H‐bonding
interaction with functional groups of Fe‐Zn‐TiO2 NC as depicted in Figure 5a. In addition,
Figure 5b,c represents a three‐dimensional view of docked NC along with pocket surface.
Similarly, 0.1Fe‐0.4Zn‐TiO2‐300 NC showed a good binding score of −3.46 kcal mol−1
against β‐lactamase from S. aureus and its binding interaction pattern (i.e., H‐bonding with
Ser462 and Thr600) is depicted in Figure 5d,e The good binding score and interaction of
NC inside active pocket suggested that it could be a possible inhibitor of β‐lactamase that
should be investigated further for its enzyme inhibition studies.
Figure 4. Photocatalytic bactericidal performance of control (C), TiO2 (T), 0.1Fe-0.4Zn-TiO2 NCcalcined at 200, 300, and 400 ◦C against E. coli and S. aureus: (a) % reduction in 90 min, (b) inactivationefficiency (CFU) against S. aureus, and (c) inactivation efficiency (CFU) against E. coli.
Catalysts 2021, 11, 1112 7 of 20
2.5. Molecular Docking Studies
Considering the bactericidal efficacy of 0.1Fe-0.4Zn-TiO2-300 NC against E. coli andS. aureus, molecular docking studies against the β-lactamase enzyme as a potential tar-get were carried out. The docking score obtained for best docked conformation was−5.72 kcal mol−1. The key amino acid residues, i.e., Pro122, Asp123, and Val125 showedH-bonding interaction with functional groups of Fe-Zn-TiO2 NC as depicted in Figure 5a.In addition, Figure 5b,c represents a three-dimensional view of docked NC along withpocket surface. Similarly, 0.1Fe-0.4Zn-TiO2-300 NC showed a good binding score of−3.46 kcal mol−1 against β-lactamase from S. aureus and its binding interaction pattern(i.e., H-bonding with Ser462 and Thr600) is depicted in Figure 5d,e The good binding scoreand interaction of NC inside active pocket suggested that it could be a possible inhibitor ofβ-lactamase that should be investigated further for its enzyme inhibition studies.
Catalysts 2021, 11, x FOR PEER REVIEW 8 of 21
Figure 5. (a) Binding interaction pattern of Fe‐Zn‐TiO2 nanocomposite with active site of β‐lactamase (2D view). (b) 3D
view of interaction with active site residues of β‐lactamase (E. coli), (c). Fe‐Zn‐TiO2 NC inside the active pocket of β‐lac‐
tamase (E. coli), (d) Fe‐Zn‐TiO2 NC inside the active pocket of β‐lactamase (S. aureus) (e). 3D view of interaction with active
site residues of β‐lactamase (S. aureus).
2.6. Energy Efficiency Analysis
The energy efficiency of the synthesized NCs was estimated using Equation (7). The
efficiency is reported in terms of electrical energy (KW h m−3) consumed for degradation
of 1000 L of DIPA. The results are depicted in Table 2. The best performing NC synthe‐
Figure 5. (a) Binding interaction pattern of Fe-Zn-TiO2 nanocomposite with active site of β-lactamase(2D view). (b) 3D view of interaction with active site residues of β-lactamase (E. coli), (c). Fe-Zn-TiO2
NC inside the active pocket of β-lactamase (E. coli), (d) Fe-Zn-TiO2 NC inside the active pocket ofβ-lactamase (S. aureus) (e). 3D view of interaction with active site residues of β-lactamase (S. aureus).

Catalysts 2021, 11, 1112 8 of 20
2.6. Energy Efficiency Analysis
The energy efficiency of the synthesized NCs was estimated using Equation (7). Theefficiency is reported in terms of electrical energy (KW h m−3) consumed for degradationof 1000 L of DIPA. The results are depicted in Table 2. The best performing NC synthesizedthrough WI method (0.1Fe-0.4Zn-TiO2-300) only consumed 457.40 KW h m−3 of electricalenergy, while energy consumption for 0.1Fe-0.4Zn-TiO2-300 NC synthesized through Co-Pwas 1374.52 KW h m−3 and 0.5Fe-0.0Zn-TiO2-300 synthesized through the SG method1575.18 KW h m−3.
Table 2. Energy efficiency of the synthesized photocatalysts through different methods forDIPA degradation.
NC Calcination (◦C)
Energy Efficiency of NC with Respect toSynthesis Method (KW h m−3)
WI Co-P SG
0.0Fe-0.1Zn-TiO2 300 2043.61 2167.06 2378.930.1Fe-0.4Zn-TiO2 300 457.40 1374.52 2029.050.2Fe-0.3Zn-TiO2 300 2058.36 2437.76 2378.930.3Fe-0.2Zn-TiO2 300 2167.06 2043.61 2043.610.4Fe-0.1Zn-TiO2 300 1932.00 1945.36 2000.470.5Fe-0.0Zn-TiO2 300 1760.40 1494.54 1575.18
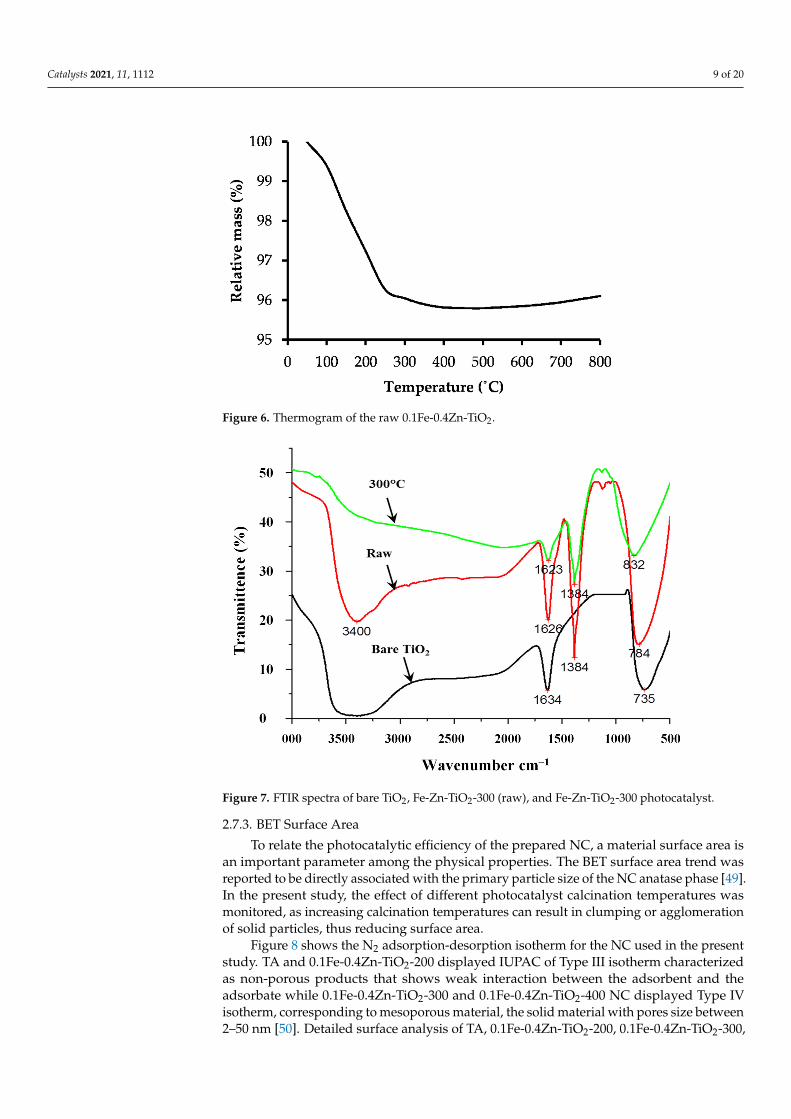
2.7. Physico-Chemical Characterization2.7.1. Thermal Stability
TGA was conducted to monitor the thermal stability and to estimate optimum cal-cination temperatures for the as-synthesized NC. The decomposition temperature of theas synthesized NC can be estimated using this TGA. Decomposition temperature is thetemperature at which the raw photocatalyst begins to decompose and the photocatalystachieves thermal stability. The weight loss profile of the doped titania sample preparedusing WI method (5 wt%-0.1Fe:0.4Zn-TiO2) is presented in Figure 6. The evaporationof physically adsorbed moisture can be seen as an abrupt, steeply decomposition with a3.898% weight loss step (50–250 ◦C), followed by a bit stable step from 250–800 ◦C repre-sents the decomposition of the Fe(NO3)2 and Zn(NO3)2, to form iron oxide and zinc oxides,respectively [30,41,42]. Total weight loss was 3.898%. Main decomposition steps proposedfor tested samples are as in Equations (1) and (2).
Fe(NO 3)2 → FeO(g)+O2(g) (1)
Zn(NO 3)2 → ZnO(s)+2NO2(g)+O2(g) (2)
2.7.2. Surface Functional Groups (FTIR)
Figure 7 shows the FTIR absorption spectra of TiO2 (TA), raw (uncalcined) and calcined0.1Fe-0.4Zn-TiO2-300 NC. Some of the identified, prominent peaks observed from thespectrums are tabulated in Table S1 (Supplementary material). The broad band around3400 cm−1 was attributed to O–H stretching, and the peak near 1623, 1626, and 1634 cm−1
to H–O–H bending and related to physically absorbed moisture [30,43]. The IR bandobserved from 400–900 cm−1 corresponds to the Ti–O stretching vibrations [44–46]. Almostsimilar peaks were observed in rest of the photocatalysts. The presence of the intense peakat 1384 cm−1 is associated with the nitrate (NO3
−) group usually identified when dopantmetal nitrate salts are used as precursors [47,48].
Catalysts 2021, 11, 1112 9 of 20
Catalysts 2021, 11, x FOR PEER REVIEW 9 of 21
sized through WI method (0.1Fe‐0.4Zn‐TiO₂‐300) only consumed 457.40 KW h m−3 of elec‐
trical energy, while energy consumption for 0.1Fe‐0.4Zn‐TiO₂‐300 NC synthesized
through Co‐P was 1374.52 KW h m−3 and 0.5Fe‐0.0Zn‐TiO₂‐300 synthesized through the
SG method 1575.18KW h m−3.
Table 2. Energy efficiency of the synthesized photocatalysts through different methods for DIPA
degradation.
NC Calcination
(°C)
Energy Efficiency of NC with Respect to Synthesis
Method (KW h m−3)
WI Co‐P SG
0.0Fe‐0.1Zn‐TiO₂ 300 2043.61 2167.06 2378.93
0.1Fe‐0.4Zn‐TiO₂ 300 457.40 1374.52 2029.05
0.2Fe‐0.3Zn‐TiO₂ 300 2058.36 2437.76 2378.93
0.3Fe‐0.2Zn‐TiO₂ 300 2167.06 2043.61 2043.61
0.4Fe‐0.1Zn‐TiO₂ 300 1932.00 1945.36 2000.47
0.5Fe‐0.0Zn‐TiO₂ 300 1760.40 1494.54 1575.18
2.7. Physico‐Chemical Characterization
2.7.1. Thermal Stability
TGA was conducted to monitor the thermal stability and to estimate optimum cal‐
cination temperatures for the as‐synthesized NC. The decomposition temperature of the
as synthesized NC can be estimated using this TGA. Decomposition temperature is the
temperature at which the raw photocatalyst begins to decompose and the photocatalyst
achieves thermal stability. The weight loss profile of the doped titania sample prepared
using WI method (5 wt%‐0.1Fe:0.4Zn‐TiO2) is presented in Figure 6. The evaporation of
physically adsorbed moisture can be seen as an abrupt, steeply decomposition with a
3.898% weight loss step (50–250 °C), followed by a bit stable step from 250–800 °C repre‐
sents the decomposition of the Fe(NO3)2 and Zn(NO3)2, to form iron oxide and zinc oxides,
respectively [30,41,42]. Total weight loss was 3.898%. Main decomposition steps proposed
for tested samples are as in Equations (1) and (2).
Fe(NO3)2→FeO(g)+ O2(g) (1)
Zn(NO3)2→ZnO(s)+2NO2(g)+ O2(g) (2)
Figure 6. Thermogram of the raw 0.1Fe‐0.4Zn‐TiO2. Figure 6. Thermogram of the raw 0.1Fe-0.4Zn-TiO2.
Catalysts 2021, 11, x FOR PEER REVIEW 10 of 21
2.7.2. Surface Functional Groups (FTIR)
Figure 7 shows the FTIR absorption spectra of TiO2 (TA), raw (uncalcined) and cal‐
cined 0.1Fe‐0.4Zn‐TiO2‐300 NC. Some of the identified, prominent peaks observed from
the spectrums are tabulated in Table S1 (Supplementary material). The broad band around
3400 cm−1 was attributed to O–H stretching, and the peak near 1623, 1626, and 1634 cm−1
to H–O–H bending and related to physically absorbed moisture [30,43]. The IR band ob‐
served from 400–900 cm−1corresponds to the Ti–O stretching vibrations [44–46]. Al‐
most similar peaks were observed in rest of the photocatalysts. The presence of the intense
peak at 1384 cm−1 is associated with the nitrate (NO3−) group usually identified when do‐
pant metal nitrate salts are used as precursors [47,48]
Figure 7. FTIR spectra of bare TiO2, Fe‐Zn‐TiO2‐300 (raw), and Fe‐Zn‐TiO2‐300 photocatalyst.
2.7.3. BET Surface Area
To relate the photocatalytic efficiency of the prepared NC, a material surface area is
an important parameter among the physical properties. The BET surface area trend was
reported to be directly associated with the primary particle size of the NC anatase phase
[49]. In the present study, the effect of different photocatalyst calcination temperatures
was monitored, as increasing calcination temperatures can result in clumping or agglom‐
eration of solid particles, thus reducing surface area.
Figure 8 shows the N2 adsorption‐desorption isotherm for the NC used in the present
study. TA and 0.1Fe‐0.4Zn‐TiO2‐200 displayed IUPAC of Type III isotherm characterized
as non‐porous products that shows weak interaction between the adsorbent and the ad‐
sorbate while 0.1Fe‐0.4Zn‐TiO2‐300 and 0.1Fe‐0.4Zn‐TiO2‐400 NC displayed Type IV iso‐
therm, corresponding to mesoporous material, the solid material with pores size between
2–50 nm [50]. Detailed surface analysis of TA, 0.1Fe‐0.4Zn‐TiO2‐200, 0.1Fe‐0.4Zn‐TiO2‐300,
and 0.1Fe‐0.4Zn‐TiO2‐400 are shown in Table 3. The BET surface area was 17.743 m2 g−1 for
TA. The slower crystallization at lower calcination temperatures (200 °C) led to smaller
surface area (7.42 m2 g−1); however, at the optimal calcination temperature (300 °C), max‐
imum surface area (55.99 m2 g−1) was attained. Nevertheless, increasing the calcination
temperature (400 °C) further reduced the surface area (8.37 m2 g−1). Previous research has
found that increasing the calcination temperature lowers the NC’s surface area [51,52].
Figure 7. FTIR spectra of bare TiO2, Fe-Zn-TiO2-300 (raw), and Fe-Zn-TiO2-300 photocatalyst.
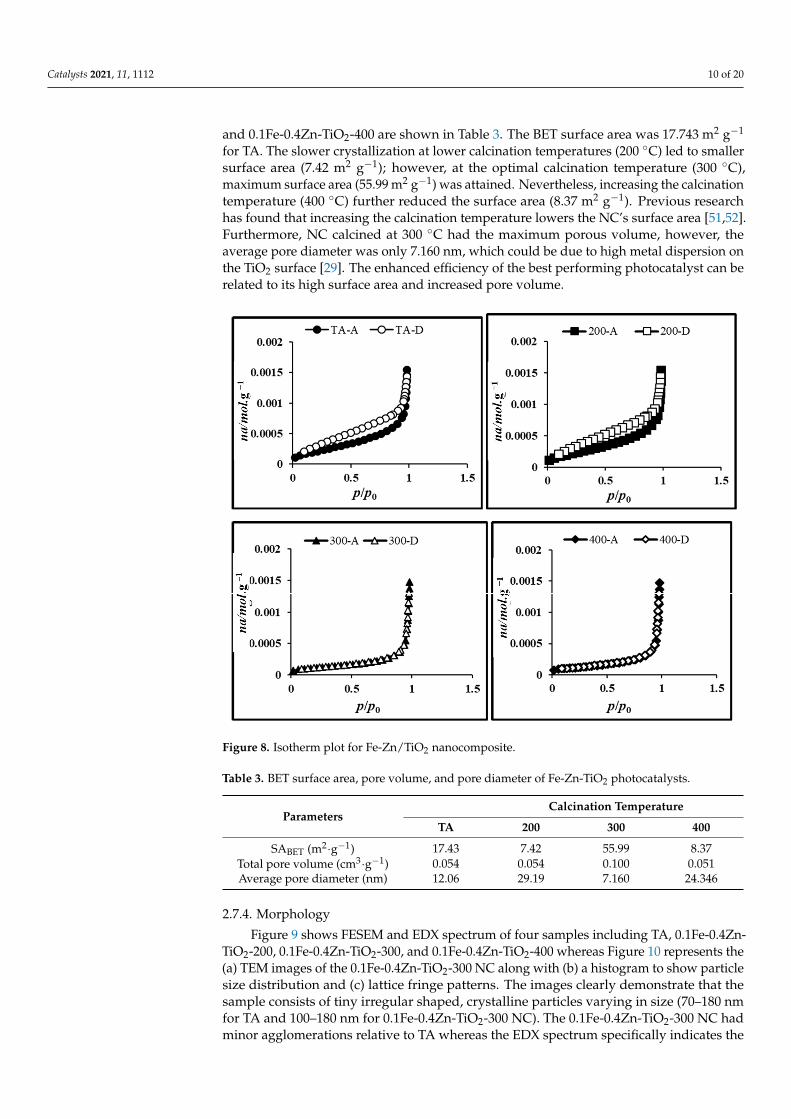
2.7.3. BET Surface Area
To relate the photocatalytic efficiency of the prepared NC, a material surface area isan important parameter among the physical properties. The BET surface area trend wasreported to be directly associated with the primary particle size of the NC anatase phase [49].In the present study, the effect of different photocatalyst calcination temperatures wasmonitored, as increasing calcination temperatures can result in clumping or agglomerationof solid particles, thus reducing surface area.
Figure 8 shows the N2 adsorption-desorption isotherm for the NC used in the presentstudy. TA and 0.1Fe-0.4Zn-TiO2-200 displayed IUPAC of Type III isotherm characterizedas non-porous products that shows weak interaction between the adsorbent and theadsorbate while 0.1Fe-0.4Zn-TiO2-300 and 0.1Fe-0.4Zn-TiO2-400 NC displayed Type IVisotherm, corresponding to mesoporous material, the solid material with pores size between2–50 nm [50]. Detailed surface analysis of TA, 0.1Fe-0.4Zn-TiO2-200, 0.1Fe-0.4Zn-TiO2-300,
Catalysts 2021, 11, 1112 10 of 20
and 0.1Fe-0.4Zn-TiO2-400 are shown in Table 3. The BET surface area was 17.743 m2 g−1
for TA. The slower crystallization at lower calcination temperatures (200 ◦C) led to smallersurface area (7.42 m2 g−1); however, at the optimal calcination temperature (300 ◦C),maximum surface area (55.99 m2 g−1) was attained. Nevertheless, increasing the calcinationtemperature (400 ◦C) further reduced the surface area (8.37 m2 g−1). Previous researchhas found that increasing the calcination temperature lowers the NC’s surface area [51,52].Furthermore, NC calcined at 300 ◦C had the maximum porous volume, however, theaverage pore diameter was only 7.160 nm, which could be due to high metal dispersion onthe TiO2 surface [29]. The enhanced efficiency of the best performing photocatalyst can berelated to its high surface area and increased pore volume.
Catalysts 2021, 11, x FOR PEER REVIEW 11 of 21
Furthermore, NC calcined at 300 °C had the maximum porous volume, however, the av‐
erage pore diameter was only 7.160 nm, which could be due to high metal dispersion on
the TiO2 surface [29]. The enhanced efficiency of the best performing photocatalyst can be
related to its high surface area and increased pore volume.
Figure 8. Isotherm plot for Fe‐Zn/TiO2 nanocomposite.
Table 3. BET surface area, pore volume, and pore diameter of Fe‐Zn‐TiO2 photocatalysts.
Parameters Calcination Temperature
TA 200 300 400
SABET (m2∙g−1) 17.43 7.42 55.99 8.37
Total pore volume (cm3∙g−1) 0.054 0.054 0.100 0.051
Average pore diameter (nm) 12.06 29.19 7.160 24.346
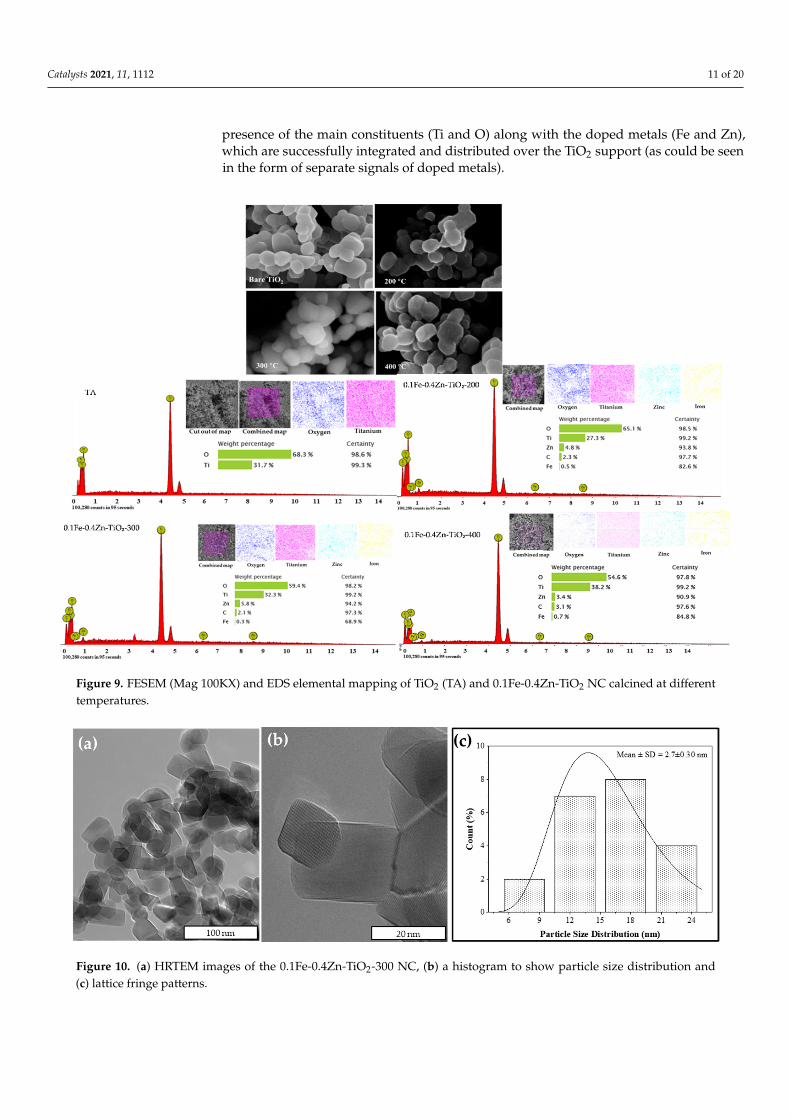
2.7.4. Morphology
Figure 9 shows FESEM and EDX spectrum of four samples including TA, 0.1Fe‐
0.4Zn‐TiO2‐200, 0.1Fe‐0.4Zn‐TiO2‐300, and 0.1Fe‐0.4Zn‐TiO2‐400 whereas Figure 10 repre‐
sents the (a) TEM images of the 0.1Fe‐0.4Zn‐TiO2‐300 NC along with (b) a histogram to
show particle size distribution and (c) lattice fringe patterns. The images clearly demon‐
strate that the sample consists of tiny irregular shaped, crystalline particles varying in size
(70–180 nm for TA and 100–180 nm for 0.1Fe‐0.4Zn‐TiO2‐300 NC). The 0.1Fe‐0.4Zn‐TiO2‐
300 NC had minor agglomerations relative to TA whereas the EDX spectrum specifically
indicates the presence of the main constituents (Ti and O) along with the doped metals
(Fe and Zn), which are successfully integrated and distributed over the TiO2 support (as
could be seen in the form of separate signals of doped metals).
Figure 8. Isotherm plot for Fe-Zn/TiO2 nanocomposite.
Table 3. BET surface area, pore volume, and pore diameter of Fe-Zn-TiO2 photocatalysts.
ParametersCalcination Temperature
TA 200 300 400
SABET (m2·g−1) 17.43 7.42 55.99 8.37Total pore volume (cm3·g−1) 0.054 0.054 0.100 0.051Average pore diameter (nm) 12.06 29.19 7.160 24.346
2.7.4. Morphology
Figure 9 shows FESEM and EDX spectrum of four samples including TA, 0.1Fe-0.4Zn-TiO2-200, 0.1Fe-0.4Zn-TiO2-300, and 0.1Fe-0.4Zn-TiO2-400 whereas Figure 10 represents the(a) TEM images of the 0.1Fe-0.4Zn-TiO2-300 NC along with (b) a histogram to show particlesize distribution and (c) lattice fringe patterns. The images clearly demonstrate that thesample consists of tiny irregular shaped, crystalline particles varying in size (70–180 nmfor TA and 100–180 nm for 0.1Fe-0.4Zn-TiO2-300 NC). The 0.1Fe-0.4Zn-TiO2-300 NC hadminor agglomerations relative to TA whereas the EDX spectrum specifically indicates the
Catalysts 2021, 11, 1112 11 of 20
presence of the main constituents (Ti and O) along with the doped metals (Fe and Zn),which are successfully integrated and distributed over the TiO2 support (as could be seenin the form of separate signals of doped metals).
Catalysts 2021, 11, x FOR PEER REVIEW 12 of 21
Figure 9. FESEM (Mag 100KX) and EDS elemental mapping of TiO2 (TA) and 0.1Fe‐0.4Zn‐TiO2 NC calcined at different
temperatures.
Figure 10. (a) HRTEM images of the 0.1Fe‐0.4Zn‐TiO2‐300 NC, (b) a histogram to show particle size distribution and (c)
lattice fringe patterns.
2.7.5. Phase and Crystal Structure
In Figure 11, the XRD patterns for the four samples (TA and 0.1Fe‐0.4Zn‐TiO2 of dif‐
ferent calcination temperature; 200, 300 and 400 °C) displays phases corresponding to an‐
atase phases, as expected, at 25.4°. All the samples calcined 300 °C and above showed two
main clear phases corresponding to anatase and rutile. The peaks at 2θ = 25.34° and 2θ =
27.46° corresponded to the main peak of anatase and rutile, respectively [30,53–55]. With
phase transition, none of the samples calcined at different temperatures were observed
due to lower calcination temperatures. As shown in previous studies, phase transition
Figure 9. FESEM (Mag 100KX) and EDS elemental mapping of TiO2 (TA) and 0.1Fe-0.4Zn-TiO2 NC calcined at differenttemperatures.
Catalysts 2021, 11, x FOR PEER REVIEW 12 of 21
Figure 9. FESEM (Mag 100KX) and EDS elemental mapping of TiO2 (TA) and 0.1Fe‐0.4Zn‐TiO2 NC calcined at different
temperatures.
Figure 10. (a) HRTEM images of the 0.1Fe‐0.4Zn‐TiO2‐300 NC, (b) a histogram to show particle size distribution and (c)
lattice fringe patterns.
2.7.5. Phase and Crystal Structure
In Figure 11, the XRD patterns for the four samples (TA and 0.1Fe‐0.4Zn‐TiO2 of dif‐
ferent calcination temperature; 200, 300 and 400 °C) displays phases corresponding to an‐
atase phases, as expected, at 25.4°. All the samples calcined 300 °C and above showed two
main clear phases corresponding to anatase and rutile. The peaks at 2θ = 25.34° and 2θ =
27.46° corresponded to the main peak of anatase and rutile, respectively [30,53–55]. With
phase transition, none of the samples calcined at different temperatures were observed
due to lower calcination temperatures. As shown in previous studies, phase transition
Figure 10. (a) HRTEM images of the 0.1Fe-0.4Zn-TiO2-300 NC, (b) a histogram to show particle size distribution and(c) lattice fringe patterns.
Catalysts 2021, 11, 1112 12 of 20
2.7.5. Phase and Crystal Structure
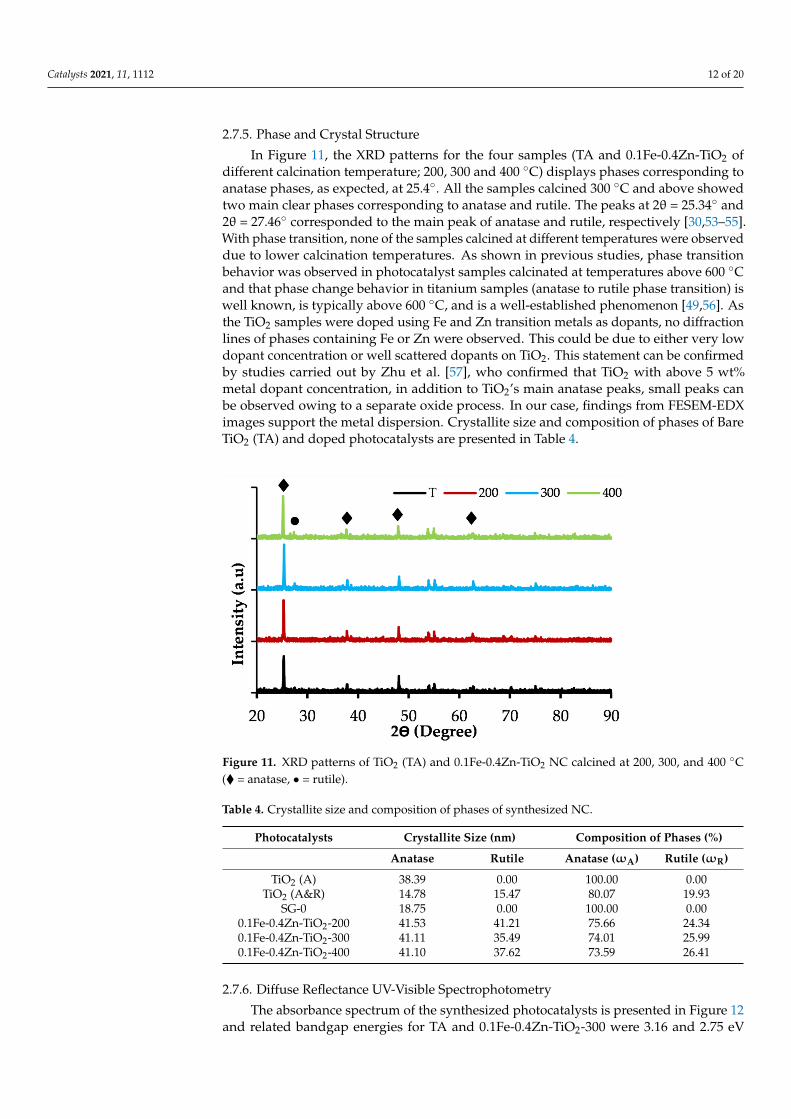
In Figure 11, the XRD patterns for the four samples (TA and 0.1Fe-0.4Zn-TiO2 ofdifferent calcination temperature; 200, 300 and 400 ◦C) displays phases corresponding toanatase phases, as expected, at 25.4◦. All the samples calcined 300 ◦C and above showedtwo main clear phases corresponding to anatase and rutile. The peaks at 2θ = 25.34◦ and2θ = 27.46◦ corresponded to the main peak of anatase and rutile, respectively [30,53–55].With phase transition, none of the samples calcined at different temperatures were observeddue to lower calcination temperatures. As shown in previous studies, phase transitionbehavior was observed in photocatalyst samples calcinated at temperatures above 600 ◦Cand that phase change behavior in titanium samples (anatase to rutile phase transition) iswell known, is typically above 600 ◦C, and is a well-established phenomenon [49,56]. Asthe TiO2 samples were doped using Fe and Zn transition metals as dopants, no diffractionlines of phases containing Fe or Zn were observed. This could be due to either very lowdopant concentration or well scattered dopants on TiO2. This statement can be confirmedby studies carried out by Zhu et al. [57], who confirmed that TiO2 with above 5 wt%metal dopant concentration, in addition to TiO2’s main anatase peaks, small peaks canbe observed owing to a separate oxide process. In our case, findings from FESEM-EDXimages support the metal dispersion. Crystallite size and composition of phases of BareTiO2 (TA) and doped photocatalysts are presented in Table 4.
Catalysts 2021, 11, x FOR PEER REVIEW 13 of 21
behavior was observed in photocatalyst samples calcinated at temperatures above 600 °C
and that phase change behavior in titanium samples (anatase to rutile phase transition) is
well known, is typically above 600 °C, and is a well‐established phenomenon [49,56]. As
the TiO2 samples were doped using Fe and Zn transition metals as dopants, no diffraction
lines of phases containing Fe or Zn were observed. This could be due to either very low
dopant concentration or well scattered dopants on TiO2. This statement can be confirmed
by studies carried out by Zhu et al. [57], who confirmed that TiO2 with above 5 wt% metal
dopant concentration, in addition to TiO2’s main anatase peaks, small peaks can be ob‐
served owing to a separate oxide process. In our case, findings from FESEM‐EDX images
support the metal dispersion. Crystallite size and composition of phases of Bare TiO2 (TA)
and doped photocatalysts are presented in Table 4.
Figure 11. XRD patterns of TiO2 (TA) and 0.1Fe‐0.4Zn‐TiO2 NC calcined at 200, 300, and 400 °C (♦ = anatase, ● = rutile).
Table 4. Crystallite size and composition of phases of synthesized NC.
Photocatalysts Crystallite Size (nm) Composition of Phases (%)
Anatase Rutile Anatase (ωA) Rutile (ωR)
TiO2 (A) 38.39 0.00 100.00 0.00
TiO2 (A&R) 14.78 15.47 80.07 19.93
SG‐0 18.75 0.00 100.00 0.00
0.1Fe‐0.4Zn‐TiO2‐200 41.53 41.21 75.66 24.34
0.1Fe‐0.4Zn‐TiO2‐300 41.11 35.49 74.01 25.99
0.1Fe‐0.4Zn‐TiO2‐400 41.10 37.62 73.59 26.41
2.7.6. Diffuse Reflectance UV‐Visible Spectrophotometry
The absorbance spectrum of the synthesized photocatalysts is presented in Figure 12
and related bandgap energies for TA and 0.1Fe‐0.4Zn‐TiO2‐300 were 3.16 and 2.75 eV (Fig‐
ure 12). The related good performance of the photocatalysts can be attributed to the re‐
duced bandgap, the increase of the surface oxygen vacancies (SOVs) could result in red
shift. In case of Zn as a dopant, as previously reported [58,59], ZnO could play the role of
a dopant in the composites, and the interfacial coupling effect between TiO2 and ZnO
might lead to the red shift. In our case, based on the photocatalytic performance, doping
Fe or Zn might have contributed to the formation of impurity energy level between the
CB and VB of the semiconductor TiO2 (used as substrate), that in turn contributed to ini‐
tiation of the visible region‐mediated photocatalytic reaction on the surface of the Fe‐
Figure 11. XRD patterns of TiO2 (TA) and 0.1Fe-0.4Zn-TiO2 NC calcined at 200, 300, and 400 ◦C(� = anatase, • = rutile).
Table 4. Crystallite size and composition of phases of synthesized NC.
Photocatalysts Crystallite Size (nm) Composition of Phases (%)
Anatase Rutile Anatase (ωA) Rutile (ωR)
TiO2 (A) 38.39 0.00 100.00 0.00TiO2 (A&R) 14.78 15.47 80.07 19.93
SG-0 18.75 0.00 100.00 0.000.1Fe-0.4Zn-TiO2-200 41.53 41.21 75.66 24.340.1Fe-0.4Zn-TiO2-300 41.11 35.49 74.01 25.990.1Fe-0.4Zn-TiO2-400 41.10 37.62 73.59 26.41
2.7.6. Diffuse Reflectance UV-Visible Spectrophotometry
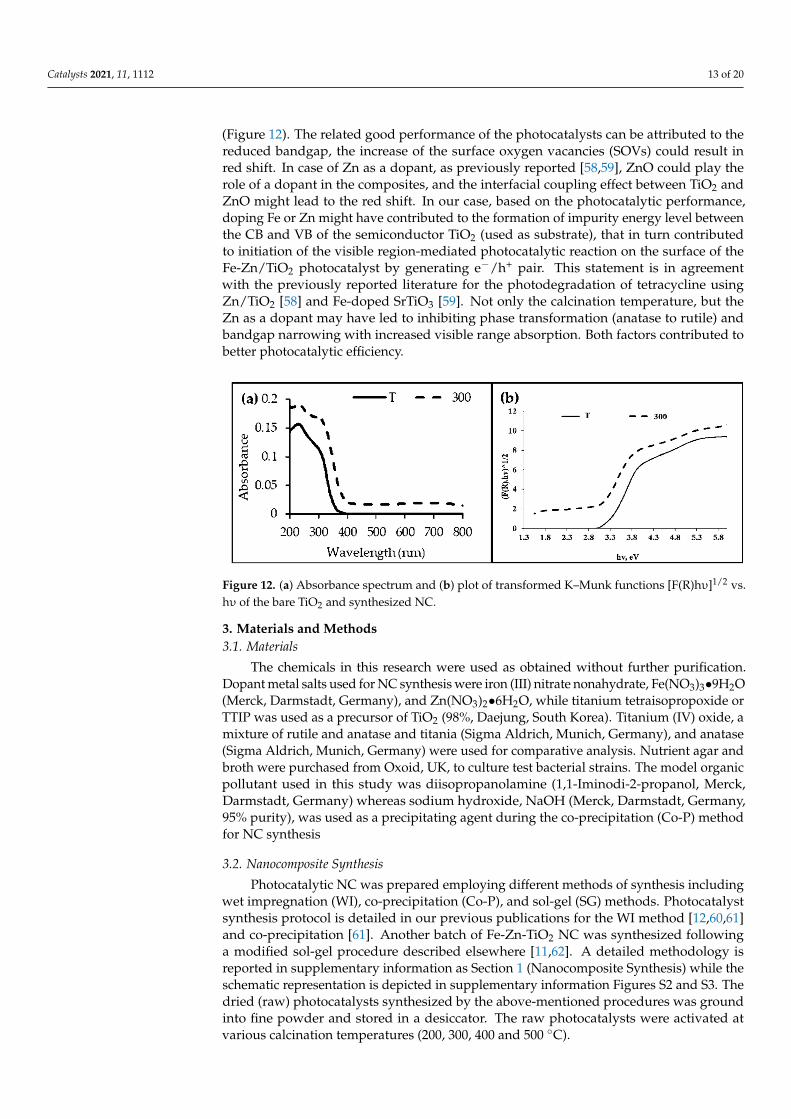
The absorbance spectrum of the synthesized photocatalysts is presented in Figure 12and related bandgap energies for TA and 0.1Fe-0.4Zn-TiO2-300 were 3.16 and 2.75 eV
Catalysts 2021, 11, 1112 13 of 20
(Figure 12). The related good performance of the photocatalysts can be attributed to thereduced bandgap, the increase of the surface oxygen vacancies (SOVs) could result inred shift. In case of Zn as a dopant, as previously reported [58,59], ZnO could play therole of a dopant in the composites, and the interfacial coupling effect between TiO2 andZnO might lead to the red shift. In our case, based on the photocatalytic performance,doping Fe or Zn might have contributed to the formation of impurity energy level betweenthe CB and VB of the semiconductor TiO2 (used as substrate), that in turn contributedto initiation of the visible region-mediated photocatalytic reaction on the surface of theFe-Zn/TiO2 photocatalyst by generating e−/h+ pair. This statement is in agreementwith the previously reported literature for the photodegradation of tetracycline usingZn/TiO2 [58] and Fe-doped SrTiO3 [59]. Not only the calcination temperature, but theZn as a dopant may have led to inhibiting phase transformation (anatase to rutile) andbandgap narrowing with increased visible range absorption. Both factors contributed tobetter photocatalytic efficiency.
Catalysts 2021, 11, x FOR PEER REVIEW 14 of 21
Zn/TiO2 photocatalyst by generating e−/h+ pair. This statement is in agreement with the
previously reported literature for the photodegradation of tetracycline using Zn/TiO2 [58]
and Fe‐doped SrTiO3 [59]. Not only the calcination temperature, but the Zn as a dopant
may have led to inhibiting phase transformation (anatase to rutile) and bandgap narrow‐
ing with increased visible range absorption. Both factors contributed to better photocata‐
lytic efficiency
Figure 12. (a) Absorbance spectrum and (b) plot of transformed K–Munk functions [F(R)hυ]1/2 vs.
hυ of the bare TiO2 and synthesized NC.
3. Materials and Methods
3.1. Materials
The chemicals in this research were used as obtained without further purification.
Dopant metal salts used for NC synthesis were iron (III) nitrate nonahydrate,
Fe(NO3)3•9H2O (Merck, Darmstadt, Germany), and Zn(NO3)2•6H2O, while titanium
tetraisopropoxide or TTIP was used as a precursor of TiO2 (98%, Daejung, South Korea).
Titanium (IV) oxide, a mixture of rutile and anatase and titania (Sigma Aldrich, Munich,
Germany), and anatase (Sigma Aldrich, Munich, Germany) were used for comparative
analysis. Nutrient agar and broth were purchased from Oxoid, UK, to culture test bacterial
strains. The model organic pollutant used in this study was diisopropanolamine (1,1‐Im‐
inodi‐2‐propanol, Merck, Darmstadt, Germany) whereas sodium hydroxide, NaOH
(Merck, Darmstadt, Germany, 95% purity), was used as a precipitating agent during the
co‐precipitation (Co‐P) method for NC synthesis
3.2. Nanocomposite Synthesis
Photocatalytic NC was prepared employing different methods of synthesis including
wet impregnation (WI), co‐precipitation (Co‐P), and sol‐gel (SG) methods. Photocatalyst
synthesis protocol is detailed in our previous publications for the WI method [12,60,61]
and co‐precipitation [61]. Another batch of Fe‐Zn‐TiO2 NC was synthesized following a
modified sol‐gel procedure described elsewhere [11,62]. A detailed methodology is re‐
ported in supplementary information as Section 1 (Nanocomposite Synthesis) while the
schematic representation is depicted in supplementary information Figures S2 and S3. The
dried (raw) photocatalysts synthesized by the above‐mentioned procedures was ground
into fine powder and stored in a desiccator. The raw photocatalysts were activated at var‐
ious calcination temperatures (200, 300, 400 and 500 °C).
3.3. Performance Evaluation of Fe‐Zn‐TiO2 Nanocomposite
3.3.1. Screening and Optimization Studies
To screen the best‐performing NC, the photocatalytic efficiency of all synthesized NC
in terms of mineralization (COD removal) was evaluated using DIPA (300 mg. L 1), as a
model pollutant under visible light irradiation. In addition, the pH and temperature were
maintained in the same conditions, i.e., working pH and room temperature (23 ± 2 °C) in
Figure 12. (a) Absorbance spectrum and (b) plot of transformed K–Munk functions [F(R)hυ]1/2 vs.hυ of the bare TiO2 and synthesized NC.
3. Materials and Methods3.1. Materials
The chemicals in this research were used as obtained without further purification.Dopant metal salts used for NC synthesis were iron (III) nitrate nonahydrate, Fe(NO3)3•9H2O(Merck, Darmstadt, Germany), and Zn(NO3)2•6H2O, while titanium tetraisopropoxide orTTIP was used as a precursor of TiO2 (98%, Daejung, South Korea). Titanium (IV) oxide, amixture of rutile and anatase and titania (Sigma Aldrich, Munich, Germany), and anatase(Sigma Aldrich, Munich, Germany) were used for comparative analysis. Nutrient agar andbroth were purchased from Oxoid, UK, to culture test bacterial strains. The model organicpollutant used in this study was diisopropanolamine (1,1-Iminodi-2-propanol, Merck,Darmstadt, Germany) whereas sodium hydroxide, NaOH (Merck, Darmstadt, Germany,95% purity), was used as a precipitating agent during the co-precipitation (Co-P) methodfor NC synthesis
3.2. Nanocomposite Synthesis
Photocatalytic NC was prepared employing different methods of synthesis includingwet impregnation (WI), co-precipitation (Co-P), and sol-gel (SG) methods. Photocatalystsynthesis protocol is detailed in our previous publications for the WI method [12,60,61]and co-precipitation [61]. Another batch of Fe-Zn-TiO2 NC was synthesized followinga modified sol-gel procedure described elsewhere [11,62]. A detailed methodology isreported in supplementary information as Section 1 (Nanocomposite Synthesis) while theschematic representation is depicted in supplementary information Figures S2 and S3. Thedried (raw) photocatalysts synthesized by the above-mentioned procedures was groundinto fine powder and stored in a desiccator. The raw photocatalysts were activated atvarious calcination temperatures (200, 300, 400 and 500 ◦C).
Catalysts 2021, 11, 1112 14 of 20
3.3. Performance Evaluation of Fe-Zn-TiO2 Nanocomposite3.3.1. Screening and Optimization Studies
To screen the best-performing NC, the photocatalytic efficiency of all synthesized NCin terms of mineralization (COD removal) was evaluated using DIPA (300 mg L−1), as amodel pollutant under visible light irradiation. In addition, the pH and temperature weremaintained in the same conditions, i.e., working pH and room temperature (23 ± 2 ◦C)in all reaction studies. The photoreactor comprised of the stirring plate placed inside acompartment with a halogen lamp (300 Watt) mounted above the photo-chamber. Sampleswere collected (at various intervals), centrifuged, and filtered twice, with Whatman filterpaper (GD/X 25 mm diameter, pore size 0.45-micron PTFE), to remove photocatalyst,followed by measuring chemical oxygen demand (COD, mg L−1) using Hach UV-Visspectrophotometer (DR 3900, Hach, Loveland, CO, USA). Percent COD was measuredthrough the following Equation (3),
COD Removal (%) =
(CODo −CODt
CODo
)× 100 (3)
Initial COD is represented as CODo and COD at time is CODt in mg L−1.
3.3.2. Kinetic Studies
The Langmuir–Hinshelwood (L–H) kinetic model was used to study the photocatalytickinetics for the degradation of DIPA. The model is given below, Equation (4).
r =dCdt
=kcKads
1 + Kads(4)
where r is the oxidation rate (mg L−1 min−1), C is the concentration of the reactant (mg L−1),t is the illumination time (min), Kc is the reaction rate constant (min−1), and Kads is theadsorption coefficient of the reactant (L mg−1).
3.3.3. Photocatalytic Bactericidal Studies
Antimicrobial activity was assessed to evaluate the efficacy of NC in terms of the min-imum time and dosage needed to effectively inhibit bacterial growth. The best performingphotocatalysts was further used for inactivation of biological contaminants. The pathogenicspecies used were Escherichia coli (ATCC 15224) and methicillin-resistant Staphylococcusaureus (MRSA 252) from Holy Family Hospital, Rawalpindi, Pakistan [63]. To ensuresterile conditions, glassware and growth media (nutrient broth and nutrient agar media)were autoclaved.
The modified protocol of Mathew et al. [64], described in our recent publication [10,65],was followed for the inactivation studies. In a typical method, the fresh broth culturesof test pathogens were prepared for photocatalytic activity and the mature test organismwas transferred to glass vessels, supplemented with NC. The sample solution with knownconcentration of bacterium (104 CFU.mL−1) and NC dose (1 mg.mL−1) was irradiated ina photoreactor, explained earlier, placed within the laminar flow hood to ensure sterileconditions and to avoid contamination. During the reaction, known quantities of aliquotswere collected and plated at regular intervals. Plates were incubated (at 37 ◦C) and findingswere recorded as CFU using colony counter. Control experiments were conducted forreference purposes without NC and light source. Kill time assessment was also conductedto check the influence of time for complete inhibition, following the similar protocol statedabove in nutrient broth culture (NB) proceeded by inoculation of known quantities oftested pathogens (S. aureus and E. coli). Inoculation was done on an agar plate by the platecount method. Plates were incubated and the findings were interpreted as the inactivationefficiency plots. Results were presented in terms of percent reduction before and afterphotocatalytic oxidation reaction (PCO) using the following Equation (5):
Catalysts 2021, 11, 1112 15 of 20
Percent reduction =
(Ao −At
Ao
)× 100 (5)
where Ao indicates the number of viable bacteria before PCO and At is the number ofviable bacteria after PCO. The inactivation efficiency [66] of the nanomaterials was shownby log unit reduction of MRSA 252/E. coli (Lr), Equation (6)
logunitreduction of bacteria (Lr) =At
Ao(6)
where At and Ao are initial concentration and concentration at a particular irradiation timeduring photocatalytic inactivation experiments, respectively.
3.4. Energy Efficiency Analysis of Synthesized NC
Energy efficiency plays an important role in the selection and cost of the NCs. En-ergy efficiency was estimated through electrical energy consumption (EE/O) to degrade1000 L of wastewater using synthesized NC. The following Equation (7) was used for thedetermination of EE/O of the NC [11,67].
EE/O =pt(1000)
(V)60In(
CoCf
) (7)
3.5. Molecular Docking Simulation Studies
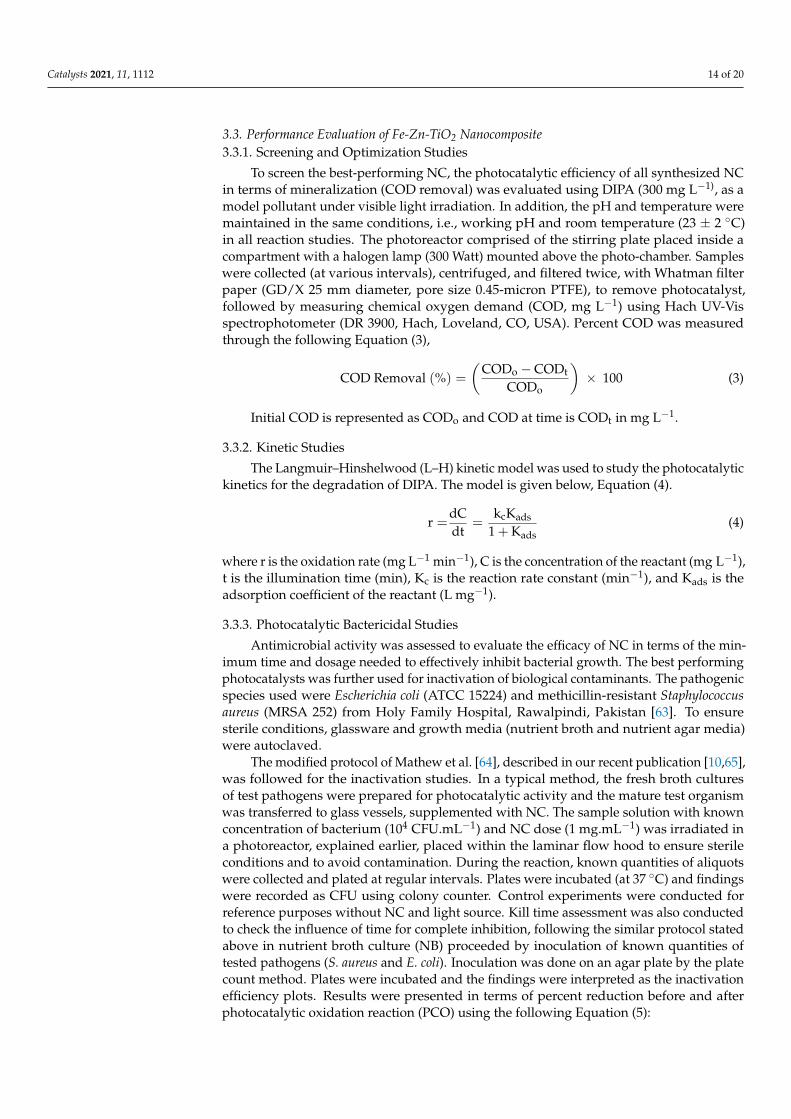
Molecular docking studies were conducted to gain more insight into potential tar-gets leading to the inhibition of bacterial growth [68]. Inhibitors of β-lactamase wereidentified as potent antibiotics [19]. Here, the interaction pattern of Fe-Zn-TiO2 NC withthe amino acid residue of the active pocket of β-lactamase from E. coli and S. aureus wasperformed. The 3D structure of the enzyme β-lactamase presented in Figure 13 was re-covered from the protein data bank (PDB ID: 4KZ3) and (PDB ID: 1MWU) resolution:1.67 Å) [69,70]. MOE (Molecular Operating Environment) software was used for dockingstudies [71]. The MMFF94x forcefield and gradient 0.05 were used for energy minimization.The possible binding site was specified around co-crystallized ligand, i.e., 5-chloro-3-sulfamoylthiophene-2-carboxylic acid of β-lactamase from E. coli.
Catalysts 2021, 11, x FOR PEER REVIEW 16 of 21
logunit reduction of bacteria Lr =At
A° (6)
where At and Ao are initial concentration and concentration at a particular irradiation time
during photocatalytic inactivation experiments, respectively.
3.4. Energy Efficiency Analysis of Synthesized NC
Energy efficiency plays an important role in the selection and cost of the NCs. Energy
efficiency was estimated through electrical energy consumption (EE/O) to degrade 1000 L
of wastewater using synthesized NC. The following Equation (7) was used for the deter‐
mination of EE/O of the NC [11,67].
E/O
o
f
pt(1000)E
C(V)60 ln
C
(7)
3.5. Molecular Docking Simulation Studies
Molecular docking studies were conducted to gain more insight into potential targets
leading to the inhibition of bacterial growth [68]. Inhibitors of β‐lactamase were identified
as potent antibiotics [19]. Here, the interaction pattern of Fe‐Zn‐TiO2 NC with the amino
acid residue of the active pocket of β‐lactamase from E. coli and S. aureus was performed.
The 3D structure of the enzyme β‐lactamase presented in Figure 13 was recovered from
the protein data bank (PDB ID: 4KZ3) and (PDB ID: 1MWU) resolution: 1.67 Å) [69,70].
MOE (Molecular Operating Environment) software was used for docking studies [71]. The
MMFF94x forcefield and gradient 0.05 were used for energy minimization. The possible
binding site was specified around co‐crystallized ligand, i.e., 5‐chloro‐3‐sulfamoylthio‐
phene‐2‐carboxylic acid of β‐lactamase from E. coli.
Figure 13. (a). 3D structure of β‐lactamase from E. coli (PDB ID: 4KZ3) and (b). S. aureus (PDB ID:
1MWU).
Polar hydrogens were added to prepare protein for docking while other default pa‐
rameters were used. Finally, the ten best docked conformations were produced to get best
binding pose and interaction of NC into active pocket. The 2‐dimensional interaction pat‐
tern of photocatalyst inside protein pocket were obtained using the ligand binding inter‐
action tool of MOE. The structure of Fe‐Zn‐TiO2 NC was built by modification of a previ‐
ously reported anatase structure of Titania TiO2 retrieved from PubChem as shown in
Figure 14a,b.
Figure 13. (a). 3D structure of β-lactamase from E. coli (PDB ID: 4KZ3) and (b). S. aureus (PDB ID:1MWU).
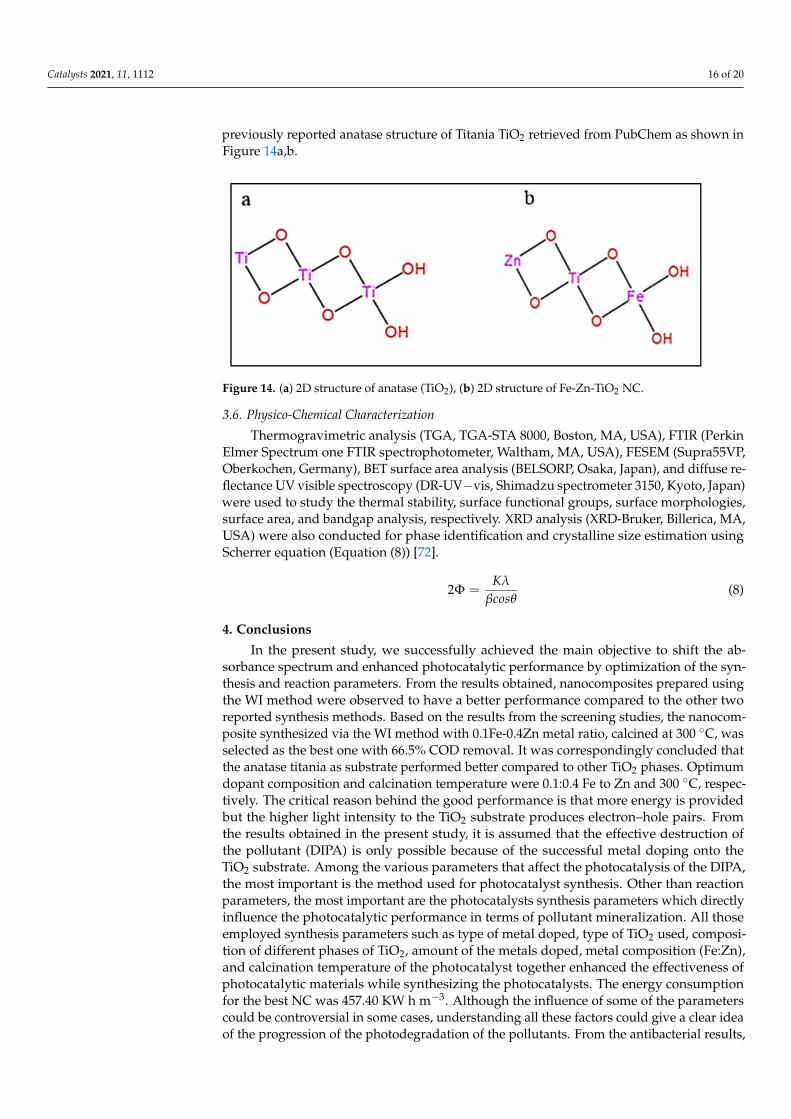
Polar hydrogens were added to prepare protein for docking while other defaultparameters were used. Finally, the ten best docked conformations were produced to getbest binding pose and interaction of NC into active pocket. The 2-dimensional interactionpattern of photocatalyst inside protein pocket were obtained using the ligand bindinginteraction tool of MOE. The structure of Fe-Zn-TiO2 NC was built by modification of a
Catalysts 2021, 11, 1112 16 of 20
previously reported anatase structure of Titania TiO2 retrieved from PubChem as shown inFigure 14a,b.
Catalysts 2021, 11, x FOR PEER REVIEW 17 of 21
Figure 14. (a) 2D structure of anatase (TiO2), (b) 2D structure of Fe‐Zn‐TiO2 NC.
3.6. Physico‐Chemical Characterization
Thermogravimetric analysis (TGA, TGA‐STA 8000, Boston, Massachusetts, United
States), FTIR (Perkin Elmer Spectrum one FTIR spectrophotometer, Waltham, MA, USA),
FESEM (Supra55VP, Oberkochen, Germany), BET surface area analysis (BELSORP,
Osaka, Japan), and diffuse reflectance UV visible spectroscopy (DR‐UV−vis, Shimadzu
spectrometer 3150, Kyoto, Japan) were used to study the thermal stability, surface func‐
tional groups, surface morphologies, surface area, and bandgap analysis, respectively.
XRD analysis (XRD‐Bruker, Billerica, MA, USA) were also conducted for phase identifi‐
cation and crystalline size estimation using Scherrer equation (Equation (8)) [72].
2
8 (8)
4. Conclusions
In the present study, we successfully achieved the main objective to shift the absorb‐
ance spectrum and enhanced photocatalytic performance by optimization of the synthesis
and reaction parameters. From the results obtained, nanocomposites prepared using the
WI method were observed to have a better performance compared to the other two re‐
ported synthesis methods. Based on the results from the screening studies, the nanocom‐
posite synthesized via the WI method with 0.1Fe‐0.4Zn metal ratio, calcined at 300 °C, was
selected as the best one with 66.5% COD removal. It was correspondingly concluded that
the anatase titania as substrate performed better compared to other TiO2 phases. Optimum
dopant composition and calcination temperature were 0.1:0.4 Fe to Zn and 300 °C, respec‐
tively. The critical reason behind the good performance is that more energy is provided
but the higher light intensity to the TiO2 substrate produces electron–hole pairs. From the
results obtained in the present study, it is assumed that the effective destruction of the
pollutant (DIPA) is only possible because of the successful metal doping onto the TiO2
substrate. Among the various parameters that affect the photocatalysis of the DIPA, the
most important is the method used for photocatalyst synthesis. Other than reaction pa‐
rameters, the most important are the photocatalysts synthesis parameters which directly
influence the photocatalytic performance in terms of pollutant mineralization. All those
employed synthesis parameters such as type of metal doped, type of TiO2 used, composi‐
tion of different phases of TiO2, amount of the metals doped, metal composition (Fe:Zn),
and calcination temperature of the photocatalyst together enhanced the effectiveness of
photocatalytic materials while synthesizing the photocatalysts. The energy consumption
for the best NC was 457.40 KW h m−3. Although the influence of some of the parameters
could be controversial in some cases, understanding all these factors could give a clear
idea of the progression of the photodegradation of the pollutants. From the antibacterial
results, it is obvious that increasing time results in an increase in % reduction of the bac‐
Figure 14. (a) 2D structure of anatase (TiO2), (b) 2D structure of Fe-Zn-TiO2 NC.
3.6. Physico-Chemical Characterization
Thermogravimetric analysis (TGA, TGA-STA 8000, Boston, MA, USA), FTIR (PerkinElmer Spectrum one FTIR spectrophotometer, Waltham, MA, USA), FESEM (Supra55VP,Oberkochen, Germany), BET surface area analysis (BELSORP, Osaka, Japan), and diffuse re-flectance UV visible spectroscopy (DR-UV−vis, Shimadzu spectrometer 3150, Kyoto, Japan)were used to study the thermal stability, surface functional groups, surface morphologies,surface area, and bandgap analysis, respectively. XRD analysis (XRD-Bruker, Billerica, MA,USA) were also conducted for phase identification and crystalline size estimation usingScherrer equation (Equation (8)) [72].
2Φ =Kλ
βcosθ(8)
4. Conclusions
In the present study, we successfully achieved the main objective to shift the ab-sorbance spectrum and enhanced photocatalytic performance by optimization of the syn-thesis and reaction parameters. From the results obtained, nanocomposites prepared usingthe WI method were observed to have a better performance compared to the other tworeported synthesis methods. Based on the results from the screening studies, the nanocom-posite synthesized via the WI method with 0.1Fe-0.4Zn metal ratio, calcined at 300 ◦C, wasselected as the best one with 66.5% COD removal. It was correspondingly concluded thatthe anatase titania as substrate performed better compared to other TiO2 phases. Optimumdopant composition and calcination temperature were 0.1:0.4 Fe to Zn and 300 ◦C, respec-tively. The critical reason behind the good performance is that more energy is providedbut the higher light intensity to the TiO2 substrate produces electron–hole pairs. Fromthe results obtained in the present study, it is assumed that the effective destruction ofthe pollutant (DIPA) is only possible because of the successful metal doping onto theTiO2 substrate. Among the various parameters that affect the photocatalysis of the DIPA,the most important is the method used for photocatalyst synthesis. Other than reactionparameters, the most important are the photocatalysts synthesis parameters which directlyinfluence the photocatalytic performance in terms of pollutant mineralization. All thoseemployed synthesis parameters such as type of metal doped, type of TiO2 used, composi-tion of different phases of TiO2, amount of the metals doped, metal composition (Fe:Zn),and calcination temperature of the photocatalyst together enhanced the effectiveness ofphotocatalytic materials while synthesizing the photocatalysts. The energy consumptionfor the best NC was 457.40 KW h m−3. Although the influence of some of the parameterscould be controversial in some cases, understanding all these factors could give a clear ideaof the progression of the photodegradation of the pollutants. From the antibacterial results,
Catalysts 2021, 11, 1112 17 of 20
it is obvious that increasing time results in an increase in % reduction of the bacterial cellcount (100% in 90 min of irradiation) due to the availability of maximum photons. Thegood binding score and interaction of nanocomposite inside active pocket suggested itto be a potential inhibitor of β-lactamase that can be further evaluated for its enzymeinhibition studies.
Supplementary Materials: The following are available online at https://www.mdpi.com/article/10.3390/catal11091112/s1, Figure S1. Effect of DIPA concentration versus corresponding irradiationtime on % COD removal, Table S1. Possible assignments of the FTIR peaks, Figure S2. Schematicrepresentation of the formation mechanism, and Figure S3. Instruments used for characterization ofthe photocatalysts.
Author Contributions: Conceptualization, N.R. and M.A.B.; methodology, D.A.C.S.F.; software, S.N.,R.S., and M.S.K.; validation, G.E.-S.B.; I.H.E.A., and U.F.; formal analysis, D.A.C.S.F. and M.S.K.;investigation, D.A.C.S.F.; resources, J.U. and A.K.; data curation, I.H.E.A. and U.F.; writing—originaldraft preparation, D.A.C.S.F., N.R., and M.S.K.; writing—review and editing, M.S.K. and N.R.;supervision, M.A.B., N.R., and A.K.; project administration, M.A.B.; funding acquisition, I.H.E.A.and M.A.B. All authors have read and agreed to the published version of the manuscript.
Funding: This work is part of YUTP project (0153AA-A36) funded by Universiti Teknologi PETRONAS,32610 Seri Iskander, Perak Darul Ridzuan, Malaysia. This work was funded by Taif University, Projectnumber (TURSP-2020/27), Taif, Saudi Arabia.
Acknowledgments: The authors extend their appreciation to Deanship of Scientific Research at TaifUniversity for funding this work through Researchers Supporting Project number (TURSP-2020/27),Taif University, Taif, Saudi Arabia.
Conflicts of Interest: The authors declare no conflict of interest.
References1. Aaron, D.; Tsouris, C. Separation of CO2 from Flue Gas: A Review. Sep. Sci. Technol. 2005, 40, 321–348. [CrossRef]2. Bradley, A.; Duan, H.; Elion, W.; van Soest-Vercammen, E.; Nagelvoort, R.K. Innovation in the LNG industry: Shell’s approach. In
Proceedings of the 24th World Gas Conference, Buenos Aires, Argentina, 5–9 October 2009.3. Poste, A.E.; Grung, M.; Wright, R.F. Amines and amine-related compounds in surface waters: A review of sources, concentrations
and aquatic toxicity. Sci. Total Environ. 2014, 481, 274–279. [CrossRef]4. Fakhru’l-Razi, A.; Pendashteh, A.; Abdullah, L.C.; Biak, D.R.A.; Madaeni, S.S.; Abidin, Z.Z. Review of technologies for oil and
gas produced water treatment. J. Hazard. Mater. 2009, 170, 530–551. [CrossRef] [PubMed]5. Eide-Haugmo, I.; Brakstad, O.G.; Hoff, K.A.; Sørheim, K.R.; da Silva, E.F.; Svendsen, H.F. Environmental impact of amines. Energy
Procedia 2009, 1, 1297–1304. [CrossRef]6. Haroon, H.; Shah, J.A.; Khan, M.S.; Alam, T.; Khan, R.; Asad, S.A.; Ali, M.A.; Farooq, G.; Iqbal, M.; Bilal, M. Activated carbon
from a specific plant precursor biomass for hazardous Cr(VI) adsorption and recovery studies in batch and column reactors:Isotherm and kinetic modeling. J. Water Process Eng. 2020, 38, 101577. [CrossRef]
7. World Health Organization. The Top 10 Causes of Death. 2018. Available online: https://www.who.int/news-room/fact-sheets/detail/the-top-10-causes-of-death (accessed on 3 September 2021).
8. World Health Organization. Diarrhoeal Disease. Available online: https://www.who.int/news-room/fact-sheets/detail/diarrhoeal-disease (accessed on 15 July 2021).
9. Troeger, C.; Forouzanfar, M.; Rao, P.C.; Khalil, I.; Brown, A.; Reiner Jr, R.C.; Fullman, N.; Thompson, R.L.; Abajobir, A.; Ahmed, M.Estimates of global, regional, and national morbidity, mortality, and aetiologies of diarrhoeal diseases: A systematic analysis forthe Global Burden of Disease Study 2015. Lancet Infect. Dis. 2017, 17, 909–948. [CrossRef]
10. Khan, M.S.; Shah, J.A.; Arshad, M.; Halim, S.A.; Khan, A.; Shaikh, A.J.; Riaz, N.; Khan, A.J.; Arfan, M.; Shahid, M. PhotocatalyticDecolorization and Biocidal Applications of Nonmetal Doped TiO2: Isotherm, Kinetic Modeling and In Silico Molecular DockingStudies. Molecules 2020, 25, 4468. [CrossRef]
11. Khan, M.S.; Shah, J.A.; Riaz, N.; Butt, T.A.; Khan, A.J.; Khalifa, W.; Gasmi, H.H.; Latifee, E.R.; Arshad, M.; Al-Naghi, A.A.A.;et al. Synthesis and Characterization of Fe-TiO2 Nanomaterial: Performance Evaluation for RB5 Decolorization and In VitroAntibacterial Studies. Nanomaterials 2021, 11, 436. [CrossRef]
12. Riaz, N.; Hassan, M.; Siddique, M.; Mahmood, Q.; Farooq, U.; Sarwar, R.; Khan, M.S. Photocatalytic degradation and kineticmodeling of azo dye using bimetallic photocatalysts: Effect of synthesis and operational parameters. Environ. Sci. Pollut. Res.2020, 27, 2992–3006. [CrossRef]
13. Riaz, N.; Kait, C.F.; Man, Z.; Dutta, B.K.; Ramli, R.M.; Khan, M.S. Visible Light Photodegradation of Azo Dye by Cu/TiO2. Adv.Mater. Res. 2014, 917, 151–159. [CrossRef]
Catalysts 2021, 11, 1112 18 of 20
14. Yoon, K.-Y.; Hoon Byeon, J.; Park, J.-H.; Hwang, J. Susceptibility constants of Escherichia coli and Bacillus subtilis to silver andcopper nanoparticles. Sci. Total Environ. 2007, 373, 572–575. [CrossRef]
15. Erdem, A.; Metzler, D.; Cha, D.; Huang, C.P. Inhibition of bacteria by photocatalytic nano-TiO2 particles in the absence of light.Int. J. Environ. Sci. Technol. 2015, 12, 2987–2996. [CrossRef]
16. Long, M.; Wang, J.; Zhuang, H.; Zhang, Y.; Wu, H.; Zhang, J. Performance and mechanism of standard nano-TiO2 (P-25) inphotocatalytic disinfection of foodborne microorganisms—Salmonella typhimurium and Listeria monocytogenes. Food Control 2014,39, 68–74. [CrossRef]
17. Foster, H.A.; Ditta, I.B.; Varghese, S.; Steele, A. Photocatalytic disinfection using titanium dioxide: Spectrum and mechanism ofantimicrobial activity. Appli. Microbiol. Biotechnol. 2011, 90, 1847–1868. [CrossRef] [PubMed]
18. Harper, J.C.; Christensen, P.A.; Egerton, T.A.; Curtis, T.P.; Gunlazuardi, J. Effect of catalyst type on the kinetics of the photoelectro-chemical disinfection of water inoculated with E. coli. J. Appl. Electrochem. 2001, 31, 623–628. [CrossRef]
19. Drawz, S.M.; Bonomo, R.A. Three Decades of β-Lactamase Inhibitors. Clin. Microbiol. Rev. 2010, 23, 160–201. [CrossRef] [PubMed]20. Hanaor, D.A.; Assadi, M.H.; Li, S.; Yu, A.; Sorrell, C.C. Ab initio study of phase stability in doped TiO2. Comput. Mech. 2012, 50,
185–194. [CrossRef]21. Assadi, M.H.N.; Hanaor, D.A.H. The effects of copper doping on photocatalytic activity at (101) planes of anatase TiO2: A
theoretical study. Appl. Surf. Sci. 2016, 387, 682–689. [CrossRef]22. Doustkhah, E.; Assadi, M.H.N.; Komaguchi, K.; Tsunoji, N.; Esmat, M.; Fukata, N.; Tomita, O.; Abe, R.; Ohtani, B.; Ide, Y. In situ
Blue titania via band shape engineering for exceptional solar H2 production in rutile TiO2. Appl. Catal. B Environ. 2021, 297,120380. [CrossRef]
23. Yodsomnuk, P.; Junjeam, K.; Termtanun, M. Photoactivity of Fe and Zn-doped TiO2 in phenol degradation under visible light.MATEC Web Conf. 2018, 192, 03047. [CrossRef]
24. Liu, W.-J.; Qian, T.-T.; Jiang, H. Bimetallic Fe nanoparticles: Recent advances in synthesis and application in catalytic eliminationof environmental pollutants. Chem. Eng. J. 2014, 236, 448–463. [CrossRef]
25. Saleh, R.; Djaja, N.F. UV light photocatalytic degradation of organic dyes with Fe-doped ZnO nanoparticles. SuperlatticesMicrostruct. 2014, 74, 217–233. [CrossRef]
26. Carp, O.; Huisman, C.L.; Reller, A. Photoinduced Reactivity of Titanium Dioxide. Prog. Solid State Chem. 2004, 32, 33–117.[CrossRef]
27. Coleman, H.M.; Chiang, K.; Amal, R. Effects of Ag and Pt on photocatalytic degradation of endocrine disrupting chemicals inwater. Chem. Eng. J. 2005, 113, 65–72. [CrossRef]
28. Behnajady, M.A.; Modirshahla, N.; Shokri, M.; Rad, B. Enhancement of photocatalytic activity of TiO2 nanoparticles by silverdoping: Photodeposition versus liquid impregnation methods. Glob. NEST J. 2008, 10, 1–7.
29. Nurlaela, E. Development of Cu-Ni/TiO2 Bimetallic Catalyst For Photohydrogen Production under Visible Light Illumination.Master’s Thesis, Universiti Teknologi PETRONAS, Tronoh, Bandar Seri Iskandar, Malaysia, 2011.
30. Yoong, L.S.; Chong, F.K.; Dutta, B.K. Development of copper-doped TiO2 photocatalyst for hydrogen production under visiblelight. Energy 2009, 34, 1652–1661. [CrossRef]
31. Ramli, R.M.; Chong, F.K.; Omar, A.A.; Murugesan, T. Performance of Surfactant Assisted Synthesis of Fe/TiO2 on the Photodegra-dation of Diisopropanolamine. CLEAN—Soil Air Water 2015, 43, 690–697. [CrossRef]
32. Blake, D.M.; Webb, J.; Turchi, C.; Magrini, K. Kinetic and mechanistic overview of TiO2-photocatalyzed oxidation reactions inaqueous solution. Solar Energy Mater. 1991, 24, 584–593. [CrossRef]
33. Li, Y.; Sun, S.; Ma, M.; Ouyang, Y.; Yan, W. Kinetic study and model of the photocatalytic degradation of rhodamine B (RhB) by aTiO2-coated activated carbon catalyst: Effects of initial RhB content, light intensity and TiO2 content in the catalyst. Chem. Eng. J.2008, 142, 147–155. [CrossRef]
34. Dominguez, S.; Ribao, P.; Rivero, M.J.; Ortiz, I. Influence of radiation and TiO2 concentration on the hydroxyl radicals generationin a photocatalytic LED reactor. Application to dodecylbenzenesulfonate degradation. Appl. Catal. B Environ. 2015, 178, 165–169.[CrossRef]
35. Giraldo-Aguirre, A.L.; Erazo-Erazo, E.D.; Flórez-Acosta, O.A.; Serna-Galvis, E.A.; Torres-Palma, R.A. TiO2 photocatalysis appliedto the degradation and antimicrobial activity removal of oxacillin: Evaluation of matrix components, experimental parameters,degradation pathways and identification of organics by-products. J. Photochem. Photobiol. A Chem. 2015, 311, 95–103. [CrossRef]
36. Lin, Y.-T.; Weng, C.-H.; Chen, F.-Y. Key operating parameters affecting photocatalytic activity of visible-light-induced C-dopedTiO2 catalyst for ethylene oxidation. Chem. Eng. J. 2014, 248, 175–183. [CrossRef]
37. Sun, Z.; Zheng, L.; Zheng, S.; Frost, R.L. Preparation and characterization of TiO2/acid leached serpentinite tailings compositesand their photocatalytic reduction of Chromium (VI). J. Colloid Interface Sci. 2013, 404, 102–109. [CrossRef] [PubMed]
38. Albrbar, A.J.; Bjelajac, A.; Ðokic, V.; Miladinovic, J.; Janackovic, Ð.; Petrovic, R. Photocatalytic efficiency of titania photocatalystsin saline waters. J. Serb. Chem. Soc. 2014, 79, 1127–1140. [CrossRef]
39. Hernández, R.; Olvera-Rodríguez, I.; Guzmán, C.; Medel, A.; Escobar-Alarcón, L.; Brillas, E.; Sirés, I.; Esquivel, K. Microwave-assisted sol-gel synthesis of an Au-TiO2 photoanode for the advanced oxidation of paracetamol as model pharmaceuticalpollutant. Electrochem. Commun. 2018, 96, 42–46. [CrossRef]
40. Kumar, K.V.; Porkodi, K.; Rocha, F. Langmuir–Hinshelwood kinetics—A theoretical study. Catal. Commun. 2008, 9, 82–84.[CrossRef]
Catalysts 2021, 11, 1112 19 of 20
41. Tanaka, H.; Sadamoto, T. The simultaneous determination of the kinetics and thermodynamics of Cu(OH)2 decomposition bymeans of TG and DSC. Thermochim. Acta 1982, 54, 273–280. [CrossRef]
42. Sun, J.; Jing, Y.; Jia, Y.; Tillard, M.; Belin, C. Mechanism of preparing ultrafine copper powder by polyol process. Mater. Lett. 2005,59, 3933–3936. [CrossRef]
43. Li, D.; Haneda, H.; Hishita, S.; Ohashi, N. Visible-light-driven nitrogen-doped TiO2 photocatalysts: Effect of nitrogen precursorson their photocatalysis for decomposition of gas-phase organic pollutants. Mater. Sci. Eng. B 2005, 117, 67–75. [CrossRef]
44. Yan, X.; He, J.; Evans, D.G.; Zhu, Y.; Duan, X. Preparation, Characterization and Photocatalytic Activity of TiO2 Formed from aMesoporous Precursor. J. Porous Mater. 2004, 11, 131–139. [CrossRef]
45. Linacero, R.; Aguado-Serrano, J.; Rojas-Cervantes, M. Preparation of mesoporous TiO2 by the sol-gel method assisted bysurfactants. J. Mater. Sci. 2006, 41, 2457–2464. [CrossRef]
46. Porkodi, K.; Arokiamary, S.D. Synthesis and spectroscopic characterization of nanostructured anatase titania: A photocatalyst.Mater. Charact. 2007, 58, 495–503. [CrossRef]
47. Mohan, J. Organic Spectroscopy Principles and Applications, 2nd ed.; Alpha Science International Ltd.: Harrow, UK, 2007.48. Li, J.L.; Inui, T. Characterization of precursors of methanol synthesis catalysts, copper/zinc/aluminum oxides, precipitated at
different pHs and temperatures. Appl. Catal. A Gen. 1996, 137, 105–117. [CrossRef]49. Caudillo-Flores, U.; Muñoz-Batista, M.J.; Kubacka, A.; Zárate-Medina, J.; Cortés, J.A.; Fernández-García, M. Measuring and
interpreting quantum efficiency of acid blue 9 photodegradation using TiO2-based catalysts. Appl. Catal. A Gen. 2018, 550, 38–47.[CrossRef]
50. Brunauer, S.; Deming, L.S.; Deming, W.E.; Teller, E. On a theory of the van der Waals adsorption of gases. J. Am. Chem. Soc. 1940,62, 1723–1732. [CrossRef]
51. Chen, Y.-F.; Lee, C.-Y.; Yeng, M.-Y.; Chiu, H.-T. The effect of calcination temperature on the crystallinity of TiO2 nanopowders. J.Cryst. Growth 2003, 247, 363–370. [CrossRef]
52. Jiang, F.; Zheng, S.; An, L.; Chen, H. Effect of calcination temperature on the adsorption and photocatalytic activity of hydrother-mally synthesized TiO2 nanotubes. Appl. Surface Sci. 2012, 258, 7188–7194. [CrossRef]
53. Bauer, A.; Lee, K.; Song, C.; Xie, Y.; Zhang, J.; Hui, R. Pt nanoparticles deposited on TiO2 based nanofibers: Electrochemicalstability and oxygen reduction activity. J. Power Sour. 2010, 195, 3105–3110. [CrossRef]
54. Xie, M.; Jing, L.; Zhou, J.; Lin, J.; Fu, H. Synthesis of nanocrystalline anatase TiO2 by one-pot two-phase separated hydrolysis-solvothermal processes and its high activity for photocatalytic degradation of rhodamine B. J. Hazard. Mater. 2010, 176, 139–145.[CrossRef]
55. Sreethawong, T.; Suzuki, Y.; Yoshikawa, S. Photocatalytic evolution of hydrogen over mesoporous TiO2 supported NiO photocat-alyst prepared by single-step sol-gel process with surfactant template. Int. J. Hydrogen Energy 2005, 30, 1053–1062. [CrossRef]
56. Fernández-García, M.; Wang, X.; Belver, C.; Hanson, J.C.; Rodriguez, J.A. Anatase-TiO2 nanomaterials: Morphological/sizedependence of the crystallization and phase behavior phenomena. J. Phys. Chem. C 2007, 111, 674–682. [CrossRef]
57. Zhu, H.; Wu, Y.; Zhao, X.; Wan, H.; Yang, L.; Hong, J.; Yu, Q.; Dong, L.; Chen, Y.; Jian, C.; et al. Influence of impregnation times onthe dispersion of CuO on anatase. J. Mol. Catal. A Chem. 2006, 243, 24–30. [CrossRef]
58. Pang, S.; Huang, J.G.; Su, Y.; Geng, B.; Lei, S.Y.; Huang, Y.T.; Lyu, C.; Liu, X.J. Synthesis and Modification of Zn-doped TiO2Nanoparticles for the Photocatalytic Degradation of Tetracycline. Photochem. Photobiol. 2016, 92, 651–657. [CrossRef]
59. Li, P.; Liu, C.; Wu, G.; Heng, Y.; Lin, S.; Ren, A.; Lv, K.; Xiao, L.; Shi, W. Solvothermal synthesis and visible light-drivenphotocatalytic degradation for tetracycline of Fe-doped SrTiO3. RSC Adv. 2014, 4, 47615–47624. [CrossRef]
60. Riaz, N.; Bustam, M.A.; Chong, F.K.; Man, Z.B.; Khan, M.S.; Shariff, A.M. Photocatalytic Degradation of DIPA Using BimetallicCu-Ni/TiO2 Photocatalyst under Visible Light Irradiation. Sci. World J. 2014, 2014, 8. [CrossRef]
61. Riaz, N.; Chong, F.K.; Man, Z.B.; Khan, M.S.; Dutta, B.K. Photodegradation of Orange II under Visible Light Using Cu–Ni/TiO2:Influence of Cu:Ni Mass Composition, Preparation, and Calcination Temperature. Ind. Eng. Chem. Res. 2013, 52, 4491–4503.[CrossRef]
62. Kobayakawa, K.; Sato, C.; Sato, Y.; Fujishima, A. Continuous-flow photoreactor packed with titanium dioxide immobilized onlarge silica gel beads to decompose oxalic acid in excess water. J. Photochem. Photobiol. A Chem. 1998, 118, 65–69. [CrossRef]
63. Mushtaq, S.; Khan, J.A.; Rabbani, F.; Latif, U.; Arfan, M.; Yameen, M.A. Biocompatible biodegradable polymeric antibacterialnanoparticles for enhancing the effects of a third-generation cephalosporin against resistant bacteria. J. Med. Microbiol. 2017, 66,318–327. [CrossRef]
64. Mathew, S.; Ganguly, P.; Rhatigan, S.; Kumaravel, V.; Byrne, C.; Hinder, S.; Bartlett, J.; Nolan, M.; Pillai, S. Cu-doped TiO2: Visiblelight assisted photocatalytic antimicrobial activity. Appl. Sci. 2018, 8, 2067. [CrossRef]
65. Iftikhar, A.; Khan, M.S.; Rashid, U.; Mahmood, Q.; Zafar, H.; Bilal, M.; Riaz, N. Influence of metallic species for efficientphotocatalytic water disinfection: Bactericidal mechanism of in vitro results using docking simulation. Environ. Sci. Pollut. Res.2020, 27, 39819–39831. [CrossRef]
66. Thakur, I.; Örmeci, B.; verma, A. Inactivation of E. coli in water employing Fe-TiO2 composite incorporating in-situ dual processof photocatalysis and photo-Fenton in fixed-mode. J. Water Process Eng. 2020, 33, 101085. [CrossRef]
67. Azbar, N.; Yonar, T.; Kestioglu, K. Comparison of various advanced oxidation processes and chemical treatment methods forCOD and color removal from a polyester and acetate fiber dyeing effluent. Chemosphere 2004, 55, 35–43. [CrossRef]

Catalysts 2021, 11, 1112 20 of 20
68. Gaber, A.; Refat, M.S.; Belal, A.A.M.; El-Deen, I.M.; Hassan, N.; Zakaria, R.; Alhomrani, M.; Alamri, A.S.; Alsanie, W.F.; Saied,M.E. New Mononuclear and Binuclear Cu(II), Co(II), Ni(II), and Zn(II) Thiosemicarbazone complexes with potential biologicalactivity: Antimicrobial and molecular docking study. Molecules 2021, 26, 2288. [CrossRef] [PubMed]
69. Barelier, S.; Eidam, O.; Fish, I.; Hollander, J.; Figaroa, F.; Nachane, R.; Irwin, J.J.; Shoichet, B.K.; Siegal, G. Increasing chemicalspace coverage by combining empirical and computational fragment screens. ACS Chem. Biol. 2014, 9, 1528–1535. [CrossRef][PubMed]
70. Lim, D.; Strynadka, N.C. Structural basis for the β lactam resistance of PBP2a from methicillin-resistant Staphylococcus aureus.Nat. Struct. Biol. 2002, 9, 870–876. [CrossRef] [PubMed]
71. Chemical Computing Group, M. Molecular Operating Environment; Chemical Computing Group: Montreal, QC, Canada, 2008.72. Scherrer, P. Determination of the size and internal structure of colloid particles by X-rays. Nachr. Ges. Wiss. Gött. 1918, 2, 98–100.
Copyright © 2022 FDOKUMEN