Synthesis of ZnO decorated graphene nanocomposite for enhanced photocatalytic properties
10
Synthesis of ZnO decorated graphene nanocomposite for enhanced photocatalytic properties S. Gayathri, P. Jayabal, M. Kottaisamy, and V. Ramakrishnan Citation: Journal of Applied Physics 115, 173504 (2014); doi: 10.1063/1.4874877 View online: http://dx.doi.org/10.1063/1.4874877 View Table of Contents: http://scitation.aip.org/content/aip/journal/jap/115/17?ver=pdfcov Published by the AIP Publishing Articles you may be interested in Electrodeposition of hierarchical ZnO/Cu2O nanorod films for highly efficient visible-light-driven photocatalytic applications J. Appl. Phys. 115, 064301 (2014); 10.1063/1.4863468 Photocatalytic and antibacterial properties of Au-TiO2 nanocomposite on monolayer graphene: From experiment to theory J. Appl. Phys. 114, 204701 (2013); 10.1063/1.4836875 Theoretical and experimental approach on dielectric properties of ZnO nanoparticles and polyurethane/ZnO nanocomposites J. Appl. Phys. 112, 054106 (2012); 10.1063/1.4749414 Visible light photocatalytic property of Zn doped V2O5 nanoparticles AIP Conf. Proc. 1447, 351 (2012); 10.1063/1.4710024 Ag/ZnO Nanocomposites Studied by X-ray Photoelectron Spectroscopy Surf. Sci. Spectra 18, 19 (2011); 10.1116/11.20110902 [This article is copyrighted as indicated in the article. Reuse of AIP content is subject to the terms at: http://scitation.aip.org/termsconditions. Downloaded to ] IP: 14.139.186.2 On: Fri, 02 May 2014 17:02:44
-
Upload
mkuniversity -
Category
Documents
-
view
0 -
download
0
Transcript of Synthesis of ZnO decorated graphene nanocomposite for enhanced photocatalytic properties

Synthesis of ZnO decorated graphene nanocomposite for enhanced photocatalyticpropertiesS. Gayathri, P. Jayabal, M. Kottaisamy, and V. Ramakrishnan
Citation: Journal of Applied Physics 115, 173504 (2014); doi: 10.1063/1.4874877 View online: http://dx.doi.org/10.1063/1.4874877 View Table of Contents: http://scitation.aip.org/content/aip/journal/jap/115/17?ver=pdfcov Published by the AIP Publishing Articles you may be interested in Electrodeposition of hierarchical ZnO/Cu2O nanorod films for highly efficient visible-light-driven photocatalyticapplications J. Appl. Phys. 115, 064301 (2014); 10.1063/1.4863468 Photocatalytic and antibacterial properties of Au-TiO2 nanocomposite on monolayer graphene: From experimentto theory J. Appl. Phys. 114, 204701 (2013); 10.1063/1.4836875 Theoretical and experimental approach on dielectric properties of ZnO nanoparticles and polyurethane/ZnOnanocomposites J. Appl. Phys. 112, 054106 (2012); 10.1063/1.4749414 Visible light photocatalytic property of Zn doped V2O5 nanoparticles AIP Conf. Proc. 1447, 351 (2012); 10.1063/1.4710024 Ag/ZnO Nanocomposites Studied by X-ray Photoelectron Spectroscopy Surf. Sci. Spectra 18, 19 (2011); 10.1116/11.20110902
[This article is copyrighted as indicated in the article. Reuse of AIP content is subject to the terms at: http://scitation.aip.org/termsconditions. Downloaded to ] IP:
14.139.186.2 On: Fri, 02 May 2014 17:02:44
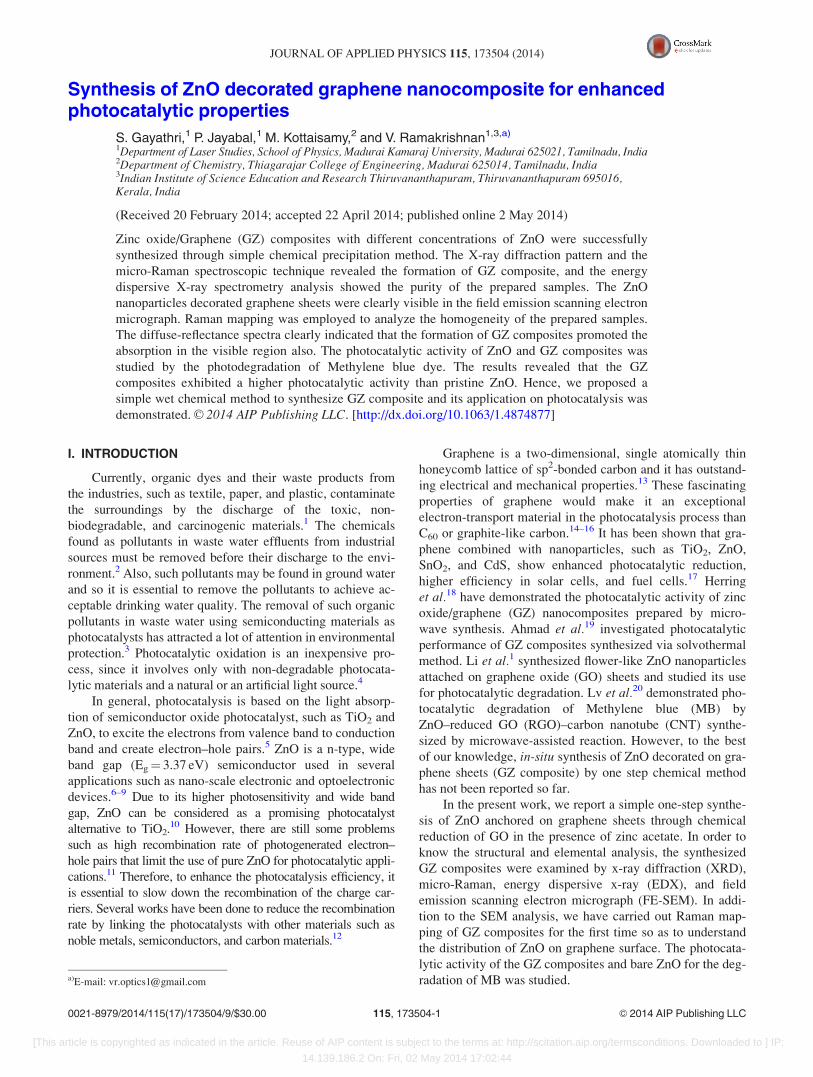
Synthesis of ZnO decorated graphene nanocomposite for enhancedphotocatalytic properties
S. Gayathri,1 P. Jayabal,1 M. Kottaisamy,2 and V. Ramakrishnan1,3,a)
1Department of Laser Studies, School of Physics, Madurai Kamaraj University, Madurai 625021, Tamilnadu, India2Department of Chemistry, Thiagarajar College of Engineering, Madurai 625014, Tamilnadu, India3Indian Institute of Science Education and Research Thiruvananthapuram, Thiruvananthapuram 695016,Kerala, India
(Received 20 February 2014; accepted 22 April 2014; published online 2 May 2014)
Zinc oxide/Graphene (GZ) composites with different concentrations of ZnO were successfully
synthesized through simple chemical precipitation method. The X-ray diffraction pattern and the
micro-Raman spectroscopic technique revealed the formation of GZ composite, and the energy
dispersive X-ray spectrometry analysis showed the purity of the prepared samples. The ZnO
nanoparticles decorated graphene sheets were clearly visible in the field emission scanning electron
micrograph. Raman mapping was employed to analyze the homogeneity of the prepared samples.
The diffuse-reflectance spectra clearly indicated that the formation of GZ composites promoted the
absorption in the visible region also. The photocatalytic activity of ZnO and GZ composites was
studied by the photodegradation of Methylene blue dye. The results revealed that the GZ
composites exhibited a higher photocatalytic activity than pristine ZnO. Hence, we proposed a
simple wet chemical method to synthesize GZ composite and its application on photocatalysis was
demonstrated. VC 2014 AIP Publishing LLC. [http://dx.doi.org/10.1063/1.4874877]
I. INTRODUCTION
Currently, organic dyes and their waste products from
the industries, such as textile, paper, and plastic, contaminate
the surroundings by the discharge of the toxic, non-
biodegradable, and carcinogenic materials.1 The chemicals
found as pollutants in waste water effluents from industrial
sources must be removed before their discharge to the envi-
ronment.2 Also, such pollutants may be found in ground water
and so it is essential to remove the pollutants to achieve ac-
ceptable drinking water quality. The removal of such organic
pollutants in waste water using semiconducting materials as
photocatalysts has attracted a lot of attention in environmental
protection.3 Photocatalytic oxidation is an inexpensive pro-
cess, since it involves only with non-degradable photocata-
lytic materials and a natural or an artificial light source.4
In general, photocatalysis is based on the light absorp-
tion of semiconductor oxide photocatalyst, such as TiO2 and
ZnO, to excite the electrons from valence band to conduction
band and create electron–hole pairs.5 ZnO is a n-type, wide
band gap (Eg¼ 3.37 eV) semiconductor used in several
applications such as nano-scale electronic and optoelectronic
devices.6–9 Due to its higher photosensitivity and wide band
gap, ZnO can be considered as a promising photocatalyst
alternative to TiO2.10 However, there are still some problems
such as high recombination rate of photogenerated electron–
hole pairs that limit the use of pure ZnO for photocatalytic appli-
cations.11 Therefore, to enhance the photocatalysis efficiency, it
is essential to slow down the recombination of the charge car-
riers. Several works have been done to reduce the recombination
rate by linking the photocatalysts with other materials such as
noble metals, semiconductors, and carbon materials.12
Graphene is a two-dimensional, single atomically thin
honeycomb lattice of sp2-bonded carbon and it has outstand-
ing electrical and mechanical properties.13 These fascinating
properties of graphene would make it an exceptional
electron-transport material in the photocatalysis process than
C60 or graphite-like carbon.14–16 It has been shown that gra-
phene combined with nanoparticles, such as TiO2, ZnO,
SnO2, and CdS, show enhanced photocatalytic reduction,
higher efficiency in solar cells, and fuel cells.17 Herring
et al.18 have demonstrated the photocatalytic activity of zinc
oxide/graphene (GZ) nanocomposites prepared by micro-
wave synthesis. Ahmad et al.19 investigated photocatalytic
performance of GZ composites synthesized via solvothermal
method. Li et al.1 synthesized flower-like ZnO nanoparticles
attached on graphene oxide (GO) sheets and studied its use
for photocatalytic degradation. Lv et al.20 demonstrated pho-
tocatalytic degradation of Methylene blue (MB) by
ZnO–reduced GO (RGO)–carbon nanotube (CNT) synthe-
sized by microwave-assisted reaction. However, to the best
of our knowledge, in-situ synthesis of ZnO decorated on gra-
phene sheets (GZ composite) by one step chemical method
has not been reported so far.
In the present work, we report a simple one-step synthe-
sis of ZnO anchored on graphene sheets through chemical
reduction of GO in the presence of zinc acetate. In order to
know the structural and elemental analysis, the synthesized
GZ composites were examined by x-ray diffraction (XRD),
micro-Raman, energy dispersive x-ray (EDX), and field
emission scanning electron micrograph (FE-SEM). In addi-
tion to the SEM analysis, we have carried out Raman map-
ping of GZ composites for the first time so as to understand
the distribution of ZnO on graphene surface. The photocata-
lytic activity of the GZ composites and bare ZnO for the deg-
radation of MB was studied.a)E-mail: [email protected]
0021-8979/2014/115(17)/173504/9/$30.00 VC 2014 AIP Publishing LLC115, 173504-1
JOURNAL OF APPLIED PHYSICS 115, 173504 (2014)
[This article is copyrighted as indicated in the article. Reuse of AIP content is subject to the terms at: http://scitation.aip.org/termsconditions. Downloaded to ] IP:
14.139.186.2 On: Fri, 02 May 2014 17:02:44
II. EXPERIMENTAL
A. Materials
Graphite powder was purchased from Alfa Aesar. 37%
hydrochloric acid (HCl), 98% sulfuric acid (H2SO4), hydro-
gen peroxide (H2O2), potassium permanganate (KMnO4),
zinc acetate dihydrate (Zn(CH3COO)2�2H2O), and hydrazine
hydrate (N2H4) were purchased from Merck. All chemicals
were used as received without further purification. Deionized
water was used throughout this study.
B. Synthesis of ZnO nanoparticles
The ZnO nanoparticles were synthesized by dissolving
0.2M zinc acetate dihydrate in water. Then, the solution was
stirred for 3 h at room temperature to get transparent solu-
tion. Appropriate amount of hydrazine hydrate was added to
the above solution and stirred for another 3 h at 80 �C. The
resulting precipitate was centrifuged and washed with water
several times and dried. Finally, the powder was annealed at
450 �C for 4 h.
C. Synthesis of graphene oxide
The graphite oxide was synthesized by modified
Hummer’s method.21 Briefly, 1 g of graphite powder was
added to 80 ml of H2SO4 and stirred in an ice bath. After
30 min, 6 g of KMnO4 was slowly added to the above solu-
tion and stirred. Then, the ice bath was replaced by a water
bath (30–35 �C) and the solution was stirred overnight.
100 ml of water was slowly added and stirred for 30 min. A
mixture of H2O2 (5 ml) and water (100 ml) was slowly added
to the above solution and stirred for 10 min. The solution
gradually turns to yellow color from dark brown. The solu-
tion was then filtered to get the precipitate. The filtered yel-
low cake (graphite oxide) was initially washed (3–4 times)
using HCl and then washed several times in H2O until the
neutral pH is reached. The synthesized graphite oxide was
then dispersed in water and sonicated for 4 h to get GO.
D. Synthesis of GZ composite
In the typical synthesis, dried GO powder was dispersed
in 90 ml of water (10 mg/ml) and sonicated for 30 min to
obtain GO suspension. Subsequently, 300 mg of zinc acetate
was added to the GO suspension and stirred for 3 h. Then,
30 ll of N2H4 was added and the resulting mixture was
stirred for another 3 h at 80 �C. The solution turned to black
from brown color indicating the reduction of GO to gra-
phene. The precipitate was then centrifuged (3000 rpm) for
30 min and washed several times using water and alcohol.
Later, the obtained powder was dried at 100 �C in a water
bath for 2 h and the dried powder was annealed at 450 �Cfor 4 h. The final powder is designated as GZ-1. In order to
optimize the graphene and ZnO composition to get better
photocatalytic efficiency, the process was repeated with
varying mass of zinc acetate, viz., 600 mg and 900 mg and
the final products were designated as GZ-2 and GZ-3,
respectively.
E. Characterization
Powder XRD of the synthesized samples was recorded
by PANalytical X-ray diffractometer with CuKa radiation
(k¼ 1.54 A). The structural morphology of the samples was
observed using a field emission scanning electron micro-
scope (Nova NanoSEM NPE206). The elemental analysis
was carried out using EDX spectrometry (Brucker Quantax
200 AS). Micro-Raman and Raman mapping measurements
were performed at room temperature in 180� back scattering
geometry by using HORIBA Jobin Yvon LabRAM HR 800
equipped with a charge coupled device (CCD) detector and
an automated XY motorized stage, where 632.8 nm line from
He-Ne laser was used as the excitation source. The room
temperature photoluminescence (PL) was measured by
LabRAM HR 800 using the 325 nm excitation line of He-Cd
laser and 40� objective. The UV–Visible diffuse reflectance
spectra (DRS) were recorded on a Shimadzu UV-2450
Spectrophotometer.
F. Photocatalytic activity experiments
The photocatalytic properties of the prepared samples
were estimated by monitoring the photodegradation of MB
in a home-made apparatus with a Newport-66901 Xe lamp
(300 W, 200–800 nm) as the radiation source. In each experi-
ment, 50 mg of photocatalyst was dispersed in 100 ml of MB
aqueous solution (1� 10�5M). The suspension was then
magnetically stirred in dark for 30 min. Later, the solution
was transferred to Erlenmeyer flask and exposed to the
UV-visible light irradiation and at a regular time interval of
20 min, 5 ml of the exposed solutions was sampled, centri-
fuged, and the supernatant was collected for analysis of
the MB concentration. The photocatalytic degradation pro-
cess was monitored using a UV–Vis spectrophotometer
(Shimadzu UV-2450) to record the characteristic absorption
peak (660 nm) of MB.
III. RESULTS AND DISCUSSION
ZnO nanoparticles were decorated on graphene sheets by
a facile reaction between Zn2þ and OH� ions in the aqueous
solution. The schematic illustration of the formation mecha-
nism of GZ composites is presented in Fig. 1. When dissolv-
ing zinc acetate powder into GO solution, Zn2þ ions will be
adsorbed onto the surfaces of GO sheets due to their bonding
with the O atoms of the negatively charged oxygen-
containing functional groups via electrostatic force.1,22 Once
the hydrazine hydrate solution is added to the above suspen-
sion, ZnðOHÞ2�4 and ZnO2� may bond with the functional
groups such as carboxyl and hydroxyl groups (introduced on
graphite oxide during the process of oxidation) of GO sheets
by intermolecular hydrogen bonds.23,24 At the same time, the
GO will be reduced to graphene. ZnO anchored on the gra-
phene sheets was obtained after the annealing treatment. The
obtained products were characterized by several techniques to
ensure the formation of GZ composite.
The XRD patterns of graphene, pristine ZnO, and GZ
composites are shown in Fig. 2. All the diffraction peaks in
the XRD pattern of ZnO nanoparticles can be indexed to
173504-2 Gayathri et al. J. Appl. Phys. 115, 173504 (2014)
[This article is copyrighted as indicated in the article. Reuse of AIP content is subject to the terms at: http://scitation.aip.org/termsconditions. Downloaded to ] IP:
14.139.186.2 On: Fri, 02 May 2014 17:02:44
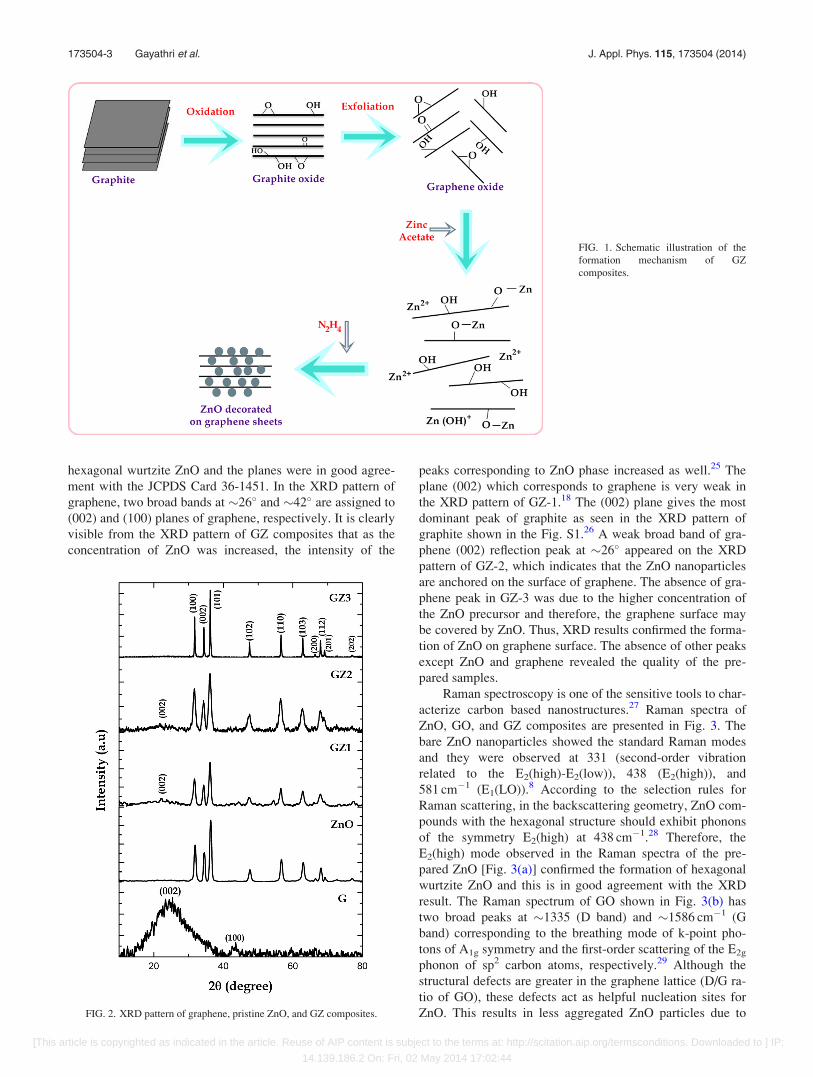
hexagonal wurtzite ZnO and the planes were in good agree-
ment with the JCPDS Card 36-1451. In the XRD pattern of
graphene, two broad bands at �26� and �42� are assigned to
(002) and (100) planes of graphene, respectively. It is clearly
visible from the XRD pattern of GZ composites that as the
concentration of ZnO was increased, the intensity of the
peaks corresponding to ZnO phase increased as well.25 The
plane (002) which corresponds to graphene is very weak in
the XRD pattern of GZ-1.18 The (002) plane gives the most
dominant peak of graphite as seen in the XRD pattern of
graphite shown in the Fig. S1.26 A weak broad band of gra-
phene (002) reflection peak at �26� appeared on the XRD
pattern of GZ-2, which indicates that the ZnO nanoparticles
are anchored on the surface of graphene. The absence of gra-
phene peak in GZ-3 was due to the higher concentration of
the ZnO precursor and therefore, the graphene surface may
be covered by ZnO. Thus, XRD results confirmed the forma-
tion of ZnO on graphene surface. The absence of other peaks
except ZnO and graphene revealed the quality of the pre-
pared samples.
Raman spectroscopy is one of the sensitive tools to char-
acterize carbon based nanostructures.27 Raman spectra of
ZnO, GO, and GZ composites are presented in Fig. 3. The
bare ZnO nanoparticles showed the standard Raman modes
and they were observed at 331 (second-order vibration
related to the E2(high)-E2(low)), 438 (E2(high)), and
581 cm�1 (E1(LO)).8 According to the selection rules for
Raman scattering, in the backscattering geometry, ZnO com-
pounds with the hexagonal structure should exhibit phonons
of the symmetry E2(high) at 438 cm�1.28 Therefore, the
E2(high) mode observed in the Raman spectra of the pre-
pared ZnO [Fig. 3(a)] confirmed the formation of hexagonal
wurtzite ZnO and this is in good agreement with the XRD
result. The Raman spectrum of GO shown in Fig. 3(b) has
two broad peaks at �1335 (D band) and �1586 cm�1 (G
band) corresponding to the breathing mode of k-point pho-
tons of A1g symmetry and the first-order scattering of the E2g
phonon of sp2 carbon atoms, respectively.29 Although the
structural defects are greater in the graphene lattice (D/G ra-
tio of GO), these defects act as helpful nucleation sites for
ZnO. This results in less aggregated ZnO particles due to
FIG. 1. Schematic illustration of the
formation mechanism of GZ
composites.
FIG. 2. XRD pattern of graphene, pristine ZnO, and GZ composites.
173504-3 Gayathri et al. J. Appl. Phys. 115, 173504 (2014)
[This article is copyrighted as indicated in the article. Reuse of AIP content is subject to the terms at: http://scitation.aip.org/termsconditions. Downloaded to ] IP:
14.139.186.2 On: Fri, 02 May 2014 17:02:44
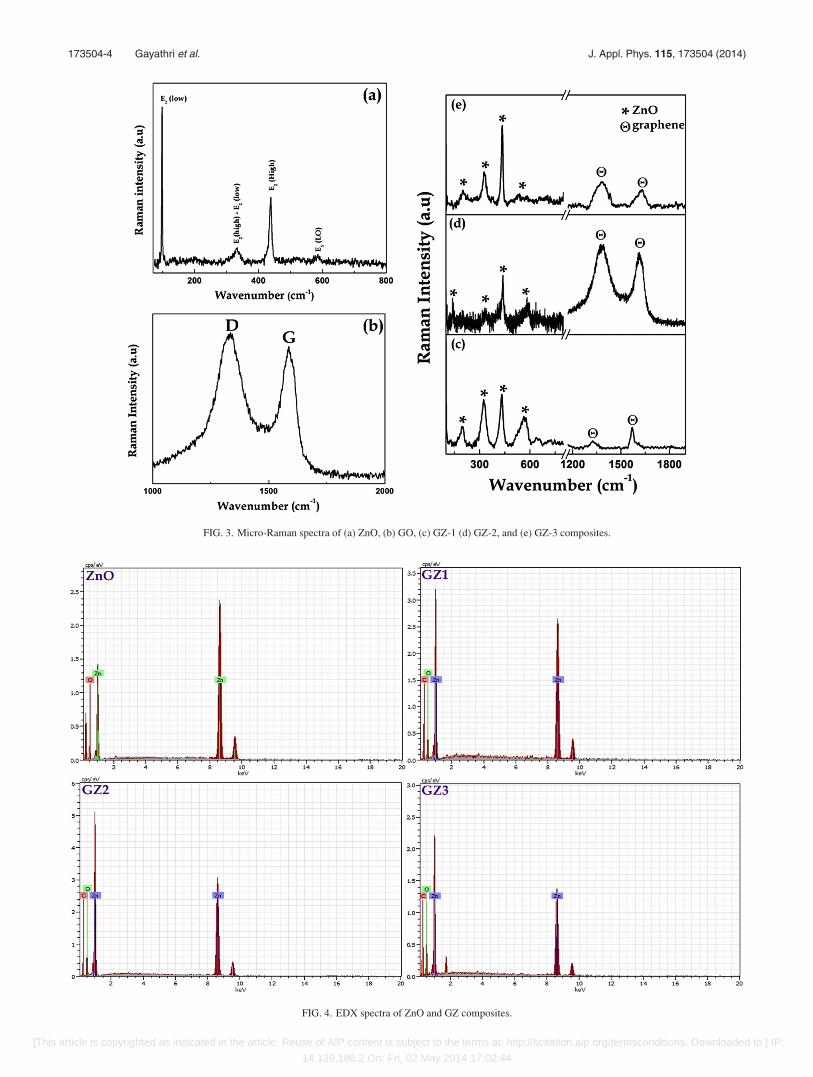
FIG. 3. Micro-Raman spectra of (a) ZnO, (b) GO, (c) GZ-1 (d) GZ-2, and (e) GZ-3 composites.
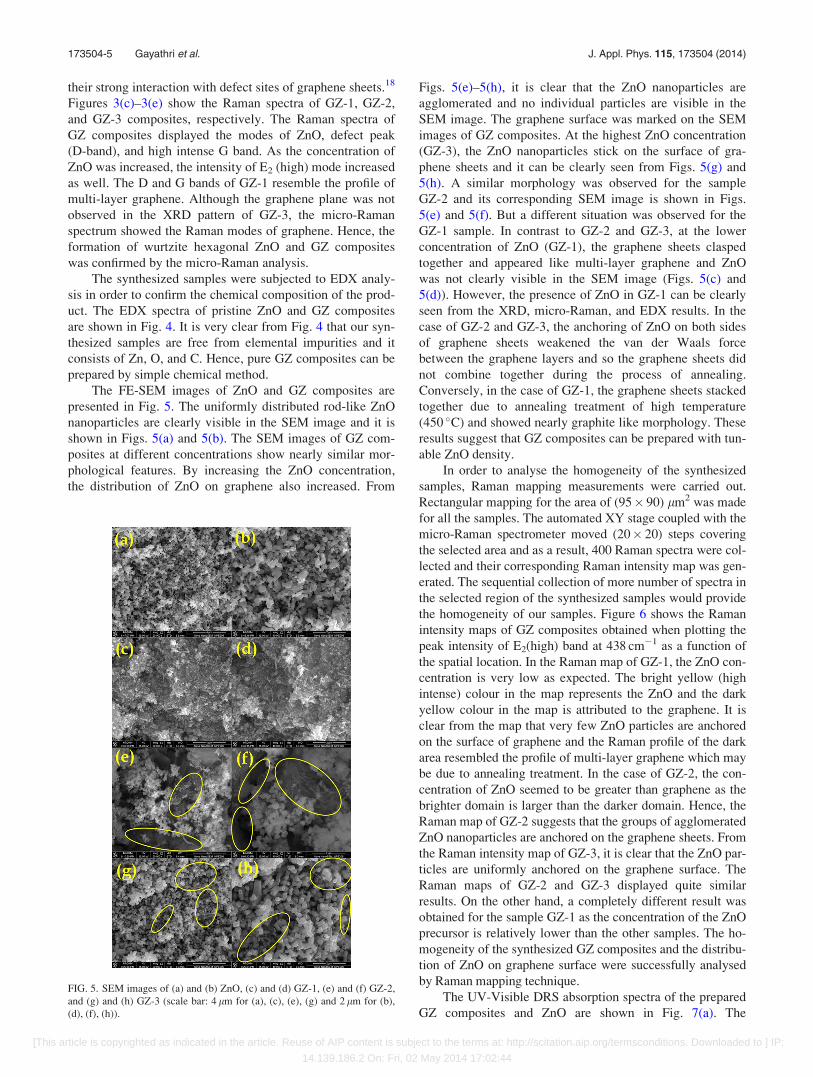
FIG. 4. EDX spectra of ZnO and GZ composites.
173504-4 Gayathri et al. J. Appl. Phys. 115, 173504 (2014)
[This article is copyrighted as indicated in the article. Reuse of AIP content is subject to the terms at: http://scitation.aip.org/termsconditions. Downloaded to ] IP:
14.139.186.2 On: Fri, 02 May 2014 17:02:44
their strong interaction with defect sites of graphene sheets.18
Figures 3(c)–3(e) show the Raman spectra of GZ-1, GZ-2,
and GZ-3 composites, respectively. The Raman spectra of
GZ composites displayed the modes of ZnO, defect peak
(D-band), and high intense G band. As the concentration of
ZnO was increased, the intensity of E2 (high) mode increased
as well. The D and G bands of GZ-1 resemble the profile of
multi-layer graphene. Although the graphene plane was not
observed in the XRD pattern of GZ-3, the micro-Raman
spectrum showed the Raman modes of graphene. Hence, the
formation of wurtzite hexagonal ZnO and GZ composites
was confirmed by the micro-Raman analysis.
The synthesized samples were subjected to EDX analy-
sis in order to confirm the chemical composition of the prod-
uct. The EDX spectra of pristine ZnO and GZ composites
are shown in Fig. 4. It is very clear from Fig. 4 that our syn-
thesized samples are free from elemental impurities and it
consists of Zn, O, and C. Hence, pure GZ composites can be
prepared by simple chemical method.
The FE-SEM images of ZnO and GZ composites are
presented in Fig. 5. The uniformly distributed rod-like ZnO
nanoparticles are clearly visible in the SEM image and it is
shown in Figs. 5(a) and 5(b). The SEM images of GZ com-
posites at different concentrations show nearly similar mor-
phological features. By increasing the ZnO concentration,
the distribution of ZnO on graphene also increased. From
Figs. 5(e)–5(h), it is clear that the ZnO nanoparticles are
agglomerated and no individual particles are visible in the
SEM image. The graphene surface was marked on the SEM
images of GZ composites. At the highest ZnO concentration
(GZ-3), the ZnO nanoparticles stick on the surface of gra-
phene sheets and it can be clearly seen from Figs. 5(g) and
5(h). A similar morphology was observed for the sample
GZ-2 and its corresponding SEM image is shown in Figs.
5(e) and 5(f). But a different situation was observed for the
GZ-1 sample. In contrast to GZ-2 and GZ-3, at the lower
concentration of ZnO (GZ-1), the graphene sheets clasped
together and appeared like multi-layer graphene and ZnO
was not clearly visible in the SEM image (Figs. 5(c) and
5(d)). However, the presence of ZnO in GZ-1 can be clearly
seen from the XRD, micro-Raman, and EDX results. In the
case of GZ-2 and GZ-3, the anchoring of ZnO on both sides
of graphene sheets weakened the van der Waals force
between the graphene layers and so the graphene sheets did
not combine together during the process of annealing.
Conversely, in the case of GZ-1, the graphene sheets stacked
together due to annealing treatment of high temperature
(450 �C) and showed nearly graphite like morphology. These
results suggest that GZ composites can be prepared with tun-
able ZnO density.
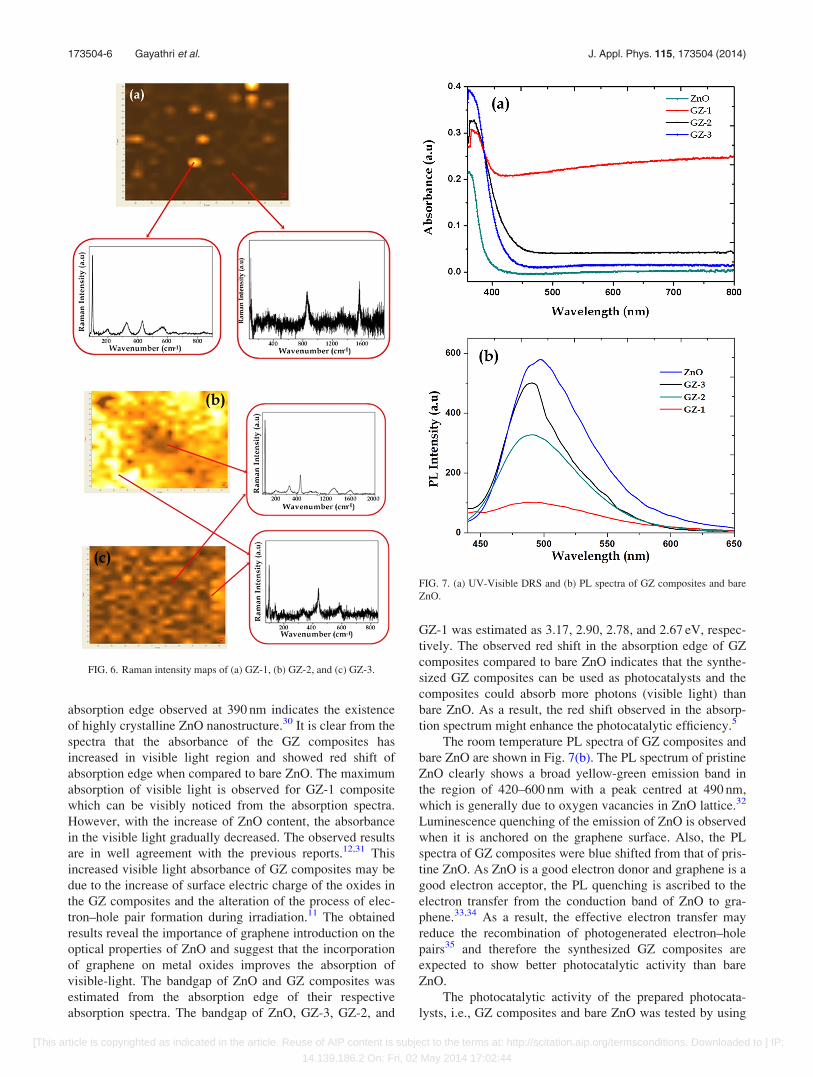
In order to analyse the homogeneity of the synthesized
samples, Raman mapping measurements were carried out.
Rectangular mapping for the area of (95� 90) lm2 was made
for all the samples. The automated XY stage coupled with the
micro-Raman spectrometer moved (20� 20) steps covering
the selected area and as a result, 400 Raman spectra were col-
lected and their corresponding Raman intensity map was gen-
erated. The sequential collection of more number of spectra in
the selected region of the synthesized samples would provide
the homogeneity of our samples. Figure 6 shows the Raman
intensity maps of GZ composites obtained when plotting the
peak intensity of E2(high) band at 438 cm�1 as a function of
the spatial location. In the Raman map of GZ-1, the ZnO con-
centration is very low as expected. The bright yellow (high
intense) colour in the map represents the ZnO and the dark
yellow colour in the map is attributed to the graphene. It is
clear from the map that very few ZnO particles are anchored
on the surface of graphene and the Raman profile of the dark
area resembled the profile of multi-layer graphene which may
be due to annealing treatment. In the case of GZ-2, the con-
centration of ZnO seemed to be greater than graphene as the
brighter domain is larger than the darker domain. Hence, the
Raman map of GZ-2 suggests that the groups of agglomerated
ZnO nanoparticles are anchored on the graphene sheets. From
the Raman intensity map of GZ-3, it is clear that the ZnO par-
ticles are uniformly anchored on the graphene surface. The
Raman maps of GZ-2 and GZ-3 displayed quite similar
results. On the other hand, a completely different result was
obtained for the sample GZ-1 as the concentration of the ZnO
precursor is relatively lower than the other samples. The ho-
mogeneity of the synthesized GZ composites and the distribu-
tion of ZnO on graphene surface were successfully analysed
by Raman mapping technique.
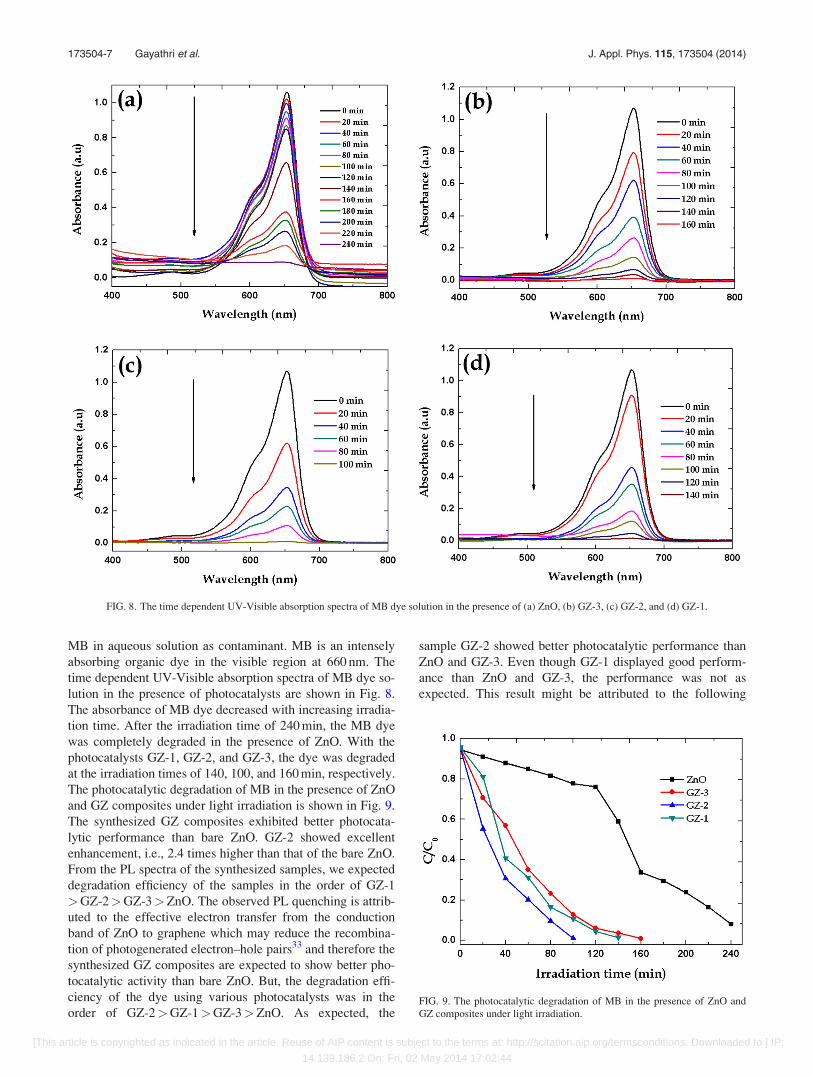
The UV-Visible DRS absorption spectra of the prepared
GZ composites and ZnO are shown in Fig. 7(a). The
FIG. 5. SEM images of (a) and (b) ZnO, (c) and (d) GZ-1, (e) and (f) GZ-2,
and (g) and (h) GZ-3 (scale bar: 4 lm for (a), (c), (e), (g) and 2 lm for (b),
(d), (f), (h)).
173504-5 Gayathri et al. J. Appl. Phys. 115, 173504 (2014)
[This article is copyrighted as indicated in the article. Reuse of AIP content is subject to the terms at: http://scitation.aip.org/termsconditions. Downloaded to ] IP:
14.139.186.2 On: Fri, 02 May 2014 17:02:44
absorption edge observed at 390 nm indicates the existence
of highly crystalline ZnO nanostructure.30 It is clear from the
spectra that the absorbance of the GZ composites has
increased in visible light region and showed red shift of
absorption edge when compared to bare ZnO. The maximum
absorption of visible light is observed for GZ-1 composite
which can be visibly noticed from the absorption spectra.
However, with the increase of ZnO content, the absorbance
in the visible light gradually decreased. The observed results
are in well agreement with the previous reports.12,31 This
increased visible light absorbance of GZ composites may be
due to the increase of surface electric charge of the oxides in
the GZ composites and the alteration of the process of elec-
tron–hole pair formation during irradiation.11 The obtained
results reveal the importance of graphene introduction on the
optical properties of ZnO and suggest that the incorporation
of graphene on metal oxides improves the absorption of
visible-light. The bandgap of ZnO and GZ composites was
estimated from the absorption edge of their respective
absorption spectra. The bandgap of ZnO, GZ-3, GZ-2, and
GZ-1 was estimated as 3.17, 2.90, 2.78, and 2.67 eV, respec-
tively. The observed red shift in the absorption edge of GZ
composites compared to bare ZnO indicates that the synthe-
sized GZ composites can be used as photocatalysts and the
composites could absorb more photons (visible light) than
bare ZnO. As a result, the red shift observed in the absorp-
tion spectrum might enhance the photocatalytic efficiency.5
The room temperature PL spectra of GZ composites and
bare ZnO are shown in Fig. 7(b). The PL spectrum of pristine
ZnO clearly shows a broad yellow-green emission band in
the region of 420–600 nm with a peak centred at 490 nm,
which is generally due to oxygen vacancies in ZnO lattice.32
Luminescence quenching of the emission of ZnO is observed
when it is anchored on the graphene surface. Also, the PL
spectra of GZ composites were blue shifted from that of pris-
tine ZnO. As ZnO is a good electron donor and graphene is a
good electron acceptor, the PL quenching is ascribed to the
electron transfer from the conduction band of ZnO to gra-
phene.33,34 As a result, the effective electron transfer may
reduce the recombination of photogenerated electron–hole
pairs35 and therefore the synthesized GZ composites are
expected to show better photocatalytic activity than bare
ZnO.
The photocatalytic activity of the prepared photocata-
lysts, i.e., GZ composites and bare ZnO was tested by using
FIG. 6. Raman intensity maps of (a) GZ-1, (b) GZ-2, and (c) GZ-3.
FIG. 7. (a) UV-Visible DRS and (b) PL spectra of GZ composites and bare
ZnO.
173504-6 Gayathri et al. J. Appl. Phys. 115, 173504 (2014)
[This article is copyrighted as indicated in the article. Reuse of AIP content is subject to the terms at: http://scitation.aip.org/termsconditions. Downloaded to ] IP:
14.139.186.2 On: Fri, 02 May 2014 17:02:44
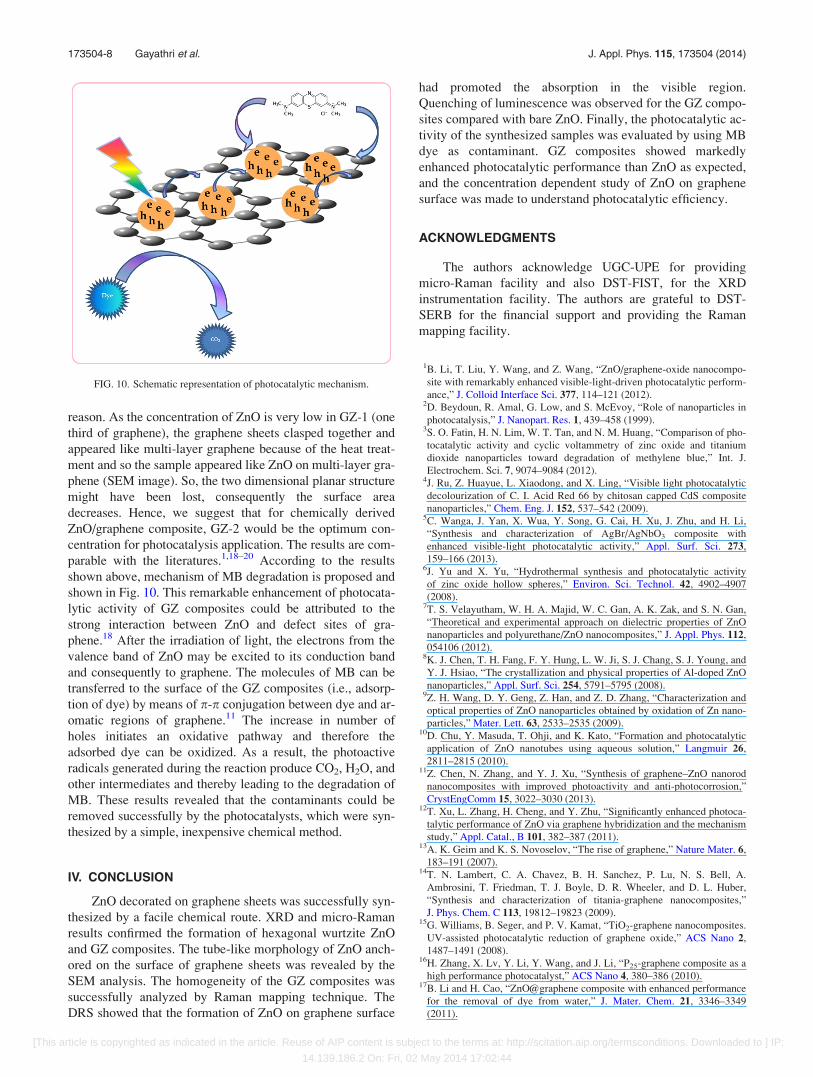
MB in aqueous solution as contaminant. MB is an intensely
absorbing organic dye in the visible region at 660 nm. The
time dependent UV-Visible absorption spectra of MB dye so-
lution in the presence of photocatalysts are shown in Fig. 8.
The absorbance of MB dye decreased with increasing irradia-
tion time. After the irradiation time of 240 min, the MB dye
was completely degraded in the presence of ZnO. With the
photocatalysts GZ-1, GZ-2, and GZ-3, the dye was degraded
at the irradiation times of 140, 100, and 160 min, respectively.
The photocatalytic degradation of MB in the presence of ZnO
and GZ composites under light irradiation is shown in Fig. 9.
The synthesized GZ composites exhibited better photocata-
lytic performance than bare ZnO. GZ-2 showed excellent
enhancement, i.e., 2.4 times higher than that of the bare ZnO.
From the PL spectra of the synthesized samples, we expected
degradation efficiency of the samples in the order of GZ-1
>GZ-2>GZ-3>ZnO. The observed PL quenching is attrib-
uted to the effective electron transfer from the conduction
band of ZnO to graphene which may reduce the recombina-
tion of photogenerated electron–hole pairs33 and therefore the
synthesized GZ composites are expected to show better pho-
tocatalytic activity than bare ZnO. But, the degradation effi-
ciency of the dye using various photocatalysts was in the
order of GZ-2>GZ-1>GZ-3>ZnO. As expected, the
sample GZ-2 showed better photocatalytic performance than
ZnO and GZ-3. Even though GZ-1 displayed good perform-
ance than ZnO and GZ-3, the performance was not as
expected. This result might be attributed to the following
FIG. 8. The time dependent UV-Visible absorption spectra of MB dye solution in the presence of (a) ZnO, (b) GZ-3, (c) GZ-2, and (d) GZ-1.
FIG. 9. The photocatalytic degradation of MB in the presence of ZnO and
GZ composites under light irradiation.
173504-7 Gayathri et al. J. Appl. Phys. 115, 173504 (2014)
[This article is copyrighted as indicated in the article. Reuse of AIP content is subject to the terms at: http://scitation.aip.org/termsconditions. Downloaded to ] IP:
14.139.186.2 On: Fri, 02 May 2014 17:02:44
reason. As the concentration of ZnO is very low in GZ-1 (one
third of graphene), the graphene sheets clasped together and
appeared like multi-layer graphene because of the heat treat-
ment and so the sample appeared like ZnO on multi-layer gra-
phene (SEM image). So, the two dimensional planar structure
might have been lost, consequently the surface area
decreases. Hence, we suggest that for chemically derived
ZnO/graphene composite, GZ-2 would be the optimum con-
centration for photocatalysis application. The results are com-
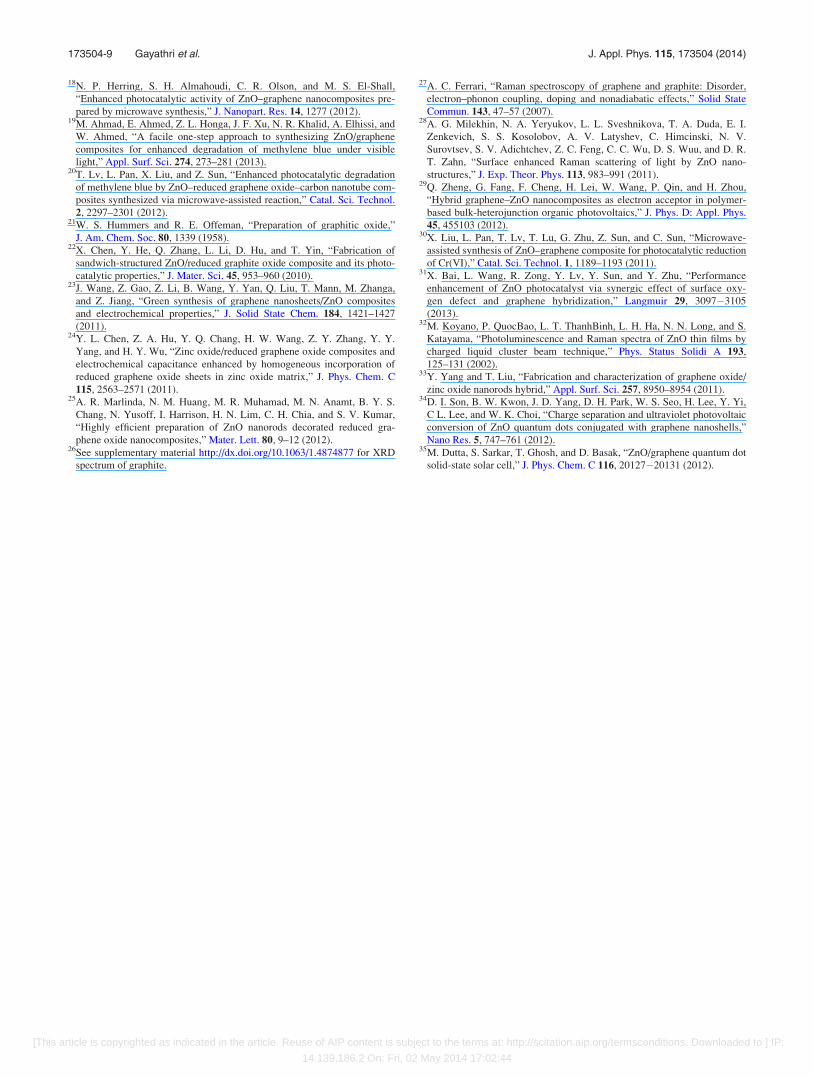
parable with the literatures.1,18–20 According to the results
shown above, mechanism of MB degradation is proposed and
shown in Fig. 10. This remarkable enhancement of photocata-
lytic activity of GZ composites could be attributed to the
strong interaction between ZnO and defect sites of gra-
phene.18 After the irradiation of light, the electrons from the
valence band of ZnO may be excited to its conduction band
and consequently to graphene. The molecules of MB can be
transferred to the surface of the GZ composites (i.e., adsorp-
tion of dye) by means of p-p conjugation between dye and ar-
omatic regions of graphene.11 The increase in number of
holes initiates an oxidative pathway and therefore the
adsorbed dye can be oxidized. As a result, the photoactive
radicals generated during the reaction produce CO2, H2O, and
other intermediates and thereby leading to the degradation of
MB. These results revealed that the contaminants could be
removed successfully by the photocatalysts, which were syn-
thesized by a simple, inexpensive chemical method.
IV. CONCLUSION
ZnO decorated on graphene sheets was successfully syn-
thesized by a facile chemical route. XRD and micro-Raman
results confirmed the formation of hexagonal wurtzite ZnO
and GZ composites. The tube-like morphology of ZnO anch-
ored on the surface of graphene sheets was revealed by the
SEM analysis. The homogeneity of the GZ composites was
successfully analyzed by Raman mapping technique. The
DRS showed that the formation of ZnO on graphene surface
had promoted the absorption in the visible region.
Quenching of luminescence was observed for the GZ compo-
sites compared with bare ZnO. Finally, the photocatalytic ac-
tivity of the synthesized samples was evaluated by using MB
dye as contaminant. GZ composites showed markedly
enhanced photocatalytic performance than ZnO as expected,
and the concentration dependent study of ZnO on graphene
surface was made to understand photocatalytic efficiency.
ACKNOWLEDGMENTS
The authors acknowledge UGC-UPE for providing
micro-Raman facility and also DST-FIST, for the XRD
instrumentation facility. The authors are grateful to DST-
SERB for the financial support and providing the Raman
mapping facility.
1B. Li, T. Liu, Y. Wang, and Z. Wang, “ZnO/graphene-oxide nanocompo-
site with remarkably enhanced visible-light-driven photocatalytic perform-
ance,” J. Colloid Interface Sci. 377, 114–121 (2012).2D. Beydoun, R. Amal, G. Low, and S. McEvoy, “Role of nanoparticles in
photocatalysis,” J. Nanopart. Res. 1, 439–458 (1999).3S. O. Fatin, H. N. Lim, W. T. Tan, and N. M. Huang, “Comparison of pho-
tocatalytic activity and cyclic voltammetry of zinc oxide and titanium
dioxide nanoparticles toward degradation of methylene blue,” Int. J.
Electrochem. Sci. 7, 9074–9084 (2012).4J. Ru, Z. Huayue, L. Xiaodong, and X. Ling, “Visible light photocatalytic
decolourization of C. I. Acid Red 66 by chitosan capped CdS composite
nanoparticles,” Chem. Eng. J. 152, 537–542 (2009).5C. Wanga, J. Yan, X. Wua, Y. Song, G. Cai, H. Xu, J. Zhu, and H. Li,
“Synthesis and characterization of AgBr/AgNbO3 composite with
enhanced visible-light photocatalytic activity,” Appl. Surf. Sci. 273,
159–166 (2013).6J. Yu and X. Yu, “Hydrothermal synthesis and photocatalytic activity
of zinc oxide hollow spheres,” Environ. Sci. Technol. 42, 4902–4907
(2008).7T. S. Velayutham, W. H. A. Majid, W. C. Gan, A. K. Zak, and S. N. Gan,
“Theoretical and experimental approach on dielectric properties of ZnO
nanoparticles and polyurethane/ZnO nanocomposites,” J. Appl. Phys. 112,
054106 (2012).8K. J. Chen, T. H. Fang, F. Y. Hung, L. W. Ji, S. J. Chang, S. J. Young, and
Y. J. Hsiao, “The crystallization and physical properties of Al-doped ZnO
nanoparticles,” Appl. Surf. Sci. 254, 5791–5795 (2008).9Z. H. Wang, D. Y. Geng, Z. Han, and Z. D. Zhang, “Characterization and
optical properties of ZnO nanoparticles obtained by oxidation of Zn nano-
particles,” Mater. Lett. 63, 2533–2535 (2009).10D. Chu, Y. Masuda, T. Ohji, and K. Kato, “Formation and photocatalytic
application of ZnO nanotubes using aqueous solution,” Langmuir 26,
2811–2815 (2010).11Z. Chen, N. Zhang, and Y. J. Xu, “Synthesis of graphene–ZnO nanorod
nanocomposites with improved photoactivity and anti-photocorrosion,”
CrystEngComm 15, 3022–3030 (2013).12T. Xu, L. Zhang, H. Cheng, and Y. Zhu, “Significantly enhanced photoca-
talytic performance of ZnO via graphene hybridization and the mechanism
study,” Appl. Catal., B 101, 382–387 (2011).13A. K. Geim and K. S. Novoselov, “The rise of graphene,” Nature Mater. 6,
183–191 (2007).14T. N. Lambert, C. A. Chavez, B. H. Sanchez, P. Lu, N. S. Bell, A.
Ambrosini, T. Friedman, T. J. Boyle, D. R. Wheeler, and D. L. Huber,
“Synthesis and characterization of titania-graphene nanocomposites,”
J. Phys. Chem. C 113, 19812–19823 (2009).15G. Williams, B. Seger, and P. V. Kamat, “TiO2-graphene nanocomposites.
UV-assisted photocatalytic reduction of graphene oxide,” ACS Nano 2,
1487–1491 (2008).16H. Zhang, X. Lv, Y. Li, Y. Wang, and J. Li, “P25-graphene composite as a
high performance photocatalyst,” ACS Nano 4, 380–386 (2010).17B. Li and H. Cao, “ZnO@graphene composite with enhanced performance
for the removal of dye from water,” J. Mater. Chem. 21, 3346–3349
(2011).
FIG. 10. Schematic representation of photocatalytic mechanism.
173504-8 Gayathri et al. J. Appl. Phys. 115, 173504 (2014)
[This article is copyrighted as indicated in the article. Reuse of AIP content is subject to the terms at: http://scitation.aip.org/termsconditions. Downloaded to ] IP:
14.139.186.2 On: Fri, 02 May 2014 17:02:44
18N. P. Herring, S. H. Almahoudi, C. R. Olson, and M. S. El-Shall,
“Enhanced photocatalytic activity of ZnO–graphene nanocomposites pre-
pared by microwave synthesis,” J. Nanopart. Res. 14, 1277 (2012).19M. Ahmad, E. Ahmed, Z. L. Honga, J. F. Xu, N. R. Khalid, A. Elhissi, and
W. Ahmed, “A facile one-step approach to synthesizing ZnO/graphene
composites for enhanced degradation of methylene blue under visible
light,” Appl. Surf. Sci. 274, 273–281 (2013).20T. Lv, L. Pan, X. Liu, and Z. Sun, “Enhanced photocatalytic degradation
of methylene blue by ZnO–reduced graphene oxide–carbon nanotube com-
posites synthesized via microwave-assisted reaction,” Catal. Sci. Technol.
2, 2297–2301 (2012).21W. S. Hummers and R. E. Offeman, “Preparation of graphitic oxide,”
J. Am. Chem. Soc. 80, 1339 (1958).22X. Chen, Y. He, Q. Zhang, L. Li, D. Hu, and T. Yin, “Fabrication of
sandwich-structured ZnO/reduced graphite oxide composite and its photo-
catalytic properties,” J. Mater. Sci. 45, 953–960 (2010).23J. Wang, Z. Gao, Z. Li, B. Wang, Y. Yan, Q. Liu, T. Mann, M. Zhanga,
and Z. Jiang, “Green synthesis of graphene nanosheets/ZnO composites
and electrochemical properties,” J. Solid State Chem. 184, 1421–1427
(2011).24Y. L. Chen, Z. A. Hu, Y. Q. Chang, H. W. Wang, Z. Y. Zhang, Y. Y.
Yang, and H. Y. Wu, “Zinc oxide/reduced graphene oxide composites and
electrochemical capacitance enhanced by homogeneous incorporation of
reduced graphene oxide sheets in zinc oxide matrix,” J. Phys. Chem. C
115, 2563–2571 (2011).25A. R. Marlinda, N. M. Huang, M. R. Muhamad, M. N. Anamt, B. Y. S.
Chang, N. Yusoff, I. Harrison, H. N. Lim, C. H. Chia, and S. V. Kumar,
“Highly efficient preparation of ZnO nanorods decorated reduced gra-
phene oxide nanocomposites,” Mater. Lett. 80, 9–12 (2012).26See supplementary material http://dx.doi.org/10.1063/1.4874877 for XRD
spectrum of graphite.
27A. C. Ferrari, “Raman spectroscopy of graphene and graphite: Disorder,
electron–phonon coupling, doping and nonadiabatic effects,” Solid State
Commun. 143, 47–57 (2007).28A. G. Milekhin, N. A. Yeryukov, L. L. Sveshnikova, T. A. Duda, E. I.
Zenkevich, S. S. Kosolobov, A. V. Latyshev, C. Himcinski, N. V.
Surovtsev, S. V. Adichtchev, Z. C. Feng, C. C. Wu, D. S. Wuu, and D. R.
T. Zahn, “Surface enhanced Raman scattering of light by ZnO nano-
structures,” J. Exp. Theor. Phys. 113, 983–991 (2011).29Q. Zheng, G. Fang, F. Cheng, H. Lei, W. Wang, P. Qin, and H. Zhou,
“Hybrid graphene–ZnO nanocomposites as electron acceptor in polymer-
based bulk-heterojunction organic photovoltaics,” J. Phys. D: Appl. Phys.
45, 455103 (2012).30X. Liu, L. Pan, T. Lv, T. Lu, G. Zhu, Z. Sun, and C. Sun, “Microwave-
assisted synthesis of ZnO–graphene composite for photocatalytic reduction
of Cr(VI),” Catal. Sci. Technol. 1, 1189–1193 (2011).31X. Bai, L. Wang, R. Zong, Y. Lv, Y. Sun, and Y. Zhu, “Performance
enhancement of ZnO photocatalyst via synergic effect of surface oxy-
gen defect and graphene hybridization,” Langmuir 29, 3097�3105
(2013).32M. Koyano, P. QuocBao, L. T. ThanhBinh, L. H. Ha, N. N. Long, and S.
Katayama, “Photoluminescence and Raman spectra of ZnO thin films by
charged liquid cluster beam technique,” Phys. Status Solidi A 193,
125–131 (2002).33Y. Yang and T. Liu, “Fabrication and characterization of graphene oxide/
zinc oxide nanorods hybrid,” Appl. Surf. Sci. 257, 8950–8954 (2011).34D. I. Son, B. W. Kwon, J. D. Yang, D. H. Park, W. S. Seo, H. Lee, Y. Yi,
C L. Lee, and W. K. Choi, “Charge separation and ultraviolet photovoltaic
conversion of ZnO quantum dots conjugated with graphene nanoshells,”
Nano Res. 5, 747–761 (2012).35M. Dutta, S. Sarkar, T. Ghosh, and D. Basak, “ZnO/graphene quantum dot
solid-state solar cell,” J. Phys. Chem. C 116, 20127�20131 (2012).
173504-9 Gayathri et al. J. Appl. Phys. 115, 173504 (2014)
[This article is copyrighted as indicated in the article. Reuse of AIP content is subject to the terms at: http://scitation.aip.org/termsconditions. Downloaded to ] IP:
14.139.186.2 On: Fri, 02 May 2014 17:02:44