Photocatalytic Oxidation of Glucose and Cellobiose Using ...
274
Photocatalytic Oxidation of Glucose and Cellobiose Using TiO 2 Supported Bimetallic Nanoparticles. Luigi Da Vià Chemistry Department This dissertation is submitted for the degree of Doctor of Philosophy February 2016
-
Upload
khangminh22 -
Category
Documents
-
view
1 -
download
0
Transcript of Photocatalytic Oxidation of Glucose and Cellobiose Using ...
Photocatalytic Oxidation of Glucose andCellobiose Using TiO2 Supported
Bimetallic Nanoparticles.
Luigi Da Vià
Chemistry Department
This dissertation is submitted for the degree of
Doctor of Philosophy
February 2016

J. Blues: The band? The band.
Rev. C. James: DO YOU SEE THE LIGHT?
J. Blues: THE BAND!.
Rev. C. James: DO YOU SEE THE LIGHT?
E. Blues: [Confused] What light?
Rev. C. James: HAVE YOU SEEEEN THE LIGHT?
J. Blues: YES! YES! JESUS H. TAP-DANCING CHRIST... I HAVE SEEN THE LIGHT!
The Blues Brothers, 1980

Declaration
I hereby declare that except where specific reference is made to the work of others, the
contents of this dissertation are original and have not been submitted in whole or in part
for consideration for any other degree or qualification in this, or any other university. This
dissertation is my own work and contains nothing which is the outcome of work done in
collaboration with others except as specified in the text. This dissertation contains fewer than
73,000 words including appendices, bibliography, footnotes, tables and equations and has
fewer than 130 figures.
Luigi Da Vià
February 2016

Acknowledgements
This PhD is not just mine. I mean, it is as I did most of the leg work, but all of this would nothave been possible without the enormous amount of help I’ve received in these three and halfyears of the spectacularly emotional roller-coaster that a PhD is. I would like to thank allthe technicians in the department for helping me setting up most of the equipment in the labspecially, Dave, Ken, Sandra and Gordon for the helping me scavenging anything I could putmy hands on, the laughs, and the weird Friday afternoon requests.
I would like to thank all Mikko, Estevão, Thalita, Thiago, Stephanie all the people thatcame by to do some research here in Liverpool. Thank you for sharing fragments of yourlives with me and becoming friends. I hope I will see you again in the future! I would like tothank all the people in our group, Joel for the quaffable drinks and the fat frogs (you evil!),Aldo for the patience and all the others for having to deal with me during some stressfultimes.
A special thank to all the people I’ve helped in the lab, thank you Erica for the patienceand understanding of being my first student, Carlo for all the work in the lab and allowingme to use for the first time the depilatory strips, sta senz’ pensieri e portami doje frittur!!
Thank you all for your patience!
Thank you Tom for the all the support, mentoring, drinking, supervision, friendship andso much more! This work is as much mine as it is yours!
Finally, last but not least, I would like to thank Tony for giving me the opportunity toembark myself upon a PhD and making me realize that, as Winston Churchill said, "If you’re
going through hell keep going.".
Vorrei ora ringraziare "the big Italian family", i papino e mammina per aver semprecreduto nel figlio che non vedeva l’ora di esplorare il mondo ed avermi sempre so(su)pportato

viii
in tutto e per tutto. Grazie per avermi dato l’opportunità di diventare l’uomo che sonononostante tutti i miei difetti.
Grazie a Roberto e Daniela, essere il fratellone maggiore a distanza é dura ogni tanto mavedervi seguire le vostre strade con successo mi rende fiero di voi.
A special THANK YOU to my Canadian family. Without you this incredible adventureprobably would have never started. Those 6 months changed my life I will be forever gratefulto you guys. Uncle Ben, Aunt Maria, Annamaria and Richard thank you for being there evenif time passes by and you are across the ocean! I will be back soon, I promise!
Ilaria, questi (quasi) 4 anni assieme sono stati intensi. Nostri. Grazie per avermi ascoltatoquando agli inizi le cose non giravano, avermi sopportato nei giorni bui e aver riso con menei tanti giorni felici. Spero di riuscire ad essere un punto di riferimento per te come lo seistata per me. Adesso tocca a te! Una volta mi hai scritto "Che tu possa avere sempre il ventoin poppa, che il sole ti risplenda in viso [..]", Luiz.
Ti auguro e ci auguro lo stesso per molto tempo a venire!Come non ricordare i gladiatori di SSRC, La Sergia, Sgrillons, Emiliano-boldra-Poli ed
Enzo. Abatjour mi ha causato notti insonni per le vivide immagini condivise, ma senza divoi, le cene, le risate, le bestemmie (tante), questo PhD sarebbe stato incolore. Grazie ed inbocca al lupo!
Vorrei ringraziare la "Banda del Mersey": Diego, Serafino, Luca, Sara, Giulia, Danilo,Diego, Michela e tutti gli italiani che ho conosciuto qui per avermi fatto sentire a casa distanteda casa. Grazie regaz!
Thanks to all the members of "Neighbours making sense of the neighbourhood" fororganising improbable hiking trips and random events!
Finally, I would like to thank all the people I’ve met through Volleyball, Andy, Maurizioaka Big Man, James, Ethan, James, Josue, Andy, Stoqn, Zach, Lucas for building a team, andlearning the hard way what it means to win and lose together. I wish you guys all the best!
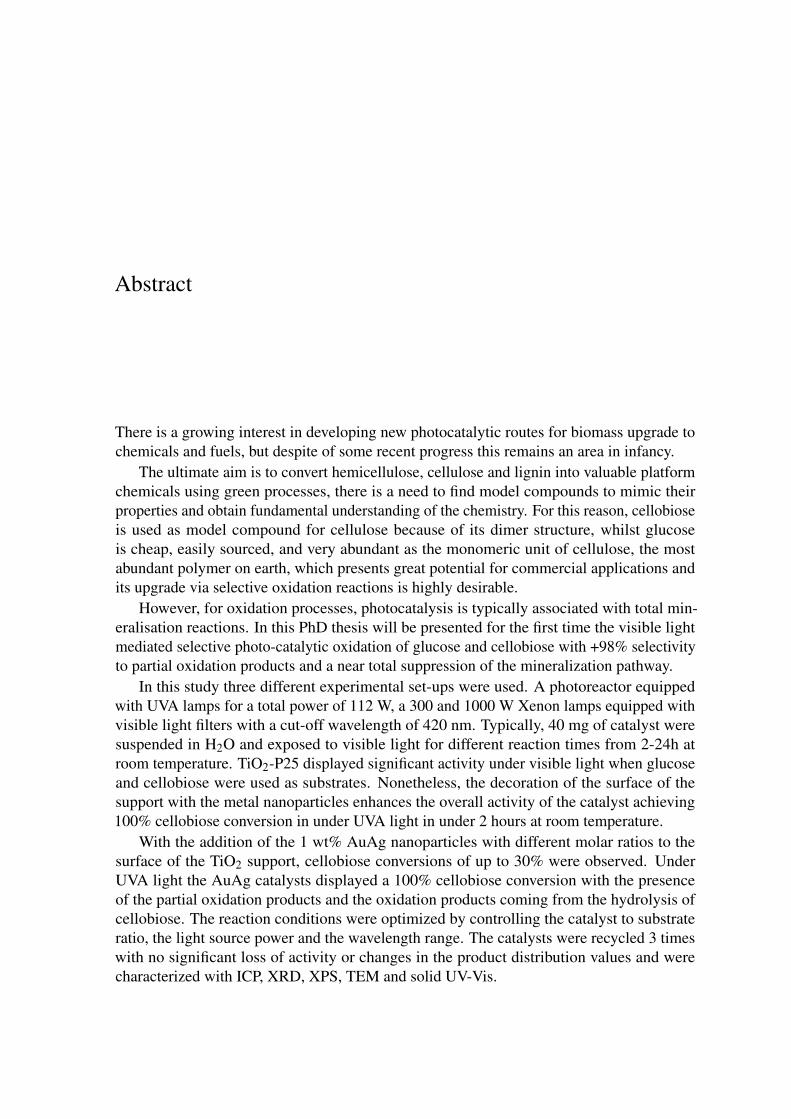
Abstract
There is a growing interest in developing new photocatalytic routes for biomass upgrade tochemicals and fuels, but despite of some recent progress this remains an area in infancy.
The ultimate aim is to convert hemicellulose, cellulose and lignin into valuable platformchemicals using green processes, there is a need to find model compounds to mimic theirproperties and obtain fundamental understanding of the chemistry. For this reason, cellobioseis used as model compound for cellulose because of its dimer structure, whilst glucoseis cheap, easily sourced, and very abundant as the monomeric unit of cellulose, the mostabundant polymer on earth, which presents great potential for commercial applications andits upgrade via selective oxidation reactions is highly desirable.
However, for oxidation processes, photocatalysis is typically associated with total min-eralisation reactions. In this PhD thesis will be presented for the first time the visible lightmediated selective photo-catalytic oxidation of glucose and cellobiose with +98% selectivityto partial oxidation products and a near total suppression of the mineralization pathway.
In this study three different experimental set-ups were used. A photoreactor equippedwith UVA lamps for a total power of 112 W, a 300 and 1000 W Xenon lamps equipped withvisible light filters with a cut-off wavelength of 420 nm. Typically, 40 mg of catalyst weresuspended in H2O and exposed to visible light for different reaction times from 2-24h atroom temperature. TiO2-P25 displayed significant activity under visible light when glucoseand cellobiose were used as substrates. Nonetheless, the decoration of the surface of thesupport with the metal nanoparticles enhances the overall activity of the catalyst achieving100% cellobiose conversion in under UVA light in under 2 hours at room temperature.
With the addition of the 1 wt% AuAg nanoparticles with different molar ratios to thesurface of the TiO2 support, cellobiose conversions of up to 30% were observed. UnderUVA light the AuAg catalysts displayed a 100% cellobiose conversion with the presenceof the partial oxidation products and the oxidation products coming from the hydrolysis ofcellobiose. The reaction conditions were optimized by controlling the catalyst to substrateratio, the light source power and the wavelength range. The catalysts were recycled 3 timeswith no significant loss of activity or changes in the product distribution values and werecharacterized with ICP, XRD, XPS, TEM and solid UV-Vis.
x
This study attempts to apply a systematic approach towards the understanding of photocat-alytic reactions, specifically focusing on the possibility of upgrading glucose and cellobioseto valuable chemicals. The reactivity of sugars when exposed to UV light and metal supportedcatalysts has been reported in the literature, but for the first time, this work tries to combinethe production of the gaseous products (H2 and CO2) along with the presence of partiallyoxidised products in the aqueous phase with a new global reaction mechanism which takesinto account what are believed to be the two main competitive reaction pathways, the Ruffdegradation, and the alpha scission of sugars.
This study can be transferred to other bio-derived molecules to get a better understandingon how to optimize and exploit photoactive materials to upgrade biomass under mild condi-tions and emphasises the crucial role of the Au and Ag metal nanoparticles present on thesurface towards extending the activity range in the visible part of the spectrum.

Table of contents
List of figures vii
List of tables xxi
1 Introduction 1
1.1 Biomass Chemistry . . . . . . . . . . . . . . . . . . . . . . . . . . . . . . 3
1.2 Conventional Processes for Biomass Utilization . . . . . . . . . . . . . . . 4
1.2.1 Thermochemical Processes . . . . . . . . . . . . . . . . . . . . . . 4
1.2.2 Biological Processes . . . . . . . . . . . . . . . . . . . . . . . . . 7
1.3 Chemical Conversion of Carbohydrates . . . . . . . . . . . . . . . . . . . 8
1.3.1 Pretreatment of Carbohydrates from Biomass . . . . . . . . . . . . 8
1.4 Photocatalysis . . . . . . . . . . . . . . . . . . . . . . . . . . . . . . . . . 13
1.4.1 Semiconductors and Photocatalytic Activity . . . . . . . . . . . . . 15
1.5 Photochemical Processes . . . . . . . . . . . . . . . . . . . . . . . . . . . 17
1.5.1 Photoreforming . . . . . . . . . . . . . . . . . . . . . . . . . . . . 18
1.5.2 Photoreforming of Carbohydrates . . . . . . . . . . . . . . . . . . 20
1.5.3 Selective Photocatalytic Processes . . . . . . . . . . . . . . . . . . 22
1.6 Plasmonic Photocatalysis . . . . . . . . . . . . . . . . . . . . . . . . . . . 25
ii Table of contents
1.6.1 Plasmonic Photocatalysis Mechanism . . . . . . . . . . . . . . . . 27
1.7 Operational Parameters in Photocatalysis . . . . . . . . . . . . . . . . . . 34
1.7.1 Solvents . . . . . . . . . . . . . . . . . . . . . . . . . . . . . . . . 35
1.7.2 Catalyst and Substrate Concentration . . . . . . . . . . . . . . . . 36
1.7.3 Temperature . . . . . . . . . . . . . . . . . . . . . . . . . . . . . 38
1.7.4 pH Influence . . . . . . . . . . . . . . . . . . . . . . . . . . . . . 39
1.7.5 Light Intensity . . . . . . . . . . . . . . . . . . . . . . . . . . . . 40
1.7.6 Adsorption on Semiconductor Surfaces . . . . . . . . . . . . . . . 42
1.7.7 Formation of the Ligand-to-Metal Charge Transfer (LMCT) . . . . 44
1.8 Aim of the Work . . . . . . . . . . . . . . . . . . . . . . . . . . . . . . . 46
2 Materials and Methods 49
2.1 Chemicals . . . . . . . . . . . . . . . . . . . . . . . . . . . . . . . . . . . 49
2.2 Wetness Impregnation . . . . . . . . . . . . . . . . . . . . . . . . . . . . . 50
2.3 Colloidal Synthesis . . . . . . . . . . . . . . . . . . . . . . . . . . . . . . 50
2.4 Synthesis of Cellobionic Acid . . . . . . . . . . . . . . . . . . . . . . . . 52
2.5 Thermal Pretreatments . . . . . . . . . . . . . . . . . . . . . . . . . . . . 53
2.6 Catalyst Characterization Techniques . . . . . . . . . . . . . . . . . . . . . 53
2.6.1 UV-Vis Spectroscopy . . . . . . . . . . . . . . . . . . . . . . . . . 53
2.6.2 X-ray Diffraction (XRD) . . . . . . . . . . . . . . . . . . . . . . . 54
2.6.3 Attenuated Total Reflectance
Infrared Spectroscopy (ATR-FTIR) . . . . . . . . . . . . . . . . . 54
2.6.4 X-ray Photoelectron Spectroscopy (XPS) . . . . . . . . . . . . . . 54
2.6.5 Scanning Electron Microscopy (SEM) . . . . . . . . . . . . . . . . 55
2.6.6 Transmission Electron Microscopy (TEM) . . . . . . . . . . . . . 56
2.6.7 Energy-Dispersive X-ray Spectroscopy (EDX) . . . . . . . . . . . 57
Table of contents iii
2.6.8 Inductively Coupled Plasma
Optical Emission Spectrometry Analysis (ICP-OES) . . . . . . . . 57
2.7 Products Analysis and Characterization . . . . . . . . . . . . . . . . . . . 58
2.7.1 High Performance Liquid Chromatography (HPLC) . . . . . . . . 58
2.7.2 HPLC- Quadrupole Time of Flight Mass Spectrometry
(HPLC-QTOF) . . . . . . . . . . . . . . . . . . . . . . . . . . . . 58
2.7.3 Nuclear Magnetic Resonance (NMR) . . . . . . . . . . . . . . . . 59
2.8 Description and Setup of the Photoreactors . . . . . . . . . . . . . . . . . . 59
2.8.1 Luzchem Photoreactor . . . . . . . . . . . . . . . . . . . . . . . . 59
2.8.2 Xenon Lamps . . . . . . . . . . . . . . . . . . . . . . . . . . . . . 60
2.9 Evaluation of the Catalyst Activity . . . . . . . . . . . . . . . . . . . . . . 64
2.9.1 Catalyst Recycling . . . . . . . . . . . . . . . . . . . . . . . . . . 65
2.9.2 Conversion . . . . . . . . . . . . . . . . . . . . . . . . . . . . . . 66
2.9.3 Product Distribution Values . . . . . . . . . . . . . . . . . . . . . 66
2.9.4 Catalyst Specific Activity . . . . . . . . . . . . . . . . . . . . . . 67
3 Optimization of the Reaction Parameters 69
3.1 Introduction . . . . . . . . . . . . . . . . . . . . . . . . . . . . . . . . . . 69
3.2 Results and Discussion . . . . . . . . . . . . . . . . . . . . . . . . . . . . 71
3.2.1 Effect of the Catalyst to Substrate Ratio . . . . . . . . . . . . . . . 71
3.2.2 Effect of the TiO2 Crystalline Structure . . . . . . . . . . . . . . . 76
3.2.3 Effect of the Calcination Temperature . . . . . . . . . . . . . . . . 82
3.2.4 Effect of the Lamp Power, Filters and Solvent Used . . . . . . . . . 85
3.3 Conclusions . . . . . . . . . . . . . . . . . . . . . . . . . . . . . . . . . . 89
4 Glucose Photo-oxidation 91
4.1 Introduction . . . . . . . . . . . . . . . . . . . . . . . . . . . . . . . . . . 91
iv Table of contents
4.2 Catalyst Testing . . . . . . . . . . . . . . . . . . . . . . . . . . . . . . . . 92
4.3 Results and Discussion . . . . . . . . . . . . . . . . . . . . . . . . . . . . 93
4.3.1 Effect of the Lamp Power, Filters and Solvent Used . . . . . . . . . 93
4.3.2 Effect of the Metal Loading . . . . . . . . . . . . . . . . . . . . . 95
4.3.3 Identification of the Reaction Pathway . . . . . . . . . . . . . . . . 103
4.3.4 Catalyst Characterisation and Recycling Studies . . . . . . . . . . 108
4.4 Photo-dispersion of Supported Metal Nanoparticles . . . . . . . . . . . . . 113
4.5 Activity of Unsupported Metal Nanoparticles . . . . . . . . . . . . . . . . 119
4.6 Conclusions . . . . . . . . . . . . . . . . . . . . . . . . . . . . . . . . . . 122
5 Cellobiose Photo-oxidation 123
5.1 Introduction . . . . . . . . . . . . . . . . . . . . . . . . . . . . . . . . . . 123
5.2 Results and Discussion . . . . . . . . . . . . . . . . . . . . . . . . . . . . 124
5.2.1 Catalytic Testing . . . . . . . . . . . . . . . . . . . . . . . . . . . 124
5.2.2 Identification of the Reaction Pathway Using HPLC-QTOF . . . . . 125
5.2.3 Experimental Reaction Pathway . . . . . . . . . . . . . . . . . . . 130
5.3 Catalytic Data . . . . . . . . . . . . . . . . . . . . . . . . . . . . . . . . . 133
5.3.1 Effect of the Substrate Concentration and Reaction Medium . . . . 133
5.4 Colloidal Synthesis and Stability . . . . . . . . . . . . . . . . . . . . . . . 141
5.4.1 P123 as Stabilizing Agent . . . . . . . . . . . . . . . . . . . . . . 141
5.4.2 PVA as Stabilizing Agent . . . . . . . . . . . . . . . . . . . . . . . 145
5.5 Catalyst Characterization and Recycling Studies . . . . . . . . . . . . . . . 147
5.5.1 TEM Characterization . . . . . . . . . . . . . . . . . . . . . . . . 147
5.5.2 XPS Characterization . . . . . . . . . . . . . . . . . . . . . . . . . 150
5.5.3 Catalyst Recycling . . . . . . . . . . . . . . . . . . . . . . . . . . 152
5.6 Conclusions . . . . . . . . . . . . . . . . . . . . . . . . . . . . . . . . . . 156
Table of contents v
6 Conclusions 157
6.1 Future Work . . . . . . . . . . . . . . . . . . . . . . . . . . . . . . . . . . 167
6.1.1 High Throughput Testing . . . . . . . . . . . . . . . . . . . . . . . 167
6.1.2 Use of Alternative Metals . . . . . . . . . . . . . . . . . . . . . . 168
6.1.3 Cellulose . . . . . . . . . . . . . . . . . . . . . . . . . . . . . . . 170
References 175
Appendix A 193
A.1 HPLC Determination of Bioderived Molecules . . . . . . . . . . . . . . . 193
A.2 HPLC-QTOF Method Development . . . . . . . . . . . . . . . . . . . . . 197
A.2.1 Instrument Overview . . . . . . . . . . . . . . . . . . . . . . . . . 200
Appendix B 203
B.1 Synthesis and Characterization of Cellobionic Acid . . . . . . . . . . . . . 203
Appendix C 211
C.1 Solid UV-Vis Measurements . . . . . . . . . . . . . . . . . . . . . . . . . 211
Appendix D 217
D.1 Cellobiose Oxidation Tables . . . . . . . . . . . . . . . . . . . . . . . . . 217
D.2 2.8 mM Cellobiose Solutions . . . . . . . . . . . . . . . . . . . . . . . . . 217
D.3 10 mM Cellobiose Solutions . . . . . . . . . . . . . . . . . . . . . . . . . 222
Appendix E 227
E.1 Redispersion of Ag Nanoparticles on TiO2 . . . . . . . . . . . . . . . . . . 227
E.2 Fresh 1.5% Ag/TiO2 . . . . . . . . . . . . . . . . . . . . . . . . . . . . . 227
E.3 Visible light - H2O . . . . . . . . . . . . . . . . . . . . . . . . . . . . . . 228
E.4 Visible Light - MeCN/H2O . . . . . . . . . . . . . . . . . . . . . . . . . . 229
vi Table of contents
E.5 UVA Light - H2O . . . . . . . . . . . . . . . . . . . . . . . . . . . . . . . 231
E.6 UVA Light - MeCN/H2O . . . . . . . . . . . . . . . . . . . . . . . . . . . 232
Appendix F 235
F.1 Au1Ag1−x/TiO2 TEM Micrographs . . . . . . . . . . . . . . . . . . . . . . 235
List of figures
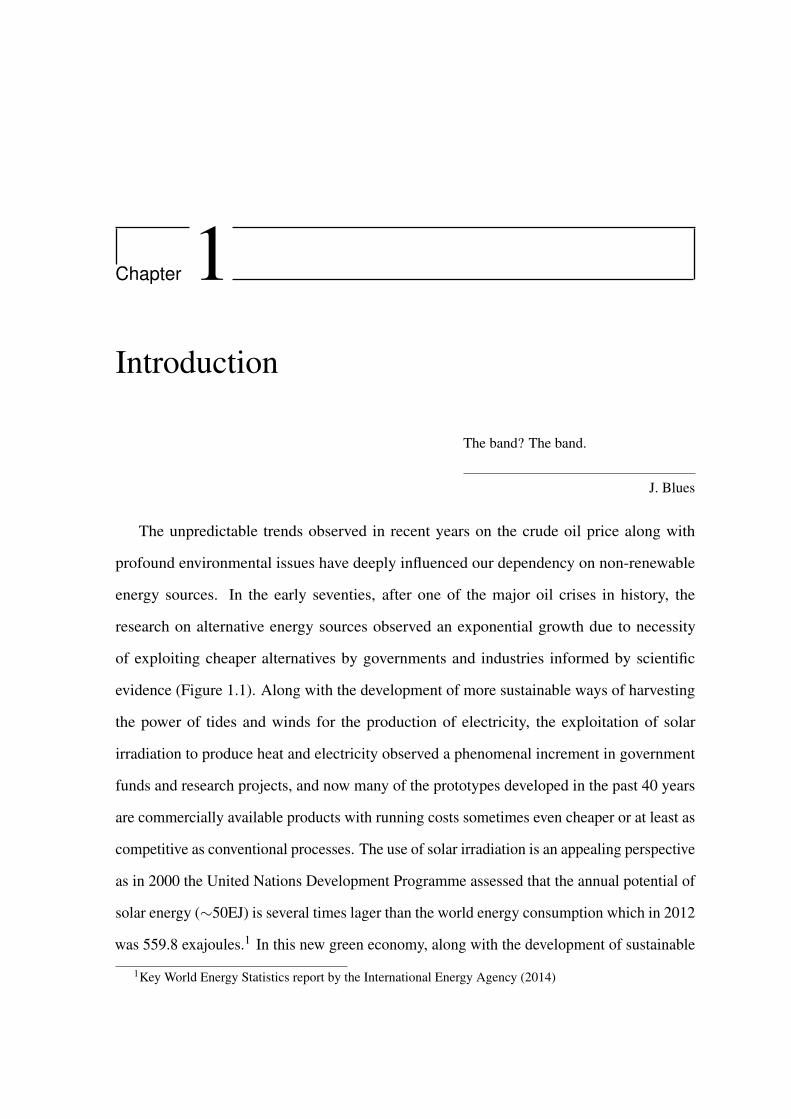
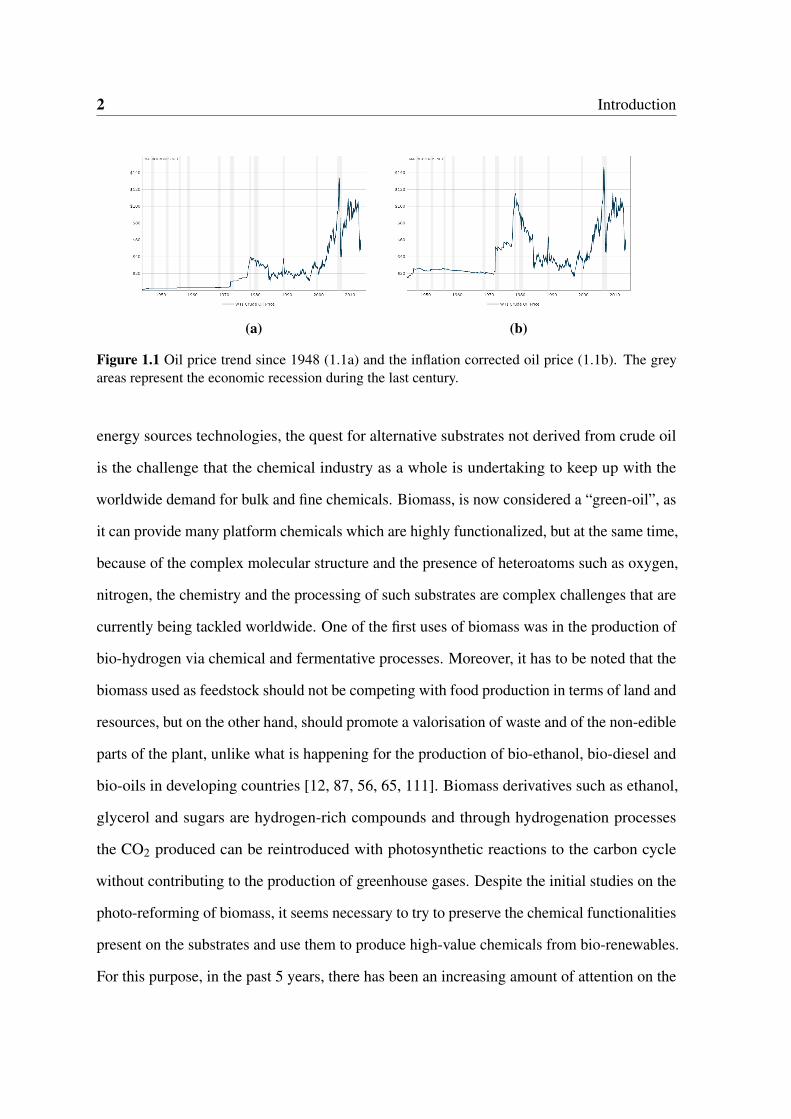
1.1 Oil price trend since 1948 (1.1a) and the inflation corrected oil price (1.1b).
The grey areas represent the economic recession during the last century. . . 2
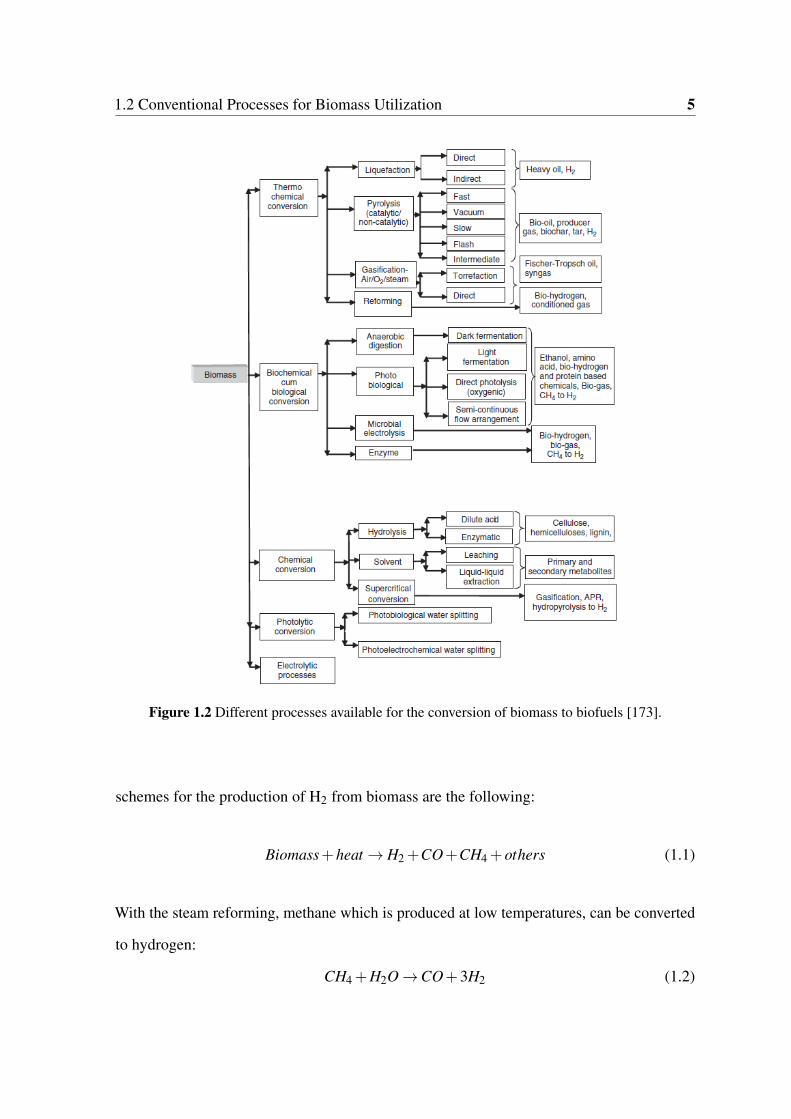
1.2 Different processes available for the conversion of biomass to biofuels [173]. 5
1.3 Glucose oxidation pathway to the corresponding C6 acids with metal sup-
ported catalysts. . . . . . . . . . . . . . . . . . . . . . . . . . . . . . . . . 11
1.4 Typical n-type (left) and p-type (right) semiconductor schematic structure.
The top band is the conduction band (cb), whilst the bottom one is the
valence band (vb). The shift in the Fermi level value can also be observed if
compared with an intrinsic semiconductor. . . . . . . . . . . . . . . . . . . 15
1.5 Band positions (top of valence band and bottom of conduction band) of
several semiconductors [47]. . . . . . . . . . . . . . . . . . . . . . . . . . 16
1.6 Time scales of fundamental steps occurring during a photocatalytic process.
Taken from Kubacka et al. [137]. . . . . . . . . . . . . . . . . . . . . . . . 20
1.7 Suggested mechanism for the one-pot degradation of cellulose to HMF.[86]. 23
1.8 Reaction mechanism proposed by Colmenares et al. [61] for the photo oxida-
tion of glucose to glucaric and gluconic acid. . . . . . . . . . . . . . . . . 24
1.9 Beneficial contribution of several factors in plasmonic photocatalysis. . . . 26
viii List of figures
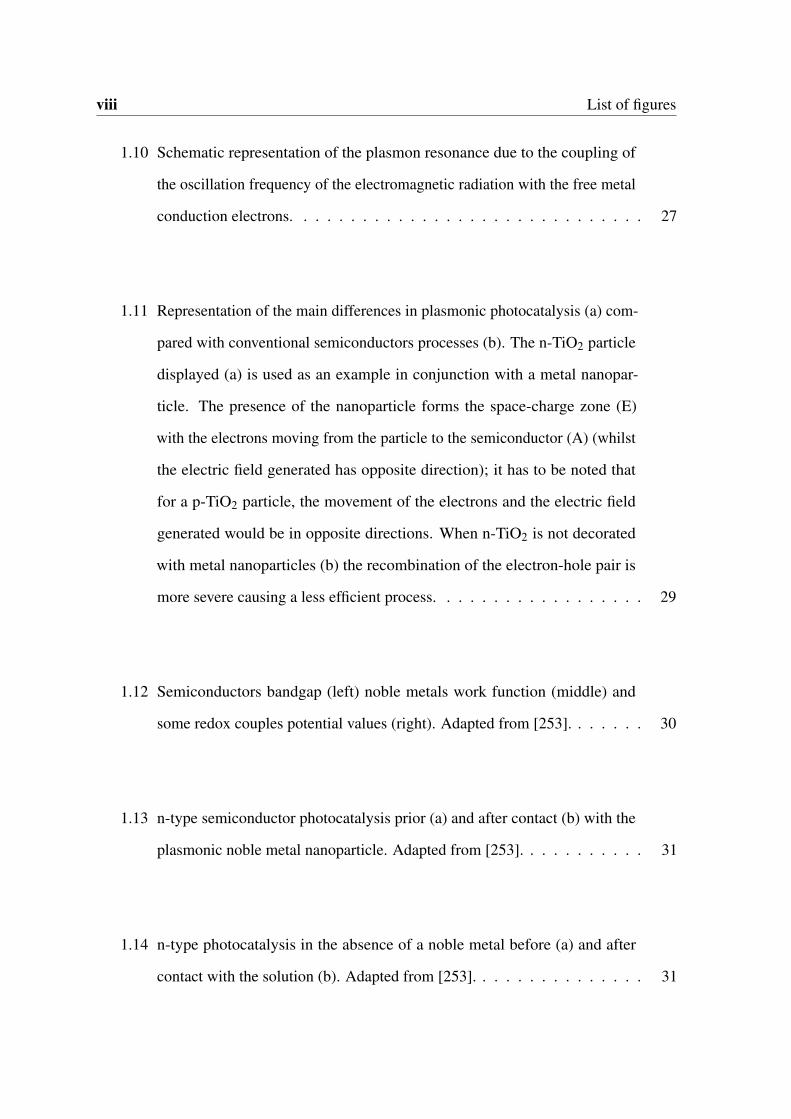
1.10 Schematic representation of the plasmon resonance due to the coupling of
the oscillation frequency of the electromagnetic radiation with the free metal
conduction electrons. . . . . . . . . . . . . . . . . . . . . . . . . . . . . . 27
1.11 Representation of the main differences in plasmonic photocatalysis (a) com-
pared with conventional semiconductors processes (b). The n-TiO2 particle
displayed (a) is used as an example in conjunction with a metal nanopar-
ticle. The presence of the nanoparticle forms the space-charge zone (E)
with the electrons moving from the particle to the semiconductor (A) (whilst
the electric field generated has opposite direction); it has to be noted that
for a p-TiO2 particle, the movement of the electrons and the electric field
generated would be in opposite directions. When n-TiO2 is not decorated
with metal nanoparticles (b) the recombination of the electron-hole pair is
more severe causing a less efficient process. . . . . . . . . . . . . . . . . . 29
1.12 Semiconductors bandgap (left) noble metals work function (middle) and
some redox couples potential values (right). Adapted from [253]. . . . . . . 30
1.13 n-type semiconductor photocatalysis prior (a) and after contact (b) with the
plasmonic noble metal nanoparticle. Adapted from [253]. . . . . . . . . . . 31
1.14 n-type photocatalysis in the absence of a noble metal before (a) and after
contact with the solution (b). Adapted from [253]. . . . . . . . . . . . . . . 31
List of figures ix
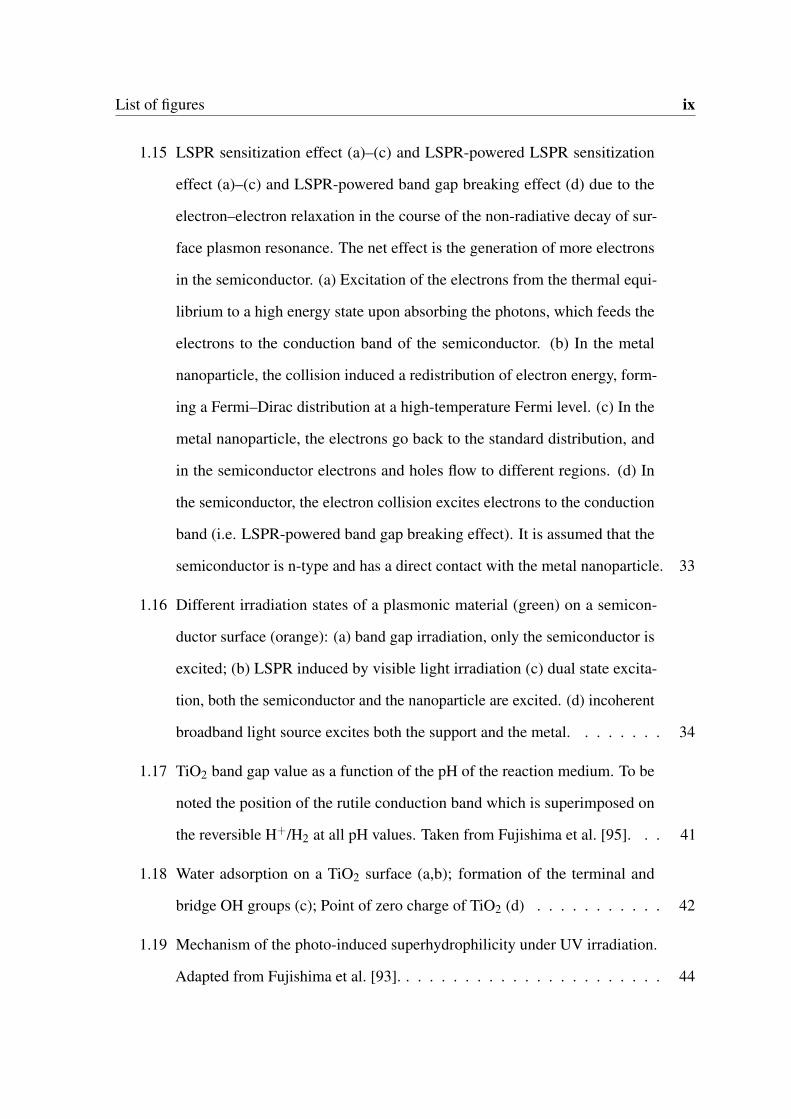
1.15 LSPR sensitization effect (a)–(c) and LSPR-powered LSPR sensitization
effect (a)–(c) and LSPR-powered band gap breaking effect (d) due to the
electron–electron relaxation in the course of the non-radiative decay of sur-
face plasmon resonance. The net effect is the generation of more electrons
in the semiconductor. (a) Excitation of the electrons from the thermal equi-
librium to a high energy state upon absorbing the photons, which feeds the
electrons to the conduction band of the semiconductor. (b) In the metal
nanoparticle, the collision induced a redistribution of electron energy, form-
ing a Fermi–Dirac distribution at a high-temperature Fermi level. (c) In the
metal nanoparticle, the electrons go back to the standard distribution, and
in the semiconductor electrons and holes flow to different regions. (d) In
the semiconductor, the electron collision excites electrons to the conduction
band (i.e. LSPR-powered band gap breaking effect). It is assumed that the
semiconductor is n-type and has a direct contact with the metal nanoparticle. 33
1.16 Different irradiation states of a plasmonic material (green) on a semicon-
ductor surface (orange): (a) band gap irradiation, only the semiconductor is
excited; (b) LSPR induced by visible light irradiation (c) dual state excita-
tion, both the semiconductor and the nanoparticle are excited. (d) incoherent
broadband light source excites both the support and the metal. . . . . . . . 34
1.17 TiO2 band gap value as a function of the pH of the reaction medium. To be
noted the position of the rutile conduction band which is superimposed on
the reversible H+/H2 at all pH values. Taken from Fujishima et al. [95]. . . 41
1.18 Water adsorption on a TiO2 surface (a,b); formation of the terminal and
bridge OH groups (c); Point of zero charge of TiO2 (d) . . . . . . . . . . . 42
1.19 Mechanism of the photo-induced superhydrophilicity under UV irradiation.
Adapted from Fujishima et al. [93]. . . . . . . . . . . . . . . . . . . . . . . 44
x List of figures
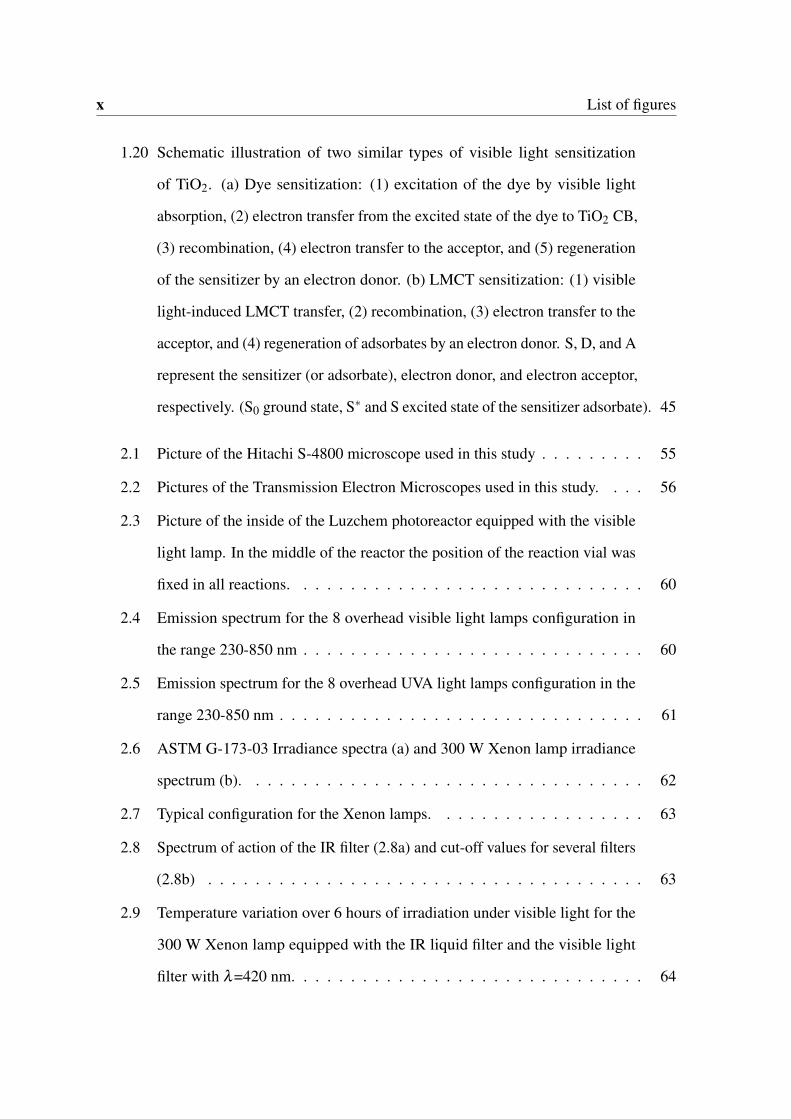
1.20 Schematic illustration of two similar types of visible light sensitization
of TiO2. (a) Dye sensitization: (1) excitation of the dye by visible light
absorption, (2) electron transfer from the excited state of the dye to TiO2 CB,
(3) recombination, (4) electron transfer to the acceptor, and (5) regeneration
of the sensitizer by an electron donor. (b) LMCT sensitization: (1) visible
light-induced LMCT transfer, (2) recombination, (3) electron transfer to the
acceptor, and (4) regeneration of adsorbates by an electron donor. S, D, and A
represent the sensitizer (or adsorbate), electron donor, and electron acceptor,
respectively. (S0 ground state, S∗ and S excited state of the sensitizer adsorbate). 45
2.1 Picture of the Hitachi S-4800 microscope used in this study . . . . . . . . . 55
2.2 Pictures of the Transmission Electron Microscopes used in this study. . . . 56
2.3 Picture of the inside of the Luzchem photoreactor equipped with the visible
light lamp. In the middle of the reactor the position of the reaction vial was
fixed in all reactions. . . . . . . . . . . . . . . . . . . . . . . . . . . . . . 60
2.4 Emission spectrum for the 8 overhead visible light lamps configuration in
the range 230-850 nm . . . . . . . . . . . . . . . . . . . . . . . . . . . . . 60
2.5 Emission spectrum for the 8 overhead UVA light lamps configuration in the
range 230-850 nm . . . . . . . . . . . . . . . . . . . . . . . . . . . . . . . 61
2.6 ASTM G-173-03 Irradiance spectra (a) and 300 W Xenon lamp irradiance
spectrum (b). . . . . . . . . . . . . . . . . . . . . . . . . . . . . . . . . . 62
2.7 Typical configuration for the Xenon lamps. . . . . . . . . . . . . . . . . . 63
2.8 Spectrum of action of the IR filter (2.8a) and cut-off values for several filters
(2.8b) . . . . . . . . . . . . . . . . . . . . . . . . . . . . . . . . . . . . . 63
2.9 Temperature variation over 6 hours of irradiation under visible light for the
300 W Xenon lamp equipped with the IR liquid filter and the visible light
filter with λ=420 nm. . . . . . . . . . . . . . . . . . . . . . . . . . . . . . 64

List of figures xi
3.1 (3.1a) Two possible configuration of the glucose-TiO2 complex; (3.1b) Lig-
and to metal charge transfer complex responsible for the TiO2 photoactivity
under visible light. Taken from Kim et al. [130]. . . . . . . . . . . . . . . . 71
3.2 Time on line (TOL) glucose conversion under visible and UVA light over
240 minutes for the different catalyst to substrate ratio values. . . . . . . . 72
3.3 Heterogeneous photocatalysis reaction rate dependence on catalyst concen-
tration. Adapted from Kisch [132]. . . . . . . . . . . . . . . . . . . . . . . 73
3.4 Representation of the low-index anatase phases (a) (110); (b)(100); (c) (001) 77
3.5 Representation of the low-index rutile phases (a) (101); (b)(100); (c) (001) . 78
3.6 Solid UV-Vis spectra of the different TiO2 polymorphs (rutile and anatase)
and Degussa P25. . . . . . . . . . . . . . . . . . . . . . . . . . . . . . . . 78
3.7 TOL glucose conversion of the P25 calcined samples under visible and UVA
light . . . . . . . . . . . . . . . . . . . . . . . . . . . . . . . . . . . . . . 82
3.8 Solid UV-Vis spectra of the starting P25 and of the heat treated samples at
different temperatures. . . . . . . . . . . . . . . . . . . . . . . . . . . . . 83
3.9 PXRD pattern for A) TiO2 –P25, B) P25-500°C and C) P25-600°C. . . . . 84
3.10 Glucose conversion obtained using two different Xenon lamps 300 W (3.10a)
and 1000 W (3.10b) with and without the visible light filter using H2O and
the 50/50 v/v H2O/MeCN mixture. . . . . . . . . . . . . . . . . . . . . . . 86
3.11 Filter Transmittance profile (blue) and the TiO2 Kubelka-Munk function in
the 300-800 nm range. The cut off value defined at the 50% transmittance is
partially transparent in 400-420 nm range. . . . . . . . . . . . . . . . . . . 87
3.12 UV-Vis MeCN absorption spectrum. . . . . . . . . . . . . . . . . . . . . . 89
4.1 Glucose conversion values for the 1 wt% Ag/TiO2 and for the TiO2 under
the same experimental conditions. . . . . . . . . . . . . . . . . . . . . . . 93
xii List of figures
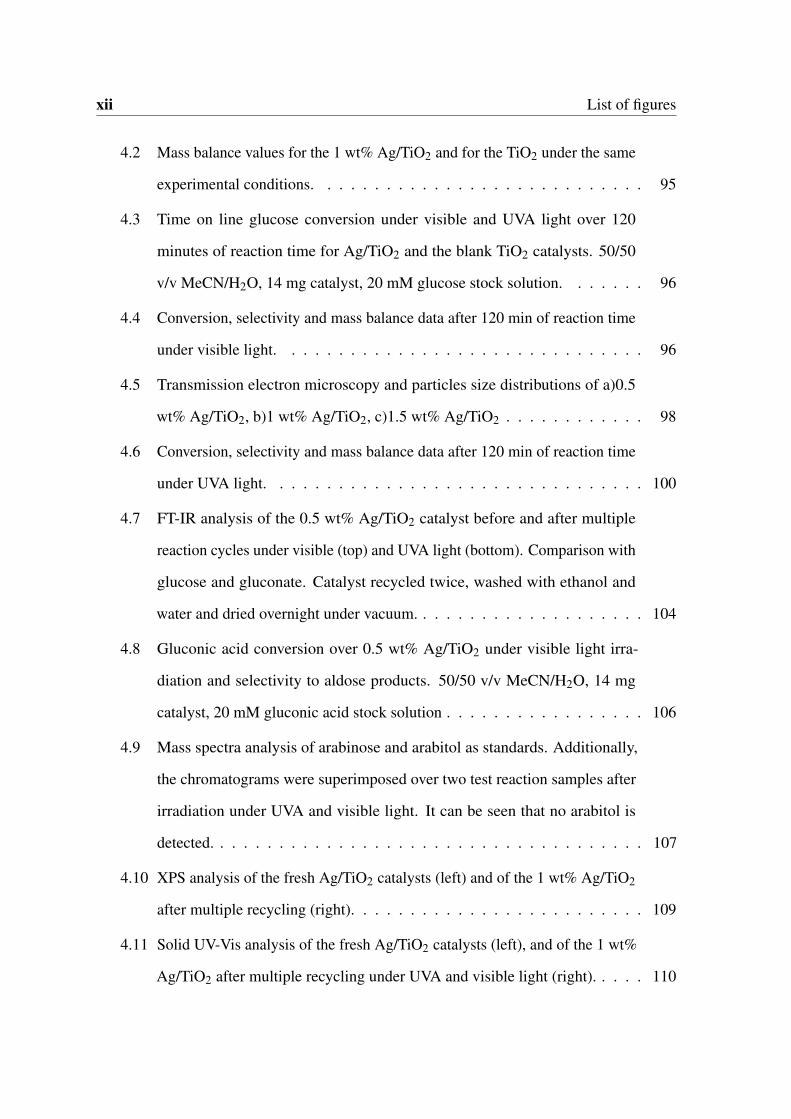
4.2 Mass balance values for the 1 wt% Ag/TiO2 and for the TiO2 under the same
experimental conditions. . . . . . . . . . . . . . . . . . . . . . . . . . . . 95
4.3 Time on line glucose conversion under visible and UVA light over 120
minutes of reaction time for Ag/TiO2 and the blank TiO2 catalysts. 50/50
v/v MeCN/H2O, 14 mg catalyst, 20 mM glucose stock solution. . . . . . . 96
4.4 Conversion, selectivity and mass balance data after 120 min of reaction time
under visible light. . . . . . . . . . . . . . . . . . . . . . . . . . . . . . . 96
4.5 Transmission electron microscopy and particles size distributions of a)0.5
wt% Ag/TiO2, b)1 wt% Ag/TiO2, c)1.5 wt% Ag/TiO2 . . . . . . . . . . . . 98
4.6 Conversion, selectivity and mass balance data after 120 min of reaction time
under UVA light. . . . . . . . . . . . . . . . . . . . . . . . . . . . . . . . 100
4.7 FT-IR analysis of the 0.5 wt% Ag/TiO2 catalyst before and after multiple
reaction cycles under visible (top) and UVA light (bottom). Comparison with
glucose and gluconate. Catalyst recycled twice, washed with ethanol and
water and dried overnight under vacuum. . . . . . . . . . . . . . . . . . . . 104
4.8 Gluconic acid conversion over 0.5 wt% Ag/TiO2 under visible light irra-
diation and selectivity to aldose products. 50/50 v/v MeCN/H2O, 14 mg
catalyst, 20 mM gluconic acid stock solution . . . . . . . . . . . . . . . . . 106
4.9 Mass spectra analysis of arabinose and arabitol as standards. Additionally,
the chromatograms were superimposed over two test reaction samples after
irradiation under UVA and visible light. It can be seen that no arabitol is
detected. . . . . . . . . . . . . . . . . . . . . . . . . . . . . . . . . . . . . 107
4.10 XPS analysis of the fresh Ag/TiO2 catalysts (left) and of the 1 wt% Ag/TiO2
after multiple recycling (right). . . . . . . . . . . . . . . . . . . . . . . . . 109
4.11 Solid UV-Vis analysis of the fresh Ag/TiO2 catalysts (left), and of the 1 wt%
Ag/TiO2 after multiple recycling under UVA and visible light (right). . . . . 110
List of figures xiii
4.12 HRTEM analysis of 0.5 wt% Ag/TiO2 showing Ag particles of ca. 4.5
nm. Bottom right: expanded image of Ag nanoparticle showing interplanar
distances of 0.24 nm, Bottom left: Profile fit for 10 lattice planes . . . . . . 111
4.13 Catalyst recycle runs for the 1 wt% Ag/TiO2 under visible (black) and UVA
light (red). The conversion and the mass balance values reported are taken
from the samples after 120 min of reaction. . . . . . . . . . . . . . . . . . 111
4.14 TEM micrograph of the recycled catalyst 0.5 wt% Ag/TiO2 used under
visible light (4.14a) and under UVA light (4.14b); (4.14c) EDX analysis of
recycled 0.5 wt% Ag/TiO2 used under visible light . . . . . . . . . . . . . 113
4.15 Multicoloured Ag/TiO2 film. Each spot (6 mm diameter) was irradiated
successively with a blue, green, red, or white light. A xenon lamp and an
UV-cut filter (blocking light below 400 nm) were used with an appropriate
band-pass filter (blue, 460 nm, 10 mW cm−2, 1 h; green, 520 nm, 11 mW
cm−2, 30 min; red, 630 nm, 10 mW cm−2, 30 min) or without any band-pass
filter (white, 480 mW cm−2, 10 min). Taken from Naoi et al. [181]. . . . . 114
4.16 Adapted from Kawahara et al. [122]. . . . . . . . . . . . . . . . . . . . . . 115
4.17 Particle size distribution values for the 1.5 wt% Ag/TiO2 after 4 hours of
exposure to visible and UVA light. The effect of the reaction medium was
also evaluated by suspending the catalyst in pure H2O and in the MeCN/H2O
50/50 v/v mixture. . . . . . . . . . . . . . . . . . . . . . . . . . . . . . . . 117
4.18 Schematic representation of the oxidation of Ag nanoparticles via the LSPR
and the subsequent redeposition of smaller satellite Ag nanoparticles (top-
left) and for a nanorod under polarized light along box axes (bottom-left).
On the right are reported some AFM images before and after irradiation of
some Ag nanorods with the formation of satellite Ag nanoparticles on TiO2.
Taken from Kazuma et al. [124], Kazuma and Tatsuma [125] . . . . . . . . 118
xiv List of figures
4.19 Particle size distribution values for the 1.5 wt% Ag/TiO2 after 4 hours of
exposure to visible and UVA light. The effect of the reaction medium was
also evaluated by suspending the catalyst in pure H2O and in the MeCN/H2O
50/50 v/v mixture. . . . . . . . . . . . . . . . . . . . . . . . . . . . . . . . 118
4.20 Glucose conversion for several unsupported metal colloidal solutions. Typi-
cal reaction parameters: Metal: 10−4 M; Glucose: 0.35 M; T: 30°C. Taken
from Comotti et al. [64]. . . . . . . . . . . . . . . . . . . . . . . . . . . . 119
4.21 Glucose conversion for several unsupported metal colloidal solutions. Typi-
cal reaction parameters: Metal: 10−4 M; Glucose: 0.35 M . . . . . . . . . 120
4.22 Representative chromatograms acquired at 210 nm at the beginning of the
reaction and after 1800 seconds. . . . . . . . . . . . . . . . . . . . . . . . 121
5.1 Equimolar (2.8 mM) TIC chromatograms for the 3 standard compounds
available: cellobiose (black) cellobionic acid (red) and cellobiosan (blue). . 126
5.2 5.2a TIC chromatograms for the 24 hours reaction under visible light with
TiO2 (black) 1%wt Au/TiO2 (red) and 1wt% Ag/TiO2 (blue) and the decon-
voluted peaks for the reaction products identified during the QTOF analysis
(5.2b). . . . . . . . . . . . . . . . . . . . . . . . . . . . . . . . . . . . . . 128
5.3 Product distribution values for the Au0.85Ag0.15/TiO2 obtained varying the
reaction medium and the light source for the 2.8 mM cellobiose solution. . 135
5.4 Product distribution values for the Au0.85Ag0.15/TiO2 obtained varying the
reaction medium and the light source for the 10 mM cellobiose solution. . . 136
5.5 Cellobiose molecular structure with the highlighted β -1,4 glycosydic bond. 136
List of figures xv
5.6 Optimized structure of the adsorbed cellobiose on kaolinite surfaces with the
hydrogen bonds configuration (blue dot line and arrow) on a fully hydrox-
ylated surface for the : (a) "up" side of the cellobiose; (b) "down" side of
the cellobiose. The White, red, pink, yellow color denote hydrogen, oxygen,
aluminum, and silicon atoms respectively. Taken from Lee et al. [143]. . . . 137
5.7 FT-IR analysis of cellobiose and cellobionic acid as standards and of the
Au0.85Ag0.15/TiO2 catalyst after visible and UVA irradiation. . . . . . . . . 137
5.8 Cellobiose conversion for the 2.8 (left) and 10 mM (right) solutions with the
different reaction media considered under visible and UVA light. . . . . . . 139
5.9 Supported 1% w/w AuAg metal nanoparticles. From left to right: Au/TiO2
(A), Au0.95Ag0.05/TiO2 (B), Au0.85Ag0.15/TiO2 (C), Au0.50Ag0.50/TiO2 (D),
Au0.15Ag0.85/TiO2, Au0.05Ag0.95/TiO2 (E), AuAg/TiO2 (F), Ag/TiO2 (G),
TiO2 (H). On the left the 1%w/w Au/TiO2 (A) shows the classic purple color
and with the addition of Ag as a second metal we obtain the grayish color
of the 1% w/w Ag/TiO2 catalyst (G). On the far right the naked TiO2 (H) is
shown as a comparison. . . . . . . . . . . . . . . . . . . . . . . . . . . . . 141
5.10 5.10a UV-Vis spectra of the unsupported mono and bimetallic colloidal
solutions; 5.10b Maximum of absorption (nm) for the unsupported colloidal
() and supported (•) bimetallic nanoparticles as a function of the Ag molar
loading in the nanoalloy. . . . . . . . . . . . . . . . . . . . . . . . . . . . 142
5.11 Solid UV-Vis spectra of the supported AuAg metal nanoparticles. . . . . . . 143
5.13 Stability of the monometallic colloidal solutions and variations of the SPR
absorbance as a function of time. . . . . . . . . . . . . . . . . . . . . . . . 144
5.14 Solid UV-Vis spectra of the supported 1%wt Au/TiO2 catalysts synthesised
using PVA (black) and P123 (red) stabilizing agents. . . . . . . . . . . . . 145
xvi List of figures
5.15 PSD values for the Au catalyst synthesised with PVA (5.15a) and P123
(5.15b) obtained for a total particle count of 300. . . . . . . . . . . . . . . 146
5.16 Micrograph of the Au0.05Ag0.95/TiO2 bimetallic catalyst and STEM images
acquired for the same material. . . . . . . . . . . . . . . . . . . . . . . . . 148
5.17 STEM images of the Ag/TiO2 catalyst. The bright spots are due to the
metallic Ag conglomerates. . . . . . . . . . . . . . . . . . . . . . . . . . . 148
5.18 STEM analysis of the fresh Au0.85Ag0.15/TiO2 catalyst under visible light.
On the right it is possible to see the EDS elemental mapping images for the
Au and Ag. . . . . . . . . . . . . . . . . . . . . . . . . . . . . . . . . . . 149
5.19 XPS detailed regions for the Ag 3d (5.19a) and Au 4f (5.19b) peaks for mono
and bimetallic Au1Ag1−x/TiO2 catalysts. . . . . . . . . . . . . . . . . . . . 150
5.20 Cellobiose conversion for the catalysts considered in this study as a function
of the substrate concentration and the reaction medium under UVA irradiation
(e.g.) and under visible light (e.g.) as shown by the left hand side legend. 153
5.21 Recycling experiments on Au0.85Ag0.15/TiO2: cellobiose conversion and
mass balance (left) and Product distribution values for the Au0.85Ag0.15/TiO2
after multiple reuses under visible (left) and UVA light (right). . . . . . . . 154
5.22 UV-Vis spectra of the recycled Au0.85Ag0.15/TiO2 catalyst after multiple
reuses under visible and UVA light. . . . . . . . . . . . . . . . . . . . . . 154
5.23 HRTEM images of the Au0.85Ag0.15/TiO2 fresh catalyst (5.23a) and after 2
reuses under UVA light (5.23b). . . . . . . . . . . . . . . . . . . . . . . . 155
6.1 Formation of Zn-Cellulose complex in molten salts hydrates. Taken from
Amarasekara and Ebede [9]. . . . . . . . . . . . . . . . . . . . . . . . . . 164
6.2 (a) Filtrated samples obtained from the hydrolysis of cellobiose using ZnCl2
under hydrothermal conditions. (b) Aspect of the reaction mixtures after 2
hours under hydrothermal conditions with ZnCl2 66% w/w. . . . . . . . . . 164
List of figures xvii
6.3 High throughput system created to test up to 6 catalysts at once. . . . . . . 168
6.4 WI Synthesised catalysts -1 wt% Cu1Ag(1−x)/TiO2 (High Ag loading (left)
to high Cu loading (right)) . . . . . . . . . . . . . . . . . . . . . . . . . . 169
6.5 6.5a solid UV-Vis spectra of the supported bimetallic CuAg/TiO2 catalysts;
6.5b Maximum of absorption (nm) for the unsupported colloidal () as a
function of the Ag molar loading in the nanoalloy. . . . . . . . . . . . . . . 169
6.6 1 wt% Cu1Au(1−x)/TiO2 (High Au loading (left) to high Cu loading (right)) 170
6.7 Cellobiose conversion values reported with the carousel set-up for the CuAg
and CuAu set of catalysts. . . . . . . . . . . . . . . . . . . . . . . . . . . 171
6.8 Au nanoboxes and nanocages prepared by reacting Ag nanocubes with
different volumes of a HAuCl4 solution and corresponding UV-Vis spectra.
Taken from Skrabalak et al. [218]. . . . . . . . . . . . . . . . . . . . . . . 171
6.9 SEM picture of the α-cellulose used in this study (a) and its molecular
structure with the H-bond network in evidence (b) . . . . . . . . . . . . . . 172
A.1 A.1a DAD signals recorded at 210 nm. It can be seen how the glucose
absorption profile (red) is 0 at 8.6 minutes and only gluconic acid can be
quantified; A.1b DAD signals recorded at 210 nm. It can be seen how the
cellobiose absorption profile (red) is 0 at 7 minutes and only cellobionic acid
can be quantified . . . . . . . . . . . . . . . . . . . . . . . . . . . . . . . 196
A.2 Picture of the Agilent 6530 QTOF instrument used in this work. . . . . . . 198
A.3 Nomenclature for the fragmentation pattern of polysaccharides adapted from
Domon and Costello [77] . . . . . . . . . . . . . . . . . . . . . . . . . . . 199
A.4 Electrospray ionisation source installed on the Agilent 6530 . . . . . . . . 200
A.5 Coulombian effect and charging mechanisms of the eluent droplets with the
formation of a bare ion . . . . . . . . . . . . . . . . . . . . . . . . . . . . 201
xviii List of figures
A.6 Schematic representation of a QTOF system. The nebuliser, the capillary
and the entrance to the ion optics are circled in orange. . . . . . . . . . . . 202
B.1 Molecular structures of lactose (left) and cellobiose (right) . . . . . . . . . 203
B.2 Molecular structures of the α-D-cellobiose and the β -D-cellobiose (B.2a)
and Cellobiose 13C NMR spectra (B.2b). Taken from Amarasekara et al. [10] 205
B.3 13C NMR cellobiose . . . . . . . . . . . . . . . . . . . . . . . . . . . . . 205
B.4 1H NMR comparison between cellobiose and cellobionic acid . . . . . . . 206
B.5 1H NMR cellobionic acid . . . . . . . . . . . . . . . . . . . . . . . . . . 206
B.6 13C NMR cellobionic acid . . . . . . . . . . . . . . . . . . . . . . . . . . 207
B.7 13C NMR cellobiose . . . . . . . . . . . . . . . . . . . . . . . . . . . . . 208
B.8 Cellobionic acid and cellobiose molecular ions and ion species detected . . 209
C.1 Diffraction, reflection and refraction phenomena occurring upon light irradi-
ation on solid samples . . . . . . . . . . . . . . . . . . . . . . . . . . . . . 212
C.2 Typical instrumental configuration for a spectrophotometer equipped with a
integrating sphere. . . . . . . . . . . . . . . . . . . . . . . . . . . . . . . . 213
C.3 Typical reflectance profiles obtained from the different TiO2 polymorphs
using BaSO4 as reference . . . . . . . . . . . . . . . . . . . . . . . . . . . 214
C.4 Schematic bandgap transition representation. (a) allowed direct transition;
(b)forbidden direct transition; (c) allowed indirect transition with the required
assistance of a phonon. All these transition are possible only with a photon
of energy ≥Eg. Adapted from [156] . . . . . . . . . . . . . . . . . . . . . 215
C.5 UV-Vis absorption profile (C.5a) for Ag/TiO2 supported catalyst with differ-
ent metal loadings and the corresponding Tauc plot (C.5b) in which only the
LSPR can be observed . . . . . . . . . . . . . . . . . . . . . . . . . . . . 215
List of figures xix
E.1 STEM micrographs of the 1.5 wt% Ag/TiO2 fresh catalyst which do not
show the the presence of large metallic nanoparticles on the fresh material. . 227
E.2 TEM micrographs of the 1.5 wt% Ag/TiO2 fresh catalyst. . . . . . . . . . . 228
E.3 TEM micrographs of the 1.5 wt% Ag/TiO2 of the catalyst exposed to visible
light in pure H2O. . . . . . . . . . . . . . . . . . . . . . . . . . . . . . . . 228
E.4 STEM micrographs of the 1.5 wt% Ag/TiO2 (left) and dark field images
(right) of the catalyst exposed to visible light in pure H2O. . . . . . . . . . 229
E.5 TEM micrographs of the 1.5 wt% Ag/TiO2 of the catalyst exposed to visible
light in the 50/50 v/v MeCN/H2O mixture. . . . . . . . . . . . . . . . . . . 230
E.6 STEM micrographs of the 1.5 wt% Ag/TiO2 (left) and dark field images
(right) of the catalyst exposed to visible light in the 50/50 v/v MeCN/H2O
mixture. . . . . . . . . . . . . . . . . . . . . . . . . . . . . . . . . . . . . 230
E.7 STEM micrographs of the 1.5 wt% Ag/TiO2 (left) and dark field images
(right) of the catalyst exposed to UVA light in pure H2O. . . . . . . . . . . 231
E.8 TEM micrographs of the 1.5 wt% Ag/TiO2 of the catalyst exposed to UVA
light in pure H2O. . . . . . . . . . . . . . . . . . . . . . . . . . . . . . . . 232
E.9 TEM micrographs of the 1.5 wt% Ag/TiO2of the catalyst exposed to UVA
light in in the 50/50 v/v MeCN/H2O mixture. . . . . . . . . . . . . . . . . 233
E.10 STEM micrographs of the 1.5 wt% Ag/TiO2 (left) and dark field images
(right) of the catalyst exposed to UVA light in in the 50/50 v/v MeCN/H2O
mixture. . . . . . . . . . . . . . . . . . . . . . . . . . . . . . . . . . . . . 234
F.1 TEM micrographs of the supported metal nanoparticles. . . . . . . . . . . . 236
F.2 Particle size distribution of the supported metal nanoparticles. Unfortunately,
it was not possible to obtain the PSD values for the Au0.05Ag0.95/TiO2 and
for the Ag/TiO2. . . . . . . . . . . . . . . . . . . . . . . . . . . . . . . . . 237

List of tables
1.1 Some of the platform chemicals obtainable from biomass, their bio-derived
chemicals and possible applications. Adapted
from Chatterjee et al. [49]. . . . . . . . . . . . . . . . . . . . . . . . . . . 9
1.2 General advantages and disadvantages of the most common routes for
biomass transformations. Adapted from Chatterjee et al. [49]. . . . . . . . . 10
1.3 Selected examples of the different heterogeneous catalysts used in the glucose
oxidation reaction . . . . . . . . . . . . . . . . . . . . . . . . . . . . . . . 12
1.4 Overpotential values for several metallic electrodes for the hydrogen and
oxygen semi-reactions. . . . . . . . . . . . . . . . . . . . . . . . . . . . . 19
2.1 Synthetic parameters for the Au and Ag loadings for each of the mono and
bimetallic catalysts synthesised. . . . . . . . . . . . . . . . . . . . . . . . 52
2.2 Instrument specification for the microscope used in this work. . . . . . . . 55
2.3 Instrument specifications of the two microscopes used in the study . . . . . 57
2.4 Typical NMR settings used for the 1H, 13C spectra aquisition. . . . . . . . . 59
xxii List of tables
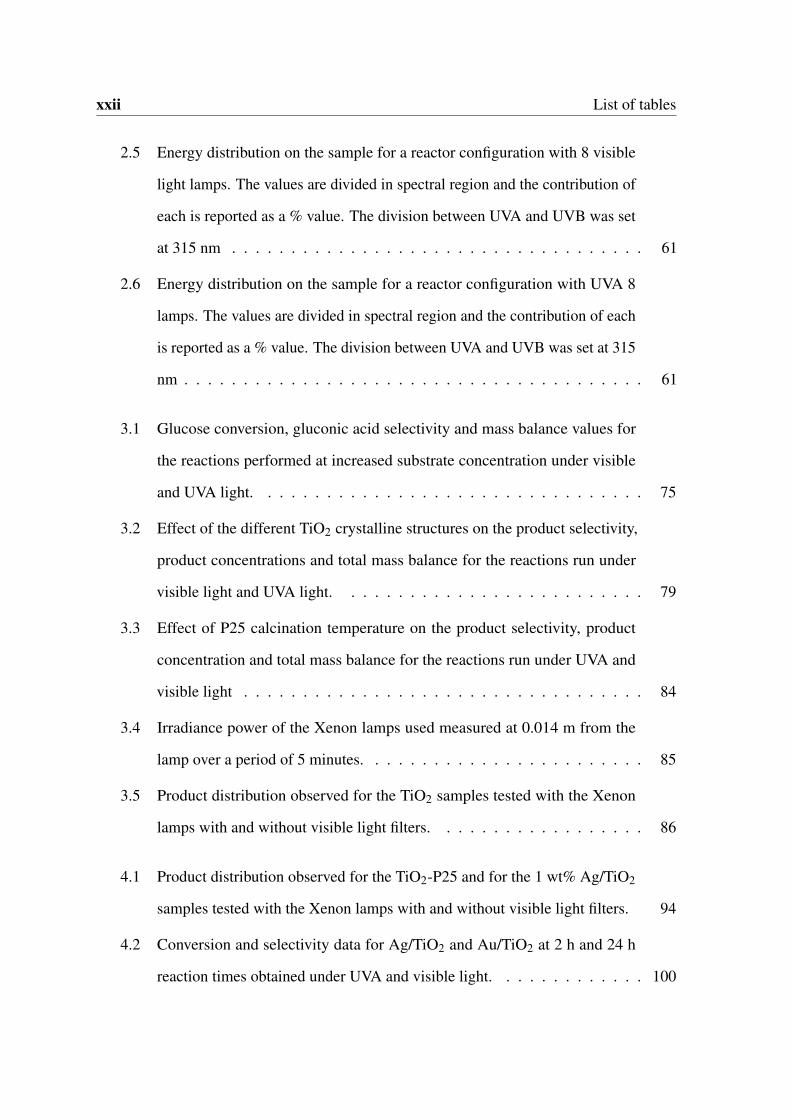
2.5 Energy distribution on the sample for a reactor configuration with 8 visible
light lamps. The values are divided in spectral region and the contribution of
each is reported as a % value. The division between UVA and UVB was set
at 315 nm . . . . . . . . . . . . . . . . . . . . . . . . . . . . . . . . . . . 61
2.6 Energy distribution on the sample for a reactor configuration with UVA 8
lamps. The values are divided in spectral region and the contribution of each
is reported as a % value. The division between UVA and UVB was set at 315
nm . . . . . . . . . . . . . . . . . . . . . . . . . . . . . . . . . . . . . . . 61
3.1 Glucose conversion, gluconic acid selectivity and mass balance values for
the reactions performed at increased substrate concentration under visible
and UVA light. . . . . . . . . . . . . . . . . . . . . . . . . . . . . . . . . 75
3.2 Effect of the different TiO2 crystalline structures on the product selectivity,
product concentrations and total mass balance for the reactions run under
visible light and UVA light. . . . . . . . . . . . . . . . . . . . . . . . . . 79
3.3 Effect of P25 calcination temperature on the product selectivity, product
concentration and total mass balance for the reactions run under UVA and
visible light . . . . . . . . . . . . . . . . . . . . . . . . . . . . . . . . . . 84
3.4 Irradiance power of the Xenon lamps used measured at 0.014 m from the
lamp over a period of 5 minutes. . . . . . . . . . . . . . . . . . . . . . . . 85
3.5 Product distribution observed for the TiO2 samples tested with the Xenon
lamps with and without visible light filters. . . . . . . . . . . . . . . . . . 86
4.1 Product distribution observed for the TiO2-P25 and for the 1 wt% Ag/TiO2
samples tested with the Xenon lamps with and without visible light filters. 94
4.2 Conversion and selectivity data for Ag/TiO2 and Au/TiO2 at 2 h and 24 h
reaction times obtained under UVA and visible light. . . . . . . . . . . . . 100
List of tables xxiii
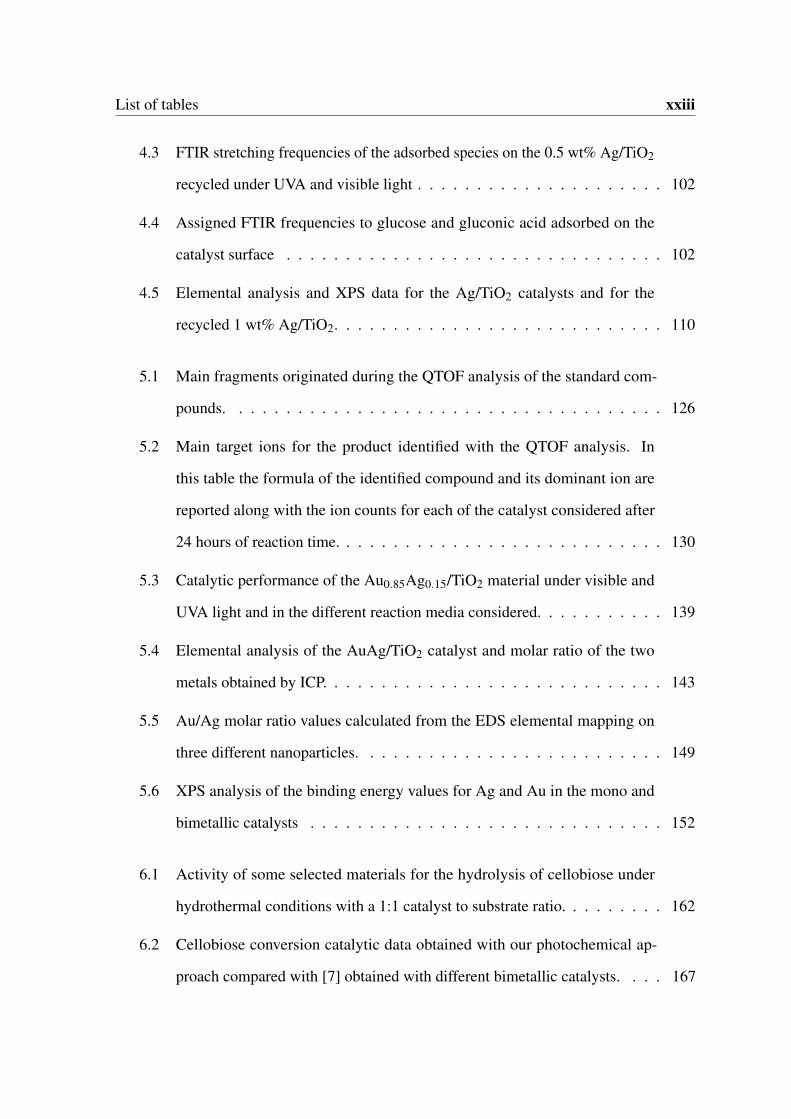
4.3 FTIR stretching frequencies of the adsorbed species on the 0.5 wt% Ag/TiO2
recycled under UVA and visible light . . . . . . . . . . . . . . . . . . . . . 102
4.4 Assigned FTIR frequencies to glucose and gluconic acid adsorbed on the
catalyst surface . . . . . . . . . . . . . . . . . . . . . . . . . . . . . . . . 102
4.5 Elemental analysis and XPS data for the Ag/TiO2 catalysts and for the
recycled 1 wt% Ag/TiO2. . . . . . . . . . . . . . . . . . . . . . . . . . . . 110
5.1 Main fragments originated during the QTOF analysis of the standard com-
pounds. . . . . . . . . . . . . . . . . . . . . . . . . . . . . . . . . . . . . 126
5.2 Main target ions for the product identified with the QTOF analysis. In
this table the formula of the identified compound and its dominant ion are
reported along with the ion counts for each of the catalyst considered after
24 hours of reaction time. . . . . . . . . . . . . . . . . . . . . . . . . . . . 130
5.3 Catalytic performance of the Au0.85Ag0.15/TiO2 material under visible and
UVA light and in the different reaction media considered. . . . . . . . . . . 139
5.4 Elemental analysis of the AuAg/TiO2 catalyst and molar ratio of the two
metals obtained by ICP. . . . . . . . . . . . . . . . . . . . . . . . . . . . . 143
5.5 Au/Ag molar ratio values calculated from the EDS elemental mapping on
three different nanoparticles. . . . . . . . . . . . . . . . . . . . . . . . . . 149
5.6 XPS analysis of the binding energy values for Ag and Au in the mono and
bimetallic catalysts . . . . . . . . . . . . . . . . . . . . . . . . . . . . . . 152
6.1 Activity of some selected materials for the hydrolysis of cellobiose under
hydrothermal conditions with a 1:1 catalyst to substrate ratio. . . . . . . . . 162
6.2 Cellobiose conversion catalytic data obtained with our photochemical ap-
proach compared with [7] obtained with different bimetallic catalysts. . . . 167
xxiv List of tables
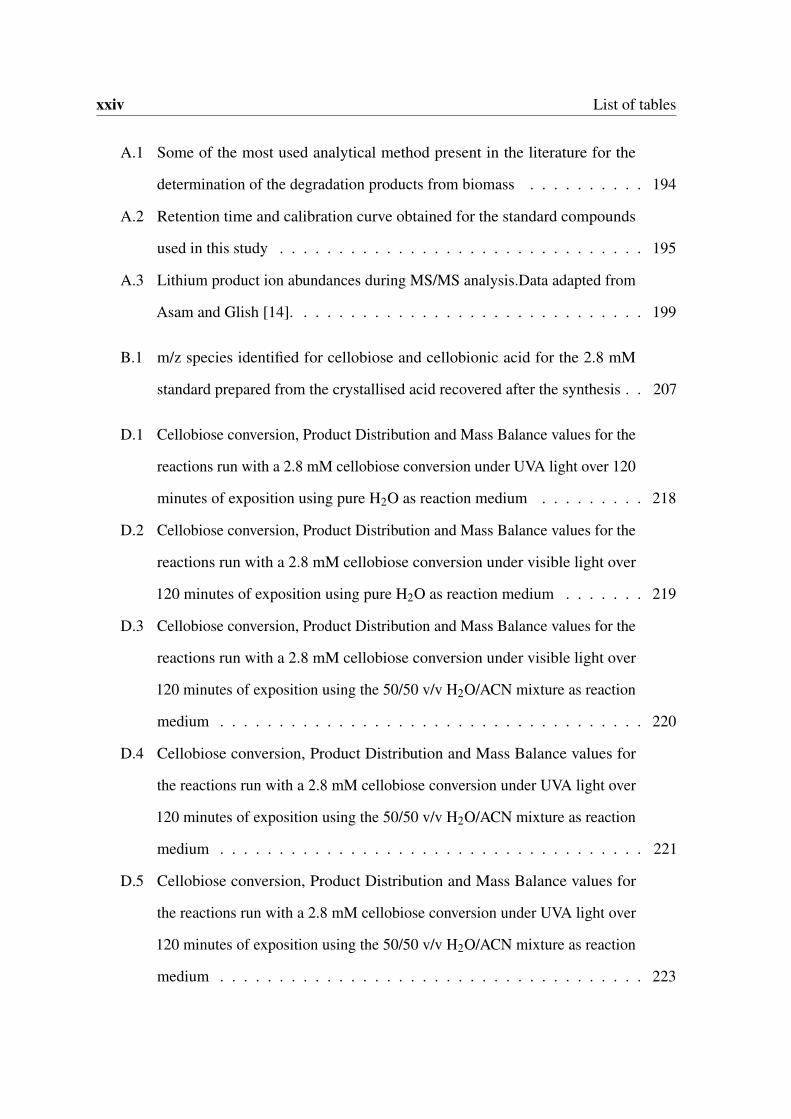
A.1 Some of the most used analytical method present in the literature for the
determination of the degradation products from biomass . . . . . . . . . . 194
A.2 Retention time and calibration curve obtained for the standard compounds
used in this study . . . . . . . . . . . . . . . . . . . . . . . . . . . . . . . 195
A.3 Lithium product ion abundances during MS/MS analysis.Data adapted from
Asam and Glish [14]. . . . . . . . . . . . . . . . . . . . . . . . . . . . . . 199
B.1 m/z species identified for cellobiose and cellobionic acid for the 2.8 mM
standard prepared from the crystallised acid recovered after the synthesis . . 207
D.1 Cellobiose conversion, Product Distribution and Mass Balance values for the
reactions run with a 2.8 mM cellobiose conversion under UVA light over 120
minutes of exposition using pure H2O as reaction medium . . . . . . . . . 218
D.2 Cellobiose conversion, Product Distribution and Mass Balance values for the
reactions run with a 2.8 mM cellobiose conversion under visible light over
120 minutes of exposition using pure H2O as reaction medium . . . . . . . 219
D.3 Cellobiose conversion, Product Distribution and Mass Balance values for the
reactions run with a 2.8 mM cellobiose conversion under visible light over
120 minutes of exposition using the 50/50 v/v H2O/ACN mixture as reaction
medium . . . . . . . . . . . . . . . . . . . . . . . . . . . . . . . . . . . . 220
D.4 Cellobiose conversion, Product Distribution and Mass Balance values for
the reactions run with a 2.8 mM cellobiose conversion under UVA light over
120 minutes of exposition using the 50/50 v/v H2O/ACN mixture as reaction
medium . . . . . . . . . . . . . . . . . . . . . . . . . . . . . . . . . . . . 221
D.5 Cellobiose conversion, Product Distribution and Mass Balance values for
the reactions run with a 2.8 mM cellobiose conversion under UVA light over
120 minutes of exposition using the 50/50 v/v H2O/ACN mixture as reaction
medium . . . . . . . . . . . . . . . . . . . . . . . . . . . . . . . . . . . . 223
List of tables xxv
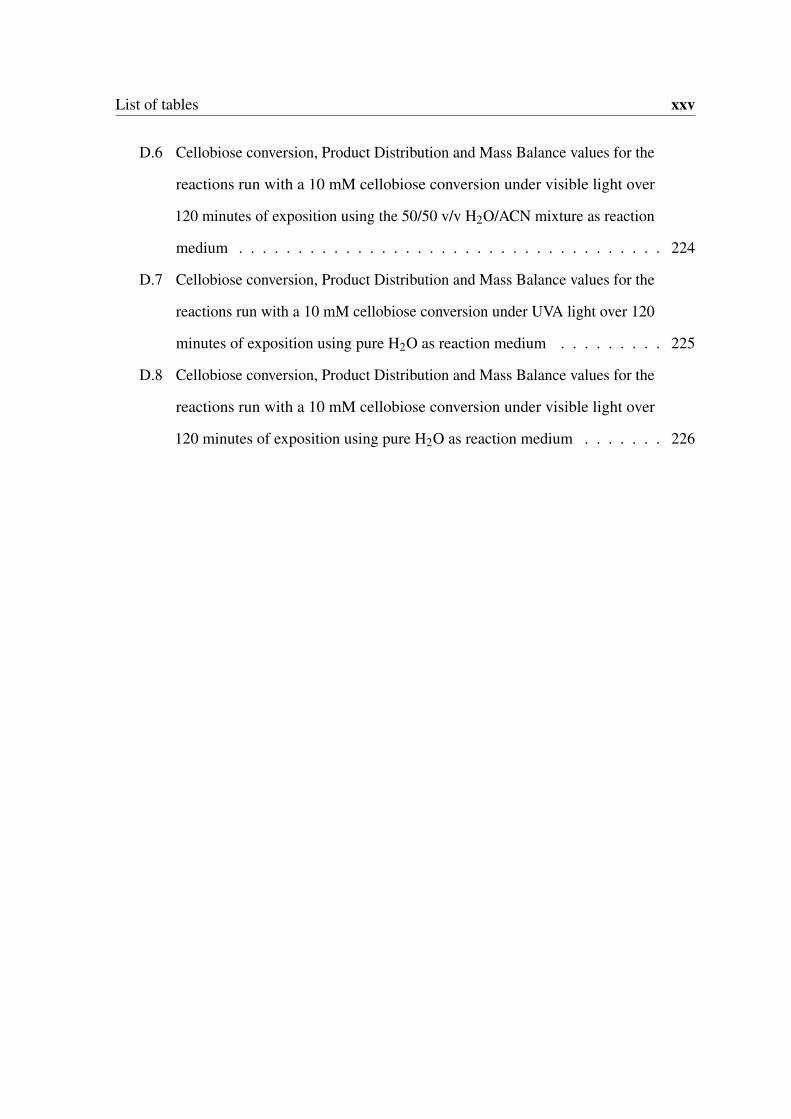
D.6 Cellobiose conversion, Product Distribution and Mass Balance values for the
reactions run with a 10 mM cellobiose conversion under visible light over
120 minutes of exposition using the 50/50 v/v H2O/ACN mixture as reaction
medium . . . . . . . . . . . . . . . . . . . . . . . . . . . . . . . . . . . . 224
D.7 Cellobiose conversion, Product Distribution and Mass Balance values for the
reactions run with a 10 mM cellobiose conversion under UVA light over 120
minutes of exposition using pure H2O as reaction medium . . . . . . . . . 225
D.8 Cellobiose conversion, Product Distribution and Mass Balance values for the
reactions run with a 10 mM cellobiose conversion under visible light over
120 minutes of exposition using pure H2O as reaction medium . . . . . . . 226

Chapter 1Introduction
The band? The band.
J. Blues
The unpredictable trends observed in recent years on the crude oil price along with
profound environmental issues have deeply influenced our dependency on non-renewable
energy sources. In the early seventies, after one of the major oil crises in history, the
research on alternative energy sources observed an exponential growth due to necessity
of exploiting cheaper alternatives by governments and industries informed by scientific
evidence (Figure 1.1). Along with the development of more sustainable ways of harvesting
the power of tides and winds for the production of electricity, the exploitation of solar
irradiation to produce heat and electricity observed a phenomenal increment in government
funds and research projects, and now many of the prototypes developed in the past 40 years
are commercially available products with running costs sometimes even cheaper or at least as
competitive as conventional processes. The use of solar irradiation is an appealing perspective
as in 2000 the United Nations Development Programme assessed that the annual potential of
solar energy (∼50EJ) is several times lager than the world energy consumption which in 2012
was 559.8 exajoules.1 In this new green economy, along with the development of sustainable
1Key World Energy Statistics report by the International Energy Agency (2014)
2 Introduction
(a) (b)
Figure 1.1 Oil price trend since 1948 (1.1a) and the inflation corrected oil price (1.1b). The greyareas represent the economic recession during the last century.
energy sources technologies, the quest for alternative substrates not derived from crude oil
is the challenge that the chemical industry as a whole is undertaking to keep up with the
worldwide demand for bulk and fine chemicals. Biomass, is now considered a “green-oil”, as
it can provide many platform chemicals which are highly functionalized, but at the same time,
because of the complex molecular structure and the presence of heteroatoms such as oxygen,
nitrogen, the chemistry and the processing of such substrates are complex challenges that are
currently being tackled worldwide. One of the first uses of biomass was in the production of
bio-hydrogen via chemical and fermentative processes. Moreover, it has to be noted that the
biomass used as feedstock should not be competing with food production in terms of land and
resources, but on the other hand, should promote a valorisation of waste and of the non-edible
parts of the plant, unlike what is happening for the production of bio-ethanol, bio-diesel and
bio-oils in developing countries [12, 87, 56, 65, 111]. Biomass derivatives such as ethanol,
glycerol and sugars are hydrogen-rich compounds and through hydrogenation processes
the CO2 produced can be reintroduced with photosynthetic reactions to the carbon cycle
without contributing to the production of greenhouse gases. Despite the initial studies on the
photo-reforming of biomass, it seems necessary to try to preserve the chemical functionalities
present on the substrates and use them to produce high-value chemicals from bio-renewables.
For this purpose, in the past 5 years, there has been an increasing amount of attention on the
1.1 Biomass Chemistry 3
possibility of performing selective photo-oxidation on sugars, glycerol and other substrates.
In this short review, after introducing the common traits for various photocatalysts and
illustrating some of the accepted reaction mechanisms responsible for the photoactivity,
this work will briefly describe some of the reaction pathways for the H2 production and
oxidation of bio-derived substrates from biomass, and will then cover the most recent results
on the photo-oxidative reaction conditions required to successfully convert sugars in platform
chemicals.
1.1 Biomass Chemistry
Lignocellulosic biomass is typically made of three fractions: cellulose (35-55%), hemi-
cellulose (20-40%) and lignin (10-20%). In addition to these macro polymers, there are
two categories which account for the remaining fractions: ashes (mineral components) and
extractives (fats, oils, steroids waxes and other phenolic compounds). The ratio between each
of the fractions is determined by the type of plant, age, climate and several other factors, thus
making it difficult to standardize chemical processes and reaction pathways [256, 107, 177].
Cellulose is a homopolymer consisting of β (1→4) linked glycosidic units and the geometry
of the bond linking each of the D-glucose units is responsible for its physical-chemical
properties. In fact, as each of the chain can be as big as 100.000 Da, there is a great interac-
tion between the hydroxyl groups thus creating a strong intra and intermolecular hydrogen
bond network which is responsible for the low cellulose solubility and its tensile strength
[262, 133].
On the other hand, hemicellulose is a mixture of different monosaccharides with different
carbon chain lengths, namely C5 (xylose, arabinose) and C6 (glucose, galactose, mannose)
along with some sugar acids (glucuronic and galacturonic acid mainly); it is generally
characterized by shorter chain lengths and due to the diverse structure of the polysaccharides,
it is a heavily branched polymer unlike cellulose [83]. Finally, lignin is a highly branched

4 Introduction
polymer made of aromatic alcohols, which impart to this biopolymer a very complex and
poorly defined structure. Generally, from lignin four major components can be extracted
via depolymerization reactions such as coumaryl alcohols, sinapyl alcohols, and coniferyl
alcohols which are used in the production of organic compounds, flavouring agents and food
preservatives [57, 177].
1.2 Conventional Processes for Biomass Utilization
Sourcing energy from biomass can be divided in four general categories, (i) crops (herbaceous,
agricultural, industrial and aquatic), (ii) agricultural waste and residues including animal
waste, (iii) paper industry residues (mill wood, shrubs, logging residues) and finally, from
municipal waste, including sewage and industrial waste streams [182]. Within these four
categories, two different process streams are available to produce energy from biomass: the
thermochemical and the fermentative biological routes. Within the thermochemical approach,
liquefaction, pyrolysis, gasification and combustion are the main approaches used, whilst
for biological processes, the biological water-gas shift, the photo and dark fermentation
processes, the direct and indirect bio-photolysis constitute the more common routes, but the
reviewing in detail of these processes exceeds the purposes of the present work (Figure 1.2).
1.2.1 Thermochemical Processes
At high temperatures, biomass decomposes to produce liquid oils, solid residues, a mixture
of gases containing CH4, CO2, H2, CO and other products depending on the composition of
the starting feedstock. During the flash pyrolysis, biomass is rapidly heated up to ca. 550°C
under inert pressure to form a vapour and then condensed. This process, in addition to the
gaseous products described above, also produces oils, tars and other chemicals such as acetic
acid in addition to the solid carbonaceous and inert fractions. Generally, the main reaction
1.2 Conventional Processes for Biomass Utilization 5
Figure 1.2 Different processes available for the conversion of biomass to biofuels [173].
schemes for the production of H2 from biomass are the following:
Biomass+heat → H2 +CO+CH4 +others (1.1)
With the steam reforming, methane which is produced at low temperatures, can be converted
to hydrogen:
CH4 +H2O →CO+3H2 (1.2)
6 Introduction
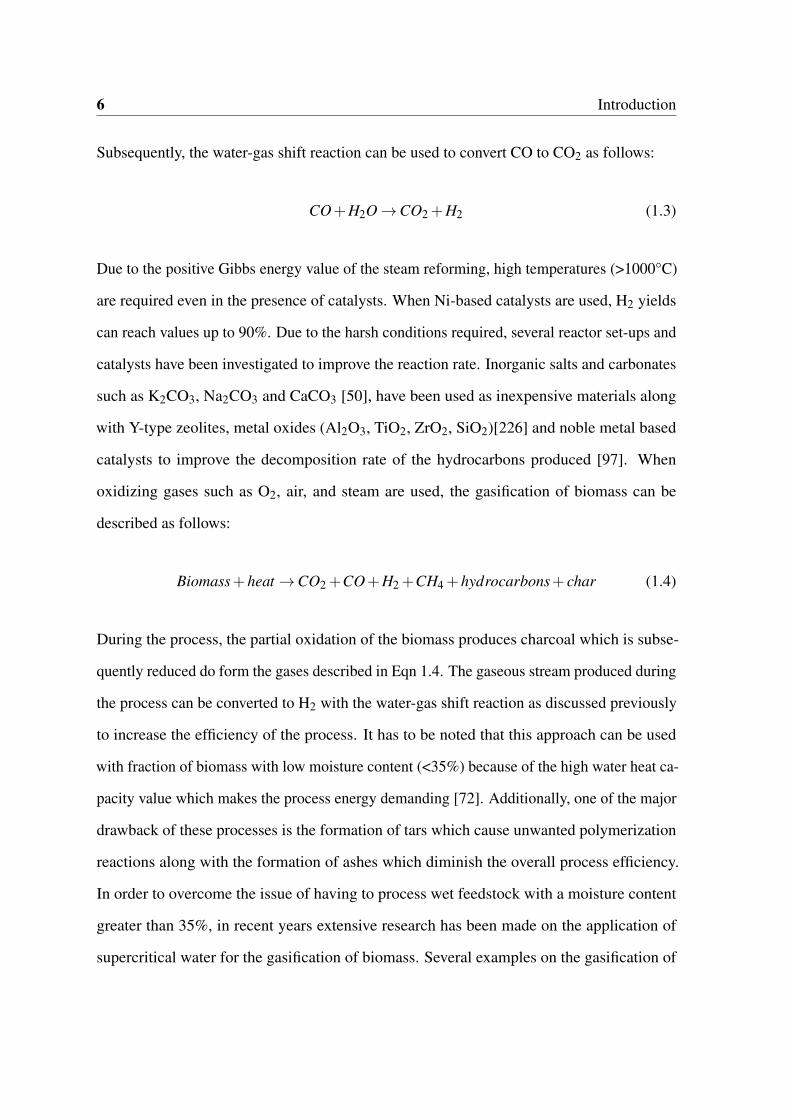
Subsequently, the water-gas shift reaction can be used to convert CO to CO2 as follows:
CO+H2O →CO2 +H2 (1.3)
Due to the positive Gibbs energy value of the steam reforming, high temperatures (>1000°C)
are required even in the presence of catalysts. When Ni-based catalysts are used, H2 yields
can reach values up to 90%. Due to the harsh conditions required, several reactor set-ups and
catalysts have been investigated to improve the reaction rate. Inorganic salts and carbonates
such as K2CO3, Na2CO3 and CaCO3 [50], have been used as inexpensive materials along
with Y-type zeolites, metal oxides (Al2O3, TiO2, ZrO2, SiO2)[226] and noble metal based
catalysts to improve the decomposition rate of the hydrocarbons produced [97]. When
oxidizing gases such as O2, air, and steam are used, the gasification of biomass can be
described as follows:
Biomass+heat →CO2 +CO+H2 +CH4 +hydrocarbons+ char (1.4)
During the process, the partial oxidation of the biomass produces charcoal which is subse-
quently reduced do form the gases described in Eqn 1.4. The gaseous stream produced during
the process can be converted to H2 with the water-gas shift reaction as discussed previously
to increase the efficiency of the process. It has to be noted that this approach can be used
with fraction of biomass with low moisture content (<35%) because of the high water heat ca-
pacity value which makes the process energy demanding [72]. Additionally, one of the major
drawback of these processes is the formation of tars which cause unwanted polymerization
reactions along with the formation of ashes which diminish the overall process efficiency.
In order to overcome the issue of having to process wet feedstock with a moisture content
greater than 35%, in recent years extensive research has been made on the application of
supercritical water for the gasification of biomass. Several examples on the gasification of
1.2 Conventional Processes for Biomass Utilization 7
cellulose and glucose with supercritical water are available in the literature [246, 66], and
the main advantage of this process is that the formation of tars and chars is suppressed. An
overview of the experimental results using glucose was published in a recent review by Ni
et al. [182] and the reader is encouraged to use it as a reference.
1.2.2 Biological Processes
The biological processes introduced at the beginning of this section, are generally found to be
more sustainable and greener alternatives to the thermochemical ones as they require milder
reaction conditions and therefore, much lower running costs. These processes generally
rely on the biological or photo-biological production of hydrogen with the only two known
enzymes which can catalyse this reaction biologically: hydrogenases and nitrogenases
[105, 68, 121]. The conversion of the different saccharides in aqueous solutions is subject
of intense research as it can be approached using homogeneous or heterogeneous systems.
These approaches are aimed at the production of methane from the anaerobic fermentation
in three major reaction steps, which can be summarized with the conversion of the macro
polymers in smaller units such as amino acids, monosaccharides and fatty acids, acid lactic
and ethanol, their conversion into methane and hydrogen by the bacteria and finally, into
methane by the methanogenic bacteria. The biogas thus obtained can either be converted
into hydrogen with by thermal decomposition or cracking reactions and to syngas with
steam reforming or water-gas shift processes [42, 15, 134]. The main drawbacks of these
fermentative techniques are the slow hydrogen production rate and the low concentration of
the gaseous and the difficulty in designing efficient bio-reactors[145].
8 Introduction
1.3 Chemical Conversion of Carbohydrates
As mentioned before, the conversion of biomass into useful chemicals, is one of the greatest
challenges of this century as it can potentially reduce our dependency on oil-exporting
countries and reduce the global footprint of chemical production. Specifically, during the
past 50 years, the research has focused on the production of biofuels from renewable sources
to integrate at first, and then maybe replace completely, the conventional petrochemical
processes. From an economical perspective, carbohydrates are abundant and inexpensive as
they account for 75 wt% of plant biomass and can be the ideal feedstock for both biofuels
and platform chemicals. In fact, the conversion of these chemicals provide access to a wide
range of "versatile chemicals" which can be incorporated in a wide range of applications
as surfactants, bio-polymers, resins and pharmaceutical intermediates, and can be used for
personal care, transportation and packaging to name but a few (Table 1.1).
It has to be pointed out, that the conversion of carbohydrates has a long history, but the
practical applications of some selected reactions on a large scale is still at an infant stage
as this field of research only started in the 1990s whilst petrochemical processes have been
thoroughly studied and continuously developed since the early 1900s. The purpose of this
short review is to give a brief overview of the main platform chemicals and their chemical
synthetic routes, in order to set the basis for the comparison of what can be achieved with
photochemical processes and if this new promising route can be practically viable and not
just a mere academic curiosity.
1.3.1 Pretreatment of Carbohydrates from Biomass
The complex structure of the raw feedstock and the presence of multiple inter-penetrating
layers make pretreatment processes necessary to be able to extract the various fractions
(cellulose and hemicellulose) from lignin. Usually, the pretreatments involve the physical-
chemical transformation of the raw material by ball milling, steam explosion, and acid or
1.3 Chemical Conversion of Carbohydrates 9
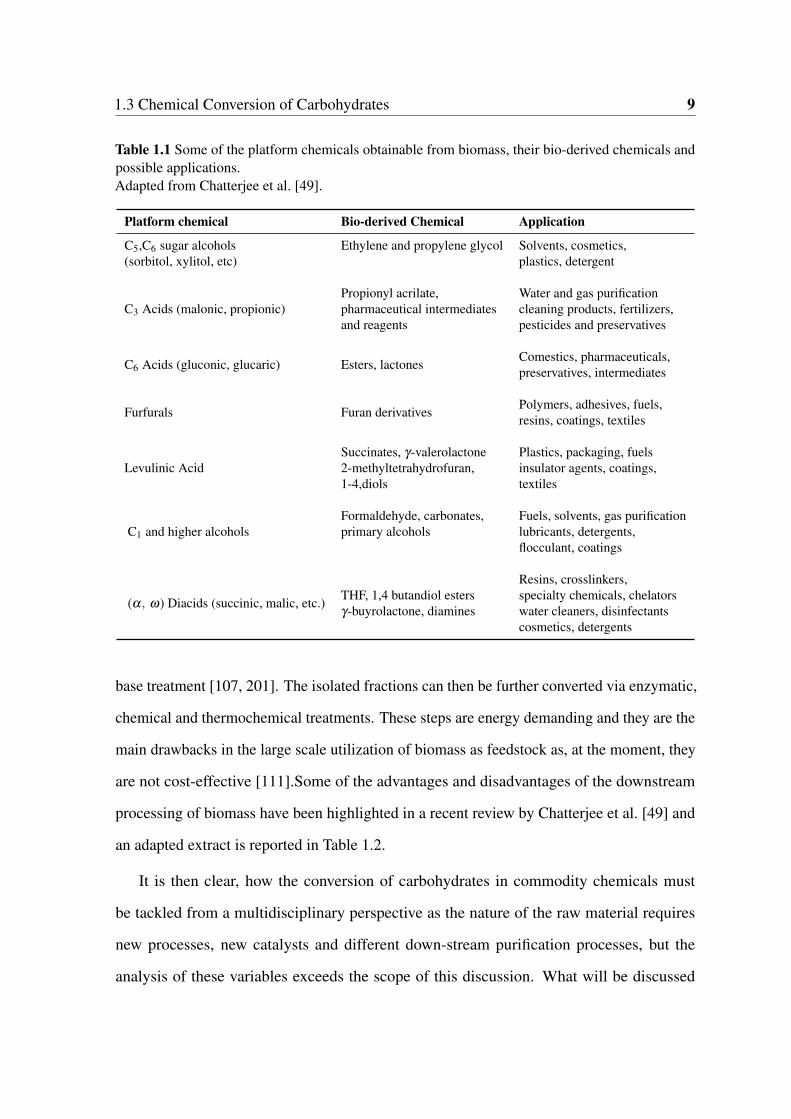
Table 1.1 Some of the platform chemicals obtainable from biomass, their bio-derived chemicals andpossible applications.Adapted from Chatterjee et al. [49].
Platform chemical Bio-derived Chemical Application
C5,C6 sugar alcohols Ethylene and propylene glycol Solvents, cosmetics,(sorbitol, xylitol, etc) plastics, detergent
C3 Acids (malonic, propionic)Propionyl acrilate, Water and gas purificationpharmaceutical intermediates cleaning products, fertilizers,and reagents pesticides and preservatives
C6 Acids (gluconic, glucaric) Esters, lactones Comestics, pharmaceuticals,preservatives, intermediates
Furfurals Furan derivatives Polymers, adhesives, fuels,resins, coatings, textiles
Levulinic AcidSuccinates, γ-valerolactone Plastics, packaging, fuels2-methyltetrahydrofuran, insulator agents, coatings,1-4,diols textiles
C1 and higher alcoholsFormaldehyde, carbonates, Fuels, solvents, gas purificationprimary alcohols lubricants, detergents,
flocculant, coatings
(α, ω) Diacids (succinic, malic, etc.)
Resins, crosslinkers,THF, 1,4 butandiol esters specialty chemicals, chelatorsγ-buyrolactone, diamines water cleaners, disinfectants
cosmetics, detergents
base treatment [107, 201]. The isolated fractions can then be further converted via enzymatic,
chemical and thermochemical treatments. These steps are energy demanding and they are the
main drawbacks in the large scale utilization of biomass as feedstock as, at the moment, they
are not cost-effective [111].Some of the advantages and disadvantages of the downstream
processing of biomass have been highlighted in a recent review by Chatterjee et al. [49] and
an adapted extract is reported in Table 1.2.
It is then clear, how the conversion of carbohydrates in commodity chemicals must
be tackled from a multidisciplinary perspective as the nature of the raw material requires
new processes, new catalysts and different down-stream purification processes, but the
analysis of these variables exceeds the scope of this discussion. What will be discussed
10 Introduction
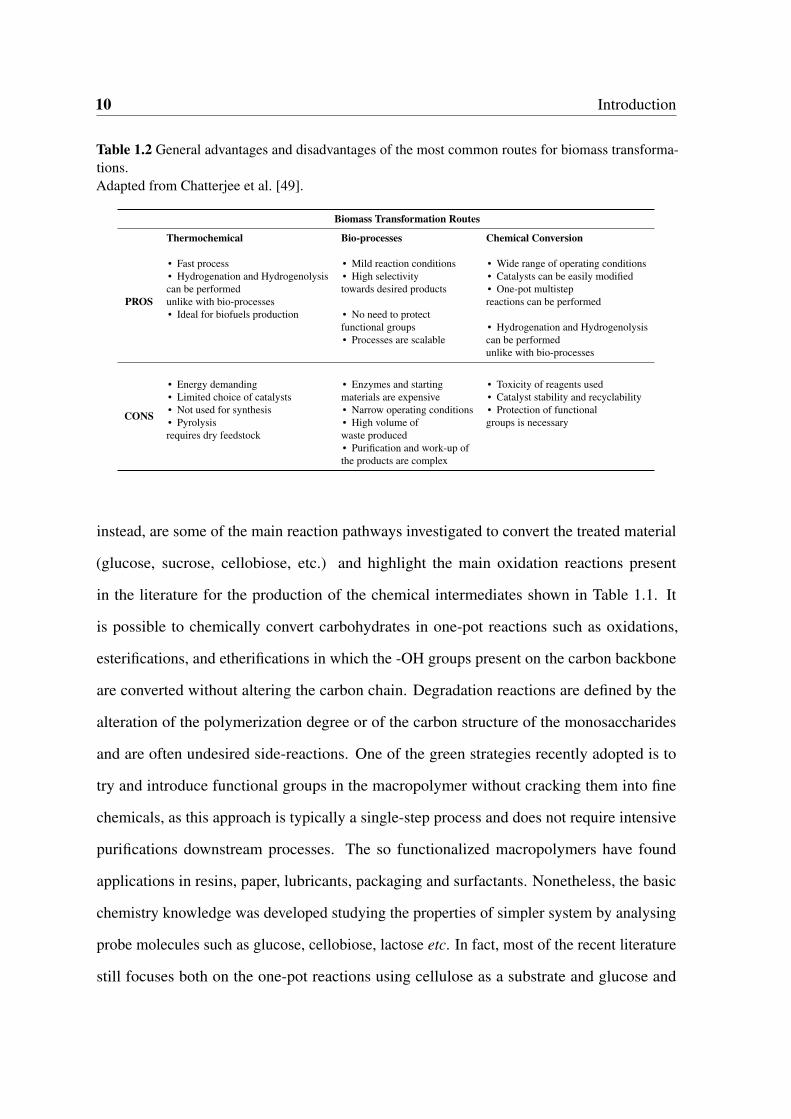
Table 1.2 General advantages and disadvantages of the most common routes for biomass transforma-tions.Adapted from Chatterjee et al. [49].
Biomass Transformation Routes
Thermochemical Bio-processes Chemical Conversion
PROS
• Fast process • Mild reaction conditions • Wide range of operating conditions• Hydrogenation and Hydrogenolysis • High selectivity • Catalysts can be easily modifiedcan be performed towards desired products • One-pot multistepunlike with bio-processes reactions can be performed• Ideal for biofuels production • No need to protect
functional groups • Hydrogenation and Hydrogenolysis• Processes are scalable can be performed
unlike with bio-processes
CONS
• Energy demanding • Enzymes and starting • Toxicity of reagents used• Limited choice of catalysts materials are expensive • Catalyst stability and recyclability• Not used for synthesis • Narrow operating conditions • Protection of functional• Pyrolysis • High volume of groups is necessaryrequires dry feedstock waste produced
• Purification and work-up ofthe products are complex
instead, are some of the main reaction pathways investigated to convert the treated material
(glucose, sucrose, cellobiose, etc.) and highlight the main oxidation reactions present
in the literature for the production of the chemical intermediates shown in Table 1.1. It
is possible to chemically convert carbohydrates in one-pot reactions such as oxidations,
esterifications, and etherifications in which the -OH groups present on the carbon backbone
are converted without altering the carbon chain. Degradation reactions are defined by the
alteration of the polymerization degree or of the carbon structure of the monosaccharides
and are often undesired side-reactions. One of the green strategies recently adopted is to
try and introduce functional groups in the macropolymer without cracking them into fine
chemicals, as this approach is typically a single-step process and does not require intensive
purifications downstream processes. The so functionalized macropolymers have found
applications in resins, paper, lubricants, packaging and surfactants. Nonetheless, the basic
chemistry knowledge was developed studying the properties of simpler system by analysing
probe molecules such as glucose, cellobiose, lactose etc. In fact, most of the recent literature
still focuses both on the one-pot reactions using cellulose as a substrate and glucose and
1.3 Chemical Conversion of Carbohydrates 11
cellobiose due to the variety of substrates available and the different composition of each
feedstock.
Oxidation of Mono and Disaccharides
The oxidation of sugars is well known, and it is usually performed under mild conditions
(T<100°C) using transition metal catalysts, mineral acids and organometallic complexes in
a wide range of pH values (6-9) and using air or oxygen as oxidants (Figure 1.3). Detailed
mechanistic and kinetic studies are now available to further tailor new catalysts. For homo-
geneous catalysis, NaClO and 2,2,6,6-tetramethylpiperidine-1-oxyl (TEMPO) is the most
recent advance in the oxidation of carbohydrates and it allows the reaction to run at low
temperature (0-15°C) with high yields towards the oxidised products (60-90%) as it allows
for the generation in situ of the oxidant species [69] .The main drawback of this catalyst
is that it has to be regenerated using secondary oxidising agents such as NaClO/NaBr or
peracetic acid and the use of halogenated compounds limits the practical usage of this system
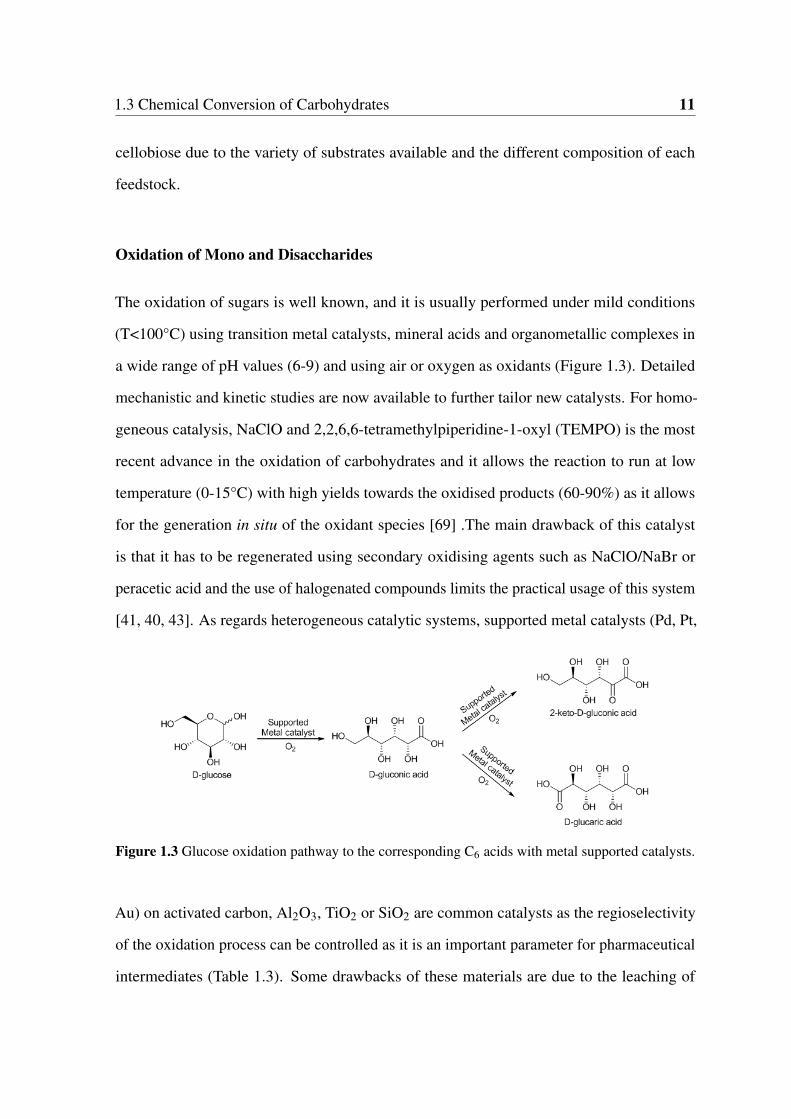
[41, 40, 43]. As regards heterogeneous catalytic systems, supported metal catalysts (Pd, Pt,
Figure 1.3 Glucose oxidation pathway to the corresponding C6 acids with metal supported catalysts.
Au) on activated carbon, Al2O3, TiO2 or SiO2 are common catalysts as the regioselectivity
of the oxidation process can be controlled as it is an important parameter for pharmaceutical
intermediates (Table 1.3). Some drawbacks of these materials are due to the leaching of
12 Introduction
the metal in solution with the subsequent loss of catalytic activity which directly affect the
lifetime and the recyclability of these materials.
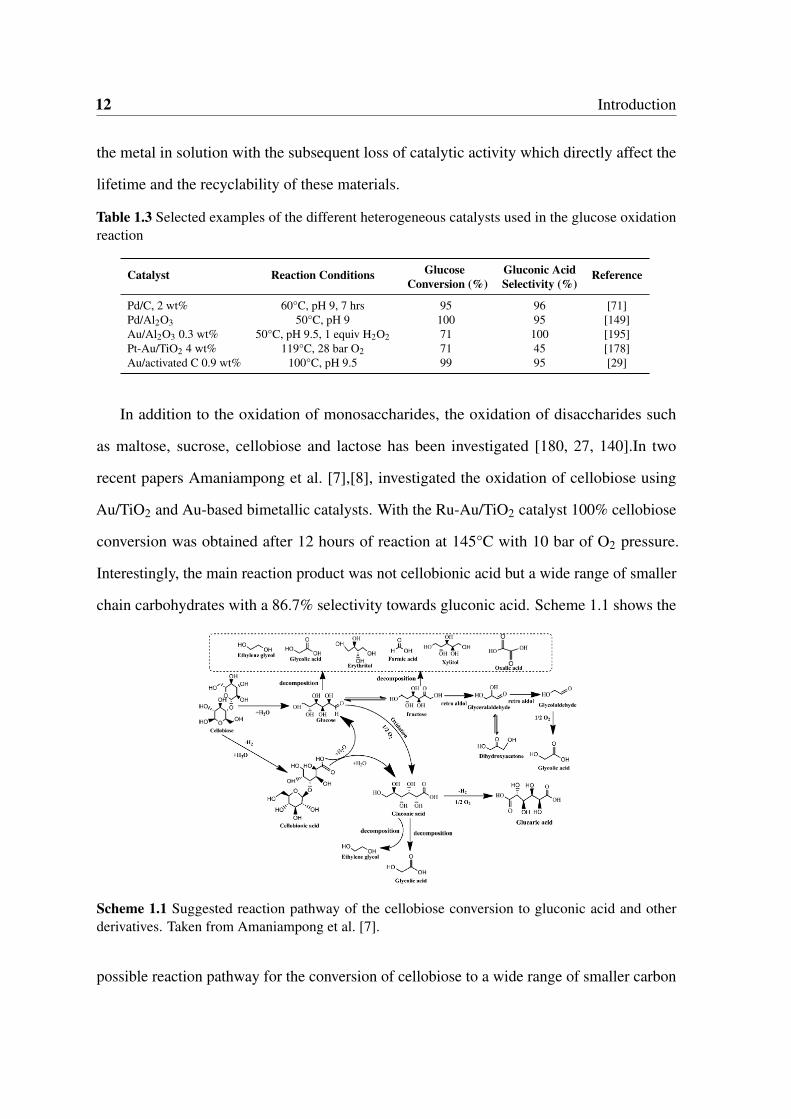
Table 1.3 Selected examples of the different heterogeneous catalysts used in the glucose oxidationreaction
Catalyst Reaction Conditions Glucose Gluconic Acid ReferenceConversion (%) Selectivity (%)
Pd/C, 2 wt% 60°C, pH 9, 7 hrs 95 96 [71]Pd/Al2O3 50°C, pH 9 100 95 [149]Au/Al2O3 0.3 wt% 50°C, pH 9.5, 1 equiv H2O2 71 100 [195]Pt-Au/TiO2 4 wt% 119°C, 28 bar O2 71 45 [178]Au/activated C 0.9 wt% 100°C, pH 9.5 99 95 [29]
In addition to the oxidation of monosaccharides, the oxidation of disaccharides such
as maltose, sucrose, cellobiose and lactose has been investigated [180, 27, 140].In two
recent papers Amaniampong et al. [7],[8], investigated the oxidation of cellobiose using
Au/TiO2 and Au-based bimetallic catalysts. With the Ru-Au/TiO2 catalyst 100% cellobiose
conversion was obtained after 12 hours of reaction at 145°C with 10 bar of O2 pressure.
Interestingly, the main reaction product was not cellobionic acid but a wide range of smaller
chain carbohydrates with a 86.7% selectivity towards gluconic acid. Scheme 1.1 shows the
Scheme 1.1 Suggested reaction pathway of the cellobiose conversion to gluconic acid and otherderivatives. Taken from Amaniampong et al. [7].
possible reaction pathway for the conversion of cellobiose to a wide range of smaller carbon
1.4 Photocatalysis 13
chain molecules. It is clear how the selectivity towards the formation of the corresponding
acid is negligible as the hydrolysis and oxidation of the monosaccharides appear to be the
prevalent reaction pathways. On the other hand, lactose is reported to successfully oxidise
to the corresponding lactobionic and 2-ketolactobionic acid (similarly to what has been
observed with glucose as a substrate) using a wide range of bimetallic catalysts (Pd-Bi, Pt-Bi,
and Au-Pd) on various supports (SiO2, CeO2, activated carbon and Al2O3) with the Au
supported catalysts on SiO2, CeO2[180, 27, 140] showing 100% selectivity to the lactobionic
acid at 65°C and pH 9 [104, 160]. Overall, by analysing these results it appears clear how
the structure and the three-dimensional conformation of the disaccharide deeply affects its
reactivity and product distribution.
1.4 Photocatalysis
Photocatalytic processes differ from electrochemical transformations as the oxidised and
reduced intermediates are generated in situ on the surface of the photoactive material. Ad-
ditionally, they differ from conventional catalytic processes by their activation mechanism
as the thermal energy required to activate these photoactive metal oxides, is replaced by the
incident irradiation which lowers the activation energy of the processes and allows for milder
reaction conditions, thus making this process more suitable for partial oxidation reactions in
the liquid phase due to the possibility of controlling the selectivity and the production of the
desired intermediates [194]. There are also some profound similarities between the surfaces
properties of a photoactive material and a conventional catalyst. In fact, the nature of the
semiconductor, its band gap value and the adsorption-desorption properties of the material
determines whether or not the reaction will occur. The ideal photocatalyst or photoactive
material should fit several criteria in order to be appealing for practical uses such as: it
should be inert in biological and chemical environments, stable photochemically by avoiding
photo-corrosion phenomena [58], cheap and easy to synthesise, activated efficiently by solar
14 Introduction
light, versatile towards a plethora of reactions and present low risks for the environment
or living organisms [47]. TiO2-based materials are close to being ideal photocatalysts as
they fulfil most of the necessary prerequisites, albeit being easily activated by solar light
due to their band gap position. Therefore, several strategies have been applied to extend the
activation of this material in the visible range of the electromagnetic spectrum and will be
analysed in this chapter. Generally, photo-initiated reactions can be described as follows:
(Ox Species1)ads +(Red Species2)adsEg≤hν
−−−−−−−−→Semiconductor
Red Species1 +Ox Species2 (1.5)
If the variation of the Gibbs free energy (∆G0) is positive the reaction might be an example
of photosynthesis, if negative a photocatalytic process might be on going. Specifically, when
TiO2 is used as photocatalyst, the ∆G0<0 implies that most of the reactions are photocatalytic
rather than photosynthetic [25]. Functional groups of organic substrates can undergo several
chemical transformations in inert solvents. The prerequisite for an appreciable conversion of
the substrate is the presence of non-bonded lone pair or π-orbitals which might display an
oxidative reactivity when TiO2 is used and might undergo several transformations such as
deoxygenation, dehydrogenation, or oxidative cleavages.
On the other hand, it is possible to impart a reducing character to the system by removing
oxygen and proton sources in the system, nonetheless, the efficiency of these process will
be lower than the ones previously described for two reasons: (1) the reducing power of
the electrons in the conduction band (e−cb) is generally lower than the one observed for the
holes in the valence band (h+vb), and (2) many of the groups which can be reduced do not
compete with oxygen in trapping the conduction band electrons. For these reasons, the
research performed on photo-reduction reactions is mainly focused on the reduction of CO2
[117, 144, 234, 176].

1.4 Photocatalysis 15
1.4.1 Semiconductors and Photocatalytic Activity
Semiconductors in general can be divided in two categories, n-type and p-type materials. In n-
type semiconductors the concentration of the electrons is greater than the hole concentration,
hence the electrons are the main energy carriers and this imparts a negative charge to the
material. In an n-type semiconductor, the Fermi level is at a higher energy level than the
one of an intrinsic semiconductor and lies closer to the conduction band than to the valence
band. On the contrary, p-type semiconductors have holes as primary energy carriers and the
Fermi level lies closer to the valence band rather than to the conduction band as for n-type
materials. P-type semiconductors can be prepared by doping an intrinsic semiconductor with
acceptors impurities. Due to the oxygen vacancies in the lattice structure, TiO2 is an n-type
Figure 1.4 Typical n-type (left) and p-type (right) semiconductor schematic structure. The top bandis the conduction band (cb), whilst the bottom one is the valence band (vb). The shift in the Fermilevel value can also be observed if compared with an intrinsic semiconductor.
semiconductor, and the vacancies are formed according to the following reaction:
Oxo
TiO2−−−→ V hho + 2e− +
12
O2 (1.6)
The representation of the defects with the Kröger-Vink notation explains that within the
TiO2 structure a positive oxygen vacancy (Vhho , +2 charge) is formed upon the subsequent
release of molecular oxygen and two electrons, and this process is commonly achieved by
heat treating the material in oxygen-poor environments.
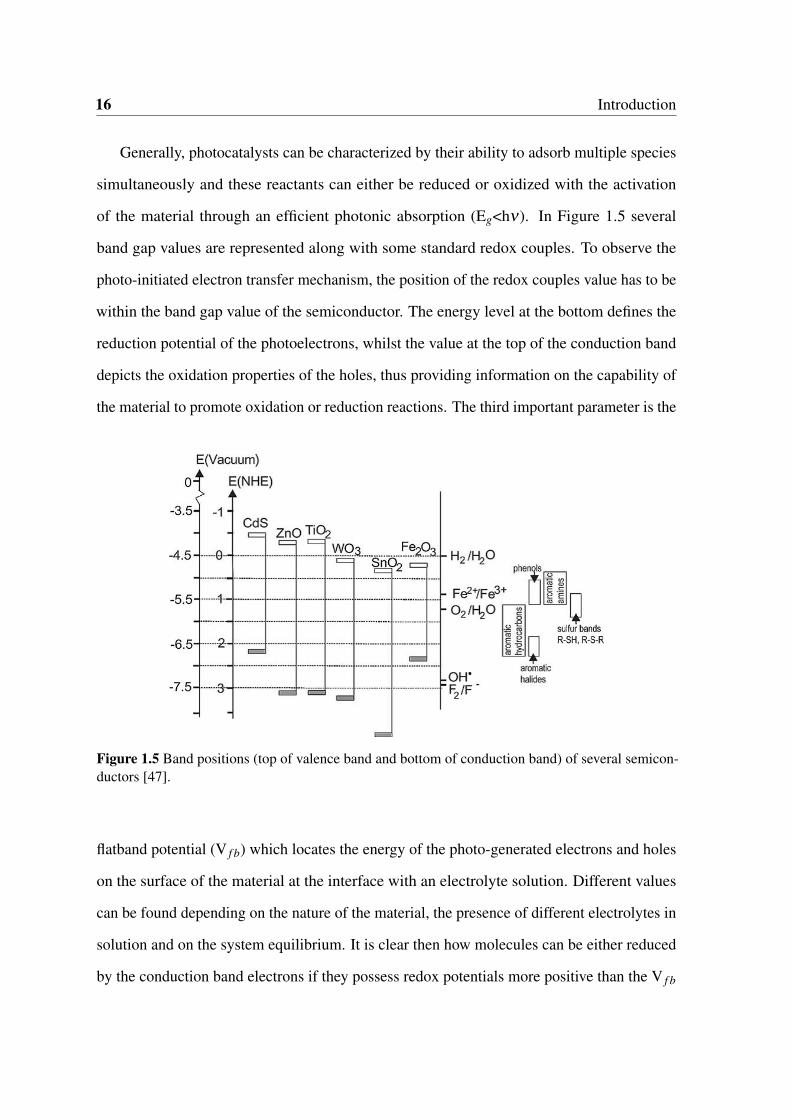
16 Introduction
Generally, photocatalysts can be characterized by their ability to adsorb multiple species
simultaneously and these reactants can either be reduced or oxidized with the activation
of the material through an efficient photonic absorption (Eg<hν). In Figure 1.5 several
band gap values are represented along with some standard redox couples. To observe the
photo-initiated electron transfer mechanism, the position of the redox couples value has to be
within the band gap value of the semiconductor. The energy level at the bottom defines the
reduction potential of the photoelectrons, whilst the value at the top of the conduction band
depicts the oxidation properties of the holes, thus providing information on the capability of
the material to promote oxidation or reduction reactions. The third important parameter is the
Figure 1.5 Band positions (top of valence band and bottom of conduction band) of several semicon-ductors [47].
flatband potential (V f b) which locates the energy of the photo-generated electrons and holes
on the surface of the material at the interface with an electrolyte solution. Different values
can be found depending on the nature of the material, the presence of different electrolytes in
solution and on the system equilibrium. It is clear then how molecules can be either reduced
by the conduction band electrons if they possess redox potentials more positive than the V f b
1.5 Photochemical Processes 17
or oxidized by the positive holes on the valence band if they have redox potentials lower than
the V f b.
The flatband potential can also be influenced by the pH or the ionic strength of the
reaction medium, and the variation of the V f b value follows a Nernstian pH dependency with
a -59mV decrease per pH unit. This pH dependency directly influences the properties and the
ability of the photogenerated electron/hole pair to drive redox reactions. By simply looking
at this representation it is then possible to predict if a reaction will occur photochemically, or
to design and engineer new materials to satisfy the thermodynamic requirements [35, 36, 85,
197, 209].
Due to the lack of a continuum of intraband states, semiconductors have the peculiar prop-
erty of assuring long lifetime of the electron/hole pair partially avoiding their recombination,
allowing the diffusion of these reactive species towards the surface of the material.
Because TiO2 exists in different polymorphs, the difference in the band gap values of
3.2 eV for anatase and 3.02 eV for rutile, can be explained with the different crystalline
structure and this difference directly affects the absorption threshold values of 384 nm and
410 nm respectively for the two polymorphs. The absorption values are also influenced by
the particle size, the amorphous content, and generally blue shifts (0.2 eV) are observed for
nanosized TiO2 materials in the range from 5-10 nm [139, 196].
1.5 Photochemical Processes
Photoactive materials have been used in several fields, from nanomedicine, water splitting
reactions, to water streams purifications, and in organic synthesis. In this section, photore-
forming of bio-derived molecules and the degradation of organic compounds, specifically
dyes, will be discussed to point out the differences and the parameters to be tuned to obtain
selective photochemical processes.
18 Introduction
1.5.1 Photoreforming
Photoreforming processes are based on a series of consecutive steps, and they all start with
the absorption of a photon by a semiconductor material with the subsequent promotion of
an electron to the conduction band and the formation of a positive hole in the valence band.
This charge separation is the driving force of all photochemical reactions, the longer the
recombination time, the more efficient the material will be in harvesting light. The band gap
is the energy barrier that photons have to at least to match in order to promote electrons and
the values have to be between 1.23 eV (1008 nm) and 3 eV (414 nm) in order to harvest the
solar light efficiently. At values lower than 1.23 eV the energy of the photons is not enough
to drive chemical reactions further and IR harvesting materials are required [245, 161]. The
general low efficiency of photochemical reactions is generally due to several factors such as
inefficient illumination due to light scattering or reflection phenomena, poor absorption due
to the material characteristics and to the fast electron/hole recombination rate. In order to
overcome the recombination rate several strategies can be applied, such as the decoration
of the semiconductor surface with metal nanoparticles. In fact, small amounts of metal act
as co-catalysts and are able to harvest the electrons thus slowing down the recombination
process. Additionally, protons can harvest these electrons to produce H2 and sometimes this
side reaction is not desired if photoreforming or water splitting are not the target reactions.
For this reason, metals should have lower overpotential values than H2; practically, if a metal
has a lower overpotential than the half reaction thermodynamic reduction potential it will
promote the production of H2 from water (Table 1.4). In addition to the production of H2, if
the metal has the proper work function, the excited electrons will tend to migrate towards the
metal itself until the two Fermi levels will be aligned and the strong metal support-interaction,
or Schottky barrier, enhances the electron scavenging tendency of the metal thus decreasing
the overall electron-hole recombination. In fact, it has to be noted that the synergistic effect
of the metal-support heterojunction in ameliorating the properties of the material is also
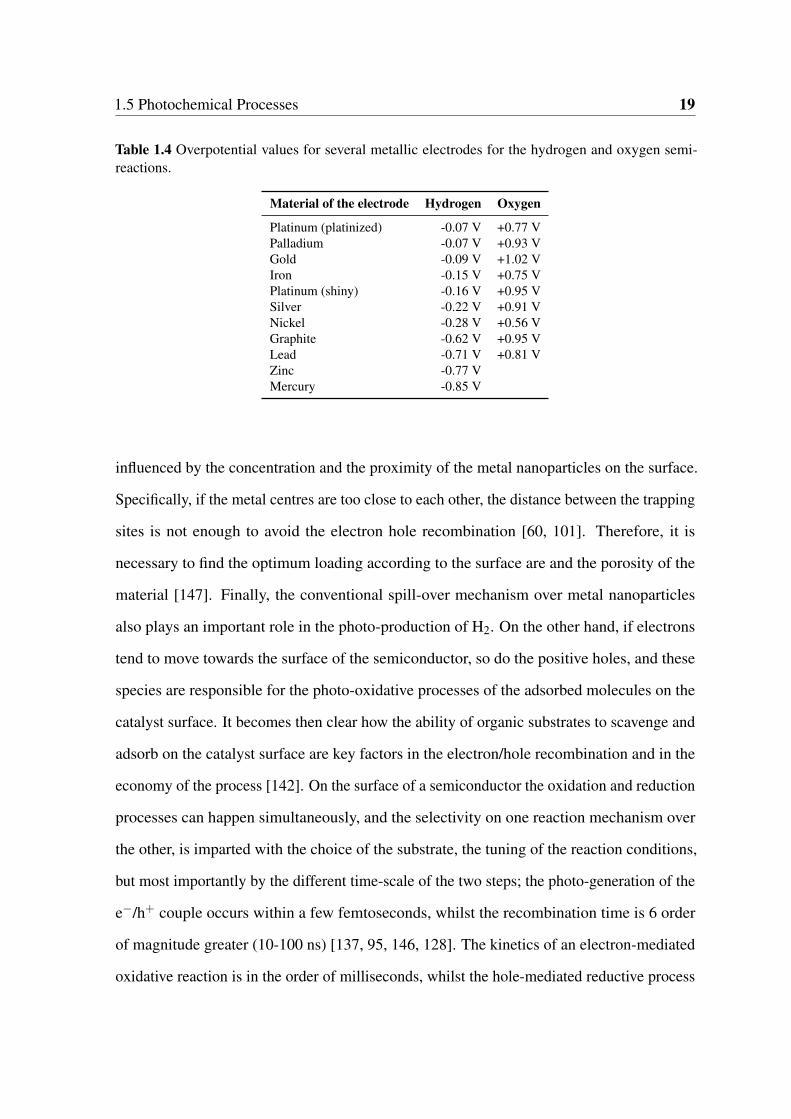
1.5 Photochemical Processes 19
Table 1.4 Overpotential values for several metallic electrodes for the hydrogen and oxygen semi-reactions.
Material of the electrode Hydrogen Oxygen
Platinum (platinized) -0.07 V +0.77 VPalladium -0.07 V +0.93 VGold -0.09 V +1.02 VIron -0.15 V +0.75 VPlatinum (shiny) -0.16 V +0.95 VSilver -0.22 V +0.91 VNickel -0.28 V +0.56 VGraphite -0.62 V +0.95 VLead -0.71 V +0.81 VZinc -0.77 VMercury -0.85 V
influenced by the concentration and the proximity of the metal nanoparticles on the surface.
Specifically, if the metal centres are too close to each other, the distance between the trapping
sites is not enough to avoid the electron hole recombination [60, 101]. Therefore, it is
necessary to find the optimum loading according to the surface are and the porosity of the
material [147]. Finally, the conventional spill-over mechanism over metal nanoparticles
also plays an important role in the photo-production of H2. On the other hand, if electrons
tend to move towards the surface of the semiconductor, so do the positive holes, and these
species are responsible for the photo-oxidative processes of the adsorbed molecules on the
catalyst surface. It becomes then clear how the ability of organic substrates to scavenge and
adsorb on the catalyst surface are key factors in the electron/hole recombination and in the
economy of the process [142]. On the surface of a semiconductor the oxidation and reduction
processes can happen simultaneously, and the selectivity on one reaction mechanism over
the other, is imparted with the choice of the substrate, the tuning of the reaction conditions,
but most importantly by the different time-scale of the two steps; the photo-generation of the
e−/h+ couple occurs within a few femtoseconds, whilst the recombination time is 6 order
of magnitude greater (10-100 ns) [137, 95, 146, 128]. The kinetics of an electron-mediated
oxidative reaction is in the order of milliseconds, whilst the hole-mediated reductive process
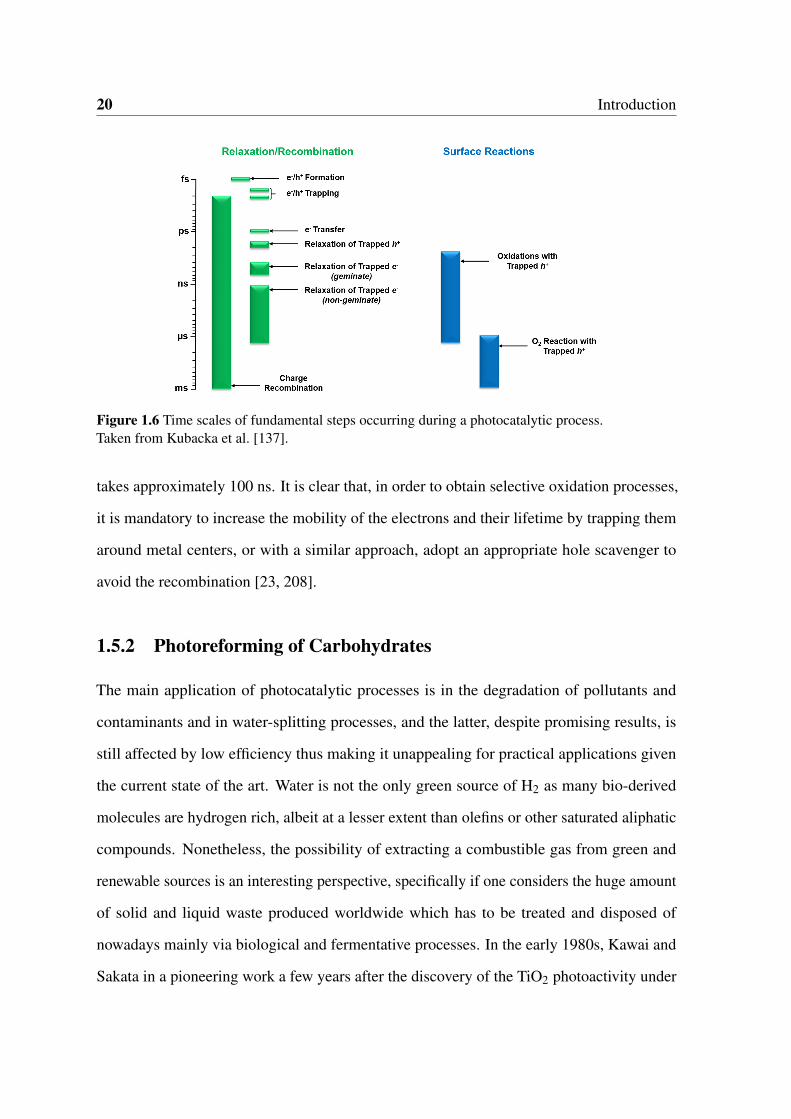
20 Introduction
Figure 1.6 Time scales of fundamental steps occurring during a photocatalytic process.Taken from Kubacka et al. [137].
takes approximately 100 ns. It is clear that, in order to obtain selective oxidation processes,
it is mandatory to increase the mobility of the electrons and their lifetime by trapping them
around metal centers, or with a similar approach, adopt an appropriate hole scavenger to
avoid the recombination [23, 208].
1.5.2 Photoreforming of Carbohydrates
The main application of photocatalytic processes is in the degradation of pollutants and
contaminants and in water-splitting processes, and the latter, despite promising results, is
still affected by low efficiency thus making it unappealing for practical applications given
the current state of the art. Water is not the only green source of H2 as many bio-derived
molecules are hydrogen rich, albeit at a lesser extent than olefins or other saturated aliphatic
compounds. Nonetheless, the possibility of extracting a combustible gas from green and
renewable sources is an interesting perspective, specifically if one considers the huge amount
of solid and liquid waste produced worldwide which has to be treated and disposed of
nowadays mainly via biological and fermentative processes. In the early 1980s, Kawai and
Sakata in a pioneering work a few years after the discovery of the TiO2 photoactivity under
1.5 Photochemical Processes 21
UV light, assessed the feasibility of the production of H2 from sugars and soluble starch using
a RuO2/TiO2/Pt mixture, reporting for the first time a successful photoreforming process in
aqueous solutions. Additionally, the activity of the substrates was reported as a function of the
molecular size of the substrate (starch<sucrose<glucose) with glucose being the most reactive
substrate [123]. It is known that the polyols hole scavenging efficiency can be correlated
with the number of hydroxyl groups present in the molecular structure. With time-resolved
transient spectroscopy, it was possible to monitor and assess the scavenging properties of
C2-C6 polyols and it was found that carbohydrates could neutralize 50-60% of the holes
generate on the TiO2 surface in approximately 6 ns [34, 215–217]. The sacrificial action of
these molecules allows for a more efficient combination between the valence band holes than
water thus enhancing the H2 production compared with the water splitting reactions. The
abundance of hydroxyl groups in carbohydrates generally leads to an increase activity until
the molecular structure reaches a critical mass and it becomes too bulky and the accessibility
of the functional groups is limited by steric hindrance or by the formation of thick hydrogen
bonds network. This intricate structure directly affects the solubility and the properties
of polysaccharides, thus explaining why cellulose is such a recalcitrant substrate towards
solubilisation, hydrolysis and conversion to valuable chemicals under mild conditions and
conventional chemical processes. The exploitation of photoreforming processes on biomass
derived compounds has been tested on several substrates such as alcohols, organic acids,
carbohydrates (glucose, mannose, arabinose, fructose and ribose)[135, 37, 38], and generally,
the ratio of H2/CO2 is in good agreement with the stoichiometry of the total mineralization
of carbohydrates to produce CO2 and H2 (Eqn. 1.7):
CxHyOz + (2x− z)→ xCO2 + (2x− z+y2)H2 (1.7)
It has also been found that the H2 production is strongly influenced by the concentration and
the structure of the substrate and, to a lesser extent, by temperature and pH.
22 Introduction
1.5.3 Selective Photocatalytic Processes
Selective oxidation reactions, if compared with the degradation of pollutants, are a much more
interesting application of photoactive materials for the production of fine chemicals. Recently,
Zhang et al. [254] reported the oxidation of alcohols to aldehydes using Au nanoparticles
supported on zeolites at room temperature and under visible light, moreover, Ag/Al2O3 was
used to catalyse the epoxidation of ethylene oxide, in addition to CO and NH3 oxidation
under visible light and these are just two cases of the well reported activity of metal supported
nanoparticles [54]. It is clear how, despite the complexity of photochemical reactions, the
difficulty in identifying the reactive species involved, and the challenges the design and
tailoring of the properties of the material, there is a growing interest in applying the current
know-how in the oxidation of probe molecules to the more complex bio-derived substrates.
Lignocellulosic substrates can be transformed using conventional processes (see Section 1.2),
but, additionally, under UV irradiation, they undergo oxidative degradation reactions. Early
studies in 1944 by Stillings and Nostrand [223] showed the possible production of CO,
CO2 and some reducing sugars from cellulose , a few years later, the degradation of filter
paper was reported to produce oxygenated hydrocarbons upon irradiation [103, 74] and
more recently, in 2011 Fan et al. [86] reported the one-pot degradation of cellulose to
hydroxymethylfurfural (HMF) under UV irradiation using a concentrated ZnCl2 solution and
a supported TiO2 catalyst. The results are somewhat difficult to interpret due to the different
experimental conditions used, but generally, show that it is possible to convert natural
polymers to platform chemicals using photoactive materials. Specifically, the selective photo-
oxidation of biomass, could potentially supply a wide range of high-value chemicals to the
pharmaceutical, food and automotive industry, as most of the obtainable substrates can be
found in the top 12 sugar derived platform chemicals identified by the U.S Department of
Energy in 2004[243], and more recently this list has been revised by Bozell and Petersen
[39]. Most importantly, the selective oxidation of alcohols to carbonyls is one of the most
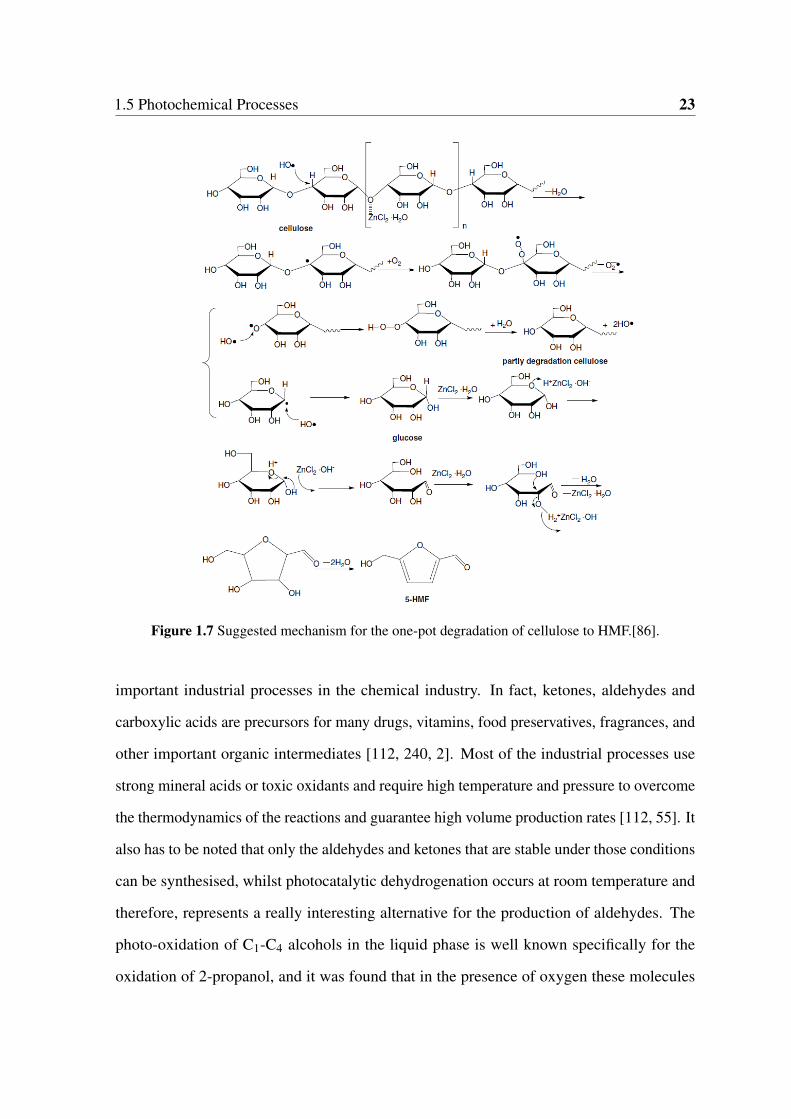
1.5 Photochemical Processes 23
Figure 1.7 Suggested mechanism for the one-pot degradation of cellulose to HMF.[86].
important industrial processes in the chemical industry. In fact, ketones, aldehydes and
carboxylic acids are precursors for many drugs, vitamins, food preservatives, fragrances, and
other important organic intermediates [112, 240, 2]. Most of the industrial processes use
strong mineral acids or toxic oxidants and require high temperature and pressure to overcome
the thermodynamics of the reactions and guarantee high volume production rates [112, 55]. It
also has to be noted that only the aldehydes and ketones that are stable under those conditions
can be synthesised, whilst photocatalytic dehydrogenation occurs at room temperature and
therefore, represents a really interesting alternative for the production of aldehydes. The
photo-oxidation of C1-C4 alcohols in the liquid phase is well known specifically for the
oxidation of 2-propanol, and it was found that in the presence of oxygen these molecules

24 Introduction
can be oxidised to the corresponding aldehydes or ketones [16, 159, 158, 106]. Colmenares
et al. [63][61] recently reported the oxidation of glucose to glucaric and gluconic acid under
UV irradiation with good selectivity values using TiO2 based photocatalysts (Figure 1.8).
From the literature, it is clear how there is discontinuity in the choice of the substrate used,
Figure 1.8 Reaction mechanism proposed by Colmenares et al. [61] for the photo oxidation of glucoseto glucaric and gluconic acid.
as one would think to gradually increase the complexity of the substrate, but actually, the
first results were obtained with cellulose, and research moved on to study, only recently, the
simplest monosaccharide available from cellulose and hemicellulose, analyse its adsorption
properties and the chemistry involved when this polyol is used. The use of probe molecules
is common in conventional heterogeneous catalysis of bio-derived molecules, in fact, phenols
are used instead of lignin, cellobiose is used instead of cellulose and other xylans are used to
investigate hemicellulose. The limitations of this approach are clear as several properties are
dramatically influenced by the size of the substrate, nonetheless, it is necessary to obtain a
deep understanding of the reaction mechanisms of the single molecule, to try and predict,
and design better performing catalysts.
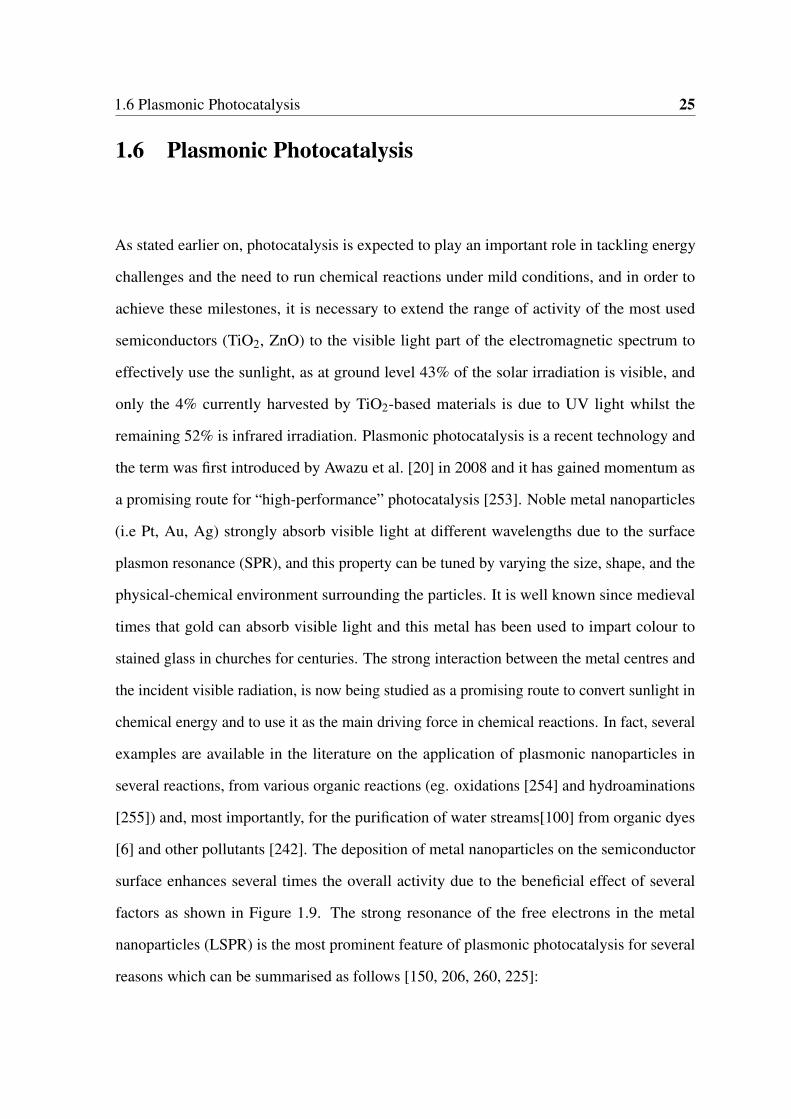
1.6 Plasmonic Photocatalysis 25
1.6 Plasmonic Photocatalysis
As stated earlier on, photocatalysis is expected to play an important role in tackling energy
challenges and the need to run chemical reactions under mild conditions, and in order to
achieve these milestones, it is necessary to extend the range of activity of the most used
semiconductors (TiO2, ZnO) to the visible light part of the electromagnetic spectrum to
effectively use the sunlight, as at ground level 43% of the solar irradiation is visible, and
only the 4% currently harvested by TiO2-based materials is due to UV light whilst the
remaining 52% is infrared irradiation. Plasmonic photocatalysis is a recent technology and
the term was first introduced by Awazu et al. [20] in 2008 and it has gained momentum as
a promising route for “high-performance” photocatalysis [253]. Noble metal nanoparticles
(i.e Pt, Au, Ag) strongly absorb visible light at different wavelengths due to the surface
plasmon resonance (SPR), and this property can be tuned by varying the size, shape, and the
physical-chemical environment surrounding the particles. It is well known since medieval
times that gold can absorb visible light and this metal has been used to impart colour to
stained glass in churches for centuries. The strong interaction between the metal centres and
the incident visible radiation, is now being studied as a promising route to convert sunlight in
chemical energy and to use it as the main driving force in chemical reactions. In fact, several
examples are available in the literature on the application of plasmonic nanoparticles in
several reactions, from various organic reactions (eg. oxidations [254] and hydroaminations
[255]) and, most importantly, for the purification of water streams[100] from organic dyes
[6] and other pollutants [242]. The deposition of metal nanoparticles on the semiconductor
surface enhances several times the overall activity due to the beneficial effect of several
factors as shown in Figure 1.9. The strong resonance of the free electrons in the metal
nanoparticles (LSPR) is the most prominent feature of plasmonic photocatalysis for several
reasons which can be summarised as follows [150, 206, 260, 225]:

26 Introduction
Figure 1.9 Beneficial contribution of several factors in plasmonic photocatalysis.Adapted from [253].
• Resonance frequency of Au and Ag can be tailored by varying the size, the shape and
the environment surrounding the particles.
• The presence of LSPR enhances the adsorption of low band gap photocatalysts such as
CdS and Fe2O3 under both UV and visible light.
• This process is characterized by the adsorption of light on a very thin layer below the
surface of the material and this feature shortens the distance the charge carries have to
cover to surface again thus reducing their recombination rate.
• The formation of a strong electric field during the LSPR, enhances the production of
electrons and holes and prevents their recombination
• The overheating of the metal nanoparticles exposed to visible light irradiation favours
the reaction rate of redox reactions along with the mass transfer properties.
• The electric field charges on the metal centres, impart polarizing properties to the
nanoparticles this increasing the substrate adsorption affinity of the material.
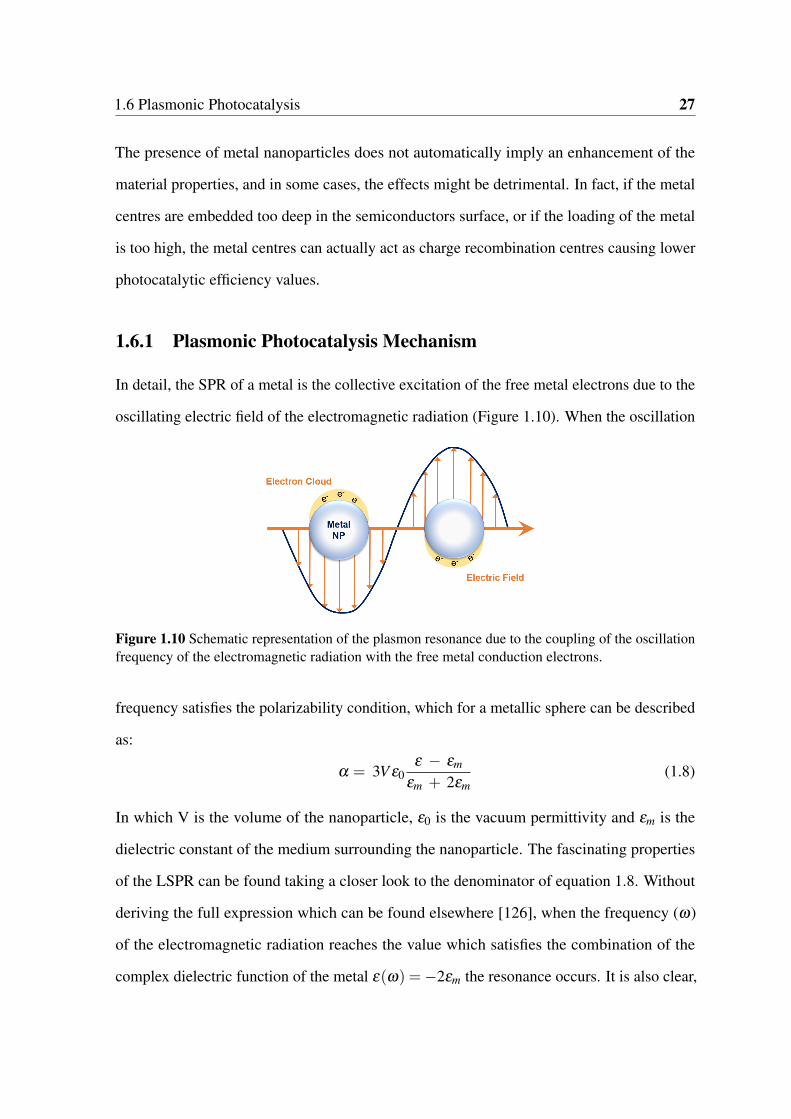
1.6 Plasmonic Photocatalysis 27
The presence of metal nanoparticles does not automatically imply an enhancement of the
material properties, and in some cases, the effects might be detrimental. In fact, if the metal
centres are embedded too deep in the semiconductors surface, or if the loading of the metal
is too high, the metal centres can actually act as charge recombination centres causing lower
photocatalytic efficiency values.
1.6.1 Plasmonic Photocatalysis Mechanism
In detail, the SPR of a metal is the collective excitation of the free metal electrons due to the
oscillating electric field of the electromagnetic radiation (Figure 1.10). When the oscillation
Figure 1.10 Schematic representation of the plasmon resonance due to the coupling of the oscillationfrequency of the electromagnetic radiation with the free metal conduction electrons.
frequency satisfies the polarizability condition, which for a metallic sphere can be described
as:
α = 3V ε0ε − εm
εm + 2εm(1.8)
In which V is the volume of the nanoparticle, ε0 is the vacuum permittivity and εm is the
dielectric constant of the medium surrounding the nanoparticle. The fascinating properties
of the LSPR can be found taking a closer look to the denominator of equation 1.8. Without
deriving the full expression which can be found elsewhere [126], when the frequency (ω)
of the electromagnetic radiation reaches the value which satisfies the combination of the
complex dielectric function of the metal ε(ω) =−2εm the resonance occurs. It is also clear,
28 Introduction
how in addition to the direct dependency of the SPR to the electromagnetic frequency, the
reaction medium properties also have dramatic effects on the intensity and the positioning
of the LSPR band. The Mie theory just described, provides a rigorous description of the
phenomenon for particles up to 100 nm as above this size, some of the approximations
regarding the distribution of the charges on the metallic surface and the phase changes of
the oscillation frequency over the volume of the particle are not valid [91, 203, 126]. If
compared with the conventional semiconductor photocatalysis, there are two distinctive
differences in plasmonic processes; the presence of a Schottky junction at the interface of
the metal nanoparticle and the semiconductor surface, which allows for the build-up of an
electrical field in the so called space-charge region in the bulk of the material but in close
proximity to the metal/semiconductor interface (Figure 1.11). Additionally, the metal acts
as charge-transfer centre by trapping charges on the metallic surface and creating active
sites for photo-reactions. The coexistence of the space-charge region, the Schottky barrier
and the charge-trap centre, impart different movements to the photo-generated electrons
thus avoiding the electron-hole pair recombination and increasing the lifetime of the active
species. As shown in Figure 1.5, semiconductors are described by their band gap position
which determines the cut-off absorption wavelength and the energy of the conduction band
electrons (Ecb) and the energy of the holes in the valence band (Evb). When coupled with
metal nanoparticles, this representation, needs to take into account the work function of the
metal along with the electrochemical potentials of the redox couples (Figure 1.12). The
band gap energy can be defined as Eg= Ecb-Evb and the e−/h+ pair is generated when the
electromagnetic radiation energy is higher than the band gap than this value. As soon as
these charge carrier species are generated they are available to be transferred to the other
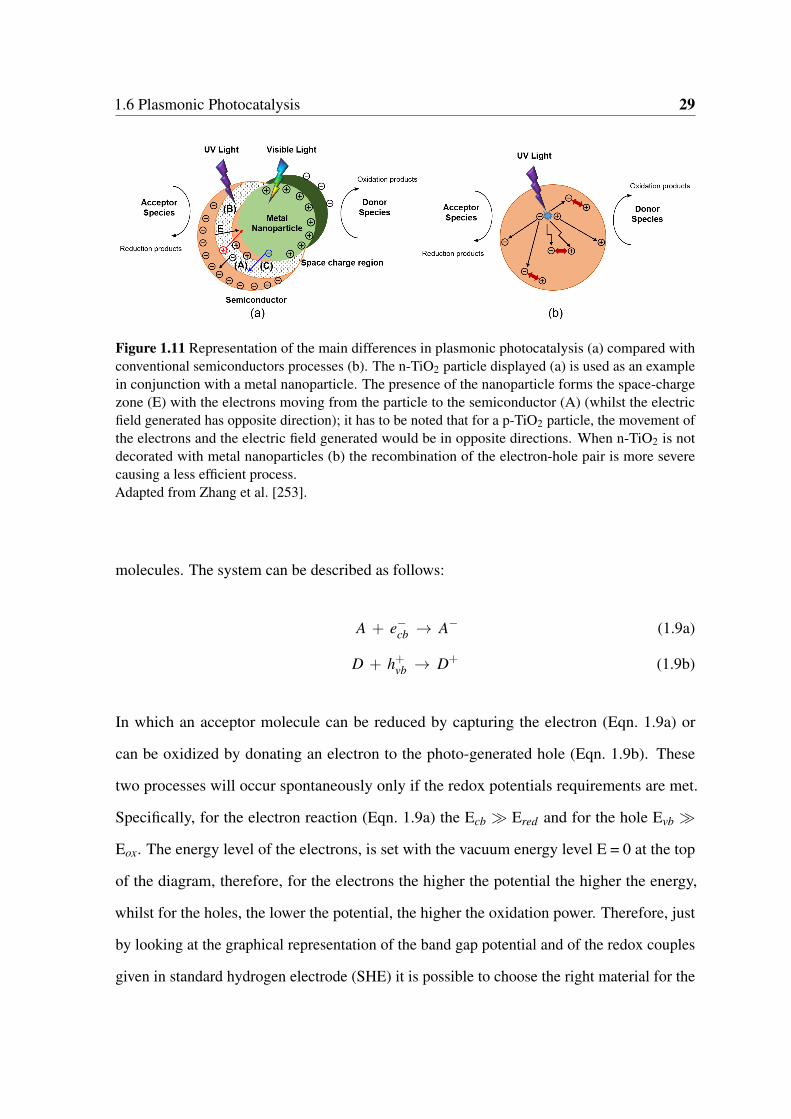
1.6 Plasmonic Photocatalysis 29
Figure 1.11 Representation of the main differences in plasmonic photocatalysis (a) compared withconventional semiconductors processes (b). The n-TiO2 particle displayed (a) is used as an examplein conjunction with a metal nanoparticle. The presence of the nanoparticle forms the space-chargezone (E) with the electrons moving from the particle to the semiconductor (A) (whilst the electricfield generated has opposite direction); it has to be noted that for a p-TiO2 particle, the movement ofthe electrons and the electric field generated would be in opposite directions. When n-TiO2 is notdecorated with metal nanoparticles (b) the recombination of the electron-hole pair is more severecausing a less efficient process.Adapted from Zhang et al. [253].
molecules. The system can be described as follows:
A + e−cb → A− (1.9a)
D + h+vb → D+ (1.9b)
In which an acceptor molecule can be reduced by capturing the electron (Eqn. 1.9a) or
can be oxidized by donating an electron to the photo-generated hole (Eqn. 1.9b). These
two processes will occur spontaneously only if the redox potentials requirements are met.
Specifically, for the electron reaction (Eqn. 1.9a) the Ecb ≫ Ered and for the hole Evb ≫
Eox. The energy level of the electrons, is set with the vacuum energy level E = 0 at the top
of the diagram, therefore, for the electrons the higher the potential the higher the energy,
whilst for the holes, the lower the potential, the higher the oxidation power. Therefore, just
by looking at the graphical representation of the band gap potential and of the redox couples
given in standard hydrogen electrode (SHE) it is possible to choose the right material for the
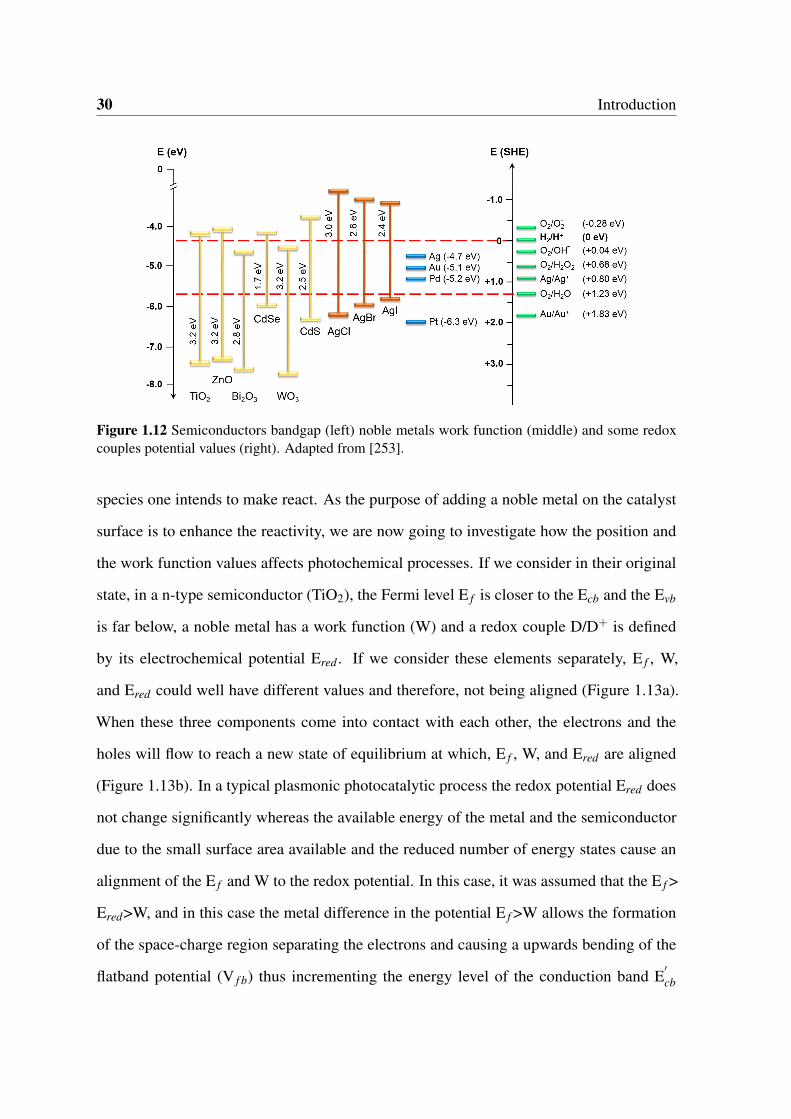
30 Introduction
Figure 1.12 Semiconductors bandgap (left) noble metals work function (middle) and some redoxcouples potential values (right). Adapted from [253].
species one intends to make react. As the purpose of adding a noble metal on the catalyst
surface is to enhance the reactivity, we are now going to investigate how the position and
the work function values affects photochemical processes. If we consider in their original
state, in a n-type semiconductor (TiO2), the Fermi level E f is closer to the Ecb and the Evb
is far below, a noble metal has a work function (W) and a redox couple D/D+ is defined
by its electrochemical potential Ered . If we consider these elements separately, E f , W,
and Ered could well have different values and therefore, not being aligned (Figure 1.13a).
When these three components come into contact with each other, the electrons and the
holes will flow to reach a new state of equilibrium at which, E f , W, and Ered are aligned
(Figure 1.13b). In a typical plasmonic photocatalytic process the redox potential Ered does
not change significantly whereas the available energy of the metal and the semiconductor
due to the small surface area available and the reduced number of energy states cause an
alignment of the E f and W to the redox potential. In this case, it was assumed that the E f >
Ered>W, and in this case the metal difference in the potential E f >W allows the formation
of the space-charge region separating the electrons and causing a upwards bending of the
flatband potential (V f b) thus incrementing the energy level of the conduction band E′cb
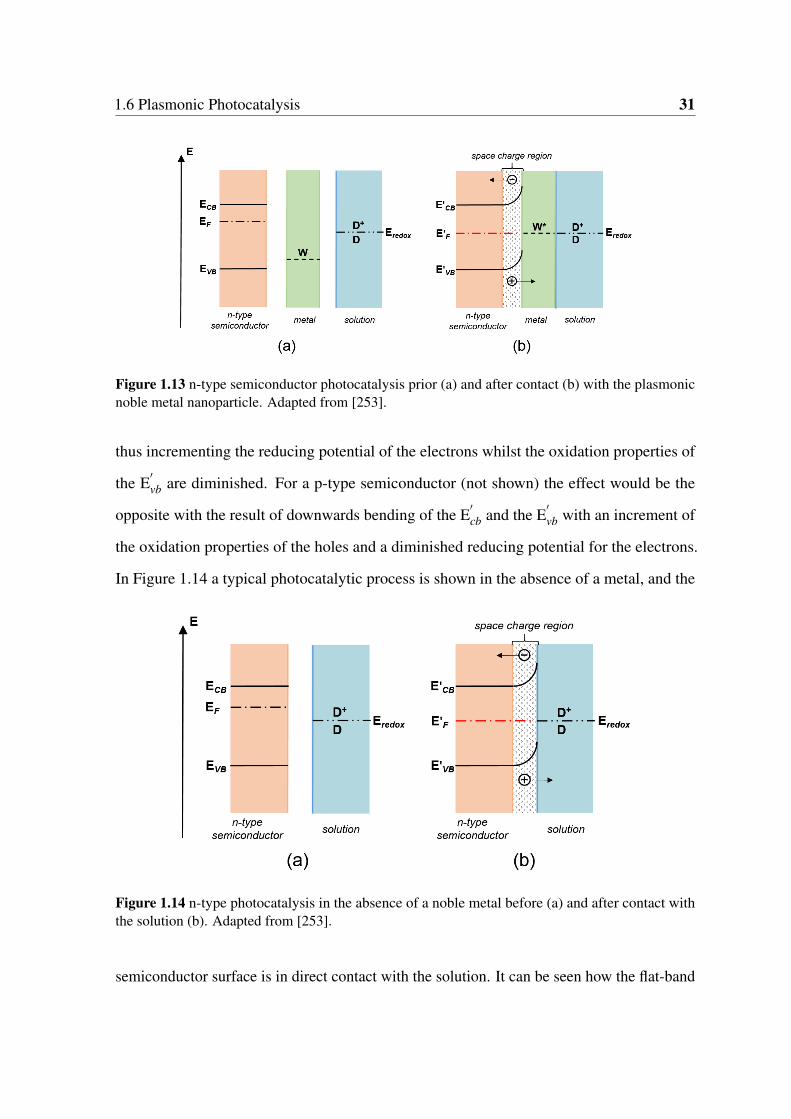
1.6 Plasmonic Photocatalysis 31
Figure 1.13 n-type semiconductor photocatalysis prior (a) and after contact (b) with the plasmonicnoble metal nanoparticle. Adapted from [253].
thus incrementing the reducing potential of the electrons whilst the oxidation properties of
the E′vb are diminished. For a p-type semiconductor (not shown) the effect would be the
opposite with the result of downwards bending of the E′cb and the E
′vb with an increment of
the oxidation properties of the holes and a diminished reducing potential for the electrons.
In Figure 1.14 a typical photocatalytic process is shown in the absence of a metal, and the
Figure 1.14 n-type photocatalysis in the absence of a noble metal before (a) and after contact withthe solution (b). Adapted from [253].
semiconductor surface is in direct contact with the solution. It can be seen how the flat-band
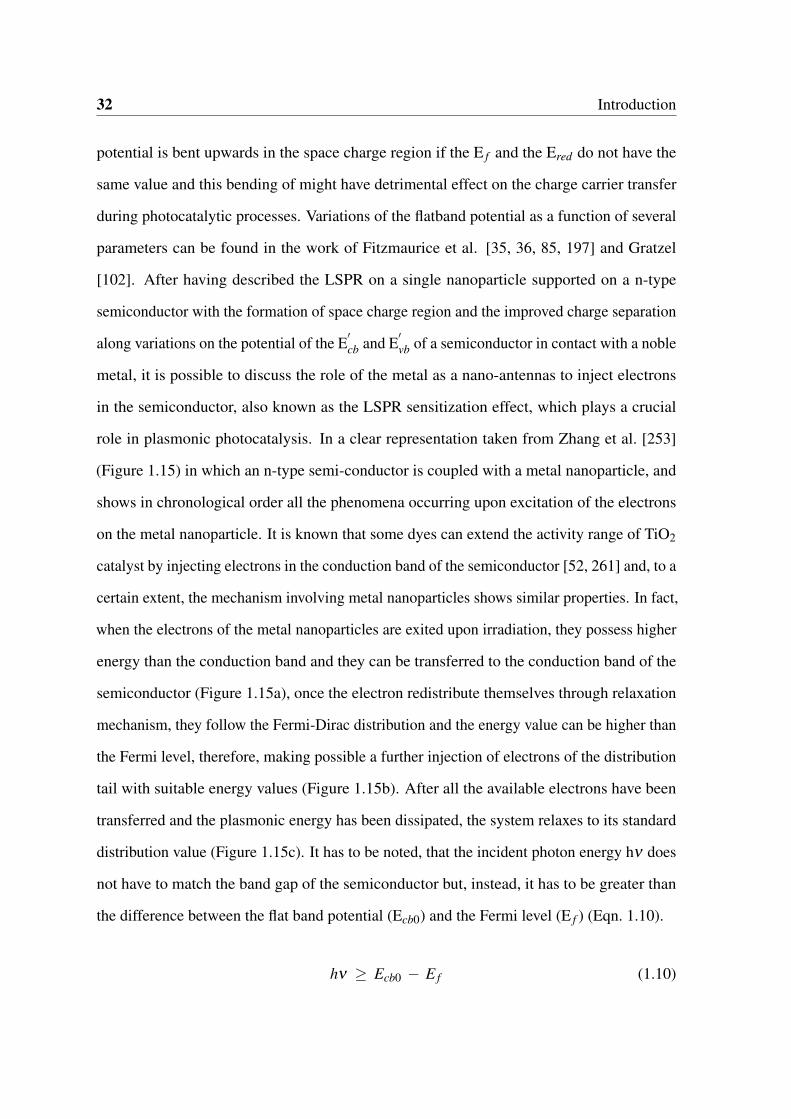
32 Introduction
potential is bent upwards in the space charge region if the E f and the Ered do not have the
same value and this bending of might have detrimental effect on the charge carrier transfer
during photocatalytic processes. Variations of the flatband potential as a function of several
parameters can be found in the work of Fitzmaurice et al. [35, 36, 85, 197] and Gratzel
[102]. After having described the LSPR on a single nanoparticle supported on a n-type
semiconductor with the formation of space charge region and the improved charge separation
along variations on the potential of the E′cb and E
′vb of a semiconductor in contact with a noble
metal, it is possible to discuss the role of the metal as a nano-antennas to inject electrons
in the semiconductor, also known as the LSPR sensitization effect, which plays a crucial
role in plasmonic photocatalysis. In a clear representation taken from Zhang et al. [253]
(Figure 1.15) in which an n-type semi-conductor is coupled with a metal nanoparticle, and
shows in chronological order all the phenomena occurring upon excitation of the electrons
on the metal nanoparticle. It is known that some dyes can extend the activity range of TiO2
catalyst by injecting electrons in the conduction band of the semiconductor [52, 261] and, to a
certain extent, the mechanism involving metal nanoparticles shows similar properties. In fact,
when the electrons of the metal nanoparticles are exited upon irradiation, they possess higher
energy than the conduction band and they can be transferred to the conduction band of the
semiconductor (Figure 1.15a), once the electron redistribute themselves through relaxation
mechanism, they follow the Fermi-Dirac distribution and the energy value can be higher than
the Fermi level, therefore, making possible a further injection of electrons of the distribution
tail with suitable energy values (Figure 1.15b). After all the available electrons have been
transferred and the plasmonic energy has been dissipated, the system relaxes to its standard
distribution value (Figure 1.15c). It has to be noted, that the incident photon energy hν does
not have to match the band gap of the semiconductor but, instead, it has to be greater than
the difference between the flat band potential (Ecb0) and the Fermi level (E f ) (Eqn. 1.10).
hν ≥ Ecb0 − E f (1.10)
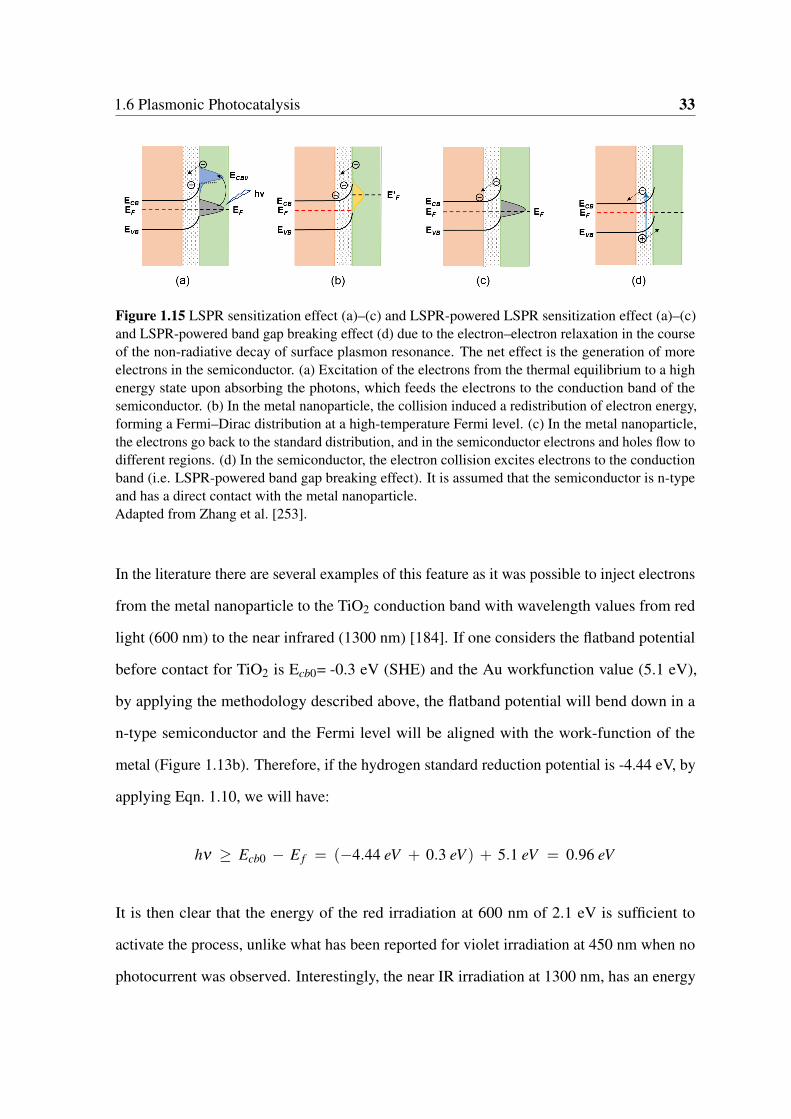
1.6 Plasmonic Photocatalysis 33
Figure 1.15 LSPR sensitization effect (a)–(c) and LSPR-powered LSPR sensitization effect (a)–(c)and LSPR-powered band gap breaking effect (d) due to the electron–electron relaxation in the courseof the non-radiative decay of surface plasmon resonance. The net effect is the generation of moreelectrons in the semiconductor. (a) Excitation of the electrons from the thermal equilibrium to a highenergy state upon absorbing the photons, which feeds the electrons to the conduction band of thesemiconductor. (b) In the metal nanoparticle, the collision induced a redistribution of electron energy,forming a Fermi–Dirac distribution at a high-temperature Fermi level. (c) In the metal nanoparticle,the electrons go back to the standard distribution, and in the semiconductor electrons and holes flow todifferent regions. (d) In the semiconductor, the electron collision excites electrons to the conductionband (i.e. LSPR-powered band gap breaking effect). It is assumed that the semiconductor is n-typeand has a direct contact with the metal nanoparticle.Adapted from Zhang et al. [253].
In the literature there are several examples of this feature as it was possible to inject electrons
from the metal nanoparticle to the TiO2 conduction band with wavelength values from red
light (600 nm) to the near infrared (1300 nm) [184]. If one considers the flatband potential
before contact for TiO2 is Ecb0= -0.3 eV (SHE) and the Au workfunction value (5.1 eV),
by applying the methodology described above, the flatband potential will bend down in a
n-type semiconductor and the Fermi level will be aligned with the work-function of the
metal (Figure 1.13b). Therefore, if the hydrogen standard reduction potential is -4.44 eV, by
applying Eqn. 1.10, we will have:
hν ≥ Ecb0 − E f = (−4.44 eV + 0.3 eV ) + 5.1 eV = 0.96 eV
It is then clear that the energy of the red irradiation at 600 nm of 2.1 eV is sufficient to
activate the process, unlike what has been reported for violet irradiation at 450 nm when no
photocurrent was observed. Interestingly, the near IR irradiation at 1300 nm, has an energy
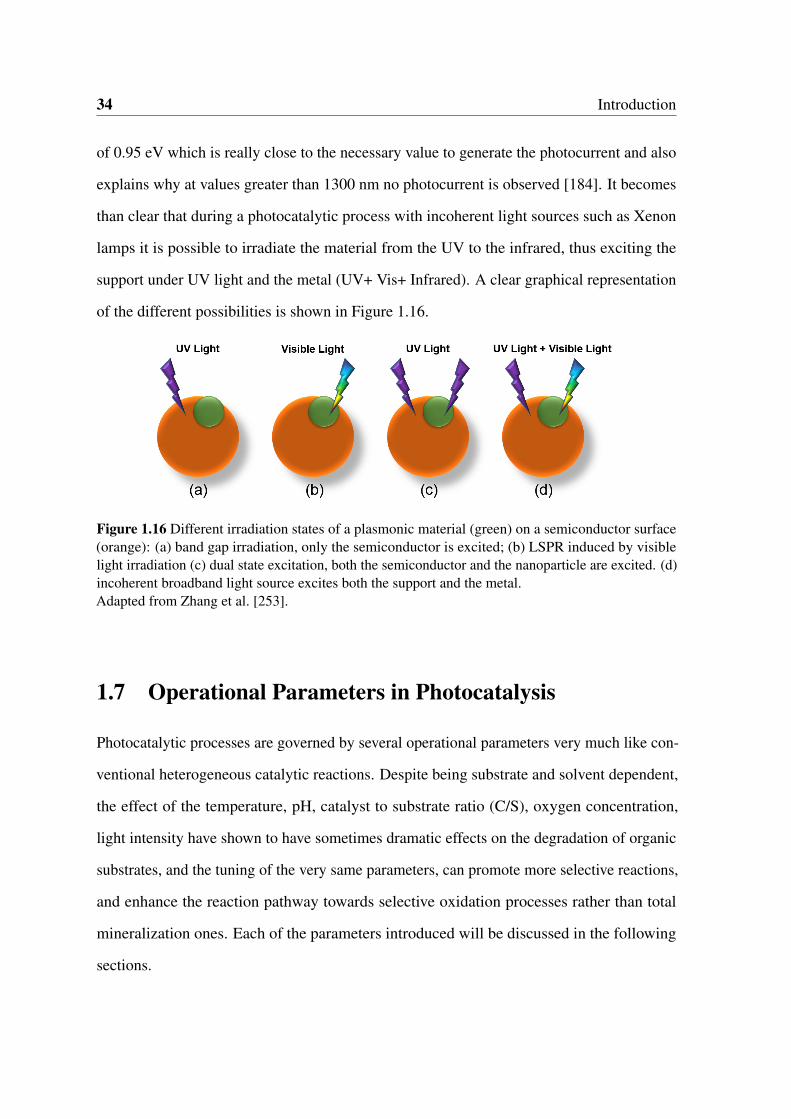
34 Introduction
of 0.95 eV which is really close to the necessary value to generate the photocurrent and also
explains why at values greater than 1300 nm no photocurrent is observed [184]. It becomes
than clear that during a photocatalytic process with incoherent light sources such as Xenon
lamps it is possible to irradiate the material from the UV to the infrared, thus exciting the
support under UV light and the metal (UV+ Vis+ Infrared). A clear graphical representation
of the different possibilities is shown in Figure 1.16.
Figure 1.16 Different irradiation states of a plasmonic material (green) on a semiconductor surface(orange): (a) band gap irradiation, only the semiconductor is excited; (b) LSPR induced by visiblelight irradiation (c) dual state excitation, both the semiconductor and the nanoparticle are excited. (d)incoherent broadband light source excites both the support and the metal.Adapted from Zhang et al. [253].
1.7 Operational Parameters in Photocatalysis
Photocatalytic processes are governed by several operational parameters very much like con-
ventional heterogeneous catalytic reactions. Despite being substrate and solvent dependent,
the effect of the temperature, pH, catalyst to substrate ratio (C/S), oxygen concentration,
light intensity have shown to have sometimes dramatic effects on the degradation of organic
substrates, and the tuning of the very same parameters, can promote more selective reactions,
and enhance the reaction pathway towards selective oxidation processes rather than total
mineralization ones. Each of the parameters introduced will be discussed in the following
sections.
1.7 Operational Parameters in Photocatalysis 35
1.7.1 Solvents
When water is used as a solvent, due to the aggressive oxidising properties of the ·OH
the partial oxidation or the total degradation of organic substrates are favourite against
photosynthetic reactions. Generally, every mineralization reaction for the production of CO2
and other inorganic species (nitrates, phosphates) starts with a partial oxidation reaction.
The ideal solvent in photocatalytic processes, should resist the strong oxidising power
of heterogeneous photocatalysts and of the reactive species produced during such reactions.
This is the main reason why, photocatalytic reactions in the presence of O2 have been carried
out in acetonitrile [16, 171, 172, 175, 214], as this polar and aprotic solvent is transparent
to UV and visible light irradiation, and most importantly is chemically inert. Sometimes
benzene [114] or alkenes [99] such as n-hexane or heptane were used albeit being less
unreactive. Cyclohexane was also used and was found to a better solvent than 2-propanol in
alcohol oxidation reactions [90]; however, it has to be noted that cyclohexane is oxidised over
TiO2 [46, 79] and therefore it is not a suitable solvent in the oxidation of weakly oxidisable
compounds as it might alter the equilibria and the reactivity of the photocatalytic system.
It is then advisable to avoid the competition of the substrate with the adsorption properties
and reactivity of the reaction medium, that is why neat liquids have been applied to maximise
the substrate adsorption, but this approach is feasible only if the products can be easily
separated from the reaction mixture and the process do not require complicated work-up
conditions. For aromatic substrates correlations between the Hammett constant (σ ) or the
1-octanol-water partition coefficient (KOW ) have been proposed for several phenolic and
substituted phenolic compounds [192]. These correlations, might become useful in targeting
special photocatalytic processes on the upgrading of the lignocellulose phenolic fraction.
36 Introduction
1.7.2 Catalyst and Substrate Concentration
The decomposition rate of organics generally increases with the catalyst loading due to the
higher amount of the photoactive material in solution. However, there is an optimum value
above which further increments in the catalyst quantity are detrimental to the photocatalytic
processes for a few very simple reasons, the first being the low light transmission due to the
light scattering from the solid particles suspended in solution, whilst the second involves an
increase rate of terminal reactions, which is a common phenomenon in radical chemistry and
can be described with the equations (Eqn. 1.11a) and (Eqn. 1.11b):
H · + OH · → H2O2 (1.11a)
H2O2 + OH · → H2O + HO·2 (1.11b)
The formation of the hydrogen peroxide initiates after the formation of hydroperoxyradicals
which are less reactive than the ·OH. The reactor design for slurry or stirred system is then
fundamental, as the effective light penetration length is the key parameter for an efficient
utilization of the photoreactor, and for this reason several dosage values are reported in the
literature for slurry system from a few mg/L to several g/L [211, 210, 220].
Immobilised systems are an alternative configuration, and in this case the key parameter
is the thickness of the film. In fact, the thicker the film, the higher the probability of incurring
in slow transfers of the photo-generated electron/hole towards the surface with a subsequent
lower turnover frequency of the adsorbed substrate, along with an increase possibility of the
undesired electron/hole recombination.
It is generally agreed that, for an efficient photodegradation process, the adsorption of
the substrate on the semiconductor material is one of the key prerequisites. Additionally,
in some cases the adsorption of the substrate actually increases the reaction rate due to
the formation of additional radical species, but it has to be noted that the high reactivity
1.7 Operational Parameters in Photocatalysis 37
of the ·OH radicals is such that they cannot diffuse far from and the reaction has to take
place in close proximity to the catalyst surface [166]. The adsorption of the substrate plays
then a crucial role, and it is influenced by the phenomena described earlier on such as the
hydrophilicity of the surface, adsorption of solvent molecules, and it is subjected to Van
der Waals forces along with hydrogen bonding, dipole-dipole interaction and outer sphere
complexation equilibria. Nonetheless, many photo-mineralization reactions can be described
with the Langmuir-Hinshelwood (LH) law, which explains the reactions kinetics occurring
between two adsorbed species such as a free radical and the substrate or a free substrate with
a surface bound radical species. Generally, the mechanism can be described as follows:
Ri = kθ = − [Si]
dt=
kK[Si]
(1 + K[Si])(1.12)
In equation 1.12, the initial degradation rate is a function of the surface coverage (θ ); the
[Si] is the initial substrate concentration, t is the reaction time and k and K are the Langmuir
adsorption constant and the adsorption equilibrium constant respectively. Specifically, K is
a measurement of the intrinsic reactivity for a photoactive surface S. Therefore, different
regimes can be identified according to the substrate concentration. According to Carp et al.
[47] if the substrate concentration [Si] is lower than 10−3M the reaction kinetic is an apparent
first order as the denominator in equation 3 is much lower than 1, whilst, if the [Si] is higher
than 5x10⁻³ M the numerator becomes much greater than 1 and the reaction kinetics has
a zero order and maximum reaction rate. However, different kinetics values have been
observed for the dehydrogenation of alcohols and for the degradation of pesticides and
dyes [250, 232, 207]. Selective oxidation reactions are better described by the competitive
adsorption mechanisms. Therefore, the 1.12 can be rewritten considering two species, namely
A and B which compete for the same adsorption site on the catalysts surface. There are a few
assumptions to apply:
• All sites are equivalent
38 Introduction
• Each site can either hold A or B not both.
• There are no interactions between the adsorbate molecules and on adjacent sites.
The surface S of the catalyst can be described as follows:
S = [S f ree] + Aads + Bads (1.13)
In which S f ree, Aads, and Bads represent the unoccupied active sites on the catalyst surface
and the sites occupied by A and B respectively. Therefore, if we consider that each of the
species has its own equilibrium constant kA,B and KA,B, it is possible to define the surface
coverage values for each of the species as follows:
θA =kAKA
1+ kAKA + kbKB(1.14)
θB =kBKB
1+ kAKA + kbKB(1.15)
The difficulty in the application of the competitive adsorption model in photocatalytic
applications lies in the identification and quantification of the reactive species being produced.
Therefore, several suggestions have been to include the oxygen content, catalyst amount and
light intensity to improve the model and obtain better correlation with the experimental data
[164, 165].
1.7.3 Temperature
Photocatalytic reactions are generally not affected by minor temperature variations. The
variation of the activity as a function of the temperature is only 5-16 kJ mol−1 if compared
with the conventional thermal reactions. In fact, at room temperature, the thermal energy
value kT is only 0.026 eV and it has negligible contribution to the TiO2 band gap [47].

1.7 Operational Parameters in Photocatalysis 39
Nonetheless, if the thermal energy does not have a direct impact on the TiO2 Eg, this value
is close to the activation energy for the formation of ·OH radicals, this is an indication that
most photocatalytic processes are governed by the formation of these active species to the
low activation energy. Moreover, changes in the temperature might affect the adsorption-
desorption properties of certain substrates along with the desorption of the intermediates,
thus freeing more surface area and increasing the activity of the material, as in most cases,
at low temperatures, the desorption of the surface-bound species is the rate-limiting factor.
Within wider temperature ranges, the variation of the Fermi level for TiO2 from 21-75°C was
only 0.04 eV but sufficient to increment the electron-transfer kinetics at the interface. On
the other hand, for O2 mediated reactions, an increase in temperature lowers the adsorption
isotherms thus lowering the overall solubilised oxygen concentration [164, 165]. Therefore,
it is important to monitor the reactions conditions, as usually the substrate concentration is
much lower than the O2 pressure and under these conditions, the effect of the temperature
will be dominant on the reaction rate rather than on the oxygen isotherms. Vice versa, the
effect of the temperature will be dominant on the electron transfer mechanism to oxygen
[25].
1.7.4 pH Influence
The pH of the reaction medium can influence the photocatalytic properties of a semiconductor
in various ways. The first one is related to the isoelectric point of the metal oxide, defined as
the pH value at which the surface does not present any electric charges due to the presence
of hydroxyl groups or protons. For TiO2 this value is around pH 6, and at lower values
the surface will be positively charge, and vice versa, at alkali pH values the surface will be
negatively charged. This electrostatic charging directly affects the capability of a substrate in
the adsorption of molecules with polar functional groups. For TiO2 as previously mentioned,
the flatband position affects the activity of the catalyst, and affects the rate of production
40 Introduction
of the different radical species formed during the photo-initiated process. For rutile, it was
found by Fujishima et al. [95] that the dependency of the flatband potential for rutile and
anatase to follow a Nernstian trend due to the acid-base equilibria on the surface of the
catalyst at 25°C and it was found to be at pH 0 +0.01 V for rutile and -0.02 V for anatase
versus SHE (Eqn. 1.16).
TiO(O) + H+ = TiO(OH) (1.16)
In Figure 1.17 the photoactivity of rutile and anatase are summarised at different pH levels.
It can be seen how the energy conduction band (Ecb) is superimposed to the hydrogen
potential at all pH values for rutile, whereas anatase has more negative potential. At low
pH levels the Ecb for rutile is also coinciding with the O2 reduction potential to generate
hydroperoxyradicals (HO·2). At higher pH values the reduction potential remains constant at
-0.284 V [230] but the Ecb continues its negative trend. It can be assumed that this reaction is
going to be preferred at alkali pH values. As regards anatase, the Ecb is negative enough to
reduce O2 to the superoxide anion (O−2 ) over a wide range of pH values and this is reflected
by the higher activity of this polymorph. Both valence band energy levels (Evb) for anatase
and rutile are at the same potential value which is sufficient for the generation of ·OH radicals
at lower pH, and O· − at higher pH values. Therefore, by tuning the pH of the reaction
medium it is possible to favour the adsorption of polar molecules on the catalyst surface and
tailor the production of selected radical species.
1.7.5 Light Intensity
Mills et al. [164] suggested that the LH isotherm is also influenced by the light absorption.
Specifically, the equilibrium constant K, is proportional to the Iθa in which Ia is the rate of the
light absorption of the photoactive material and θ is a power term which is a function of the
intensity of the lamp and can be equal to 0.5, 1 or 2 for low, medium and high intensity lamps
respectively. They also reported that, in many of the kinetic studies, the light intensities were
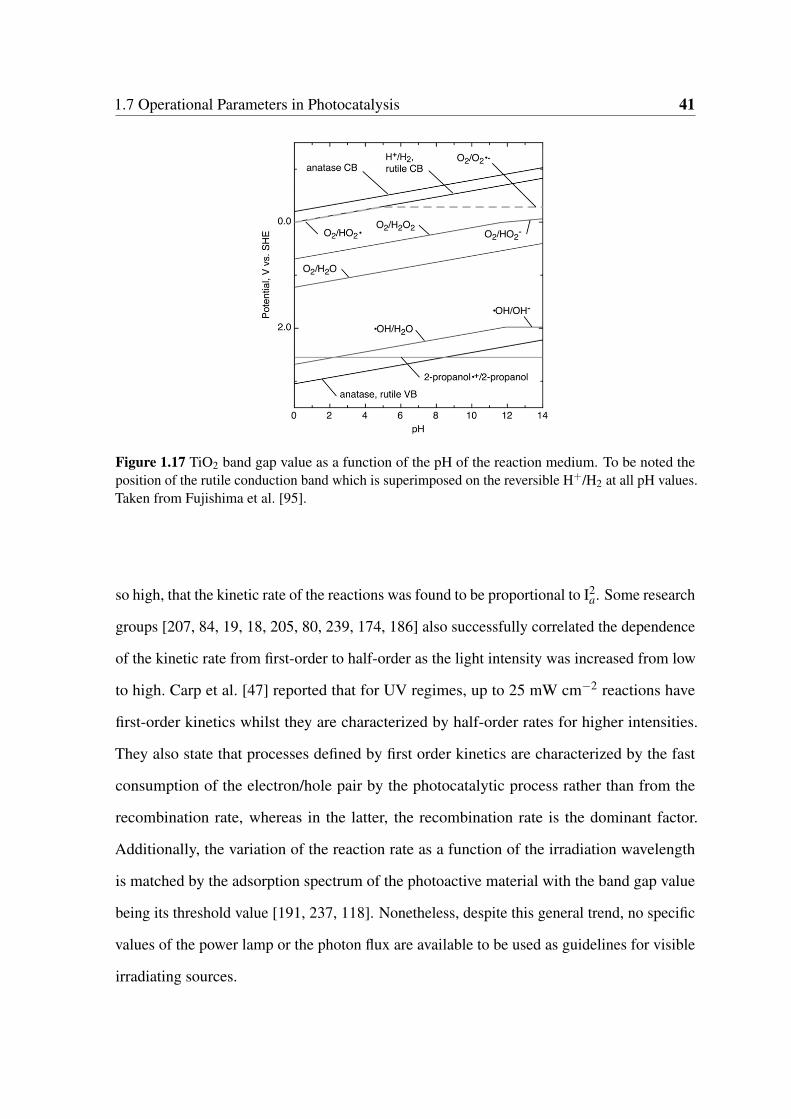
1.7 Operational Parameters in Photocatalysis 41
Figure 1.17 TiO2 band gap value as a function of the pH of the reaction medium. To be noted theposition of the rutile conduction band which is superimposed on the reversible H+/H2 at all pH values.Taken from Fujishima et al. [95].
so high, that the kinetic rate of the reactions was found to be proportional to I2a. Some research
groups [207, 84, 19, 18, 205, 80, 239, 174, 186] also successfully correlated the dependence
of the kinetic rate from first-order to half-order as the light intensity was increased from low
to high. Carp et al. [47] reported that for UV regimes, up to 25 mW cm−2 reactions have
first-order kinetics whilst they are characterized by half-order rates for higher intensities.
They also state that processes defined by first order kinetics are characterized by the fast
consumption of the electron/hole pair by the photocatalytic process rather than from the
recombination rate, whereas in the latter, the recombination rate is the dominant factor.
Additionally, the variation of the reaction rate as a function of the irradiation wavelength
is matched by the adsorption spectrum of the photoactive material with the band gap value
being its threshold value [191, 237, 118]. Nonetheless, despite this general trend, no specific
values of the power lamp or the photon flux are available to be used as guidelines for visible
irradiating sources.
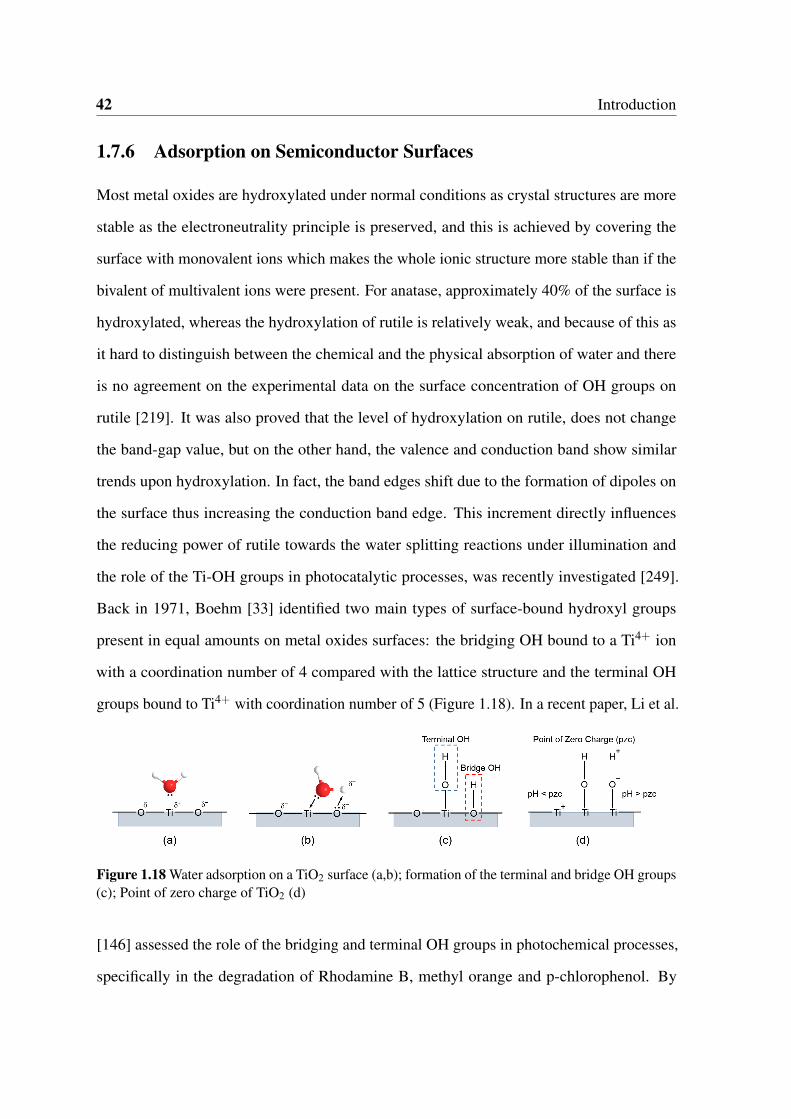
42 Introduction
1.7.6 Adsorption on Semiconductor Surfaces
Most metal oxides are hydroxylated under normal conditions as crystal structures are more
stable as the electroneutrality principle is preserved, and this is achieved by covering the
surface with monovalent ions which makes the whole ionic structure more stable than if the
bivalent of multivalent ions were present. For anatase, approximately 40% of the surface is
hydroxylated, whereas the hydroxylation of rutile is relatively weak, and because of this as
it hard to distinguish between the chemical and the physical absorption of water and there
is no agreement on the experimental data on the surface concentration of OH groups on
rutile [219]. It was also proved that the level of hydroxylation on rutile, does not change
the band-gap value, but on the other hand, the valence and conduction band show similar
trends upon hydroxylation. In fact, the band edges shift due to the formation of dipoles on
the surface thus increasing the conduction band edge. This increment directly influences
the reducing power of rutile towards the water splitting reactions under illumination and
the role of the Ti-OH groups in photocatalytic processes, was recently investigated [249].
Back in 1971, Boehm [33] identified two main types of surface-bound hydroxyl groups
present in equal amounts on metal oxides surfaces: the bridging OH bound to a Ti4+ ion
with a coordination number of 4 compared with the lattice structure and the terminal OH
groups bound to Ti4+ with coordination number of 5 (Figure 1.18). In a recent paper, Li et al.
Figure 1.18 Water adsorption on a TiO2 surface (a,b); formation of the terminal and bridge OH groups(c); Point of zero charge of TiO2 (d)
[146] assessed the role of the bridging and terminal OH groups in photochemical processes,
specifically in the degradation of Rhodamine B, methyl orange and p-chlorophenol. By
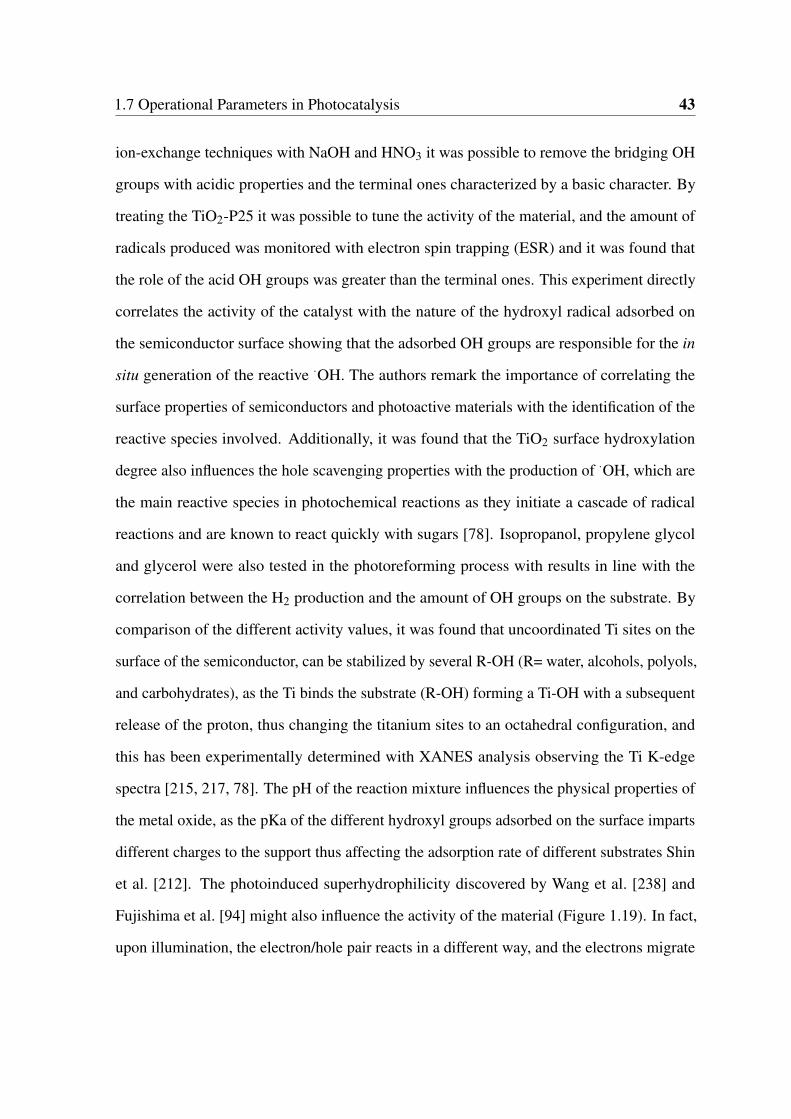
1.7 Operational Parameters in Photocatalysis 43
ion-exchange techniques with NaOH and HNO3 it was possible to remove the bridging OH
groups with acidic properties and the terminal ones characterized by a basic character. By
treating the TiO2-P25 it was possible to tune the activity of the material, and the amount of
radicals produced was monitored with electron spin trapping (ESR) and it was found that
the role of the acid OH groups was greater than the terminal ones. This experiment directly
correlates the activity of the catalyst with the nature of the hydroxyl radical adsorbed on
the semiconductor surface showing that the adsorbed OH groups are responsible for the in
situ generation of the reactive ·OH. The authors remark the importance of correlating the
surface properties of semiconductors and photoactive materials with the identification of the
reactive species involved. Additionally, it was found that the TiO2 surface hydroxylation
degree also influences the hole scavenging properties with the production of ·OH, which are
the main reactive species in photochemical reactions as they initiate a cascade of radical
reactions and are known to react quickly with sugars [78]. Isopropanol, propylene glycol
and glycerol were also tested in the photoreforming process with results in line with the
correlation between the H2 production and the amount of OH groups on the substrate. By
comparison of the different activity values, it was found that uncoordinated Ti sites on the
surface of the semiconductor, can be stabilized by several R-OH (R= water, alcohols, polyols,
and carbohydrates), as the Ti binds the substrate (R-OH) forming a Ti-OH with a subsequent
release of the proton, thus changing the titanium sites to an octahedral configuration, and
this has been experimentally determined with XANES analysis observing the Ti K-edge
spectra [215, 217, 78]. The pH of the reaction mixture influences the physical properties of
the metal oxide, as the pKa of the different hydroxyl groups adsorbed on the surface imparts
different charges to the support thus affecting the adsorption rate of different substrates Shin
et al. [212]. The photoinduced superhydrophilicity discovered by Wang et al. [238] and
Fujishima et al. [94] might also influence the activity of the material (Figure 1.19). In fact,
upon illumination, the electron/hole pair reacts in a different way, and the electrons migrate
44 Introduction
Figure 1.19 Mechanism of the photo-induced superhydrophilicity under UV irradiation. Adaptedfrom Fujishima et al. [93].
towards the surface to reduce the Ti(IV) species to Ti(III) whilst the holes oxidise the O−2
anions. During this process, oxygen vacancies are created with the elimination of the oxygen
atoms. These vacancies can then be occupied by adsorbed species, and if water is present,
the adsorbed OH groups make the surface of the material hydrophilic. The presence of these
OH groups adsorbed on the bridging oxygen atoms in the lattice structure increases the
hydroxylation content of the material, thus enhancing the formation of the ·OH radicals.
1.7.7 Formation of the Ligand-to-Metal Charge Transfer (LMCT)
Along with the deposition of metals on the surface of semiconductors, another method of
extending the activity of wide band gap semiconductors to the visible range is the sensitization
of the material with dyes or via the formation of complexes with the adsorbed molecules and
the surface of the semiconductor itself [45, 247, 193, 198]. The adsorbed organic compounds
do not necessarily have to absorb light themselves, in fact, in this process, the visible light
induced charge transfer occurs from the HOMO of the adsorbate to the conduction band
of the TiO2. Figure 1.20 shows the different cartoons for the dye sensitization (a) and for

1.7 Operational Parameters in Photocatalysis 45
the LMCT process (b). The first mechanism is initiated by the HOMO-LUMO electron
transfer of the adsorbed dye on the TiO2 surface. After this initial excitation, the HOMO
electrons are then injected in the TiO2 conduction band, and become available for further
reactions. The oxidised dye can be regenerated as soon as suitable electron donors become
available in the system. The latter LMCT mechanism is characterized by the excitation of the
ground state electrons of the adsorbate which are then injected into the conduction band of the
semiconductor without involving any excited state from the adsorbate. The oxidised adsorbate
can either undergo further degradation into smaller molecules or it can be regenerated by
suitable electron donors in the reaction medium or by the back electron transfer from the
recombination of the electron from the conduction band of the semiconductor to the adsorbate
itself. Typically, the formation of the LMCT complex can be observed by the appearance
Figure 1.20 Schematic illustration of two similar types of visible light sensitization of TiO2. (a)Dye sensitization: (1) excitation of the dye by visible light absorption, (2) electron transfer from theexcited state of the dye to TiO2 CB, (3) recombination, (4) electron transfer to the acceptor, and (5)regeneration of the sensitizer by an electron donor. (b) LMCT sensitization: (1) visible light-inducedLMCT transfer, (2) recombination, (3) electron transfer to the acceptor, and (4) regeneration ofadsorbates by an electron donor. S, D, and A represent the sensitizer (or adsorbate), electron donor,and electron acceptor, respectively. (S0 ground state, S∗ and S excited state of the sensitizer adsorbate).Adapted from Zhang et al. [253].
of an absorption band in the visible range with a subsequent colouration of the material,
46 Introduction
which cannot be seen for the TiO2 alone. The most important difference between the dye
sensitization process and the LMCT is the fact that for the former, the positioning of the
HOMO-LUMO gap is the determining factor in the dye visible light absorption properties,
whereas for the latter, the adsorbate does not necessarily have to absorb light as the HOMO
level is the only parameter to be considered. For this specific reason, LMCT complexes
are much more flexible and grant some freedom in the design and application of different
substrates specifically for environmental applications in which many organic pollutants can
form stable complexes with the surface of metal oxides semiconductors and can be degraded
using solar light.
1.8 Aim of the Work
This work will focus on a multidisciplinary approach and will try to answer some of the
questions regarding the activity of TiO2 based materials for the selective oxidation of bio-
derived molecules, specifically on glucose and cellobiose. The aim of this PhD is to gather
basic information regarding the activity of semiconductor photocatalysis under visible light,
enhancing the activity of TiO2 oxides by creating novel materials through the creation of
metallic AuAg nano-alloys in order to extend and enhance the photoactivity under visible
light. The project can be divided in the following workpackages:
• Assessment of the activity of TiO2 under visible and UVA light in the oxidation of
glucose. Identification of the optimum reaction conditions.
• Assessment of the activity of several metal supported Ag/TiO2 materials in the oxida-
tion of glucose. Does the presence of the metal affect the reaction pathway? Which
products can be obtained by tailoring the properties of the support?
• Identification of the reaction pathway of the oxidation of glucose under UVA and
visible light.
1.8 Aim of the Work 47
• Is it possible to extend the visible light response of the Ag/TiO2 materials by coupling
a second metal such as Au?
• Can cellobiose, a model compound for cellulose, react in a similar fashion to glucose
and produce partial oxidation products under visible and UVA light?
Ultimately, the radical chemistry of the oxidation of glucose and the hydrolytic oxidation of
cellobiose will be investigated to obtain fundamental understanding of the key factor govern-
ing this specific class of reactions, understanding the effect of several catalytic parameters
in order to build a bottom up approach robust enough to efficiently and, most importantly,
provide the fundamental analytical and methodological tools for a correct understanding of
the valorisation of sugars, with the ultimate intent of using cellulose as a reactant.

Chapter 2Materials and Methods
DO YOU SEE THE LIGHT?
Rev. C. James
2.1 Chemicals
The following reagents were used:Gold (III) chloride trihydrate (99.9%), Silver nitrate (>
99.0%),Titanium (IV) Oxide Aeroxide P25 (Acros Organics), NaBH4 (Sigma-Aldrich),
Titanium (IV) oxide anatase 99.8%, Titanium (IV) oxide rutile 99.99% (Sigma-Aldrich),
Acetonitrile (MeCN) HPLC Grade 99.9% (Fisher Chemical), Poly (ethylene glycol)-block-
poly (propylene glycol)-block-poly (ethylene glycol) (Pluronic P123, Mn 5800), Polyvinyl
alcohol (PVA, average MW 130,000, 99+% hydrolyzed) (Sigma-Aldrich).
HPLC calibration standards:D-(+)-Cellobiose (≥ 99%), D-(+)-Glucose ≥ 99.5% (GC), D-
Gluconic acid sodium salt > 99%, D-(-)-Arabinose ≥ 98%, D-(+)-Glyceraldehyde ≥ 98%,
D-(-)-Erythrose ≥ 75%, Formic acid ≥ 95% were all purchased from Sigma-Aldrich and
used without further purification. 1,6-Anhydro-β -D-cellobiose ≥ 96% was purchased from
Carbosynth (Carbosynth Limited , UK)
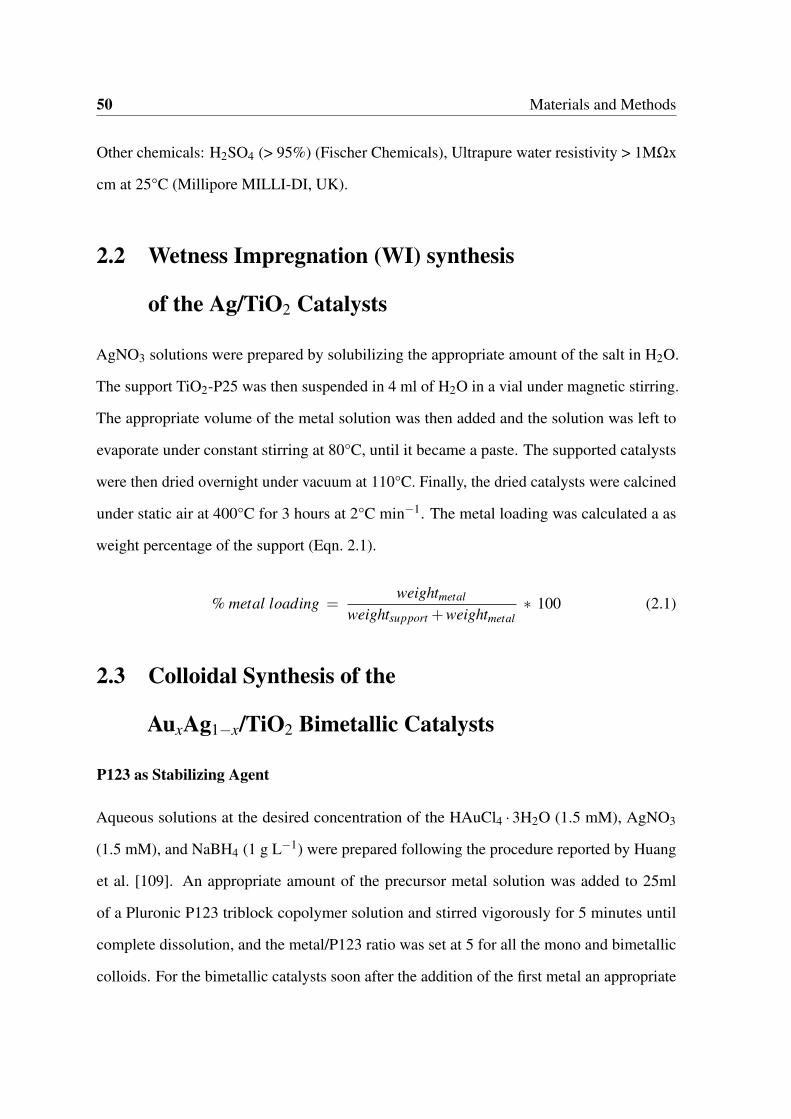
50 Materials and Methods
Other chemicals: H2SO4 (> 95%) (Fischer Chemicals), Ultrapure water resistivity > 1MΩx
cm at 25°C (Millipore MILLI-DI, UK).
2.2 Wetness Impregnation (WI) synthesis
of the Ag/TiO2 Catalysts
AgNO3 solutions were prepared by solubilizing the appropriate amount of the salt in H2O.
The support TiO2-P25 was then suspended in 4 ml of H2O in a vial under magnetic stirring.
The appropriate volume of the metal solution was then added and the solution was left to
evaporate under constant stirring at 80°C, until it became a paste. The supported catalysts
were then dried overnight under vacuum at 110°C. Finally, the dried catalysts were calcined
under static air at 400°C for 3 hours at 2°C min−1. The metal loading was calculated a as
weight percentage of the support (Eqn. 2.1).
% metal loading =weightmetal
weightsupport +weightmetal∗ 100 (2.1)
2.3 Colloidal Synthesis of the
AuxAg1−x/TiO2 Bimetallic Catalysts
P123 as Stabilizing Agent
Aqueous solutions at the desired concentration of the HAuCl4 · 3H2O (1.5 mM), AgNO3
(1.5 mM), and NaBH4 (1 g L−1) were prepared following the procedure reported by Huang
et al. [109]. An appropriate amount of the precursor metal solution was added to 25ml
of a Pluronic P123 triblock copolymer solution and stirred vigorously for 5 minutes until
complete dissolution, and the metal/P123 ratio was set at 5 for all the mono and bimetallic
colloids. For the bimetallic catalysts soon after the addition of the first metal an appropriate
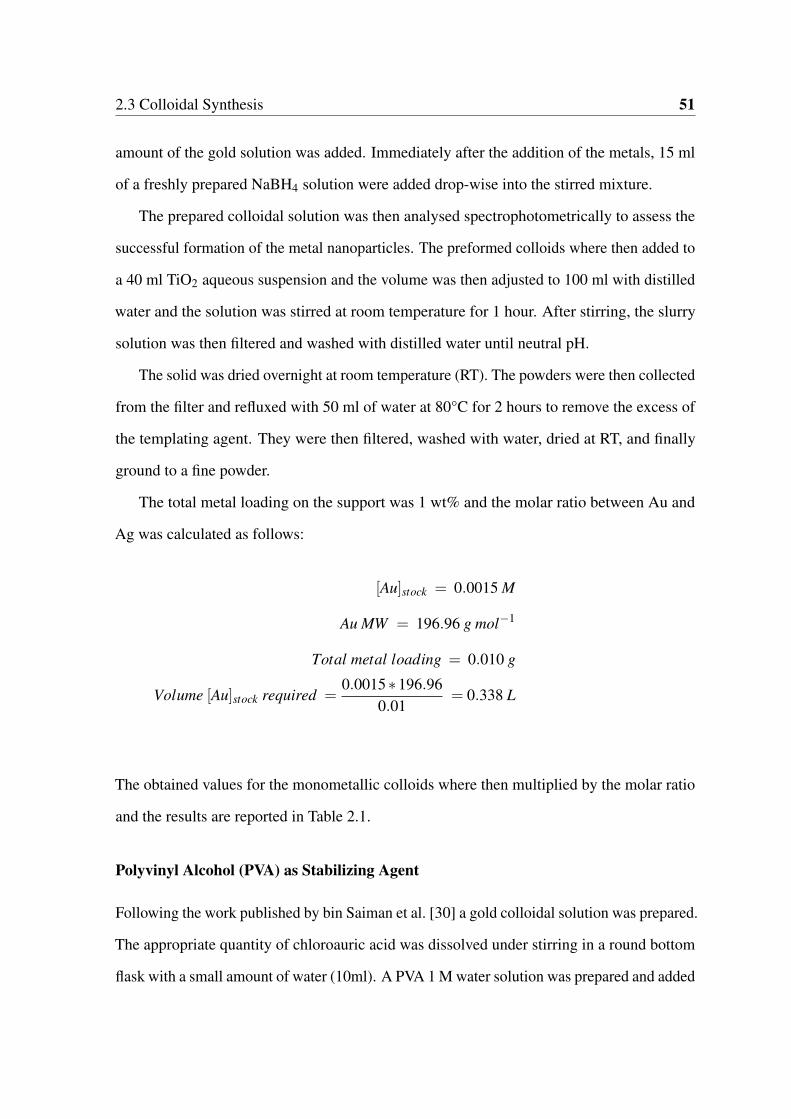
2.3 Colloidal Synthesis 51
amount of the gold solution was added. Immediately after the addition of the metals, 15 ml
of a freshly prepared NaBH4 solution were added drop-wise into the stirred mixture.
The prepared colloidal solution was then analysed spectrophotometrically to assess the
successful formation of the metal nanoparticles. The preformed colloids where then added to
a 40 ml TiO2 aqueous suspension and the volume was then adjusted to 100 ml with distilled
water and the solution was stirred at room temperature for 1 hour. After stirring, the slurry
solution was then filtered and washed with distilled water until neutral pH.
The solid was dried overnight at room temperature (RT). The powders were then collected
from the filter and refluxed with 50 ml of water at 80°C for 2 hours to remove the excess of
the templating agent. They were then filtered, washed with water, dried at RT, and finally
ground to a fine powder.
The total metal loading on the support was 1 wt% and the molar ratio between Au and
Ag was calculated as follows:
[Au]stock = 0.0015 M
Au MW = 196.96 g mol−1
Total metal loading = 0.010 g
Volume [Au]stock required =0.0015∗196.96
0.01= 0.338 L
The obtained values for the monometallic colloids where then multiplied by the molar ratio
and the results are reported in Table 2.1.
Polyvinyl Alcohol (PVA) as Stabilizing Agent
Following the work published by bin Saiman et al. [30] a gold colloidal solution was prepared.
The appropriate quantity of chloroauric acid was dissolved under stirring in a round bottom
flask with a small amount of water (10ml). A PVA 1 M water solution was prepared and added
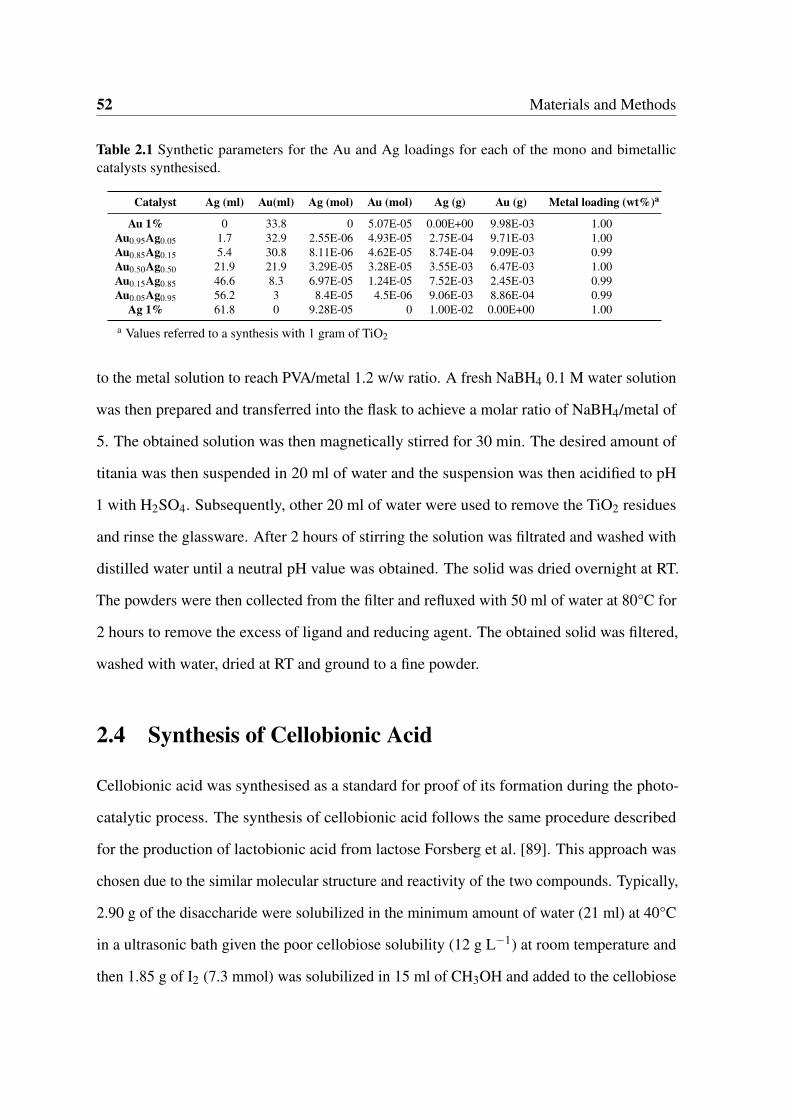
52 Materials and Methods
Table 2.1 Synthetic parameters for the Au and Ag loadings for each of the mono and bimetalliccatalysts synthesised.
Catalyst Ag (ml) Au(ml) Ag (mol) Au (mol) Ag (g) Au (g) Metal loading (wt%)a
Au 1% 0 33.8 0 5.07E-05 0.00E+00 9.98E-03 1.00Au0.95Ag0.05 1.7 32.9 2.55E-06 4.93E-05 2.75E-04 9.71E-03 1.00Au0.85Ag0.15 5.4 30.8 8.11E-06 4.62E-05 8.74E-04 9.09E-03 0.99Au0.50Ag0.50 21.9 21.9 3.29E-05 3.28E-05 3.55E-03 6.47E-03 1.00Au0.15Ag0.85 46.6 8.3 6.97E-05 1.24E-05 7.52E-03 2.45E-03 0.99Au0.05Ag0.95 56.2 3 8.4E-05 4.5E-06 9.06E-03 8.86E-04 0.99
Ag 1% 61.8 0 9.28E-05 0 1.00E-02 0.00E+00 1.00
a Values referred to a synthesis with 1 gram of TiO2
to the metal solution to reach PVA/metal 1.2 w/w ratio. A fresh NaBH4 0.1 M water solution
was then prepared and transferred into the flask to achieve a molar ratio of NaBH4/metal of
5. The obtained solution was then magnetically stirred for 30 min. The desired amount of
titania was then suspended in 20 ml of water and the suspension was then acidified to pH
1 with H2SO4. Subsequently, other 20 ml of water were used to remove the TiO2 residues
and rinse the glassware. After 2 hours of stirring the solution was filtrated and washed with
distilled water until a neutral pH value was obtained. The solid was dried overnight at RT.
The powders were then collected from the filter and refluxed with 50 ml of water at 80°C for
2 hours to remove the excess of ligand and reducing agent. The obtained solid was filtered,
washed with water, dried at RT and ground to a fine powder.
2.4 Synthesis of Cellobionic Acid
Cellobionic acid was synthesised as a standard for proof of its formation during the photo-
catalytic process. The synthesis of cellobionic acid follows the same procedure described
for the production of lactobionic acid from lactose Forsberg et al. [89]. This approach was
chosen due to the similar molecular structure and reactivity of the two compounds. Typically,
2.90 g of the disaccharide were solubilized in the minimum amount of water (21 ml) at 40°C
in a ultrasonic bath given the poor cellobiose solubility (12 g L−1) at room temperature and
then 1.85 g of I2 (7.3 mmol) was solubilized in 15 ml of CH3OH and added to the cellobiose
2.5 Thermal Pretreatments 53
solution under stirring. Subsequently, a 4% w/w KOH solution was prepared solubilizing
1.65 g of the hydroxyde in 50 ml of CH3OH and added dropwise. Upon the addition of the
KOH the pale yellow color of the iodine solution gradually disappeared and to speed up the
process, the solution was heated to 40°C until transparent. The reaction mixture was then
cooled in a refrigerator at 4°C overnight to precipitate the cellobionic acid crystals. The
recover solid was then filtrated from the mother solution and dried in a rotavapor. The dry
solid was then weighed yielding 0.34 g of potassium cellobionate crystals. The purity of
the solid was then assessed using 1H and 13C NMR along with mass spectrometry analysis
(HPLC-QTOF) and ATR-FTIR measurements of the solid. For the characterization results
the reader is invited to see Appendix B.1.
2.5 Thermal Pretreatments
The different TiO2 polymorphs were dried under vacuum at 100°C before the reactions and
the TiO2-P25 was heat treated under static air at 500 and 600°C respectively to change the
rutile to anatase ratio. The catalyst after the heat treatment procedure were ground and stored
in a desiccator until further use.
2.6 Catalyst Characterization Techniques
2.6.1 UV-Vis Spectroscopy
UV-Vis
UV-VIS absorbance analyses were performed in a 10 mm quartz cuvette in the range 200-820
nm using a Thermo Scientific Evolution 220 spectrophotometer (Thermo Scientific, UK).
Instrument settings were: bandwidth 2 nm, integration time 0.01 s, data interval 0.20 nm and
scan speed 1200 nm min−1. Baseline was obtained with distilled water.
54 Materials and Methods
Solid UV-Vis
The solid UV-Vis analysis of the catalysts was performed using a UV-2550 Shimadzu
spectrophotometer equipped with a ISR-2200 integrating sphere (Shimadzu Corp, JP) in
the range 200-800 nm with a 1 nm sampling interval and a 5 nm slit with using BaSO4 as
reference. The reflectance data were used to calculate the Kubelka-Munk function using the
absolute reflectance (R∞) to evaluate the bandgap of the solid samples (see Appendix C.1).
2.6.2 X-ray Diffraction (XRD)
X-ray diffraction (XRD) patterns were recorded using in transmission mode using a PANa-
lytical X’Pert Pro HTS diffractometer with a slit of 0.04° at a scanning rate of 9° min−1 in
the range 4-90° using a Cu-Kα radiation (λ=1.54Å).
2.6.3 Attenuated Total Reflectance
Infrared Spectroscopy (ATR-FTIR)
The ATR-FTIR spectra were recorded using a HTS-XT Bruker Tensor 27 (Bruker, USA)
equipped with a Quest ATR accessory (Specac, USA) with a high throughput diamond crystal
in the range 6000-400 cm−1 (resolution 4 cm−1) and 32 interferograms were recorded for
each sample.
2.6.4 X-ray Photoelectron Spectroscopy (XPS)
Samples were sent for XPS analysis at NEXUS National EPSRC XPS User’s Service hosted
by nanoLAB at Newcastle University. The XPS analysis was performed with a Thermo
K-Alpha (Thermo Scientific, East Grinstead, UK) with a microfocused monochromatic Al
Kα source (1486.6 eV, 12 kV, 3 mA, 36 W) with a spot size of 400 by 800 µm. The data
aquired was obtained from the analysis of 3 positions per sample with a general 30 scan
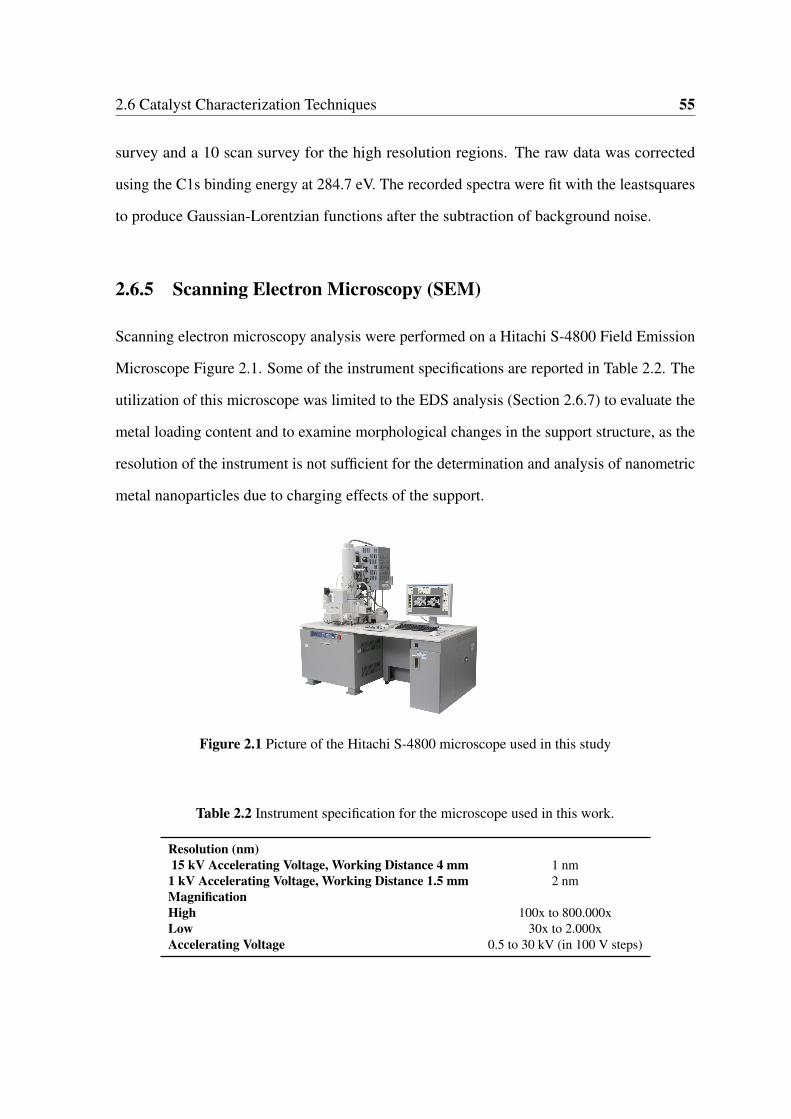
2.6 Catalyst Characterization Techniques 55
survey and a 10 scan survey for the high resolution regions. The raw data was corrected
using the C1s binding energy at 284.7 eV. The recorded spectra were fit with the leastsquares
to produce Gaussian-Lorentzian functions after the subtraction of background noise.
2.6.5 Scanning Electron Microscopy (SEM)
Scanning electron microscopy analysis were performed on a Hitachi S-4800 Field Emission
Microscope Figure 2.1. Some of the instrument specifications are reported in Table 2.2. The
utilization of this microscope was limited to the EDS analysis (Section 2.6.7) to evaluate the
metal loading content and to examine morphological changes in the support structure, as the
resolution of the instrument is not sufficient for the determination and analysis of nanometric
metal nanoparticles due to charging effects of the support.
Figure 2.1 Picture of the Hitachi S-4800 microscope used in this study
Table 2.2 Instrument specification for the microscope used in this work.
Resolution (nm)15 kV Accelerating Voltage, Working Distance 4 mm 1 nm
1 kV Accelerating Voltage, Working Distance 1.5 mm 2 nmMagnificationHigh 100x to 800.000xLow 30x to 2.000xAccelerating Voltage 0.5 to 30 kV (in 100 V steps)
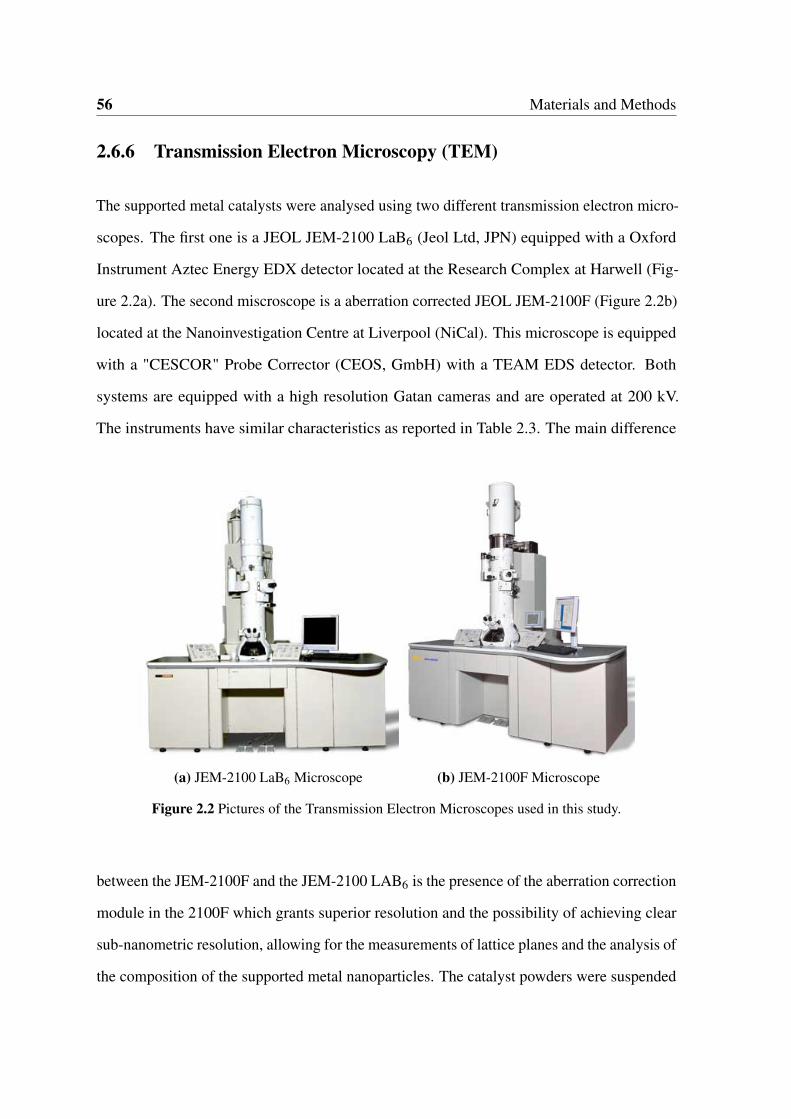
56 Materials and Methods
2.6.6 Transmission Electron Microscopy (TEM)
The supported metal catalysts were analysed using two different transmission electron micro-
scopes. The first one is a JEOL JEM-2100 LaB6 (Jeol Ltd, JPN) equipped with a Oxford
Instrument Aztec Energy EDX detector located at the Research Complex at Harwell (Fig-
ure 2.2a). The second miscroscope is a aberration corrected JEOL JEM-2100F (Figure 2.2b)
located at the Nanoinvestigation Centre at Liverpool (NiCal). This microscope is equipped
with a "CESCOR" Probe Corrector (CEOS, GmbH) with a TEAM EDS detector. Both
systems are equipped with a high resolution Gatan cameras and are operated at 200 kV.
The instruments have similar characteristics as reported in Table 2.3. The main difference
(a) JEM-2100 LaB6 Microscope (b) JEM-2100F Microscope
Figure 2.2 Pictures of the Transmission Electron Microscopes used in this study.
between the JEM-2100F and the JEM-2100 LAB6 is the presence of the aberration correction
module in the 2100F which grants superior resolution and the possibility of achieving clear
sub-nanometric resolution, allowing for the measurements of lattice planes and the analysis of
the composition of the supported metal nanoparticles. The catalyst powders were suspended
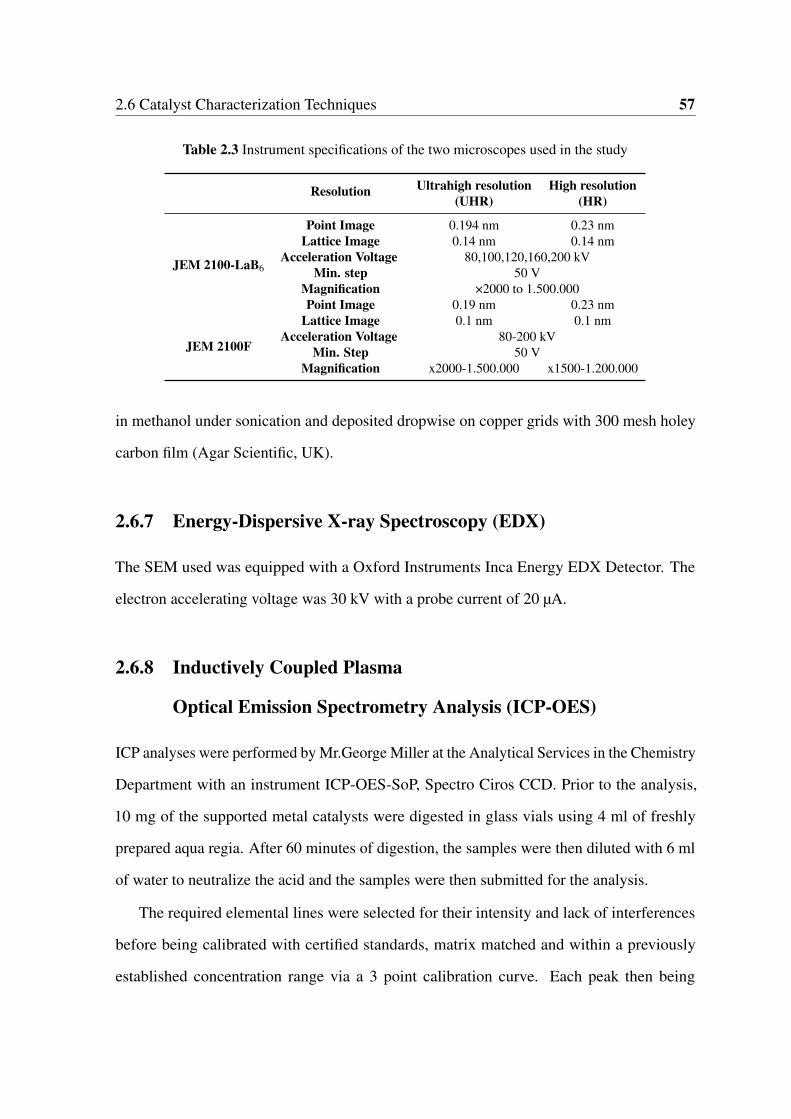
2.6 Catalyst Characterization Techniques 57
Table 2.3 Instrument specifications of the two microscopes used in the study
Resolution Ultrahigh resolution High resolution(UHR) (HR)
JEM 2100-LaB6
Point Image 0.194 nm 0.23 nmLattice Image 0.14 nm 0.14 nm
Acceleration Voltage 80,100,120,160,200 kVMin. step 50 V
Magnification ×2000 to 1.500.000
JEM 2100F
Point Image 0.19 nm 0.23 nmLattice Image 0.1 nm 0.1 nm
Acceleration Voltage 80-200 kVMin. Step 50 V
Magnification x2000-1.500.000 x1500-1.200.000
in methanol under sonication and deposited dropwise on copper grids with 300 mesh holey
carbon film (Agar Scientific, UK).
2.6.7 Energy-Dispersive X-ray Spectroscopy (EDX)
The SEM used was equipped with a Oxford Instruments Inca Energy EDX Detector. The
electron accelerating voltage was 30 kV with a probe current of 20 µA.
2.6.8 Inductively Coupled Plasma
Optical Emission Spectrometry Analysis (ICP-OES)
ICP analyses were performed by Mr.George Miller at the Analytical Services in the Chemistry
Department with an instrument ICP-OES-SoP, Spectro Ciros CCD. Prior to the analysis,
10 mg of the supported metal catalysts were digested in glass vials using 4 ml of freshly
prepared aqua regia. After 60 minutes of digestion, the samples were then diluted with 6 ml
of water to neutralize the acid and the samples were then submitted for the analysis.
The required elemental lines were selected for their intensity and lack of interferences
before being calibrated with certified standards, matrix matched and within a previously
established concentration range via a 3 point calibration curve. Each peak then being
58 Materials and Methods
maximised with background compensation applied before final recalculation of the method
and with a correlation coefficient R2>0.9993. Instrument parameters from optimisation were,
Plasma power 1400 W with a nebulising flow of 0.82 L min−1, coolant flow of 12.0 L min−1
and auxiliary flow of 1.0 L min−1 Line selection for each element was, Ag 328.068 and
338.289 nm, Au 242.795 and 267.595 nm respectively. Typical %RSD values were between
1-2% indicating a stable plasma with consistent sample injection and aspiration.
2.7 Products Analysis and Characterization
2.7.1 High Performance Liquid Chromatography (HPLC)
The glucose stock solutions and reaction products were analysed with a 1200 HPLC Agilent
(Agilent, USA) system equipped with a photodiode array detector (DAD) and a refractive
index detector (RID). The analytical column used was an Aminex HPX-87H (300 mm x 7.8
mm), 9 µm particle size (Bio-Rad CA, USA) kept at 65°C and using a 0.025 M H2SO4 as
eluent with a flow rate of 0.65 ml min−1. The products concentration and glucose conversion
was determined using calibration curves (see Appendix A.1).
2.7.2 HPLC- Quadrupole Time of Flight Mass Spectrometry
(HPLC-QTOF)
The accurate mass of the oxidized products obtained from glucose were analysed with an
Agilent 6510 Q-TOF LC/MS system and interpreted using Agilent MassHunter Workstation
Software (Version B.06.00). The column used for the mass spectrometry analysis was a
Varian MetaCarb 67H (300 mm x 6.5 mm) (Agilent, USA) kept at 65°C using a 0.1% w/w
formic acid aqueous solution at a flow rate of 0.8 ml min−1. The Q-TOF was operated in
positive ESI mode (see Appendix:A.2).
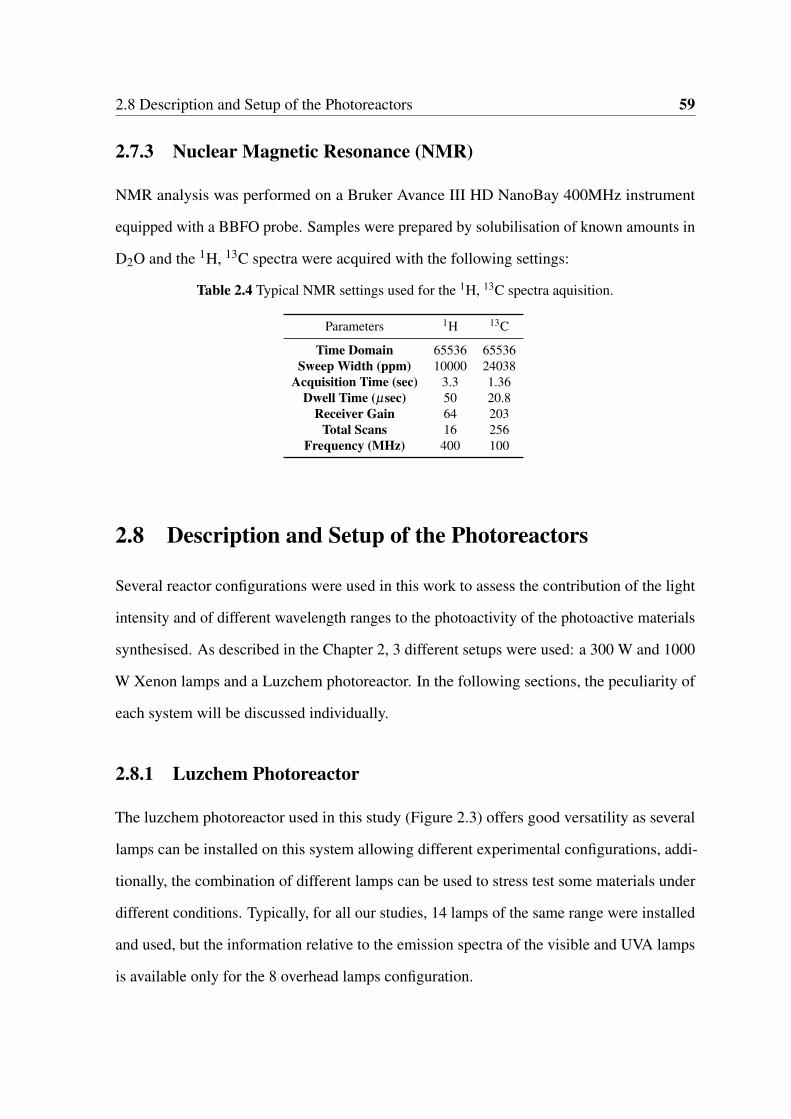
2.8 Description and Setup of the Photoreactors 59
2.7.3 Nuclear Magnetic Resonance (NMR)
NMR analysis was performed on a Bruker Avance III HD NanoBay 400MHz instrument
equipped with a BBFO probe. Samples were prepared by solubilisation of known amounts in
D2O and the 1H, 13C spectra were acquired with the following settings:
Table 2.4 Typical NMR settings used for the 1H, 13C spectra aquisition.
Parameters 1H 13C
Time Domain 65536 65536Sweep Width (ppm) 10000 24038
Acquisition Time (sec) 3.3 1.36Dwell Time (µsec) 50 20.8
Receiver Gain 64 203Total Scans 16 256
Frequency (MHz) 400 100
2.8 Description and Setup of the Photoreactors
Several reactor configurations were used in this work to assess the contribution of the light
intensity and of different wavelength ranges to the photoactivity of the photoactive materials
synthesised. As described in the Chapter 2, 3 different setups were used: a 300 W and 1000
W Xenon lamps and a Luzchem photoreactor. In the following sections, the peculiarity of
each system will be discussed individually.
2.8.1 Luzchem Photoreactor
The luzchem photoreactor used in this study (Figure 2.3) offers good versatility as several
lamps can be installed on this system allowing different experimental configurations, addi-
tionally, the combination of different lamps can be used to stress test some materials under
different conditions. Typically, for all our studies, 14 lamps of the same range were installed
and used, but the information relative to the emission spectra of the visible and UVA lamps
is available only for the 8 overhead lamps configuration.
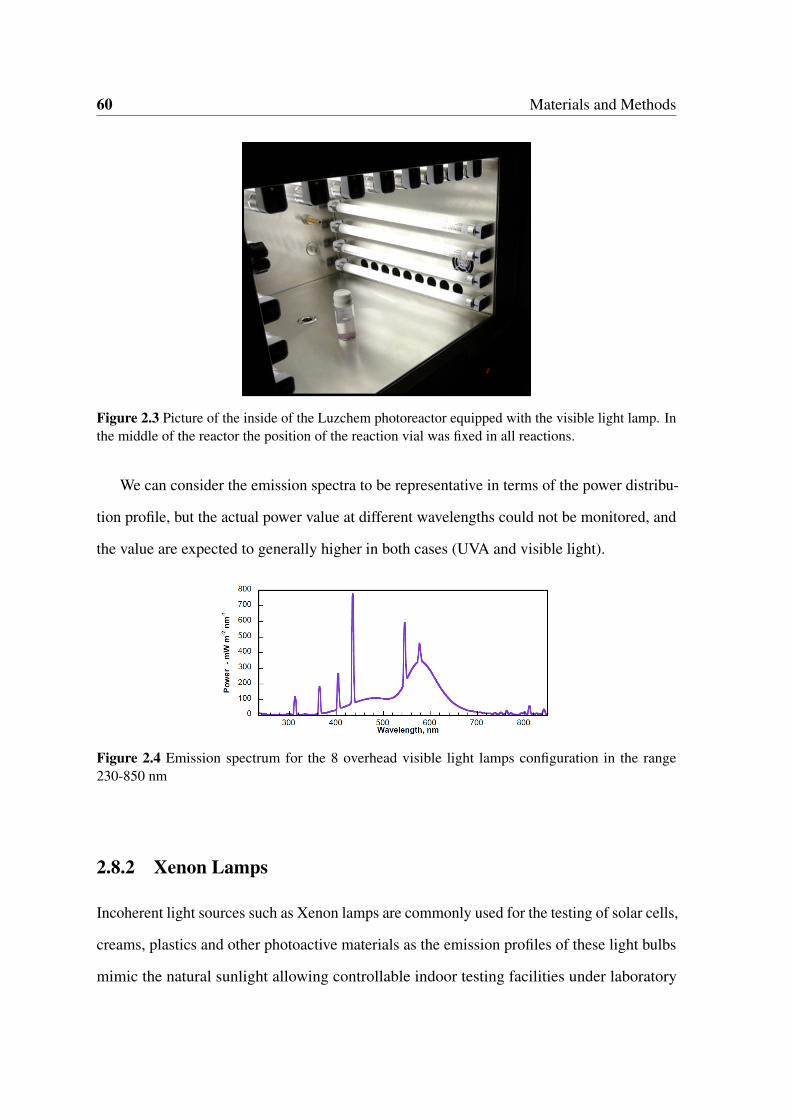
60 Materials and Methods
Figure 2.3 Picture of the inside of the Luzchem photoreactor equipped with the visible light lamp. Inthe middle of the reactor the position of the reaction vial was fixed in all reactions.
We can consider the emission spectra to be representative in terms of the power distribu-
tion profile, but the actual power value at different wavelengths could not be monitored, and
the value are expected to generally higher in both cases (UVA and visible light).
Figure 2.4 Emission spectrum for the 8 overhead visible light lamps configuration in the range230-850 nm
2.8.2 Xenon Lamps
Incoherent light sources such as Xenon lamps are commonly used for the testing of solar cells,
creams, plastics and other photoactive materials as the emission profiles of these light bulbs
mimic the natural sunlight allowing controllable indoor testing facilities under laboratory
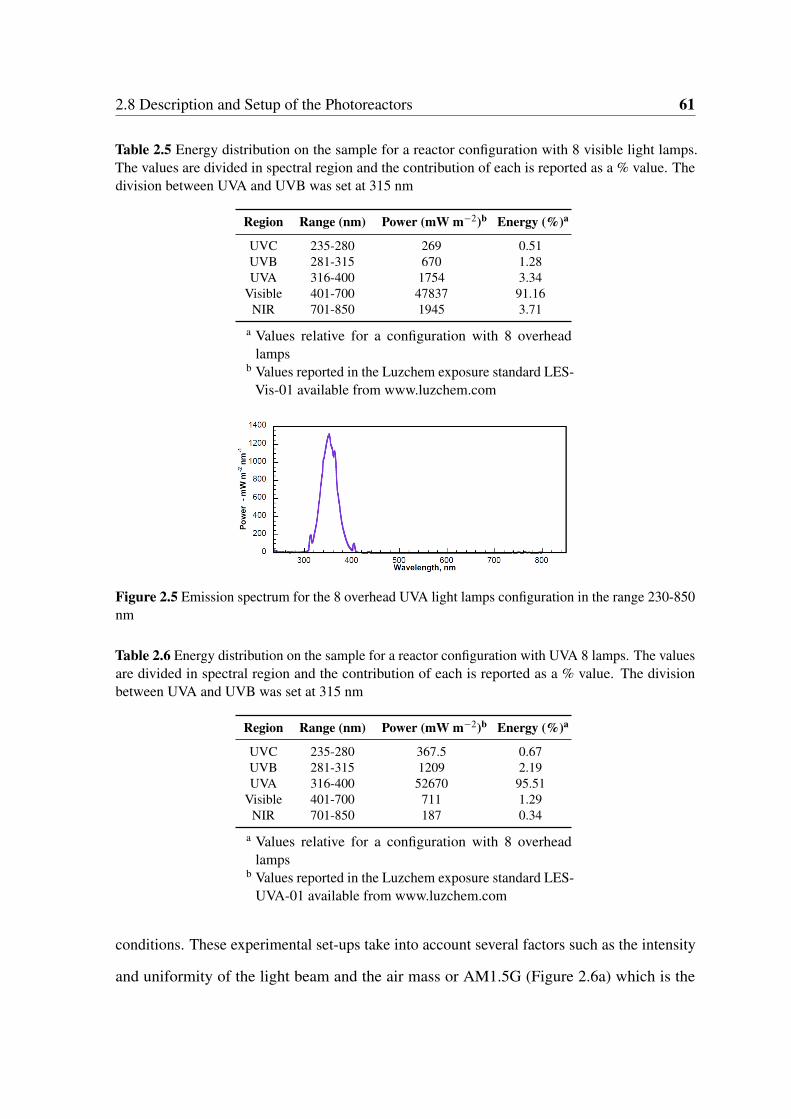
2.8 Description and Setup of the Photoreactors 61
Table 2.5 Energy distribution on the sample for a reactor configuration with 8 visible light lamps.The values are divided in spectral region and the contribution of each is reported as a % value. Thedivision between UVA and UVB was set at 315 nm
Region Range (nm) Power (mW m−2)b Energy (%)a
UVC 235-280 269 0.51UVB 281-315 670 1.28UVA 316-400 1754 3.34
Visible 401-700 47837 91.16NIR 701-850 1945 3.71
a Values relative for a configuration with 8 overheadlamps
b Values reported in the Luzchem exposure standard LES-Vis-01 available from www.luzchem.com
Figure 2.5 Emission spectrum for the 8 overhead UVA light lamps configuration in the range 230-850nm
Table 2.6 Energy distribution on the sample for a reactor configuration with UVA 8 lamps. The valuesare divided in spectral region and the contribution of each is reported as a % value. The divisionbetween UVA and UVB was set at 315 nm
Region Range (nm) Power (mW m−2)b Energy (%)a
UVC 235-280 367.5 0.67UVB 281-315 1209 2.19UVA 316-400 52670 95.51
Visible 401-700 711 1.29NIR 701-850 187 0.34
a Values relative for a configuration with 8 overheadlamps
b Values reported in the Luzchem exposure standard LES-UVA-01 available from www.luzchem.com
conditions. These experimental set-ups take into account several factors such as the intensity
and uniformity of the light beam and the air mass or AM1.5G (Figure 2.6a) which is the
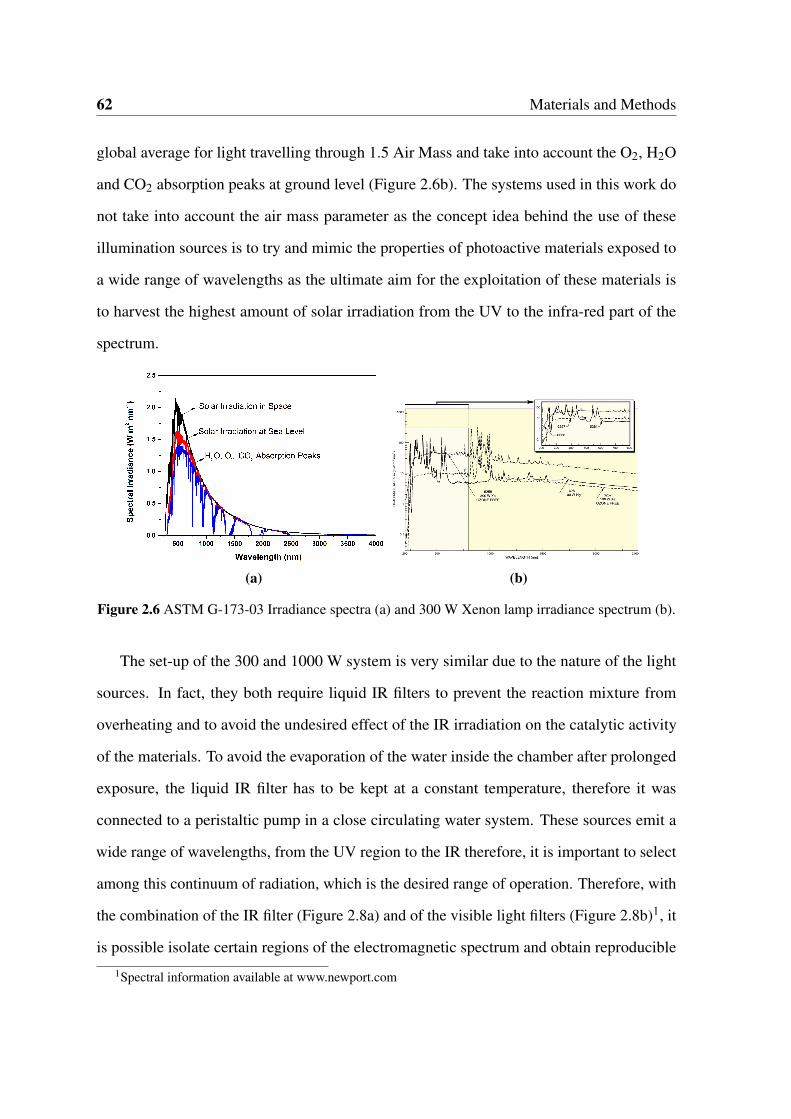
62 Materials and Methods
global average for light travelling through 1.5 Air Mass and take into account the O2, H2O
and CO2 absorption peaks at ground level (Figure 2.6b). The systems used in this work do
not take into account the air mass parameter as the concept idea behind the use of these
illumination sources is to try and mimic the properties of photoactive materials exposed to
a wide range of wavelengths as the ultimate aim for the exploitation of these materials is
to harvest the highest amount of solar irradiation from the UV to the infra-red part of the
spectrum.
(a) (b)
Figure 2.6 ASTM G-173-03 Irradiance spectra (a) and 300 W Xenon lamp irradiance spectrum (b).
The set-up of the 300 and 1000 W system is very similar due to the nature of the light
sources. In fact, they both require liquid IR filters to prevent the reaction mixture from
overheating and to avoid the undesired effect of the IR irradiation on the catalytic activity
of the materials. To avoid the evaporation of the water inside the chamber after prolonged
exposure, the liquid IR filter has to be kept at a constant temperature, therefore it was
connected to a peristaltic pump in a close circulating water system. These sources emit a
wide range of wavelengths, from the UV region to the IR therefore, it is important to select
among this continuum of radiation, which is the desired range of operation. Therefore, with
the combination of the IR filter (Figure 2.8a) and of the visible light filters (Figure 2.8b)1, it
is possible isolate certain regions of the electromagnetic spectrum and obtain reproducible
1Spectral information available at www.newport.com
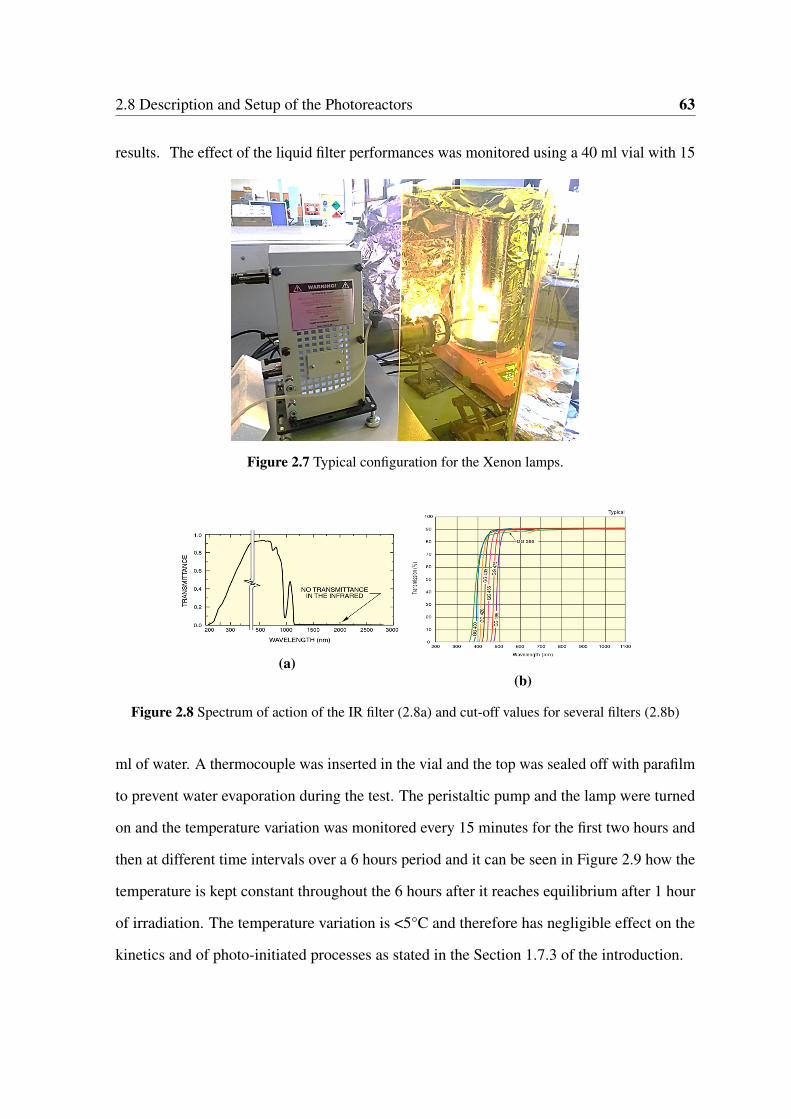
2.8 Description and Setup of the Photoreactors 63
results. The effect of the liquid filter performances was monitored using a 40 ml vial with 15
Figure 2.7 Typical configuration for the Xenon lamps.
(a)(b)
Figure 2.8 Spectrum of action of the IR filter (2.8a) and cut-off values for several filters (2.8b)
ml of water. A thermocouple was inserted in the vial and the top was sealed off with parafilm
to prevent water evaporation during the test. The peristaltic pump and the lamp were turned
on and the temperature variation was monitored every 15 minutes for the first two hours and
then at different time intervals over a 6 hours period and it can be seen in Figure 2.9 how the
temperature is kept constant throughout the 6 hours after it reaches equilibrium after 1 hour
of irradiation. The temperature variation is <5°C and therefore has negligible effect on the
kinetics and of photo-initiated processes as stated in the Section 1.7.3 of the introduction.

64 Materials and Methods
Figure 2.9 Temperature variation over 6 hours of irradiation under visible light for the 300 W Xenonlamp equipped with the IR liquid filter and the visible light filter with λ=420 nm.
2.9 Evaluation of the Catalyst Activity
Typically, the catalyst testing was performed in 16 ml borosilicate glass vials which are
transparent to the wavelength range used and do not interfere with the light sources. Glucose
solutions at different concentration were prepared solubilising the substrate in a 50/50 v/v
MeCN/H2O solution. Once the solution was transferred, the vial was sealed with a rubber
septum to prevent the evaporation of the sample. It has to be noted that for these sets of
experiments, no particular procedure was used to purge the reaction mixture of solubilised
oxygen. Subsequently an appropriate amount of catalyst (14 mg) was added to the solution.
The reactions were performed at different reaction times and samples were taken every 30
minutes in the first 2 hours and at the end of the reaction. The photocatalytic reactions were
performed using three different systems: a Luzchem Photoreactor (Mod. LZC-4, Luzchem
Research Inc. ON, CAN) equipped with 14x8 W UVA lamps for a total power of 112 W. The
temperature was kept constant at 30°C for all the reactions run in the Luzchem Photoreactor.
The second system was a 300 W Xenon Oriel Lamp (Mod. 6258, Newport, UK) controlled
by a power supply (Mod.69911, Newport, UK). The third lamp used was a 1000 W Xenon
Oriel Arc Lamp (Mod.6271, Newport, UK) controlled by digital power supply (Mod.69920,
2.9 Evaluation of the Catalyst Activity 65
Newport, UK). Both lamps were equipped with UV filters with a cut-off value of 420 nm
(Mod.FSQ-GG420, Newport, UK. Additionally, due to the intense irradiation energy of the
lamps, liquid IR filters were installed (Mod.61945 and Mod.6123NS for the 300 W and 1000
W respectively) to prevent the reaction mixture from overheating and the temperature of the
reaction mixture was kept at 25±3°C. The vials were kept under magnetic stirring at 1300
rpm and at a constant distance (0.014 m) from the light source for all experiments.
2.9.1 Catalyst Recycling
The recycling of the Ag catalyst under visible and UV radiation was performed following a
pyramidal scheme: for the first run 3 reactions were run for two hours under the same experi-
mental conditions. The first three reactions were run using 14 mg of catalyst respectively, the
catalyst recovered was then centrifuged and the supernatant was removed. The catalysts were
then washed with H2O and ethanol 3 times to remove any organics adsorbed on the catalyst.
The washed powders were then dried overnight at 50°C and then ground. The recovered
catalyst was then used in the second run for 2 reactions and, after the reaction, it was treated
following the procedure described above. Finally, for the third run, only one reaction was
analysed. The values provided for the conversions and the products selectivity for the first
and the second run are the average of the results obtained for each of the reactions.
66 Materials and Methods
2.9.2 Conversion
Glucose conversion values were calculated as follows:
Conversion (%) =[A]in − [A]out
[A]in(2.2)
The cellobiose conversion value was calculated as follows:
Conversion (%) =[B]in − [C]out
[B]in(2.3)
In which B is the concentration of the initial cellobiose and C is the concentration of the
cellobionic acid being produced during the reaction. As the two molecules coelute as because
of the close k factor values due to the close proximity of the retention times of cellobionic
acid (tR=6.89 min) and cellobiose (tR=7.01 min) (Appendix A.1) the area of the cellobionic
acid was determined by analysing the peak obtained on the DAD detector thus calculating
the corresponding concentration with the calibration curve available. The corresponding
concentration value was then imput in the calibration curve obtained with the RID detector to
calculate the equivalent area of the peak and this value was then subtracted to the cellobiose
RID peak value to obtain the net cellobiose concentration for each sample.
2.9.3 Product Distribution Values
The product distribution values were calculated as follows and as an example gluconic acid
(%) is reported below:
Gluconic Acid (%) =[Gluconic Acid]out
[Gluconic Acid]out +[A]out +[E + G]out +[F ]out(2.4)
In which A is arabinose, E+G are erythrose and glyceraldehyde and F is formic acid. It
has to be noted that erythrose (tR=10.87 min) and glyceraldehyde (tR=10.72 min) coelute
2.9 Evaluation of the Catalyst Activity 67
under the analysis conditions used, and by analysing the RID response factor (Appendix A.1)
for glyceraldeyde (m = 12320) and erythrose (m =12771) the average of these two values
was used to report the overall concentration of these two molecules together. The product
distribution values for the cellobiose reactions were calculated using Equation: 2.4. As
regards the determination of the C11H20O11 product from the oxidation of cellobiose, due
to the absence of commercially available standards and the impossibility of isolating and
fully characterize the molecular structure, the calibration curve for cellobiose was used to
determine the concentration of this molecule.
2.9.4 Catalyst Specific Activity
The catalytic activity was evaluated by dividing the moles of substrate (A) converted over the
grams of catalyst used in the reaction multiplied by the reaction time in hours:
Speci f ic Activity =A converted (mmol)
grams catalyst ∗ hour(2.5)

Chapter 3Optimization of the Reaction Parameters
THE BAND!
J. Blues
3.1 Introduction
Many photocatalytic processes are associated with unselective reactions aimed at the abate-
ment of organic pollutants and other contaminants in the purification of water and gas streams
[227, 4, 120]. In these applications, TiO2-based materials show great potential as they are
generally chemically stable, nontoxic and have high reactivity. Nonetheless, the mechanistic
aspects behind these photo-initiated reactions are still unclear as the role of the species
present on the surface of these materials can dramatically influence their reactivity. The
identification of the factors that govern the kinetics and resolving each individual reaction
step is a key aspect in the development of highly efficient photocatalytic systems. Typically
the reference material used to benchmark the catalytic properties of various systems is the
Evonik Degussa P25 which is a mixture of anatase and rutile in a ratio 3:1 often with small
traces of brookite. The presence of multiple phases and structural defects in P25 make it
difficult to characterize the adsorption-desorption properties of each phase and their role in
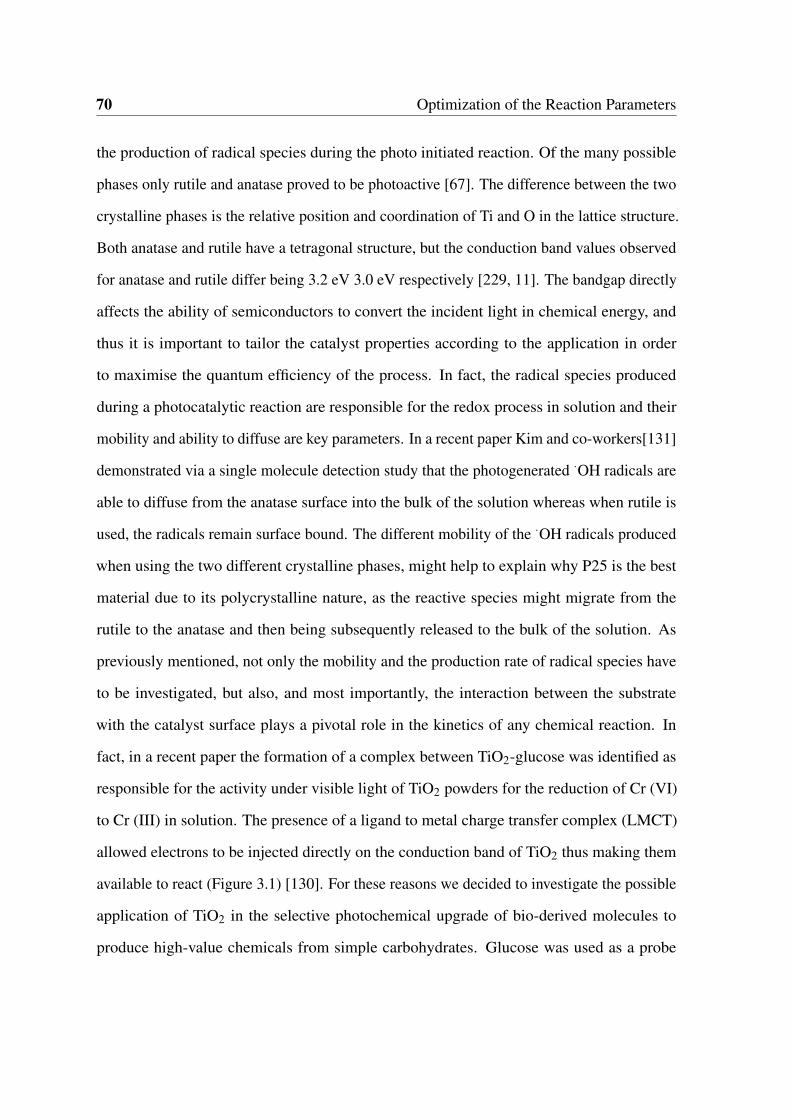
70 Optimization of the Reaction Parameters
the production of radical species during the photo initiated reaction. Of the many possible
phases only rutile and anatase proved to be photoactive [67]. The difference between the two
crystalline phases is the relative position and coordination of Ti and O in the lattice structure.
Both anatase and rutile have a tetragonal structure, but the conduction band values observed
for anatase and rutile differ being 3.2 eV 3.0 eV respectively [229, 11]. The bandgap directly
affects the ability of semiconductors to convert the incident light in chemical energy, and
thus it is important to tailor the catalyst properties according to the application in order
to maximise the quantum efficiency of the process. In fact, the radical species produced
during a photocatalytic reaction are responsible for the redox process in solution and their
mobility and ability to diffuse are key parameters. In a recent paper Kim and co-workers[131]
demonstrated via a single molecule detection study that the photogenerated ·OH radicals are
able to diffuse from the anatase surface into the bulk of the solution whereas when rutile is
used, the radicals remain surface bound. The different mobility of the ·OH radicals produced
when using the two different crystalline phases, might help to explain why P25 is the best
material due to its polycrystalline nature, as the reactive species might migrate from the
rutile to the anatase and then being subsequently released to the bulk of the solution. As
previously mentioned, not only the mobility and the production rate of radical species have
to be investigated, but also, and most importantly, the interaction between the substrate
with the catalyst surface plays a pivotal role in the kinetics of any chemical reaction. In
fact, in a recent paper the formation of a complex between TiO2-glucose was identified as
responsible for the activity under visible light of TiO2 powders for the reduction of Cr (VI)
to Cr (III) in solution. The presence of a ligand to metal charge transfer complex (LMCT)
allowed electrons to be injected directly on the conduction band of TiO2 thus making them
available to react (Figure 3.1) [130]. For these reasons we decided to investigate the possible
application of TiO2 in the selective photochemical upgrade of bio-derived molecules to
produce high-value chemicals from simple carbohydrates. Glucose was used as a probe
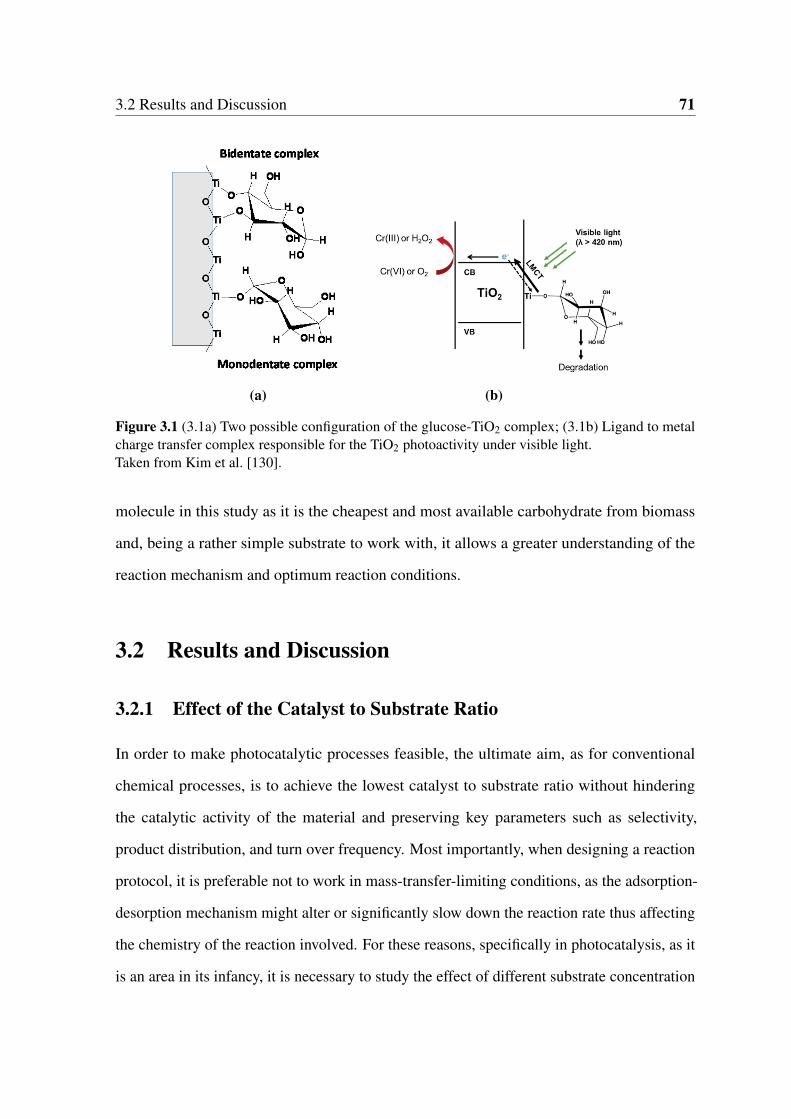
3.2 Results and Discussion 71
(a) (b)
Figure 3.1 (3.1a) Two possible configuration of the glucose-TiO2 complex; (3.1b) Ligand to metalcharge transfer complex responsible for the TiO2 photoactivity under visible light.Taken from Kim et al. [130].
molecule in this study as it is the cheapest and most available carbohydrate from biomass
and, being a rather simple substrate to work with, it allows a greater understanding of the
reaction mechanism and optimum reaction conditions.
3.2 Results and Discussion
3.2.1 Effect of the Catalyst to Substrate Ratio
In order to make photocatalytic processes feasible, the ultimate aim, as for conventional
chemical processes, is to achieve the lowest catalyst to substrate ratio without hindering
the catalytic activity of the material and preserving key parameters such as selectivity,
product distribution, and turn over frequency. Most importantly, when designing a reaction
protocol, it is preferable not to work in mass-transfer-limiting conditions, as the adsorption-
desorption mechanism might alter or significantly slow down the reaction rate thus affecting
the chemistry of the reaction involved. For these reasons, specifically in photocatalysis, as it
is an area in its infancy, it is necessary to study the effect of different substrate concentration
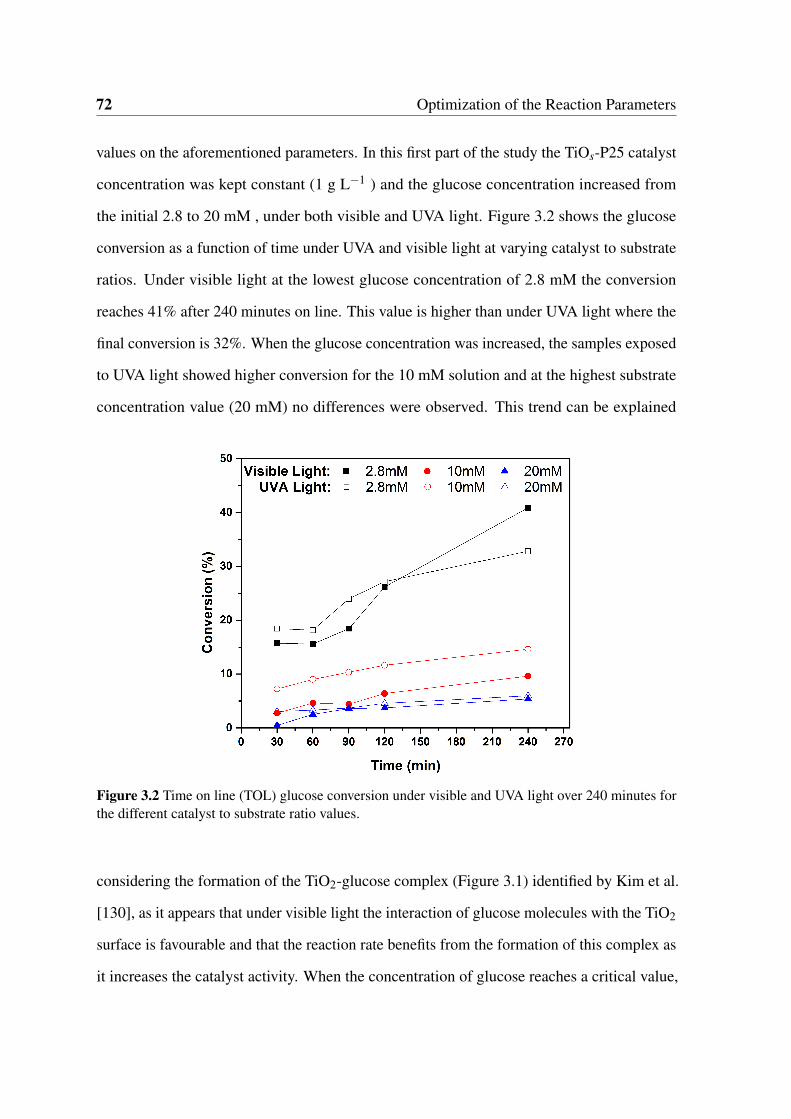
72 Optimization of the Reaction Parameters
values on the aforementioned parameters. In this first part of the study the TiOs-P25 catalyst
concentration was kept constant (1 g L−1 ) and the glucose concentration increased from
the initial 2.8 to 20 mM , under both visible and UVA light. Figure 3.2 shows the glucose
conversion as a function of time under UVA and visible light at varying catalyst to substrate
ratios. Under visible light at the lowest glucose concentration of 2.8 mM the conversion
reaches 41% after 240 minutes on line. This value is higher than under UVA light where the
final conversion is 32%. When the glucose concentration was increased, the samples exposed
to UVA light showed higher conversion for the 10 mM solution and at the highest substrate
concentration value (20 mM) no differences were observed. This trend can be explained
Figure 3.2 Time on line (TOL) glucose conversion under visible and UVA light over 240 minutes forthe different catalyst to substrate ratio values.
considering the formation of the TiO2-glucose complex (Figure 3.1) identified by Kim et al.
[130], as it appears that under visible light the interaction of glucose molecules with the TiO2
surface is favourable and that the reaction rate benefits from the formation of this complex as
it increases the catalyst activity. When the concentration of glucose reaches a critical value,
3.2 Results and Discussion 73
it is safe to assume that the active sites to which glucose can bind to are already occupied
and, therefore, there is no significant increase in the reaction rate.
Kisch [132] reported that the evaluation of the quantum yield efficiency of photocatalysts
and the comparison of the reaction rates in heterogenous photocatalysis is a complex problem
to solve. In fact, the rate of any photoreaction is controlled by the product of the quantum
yield and the absorbed light intensity, with the latter, depending on the concentration of
the light-absorbing species. It was found that photochemical reactions rates are determined
Figure 3.3 Heterogeneous photocatalysis reaction rate dependence on catalyst concentration. Adaptedfrom Kisch [132].
by the catalyst concentration; in fact, initially, the reaction rate increases linearly with the
photocatalyst concentration due to increment of the photon absorption (Figure 3.3 A to B)
and then it reaches a plateau value corresponding to the saturation of the light absorption
and not to diffusion limitations (B to C). Additionally, it was reported that the optimum
concentration for TiO2-catalysed reactions to be in the range of 0.5 to 3.0 g ml−1 depending
on the configuration of the light sources used.
The catalyst concentration used in this work was optimised at the maximum stirring speed
used (1300 rpm). In fact, at this stirring speed, the catalyst could be suspended completely,
and it was observed that at values grater than 1 mg ml−1 the catalyst could not be entirely
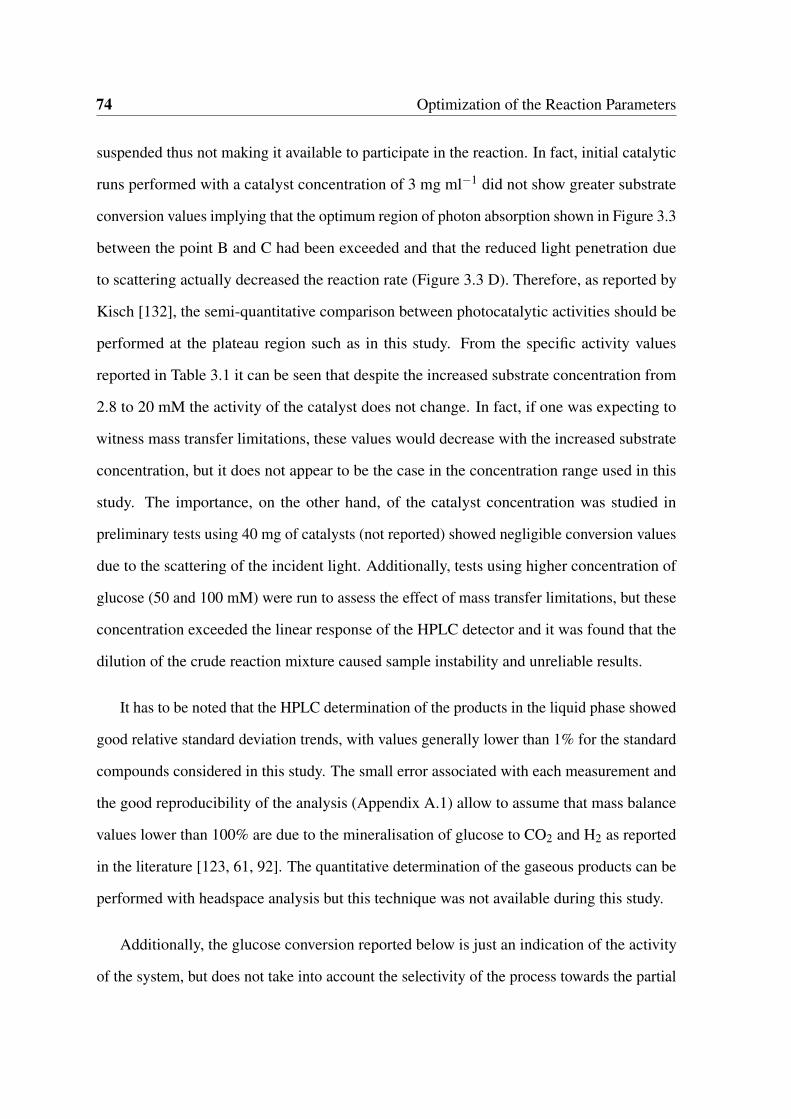
74 Optimization of the Reaction Parameters
suspended thus not making it available to participate in the reaction. In fact, initial catalytic
runs performed with a catalyst concentration of 3 mg ml−1 did not show greater substrate
conversion values implying that the optimum region of photon absorption shown in Figure 3.3
between the point B and C had been exceeded and that the reduced light penetration due
to scattering actually decreased the reaction rate (Figure 3.3 D). Therefore, as reported by
Kisch [132], the semi-quantitative comparison between photocatalytic activities should be
performed at the plateau region such as in this study. From the specific activity values
reported in Table 3.1 it can be seen that despite the increased substrate concentration from
2.8 to 20 mM the activity of the catalyst does not change. In fact, if one was expecting to
witness mass transfer limitations, these values would decrease with the increased substrate
concentration, but it does not appear to be the case in the concentration range used in this
study. The importance, on the other hand, of the catalyst concentration was studied in
preliminary tests using 40 mg of catalysts (not reported) showed negligible conversion values
due to the scattering of the incident light. Additionally, tests using higher concentration of
glucose (50 and 100 mM) were run to assess the effect of mass transfer limitations, but these
concentration exceeded the linear response of the HPLC detector and it was found that the
dilution of the crude reaction mixture caused sample instability and unreliable results.
It has to be noted that the HPLC determination of the products in the liquid phase showed
good relative standard deviation trends, with values generally lower than 1% for the standard
compounds considered in this study. The small error associated with each measurement and
the good reproducibility of the analysis (Appendix A.1) allow to assume that mass balance
values lower than 100% are due to the mineralisation of glucose to CO2 and H2 as reported
in the literature [123, 61, 92]. The quantitative determination of the gaseous products can be
performed with headspace analysis but this technique was not available during this study.
Additionally, the glucose conversion reported below is just an indication of the activity
of the system, but does not take into account the selectivity of the process towards the partial
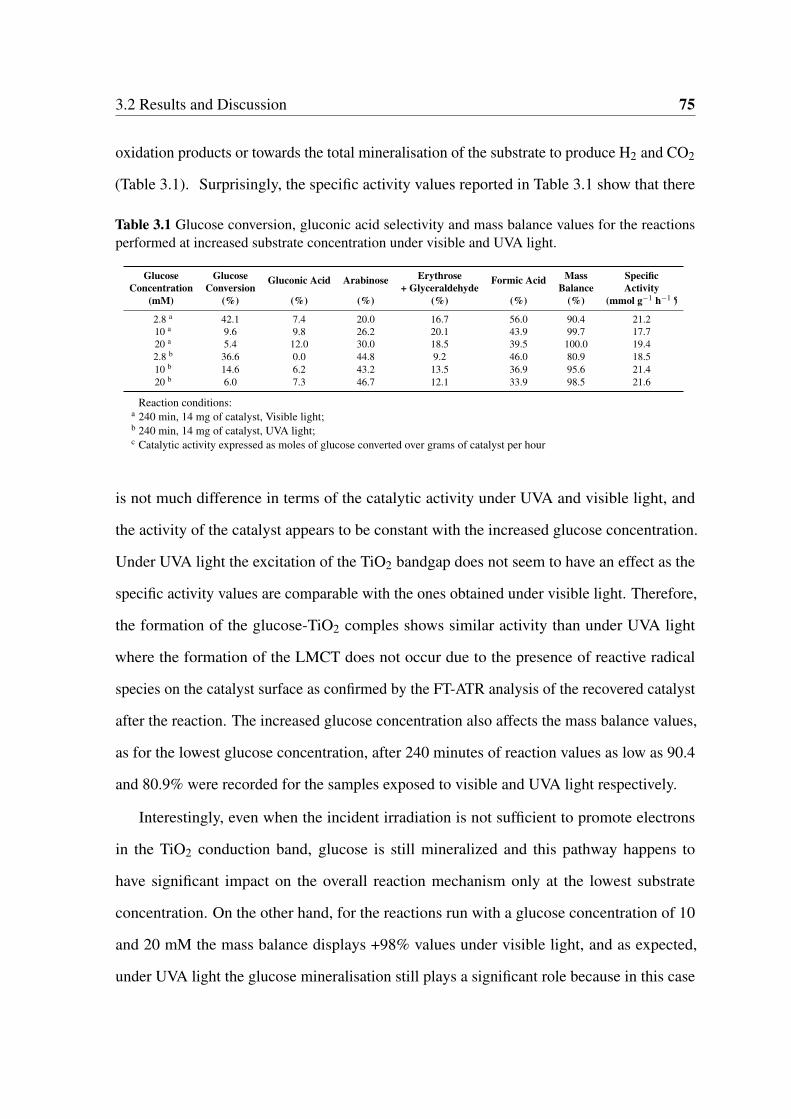
3.2 Results and Discussion 75
oxidation products or towards the total mineralisation of the substrate to produce H2 and CO2
(Table 3.1). Surprisingly, the specific activity values reported in Table 3.1 show that there
Table 3.1 Glucose conversion, gluconic acid selectivity and mass balance values for the reactionsperformed at increased substrate concentration under visible and UVA light.
Glucose Glucose Gluconic Acid Arabinose Erythrose Formic Acid Mass SpecificConcentration Conversion + Glyceraldehyde Balance Activity
(mM) (%) (%) (%) (%) (%) (%) (mmol g−1 h−1 c)
2.8 a 42.1 7.4 20.0 16.7 56.0 90.4 21.210 a 9.6 9.8 26.2 20.1 43.9 99.7 17.720 a 5.4 12.0 30.0 18.5 39.5 100.0 19.42.8 b 36.6 0.0 44.8 9.2 46.0 80.9 18.510 b 14.6 6.2 43.2 13.5 36.9 95.6 21.420 b 6.0 7.3 46.7 12.1 33.9 98.5 21.6
Reaction conditions:a 240 min, 14 mg of catalyst, Visible light;b 240 min, 14 mg of catalyst, UVA light;c Catalytic activity expressed as moles of glucose converted over grams of catalyst per hour
is not much difference in terms of the catalytic activity under UVA and visible light, and
the activity of the catalyst appears to be constant with the increased glucose concentration.
Under UVA light the excitation of the TiO2 bandgap does not seem to have an effect as the
specific activity values are comparable with the ones obtained under visible light. Therefore,
the formation of the glucose-TiO2 comples shows similar activity than under UVA light
where the formation of the LMCT does not occur due to the presence of reactive radical
species on the catalyst surface as confirmed by the FT-ATR analysis of the recovered catalyst
after the reaction. The increased glucose concentration also affects the mass balance values,
as for the lowest glucose concentration, after 240 minutes of reaction values as low as 90.4
and 80.9% were recorded for the samples exposed to visible and UVA light respectively.
Interestingly, even when the incident irradiation is not sufficient to promote electrons
in the TiO2 conduction band, glucose is still mineralized and this pathway happens to
have significant impact on the overall reaction mechanism only at the lowest substrate
concentration. On the other hand, for the reactions run with a glucose concentration of 10
and 20 mM the mass balance displays +98% values under visible light, and as expected,
under UVA light the glucose mineralisation still plays a significant role because in this case
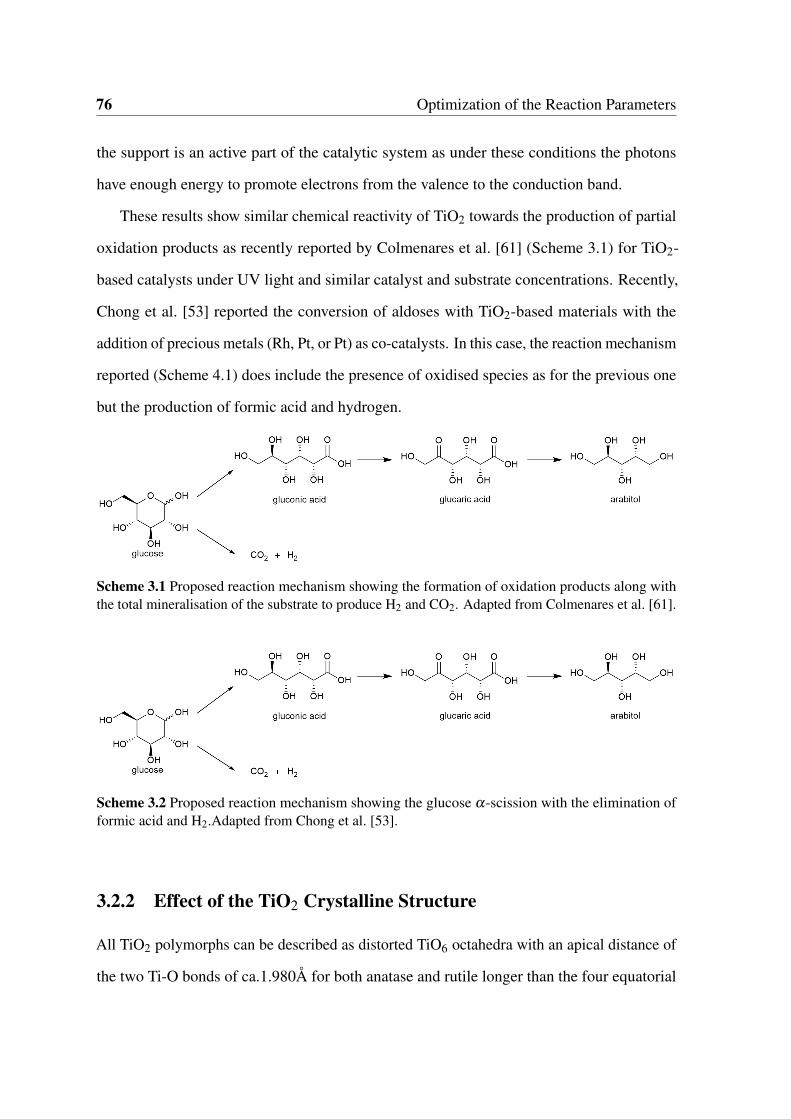
76 Optimization of the Reaction Parameters
the support is an active part of the catalytic system as under these conditions the photons
have enough energy to promote electrons from the valence to the conduction band.
These results show similar chemical reactivity of TiO2 towards the production of partial
oxidation products as recently reported by Colmenares et al. [61] (Scheme 3.1) for TiO2-
based catalysts under UV light and similar catalyst and substrate concentrations. Recently,
Chong et al. [53] reported the conversion of aldoses with TiO2-based materials with the
addition of precious metals (Rh, Pt, or Pt) as co-catalysts. In this case, the reaction mechanism
reported (Scheme 4.1) does include the presence of oxidised species as for the previous one
but the production of formic acid and hydrogen.
Scheme 3.1 Proposed reaction mechanism showing the formation of oxidation products along withthe total mineralisation of the substrate to produce H2 and CO2. Adapted from Colmenares et al. [61].
Scheme 3.2 Proposed reaction mechanism showing the glucose α-scission with the elimination offormic acid and H2.Adapted from Chong et al. [53].
3.2.2 Effect of the TiO2 Crystalline Structure
All TiO2 polymorphs can be described as distorted TiO6 octahedra with an apical distance of
the two Ti-O bonds of ca.1.980Å for both anatase and rutile longer than the four equatorial
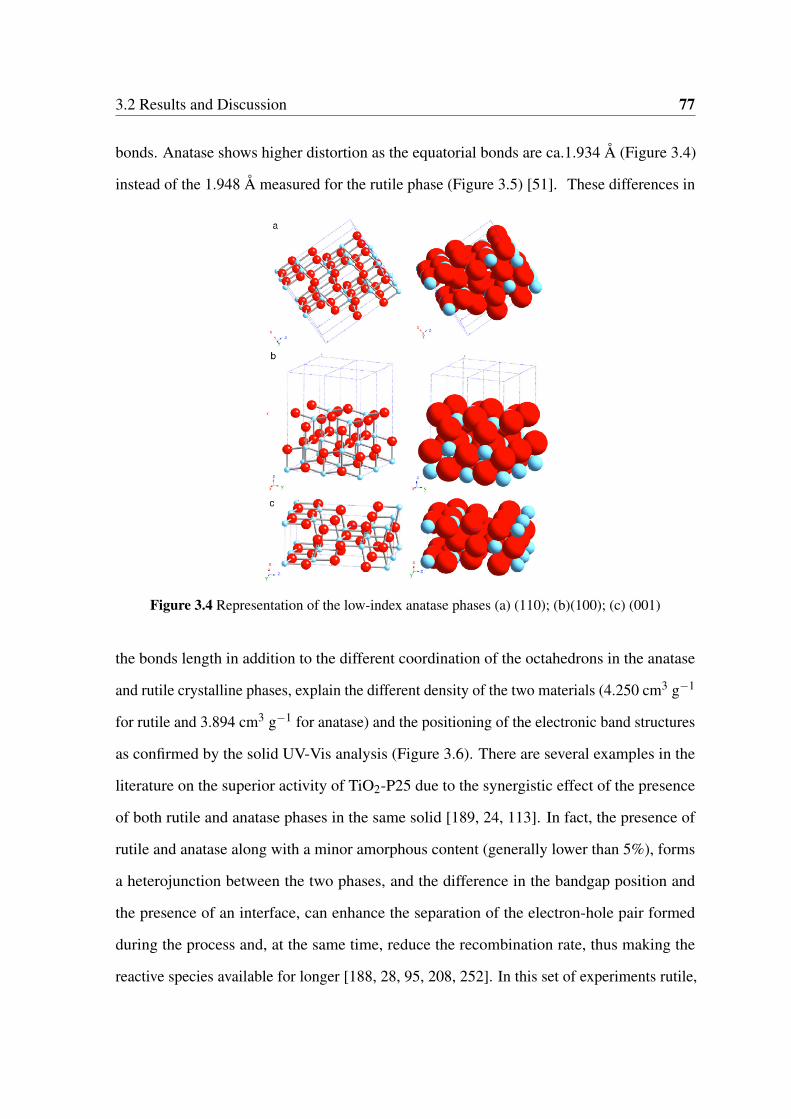
3.2 Results and Discussion 77
bonds. Anatase shows higher distortion as the equatorial bonds are ca.1.934 Å (Figure 3.4)
instead of the 1.948 Å measured for the rutile phase (Figure 3.5) [51]. These differences in
Figure 3.4 Representation of the low-index anatase phases (a) (110); (b)(100); (c) (001)
the bonds length in addition to the different coordination of the octahedrons in the anatase
and rutile crystalline phases, explain the different density of the two materials (4.250 cm3 g−1
for rutile and 3.894 cm3 g−1 for anatase) and the positioning of the electronic band structures
as confirmed by the solid UV-Vis analysis (Figure 3.6). There are several examples in the
literature on the superior activity of TiO2-P25 due to the synergistic effect of the presence
of both rutile and anatase phases in the same solid [189, 24, 113]. In fact, the presence of
rutile and anatase along with a minor amorphous content (generally lower than 5%), forms
a heterojunction between the two phases, and the difference in the bandgap position and
the presence of an interface, can enhance the separation of the electron-hole pair formed
during the process and, at the same time, reduce the recombination rate, thus making the
reactive species available for longer [188, 28, 95, 208, 252]. In this set of experiments rutile,
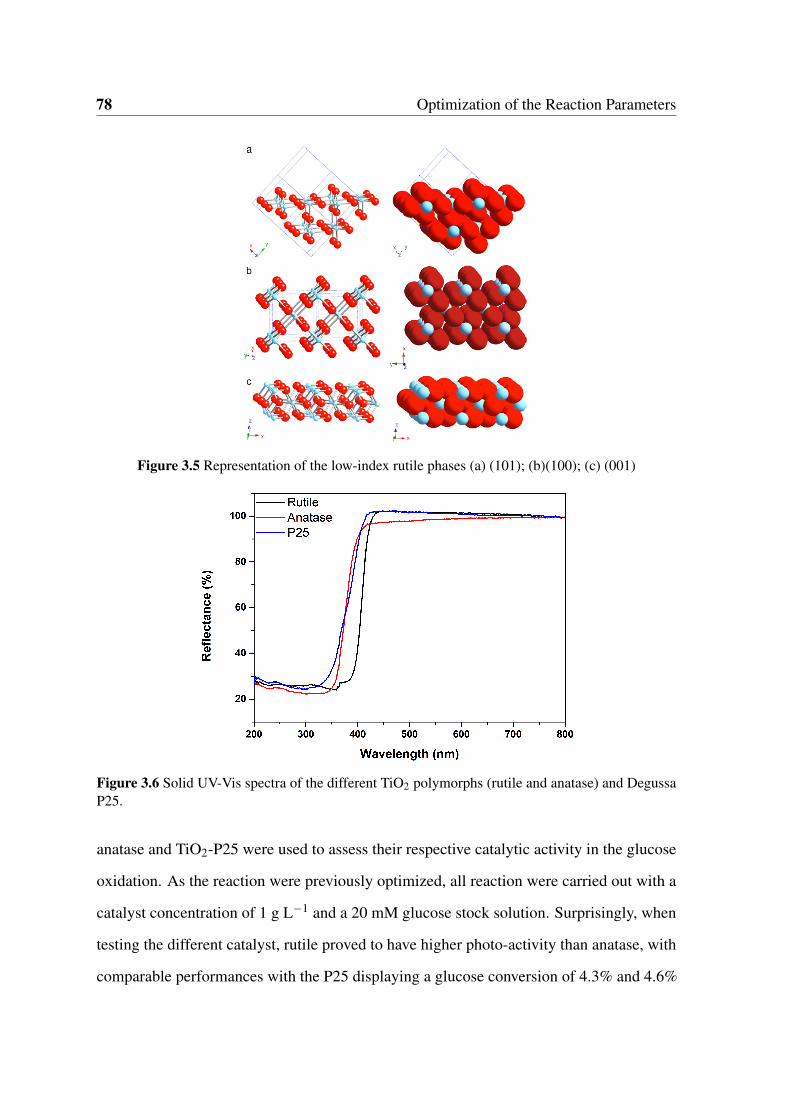
78 Optimization of the Reaction Parameters
Figure 3.5 Representation of the low-index rutile phases (a) (101); (b)(100); (c) (001)
Figure 3.6 Solid UV-Vis spectra of the different TiO2 polymorphs (rutile and anatase) and DegussaP25.
anatase and TiO2-P25 were used to assess their respective catalytic activity in the glucose
oxidation. As the reaction were previously optimized, all reaction were carried out with a
catalyst concentration of 1 g L−1 and a 20 mM glucose stock solution. Surprisingly, when
testing the different catalyst, rutile proved to have higher photo-activity than anatase, with
comparable performances with the P25 displaying a glucose conversion of 4.3% and 4.6%
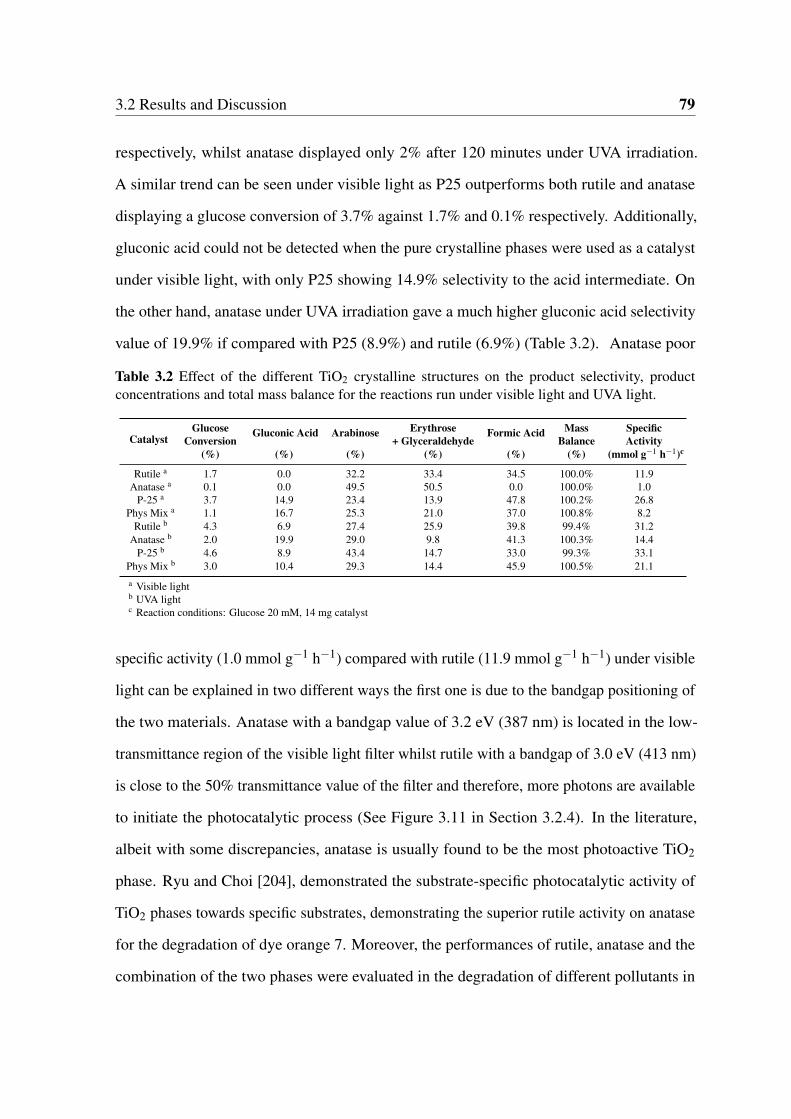
3.2 Results and Discussion 79
respectively, whilst anatase displayed only 2% after 120 minutes under UVA irradiation.
A similar trend can be seen under visible light as P25 outperforms both rutile and anatase
displaying a glucose conversion of 3.7% against 1.7% and 0.1% respectively. Additionally,
gluconic acid could not be detected when the pure crystalline phases were used as a catalyst
under visible light, with only P25 showing 14.9% selectivity to the acid intermediate. On
the other hand, anatase under UVA irradiation gave a much higher gluconic acid selectivity
value of 19.9% if compared with P25 (8.9%) and rutile (6.9%) (Table 3.2). Anatase poor
Table 3.2 Effect of the different TiO2 crystalline structures on the product selectivity, productconcentrations and total mass balance for the reactions run under visible light and UVA light.
CatalystGlucose Gluconic Acid Arabinose Erythrose Formic Acid Mass Specific
Conversion + Glyceraldehyde Balance Activity(%) (%) (%) (%) (%) (%) (mmol g−1 h−1)c
Rutile a 1.7 0.0 32.2 33.4 34.5 100.0% 11.9Anatase a 0.1 0.0 49.5 50.5 0.0 100.0% 1.0
P-25 a 3.7 14.9 23.4 13.9 47.8 100.2% 26.8Phys Mix a 1.1 16.7 25.3 21.0 37.0 100.8% 8.2
Rutile b 4.3 6.9 27.4 25.9 39.8 99.4% 31.2Anatase b 2.0 19.9 29.0 9.8 41.3 100.3% 14.4
P-25 b 4.6 8.9 43.4 14.7 33.0 99.3% 33.1Phys Mix b 3.0 10.4 29.3 14.4 45.9 100.5% 21.1a Visible lightb UVA lightc Reaction conditions: Glucose 20 mM, 14 mg catalyst
specific activity (1.0 mmol g−1 h−1) compared with rutile (11.9 mmol g−1 h−1) under visible
light can be explained in two different ways the first one is due to the bandgap positioning of
the two materials. Anatase with a bandgap value of 3.2 eV (387 nm) is located in the low-
transmittance region of the visible light filter whilst rutile with a bandgap of 3.0 eV (413 nm)
is close to the 50% transmittance value of the filter and therefore, more photons are available
to initiate the photocatalytic process (See Figure 3.11 in Section 3.2.4). In the literature,
albeit with some discrepancies, anatase is usually found to be the most photoactive TiO2
phase. Ryu and Choi [204], demonstrated the substrate-specific photocatalytic activity of
TiO2 phases towards specific substrates, demonstrating the superior rutile activity on anatase
for the degradation of dye orange 7. Moreover, the performances of rutile, anatase and the
combination of the two phases were evaluated in the degradation of different pollutants in
80 Optimization of the Reaction Parameters
aqueous solutions. We can conclude that, for the oxidation of glucose, the specific interaction
substrate-support is favourable for rutile, despite its lower surface area compared with anatase.
From these preliminary results, it is clear that the different TiO2 allotropic structures, not only
have an effect on the glucose conversion but, interestingly, also on the product distribution.
In order to demonstrate the synergistic effect of the two crystalline phases, rutile and anatase
in a proportion 1:3 (to mimic the typical composition of P25) were mixed together and the
mixture was tested under the same experimental conditions. Interestingly, the selectivity
values for the partial oxidation products observed after 120 minutes of visible light irradiation
are similar to the ones observed for the P25 after the same reaction time, but significantly
different from the ones obtained when the pure TiO2 phases were used as no gluconic acid
was detected in both cases. What is surprising in all 3 cases, is that the different crystalline
phases are active, to some extent, at wavelengths greater than 420 nm, which is surprising
as in this range, the incident photons do not have sufficient energy to promote electrons in
the TiO2 conduction band. The formation of a photoactive ligand to metal charge transfer
(LMCT) TiO2-glucose complex has been proven to be effective in the reduction of metal ions
in solution as the organometallic complex is able to inject electrons directly in the conduction
band of the TiO2 thus making them available for further reactions [130]. In fact, all the
catalysts tested in this section, showed the color transition from white to yellow as reported
by Kim et al. [130] in their work, therefore, confirming the formation of the glucose-TiO2
complex. Direct measurements to confirm of the presence of the LMCT complex were
performed on the Ag-decorated TiO2 catalysts described in the following chapter. In fact,
in this case, the presence of such complex is mandatory to extend the TiO2 activity to the
visible part of the spectrum and the results obtained are in good agreement with the previous
findings deported by Kim et al. [130].
The possibility of extending the activity of an inorganic material via the formation of a
metalorganic complex in which the reactant acts as a co-catalyst demonstrates the pivotal

3.2 Results and Discussion 81
role of the adsorption mechanisms and the possible interactions between the photoactive
material and the substrate, not only in photodegradation processess, but more interestingly,
for their application in selective photocatalytic oxidative reactions.
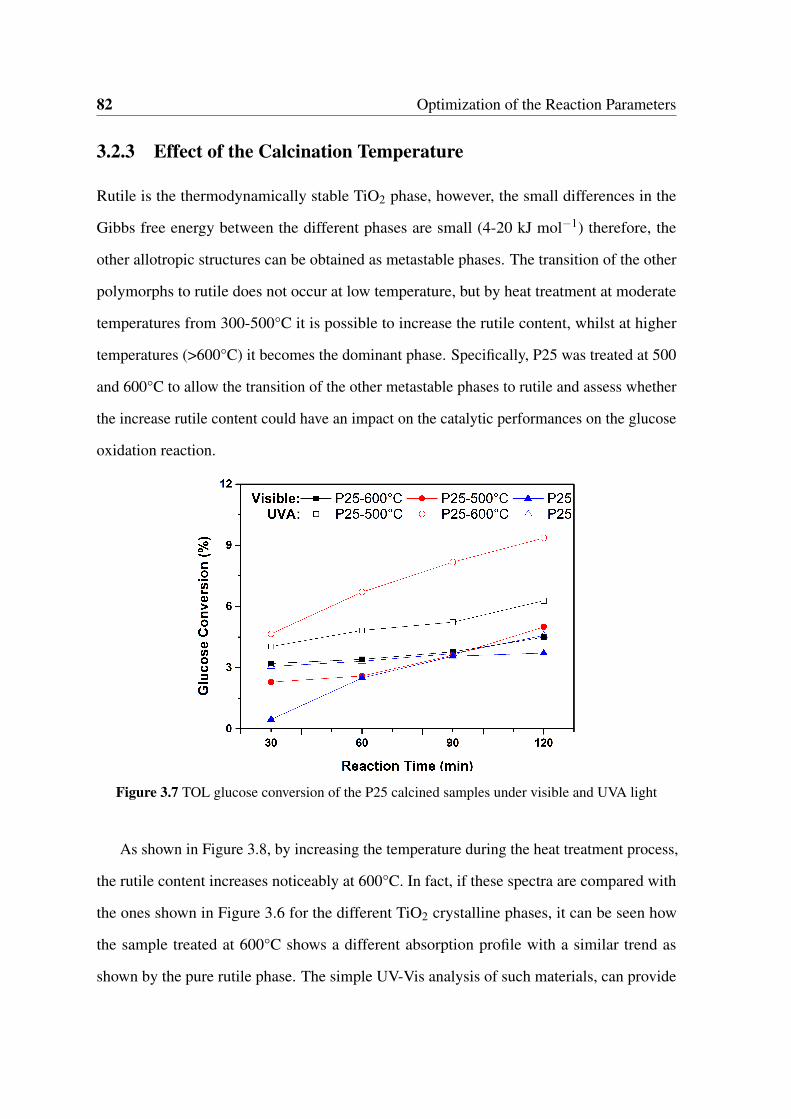
82 Optimization of the Reaction Parameters
3.2.3 Effect of the Calcination Temperature
Rutile is the thermodynamically stable TiO2 phase, however, the small differences in the
Gibbs free energy between the different phases are small (4-20 kJ mol−1) therefore, the
other allotropic structures can be obtained as metastable phases. The transition of the other
polymorphs to rutile does not occur at low temperature, but by heat treatment at moderate
temperatures from 300-500°C it is possible to increase the rutile content, whilst at higher
temperatures (>600°C) it becomes the dominant phase. Specifically, P25 was treated at 500
and 600°C to allow the transition of the other metastable phases to rutile and assess whether
the increase rutile content could have an impact on the catalytic performances on the glucose
oxidation reaction.
Figure 3.7 TOL glucose conversion of the P25 calcined samples under visible and UVA light
As shown in Figure 3.8, by increasing the temperature during the heat treatment process,
the rutile content increases noticeably at 600°C. In fact, if these spectra are compared with
the ones shown in Figure 3.6 for the different TiO2 crystalline phases, it can be seen how
the sample treated at 600°C shows a different absorption profile with a similar trend as
shown by the pure rutile phase. The simple UV-Vis analysis of such materials, can provide
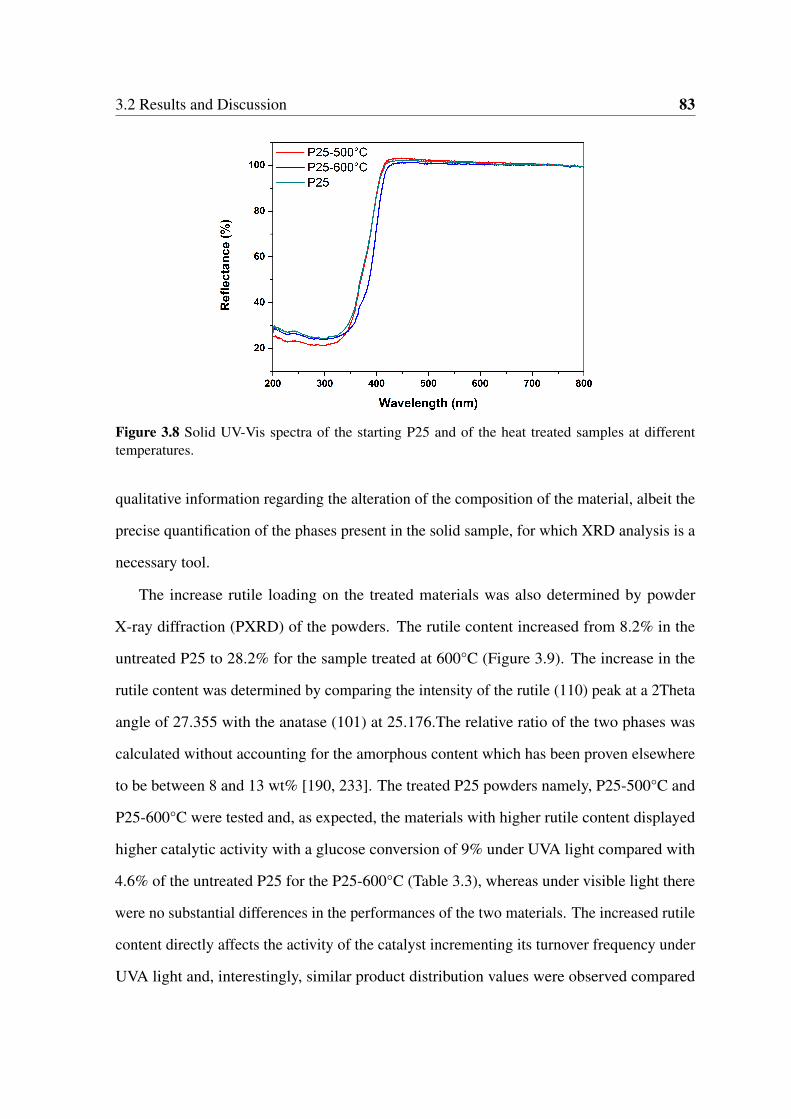
3.2 Results and Discussion 83
Figure 3.8 Solid UV-Vis spectra of the starting P25 and of the heat treated samples at differenttemperatures.
qualitative information regarding the alteration of the composition of the material, albeit the
precise quantification of the phases present in the solid sample, for which XRD analysis is a
necessary tool.
The increase rutile loading on the treated materials was also determined by powder
X-ray diffraction (PXRD) of the powders. The rutile content increased from 8.2% in the
untreated P25 to 28.2% for the sample treated at 600°C (Figure 3.9). The increase in the
rutile content was determined by comparing the intensity of the rutile (110) peak at a 2Theta
angle of 27.355 with the anatase (101) at 25.176.The relative ratio of the two phases was
calculated without accounting for the amorphous content which has been proven elsewhere
to be between 8 and 13 wt% [190, 233]. The treated P25 powders namely, P25-500°C and
P25-600°C were tested and, as expected, the materials with higher rutile content displayed
higher catalytic activity with a glucose conversion of 9% under UVA light compared with
4.6% of the untreated P25 for the P25-600°C (Table 3.3), whereas under visible light there
were no substantial differences in the performances of the two materials. The increased rutile
content directly affects the activity of the catalyst incrementing its turnover frequency under
UVA light and, interestingly, similar product distribution values were observed compared
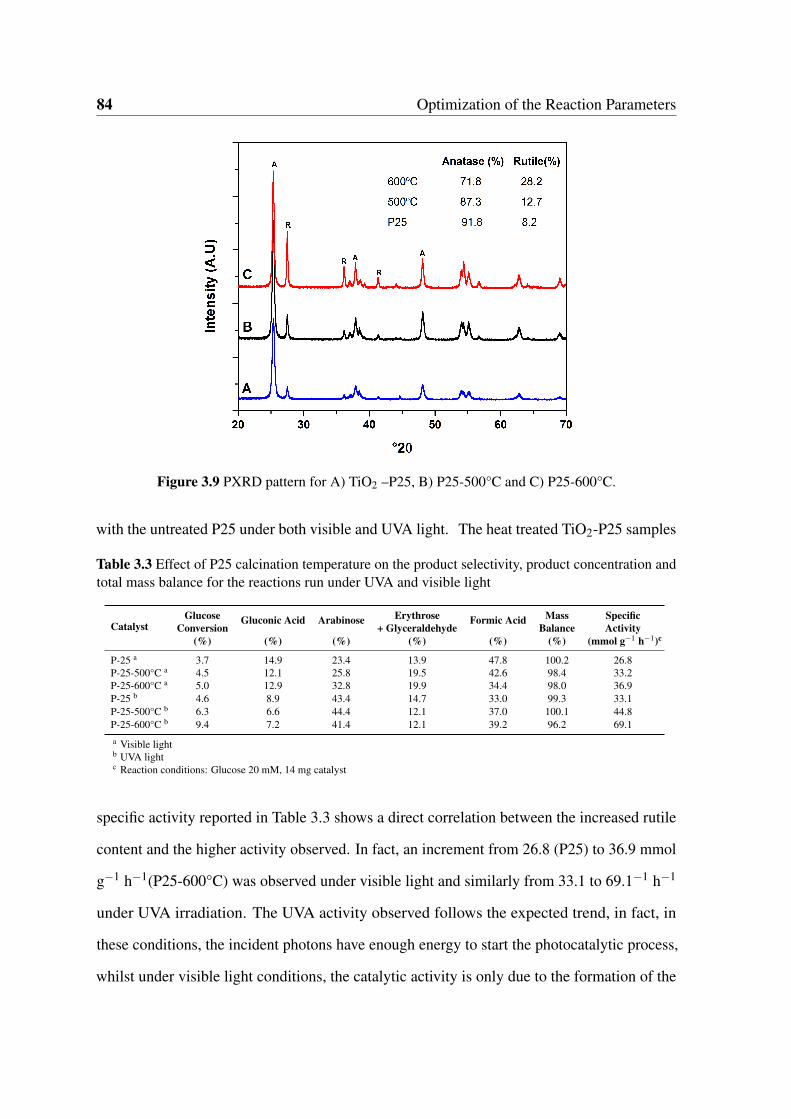
84 Optimization of the Reaction Parameters
Figure 3.9 PXRD pattern for A) TiO2 –P25, B) P25-500°C and C) P25-600°C.
with the untreated P25 under both visible and UVA light. The heat treated TiO2-P25 samples
Table 3.3 Effect of P25 calcination temperature on the product selectivity, product concentration andtotal mass balance for the reactions run under UVA and visible light
CatalystGlucose Gluconic Acid Arabinose Erythrose Formic Acid Mass Specific
Conversion + Glyceraldehyde Balance Activity(%) (%) (%) (%) (%) (%) (mmol g−1 h−1)c
P-25 a 3.7 14.9 23.4 13.9 47.8 100.2 26.8P-25-500°C a 4.5 12.1 25.8 19.5 42.6 98.4 33.2P-25-600°C a 5.0 12.9 32.8 19.9 34.4 98.0 36.9P-25 b 4.6 8.9 43.4 14.7 33.0 99.3 33.1P-25-500°C b 6.3 6.6 44.4 12.1 37.0 100.1 44.8P-25-600°C b 9.4 7.2 41.4 12.1 39.2 96.2 69.1a Visible lightb UVA lightc Reaction conditions: Glucose 20 mM, 14 mg catalyst
specific activity reported in Table 3.3 shows a direct correlation between the increased rutile
content and the higher activity observed. In fact, an increment from 26.8 (P25) to 36.9 mmol
g−1 h−1(P25-600°C) was observed under visible light and similarly from 33.1 to 69.1−1 h−1
under UVA irradiation. The UVA activity observed follows the expected trend, in fact, in
these conditions, the incident photons have enough energy to start the photocatalytic process,
whilst under visible light conditions, the catalytic activity is only due to the formation of the
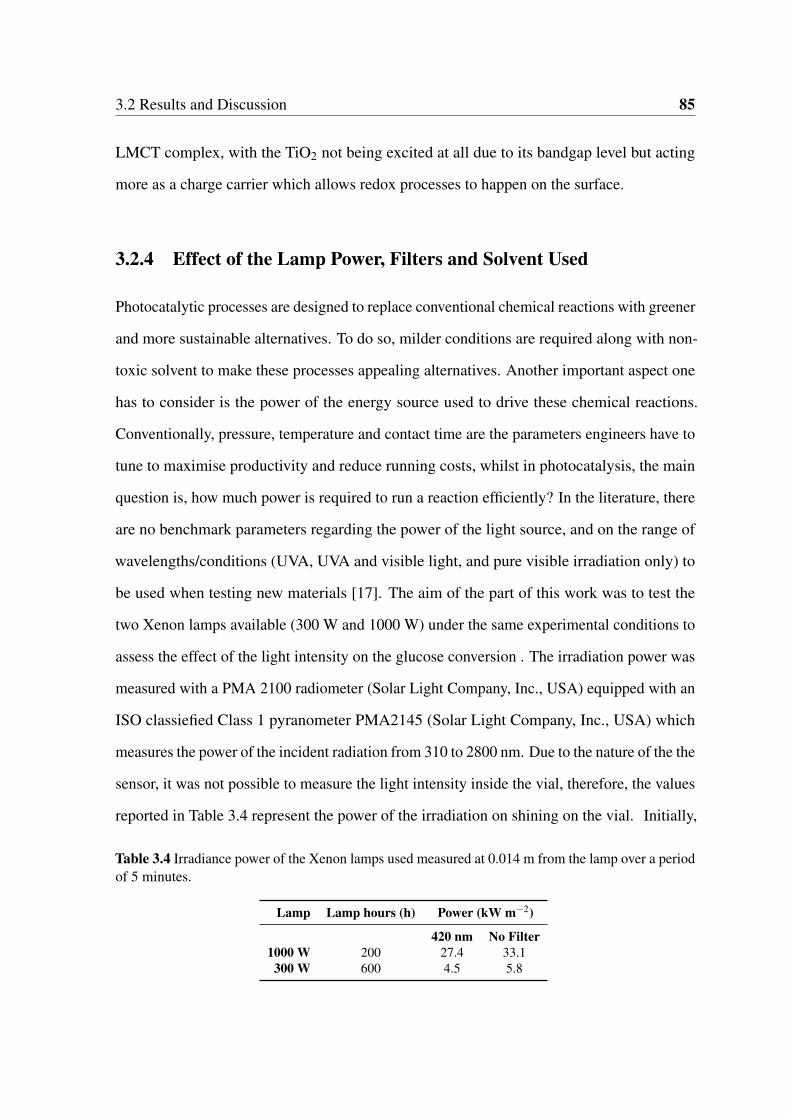
3.2 Results and Discussion 85
LMCT complex, with the TiO2 not being excited at all due to its bandgap level but acting
more as a charge carrier which allows redox processes to happen on the surface.
3.2.4 Effect of the Lamp Power, Filters and Solvent Used
Photocatalytic processes are designed to replace conventional chemical reactions with greener
and more sustainable alternatives. To do so, milder conditions are required along with non-
toxic solvent to make these processes appealing alternatives. Another important aspect one
has to consider is the power of the energy source used to drive these chemical reactions.
Conventionally, pressure, temperature and contact time are the parameters engineers have to
tune to maximise productivity and reduce running costs, whilst in photocatalysis, the main
question is, how much power is required to run a reaction efficiently? In the literature, there
are no benchmark parameters regarding the power of the light source, and on the range of
wavelengths/conditions (UVA, UVA and visible light, and pure visible irradiation only) to
be used when testing new materials [17]. The aim of the part of this work was to test the
two Xenon lamps available (300 W and 1000 W) under the same experimental conditions to
assess the effect of the light intensity on the glucose conversion . The irradiation power was
measured with a PMA 2100 radiometer (Solar Light Company, Inc., USA) equipped with an
ISO classiefied Class 1 pyranometer PMA2145 (Solar Light Company, Inc., USA) which
measures the power of the incident radiation from 310 to 2800 nm. Due to the nature of the the
sensor, it was not possible to measure the light intensity inside the vial, therefore, the values
reported in Table 3.4 represent the power of the irradiation on shining on the vial. Initially,
Table 3.4 Irradiance power of the Xenon lamps used measured at 0.014 m from the lamp over a periodof 5 minutes.
Lamp Lamp hours (h) Power (kW m−2)
420 nm No Filter1000 W 200 27.4 33.1300 W 600 4.5 5.8
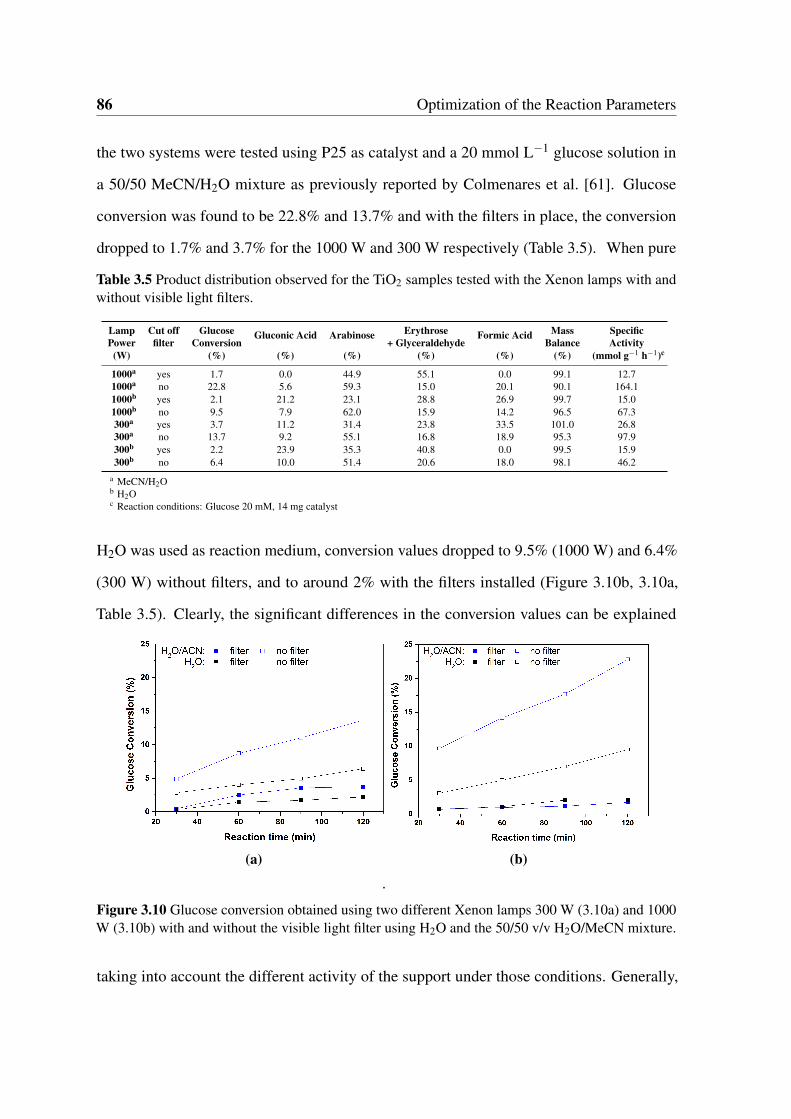
86 Optimization of the Reaction Parameters
the two systems were tested using P25 as catalyst and a 20 mmol L−1 glucose solution in
a 50/50 MeCN/H2O mixture as previously reported by Colmenares et al. [61]. Glucose
conversion was found to be 22.8% and 13.7% and with the filters in place, the conversion
dropped to 1.7% and 3.7% for the 1000 W and 300 W respectively (Table 3.5). When pure
Table 3.5 Product distribution observed for the TiO2 samples tested with the Xenon lamps with andwithout visible light filters.
Lamp Cut off Glucose Gluconic Acid Arabinose Erythrose Formic Acid Mass SpecificPower filter Conversion + Glyceraldehyde Balance Activity
(W) (%) (%) (%) (%) (%) (%) (mmol g−1 h−1)c
1000a yes 1.7 0.0 44.9 55.1 0.0 99.1 12.71000a no 22.8 5.6 59.3 15.0 20.1 90.1 164.11000b yes 2.1 21.2 23.1 28.8 26.9 99.7 15.01000b no 9.5 7.9 62.0 15.9 14.2 96.5 67.3300a yes 3.7 11.2 31.4 23.8 33.5 101.0 26.8300a no 13.7 9.2 55.1 16.8 18.9 95.3 97.9300b yes 2.2 23.9 35.3 40.8 0.0 99.5 15.9300b no 6.4 10.0 51.4 20.6 18.0 98.1 46.2
a MeCN/H2Ob H2Oc Reaction conditions: Glucose 20 mM, 14 mg catalyst
H2O was used as reaction medium, conversion values dropped to 9.5% (1000 W) and 6.4%
(300 W) without filters, and to around 2% with the filters installed (Figure 3.10b, 3.10a,
Table 3.5). Clearly, the significant differences in the conversion values can be explained
(a) (b)
.
Figure 3.10 Glucose conversion obtained using two different Xenon lamps 300 W (3.10a) and 1000W (3.10b) with and without the visible light filter using H2O and the 50/50 v/v H2O/MeCN mixture.
taking into account the different activity of the support under those conditions. Generally,
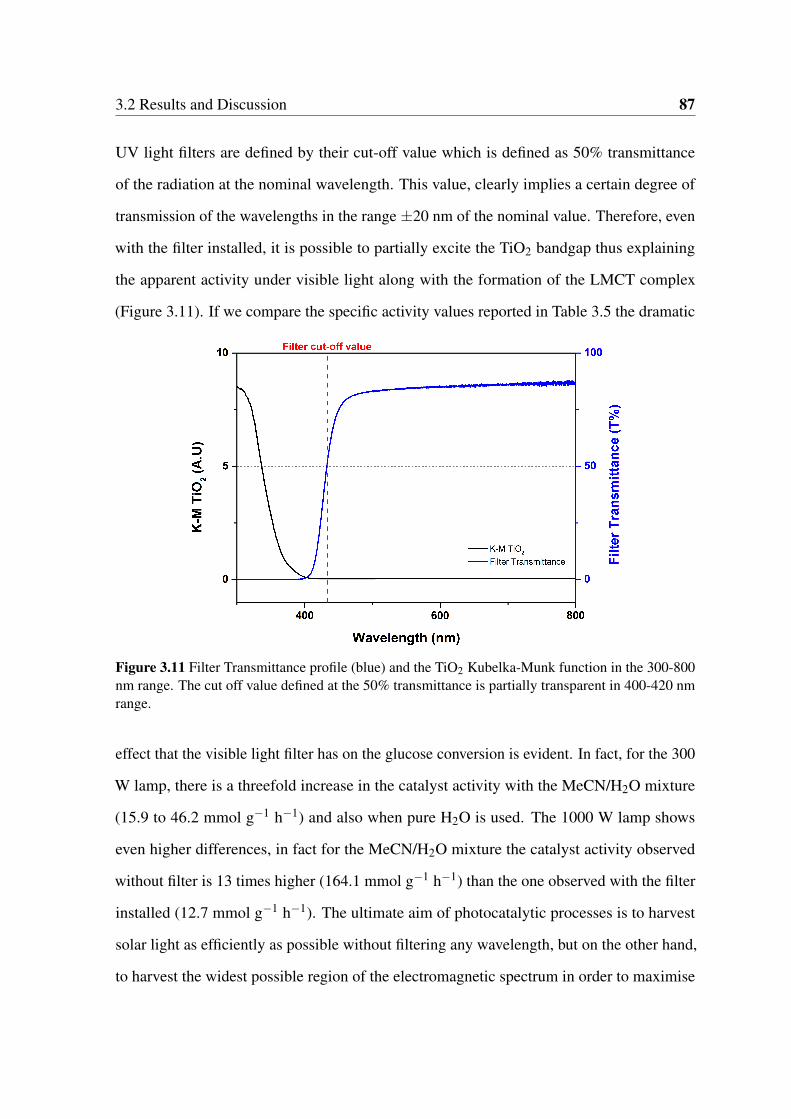
3.2 Results and Discussion 87
UV light filters are defined by their cut-off value which is defined as 50% transmittance
of the radiation at the nominal wavelength. This value, clearly implies a certain degree of
transmission of the wavelengths in the range ±20 nm of the nominal value. Therefore, even
with the filter installed, it is possible to partially excite the TiO2 bandgap thus explaining
the apparent activity under visible light along with the formation of the LMCT complex
(Figure 3.11). If we compare the specific activity values reported in Table 3.5 the dramatic
Figure 3.11 Filter Transmittance profile (blue) and the TiO2 Kubelka-Munk function in the 300-800nm range. The cut off value defined at the 50% transmittance is partially transparent in 400-420 nmrange.
effect that the visible light filter has on the glucose conversion is evident. In fact, for the 300
W lamp, there is a threefold increase in the catalyst activity with the MeCN/H2O mixture
(15.9 to 46.2 mmol g−1 h−1) and also when pure H2O is used. The 1000 W lamp shows
even higher differences, in fact for the MeCN/H2O mixture the catalyst activity observed
without filter is 13 times higher (164.1 mmol g−1 h−1) than the one observed with the filter
installed (12.7 mmol g−1 h−1). The ultimate aim of photocatalytic processes is to harvest
solar light as efficiently as possible without filtering any wavelength, but on the other hand,
to harvest the widest possible region of the electromagnetic spectrum in order to maximise

88 Optimization of the Reaction Parameters
the overall efficiency of the process. In fact, when the filters are removed, the catalyst is
exposed to both the UVA and visible part of the spectrum and under these circumstances
photons have enough energy to start the photocatalytic process and the conditions are similar
to what would happen if solar light was used. These results clearly show that the power of
the light source along with its irradiance flux and area, have to be chosen according to the
experimental set-up used. In fact, more irradiance does not necessarily imply better results.
Lower power lamps have also benefits as the arc sources are smaller and, in some cases, even
brighter than more powerful lamps, thus it is possible to achieve high flux densities on small
targets as well as with small lamps. It is also worth considering that smaller lamps are easier
to operate, and they do not require additional filters to dissipate the heat produced and avoid
thermal variations in the reaction mixture. Therefore, the application of every lamp is really
reaction and configuration sensitive and the choice on which configuration to use has to be
made carefully. Additionally, when photocatalytic results are reported, information on the
lamp hours and on the average lifetime of the irradiating source should also be available, as
the performances of the same lamp throughout its life cycle vary dramatically. The solvent
choice also has an impact on the substrate conversion in photochemical reactions. The use
of acetonitrile in photocatalysis, despite not being an ideal green solvent, is due to the fact
that this molecule has no absorption in the ultraviolet nor visible region of the spectrum
(Figure 3.12), it is a polar and aprotic solvent, and has very little chemical reactivity.
In the literature there are some examples of H2O/MeCN mixtures in photochemical
applications, but the role of the MeCN is not yet fully understood because of the complexity
of the chemistry involve [213, 62, 59]. Redmond and Fitzmaurice [197], proved that the
TiO2 flatband potential is also affected by non-aqueous solvents, and they reported that in the
absence of the proton adsorption-desorption mechanism the negative values were observed in
MeCN, EtOH and MeOH. When electrolytes and water are added to the systems, significant
positive shifts were observed. Therefore, when considering a photocatalytic system it is
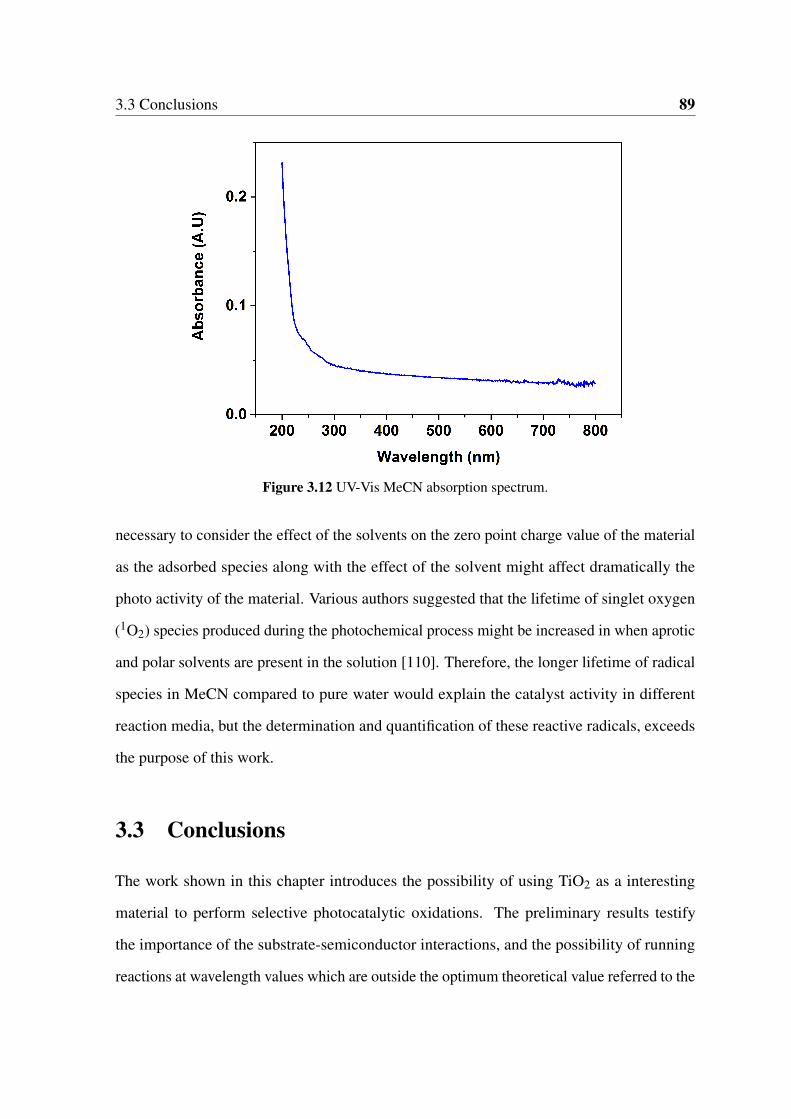
3.3 Conclusions 89
Figure 3.12 UV-Vis MeCN absorption spectrum.
necessary to consider the effect of the solvents on the zero point charge value of the material
as the adsorbed species along with the effect of the solvent might affect dramatically the
photo activity of the material. Various authors suggested that the lifetime of singlet oxygen
(1O2) species produced during the photochemical process might be increased in when aprotic
and polar solvents are present in the solution [110]. Therefore, the longer lifetime of radical
species in MeCN compared to pure water would explain the catalyst activity in different
reaction media, but the determination and quantification of these reactive radicals, exceeds
the purpose of this work.
3.3 Conclusions
The work shown in this chapter introduces the possibility of using TiO2 as a interesting
material to perform selective photocatalytic oxidations. The preliminary results testify
the importance of the substrate-semiconductor interactions, and the possibility of running
reactions at wavelength values which are outside the optimum theoretical value referred to the
90 Optimization of the Reaction Parameters
bandgap of the semiconductor. In fact, the formation of LMCT complexes partially extends
the activity of semiconductors which are active under UV irradiation to the visible part of
the spectrum. This concept cannot be extended tout court to all semiconductors due to the
influence of several parameters (pH, zero charge point, hydroxylation of the surface etc) but
this scenario has to be taken into account when approaching new reactions for the first time
as the results obtained might be significantly influenced by this phenomenon. The surprising
activity of these materials under the experimental conditions considered, introduces the
following chapter in which the addition of metal nanoparticles on the semiconductor surface
is used to extend the range of activity at even higher wavelengths with significant effect on
the mass balance, conversion and the specific activity values.
Chapter 4Glucose Photo-oxidation
DO YOU SEE THE LIGHT?
Rev. C. James
4.1 Introduction
Glucose is the most common and cheapest carbohydrate available in nature as it is easily
extracted from many plants (i.e. cane sugar or beetroot), or easily obtained from corn
and other crops. It can be obtained from starch or any waste lignocellulosic biomass via
the hydrolysis of its component polysaccharides (cellulose and hemicellulose). Glucose
can be valorised into platform chemicals such as glucaric acid, arabitol, levulinic acid
and hydroxymethylfurfural by variety of chemical, catalytic and enzymatic pathways [27].
Early reviews surveyed the possible application of glucose oxidation products as chiral
intermediates with potential application in the pharmaceutical industry and as precursors
for vitamin C and other high value chemicals [202]. Commercially, it is a precursor to
gluconic acid which is used in the pharmaceutical, food, health and textiles industry [115].
Glucose transformations are typically carried out by fermentation and enzymatic routes but
these often suffer from poor rates, low yields and the cost of the enzyme used [115]. An
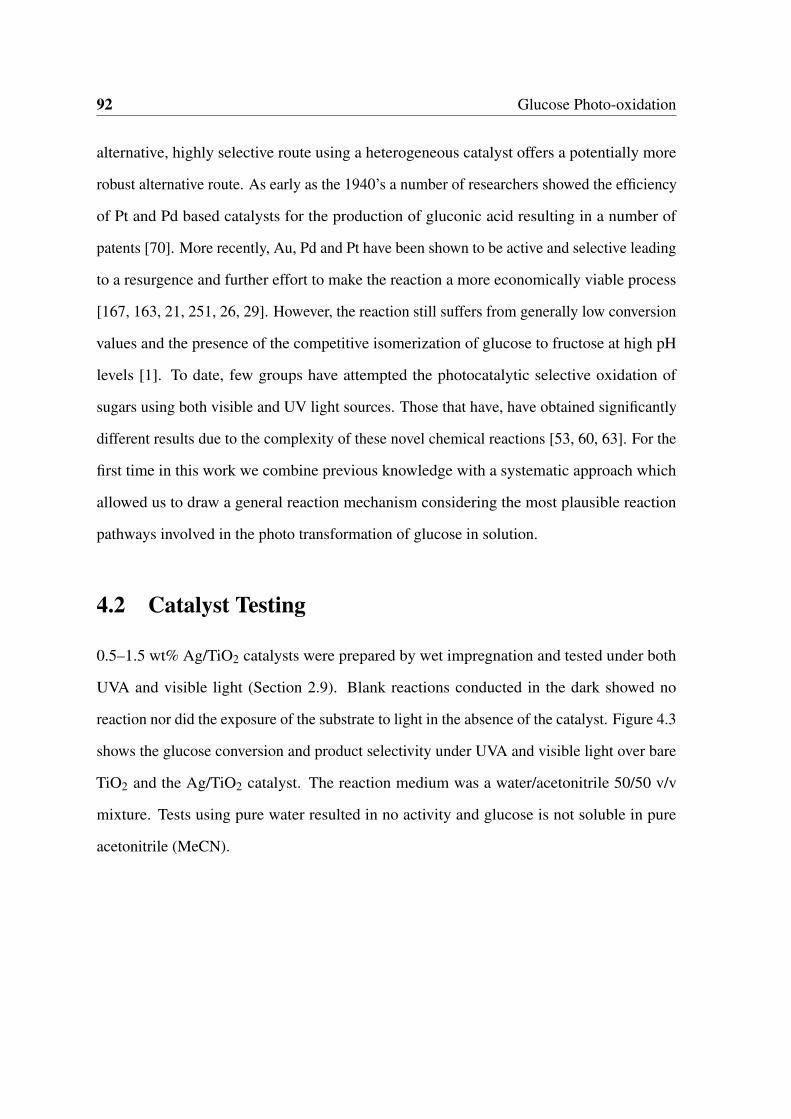
92 Glucose Photo-oxidation
alternative, highly selective route using a heterogeneous catalyst offers a potentially more
robust alternative route. As early as the 1940’s a number of researchers showed the efficiency
of Pt and Pd based catalysts for the production of gluconic acid resulting in a number of
patents [70]. More recently, Au, Pd and Pt have been shown to be active and selective leading
to a resurgence and further effort to make the reaction a more economically viable process
[167, 163, 21, 251, 26, 29]. However, the reaction still suffers from generally low conversion
values and the presence of the competitive isomerization of glucose to fructose at high pH
levels [1]. To date, few groups have attempted the photocatalytic selective oxidation of
sugars using both visible and UV light sources. Those that have, have obtained significantly
different results due to the complexity of these novel chemical reactions [53, 60, 63]. For the
first time in this work we combine previous knowledge with a systematic approach which
allowed us to draw a general reaction mechanism considering the most plausible reaction
pathways involved in the photo transformation of glucose in solution.
4.2 Catalyst Testing
0.5–1.5 wt% Ag/TiO2 catalysts were prepared by wet impregnation and tested under both
UVA and visible light (Section 2.9). Blank reactions conducted in the dark showed no
reaction nor did the exposure of the substrate to light in the absence of the catalyst. Figure 4.3
shows the glucose conversion and product selectivity under UVA and visible light over bare
TiO2 and the Ag/TiO2 catalyst. The reaction medium was a water/acetonitrile 50/50 v/v
mixture. Tests using pure water resulted in no activity and glucose is not soluble in pure
acetonitrile (MeCN).
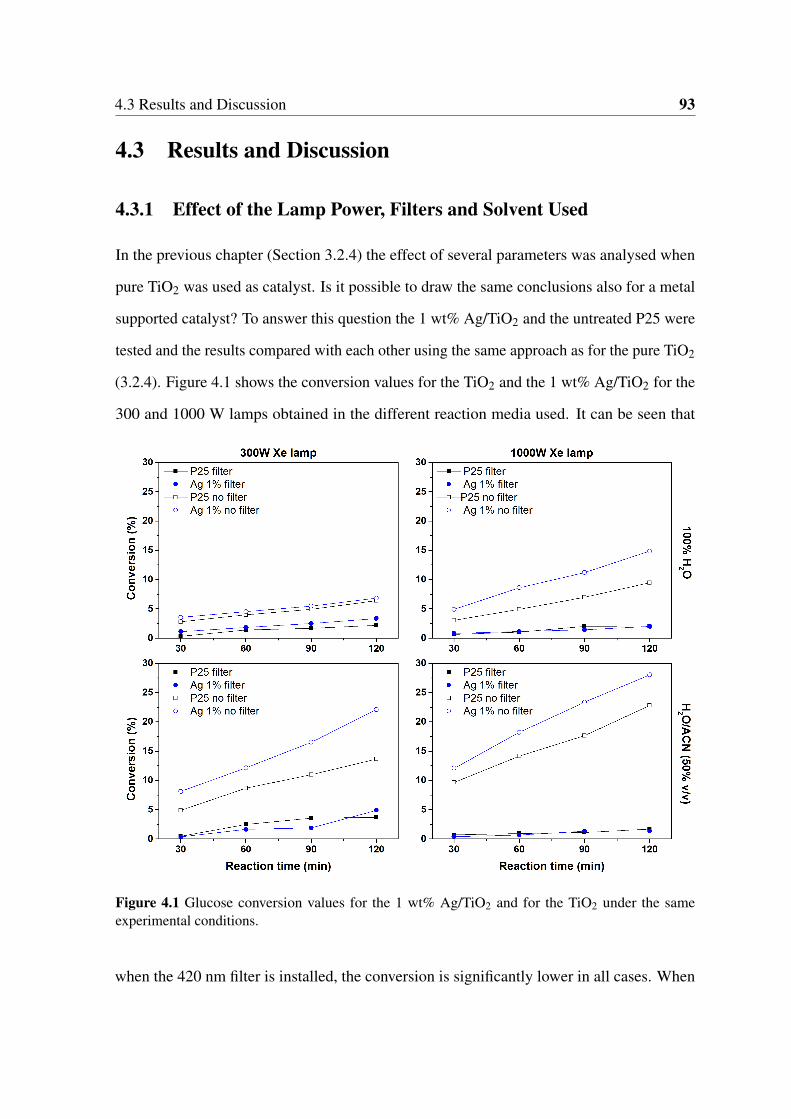
4.3 Results and Discussion 93
4.3 Results and Discussion
4.3.1 Effect of the Lamp Power, Filters and Solvent Used
In the previous chapter (Section 3.2.4) the effect of several parameters was analysed when
pure TiO2 was used as catalyst. Is it possible to draw the same conclusions also for a metal
supported catalyst? To answer this question the 1 wt% Ag/TiO2 and the untreated P25 were
tested and the results compared with each other using the same approach as for the pure TiO2
(3.2.4). Figure 4.1 shows the conversion values for the TiO2 and the 1 wt% Ag/TiO2 for the
300 and 1000 W lamps obtained in the different reaction media used. It can be seen that
Figure 4.1 Glucose conversion values for the 1 wt% Ag/TiO2 and for the TiO2 under the sameexperimental conditions.
when the 420 nm filter is installed, the conversion is significantly lower in all cases. When

94 Glucose Photo-oxidation
the filter is removed the conversion is generally higher with the 1 wt% Ag/TiO2 catalyst
displaying the highest activity in all cases (Table 4.1) .
Table 4.1 Product distribution observed for the TiO2-P25 and for the 1 wt% Ag/TiO2 samples testedwith the Xenon lamps with and without visible light filters.
LampCatalyst
Cut-off Conversion Mass SpecificPower filter Balance Activity
(W) (%) (%) (%) (mmol g−1 h−1)c
1000a TiO2-P25 yes 1.7 99.1 12.21000a TiO2-P25 no 22.8 90.1 164.11000a 1%Ag/TiO2 yes 1.4 100.2 10.01000a 1%Ag/TiO2 no 28.0 87.1 199.41000b TiO2-P25 yes 2.1 99.7 15.01000b TiO2-P25 no 9.5 96.5 67.31000b 1%Ag/TiO2 yes 2.0 99.6 14.61000b 1%Ag/TiO2 no 14.9 93.6 105.5300a TiO2-P25 yes 3.7 101.0 26.8300a TiO2-P25 no 13.7 95.3 97.9300a 1%Ag/TiO2 yes 4.9 99.8 35.6300a 1%Ag/TiO2 no 22.1 90.6 159.0300b TiO2-P25 yes 2.2 99.5 15.9300b TiO2-P25 no 6.4 98.1 46.2300 b 1%Ag/TiO2 yes 3.4 99.4 24.0300b 1%Ag/TiO2 no 6.8 97.4 48.7
a MeCN/H2Ob H2Oc Reaction conditions: Glucose 20 mM, 14 mg catalyst
The higher activity of the catalyst has to be compared with the mass balance values,
as the direct glucose mineralization is undesired as the aim is to produce partial oxidation
products and not H2 and CO2. In fact, when the filters are removed, the Ag/TiO2 catalyst
displayed mass balance values as low as 86% with the 1000 W lamp (Figure 4.2). These
values despite being significantly lower than the 99+% obtained with the filters installed, are
a good indication that the combination of UV + visible light has increased the activity of
the material as both the support + the metal nanoparticles are excited at the same time as
reported in Figure 1.16 in Section 1.6.1, but a compromise has to be made with the amount
of gases evolved which can be used as a feed in other processes.
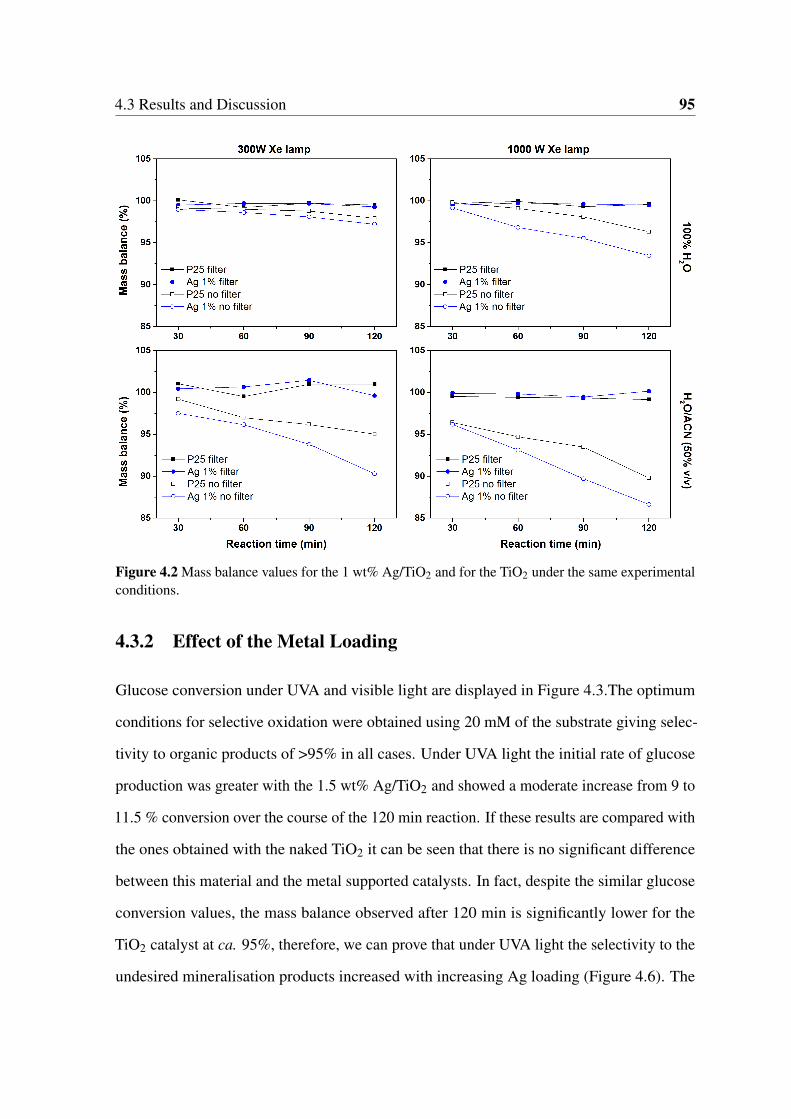
4.3 Results and Discussion 95
Figure 4.2 Mass balance values for the 1 wt% Ag/TiO2 and for the TiO2 under the same experimentalconditions.
4.3.2 Effect of the Metal Loading
Glucose conversion under UVA and visible light are displayed in Figure 4.3.The optimum
conditions for selective oxidation were obtained using 20 mM of the substrate giving selec-
tivity to organic products of >95% in all cases. Under UVA light the initial rate of glucose
production was greater with the 1.5 wt% Ag/TiO2 and showed a moderate increase from 9 to
11.5 % conversion over the course of the 120 min reaction. If these results are compared with
the ones obtained with the naked TiO2 it can be seen that there is no significant difference
between this material and the metal supported catalysts. In fact, despite the similar glucose
conversion values, the mass balance observed after 120 min is significantly lower for the
TiO2 catalyst at ca. 95%, therefore, we can prove that under UVA light the selectivity to the
undesired mineralisation products increased with increasing Ag loading (Figure 4.6). The
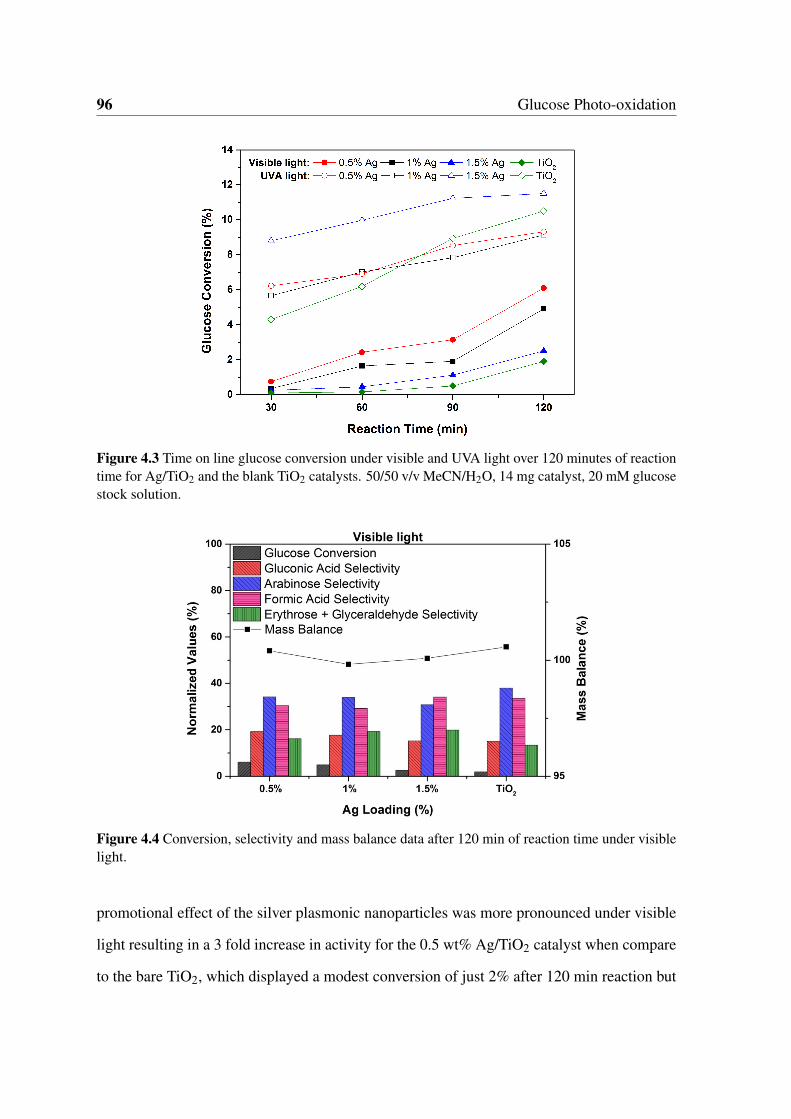
96 Glucose Photo-oxidation
Figure 4.3 Time on line glucose conversion under visible and UVA light over 120 minutes of reactiontime for Ag/TiO2 and the blank TiO2 catalysts. 50/50 v/v MeCN/H2O, 14 mg catalyst, 20 mM glucosestock solution.
Figure 4.4 Conversion, selectivity and mass balance data after 120 min of reaction time under visiblelight.
promotional effect of the silver plasmonic nanoparticles was more pronounced under visible
light resulting in a 3 fold increase in activity for the 0.5 wt% Ag/TiO2 catalyst when compare
to the bare TiO2, which displayed a modest conversion of just 2% after 120 min reaction but
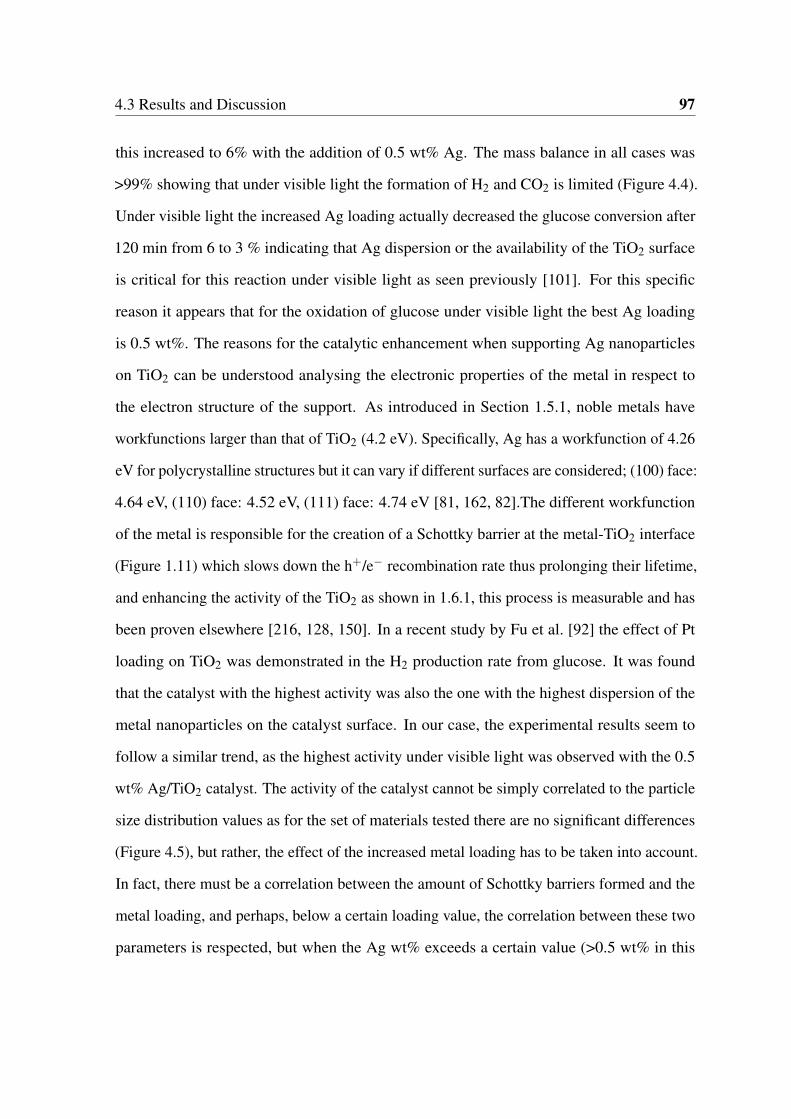
4.3 Results and Discussion 97
this increased to 6% with the addition of 0.5 wt% Ag. The mass balance in all cases was
>99% showing that under visible light the formation of H2 and CO2 is limited (Figure 4.4).
Under visible light the increased Ag loading actually decreased the glucose conversion after
120 min from 6 to 3 % indicating that Ag dispersion or the availability of the TiO2 surface
is critical for this reaction under visible light as seen previously [101]. For this specific
reason it appears that for the oxidation of glucose under visible light the best Ag loading
is 0.5 wt%. The reasons for the catalytic enhancement when supporting Ag nanoparticles
on TiO2 can be understood analysing the electronic properties of the metal in respect to
the electron structure of the support. As introduced in Section 1.5.1, noble metals have
workfunctions larger than that of TiO2 (4.2 eV). Specifically, Ag has a workfunction of 4.26
eV for polycrystalline structures but it can vary if different surfaces are considered; (100) face:
4.64 eV, (110) face: 4.52 eV, (111) face: 4.74 eV [81, 162, 82].The different workfunction
of the metal is responsible for the creation of a Schottky barrier at the metal-TiO2 interface
(Figure 1.11) which slows down the h+/e− recombination rate thus prolonging their lifetime,
and enhancing the activity of the TiO2 as shown in 1.6.1, this process is measurable and has
been proven elsewhere [216, 128, 150]. In a recent study by Fu et al. [92] the effect of Pt
loading on TiO2 was demonstrated in the H2 production rate from glucose. It was found
that the catalyst with the highest activity was also the one with the highest dispersion of the
metal nanoparticles on the catalyst surface. In our case, the experimental results seem to
follow a similar trend, as the highest activity under visible light was observed with the 0.5
wt% Ag/TiO2 catalyst. The activity of the catalyst cannot be simply correlated to the particle
size distribution values as for the set of materials tested there are no significant differences
(Figure 4.5), but rather, the effect of the increased metal loading has to be taken into account.
In fact, there must be a correlation between the amount of Schottky barriers formed and the
metal loading, and perhaps, below a certain loading value, the correlation between these two
parameters is respected, but when the Ag wt% exceeds a certain value (>0.5 wt% in this
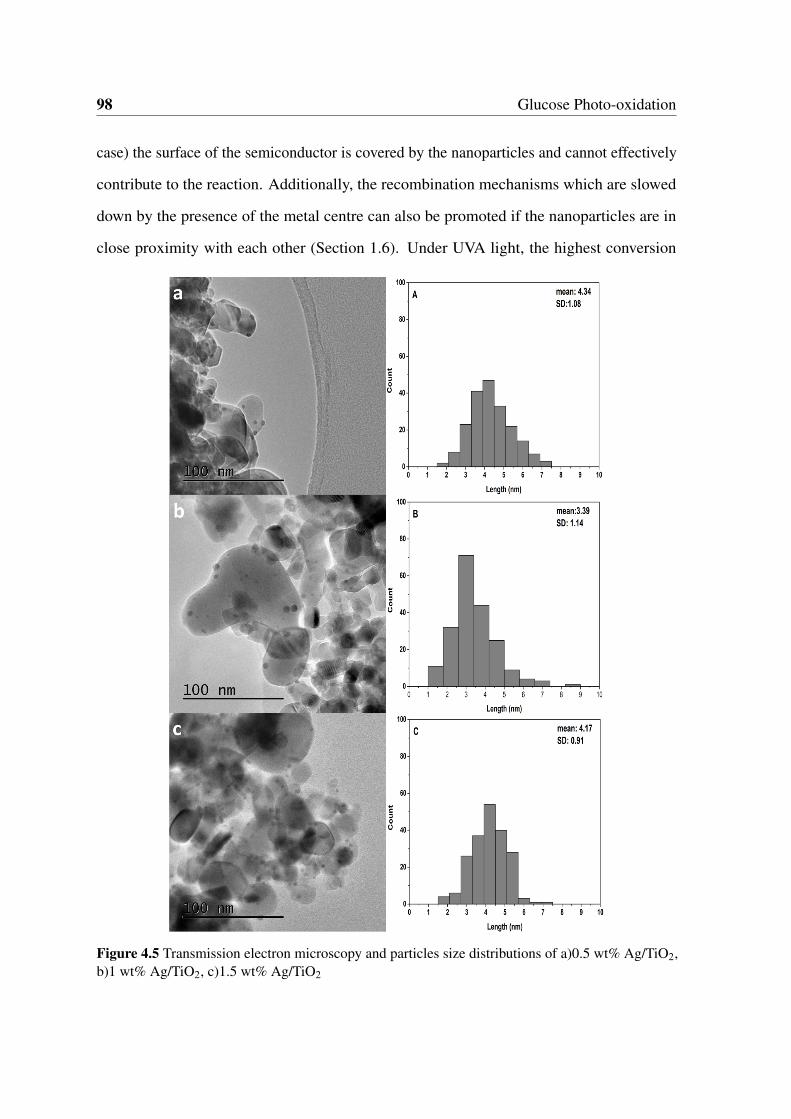
98 Glucose Photo-oxidation
case) the surface of the semiconductor is covered by the nanoparticles and cannot effectively
contribute to the reaction. Additionally, the recombination mechanisms which are slowed
down by the presence of the metal centre can also be promoted if the nanoparticles are in
close proximity with each other (Section 1.6). Under UVA light, the highest conversion
Figure 4.5 Transmission electron microscopy and particles size distributions of a)0.5 wt% Ag/TiO2,b)1 wt% Ag/TiO2, c)1.5 wt% Ag/TiO2
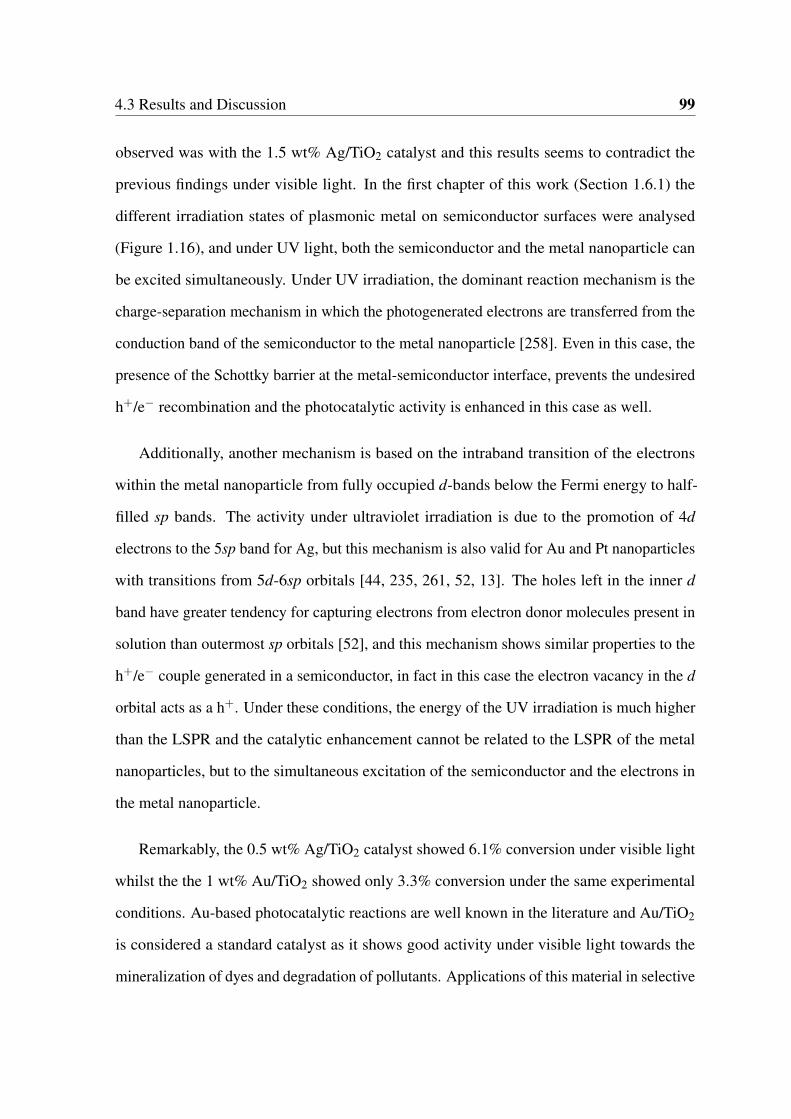
4.3 Results and Discussion 99
observed was with the 1.5 wt% Ag/TiO2 catalyst and this results seems to contradict the
previous findings under visible light. In the first chapter of this work (Section 1.6.1) the
different irradiation states of plasmonic metal on semiconductor surfaces were analysed
(Figure 1.16), and under UV light, both the semiconductor and the metal nanoparticle can
be excited simultaneously. Under UV irradiation, the dominant reaction mechanism is the
charge-separation mechanism in which the photogenerated electrons are transferred from the
conduction band of the semiconductor to the metal nanoparticle [258]. Even in this case, the
presence of the Schottky barrier at the metal-semiconductor interface, prevents the undesired
h+/e− recombination and the photocatalytic activity is enhanced in this case as well.
Additionally, another mechanism is based on the intraband transition of the electrons
within the metal nanoparticle from fully occupied d-bands below the Fermi energy to half-
filled sp bands. The activity under ultraviolet irradiation is due to the promotion of 4d
electrons to the 5sp band for Ag, but this mechanism is also valid for Au and Pt nanoparticles
with transitions from 5d-6sp orbitals [44, 235, 261, 52, 13]. The holes left in the inner d
band have greater tendency for capturing electrons from electron donor molecules present in
solution than outermost sp orbitals [52], and this mechanism shows similar properties to the
h+/e− couple generated in a semiconductor, in fact in this case the electron vacancy in the d
orbital acts as a h+. Under these conditions, the energy of the UV irradiation is much higher
than the LSPR and the catalytic enhancement cannot be related to the LSPR of the metal
nanoparticles, but to the simultaneous excitation of the semiconductor and the electrons in
the metal nanoparticle.
Remarkably, the 0.5 wt% Ag/TiO2 catalyst showed 6.1% conversion under visible light
whilst the the 1 wt% Au/TiO2 showed only 3.3% conversion under the same experimental
conditions. Au-based photocatalytic reactions are well known in the literature and Au/TiO2
is considered a standard catalyst as it shows good activity under visible light towards the
mineralization of dyes and degradation of pollutants. Applications of this material in selective
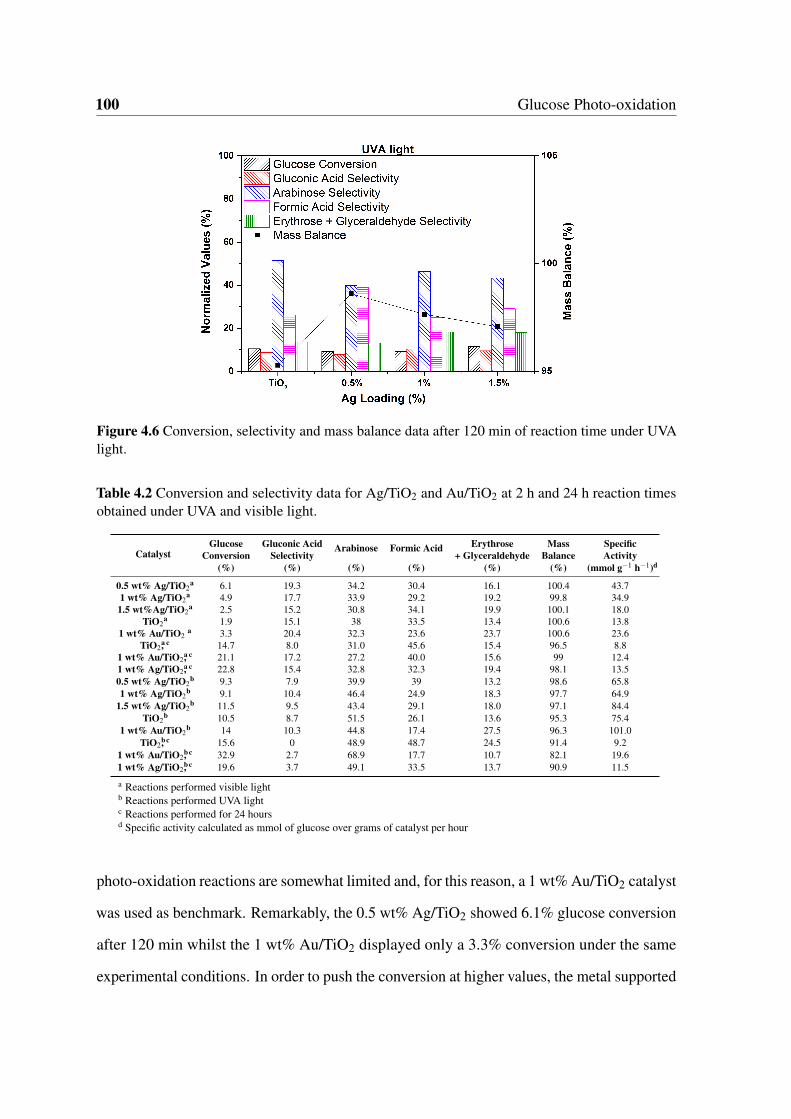
100 Glucose Photo-oxidation
Figure 4.6 Conversion, selectivity and mass balance data after 120 min of reaction time under UVAlight.
Table 4.2 Conversion and selectivity data for Ag/TiO2 and Au/TiO2 at 2 h and 24 h reaction timesobtained under UVA and visible light.
CatalystGlucose Gluconic Acid Arabinose Formic Acid Erythrose Mass Specific
Conversion Selectivity + Glyceraldehyde Balance Activity(%) (%) (%) (%) (%) (%) (mmol g−1 h−1)d
0.5 wt% Ag/TiO2a 6.1 19.3 34.2 30.4 16.1 100.4 43.7
1 wt% Ag/TiO2a 4.9 17.7 33.9 29.2 19.2 99.8 34.9
1.5 wt%Ag/TiO2a 2.5 15.2 30.8 34.1 19.9 100.1 18.0
TiO2a 1.9 15.1 38 33.5 13.4 100.6 13.8
1 wt% Au/TiO2a 3.3 20.4 32.3 23.6 23.7 100.6 23.6
TiO2a, c 14.7 8.0 31.0 45.6 15.4 96.5 8.8
1 wt% Au/TiO2a, c 21.1 17.2 27.2 40.0 15.6 99 12.4
1 wt% Ag/TiO2a, c 22.8 15.4 32.8 32.3 19.4 98.1 13.5
0.5 wt% Ag/TiO2b 9.3 7.9 39.9 39 13.2 98.6 65.8
1 wt% Ag/TiO2b 9.1 10.4 46.4 24.9 18.3 97.7 64.9
1.5 wt% Ag/TiO2b 11.5 9.5 43.4 29.1 18.0 97.1 84.4
TiO2b 10.5 8.7 51.5 26.1 13.6 95.3 75.4
1 wt% Au/TiO2b 14 10.3 44.8 17.4 27.5 96.3 101.0
TiO2b, c 15.6 0 48.9 48.7 24.5 91.4 9.2
1 wt% Au/TiO2b, c 32.9 2.7 68.9 17.7 10.7 82.1 19.6
1 wt% Ag/TiO2b, c 19.6 3.7 49.1 33.5 13.7 90.9 11.5
a Reactions performed visible lightb Reactions performed UVA lightc Reactions performed for 24 hoursd Specific activity calculated as mmol of glucose over grams of catalyst per hour
photo-oxidation reactions are somewhat limited and, for this reason, a 1 wt% Au/TiO2 catalyst
was used as benchmark. Remarkably, the 0.5 wt% Ag/TiO2 showed 6.1% glucose conversion
after 120 min whilst the 1 wt% Au/TiO2 displayed only a 3.3% conversion under the same
experimental conditions. In order to push the conversion at higher values, the metal supported
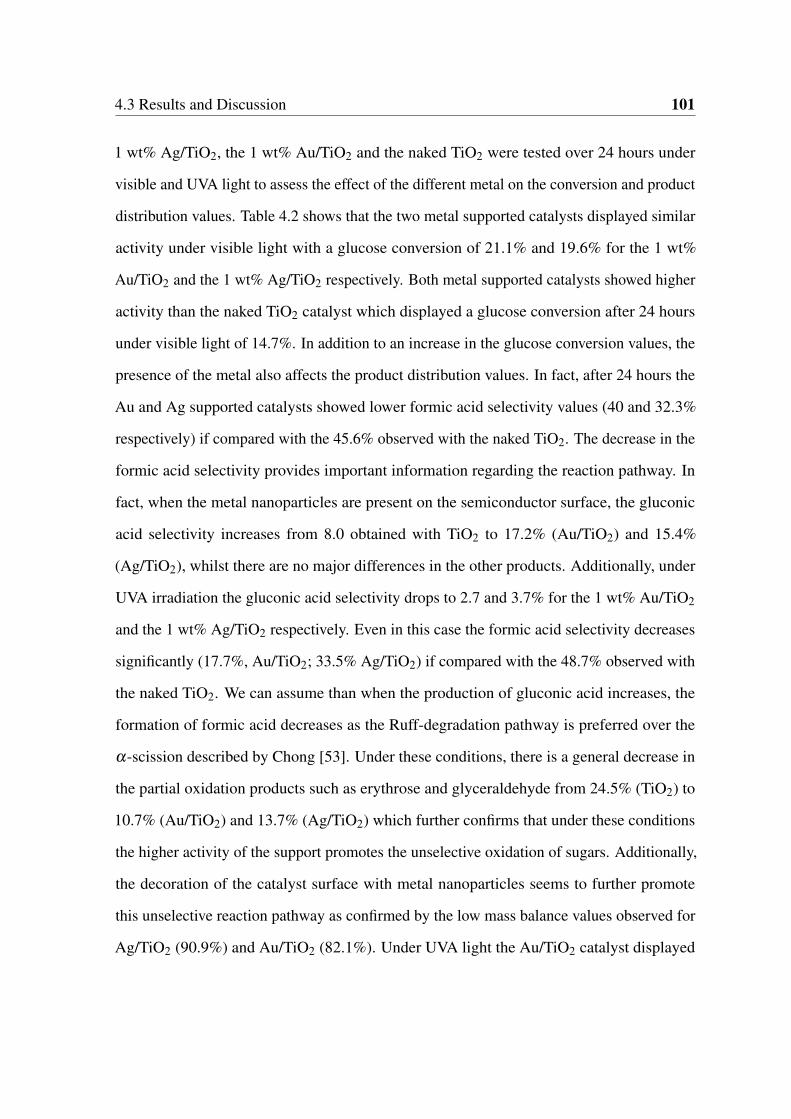
4.3 Results and Discussion 101
1 wt% Ag/TiO2, the 1 wt% Au/TiO2 and the naked TiO2 were tested over 24 hours under
visible and UVA light to assess the effect of the different metal on the conversion and product
distribution values. Table 4.2 shows that the two metal supported catalysts displayed similar
activity under visible light with a glucose conversion of 21.1% and 19.6% for the 1 wt%
Au/TiO2 and the 1 wt% Ag/TiO2 respectively. Both metal supported catalysts showed higher
activity than the naked TiO2 catalyst which displayed a glucose conversion after 24 hours
under visible light of 14.7%. In addition to an increase in the glucose conversion values, the
presence of the metal also affects the product distribution values. In fact, after 24 hours the
Au and Ag supported catalysts showed lower formic acid selectivity values (40 and 32.3%
respectively) if compared with the 45.6% observed with the naked TiO2. The decrease in the
formic acid selectivity provides important information regarding the reaction pathway. In
fact, when the metal nanoparticles are present on the semiconductor surface, the gluconic
acid selectivity increases from 8.0 obtained with TiO2 to 17.2% (Au/TiO2) and 15.4%
(Ag/TiO2), whilst there are no major differences in the other products. Additionally, under
UVA irradiation the gluconic acid selectivity drops to 2.7 and 3.7% for the 1 wt% Au/TiO2
and the 1 wt% Ag/TiO2 respectively. Even in this case the formic acid selectivity decreases
significantly (17.7%, Au/TiO2; 33.5% Ag/TiO2) if compared with the 48.7% observed with
the naked TiO2. We can assume than when the production of gluconic acid increases, the
formation of formic acid decreases as the Ruff-degradation pathway is preferred over the
α-scission described by Chong [53]. Under these conditions, there is a general decrease in
the partial oxidation products such as erythrose and glyceraldehyde from 24.5% (TiO2) to
10.7% (Au/TiO2) and 13.7% (Ag/TiO2) which further confirms that under these conditions
the higher activity of the support promotes the unselective oxidation of sugars. Additionally,
the decoration of the catalyst surface with metal nanoparticles seems to further promote
this unselective reaction pathway as confirmed by the low mass balance values observed for
Ag/TiO2 (90.9%) and Au/TiO2 (82.1%). Under UVA light the Au/TiO2 catalyst displayed
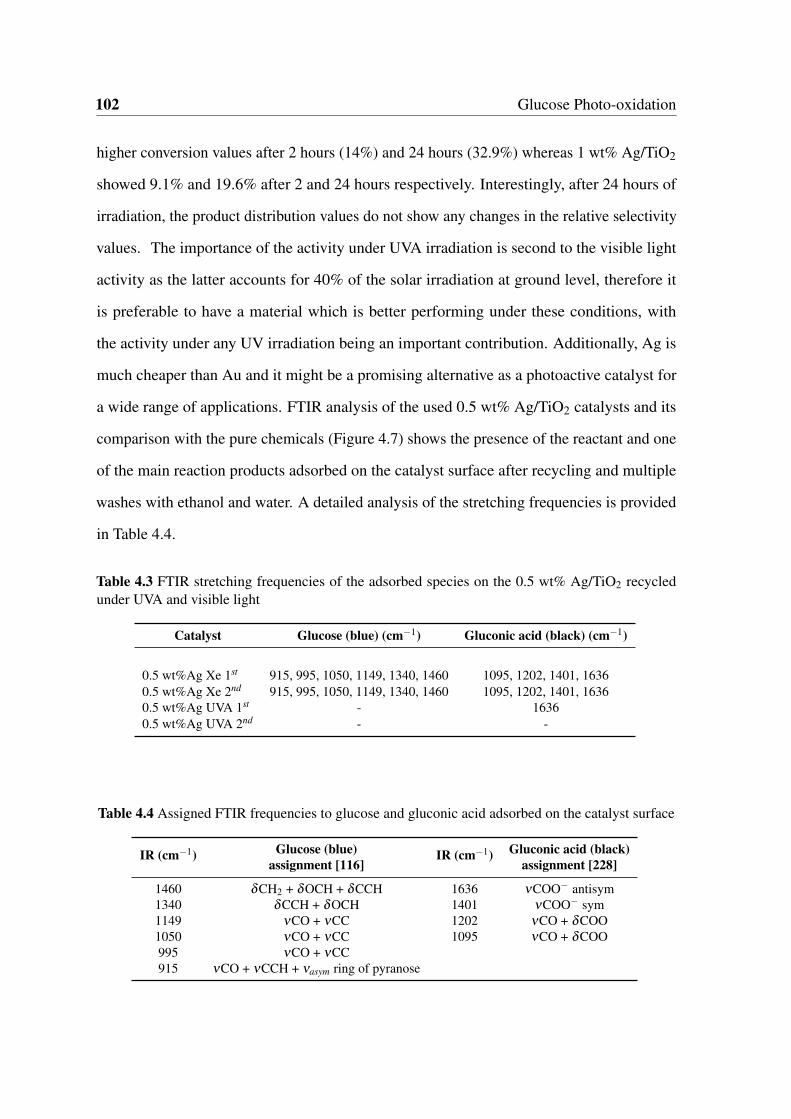
102 Glucose Photo-oxidation
higher conversion values after 2 hours (14%) and 24 hours (32.9%) whereas 1 wt% Ag/TiO2
showed 9.1% and 19.6% after 2 and 24 hours respectively. Interestingly, after 24 hours of
irradiation, the product distribution values do not show any changes in the relative selectivity
values. The importance of the activity under UVA irradiation is second to the visible light
activity as the latter accounts for 40% of the solar irradiation at ground level, therefore it
is preferable to have a material which is better performing under these conditions, with
the activity under any UV irradiation being an important contribution. Additionally, Ag is
much cheaper than Au and it might be a promising alternative as a photoactive catalyst for
a wide range of applications. FTIR analysis of the used 0.5 wt% Ag/TiO2 catalysts and its
comparison with the pure chemicals (Figure 4.7) shows the presence of the reactant and one
of the main reaction products adsorbed on the catalyst surface after recycling and multiple
washes with ethanol and water. A detailed analysis of the stretching frequencies is provided
in Table 4.4.
Table 4.3 FTIR stretching frequencies of the adsorbed species on the 0.5 wt% Ag/TiO2 recycledunder UVA and visible light
Catalyst Glucose (blue) (cm−1) Gluconic acid (black) (cm−1)
0.5 wt%Ag Xe 1st 915, 995, 1050, 1149, 1340, 1460 1095, 1202, 1401, 16360.5 wt%Ag Xe 2nd 915, 995, 1050, 1149, 1340, 1460 1095, 1202, 1401, 16360.5 wt%Ag UVA 1st - 16360.5 wt%Ag UVA 2nd - -
Table 4.4 Assigned FTIR frequencies to glucose and gluconic acid adsorbed on the catalyst surface
IR (cm−1) Glucose (blue) IR (cm−1) Gluconic acid (black)assignment [116] assignment [228]
1460 δCH2 + δOCH + δCCH 1636 νCOO− antisym1340 δCCH + δOCH 1401 νCOO− sym1149 νCO + νCC 1202 νCO + δCOO1050 νCO + νCC 1095 νCO + δCOO995 νCO + νCC915 νCO + νCCH + νasym ring of pyranose
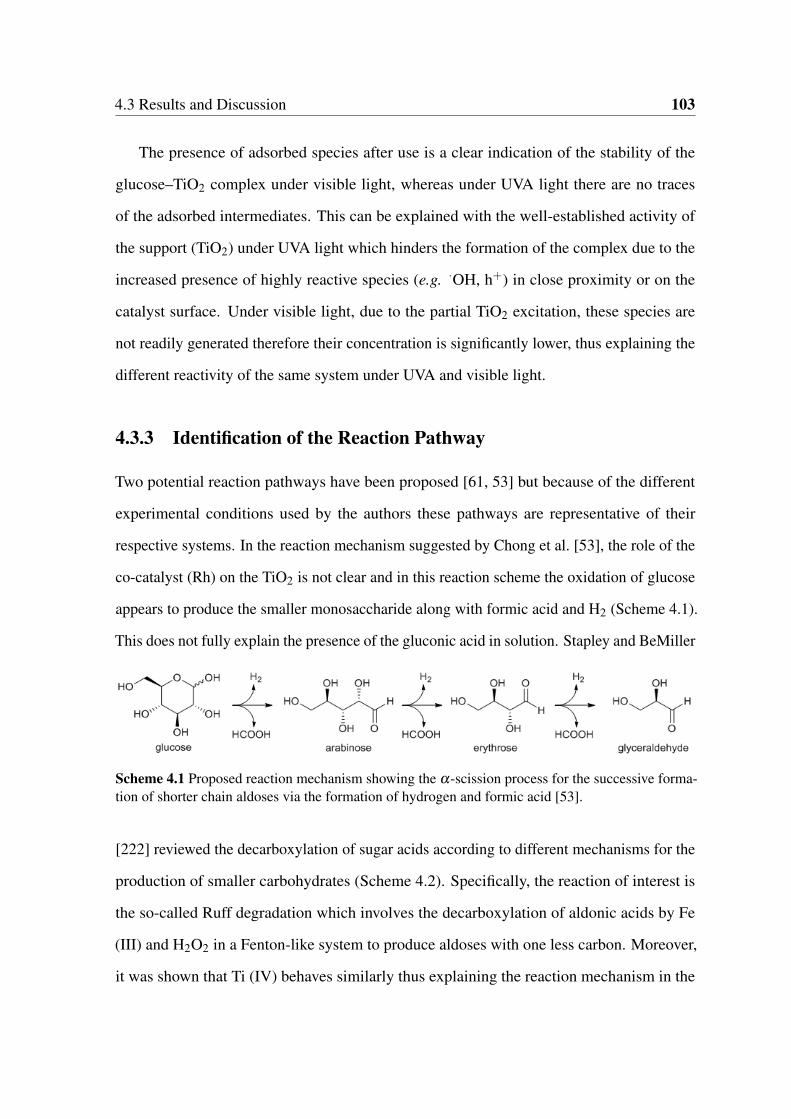
4.3 Results and Discussion 103
The presence of adsorbed species after use is a clear indication of the stability of the
glucose–TiO2 complex under visible light, whereas under UVA light there are no traces
of the adsorbed intermediates. This can be explained with the well-established activity of
the support (TiO2) under UVA light which hinders the formation of the complex due to the
increased presence of highly reactive species (e.g. ·OH, h+) in close proximity or on the
catalyst surface. Under visible light, due to the partial TiO2 excitation, these species are
not readily generated therefore their concentration is significantly lower, thus explaining the
different reactivity of the same system under UVA and visible light.
4.3.3 Identification of the Reaction Pathway
Two potential reaction pathways have been proposed [61, 53] but because of the different
experimental conditions used by the authors these pathways are representative of their
respective systems. In the reaction mechanism suggested by Chong et al. [53], the role of the
co-catalyst (Rh) on the TiO2 is not clear and in this reaction scheme the oxidation of glucose
appears to produce the smaller monosaccharide along with formic acid and H2 (Scheme 4.1).
This does not fully explain the presence of the gluconic acid in solution. Stapley and BeMiller
Scheme 4.1 Proposed reaction mechanism showing the α-scission process for the successive forma-tion of shorter chain aldoses via the formation of hydrogen and formic acid [53].
[222] reviewed the decarboxylation of sugar acids according to different mechanisms for the
production of smaller carbohydrates (Scheme 4.2). Specifically, the reaction of interest is
the so-called Ruff degradation which involves the decarboxylation of aldonic acids by Fe
(III) and H2O2 in a Fenton-like system to produce aldoses with one less carbon. Moreover,
it was shown that Ti (IV) behaves similarly thus explaining the reaction mechanism in the
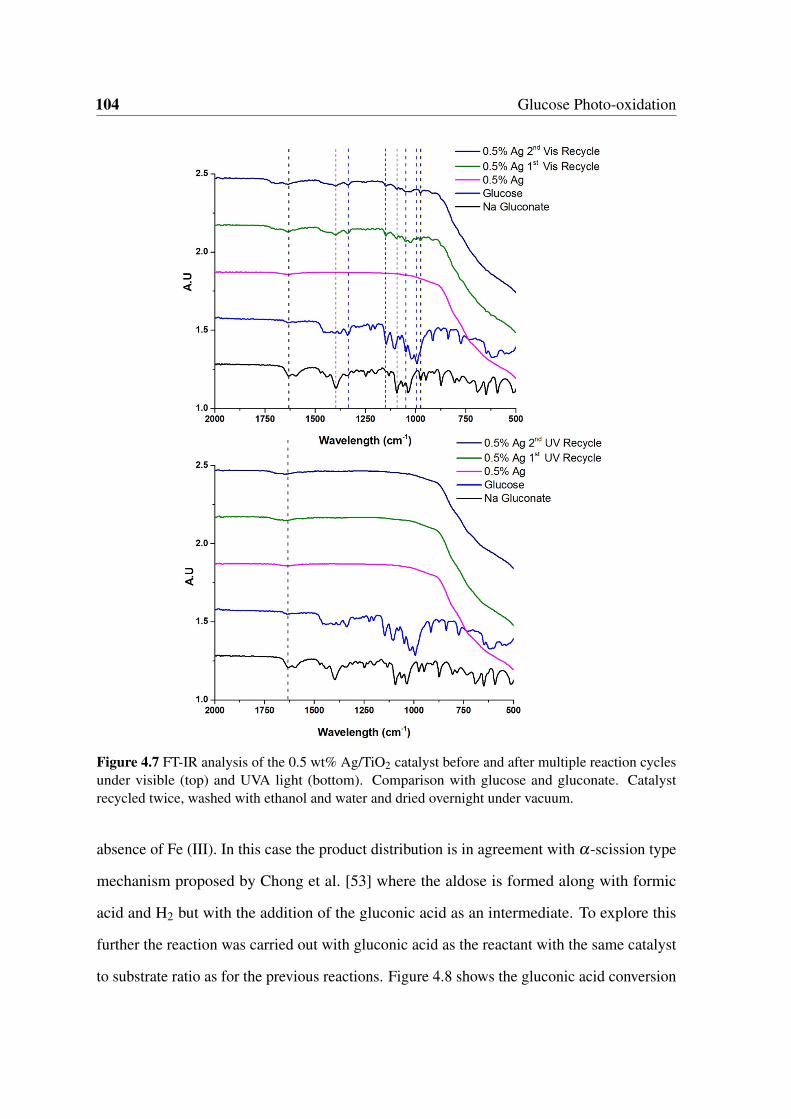
104 Glucose Photo-oxidation
Figure 4.7 FT-IR analysis of the 0.5 wt% Ag/TiO2 catalyst before and after multiple reaction cyclesunder visible (top) and UVA light (bottom). Comparison with glucose and gluconate. Catalystrecycled twice, washed with ethanol and water and dried overnight under vacuum.
absence of Fe (III). In this case the product distribution is in agreement with α-scission type
mechanism proposed by Chong et al. [53] where the aldose is formed along with formic
acid and H2 but with the addition of the gluconic acid as an intermediate. To explore this
further the reaction was carried out with gluconic acid as the reactant with the same catalyst
to substrate ratio as for the previous reactions. Figure 4.8 shows the gluconic acid conversion
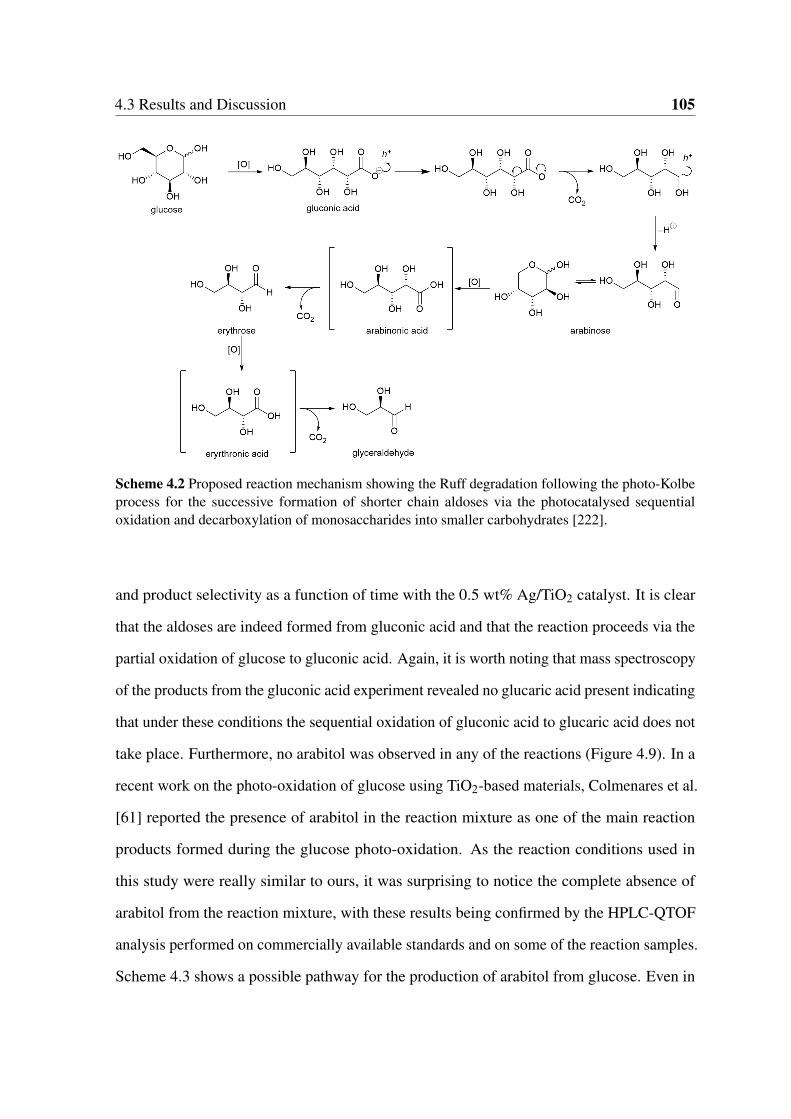
4.3 Results and Discussion 105
Scheme 4.2 Proposed reaction mechanism showing the Ruff degradation following the photo-Kolbeprocess for the successive formation of shorter chain aldoses via the photocatalysed sequentialoxidation and decarboxylation of monosaccharides into smaller carbohydrates [222].
and product selectivity as a function of time with the 0.5 wt% Ag/TiO2 catalyst. It is clear
that the aldoses are indeed formed from gluconic acid and that the reaction proceeds via the
partial oxidation of glucose to gluconic acid. Again, it is worth noting that mass spectroscopy
of the products from the gluconic acid experiment revealed no glucaric acid present indicating
that under these conditions the sequential oxidation of gluconic acid to glucaric acid does not
take place. Furthermore, no arabitol was observed in any of the reactions (Figure 4.9). In a
recent work on the photo-oxidation of glucose using TiO2-based materials, Colmenares et al.
[61] reported the presence of arabitol in the reaction mixture as one of the main reaction
products formed during the glucose photo-oxidation. As the reaction conditions used in
this study were really similar to ours, it was surprising to notice the complete absence of
arabitol from the reaction mixture, with these results being confirmed by the HPLC-QTOF
analysis performed on commercially available standards and on some of the reaction samples.
Scheme 4.3 shows a possible pathway for the production of arabitol from glucose. Even in
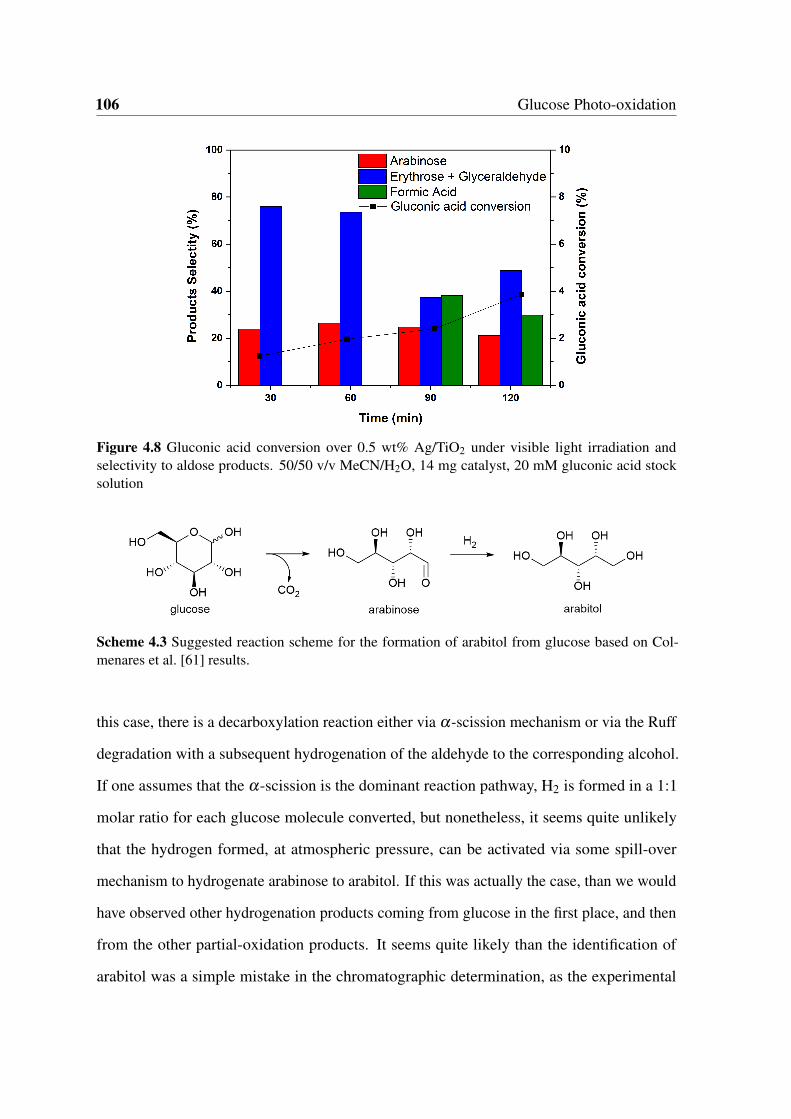
106 Glucose Photo-oxidation
Figure 4.8 Gluconic acid conversion over 0.5 wt% Ag/TiO2 under visible light irradiation andselectivity to aldose products. 50/50 v/v MeCN/H2O, 14 mg catalyst, 20 mM gluconic acid stocksolution
Scheme 4.3 Suggested reaction scheme for the formation of arabitol from glucose based on Col-menares et al. [61] results.
this case, there is a decarboxylation reaction either via α-scission mechanism or via the Ruff
degradation with a subsequent hydrogenation of the aldehyde to the corresponding alcohol.
If one assumes that the α-scission is the dominant reaction pathway, H2 is formed in a 1:1
molar ratio for each glucose molecule converted, but nonetheless, it seems quite unlikely
that the hydrogen formed, at atmospheric pressure, can be activated via some spill-over
mechanism to hydrogenate arabinose to arabitol. If this was actually the case, than we would
have observed other hydrogenation products coming from glucose in the first place, and then
from the other partial-oxidation products. It seems quite likely than the identification of
arabitol was a simple mistake in the chromatographic determination, as the experimental
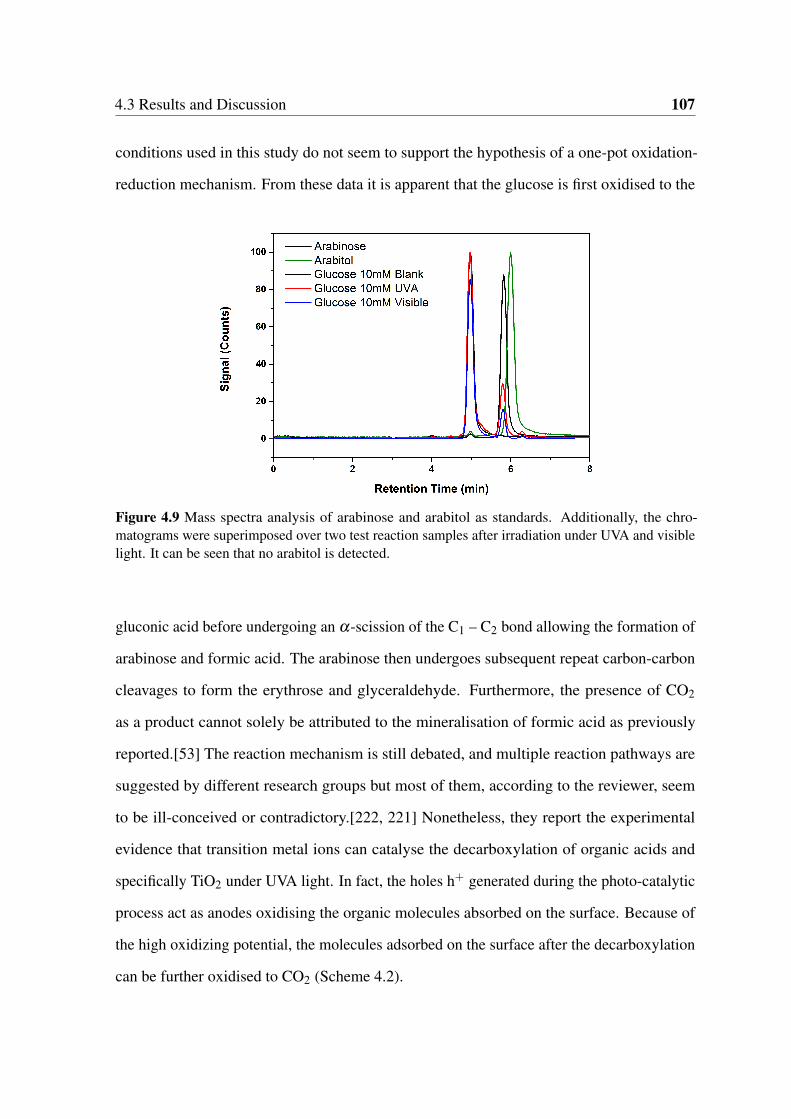
4.3 Results and Discussion 107
conditions used in this study do not seem to support the hypothesis of a one-pot oxidation-
reduction mechanism. From these data it is apparent that the glucose is first oxidised to the
Figure 4.9 Mass spectra analysis of arabinose and arabitol as standards. Additionally, the chro-matograms were superimposed over two test reaction samples after irradiation under UVA and visiblelight. It can be seen that no arabitol is detected.
gluconic acid before undergoing an α-scission of the C1 – C2 bond allowing the formation of
arabinose and formic acid. The arabinose then undergoes subsequent repeat carbon-carbon
cleavages to form the erythrose and glyceraldehyde. Furthermore, the presence of CO2
as a product cannot solely be attributed to the mineralisation of formic acid as previously
reported.[53] The reaction mechanism is still debated, and multiple reaction pathways are
suggested by different research groups but most of them, according to the reviewer, seem
to be ill-conceived or contradictory.[222, 221] Nonetheless, they report the experimental
evidence that transition metal ions can catalyse the decarboxylation of organic acids and
specifically TiO2 under UVA light. In fact, the holes h+ generated during the photo-catalytic
process act as anodes oxidising the organic molecules absorbed on the surface. Because of
the high oxidizing potential, the molecules adsorbed on the surface after the decarboxylation
can be further oxidised to CO2 (Scheme 4.2).
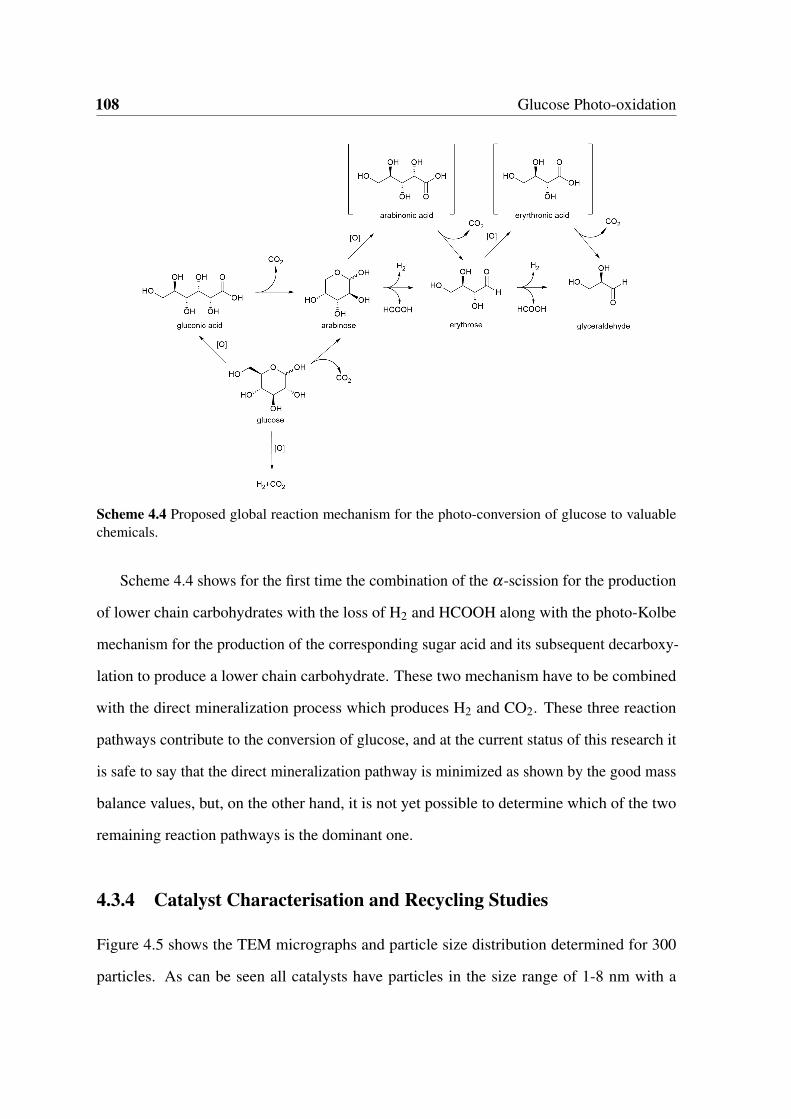
108 Glucose Photo-oxidation
Scheme 4.4 Proposed global reaction mechanism for the photo-conversion of glucose to valuablechemicals.
Scheme 4.4 shows for the first time the combination of the α-scission for the production
of lower chain carbohydrates with the loss of H2 and HCOOH along with the photo-Kolbe
mechanism for the production of the corresponding sugar acid and its subsequent decarboxy-
lation to produce a lower chain carbohydrate. These two mechanism have to be combined
with the direct mineralization process which produces H2 and CO2. These three reaction
pathways contribute to the conversion of glucose, and at the current status of this research it
is safe to say that the direct mineralization pathway is minimized as shown by the good mass
balance values, but, on the other hand, it is not yet possible to determine which of the two
remaining reaction pathways is the dominant one.
4.3.4 Catalyst Characterisation and Recycling Studies
Figure 4.5 shows the TEM micrographs and particle size distribution determined for 300
particles. As can be seen all catalysts have particles in the size range of 1-8 nm with a
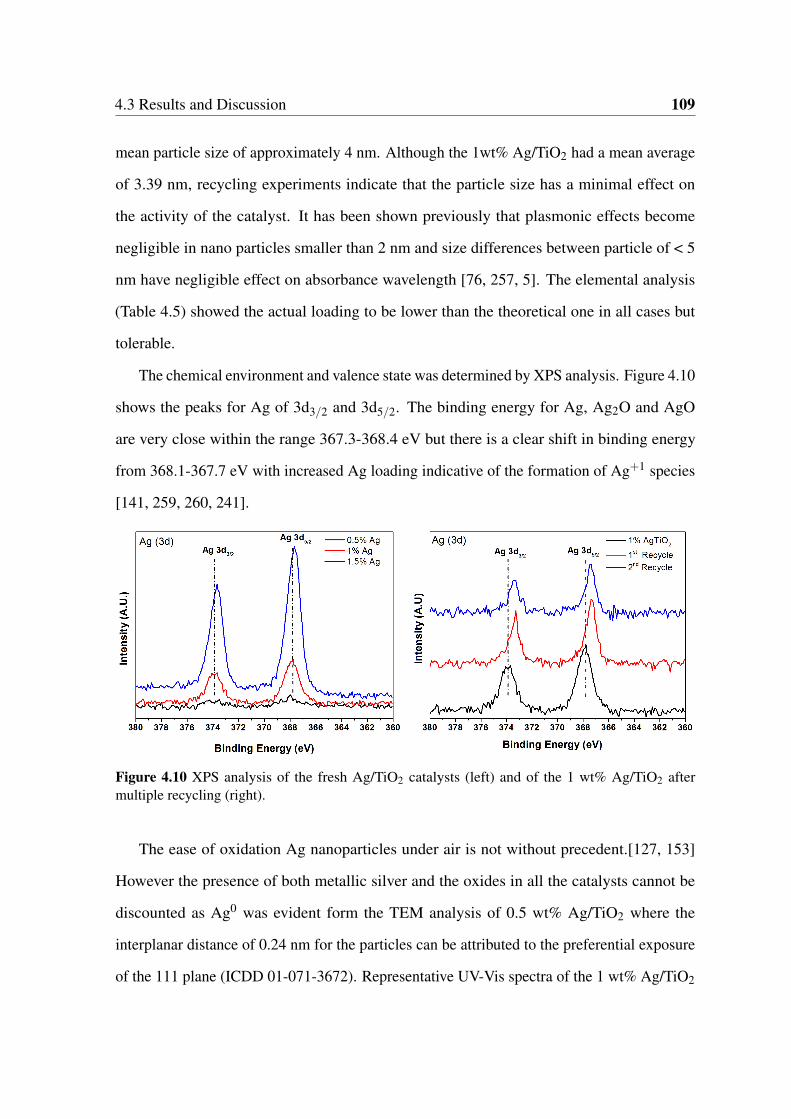
4.3 Results and Discussion 109
mean particle size of approximately 4 nm. Although the 1wt% Ag/TiO2 had a mean average
of 3.39 nm, recycling experiments indicate that the particle size has a minimal effect on
the activity of the catalyst. It has been shown previously that plasmonic effects become
negligible in nano particles smaller than 2 nm and size differences between particle of < 5
nm have negligible effect on absorbance wavelength [76, 257, 5]. The elemental analysis
(Table 4.5) showed the actual loading to be lower than the theoretical one in all cases but
tolerable.
The chemical environment and valence state was determined by XPS analysis. Figure 4.10
shows the peaks for Ag of 3d3/2 and 3d5/2. The binding energy for Ag, Ag2O and AgO
are very close within the range 367.3-368.4 eV but there is a clear shift in binding energy
from 368.1-367.7 eV with increased Ag loading indicative of the formation of Ag+1 species
[141, 259, 260, 241].
Figure 4.10 XPS analysis of the fresh Ag/TiO2 catalysts (left) and of the 1 wt% Ag/TiO2 aftermultiple recycling (right).
The ease of oxidation Ag nanoparticles under air is not without precedent.[127, 153]
However the presence of both metallic silver and the oxides in all the catalysts cannot be
discounted as Ag0 was evident form the TEM analysis of 0.5 wt% Ag/TiO2 where the
interplanar distance of 0.24 nm for the particles can be attributed to the preferential exposure
of the 111 plane (ICDD 01-071-3672). Representative UV-Vis spectra of the 1 wt% Ag/TiO2
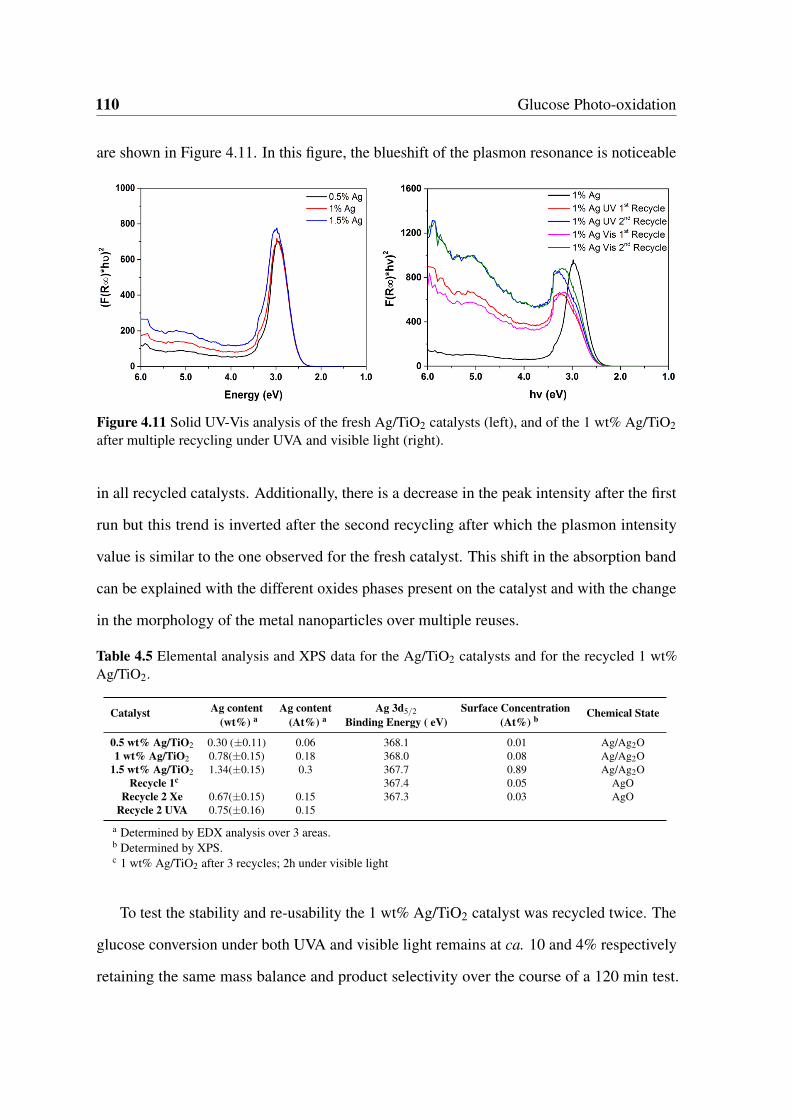
110 Glucose Photo-oxidation
are shown in Figure 4.11. In this figure, the blueshift of the plasmon resonance is noticeable
Figure 4.11 Solid UV-Vis analysis of the fresh Ag/TiO2 catalysts (left), and of the 1 wt% Ag/TiO2after multiple recycling under UVA and visible light (right).
in all recycled catalysts. Additionally, there is a decrease in the peak intensity after the first
run but this trend is inverted after the second recycling after which the plasmon intensity
value is similar to the one observed for the fresh catalyst. This shift in the absorption band
can be explained with the different oxides phases present on the catalyst and with the change
in the morphology of the metal nanoparticles over multiple reuses.
Table 4.5 Elemental analysis and XPS data for the Ag/TiO2 catalysts and for the recycled 1 wt%Ag/TiO2.
Catalyst Ag content Ag content Ag 3d5/2 Surface Concentration Chemical State(wt%) a (At%) a Binding Energy ( eV) (At%) b
0.5 wt% Ag/TiO2 0.30 (±0.11) 0.06 368.1 0.01 Ag/Ag2O1 wt% Ag/TiO2 0.78(±0.15) 0.18 368.0 0.08 Ag/Ag2O
1.5 wt% Ag/TiO2 1.34(±0.15) 0.3 367.7 0.89 Ag/Ag2ORecycle 1c 367.4 0.05 AgO
Recycle 2 Xe 0.67(±0.15) 0.15 367.3 0.03 AgORecycle 2 UVA 0.75(±0.16) 0.15
a Determined by EDX analysis over 3 areas.b Determined by XPS.c 1 wt% Ag/TiO2 after 3 recycles; 2h under visible light
To test the stability and re-usability the 1 wt% Ag/TiO2 catalyst was recycled twice. The
glucose conversion under both UVA and visible light remains at ca. 10 and 4% respectively
retaining the same mass balance and product selectivity over the course of a 120 min test.
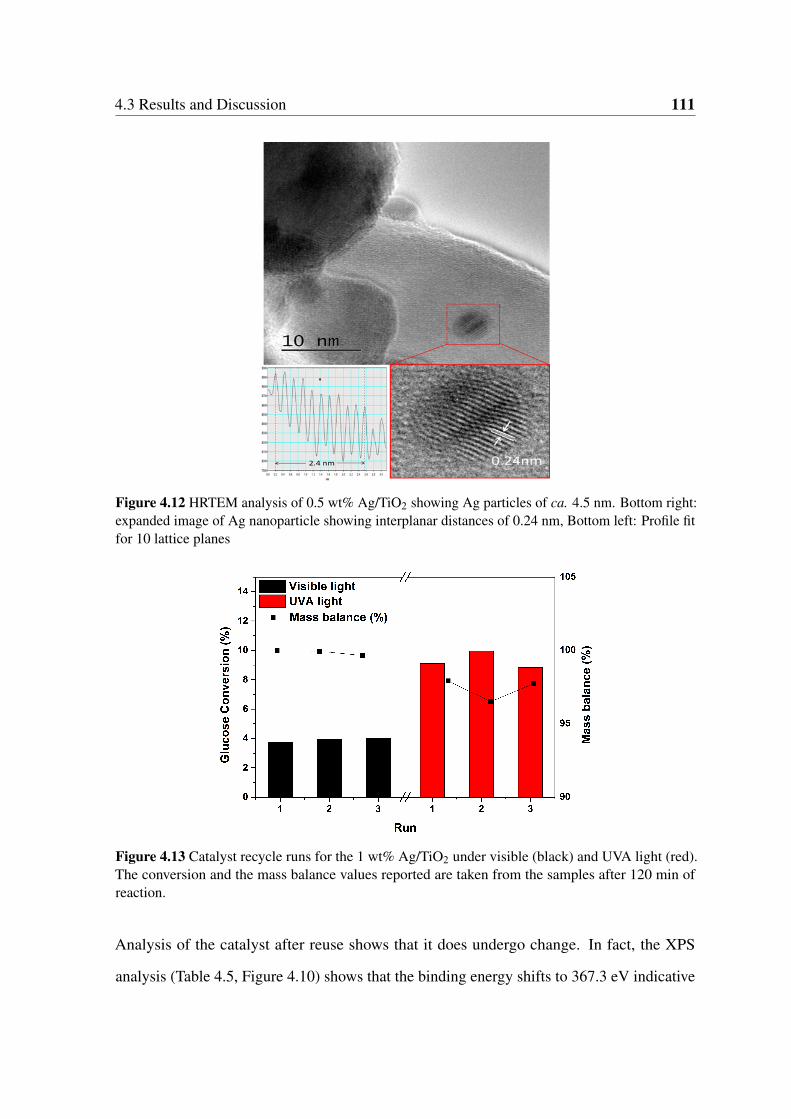
4.3 Results and Discussion 111
Figure 4.12 HRTEM analysis of 0.5 wt% Ag/TiO2 showing Ag particles of ca. 4.5 nm. Bottom right:expanded image of Ag nanoparticle showing interplanar distances of 0.24 nm, Bottom left: Profile fitfor 10 lattice planes
Figure 4.13 Catalyst recycle runs for the 1 wt% Ag/TiO2 under visible (black) and UVA light (red).The conversion and the mass balance values reported are taken from the samples after 120 min ofreaction.
Analysis of the catalyst after reuse shows that it does undergo change. In fact, the XPS
analysis (Table 4.5, Figure 4.10) shows that the binding energy shifts to 367.3 eV indicative
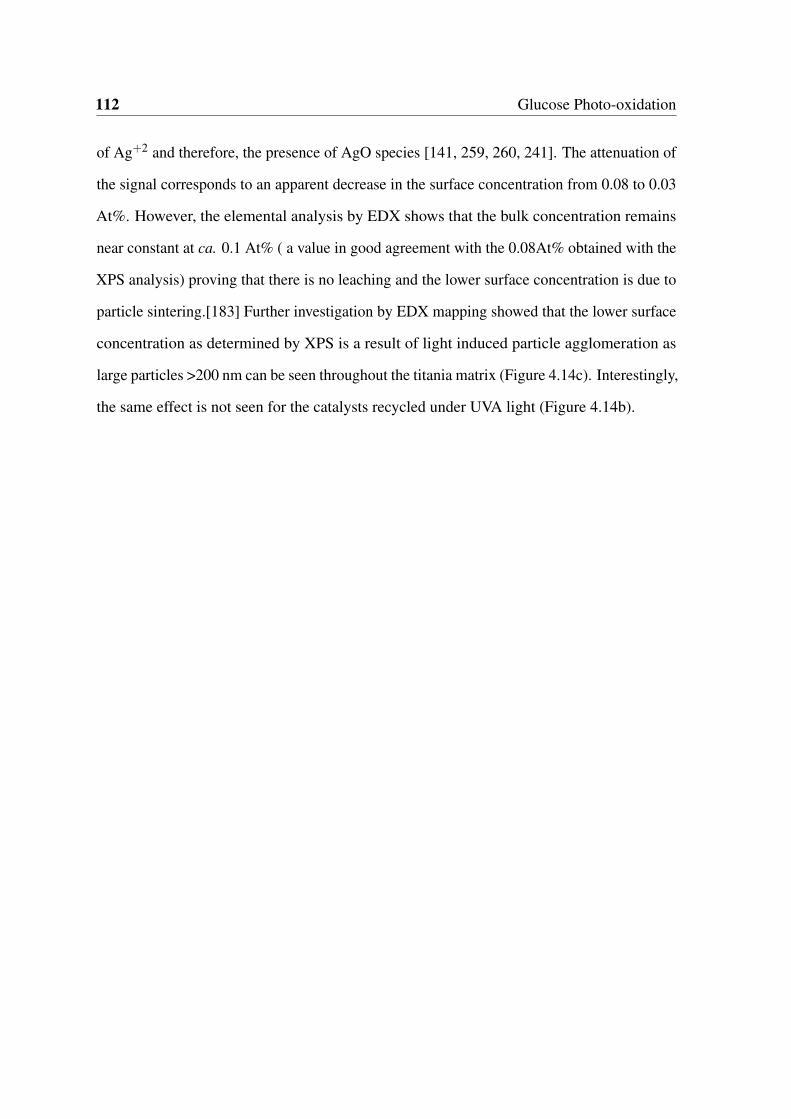
112 Glucose Photo-oxidation
of Ag+2 and therefore, the presence of AgO species [141, 259, 260, 241]. The attenuation of
the signal corresponds to an apparent decrease in the surface concentration from 0.08 to 0.03
At%. However, the elemental analysis by EDX shows that the bulk concentration remains
near constant at ca. 0.1 At% ( a value in good agreement with the 0.08At% obtained with the
XPS analysis) proving that there is no leaching and the lower surface concentration is due to
particle sintering.[183] Further investigation by EDX mapping showed that the lower surface
concentration as determined by XPS is a result of light induced particle agglomeration as
large particles >200 nm can be seen throughout the titania matrix (Figure 4.14c). Interestingly,
the same effect is not seen for the catalysts recycled under UVA light (Figure 4.14b).
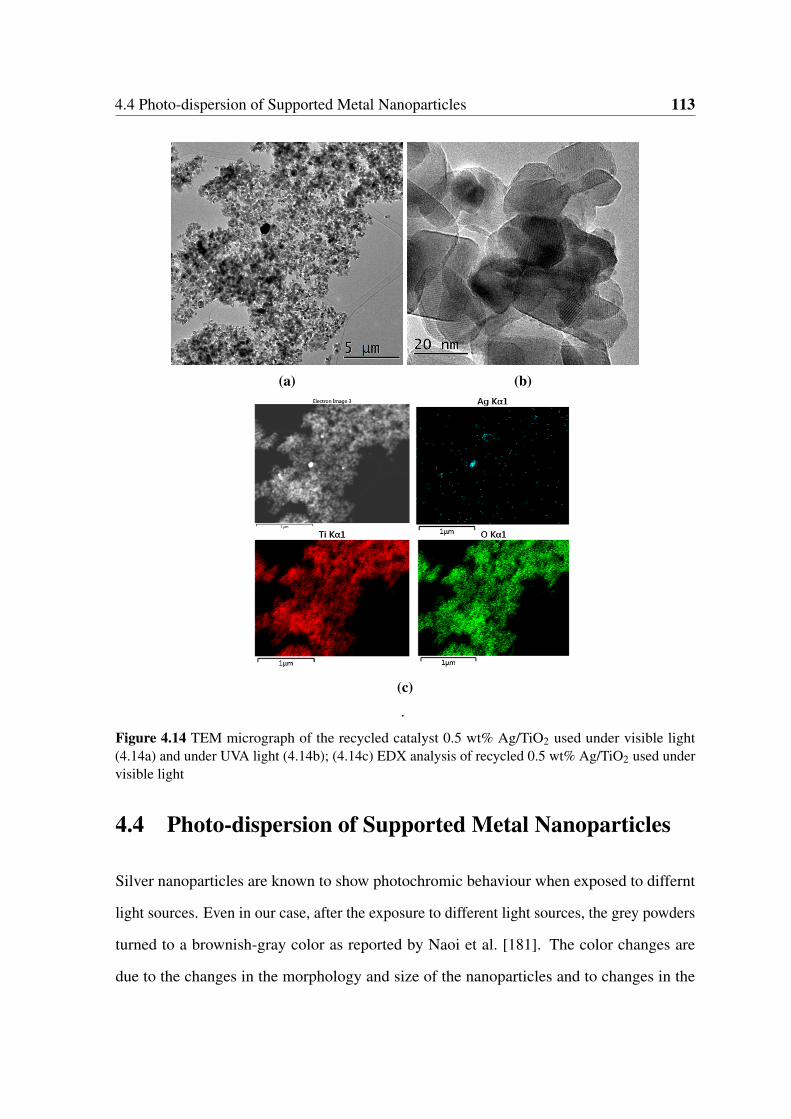
4.4 Photo-dispersion of Supported Metal Nanoparticles 113
(a) (b)
(c)
.
Figure 4.14 TEM micrograph of the recycled catalyst 0.5 wt% Ag/TiO2 used under visible light(4.14a) and under UVA light (4.14b); (4.14c) EDX analysis of recycled 0.5 wt% Ag/TiO2 used undervisible light
4.4 Photo-dispersion of Supported Metal Nanoparticles
Silver nanoparticles are known to show photochromic behaviour when exposed to differnt
light sources. Even in our case, after the exposure to different light sources, the grey powders
turned to a brownish-gray color as reported by Naoi et al. [181]. The color changes are
due to the changes in the morphology and size of the nanoparticles and to changes in the
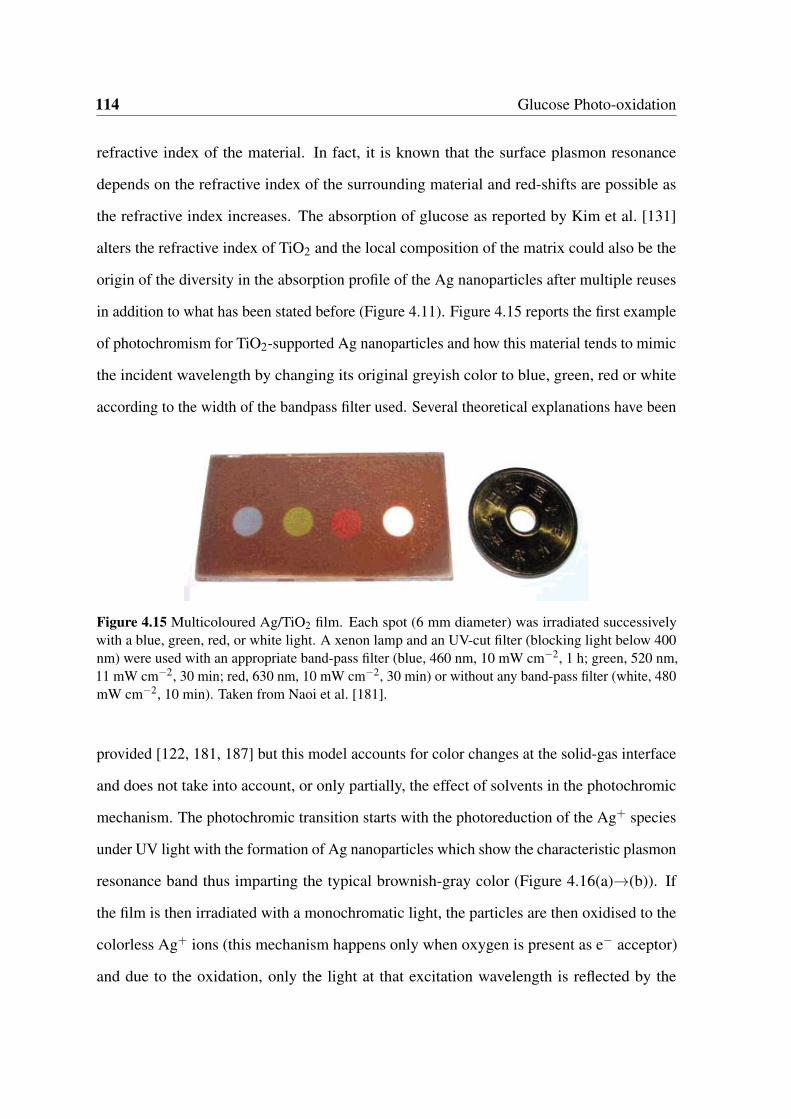
114 Glucose Photo-oxidation
refractive index of the material. In fact, it is known that the surface plasmon resonance
depends on the refractive index of the surrounding material and red-shifts are possible as
the refractive index increases. The absorption of glucose as reported by Kim et al. [131]
alters the refractive index of TiO2 and the local composition of the matrix could also be the
origin of the diversity in the absorption profile of the Ag nanoparticles after multiple reuses
in addition to what has been stated before (Figure 4.11). Figure 4.15 reports the first example
of photochromism for TiO2-supported Ag nanoparticles and how this material tends to mimic
the incident wavelength by changing its original greyish color to blue, green, red or white
according to the width of the bandpass filter used. Several theoretical explanations have been
Figure 4.15 Multicoloured Ag/TiO2 film. Each spot (6 mm diameter) was irradiated successivelywith a blue, green, red, or white light. A xenon lamp and an UV-cut filter (blocking light below 400nm) were used with an appropriate band-pass filter (blue, 460 nm, 10 mW cm−2, 1 h; green, 520 nm,11 mW cm−2, 30 min; red, 630 nm, 10 mW cm−2, 30 min) or without any band-pass filter (white, 480mW cm−2, 10 min). Taken from Naoi et al. [181].
provided [122, 181, 187] but this model accounts for color changes at the solid-gas interface
and does not take into account, or only partially, the effect of solvents in the photochromic
mechanism. The photochromic transition starts with the photoreduction of the Ag+ species
under UV light with the formation of Ag nanoparticles which show the characteristic plasmon
resonance band thus imparting the typical brownish-gray color (Figure 4.16(a)→(b)). If
the film is then irradiated with a monochromatic light, the particles are then oxidised to the
colorless Ag+ ions (this mechanism happens only when oxygen is present as e− acceptor)
and due to the oxidation, only the light at that excitation wavelength is reflected by the
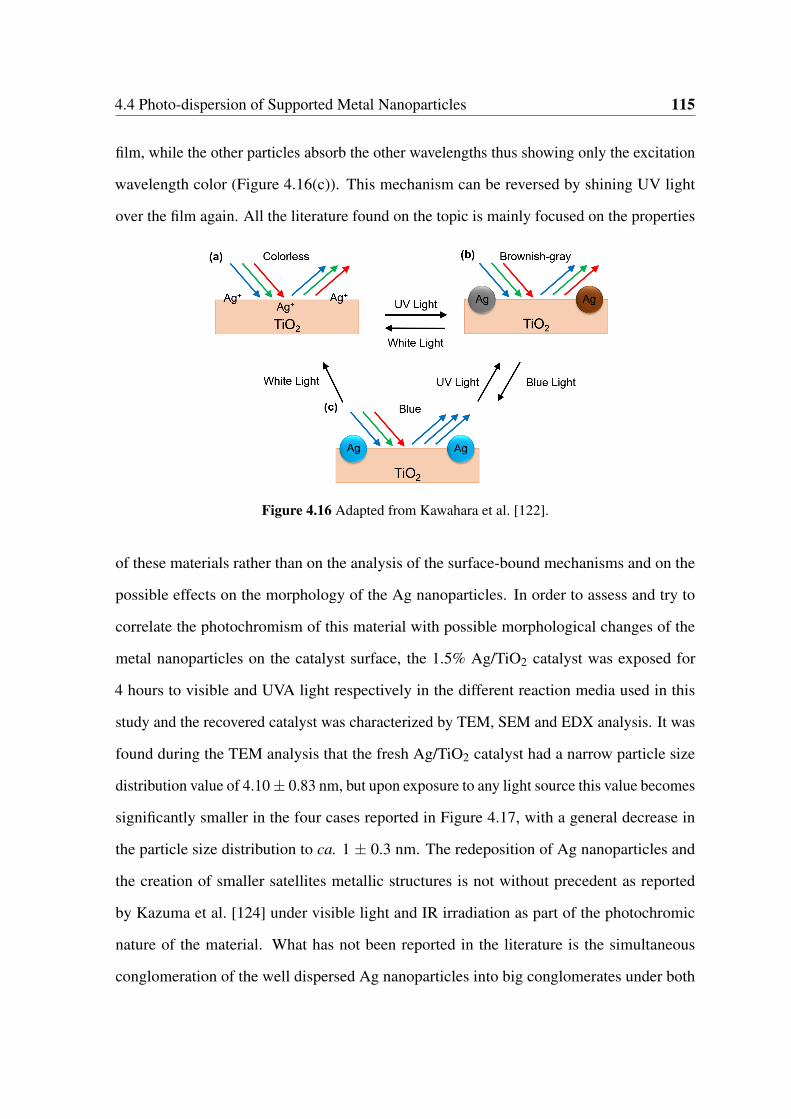
4.4 Photo-dispersion of Supported Metal Nanoparticles 115
film, while the other particles absorb the other wavelengths thus showing only the excitation
wavelength color (Figure 4.16(c)). This mechanism can be reversed by shining UV light
over the film again. All the literature found on the topic is mainly focused on the properties
Figure 4.16 Adapted from Kawahara et al. [122].
of these materials rather than on the analysis of the surface-bound mechanisms and on the
possible effects on the morphology of the Ag nanoparticles. In order to assess and try to
correlate the photochromism of this material with possible morphological changes of the
metal nanoparticles on the catalyst surface, the 1.5% Ag/TiO2 catalyst was exposed for
4 hours to visible and UVA light respectively in the different reaction media used in this
study and the recovered catalyst was characterized by TEM, SEM and EDX analysis. It was
found during the TEM analysis that the fresh Ag/TiO2 catalyst had a narrow particle size
distribution value of 4.10 ± 0.83 nm, but upon exposure to any light source this value becomes
significantly smaller in the four cases reported in Figure 4.17, with a general decrease in
the particle size distribution to ca. 1 ± 0.3 nm. The redeposition of Ag nanoparticles and
the creation of smaller satellites metallic structures is not without precedent as reported
by Kazuma et al. [124] under visible light and IR irradiation as part of the photochromic
nature of the material. What has not been reported in the literature is the simultaneous
conglomeration of the well dispersed Ag nanoparticles into big conglomerates under both

116 Glucose Photo-oxidation
UVA and visible light. In fact, Figure 4.19 shows the effect of the incident irradiation on
the redistribution and conglomeration of the supported nanoparticles in different reaction
media. It can be seen how under UVA light the conglomeration produces particles up to
60 nm in size, whilst under visible light particles up to 500 nm were observed with a much
larger particle size distribution value (Appendix E.1). This "photo-sintering" mechanism
can be explained considering the different excitation mechanisms happening under UVA
and visible light. It is known that upon visible light irradiation, the LSPR frequency also
produces localised hotspots which are used to provide heat in microreactors for ethanol
steam reforming. The heat produced during the excitation of Au nanoparticles with a low
power laser is sufficient to vaporize the fluid without excessive heating of the immediate
surroundings or the need to preheat the reactants feed [3]. Huang et al. [108] recently showed
that Ag nanoparticles behave similarly and can be superheated upon irradiation with laser
pulses, and in this case, Ag nanoparticles were supported on a Si wafer and irradiated with
femtolaser pulses and it was found that the particles rearranged in bigger structures after
10000 pulses (10 s). The LSPR was sufficient to overheat the Ag particles above their melting
point and due to the strong electric fields present during the excitation process [185] particles
in close proximity could conglomerate in bigger structures [154, 151, 22]. The 1.5 wt%
Ag/TiO2 catalyst used in this study Figure 4.5(c) showed really good particle size distribution
and dispersion values before exposure to any light source, therefore the two mechanisms
described above are likely to happen simultaneously upon visible light irradiation and cause
this redistribution-conglomeration dualism. Under UVA light the presence of the intraband
transitions do not cause overheating of the metal nanoparticles, but the presence of electric
field at the Schottky metal-support interface might cause the conglomeration of the particles
but at a lesser extent as seen in Figure 4.19.
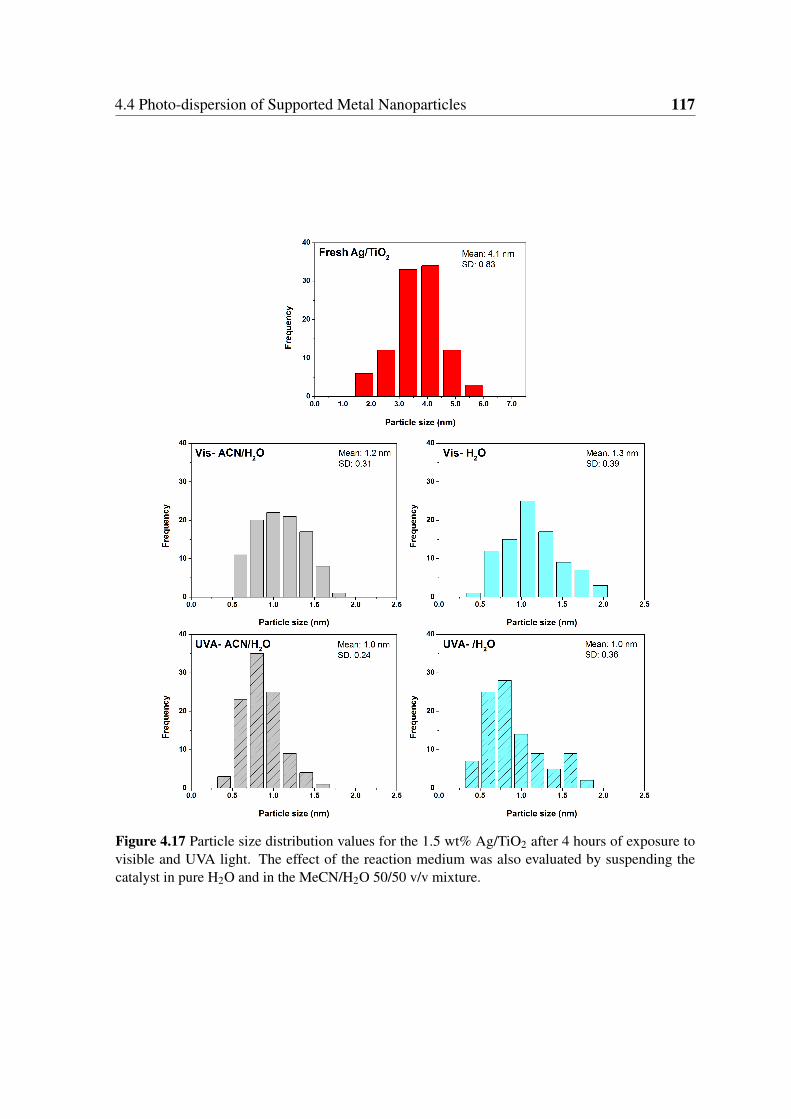
4.4 Photo-dispersion of Supported Metal Nanoparticles 117
Figure 4.17 Particle size distribution values for the 1.5 wt% Ag/TiO2 after 4 hours of exposure tovisible and UVA light. The effect of the reaction medium was also evaluated by suspending thecatalyst in pure H2O and in the MeCN/H2O 50/50 v/v mixture.
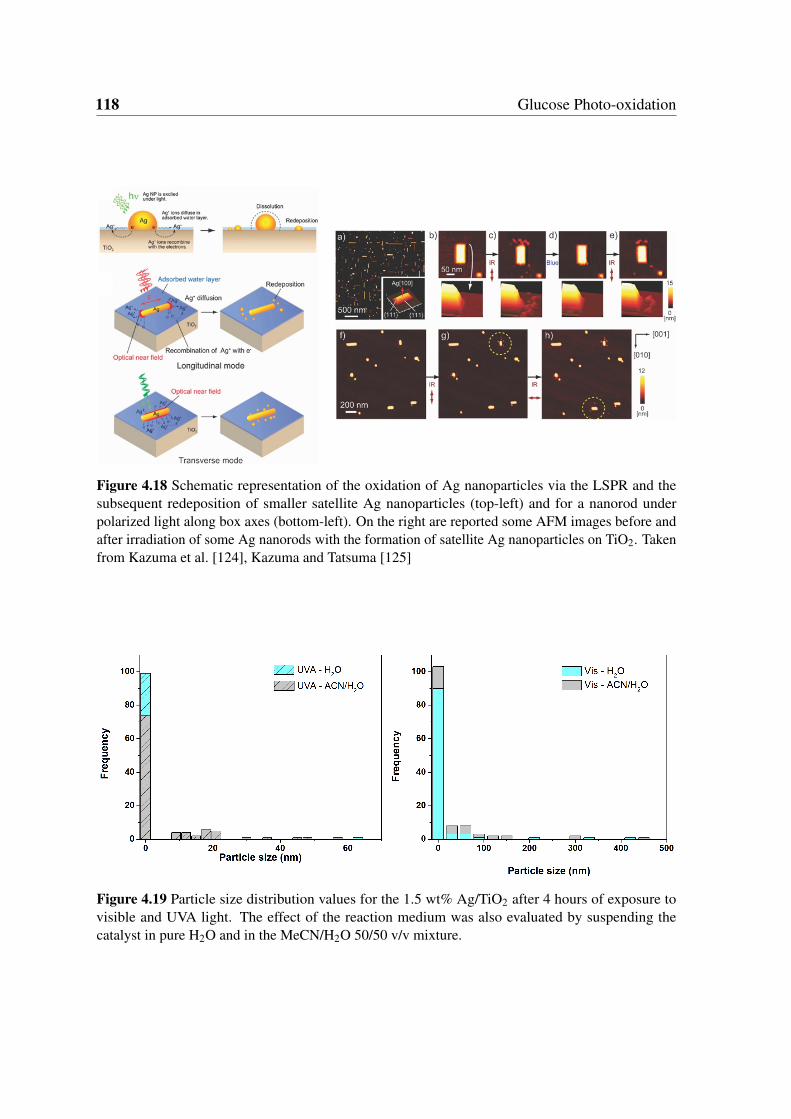
118 Glucose Photo-oxidation
Figure 4.18 Schematic representation of the oxidation of Ag nanoparticles via the LSPR and thesubsequent redeposition of smaller satellite Ag nanoparticles (top-left) and for a nanorod underpolarized light along box axes (bottom-left). On the right are reported some AFM images before andafter irradiation of some Ag nanorods with the formation of satellite Ag nanoparticles on TiO2. Takenfrom Kazuma et al. [124], Kazuma and Tatsuma [125]
Figure 4.19 Particle size distribution values for the 1.5 wt% Ag/TiO2 after 4 hours of exposure tovisible and UVA light. The effect of the reaction medium was also evaluated by suspending thecatalyst in pure H2O and in the MeCN/H2O 50/50 v/v mixture.
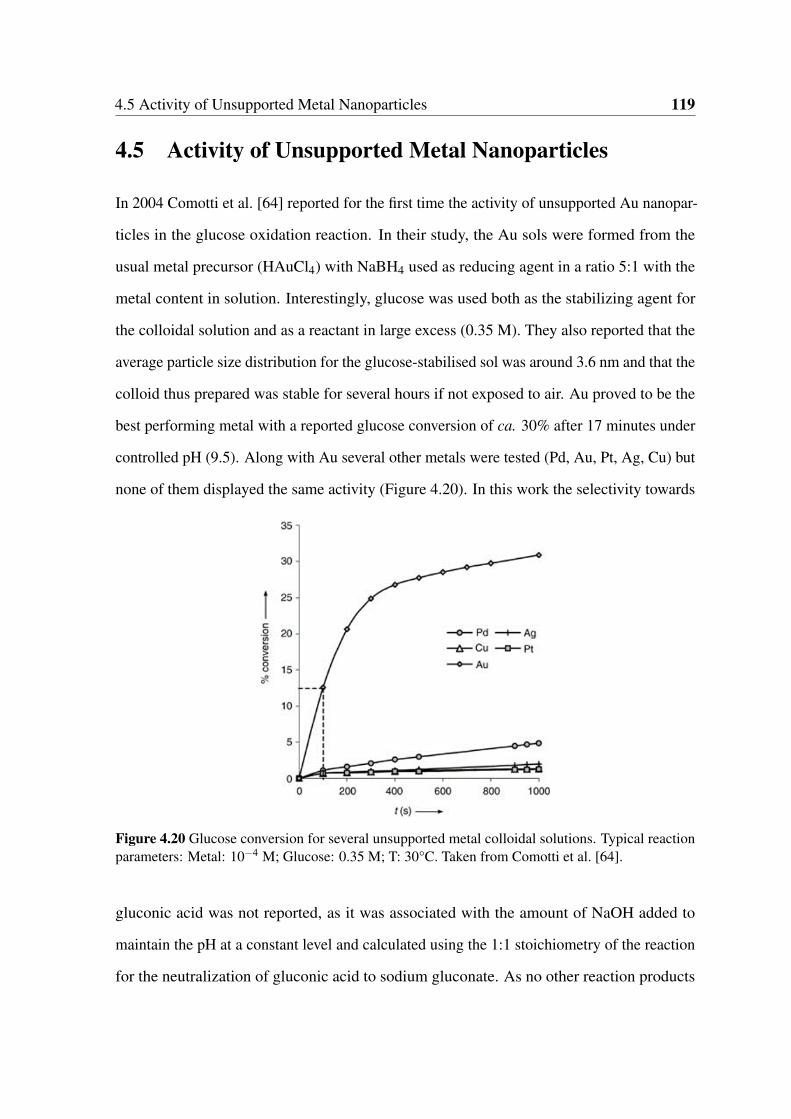
4.5 Activity of Unsupported Metal Nanoparticles 119
4.5 Activity of Unsupported Metal Nanoparticles
In 2004 Comotti et al. [64] reported for the first time the activity of unsupported Au nanopar-
ticles in the glucose oxidation reaction. In their study, the Au sols were formed from the
usual metal precursor (HAuCl4) with NaBH4 used as reducing agent in a ratio 5:1 with the
metal content in solution. Interestingly, glucose was used both as the stabilizing agent for
the colloidal solution and as a reactant in large excess (0.35 M). They also reported that the
average particle size distribution for the glucose-stabilised sol was around 3.6 nm and that the
colloid thus prepared was stable for several hours if not exposed to air. Au proved to be the
best performing metal with a reported glucose conversion of ca. 30% after 17 minutes under
controlled pH (9.5). Along with Au several other metals were tested (Pd, Au, Pt, Ag, Cu) but
none of them displayed the same activity (Figure 4.20). In this work the selectivity towards
Figure 4.20 Glucose conversion for several unsupported metal colloidal solutions. Typical reactionparameters: Metal: 10−4 M; Glucose: 0.35 M; T: 30°C. Taken from Comotti et al. [64].
gluconic acid was not reported, as it was associated with the amount of NaOH added to
maintain the pH at a constant level and calculated using the 1:1 stoichiometry of the reaction
for the neutralization of gluconic acid to sodium gluconate. As no other reaction products
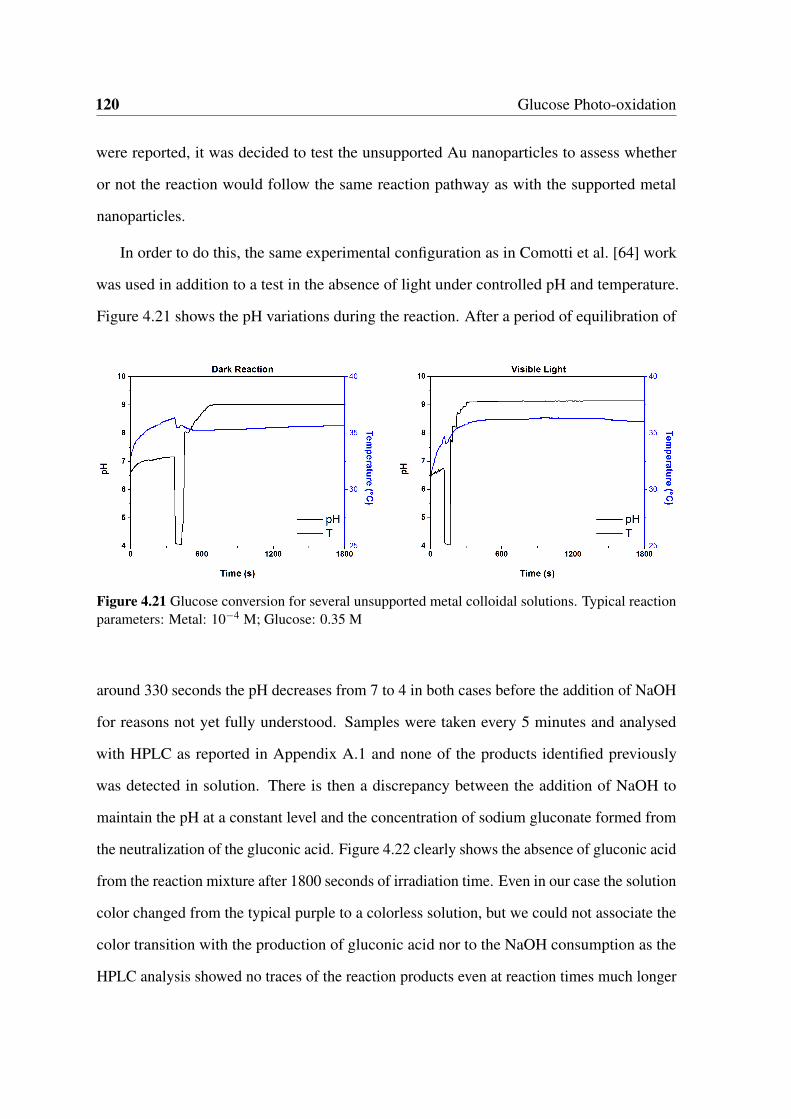
120 Glucose Photo-oxidation
were reported, it was decided to test the unsupported Au nanoparticles to assess whether
or not the reaction would follow the same reaction pathway as with the supported metal
nanoparticles.
In order to do this, the same experimental configuration as in Comotti et al. [64] work
was used in addition to a test in the absence of light under controlled pH and temperature.
Figure 4.21 shows the pH variations during the reaction. After a period of equilibration of
Figure 4.21 Glucose conversion for several unsupported metal colloidal solutions. Typical reactionparameters: Metal: 10−4 M; Glucose: 0.35 M
around 330 seconds the pH decreases from 7 to 4 in both cases before the addition of NaOH
for reasons not yet fully understood. Samples were taken every 5 minutes and analysed
with HPLC as reported in Appendix A.1 and none of the products identified previously
was detected in solution. There is then a discrepancy between the addition of NaOH to
maintain the pH at a constant level and the concentration of sodium gluconate formed from
the neutralization of the gluconic acid. Figure 4.22 clearly shows the absence of gluconic acid
from the reaction mixture after 1800 seconds of irradiation time. Even in our case the solution
color changed from the typical purple to a colorless solution, but we could not associate the
color transition with the production of gluconic acid nor to the NaOH consumption as the
HPLC analysis showed no traces of the reaction products even at reaction times much longer

4.5 Activity of Unsupported Metal Nanoparticles 121
Figure 4.22 Representative chromatograms acquired at 210 nm at the beginning of the reaction andafter 1800 seconds.
than those reported by Comotti et al. [64]. From these results the activity of Au sols appears
to be controversial and will have to be investigated further in the future.
122 Glucose Photo-oxidation
4.6 Conclusions
After the optimization of the operational parameters described in the previous chapter, the
aim of this part of the work was to focus on ameliorating the activity of the catalyst by
supporting metal nanoparticles on the surface of the semiconductor. With the addition of
Ag nanoparticles the catalyst activity improved substantially under UVA and visible light
showing better performances than the 1wt% Au/TiO2 catalyst used as a comparison. On the
other hand, the negligible activity of Au unsupported nanoparticles testifies the importance
of the metal-semiconductor-substrate interactions. In fact, with the FTIR analysis, which
confirmed the presence on the catalyst surface of multiple adsorbed species, it was possible
to draw a global reaction mechanism (Scheme 4.4) to account for the presence of all the
reaction products formed during the photocatalytic process. By recycling the catalyst it
was possible to analyse the morphological changes of the metal nanoparticles and correlate
these variations with the catalytic activity of the different materials. Ag/TiO2 proved to
be a really good catalyst for this reaction, but unfortunately its excitation wavelength in
the range 390-410 nm limits its application as it excludes most of the visible part of the
spectrum. Therefore, a different approach is needed to try and harvest visible light at different
wavelengths simultaneously in order to maximise the efficiency of the process. The analysis
of the reactivity on a simple carbohydrate such as glucose with the monometallic Ag/TiO2
catalyst will prove to be fundamental in the understanding of the results obtained with
cellobiose in the next chapter.
Chapter 5Cellobiose Photo-oxidation
What light?
E. Blues
5.1 Introduction
The thorough investigation of the reaction conditions in Chapter 3 on the oxidation of glucose
to a gluconic acid intermediate led us to investigate the effect of the presence of metal
nanoparticles on the TiO2 surface and their effect on the product distribution (Chapter 4).
The consistent results obtained coupled with a robust analytical system, allowed us to
use cellobiose, a more complex substrate, in order to understand the chemical reactivity
of this disaccharide and assess the different reactivity if compared with a simple glucose
molecule. This bottom up approach is useful to gradually impart more complexity to the
system without neglecting any of the important factors which influence photochemical
reactions. Gold, silver, copper and other noble metals on a nanometric scale, exhibit the
extraordinary property of responding upon light excitation with a charge transfer mechanism
which activates molecules that are adsorbed on the surface or that are in close proximity
to the metal nanoparticles itself. This mechanism is well known in the literature and it
124 Cellobiose Photo-oxidation
is currently used to degrade organic pollutants at room temperature and at atmospheric
pressure. Specifically, gold nanoparticles are being studied for the oxidation of different
substrates, such as alcohols, aldehydes and various hydrocarbons with promising results.
On the other hand, photocatalysis by nanoparticles and semi-conductor oxides continues to
receive attention due to its efficiency at converting solar energy to useful chemical energy
resulting in mild reaction conditions, and a high intrinsic activity for the conversion of
different substrates. A review by Colmenares and Luque [58] highlights the advances in
photocatalytic processes as a result of the continual requirement for environmentally friendly
methods for pollution abatement, hydrogen generation and the transformation of renewable
feedstock to higher value intermediates. In fact, heterogeneous photocatalysts have been
used in water splitting processes, water-air purification, artificial photosynthesis and many
more. Herein, we report the first example of the photo-catalysed selective oxidation and
hydrolysis of the model compound cellobiose along with evidence for the radical cleavage of
β -1,4 glycosidic bond. Cellobiose can be cleaved via photocatalytic reaction under visible
light to yield glucose and other smaller chain monosaccherides. Crucially, the mineralisation
pathway that leads to formation of CO2 and H2 is suppressed resulting in the formation of
valuable organic products.
5.2 Results and Discussion
5.2.1 Catalytic Testing
The catalyst were tested as described in Section 2.9, with the Luzchem Photoreactor equipped
with UVA lamps and with the 300 W Xenon lamp equipped with visible light filters (Ap-
pendix 2.8). The different reactors configurations allowed us to apply the same rationale
in the reaction design used in the previous chapters when glucose activity was investigated
(Chapters 3 and 4).
5.2 Results and Discussion 125
5.2.2 Identification of the Reaction Pathway Using HPLC-QTOF
The identification of the main reactions involved in the photo-oxidation of glucose described
in Section 4.3.3, proved to be extremely useful in the identification of the cellobiose photo-
oxidation reaction pathway. It is known that disaccharides have different hole-scavenging
properties than simple sugars and therefore, some differences in their reactivity are to be
expected.
The main difficulty in determining the reaction pathway was the identification of the
intermediates and reactions products as for some of them, there are no commercially available
standards or reference materials. For this reason cellobionic acid had to be synthesised and
purified following the procedure reported in Appendix B.1.
The identification of the key intermediates and reaction products was performed using
HPLC-QTOF (Section 2.7.2) and the method developed in Appendix A.2. With the applica-
tion of mass spectrometry techniques it was possible to identify, deconvolute, and isolate from
the chromatographic peaks the main species and reconstruct the reaction mechanism from the
TOL data. Initially, pure cellobiose and cellobiosan at known concentration were solubilized
in water and the total ion chromatograms (TIC) were recorded for each of the standards
considered. Figure 5.1 shows the TIC chromatograms for the three standards considered and
shows the level of chromatographic separation obtained. Because every molecule fragments
differently during the QTOF analysis, it was possible to gather data on the fingerprint of each
of the species produced by analysing their fragmentation patterns and take these into account
to avoid possible misinterpretation of the mass spectra. Table 5.1 shows the main fragments
originated during the analysis along with the relative abundances and the difference between
the theoretical mass and the measured one for each specific ion. The difference in ppm
expresses the accuracy of the instrument in measuring the mass against the theoretical value.
By combining the data from the mass spectrometry it was possible to identify 4 possible
reaction pathway for the oxidation of cellobiose and the formation of lower carbon chain
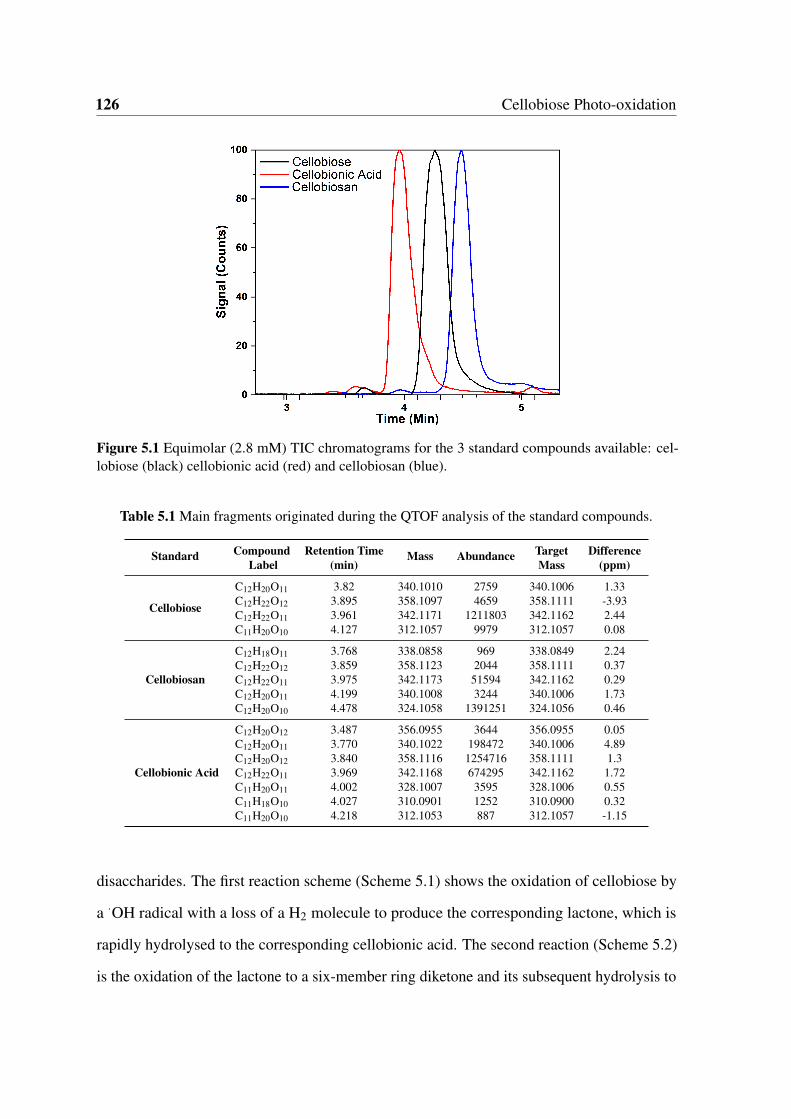
126 Cellobiose Photo-oxidation
Figure 5.1 Equimolar (2.8 mM) TIC chromatograms for the 3 standard compounds available: cel-lobiose (black) cellobionic acid (red) and cellobiosan (blue).
Table 5.1 Main fragments originated during the QTOF analysis of the standard compounds.
Standard Compound Retention Time Mass Abundance Target DifferenceLabel (min) Mass (ppm)
Cellobiose
C12H20O11 3.82 340.1010 2759 340.1006 1.33C12H22O12 3.895 358.1097 4659 358.1111 -3.93C12H22O11 3.961 342.1171 1211803 342.1162 2.44C11H20O10 4.127 312.1057 9979 312.1057 0.08
Cellobiosan
C12H18O11 3.768 338.0858 969 338.0849 2.24C12H22O12 3.859 358.1123 2044 358.1111 0.37C12H22O11 3.975 342.1173 51594 342.1162 0.29C12H20O11 4.199 340.1008 3244 340.1006 1.73C12H20O10 4.478 324.1058 1391251 324.1056 0.46
Cellobionic Acid
C12H20O12 3.487 356.0955 3644 356.0955 0.05C12H20O11 3.770 340.1022 198472 340.1006 4.89C12H20O12 3.840 358.1116 1254716 358.1111 1.3C12H22O11 3.969 342.1168 674295 342.1162 1.72C11H20O11 4.002 328.1007 3595 328.1006 0.55C11H18O10 4.027 310.0901 1252 310.0900 0.32C11H20O10 4.218 312.1053 887 312.1057 -1.15
disaccharides. The first reaction scheme (Scheme 5.1) shows the oxidation of cellobiose by
a ·OH radical with a loss of a H2 molecule to produce the corresponding lactone, which is
rapidly hydrolysed to the corresponding cellobionic acid. The second reaction (Scheme 5.2)
is the oxidation of the lactone to a six-member ring diketone and its subsequent hydrolysis to
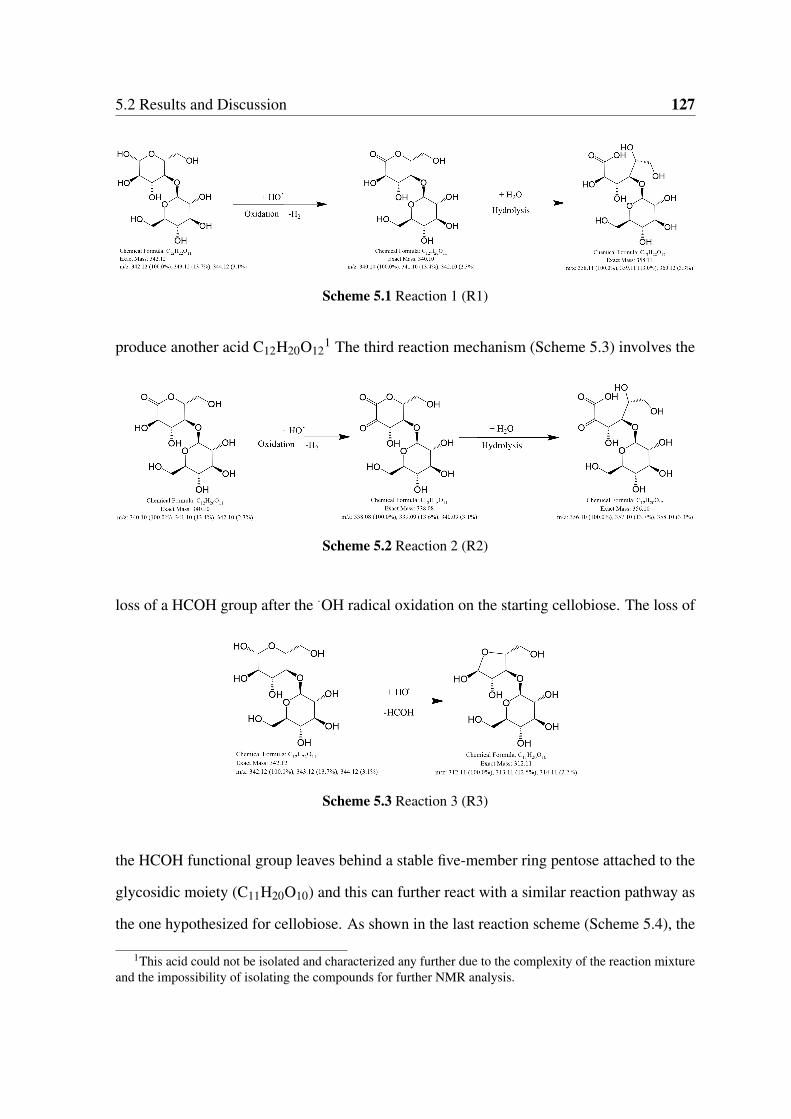
5.2 Results and Discussion 127
Scheme 5.1 Reaction 1 (R1)
produce another acid C12H20O121 The third reaction mechanism (Scheme 5.3) involves the
Scheme 5.2 Reaction 2 (R2)
loss of a HCOH group after the ·OH radical oxidation on the starting cellobiose. The loss of
Scheme 5.3 Reaction 3 (R3)
the HCOH functional group leaves behind a stable five-member ring pentose attached to the
glycosidic moiety (C11H20O10) and this can further react with a similar reaction pathway as
the one hypothesized for cellobiose. As shown in the last reaction scheme (Scheme 5.4), the
1This acid could not be isolated and characterized any further due to the complexity of the reaction mixtureand the impossibility of isolating the compounds for further NMR analysis.
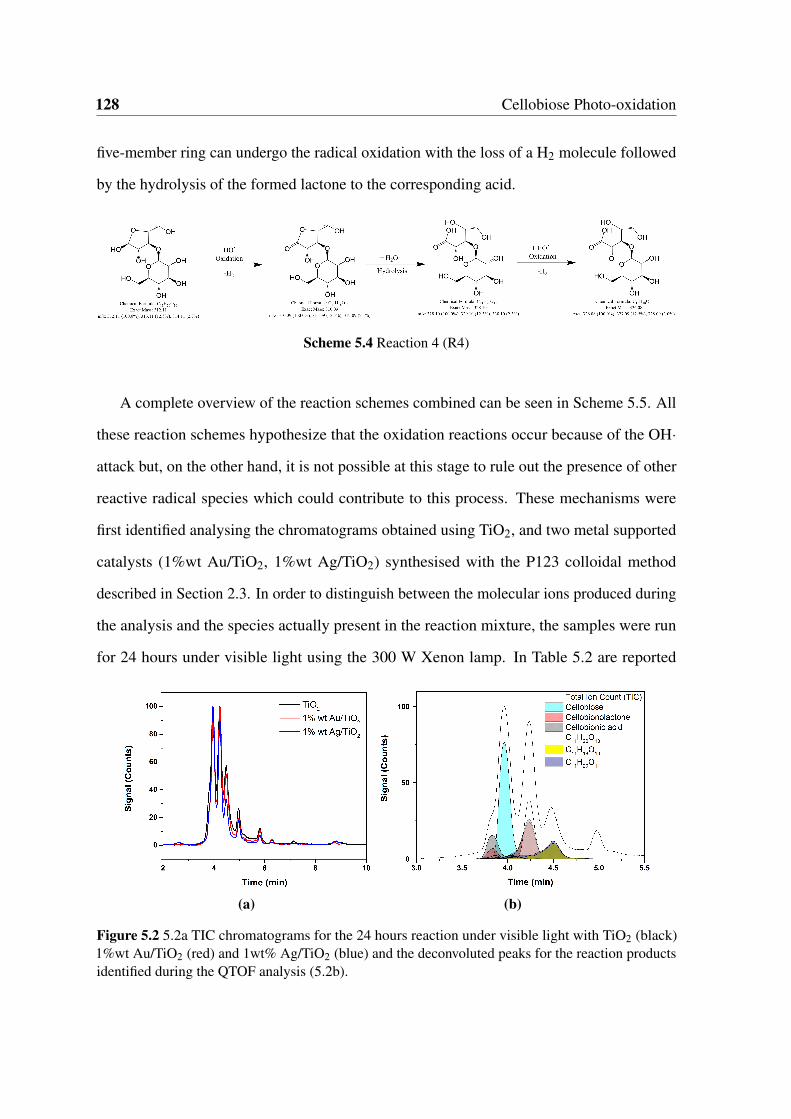
128 Cellobiose Photo-oxidation
five-member ring can undergo the radical oxidation with the loss of a H2 molecule followed
by the hydrolysis of the formed lactone to the corresponding acid.
Scheme 5.4 Reaction 4 (R4)
A complete overview of the reaction schemes combined can be seen in Scheme 5.5. All
these reaction schemes hypothesize that the oxidation reactions occur because of the OH·
attack but, on the other hand, it is not possible at this stage to rule out the presence of other
reactive radical species which could contribute to this process. These mechanisms were
first identified analysing the chromatograms obtained using TiO2, and two metal supported
catalysts (1%wt Au/TiO2, 1%wt Ag/TiO2) synthesised with the P123 colloidal method
described in Section 2.3. In order to distinguish between the molecular ions produced during
the analysis and the species actually present in the reaction mixture, the samples were run
for 24 hours under visible light using the 300 W Xenon lamp. In Table 5.2 are reported
(a) (b)
Figure 5.2 5.2a TIC chromatograms for the 24 hours reaction under visible light with TiO2 (black)1%wt Au/TiO2 (red) and 1wt% Ag/TiO2 (blue) and the deconvoluted peaks for the reaction productsidentified during the QTOF analysis (5.2b).
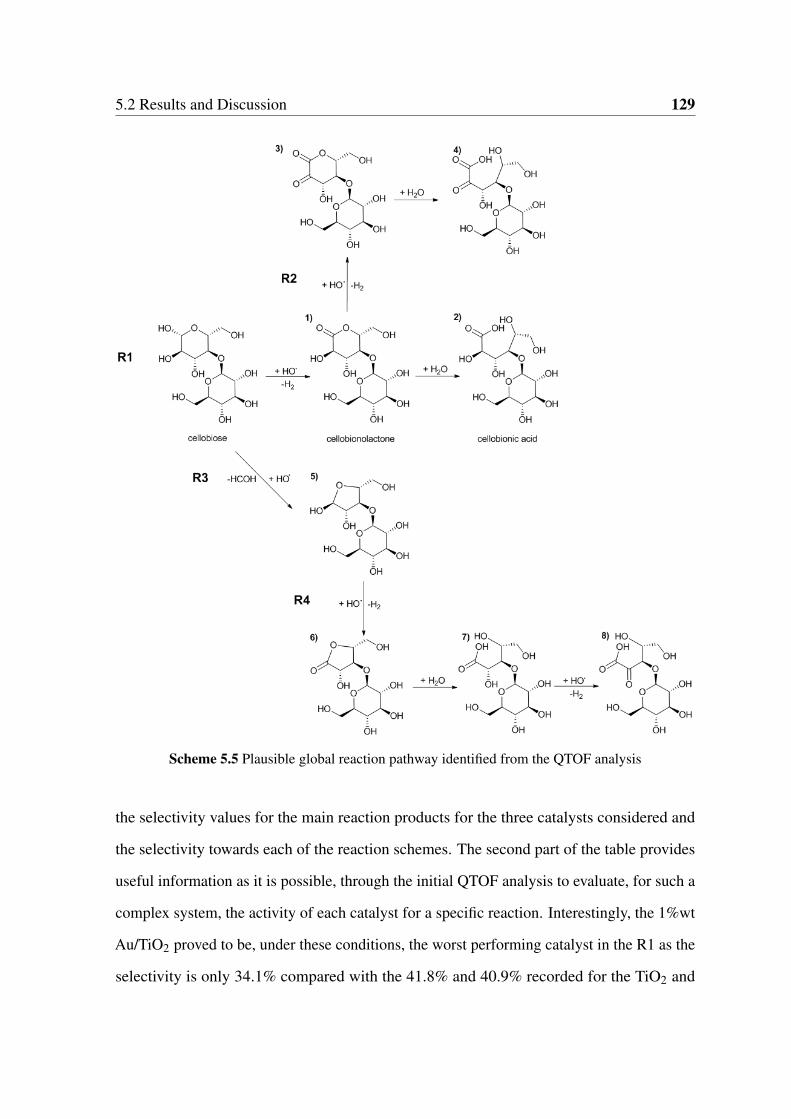
5.2 Results and Discussion 129
Scheme 5.5 Plausible global reaction pathway identified from the QTOF analysis
the selectivity values for the main reaction products for the three catalysts considered and
the selectivity towards each of the reaction schemes. The second part of the table provides
useful information as it is possible, through the initial QTOF analysis to evaluate, for such a
complex system, the activity of each catalyst for a specific reaction. Interestingly, the 1%wt
Au/TiO2 proved to be, under these conditions, the worst performing catalyst in the R1 as the
selectivity is only 34.1% compared with the 41.8% and 40.9% recorded for the TiO2 and
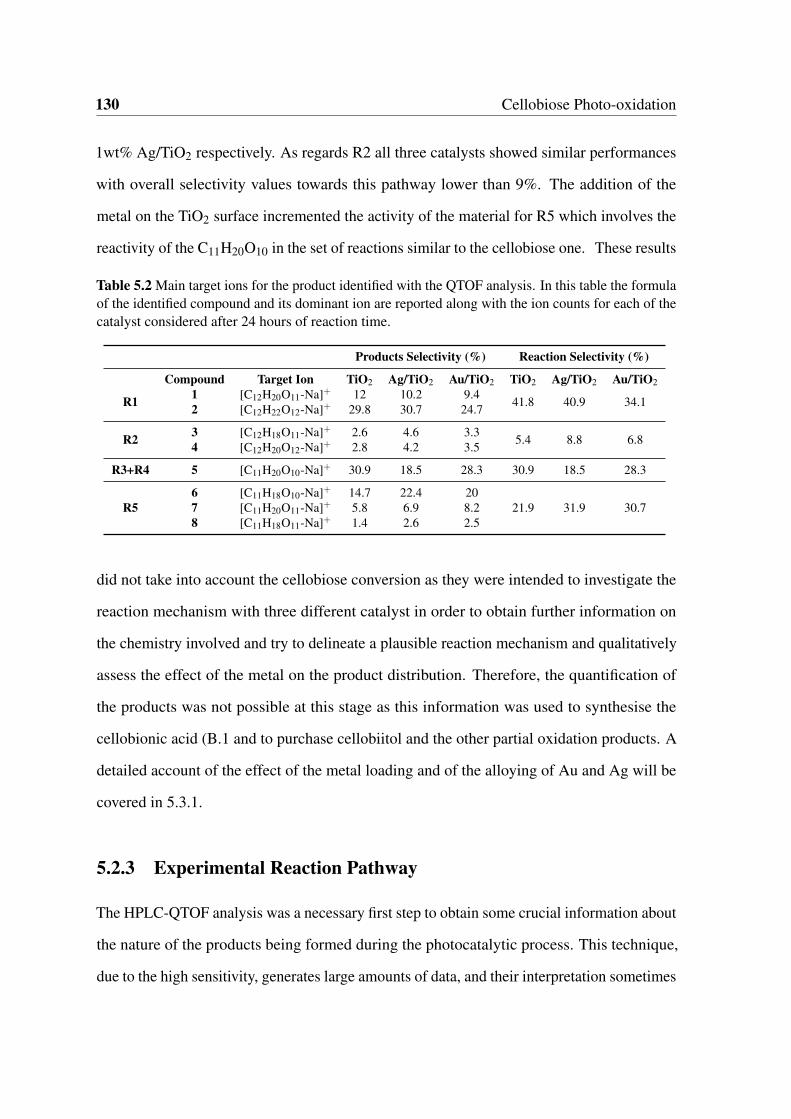
130 Cellobiose Photo-oxidation
1wt% Ag/TiO2 respectively. As regards R2 all three catalysts showed similar performances
with overall selectivity values towards this pathway lower than 9%. The addition of the
metal on the TiO2 surface incremented the activity of the material for R5 which involves the
reactivity of the C11H20O10 in the set of reactions similar to the cellobiose one. These results
Table 5.2 Main target ions for the product identified with the QTOF analysis. In this table the formulaof the identified compound and its dominant ion are reported along with the ion counts for each of thecatalyst considered after 24 hours of reaction time.
Products Selectivity (%) Reaction Selectivity (%)
Compound Target Ion TiO2 Ag/TiO2 Au/TiO2 TiO2 Ag/TiO2 Au/TiO2
R1 1 [C12H20O11-Na]+ 12 10.2 9.4 41.8 40.9 34.12 [C12H22O12-Na]+ 29.8 30.7 24.7
R2 3 [C12H18O11-Na]+ 2.6 4.6 3.3 5.4 8.8 6.84 [C12H20O12-Na]+ 2.8 4.2 3.5
R3+R4 5 [C11H20O10-Na]+ 30.9 18.5 28.3 30.9 18.5 28.3
R56 [C11H18O10-Na]+ 14.7 22.4 20
21.9 31.9 30.77 [C11H20O11-Na]+ 5.8 6.9 8.28 [C11H18O11-Na]+ 1.4 2.6 2.5
did not take into account the cellobiose conversion as they were intended to investigate the
reaction mechanism with three different catalyst in order to obtain further information on
the chemistry involved and try to delineate a plausible reaction mechanism and qualitatively
assess the effect of the metal on the product distribution. Therefore, the quantification of
the products was not possible at this stage as this information was used to synthesise the
cellobionic acid (B.1 and to purchase cellobiitol and the other partial oxidation products. A
detailed account of the effect of the metal loading and of the alloying of Au and Ag will be
covered in 5.3.1.
5.2.3 Experimental Reaction Pathway
The HPLC-QTOF analysis was a necessary first step to obtain some crucial information about
the nature of the products being formed during the photocatalytic process. This technique,
due to the high sensitivity, generates large amounts of data, and their interpretation sometimes
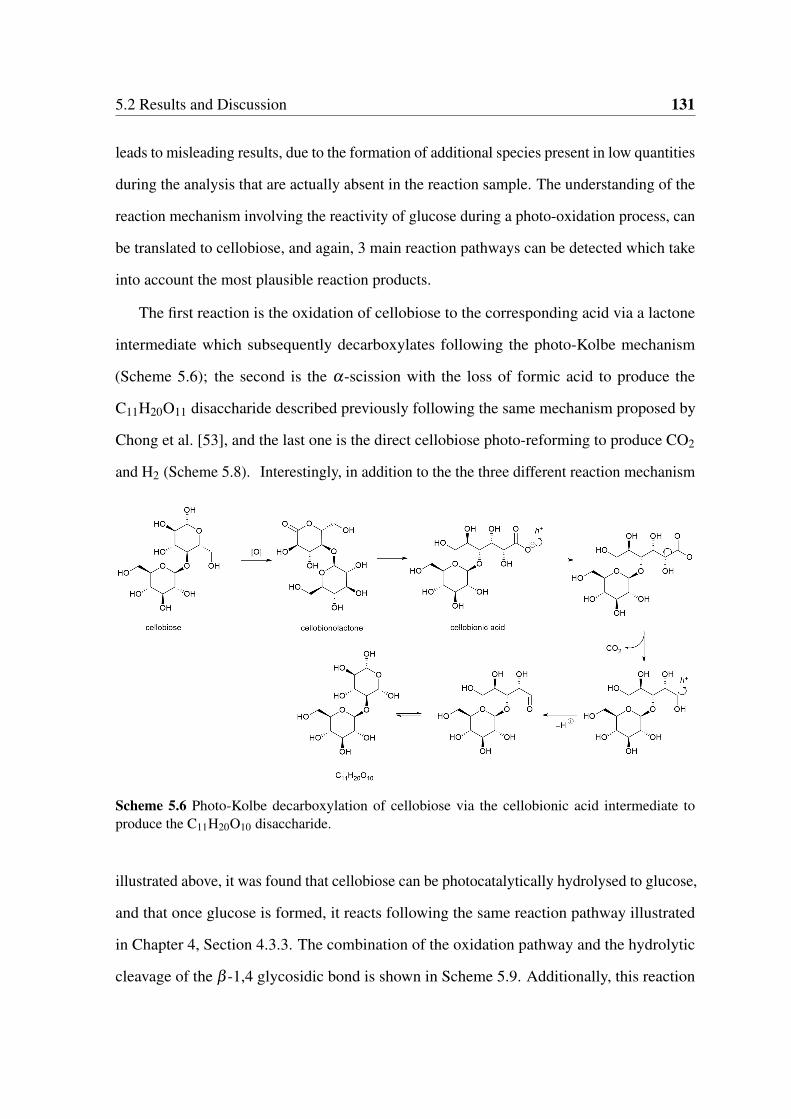
5.2 Results and Discussion 131
leads to misleading results, due to the formation of additional species present in low quantities
during the analysis that are actually absent in the reaction sample. The understanding of the
reaction mechanism involving the reactivity of glucose during a photo-oxidation process, can
be translated to cellobiose, and again, 3 main reaction pathways can be detected which take
into account the most plausible reaction products.
The first reaction is the oxidation of cellobiose to the corresponding acid via a lactone
intermediate which subsequently decarboxylates following the photo-Kolbe mechanism
(Scheme 5.6); the second is the α-scission with the loss of formic acid to produce the
C11H20O11 disaccharide described previously following the same mechanism proposed by
Chong et al. [53], and the last one is the direct cellobiose photo-reforming to produce CO2
and H2 (Scheme 5.8). Interestingly, in addition to the the three different reaction mechanism
Scheme 5.6 Photo-Kolbe decarboxylation of cellobiose via the cellobionic acid intermediate toproduce the C11H20O10 disaccharide.
illustrated above, it was found that cellobiose can be photocatalytically hydrolysed to glucose,
and that once glucose is formed, it reacts following the same reaction pathway illustrated
in Chapter 4, Section 4.3.3. The combination of the oxidation pathway and the hydrolytic
cleavage of the β -1,4 glycosidic bond is shown in Scheme 5.9. Additionally, this reaction
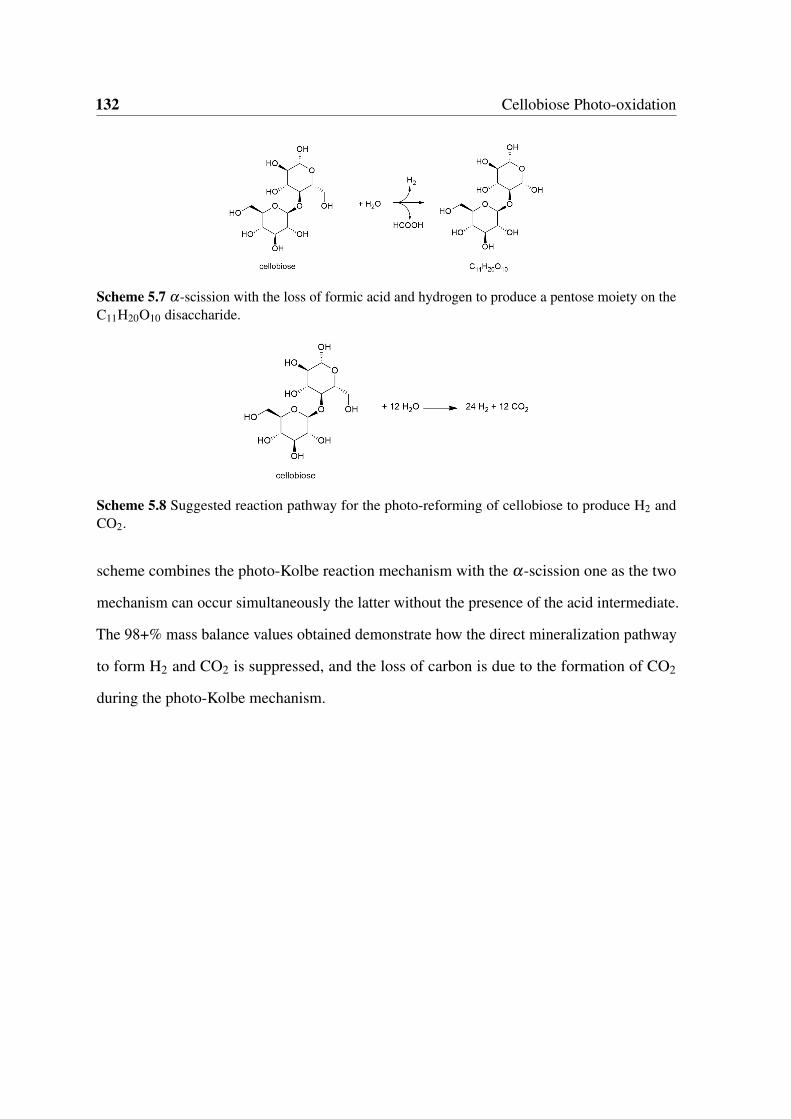
132 Cellobiose Photo-oxidation
Scheme 5.7 α-scission with the loss of formic acid and hydrogen to produce a pentose moiety on theC11H20O10 disaccharide.
Scheme 5.8 Suggested reaction pathway for the photo-reforming of cellobiose to produce H2 andCO2.
scheme combines the photo-Kolbe reaction mechanism with the α-scission one as the two
mechanism can occur simultaneously the latter without the presence of the acid intermediate.
The 98+% mass balance values obtained demonstrate how the direct mineralization pathway
to form H2 and CO2 is suppressed, and the loss of carbon is due to the formation of CO2
during the photo-Kolbe mechanism.
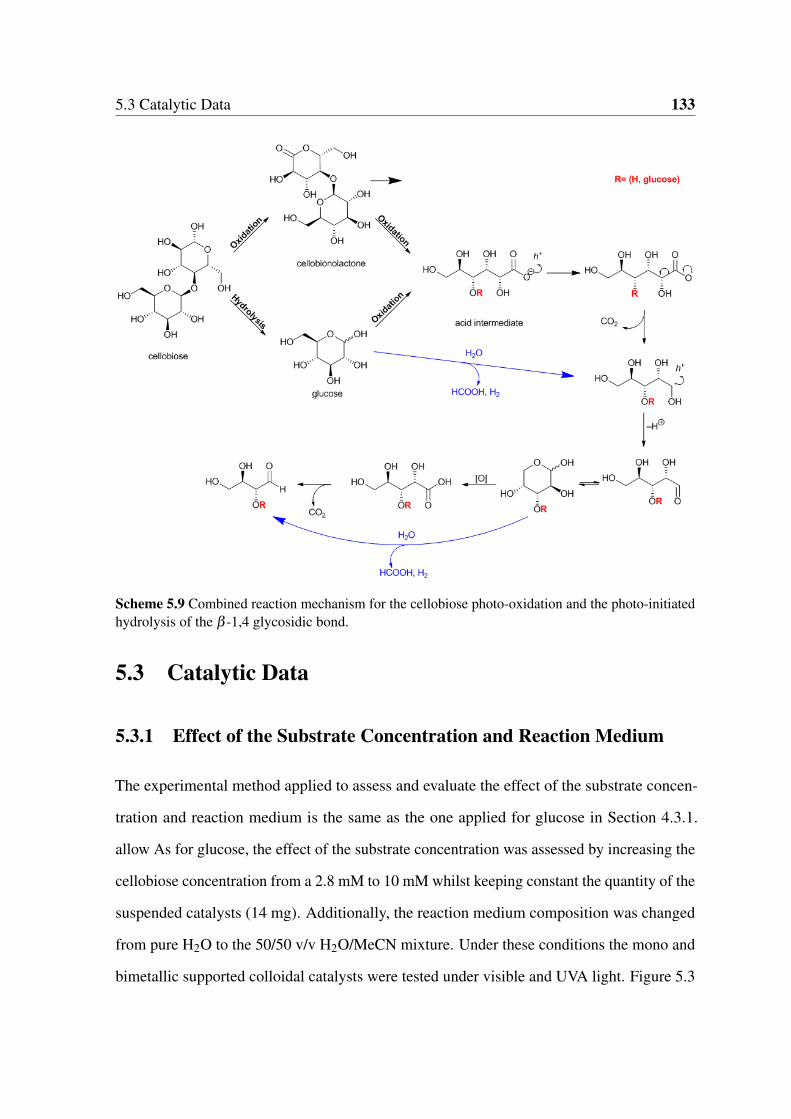
5.3 Catalytic Data 133
Scheme 5.9 Combined reaction mechanism for the cellobiose photo-oxidation and the photo-initiatedhydrolysis of the β -1,4 glycosidic bond.
5.3 Catalytic Data
5.3.1 Effect of the Substrate Concentration and Reaction Medium
The experimental method applied to assess and evaluate the effect of the substrate concen-
tration and reaction medium is the same as the one applied for glucose in Section 4.3.1.
allow As for glucose, the effect of the substrate concentration was assessed by increasing the
cellobiose concentration from a 2.8 mM to 10 mM whilst keeping constant the quantity of the
suspended catalysts (14 mg). Additionally, the reaction medium composition was changed
from pure H2O to the 50/50 v/v H2O/MeCN mixture. Under these conditions the mono and
bimetallic supported colloidal catalysts were tested under visible and UVA light. Figure 5.3
134 Cellobiose Photo-oxidation
reports the product distribution values obtained for the 2.8 mM cellobiose solution. It is clear
from the four bar charts how the reaction medium affects the product distribution values.
In fact, cellobionic acid is the primary reaction product when H2O is used with selectivity
generally being between 45 and 65% for both visible and UVA light.
Interestingly, with just water as a solvent, gluconic acid is produced under both UV
and visible light but is absent when the H2O/MeCN mixture is used. In this case, due
to the higher photoactivity of the material and the effect of the acetonitrile in solution,
gluconic acid is not only a product of the hydrolytic cleavage of the β -1,4 glycosidic bond
but it is also a reagent in the photo-Kolbe reaction pathway and it quickly reacts under
these conditions to form arabinose, erythrose, glyceraldehyde and formic acid as previously
reported (Chapter 4). The hydrolytic step does not seem to occur under visible light irradiation
as only the cellobiose oxidation products are detected with overall selectivity values between
70 and 75% with formic acid being the third major product after the C11H20O10 disaccharide.
This indicates that for the 2.8 mM cellobiose solution, the preferred reaction pathway under
visible light in the H2O/MeCN mixture is the α-scission of cellobiose with the production
of formic acid and a lower carbon chain disaccharide (Scheme 5.7), whilst under the more
aggressive UVA irradiation, the reactions are driven further with the formation of gluconic
acid as a short lived intermediate which rapidly reacts to produce shorter carbon chain
carbohydrates. When the substrate concentration is increased to 10 mM the (Figure 5.4)
cellobionic acid selectivity increases for both the H2O and the H2O/MeCN mixture between
40-55% and 55-50% respectively. In this case, unlike for the 2.8 mM solution, gluconic
acid can be found in both systems, but the photoactivity of the material is not sufficient to
start the photo-Kolbe mechanism under visible light. In fact none of the products originated
from this reaction is observed under these conditions. Under UVA light the differences
between the different catalysts considered are not so evident as, generally, cellobionic acid
is the primary oxidation product along with the C11H20O10 which together make up for
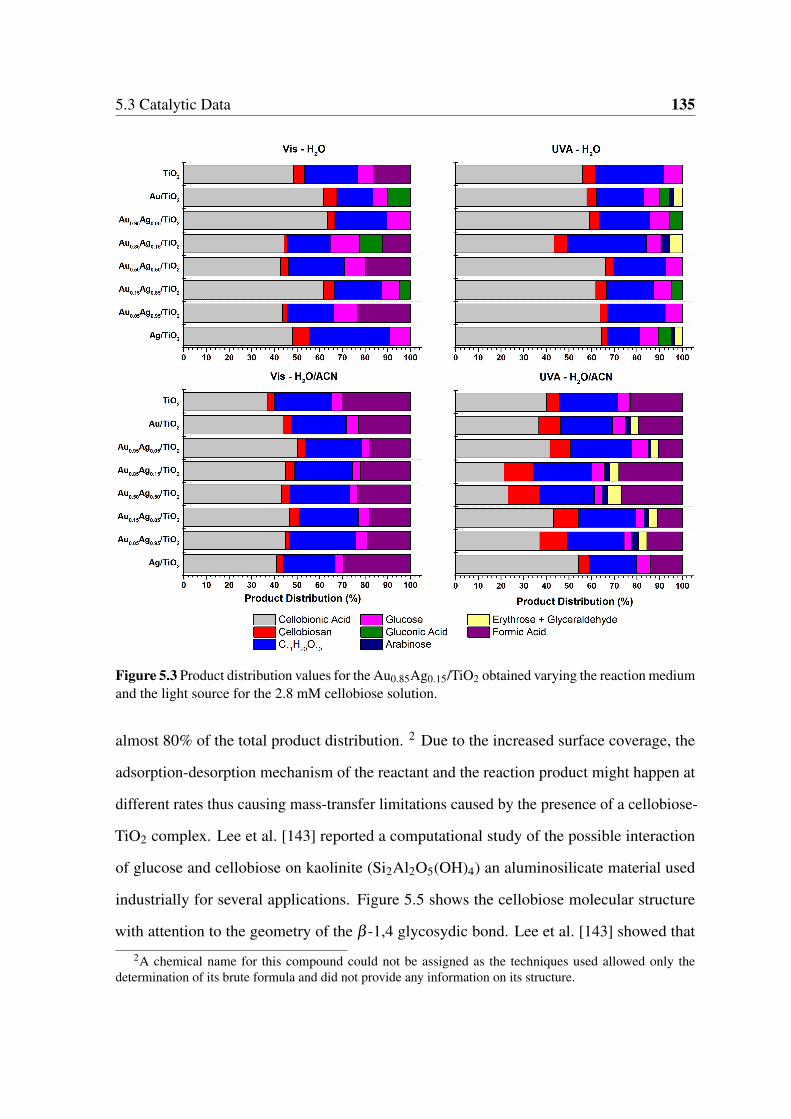
5.3 Catalytic Data 135
Figure 5.3 Product distribution values for the Au0.85Ag0.15/TiO2 obtained varying the reaction mediumand the light source for the 2.8 mM cellobiose solution.
almost 80% of the total product distribution. 2 Due to the increased surface coverage, the
adsorption-desorption mechanism of the reactant and the reaction product might happen at
different rates thus causing mass-transfer limitations caused by the presence of a cellobiose-
TiO2 complex. Lee et al. [143] reported a computational study of the possible interaction
of glucose and cellobiose on kaolinite (Si2Al2O5(OH)4) an aluminosilicate material used
industrially for several applications. Figure 5.5 shows the cellobiose molecular structure
with attention to the geometry of the β -1,4 glycosydic bond. Lee et al. [143] showed that
2A chemical name for this compound could not be assigned as the techniques used allowed only thedetermination of its brute formula and did not provide any information on its structure.
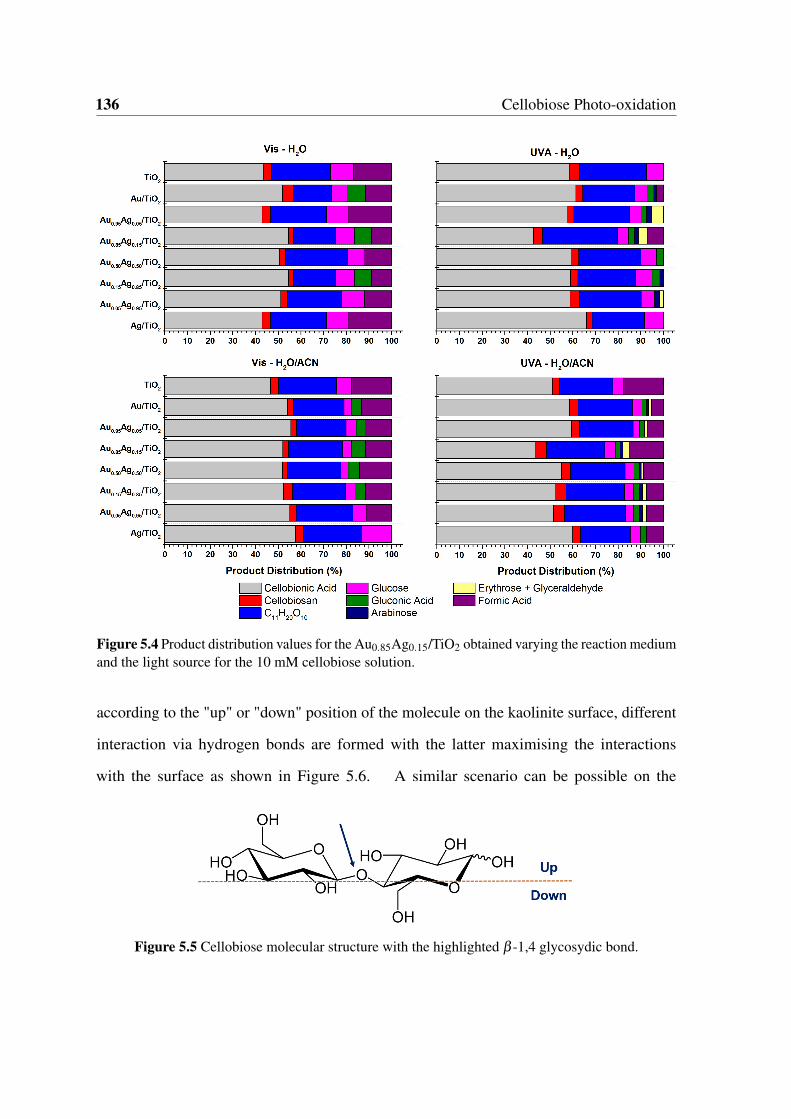
136 Cellobiose Photo-oxidation
Figure 5.4 Product distribution values for the Au0.85Ag0.15/TiO2 obtained varying the reaction mediumand the light source for the 10 mM cellobiose solution.
according to the "up" or "down" position of the molecule on the kaolinite surface, different
interaction via hydrogen bonds are formed with the latter maximising the interactions
with the surface as shown in Figure 5.6. A similar scenario can be possible on the
Figure 5.5 Cellobiose molecular structure with the highlighted β -1,4 glycosydic bond.
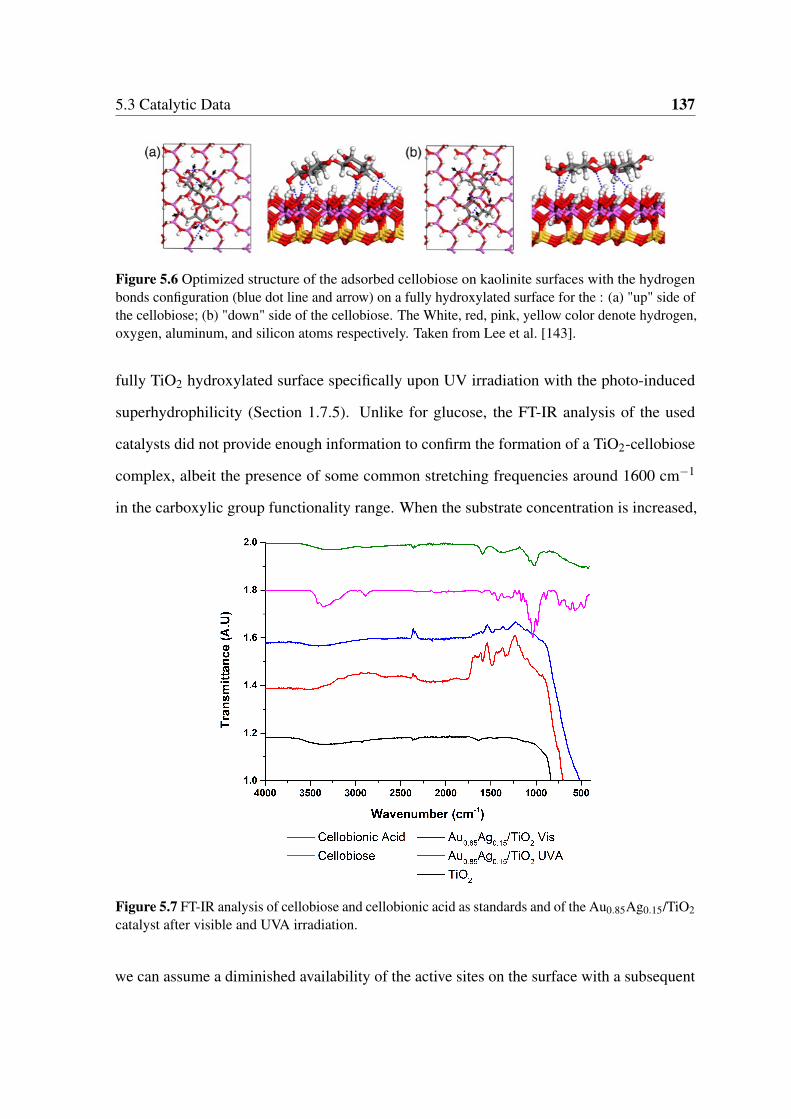
5.3 Catalytic Data 137
Figure 5.6 Optimized structure of the adsorbed cellobiose on kaolinite surfaces with the hydrogenbonds configuration (blue dot line and arrow) on a fully hydroxylated surface for the : (a) "up" side ofthe cellobiose; (b) "down" side of the cellobiose. The White, red, pink, yellow color denote hydrogen,oxygen, aluminum, and silicon atoms respectively. Taken from Lee et al. [143].
fully TiO2 hydroxylated surface specifically upon UV irradiation with the photo-induced
superhydrophilicity (Section 1.7.5). Unlike for glucose, the FT-IR analysis of the used
catalysts did not provide enough information to confirm the formation of a TiO2-cellobiose
complex, albeit the presence of some common stretching frequencies around 1600 cm−1
in the carboxylic group functionality range. When the substrate concentration is increased,
Figure 5.7 FT-IR analysis of cellobiose and cellobionic acid as standards and of the Au0.85Ag0.15/TiO2catalyst after visible and UVA irradiation.
we can assume a diminished availability of the active sites on the surface with a subsequent
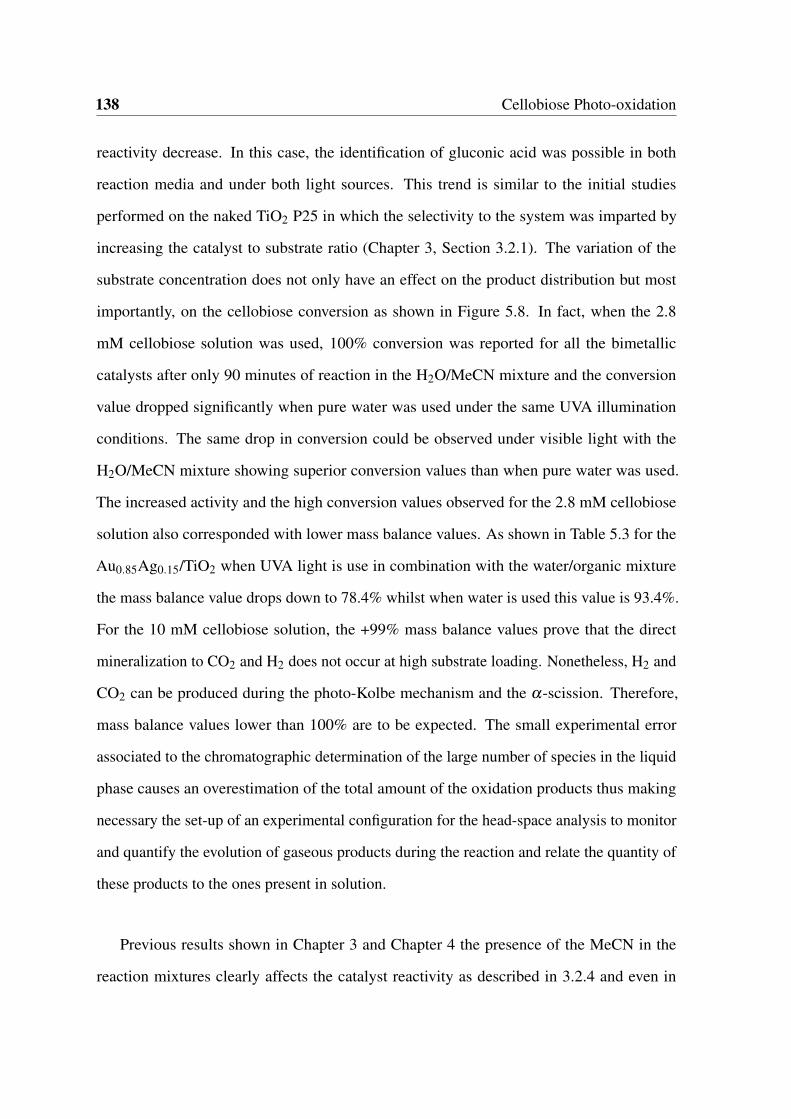
138 Cellobiose Photo-oxidation
reactivity decrease. In this case, the identification of gluconic acid was possible in both
reaction media and under both light sources. This trend is similar to the initial studies
performed on the naked TiO2 P25 in which the selectivity to the system was imparted by
increasing the catalyst to substrate ratio (Chapter 3, Section 3.2.1). The variation of the
substrate concentration does not only have an effect on the product distribution but most
importantly, on the cellobiose conversion as shown in Figure 5.8. In fact, when the 2.8
mM cellobiose solution was used, 100% conversion was reported for all the bimetallic
catalysts after only 90 minutes of reaction in the H2O/MeCN mixture and the conversion
value dropped significantly when pure water was used under the same UVA illumination
conditions. The same drop in conversion could be observed under visible light with the
H2O/MeCN mixture showing superior conversion values than when pure water was used.
The increased activity and the high conversion values observed for the 2.8 mM cellobiose
solution also corresponded with lower mass balance values. As shown in Table 5.3 for the
Au0.85Ag0.15/TiO2 when UVA light is use in combination with the water/organic mixture
the mass balance value drops down to 78.4% whilst when water is used this value is 93.4%.
For the 10 mM cellobiose solution, the +99% mass balance values prove that the direct
mineralization to CO2 and H2 does not occur at high substrate loading. Nonetheless, H2 and
CO2 can be produced during the photo-Kolbe mechanism and the α-scission. Therefore,
mass balance values lower than 100% are to be expected. The small experimental error
associated to the chromatographic determination of the large number of species in the liquid
phase causes an overestimation of the total amount of the oxidation products thus making
necessary the set-up of an experimental configuration for the head-space analysis to monitor
and quantify the evolution of gaseous products during the reaction and relate the quantity of
these products to the ones present in solution.
Previous results shown in Chapter 3 and Chapter 4 the presence of the MeCN in the
reaction mixtures clearly affects the catalyst reactivity as described in 3.2.4 and even in
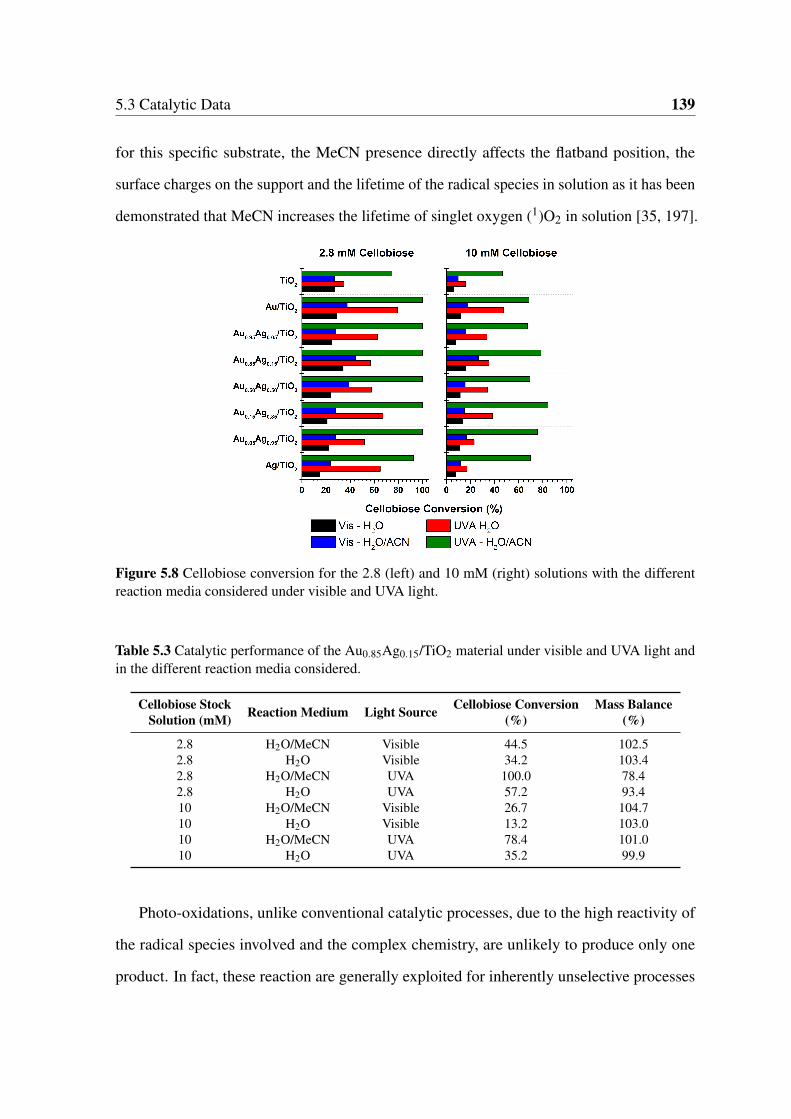
5.3 Catalytic Data 139
for this specific substrate, the MeCN presence directly affects the flatband position, the
surface charges on the support and the lifetime of the radical species in solution as it has been
demonstrated that MeCN increases the lifetime of singlet oxygen (1)O2 in solution [35, 197].
Figure 5.8 Cellobiose conversion for the 2.8 (left) and 10 mM (right) solutions with the differentreaction media considered under visible and UVA light.
Table 5.3 Catalytic performance of the Au0.85Ag0.15/TiO2 material under visible and UVA light andin the different reaction media considered.
Cellobiose Stock Reaction Medium Light Source Cellobiose Conversion Mass BalanceSolution (mM) (%) (%)
2.8 H2O/MeCN Visible 44.5 102.52.8 H2O Visible 34.2 103.42.8 H2O/MeCN UVA 100.0 78.42.8 H2O UVA 57.2 93.410 H2O/MeCN Visible 26.7 104.710 H2O Visible 13.2 103.010 H2O/MeCN UVA 78.4 101.010 H2O UVA 35.2 99.9
Photo-oxidations, unlike conventional catalytic processes, due to the high reactivity of
the radical species involved and the complex chemistry, are unlikely to produce only one
product. In fact, these reaction are generally exploited for inherently unselective processes
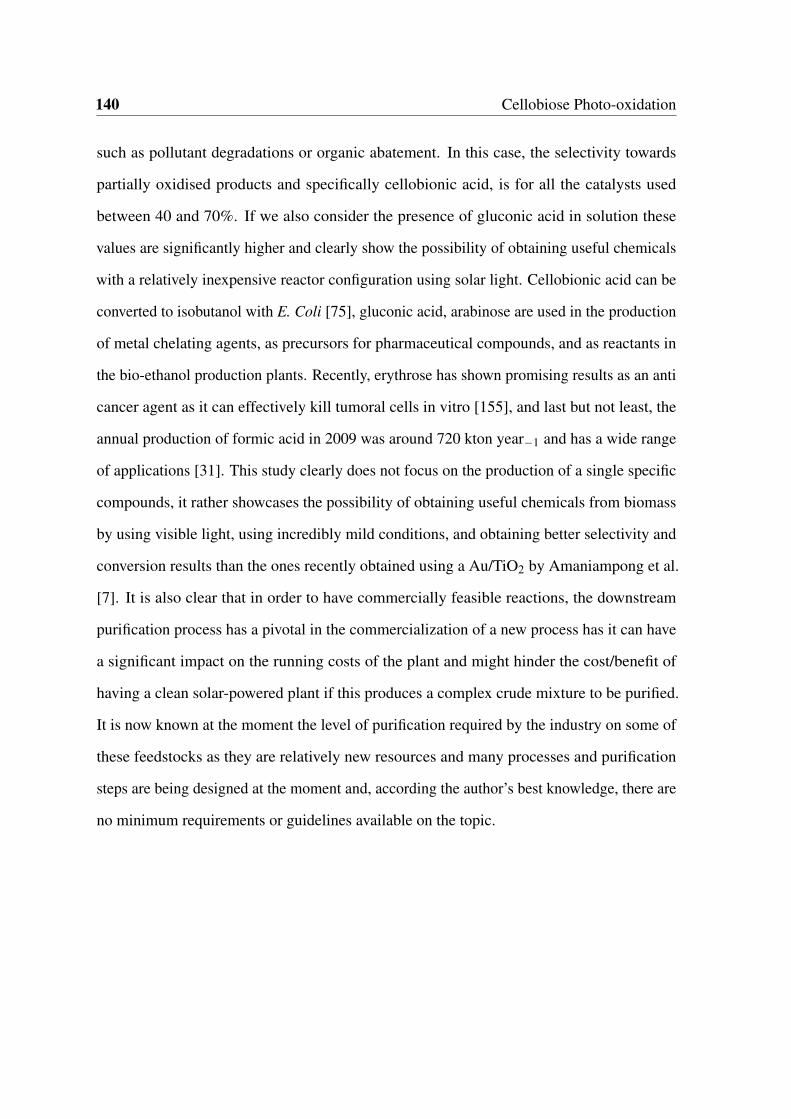
140 Cellobiose Photo-oxidation
such as pollutant degradations or organic abatement. In this case, the selectivity towards
partially oxidised products and specifically cellobionic acid, is for all the catalysts used
between 40 and 70%. If we also consider the presence of gluconic acid in solution these
values are significantly higher and clearly show the possibility of obtaining useful chemicals
with a relatively inexpensive reactor configuration using solar light. Cellobionic acid can be
converted to isobutanol with E. Coli [75], gluconic acid, arabinose are used in the production
of metal chelating agents, as precursors for pharmaceutical compounds, and as reactants in
the bio-ethanol production plants. Recently, erythrose has shown promising results as an anti
cancer agent as it can effectively kill tumoral cells in vitro [155], and last but not least, the
annual production of formic acid in 2009 was around 720 kton year−1 and has a wide range
of applications [31]. This study clearly does not focus on the production of a single specific
compounds, it rather showcases the possibility of obtaining useful chemicals from biomass
by using visible light, using incredibly mild conditions, and obtaining better selectivity and
conversion results than the ones recently obtained using a Au/TiO2 by Amaniampong et al.
[7]. It is also clear that in order to have commercially feasible reactions, the downstream
purification process has a pivotal in the commercialization of a new process has it can have
a significant impact on the running costs of the plant and might hinder the cost/benefit of
having a clean solar-powered plant if this produces a complex crude mixture to be purified.
It is now known at the moment the level of purification required by the industry on some of
these feedstocks as they are relatively new resources and many processes and purification
steps are being designed at the moment and, according the author’s best knowledge, there are
no minimum requirements or guidelines available on the topic.
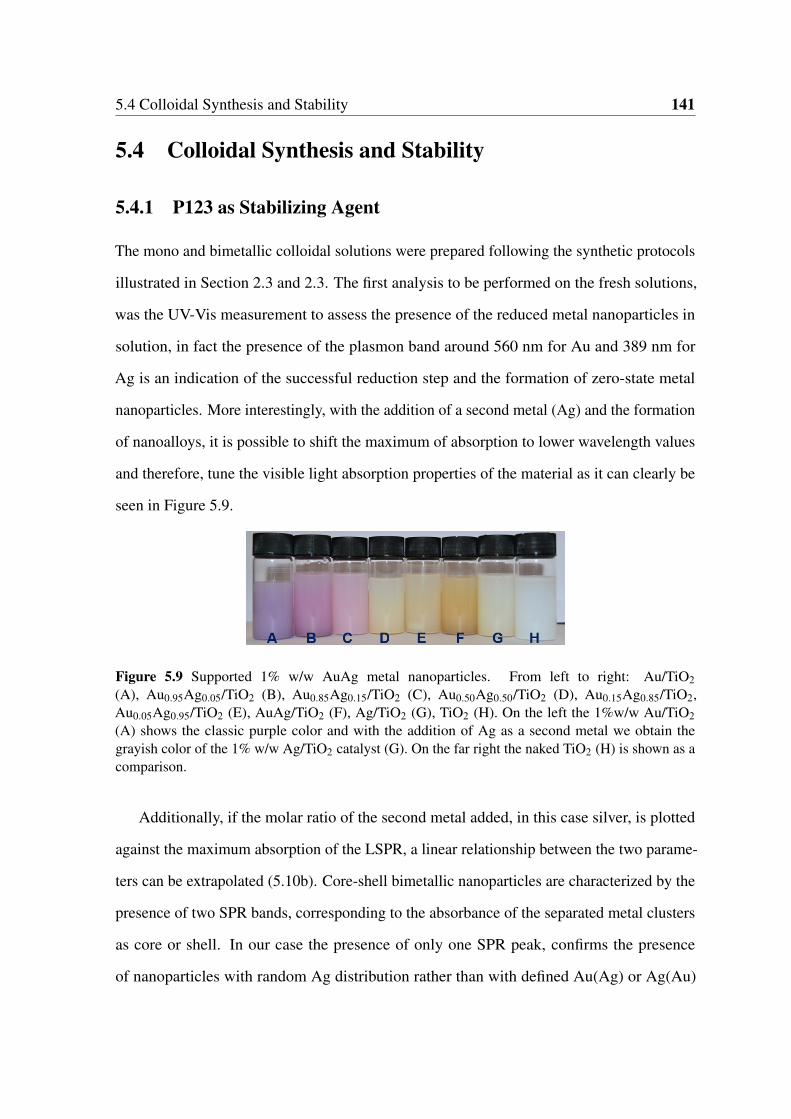
5.4 Colloidal Synthesis and Stability 141
5.4 Colloidal Synthesis and Stability
5.4.1 P123 as Stabilizing Agent
The mono and bimetallic colloidal solutions were prepared following the synthetic protocols
illustrated in Section 2.3 and 2.3. The first analysis to be performed on the fresh solutions,
was the UV-Vis measurement to assess the presence of the reduced metal nanoparticles in
solution, in fact the presence of the plasmon band around 560 nm for Au and 389 nm for
Ag is an indication of the successful reduction step and the formation of zero-state metal
nanoparticles. More interestingly, with the addition of a second metal (Ag) and the formation
of nanoalloys, it is possible to shift the maximum of absorption to lower wavelength values
and therefore, tune the visible light absorption properties of the material as it can clearly be
seen in Figure 5.9.
Figure 5.9 Supported 1% w/w AuAg metal nanoparticles. From left to right: Au/TiO2(A), Au0.95Ag0.05/TiO2 (B), Au0.85Ag0.15/TiO2 (C), Au0.50Ag0.50/TiO2 (D), Au0.15Ag0.85/TiO2,Au0.05Ag0.95/TiO2 (E), AuAg/TiO2 (F), Ag/TiO2 (G), TiO2 (H). On the left the 1%w/w Au/TiO2(A) shows the classic purple color and with the addition of Ag as a second metal we obtain thegrayish color of the 1% w/w Ag/TiO2 catalyst (G). On the far right the naked TiO2 (H) is shown as acomparison.
Additionally, if the molar ratio of the second metal added, in this case silver, is plotted
against the maximum absorption of the LSPR, a linear relationship between the two parame-
ters can be extrapolated (5.10b). Core-shell bimetallic nanoparticles are characterized by the
presence of two SPR bands, corresponding to the absorbance of the separated metal clusters
as core or shell. In our case the presence of only one SPR peak, confirms the presence
of nanoparticles with random Ag distribution rather than with defined Au(Ag) or Ag(Au)
142 Cellobiose Photo-oxidation
core-shell structures, or worse, a distribution of pure Au and Ag monometallic nanoparticles
[109, 236, 153, 152, 179]. The freshly prepared colloidal solutions were then supported on
(a) (b)
Figure 5.10 5.10a UV-Vis spectra of the unsupported mono and bimetallic colloidal solutions;5.10b Maximum of absorption (nm) for the unsupported colloidal () and supported (•) bimetallicnanoparticles as a function of the Ag molar loading in the nanoalloy.
TiO2 and solid UV-Vis analysis was performed on the dried materials ground to a fine powder
to assess the successful deposition of the metallic nanoparticles on the semiconductor surface
and evaluate possible shifts of the SPR band. Figure 5.11 shows the absorption profiles in
the 200-800 nm range of the mono and bimetallic catalyst. The absorptions in the 300-600
nm range are due to the SPR resonance, and the increased absorbance at wavelength values
lower than 300 nm is due to the absorption of the incident irradiation by the TiO2 band gap.
The metal supported catalysts were then digested using a freshly prepared aqua regia solution
(Section 2.6.8) to evaluate the actual metal loading of the material using ICP. These results
are reported in Table 5.4 and show good agreement between the theoretical value and the
calculated one.
Additionally, the stability of the colloidal solution was measured to assess their lifetime
and storage properties. Gold and silver solutions were stored in the dark at room temperature
for a week and were analysed by UV-Vis over this time frame. The stability of the colloids
varies significantly with time; in fact, Ag colloids showed a significant decrease in absorption
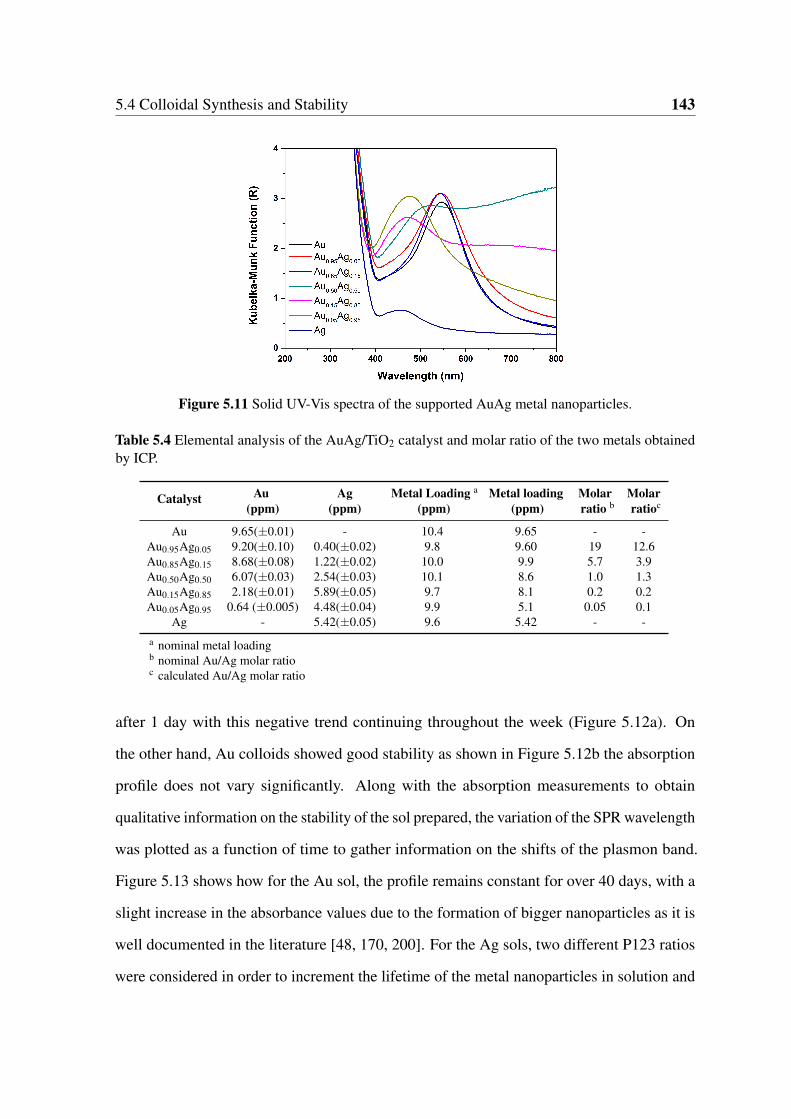
5.4 Colloidal Synthesis and Stability 143
Figure 5.11 Solid UV-Vis spectra of the supported AuAg metal nanoparticles.
Table 5.4 Elemental analysis of the AuAg/TiO2 catalyst and molar ratio of the two metals obtainedby ICP.
Catalyst Au Ag Metal Loading a Metal loading Molar Molar(ppm) (ppm) (ppm) (ppm) ratio b ratioc
Au 9.65(±0.01) - 10.4 9.65 - -Au0.95Ag0.05 9.20(±0.10) 0.40(±0.02) 9.8 9.60 19 12.6Au0.85Ag0.15 8.68(±0.08) 1.22(±0.02) 10.0 9.9 5.7 3.9Au0.50Ag0.50 6.07(±0.03) 2.54(±0.03) 10.1 8.6 1.0 1.3Au0.15Ag0.85 2.18(±0.01) 5.89(±0.05) 9.7 8.1 0.2 0.2Au0.05Ag0.95 0.64 (±0.005) 4.48(±0.04) 9.9 5.1 0.05 0.1
Ag - 5.42(±0.05) 9.6 5.42 - -a nominal metal loadingb nominal Au/Ag molar ratioc calculated Au/Ag molar ratio
after 1 day with this negative trend continuing throughout the week (Figure 5.12a). On
the other hand, Au colloids showed good stability as shown in Figure 5.12b the absorption
profile does not vary significantly. Along with the absorption measurements to obtain
qualitative information on the stability of the sol prepared, the variation of the SPR wavelength
was plotted as a function of time to gather information on the shifts of the plasmon band.
Figure 5.13 shows how for the Au sol, the profile remains constant for over 40 days, with a
slight increase in the absorbance values due to the formation of bigger nanoparticles as it is
well documented in the literature [48, 170, 200]. For the Ag sols, two different P123 ratios
were considered in order to increment the lifetime of the metal nanoparticles in solution and

144 Cellobiose Photo-oxidation
(a) (b)
Figure 5.12 UV-Vis spectra for the Ag (5.12a) and Au sols (5.12b) over 7 days.
Figure 5.13 Stability of the monometallic colloidal solutions and variations of the SPR absorbance asa function of time.
avoid agglomeration and precipitation phenomena. Despite the increase from a metal/P123
ratio from 5 to 10, the trend observed in both systems shows similar features with a significant
drop in the absorbance just after 1 day and with fluctuating values due to the formation
large suspended particles and some precipitates which affected the measurements. It is clear
then, how when Ag sols are considered, the short lifetime of this precursor, imparts fast
synthesis protocols and short storage times, whilst, when Au sols are used, these are stable
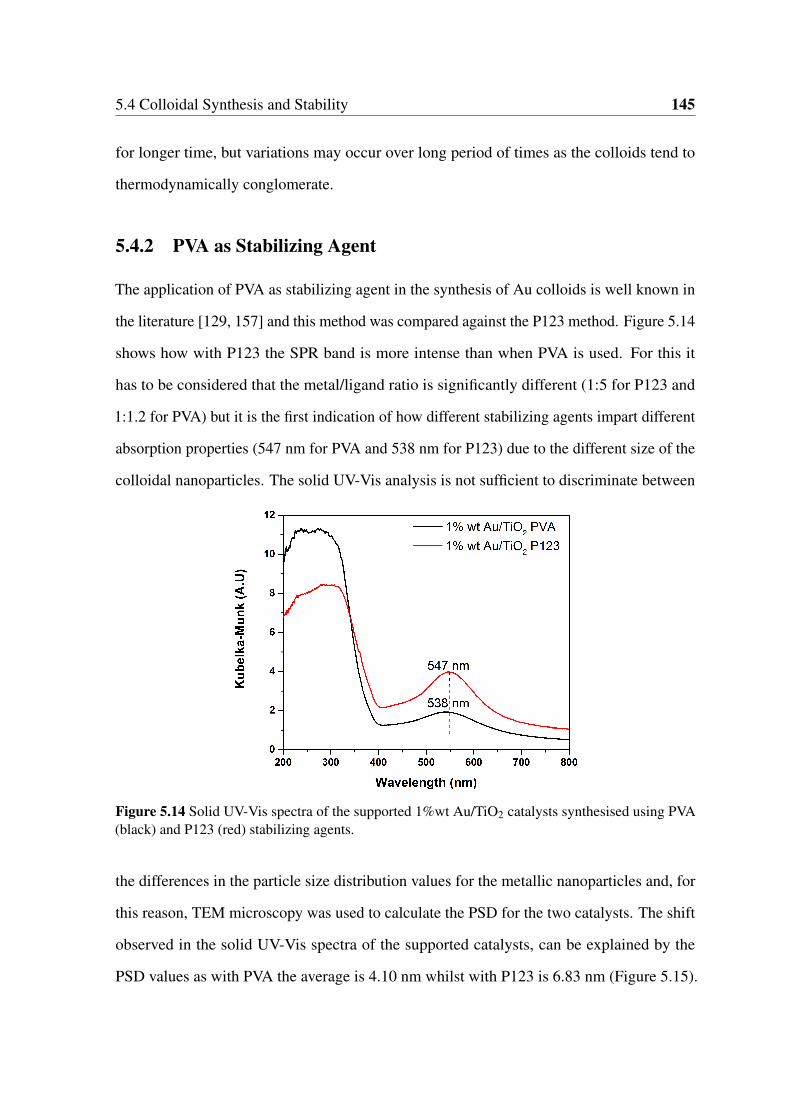
5.4 Colloidal Synthesis and Stability 145
for longer time, but variations may occur over long period of times as the colloids tend to
thermodynamically conglomerate.
5.4.2 PVA as Stabilizing Agent
The application of PVA as stabilizing agent in the synthesis of Au colloids is well known in
the literature [129, 157] and this method was compared against the P123 method. Figure 5.14
shows how with P123 the SPR band is more intense than when PVA is used. For this it
has to be considered that the metal/ligand ratio is significantly different (1:5 for P123 and
1:1.2 for PVA) but it is the first indication of how different stabilizing agents impart different
absorption properties (547 nm for PVA and 538 nm for P123) due to the different size of the
colloidal nanoparticles. The solid UV-Vis analysis is not sufficient to discriminate between
Figure 5.14 Solid UV-Vis spectra of the supported 1%wt Au/TiO2 catalysts synthesised using PVA(black) and P123 (red) stabilizing agents.
the differences in the particle size distribution values for the metallic nanoparticles and, for
this reason, TEM microscopy was used to calculate the PSD for the two catalysts. The shift
observed in the solid UV-Vis spectra of the supported catalysts, can be explained by the
PSD values as with PVA the average is 4.10 nm whilst with P123 is 6.83 nm (Figure 5.15).

146 Cellobiose Photo-oxidation
The different molecular weight and chain length of the two stabilizing agents used produces
particles with different sizes during the enucleation process. In fact, it is well known that
by using different ligands it is possible to tune the shape and size of metal nanoparticles for
different applications [168, 119].
(a) (b)
Figure 5.15 PSD values for the Au catalyst synthesised with PVA (5.15a) and P123 (5.15b) obtainedfor a total particle count of 300.
The considerations on the colloidal stability and on the different synthetic protocols
were part of the initial training on the synthesis of different catalysts during my PhD. The
possibility of tuning the plasmon resonance band by using P123 as stabilizing agent and
the higher catalytic activity of the catalysts synthesised following the paper by Huang et al.
[109] made us discard the catalyst prepared with PVA, and that is the main reason why all
the catalytic and characterization data shown in this chapter will mention exclusively the
P123 bimetallic catalysts.
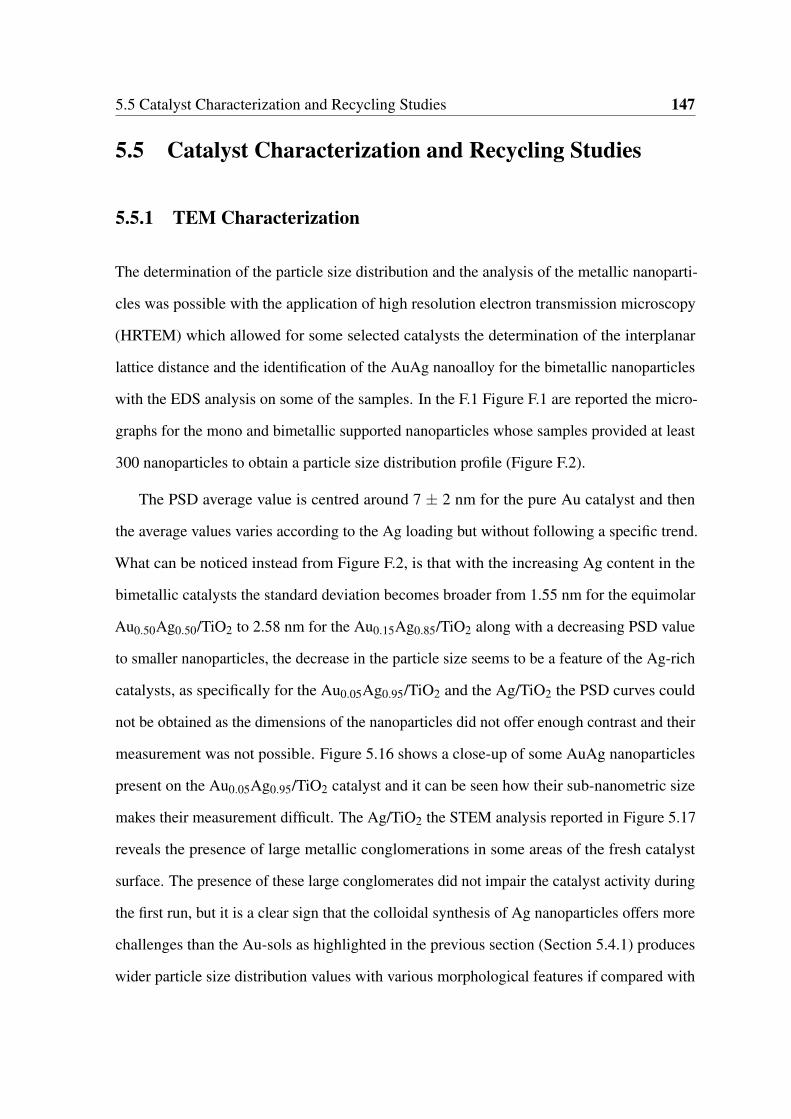
5.5 Catalyst Characterization and Recycling Studies 147
5.5 Catalyst Characterization and Recycling Studies
5.5.1 TEM Characterization
The determination of the particle size distribution and the analysis of the metallic nanoparti-
cles was possible with the application of high resolution electron transmission microscopy
(HRTEM) which allowed for some selected catalysts the determination of the interplanar
lattice distance and the identification of the AuAg nanoalloy for the bimetallic nanoparticles
with the EDS analysis on some of the samples. In the F.1 Figure F.1 are reported the micro-
graphs for the mono and bimetallic supported nanoparticles whose samples provided at least
300 nanoparticles to obtain a particle size distribution profile (Figure F.2).
The PSD average value is centred around 7 ± 2 nm for the pure Au catalyst and then
the average values varies according to the Ag loading but without following a specific trend.
What can be noticed instead from Figure F.2, is that with the increasing Ag content in the
bimetallic catalysts the standard deviation becomes broader from 1.55 nm for the equimolar
Au0.50Ag0.50/TiO2 to 2.58 nm for the Au0.15Ag0.85/TiO2 along with a decreasing PSD value
to smaller nanoparticles, the decrease in the particle size seems to be a feature of the Ag-rich
catalysts, as specifically for the Au0.05Ag0.95/TiO2 and the Ag/TiO2 the PSD curves could
not be obtained as the dimensions of the nanoparticles did not offer enough contrast and their
measurement was not possible. Figure 5.16 shows a close-up of some AuAg nanoparticles
present on the Au0.05Ag0.95/TiO2 catalyst and it can be seen how their sub-nanometric size
makes their measurement difficult. The Ag/TiO2 the STEM analysis reported in Figure 5.17
reveals the presence of large metallic conglomerations in some areas of the fresh catalyst
surface. The presence of these large conglomerates did not impair the catalyst activity during
the first run, but it is a clear sign that the colloidal synthesis of Ag nanoparticles offers more
challenges than the Au-sols as highlighted in the previous section (Section 5.4.1) produces
wider particle size distribution values with various morphological features if compared with
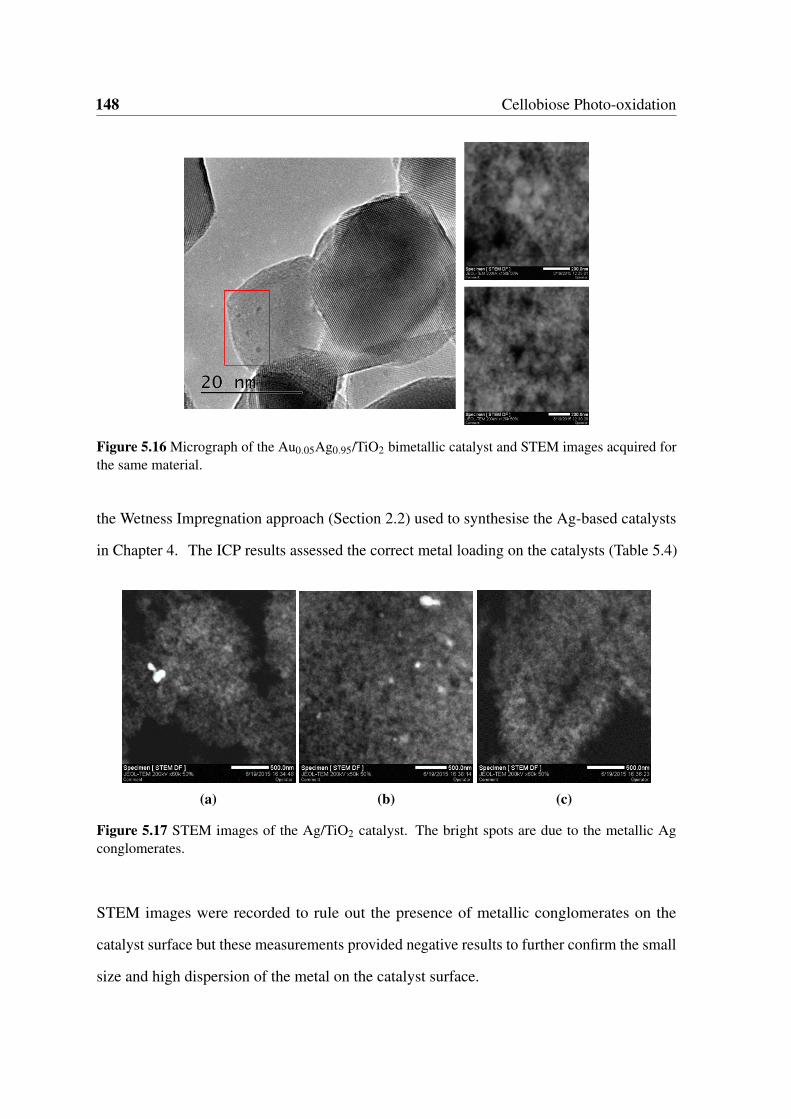
148 Cellobiose Photo-oxidation
Figure 5.16 Micrograph of the Au0.05Ag0.95/TiO2 bimetallic catalyst and STEM images acquired forthe same material.
the Wetness Impregnation approach (Section 2.2) used to synthesise the Ag-based catalysts
in Chapter 4. The ICP results assessed the correct metal loading on the catalysts (Table 5.4)
(a) (b) (c)
Figure 5.17 STEM images of the Ag/TiO2 catalyst. The bright spots are due to the metallic Agconglomerates.
STEM images were recorded to rule out the presence of metallic conglomerates on the
catalyst surface but these measurements provided negative results to further confirm the small
size and high dispersion of the metal on the catalyst surface.
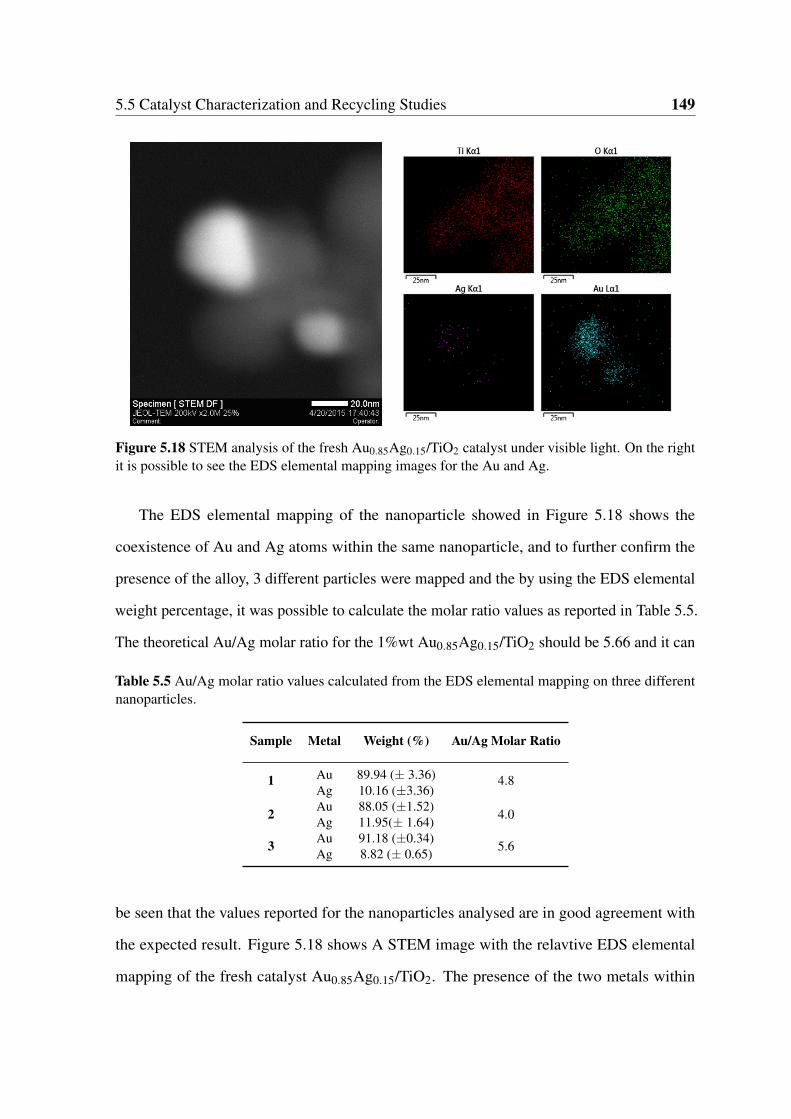
5.5 Catalyst Characterization and Recycling Studies 149
Figure 5.18 STEM analysis of the fresh Au0.85Ag0.15/TiO2 catalyst under visible light. On the rightit is possible to see the EDS elemental mapping images for the Au and Ag.
The EDS elemental mapping of the nanoparticle showed in Figure 5.18 shows the
coexistence of Au and Ag atoms within the same nanoparticle, and to further confirm the
presence of the alloy, 3 different particles were mapped and the by using the EDS elemental
weight percentage, it was possible to calculate the molar ratio values as reported in Table 5.5.
The theoretical Au/Ag molar ratio for the 1%wt Au0.85Ag0.15/TiO2 should be 5.66 and it can
Table 5.5 Au/Ag molar ratio values calculated from the EDS elemental mapping on three differentnanoparticles.
Sample Metal Weight (%) Au/Ag Molar Ratio
1 Au 89.94 (± 3.36) 4.8Ag 10.16 (±3.36)
2 Au 88.05 (±1.52) 4.0Ag 11.95(± 1.64)
3 Au 91.18 (±0.34) 5.6Ag 8.82 (± 0.65)
be seen that the values reported for the nanoparticles analysed are in good agreement with
the expected result. Figure 5.18 shows A STEM image with the relavtive EDS elemental
mapping of the fresh catalyst Au0.85Ag0.15/TiO2. The presence of the two metals within
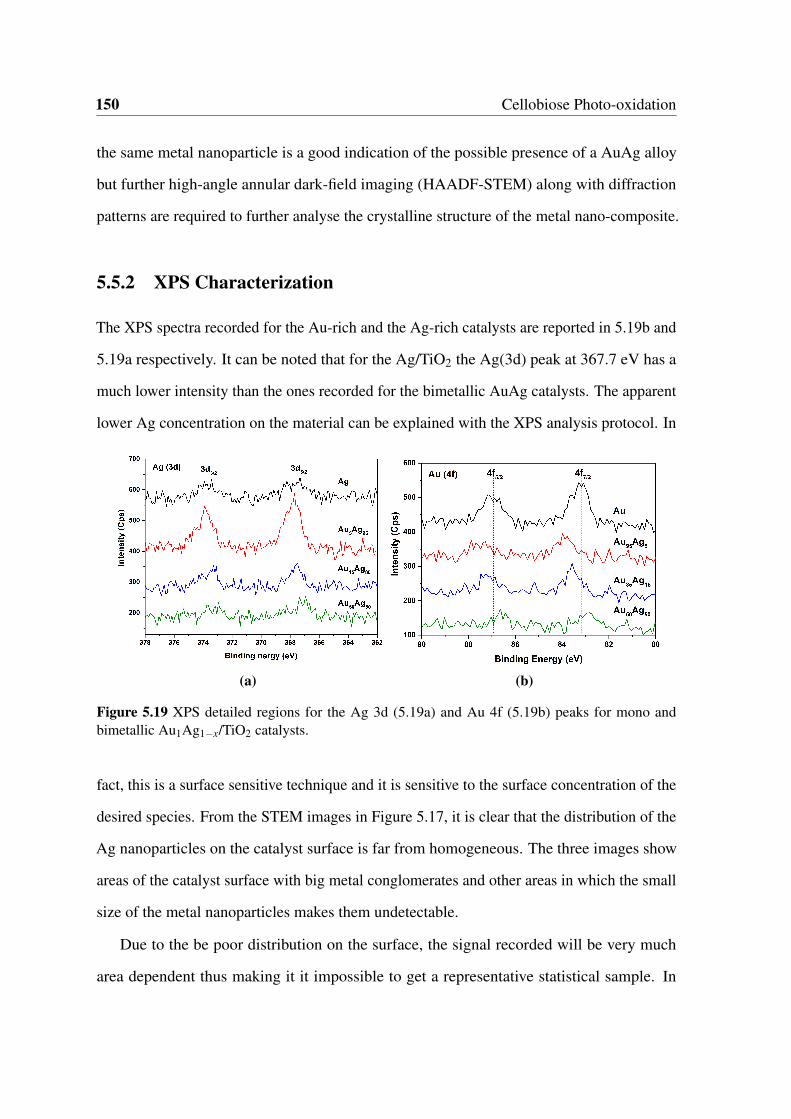
150 Cellobiose Photo-oxidation
the same metal nanoparticle is a good indication of the possible presence of a AuAg alloy
but further high-angle annular dark-field imaging (HAADF-STEM) along with diffraction
patterns are required to further analyse the crystalline structure of the metal nano-composite.
5.5.2 XPS Characterization
The XPS spectra recorded for the Au-rich and the Ag-rich catalysts are reported in 5.19b and
5.19a respectively. It can be noted that for the Ag/TiO2 the Ag(3d) peak at 367.7 eV has a
much lower intensity than the ones recorded for the bimetallic AuAg catalysts. The apparent
lower Ag concentration on the material can be explained with the XPS analysis protocol. In
(a) (b)
Figure 5.19 XPS detailed regions for the Ag 3d (5.19a) and Au 4f (5.19b) peaks for mono andbimetallic Au1Ag1−x/TiO2 catalysts.
fact, this is a surface sensitive technique and it is sensitive to the surface concentration of the
desired species. From the STEM images in Figure 5.17, it is clear that the distribution of the
Ag nanoparticles on the catalyst surface is far from homogeneous. The three images show
areas of the catalyst surface with big metal conglomerates and other areas in which the small
size of the metal nanoparticles makes them undetectable.
Due to the be poor distribution on the surface, the signal recorded will be very much
area dependent thus making it it impossible to get a representative statistical sample. In
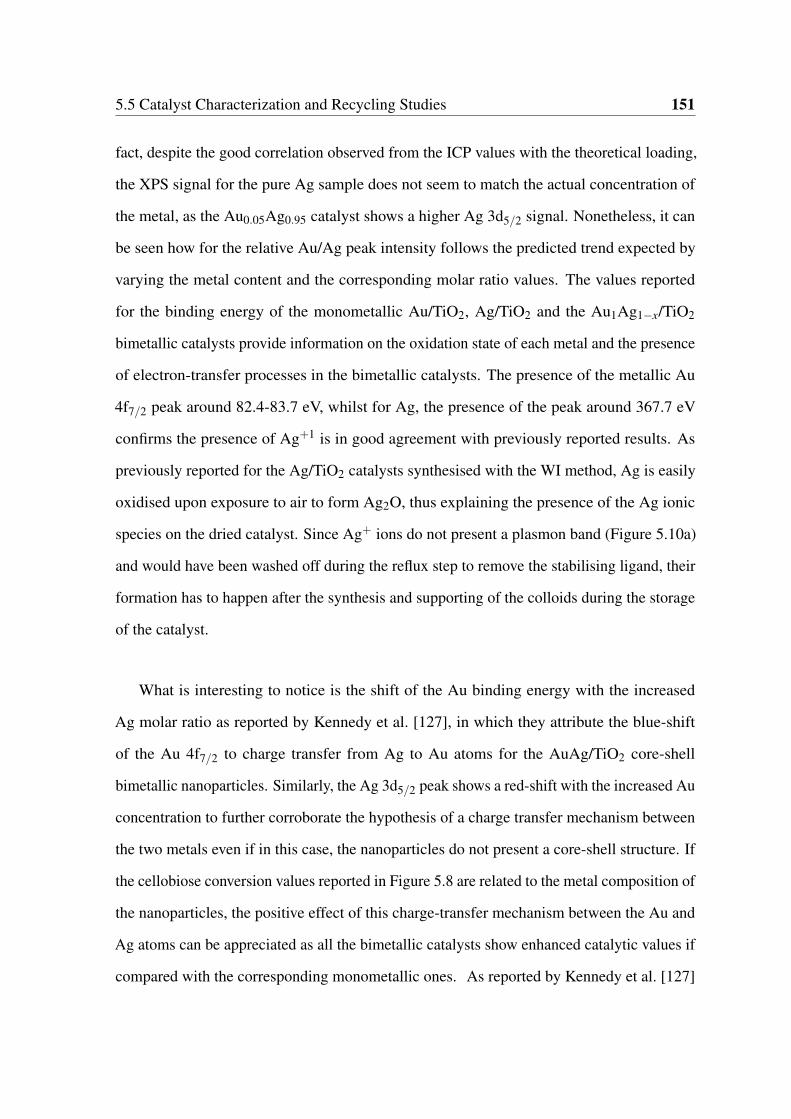
5.5 Catalyst Characterization and Recycling Studies 151
fact, despite the good correlation observed from the ICP values with the theoretical loading,
the XPS signal for the pure Ag sample does not seem to match the actual concentration of
the metal, as the Au0.05Ag0.95 catalyst shows a higher Ag 3d5/2 signal. Nonetheless, it can
be seen how for the relative Au/Ag peak intensity follows the predicted trend expected by
varying the metal content and the corresponding molar ratio values. The values reported
for the binding energy of the monometallic Au/TiO2, Ag/TiO2 and the Au1Ag1−x/TiO2
bimetallic catalysts provide information on the oxidation state of each metal and the presence
of electron-transfer processes in the bimetallic catalysts. The presence of the metallic Au
4f7/2 peak around 82.4-83.7 eV, whilst for Ag, the presence of the peak around 367.7 eV
confirms the presence of Ag+1 is in good agreement with previously reported results. As
previously reported for the Ag/TiO2 catalysts synthesised with the WI method, Ag is easily
oxidised upon exposure to air to form Ag2O, thus explaining the presence of the Ag ionic
species on the dried catalyst. Since Ag+ ions do not present a plasmon band (Figure 5.10a)
and would have been washed off during the reflux step to remove the stabilising ligand, their
formation has to happen after the synthesis and supporting of the colloids during the storage
of the catalyst.
What is interesting to notice is the shift of the Au binding energy with the increased
Ag molar ratio as reported by Kennedy et al. [127], in which they attribute the blue-shift
of the Au 4f7/2 to charge transfer from Ag to Au atoms for the AuAg/TiO2 core-shell
bimetallic nanoparticles. Similarly, the Ag 3d5/2 peak shows a red-shift with the increased Au
concentration to further corroborate the hypothesis of a charge transfer mechanism between
the two metals even if in this case, the nanoparticles do not present a core-shell structure. If
the cellobiose conversion values reported in Figure 5.8 are related to the metal composition of
the nanoparticles, the positive effect of this charge-transfer mechanism between the Au and
Ag atoms can be appreciated as all the bimetallic catalysts show enhanced catalytic values if
compared with the corresponding monometallic ones. As reported by Kennedy et al. [127]
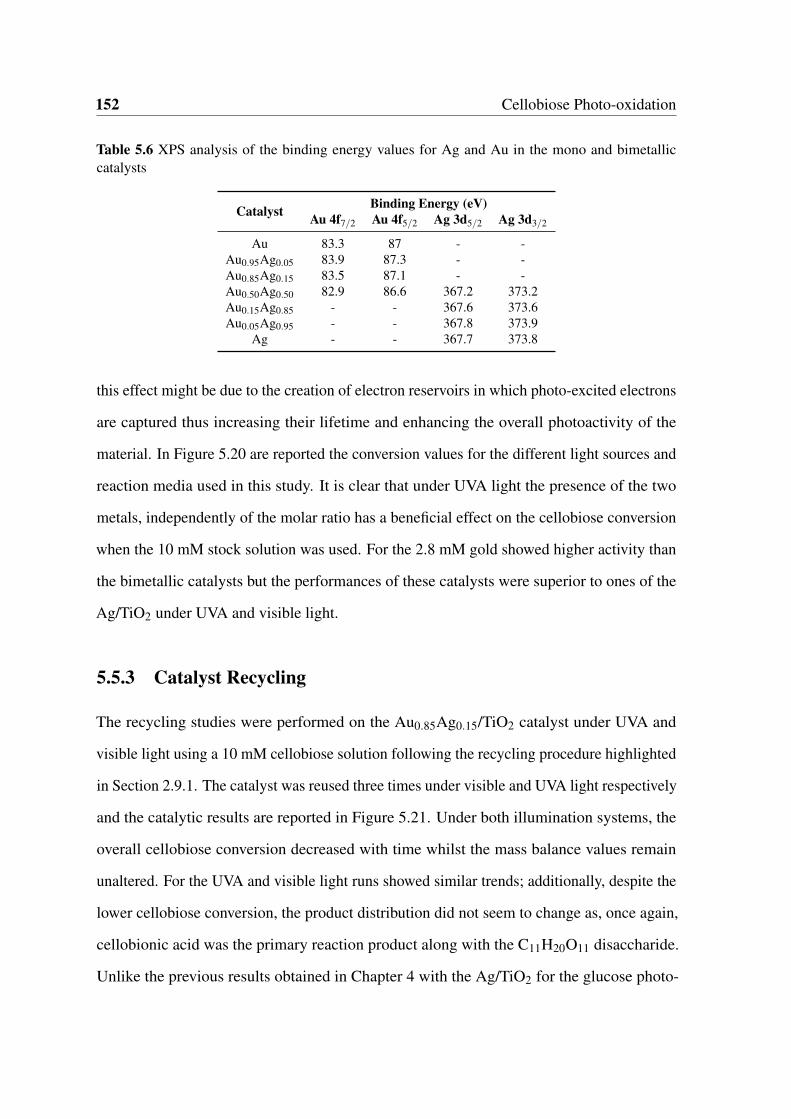
152 Cellobiose Photo-oxidation
Table 5.6 XPS analysis of the binding energy values for Ag and Au in the mono and bimetalliccatalysts
Catalyst Binding Energy (eV)Au 4f7/2 Au 4f5/2 Ag 3d5/2 Ag 3d3/2
Au 83.3 87 - -Au0.95Ag0.05 83.9 87.3 - -Au0.85Ag0.15 83.5 87.1 - -Au0.50Ag0.50 82.9 86.6 367.2 373.2Au0.15Ag0.85 - - 367.6 373.6Au0.05Ag0.95 - - 367.8 373.9
Ag - - 367.7 373.8
this effect might be due to the creation of electron reservoirs in which photo-excited electrons
are captured thus increasing their lifetime and enhancing the overall photoactivity of the
material. In Figure 5.20 are reported the conversion values for the different light sources and
reaction media used in this study. It is clear that under UVA light the presence of the two
metals, independently of the molar ratio has a beneficial effect on the cellobiose conversion
when the 10 mM stock solution was used. For the 2.8 mM gold showed higher activity than
the bimetallic catalysts but the performances of these catalysts were superior to ones of the
Ag/TiO2 under UVA and visible light.
5.5.3 Catalyst Recycling
The recycling studies were performed on the Au0.85Ag0.15/TiO2 catalyst under UVA and
visible light using a 10 mM cellobiose solution following the recycling procedure highlighted
in Section 2.9.1. The catalyst was reused three times under visible and UVA light respectively
and the catalytic results are reported in Figure 5.21. Under both illumination systems, the
overall cellobiose conversion decreased with time whilst the mass balance values remain
unaltered. For the UVA and visible light runs showed similar trends; additionally, despite the
lower cellobiose conversion, the product distribution did not seem to change as, once again,
cellobionic acid was the primary reaction product along with the C11H20O11 disaccharide.
Unlike the previous results obtained in Chapter 4 with the Ag/TiO2 for the glucose photo-

5.5 Catalyst Characterization and Recycling Studies 153
Figure 5.20 Cellobiose conversion for the catalysts considered in this study as a function of thesubstrate concentration and the reaction medium under UVA irradiation (e.g.) and under visiblelight (e.g.) as shown by the left hand side legend.
oxidation reaction in which the catalysts showed outstanding stability over three runs with
no loss of catalytic activity, in this case the performances of the Au0.85Ag0.15/TiO2 are
somewhat disappointing and required further characterization of the recycled material to
glean information on the possible causes of the catalyst deactivation. The solid UV-Vis was
the first characterization technique used to determine possible shifts or changes of the LSPR
resonance. Figure 5.22 shows the spectra for the recycled Au0.85Ag0.15/TiO2 under UVA
and visible light. If compared with the fresh absorption profile, the reused catalyst generally
displays a decrease in the intensity of the LSPR band with this trend being more pronounced
for the visible-light-reused catalysts. For the UVA, after the initial decrease in the first run, the
intensity of the band is constant and does not shift any further. This might imply that during
the first reaction the nanoparticles on the surface undergo some physical transformation (eg.
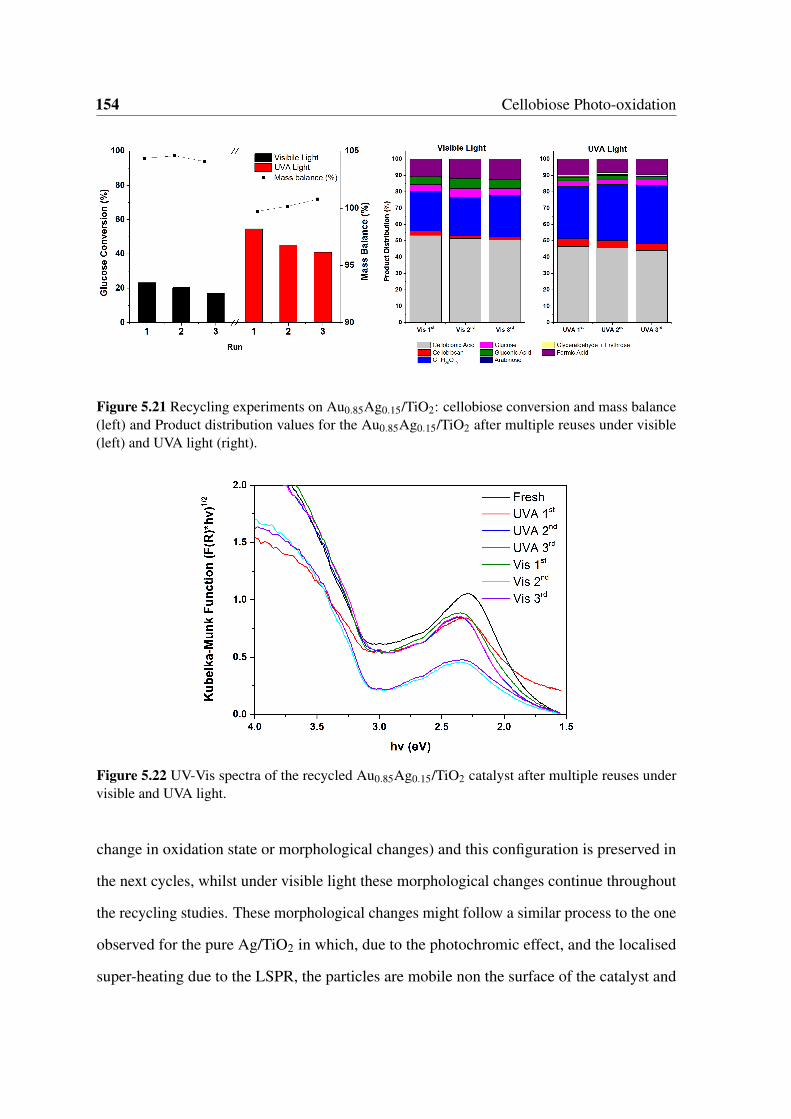
154 Cellobiose Photo-oxidation
Figure 5.21 Recycling experiments on Au0.85Ag0.15/TiO2: cellobiose conversion and mass balance(left) and Product distribution values for the Au0.85Ag0.15/TiO2 after multiple reuses under visible(left) and UVA light (right).
Figure 5.22 UV-Vis spectra of the recycled Au0.85Ag0.15/TiO2 catalyst after multiple reuses undervisible and UVA light.
change in oxidation state or morphological changes) and this configuration is preserved in
the next cycles, whilst under visible light these morphological changes continue throughout
the recycling studies. These morphological changes might follow a similar process to the one
observed for the pure Ag/TiO2 in which, due to the photochromic effect, and the localised
super-heating due to the LSPR, the particles are mobile non the surface of the catalyst and
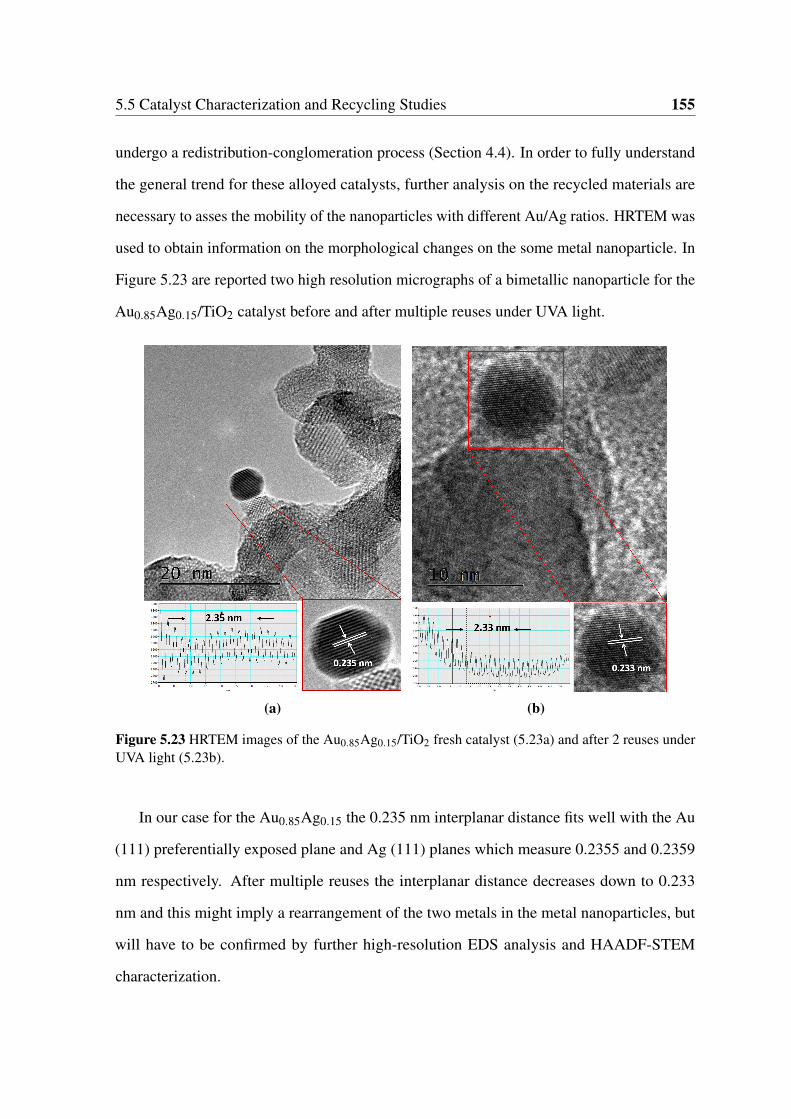
5.5 Catalyst Characterization and Recycling Studies 155
undergo a redistribution-conglomeration process (Section 4.4). In order to fully understand
the general trend for these alloyed catalysts, further analysis on the recycled materials are
necessary to asses the mobility of the nanoparticles with different Au/Ag ratios. HRTEM was
used to obtain information on the morphological changes on the some metal nanoparticle. In
Figure 5.23 are reported two high resolution micrographs of a bimetallic nanoparticle for the
Au0.85Ag0.15/TiO2 catalyst before and after multiple reuses under UVA light.
(a) (b)
Figure 5.23 HRTEM images of the Au0.85Ag0.15/TiO2 fresh catalyst (5.23a) and after 2 reuses underUVA light (5.23b).
In our case for the Au0.85Ag0.15 the 0.235 nm interplanar distance fits well with the Au
(111) preferentially exposed plane and Ag (111) planes which measure 0.2355 and 0.2359
nm respectively. After multiple reuses the interplanar distance decreases down to 0.233
nm and this might imply a rearrangement of the two metals in the metal nanoparticles, but
will have to be confirmed by further high-resolution EDS analysis and HAADF-STEM
characterization.
156 Cellobiose Photo-oxidation
5.6 Conclusions
In this chapter the effect of the preparation of Au/TiO2 catalysts was correlated with their
catalytic performances with the P123 method showing the highest catalytic activity, and this
stabilising ligand was chosen for the preparation of the AuAg colloidal solutions. With the
addition of a second metal, it was possible to shift the LSPR frequency of the material to
a wide range of wavelength values in order to maximise the response of these materials to
visible light irradiation. By alloying the Au and Ag a general increase on the catalytic perfor-
mances of the bimetallic catalysts was observed under UVA and visible light if compared with
the pure monometallic Au and Ag/TiO2. Additionally, it was found that cellobiose showed
similar chemical reactivity to glucose, undergoing the same oxidative pathways (photo-Kolbe,
α-scission) mechanisms with the addition of the unprecedented photo-initiated hydrolytic
step. For the first time the one-pot oxidative hydrolysis of cellobiose was reported with the
identification of a global reaction mechanism using 1 wt% Au1Ag(1−x)/TiO2 catalysts. The
good catalytic activity and recyclability of these materials make them appealing materials for
the various photocatalytic applications.
Chapter 6Conclusions
HAVE YOU SEEN THE LIGHT?
Rev. C. James
YES! YES! JESUS H. TAP-DANCING
CHRIST... I HAVE SEEN THE LIGHT!
J. Blues
The final aim of this work was to shed some light on the possibility of using the power of
the sun as a viable driving force for green and sustainable chemical reactions and to provide
the fundamental experimental tools for the understanding and analysis of the photo-reactivity
of simple carbohydrates in order to provide the basis for the research on cellulosic materials.
The use of photocatalysis in the literature has been associated with non selective reactions for
the degradation of pollutants in water streams, the production of H2 from various organics or
from water-splitting reactions. Only recently, has photocatalysis started to be exploited to
run selective oxidation reactions with promising results. Due to the necessity of exploiting
biomass as a raw material and the need to find greener processes, in recent years a few studies
have been published on the application of light-driven reactions to convert cellulose and other
simple carbohydrates to produce H2. The presence of partial oxidation products in the liquid
158 Conclusions
phase has always been neglected as most of the research was focused on the production of
hydrogen as the next green fuel.
There was then a need to try and bridge the production of these gaseous products with
other useful bio-derived molecules given the amount of chemical functionalities present on
these feedstocks. The approach used in this study involved some detailed studies on the
photo-chemical properties of TiO2, a well known photoactive material. With the systematic
analysis of several key parameters such as the catalyst to substrate ratio and irradiation
source it was possible to discover that H2 and CO2 only accounted for a fraction of the
reaction products. Clearly, the total mineralization pathway had to be suppressed somehow
in favour of other reaction products given the high glucose conversion values registered.
The catalyst/substrate ratio played a fundamental role in driving the reaction down different
reaction pathways. In fact, unlike previous results, in this study the substrate concentration
was several orders of magnitude greater than the values present in the literature, which as a
consequence, resulted in the complete suppression of the mineralization pathway as the main
reaction scheme. Another striking result observed was the activity of TiO2 under visible light
conditions. In fact, at 420 nm the incident photons do not have enough energy to promote
electrons from the valence band to the TiO2 conduction band, and the results published by
Kim et al. [130] proved the existence of a ligand to metal charge transfer complex between
glucose and the surface of the semiconductor. This type of complex was investigated for the
first time, as before the interaction between substrate-semiconductor was investigated only
for the application of dyes as sensitisers to extend the TiO2 activity under visible light. The
substantial difference between the dye-sensitisation approach and the LMCT is that dyes
usually possess chromophore groups due to the presence of substituted aromatics rings and
the π electrons on these rings are responsible for the charge transfer mechanism.
The possibility of having charge transfer complexes with molecules that do not absorb
visible light irradiation and do not have unsaturated bonds, testifies the importance of the
159
adsorption-desorption properties and the specific interactions between hydroxylated surfaces
and the substrate and opens up the possibility of dual-exploitation of specific substrates both
as enhancers of the catalytic activity of the semiconductor and as reactants. The glucose
double role during its photocatalytic oxidation made it difficult to understand the kinetics
of the reaction and understand the global reaction pathway. In fact, only a few works are
available on the upgrading of glucose to valuable chemicals using a photocatalytic approach
and some the results reported in the literature are sometimes difficult to interpret due to the
different reaction set-ups and analytical methods used.
For this reason the identification of the reaction schemes involved in the glucose reactivity
has been the most important part of this work. The puzzle could be solved combining
different reaction mechanisms reported in the literature for Fenton systems by Stapley and
BeMiller [222]. Their work focused on the description of the oxidative decarboxylation
of sugars with the use of Fe(III) and H2O2 for the production of aldoses. This reaction
mechasim was then translated to a photo-Fenton system using the Ti(IV) metallic centre on
the semiconductor surface as part of the redox process. The application of this approach
allowed for the identification and quantification of all the reaction products in this work and
to rule out the presence of arabitol as reported by Colmenares et al. [61] with the application
of the powerful HPLC-QTOF mass spectrometry technique. Nonetheless, the photo-Kolbe
mechanism alone could not explain the presence of formic acid in solution and it was evident
that the photocatalytic oxidation of glucose could follow an additional reaction pathway.
Thanks to the recent results published by Chong et al. [53],α-scission reaction mechanism
with the formation of formic acid and H2 from glucose along with other partial oxidation
products was identified and allowed for the complete identification of the reaction species if
combined with the photo-Kolbe mechanism.
From this it is clear from the literature that the amount of information available on
the specific reactivity of bio-derived molecules is limited and fragmented, and the general
160 Conclusions
understanding of these mechanisms is sometimes misled by the specific experimental set-ups
adopted by each research group and the complex reactivity of these systems. For these
reasons, this PhD work focused on the utilization of a well known catalyst such as TiO2 and
on how to extend and improve its catalytic activity. The use of Au and Ag nanoparticles to
extend the activity of semiconductor to the visible light part of the solar spectrum has been
widely reported in water splitting reactions and pollutant degradations. The use of Pd, Pt, and
Rh was reported by Chong et al. [53] along with Cr, Cu, and Ni by Colmenares et al. [61]
but the effect of the plasmon resonance was never investigated as these metals were added as
co-catalysts.
The addition of different Ag wt% metal loadings proved to be an effective way of
improving the catalytic performances of the support, and the addition of 0.5 wt% Ag showed
better conversion values than a 1 wt% Au/TiO2 used as a comparison. Initially, it was
decided to use Ag as its cost is much cheaper than for the Au precursor thus making it more
interesting for a possible commercial application. The high activity and no leaching of the
metal over multiple runs with no significant loss of activity was an exciting result, despite the
morphological changes of the metal nanoparticles on the catalyst surface with the formation
of large metal conglomerates. As the main aim of photocatalytic reactions is to exploit the
widest range of visible light wavelength values, the use of only one metal with a very narrow
plasmon band resonance in the region of 380-410 nm is not ideal as it cannot be excited by
photons at energy levels that do not match this interval. Therefore, the coupling of Au and
Ag with the formation of nanoalloys was decided could be a promising technology as it could
allow to tailor the response of this material from 380-560 nm which are the LSPR frequency
values of Ag and Au respectively, thus covering a large part of the visible light spectrum.
Unlike for the Ag/TiO2 catalysts synthesised with the WI method, the delicate tailoring
of the visible light properties requires a more controlled synthetic approach and the colloidal
preparation of nanoalloys has been reported for various metals with reproducible protocols
161
and consistent results. The protocol used allowed a strict and precise control over the
composition of the catalysts as confirmed by the ICP and EDS analysis. Most importantly,
during the synthesis of the sols, the phase separation of pure Ag and Au nanoparticles was
ruled out with the UV-Vis analysis as only one sharp peak was noticeable as a clear indication
of the formation of the nanoalloy. Additionally, by plotting the maximum of absorption
as a function of the Ag molar ratio in the alloy a good linear correlation between the two
parameters could be found. This could allow a further engineering of the colloidal preparation
which, with the addition of a third metal, could extend the properties of these nanoalloys
even further.
The control over the synthetic protocol was a promising start, but it was not certain if the
alloys would have a positive effect due to the synergy of the two metals on the conversion
of a bigger and more complex substrate such as cellobiose. Indeed, when the catalysts
were tested under UVA and visible light, in both conditions the synergy of the presence of
Au and Ag metal had a positive effect on the catalytic activity with the supported alloyed
nanoparticles being more active than the corresponding monometallic Au/TiO2 and Ag/TiO2.
Au0.85Ag0.15/TiO2 proved to be the best performing alloyed catalyst and displayed good
activity with only 5% conversion decrease over three runs. The product distribution values
remained within experimental error with no substantial differences between each test. In
addition to the unprecedented effect of the Au/Ag alloying in selective photo-oxidation
reactions, cellobiose displayed similar reactivity to glucose. Cellobiose hydrolysis has been
investigated with mineral acids (H2SO4, HCl, H3PO4) but the use of concentrated acid
solutions poses problems for practical applications due to the corrosion of the equipment and
reactors. Therefore, research moved on to try and functionalise materials with acid groups,
and it was found that by using mesoporous silica materials (SBA-15) with the addition of acid
groups good glucose yields could be obtained but careful tuning of the reaction conditions
was necessary to avoid the formation of humins, char, and other dehydration products. At the
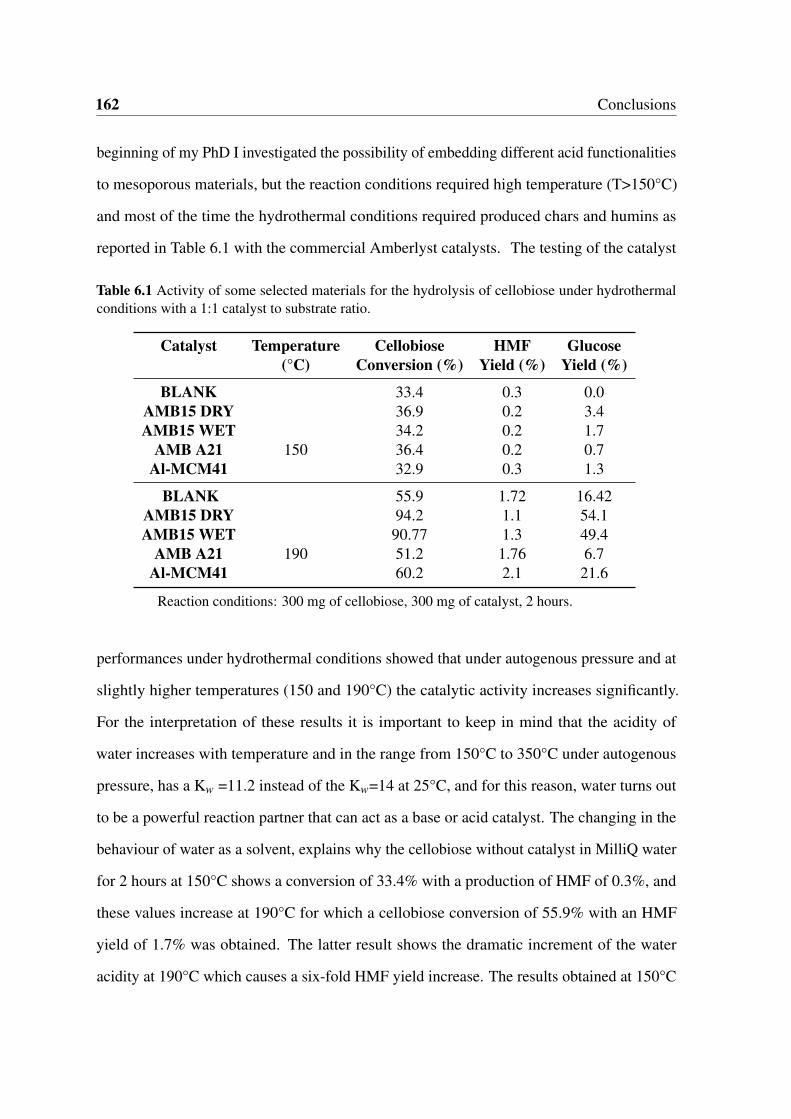
162 Conclusions
beginning of my PhD I investigated the possibility of embedding different acid functionalities
to mesoporous materials, but the reaction conditions required high temperature (T>150°C)
and most of the time the hydrothermal conditions required produced chars and humins as
reported in Table 6.1 with the commercial Amberlyst catalysts. The testing of the catalyst
Table 6.1 Activity of some selected materials for the hydrolysis of cellobiose under hydrothermalconditions with a 1:1 catalyst to substrate ratio.
Catalyst Temperature Cellobiose HMF Glucose(°C) Conversion (%) Yield (%) Yield (%)
BLANK 33.4 0.3 0.0AMB15 DRY
150
36.9 0.2 3.4AMB15 WET 34.2 0.2 1.7
AMB A21 36.4 0.2 0.7Al-MCM41 32.9 0.3 1.3
BLANK 55.9 1.72 16.42AMB15 DRY
190
94.2 1.1 54.1AMB15 WET 90.77 1.3 49.4
AMB A21 51.2 1.76 6.7Al-MCM41 60.2 2.1 21.6
Reaction conditions: 300 mg of cellobiose, 300 mg of catalyst, 2 hours.
performances under hydrothermal conditions showed that under autogenous pressure and at
slightly higher temperatures (150 and 190°C) the catalytic activity increases significantly.
For the interpretation of these results it is important to keep in mind that the acidity of
water increases with temperature and in the range from 150°C to 350°C under autogenous
pressure, has a Kw =11.2 instead of the Kw=14 at 25°C, and for this reason, water turns out
to be a powerful reaction partner that can act as a base or acid catalyst. The changing in the
behaviour of water as a solvent, explains why the cellobiose without catalyst in MilliQ water
for 2 hours at 150°C shows a conversion of 33.4% with a production of HMF of 0.3%, and
these values increase at 190°C for which a cellobiose conversion of 55.9% with an HMF
yield of 1.7% was obtained. The latter result shows the dramatic increment of the water
acidity at 190°C which causes a six-fold HMF yield increase. The results obtained at 150°C

163
show that among the catalyst tested Amberlyst 15 DRY shows a cellobiose conversion value
of 94.2% and the highest yield of glucose (54.1%) with a selectivity towards the production
of HMF of 2.4%; similar values are obtained with the Amberlyst 15 WET with a conversion
of cellobiose of 90.7%, a yield of glucose of almost 50%, and with the HMF selectivity
value of 2.7%. Unlike the results obtained under the reflux conditions, the stability and
the reactivity of the Amberlyst 15 DRY and WET is similar, but if the water is taken into
account, these values decrease sensibly, and the net conversion of cellobiose due to the
presence of the solid acid catalyst is around 35%. It is then clear how the Al-MCM41 is not
active towards the hydrolysis of cellobiose nor towards the dehydration of glucose into HMF,
because the product distribution is similar to the one obtained with the blank reaction under
the same experimental conditions. The results obtained at a higher temperature (190°C)
do not show a differentiation in the product distribution or in the catalytic activities of the
materials considered. It can be seen how the conversion values are higher than the ones
obtained at 150°C, but this increment is mainly due to the increased activity of water rather
than in an increased activity of the catalysts, which is present but at a lower extent. Even
the reaction in which the Amberlyst A21 and the Amberlyst 15 DRY were combined in
equal quantities did not show any synergistic effect of the two catalysts in the production
of HMF. Theoretically, the Amberlyst 15 DRY would break down the glycosidic bond and
produce glucose, which should have been isomerised into fructose by the Amberlyst A21.
This reaction had selectivity towards the production of HMF of 5.2% with a glucose yield
of 18.8% on a conversion of cellobiose of 61.5%. These results show how glucose in the
experimental condition used behaves as an intermediate, and that water itself works as an
efficient catalyst for the hydrolysis of cellobiose.
A different approach was used to try and improve the hydrolytic rate by using ZnCl2
concentrated solutions, as it is known that molten salts solutions are capable of penetrating
cellulosic fibres and loosing the H-bond network as shown in Figure 6.1 [9]. Several attempts
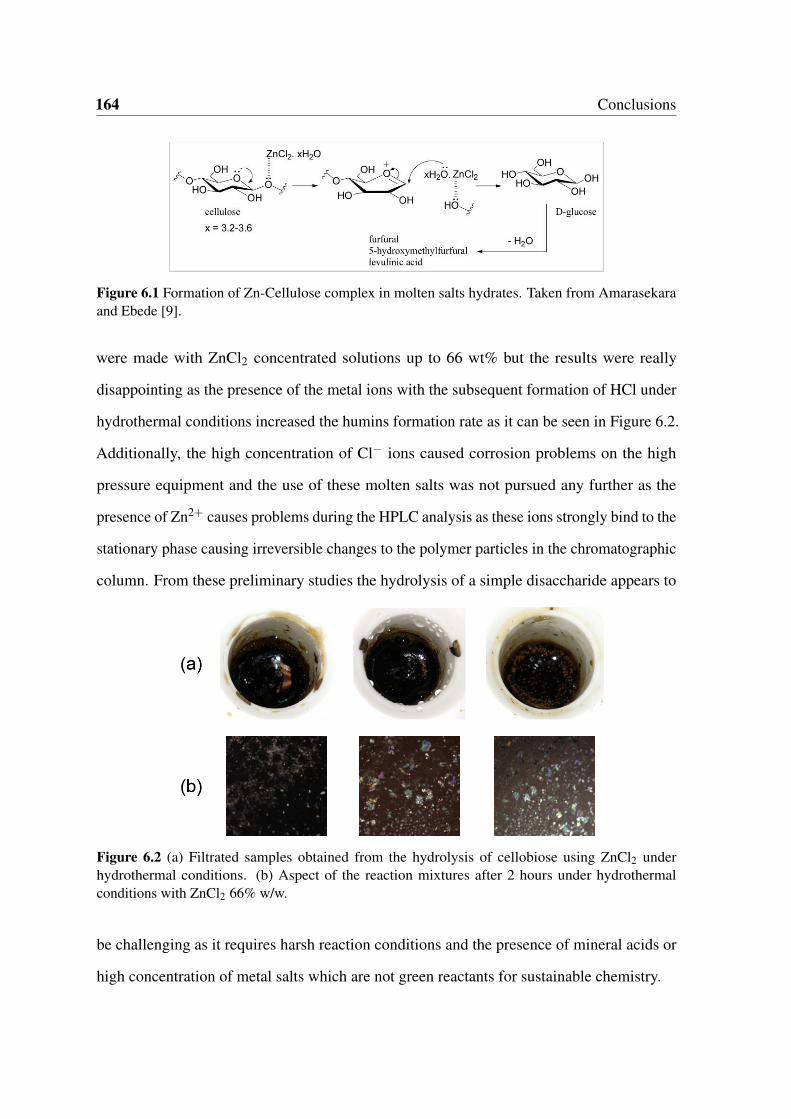
164 Conclusions
Figure 6.1 Formation of Zn-Cellulose complex in molten salts hydrates. Taken from Amarasekaraand Ebede [9].
were made with ZnCl2 concentrated solutions up to 66 wt% but the results were really
disappointing as the presence of the metal ions with the subsequent formation of HCl under
hydrothermal conditions increased the humins formation rate as it can be seen in Figure 6.2.
Additionally, the high concentration of Cl− ions caused corrosion problems on the high
pressure equipment and the use of these molten salts was not pursued any further as the
presence of Zn2+ causes problems during the HPLC analysis as these ions strongly bind to the
stationary phase causing irreversible changes to the polymer particles in the chromatographic
column. From these preliminary studies the hydrolysis of a simple disaccharide appears to
Figure 6.2 (a) Filtrated samples obtained from the hydrolysis of cellobiose using ZnCl2 underhydrothermal conditions. (b) Aspect of the reaction mixtures after 2 hours under hydrothermalconditions with ZnCl2 66% w/w.
be challenging as it requires harsh reaction conditions and the presence of mineral acids or
high concentration of metal salts which are not green reactants for sustainable chemistry.
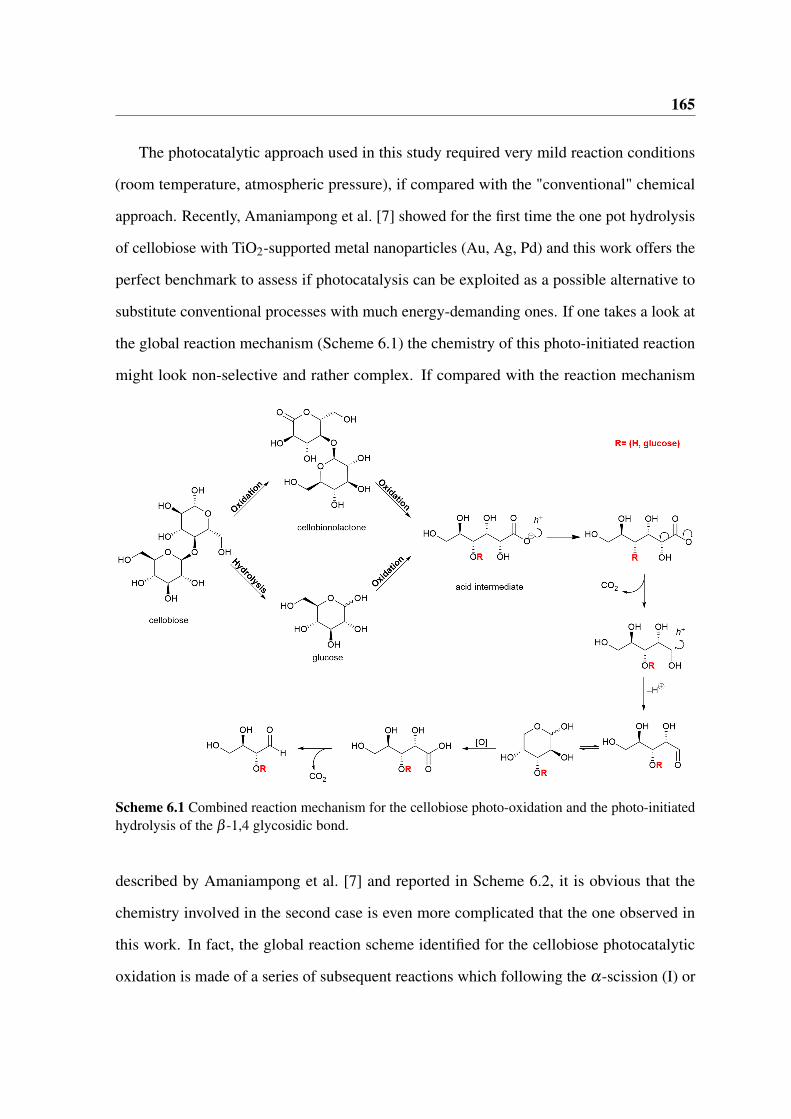
165
The photocatalytic approach used in this study required very mild reaction conditions
(room temperature, atmospheric pressure), if compared with the "conventional" chemical
approach. Recently, Amaniampong et al. [7] showed for the first time the one pot hydrolysis
of cellobiose with TiO2-supported metal nanoparticles (Au, Ag, Pd) and this work offers the
perfect benchmark to assess if photocatalysis can be exploited as a possible alternative to
substitute conventional processes with much energy-demanding ones. If one takes a look at
the global reaction mechanism (Scheme 6.1) the chemistry of this photo-initiated reaction
might look non-selective and rather complex. If compared with the reaction mechanism
Scheme 6.1 Combined reaction mechanism for the cellobiose photo-oxidation and the photo-initiatedhydrolysis of the β -1,4 glycosidic bond.
described by Amaniampong et al. [7] and reported in Scheme 6.2, it is obvious that the
chemistry involved in the second case is even more complicated that the one observed in
this work. In fact, the global reaction scheme identified for the cellobiose photocatalytic
oxidation is made of a series of subsequent reactions which following the α-scission (I) or
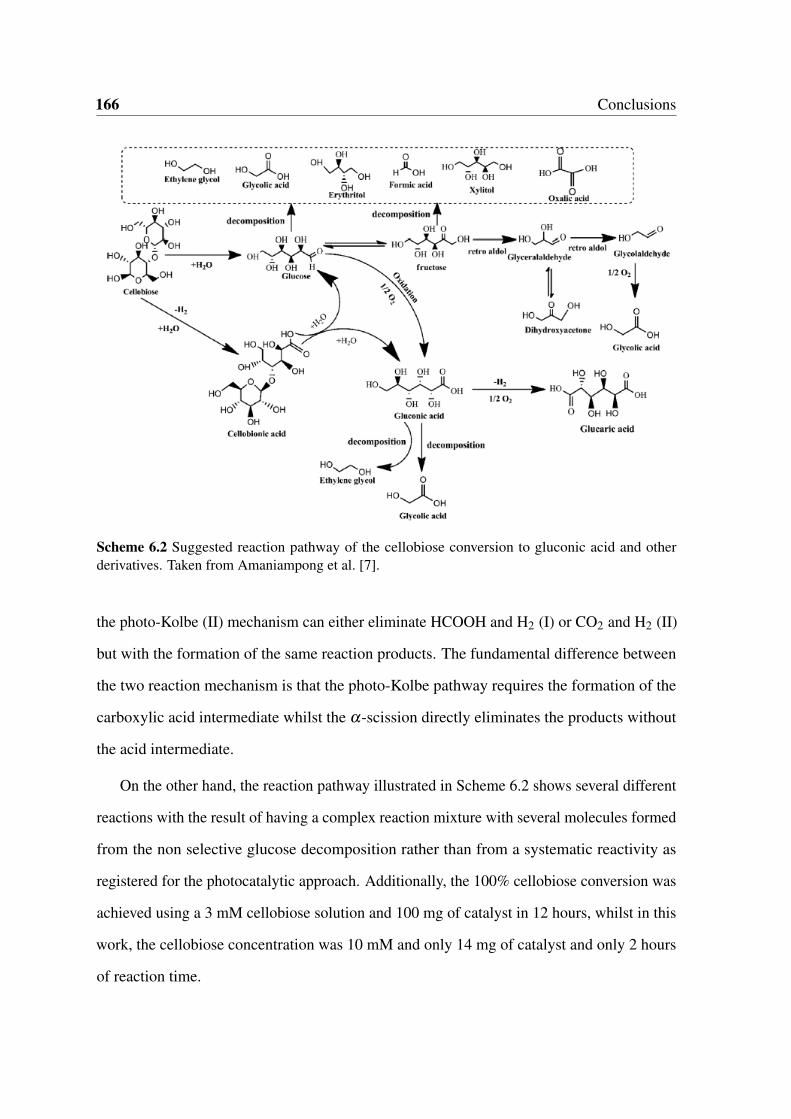
166 Conclusions
Scheme 6.2 Suggested reaction pathway of the cellobiose conversion to gluconic acid and otherderivatives. Taken from Amaniampong et al. [7].
the photo-Kolbe (II) mechanism can either eliminate HCOOH and H2 (I) or CO2 and H2 (II)
but with the formation of the same reaction products. The fundamental difference between
the two reaction mechanism is that the photo-Kolbe pathway requires the formation of the
carboxylic acid intermediate whilst the α-scission directly eliminates the products without
the acid intermediate.
On the other hand, the reaction pathway illustrated in Scheme 6.2 shows several different
reactions with the result of having a complex reaction mixture with several molecules formed
from the non selective glucose decomposition rather than from a systematic reactivity as
registered for the photocatalytic approach. Additionally, the 100% cellobiose conversion was
achieved using a 3 mM cellobiose solution and 100 mg of catalyst in 12 hours, whilst in this
work, the cellobiose concentration was 10 mM and only 14 mg of catalyst and only 2 hours
of reaction time.
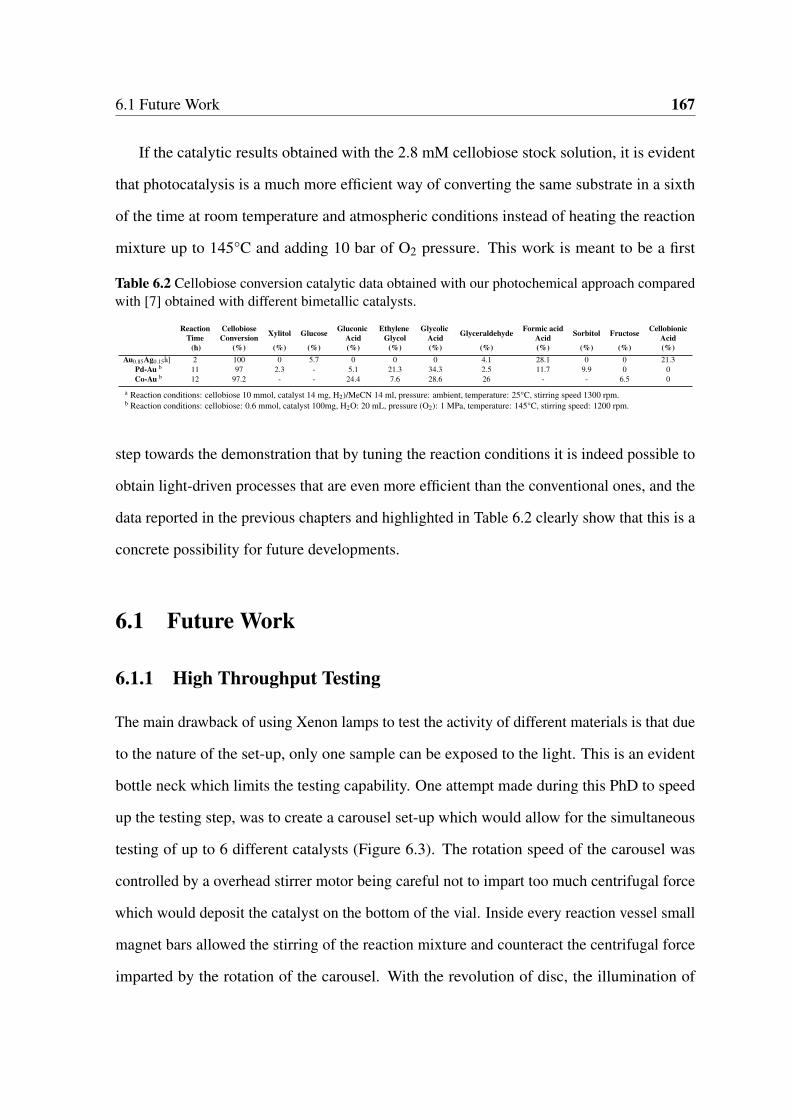
6.1 Future Work 167
If the catalytic results obtained with the 2.8 mM cellobiose stock solution, it is evident
that photocatalysis is a much more efficient way of converting the same substrate in a sixth
of the time at room temperature and atmospheric conditions instead of heating the reaction
mixture up to 145°C and adding 10 bar of O2 pressure. This work is meant to be a first
Table 6.2 Cellobiose conversion catalytic data obtained with our photochemical approach comparedwith [7] obtained with different bimetallic catalysts.
Reaction Cellobiose Xylitol Glucose Gluconic Ethylene Glycolic Glyceraldehyde Formic acid Sorbitol Fructose CellobionicTime Conversion Acid Glycol Acid Acid Acid
(h) (%) (%) (%) (%) (%) (%) (%) (%) (%) (%) (%)Au0.85Ag0.15
[a] 2 100 0 5.7 0 0 0 4.1 28.1 0 0 21.3Pd-Au b 11 97 2.3 - 5.1 21.3 34.3 2.5 11.7 9.9 0 0Co-Au b 12 97.2 - - 24.4 7.6 28.6 26 - - 6.5 0
a Reaction conditions: cellobiose 10 mmol, catalyst 14 mg, H2)/MeCN 14 ml, pressure: ambient, temperature: 25°C, stirring speed 1300 rpm.b Reaction conditions: cellobiose: 0.6 mmol, catalyst 100mg, H2O: 20 mL, pressure (O2): 1 MPa, temperature: 145°C, stirring speed: 1200 rpm.
step towards the demonstration that by tuning the reaction conditions it is indeed possible to
obtain light-driven processes that are even more efficient than the conventional ones, and the
data reported in the previous chapters and highlighted in Table 6.2 clearly show that this is a
concrete possibility for future developments.
6.1 Future Work
6.1.1 High Throughput Testing
The main drawback of using Xenon lamps to test the activity of different materials is that due
to the nature of the set-up, only one sample can be exposed to the light. This is an evident
bottle neck which limits the testing capability. One attempt made during this PhD to speed
up the testing step, was to create a carousel set-up which would allow for the simultaneous
testing of up to 6 different catalysts (Figure 6.3). The rotation speed of the carousel was
controlled by a overhead stirrer motor being careful not to impart too much centrifugal force
which would deposit the catalyst on the bottom of the vial. Inside every reaction vessel small
magnet bars allowed the stirring of the reaction mixture and counteract the centrifugal force
imparted by the rotation of the carousel. With the revolution of disc, the illumination of
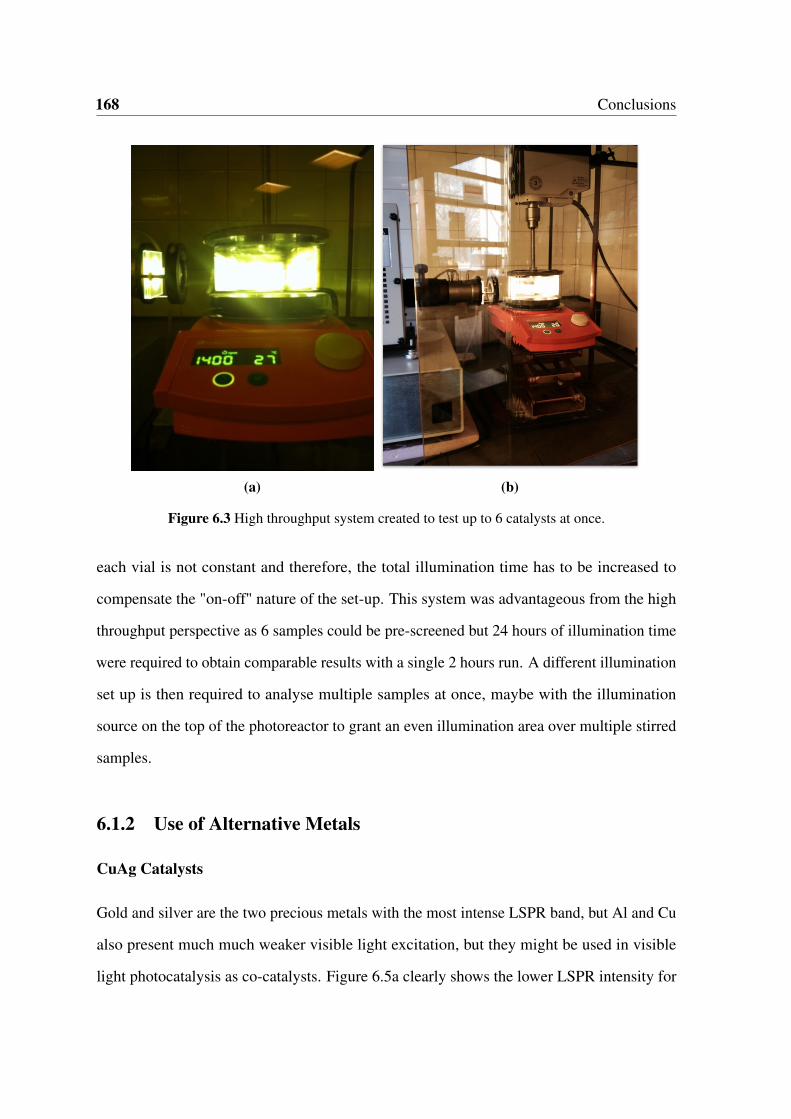
168 Conclusions
(a) (b)
Figure 6.3 High throughput system created to test up to 6 catalysts at once.
each vial is not constant and therefore, the total illumination time has to be increased to
compensate the "on-off" nature of the set-up. This system was advantageous from the high
throughput perspective as 6 samples could be pre-screened but 24 hours of illumination time
were required to obtain comparable results with a single 2 hours run. A different illumination
set up is then required to analyse multiple samples at once, maybe with the illumination
source on the top of the photoreactor to grant an even illumination area over multiple stirred
samples.
6.1.2 Use of Alternative Metals
CuAg Catalysts
Gold and silver are the two precious metals with the most intense LSPR band, but Al and Cu
also present much much weaker visible light excitation, but they might be used in visible
light photocatalysis as co-catalysts. Figure 6.5a clearly shows the lower LSPR intensity for
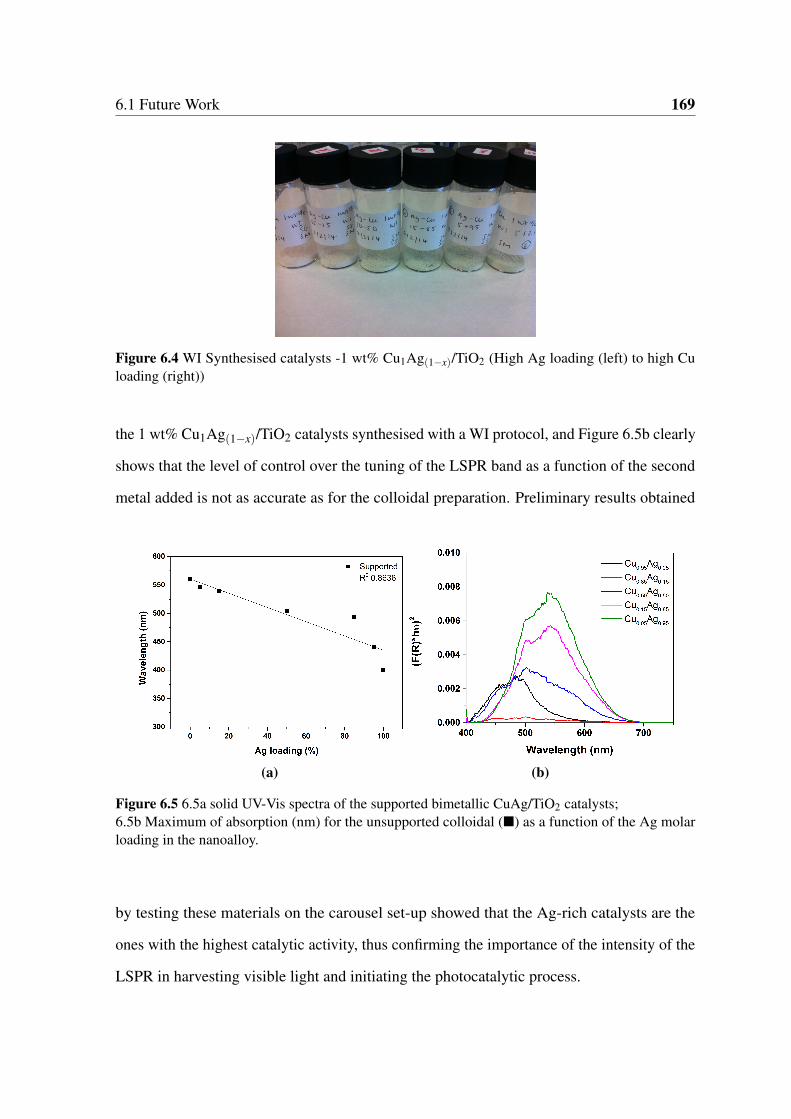
6.1 Future Work 169
Figure 6.4 WI Synthesised catalysts -1 wt% Cu1Ag(1−x)/TiO2 (High Ag loading (left) to high Culoading (right))
the 1 wt% Cu1Ag(1−x)/TiO2 catalysts synthesised with a WI protocol, and Figure 6.5b clearly
shows that the level of control over the tuning of the LSPR band as a function of the second
metal added is not as accurate as for the colloidal preparation. Preliminary results obtained
(a) (b)
Figure 6.5 6.5a solid UV-Vis spectra of the supported bimetallic CuAg/TiO2 catalysts;6.5b Maximum of absorption (nm) for the unsupported colloidal () as a function of the Ag molarloading in the nanoalloy.
by testing these materials on the carousel set-up showed that the Ag-rich catalysts are the
ones with the highest catalytic activity, thus confirming the importance of the intensity of the
LSPR in harvesting visible light and initiating the photocatalytic process.
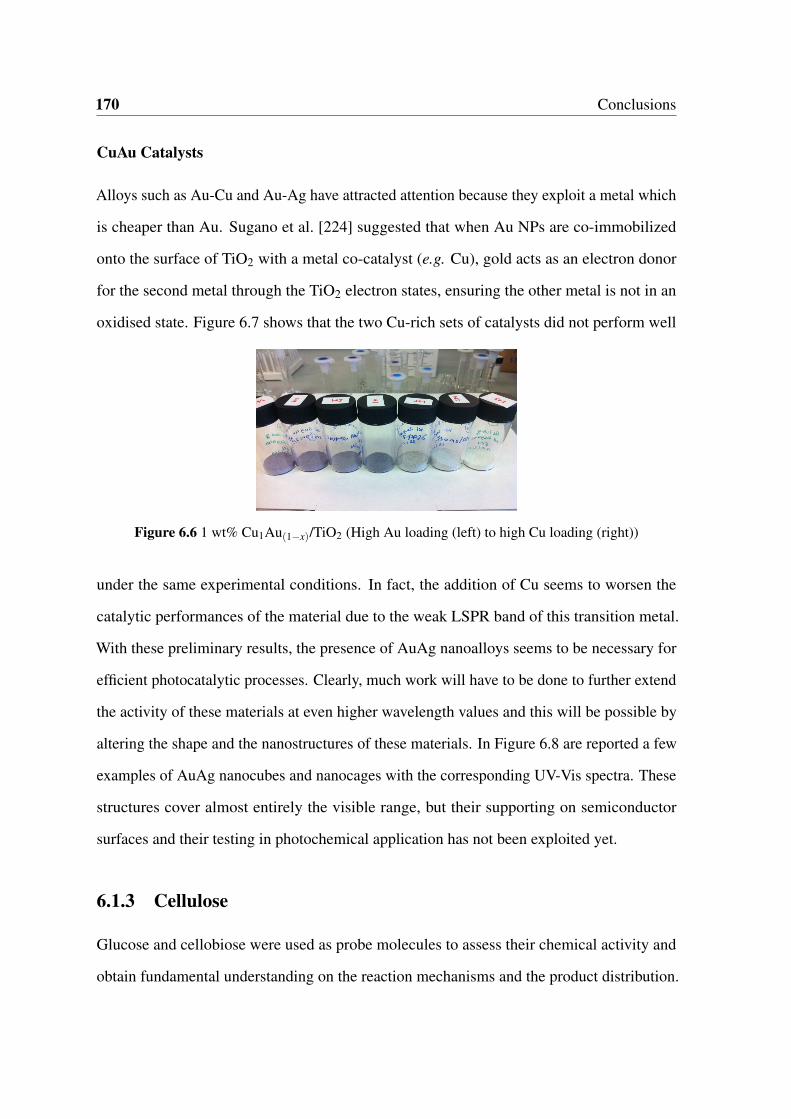
170 Conclusions
CuAu Catalysts
Alloys such as Au-Cu and Au-Ag have attracted attention because they exploit a metal which
is cheaper than Au. Sugano et al. [224] suggested that when Au NPs are co-immobilized
onto the surface of TiO2 with a metal co-catalyst (e.g. Cu), gold acts as an electron donor
for the second metal through the TiO2 electron states, ensuring the other metal is not in an
oxidised state. Figure 6.7 shows that the two Cu-rich sets of catalysts did not perform well
Figure 6.6 1 wt% Cu1Au(1−x)/TiO2 (High Au loading (left) to high Cu loading (right))
under the same experimental conditions. In fact, the addition of Cu seems to worsen the
catalytic performances of the material due to the weak LSPR band of this transition metal.
With these preliminary results, the presence of AuAg nanoalloys seems to be necessary for
efficient photocatalytic processes. Clearly, much work will have to be done to further extend
the activity of these materials at even higher wavelength values and this will be possible by
altering the shape and the nanostructures of these materials. In Figure 6.8 are reported a few
examples of AuAg nanocubes and nanocages with the corresponding UV-Vis spectra. These
structures cover almost entirely the visible range, but their supporting on semiconductor
surfaces and their testing in photochemical application has not been exploited yet.
6.1.3 Cellulose
Glucose and cellobiose were used as probe molecules to assess their chemical activity and
obtain fundamental understanding on the reaction mechanisms and the product distribution.
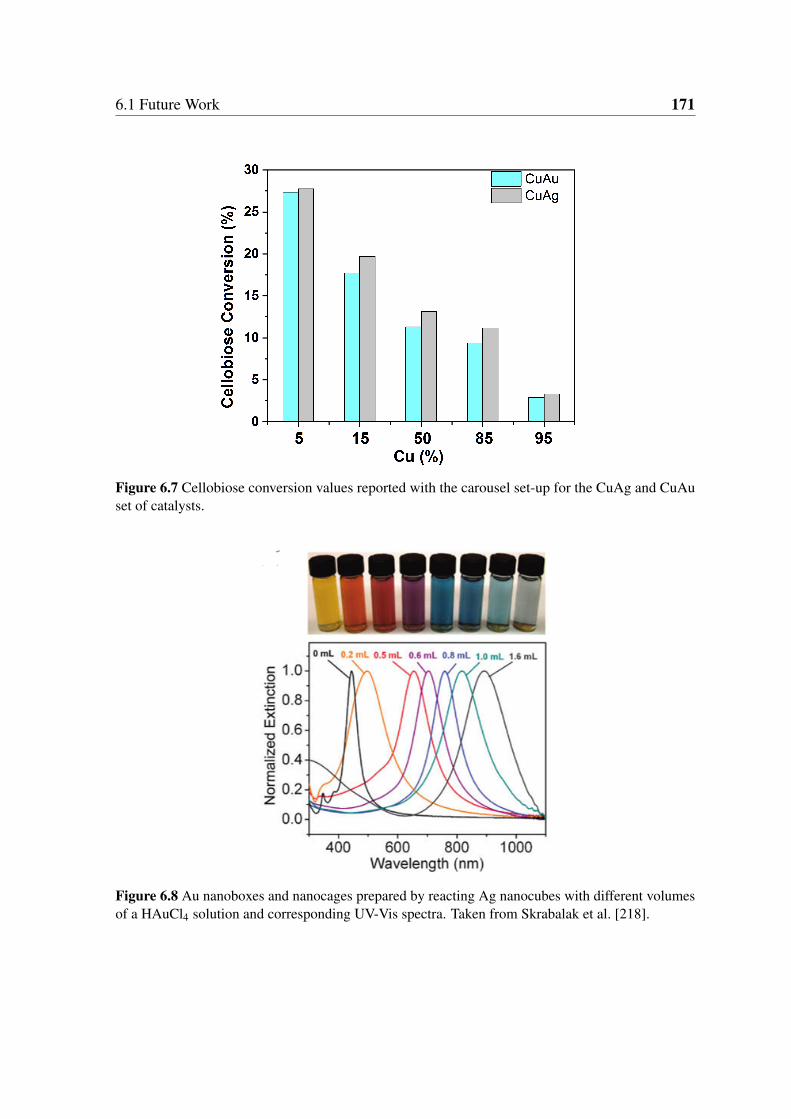
6.1 Future Work 171
Figure 6.7 Cellobiose conversion values reported with the carousel set-up for the CuAg and CuAuset of catalysts.
Figure 6.8 Au nanoboxes and nanocages prepared by reacting Ag nanocubes with different volumesof a HAuCl4 solution and corresponding UV-Vis spectra. Taken from Skrabalak et al. [218].
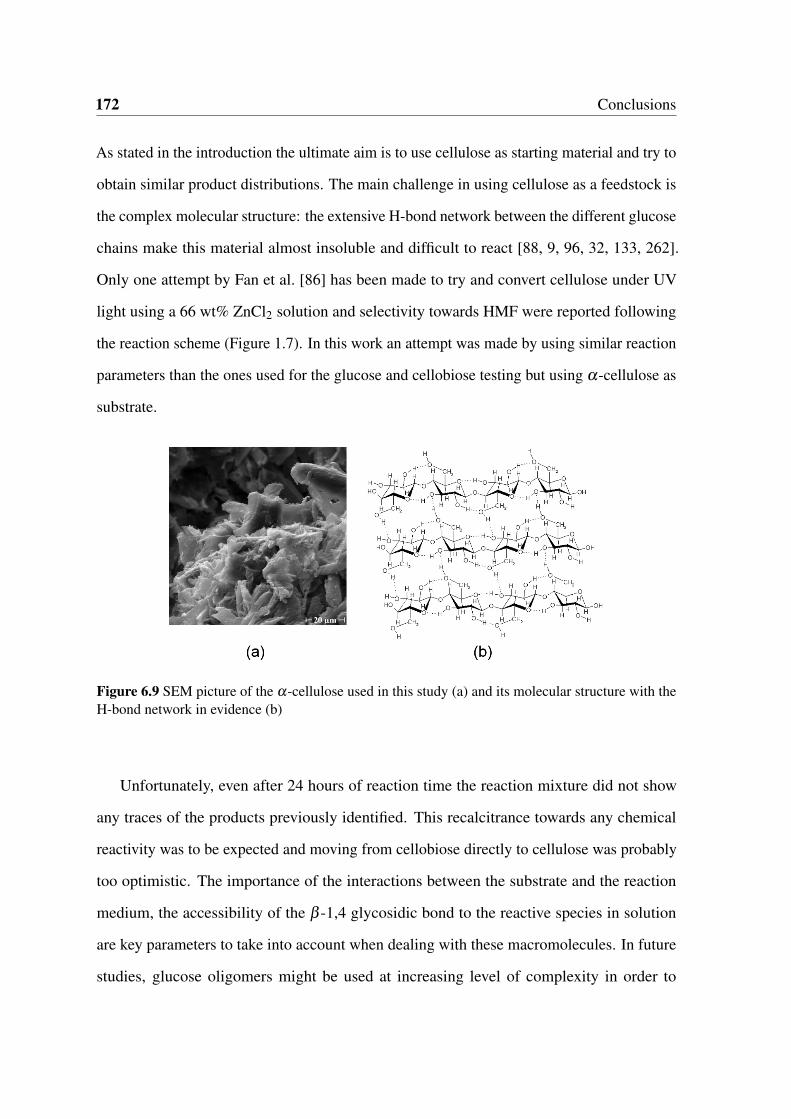
172 Conclusions
As stated in the introduction the ultimate aim is to use cellulose as starting material and try to
obtain similar product distributions. The main challenge in using cellulose as a feedstock is
the complex molecular structure: the extensive H-bond network between the different glucose
chains make this material almost insoluble and difficult to react [88, 9, 96, 32, 133, 262].
Only one attempt by Fan et al. [86] has been made to try and convert cellulose under UV
light using a 66 wt% ZnCl2 solution and selectivity towards HMF were reported following
the reaction scheme (Figure 1.7). In this work an attempt was made by using similar reaction
parameters than the ones used for the glucose and cellobiose testing but using α-cellulose as
substrate.
Figure 6.9 SEM picture of the α-cellulose used in this study (a) and its molecular structure with theH-bond network in evidence (b)
Unfortunately, even after 24 hours of reaction time the reaction mixture did not show
any traces of the products previously identified. This recalcitrance towards any chemical
reactivity was to be expected and moving from cellobiose directly to cellulose was probably
too optimistic. The importance of the interactions between the substrate and the reaction
medium, the accessibility of the β -1,4 glycosidic bond to the reactive species in solution
are key parameters to take into account when dealing with these macromolecules. In future
studies, glucose oligomers might be used at increasing level of complexity in order to
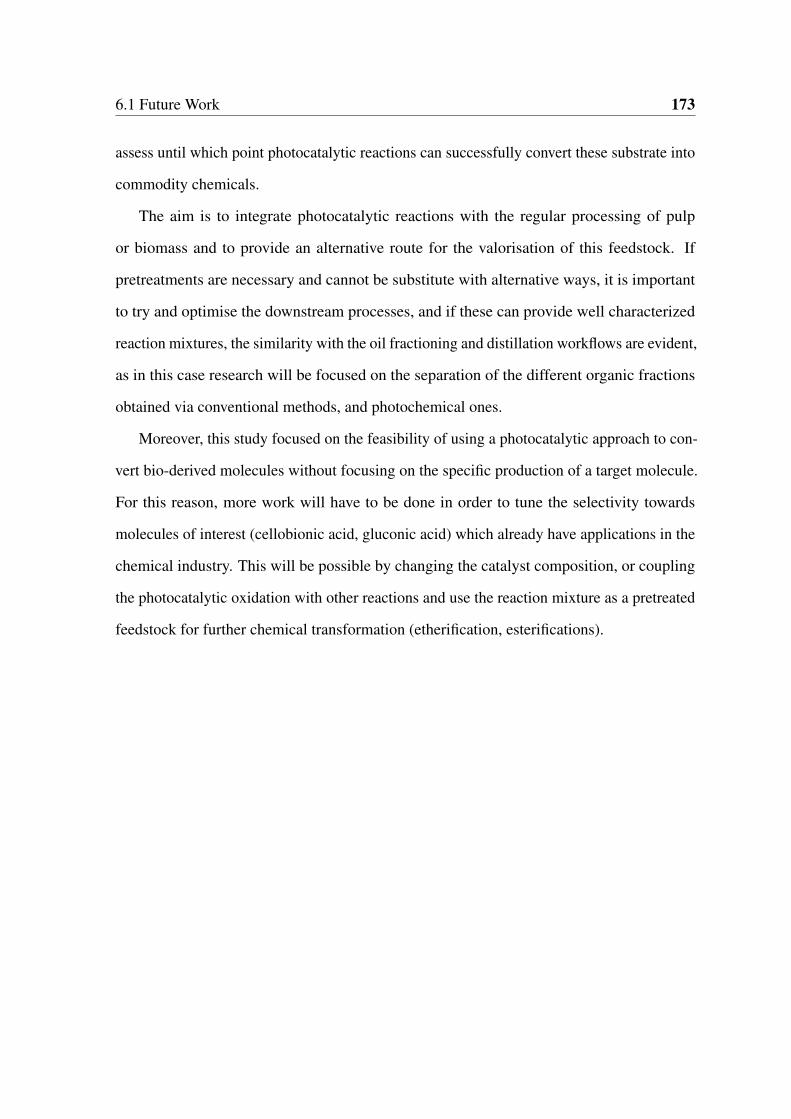
6.1 Future Work 173
assess until which point photocatalytic reactions can successfully convert these substrate into
commodity chemicals.
The aim is to integrate photocatalytic reactions with the regular processing of pulp
or biomass and to provide an alternative route for the valorisation of this feedstock. If
pretreatments are necessary and cannot be substitute with alternative ways, it is important
to try and optimise the downstream processes, and if these can provide well characterized
reaction mixtures, the similarity with the oil fractioning and distillation workflows are evident,
as in this case research will be focused on the separation of the different organic fractions
obtained via conventional methods, and photochemical ones.
Moreover, this study focused on the feasibility of using a photocatalytic approach to con-
vert bio-derived molecules without focusing on the specific production of a target molecule.
For this reason, more work will have to be done in order to tune the selectivity towards
molecules of interest (cellobionic acid, gluconic acid) which already have applications in the
chemical industry. This will be possible by changing the catalyst composition, or coupling
the photocatalytic oxidation with other reactions and use the reaction mixture as a pretreated
feedstock for further chemical transformation (etherification, esterifications).

References
[1] Abbadi, A. and van Bekkum, H. (1995). Effect of pH in the Pt-catalyzed oxidation ofd-glucose to d-gluconic acid. Journal of Molecular Catalysis A: Chemical, 97(2):111 –118.
[2] Acton, Q. (2012). Carboxylic Acids Advances in Research and Application: 2012 Edition.ScholarlyEditions.
[3] Adleman, J. R., Boyd, D. A., Goodwin, D. G., and Psaltis, D. (2009). Heterogenouscatalysis mediated by plasmon heating. Nano Letters, 9(12):4417–4423.
[4] Ahmed, S., Rasul, M., Martens, W., Brown, R., and Hashib, M. (2011). Advances inheterogeneous photocatalytic degradation of phenols and dyes in wastewater: A review.Water, Air, & Soil Pollution, 215(1-4):3–29.
[5] Aikens, C. M., Li, S., and Schatz, G. C. (2008). From discrete electronic states toplasmons: TDDFT optical absorption properties of Ag n ( n = 10, 20, 35, 56, 84, 120)tetrahedral clusters. The Journal of Physical Chemistry C, 112(30):11272–11279.
[6] Akpan, U. and Hameed, B. (2009). Parameters affecting the photocatalytic degradationof dyes using TiO2-based photocatalysts: A review. Journal of Hazardous Materials,170(2–3):520 – 529.
[7] Amaniampong, P. N., Jia, X., Wang, B., Mushrif, S. H., Borgna, A., and Yang, Y. (2015).Catalytic oxidation of cellobiose over TiO2 supported gold-based bimetallic nanoparticles.Catal. Sci. Technol., 5:2393–2405.
[8] Amaniampong, P. N., Li, K., Jia, X., Wang, B., Borgna, A., and Yang, Y. (2014). Titania-supported gold nanoparticles as efficient catalysts for the oxidation of cellobiose to organicacids in aqueous medium. ChemCatChem, 6(7):2105–2114.
[9] Amarasekara, A. S. and Ebede, C. C. (2009). Zinc chloride mediated degradation of cel-lulose at 200°C and identification of the products. Bioresource Technology, 100(21):5301– 5304.
[10] Amarasekara, A. S., Owereh, O. S., and Ezeh, B. (2011). Interactions of d-cellobiosewith p-toluenesulfonic acid in aqueous solution: a 13C NMR study. CarbohydrateResearch, 346(17):2820 – 2822.
[11] Amtout, A. and Leonelli, R. (1995). Optical properties of rutile near its fundamentalband gap. Phys. Rev. B, 51:6842–6851.
[12] Anastas, P. T. and Kirchhoff, M. M. (2002). Origins, current status, and future challengesof green chemistry. Accounts of Chemical Research, 35(9):686–694.
176 References
[13] Arce, M., Quaino, P., and Santos, E. (2013). Electronic changes at the Pt(111) interfaceinduced by the adsorption of OH species. Catalysis Today, 202:120–127.
[14] Asam, M. R. and Glish, G. L. (1997). Tandem mass spectrometry of alkali cationizedpolysaccharides in a quadrupole ion trap. Journal of the American Society for MassSpectrometry, 8(9):987 – 995.
[15] Asencios, Y. J., Bellido, J. D., and Assaf, E. M. (2011). Synthesis of NiO–MgO–ZrO2catalysts and their performance in reforming of model biogas. Applied Catalysis A:General, 397(1–2):138 – 144.
[16] Augugliaro, V., Kisch, H., Loddo, V., López-Muñoz, M. J., Márquez-Álvarez, C.,Palmisano, G., Palmisano, L., Parrino, F., and Yurdakal, S. (2008). Photocatalyticoxidation of aromatic alcohols to aldehydes in aqueous suspension of home-preparedtitanium dioxide: 1. selectivity enhancement by aliphatic alcohols. Applied Catalysis A:General, 349(1–2):182 – 188.
[17] Augugliaro, V., Loddo, V., Pagliaro, M., Palmisano, G., and Palmisano, L. (2010).Clean by Light Irradiation. The Royal Society of Chemistry.
[18] Augugliaro, V., Loddo, V., Palmisano, L., and Schiavello, M. (1995a). Heteroge-neous photocatalytic systems: Influence of some operational variables on actual photonsabsorbed by aqueous dispersions of TiO2. Solar Energy Materials and Solar Cells,38(1–4):411 – 419.
[19] Augugliaro, V., Loddo, V., Palmisano, L., and Schiavello, M. (1995b). Performance ofheterogeneous photocatalytic systems: Influence of operational variables on photoactivityof aqueous suspension of TiO2. Journal of Catalysis, 153(1):32 – 40.
[20] Awazu, K., Fujimaki, M., Rockstuhl, C., Tominaga, J., Murakami, H., Ohki, Y., Yoshida,N., and Watanabe, T. (2008). A plasmonic photocatalyst consisting of silver nanoparticlesembedded in titanium dioxide. Journal of the American Chemical Society, 130(5):1676–1680.
[21] Baatz, C., Thielecke, N., and Prüße, U. (2007). Influence of the preparation conditionson the properties of gold catalysts for the oxidation of glucose. Applied Catalysis B:Environmental, 70(1–4):653 – 660.
[22] Baffou, G., Quidant, R., and Girard, C. (2009). Heat generation in plasmonic nanos-tructures: Influence of morphology. Applied Physics Letters, 94(15):–.
[23] Bahnemann, W., Muneer, M., and Haque, M. (2007). Titanium dioxide-mediatedphotocatalysed degradation of few selected organic pollutants in aqueous suspensions.Catalysis Today, 124(3–4):133 – 148.
[24] Bakardjieva, S., Šubrt, J., Štengl, V., Dianez, M. J., and Sayagues, M. J. (2005).Photoactivity of anatase–rutile TiO2 nanocrystalline mixtures obtained by heat treatmentof homogeneously precipitated anatase. Applied Catalysis B: Environmental, 58(3–4):193– 202.
[25] Bard, A. J. (1980). Photoelectrochemistry. Science, 207(4427):139–144.
[26] Besson, M., Fleche, G., Fuertes, P., Gallezot, P., and Lahmer, F. (1996). Oxidation ofglucose and gluconate on Pt, PtBi, and PtAu catalysts. Recueil des travaux chimiques desPays-Bas-Journal of the Royal Netherlands Chemical Society, 115(4):217–&.
References 177
[27] Besson, M., Gallezot, P., and Pinel, C. (2014). Conversion of biomass into chemicalsover metal catalysts. Chemical Reviews, 114(3):1827–1870.
[28] Bickley, R. I., Gonzalez-Carreno, T., Lees, J. S., Palmisano, L., and Tilley, R. J. (1991).A structural investigation of titanium dioxide photocatalysts. Journal of Solid StateChemistry, 92(1):178 – 190.
[29] Biella, S., Prati, L., and Rossi, M. (2002). Selective oxidation of d-glucose on goldcatalyst. Journal Of Catalysis, 206(2):242–247.
[30] bin Saiman, M. I., Brett, G. L., Tiruvalam, R., Forde, M. M., Sharples, K., Thetford, A.,Jenkins, R. L., Dimitratos, N., Lopez-Sanchez, J. A., Murphy, D. M., Bethell, D., Willock,D. J., Taylor, S. H., Knight, D. W., Kiely, C. J., and Hutchings, G. J. (2012). Involvementof surface-bound radicals in the oxidation of toluene using supported Au-Pd nanoparticles.Angewandte Chemie International Edition, 51(24):5981–5985.
[31] Bizzari, S. N. and Blagoev, M. (2011). "CEH Marketing Research Report: FORMICACID".
[32] Bobleter, O. (1994). Hydrothermal degradation of polymers derived from plants.Progress in Polymer Science, 19(5):797 – 841.
[33] Boehm, H. P. (1971). Acidic and basic properties of hydroxylated metal oxide surfaces.Discuss. Faraday Soc., 52:264–275.
[34] Boonstra, A. H. and Mutsaers, C. A. H. A. (1975). Relation between the photoadsorptionof oxygen and the number of hydroxyl groups on a titanium dioxide surface. The Journalof Physical Chemistry, 79(16):1694–1698.
[35] Boschloo, G. and Fitzmaurice, D. (1999a). Electron accumulation in nanostructuredTiO2 (anatase) electrodes. The Journal of Physical Chemistry B, 103(37):7860–7868.
[36] Boschloo, G. and Fitzmaurice, D. (1999b). Spectroelectrochemical investigation ofsurface states in nanostructured TiO2 electrodes. The Journal of Physical Chemistry B,103(12):2228–2231.
[37] Bowker, M. (2012). Photocatalytic hydrogen production and oxygenate photoreforming.Catalysis Letters, 142(8):923–929.
[38] Bowker, M., Morton, C., Kennedy, J., Bahruji, H., Greves, J., Jones, W., Davies, P.,Brookes, C., Wells, P., and Dimitratos, N. (2014). Hydrogen production by photoreformingof biofuels using Au, Pd and Au–Pd/TiO2 photocatalysts. Journal of Catalysis, 310:10 –15.
[39] Bozell, J. J. and Petersen, G. R. (2010). Technology development for the production ofbiobased products from biorefinery carbohydrates-the US department of energy’s "top10" revisited. Green Chem., 12:539–554.
[40] Bragd, P., van Bekkum, H., and Besemer, A. (2004). TEMPO-mediated oxidation ofpolysaccharides: Survey of methods and applications. Topics in Catalysis, 27(1-4):49–66.
[41] Bragd, P. L., Besemer, A. C., and van Bekkum, H. (2002). Selective oxidation ofcarbohydrates by 4-AcNH-TEMPO/peracid systems. Carbohydrate Polymers, 49(4):397 –406.
[42] Branson, J. (2004). System and method for extracting energy from agricultural waste.
178 References
[43] Brochette-Lemoine, S., Joannard, D., Descotes, G., Bouchu, A., and Queneau, Y. (1999).Sonocatalysis of the TEMPO-mediated oxidation of glucosides. Journal of MolecularCatalysis A: Chemical, 150(1-2):31 – 36.
[44] Bumajdad, A. and Madkour, M. (2014). Understanding the superior photocatalyticactivity of noble metals modified titania under UV and visible light irradiation. Phys.Chem. Chem. Phys., 16:7146–7158.
[45] Campbell, W. M., Burrell, A. K., Officer, D. L., and Jolley, K. W. (2004). Porphyrinsas light harvesters in the dye-sensitised TiO2 solar cell. Coordination Chemistry Reviews,248(13-14):1363 – 1379.
[46] Carneiro, J., Yang, C.-C., Moma, J., Moulijn, J., and Mul, G. (2009). How golddeposition affects anatase performance in the photo-catalytic oxidation of cyclohexane.Catalysis Letters, 129(1-2):12–19.
[47] Carp, O., Huisman, C., and Reller, A. (2004). Photoinduced reactivity of titaniumdioxide. Progress in Solid State Chemistry, 32(1-2):33 – 177.
[48] Cepak, V. M. and Martin, C. R. (1998). Preparation and stability of template-synthesized metal nanorod sols in organic solvents. The Journal of Physical Chemistry B,102(49):9985–9990.
[49] Chatterjee, C., Pong, F., and Sen, A. (2015). Chemical conversion pathways forcarbohydrates. Green Chem., 17:40–71.
[50] Chen, G., Andries, J., and Spliethoff, H. (2003). Catalytic pyrolysis of biomass forhydrogen rich fuel gas production. Energy Conversion and Management, 44(14):2289 –2296.
[51] Chen, X. and Mao, S. S. (2007). Titanium dioxide nanomaterials: Synthesis, properties,modifications, and applications. Chemical Reviews, 107(7):2891–2959.
[52] Chen, X., Zheng, Z., Ke, X., Jaatinen, E., Xie, T., Wang, D., Guo, C., Zhao, J., and Zhu,H. (2010). Supported silver nanoparticles as photocatalysts under ultraviolet and visiblelight irradiation. Green Chem., 12:414–419.
[53] Chong, R., Li, J., Ma, Y., Zhang, B., Han, H., and Li, C. (2014). Selective conversionof aueous glucose to value-added sugar aldose on TiO2-based photocatalysts. Journal ofCatalysis, 314:101 – 108.
[54] Christopher, P., Xin, H., and Linic, S. (2011). Visible-light-enhanced catalytic oxidationreactions on plasmonic silver nanostructures. Nature Publishing Group, 3(6).
[55] Clark, J. and Deswarte, F. (2014). Introduction to Chemicals from Biomass. WileySeries in Renewable Resource. Wiley.
[56] Climent, M. J., Corma, A., and Iborra, S. (2011). Converting carbohydrates to bulkchemicals and fine chemicals over heterogeneous catalysts. Green Chem., 13:520–540.
[57] Collinson, S. and Thielemans, W. (2010). The catalytic oxidation of biomass to newmaterials focusing on starch, cellulose and lignin. Coordination Chemistry Reviews,254(15–16):1854 – 1870.
[58] Colmenares, J. C. and Luque, R. (2014). Heterogeneous photocatalytic nanomaterials:Prospects and challenges in selective transformations of biomass-derived compounds.Chem. Soc. Rev., 43:765–778.
References 179
[59] Colmenares, J. C. and Magdziarz, A. (2013). Room temperature versatile conversionof biomass-derived compounds by means of supported TiO2 photocatalysts. Journal ofMolecular Catalysis A: Chemical, 366(0):156 – 162.
[60] Colmenares, J. C., Magdziarz, A., Aramendia, M. A., Marinas, A., Marinas, J. M.,Urbano, F. J., and Navio, J. A. (2011a). Influence of the strong metal support interac-tion effect (SMSI) of Pt/TiO2 and Pd/TiO2 systems in the photocatalytic biohydrogenproduction from glucose solution. Catalysis Communications, 16(1):1 – 6.
[61] Colmenares, J. C., Magdziarz, A., and Bielejewska, A. (2011b). High-value chemicalsobtained from selective photo-oxidation of glucose in the presence of nanostructuredtitanium photocatalysts. Bioresource Technology, 102(24):11254 – 11257.
[62] Colmenares, J. C., Magdziarz, A., Chernyayeva, O., Lisovytskiy, D., Kurzydłowski, K.,and Grzonka, J. (2013a). Sonication-assisted low-temperature routes for the synthesisof supported Fe–TiO2 econanomaterials: Partial photooxidation of glucose and phenolaqueous degradation. ChemCatChem, 5(8):2270–2277.
[63] Colmenares, J. C., Magdziarz, A., Kurzydlowski, K., Grzonka, J., Chernyayeva, O., andLisovytskiy, D. (2013b). Low-temperature ultrasound-promoted synthesis of Cr–TiO2-supported photocatalysts for valorization of glucose and phenol degradation from liquidphase. Applied Catalysis B: Environmental, 134–135:136 – 144.
[64] Comotti, M., Della Pina, C., Matarrese, R., and Rossi, M. (2004). The catalytic activityof “naked” gold particles. Angewandte Chemie International Edition, 43(43):5812–5815.
[65] Corma, A., Iborra, S., and Velty, A. (2007). Chemical routes for the transformation ofbiomass into chemicals. Chemical Reviews, 107(6):2411–2502.
[66] Cortright, R. D., Davda, R. R., and Dumesic, J. A. (2002). Hydrogen from catalyticreforming of biomass–derived hydrocarbons in liquid water. Nature, 418:964–967.
[67] Dambournet, D., Belharouak, I., and Amine, K. (2010). Tailored preparation methodsof TiO2 anatase, rutile, brookite: Mechanism of formation and electrochemical properties.Chemistry of Materials, 22(3):1173–1179.
[68] Das, D. and Veziroglu, T. (2001). Hydrogen production by biological processes: Asurvey of literature. International Journal of Hydrogen Energy, 26(1):13 – 28.
[69] de Nooy, A. E., Besemer, A. C., and van Bekkum, H. (1995). Highly selective ni-troxyl radical-mediated oxidation of primary alcohol groups in water-soluble glucans.Carbohydrate Research, 269(1):89 – 98.
[70] de Wilt, H. G. J. (1972). Part I. oxidation of glucose to gluconic acid. survey oftechniques. Product R&D, 11(4):370–373.
[71] Delidovich, I., Taran, O., Matvienko, L., Simonov, A., Simakova, I., Bobrovskaya, A.,and Parmon, V. (2010). Selective oxidation of glucose over carbon-supported Pd and Ptcatalysts. Catalysis Letters, 140(1-2):14–21.
[72] Demirbas, A. (2002). Hydrogen production from biomass by the gasification process.Energy Sources, 24(1):59–68.
[73] Deng, W., Liu, M., Tan, X., Zhang, Q., and Wang, Y. (2010). Conversion of cellobioseinto sorbitol in neutral water medium over carbon nanotube-supported ruthenium catalysts.Journal of Catalysis, 271(1):22 – 32.
180 References
[74] Desai, R. L. and Shields, J. A. (1969). Photochemical degradation of cellulosea material.Die Makromolekulare Chemie, 122(1):134–144.
[75] Desai, S. H., Rabinovitch-Deere, C. A., Fan, Z., and Atsumi, S. (2015). Isobutanolproduction from cellobionic acid in escherichia coli. Microbial Cell Factories, 14(1):1–10.
[76] Diez, I. and Ras, R. H. A. (2011). Fluorescent silver nanoclusters. Nanoscale, 3:1963–1970.
[77] Domon, B. and Costello, C. (1988). A systematic nomenclature for carbohydratefragmentations in FAB-MS/MS spectra of glycoconjugates. Glycoconjugate Journal,5(4):397–409.
[78] Du, M.-H., Feng, J., and Zhang, S. B. (2007). Photo-oxidation of polyhydroxylmolecules on TiO2 surfaces: From hole scavenging to light-induced self-assembly ofTiO2-cyclodextrin wires. Phys. Rev. Lett., 98:066102.
[79] Du, P., Moulijn, J. A., and Mul, G. (2006). Selective photo(catalytic)-oxidation ofcyclohexane: Effect of wavelength and TiO2 structure on product yields. Journal ofCatalysis, 238(2):342 – 352.
[80] Du, Y. and Rabani, J. (2003). The measure of TiO2 photocatalytic efficiency and thecomparison of different photocatalytic titania. The Journal of Physical Chemistry B,107(43):11970–11978.
[81] Dweydari, A. W. and Mee, C. H. B. (1975). Work function measurements on (100) and(110) surfaces of silver. physica status solidi (a), 27(1):223–230.
[82] Eastman, D. E. (1970). Photoelectric work functions of transition, rare-earth, and noblemetals. Phys. Rev. B, 2:1–2.
[83] Ebringerová, A., Hromádková, Z., and Heinze, T. (2005). Hemicellulose. In Heinze,T., editor, Polysaccharides I, volume 186 of Advances in Polymer Science, pages 1–67.Springer Berlin Heidelberg.
[84] Egerton, T. and King, C. (1979). The influence of light intensity on photoactivity in TiO2pigmented systems. Journal of the Oil and Colour Chemists Association, 62(10):386–391.
[85] Enright, B., Redmond, G., and Fitzmaurice, D. (1994). Spectroscopic determinationof flatband potentials for polycrystalline TiO2 electrodes in mixed solvent systems. TheJournal of Physical Chemistry, 98(24):6195–6200.
[86] Fan, H., Li, G., Yang, F., Yang, L., and Zhang, S. (2011). Photodegradation of celluloseunder UV light catalysed by TiO2. Journal of Chemical Technology & Biotechnology,86(8):1107–1112.
[87] Farrell, A. E., Plevin, R. J., Turner, B. T., Jones, A. D., O’Hare, M., and Kammen,D. M. (2006). Ethanol can contribute to energy and environmental goals. Science,311(5760):506–508.
[88] Fischer, S., Leipner, H., Thümmler, K., Brendler, E., and Peters, J. (2003). Inorganicmolten salts as solvents for cellulose. Cellulose, 10(3):227–236.
[89] Forsberg, Z., Vaaje-Kolstad, G., Westereng, B., Bunaes, A. C., Stenstrom, Y., MacKen-zie, A., Sorlie, M., Horn, S. J., and Eijsink, V. G. (2011). Cleavage of cellulose by aCBM33 protein. Protein Science, 20(9):1479–1483.
References 181
[90] Fraser, I. M. and MacCallum, J. R. (1986). Photocatalytic dehydrogenation of liquidpropan-2-ol by TiO2. part 1.- kinetics. J. Chem. Soc., Faraday Trans. 1, 82:607–615.
[91] Fu, Q. and Sun, W. (2001). Mie theory for light scattering by a spherical particle in anabsorbing medium. Appl. Opt., 40(9):1354–1361.
[92] Fu, X., Long, J., Wang, X., Leung, D. Y., Ding, Z., Wu, L., Zhang, Z., Li, Z., and Fu, X.(2008). Photocatalytic reforming of biomass: A systematic study of hydrogen evolutionfrom glucose solution. International Journal of Hydrogen Energy, 33(22):6484 – 6491.
[93] Fujishima, A., Hashimoto, K., and Watanabe, T. (1999). TiO2 Photocatalysis: Funda-mentals and Applications. BKC.
[94] Fujishima, A., Rao, T. N., and Tryk, D. A. (2000). Titanium dioxide photocatalysis.Journal of Photochemistry and Photobiology C: Photochemistry Reviews, 1(1):1 – 21.
[95] Fujishima, A., Zhang, X., and Tryk, D. A. (2008). TiO2 photocatalysis and relatedsurface phenomena. Surface Science Reports, 63(12):515 – 582.
[96] Fukuoka, A. and Dhepe, P. L. (2006). Catalytic conversion of cellulose into sugaralcohols. Angewandte Chemie International Edition, 45(31):5161–5163.
[97] Garcia, L., French, R., Czernik, S., and Chornet, E. (2000). Catalytic steam reformingof bio-oils for the production of hydrogen: effects of catalyst composition. AppliedCatalysis A: General, 201(2):225 – 239.
[98] Geboers, J., Van de Vyver, S., Carpentier, K., de Blochouse, K., Jacobs, P., and Sels,B. (2010). Efficient catalytic conversion of concentrated cellulose feeds to hexitols withheteropoly acids and Ru on carbon. Chem. Commun., 46:3577–3579.
[99] Giannotti, C., Greneur, S. L., and Watts, O. (1983). Photo-oxidation of alkanes bymetal oxide semiconductors. Tetrahedron Letters, 24(46):5071 – 5072.
[100] Gomez, L., Sebastian, V., Arruebo, M., Santamaria, J., and Cronin, S. B. (2014).Plasmon-enhanced photocatalytic water purification. Phys. Chem. Chem. Phys., 16:15111–15116.
[101] Grabowska, E., Zaleska, A., Sorgues, S., Kunst, M., Etcheberry, A., Colbeau-Justin,C., and Remita, H. (2013). Modification of titanium(IV) dioxide with small silvernanoparticles: Application in photocatalysis. The Journal of Physical Chemistry C,117(4):1955–1962.
[102] Gratzel, M. (2001). Photoelectrochemical cells. Nature, 414(6861):338–344.
[103] Greenbaum, E., Tevault, C. V., and Ma, C. Y. (1995). New photosynthesis: Directphotoconversion of biomass to molecular oxygen and volatile hydrocarbons. Energy &Fuels, 9(1):163–167.
[104] Gutierrez, L.-F., Hamoudi, S., and Belkacemi, K. (2011). Selective productionof lactobionic acid by aerobic oxidation of lactose over gold crystallites supported onmesoporous silica. Applied Catalysis A: General, 402(1–2):94 – 103.
[105] Hallenbeck, P. C. and Benemann, J. R. (2002). Biological hydrogen produc-tion; fundamentals and limiting processes. International Journal of Hydrogen Energy,27(11–12):1185 – 1193.
182 References
[106] Harvey, P. R., Rudham, R., and Ward, S. (1983). Photocatalytic oxidation of liquidalcohols and binary alcohol mixtures by rutile. J. Chem. Soc., Faraday Trans. 1, 79:2975–2981.
[107] Hendriks, A. and Zeeman, G. (2009). Pretreatments to enhance the digestibility oflignocellulosic biomass. Bioresource Technology, 100(1):10 – 18.
[108] Huang, H., Sivayoganathan, M., Duley, W., and Zhou, Y. (2015). Efficient localizedheating of silver nanoparticles by low-fluence femtosecond laser pulses. Applied SurfaceScience, 331:392 – 398.
[109] Huang, X., Wang, X., Wang, X., Wang, X., Tan, M., Ding, W., and Lu, X. (2013).P123-stabilized Au-Ag alloy nanoparticles for kinetics of aerobic oxidation of benzylalcohol in aqueous solution. Journal of Catalysis, 301(0):217 – 226.
[110] Huang, Y.-F., Zhang, M., Zhao, L.-B., Feng, J.-M., Wu, D.-Y., Ren, B., and Tian, Z.-Q.(2014). Activation of oxygen on gold and silver nanoparticles assisted by surface plasmonresonances. Angewandte Chemie International Edition, 53(9):2353–2357.
[111] Huber, G. W., Iborra, S., and Corma, A. (2006). Synthesis of transportation fuels frombiomass: Chemistry, catalysts, and engineering. Chemical Reviews, 106(9):4044–4098.
[112] Hudlicky, M. (1990). Oxidations in Organic Chemistry. ACS monograph: AmericanChemical Society. Wiley.
[113] Hurum, D. C., Agrios, A. G., Gray, K. A., Rajh, T., and Thurnauer, M. C. (2003).Explaining the enhanced photocatalytic activity of Degussa P25 mixed-phase TiO2 usingEPR. The Journal of Physical Chemistry B, 107(19):4545–4549.
[114] Hussein, F. H., Pattenden, G., Rudham, R., and Russell, J. J. (1984). Photo-oxidationof alcohols catalysed by platinised titanium dioxide. Tetrahedron Letters, 25(31):3363 –3364.
[115] Hustede, H., Haberstroh, H.-J., and Schinzig, E. (2000). Gluconic Acid. Wiley-VCHVerlag GmbH & Co. KGaA.
[116] Ibrahim, M., Alaam, M., El-Haes, H., Jalbout, A. F., and Leon, A. d. (2006). Analysisof the structure and vibrational spectra of glucose and fructose. Ecletica Quimica, 31:15 –21.
[117] Indrakanti, V. P., Kubicki, J. D., and Schobert, H. H. (2009). Photoinduced activationof CO2 on ti-based heterogeneous catalysts: Current state, chemical physics-based insightsand outlook. Energy Environ. Sci., 2:745–758.
[118] Jacoby, W., Blake, D., Noble, R., and Koval, C. (1995). Kinetics of the oxidation oftrichloroethylene in air via heterogeneous photocatalysis. Journal of Catalysis, 157(1):87– 96.
[119] Jain, P. K., Lee, K. S., El-Sayed, I. H., , and El-Sayed, M. A. (2006). Calculatedabsorption and scattering properties of gold nanoparticles of different size, shape, andcomposition: Applications in biological imaging and biomedicine. The Journal of PhysicalChemistry B, 110(14):7238–7248.
[120] Janus, M. and Morawski, A. (2007). New method of improving photocatalyticactivity of commercial Degussa P25 for azo dyes decomposition. Applied Catalysis B:Environmental, 75(1–2):118 – 123.

References 183
[121] Kapdan, I. K. and Kargi, F. (2006). Bio-hydrogen production from waste materials.Enzyme and Microbial Technology, 38(5):569 – 582.
[122] Kawahara, K., Suzuki, K., Ohko, Y., and Tatsuma, T. (2005). Electron transport insilver-semiconductor nanocomposite films exhibiting multicolor photochromism. Phys.Chem. Chem. Phys., 7:3851–3855.
[123] Kawai, T. and Sakata, T. (1980). Conversion of carbohydrate into hydrogen fuel by aphotocatalytic process. Nature, 286(5772):474–476.
[124] Kazuma, E., Sakai, N., and Tatsuma, T. (2011). Nanoimaging of localized plasmon-induced charge separation. Chem. Commun., 47:5777–5779.
[125] Kazuma, E. and Tatsuma, T. (2012). Photoinduced reversible changes in morphologyof plasmonic Ag nanorods on TiO2 and application to versatile photochromism. Chem.Commun., 48:1733–1735.
[126] Kelly, K. L., Coronado, E., Zhao, L. L., and Schatz, G. C. (2003). The opticalproperties of metal nanoparticles: The influence of size, shape, and dielectric environment.The Journal of Physical Chemistry B, 107(3):668–677.
[127] Kennedy, J., Jones, W., J.Morgan, D., Bowker, M., Lu, L., J.Kiely, C., P.Wells, P., andDimitratos, N. (2015). Photocatalytic hydrogen production by reforming of methanolusing Au/TiO2, Ag/TiO2 and Au-Ag/TiO2 catalysts. Catalysis, Structure & Reactivity,1(1):35–43.
[128] Khan, M. R., Chuan, T. W., Yousuf, A., Chowdhury, M. N. K., and Cheng, C. K. (2015).Schottky barrier and surface plasmonic resonance phenomena towards the photocatalyticreaction: study of their mechanisms to enhance photocatalytic activity. Catal. Sci. Technol.,5:2522–2531.
[129] Khanna, P., Gokhale, R., Subbarao, V., Vishwanath, A. K., Das, B., and Satyanarayana,C. (2005). PVA stabilized gold nanoparticles by use of unexplored albeit conventionalreducing agent. Materials Chemistry and Physics, 92(1):229 – 233.
[130] Kim, G., Lee, S.-H., and Choi, W. (2015). Glucose–TiO2 charge transfer complex-mediated photocatalysis under visible light. Applied Catalysis B: Environmental,162(0):463 – 469.
[131] Kim, W., Tachikawa, T., Moon, G.-h., Majima, T., and Choi, W. (2014). Molecular-level understanding of the photocatalytic activity difference between anatase and rutilenanoparticles. Angewandte Chemie International Edition, 53(51):14036–14041.
[132] Kisch, H. (2010). On the problem of comparing rates or apparent quantum yields inheterogeneous photocatalysis. Angewandte Chemie International Edition, 49(50):9588–9589.
[133] Klemm, D., Philipp, B., Heinze, T., Heinze, U., and Wagenknecht, W. (2004). GeneralConsiderations on Structure and Reactivity of Cellulose: Section 2.1–2.1.4, pages 9–29.Wiley-VCH Verlag GmbH & Co. KGaA.
[134] Kolbitsch, P., Pfeifer, C., and Hofbauer, H. (2008). Catalytic steam reforming ofmodel biogas. Fuel, 87(6):701 – 706.
[135] Kondarides, D., Daskalaki, V., Patsoura, A., and Verykios, X. (2008). Hydrogenproduction by photo-induced reforming of biomass components and derivatives at ambientconditions. Catalysis Letters, 122(1-2):26–32.
184 References
[136] Kortum, G., Braun, W., and Herzog, G. (1963). Principles and techniques of diffuse-reflectance spectroscopy. Angewandte Chemie International Edition in English, 2(7):333–341.
[137] Kubacka, A., Fernández-García, M., and Colón, G. (2012). Advanced nanoarchitec-tures for solar photocatalytic applications. Chemical Reviews, 112(3):1555–1614.
[138] Kubelka, P. and Munk, F. (1931). An article on optics of paint layers. Z. Tech. Phys,12(593-601).
[139] Kumar, P., Badrinarayanan, S., and Sastry, M. (2000). Nanocrystalline TiO2 studiedby optical, FTIR and X-ray photoelectron spectroscopy: correlation to presence of surfacestates. Thin Solid Films, 358(1–2):122 – 130.
[140] Kusema, B. T. and Murzin, D. Y. (2013). Catalytic oxidation of rare sugars over goldcatalysts. Catal. Sci. Technol., 3:297–307.
[141] Lalitha, K., Reddy, J. K., Sharma, M. V. P., Kumari, V. D., and Subrahmanyam,M. (2010). Continuous hydrogen production activity over finely dispersed Ag2O/TiO2catalysts from methanol:water mixtures under solar irradiation: A structure–activitycorrelation. International Journal of Hydrogen Energy, 35(9):3991 – 4001.
[142] Lang, X., Ma, W., Chen, C., Ji, H., and Zhao, J. (2014). Selective aerobic oxidationmediated by TiO2 photocatalysis. Accounts of Chemical Research, 47(2):355–363.
[143] Lee, S. G., Choi, J. I., Koh, W., and Jang, S. S. (2013). Adsorption of β -d-glucoseand cellobiose on kaolinite surfaces: Density functional theory (DFT) approach. AppliedClay Science, 71:73 – 81.
[144] Leitner, W. (1995). Carbon dioxide as a raw material: The synthesis of formic acidand its derivatives from CO2. Angewandte Chemie International Edition in English,34(20):2207–2221.
[145] Levin, D. B., Pitt, L., and Love, M. (2004). Biohydrogen production: prospects andlimitations to practical application. International Journal of Hydrogen Energy, 29(2):173– 185.
[146] Li, W., Du, D., Yan, T., Kong, D., You, J., and Li, D. (2015). Relationship betweensurface hydroxyl groups and liquid-phase photocatalytic activity of titanium dioxide.Journal of colloid and interface science, 444:42—48.
[147] Li, Y., Sasaki, T., Shimizu, Y., and Koshizaki, N. (2008). Hexagonal-close-packed,hierarchical amorphous TiO2 nanocolumn arrays: Transferability, enhanced photocat-alytic activity, and superamphiphilicity without UV irradiation. Journal of the AmericanChemical Society, 130(44):14755–14762.
[148] Liang, G., Wu, C., He, L., Ming, J., Cheng, H., Zhuo, L., and Zhao, F. (2011). Selectiveconversion of concentrated microcrystalline cellulose to isosorbide over Ru/C catalyst.Green Chem., 13:839–842.
[149] Liang, X., Liu, C.-j., and Kuai, P. (2008). Selective oxidation of glucose to gluconicacid over argon plasma reduced Pd/Al2O3. Green Chem., 10:1318–1322.
[150] Linic, S., Aslam, U., Boerigter, C., and Morabito, M. (2015). Photochemical transfor-mations on plasmonic metal nanoparticles. Nature Materials, 14(6):567–576.
References 185
[151] Liu, L., Peng, P., Hu, A., Zou, G., Duley, W. W., and Zhou, Y. N. (2013). Highly local-ized heat generation by femtosecond laser induced plasmon excitation in Ag nanowires.Applied Physics Letters, 102(7):–.
[152] Liu, S., Chen, G., Prasad, P. N., and Swihart, M. T. (2011a). Synthesis of monodisperseAu, Ag, and Au–Ag alloy nanoparticles with tunable size and surface plasmon resonancefrequency. Chemistry of Materials, 23(18):4098–4101.
[153] Liu, X., Wang, A., Yang, X., Zhang, T., Mou, C.-Y., Su, D.-S., and Li, J. (2009).Synthesis of thermally stable and highly active bimetallic Au–Ag nanoparticles on inertsupports. Chemistry of Materials, 21(2):410–418.
[154] Liu, Z., Hou, W., Pavaskar, P., Aykol, M., and Cronin, S. B. (2011b). Plasmon resonantenhancement of photocatalytic water splitting under visible illumination. Nano Letters,11(3):1111–1116.
[155] Liu L-L, Yi T, Z. X. (2015). Antitumor effect of d-erythrose in an abdominal metastaticmodel of colon carcinoma. Oncology Letters., 9(2):769–773.
[156] Lopez, R. and Gomez, R. (2012). Band-gap energy estimation from diffuse reflectancemeasurements on sol-gel and commercial TiO2: a comparative study. Journal of Sol-GelScience and Technology, 61(1):1 – 7.
[157] Lopez-Sanchez, J. A., Dimitratos, N., Hammond, C., Brett, G. L., Kesavan, L., White,S., Miedziak, P., Tiruvalam, R., Jenkins, R. L., Carley, A. F., Knight, D., Kiely, C. J.,and Hutchings, G. J. (2011). Facile removal of stabilizer-ligands from supported goldnanoparticles. Nature Chemistry, 3(7).
[158] López-Tenllado, F., Marinas, A., Urbano, F., Colmenares, J., Hidalgo, M., Marinas,J., and Moreno, J. (2012). Selective photooxidation of alcohols as test reaction forphotocatalytic activity. Applied Catalysis B: Environmental, 128:150 – 158.
[159] Luken, A., Muhler, M., and Strunk, J. (2015). On the role of gold nanoparticles inthe selective photooxidation of 2-propanol over Au/TiO2. Phys. Chem. Chem. Phys.,17:10391–10397.
[160] Maki-Arvela, P., Tokarev, A. V., Murzina, E. V., Campo, B., Heikkila, T., Brozinski,J.-M., Wolf, D., and Murzin, D. Y. (2011). Kinetics of lactose and rhamnose oxidationover supported metal catalysts. Phys. Chem. Chem. Phys., 13:9268–9280.
[161] Mendez-Ramos, J., Acosta-Mora, P., Ruiz-Morales, J. C., Hernandez, T., Borges,M. E., and Esparza, P. (2013). Turning into the blue: materials for enhancing TiO2photocatalysis by up-conversion photonics. RSC Adv., 3:23028–23034.
[162] Michaelson, H. B. (1977). The work function of the elements and its periodicity.Journal of Applied Physics, 48(11):4729–4733.
[163] Miedziak, P. J., Alshammari, H., Kondrat, S. A., Clarke, T. J., Davies, T. E., Morad,M., Morgan, D. J., Willock, D. J., Knight, D. W., Taylor, S. H., and Hutchings, G. J.(2014). Base-free glucose oxidation using air with supported gold catalysts. Green Chem.,16:3132–3141.
[164] Mills, A., Davies, R. H., and Worsley, D. (1993). Water purification by semiconductorphotocatalysis. Chem. Soc. Rev., 22:417–425.
[165] Mills, A. and Hunte, S. L. (1997). An overview of semiconductor photocatalysis.Journal of Photochemistry and Photobiology A: Chemistry, 108(1):1 – 35.
186 References
[166] Minero, C., Catozzo, F., and Pelizzetti, E. (1992). Role of adsorption in photocatalyzedreactions of organic molecules in aqueous titania suspensions. Langmuir, 8(2):481–486.
[167] Mirescu, A. and Prüße, U. (2007). A new environmental friendly method for thepreparation of sugar acids via catalytic oxidation on gold catalysts. Applied Catalysis B:Environmental, 70(1–4):644 – 652.
[168] Mock, J. J., Barbic, M., Smith, D. R., Schultz, D. A., and Schultz, S. (2002). Shapeeffects in plasmon resonance of individual colloidal silver nanoparticles. The Journal ofChemical Physics, 116(15):6755–6759.
[169] Moe, S., Holen, A., and Schult, T. (2002). 4-O-beta-d-glucopyranosyl-d-gluconic acid(cellobionic acid) produced by ozonation of cellobiose: isolation by HPLC and assignmentof NMR chemical shifts. Journal of carbohydrate chemistry, 21(6):513 – 520.
[170] Mogensen, K. B. and Kneipp, K. (2014). Size-dependent shifts of plasmon resonancein silver nanoparticle films using controlled dissolution: Monitoring the onset of surfacescreening effects. The Journal of Physical Chemistry C, 118(48):28075–28083.
[171] Mohamed, O. S., Ahmed, S. A., Mostafa, M. F., and Abdel-Wahab, A.-M. A. (2008).Nanoparticles TiO2-photocatalyzed oxidation of selected cyclohexyl alcohols. Journal ofPhotochemistry and Photobiology A: Chemistry, 200(2–3):209 – 215.
[172] Mohamed, O. S., Gaber, A. E.-A. M., and Abdel-Wahab, A. (2002). Photocatalyticoxidation of selected aryl alcohols in acetonitrile. Journal of Photochemistry and Photobi-ology A: Chemistry, 148(1–3):205 – 210.
[173] Mohanty, P., Pant, K. K., and Mittal, R. (2015). Hydrogen generation from biomassmaterials: challenges and opportunities. Wiley Interdisciplinary Reviews: Energy andEnvironment, 4(2):139–155.
[174] Montoya, J., Velásquez, J., and Salvador, P. (2009). The direct–indirect kinetic modelin photocatalysis: A reanalysis of phenol and formic acid degradation rate dependenceon photon flow and concentration in TiO2 aqueous dispersions. Applied Catalysis B:Environmental, 88(1–2):50 – 58.
[175] Montoya, J. F., Bahnemann, D. W., Peral, J., and Salvador, P. (2014). Catalytic roleof TiO2 terminal oxygen atoms in liquid-phase photocatalytic reactions: Oxidation ofaromatic compounds in anhydrous acetonitrile. ChemPhysChem, 15(11):2311–2320.
[176] Morris, A. J., Meyer, G. J., and Fujita, E. (2009). Molecular approaches to thephotocatalytic reduction of carbon dioxide for solar fuels. Accounts of Chemical Research,42(12):1983–1994.
[177] Mosier, N., Wyman, C., Dale, B., Elander, R., Lee, Y., Holtzapple, M., and Ladisch,M. (2005). Features of promising technologies for pretreatment of lignocellulosic biomass.Bioresource Technology, 96(6):673 – 686.
[178] Murphy, V., Shoemaker, J., Zhu, G., Archer, R., Salem, G., and Dias, E. (2011).Oxidation catalysts.
[179] Murugadoss, A., Kai, N., and Sakurai, H. (2012). Synthesis of bimetallic gold-silveralloy nanoclusters by simple mortar grinding. Nanoscale, 4:1280–1282.
References 187
[180] Murzina, E. V., Tokarev, A. V., Kordás, K., Karhu, H., Mikkola, J.-P., and Murzin,D. Y. (2008). d-Lactose oxidation over gold catalysts. Catalysis Today, 131(1–4):385 –392. Recent advances in catalysis - selected papers from APCAT 4 (Singapore, 6-8December 2006).
[181] Naoi, K., Ohko, Y., , and Tatsuma, T. (2004). TiO2 films loaded with silver nanoparti-cles: Control of multicolor photochromic behavior. Journal of the American ChemicalSociety, 126(11):3664–3668.
[182] Ni, M., Leung, D. Y., Leung, M. K., and Sumathy, K. (2006). An overview of hydrogenproduction from biomass. Fuel Processing Technology, 87(5):461 – 472.
[183] Niemantsverdriet, J. W. (2007). Photoemission and Auger Spectroscopy, pages 39–83.Wiley-VCH Verlag GmbH & Co. KGaA.
[184] Nishijima, Y., Ueno, K., Yokota, Y., Murakoshi, K., and Misawa, H. (2010). Plasmon-assisted photocurrent generation from visible to near-infrared wavelength using a Au-nanorods/TiO2 electrode. The Journal of Physical Chemistry Letters, 1(13):2031–2036.
[185] Noguez, C. (2007). Surface plasmons on metal nanoparticles: The influence of shapeand physical environment. The Journal of Physical Chemistry C, 111(10):3806–3819.
[186] Ochiai, T. and Fujishima, A. (2012). Photoelectrochemical properties of TiO2 photo-catalyst and its applications for environmental purification. Journal of Photochemistryand Photobiology C: Photochemistry Reviews, 13(4):247 – 262.
[187] Ohko, Y., Tatsuma, T., Fujii, T., Naoi, K., Niwa, C., Kubota, Y., and Fujishima, A.(2003). Multicolour photochromism of TiO2 films loaded with silver nanoparticles. NatureMaterials, 2(1):29–31.
[188] Ohno, T., Sarukawa, K., Tokieda, K., and Matsumura, M. (2001). Morphology of aTiO2 photocatalyst (Degussa, P-25) consisting of anatase and rutile crystalline phases.Journal of Catalysis, 203(1):82 – 86.
[189] Ohno, T., Tokieda, K., Higashida, S., and Matsumura, M. (2003). Synergism betweenrutile and anatase TiO2 particles in photocatalytic oxidation of naphthalene. AppliedCatalysis A: General, 244(2):383 – 391.
[190] Ohtani, B., Prieto-Mahaney, O., Li, D., and Abe, R. (2010). What is Degussa (Evonik)P25? crystalline composition analysis, reconstruction from isolated pure particles andphotocatalytic activity test. Journal of Photochemistry and Photobiology A: Chemistry,216(2–3):179 – 182.
[191] Ollis, D. F., Pelizzetti, E., and Serpone, N. (1991). Photocatalyzed destruction ofwater contaminants. Environmental Science & Technology, 25(9):1522–1529.
[192] Parra, S., Olivero, J., Pacheco, L., and Pulgarin, C. (2003). Structural propertiesand photoreactivity relationships of substituted phenols in TiO2 suspensions. AppliedCatalysis B: Environmental, 43(3):293 – 301.
[193] Pelaez, M., Nolan, N. T., Pillai, S. C., Seery, M. K., Falaras, P., Kontos, A. G., Dunlop,P. S., Hamilton, J. W., Byrne, J., O’Shea, K., Entezari, M. H., and Dionysiou, D. D. (2012).A review on the visible light active titanium dioxide photocatalysts for environmentalapplications. Applied Catalysis B: Environmental, 125:331 – 349.
188 References
[194] Pichat, P. (1994). Partial or complete heterogeneous photocatalytic oxidation oforganic compounds in liquid organic or aqueous phases. Catalysis Today, 19(2):313 –333.
[195] Prüße, U., Herrmann, M., Baatz, C., and Decker, N. (2011). Gold-catalyzed selectiveglucose oxidation at high glucose concentrations and oxygen partial pressures. AppliedCatalysis A: General, 406(1–2):89 – 93.
[196] Reddy, K. M., Reddy, C. G., and Manorama, S. (2001). Preparation, characterization,and spectral studies on nanocrystalline anatase TiO2. Journal of Solid State Chemistry,158(2):180 – 186.
[197] Redmond, G. and Fitzmaurice, D. (1993). Spectroscopic determination of flatbandpotentials for polycrystalline titania electrodes in nonaqueous solvents. The Journal ofPhysical Chemistry, 97(7):1426–1430.
[198] Rehman, S., Ullah, R., Butt, A., and Gohar, N. (2009). Strategies of making TiO2 andZnO visible light active. Journal of Hazardous Materials, 170(2–3):560 – 569.
[199] Rinaldi, R., Meine, N., vom Stein, J., Palkovits, R., and Schüth, F. (2010). Whichcontrols the depolymerization of cellulose in ionic liquids: The solid acid catalyst orcellulose? ChemSusChem, 3(2):266–276.
[200] Rongchao, J., Charles Cao, Y., Encai, H., Métraux, G. S., Schatz, G. C., and Chad,A. M. (2003). Controlling anisotropic nanoparticle growth through plasmon excitation.Nature, 425:487–490.
[201] Rose, M., Hausoul, P. J. C., and Palkovits, R. (2013). Nanostructured solid catalystsin the conversion of cellulose and cellulose-derived platform chemicals. chapter 8, pages182–218. CRC Press.
[202] Röper, H. (1990). Selective oxidation of d-glucose: Chiral intermediates for industrialutilization. Starch - Stärke, 42(9):342–349.
[203] Russell, B. K., Mantovani, J. G., Anderson, V. E., Warmack, R. J., and Ferrell, T. L.(1987). Experimental test of the Mie theory for microlithographically produced silverspheres. Phys. Rev. B, 35:2151–2154.
[204] Ryu, J. and Choi, W. (2008). Substrate-specific photocatalytic activities of TiO2 andmultiactivity test for water treatment application. Environmental Science & Technology,42(1):294–300.
[205] Sakthivel, S., Neppolian, B., Shankar, M., Arabindoo, B., Palanichamy, M., andMurugesan, V. (2003). Solar photocatalytic degradation of azo dye: comparison ofphotocatalytic efficiency of ZnO and TiO2. Solar Energy Materials and Solar Cells,77(1):65 – 82.
[206] Sarina, S., Waclawik, E. R., and Zhu, H. (2013). Photocatalysis on supported goldand silver nanoparticles under ultraviolet and visible light irradiation. Green Chem.,15:1814–1833.
[207] Sauer, T., Neto, G. C., José, H., and Moreira, R. (2002). Kinetics of photocatalyticdegradation of reactive dyes in a TiO2 slurry reactor. Journal of Photochemistry andPhotobiology A: Chemistry, 149(1–3):147 – 154.
[208] Schneider, J., Matsuoka, M., Takeuchi, M., Zhang, J., Horiuchi, Y., Anpo, M., and Bah-nemann, D. W. (2014). Understanding TiO2 photocatalysis: Mechanisms and materials.Chemical Reviews, 114(19):9919–9986.
References 189
[209] Serpone, N. (1997). Relative photonic efficiencies and quantum yields in hetero-geneous photocatalysis. Journal of Photochemistry and Photobiology A: Chemistry,104(1–3):1 – 12.
[210] Serrano, B. and de Lasa, H. (1997). Photocatalytic degradation of water organicpollutants. kinetic modeling and energy efficiency. Industrial & Engineering ChemistryResearch, 36(11):4705–4711.
[211] Serrano, B. and de Lasa, H. (1999). Photocatalytic degradation of water organicpollutants: pollutant reactivity and kinetic modeling. Chemical Engineering Science,54(15–16):3063 – 3069.
[212] Shin, H., Byun, T.-H., Lee, S., Bae, S.-T., and Jung, H. S. (2013). Surface hydroxyla-tion of TiO2 yields notable visible-light photocatalytic activity to decompose rhodamineB in aqueous solution. Journal of Physics and Chemistry of Solids, 74(8):1136 – 1142.
[213] Shiraishi, Y. and Hirai, T. (2008). Selective organic transformations on titanium oxide-based photocatalysts. Journal of Photochemistry and Photobiology C: PhotochemistryReviews, 9(4):157 – 170.
[214] Shiraishi, Y., Morishita, M., and Hirai, T. (2005). Acetonitrile-assisted highly selectivephotocatalytic epoxidation of olefins on Ti-containing silica with molecular oxygen. Chem.Commun., pages 5977–5979.
[215] Shkrob, I. A., Marin, T. W., Chemerisov, S. D., and Sevilla, M. D. (2011). Mechanisticaspects of photooxidation of polyhydroxylated molecules on metal oxides. The Journal ofPhysical Chemistry C, 115(11):4642–4648.
[216] Shkrob, I. A. and Sauer, M. C. (2004). Hole scavenging and photo-stimulated recom-bination of electron-hole pairs in aqueous TiO2 nanoparticles. The Journal of PhysicalChemistry B, 108(33):12497–12511.
[217] Shkrob, I. A., Sauer, M. C., and Gosztola, D. (2004). Efficient, rapid photooxidationof chemisorbed polyhydroxyl alcohols and carbohydrates by TiO2 nanoparticles in anaqueous solution. The Journal of Physical Chemistry B, 108(33):12512–12517.
[218] Skrabalak, S. E., Au, L., Li, X., and Xia, Y. (2007). Facile synthesis of Ag nanocubesand Au nanocages. Nature Protocols, 2:2182–2190.
[219] Somasundaran, P. (2006). Encyclopedia of Surface and Colloid Science. Number v. 1in Encyclopedia of Surface and Colloid Science. Taylor & Francis.
[220] Spasiano, D., Marotta, R., Malato, S., Fernandez-Ibañez, P., and Somma, I. D. (2015).Solar photocatalysis: Materials, reactors, some commercial, and pre-industrialized appli-cations. a comprehensive approach. Applied Catalysis B: Environmental, 170–171:90 –123.
[221] Stapley, J. A. and BeMiller, J. N. (2007a). The Hofer–Moest decarboxylation ofd-glucuronic acid and d-glucuronosides. Carbohydrate Research, 342(3–4):610 – 613.
[222] Stapley, J. A. and BeMiller, J. N. (2007b). The Ruff degradation: a review of previouslyproposed mechanisms with evidence that the reaction proceeds by a Hofer–Moest-typereaction. Carbohydrate Research, 342(3–4):407 – 418.
[223] Stillings, R. A. and Nostrand, R. J. V. (1944). The action of ultraviolet light uponcellulose. I. irradiation effects. II. post-irradiation effects 1. Journal of the AmericanChemical Society, 66(5):753–760.
190 References
[224] Sugano, Y., Shiraishi, Y., Tsukamoto, D., Ichikawa, S., Tanaka, S., and Hirai, T.(2013). Supported Au–Cu bimetallic alloy nanoparticles: An aerobic oxidation catalystwith regenerable activity by visible-light irradiation. Angewandte Chemie InternationalEdition, 52(20):5295–5299.
[225] Suljo, L., Phillip, C., and David, B. I. (2011). Plasmonic-metal nanostructures forefficient conversion of solar to chemical energy. Nature M, 10(12):911–921.
[226] Sutton, D., Kelleher, B., and Ross, J. R. (2002). Catalytic conditioning of organicvolatile products produced by peat pyrolysis. Biomass and Bioenergy, 23(3):209 – 216.
[227] Tacchini, I., Terrado, E., Anson, A., and Martinez, M. (2011). Preparation of a TiO2-MoS2 nanoparticle-based composite by solvothermal method with enhanced photoactivityfor the degradation of organic molecules in water under uv light. Micro Nano Letters, IET,6(11):932–936.
[228] Tajmir-Riahi, H.-A. and Agbebavi, J. T. (1993). Carbohydrate interaction with mono-valent ions. the effects of Li+, Na+, K+, NH+
4 , Rb+, and Cs+ on the solid state andsolution structures of d-glucono-1,5-lactone and d-gluconic acid. Carbohydrate Research,241:25 – 35.
[229] Tang, H., Lévy, F., Berger, H., and Schmid, P. E. (1995). Urbach tail of anatase TiO2.Phys. Rev. B, 52:7771–7774.
[230] Tarasevich, M., Sadkowski, A., and Yeager, E. (1983). Oxygen electrochemistry. InConway, B., Bockris, J., Yeager, E., Khan, S., and White, R., editors, ComprehensiveTreatise of Electrochemistry, pages 301–398. Springer US.
[231] Tauc, J. (1968). Optical properties and electronic structure of amorphous Ge and Si.Materials Research Bulletin, 3(1):37 – 46.
[232] Theurich, J., Lindner, M., and Bahnemann, D. W. (1996). Photocatalytic degrada-tion of 4-chlorophenol in aerated aqueous titanium dioxide suspensions: A kinetic andmechanistic study. Langmuir, 12(26):6368–6376.
[233] Tobaldi, D., Pullar, R., Seabra, M., and Labrincha, J. (2014). Fully quantitative X-raycharacterisation of Evonik Aeroxide TiO2 P25. Materials Letters, 122:345 – 347.
[234] Tseng, I.-H., Chang, W.-C., and Wu, J. C. (2002). Photoreduction of CO2 using sol–gelderived titania and titania-supported copper catalysts. Applied Catalysis B: Environmental,37(1):37 – 48.
[235] Voisin, C., Fatti, N. D., Christofilos, D., and Vallée, F. (2001). Ultrafast electrondynamics and optical nonlinearities in metal nanoparticles. The Journal of PhysicalChemistry B, 105(12):2264–2280.
[236] Wang, C., Yin, H., Chan, R., Peng, S., Dai, S., and Sun, S. (2009). One-pot synthesisof oleylamine coated AuAg alloy NPs and their catalysis for CO oxidation. Chemistry ofMaterials, 21(3):433–435.
[237] Wang, K.-H., Tsai, H.-H., and Hsieh, Y.-H. (1998a). The kinetics of photocatalyticdegradation of trichloroethylene in gas phase over TiO2 supported on glass bead. AppliedCatalysis B: Environmental, 17(4):313 – 320.
[238] Wang, R., Hashimoto, K., Fujishima, A., Chikuni, M., Kojima, E., Kitamura, A.,Shimohigoshi, M., and Watanabe, T. (1998b). Photogeneration of highly amphiphilicTiO2 surfaces. Advanced Materials, 10(2):135–138.
References 191
[239] Wang, W., Chiang, L.-W., and Ku, Y. (2003). Decomposition of benzene in air streamsby UV/TiO2 process. Journal of Hazardous Materials, 101(2):133 – 146.
[240] Webster, D., PAVLACKY, E., and KOVASH, C. (2014). Blocked bio-based carboxylicacids and their use in thermosetting materials.
[241] Wei, W., Mao, X., Ortiz, L. A., and Sadoway, D. R. (2011). Oriented silver oxidenanostructures synthesized through a template-free electrochemical route. J. Mater. Chem.,21:432–438.
[242] Wen, B., Ma, J., Chen, C., Ma, W., Zhu, H., and Zhao, J. (2011). Supported noblemetal nanoparticles as photo/sono-catalysts for synthesis of chemicals and degradation ofpollutants. Science China Chemistry, 54(6):887–897.
[243] Werpy, T. and Petersen, G. (2004). Top value added chemicals from biomass: VolumeI – results of screening for potential candidates from sugars and synthesis gas. Technicalreport, U.S. Department of Energy, Energy Efficiency and Renewable Energy.
[244] Williamson, L. N. and Bartlett, M. G. (2007). Quantitative liquid chromatography/time-of-flight mass spectrometry. Biomedical Chromatography, 21(6):567–576.
[245] Xu, Z., Quintanilla, M., Vetrone, F., Govorov, A. O., Chaker, M., and Ma, D. (2015).Harvesting lost photons: Plasmon and upconversion enhanced broadband photocatalyticactivity in core@shell microspheres based on lanthanide-doped NaYF4, TiO2, and Au.Advanced Functional Materials, 25(20):2950–2960.
[246] Yu, D., Aihara, M., and Antal, M. J. (1993). Hydrogen production by steam reformingglucose in supercritical water. Energy & Fuels, 7(5):574–577.
[247] Yum, J.-H., Walter, P., Huber, S., Rentsch, D., Geiger, T., Nüesch, F., De Angelis, F.,Grätzel, M., and Nazeeruddin, M. K. (2007). Efficient far red sensitization of nanocrys-talline TiO2 films by an unsymmetrical squaraine dye. Journal of the American ChemicalSociety, 129(34):10320–10321.
[248] Zaia, J. (2004). Mass spectrometry of oligosaccharides. Mass Spectrometry Reviews,23(3):161–227.
[249] Zhang, D., Yang, M., and Dong, S. (2015). Hydroxylation of the rutile TiO2(110) sur-face enhancing its reducing power for photocatalysis. The Journal of Physical ChemistryC, 119(3):1451–1456.
[250] Zhang, F., Zhao, J., Shen, T., Hidaka, H., Pelizzetti, E., and Serpone, N. (1998). TiO2-assisted photodegradation of dye pollutants II. adsorption and degradation kinetics of eosinin TiO2 dispersions under visible light irradiation. Applied Catalysis B: Environmental,15(1–2):147 – 156.
[251] Zhang, H., Okuni, J., and Toshima, N. (2011). One-pot synthesis of Ag–Au bimetallicnanoparticles with Au shell and their high catalytic activity for aerobic glucose oxidation.Journal of Colloid and Interface Science, 354(1):131 – 138.
[252] Zhang, J., Xu, Q., Feng, Z., Li, M., and Li, C. (2008). Importance of the relation-ship between surface phases and photocatalytic activity of TiO2. Angewandte Chemie,120(9):1790–1793.
[253] Zhang, X., Chen, Y. L., Liu, R.-S., and Tsai, D. P. (2013). Plasmonic photocatalysis.Reports on Progress in Physics, 76(4):046401.
192 References
[254] Zhang, X., Ke, X., and Zhu, H. (2012). Zeolite-supported gold nanoparticles forselective photooxidation of aromatic alcohols under visible-light irradiation. Chemistry –A European Journal, 18(26):8048–8056.
[255] Zhao, J., Zheng, Z., Bottle, S., Chou, A., Sarina, S., and Zhu, H. (2013). Highly effi-cient and selective photocatalytic hydroamination of alkynes by supported gold nanoparti-cles using visible light at ambient temperature. Chem. Commun., 49:2676–2678.
[256] Zhao, X., Zhang, L., and Liu, D. (2012). Biomass recalcitrance. part I: the chemicalcompositions and physical structures affecting the enzymatic hydrolysis of lignocellulose.Biofuels, Bioproducts and Biorefining, 6(4):465–482.
[257] Zheng, J., Nicovich, P. R., and Dickson, R. M. (2007). Highly fluorescent noble-metalquantum dots. Annual Review of Physical Chemistry, 58(1):409–431.
[258] Zhou, W. and Fu, H. (2013). Mesoporous TiO2: Preparation, doping, and as acomposite for photocatalysis. ChemCatChem, 5(4):885–894.
[259] Zhou, W., Liu, H., Wang, J., Liu, D., Du, G., and Cui, J. (2010). Ag2O/TiO2 nanobeltsheterostructure with enhanced ultraviolet and visible photocatalytic activity. ACS AppliedMaterials & Interfaces, 2(8):2385–2392. PMID: 20735112.
[260] Zhou, X., Liu, G., Yu, J., and Fan, W. (2012). Surface plasmon resonance-mediatedphotocatalysis by noble metal-based composites under visible light. J. Mater. Chem.,22:21337–21354.
[261] Zhu, H., Chen, X., Zheng, Z., Ke, X., Jaatinen, E., Zhao, J., Guo, C., Xie, T., andWang, D. (2009). Mechanism of supported gold nanoparticles as photocatalysts underultraviolet and visible light irradiation. Chem. Commun., pages 7524–7526.
[262] Zugenmaier, P. (2001). Conformation and packing of various crystalline cellulosefibers. Progress in Polymer Science, 26(9):1341 – 1417.
Appendix A
A.1 HPLC Determination of Bioderived Molecules
Sugars are highly polar molecules and for this reason, the common C18 reverse-phase
columns are not suitable for this analysis, because the molecules would just coelute and thus
no separation would occur. To achieve a good level of separation it is necessary to have a
polar environment made by the stationary phase, able to interact with the sugars and by the
polar eluent phase tuned to maximize the interactions occurring between the analytes and the
stationary phase. There are several options available on the market for the sugar analysis and
the vast majority of them are based on two different columns:
• DIOL column, in which the silica particles are coated with aliphatic chains with
terminal –OH groups
• AMINO column: in which the silica particles are coated with aliphatic chains with
terminal –NH2 groups
Both these columns have in common the presence of highly polar terminal groups that are
able to interact in several ways with the analytes. In the literature these two types of column
are widely applied in the separation of sugars, and sugar alcohols. After having performed a
literature background, several methods have been found in the separation of the degradation
products of cellulose. Unfortunately, it is not possible to compare the performances of each
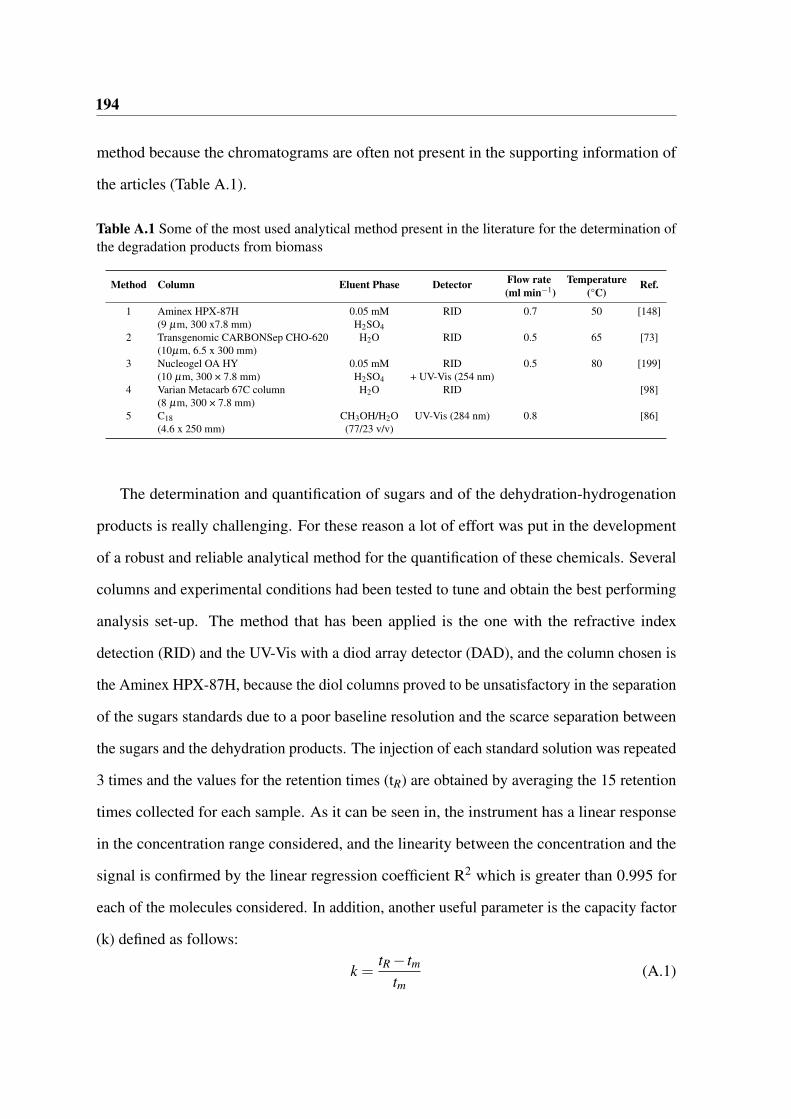
194
method because the chromatograms are often not present in the supporting information of
the articles (Table A.1).
Table A.1 Some of the most used analytical method present in the literature for the determination ofthe degradation products from biomass
Method Column Eluent Phase Detector Flow rate Temperature Ref.(ml min−1) (°C)
1 Aminex HPX-87H 0.05 mM RID 0.7 50 [148](9 µm, 300 x7.8 mm) H2SO4
2 Transgenomic CARBONSep CHO-620 H2O RID 0.5 65 [73](10µm, 6.5 x 300 mm)
3 Nucleogel OA HY 0.05 mM RID 0.5 80 [199](10 µm, 300 × 7.8 mm) H2SO4 + UV-Vis (254 nm)
4 Varian Metacarb 67C column H2O RID [98](8 µm, 300 × 7.8 mm)
5 C18 CH3OH/H2O UV-Vis (284 nm) 0.8 [86](4.6 x 250 mm) (77/23 v/v)
The determination and quantification of sugars and of the dehydration-hydrogenation
products is really challenging. For these reason a lot of effort was put in the development
of a robust and reliable analytical method for the quantification of these chemicals. Several
columns and experimental conditions had been tested to tune and obtain the best performing
analysis set-up. The method that has been applied is the one with the refractive index
detection (RID) and the UV-Vis with a diod array detector (DAD), and the column chosen is
the Aminex HPX-87H, because the diol columns proved to be unsatisfactory in the separation
of the sugars standards due to a poor baseline resolution and the scarce separation between
the sugars and the dehydration products. The injection of each standard solution was repeated
3 times and the values for the retention times (tR) are obtained by averaging the 15 retention
times collected for each sample. As it can be seen in, the instrument has a linear response
in the concentration range considered, and the linearity between the concentration and the
signal is confirmed by the linear regression coefficient R2 which is greater than 0.995 for
each of the molecules considered. In addition, another useful parameter is the capacity factor
(k) defined as follows:
k =tR − tm
tm(A.1)
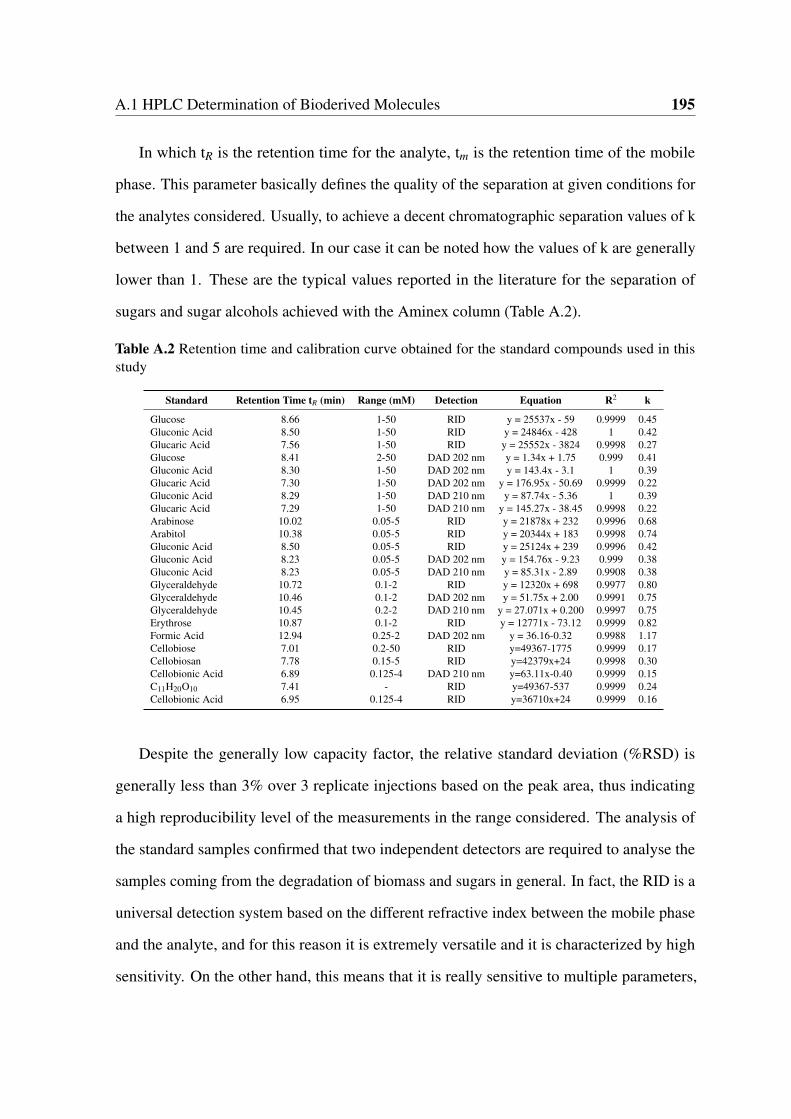
A.1 HPLC Determination of Bioderived Molecules 195
In which tR is the retention time for the analyte, tm is the retention time of the mobile
phase. This parameter basically defines the quality of the separation at given conditions for
the analytes considered. Usually, to achieve a decent chromatographic separation values of k
between 1 and 5 are required. In our case it can be noted how the values of k are generally
lower than 1. These are the typical values reported in the literature for the separation of
sugars and sugar alcohols achieved with the Aminex column (Table A.2).
Table A.2 Retention time and calibration curve obtained for the standard compounds used in thisstudy
Standard Retention Time tR (min) Range (mM) Detection Equation R2 k
Glucose 8.66 1-50 RID y = 25537x - 59 0.9999 0.45Gluconic Acid 8.50 1-50 RID y = 24846x - 428 1 0.42Glucaric Acid 7.56 1-50 RID y = 25552x - 3824 0.9998 0.27Glucose 8.41 2-50 DAD 202 nm y = 1.34x + 1.75 0.999 0.41Gluconic Acid 8.30 1-50 DAD 202 nm y = 143.4x - 3.1 1 0.39Glucaric Acid 7.30 1-50 DAD 202 nm y = 176.95x - 50.69 0.9999 0.22Gluconic Acid 8.29 1-50 DAD 210 nm y = 87.74x - 5.36 1 0.39Glucaric Acid 7.29 1-50 DAD 210 nm y = 145.27x - 38.45 0.9998 0.22Arabinose 10.02 0.05-5 RID y = 21878x + 232 0.9996 0.68Arabitol 10.38 0.05-5 RID y = 20344x + 183 0.9998 0.74Gluconic Acid 8.50 0.05-5 RID y = 25124x + 239 0.9996 0.42Gluconic Acid 8.23 0.05-5 DAD 202 nm y = 154.76x - 9.23 0.999 0.38Gluconic Acid 8.23 0.05-5 DAD 210 nm y = 85.31x - 2.89 0.9908 0.38Glyceraldehyde 10.72 0.1-2 RID y = 12320x + 698 0.9977 0.80Glyceraldehyde 10.46 0.1-2 DAD 202 nm y = 51.75x + 2.00 0.9991 0.75Glyceraldehyde 10.45 0.2-2 DAD 210 nm y = 27.071x + 0.200 0.9997 0.75Erythrose 10.87 0.1-2 RID y = 12771x - 73.12 0.9999 0.82Formic Acid 12.94 0.25-2 DAD 202 nm y = 36.16-0.32 0.9988 1.17Cellobiose 7.01 0.2-50 RID y=49367-1775 0.9999 0.17Cellobiosan 7.78 0.15-5 RID y=42379x+24 0.9998 0.30Cellobionic Acid 6.89 0.125-4 DAD 210 nm y=63.11x-0.40 0.9999 0.15C11H20O10 7.41 - RID y=49367-537 0.9999 0.24Cellobionic Acid 6.95 0.125-4 RID y=36710x+24 0.9999 0.16
Despite the generally low capacity factor, the relative standard deviation (%RSD) is
generally less than 3% over 3 replicate injections based on the peak area, thus indicating
a high reproducibility level of the measurements in the range considered. The analysis of
the standard samples confirmed that two independent detectors are required to analyse the
samples coming from the degradation of biomass and sugars in general. In fact, the RID is a
universal detection system based on the different refractive index between the mobile phase
and the analyte, and for this reason it is extremely versatile and it is characterized by high
sensitivity. On the other hand, this means that it is really sensitive to multiple parameters,
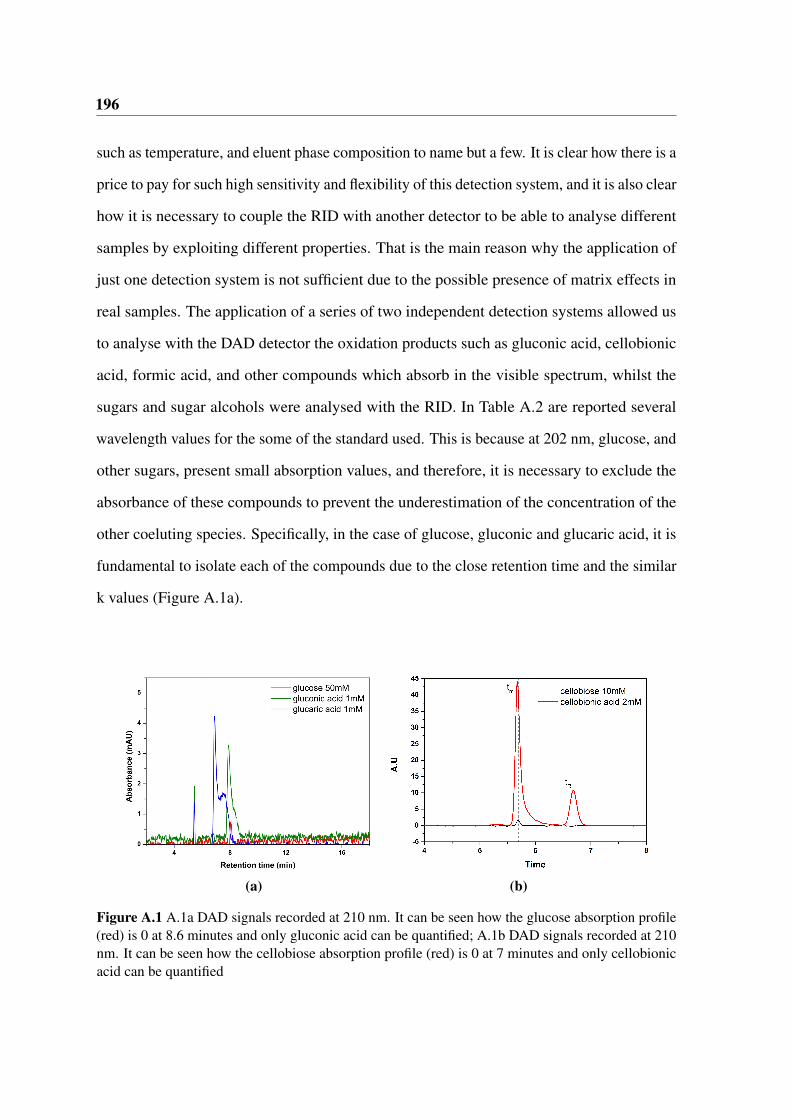
196
such as temperature, and eluent phase composition to name but a few. It is clear how there is a
price to pay for such high sensitivity and flexibility of this detection system, and it is also clear
how it is necessary to couple the RID with another detector to be able to analyse different
samples by exploiting different properties. That is the main reason why the application of
just one detection system is not sufficient due to the possible presence of matrix effects in
real samples. The application of a series of two independent detection systems allowed us
to analyse with the DAD detector the oxidation products such as gluconic acid, cellobionic
acid, formic acid, and other compounds which absorb in the visible spectrum, whilst the
sugars and sugar alcohols were analysed with the RID. In Table A.2 are reported several
wavelength values for the some of the standard used. This is because at 202 nm, glucose, and
other sugars, present small absorption values, and therefore, it is necessary to exclude the
absorbance of these compounds to prevent the underestimation of the concentration of the
other coeluting species. Specifically, in the case of glucose, gluconic and glucaric acid, it is
fundamental to isolate each of the compounds due to the close retention time and the similar
k values (Figure A.1a).
(a) (b)
Figure A.1 A.1a DAD signals recorded at 210 nm. It can be seen how the glucose absorption profile(red) is 0 at 8.6 minutes and only gluconic acid can be quantified; A.1b DAD signals recorded at 210nm. It can be seen how the cellobiose absorption profile (red) is 0 at 7 minutes and only cellobionicacid can be quantified
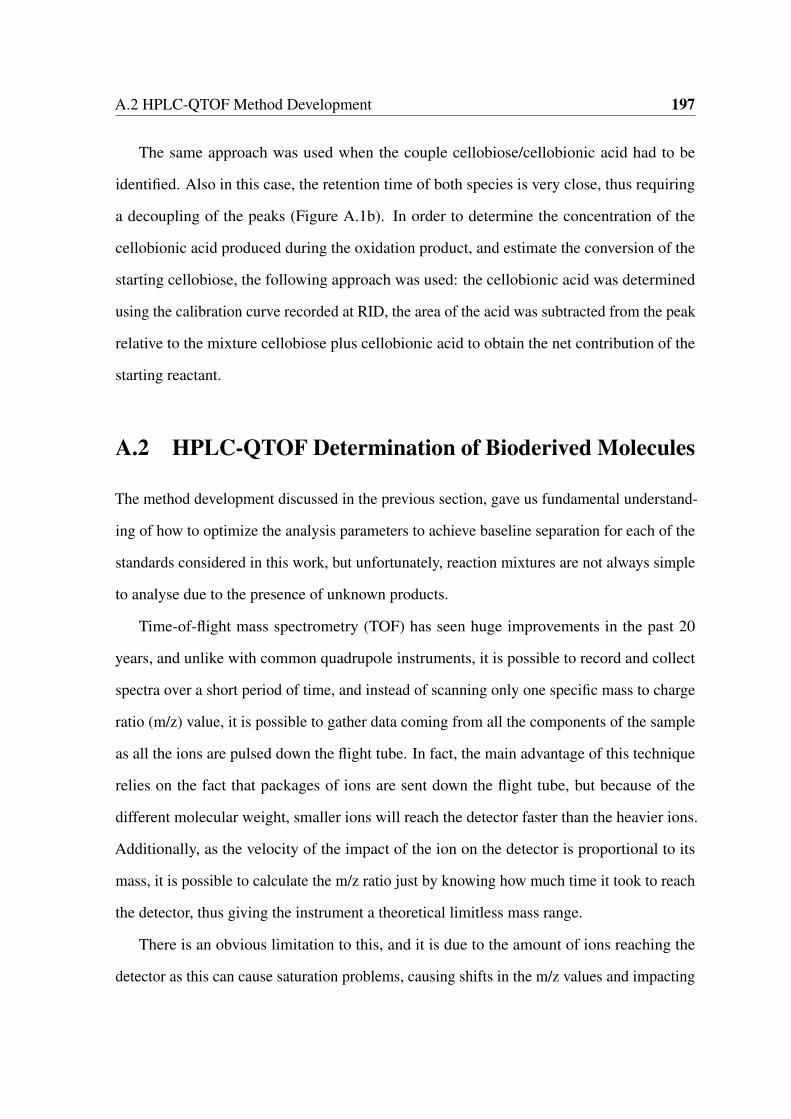
A.2 HPLC-QTOF Method Development 197
The same approach was used when the couple cellobiose/cellobionic acid had to be
identified. Also in this case, the retention time of both species is very close, thus requiring
a decoupling of the peaks (Figure A.1b). In order to determine the concentration of the
cellobionic acid produced during the oxidation product, and estimate the conversion of the
starting cellobiose, the following approach was used: the cellobionic acid was determined
using the calibration curve recorded at RID, the area of the acid was subtracted from the peak
relative to the mixture cellobiose plus cellobionic acid to obtain the net contribution of the
starting reactant.
A.2 HPLC-QTOF Determination of Bioderived Molecules
The method development discussed in the previous section, gave us fundamental understand-
ing of how to optimize the analysis parameters to achieve baseline separation for each of the
standards considered in this work, but unfortunately, reaction mixtures are not always simple
to analyse due to the presence of unknown products.
Time-of-flight mass spectrometry (TOF) has seen huge improvements in the past 20
years, and unlike with common quadrupole instruments, it is possible to record and collect
spectra over a short period of time, and instead of scanning only one specific mass to charge
ratio (m/z) value, it is possible to gather data coming from all the components of the sample
as all the ions are pulsed down the flight tube. In fact, the main advantage of this technique
relies on the fact that packages of ions are sent down the flight tube, but because of the
different molecular weight, smaller ions will reach the detector faster than the heavier ions.
Additionally, as the velocity of the impact of the ion on the detector is proportional to its
mass, it is possible to calculate the m/z ratio just by knowing how much time it took to reach
the detector, thus giving the instrument a theoretical limitless mass range.
There is an obvious limitation to this, and it is due to the amount of ions reaching the
detector as this can cause saturation problems, causing shifts in the m/z values and impacting

198
on the sensitivity of the instrument. The shift in the m/z values can become a serious issue
when determining the molecular ions of unknown species for the exact mass identification
analysis.
To overcome this difficulty, the ions are decelerated before reaching the detector, increas-
ing the linear range of response to several order of magnitude. TOF instruments are currently
used in the pharmaceutical and food industry, but one of the main fields of applications is in
proteomics as this technique is particularly useful in determine the molecular structure and
fragmentation of proteins, enzyme and metabolites.
The main advantage of using this technique over the standard quadrupole instruments, is
the possibility of removing background noise and to decouple the presence of contaminants
in the sample. The improved sensitivity allows the identification of compounds with the
same unit mass and this makes QTOF an excellent tool for screening multiple compounds of
interest at once.[244] Zaia [248] reviewed the application of mass spectrometry techniques
Figure A.2 Picture of the Agilent 6530 QTOF instrument used in this work.
in the analysis of oligosaccharides as they their fragmentation properties are similar to the
ones observed from proteins. Based on the nomenclature introduce by Domon and Costello
[77] on the fragmentation of oligosaccharides, it is possible to predict, and identify the major
species produced during the fragmentation process (Figure A.3). Fragment ions that contain
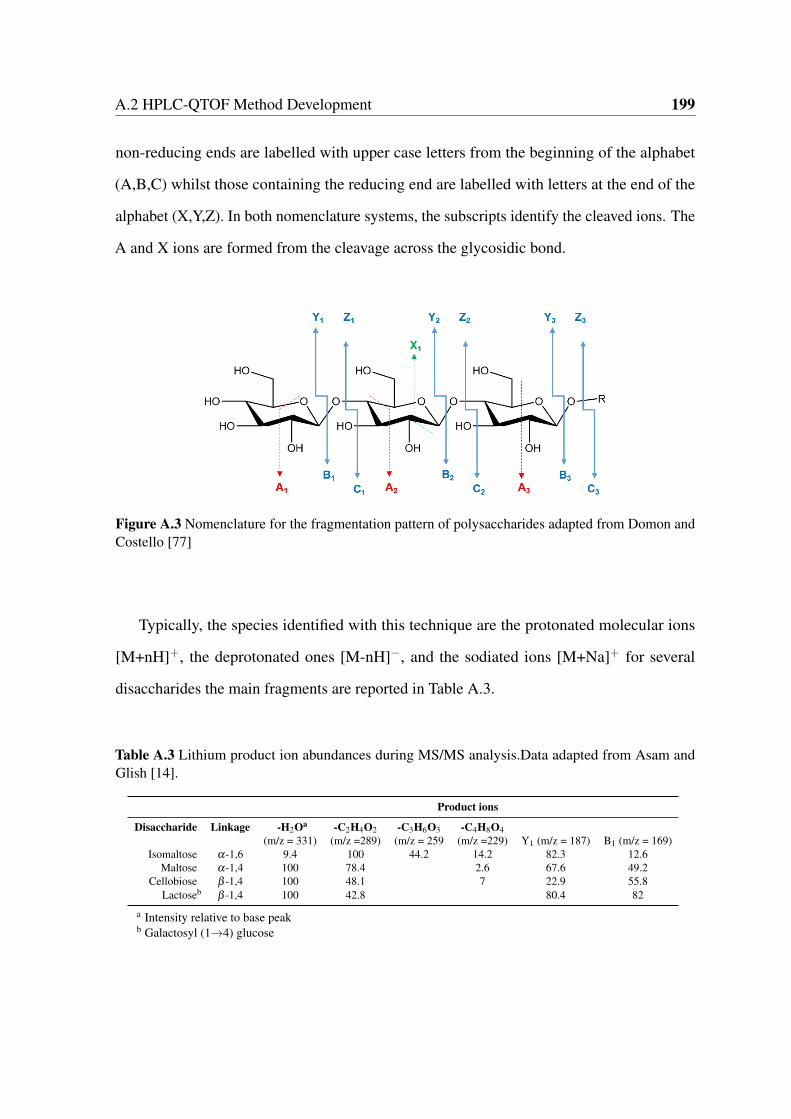
A.2 HPLC-QTOF Method Development 199
non-reducing ends are labelled with upper case letters from the beginning of the alphabet
(A,B,C) whilst those containing the reducing end are labelled with letters at the end of the
alphabet (X,Y,Z). In both nomenclature systems, the subscripts identify the cleaved ions. The
A and X ions are formed from the cleavage across the glycosidic bond.
Figure A.3 Nomenclature for the fragmentation pattern of polysaccharides adapted from Domon andCostello [77]
Typically, the species identified with this technique are the protonated molecular ions
[M+nH]+, the deprotonated ones [M-nH]−, and the sodiated ions [M+Na]+ for several
disaccharides the main fragments are reported in Table A.3.
Table A.3 Lithium product ion abundances during MS/MS analysis.Data adapted from Asam andGlish [14].
Product ions
Disaccharide Linkage -H2Oa -C2H4O2 -C3H6O3 -C4H8O4(m/z = 331) (m/z =289) (m/z = 259 (m/z =229) Y1 (m/z = 187) B1 (m/z = 169)
Isomaltose α-1,6 9.4 100 44.2 14.2 82.3 12.6Maltose α-1,4 100 78.4 2.6 67.6 49.2
Cellobiose β -1,4 100 48.1 7 22.9 55.8Lactoseb β -1,4 100 42.8 80.4 82
a Intensity relative to base peakb Galactosyl (1→4) glucose
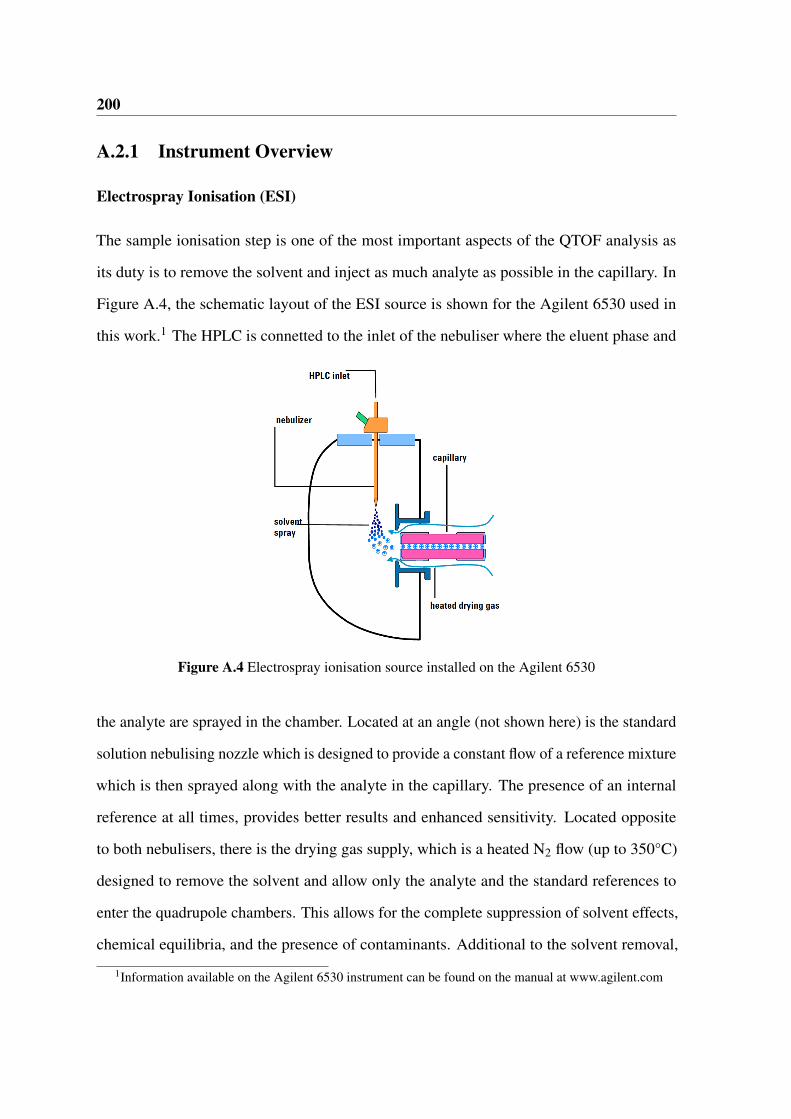
200
A.2.1 Instrument Overview
Electrospray Ionisation (ESI)
The sample ionisation step is one of the most important aspects of the QTOF analysis as
its duty is to remove the solvent and inject as much analyte as possible in the capillary. In
Figure A.4, the schematic layout of the ESI source is shown for the Agilent 6530 used in
this work.1 The HPLC is connetted to the inlet of the nebuliser where the eluent phase and
Figure A.4 Electrospray ionisation source installed on the Agilent 6530
the analyte are sprayed in the chamber. Located at an angle (not shown here) is the standard
solution nebulising nozzle which is designed to provide a constant flow of a reference mixture
which is then sprayed along with the analyte in the capillary. The presence of an internal
reference at all times, provides better results and enhanced sensitivity. Located opposite
to both nebulisers, there is the drying gas supply, which is a heated N2 flow (up to 350°C)
designed to remove the solvent and allow only the analyte and the standard references to
enter the quadrupole chambers. This allows for the complete suppression of solvent effects,
chemical equilibria, and the presence of contaminants. Additional to the solvent removal,
1Information available on the Agilent 6530 instrument can be found on the manual at www.agilent.com
A.2 HPLC-QTOF Method Development 201
Figure A.5 Coulombian effect and charging mechanisms of the eluent droplets with the formation ofa bare ion
the presence of the drying gas charges the solvent droplets due to Coulombian repulsions
mechanisms, and the charge on these molecules is high enough (108 V cm−3) the ions
produced are attracted by the electrical field of the capillary and propelled in the ion optics
and to the mass analyser (Figure A.5). For these purposes, the importance of the buffers, and
the ionization properties of the solvents use in the chromatographic separation have dramatic
impacts on the quality of the mass spectrometry analysis result. Heat capacity, dielectric
constant, and surface tension are key variables for a successful and efficient ionization
process. Ideally these considerations should be made:
• Use solvents with low heat capacity and surface tension to enhance ion desorption
• Use solvents which do not interfere with the ions in the gas-phase reactions (e.g. proton
transfer, ion pair reactions)
• Adjust solvent pH to the polarity of the ions to be analysed
• Reduce, if not avoid totally, the presence of inorganic buffers to avoid salts build-up in
the ion source.
QTOF schematics
After being vaporized and accelerate through the capillary, the ions are accelerated in
the quadrupole tubes where the ions to be fragmented in the collision cell, and there are
subsequently collimated in the skimmer to improve resolution. After being filtered, the ions
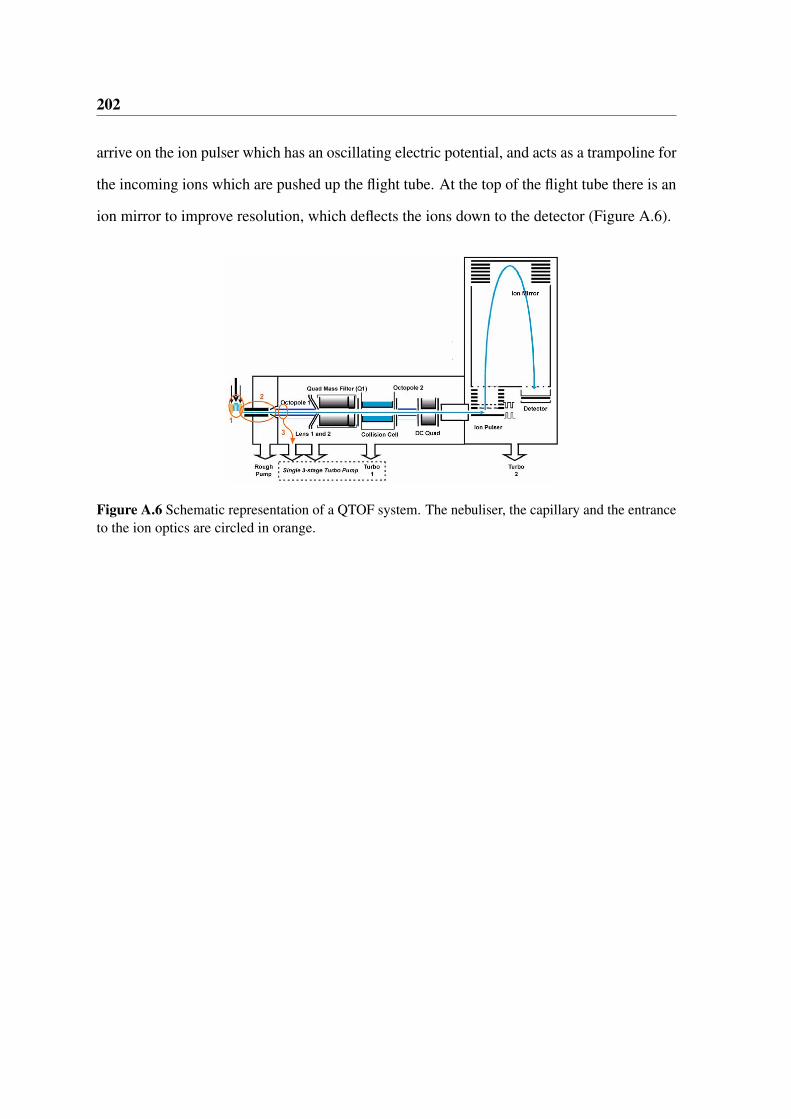
202
arrive on the ion pulser which has an oscillating electric potential, and acts as a trampoline for
the incoming ions which are pushed up the flight tube. At the top of the flight tube there is an
ion mirror to improve resolution, which deflects the ions down to the detector (Figure A.6).
Figure A.6 Schematic representation of a QTOF system. The nebuliser, the capillary and the entranceto the ion optics are circled in orange.
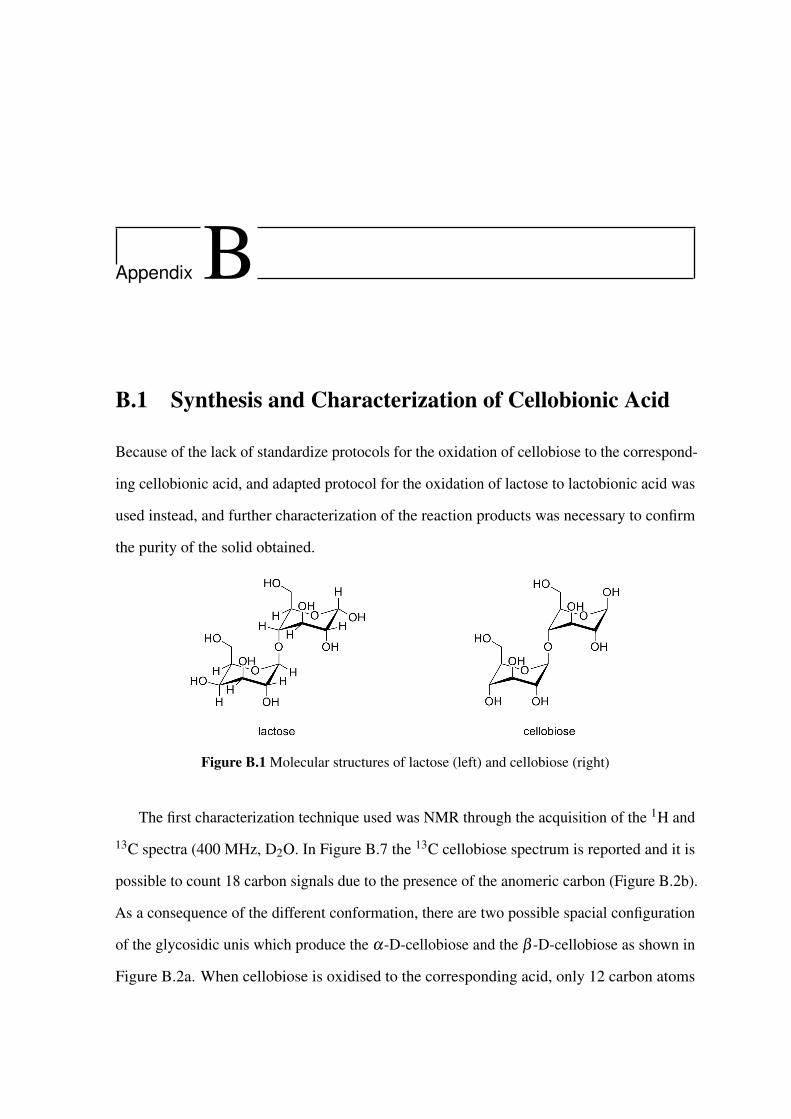
Appendix B
B.1 Synthesis and Characterization of Cellobionic Acid
Because of the lack of standardize protocols for the oxidation of cellobiose to the correspond-
ing cellobionic acid, and adapted protocol for the oxidation of lactose to lactobionic acid was
used instead, and further characterization of the reaction products was necessary to confirm
the purity of the solid obtained.
Figure B.1 Molecular structures of lactose (left) and cellobiose (right)
The first characterization technique used was NMR through the acquisition of the 1H and
13C spectra (400 MHz, D2O. In Figure B.7 the 13C cellobiose spectrum is reported and it is
possible to count 18 carbon signals due to the presence of the anomeric carbon (Figure B.2b).
As a consequence of the different conformation, there are two possible spacial configuration
of the glycosidic unis which produce the α-D-cellobiose and the β -D-cellobiose as shown in
Figure B.2a. When cellobiose is oxidised to the corresponding acid, only 12 carbon atoms
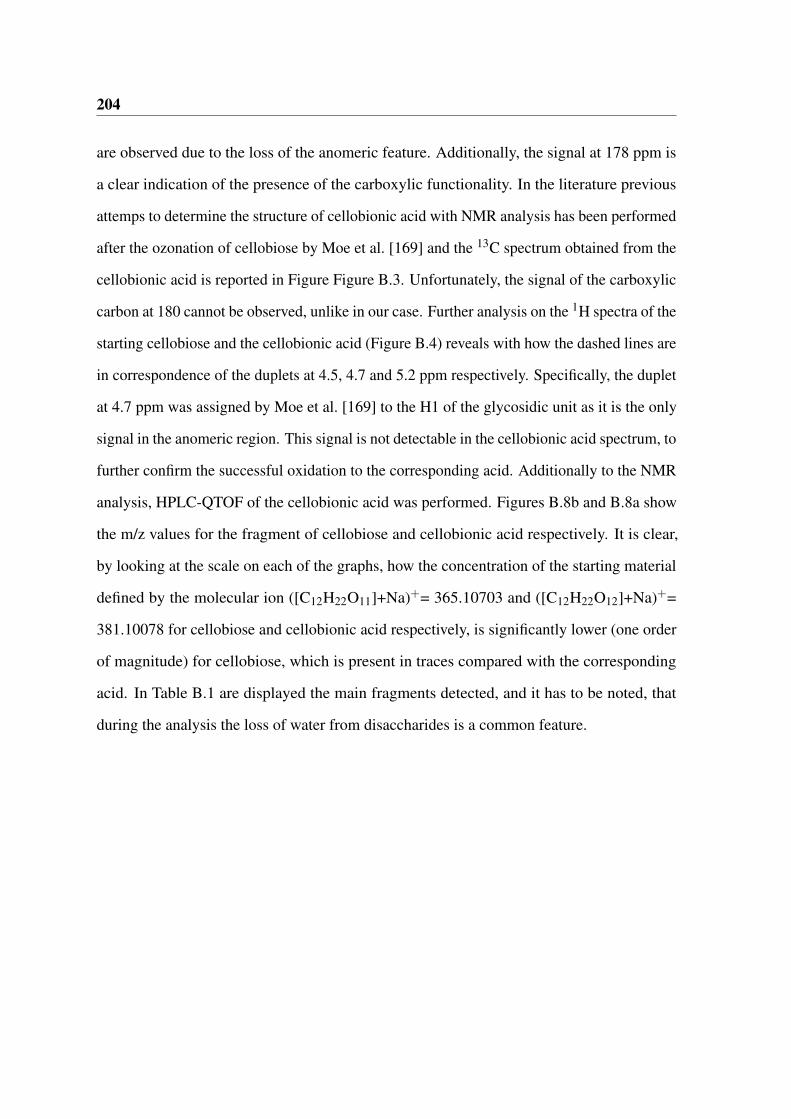
204
are observed due to the loss of the anomeric feature. Additionally, the signal at 178 ppm is
a clear indication of the presence of the carboxylic functionality. In the literature previous
attemps to determine the structure of cellobionic acid with NMR analysis has been performed
after the ozonation of cellobiose by Moe et al. [169] and the 13C spectrum obtained from the
cellobionic acid is reported in Figure Figure B.3. Unfortunately, the signal of the carboxylic
carbon at 180 cannot be observed, unlike in our case. Further analysis on the 1H spectra of the
starting cellobiose and the cellobionic acid (Figure B.4) reveals with how the dashed lines are
in correspondence of the duplets at 4.5, 4.7 and 5.2 ppm respectively. Specifically, the duplet
at 4.7 ppm was assigned by Moe et al. [169] to the H1 of the glycosidic unit as it is the only
signal in the anomeric region. This signal is not detectable in the cellobionic acid spectrum, to
further confirm the successful oxidation to the corresponding acid. Additionally to the NMR
analysis, HPLC-QTOF of the cellobionic acid was performed. Figures B.8b and B.8a show
the m/z values for the fragment of cellobiose and cellobionic acid respectively. It is clear,
by looking at the scale on each of the graphs, how the concentration of the starting material
defined by the molecular ion ([C12H22O11]+Na)+= 365.10703 and ([C12H22O12]+Na)+=
381.10078 for cellobiose and cellobionic acid respectively, is significantly lower (one order
of magnitude) for cellobiose, which is present in traces compared with the corresponding
acid. In Table B.1 are displayed the main fragments detected, and it has to be noted, that
during the analysis the loss of water from disaccharides is a common feature.
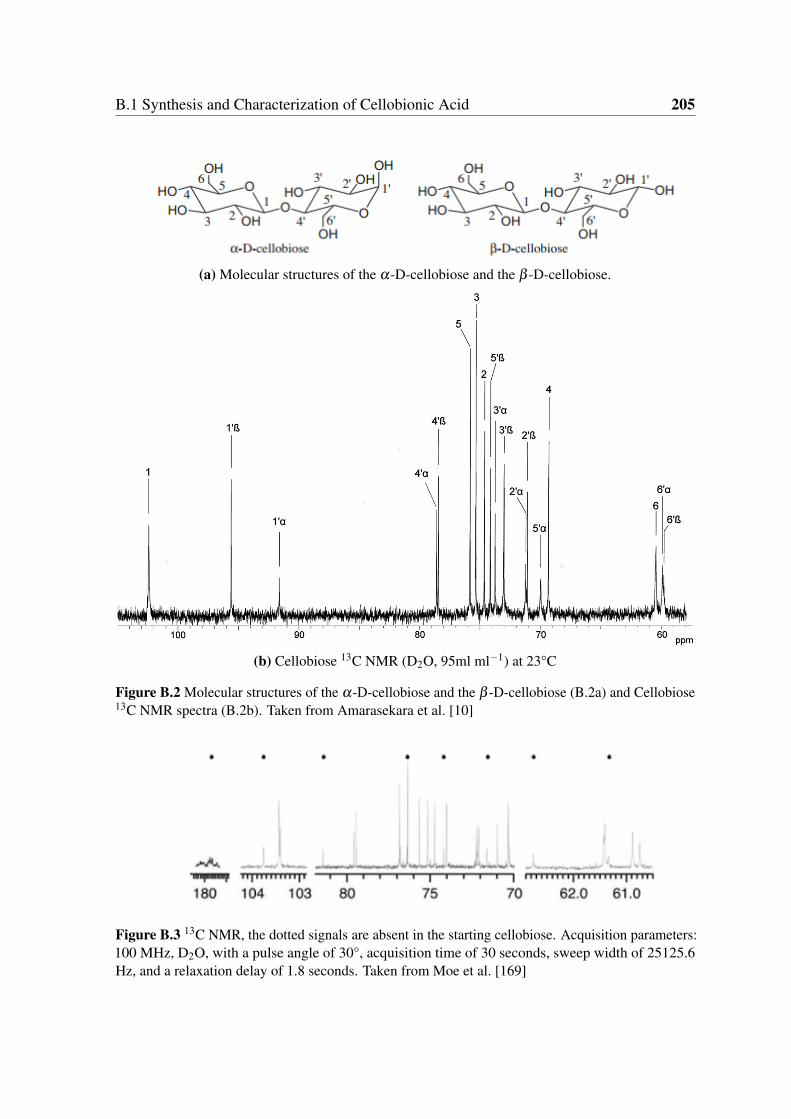
B.1 Synthesis and Characterization of Cellobionic Acid 205
(a) Molecular structures of the α-D-cellobiose and the β -D-cellobiose.
(b) Cellobiose 13C NMR (D2O, 95ml ml−1) at 23°C
Figure B.2 Molecular structures of the α-D-cellobiose and the β -D-cellobiose (B.2a) and Cellobiose13C NMR spectra (B.2b). Taken from Amarasekara et al. [10]
Figure B.3 13C NMR, the dotted signals are absent in the starting cellobiose. Acquisition parameters:100 MHz, D2O, with a pulse angle of 30°, acquisition time of 30 seconds, sweep width of 25125.6Hz, and a relaxation delay of 1.8 seconds. Taken from Moe et al. [169]
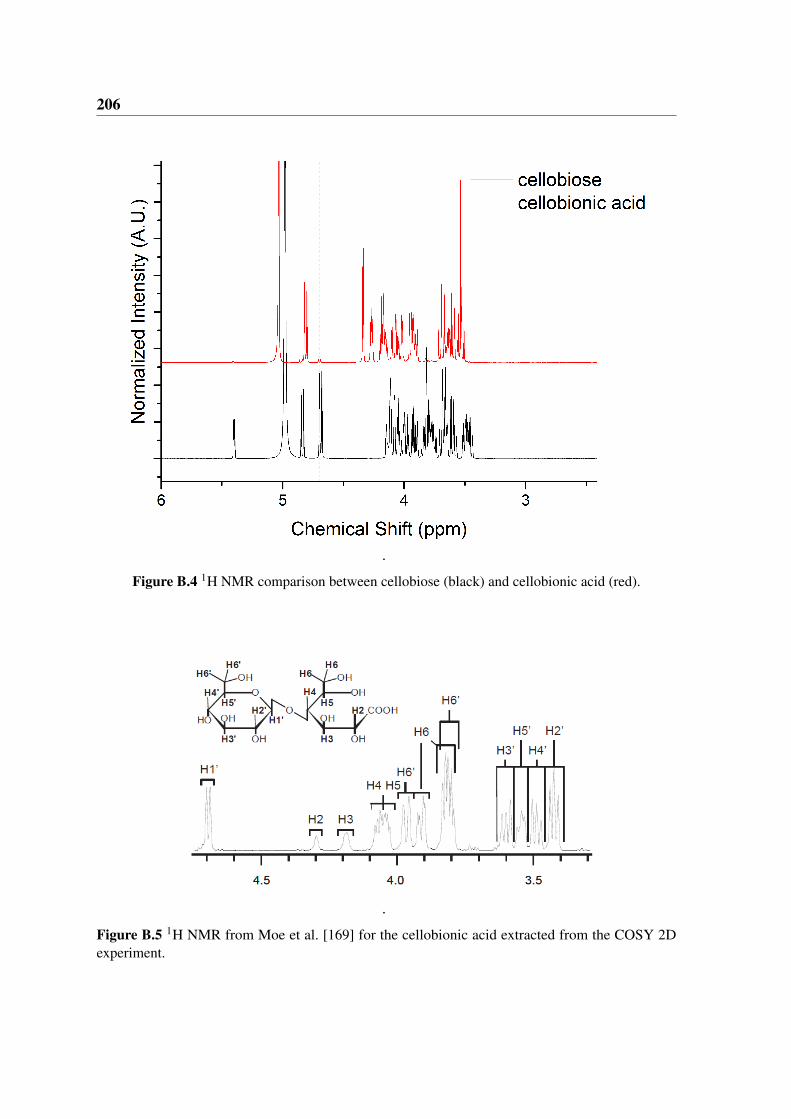
206
.
Figure B.4 1H NMR comparison between cellobiose (black) and cellobionic acid (red).
.
Figure B.5 1H NMR from Moe et al. [169] for the cellobionic acid extracted from the COSY 2Dexperiment.
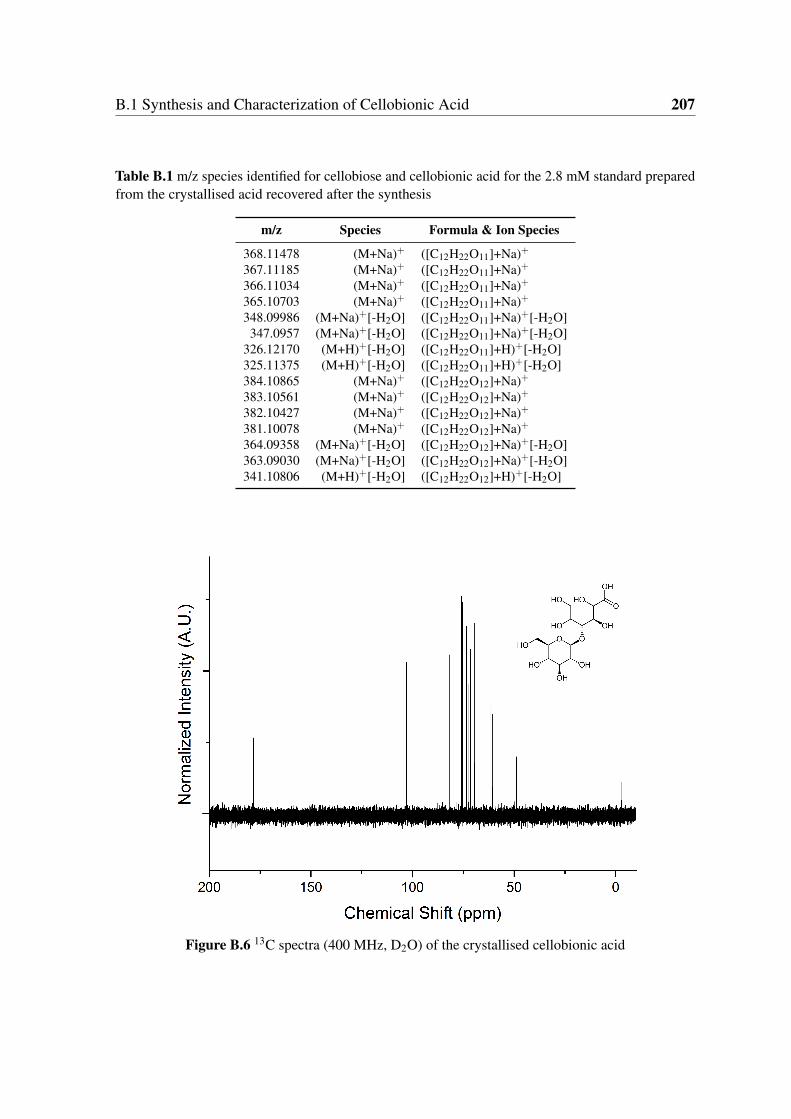
B.1 Synthesis and Characterization of Cellobionic Acid 207
Table B.1 m/z species identified for cellobiose and cellobionic acid for the 2.8 mM standard preparedfrom the crystallised acid recovered after the synthesis
m/z Species Formula & Ion Species
368.11478 (M+Na)+ ([C12H22O11]+Na)+
367.11185 (M+Na)+ ([C12H22O11]+Na)+
366.11034 (M+Na)+ ([C12H22O11]+Na)+
365.10703 (M+Na)+ ([C12H22O11]+Na)+
348.09986 (M+Na)+[-H2O] ([C12H22O11]+Na)+[-H2O]347.0957 (M+Na)+[-H2O] ([C12H22O11]+Na)+[-H2O]
326.12170 (M+H)+[-H2O] ([C12H22O11]+H)+[-H2O]325.11375 (M+H)+[-H2O] ([C12H22O11]+H)+[-H2O]384.10865 (M+Na)+ ([C12H22O12]+Na)+
383.10561 (M+Na)+ ([C12H22O12]+Na)+
382.10427 (M+Na)+ ([C12H22O12]+Na)+
381.10078 (M+Na)+ ([C12H22O12]+Na)+
364.09358 (M+Na)+[-H2O] ([C12H22O12]+Na)+[-H2O]363.09030 (M+Na)+[-H2O] ([C12H22O12]+Na)+[-H2O]341.10806 (M+H)+[-H2O] ([C12H22O12]+H)+[-H2O]
Figure B.6 13C spectra (400 MHz, D2O) of the crystallised cellobionic acid
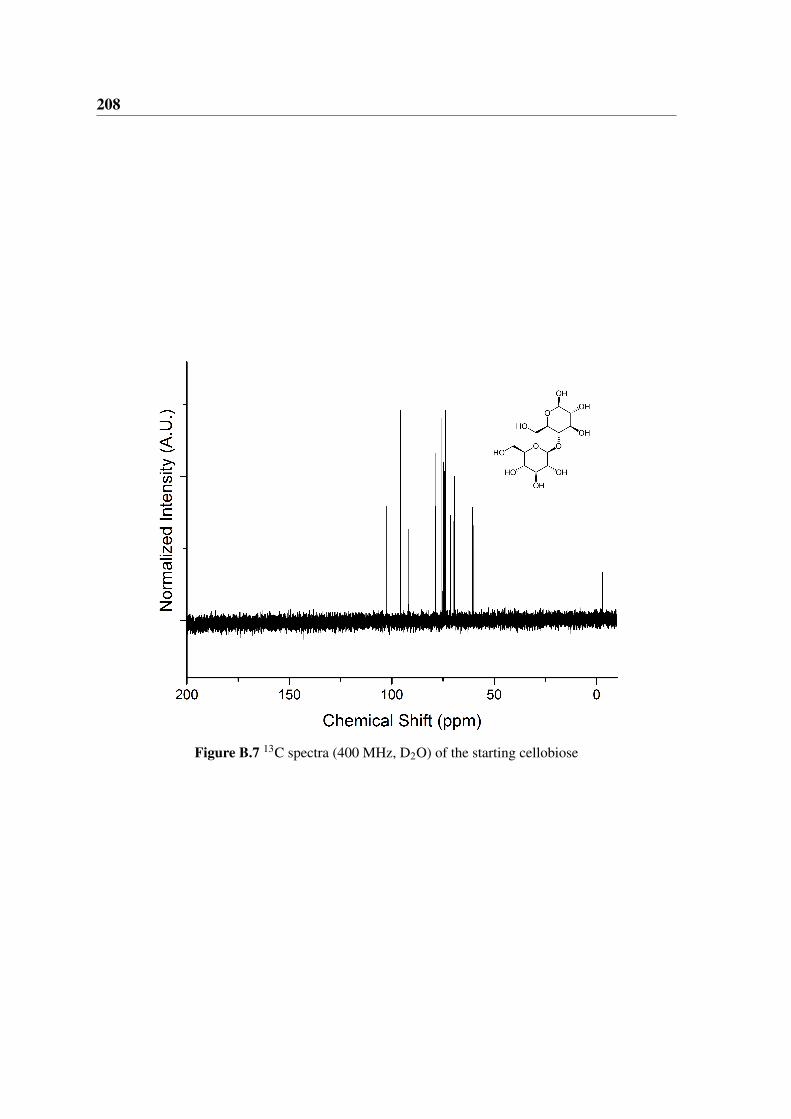
208
Figure B.7 13C spectra (400 MHz, D2O) of the starting cellobiose
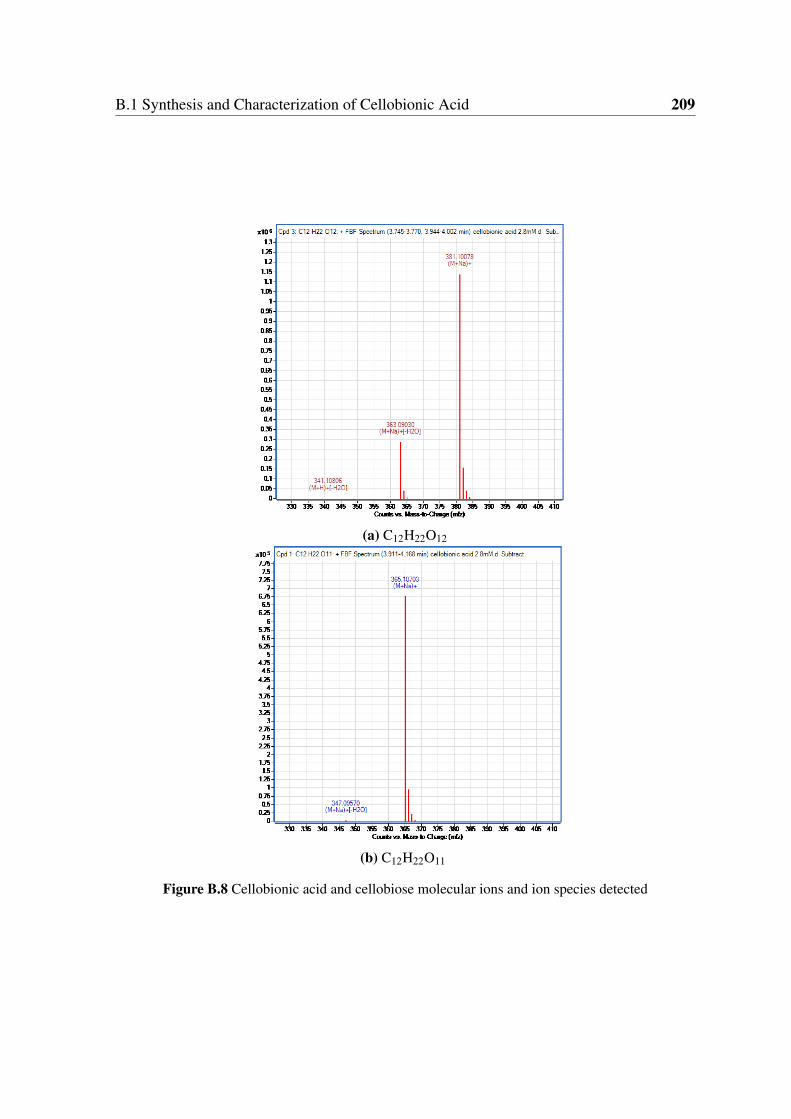
B.1 Synthesis and Characterization of Cellobionic Acid 209
(a) C12H22O12
(b) C12H22O11
Figure B.8 Cellobionic acid and cellobiose molecular ions and ion species detected

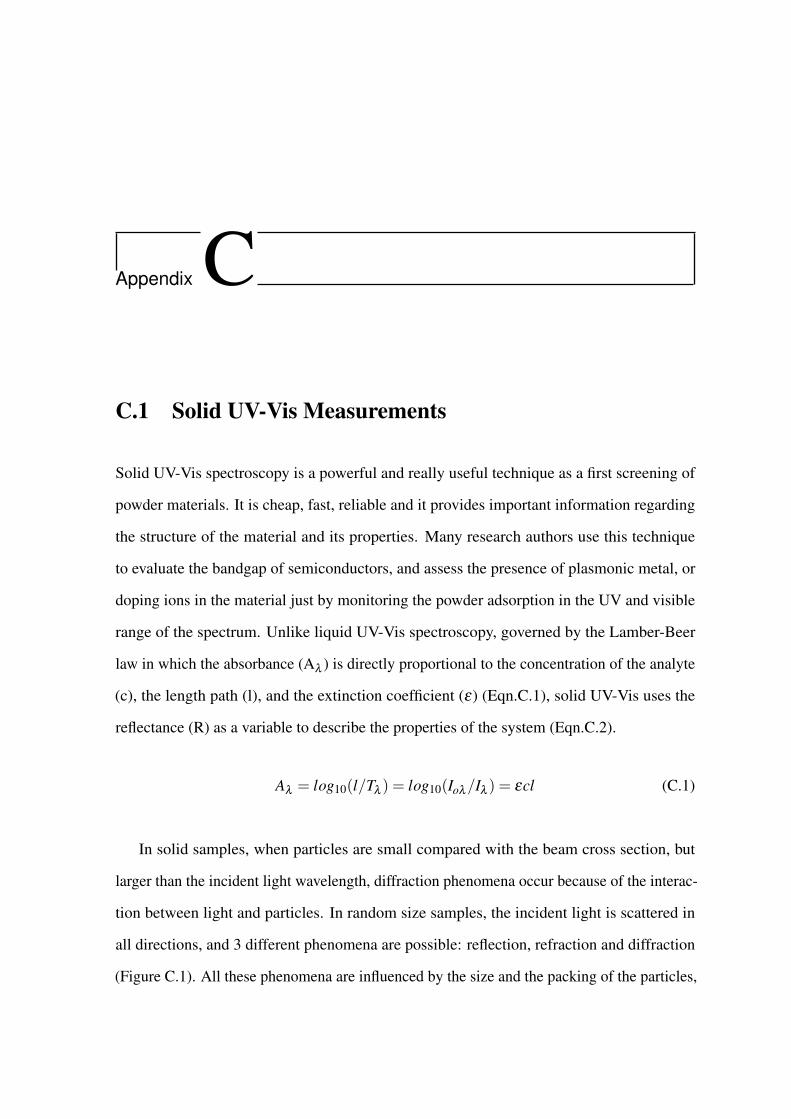
Appendix C
C.1 Solid UV-Vis Measurements
Solid UV-Vis spectroscopy is a powerful and really useful technique as a first screening of
powder materials. It is cheap, fast, reliable and it provides important information regarding
the structure of the material and its properties. Many research authors use this technique
to evaluate the bandgap of semiconductors, and assess the presence of plasmonic metal, or
doping ions in the material just by monitoring the powder adsorption in the UV and visible
range of the spectrum. Unlike liquid UV-Vis spectroscopy, governed by the Lamber-Beer
law in which the absorbance (Aλ ) is directly proportional to the concentration of the analyte
(c), the length path (l), and the extinction coefficient (ε) (Eqn.C.1), solid UV-Vis uses the
reflectance (R) as a variable to describe the properties of the system (Eqn.C.2).
Aλ = log10(l/Tλ ) = log10(Ioλ/Iλ ) = εcl (C.1)
In solid samples, when particles are small compared with the beam cross section, but
larger than the incident light wavelength, diffraction phenomena occur because of the interac-
tion between light and particles. In random size samples, the incident light is scattered in
all directions, and 3 different phenomena are possible: reflection, refraction and diffraction
(Figure C.1). All these phenomena are influenced by the size and the packing of the particles,
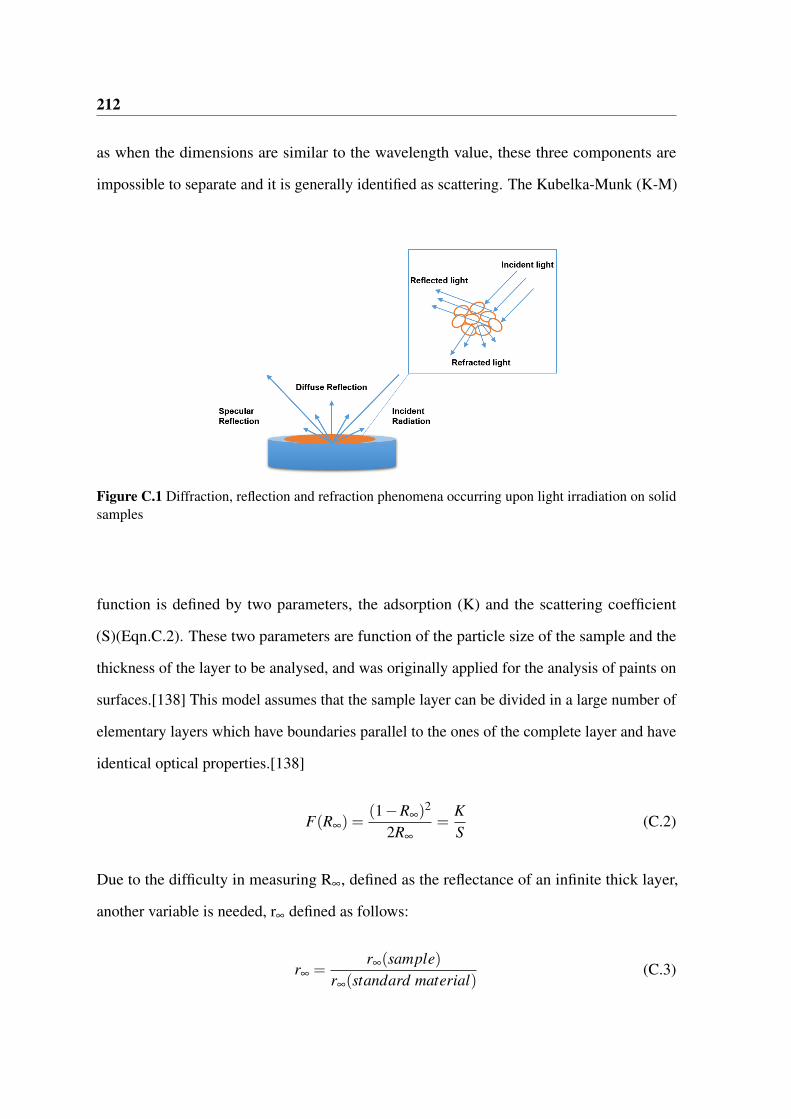
212
as when the dimensions are similar to the wavelength value, these three components are
impossible to separate and it is generally identified as scattering. The Kubelka-Munk (K-M)
Figure C.1 Diffraction, reflection and refraction phenomena occurring upon light irradiation on solidsamples
function is defined by two parameters, the adsorption (K) and the scattering coefficient
(S)(Eqn.C.2). These two parameters are function of the particle size of the sample and the
thickness of the layer to be analysed, and was originally applied for the analysis of paints on
surfaces.[138] This model assumes that the sample layer can be divided in a large number of
elementary layers which have boundaries parallel to the ones of the complete layer and have
identical optical properties.[138]
F(R∞) =(1−R∞)
2
2R∞
=KS
(C.2)
Due to the difficulty in measuring R∞, defined as the reflectance of an infinite thick layer,
another variable is needed, r∞ defined as follows:
r∞ =r∞(sample)
r∞(standard material)(C.3)
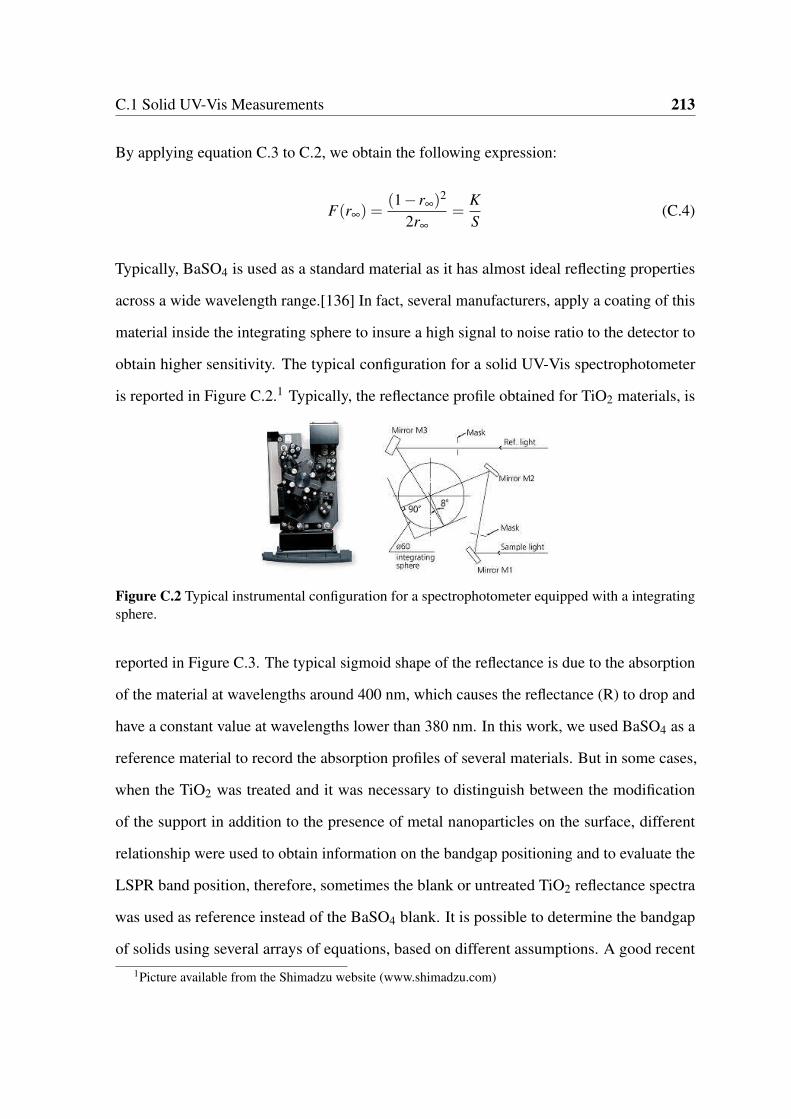
C.1 Solid UV-Vis Measurements 213
By applying equation C.3 to C.2, we obtain the following expression:
F(r∞) =(1− r∞)
2
2r∞
=KS
(C.4)
Typically, BaSO4 is used as a standard material as it has almost ideal reflecting properties
across a wide wavelength range.[136] In fact, several manufacturers, apply a coating of this
material inside the integrating sphere to insure a high signal to noise ratio to the detector to
obtain higher sensitivity. The typical configuration for a solid UV-Vis spectrophotometer
is reported in Figure C.2.1 Typically, the reflectance profile obtained for TiO2 materials, is
Figure C.2 Typical instrumental configuration for a spectrophotometer equipped with a integratingsphere.
reported in Figure C.3. The typical sigmoid shape of the reflectance is due to the absorption
of the material at wavelengths around 400 nm, which causes the reflectance (R) to drop and
have a constant value at wavelengths lower than 380 nm. In this work, we used BaSO4 as a
reference material to record the absorption profiles of several materials. But in some cases,
when the TiO2 was treated and it was necessary to distinguish between the modification
of the support in addition to the presence of metal nanoparticles on the surface, different
relationship were used to obtain information on the bandgap positioning and to evaluate the
LSPR band position, therefore, sometimes the blank or untreated TiO2 reflectance spectra
was used as reference instead of the BaSO4 blank. It is possible to determine the bandgap
of solids using several arrays of equations, based on different assumptions. A good recent1Picture available from the Shimadzu website (www.shimadzu.com)
214
Figure C.3 Typical reflectance profiles obtained from the different TiO2 polymorphs using BaSO4 asreference
review on the application of different equations was published by Lopez and Gomez [156].
In this study, the Kubelka-Munk function (C.2) was modified multiplying the F(R∞) by hν
to obtain the energy of the bandgap in eV and by using a coefficient (n) associated with
the specific transition considered. Therefore, the equation C.2 can be rewritten as follows
identifying α as the extinction coefficient:
α(hν) = (F(r∞) ·hν)n (C.5)
The coefficient is reported to be n=1/2 for direct allowed transition (Figure C.4a), and n=2
for indirect allowed transition (Figure C.4c). The so called Tauc plot is the result of the
relationship between C.5 and hν . [231]
From Figure C.5 it is clear how the amount of information obtainable from the simple
UV-Vis spectrum is not sufficient to assess the presence of metal nanoparticles on the surface
of the TiO2 especially if their absorption happens to be in the region where the semiconductor
absorbs light. It is necessary to de-convolute the spectra and the Tauc plot obtained using n=2
is displayed in Figure C.5b. The presence of the metal on the surface of the semiconductor is
now clear, and additionally, it is possible to examine the nature of the nanoparticles (mono,
bimetallic, core-shell) according to the peak shape and positioning.
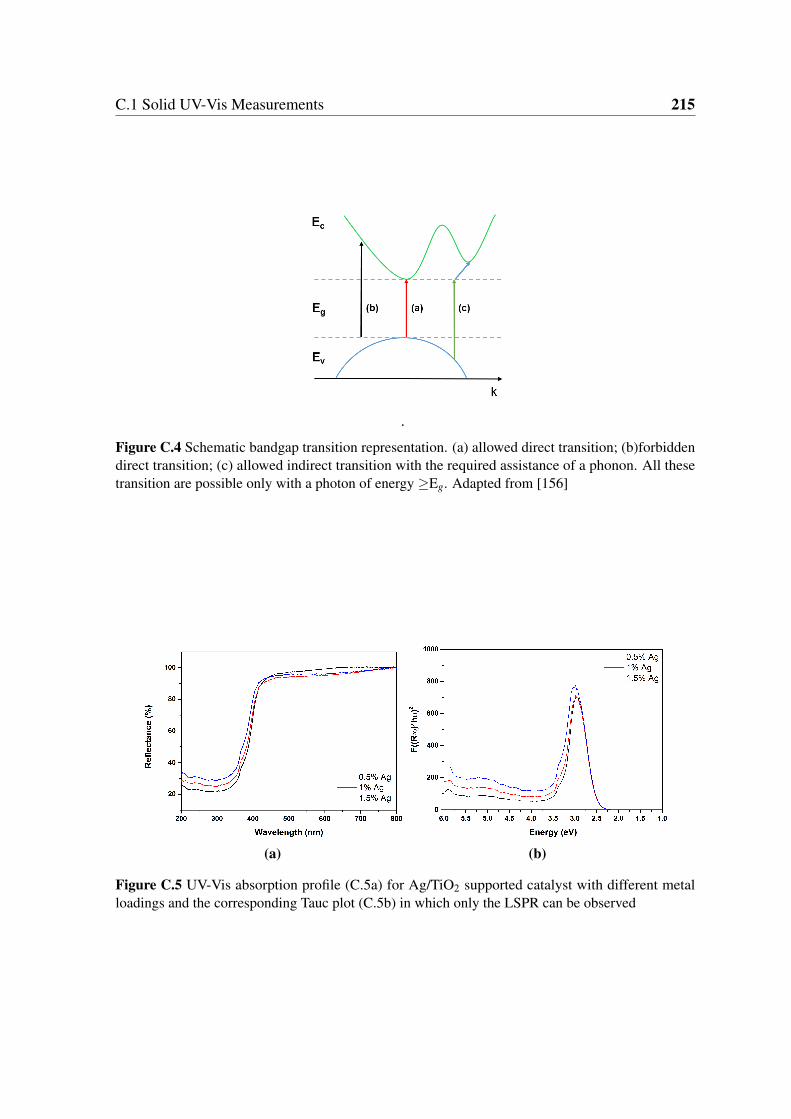
C.1 Solid UV-Vis Measurements 215
.
Figure C.4 Schematic bandgap transition representation. (a) allowed direct transition; (b)forbiddendirect transition; (c) allowed indirect transition with the required assistance of a phonon. All thesetransition are possible only with a photon of energy ≥Eg. Adapted from [156]
(a) (b)
Figure C.5 UV-Vis absorption profile (C.5a) for Ag/TiO2 supported catalyst with different metalloadings and the corresponding Tauc plot (C.5b) in which only the LSPR can be observed

Appendix D
D.1 Cellobiose Oxidation Tables
D.2 2.8 mM Cellobiose Solutions
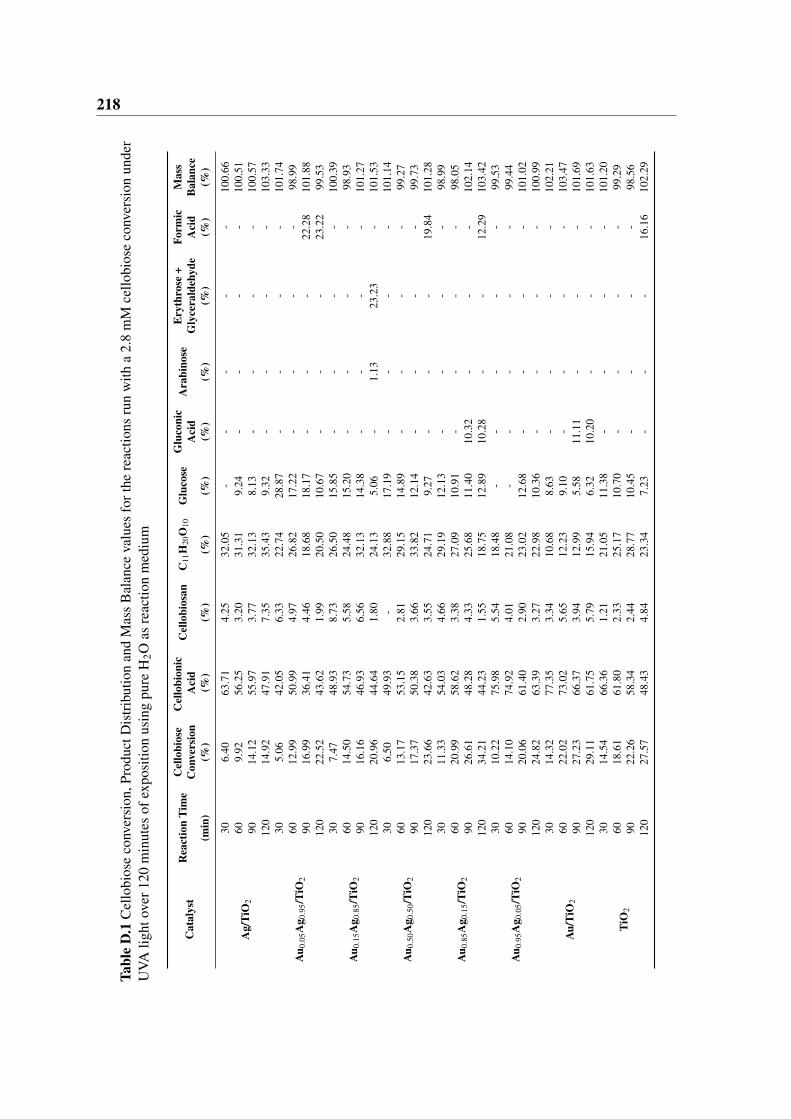
218Ta
ble
D.1
Cel
lobi
ose
conv
ersi
on,P
rodu
ctD
istr
ibut
ion
and
Mas
sB
alan
ceva
lues
fort
here
actio
nsru
nw
itha
2.8
mM
cello
bios
eco
nver
sion
unde
rU
VAlig
htov
er12
0m
inut
esof
expo
sitio
nus
ing
pure
H2O
asre
actio
nm
ediu
m
Cat
alys
tR
eact
ion
Tim
eC
ello
bios
eC
ello
bion
icC
ello
bios
anC
11H
20O
10G
luco
seG
luco
nic
Ara
bino
seE
ryth
rose
+Fo
rmic
Mas
sC
onve
rsio
nA
cid
Aci
dG
lyce
rald
ehyd
eA
cid
Bal
ance
(min
)(%
)(%
)(%
)(%
)(%
)(%
)(%
)(%
)(%
)(%
)
Ag/
TiO
2
306.
4063
.71
4.25
32.0
5-
--
--
100.
6660
9.92
56.2
53.
2031
.31
9.24
--
--
100.
5190
14.1
255
.97
3.77
32.1
38.
13-
--
-10
0.57
120
14.9
247
.91
7.35
35.4
39.
32-
--
-10
3.33
Au 0
.05A
g 0.9
5/Ti
O2
305.
0642
.05
6.33
22.7
428
.87
--
--
101.
7460
12.9
950
.99
4.97
26.8
217
.22
--
--
98.9
990
16.9
936
.41
4.46
18.6
818
.17
--
-22
.28
101.
8812
022
.52
43.6
21.
9920
.50
10.6
7-
--
23.2
299
.53
Au 0
.15A
g 0.8
5/Ti
O2
307.
4748
.93
8.73
26.5
015
.85
--
--
100.
3960
14.5
054
.73
5.58
24.4
815
.20
--
--
98.9
390
16.1
646
.93
6.56
32.1
314
.38
--
--
101.
2712
020
.96
44.6
41.
8024
.13
5.06
-1.
1323
.23
-10
1.53
Au 0
.50A
g 0.5
0/Ti
O2
306.
5049
.93
-32
.88
17.1
9-
--
-10
1.14
6013
.17
53.1
52.
8129
.15
14.8
9-
--
-99
.27
9017
.37
50.3
83.
6633
.82
12.1
4-
--
-99
.73
120
23.6
642
.63
3.55
24.7
19.
27-
--
19.8
410
1.28
Au 0
.85A
g 0.1
5/Ti
O2
3011
.33
54.0
34.
6629
.19
12.1
3-
--
-98
.99
6020
.99
58.6
23.
3827
.09
10.9
1-
--
-98
.05
9026
.61
48.2
84.
3325
.68
11.4
010
.32
--
-10
2.14
120
34.2
144
.23
1.55
18.7
512
.89
10.2
8-
-12
.29
103.
42
Au 0
.95A
g 0.0
5/Ti
O2
3010
.22
75.9
85.
5418
.48
--
--
-99
.53
6014
.10
74.9
24.
0121
.08
--
--
-99
.44
9020
.06
61.4
02.
9023
.02
12.6
8-
--
-10
1.02
120
24.8
263
.39
3.27
22.9
810
.36
--
--
100.
99
Au/
TiO
2
3014
.32
77.3
53.
3410
.68
8.63
--
--
102.
2160
22.0
273
.02
5.65
12.2
39.
10-
--
-10
3.47
9027
.23
66.3
73.
9412
.99
5.58
11.1
1-
--
101.
6912
029
.11
61.7
55.
7915
.94
6.32
10.2
0-
--
101.
63
TiO
2
3014
.54
66.3
61.
2121
.05
11.3
8-
--
-10
1.20
6018
.61
61.8
02.
3325
.17
10.7
0-
--
-99
.29
9022
.26
58.3
42.
4428
.77
10.4
5-
--
-98
.56
120
27.5
748
.43
4.84
23.3
47.
23-
--
16.1
610
2.29
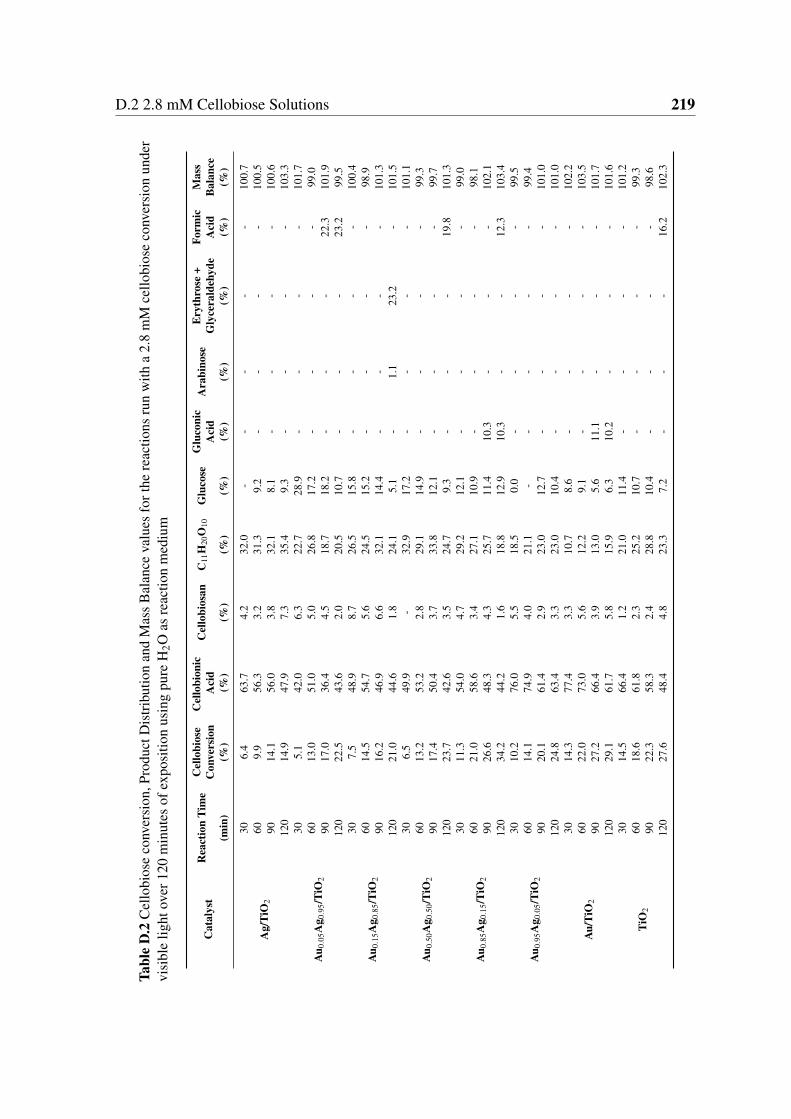
D.2 2.8 mM Cellobiose Solutions 219
Tabl
eD
.2C
ello
bios
eco
nver
sion
,Pro
duct
Dis
trib
utio
nan
dM
ass
Bal
ance
valu
esfo
rthe
reac
tions
run
with
a2.
8m
Mce
llobi
ose
conv
ersi
onun
der
visi
ble
light
over
120
min
utes
ofex
posi
tion
usin
gpu
reH
2Oas
reac
tion
med
ium
Cat
alys
tR
eact
ion
Tim
eC
ello
bios
eC
ello
bion
icC
ello
bios
anC
11H
20O
10G
luco
seG
luco
nic
Ara
bino
seE
ryth
rose
+Fo
rmic
Mas
sC
onve
rsio
nA
cid
Aci
dG
lyce
rald
ehyd
eA
cid
Bal
ance
(min
)(%
)(%
)(%
)(%
)(%
)(%
)(%
)(%
)(%
)(%
)
Ag/
TiO
2
306.
463
.74.
232
.0-
--
--
100.
760
9.9
56.3
3.2
31.3
9.2
--
--
100.
590
14.1
56.0
3.8
32.1
8.1
--
--
100.
612
014
.947
.97.
335
.49.
3-
--
-10
3.3
Au 0
.05A
g 0.9
5/Ti
O2
305.
142
.06.
322
.728
.9-
--
-10
1.7
6013
.051
.05.
026
.817
.2-
--
-99
.090
17.0
36.4
4.5
18.7
18.2
--
-22
.310
1.9
120
22.5
43.6
2.0
20.5
10.7
--
-23
.299
.5
Au 0
.15A
g 0.8
5/Ti
O2
307.
548
.98.
726
.515
.8-
--
-10
0.4
6014
.554
.75.
624
.515
.2-
--
-98
.990
16.2
46.9
6.6
32.1
14.4
--
--
101.
312
021
.044
.61.
824
.15.
1-
1.1
23.2
-10
1.5
Au 0
.50A
g 0.5
0/Ti
O2
306.
549
.9-
32.9
17.2
--
--
101.
160
13.2
53.2
2.8
29.1
14.9
--
--
99.3
9017
.450
.43.
733
.812
.1-
--
-99
.712
023
.742
.63.
524
.79.
3-
--
19.8
101.
3
Au 0
.85A
g 0.1
5/Ti
O2
3011
.354
.04.
729
.212
.1-
--
-99
.060
21.0
58.6
3.4
27.1
10.9
--
--
98.1
9026
.648
.34.
325
.711
.410
.3-
--
102.
112
034
.244
.21.
618
.812
.910
.3-
-12
.310
3.4
Au 0
.95A
g 0.0
5/Ti
O2
3010
.276
.05.
518
.50.
0-
--
-99
.560
14.1
74.9
4.0
21.1
--
--
-99
.490
20.1
61.4
2.9
23.0
12.7
--
--
101.
012
024
.863
.43.
323
.010
.4-
--
-10
1.0
Au/
TiO
2
3014
.377
.43.
310
.78.
6-
--
-10
2.2
6022
.073
.05.
612
.29.
1-
--
-10
3.5
9027
.266
.43.
913
.05.
611
.1-
--
101.
712
029
.161
.75.
815
.96.
310
.2-
--
101.
6
TiO
2
3014
.566
.41.
221
.011
.4-
--
-10
1.2
6018
.661
.82.
325
.210
.7-
--
-99
.390
22.3
58.3
2.4
28.8
10.4
--
--
98.6
120
27.6
48.4
4.8
23.3
7.2
--
-16
.210
2.3
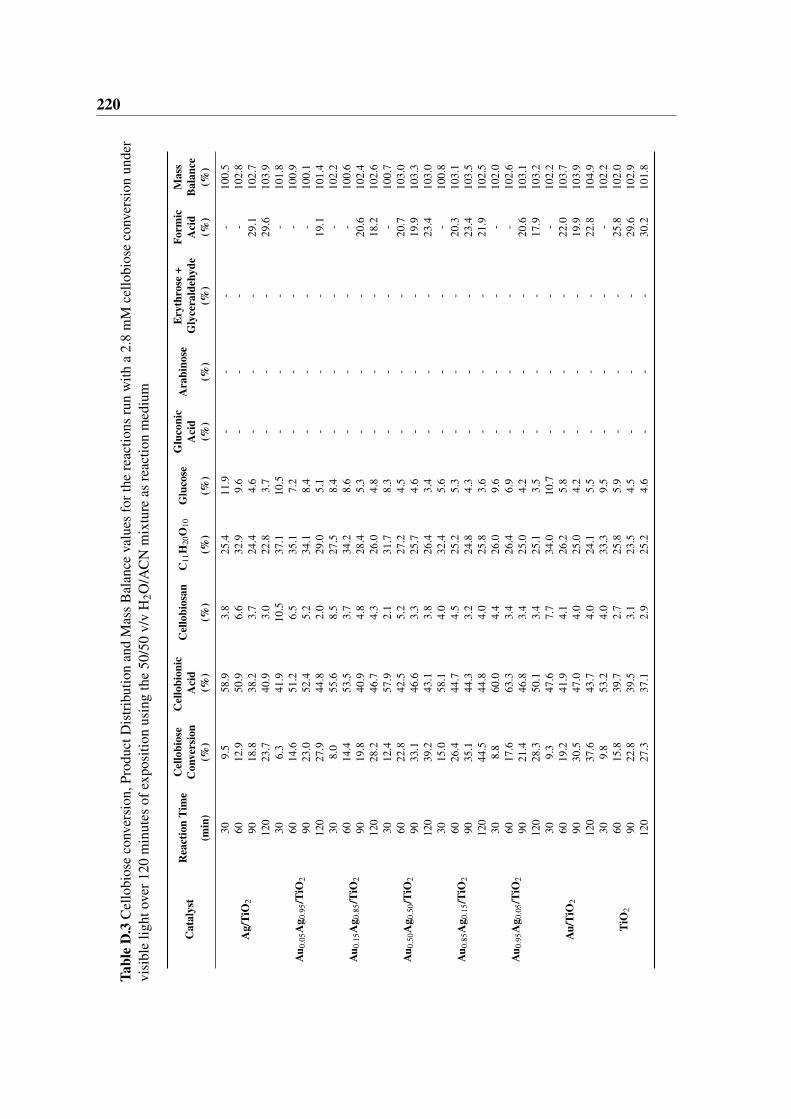
220Ta
ble
D.3
Cel
lobi
ose
conv
ersi
on,P
rodu
ctD
istr
ibut
ion
and
Mas
sB
alan
ceva
lues
fort
here
actio
nsru
nw
itha
2.8
mM
cello
bios
eco
nver
sion
unde
rvi
sibl
elig
htov
er12
0m
inut
esof
expo
sitio
nus
ing
the
50/5
0v/
vH
2O/A
CN
mix
ture
asre
actio
nm
ediu
m
Cat
alys
tR
eact
ion
Tim
eC
ello
bios
eC
ello
bion
icC
ello
bios
anC
11H
20O
10G
luco
seG
luco
nic
Ara
bino
seE
ryth
rose
+Fo
rmic
Mas
sC
onve
rsio
nA
cid
Aci
dG
lyce
rald
ehyd
eA
cid
Bal
ance
(min
)(%
)(%
)(%
)(%
)(%
)(%
)(%
)(%
)(%
)(%
)
Ag/
TiO
2
309.
558
.93.
825
.411
.9-
--
-10
0.5
6012
.950
.96.
632
.99.
6-
--
-10
2.8
9018
.838
.23.
724
.44.
6-
--
29.1
102.
712
023
.740
.93.
022
.83.
7-
--
29.6
103.
9
Au 0
.05A
g 0.9
5/Ti
O2
306.
341
.910
.537
.110
.5-
--
-10
1.8
6014
.651
.26.
535
.17.
2-
--
-10
0.9
9023
.052
.45.
234
.18.
4-
--
-10
0.1
120
27.9
44.8
2.0
29.0
5.1
--
-19
.110
1.4
Au 0
.15A
g 0.8
5/Ti
O2
308.
055
.68.
527
.58.
4-
--
-10
2.2
6014
.453
.53.
734
.28.
6-
--
-10
0.6
9019
.840
.94.
828
.45.
3-
--
20.6
102.
412
028
.246
.74.
326
.04.
8-
--
18.2
102.
6
Au 0
.50A
g 0.5
0/Ti
O2
3012
.457
.92.
131
.78.
3-
--
-10
0.7
6022
.842
.55.
227
.24.
5-
--
20.7
103.
090
33.1
46.6
3.3
25.7
4.6
--
-19
.910
3.3
120
39.2
43.1
3.8
26.4
3.4
--
-23
.410
3.0
Au 0
.85A
g 0.1
5/Ti
O2
3015
.058
.14.
032
.45.
6-
--
-10
0.8
6026
.444
.74.
525
.25.
3-
--
20.3
103.
190
35.1
44.3
3.2
24.8
4.3
--
-23
.410
3.5
120
44.5
44.8
4.0
25.8
3.6
--
-21
.910
2.5
Au 0
.95A
g 0.0
5/Ti
O2
308.
860
.04.
426
.09.
6-
--
-10
2.0
6017
.663
.33.
426
.46.
9-
--
-10
2.6
9021
.446
.83.
425
.04.
2-
--
20.6
103.
112
028
.350
.13.
425
.13.
5-
--
17.9
103.
2
Au/
TiO
2
309.
347
.67.
734
.010
.7-
--
-10
2.2
6019
.241
.94.
126
.25.
8-
--
22.0
103.
790
30.5
47.0
4.0
25.0
4.2
--
-19
.910
3.9
120
37.6
43.7
4.0
24.1
5.5
--
-22
.810
4.9
TiO
2
309.
853
.24.
033
.39.
5-
--
-10
2.2
6015
.839
.72.
725
.85.
9-
--
25.8
102.
090
22.8
39.5
3.1
23.5
4.5
--
-29
.610
2.9
120
27.3
37.1
2.9
25.2
4.6
--
-30
.210
1.8
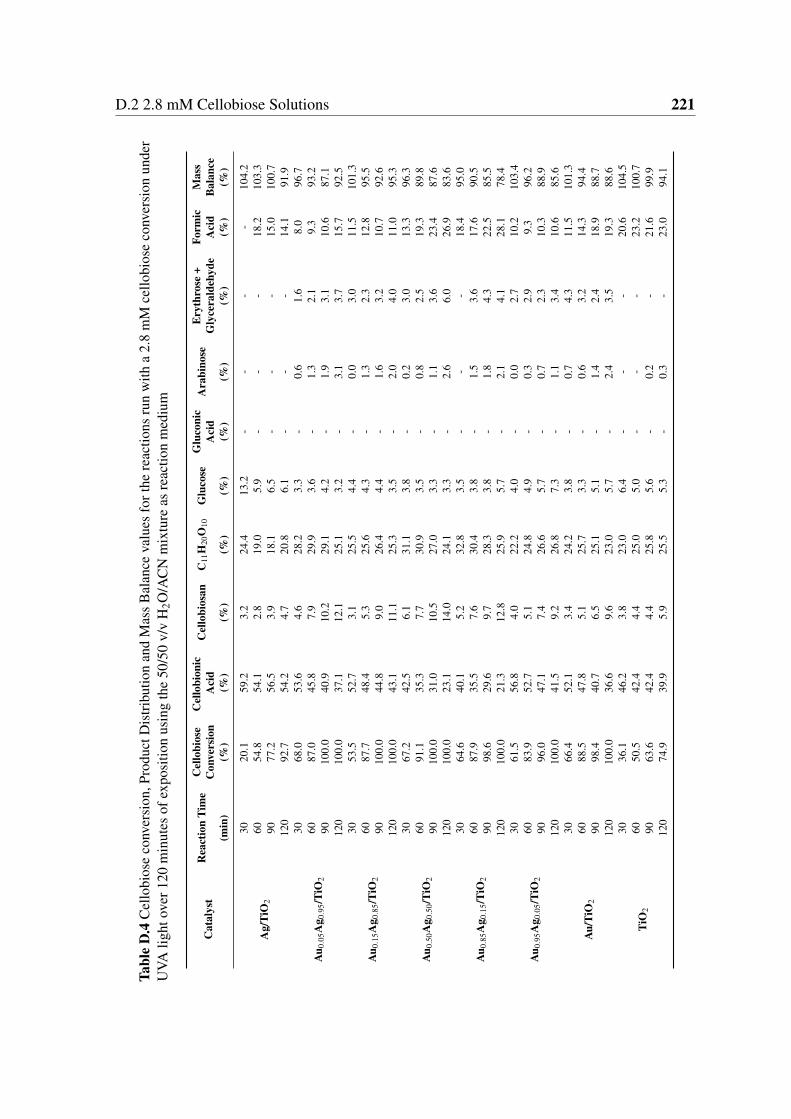
D.2 2.8 mM Cellobiose Solutions 221
Tabl
eD
.4C
ello
bios
eco
nver
sion
,Pro
duct
Dis
trib
utio
nan
dM
ass
Bal
ance
valu
esfo
rthe
reac
tions
run
with
a2.
8m
Mce
llobi
ose
conv
ersi
onun
der
UVA
light
over
120
min
utes
ofex
posi
tion
usin
gth
e50
/50
v/v
H2O
/AC
Nm
ixtu
reas
reac
tion
med
ium
Cat
alys
tR
eact
ion
Tim
eC
ello
bios
eC
ello
bion
icC
ello
bios
anC
11H
20O
10G
luco
seG
luco
nic
Ara
bino
seE
ryth
rose
+Fo
rmic
Mas
sC
onve
rsio
nA
cid
Aci
dG
lyce
rald
ehyd
eA
cid
Bal
ance
(min
)(%
)(%
)(%
)(%
)(%
)(%
)(%
)(%
)(%
)(%
)
Ag/
TiO
2
3020
.159
.23.
224
.413
.2-
--
-10
4.2
6054
.854
.12.
819
.05.
9-
--
18.2
103.
390
77.2
56.5
3.9
18.1
6.5
--
-15
.010
0.7
120
92.7
54.2
4.7
20.8
6.1
--
-14
.191
.9
Au 0
.05A
g 0.9
5/Ti
O2
3068
.053
.64.
628
.23.
3-
0.6
1.6
8.0
96.7
6087
.045
.87.
929
.93.
6-
1.3
2.1
9.3
93.2
9010
0.0
40.9
10.2
29.1
4.2
-1.
93.
110
.687
.112
010
0.0
37.1
12.1
25.1
3.2
-3.
13.
715
.792
.5
Au 0
.15A
g 0.8
5/Ti
O2
3053
.552
.73.
125
.54.
4-
0.0
3.0
11.5
101.
360
87.7
48.4
5.3
25.6
4.3
-1.
32.
312
.895
.590
100.
044
.89.
026
.44.
4-
1.6
3.2
10.7
92.6
120
100.
043
.111
.125
.33.
5-
2.0
4.0
11.0
95.3
Au 0
.50A
g 0.5
0/Ti
O2
3067
.242
.56.
131
.13.
8-
0.2
3.0
13.3
96.3
6091
.135
.37.
730
.93.
5-
0.8
2.5
19.3
89.8
9010
0.0
31.0
10.5
27.0
3.3
-1.
13.
623
.487
.612
010
0.0
23.1
14.0
24.1
3.3
-2.
66.
026
.983
.6
Au 0
.85A
g 0.1
5/Ti
O2
3064
.640
.15.
232
.83.
5-
--
18.4
95.0
6087
.935
.57.
630
.43.
8-
1.5
3.6
17.6
90.5
9098
.629
.69.
728
.33.
8-
1.8
4.3
22.5
85.5
120
100.
021
.312
.825
.95.
7-
2.1
4.1
28.1
78.4
Au 0
.95A
g 0.0
5/Ti
O2
3061
.556
.84.
022
.24.
0-
0.0
2.7
10.2
103.
460
83.9
52.7
5.1
24.8
4.9
-0.
32.
99.
396
.290
96.0
47.1
7.4
26.6
5.7
-0.
72.
310
.388
.912
010
0.0
41.5
9.2
26.8
7.3
-1.
13.
410
.685
.6
Au/
TiO
2
3066
.452
.13.
424
.23.
8-
0.7
4.3
11.5
101.
360
88.5
47.8
5.1
25.7
3.3
-0.
63.
214
.394
.490
98.4
40.7
6.5
25.1
5.1
-1.
42.
418
.988
.712
010
0.0
36.6
9.6
23.0
5.7
-2.
43.
519
.388
.6
TiO
2
3036
.146
.23.
823
.06.
4-
--
20.6
104.
560
50.5
42.4
4.4
25.0
5.0
--
-23
.210
0.7
9063
.642
.44.
425
.85.
6-
0.2
-21
.699
.912
074
.939
.95.
925
.55.
3-
0.3
-23
.094
.1

222
D.3 10 mM Cellobiose Solutions
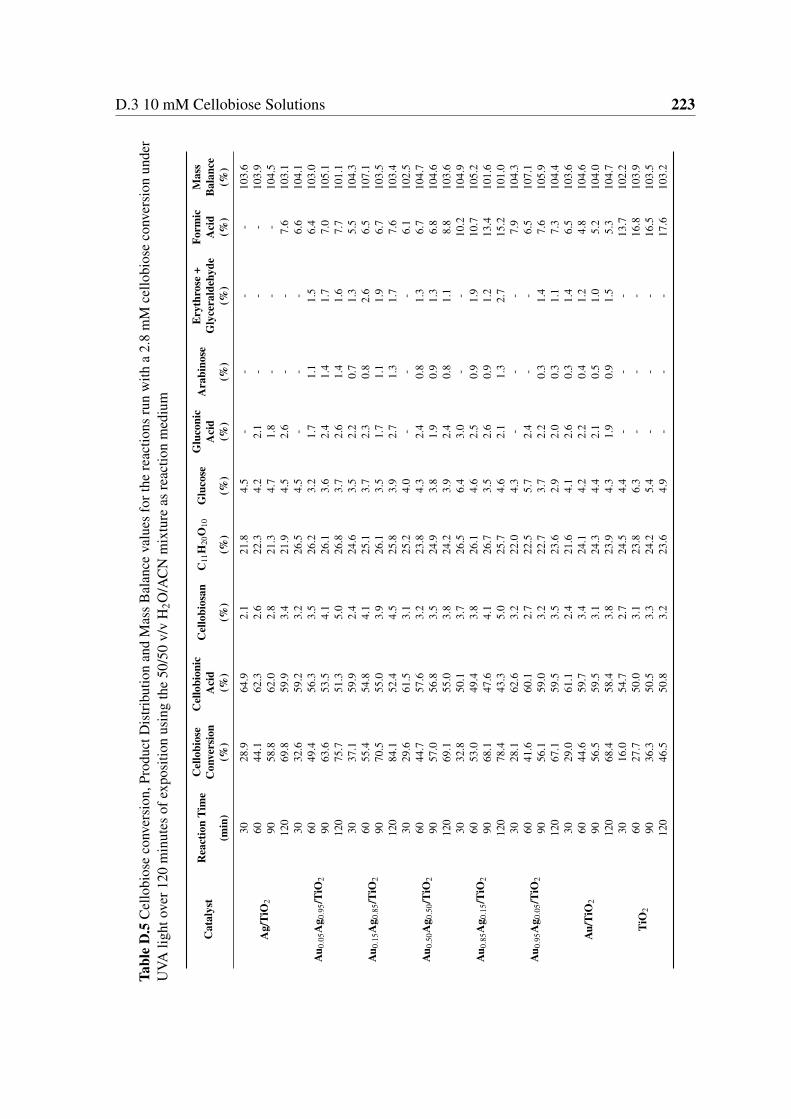
D.3 10 mM Cellobiose Solutions 223
Tabl
eD
.5C
ello
bios
eco
nver
sion
,Pro
duct
Dis
trib
utio
nan
dM
ass
Bal
ance
valu
esfo
rthe
reac
tions
run
with
a2.
8m
Mce
llobi
ose
conv
ersi
onun
der
UVA
light
over
120
min
utes
ofex
posi
tion
usin
gth
e50
/50
v/v
H2O
/AC
Nm
ixtu
reas
reac
tion
med
ium
Cat
alys
tR
eact
ion
Tim
eC
ello
bios
eC
ello
bion
icC
ello
bios
anC
11H
20O
10G
luco
seG
luco
nic
Ara
bino
seE
ryth
rose
+Fo
rmic
Mas
sC
onve
rsio
nA
cid
Aci
dG
lyce
rald
ehyd
eA
cid
Bal
ance
(min
)(%
)(%
)(%
)(%
)(%
)(%
)(%
)(%
)(%
)(%
)
Ag/
TiO
2
3028
.964
.92.
121
.84.
5-
--
-10
3.6
6044
.162
.32.
622
.34.
22.
1-
--
103.
990
58.8
62.0
2.8
21.3
4.7
1.8
--
-10
4.5
120
69.8
59.9
3.4
21.9
4.5
2.6
--
7.6
103.
1
Au 0
.05A
g 0.9
5/Ti
O2
3032
.659
.23.
226
.54.
5-
--
6.6
104.
160
49.4
56.3
3.5
26.2
3.2
1.7
1.1
1.5
6.4
103.
090
63.6
53.5
4.1
26.1
3.6
2.4
1.4
1.7
7.0
105.
112
075
.751
.35.
026
.83.
72.
61.
41.
67.
710
1.1
Au 0
.15A
g 0.8
5/Ti
O2
3037
.159
.92.
424
.63.
52.
20.
71.
35.
510
4.3
6055
.454
.84.
125
.13.
72.
30.
82.
66.
510
7.1
9070
.555
.03.
926
.13.
51.
71.
11.
96.
710
3.5
120
84.1
52.4
4.5
25.8
3.9
2.7
1.3
1.7
7.6
103.
4
Au 0
.50A
g 0.5
0/Ti
O2
3029
.661
.53.
125
.24.
0-
--
6.1
102.
560
44.7
57.6
3.2
23.8
4.3
2.4
0.8
1.3
6.7
104.
790
57.0
56.8
3.5
24.9
3.8
1.9
0.9
1.3
6.8
104.
612
069
.155
.03.
824
.23.
92.
40.
81.
18.
810
3.6
Au 0
.85A
g 0.1
5/Ti
O2
3032
.850
.13.
726
.56.
43.
0-
-10
.210
4.9
6053
.049
.43.
826
.14.
62.
50.
91.
910
.710
5.2
9068
.147
.64.
126
.73.
52.
60.
91.
213
.410
1.6
120
78.4
43.3
5.0
25.7
4.6
2.1
1.3
2.7
15.2
101.
0
Au 0
.95A
g 0.0
5/Ti
O2
3028
.162
.63.
222
.04.
3-
--
7.9
104.
360
41.6
60.1
2.7
22.5
5.7
2.4
--
6.5
107.
190
56.1
59.0
3.2
22.7
3.7
2.2
0.3
1.4
7.6
105.
912
067
.159
.53.
523
.62.
92.
00.
31.
17.
310
4.4
Au/
TiO
2
3029
.061
.12.
421
.64.
12.
60.
31.
46.
510
3.6
6044
.659
.73.
424
.14.
22.
20.
41.
24.
810
4.6
9056
.559
.53.
124
.34.
42.
10.
51.
05.
210
4.0
120
68.4
58.4
3.8
23.9
4.3
1.9
0.9
1.5
5.3
104.
7
TiO
2
3016
.054
.72.
724
.54.
4-
--
13.7
102.
260
27.7
50.0
3.1
23.8
6.3
--
-16
.810
3.9
9036
.350
.53.
324
.25.
4-
--
16.5
103.
512
046
.550
.83.
223
.64.
9-
--
17.6
103.
2
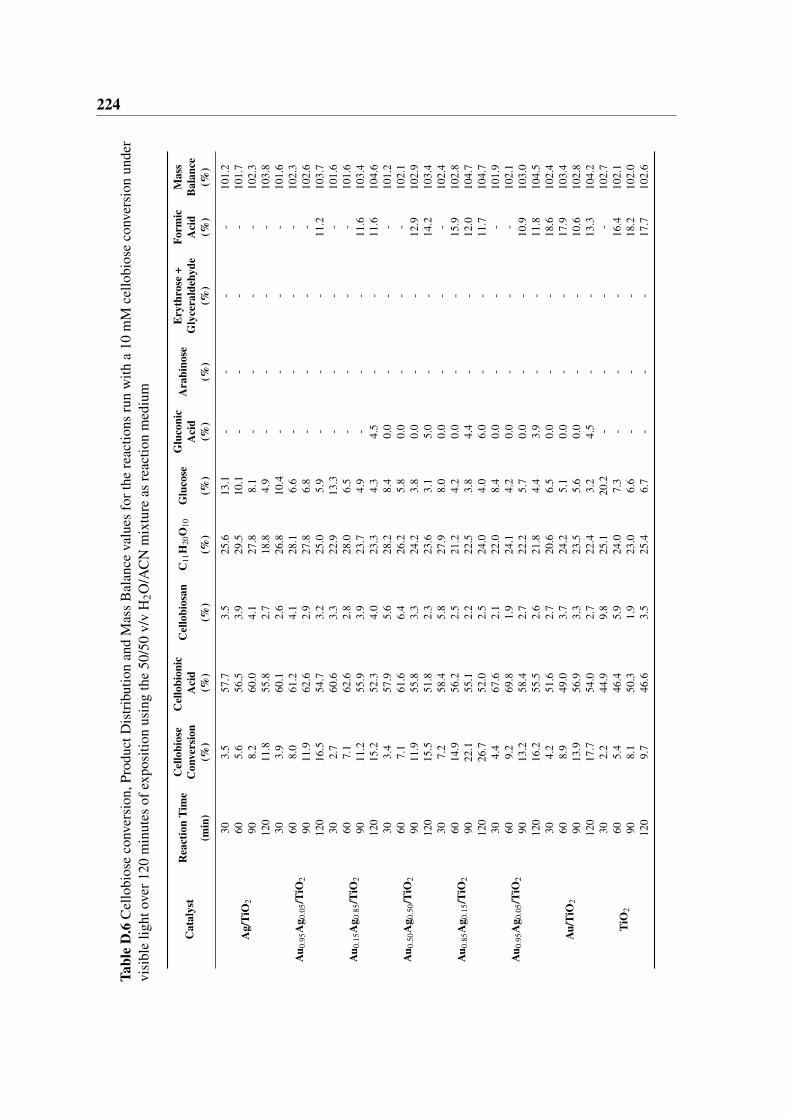
224Ta
ble
D.6
Cel
lobi
ose
conv
ersi
on,P
rodu
ctD
istr
ibut
ion
and
Mas
sB
alan
ceva
lues
fort
here
actio
nsru
nw
itha
10m
Mce
llobi
ose
conv
ersi
onun
der
visi
ble
light
over
120
min
utes
ofex
posi
tion
usin
gth
e50
/50
v/v
H2O
/AC
Nm
ixtu
reas
reac
tion
med
ium
Cat
alys
tR
eact
ion
Tim
eC
ello
bios
eC
ello
bion
icC
ello
bios
anC
11H
20O
10G
luco
seG
luco
nic
Ara
bino
seE
ryth
rose
+Fo
rmic
Mas
sC
onve
rsio
nA
cid
Aci
dG
lyce
rald
ehyd
eA
cid
Bal
ance
(min
)(%
)(%
)(%
)(%
)(%
)(%
)(%
)(%
)(%
)(%
)
Ag/
TiO
2
303.
557
.73.
525
.613
.1-
--
-10
1.2
605.
656
.53.
929
.510
.1-
--
-10
1.7
908.
260
.04.
127
.88.
1-
--
-10
2.3
120
11.8
55.8
2.7
18.8
4.9
--
--
103.
8
Au 0
.95A
g 0.0
5/Ti
O2
303.
960
.12.
626
.810
.4-
--
-10
1.6
608.
061
.24.
128
.16.
6-
--
-10
2.3
9011
.962
.62.
927
.86.
8-
--
-10
2.6
120
16.5
54.7
3.2
25.0
5.9
--
-11
.210
3.7
Au 0
.15A
g 0.8
5/Ti
O2
302.
760
.63.
322
.913
.3-
--
-10
1.6
607.
162
.62.
828
.06.
5-
--
-10
1.6
9011
.255
.93.
923
.74.
9-
--
11.6
103.
412
015
.252
.34.
023
.34.
34.
5-
-11
.610
4.6
Au 0
.50A
g 0.5
0/Ti
O2
303.
457
.95.
628
.28.
40.
0-
--
101.
260
7.1
61.6
6.4
26.2
5.8
0.0
--
-10
2.1
9011
.955
.83.
324
.23.
80.
0-
-12
.910
2.9
120
15.5
51.8
2.3
23.6
3.1
5.0
--
14.2
103.
4
Au 0
.85A
g 0.1
5/Ti
O2
307.
258
.45.
827
.98.
00.
0-
--
102.
460
14.9
56.2
2.5
21.2
4.2
0.0
--
15.9
102.
890
22.1
55.1
2.2
22.5
3.8
4.4
--
12.0
104.
712
026
.752
.02.
524
.04.
06.
0-
-11
.710
4.7
Au 0
.95A
g 0.0
5/Ti
O2
304.
467
.62.
122
.08.
40.
0-
--
101.
960
9.2
69.8
1.9
24.1
4.2
0.0
--
-10
2.1
9013
.258
.42.
722
.25.
70.
0-
-10
.910
3.0
120
16.2
55.5
2.6
21.8
4.4
3.9
--
11.8
104.
5
Au/
TiO
2
304.
251
.62.
720
.66.
50.
0-
-18
.610
2.4
608.
949
.03.
724
.25.
10.
0-
-17
.910
3.4
9013
.956
.93.
323
.55.
60.
0-
-10
.610
2.8
120
17.7
54.0
2.7
22.4
3.2
4.5
--
13.3
104.
2
TiO
2
302.
244
.99.
825
.120
.2-
--
-10
2.7
605.
446
.45.
924
.07.
3-
--
16.4
102.
190
8.1
50.3
1.9
23.0
6.6
--
-18
.210
2.0
120
9.7
46.6
3.5
25.4
6.7
--
-17
.710
2.6
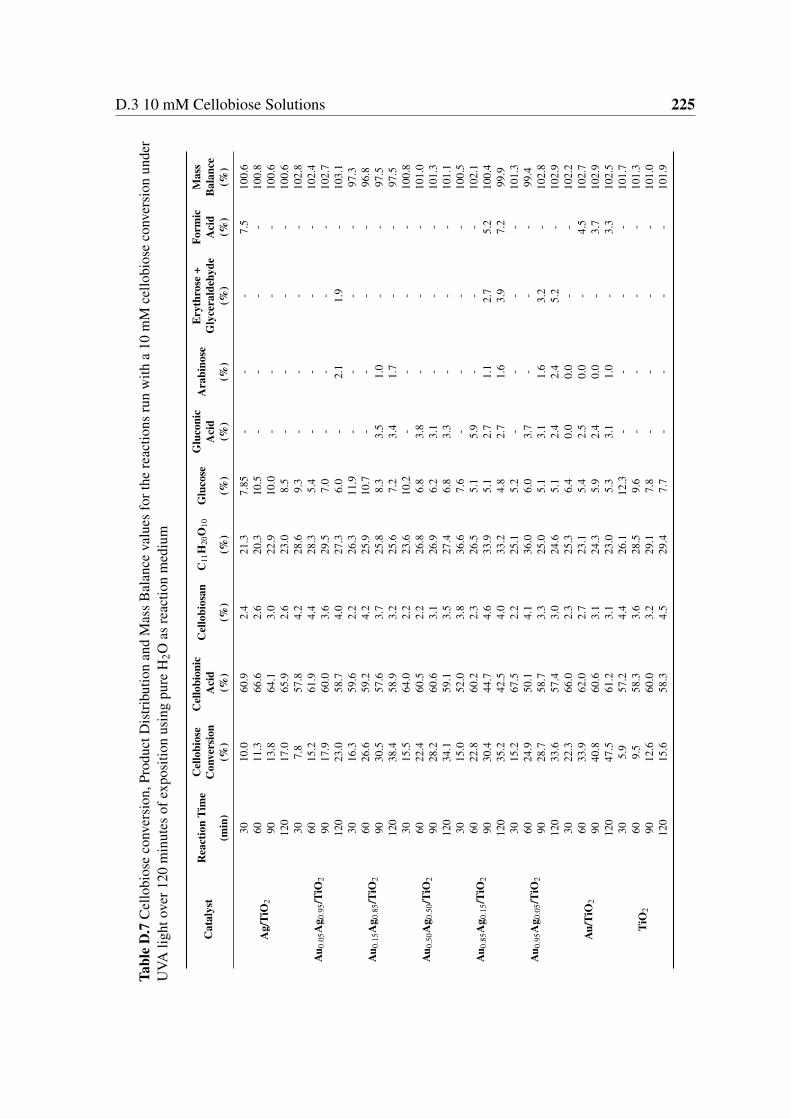
D.3 10 mM Cellobiose Solutions 225
Tabl
eD
.7C
ello
bios
eco
nver
sion
,Pro
duct
Dis
trib
utio
nan
dM
ass
Bal
ance
valu
esfo
rthe
reac
tions
run
with
a10
mM
cello
bios
eco
nver
sion
unde
rU
VAlig
htov
er12
0m
inut
esof
expo
sitio
nus
ing
pure
H2O
asre
actio
nm
ediu
m
Cat
alys
tR
eact
ion
Tim
eC
ello
bios
eC
ello
bion
icC
ello
bios
anC
11H
20O
10G
luco
seG
luco
nic
Ara
bino
seE
ryth
rose
+Fo
rmic
Mas
sC
onve
rsio
nA
cid
Aci
dG
lyce
rald
ehyd
eA
cid
Bal
ance
(min
)(%
)(%
)(%
)(%
)(%
)(%
)(%
)(%
)(%
)(%
)
Ag/
TiO
2
3010
.060
.92.
421
.37.
85-
--
7.5
100.
660
11.3
66.6
2.6
20.3
10.5
--
--
100.
890
13.8
64.1
3.0
22.9
10.0
--
--
100.
612
017
.065
.92.
623
.08.
5-
--
-10
0.6
Au 0
.05A
g 0.9
5/Ti
O2
307.
857
.84.
228
.69.
3-
--
-10
2.8
6015
.261
.94.
428
.35.
4-
--
-10
2.4
9017
.960
.03.
629
.57.
0-
--
-10
2.7
120
23.0
58.7
4.0
27.3
6.0
-2.
11.
9-
103.
1
Au 0
.15A
g 0.8
5/Ti
O2
3016
.359
.62.
226
.311
.9-
--
-97
.360
26.6
59.2
4.2
25.9
10.7
--
--
96.8
9030
.557
.63.
725
.88.
33.
51.
0-
-97
.512
038
.458
.93.
225
.67.
23.
41.
7-
-97
.5
Au 0
.50A
g 0.5
0/Ti
O2
3015
.564
.02.
223
.610
.2-
--
-10
0.8
6022
.460
.52.
226
.86.
83.
8-
--
101.
090
28.2
60.6
3.1
26.9
6.2
3.1
--
-10
1.3
120
34.1
59.1
3.5
27.4
6.8
3.3
--
-10
1.1
Au 0
.85A
g 0.1
5/Ti
O2
3015
.052
.03.
836
.67.
6-
--
-10
0.5
6022
.860
.22.
326
.55.
15.
9-
--
102.
190
30.4
44.7
4.6
33.9
5.1
2.7
1.1
2.7
5.2
100.
412
035
.242
.54.
033
.24.
82.
71.
63.
97.
299
.9
Au 0
.95A
g 0.0
5/Ti
O2
3015
.267
.52.
225
.15.
2-
--
-10
1.3
6024
.950
.14.
136
.06.
03.
7-
--
99.4
9028
.758
.73.
325
.05.
13.
11.
63.
2-
102.
812
033
.657
.43.
024
.65.
12.
42.
45.
2-
102.
9
Au/
TiO
2
3022
.366
.02.
325
.36.
40.
00.
0-
-10
2.2
6033
.962
.02.
723
.15.
42.
50.
0-
4.5
102.
790
40.8
60.6
3.1
24.3
5.9
2.4
0.0
-3.
710
2.9
120
47.5
61.2
3.1
23.0
5.3
3.1
1.0
-3.
310
2.5
TiO
2
305.
957
.24.
426
.112
.3-
--
-10
1.7
609.
558
.33.
628
.59.
6-
--
-10
1.3
9012
.660
.03.
229
.17.
8-
--
-10
1.0
120
15.6
58.3
4.5
29.4
7.7
--
--
101.
9
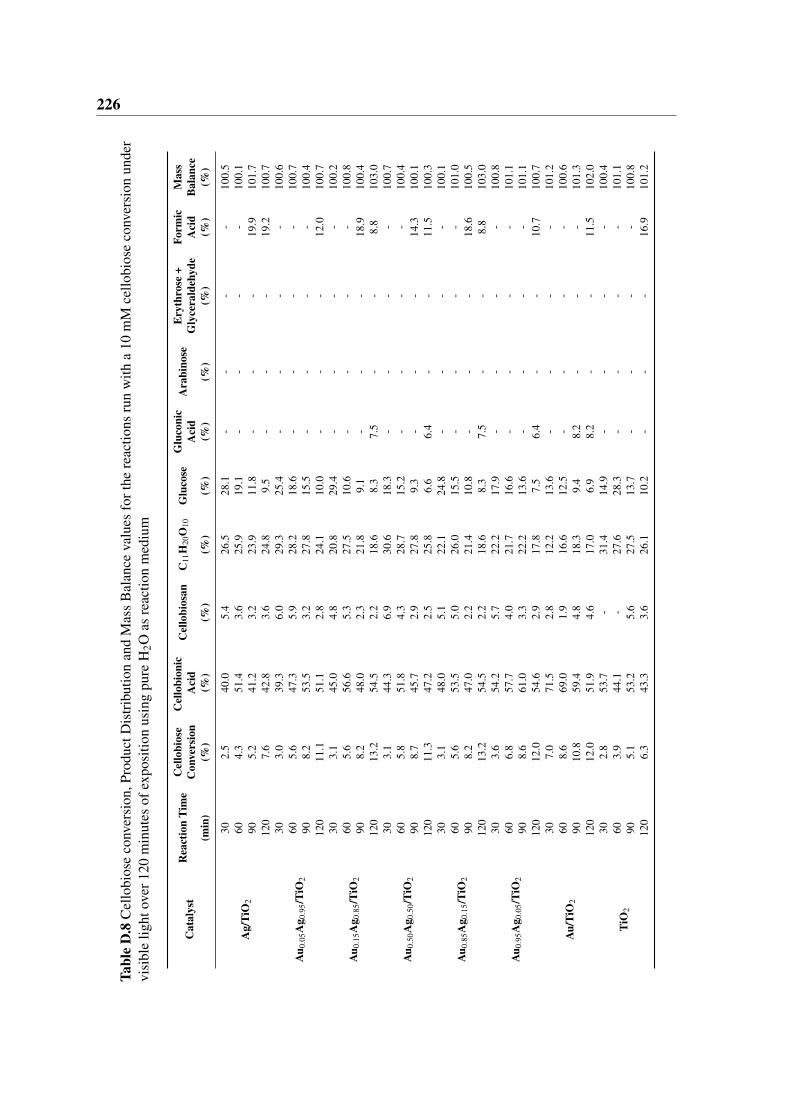
226Ta
ble
D.8
Cel
lobi
ose
conv
ersi
on,P
rodu
ctD
istr
ibut
ion
and
Mas
sB
alan
ceva
lues
fort
here
actio
nsru
nw
itha
10m
Mce
llobi
ose
conv
ersi
onun
der
visi
ble
light
over
120
min
utes
ofex
posi
tion
usin
gpu
reH
2Oas
reac
tion
med
ium
Cat
alys
tR
eact
ion
Tim
eC
ello
bios
eC
ello
bion
icC
ello
bios
anC
11H
20O
10G
luco
seG
luco
nic
Ara
bino
seE
ryth
rose
+Fo
rmic
Mas
sC
onve
rsio
nA
cid
Aci
dG
lyce
rald
ehyd
eA
cid
Bal
ance
(min
)(%
)(%
)(%
)(%
)(%
)(%
)(%
)(%
)(%
)(%
)
Ag/
TiO
2
302.
540
.05.
426
.528
.1-
--
-10
0.5
604.
351
.43.
625
.919
.1-
--
-10
0.1
905.
241
.23.
223
.911
.8-
--
19.9
101.
712
07.
642
.83.
624
.89.
5-
--
19.2
100.
7
Au 0
.05A
g 0.9
5/Ti
O2
303.
039
.36.
029
.325
.4-
--
-10
0.6
605.
647
.35.
928
.218
.6-
--
-10
0.7
908.
253
.53.
227
.815
.5-
--
-10
0.4
120
11.1
51.1
2.8
24.1
10.0
--
-12
.010
0.7
Au 0
.15A
g 0.8
5/Ti
O2
303.
145
.04.
820
.829
.4-
--
-10
0.2
605.
656
.65.
327
.510
.6-
--
-10
0.8
908.
248
.02.
321
.89.
1-
--
18.9
100.
412
013
.254
.52.
218
.68.
37.
5-
-8.
810
3.0
Au 0
.50A
g 0.5
0/Ti
O2
303.
144
.36.
930
.618
.3-
--
-10
0.7
605.
851
.84.
328
.715
.2-
--
-10
0.4
908.
745
.72.
927
.89.
3-
--
14.3
100.
112
011
.347
.22.
525
.86.
66.
4-
-11
.510
0.3
Au 0
.85A
g 0.1
5/Ti
O2
303.
148
.05.
122
.124
.8-
--
-10
0.1
605.
653
.55.
026
.015
.5-
--
-10
1.0
908.
247
.02.
221
.410
.8-
--
18.6
100.
512
013
.254
.52.
218
.68.
37.
5-
-8.
810
3.0
Au 0
.95A
g 0.0
5/Ti
O2
303.
654
.25.
722
.217
.9-
--
-10
0.8
606.
857
.74.
021
.716
.6-
--
-10
1.1
908.
661
.03.
322
.213
.6-
--
-10
1.1
120
12.0
54.6
2.9
17.8
7.5
6.4
--
10.7
100.
7
Au/
TiO
2
307.
071
.52.
812
.213
.6-
--
-10
1.2
608.
669
.01.
916
.612
.5-
--
-10
0.6
9010
.859
.44.
818
.39.
48.
2-
--
101.
312
012
.051
.94.
617
.06.
98.
2-
-11
.510
2.0
TiO
2
302.
853
.7-
31.4
14.9
--
--
100.
460
3.9
44.1
-27
.628
.3-
--
-10
1.1
905.
153
.25.
627
.513
.7-
--
-10
0.8
120
6.3
43.3
3.6
26.1
10.2
--
-16
.910
1.2
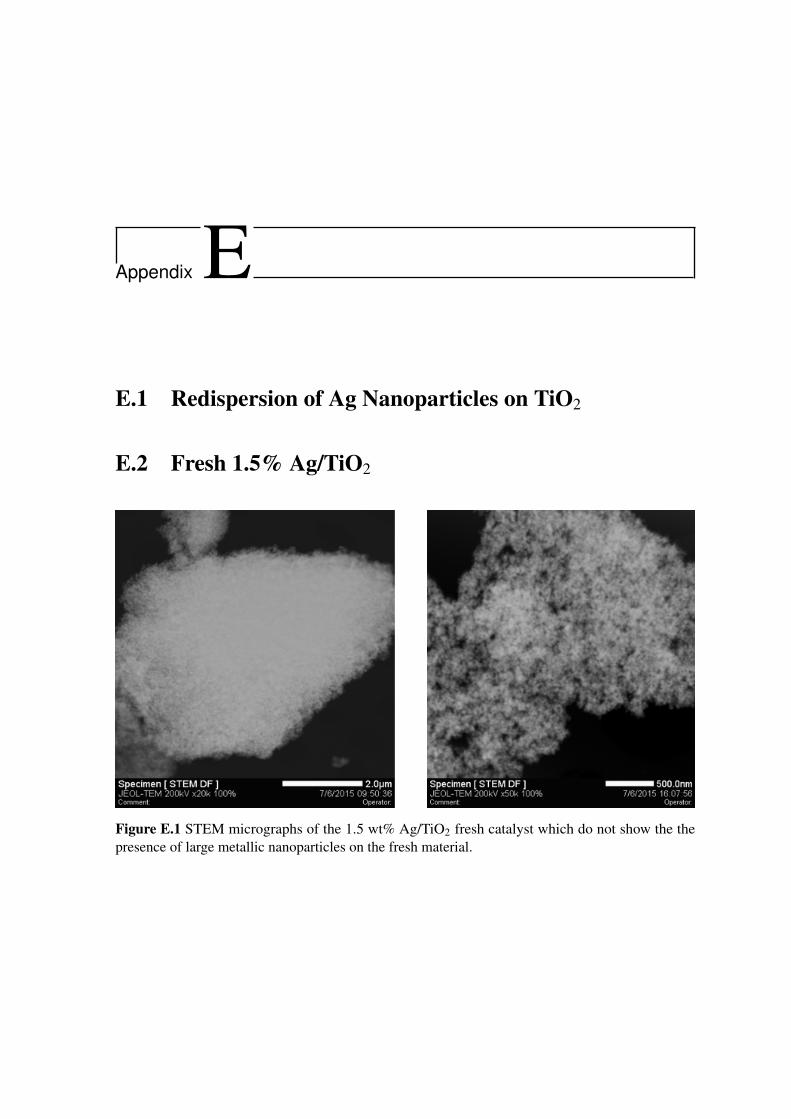
Appendix E
E.1 Redispersion of Ag Nanoparticles on TiO2
E.2 Fresh 1.5% Ag/TiO2
Figure E.1 STEM micrographs of the 1.5 wt% Ag/TiO2 fresh catalyst which do not show the thepresence of large metallic nanoparticles on the fresh material.
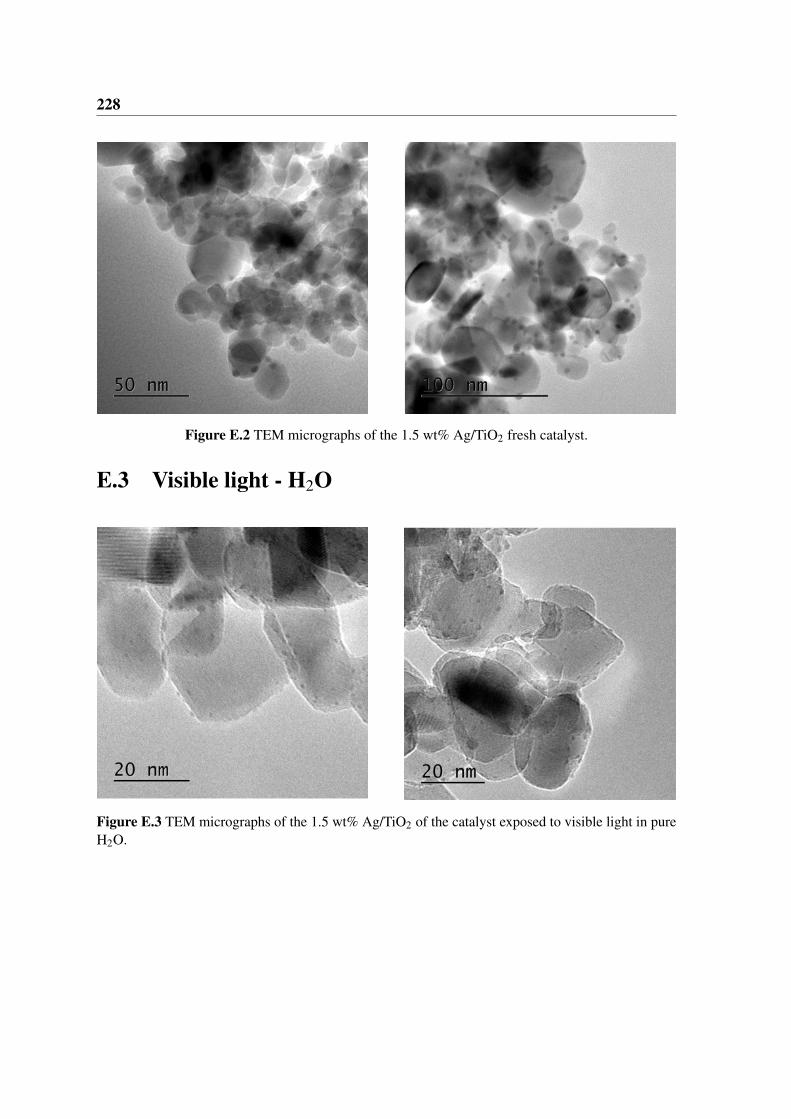
228
Figure E.2 TEM micrographs of the 1.5 wt% Ag/TiO2 fresh catalyst.
E.3 Visible light - H2O
Figure E.3 TEM micrographs of the 1.5 wt% Ag/TiO2 of the catalyst exposed to visible light in pureH2O.
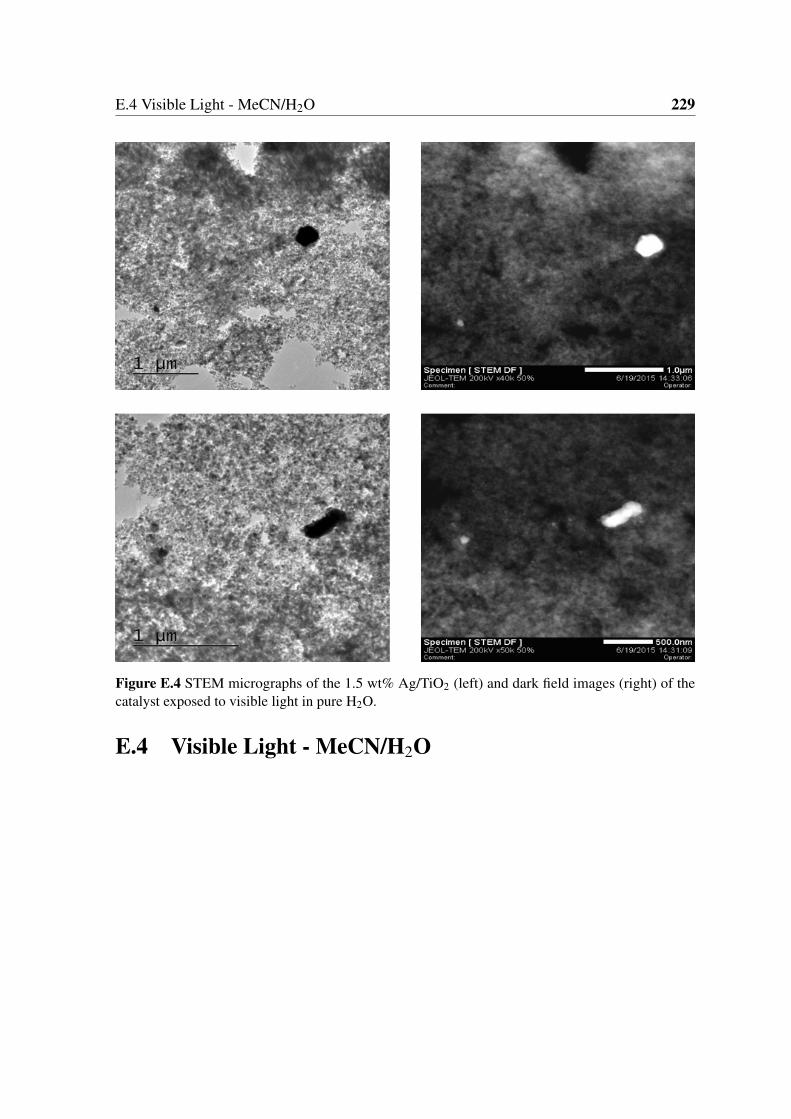
E.4 Visible Light - MeCN/H2O 229
Figure E.4 STEM micrographs of the 1.5 wt% Ag/TiO2 (left) and dark field images (right) of thecatalyst exposed to visible light in pure H2O.
E.4 Visible Light - MeCN/H2O
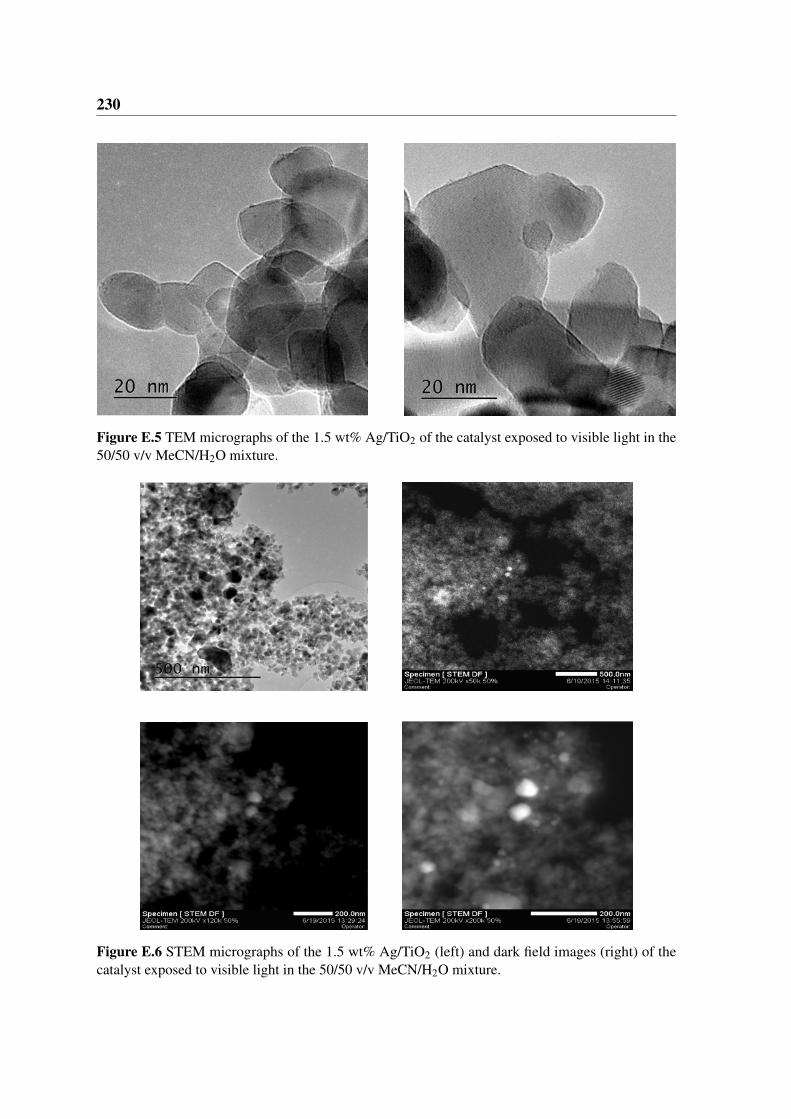
230
Figure E.5 TEM micrographs of the 1.5 wt% Ag/TiO2 of the catalyst exposed to visible light in the50/50 v/v MeCN/H2O mixture.
Figure E.6 STEM micrographs of the 1.5 wt% Ag/TiO2 (left) and dark field images (right) of thecatalyst exposed to visible light in the 50/50 v/v MeCN/H2O mixture.
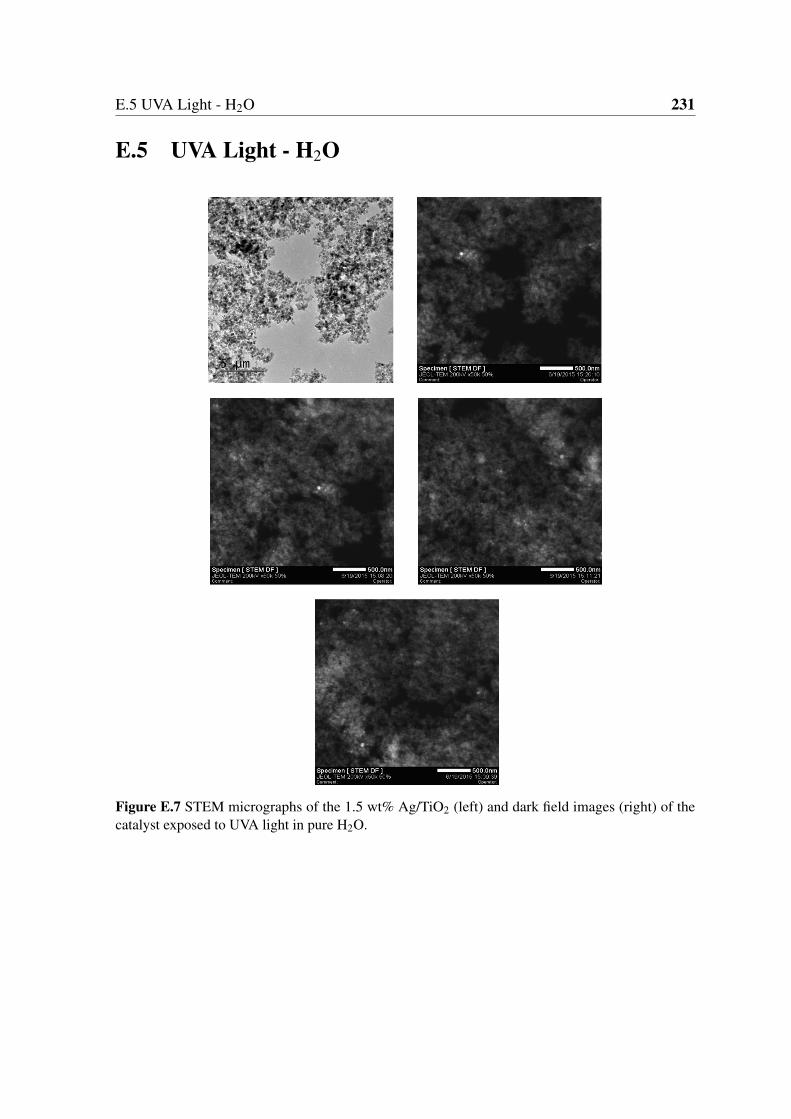
E.5 UVA Light - H2O 231
E.5 UVA Light - H2O
Figure E.7 STEM micrographs of the 1.5 wt% Ag/TiO2 (left) and dark field images (right) of thecatalyst exposed to UVA light in pure H2O.
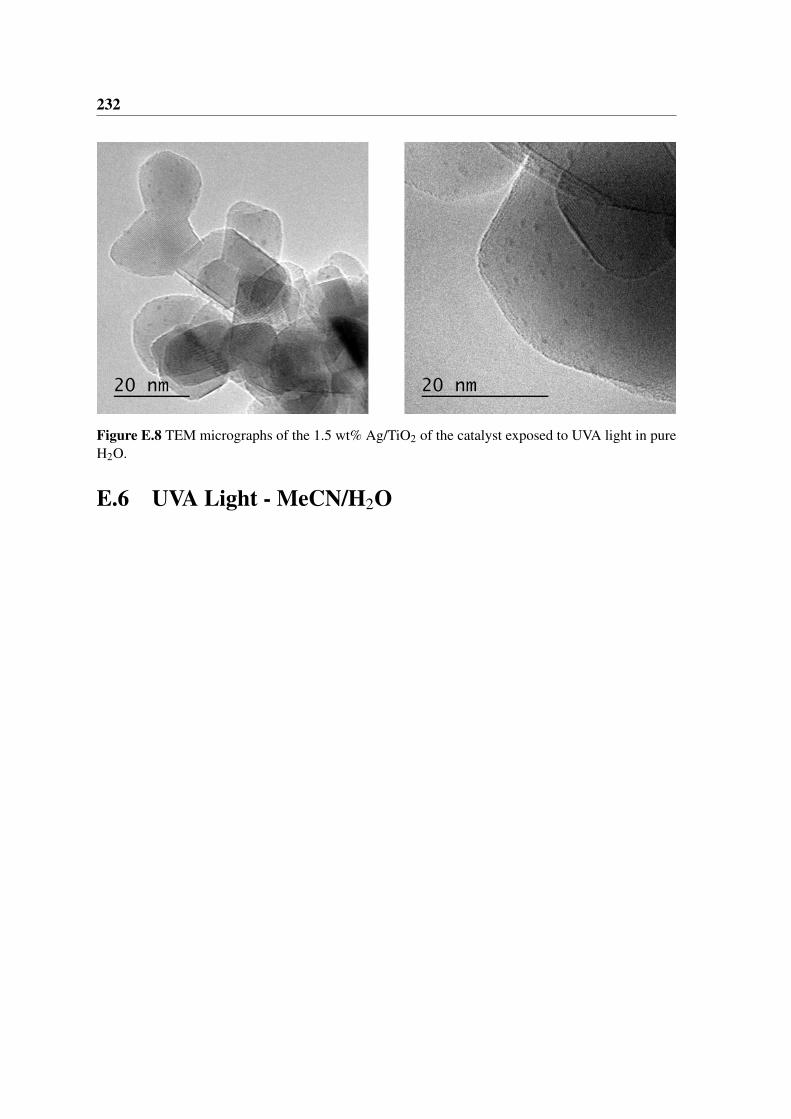
232
Figure E.8 TEM micrographs of the 1.5 wt% Ag/TiO2 of the catalyst exposed to UVA light in pureH2O.
E.6 UVA Light - MeCN/H2O
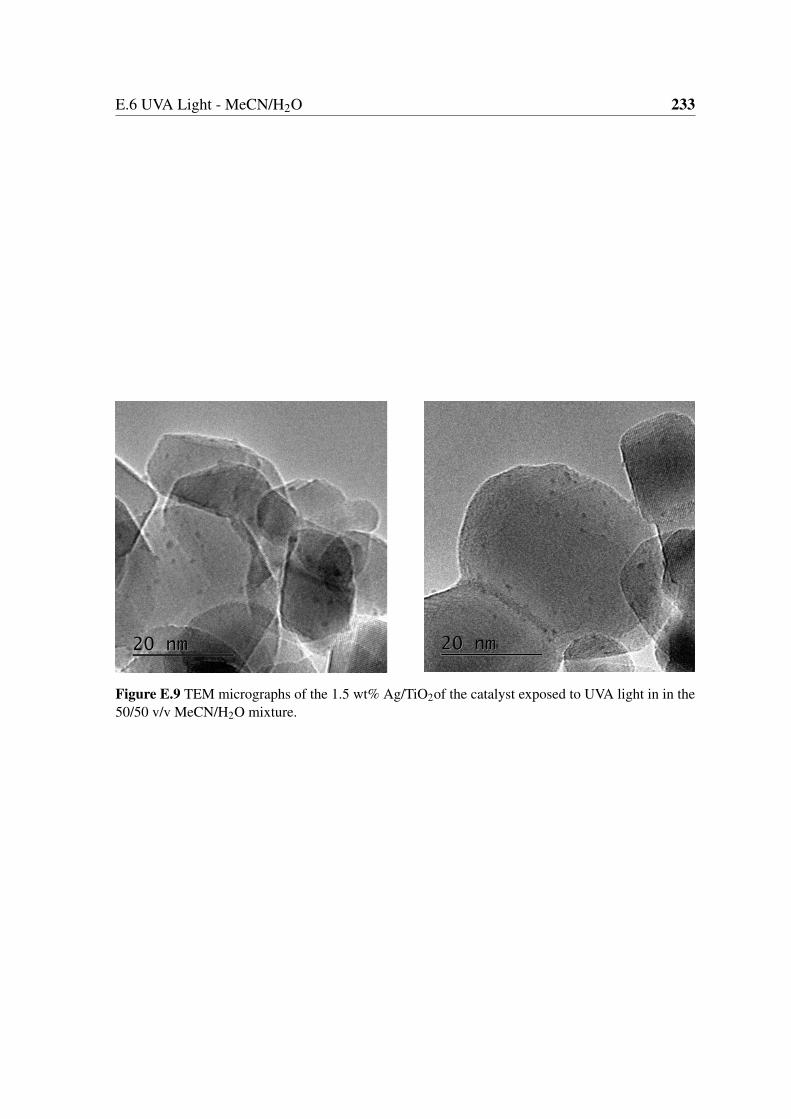
E.6 UVA Light - MeCN/H2O 233
Figure E.9 TEM micrographs of the 1.5 wt% Ag/TiO2of the catalyst exposed to UVA light in in the50/50 v/v MeCN/H2O mixture.
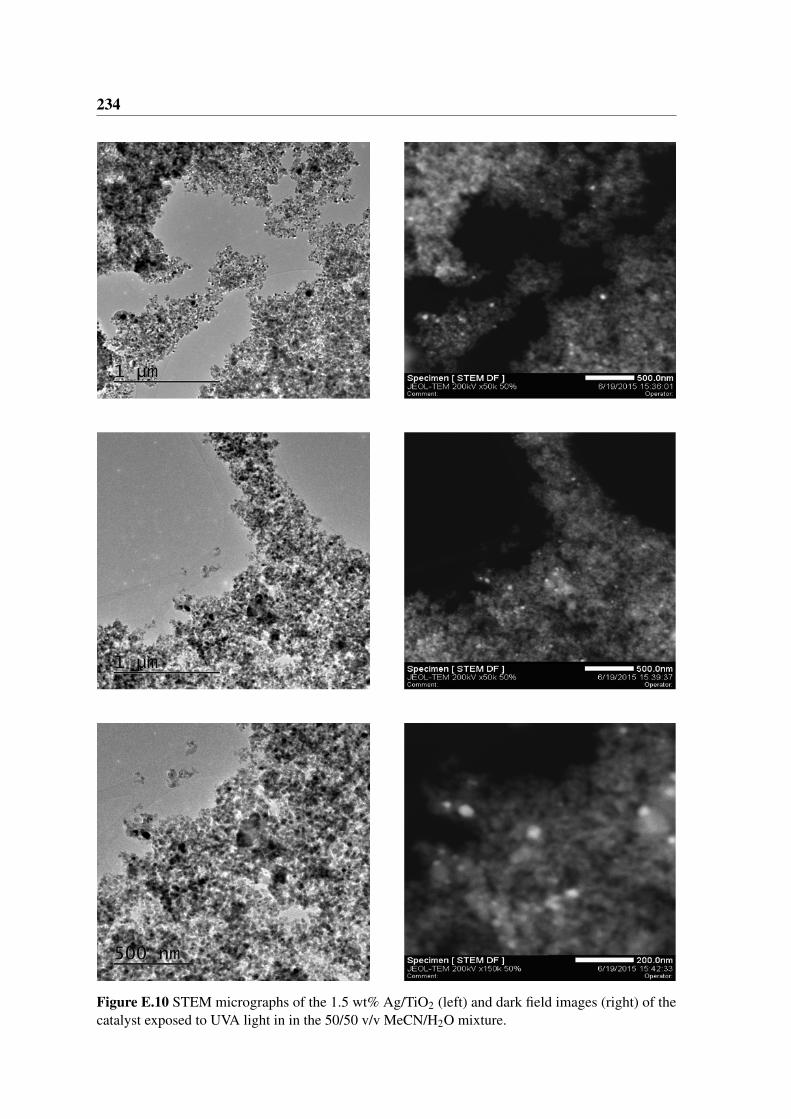
234
Figure E.10 STEM micrographs of the 1.5 wt% Ag/TiO2 (left) and dark field images (right) of thecatalyst exposed to UVA light in in the 50/50 v/v MeCN/H2O mixture.
Appendix F
F.1 Au1Ag1−x/TiO2 TEM Micrographs

236
(a) Au/TiO2 (b) Au0.95Ag0.05/TiO2
(c) Au0.85Ag0.15/TiO2 (d) Au0.50Ag0.50/TiO2
(e) Au0.15Ag0.85/TiO2 (f) Au0.05Ag0.95/TiO2
Figure F.1 TEM micrographs of the supported metal nanoparticles.
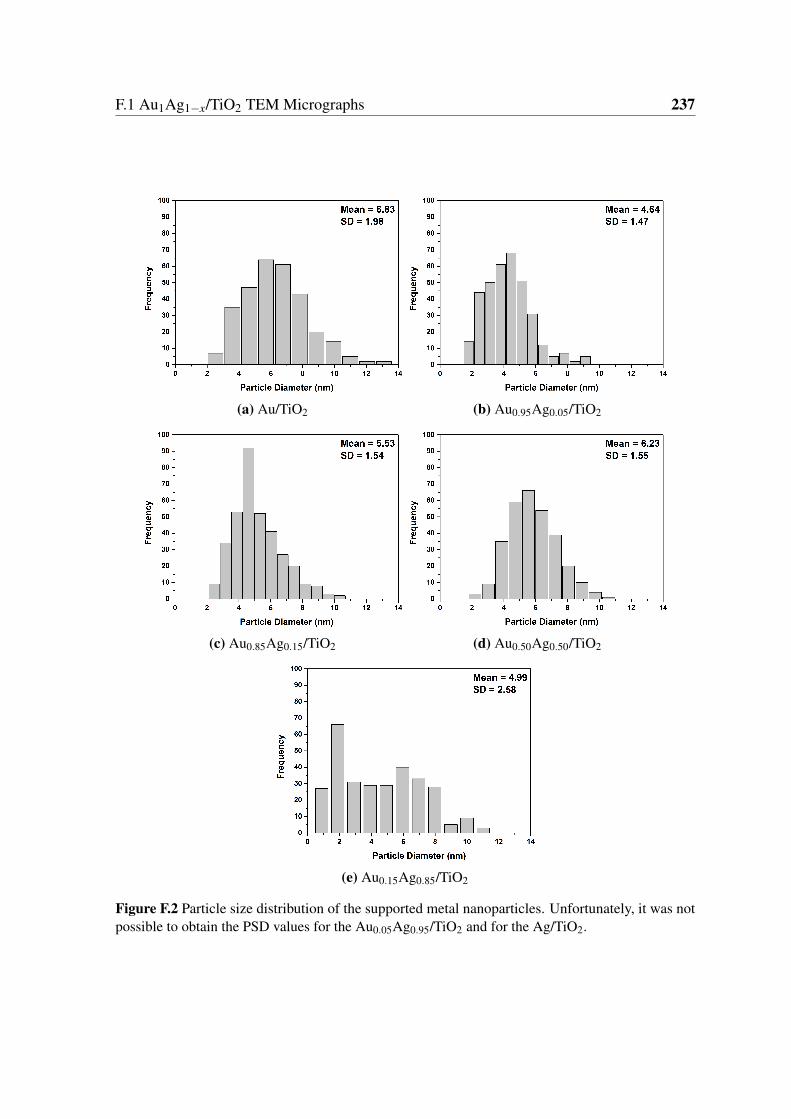
F.1 Au1Ag1−x/TiO2 TEM Micrographs 237
(a) Au/TiO2 (b) Au0.95Ag0.05/TiO2
(c) Au0.85Ag0.15/TiO2 (d) Au0.50Ag0.50/TiO2
(e) Au0.15Ag0.85/TiO2
Figure F.2 Particle size distribution of the supported metal nanoparticles. Unfortunately, it was notpossible to obtain the PSD values for the Au0.05Ag0.95/TiO2 and for the Ag/TiO2.