Glucose Metabolism After Pancreatectomy
12
The Journal of Clinical Endocrinology & Metabolism, 2021, Vol. 106, No. 5, e2203–e2214 doi:10.1210/clinem/dgab036 Clinical Research Article ISSN Print 0021-972X ISSN Online 1945-7197 Printed in USA https://academic.oup.com/jcem e2203 This is an Open Access article distributed under the terms of the Creative Commons Attribution-NonCommercial-NoDerivs licence (http://creativecommons.org/licenses/by-nc-nd/4.0/), which permits non-commercial reproduction and distribution of the work, in any medium, provided the original work is not altered or transformed in any way, and that the work is properly cited. For commercial re-use, please contact [email protected] © The Author(s) 2021. Published by Oxford University Press on behalf of the Endocrine Society. Clinical Research Article Glucose Metabolism After Pancreatectomy: Opposite Extremes Between Pancreaticoduodenectomy and Distal Pancreatectomy Fumimaru Niwano, 1 Naru Babaya, 1 Yoshihisa Hiromine, 1 Ippei Matsumoto, 2 Keiko Kamei, 2 Shinsuke Noso, 1 Yasunori Taketomo, 1 Yoshifumi Takeyama, 2 Yumiko Kawabata, 1 and Hiroshi Ikegami 1 1 Department of Endocrinology, Metabolism and Diabetes, Kindai University Faculty of Medicine, Osaka- sayama, Osaka, 589-8511, Japan; and 2 Department of Surgery, Kindai University Faculty of Medicine, Osaka-sayama, Osaka, 589-8511, Japan ORCiD numbers: 0000-0003-4673-9401 (F. Niwano); 0000-0003-2466-1228 (N. Babaya); 0000-0002-7317-236X (Y. Hiromine); 0000-0002-0943-8450 (S. Noso); 0000-0001-8808-4605 (H. Ikegami). Abbreviations: AUC, area under the curve; 75gOGTT, 75-g oral glucose tolerance test; BMI, body mass index; BT-PABA, N-benzoyl-L-tyrosyl-p-aminobenzoic acid; DP, distal pancreatectomy; FBG, fasting blood glucose; GLP-1, glucagon- like peptide 1; HbA 1c , glycated hemoglobin A 1c ; HOMA-IR, homeostasis model assessment of insulin resistance; PD, pancreaticoduodenectomy; SSPPD, subtotal stomach-preserving pancreaticoduodenectomy. Received: 6 October 2020; Editorial Decision: 14 January 2021; First Published Online: 23 January 2021; Corrected and Typeset: 9 February 2021. Abstract Context: The rate of glucose metabolism changes drastically after partial pancreatectomy. Objective: This work aims to analyze changes in patients’ glucose metabolism and endocrine and exocrine function before and after partial pancreatectomy relative to different resection types (Kindai Prospective Study on Metabolism and Endocrinology after Pancreatectomy: KIP-MEP study). Methods: A series of 278 consecutive patients with scheduled pancreatectomy were enrolled into our prospective study. Of them, 109 individuals without diabetes, who underwent partial pancreatectomy, were investigated. Data were compared between patients with pancreaticoduodenectomy (PD, n = 73) and those with distal pancreatectomy (DP, n = 36). Results: Blood glucose levels during the 75-g oral glucose tolerance test (75gOGTT) significantly decreased after pancreatectomy in the PD group (area under the curve [AUC] –9.3%, P < .01), and significantly increased in the DP population (AUC + 16.8%, P < .01). Insulin secretion rate during the 75gOGTT and glucagon stimulation test significantly decreased after pancreatectomy both in the PD and DP groups (P < .001). Both groups showed similar homeostasis model assessment of insulin resistance (HOMA-IR) values after pancreatectomy. Decrease in exocrine function quality after pancreatectomy was Downloaded from https://academic.oup.com/jcem/article/106/5/e2203/6117789 by guest on 30 January 2022
-
Upload
khangminh22 -
Category
Documents
-
view
0 -
download
0
Transcript of Glucose Metabolism After Pancreatectomy
The Journal of Clinical Endocrinology & Metabolism, 2021, Vol. 106, No. 5, e2203–e2214doi:10.1210/clinem/dgab036
Clinical Research Article
ISSN Print 0021-972X ISSN Online 1945-7197Printed in USA
https://academic.oup.com/jcem e2203This is an Open Access article distributed under the terms of the Creative Commons Attribution-NonCommercial-NoDerivs licence (http://creativecommons.org/licenses/by-nc-nd/4.0/), which permits non-commercial reproduction and distribution of the work, in any medium, provided the original work is not altered or transformed in any way, and that the work is properly cited. For commercial re-use, please contact [email protected]
© The Author(s) 2021. Published by Oxford University Press on behalf of the Endocrine Society.
Clinical Research Article
Glucose Metabolism After Pancreatectomy: Opposite Extremes Between Pancreaticoduodenectomy and Distal PancreatectomyFumimaru Niwano,1 Naru Babaya,1 Yoshihisa Hiromine,1 Ippei Matsumoto,2 Keiko Kamei,2 Shinsuke Noso,1 Yasunori Taketomo,1 Yoshifumi Takeyama,2 Yumiko Kawabata,1 and Hiroshi Ikegami1
1Department of Endocrinology, Metabolism and Diabetes, Kindai University Faculty of Medicine, Osaka-sayama, Osaka, 589-8511, Japan; and 2Department of Surgery, Kindai University Faculty of Medicine, Osaka-sayama, Osaka, 589-8511, Japan
ORCiD numbers: 0000-0003-4673-9401 (F. Niwano); 0000-0003-2466-1228 (N. Babaya); 0000-0002-7317-236X (Y. Hiromine); 0000-0002-0943-8450 (S. Noso); 0000-0001-8808-4605 (H. Ikegami).
Abbreviations: AUC, area under the curve; 75gOGTT, 75-g oral glucose tolerance test; BMI, body mass index; BT-PABA, N-benzoyl-L-tyrosyl-p-aminobenzoic acid; DP, distal pancreatectomy; FBG, fasting blood glucose; GLP-1, glucagon-like peptide 1; HbA1c, glycated hemoglobin A1c; HOMA-IR, homeostasis model assessment of insulin resistance; PD, pancreaticoduodenectomy; SSPPD, subtotal stomach-preserving pancreaticoduodenectomy.
Received: 6 October 2020; Editorial Decision: 14 January 2021; First Published Online: 23 January 2021; Corrected and Typeset: 9 February 2021.
Abstract
Context: The rate of glucose metabolism changes drastically after partial pancreatectomy.Objective: This work aims to analyze changes in patients’ glucose metabolism and endocrine and exocrine function before and after partial pancreatectomy relative to different resection types (Kindai Prospective Study on Metabolism and Endocrinology after Pancreatectomy: KIP-MEP study).Methods: A series of 278 consecutive patients with scheduled pancreatectomy were enrolled into our prospective study. Of them, 109 individuals without diabetes, who underwent partial pancreatectomy, were investigated. Data were compared between patients with pancreaticoduodenectomy (PD, n = 73) and those with distal pancreatectomy (DP, n = 36).Results: Blood glucose levels during the 75-g oral glucose tolerance test (75gOGTT) significantly decreased after pancreatectomy in the PD group (area under the curve [AUC] –9.3%, P < .01), and significantly increased in the DP population (AUC + 16.8%, P < .01). Insulin secretion rate during the 75gOGTT and glucagon stimulation test significantly decreased after pancreatectomy both in the PD and DP groups (P < .001). Both groups showed similar homeostasis model assessment of insulin resistance (HOMA-IR) values after pancreatectomy. Decrease in exocrine function quality after pancreatectomy was
Dow
nloaded from https://academ
ic.oup.com/jcem
/article/106/5/e2203/6117789 by guest on 30 January 2022

e2204 The Journal of Clinical Endocrinology & Metabolism, 2021, Vol. 106, No. 5
more marked in association with PD than DP (P < .01). Multiple regression analysis indicated that resection type and preoperative HOMA-IR independently influenced glucose tolerance-related postoperative outcomes.Conclusions: Blood glucose levels after the OGTT differed markedly between PD and DP populations. The observed differences between PD and DP suggest the importance of individualization in the management of metabolism and nutrition after partial pancreatectomy.
Key Words: BT-PABA test, distal pancreatectomy, glucose metabolism, insulin secretion, pancreaticoduodenectomy, partial pancreatectomy
The pancreas is a pivotal organ that secretes various hor-mones and digestive enzymes. Insulin and glucagon, se-creted by pancreatic β and α cells, respectively, play a major role in glucose metabolism (1-4). In addition to its endocrine function, the organ also influences nutritional status through exocrine function, including amylase, lipase, elastase, trypsin, and chymotrypsin, which are secreted by acinar cells. Resection of the pancreas (pancreatectomy), therefore, contributes both to endocrine and exocrine pan-creatic dysfunction, leading to glucose intolerance and various nutritional disorders (4).
Pancreatectomy is classified into 2 major types: partial and total pancreatic resection. Total pancreatectomy results in complete pancreatic endocrine and exocrine function de-ficiency, leading to difficulties in achieving glycemic control (5). In contrast, partial pancreatectomy enables the retain-ment of endocrine and exocrine pancreatic system func-tion, and allows for easier blood glucose control than total pancreatectomy. Therefore, there is a general trend toward the use of partial rather than total pancreatectomy, except under specific conditions (6-8). Recent improvements in diagnosis have allowed for the early detection of cancerous lesions, such as intraductal papillary mucinous neoplasm, resulting in an increase in the number of partial pancrea-tectomies with better prognoses. Gaining an understanding of the changes in patients’ metabolic, endocrine, and exo-crine function after partial pancreatectomy is, therefore, important for the provision of optimal metabolism and nutrition-related management.
Partial pancreatectomy is classified into 2 major sub-types: pancreaticoduodenectomy (PD) and distal pancrea-tectomy (DP); although both are associated with similar resection volumes, the manner in which the stomach and gut as well as residual pancreas are handled and recon-structed markedly differs between them. This suggests the presence of differences in the glucose metabolism-related outcomes, and exocrine and endocrine function, following pancreatectomy. While several studies have investigated patients’ glycemic status after partial pancreatectomy (9-16), the similarities and differences in their endocrine and
exocrine function across different resection types have not been well characterized. In this study, we aimed to inves-tigate the changes in the rate of glucose metabolism and endocrine and exocrine function, following PD and DP in patients without diabetes.
Materials and Methods
Participants
In total, 278 consecutive patients who were scheduled to undergo pancreatectomy at the Kindai University Hospital, Division of Hepato-Biliary-Pancreatic Surgery, Department of Surgery, between June 2015 and February 2018, were prospectively enrolled into the Kindai Prospective Study on Metabolism and Endocrinology after Pancreatectomy (KIP-MEP study). In the present study, participants who satisfied the following criteria were analyzed: under-went partial pancreatectomy (PD or DP); age older than 20 years; provision of consent to participate; and absence of advanced cancers other than those pertaining to the pancreas. We excluded participants with diabetes mellitus, those who underwent total pancreatectomy, and those in whom participation was deemed inappropriate by the doc-tors in charge. We also excluded patients with chronic pan-creatitis for the avoidance of heterogeneity arising from abnormalities in the preserved pancreas. Eventually, 109 patients were enrolled (73 underwent PD and 36 DP). All patients provided written informed consent. This study was approved by the institutional ethics committee of the Kindai University Faculty of Medicine.
Surgical Techniques
For PD, subtotal stomach-preserving pancreaticoduodenectomy (SSPPD) is performed as a standard procedure in our center. Briefly, the stomach was divided 3 cm above the pylorus ring at the pyloric region of the stomach. Reconstruction was performed with end-to-side choledochojejunostomy, pancreatogastrostomy, and end-to-side gastrojejunostomy. For DP, distal
Dow
nloaded from https://academ
ic.oup.com/jcem
/article/106/5/e2203/6117789 by guest on 30 January 2022

The Journal of Clinical Endocrinology & Metabolism, 2021, Vol. 106, No. 5 e2205
pancreatectomy with splenectomy is performed as a standard. After dividing the splenic vessels, the pancreas was transected at the levels of the portal and superior mes-enteric vein in most cases.
Data Collection
All patients were admitted to Kindai University Hospital, Department of Endocrinology, Metabolism, and Diabetes, before and after pancreatectomy. “Before pancreatec-tomy” referred to the period approximately a month before the surgery, whereas “after pancreatectomy” re-ferred to the period less than a month after the surgery and after improvements were observed in the patients’ general condition. General health status was assessed by normalized laboratory data, such as those pertaining to peripheral blood white blood cell and C-reactive pro-tein levels (Supplementary Table 1 [17]), as well as by the normal intake of meals and absence of abdominal symp-toms including nausea, vomiting, abdominal pain and cramping, frequent bowel movements, watery diarrhea, and fatty stools. Following pancreatectomy, inspection was initiated at 14.3 ± 6.6 (mean ± SD) days in the PD group and 10.8 ± 4.5 days in the DP group (P < .05). For the de-tailed assessment of the degree of deterioration in the rate of glucose metabolism and endocrine function after pan-createctomy, we analyzed only patients without diabetes before pancreatectomy. Diabetes was defined, per World Health Organization criteria, as either a fasting blood glucose (FBG) level greater than or equal to 7.0 mmol/L, as detected on 2 or more separate days, or an abnormal FBG level that was detected once and blood glucose level greater than or equal to 11.1 mmol/L as measured 2 hours after a 75-g oral glucose tolerance test (75gOGTT).
We prospectively investigated the changes in the pa-tients’ glucose metabolism, and pancreatic endocrine and exocrine function, and indicators of nutrition before and after pancreatectomy. Glucose metabolism and endocrine function were assessed using the 75gOGTT and glucagon stimulation test, respectively, and exocrine function by the N-benzoyl-L-tyrosyl-p-aminobenzoic acid (BT-PABA) test. The 75gOGTT was performed after an overnight fast. Blood samples were drawn at 0, 30, 60, 90, 120, 150, and 180 minutes, and the levels of blood glucose, serum insulin, and C-peptide were measured. The areas under the curve AUCs for glucose, insulin, and C-peptide were calculated using the trapezoidal rule. As an index of early insulin re-sponse to glucose, the insulinogenic index was calculated by the increment in the level of serum insulin from 0 to 30 minutes (ΔIRI 30) after a glucose challenge divided by the increment in the blood glucose level from 0 to 30 minutes
(ΔBG 30). Glucagon stimulation tests were performed by the intravenous injection of 1-mg glucagon (Novo Nordisk Pharma Ltd). Blood samples were collected at 0 and 5 min-utes, and the increment in the level of C-peptide from 0 to 5 minutes (ΔC-peptide) was calculated. As an index of insulin sensitivity, the homeostasis model assessment of in-sulin resistance (HOMA-IR) value was calculated using the following formula: (fasting insulin [µIU/mL] × fasting glu-cose [mmol/L])/22.5. Exocrine function was assessed using the BT-PABA test (18). BT-PABA was administered orally, and the rate of urinary PABA excretion was determined 6 hours after administration. The influence of comorbidities on glucose tolerance was assessed using the Charlson comorbidity index (19).
Statistical Analyses
Quantitative data were expressed as mean ± SEM. Differences in the quantitative data were expressed as mean differences and 95% CIs. Categorical variables were expressed as the number (percentage) of patients. All statis-tical analyses were performed using the Bell Curve for Excel software (Social Survey Research Information Co Ltd). Categorical variables were compared using the chi-square test, and continuous variables using paired or unpaired t tests. Statistical significance was defined as P less than .05. Logistic regression analysis with the forward-backward stepwise selection method was performed for the calcula-tion of the adjusted odds ratio (OR) with its 95% CI for the factors that were potentially independently associated with deteriorations in the degree of glucose tolerance after pan-createctomy. The difference between the AUCs for glucose after pancreatectomy and before pancreatectomy was used as an indicator of the degree of deterioration of glucose tol-erance after pancreatectomy, and was selected as a response variable. Preoperative indicators possibly related to the de-terioration of glucose tolerance after pancreatectomy were selected as explanatory variables.
Results
Baseline Characteristics
The clinical characteristics of the participants before pancreatectomy are shown in Table 1. Of the 109 pa-tients, 73 underwent PD and 36 DP. None of the parti-cipants had diabetes (glycated hemoglobin A1c [HbA1c] level 40.3 ± 0.46 mmol/mol [5.84 ± 0.04%], FBG level 5.10 ± 0.05 mmol/L). The demographic data were compar-able between the PD and DP groups, except for the slight male predominance noted in the PD group.
Dow
nloaded from https://academ
ic.oup.com/jcem
/article/106/5/e2203/6117789 by guest on 30 January 2022

e2206 The Journal of Clinical Endocrinology & Metabolism, 2021, Vol. 106, No. 5
Changes in Demographic Parameters and Exocrine Function After Pancreatectomy
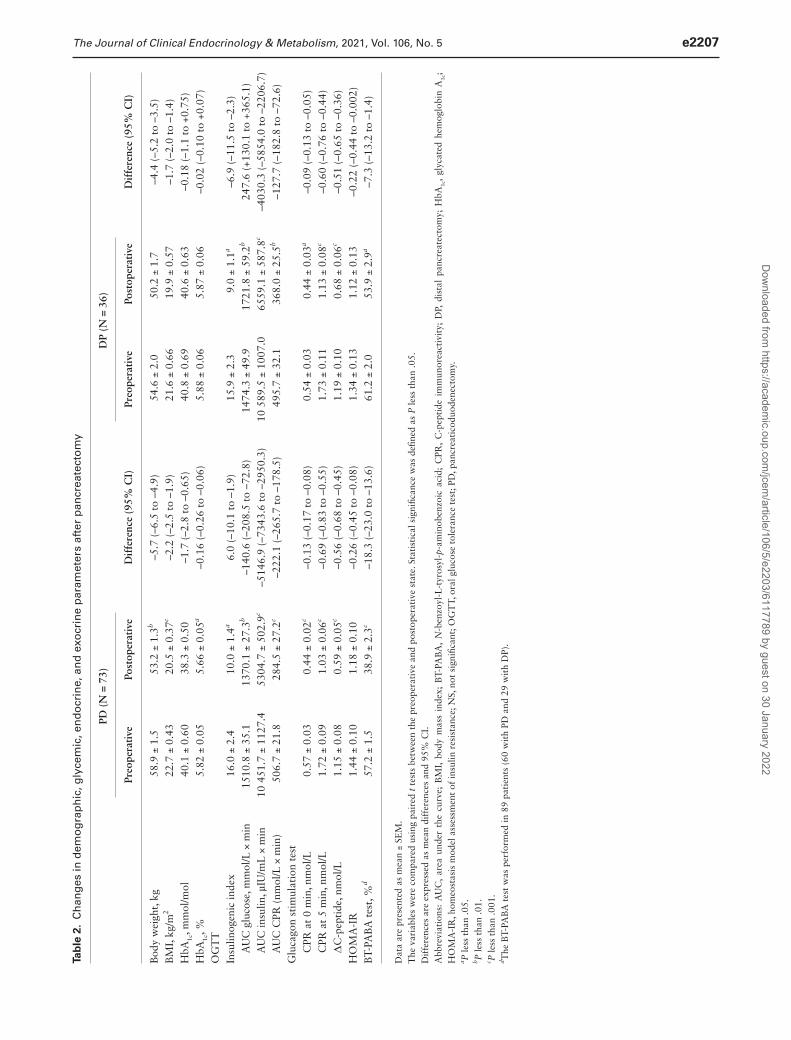
The patients’ body weight significantly decreased after pancreatectomy in the PD group (58.9 ± 1.5 vs 53.2 ± 1.3 kg; P < .01); a decreasing tendency was ob-served in the DP group (54.6 ± 2.0 vs 50.2 ± 1.7 kg; NS) (Table 2). Body mass index (BMI) also significantly de-creased in the PD group (22.7 ± 0.43 vs 20.5 ± 0.37 kg/m2; P < .001) and showed a decreasing tendency in the DP group (21.6 ± 0.66 vs 19.9 ± 0.57 kg/m2; NS). HbA1c value significantly decreased in the PD group (40.1 ± 0.60 [5.82 ± 0.05] vs 38.3 ± 0.50 mmol/mol [5.66 ± 0.05%]; P < .05) but not in the DP group (40.8 ± 0.69 [5.88 ± 0.06] vs 40.6 ± 0.63 mmol/mol [5.87 ± 0.06%]; NS). No signifi-cant difference was observed in the HOMA-IR value be-fore and after pancreatectomy between the PD (1.44 ± 0.10 vs 1.18 ± 0.10, NS) and DP (1.34 ± 0.13 vs 1.12 ± 0.13, NS) groups.
For the evaluation of exocrine function, the BT-PABA test was performed in 89 patients (60 with PD and 29 with DP). The PABA value decreased significantly after pan-createctomy both in the PD (57.2 ± 1.5% vs 38.9 ± 2.3, P < .001) and DP (61.2 ± 2.0% vs 53.9 ± 2.9, P < .05) groups (Table 2). The decrease in the BT-PABA test value was more marked in the PD group than DP group (–32.0%
vs –11.9%, P < .01), suggesting that PD has a stronger effect on pancreatic exocrine than DP.
Glucose Tolerance and Insulin Secretion
PancreaticoduodenectomyWe compared the results of the 75gOGTT (values of 0, 30, 60, 90, 120, 150, and 180 minutes), and AUCs for glucose, insulin, and C-peptide before and after PD (Fig. 1A-1C). The blood glucose levels after PD were significantly lower than those before PD at 30, 60, 90, 120, and 150 minutes, but higher at 0 minutes. Insulin and C-peptide levels after PD were also significantly lower than those before PD at all time points after the 75gOGTT. AUCs for glucose, in-sulin, and C-peptide decreased significantly after PD (Table 2). The strength of the early insulin response to glucose, as evaluated by the insulinogenic index, decreased sig-nificantly after pancreatectomy (16.0 ± 2.4 vs 10.0 ± 1.4, P < .05) (see Table 2).
To better understand the mechanism of insulin secre-tion, we evaluated the rate of insulin secretion by a glu-cagon stimulation test, which differs from the OGTT both in the secretagogue used (glucagon vs glucose) and ad-ministration route (intravenous vs oral) (see Table 2). The C-peptide values at 0 and 5 minutes decreased significantly
Table 1. Clinical characteristics of patients who underwent pancreatectomy
Total (N = 109) PD (N = 73) DP (N = 36) P
Age, y 66.1 ± 0.87 66.9 ± 1.0 64.5 ± 1.6 NSMale, n (%) 57 (53.8%) 43 (58.9%) 14 (38.9%) < .05Height, cm 159.9 ± 0.87 160.5 ± 1.1 158.8 ± 1.6 NSBody weight, kg 57.6 ± 1.2 58.9 ± 1.5 54.6 ± 2.0 NSBMI, kg/m2 22.4 ± 0.36 22.7 ± 0.43 21.6 ± 0.66 NSHistology of pancreas lesion – – – NS Malignant, n (%) 72 (66.1%) 52 (71.2%) 20 (55.6%) Benign, n (%) 37 (33.9%) 21 (28.8%) 16 (44.4%) HbA1c, mmol/mol 40.3 ± 0.46 40.1 ± 0.60 40.8 ± 0.69 NSHbA1c, % 5.84 ± 0.04 5.82 ± 0.05 5.88 ± 0.06 NSFasting blood glucose, mmol/L 5.10 ± 0.05 5.16 ± 0.06 4.97 ± 0.09 NSFasting insulin, µIU/mL × min 6.12 ± 0.31 6.19 ± 0.39 5.99 ± 0.54 NSFasting C-peptide, nmol/L 0.60 ± 0.02 0.62 ± 0.03 0.56 ± 0.04 NSHOMA-IR 1.41 ± 0.08 1.44 ± 0.10 1.34 ± 0.13 NSBT-PABA test, %a 58.5 ± 1.1 57.2 ± 1.5 61.2 ± 2.0 NSAdministration of pancreatic enzyme drug, n (%)b 26 (23.9%) 18 (24.7%) 8 (22.2%) NSDosage of pancreatic enzyme drug, mg/db 1453.8 ± 87.6 1400.0 ± 108.5 1 575.0 ± 147.3 NSIntraoperative blood loss, mL 916.4 ± 120.8 1182.4 ± 167.4 376.9 ± 83.5 < .001Intraoperative blood transfusion, mL 195.2 ± 45.2 237.8 ± 62.0 108.9 ± 52.7 NS
Data are presented as mean ± SEM. Categorical variables were compared using the chi-square test, and continuous variables using unpaired t tests between PD and DP. Statistical significance was defined as P less than 0.05.Abbreviations: BMI, body mass index; BT-PABA, N-benzoyl-L-tyrosyl-p-aminobenzoic acid; DP, distal pancreatectomy; HbA1c, glycated hemoglobin A1c; HOMA-IR, homeostasis model assessment of insulin resistance; NS, not significant; PD, pancreaticoduodenectomy.aThe BT-PABA test was performed in 89 patients (60 with PD and 29 with DP).bThe pancreatic enzyme drug was pancrelipase (Mylan EPD G.K.).
Tab
le 2
. C
han
ges
in d
emo
gra
ph
ic, g
lyce
mic
, en
do
crin
e, a
nd
exo
crin
e p
aram
eter
s af
ter
pan
crea
tect
om
y
PD (
N =
73)
DP
(N =
36)
Pr
eope
rativ
ePo
stop
erat
ive
Dif
fere
nce
(95%
CI)
Preo
pera
tive
Post
oper
ativ
eD
iffe
renc
e (9
5% C
I)
Bod
y w
eigh
t, kg
58.9
± 1
.553
.2 ±
1.3
b–5
.7 (
–6.5
to
–4.9
)54
.6 ±
2.0
50.2
± 1
.7–4
.4 (
–5.2
to
–3.5
)B
MI,
kg/m
222
.7 ±
0.4
320
.5 ±
0.3
7c–2
.2 (
–2.5
to
–1.9
)21
.6 ±
0.6
619
.9 ±
0.5
7–1
.7 (
–2.0
to
–1.4
)H
bA1c
, mm
ol/m
ol40
.1 ±
0.6
038
.3 ±
0.5
0–1
.7 (
–2.8
to
–0.6
5)40
.8 ±
0.6
940
.6 ±
0.6
3–0
.18
(–1.
1 to
+0.
75)
HbA
1c, %
5.82
± 0
.05
5.66
± 0
.05a
–0.1
6 (–
0.26
to
–0.0
6)5.
88 ±
0.0
65.
87 ±
0.0
6–0
.02
(–0.
10 t
o +0
.07)
OG
TT
Insu
linog
enic
inde
x16
.0 ±
2.4
10.0
± 1
.4a
6.0
(–10
.1 t
o –1
.9)
15.9
± 2
.39.
0 ±
1.1a
–6.9
(–1
1.5
to –
2.3)
A
UC
glu
cose
, mm
ol/L
× m
in15
10.8
± 3
5.1
1370
.1 ±
27.
3b–1
40.6
(–2
08.5
to
–72.
8)14
74.3
± 4
9.9
1721
.8 ±
59.
2b24
7.6
(+13
0.1
to +
365.
1)
AU
C in
sulin
, µIU
/mL
× m
in10
451
.7 ±
112
7.4
5304
.7 ±
502
.9c
–514
6.9
(–73
43.6
to
–295
0.3)
10 5
89.5
± 1
007.
065
59.1
± 5
87.8
c–4
030.
3 (–
5854
.0 t
o –2
206.
7)
AU
C C
PR (
nmol
/L ×
min
)50
6.7
± 21
.828
4.5
± 27
.2c
–222
.1 (
–265
.7 t
o –1
78.5
)49
5.7
± 32
.136
8.0
± 25
.5b
–127
.7 (
–182
.8 t
o –7
2.6)
Glu
cago
n st
imul
atio
n te
st
CPR
at
0 m
in, n
mol
/L0.
57 ±
0.0
30.
44 ±
0.0
2c–0
.13
(–0.
17 t
o –0
.08)
0.54
± 0
.03
0.44
± 0
.03a
–0.0
9 (–
0.13
to
–0.0
5)
CPR
at
5 m
in, n
mol
/L1.
72 ±
0.0
91.
03 ±
0.0
6c–0
.69
(–0.
83 t
o –0
.55)
1.73
± 0
.11
1.13
± 0
.08c
–0.6
0 (–
0.76
to
–0.4
4)
ΔC
-pep
tide
, nm
ol/L
1.15
± 0
.08
0.59
± 0
.05c
–0.5
6 (–
0.68
to
–0.4
5)1.
19 ±
0.1
00.
68 ±
0.0
6c–0
.51
(–0.
65 t
o –0
.36)
HO
MA
-IR
1.44
± 0
.10
1.18
± 0
.10
–0.2
6 (–
0.45
to
–0.0
8)1.
34 ±
0.1
31.
12 ±
0.1
3–0
.22
(–0.
44 t
o –0
.002
)B
T-PA
BA
tes
t, %
d57
.2 ±
1.5
38.9
± 2
.3c
–18.
3 (–
23.0
to
–13.
6)61
.2 ±
2.0
53.9
± 2
.9a
–7.3
(–1
3.2
to –
1.4)
Dat
a ar
e pr
esen
ted
as m
ean
± SE
M.
The
var
iabl
es w
ere
com
pare
d us
ing
pair
ed t
tes
ts b
etw
een
the
preo
pera
tive
and
pos
tope
rati
ve s
tate
. Sta
tist
ical
sig
nific
ance
was
defi
ned
as P
less
tha
n .0
5.D
iffe
renc
es a
re e
xpre
ssed
as
mea
n di
ffer
ence
s an
d 95
% C
I.A
bbre
viat
ions
: A
UC
, ar
ea u
nder
the
cur
ve;
BM
I, bo
dy m
ass
inde
x; B
T-PA
BA
, N
-ben
zoyl
-L-t
yros
yl-p
-am
inob
enzo
ic a
cid;
CPR
, C
-pep
tide
im
mun
orea
ctiv
ity;
DP,
dis
tal
panc
reat
ecto
my;
HbA
1c,
glyc
ated
hem
oglo
bin
A1c
; H
OM
A-I
R, h
omeo
stas
is m
odel
ass
essm
ent
of in
sulin
res
ista
nce;
NS,
not
sig
nific
ant;
OG
TT,
ora
l glu
cose
tol
eran
ce t
est;
PD
, pan
crea
tico
duod
enec
tom
y.a P
less
tha
n .0
5.b P
less
tha
n .0
1.c P
less
tha
n .0
01.
d The
BT-
PAB
A t
est
was
per
form
ed in
89
pati
ents
(60
wit
h PD
and
29
wit
h D
P).
Dow
nloaded from https://academ
ic.oup.com/jcem
/article/106/5/e2203/6117789 by guest on 30 January 2022
The Journal of Clinical Endocrinology & Metabolism, 2021, Vol. 106, No. 5 e2207
Tab
le 2
. C
han
ges
in d
emo
gra
ph
ic, g
lyce
mic
, en
do
crin
e, a
nd
exo
crin
e p
aram
eter
s af
ter
pan
crea
tect
om
y
PD (
N =
73)
DP
(N =
36)
Pr
eope
rativ
ePo
stop
erat
ive
Dif
fere
nce
(95%
CI)
Preo
pera
tive
Post
oper
ativ
eD
iffe
renc
e (9
5% C
I)
Bod
y w
eigh
t, kg
58.9
± 1
.553
.2 ±
1.3
b–5
.7 (
–6.5
to
–4.9
)54
.6 ±
2.0
50.2
± 1
.7–4
.4 (
–5.2
to
–3.5
)B
MI,
kg/m
222
.7 ±
0.4
320
.5 ±
0.3
7c–2
.2 (
–2.5
to
–1.9
)21
.6 ±
0.6
619
.9 ±
0.5
7–1
.7 (
–2.0
to
–1.4
)H
bA1c
, mm
ol/m
ol40
.1 ±
0.6
038
.3 ±
0.5
0–1
.7 (
–2.8
to
–0.6
5)40
.8 ±
0.6
940
.6 ±
0.6
3–0
.18
(–1.
1 to
+0.
75)
HbA
1c, %
5.82
± 0
.05
5.66
± 0
.05a
–0.1
6 (–
0.26
to
–0.0
6)5.
88 ±
0.0
65.
87 ±
0.0
6–0
.02
(–0.
10 t
o +0
.07)
OG
TT
Insu
linog
enic
inde
x16
.0 ±
2.4
10.0
± 1
.4a
6.0
(–10
.1 t
o –1
.9)
15.9
± 2
.39.
0 ±
1.1a
–6.9
(–1
1.5
to –
2.3)
A
UC
glu
cose
, mm
ol/L
× m
in15
10.8
± 3
5.1
1370
.1 ±
27.
3b–1
40.6
(–2
08.5
to
–72.
8)14
74.3
± 4
9.9
1721
.8 ±
59.
2b24
7.6
(+13
0.1
to +
365.
1)
AU
C in
sulin
, µIU
/mL
× m
in10
451
.7 ±
112
7.4
5304
.7 ±
502
.9c
–514
6.9
(–73
43.6
to
–295
0.3)
10 5
89.5
± 1
007.
065
59.1
± 5
87.8
c–4
030.
3 (–
5854
.0 t
o –2
206.
7)
AU
C C
PR (
nmol
/L ×
min
)50
6.7
± 21
.828
4.5
± 27
.2c
–222
.1 (
–265
.7 t
o –1
78.5
)49
5.7
± 32
.136
8.0
± 25
.5b
–127
.7 (
–182
.8 t
o –7
2.6)
Glu
cago
n st
imul
atio
n te
st
CPR
at
0 m
in, n
mol
/L0.
57 ±
0.0
30.
44 ±
0.0
2c–0
.13
(–0.
17 t
o –0
.08)
0.54
± 0
.03
0.44
± 0
.03a
–0.0
9 (–
0.13
to
–0.0
5)
CPR
at
5 m
in, n
mol
/L1.
72 ±
0.0
91.
03 ±
0.0
6c–0
.69
(–0.
83 t
o –0
.55)
1.73
± 0
.11
1.13
± 0
.08c
–0.6
0 (–
0.76
to
–0.4
4)
ΔC
-pep
tide
, nm
ol/L
1.15
± 0
.08
0.59
± 0
.05c
–0.5
6 (–
0.68
to
–0.4
5)1.
19 ±
0.1
00.
68 ±
0.0
6c–0
.51
(–0.
65 t
o –0
.36)
HO
MA
-IR
1.44
± 0
.10
1.18
± 0
.10
–0.2
6 (–
0.45
to
–0.0
8)1.
34 ±
0.1
31.
12 ±
0.1
3–0
.22
(–0.
44 t
o –0
.002
)B
T-PA
BA
tes
t, %
d57
.2 ±
1.5
38.9
± 2
.3c
–18.
3 (–
23.0
to
–13.
6)61
.2 ±
2.0
53.9
± 2
.9a
–7.3
(–1
3.2
to –
1.4)
Dat
a ar
e pr
esen
ted
as m
ean
± SE
M.
The
var
iabl
es w
ere
com
pare
d us
ing
pair
ed t
tes
ts b
etw
een
the
preo
pera
tive
and
pos
tope
rati
ve s
tate
. Sta
tist
ical
sig
nific
ance
was
defi
ned
as P
less
tha
n .0
5.D
iffe
renc
es a
re e
xpre
ssed
as
mea
n di
ffer
ence
s an
d 95
% C
I.A
bbre
viat
ions
: A
UC
, ar
ea u
nder
the
cur
ve;
BM
I, bo
dy m
ass
inde
x; B
T-PA
BA
, N
-ben
zoyl
-L-t
yros
yl-p
-am
inob
enzo
ic a
cid;
CPR
, C
-pep
tide
im
mun
orea
ctiv
ity;
DP,
dis
tal
panc
reat
ecto
my;
HbA
1c,
glyc
ated
hem
oglo
bin
A1c
; H
OM
A-I
R, h
omeo
stas
is m
odel
ass
essm
ent
of in
sulin
res
ista
nce;
NS,
not
sig
nific
ant;
OG
TT,
ora
l glu
cose
tol
eran
ce t
est;
PD
, pan
crea
tico
duod
enec
tom
y.a P
less
tha
n .0
5.b P
less
tha
n .0
1.c P
less
tha
n .0
01.
d The
BT-
PAB
A t
est
was
per
form
ed in
89
pati
ents
(60
wit
h PD
and
29
wit
h D
P).
Dow
nloaded from https://academ
ic.oup.com/jcem
/article/106/5/e2203/6117789 by guest on 30 January 2022

e2208 The Journal of Clinical Endocrinology & Metabolism, 2021, Vol. 106, No. 5
after PD. The ΔC-peptide value also decreased significantly after PD (1.15-0.59 nmol/L).
Distal pancreatectomyThe blood glucose levels after DP were significantly higher than those before DP at 0, 90, 120, 150, and 180 minutes after the 75gOGTT (Fig. 1D). Consequently, the AUC for glu-cose increased significantly after DP (see Table 2), in contrast to the significant decrease noted in the PD group. The insulin levels at 0, 30, 60, 120, and 150 minutes after the 75gOGTT and C-peptide levels at all time points after the 75gOGTT were significantly lower after DP than before (Fig. 1E and 1F). The AUCs for insulin and C-peptide decreased signifi-cantly after DP (see Table 2). The strength of the early insulin response to glucose, as evaluated by the insulinogenic index, decreased significantly after pancreatectomy (15.9 ± 2.3 vs 9.0 ± 1.1, P < .05).
The rate of insulin secretion, as assessed by the glu-cagon stimulation test, decreased significantly after DP (see Table 2). The C-peptide values at 0 and 5 minutes were significantly lower after DP than before. The rate of increment in the C-peptide (ΔC-peptide) value also decreased significantly after DP (1.19-0.68 nmol/L) (see Table 2).
Comparison between pancreaticoduodenectomy and distal pancreatectomy groupsChanges in the patients’ metabolic, endocrine, and exocrine function after pancreatectomy are summarized in Fig. 2. The blood glucose levels decreased in the PD group and increased in the DP group (AUC during the OGTT –9% vs +17%, P < .001). The rate of insulin secretion, as assessed by the insulin and C-peptide reactivity response during the OGTT and increments in the C-peptide levels after the glu-cagon stimulation test, decreased in a similar manner both in the PD and DP groups; body weight and insulin resist-ance, as assessed by the HOMA-IR, also showed similar de-creases across the groups. The degree of exocrine function, as assessed by the BT-PABA test, decreased in both groups, but the decrease was more pronounced in the PD group than the DP group (–32% vs –12%, P < .01).
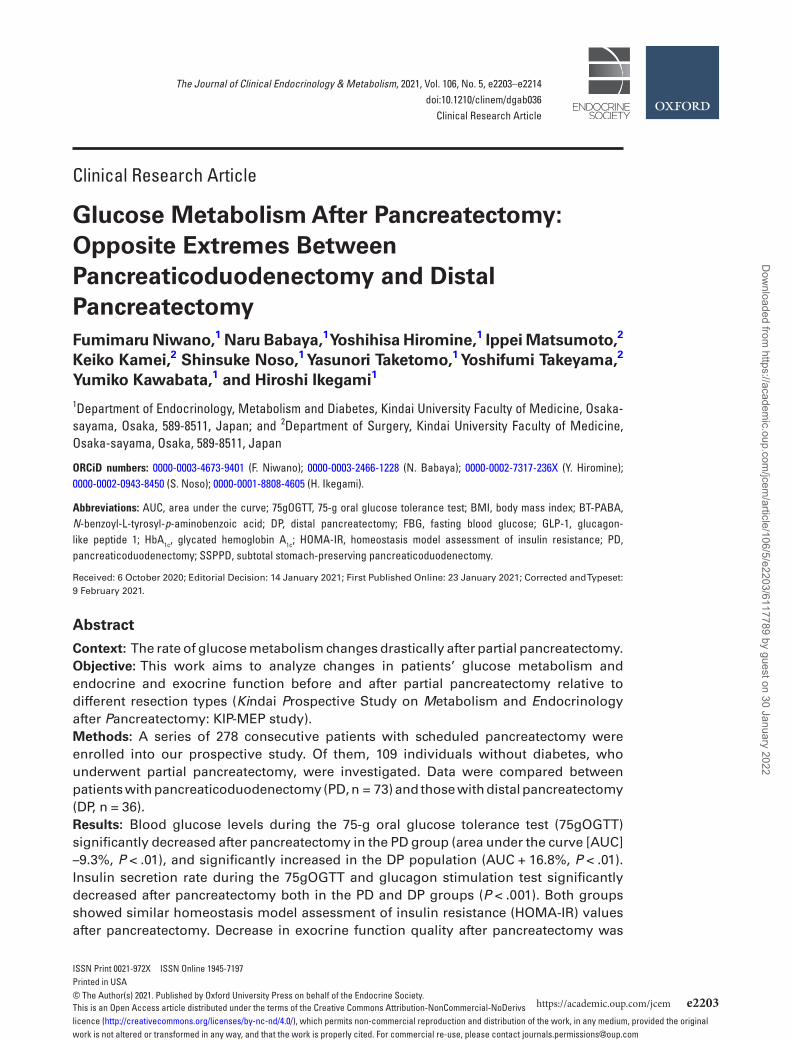
The changes in the AUCs for blood glucose during the OGTT after pancreatectomy were categorized as 1) marked deterioration (≥ 10% increase), 2) mild deterioration (< 10% increase), 3) mild improvement (< 10% decrease), and 4) marked improvement (≥ 10% decrease). In total, 43.5% (32/73) of the patients showed marked improve-ment after PD, in contrast to the 8.3% (3/36) observed after DP (Fig. 3). However, 50% (18/36) of the patients
Figure 1. Graphs of 75-g oral glucose tolerance test obtained before (open triangle) and after (closed circle) partial pancreatectomy. A to C, Patients who underwent pancreaticoduodenectomy. A, Changes in blood glucose levels. B, Changes in insulin levels. C, Changes in C-peptide levels. D to F, Patients who underwent distal pancreatectomy. D, Changes in blood glucose levels. E, Changes in insulin levels. Changes in C-peptide levels. F, Data are expressed as mean ± SEM. * P less than .05, **P less than .01, and ***P less than .001 vs before surgery.
Dow
nloaded from https://academ
ic.oup.com/jcem
/article/106/5/e2203/6117789 by guest on 30 January 2022

The Journal of Clinical Endocrinology & Metabolism, 2021, Vol. 106, No. 5 e2209
showed marked deterioration after DP, in contrast to the 15.1% (11/73) observed after PD (see Fig. 3), indicating that a larger number of patients with PD had an improved status, whereas those with DP tended to show a deterior-ated status after pancreatectomy (P < .001, chi-square test).
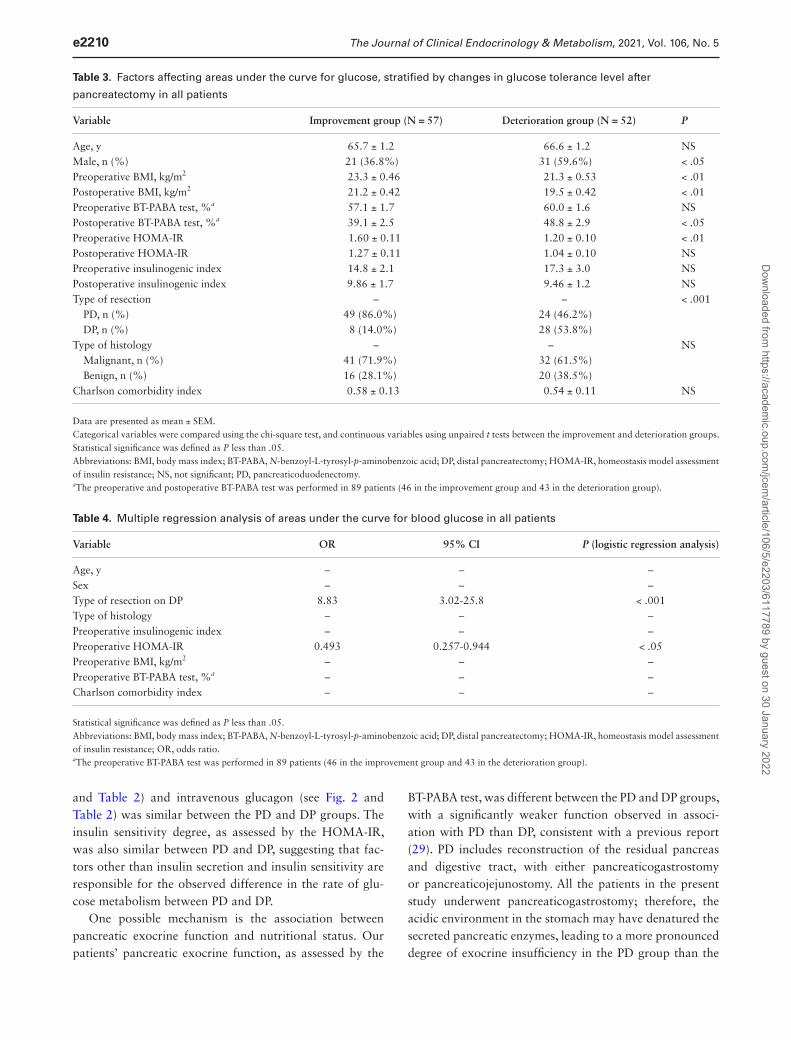
Factors affecting glucose tolerance after pancreatectomyFor the clarification of the factors that contribute to the deterioration of glucose metabolism rate after pancreatec-tomy, we evaluated the factors affecting the AUCs for glu-cose between the improvement and deterioration groups. Significant differences were observed in terms of sex, BMI, postoperative BT-PABA, preoperative HOMA-IR, and re-section type between the improvement and deterioration groups (Table 3). Female predominance was noted in the improvement group. The preoperative BMI, postoperative BMI, and preoperative HOMA-IR values were significantly higher in the improvement group than the deterioration group (see Table 3). In addition, the number of patients with PD was significantly higher in the improvement group (P < .001, chi-square test) (see Table 3).
Multiple regression analysis using the AUCs for blood glucose as dependent variables indicated that DP (OR 8.83; 95% CI, 3.02 to 25.8; P < .001) and preoperative HOMA-IR (OR 0.493; 95% CI, 0.257 to 0.944; P < .05) were independent factors affecting postoperative glucose tolerance-related outcomes (Table 4).
Discussion
In the present study, we observed that despite similarities in the resection volume and level of decrease in the rates of insulin secretion and insulin sensitivity after PD and DP, the blood glucose levels after the OGTT markedly differed between the PD and DP populations, showing a decrease in its association with PD and increase with DP.
While several clinical studies have focused on the de-velopment of diabetes mellitus after partial pancreatec-tomy (10-12, 20-22), most of them had a retrospective observational nature; few studies in this context have tar-geted populations with weak innate β-cell function, such as Japanese people (23). The strengths of our study are its prospective observational design, enrollment of Japanese people, and detailed assessment of glucose metabolism changes using the 75gOGTT, glucagon stimulation test, and BT-PABA test before and after partial pancreatectomy.
Partial pancreatectomy is associated with deteriorations in the rate of insulin secretion and glucose tolerance (24, 25). The present study, however, clearly demonstrates that the glucose metabolism–related changes observed after partial pancreatectomy are markedly different between PD and DP, with significant improvements in the degree of glucose tolerance observed following PD. The remnant pancreatic volume following PD is approximately 50% (26, 27), while the resected volume in PD (approximately 50%) (26, 27) is similar to or rather larger than that in DP (~30%-40%) (13, 28). The observed decrease in the insulin secretion rate in response both to oral glucose (see Fig. 1
Figure 2. Percentage changes in areas under the curve (AUCs) for glu-cose, insulin, and C-peptide reactivity (CPR) during 75-g oral glucose tolerance test (75gOGTT), intravenous (iv) glucagon for ΔCPR, body weight (BW), homeostasis model assessment of insulin resistance (HOMA-IR), and N-benzoyl-L-tyrosyl-p-aminobenzoic acid (BT-PABA) after partial pancreatectomy stratified by type of resection. *P less than .001, and **P less than .01.
Figure 3. Distribution of patients categorized by changes in area under the curve (AUC) for glucose after partial pancreatectomy. Changes in AUCs for blood glucose during oral glucose tolerance test after pancreatectomy were categorized as 1) marked deterioration (10% or more increase), 2) mild deterioration (less than 10% increase), 3) mild improvement (less than 10% decrease), or 4) marked im-provement (10% or more decrease). A larger number of patients with pancreaticoduodenectomy (PD) showed improvements, and a larger proportion of those with distal pancreatectomy (DP) exhibited deterior-ations following pancreatectomy (P < .001, chi-squared test).
Dow
nloaded from https://academ
ic.oup.com/jcem
/article/106/5/e2203/6117789 by guest on 30 January 2022
e2210 The Journal of Clinical Endocrinology & Metabolism, 2021, Vol. 106, No. 5
and Table 2) and intravenous glucagon (see Fig. 2 and Table 2) was similar between the PD and DP groups. The insulin sensitivity degree, as assessed by the HOMA-IR, was also similar between PD and DP, suggesting that fac-tors other than insulin secretion and insulin sensitivity are responsible for the observed difference in the rate of glu-cose metabolism between PD and DP.
One possible mechanism is the association between pancreatic exocrine function and nutritional status. Our patients’ pancreatic exocrine function, as assessed by the
BT-PABA test, was different between the PD and DP groups, with a significantly weaker function observed in associ-ation with PD than DP, consistent with a previous report (29). PD includes reconstruction of the residual pancreas and digestive tract, with either pancreaticogastrostomy or pancreaticojejunostomy. All the patients in the present study underwent pancreaticogastrostomy; therefore, the acidic environment in the stomach may have denatured the secreted pancreatic enzymes, leading to a more pronounced degree of exocrine insufficiency in the PD group than the
Table 3. Factors affecting areas under the curve for glucose, stratified by changes in glucose tolerance level after
pancreatectomy in all patients
Variable Improvement group (N = 57) Deterioration group (N = 52) P
Age, y 65.7 ± 1.2 66.6 ± 1.2 NSMale, n (%) 21 (36.8%) 31 (59.6%) < .05Preoperative BMI, kg/m2 23.3 ± 0.46 21.3 ± 0.53 < .01Postoperative BMI, kg/m2 21.2 ± 0.42 19.5 ± 0.42 < .01Preoperative BT-PABA test, %a 57.1 ± 1.7 60.0 ± 1.6 NSPostoperative BT-PABA test, %a 39.1 ± 2.5 48.8 ± 2.9 < .05Preoperative HOMA-IR 1.60 ± 0.11 1.20 ± 0.10 < .01Postoperative HOMA-IR 1.27 ± 0.11 1.04 ± 0.10 NSPreoperative insulinogenic index 14.8 ± 2.1 17.3 ± 3.0 NSPostoperative insulinogenic index 9.86 ± 1.7 9.46 ± 1.2 NSType of resection – – < .001 PD, n (%) 49 (86.0%) 24 (46.2%) DP, n (%) 8 (14.0%) 28 (53.8%) Type of histology – – NS Malignant, n (%) 41 (71.9%) 32 (61.5%) Benign, n (%) 16 (28.1%) 20 (38.5%) Charlson comorbidity index 0.58 ± 0.13 0.54 ± 0.11 NS
Data are presented as mean ± SEM.Categorical variables were compared using the chi-square test, and continuous variables using unpaired t tests between the improvement and deterioration groups. Statistical significance was defined as P less than .05.Abbreviations: BMI, body mass index; BT-PABA, N-benzoyl-L-tyrosyl-p-aminobenzoic acid; DP, distal pancreatectomy; HOMA-IR, homeostasis model assessment of insulin resistance; NS, not significant; PD, pancreaticoduodenectomy.aThe preoperative and postoperative BT-PABA test was performed in 89 patients (46 in the improvement group and 43 in the deterioration group).
Table 4. Multiple regression analysis of areas under the curve for blood glucose in all patients
Variable OR 95% CI P (logistic regression analysis)
Age, y – – –Sex – – –Type of resection on DP 8.83 3.02-25.8 < .001Type of histology – – –Preoperative insulinogenic index – – –Preoperative HOMA-IR 0.493 0.257-0.944 < .05Preoperative BMI, kg/m2 – – –Preoperative BT-PABA test, %a – – –Charlson comorbidity index – – –
Statistical significance was defined as P less than .05.Abbreviations: BMI, body mass index; BT-PABA, N-benzoyl-L-tyrosyl-p-aminobenzoic acid; DP, distal pancreatectomy; HOMA-IR, homeostasis model assessment of insulin resistance; OR, odds ratio.aThe preoperative BT-PABA test was performed in 89 patients (46 in the improvement group and 43 in the deterioration group).
Dow
nloaded from https://academ
ic.oup.com/jcem
/article/106/5/e2203/6117789 by guest on 30 January 2022
The Journal of Clinical Endocrinology & Metabolism, 2021, Vol. 106, No. 5 e2211
DP group. Bock et al (12) reported that 52.8% of patients who underwent PD with pancreaticogastrostomy devel-oped exocrine insufficiency with symptomatic steatorrhea, and consequently required pancreatic enzyme therapy. In our study, 18 (24.7%) patients after PD and 8 (22.2%) after DP required pancreatic enzyme therapy after pan-createctomy (see Table 1). While the BT-PABA test assesses chymotrypsin activity, reflecting the degree of exocrine function in protein digestion (30), the results may reflect exocrine insufficiency as a whole, including carbohydrates. Body weight and BMI were comparable between the PD and DP groups, suggesting that nutritional status as a result of exocrine dysfunction may not contribute significantly to glucose tolerance-related differences. Differences in exo-crine function, however, may affect the body composition, particularly in terms of muscle and adipose tissue, resulting in the differences in the insulin resistance and glucose tol-erance values. Although the similarities in the HOMA-IR values suggest that the PD and DP groups had similar whole-body insulin sensitivity levels, further studies are ne-cessary to evaluate the changes in patients’ body compos-ition after pancreatectomy.
PD results in delayed gastric emptying (31). However, studies that compared PD with pylorus resection and pyl-orus preservation showed that the rate of delayed gastric emptying was reduced in pylorus-resecting PD (32-34). Higher rates of gastric emptying were reported in PD with distal gastrectomy than PD with pylorus preservation, re-sulting in higher glucagon-like peptide 1 (GLP-1) concen-trations and better glucose tolerance during OGTTs (35). Because all the patients with PD in the present study under-went subtotal stomach preserving PD (SSPPD) in which the pylorus was resected, enhanced rates of GLP-1 release in association with altered gastric emptying may be among the reasons for the improved glucose tolerance observed after PD in the present study.
Gut hormone–related changes, particularly increases in the levels of GLP-1, have previously been reported after the removal of the duodenum in PD (35-37) as well as Roux-en-Y gastric bypass for bariatric surgery (38-40). Patients’ glucose tolerance and insulin sensitivity improve soon after Roux-en-Y gastric bypass for bariatric surgery, much earlier than body weight reductions, which may be explained by, at least in part, the changes in the levels of gut hormones, particularly GLP-1. It is reasonable to at-tribute the improvement in the degree of glucose tolerance after PD in the present study to gut hormones, particularly GLP-1, as the food passage after SSPPD was similar to that associated with Roux-en-Y gastric bypass (37). Although we did not measure our patients’ GLP-1 levels, the differ-ences in the degree of glucose tolerance after PD and DP were most likely a result of the differences in the resection
and reconstruction of the digestive tract and associated changes in the gut hormones, particularly GLP-1, in PD but not DP. Further studies must clarify the contribution of gut hormones to glucose tolerance after pancreatectomy.
Several clinical studies have focused on the deterioration of glucose tolerance and development of diabetes mellitus after partial pancreatectomy (10-12, 15, 16, 20-23). In a recent systematic review and meta-analysis of 37 studies focusing on diabetes after partial pancreatectomy, the in-cidence of new-onset diabetes was 16% (95% CI, 14%-17%) in PD and 21% (95% CI, 16%-25%) in DP (15). Most studies, however, focused on patients with PD alone, DP alone, or partial pancreatectomy as a whole, in which PD and DP were combined. Deteriorations in the degree of glucose tolerance and diabetes development have been ob-served in studies on partial pancreatectomy as a whole or DP alone. Burkhart et al (10) reported that DP was related to a greater risk of diabetes development than PD, while Lee et al (20) showed that patients with DP had lower insulin secretion rates than control participants with a normal glu-cose tolerance status. After PD, however, both deterioration and amelioration of the patients’ diabetes status have been reported (41). Preexisting diabetes associated with pancre-atic lesions was suggested to be ameliorated by the removal of the pancreatic lesion and/or changes in body mass and insulin sensitivity after pancreatectomy. For clarification of the metabolic and endocrine changes that occur after partial pancreatectomy, studies conducted among people without diabetes before surgery are indispensable. The pre-sent study, which enrolled people without diabetes before surgery, clearly demonstrated that partial pancreatectomy does not necessarily cause patients’ glucose tolerance status to deteriorate, particularly in PD settings in the short term, within less than a month after pancreatectomy. A previous study demonstrated no changes in patients’ blood glucose levels with decreased fasting insulin and C-peptide levels after PD, concluding that an acute reduction in pancreatic mass does not impair glucose tolerance with insulin sen-sitivity preservation (42). Our findings are in accordance with those of the aforementioned studies, in that the degree of glucose tolerance was not impaired despite a significant decrease in the rate of insulin secretion. However, in our study, the glucose tolerance degree improved significantly after PD. This difference may be attributed to variations in the evaluation periods (4 days vs less than a month) and the methods used in the evaluation of glucose toler-ance (intravenous glucose vs oral glucose). In PD, because the head of the pancreas, duodenum, jejunum, portion of the stomach, and gallbladder are removed, the function of the digestive tract is profoundly affected. PD in our study was performed by SSPPD, which is accompanied by pyl-orus resection and pancreaticogastrostomy; therefore, the
Dow
nloaded from https://academ
ic.oup.com/jcem
/article/106/5/e2203/6117789 by guest on 30 January 2022
e2212 The Journal of Clinical Endocrinology & Metabolism, 2021, Vol. 106, No. 5
food stagnation time might be short. Careful consideration is desirable when our results were translated into other variants of the Whipple procedure, pylorus preserving, or pancreaticojejunostomy, which are associated with long re-taining of food stagnation.
Whereas Elliott et al (11) reported that approximately 20% of the patients without diabetes who received PD or DP developed diabetes within 1 week after pancreatectomy, in our study, however, only 4% of the patients (1 patient with PD and 3 patients with DP) developed diabetes. This incon-sistency may be attributed, among other reasons, to differ-ences in the survey period (1998-2010 vs 2015-2018), and consequent improvements in the surgical procedures and treatments. The presence of comorbidities may have also in-fluenced this difference. The comorbidity index observed in the present study was significantly lower than that noted in the study by Elliott et al (see Supplementary Table 2 [17]), suggesting that the presence of comorbidities contributed to differences in the incidence of diabetes between the 2 studies, and also confirming that comorbidities are important factors associated with the development of diabetes after pancreatec-tomy. In our study, no significant difference was observed in the comorbidity index between the improvement and deteri-oration groups, and the comorbidity index did not remain a significant factor in the multiple regression analysis of the AUCs for blood glucose in all patients (see Table 4).
In this study, an important factor to be considered is the variation in the degree of change in the AUCs for blood glucose within each group. Whereas the AUCs significantly decreased after PD and increased after DP, the AUC for blood glucose after PD does not always improve and that of after DP does not always deteriorate for each patient (see Fig. 3 and Supplementary Figure [17]), suggesting that individualization is necessary for the application of our re-sults in clinical practice. To clarify the factors contributing to the deterioration of glucose tolerance after pancreatec-tomy, we evaluated the differences between the patients with a deteriorated status and those with improvements. Multiple-regression analysis of the AUCs for blood glucose revealed that resection type and preoperative HOMA-IR were independent factors, in that DP and smaller preopera-tive HOMA-IR values were associated with deteriorations in the degree of glucose tolerance after pancreatectomy (see Table 4). Patients with a high preoperative HOMA-IR value were expected to experience greater benefits, in terms of improved insulin resistance rates after pancreatectomy, resulting in a lower degree of glucose tolerance deterior-ation. Whether the preoperative HOMA-IR value is high or low is influenced by body composition. Accordingly, a study examining patients’ body composition before and after pancreatectomy is currently under way.
A limitation of our study is that we investigated the changes in patients’ glucose tolerance and pancreatic func-tion for a relatively short duration (less than a month) after pancreatectomy. However, the results obtained in the nondiabetic population after the short-term partial pan-createctomy provides basic information for applied condi-tions such as diabetes, leading to successful treatment in the short term under various pathophysiologies. In addition, our major concerns are whether these short-term changes after surgery consequently lead to long-term problematic issues such as the development of diabetes mellitus and malnutrition. An increase in the number of people with endocrine and exocrine insufficiency was previously re-ported with an increasing follow-up period after pancrea-tectomy (43). In our short-term study, although the glucose tolerance did not always deteriorate in PD, the result does not necessarily reflect long-term efficacy and problems in glucose metabolism including diabetes and reactive hypo-glycemia, as well as nutritional status including body weight and body composition. In particular, late onset of reactive hypoglycemia will be problematic, and sometimes severe in PD, accompanied with pylorus resection, as in our case. The follow-up study of these patients will provide important information on long-term effects and problem-atic issues relative to the short-term changes described in the present study. We are currently in the process of the prospective follow-up of various clinical indicators of me-tabolism and pancreatic endocrine and exocrine function, including 75gOGTTs, every 6 months after pancreatec-tomy at our institute.
In conclusion, our study demonstrated that the changes in the rate of glucose metabolism are markedly different between PD and DP, with significant improvements ob-served after PD and deteriorations after DP, despite simi-larities in the resection volume, insulin secretion rate, and insulin sensitivity rate. Multiple-regression analysis fur-ther confirmed that resection type was an independent factor affecting glucose tolerance–related outcomes postoperatively. The differences observed between PD and DP as well as the variations within each group suggest the importance of individualization in the management of metabolism and nutrition after partial pancreatectomy. Finally, the apparent improvement of glucose tolerance in the short term after PD does not necessarily reflect its long-term benefits. In the PD group, malnutrition, mal-absorption, and postprandial hypoglycemia have greater chances of occurrence in the long term. In addition, the risk of diabetes increases as patients gain weight, gastric motility changes, and exocrine insufficiency are treated; therefore, long-term follow-up with careful evaluation is necessary after partial pancreatectomy.
Dow
nloaded from https://academ
ic.oup.com/jcem
/article/106/5/e2203/6117789 by guest on 30 January 2022

The Journal of Clinical Endocrinology & Metabolism, 2021, Vol. 106, No. 5 e2213
AcknowledgmentsWe thank Ms Shie Hayase and Ms Mariko Shiota for their
skillful technical assistance.Financial Support: This work was supported in part by the Pro-
motion and Mutual Aid Corporation for Private Schools of Japan (grant to F.N.).
Additional InformationCorrespondence: Hiroshi Ikegami, MD, PhD, Department of
Endocrinology, Metabolism and Diabetes, Kindai University Faculty of Medicine, 377-2 Ohno-higashi, Osaka-sayama, Osaka, 589-8511, Japan. Email: [email protected].
Disclosures: The authors have nothing to disclose.Data Availability: Primary data sets generated and analyzed
during the present study are not publicly available but are available from the corresponding author on reasonable request.
References 1. Holst JJ, Holland W, Gromada J, et al. Insulin and glucagon:
partners for life. Endocrinology. 2017;158(4):696-701. 2. He S, Wang D, Lu Y, et al. Increasing glucagon secretion could
antagonize the action of exogenous insulin for glycemic control in streptozocin-induced diabetic rhesus monkeys. Exp Biol Med (Maywood). 2013;238(4):385-391.
3. Kawamori D, Kulkarni RN. Insulin modulation of glucagon se-cretion: the role of insulin and other factors in the regulation of glucagon secretion. Islets. 2009;1(3):276-279.
4. Cui Y, Andersen DK. Pancreatogenic diabetes: special consider-ations for management. Pancreatology. 2011;11(3):279-294.
5. Niwano F, Hiromine Y, Noso S, et al. Insulin deficiency with and without glucagon: a comparative study between total pancreatec-tomy and type 1 diabetes. J Diabetes Investig. 2018;9(5):1084-1090.
6. Bellin MD, Beilman GJ, Dunn TB, et al. Islet autotransplantation to preserve beta cell mass in selected patients with chronic pan-creatitis and diabetes mellitus undergoing total pancreatectomy. Pancreas. 2013;42(2):317-321.
7. Lundberg R, Beilman GJ, Dunn TB, et al. Metabolic as-sessment prior to total pancreatectomy and islet autotrans-plant: utility, limitations and potential. Am J Transplant. 2013;13(10):2664-2671.
8. Andrén-Sandberg Å, Ansorge C, Yadav TD. Are there indications for total pancreatectomy in 2016? Dig Surg. 2016;33(4):329-334.
9. Hirata K, Nakata B, Amano R, Yamazoe S, Kimura K, Hirakawa K. Predictive factors for change of diabetes mel-litus status after pancreatectomy in preoperative diabetic and nondiabetic patients. J Gastrointest Surg. 2014;18(9):1597-1603.
10. Burkhart RA, Gerber SM, Tholey RM, et al. Incidence and se-verity of pancreatogenic diabetes after pancreatic resection. J Gastrointest Surg. 2015;19(2):217-225.
11. Elliott IA, Epelboym I, Winner M, Allendorf JD, Haigh PI. Population-level incidence and predictors of surgically induced diabetes and exocrine insufficiency after partial pancreatic resec-tion. Perm J. 2017;21:16-095.
12. Bock EA, Hurtuk MG, Shoup M, Aranha GV. Late complications after pancreaticoduodenectomy with pancreaticogastrostomy. J Gastrointest Surg. 2012;16(5):914-919.
13. Shirakawa S, Matsumoto I, Toyama H, et al. Pancreatic volumetric assessment as a predictor of new-onset diabetes following distal pancreatectomy. J Gastrointest Surg. 2012;16(12):2212-2219.
14. Maxwell DW, Jajja MR, Tariq M, et al. Development of dia-betes after pancreaticoduodenectomy: results of a 10-year series using prospective endocrine evaluation. J Am Coll Surg. 2019;228(4):400-412.e2.
15. Wu L, Nahm CB, Jamieson NB, et al. Risk factors for develop-ment of diabetes mellitus (Type 3c) after partial pancreatectomy: a systematic review. Clin Endocrinol (Oxf). 2020;92(5):396-406.
16. Menge BA, Schrader H, Breuer TG, et al. Metabolic consequences of a 50% partial pancreatectomy in humans. Diabetologia. 2009;52(2):306-317.
17. Niwano F, Babaya N, Hiromine Y, et al. Data from: “Glucose metabolism after pancreatectomy: opposite extremes between pancreaticoduodenectomy and distal pancreatectomy.” Kindai University Academic Resource Repository. 2020. Uploaded December 16, 2020. http://id.nii.ac.jp/1391/00021235/
18. Lang C, Gyr K, Tonko I, Conen D, Stalder GA. Value of serum PABA as a pancreatic function test. Gut. 1984;25(5):508-512.
19. Charlson ME, Pompei P, Ales KL, MacKenzie CR. A new method of classifying prognostic comorbidity in longitudinal studies: de-velopment and validation. J Chronic Dis. 1987;40(5):373-383.
20. Lee BW, Kang HW, Heo JS, et al. Insulin secretory defect plays a major role in the development of diabetes in patients with distal pancreatectomy. Metabolism. 2006;55(1):135-141.
21. Hutchins RR, Hart RS, Pacifico M, Bradley NJ, Williamson RC. Long-term results of distal pancreatectomy for chronic pancrea-titis in 90 patients. Ann Surg. 2002;236(5):612-618.
22. King J, Kazanjian K, Matsumoto J, et al. Distal pancreatec-tomy: incidence of postoperative diabetes. J Gastrointest Surg. 2008;12(9):1548-1553.
23. Kodama K, Tojjar D, Yamada S, Toda K, Patel CJ, Butte AJ. Ethnic differences in the relationship between insulin sensitivity and insulin response: a systematic review and meta-analysis. Diabetes Care. 2013;36(6):1789-1796.
24. Kendall DM, Sutherland DE, Najarian JS, Goetz FC, Robertson RP. Effects of hemipancreatectomy on insulin secre-tion and glucose tolerance in healthy humans. N Engl J Med. 1990;322(13):898-903.
25. Kumar AF, Gruessner RW, Seaquist ER. Risk of glucose intoler-ance and diabetes in hemipancreatectomized donors selected for normal preoperative glucose metabolism. Diabetes Care. 2008;31(8):1639-1643.
26. You DD, Choi SH, Choi DW, Heo JS, Ho CY, Kim WS. Long-term effects of pancreaticoduodenectomy on glucose metab-olism. ANZ J Surg. 2012;82(6):447-451.
27. Singh AN, Pal S, Kilambi R, et al. Diabetes after pancreaticoduodenectomy: can we predict it? J Surg Res. 2018;227:211-219.
28. Kang JS, Jang JY, Kang MJ, et al. Endocrine function impairment after distal pancreatectomy: incidence and related factors. World J Surg. 2016;40(2):440-446.
Dow
nloaded from https://academ
ic.oup.com/jcem
/article/106/5/e2203/6117789 by guest on 30 January 2022
e2214 The Journal of Clinical Endocrinology & Metabolism, 2021, Vol. 106, No. 5
29. Sato N, Yamaguchi K, Chijiiwa K, Tanaka M. Duct-parenchymal ratio predicts exocrine pancreatic function after pancreatoduodenectomy and distal pancreatectomy. Am J Surg. 1998;176(3):270-273.
30. Lankisch PG. Exocrine pancreatic function tests. Gut. 1982;23(9):777-798.
31. Kobayashi I, Miyachi M, Kanai M, et al. Different gastric emptying of solid and liquid meals after pylorus-preserving pancreatoduodenectomy. Br J Surg. 1998;85(7):927-930.
32. Kawai M, Tani M, Hirono S, et al. Pylorus ring resection re-duces delayed gastric emptying in patients undergoing pancreatoduodenectomy: a prospective, randomized, con-trolled trial of pylorus-resecting versus pylorus-preserving pancreatoduodenectomy. Ann Surg. 2011;253(3):495-501.
33. Matsumoto I, Shinzeki M, Asari S, et al. A prospective ran-domized comparison between pylorus- and subtotal stomach-preserving pancreatoduodenectomy on postoperative delayed gastric emptying occurrence and long-term nutritional status. J Surg Oncol. 2014;109(7):690-696.
34. Hanna MM, Hanna M, Gadde R, et al. Delayed gastric emptying after pancreaticoduodenectomy: is subtotal stomach preserving better or pylorus preserving? J Gastrointest Surg. 2015;19(8):1542-1552.
35. Harmuth S, Wewalka M, Holst JJ, et al. Distal gastrectomy in pancreaticoduodenectomy is associated with accelerated gastric
emptying, enhanced postprandial release of GLP-1, and im-proved insulin sensitivity. J Gastrointest Surg. 2014;18(1):52-59.
36. Muscogiuri G, Mezza T, Prioletta A, et al. Removal of duodenum elicits GLP-1 secretion. Diabetes Care. 2013;36(6):1641-1646.
37. Kang CM, Lee JH. Pathophysiology after pancreaticoduodenectomy. World J Gastroenterol. 2015;21(19):5794-5804.
38. Holst JJ. Postprandial insulin secretion after gastric by-pass surgery: the role of glucagon-like peptide 1. Diabetes. 2011;60(9):2203-2205.
39. Hutch CR, Sandoval D. The role of GLP-1 in the metabolic success of bariatric surgery. Endocrinology. 2017;158(12):4139-4151.
40. Holst JJ, Madsbad S, Bojsen-Møller KN, et al. Mechanisms in bariatric surgery: gut hormones, diabetes resolution, and weight loss. Surg Obes Relat Dis. 2018;14(5):708-714.
41. Kang MJ, Jung HS, Jang JY, et al. Metabolic effect of pancreatoduodenectomy: resolution of diabetes mellitus after surgery. Pancreatology. 2016;16(2):272-277.
42. Magnússon J, Bengmark S, Tranberg KG. Reduced insulin se-cretion by subtotal pancreatectomy: preservation of insulin sen-sitivity and glucose tolerance in postoperative patients. Scand J Gastroenterol. 1990;25(7):669-675.
43. Lim PW, Dinh KH, Sullivan M, et al. Thirty-day outcomes underestimate endocrine and exocrine insufficiency after pan-creatic resection. HPB (Oxford). 2016;18(4):360-366.
Dow
nloaded from https://academ
ic.oup.com/jcem
/article/106/5/e2203/6117789 by guest on 30 January 2022