SLC30A3 Responds to Glucose- and Zinc Variations in ß-Cells and Is Critical for Insulin Production...
12
SLC30A3 Responds to Glucose- and Zinc Variations in ß- Cells and Is Critical for Insulin Production and In Vivo Glucose-Metabolism During ß-Cell Stress Kamille Smidt 1 , Niels Jessen 5 , Andreas Brønden Petersen 1 , Agnete Larsen 2 , Nils Magnusson 1 , Johanne Bruun Jeppesen 1 , Meredin Stoltenberg 2 , Janetta G. Culvenor 6 , Andrew Tsatsanis 7 , Birgitte Brock 1 , Ole Schmitz 1,5 , Lise Wogensen 4 , Ashley I. Bush 6,7 , Jørgen Rungby 1,3 * 1 Department of Pharmacology, University of Aarhus, A ˚ rhus, Denmark, 2 Department of Neurobiology, Institute of Anatomy, University of Aarhus, A ˚ rhus, Denmark, 3 Department of Endocrinology and Metabolism C, Aarhus University Hospital, A ˚ rhus, Denmark, 4 Research Laboratory for Biochemical Pathology, Aarhus University Hospital, A ˚ rhus, Denmark, 5 Department of Endocrinology M, Aarhus University Hospital, A ˚ rhus, Denmark, 6 Department of Pathology, University of Melbourne, Melbourne, Victoria, Australia, 7 Oxidation Biology Laboratory, Mental Health Research Institute, Parkville, Victoria, Australia Abstract Background: Ion transporters of the Slc30A- (ZnT-) family regulate zinc fluxes into sub-cellular compartments. b-cells depend on zinc for both insulin crystallization and regulation of cell mass. Methodology/Principal Findings: This study examined: the effect of glucose and zinc chelation on ZnT gene and protein levels and apoptosis in b-cells and pancreatic islets, the effects of ZnT-3 knock-down on insulin secretion in a b-cell line and ZnT-3 knock-out on glucose metabolism in mice during streptozotocin-induced b-cell stress. In INS-1E cells 2 mM glucose down-regulated ZnT-3 and up-regulated ZnT-5 expression relative to 5 mM. 16 mM glucose increased ZnT-3 and decreased ZnT-8 expression. Zinc chelation by DEDTC lowered INS-1E insulin content and insulin expression. Furthermore, zinc depletion increased ZnT-3- and decreased ZnT-8 gene expression whereas the amount of ZnT-3 protein in the cells was decreased. Zinc depletion and high glucose induced apoptosis and necrosis in INS-1E cells. The most responsive zinc transporter, ZnT-3, was investigated further; by immunohistochemistry and western blotting ZnT-3 was demonstrated in INS-1E cells. 44% knock-down of ZnT-3 by siRNA transfection in INS-1E cells decreased insulin expression and secretion. Streptozotocin-treated mice had higher glucose levels after ZnT-3 knock-out, particularly in overt diabetic animals. Conclusion/Significance: Zinc transporting proteins in b-cells respond to variations in glucose and zinc levels. ZnT-3, which is pivotal in the development of cellular changes as also seen in type 2 diabetes (e.g. amyloidosis in Alzheimer’s disease) but not previously described in b-cells, is present in this cell type, up-regulated by glucose in a concentration dependent manner and up-regulated by zinc depletion which by contrast decreased ZnT-3 protein levels. Knock-down of the ZnT-3 gene lowers insulin secretion in vitro and affects in vivo glucose metabolism after streptozotocin treatment. Citation: Smidt K, Jessen N, Petersen AB, Larsen A, Magnusson N, et al. (2009) SLC30A3 Responds to Glucose- and Zinc Variations in ß-Cells and Is Critical for Insulin Production and In Vivo Glucose-Metabolism During ß-Cell Stress. PLoS ONE 4(5): e5684. doi:10.1371/journal.pone.0005684 Editor: Kathrin Maedler, University of Bremen, Germany Received August 1, 2008; Accepted April 8, 2009; Published May 25, 2009 Copyright: ß 2009 Smidt et al. This is an open-access article distributed under the terms of the Creative Commons Attribution License, which permits unrestricted use, distribution, and reproduction in any medium, provided the original author and source are credited. Funding: Grants were received from Novo Nordisk Research Foundation, Bernhard and Marie Klein’s Fond for Diabetes Research and from the Danish Diabetes Association. The funders hand no role in the study design, data collection and analysis, decision to publish, or preparation of the manuscript. Competing Interests: The authors have declared that no competing interests exist. * E-mail: [email protected] Introduction The in- and efflux of zinc ions in cells has a number of physiological roles. Apart from being an essential metal for many enzymatic reactions [1], zinc is necessary in b-cells for proper storage of insulin by crystallization [2]. Furthermore, zinc, which is co-secreted with insulin, has paracrine effects on glucagon secretion from neighbouring a-cells [3,4] and participates in the regulation of b-cell mass by inducing cell death in a dose- dependent manner by largely unknown mechanisms [5–7]. Recently, mutations in the gene for a b-cell zinc-transporter have been identified as major risk mediators for type 2 diabetes and a zinc transporter appears to be responsible for a substantial part of the b-cell autoimmunity in type 1 diabetes suggesting a key role of b-cell zinc metabolism in these conditions [8–12]. Zinc and zinc transporters are important in other cell types and diseases, particularly in degenerative amyloidosis caused by the formation of b-amyloid plaques in the central nervous system. Such changes cause neuronal degeneration, resulting in Alzhei- mers disease (AD). Endogenous metals like zinc contribute to the aggregation of b-amyloid plaques and knocking out zinc transporters (ZnT-3) in mice leads to significantly fewer and smaller plaques and lower zinc concentrations in the hippocampus [13,14]. It has been hypothesised that intracellular chelatable zinc as well as extracellular zinc contribute to apoptosis [15]. Two different zinc-transporter families regulate zinc trafficking in cells. Efflux from the cytoplasm to extracellular spaces and intracellular membrane-limited compartments is mediated by ZnT proteins (SLC30A-family). Conversely, influx is regulated by ZIP PLoS ONE | www.plosone.org 1 May 2009 | Volume 4 | Issue 5 | e5684
Transcript of SLC30A3 Responds to Glucose- and Zinc Variations in ß-Cells and Is Critical for Insulin Production...

SLC30A3 Responds to Glucose- and Zinc Variations in ß-Cells and Is Critical for Insulin Production and In VivoGlucose-Metabolism During ß-Cell StressKamille Smidt1, Niels Jessen5, Andreas Brønden Petersen1, Agnete Larsen2, Nils Magnusson1, Johanne
Bruun Jeppesen1, Meredin Stoltenberg2, Janetta G. Culvenor6, Andrew Tsatsanis7, Birgitte Brock1, Ole
Schmitz1,5, Lise Wogensen4, Ashley I. Bush6,7, Jørgen Rungby1,3*
1 Department of Pharmacology, University of Aarhus, Arhus, Denmark, 2 Department of Neurobiology, Institute of Anatomy, University of Aarhus, Arhus, Denmark,
3 Department of Endocrinology and Metabolism C, Aarhus University Hospital, Arhus, Denmark, 4 Research Laboratory for Biochemical Pathology, Aarhus University
Hospital, Arhus, Denmark, 5 Department of Endocrinology M, Aarhus University Hospital, Arhus, Denmark, 6 Department of Pathology, University of Melbourne,
Melbourne, Victoria, Australia, 7 Oxidation Biology Laboratory, Mental Health Research Institute, Parkville, Victoria, Australia
Abstract
Background: Ion transporters of the Slc30A- (ZnT-) family regulate zinc fluxes into sub-cellular compartments. b-cellsdepend on zinc for both insulin crystallization and regulation of cell mass.
Methodology/Principal Findings: This study examined: the effect of glucose and zinc chelation on ZnT gene and proteinlevels and apoptosis in b-cells and pancreatic islets, the effects of ZnT-3 knock-down on insulin secretion in a b-cell line andZnT-3 knock-out on glucose metabolism in mice during streptozotocin-induced b-cell stress. In INS-1E cells 2 mM glucosedown-regulated ZnT-3 and up-regulated ZnT-5 expression relative to 5 mM. 16 mM glucose increased ZnT-3 and decreasedZnT-8 expression. Zinc chelation by DEDTC lowered INS-1E insulin content and insulin expression. Furthermore, zincdepletion increased ZnT-3- and decreased ZnT-8 gene expression whereas the amount of ZnT-3 protein in the cells wasdecreased. Zinc depletion and high glucose induced apoptosis and necrosis in INS-1E cells. The most responsive zinctransporter, ZnT-3, was investigated further; by immunohistochemistry and western blotting ZnT-3 was demonstrated inINS-1E cells. 44% knock-down of ZnT-3 by siRNA transfection in INS-1E cells decreased insulin expression and secretion.Streptozotocin-treated mice had higher glucose levels after ZnT-3 knock-out, particularly in overt diabetic animals.
Conclusion/Significance: Zinc transporting proteins in b-cells respond to variations in glucose and zinc levels. ZnT-3, whichis pivotal in the development of cellular changes as also seen in type 2 diabetes (e.g. amyloidosis in Alzheimer’s disease) butnot previously described in b-cells, is present in this cell type, up-regulated by glucose in a concentration dependentmanner and up-regulated by zinc depletion which by contrast decreased ZnT-3 protein levels. Knock-down of the ZnT-3gene lowers insulin secretion in vitro and affects in vivo glucose metabolism after streptozotocin treatment.
Citation: Smidt K, Jessen N, Petersen AB, Larsen A, Magnusson N, et al. (2009) SLC30A3 Responds to Glucose- and Zinc Variations in ß-Cells and Is Critical forInsulin Production and In Vivo Glucose-Metabolism During ß-Cell Stress. PLoS ONE 4(5): e5684. doi:10.1371/journal.pone.0005684
Editor: Kathrin Maedler, University of Bremen, Germany
Received August 1, 2008; Accepted April 8, 2009; Published May 25, 2009
Copyright: � 2009 Smidt et al. This is an open-access article distributed under the terms of the Creative Commons Attribution License, which permitsunrestricted use, distribution, and reproduction in any medium, provided the original author and source are credited.
Funding: Grants were received from Novo Nordisk Research Foundation, Bernhard and Marie Klein’s Fond for Diabetes Research and from the Danish DiabetesAssociation. The funders hand no role in the study design, data collection and analysis, decision to publish, or preparation of the manuscript.
Competing Interests: The authors have declared that no competing interests exist.
* E-mail: [email protected]
Introduction
The in- and efflux of zinc ions in cells has a number of
physiological roles. Apart from being an essential metal for many
enzymatic reactions [1], zinc is necessary in b-cells for proper
storage of insulin by crystallization [2]. Furthermore, zinc, which is
co-secreted with insulin, has paracrine effects on glucagon
secretion from neighbouring a-cells [3,4] and participates in the
regulation of b-cell mass by inducing cell death in a dose-
dependent manner by largely unknown mechanisms [5–7].
Recently, mutations in the gene for a b-cell zinc-transporter have
been identified as major risk mediators for type 2 diabetes and a
zinc transporter appears to be responsible for a substantial part of
the b-cell autoimmunity in type 1 diabetes suggesting a key role of
b-cell zinc metabolism in these conditions [8–12].
Zinc and zinc transporters are important in other cell types and
diseases, particularly in degenerative amyloidosis caused by the
formation of b-amyloid plaques in the central nervous system.
Such changes cause neuronal degeneration, resulting in Alzhei-
mers disease (AD). Endogenous metals like zinc contribute to the
aggregation of b-amyloid plaques and knocking out zinc
transporters (ZnT-3) in mice leads to significantly fewer and
smaller plaques and lower zinc concentrations in the hippocampus
[13,14]. It has been hypothesised that intracellular chelatable zinc
as well as extracellular zinc contribute to apoptosis [15].
Two different zinc-transporter families regulate zinc trafficking
in cells. Efflux from the cytoplasm to extracellular spaces and
intracellular membrane-limited compartments is mediated by ZnT
proteins (SLC30A-family). Conversely, influx is regulated by ZIP
PLoS ONE | www.plosone.org 1 May 2009 | Volume 4 | Issue 5 | e5684

proteins (SLC39A-family). So far, at least 10 ZnTs and 14 ZIPs
have been identified in mammals and zinc transport activity has
been confirmed with 7 ZnTs and 9 ZIPs [16].
The distribution of individual zinc transporters in the pancreas
appears to vary. In mouse pancreas the acinar cells express high
levels of ZnT-1 and ZnT-2, this level is reduced in zinc-depletion
states [17]. ZnT-3 is uninvestigated in pancreas, but ZnT-32/2
mice have histochemically reactive zinc in pancreatic islet cells
[18] which indicates that other members of the ZnT family
contribute to the compartmentalization of zinc into secretory
granules. ZnT-4 expression is present in pancreatic islets but the
distribution of the ZnT-4 protein is unknown [19]. ZnT-5 is
abundantly expressed in pancreatic b-cells and the localisation of
ZnT-5 in secretory granules suggests that ZnT-5 is involved in
supplementing zinc for the formation and stabilization of insulin-
zinc complexes [20]. No functional studies, however, have
confirmed the role of ZnT-5. ZnT-6 and ZnT-7 are expressed
in acinar cells from mouse pancreata [17]. The ZnT-8 gene is
highly expressed in b-cells. ZnT-8 is localised in secretory granules
which indicates a role for ZnT-8 similar to ZnT-5 in providing
zinc for insulin storage [21,22]. Recently it was found that ZnT-8
auto-antibodies are present in 60–80% of new-onset Type 1
diabetes patients [9], and that a polymorphism in the ZnT-8 gene
leads to impaired pro-insulin conversion and is associated with
Type 2 diabetes [8,23]. We recently demonstrated that ZnT-8 is
expressed at high levels also in human adipose tissue (high levels in
subcutaneous fat from lean, low levels in intra-abdominal fat from
obese) [24]. ZnT-9 and ZnT-10 have not yet been described in
pancreatic cells.
The molecular events responsible for insulin processing in b-
cells thus depend on the regulatory processes for zinc metabolism.
Zinc has a number of important paracrine effects in islets and a
zinc transporter (ZnT-8) seems to be critical for the genetic risk of
diabetes. Therefore, we hypothesized that the regulation of ZnT
gene expression is actively controlled by changes in glucose and
zinc concentration, and that genetic manipulation of ZnTs may
influence in vivo glucose homeostasis.
In order to determine whether this system is influenced by
glucose- and/or zinc levels in b-cells we examined the expression
patterns of ZnT-1 and ZnT-3-8 in glucose sensitive INS-1E cells at
different glucose concentrations and the expression patterns of
ZnT-3 and ZnT-8 during zinc-depletion. In mouse islets ZnT-3
and ZnT-8 expression was examined at different glucose
concentrations. The apoptotic and necrotic status of the INS-1E
cells at different glucose levels and after zinc chelation was tested
by measuring the expression patterns of the anti-apoptotic gene, B-
cell leukemia/lymphoma 2 (Bcl-2), and the pro-apoptotic gene,
Bcl-2-associated X protein (Bax) and by measuring DNA
fragmentation. In mouse islets the effect of different glucose
concentrations on the Bax/Bcl-2 ratio was analysed. In addition,
we developed a specific anti-ZnT3 antibody and described the
presence of ZnT-3 protein in INS-1E cells and mouse islets.
Further, since ZnT-3 appears to be particularly responsive to
variations in glucose, we investigated the effects of ZnT-3 knock-
down in INS-1E on in vitro insulin secretion and ZnT-3 knock-out
in mice on in vivo glucose metabolism during streptozotocin-
induced b-cell stress.
Materials and Methods
Cell culturesINS-1E cells were cultured in a 5% CO2 atmosphere in complete
RPMI 1640 supplemented with 11 mM glucose, 10% (v/v) heat-
inactivated fetal bovine serum, 50 mM b-mercaptoethanol, 2 mM
L-Glutamine, 100 U/ml penicillin, and 100 mg/ml streptomycin.
For stimulation assays INS-1E cells were plated (1,400,000 cells/
well) into 6-well plates (NUNC) at 11 mM glucose and cultured for
24 hours. Then cells were stimulated for 24 hours with 2, 5 or
16 mM glucose in replicas of 9 followed by RNA extraction.
DiEthylDiThioCarbamate (DEDTC) treatments were performed
with +/2100 mM DEDTC (Merck, Darmstadt, Germany) dis-
solved in complete RPMI 1640 medium with 5 mM glucose in
replicas of 6 for RNA extraction and replicas of 3 for insulin
measurements. Controls were stimulated for 24 hours with RPMI
1640 medium and 5 mM glucose in replicas of 6 and 3 for RNA
extraction and insulin measurements, respectively.
Harvest and stimulation of islets4 week old male BALB/CA mice were killed by cervical
dislocation. For gene expression analysis islets were split into
groups of 60, cultured for 24 hours in a 5% CO2 atmosphere in
RPMI 1640 supplemented with 100 U/ml penicillin, and 100 mg/
ml streptomycin. Then cells were washed in PBS and stimulated
with RPMI 1640 supplemented with 100 U/ml penicillin, and
100 mg/ml streptomycin, 10% (v/v) heat-inactivated fetal bovine
serum, 2 mM L-Glutamine, 2, 5 or 16 mM glucose for 24 hours
in replicas of 6 followed by RNA extraction. For western blotting
analysis 200 islets were stimulated with 100 mM DEDTC dissolved
in RPMI 1640 medium supplemented with 100 U/ml penicillin,
and 100 mg/ml streptomycin, 10% (v/v) heat-inactivated fetal
bovine serum, 2 mM L-Glutamine with 10% FBS, 2 mM L-
Glutamine, and 5 mM glucose for 24 hours followed by cell lysis.
RNA extraction and cDNA synthesisINS-1E RNA was extracted using Qiagen RNeasy Mini Kit
(VWR, Denmark) and treated with DNase (VWR, Denmark). The
RNA quality was controlled on a 1% (v/v) agarose gel stained with
ethidium-bromide. 500 ng total RNA was reversely transcribed
using ImProm-IITM Reverse Transcription System (Promega,
Denmark) and oligo dT18 primers (TAC, Copenhagen). The
cDNA was checked for genomic DNA contamination by PCR
analysis using Qiagen HotStarTaq Master Mix Kit (VWR,
Denmark) with an intron-spanning primer-set of b-actin (TAC,
Copenhagen). The PCR product was analysed by ethidium
bromide staining after electrophoresis in a 1% agarose gel.
RNA amplificationRNA from islet was extracted followed by RNA amplification
using RiboAmpH HSPLUS Kit (MDS Analytical Technologies)
which, in two rounds, leads to a linear amplification of mRNA
from total RNA. 500 ng RNA was reversely transcribed using
ImProm-IITM Reverse Transcription System (Promega, Denmark)
and used for analysis of ZnT-8, insulin, Bax and Bcl-2 expression
whereas 2 mg RNA was used for analysis of ZnT-3.
Real-time PCRQuantitative real-time PCR was performed in duplicate with IQ
Sybr Green supermix (Bio-Rad, Denmark) in a MyiQ Single-
Color Real-Time PCR Detection System (Bio-Rad, Denmark).
For all reactions a melting curve was included. The results were
analysed with iQTM5 Optical System Software, Version 2.0.
Starting quantities were calculated from a standard curve. Values
were normalised to the geomean of three housekeeping genes
(HKGs) [25]. The expression of the HKGs were analysed to assure
stable expression, and neither glucose nor DEDTC treatment
seemed to change the gene expression of the selected HKGs (data
not shown).
ZnT-3 and Glucose Metabolism
PLoS ONE | www.plosone.org 2 May 2009 | Volume 4 | Issue 5 | e5684

Primers used for RealTime PCRRat. Ubiquitin Conjugase-7 (UBC-7): F: 59CAG CTG GCA
GAA CTC AAC AA 39, R: 59TTT GGG TGC CAA ATC TCT
GT 39. Annealing temp: 58uC. Hypozanthine-guanine
Phosphoribosyltransferase (HPRT): F: 59GCA GAC TTT GCT
TTC CTT GG 39, R: 59CCG CTG TCT TTT AGG CTT TG
39. Annealing temp: 58uC. Cyclophilin A (CycA): F: 59AGG TCC
TGG CAT CTT GTC CA 39, R: 59CTT GCT GGT CTT GCC
ATT CC 39. Annealing temp: 58uC. Clathrin (Cltc): F: 59AAG
GAG GCG AAA CTC ACA GA 39, R: 59GAG CAG TCA ACA
TCC AGC AA 39. Annealing temp: 59uC. Heat Shock Protein
(HSPcb): F: 59GAT TGA CAT CAT CCC CAA CC 39, R:
59CTG CTC ATC ATC GTT GTG CT 39. Annealing temp:
59uC. ZnT-1: F: 59CCC AGC TTC ATA CAT GCA GGT G 39,
R: 59CCT TGC TCT TCT CCC CTA TAT GCT C 39.
Annealing temp: 63uC. ZnT-3: F: 59TCC TCT TCT CTA TCT
GCG CCC 39, R: 59TGT GCG GAG GCA ACG TGG TAA 39.
Annealing temp: 59uC. ZnT-4: F: 59GAT CGG AGA GCT TGT
AGG TGG ATA 39, R: 59ACA CCA GCA TGA CAC TGA
TCA TGG 39. Annealing temp: 63uC. ZnT-5: F: 59ATG GCC
GAA TAG AAA TTC TC 39, R: 59CCT TTC TGT CCT CTT
ACC ACT C 39. Annealing temp: 53uC. ZnT-6: F: 59GCT GAC
CGA AGG TCC TGG AAG A 39, R: 59TAG GCA GCG CTA
GGT CTC CTC A C 39. Annealing temp: 65uC. ZnT-7: F:
59ATG TTG CCC CTG TCC ATC AAG G 39, R: 59TCG GAG
ATC AAG CCT AGG CAG T 39. Annealing temp: 60uC. ZnT-8:
F. 59GGT GGA CAT GTT GCT GGG AG 39, R: 59CAC CAG
TCA CCA CCC AGA TG 39. Annealing temp: 56uC. Insulin
(INS): F: 59CGC TTC CTG CCC CTG CTG GC 39, R: 59CGG
GCC TCC ACC CAG CTC CA 39. Annealing temp: 65uC. Bax:
F: 59GTG AGC GGC TGC TTG TCT 39, R: 59GTG GGG
GTC CCG AAG TAG 59. Annealing temp: 60uC. Bcl-2: F:
59GTA CCT GAA CCG GCA TCT G 59, R: 59GGG GCC ATA
TAG TTC CAC AA 39. Annealing temp: 59uC.
Mouse. HPRT: F: 59AAG CTT GCT GGT GAA AAG GA
39, R: 59TTG CGC TCA TCT TAG GCT TT 39. Annealing temp:
57uC. CycA: F: 59GTG GTC TTT GGG AAG GTG AA 39, R:
59TTA CAG GAC ATT GCG AGC AG 39. Annealing temp: 58uC.
UBC-7: F: 59GGA ACT GGG CTG CAA TAA AA 39, R: 59CCG
GAT CAT GTT GTG CTA TG 39. Annealing temp: 58uC.BAX:
F: 59TGC AGA GGA TGA TTG CTG AC 39, R: 59GAT CAG
CTC GGG CAC TTT AG 59. Annealing temp: 57uC. BCL-2: F: 59
AGG AGC AGG TGC CTA CAA GA 39, R: 59GCA TTT TCC
CAC CAC TGT CT 39. Annealing temp: 57uC. ZnT-8: F: 59TTG
GTT TTC ATA CGG CTT CC 39, R: 59GAT GCA AAG GAC
AGA CAG CA 39. Annealing temp: 57uC. ZnT-3: F: 59AGC CAT
GGA TCT ACA GGT GC 39, R: 59CGC AGA TGG AGA AGA
GGA AG 39. Annealing temp: 59uC. Insulin: F: 59GAC CCT CCA
CAC CTA GGA CA 39, R: 59AAG CAG CAC CTT TGT GGT
TC 39. Annealing temp: 57uC.
Rat and mouse. The intron-spanning primers of b-actin: F:
59CTA CAA TGA GCT GCG TGT GGC 39, R: 59 GTC CAG
ACG CAG GAT GGC ATG 39. Annealing temp: 65uC. cDNA
gives a band of 269 basepair, and genomic DNA gives a band of
732 basepair. All PCR sequences were confirmed by sequencing
with Thermo SequenaseTM Dye Terminator Cycle Sequencing
Premix Kit (Amersham Bioscience, Denmark).
Insulin measurementINS-1E cells were treated with 100 mM DEDTC in complete
RPMI medium for 24 hours. Hereafter the cells were incubated
for 2 hours in a Krebs-Ringer bicarbonate HEPES buffer (KRBH)
(at pH 7.4) containing 115 mM NaCl, 4.7 mM KCl, 1.2 mM
MgSO4, 2.6 mM CaCl2, 1.2 mM KH2PO4, 20 mM HEPES,
5 mM NaHCO3, 0.1% (v/v) human serum albumin (HSA)
(Sigma, Denmark), +/2100 mM DEDTC and 5 mmol/l glucose
for insulin release determination. The incubation medium was
collected for insulin analysis and insulin release was measured.
Afterwards, the cells were washed in Earle’s basal medium
(Invitrogen, Denmark) at room temperature before adding 1 ml
ice-cold Earle’s basal medium in which the cells were scraped off
with a rubber policeman. After centrifugation, the medium was
discharged and the intact cells re-suspended partly in a buffer
containing 0.75% (v/v) glycine and 0.25% (v/v) bovine serum
albumin adjusted to pH 8.8 for insulin determination after
sonication and centrifugation at 30,0006g for 30 minutes at
4uC, and partly in 0.1 mol/l NaOH for protein determination.
Total protein was determined using BCA Protein Assay Reagent
Kit from PIERCE, US (Bie & Berntsen A/S, Denmark).
Insulin assaySamples of the incubation medium were immediately frozen for
insulin analysis. Insulin content was determined using an ultrasentive
Rat Insulin Elisa Kit from DRG Diagnostics (VWR. Denmark).
Cell Death ELISA AssayFragmentation of histone-associated-DNA after cell death in-
duced by glucose or DEDTC was determined by photometric
enzyme immunoassay (Cell Death Detection ELISAPLUS, Roche
Applied Science). INS-1E cells were plated on 24-well plate with
200,000 cells per well and stimulated 36 hours later either with
5 mM, 11 mM, 16 mM glucose or 100 mM DEDTC and 5 mM
glucose for 24 hours. Experiments were performed in quadrupli-
cates. Cells were scraped of with a rubber policeman and centrifuged
at 2006g for 10 minutes. Supernatants containing DNA from
necrotic cells were removed and stored at 4uC for further analysis.
Cell pellets containing DNA fragments were lysed and centrifuged at
2006g for 10 minutes. The supernatant containing the cytoplasmic
fraction and the supernatant containing the DNA from necrotic cells
were transferred into streptavidin coated microtiter plate in duplicate
and incubated with Anti-histone-biotin. The amount of fragmented
DNA bound to Anti-DNA-peroxidase was measured by ABTS (2,29-
azino-bis(3-ethylbenzthiazoline-6-sulphonic acid) at 405 nm and
490 nm as reference wavelength.
Cell preparation and zinc ion stainingINS-1E cells were grown for 24 hours in staining chambers at a
density of 400,000 per chamber. The cells were rinsed in a KRBH
buffer supplemented with 0.1% (v/v) HSA and 11 mM glucose as
described above, and were then exposed to 0.04% (v/v) sodium
sulfide dissolved in KRB+0.1% (v/v) HSA for 60 minutes at room
temperature. The cells were rinsed in KRBH and fixed using
glutaraldehyde (GA) (3% (v/v), 100 mM phosphate-buffered
aqueous solution) at 4uC overnight. The fixed cells were rinsed
in distilled water. Slides with cells were placed in jars filled with the
AMG developer [19], kept in darkness at 26uC, and developed for
60 minutes. Thereafter slides were placed in 5% (v/v) sodium
thiosulfate for 10 minutes in order to stop the AMG development,
rinsed in demineralized water for 10 minutes, and air-dried.
Finally, the slides were counterstained with 0.1% (v/v) toluidine
blue for 90 seconds (for details see e.g. [26]). Control of zinc ion
specificity was performed as previously described [26,26,27].
Western blottingAliquots of protein from mouse islets, rat brain and INS-1E cells
(+/2100 mM DEDTC; mock- or ZnT-3 siRNA transfected) were
resolved by sodium dodecyl sulfate-polyacrylamide gel (10%
ZnT-3 and Glucose Metabolism
PLoS ONE | www.plosone.org 3 May 2009 | Volume 4 | Issue 5 | e5684

polyacrylamide gels), transferred to nitrocellulose, blocked with
5% non-fat milk in Tris-Buffered Saline Tween-20 (10 mM Tris,
150 mM NaCl, pH 8.0, and 0.1% Tween-20), and incubated with
ZnT-3 antibody (1:2500). b-actin was used as an internal control.
The membrane was washed and incubated with horseradish
peroxidase-conjugated goat anti-rabbit IgG antibody (1:4000)
(Invitrogen, Denmark) as secondary antibody, and proteins were
visualized by ECL Plus Western Blotting Detection System
Amersham (GE Healthcare, Denmark).
ZnT-3 polyclonal antibodyA custom synthesised peptide H-SLRLKSLFTEPSEPLPEEC-
OH was used to generate the antibody (Mimotopes). It had an
additional cysteine at the C-terminus for coupling to carrier
protein. The sequence is to human ZnT-3 in the N-terminal
domain where there is strong conservation with mouse ZnT-3. It
was coupled at the C-terminus to diphtheria toxoid by Mimotopes
for immunization in rabbits with Freund’s Adjuvant. Rabbits 04/
13 and 04/14 were immunized 9 times at monthly intervals, and
bled at 2 weeks after boosts. Serum was incubated at RT for
40 minutes with crushed lyophilised mouse liver to capture any
non-specific antibodies. ZnT-3 has a moleculear weight of 44 kDa.
ZnT-3 immunohistochemistryThe cells (grown in staining chambers) were fixed in 4% (v/v)
paraformaldehyde (PFA) for 20 minutes, and subsequently rinsed
carefully in TBS for 20 minutes, followed by TBS and triton 1% (v/
v) for 10 minutes. The pre-incubation in TBS and 1% (v/v) triton
and 0.2% (v/v) milk lasted 30 minutes. The cells were incubated
with a ZnT-3 antibody (1:2000) (kindly provided by Professor R.
Palmiter, Seattle, USA) at 4uC overnight, rinsed in TBS and 1% (v/
v) triton, and incubated with 10 nm colloidal gold labelled secondary
goat anti-rabbit antibody, 1:50 dilution, (Aurion) for 1 hour at room
temperature. After rinsing in TBS followed by water, the cells
exposed to silver enhancement for 40 minutes (developer, enhancer,
gum arabic; 1:1:1) using a commercial kit (Aurion R-GENT
SE_LM). Finally, the cells were rinsed in water and counterstained
with 0.1% (v/v) toluidine blue. After light microscopy, selected parts
were chosen for re-embedding in Epon (see e.g. [28]) and 75 nm
sections were cut, placed on grids, and finally counterstained with
lead citrate and saturated uranyl acetate. The sections were
examined by routine transmission electron microscopy. Cells not
incubated with ZnT-3 antibody remained unstained.
ZnT-3 siRNA transfection in INS-1E cellsFor transfection with small interference RNA (siRNA) INS-1E
cells were plated in 24-well plates at a density of 100,000 cells per
well. 72 hours later the cells were transfected with ZnT-3 or
control non-silencing (mock) siRNA in OPTI-MEM with 0.7 ml
DharmaFect (Dharmacon) in a total volume of 500 ml. The final
siRNA concentration was 100 nM. After 16 hours of transfection
the transfection-medium was replaced with complete RPMI
medium without antibiotics. Cells were cultured for an additional
48 hours before insulin expression and secretion studies were
performed. Target sequence for ZnT-3 siRNA was (J-099172-10),
and target sequence for mock was (D-001810-01-20), (Dharma-
con). Efficiency of transfection was approximately 40% as assed
with RT-PCR. For RNA expression and insulin secretion analysis
replicas of 3 and 4 were employed, respectively.
In vivo glucose metabolism after ZnT-3 knock-outThe study was undertaken in accordance with Danish law and
the University of Aarhus guidelines for animal welfare. Every
effort was made to minimize the number of animals used and their
suffering. To examine whole body glucose metabolism after ZnT-3
knock-out we employed a whole body ZnT-3 knock-out (ZnT-
32/2) mouse model using male animals only [18]. Male, age
matched wild-type C57Bl6 (ZnT-3+/+) mice bred from ZnT-3+/
2 littermates were used as controls. Three months old mice were
housed under standard laboratory conditions with free access to
food and water. For fasting measurements food was removed for
12 hours maintaining free access to water. For glucose measure-
ments samples were obtained by tail bleeding. For the intraper-
itoneal glucose tolerance test (IPGTT) 2 g glucose/kg body weight
were injected and blood glucose was measured after 15, 30, 60 and
120 minutes. All fasting and non-fasting glucose measurements
were performed between 8 AM and 10 AM. For the first
experiment freshly dissolved streptozotocin was injected intraper-
itoneally (50 mg/kg/day) to 15 knock-out and 15 wild-type
animals for 5 days and fasting blood glucose levels were measured
after a 3 day wash-out. In a smaller group (10 knock-outs and 10
wild-types) this was repeated for 3 weeks with IPGTTs being
performed after each series of injections after a 3 day wash-out.
Since none of the animals developed diabetes we performed a
high-dose streptozotocin experiment (200 mg/kg/day for 3 days)
in 10 randomly selected mice (5 knock-outs, 5 wild-types with one
accidental death in the WT-group after day 1). On the day after
the last injection we measured non-fasting glucose levels and the
following day performed an IPGTT. Blood glucose was measured
using an OneTouch Ultra meter (Lifescan, Milpitas, USA.).
Data analysisCell cultures: Means are shown 6SEM. Comparisons between
groups in RT PCR experiments and analysis of DNA fragmen-
tation were made by Mann-Whitney test. Student unpaired t-test
was used to analyse insulin content and secretion data in the
DEDTC treatment experiment. ZnT-3 siRNA experiment: AUCs
of insulin secretion/insulin content were compared by Mann-
Whitney test. IPGTT: AUCs of glucose levels after intraperitaneal
exposure were compared by two-way ANOVA.
Results
ZnT-3, ZnT-5 and ZnT-8 gene expressions are regulatedby glucose
We cultured INS-1E cells for 24 hours at 2, 5 or 16 mM glucose
in order to study the gene expression of selected ZnTs. ZnT-1 and
ZnT-3-8 were expressed at all glucose concentrations. ZnT-5
expression was significantly up-regulated at the lowest glucose-
concentration (p,0.01) while ZnT-3 was significantly down-
regulated (p,0.05). At the highest glucose concentration, ZnT-8
was significantly down-regulated (p,0.05) whereas ZnT-3 was
significantly up-regulated (p,0.01) (Fig. 1A). All comparisons are
relative to 5 mM glucose. Islets from mice cultured for 24 hours at
2, 5 or 16 mM glucose had significantly higher ZnT-3 expression
at 16 mM glucose compared to 2 mM glucose (p,0.05). ZnT-8
expression was not significantly different at the various glucose
concentrations (Fig. 1B).
Zinc chelation stimulates ZnT-3 gene expression butinhibits ZnT-8 and insulin gene expression, and lowersinsulin content
In order to examine the effects of zinc chelation we treated INS-
1E cells grown for 24 hours at 11 mM glucose with a zinc chelator
(100 mM DEDTC) and visualized free intracellular zinc ions by
autometallography. We found that DEDTC removed most of the
ZnT-3 and Glucose Metabolism
PLoS ONE | www.plosone.org 4 May 2009 | Volume 4 | Issue 5 | e5684

detectable zinc in b-cells (Fig. 2). After 24 hours of DEDTC-
treatment at 5 mM glucose we examined insulin gene expression,
intracellular insulin content and insulin secretion along with the
expression of ZnTs. Insulin expression decreased significantly after
DEDTC treatment (p,0.01), whereas the ratio between insulin
secretion and insulin content was increased in DEDTC treated cells
(p,0.01) due to a significantly lower insulin content in DEDTC
treated cells (data not shown) (Fig. 3A and Fig. 3B). DEDTC
treatment stimulated the expression of ZnT-3 significantly (p,0.05)
(Fig. 4A) but decreased the expression of ZnT-8 (p,0.01) (Fig. 4B)
(all comparisons relative to untreated cells). We have previously
demonstrated that ZnT-3, ZnT-8 and insulin expression varies with
DEDTC treatment, and that the results depend on specific
housekeeping genes [29]. Accordingly we normalised to HPRT,
Cltc and HSP since they were the most stable HKGs.
Hyperglycemia and zinc chelation induce cell death inINS-1E cells
The apoptotic effect of hyperglycemia and DEDTC on INS-1E
cells was tested next. We analysed the gene expression of Bcl-2 and
Bax. We found that hyperglycemia increased the Bax/Bcl-2 ratio
(p,0.01) (Fig. 5A). Analysis of DNA fragmentation confirmed cell
death, not by apoptotis but by necrosis (p,0.05) (Fig. 5B and
Fig. 5C). In mouse islets hypoglycemia but not hyperglycemia
increased the Bax/Bcl-2 ratio (p,0.01) (data not shown). Zinc-
chelation by DEDTC in INS-1E cells lead to an up-regulation of
the Bax/Bcl-2 ratio (p,0.01) (Fig. 5D) and measuring DNA
fragments showed that the cells were apoptotic as well as necrotic
(p,0.01 and p,0.01, respectively) (Fig. 5E and Fig. 5F). In order
to avoid any effect of glucose on cell death we chose to stimulate
the INS-1E cells with 5 mM glucose instead of 11 mM glucose in
the DEDTC experiment because our data indicated that 11 mM
tended to affect the necrotic state of INS-1E cells (data not
shown).
ZnT-3 protein is present in INS-1E cells and mouseisletsWe developed a polyclonal specific antibody against the N-
terminal domain of ZnT-3 (Fig. 6A). By western blotting, we
determined the presence of ZnT-3 protein in DEDTC treated or
siRNA transfected INS-1E cells (Fig. 6B). Brain tissue was used as
Figure 1. Relative gene expression of ZnTs in INS-1E cells and mouse islets after 24 hours of glucose stimulation. A) INS-1E cells:Stimulations were performed at 2, 5 or 16 mM glucose. Normalised to UBC-7, CycA and b-actin. Data are mean and SEM (*p,0.05). N = 9. B) Mouseislets: Stimulations were performed at 2, 5 or 16 mM glucose. Normalised to UBC-7, CycA and HPRT. Data are mean and SEM (*p,0.05). N = 6.doi:10.1371/journal.pone.0005684.g001
ZnT-3 and Glucose Metabolism
PLoS ONE | www.plosone.org 5 May 2009 | Volume 4 | Issue 5 | e5684

control since high levels of ZnT-3 protein has previously been
detected in synaptic vesicles of the hippocampus [30] (Fig. 6B). In
contrast to the increased mRNA levels observed (fig. 4A),
treatment of INS-1E cells with DEDTC decreasedZnT-3 protein
levels assayed by western blotting (Fig. 6B). Knock-down of the
ZnT-3 gene decreased protein levels by 57% (Fig. 6B). ZnT3
protein was present also in intact islets (Fig. 6D). Localisation of
ZnT-3 in INS-1E cells to an intracellular compartment was
determined by immunohistochemistry (Fig. 6C).
Insulin expression and secretion is decreased by ZnT-3knock-down in INS-1E cells
To examine the in vitro effect of ZnT-3 knock-down we
transfected INS-1E with ZnT-3 siRNA. The ZnT-3 mRNA level
Figure 2. Zinc content of INS-1E cells. (A+B) Zn2+ autometallography of untreated INS-1E cells. (A) 406. Bar = 50 mm. (B) 1006. Bar = 20 mm. (C+D)DEDTC treatment for 24 hours removed most autometallographically-detectable Zn2+ from the INS-1E cells. (C) 406. Bar = 50 mm. (D) 1006. Bar = 20 mm.doi:10.1371/journal.pone.0005684.g002
ZnT-3 and Glucose Metabolism
PLoS ONE | www.plosone.org 6 May 2009 | Volume 4 | Issue 5 | e5684

was knocked down by 44% (p,0.05) and insulin expression was
reduced by 41% (p,0.05) (Fig. 7A and Fig. 7B). AUC for insulin
secretion/insulin content was decreased in ZnT-3 siRNA
transfected INS-1E cell compared to mock-transfected INS-1E
cells (p,0.05) (Fig. 7C).
Glucose metabolism is impaired in ZnT-3 knock-out miceKnocking out ZnT-3 affected in vivo glucose metabolism after
low- and high-dose streptozotocin, most significantly following
severe b-cell stress. There were no significant differences in body
weights when comparing knock-out and wild-type mice. Fasting
blood glucose levels were unaffected by ZnT-3 knock-out, data not
shown, thus under normal circumstances glucose metabolism after
knock down resembles that of the wild-type. After a single series of
low-dose streptozotozin (50 mg/kg/day for 5 days) all mice,
knock-out and wild-type, remained non-diabetic with a slight
increase in fasting glucose levels in the knock-out group (p,0.01)
(Fig. 8). IPGTTs showed no difference when measuring AUC for
glucose. Repeated courses of low-dose streptozotocin did not cause
diabetes in either group and their IPGTTs were similar. High-
dose streptozotocin (200 mg/kg/day for 3 days) resulted in
significantly higher glucose levels in the knock-out group both
while non-fasting and after IPGTT (p,0.01 for both comparisons)
(Fig. 9).
Discussion
A number of observations support the importance of zinc in
maintaining a normal glucose homeostasis. Low amounts of free
(non-enzymatic) zinc are associated with a decreased insulin
content in b-cells [31] and zinc depletion by DEDTC leads to
diabetes [32,33]. Recently, Gyulkhandanyan et al. [34] demon-
strated in mouse b-cells that zinc transport from the extracellular
space into the cytoplasm is regulated by the activity of L-type
Figure 3. Insulin expression, content and secretion after 24 hours of 100 mM DEDTC treatment. INS-1E cells were treated with DEDTC at5 mM glucose. A) Insulin gene expression normalized to Cltc, HPRT and HSPcb. Data are mean and SEM (*p,0.01). N = 6. B) Insulin secretion relatedto insulin content in INS-1E cells. Data are mean and SEM (*p,0.01). N = 3.doi:10.1371/journal.pone.0005684.g003
Figure 4. Relative gene expression of ZnT-3 and ZnT-8 after 24 hours of 100 mM DEDTC treatment. INS-1E cells were treated withDEDTC at 5 mM glucose. A) ZnT-3 gene expression normalised to Cltc, HPRT and HSPcb. Data are mean and SEM (*p,0.05). N = 6. B) ZnT-8 geneexpression normalised to Cltc, HPRT and HSPcb. Data are mean and SEM (*p,0.01). N = 6.doi:10.1371/journal.pone.0005684.g004
ZnT-3 and Glucose Metabolism
PLoS ONE | www.plosone.org 7 May 2009 | Volume 4 | Issue 5 | e5684
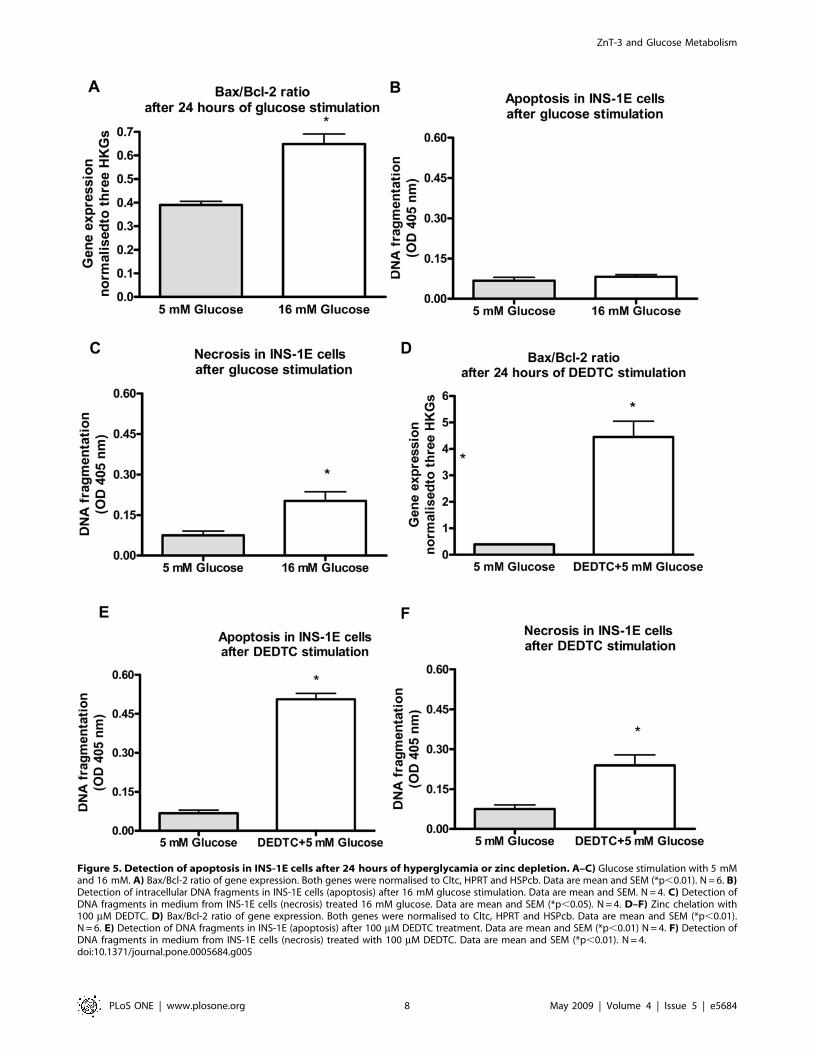
Figure 5. Detection of apoptosis in INS-1E cells after 24 hours of hyperglycamia or zinc depletion. A–C) Glucose stimulation with 5 mMand 16 mM. A) Bax/Bcl-2 ratio of gene expression. Both genes were normalised to Cltc, HPRT and HSPcb. Data are mean and SEM (*p,0.01). N = 6. B)Detection of intracellular DNA fragments in INS-1E cells (apoptosis) after 16 mM glucose stimulation. Data are mean and SEM. N = 4. C) Detection ofDNA fragments in medium from INS-1E cells (necrosis) treated 16 mM glucose. Data are mean and SEM (*p,0.05). N = 4. D–F) Zinc chelation with100 mM DEDTC. D) Bax/Bcl-2 ratio of gene expression. Both genes were normalised to Cltc, HPRT and HSPcb. Data are mean and SEM (*p,0.01).N = 6. E) Detection of DNA fragments in INS-1E (apoptosis) after 100 mM DEDTC treatment. Data are mean and SEM (*p,0.01) N = 4. F) Detection ofDNA fragments in medium from INS-1E cells (necrosis) treated with 100 mM DEDTC. Data are mean and SEM (*p,0.01). N = 4.doi:10.1371/journal.pone.0005684.g005
ZnT-3 and Glucose Metabolism
PLoS ONE | www.plosone.org 8 May 2009 | Volume 4 | Issue 5 | e5684

Figure 6. ZnT-3 protein in INS-1E cells and mouse islets. A) Western blot of ZnT-3 knockout tissue, and normal background strain tissue usingthe anti-ZnT-3 polyclonal antibody (20 mg per lane). B) Western blot with ZnT-3 antibody. Lane one shows the protein marker in kDa. Subsequentlanes: Control rat brain (10 mg protein) (lanes 2–4), mock transfected INS1-E cells (50 mg protein) (lanes 5–7), 100 mM DEDTC-treated INS1-E cells(50 mg protein) (lanes 8–10), ZnT-3 siRNA transfected INS1-E cells (50 mg protein) (lanes 11–13). Insert shows the quantification, brain tissue values areoriginal multiplied by 5. C) Light micrograph of INS-1E cells exposed to ZnT-3 antibody. Silver enhanced colloidal gold (10 nm) particles attached tosecondary antibodies against the ZnT-3 primary antibody are seen within the cells. There was no background stain and controls were negative(insert). Bar = 20 mm. D) Demonstration of ZnT3 antibody positivity in intact mouse islets (lane 1), compared with INS-1E cells before (lane 2) and after(lane 3) treatment with 100 mM DEDTC and brain tissue (lane 4). Each upload with 20 mg protein.doi:10.1371/journal.pone.0005684.g006
ZnT-3 and Glucose Metabolism
PLoS ONE | www.plosone.org 9 May 2009 | Volume 4 | Issue 5 | e5684

calcium channels. During high-glucose exposure L-type calcium
channels appear to be crucial and in resting states ZIP proteins
gain responsibility for the inward zinc transport. On the other
hand, ZnTs are responsible for the outward transport i.e. from
cytoplasm to extracellular spaces or intracellular vesicles. The
transport of zinc into secretory vesicles is vital for the
crystallization of insulin [2].
We here describe that ZnT-1 and ZnT-3-8 genes are expressed
in INS-1E cells. We studied the expression of zinc transporters in
response to either different levels of glucose or removal of non-
protein-bound zinc by DEDTC. At high glucose concentrations,
ZnT-8 expression was down-regulated whereas ZnT-3 expression
was up-regulated. In mouse islets ZnT-3 expression was up-
regulated by high glucose concentrations. This is the first
demonstration that glucose can significantly influence the gene
expression of zinc transporting proteins.
Previously, we have shown that treatment with 5 mM DEDTC
removes all non-protein-bound zinc in INS-1E cells when treated
for 30 minutes [26]. In order to achieve a long-term chelation of
zinc we treated INS-1E cells with 100 mM DEDTC for 24 hours.
This led to the removal of the majority of the zinc. ZnT-8 and
insulin expressions were down-regulated after DEDTC treatment
while ZnT-3 gene expression increased and protein levels decreased
after DEDTC. Thus, zinc depletion as well as high glucose
concentrations appears to affect the expression of ZnT-3 and ZnT-8
in opposite directions, indicating that these two transporters in
particular play a pivotal role in maintaining b-cell zinc homeostasis.
Stimulation with high glucose leads to glucotoxicity in human
pancreatic islets causing b-cell death [35]. In our study, Bcl-2 and
Bax gene expressions were indicative of cell death after stimulation
with high glucose and after treatment with DEDTC in INS-1E
cells. These results were confirmed by an ELISA based cell death
detection kit. In mouse islets, 24 hour of stimulation with high
glucose concentrations did not lead to an increased Bax/Bcl-2
ratio, indicating that glucotoxicity arises at a later time than
24 hours in primary cells.
Figure 7. Knock-down of ZnT-3 in INS-1E cells. A) Relative gene expression of ZnT-3 in ZnT-3 knock-downed INS-1E cells compared tomismatch controls. ZnT-3 gene expression normalised to b-actin and HSP. Data are mean and SEM (*p,0.05) N = 3. B) Relative gene expression ofinsulin in ZnT-3 knock-down INS-1E cells. Insulin gene expression normalised to b-actin and HSP. Data are mean and SEM (*p,0.05). N = 3. C) Glucosestimulated insulin secretion in ZnT-3 knock-down INS-1E cells. Cells were stimulated with either 2, 6.6 or 16.6 mM glucose for 2 hours. Insulinsecretion was normalised to insulin content. Data are mean and SEM (p,0.01 for AUC). N = 4.doi:10.1371/journal.pone.0005684.g007
ZnT-3 and Glucose Metabolism
PLoS ONE | www.plosone.org 10 May 2009 | Volume 4 | Issue 5 | e5684

ZnT-8 over-expressing INS-1E cells are protected from zinc
depletion-induced cell death compared to control cells and ZnT-8
over-expression leads to increased glucose-induced insulin secre-
tion [36]. Our study shows that the benefits of ZnT-8 on the cell
survival and the insulin secretion may be absent in non-transfected
cells due to a glucose or DEDTC mediated down-regulation of
ZnT-8 expression. We found that ZnT-3 is up-regulated by high
glucose.
ZnT-3, which thus appears to be responsive to both glucose and
zinc depletion in b-cells, is known to be responsible for the
transport of zinc into synaptic vesicles in the hippocampus and
cerebellum, both regions rich in neurones using zinc for
neuromodulation and ZnT3 may be a marker for apoptosis
[37,38,39]. Removal of ZnT-3 results in defective neurotransmis-
sion and cytoplasmic accumulation of potentially toxic zinc ions
[18,40]. Expression levels may be influenced by exogenous stimuli
other than glucose and DEDTC, e.g. oestrogen lowers ZnT-3
expression in mouse brain [41]. ZnT-3 is an important factor in
AD since ZnT-3 is supplying the zinc which is partly responsible
for the formation of amyloid plaques [13]. It may be hypothesized
that the link between ZnT-3 and amyloid-related pathologies, such
as type 2 diabetes, is present in b-cells as well as in the
hippocampus.
ZnT-3 has not previously been detected in b-cells [42]. We here
demonstrate the presence of ZnT-3 protein in INS-1E cells and
the decrease of protein levels after ZnT3 gene knock-down.
By contrast, ZnT-8 has previously been shown to be present in
b-cells, located in secretory vesicles. Our current observations
suggest ZnT-3 to be another key player. Using ZnT-3 knock-down
INS-1E cells we were able to reveal in vitro the effects of down-
regulation of the ZnT-3 gene on insulin expression and secretion.
Using a knock-out mouse model, we demonstrated that the in vivo
glucose metabolism can be affected by alterations in the zinc
transporter system. Since this was evident only after severe b-cell
stress, compensatory mechanisms must exist, the maintenance of
intracellular and intravesicular zinc levels in b-cells is most likely
dependent upon a number of interacting transporters. The impact
of changes in the expression of zinc transporters on other actions
of zinc in islets (most notably regulation of b-cell mass and
glucagon secretion) remains to be settled [7].
In conclusion, we have found that a number of ZnTs are
present in b-cells. ZnT-3 expression is up-regulated by glucose and
zinc depletion whereas ZnT-8 is down-regulated. Zinc depletion
decreased protein levels. This is the first evidence that zinc
transporting proteins are actively influenced by the metabolic
status of b-cells and suggests that b-cell zinc homeostasis must be
further studied in order to establish whether this system has a role
also in b-cell pathologies. In the ZnT-3 knock-out model we have
demonstrated that in vivo glucose metabolism can be affected by
alterations in zinc transporters. This was also suggested by large-
scale epidemiological studies in populations of patients [8] and b-
cell zinc metabolism is emerging as yet another important system
in understanding the development of type 2 diabetes.
Figure 9. High-dose streptozotocin for three days in ZnT-32/2 knockout mice and control mice. Following a series of low-doseexposures (see Fig. 8) ZnT-32/2 knock-out mice and control mice were treated with 200 mg/kg/day. A) Non-fasting morning blood glucose levels.Salt indicates sham saline injections. Data are mean and SEM (*p,0.01). B) Intraperitoneal glucose tolerance test in ZnT-32/2 knockout mice andcontrol mice after high-dose streptozotozin. Blood glucose concentrations were measured before and 15, 30, 60 and 120 minutes after the glucoseinjection. Significantly higher AUC0–120 in knock-out vs WT mice (p,0.01). N = 5 for ZnT-32/2 and n = 4 for wild type.doi:10.1371/journal.pone.0005684.g009
Figure 8. Fasting glucose levels after low-dose streptozotozinin ZnT-32/2 knock-out mice. ZnT-32/2 knock-out mice andcontrol mice were treated with 50 mg/kg/day for five days. Data aremean and SEM (*p,0.01). N = 15.doi:10.1371/journal.pone.0005684.g008
ZnT-3 and Glucose Metabolism
PLoS ONE | www.plosone.org 11 May 2009 | Volume 4 | Issue 5 | e5684

Acknowledgments
We thank Karen Skjoedt Soerensen and Elin Carstensen, Department of
Pharmacology, Aarhus University, Denmark, Dorete Jensen, Lene
Munkoe and Majken Sand, Neurobiology, Institute of Anatomy, Aarhus
University, Denmark for expert technical assistance. ZnT-3 antibody for
hstochemistry and ZnT-3 knock-out mice were kindly supplied by
Professor Richard Palmiter. Supported by the Danish Diabetes Association
and the Novo Nordisk Research Foundation.
Author Contributions
Conceived and designed the experiments: KS NJ ABP AL NM MS BB OS
LW AIB JR. Performed the experiments: KS NJ ABP NM JBJ MS JGC
AT. Analyzed the data: KS NJ NM JBJ MS AIB JR. Contributed
reagents/materials/analysis tools: KS AL MS JGC AT BB OS LW JR.
Wrote the paper: KS BB LW AIB JR.
References
1. Vallee BL, Falchuk KH (1993) The biochemical basis of zinc physiology. Physiol
Rev 73: 79–118.2. Chausmer AB (1998) Zinc, insulin and diabetes. J Am Coll Nutr 17: 109–115.
3. Ishihara H, Maechler P, Gjinovci A, Herrera PL, Wollheim CB (2003) Islet beta-
cell secretion determines glucagon release from neighbouring alpha-cells. NatCell Biol 5: 330–335.
4. Franklin I, Gromada J, Gjinovci A, Theander S, Wollheim CB (2005) Beta-cellsecretory products activate alpha-cell ATP-dependent potassium channels to
inhibit glucagon release. Diabetes 54: 1808–1815.
5. Chang I, Cho N, Koh JY, Lee MS (2003) Pyruvate inhibits zinc-mediatedpancreatic islet cell death and diabetes. Diabetologia 46: 1220–1227.
6. Kim BJ, Kim YH, Kim S, Kim JW, Koh JY, et al. (2000) Zinc as a paracrineeffector in pancreatic islet cell death. Diabetes 49: 367–372.
7. Priel T, Aricha-Tamir B, Sekler I (2007) Clioquinol attenuates zinc-dependentbeta-cell death and the onset of insulitis and hyperglycemia associated with
experimental type I diabetes in mice. Eur J Pharmacol 565: 232–239.
8. Sladek R, Rocheleau G, Rung J, Dina C, Shen L, et al. (2007) A genome-wideassociation study identifies novel risk loci for type 2 diabetes. Nature 445:
881–885.9. Wenzlau JM, Juhl K, Yu L, Moua O, Sarkar SA, et al. (2007) The cation efflux
transporter ZnT8 (Slc30A8) is a major autoantigen in human type 1 diabetes.
Proc Natl Acad Sci U S A 104: 17040–17045.10. Cauchi S, Proenca C, Choquet H, Gaget S, De Graeve F, et al. (2008) Analysis
of novel risk loci for type 2 diabetes in a general French population: theD.E.S.I.R. study. J Mol Med 86: 341–348.
11. Saxena R, Voight BF, Lyssenko V, Burtt NP, de Bakker PI, et al. (2007)Genome-wide association analysis identifies loci for type 2 diabetes and
triglyceride levels. Science 316: 1331–1336.
12. Zeggini E, Weedon MN, Lindgren CM, Frayling TM, Elliott KS, et al. (2007)Replication of genome-wide association signals in UK samples reveals risk loci
for type 2 diabetes. Science 316: 1336–1341.13. Lee JY, Cole TB, Palmiter RD, Suh SW, Koh JY (2002) Contribution by
synaptic zinc to the gender-disparate plaque formation in human Swedish
mutant APP transgenic mice. Proc Natl Acad Sci U S A 99: 7705–7710.14. Stoltenberg M, Bush AI, Bach G, Smidt K, Larsen A, et al. (2007) Amyloid
plaques arise from zinc-enriched cortical layers in APP/PS1 transgenic mice andare paradoxically enlarged with dietary zinc deficiency. Neuroscience 150:
357–369.15. Cuajungco MP, Lees GJ (1997) Zinc and Alzheimer’s disease: is there a direct
link? Brain Res Brain Res Rev 23: 219–236.
16. Cousins RJ, Liuzzi JP, Lichten LA (2006) Mammalian zinc transport, trafficking,and signals. J Biol Chem 281: 24085–24089.
17. Liuzzi JP, Bobo JA, Lichten LA, Samuelson DA, Cousins RJ (2004) Responsivetransporter genes within the murine intestinal-pancreatic axis form a basis of
zinc homeostasis. Proc Natl Acad Sci U S A 101: 14355–14360.
18. Cole TB, Wenzel HJ, Kafer KE, Schwartzkroin PA, Palmiter RD (1999)Elimination of zinc from synaptic vesicles in the intact mouse brain by disruption
of the ZnT3 gene. Proc Natl Acad Sci U S A 96: 1716–1721.19. Clifford KS, MacDonald MJ (2000) Survey of mRNAs encoding zinc
transporters and other metal complexing proteins in pancreatic islets of ratsfrom birth to adulthood: similar patterns in the Sprague-Dawley and Wistar BB
strains. Diabetes Res Clin Pract 49: 77–85.
20. Kambe T, Narita H, Yamaguchi-Iwai Y, Hirose J, Amano T, et al. (2002)Cloning and characterization of a novel mammalian zinc transporter, zinc
transporter 5, abundantly expressed in pancreatic beta cells. J Biol Chem 277:19049–19055.
21. Chimienti F, Devergnas S, Favier A, Seve M (2004) Identification and Cloning
of a {beta}-Cell-Specific Zinc Transporter, ZnT-8, Localized Into InsulinSecretory Granules. Diabetes 53: 2330–2337.
22. Chimienti F, Favier A, Seve M (2005) ZnT-8, a pancreatic beta-cell-specific zinctransporter. Biometals 18: 313–317.
23. Kirchhoff K, Machicao F, Haupt A, Schafer SA, Tschritter O, et al. (2008)
Polymorphisms in the TCF7L2, CDKAL1 and SLC30A8 genes are associatedwith impaired proinsulin conversion. Diabetologia 51: 597–601.
24. Smidt K, Pedersen S, Brock B, Schmitz O, Fisker S, et al. (2007) Zinc-
transporter genes in human visceral and subcutaneous adipocytes: Lean versus
obese. Mol Cell Endocrinol 264: 68–73.
25. Vandesompele J, De Preter K, Pattyn F, Poppe B, Van Roy N, et al. (2002)
Accurate normalization of real-time quantitative RT-PCR data by geometric
averaging of multiple internal control genes. Genome Biol 3: RESEARCH0034.
26. Sondergaard LG, Brock B, Stoltenberg M, Flyvbjerg A, Schmitz O, et al. (2005)
Zinc fluxes during acute and chronic exposure of INS-1E cells to increasing
glucose levels. Horm Metab Res 37: 133–139.
27. Danscher G (1981) Histochemical demonstration of heavy metals. A revised
version of the sulphide silver method suitable for both light and electronmicro-
scopy. Histochemistry 71: 1–16.
28. Danscher G, Stoltenberg M (2006) Silver enhancement of quantum dots
resulting from (1) metabolism of toxic metals in animals and humans, (2) in vivo,
in vitro and immersion created zinc-sulphur/zinc-selenium nanocrystals, (3)
metal ions liberated from metal implants and particles. Prog Histochem
Cytochem 41: 57–139.
29. Smidt K, Wogensen L, Brock B, Schmitz O, Rungby J (2006) Real-time PCR:
housekeeping genes in the INS-1E beta-cell line. Horm Metab Res 38: 8–11.
30. Palmiter RD, Cole TB, Quaife CJ, Findley SD (1996) ZnT-3, a putative
transporter of zinc into synaptic vesicles. Proc Natl Acad Sci U S A 93:
14934–14939.
31. Sondergaard LG, Stoltenberg M, Flyvbjerg A, Brock B, Schmitz O, et al. (2003)
Zinc ions in beta-cells of obese, insulin-resistant, and type 2 diabetic rats traced
by autometallography. APMIS 111: 1147–1154.
32. Kadota I, Midorikawa O (1951) Diabetogenic action of organic reagents:
destructive lesions of islets of Langerhans caused by sodium diethyldithiocarba-
mate and potassium ethylxanthate. J Lab Clin Med 38: 671–688.
33. Kurahashi M, Masui H, Yoshimoto S, Wakabayashi I, Sakamoto K (1993)
Effect of diethyldithiocarbamate on diabetogenic action of alloxan in rats.
Diabetes Res Clin Pract 19: 39–47.
34. Gyulkhandanyan AV, Lee SC, Bikopoulos G, Dai F, Wheeler MB (2006) The
Zn2+-transporting pathways in pancreatic beta-cells: a role for the L-type
voltage-gated Ca2+ channel. J Biol Chem 281: 9361–9372.
35. Federici M, Hribal M, Perego L, Ranalli M, Caradonna Z, et al. (2001) High
glucose causes apoptosis in cultured human pancreatic islets of Langerhans: a
potential role for regulation of specific Bcl family genes toward an apoptotic cell
death program. Diabetes 50: 1290–1301.
36. Chimienti F, Devergnas S, Pattou F, Schuit F, Garcia-Cuenca R, et al. (2006) In
vivo expression and functional characterization of the zinc transporter ZnT8 in
glucose-induced insulin secretion. J Cell Sci 119: 4199–4206.
37. Ackland ML, Zou L, Freestone D, van de Waasenburg S, Michalczyk AA (2007)
Diesel exhaust particulate matter induces multinucleate cells and zinc
transporter-dependent apoptosis in human airway cells. Immunol Cell Biol 85:
617–622.
38. Wenzel HJ, Cole TB, Born DE, Schwartzkroin PA, Palmiter RD (1997)
Ultrastructural localization of zinc transporter-3 (ZnT-3) to synaptic vesicle
membranes within mossy fiber boutons in the hippocampus of mouse and
monkey. Proc Natl Acad Sci U S A 94: 12676–12681.
39. Wall MJ (2005) A role for zinc in cerebellar synaptic transmission? Cerebellum
4: 224–229.
40. Lee JY, Cole TB, Palmiter RD, Koh JY (2000) Accumulation of zinc in
degenerating hippocampal neurons of ZnT3-null mice after seizures: evidence
against synaptic vesicle origin. J Neurosci 20: RC79.
41. Lee JY, Kim JH, Hong SH, Lee JY, Cherny RA, et al. (2004) Estrogen decreases
zinc transporter 3 expression and synaptic vesicle zinc levels in mouse brain.
J Biol Chem 279: 8602–8607.
42. Seve M, Chimienti F, Devergnas S, Favier A (2004) In silico identification and
expression of SLC30 family genes: an expressed sequence tag data mining
strategy for the characterization of zinc transporters’ tissue expression. BMC
Genomics 5: 32.
ZnT-3 and Glucose Metabolism
PLoS ONE | www.plosone.org 12 May 2009 | Volume 4 | Issue 5 | e5684