TRPV1 antagonists attenuate antigen-provoked cough in ovalbumin sensitized guinea pigs
Upload
independentCategory
view
4download
0
ARTICLE
Effects of glucose tolerance on the changes provokedby glucose ingestion in microvascular function
A. Natali & S. Baldi & F. Vittone & E. Muscelli &A. Casolaro & C. Morgantini & C. Palombo &
E. Ferrannini
Received: 2 August 2007 /Accepted: 25 January 2008 /Published online: 29 March 2008# Springer-Verlag 2008
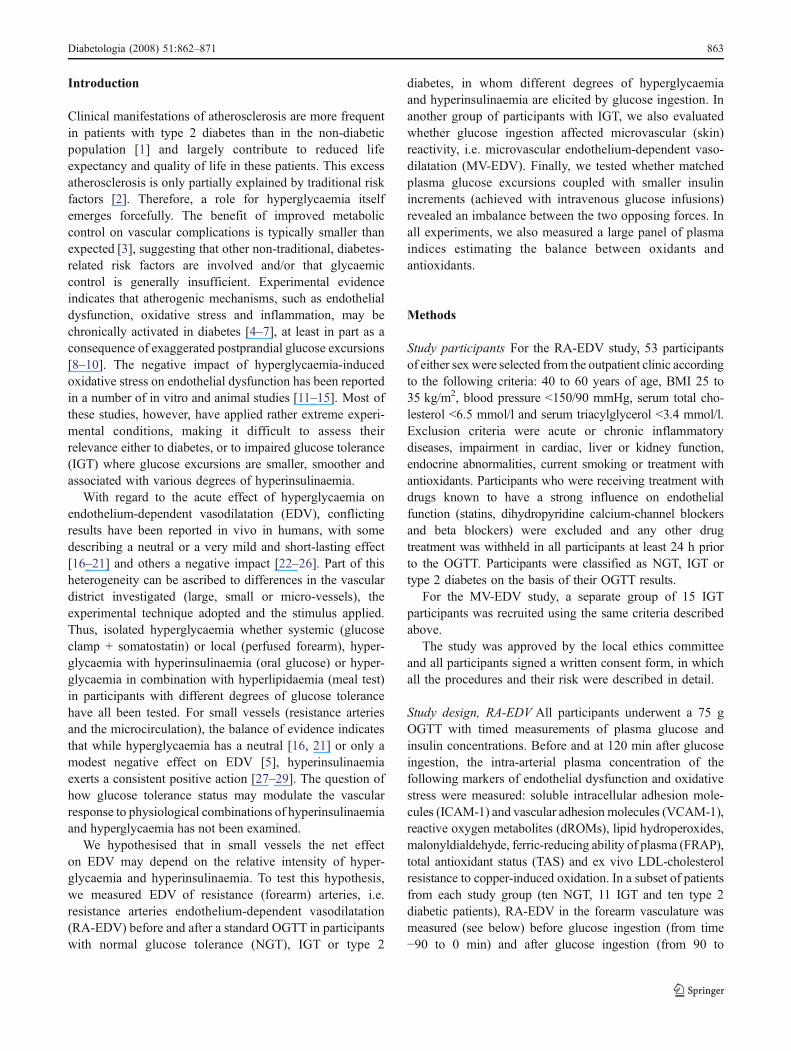
AbstractAims/hypothesis Hyperglycaemia and hyperinsulinaemiahave opposite effects on endothelium-dependent vasodila-tation in microcirculation, but the net effect elicited byglucose ingestion and the separate influence of glucosetolerance are unknown.Methods In participants with normal glucose tolerance(NGT), impaired glucose tolerance (IGT) or diabetic glucosetolerance, multiple plasma markers of both oxidative stressand endothelial activation, and forearm vascular responses(plethysmography) to intra-arterial acetylcholine (ACh) andsodium nitroprusside (SNP) infusions were measured beforeand after glucose ingestion. In another IGT group, weevaluated the time-course of the skin vascular responses(laser Doppler) to ACh and SNP (by iontophoresis) 1, 2 and3 h into the OGTT; the plasma glucose profile was thenreproduced by means of a variable intravenous glucoseinfusion and the vascular measurements repeated.Results Following oral glucose, plasma antioxidants werereduced by 5% to 10% (p<0.01) in all patient groups. Theresponse to acetylcholine was not affected by glucoseingestion in any group, while the response to SNP wasattenuated, particularly in the IGT group. The ACh:SNPratio was slightly improved therefore in all groups, even indiabetic participants, in whom it was impaired basally. Atime-dependent improvement in ACh:SNP ratio was also
observed in skin microcirculation following oral glucose;this improvement was blunted when matched hyperglycae-mia was coupled with lower hyperinsulinaemia (intraven-ous glucose).Conclusions/interpretation Regardless of glucose toler-ance, oral glucose does not impair endothelium-dependentvasodilatation either in resistance arteries or in themicrocirculation, despite causing increased oxidative stress;the endogenous insulin response is probably responsible forcountering any inhibitory effect on vascular function.
Keywords Endothelium . Glucose intolerance .
Hyperglycaemia . Hyperinsulinaemia .Microcirculation .
Nitric oxide . Oxidative stress . Resistance arteries .
Type 2 diabetes . Vascular function
AbbreviationsACh acetylcholinedROMs reactive oxygen metabolitesEDV endothelium-dependent vasodilatationFRAP ferric-reducing ability of plasmaICAM-1 soluble intracellular adhesion moleculesIGT impaired glucose toleranceNGT normal glucose toleranceMV-EDV microvascular endothelium-dependent va-
sodilatationNO nitric oxideRA-EDV resistance arteries endothelium-dependent
vasodilatationSNP sodium nitroprussideTAS total antioxidant statusVCAM-1 soluble vascular adhesion molecules8�iso�PGF2α 8-iso-prostaglandin F2a
Diabetologia (2008) 51:862–871DOI 10.1007/s00125-008-0971-6
A. Natali (*) : S. Baldi : F. Vittone : E. Muscelli :A. Casolaro :C. Morgantini :C. Palombo : E. FerranniniDepartment of Internal Medicine, University of Pisa,Via Roma, 67,Pisa 56100, Italye-mail: [email protected]
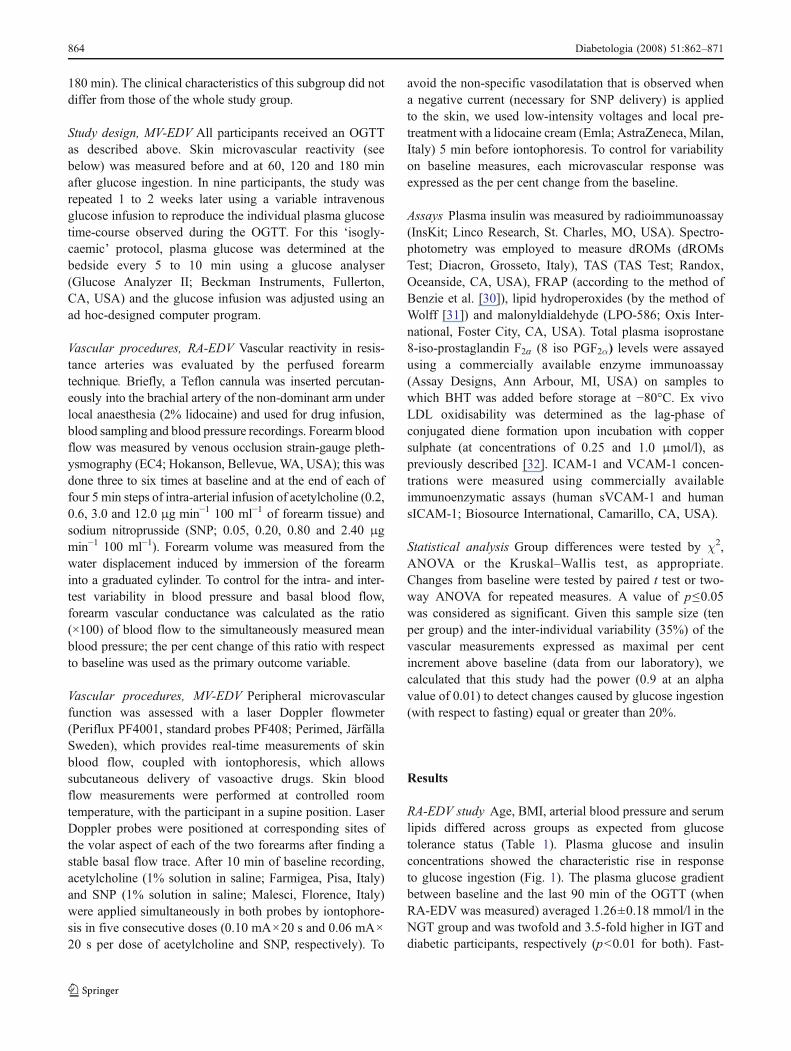
Introduction
Clinical manifestations of atherosclerosis are more frequentin patients with type 2 diabetes than in the non-diabeticpopulation [1] and largely contribute to reduced lifeexpectancy and quality of life in these patients. This excessatherosclerosis is only partially explained by traditional riskfactors [2]. Therefore, a role for hyperglycaemia itselfemerges forcefully. The benefit of improved metaboliccontrol on vascular complications is typically smaller thanexpected [3], suggesting that other non-traditional, diabetes-related risk factors are involved and/or that glycaemiccontrol is generally insufficient. Experimental evidenceindicates that atherogenic mechanisms, such as endothelialdysfunction, oxidative stress and inflammation, may bechronically activated in diabetes [4–7], at least in part as aconsequence of exaggerated postprandial glucose excursions[8–10]. The negative impact of hyperglycaemia-inducedoxidative stress on endothelial dysfunction has been reportedin a number of in vitro and animal studies [11–15]. Most ofthese studies, however, have applied rather extreme experi-mental conditions, making it difficult to assess theirrelevance either to diabetes, or to impaired glucose tolerance(IGT) where glucose excursions are smaller, smoother andassociated with various degrees of hyperinsulinaemia.
With regard to the acute effect of hyperglycaemia onendothelium-dependent vasodilatation (EDV), conflictingresults have been reported in vivo in humans, with somedescribing a neutral or a very mild and short-lasting effect[16–21] and others a negative impact [22–26]. Part of thisheterogeneity can be ascribed to differences in the vasculardistrict investigated (large, small or micro-vessels), theexperimental technique adopted and the stimulus applied.Thus, isolated hyperglycaemia whether systemic (glucoseclamp + somatostatin) or local (perfused forearm), hyper-glycaemia with hyperinsulinaemia (oral glucose) or hyper-glycaemia in combination with hyperlipidaemia (meal test)in participants with different degrees of glucose tolerancehave all been tested. For small vessels (resistance arteriesand the microcirculation), the balance of evidence indicatesthat while hyperglycaemia has a neutral [16, 21] or only amodest negative effect on EDV [5], hyperinsulinaemiaexerts a consistent positive action [27–29]. The question ofhow glucose tolerance status may modulate the vascularresponse to physiological combinations of hyperinsulinaemiaand hyperglycaemia has not been examined.
We hypothesised that in small vessels the net effecton EDV may depend on the relative intensity of hyper-glycaemia and hyperinsulinaemia. To test this hypothesis,we measured EDV of resistance (forearm) arteries, i.e.resistance arteries endothelium-dependent vasodilatation(RA-EDV) before and after a standard OGTT in participantswith normal glucose tolerance (NGT), IGT or type 2
diabetes, in whom different degrees of hyperglycaemiaand hyperinsulinaemia are elicited by glucose ingestion. Inanother group of participants with IGT, we also evaluatedwhether glucose ingestion affected microvascular (skin)reactivity, i.e. microvascular endothelium-dependent vaso-dilatation (MV-EDV). Finally, we tested whether matchedplasma glucose excursions coupled with smaller insulinincrements (achieved with intravenous glucose infusions)revealed an imbalance between the two opposing forces. Inall experiments, we also measured a large panel of plasmaindices estimating the balance between oxidants andantioxidants.
Methods
Study participants For the RA-EDV study, 53 participantsof either sex were selected from the outpatient clinic accordingto the following criteria: 40 to 60 years of age, BMI 25 to35 kg/m2, blood pressure <150/90 mmHg, serum total cho-lesterol <6.5 mmol/l and serum triacylglycerol <3.4 mmol/l.Exclusion criteria were acute or chronic inflammatorydiseases, impairment in cardiac, liver or kidney function,endocrine abnormalities, current smoking or treatment withantioxidants. Participants who were receiving treatment withdrugs known to have a strong influence on endothelialfunction (statins, dihydropyridine calcium-channel blockersand beta blockers) were excluded and any other drugtreatment was withheld in all participants at least 24 h priorto the OGTT. Participants were classified as NGT, IGT ortype 2 diabetes on the basis of their OGTT results.
For the MV-EDV study, a separate group of 15 IGTparticipants was recruited using the same criteria describedabove.
The study was approved by the local ethics committeeand all participants signed a written consent form, in whichall the procedures and their risk were described in detail.
Study design, RA-EDV All participants underwent a 75 gOGTT with timed measurements of plasma glucose andinsulin concentrations. Before and at 120 min after glucoseingestion, the intra-arterial plasma concentration of thefollowing markers of endothelial dysfunction and oxidativestress were measured: soluble intracellular adhesion mole-cules (ICAM-1) and vascular adhesion molecules (VCAM-1),reactive oxygen metabolites (dROMs), lipid hydroperoxides,malonyldialdehyde, ferric-reducing ability of plasma (FRAP),total antioxidant status (TAS) and ex vivo LDL-cholesterolresistance to copper-induced oxidation. In a subset of patientsfrom each study group (ten NGT, 11 IGT and ten type 2diabetic patients), RA-EDV in the forearm vasculature wasmeasured (see below) before glucose ingestion (from time−90 to 0 min) and after glucose ingestion (from 90 to
Diabetologia (2008) 51:862–871 863
180 min). The clinical characteristics of this subgroup did notdiffer from those of the whole study group.
Study design, MV-EDV All participants received an OGTTas described above. Skin microvascular reactivity (seebelow) was measured before and at 60, 120 and 180 minafter glucose ingestion. In nine participants, the study wasrepeated 1 to 2 weeks later using a variable intravenousglucose infusion to reproduce the individual plasma glucosetime-course observed during the OGTT. For this ‘isogly-caemic’ protocol, plasma glucose was determined at thebedside every 5 to 10 min using a glucose analyser(Glucose Analyzer II; Beckman Instruments, Fullerton,CA, USA) and the glucose infusion was adjusted using anad hoc-designed computer program.
Vascular procedures, RA-EDV Vascular reactivity in resis-tance arteries was evaluated by the perfused forearmtechnique. Briefly, a Teflon cannula was inserted percutan-eously into the brachial artery of the non-dominant arm underlocal anaesthesia (2% lidocaine) and used for drug infusion,blood sampling and blood pressure recordings. Forearm bloodflow was measured by venous occlusion strain-gauge pleth-ysmography (EC4; Hokanson, Bellevue, WA, USA); this wasdone three to six times at baseline and at the end of each offour 5 min steps of intra-arterial infusion of acetylcholine (0.2,0.6, 3.0 and 12.0 μg min−1 100 ml−1 of forearm tissue) andsodium nitroprusside (SNP; 0.05, 0.20, 0.80 and 2.40 μgmin−1 100 ml−1). Forearm volume was measured from thewater displacement induced by immersion of the forearminto a graduated cylinder. To control for the intra- and inter-test variability in blood pressure and basal blood flow,forearm vascular conductance was calculated as the ratio(×100) of blood flow to the simultaneously measured meanblood pressure; the per cent change of this ratio with respectto baseline was used as the primary outcome variable.
Vascular procedures, MV-EDV Peripheral microvascularfunction was assessed with a laser Doppler flowmeter(Periflux PF4001, standard probes PF408; Perimed, JärfällaSweden), which provides real-time measurements of skinblood flow, coupled with iontophoresis, which allowssubcutaneous delivery of vasoactive drugs. Skin bloodflow measurements were performed at controlled roomtemperature, with the participant in a supine position. LaserDoppler probes were positioned at corresponding sites ofthe volar aspect of each of the two forearms after finding astable basal flow trace. After 10 min of baseline recording,acetylcholine (1% solution in saline; Farmigea, Pisa, Italy)and SNP (1% solution in saline; Malesci, Florence, Italy)were applied simultaneously in both probes by iontophore-sis in five consecutive doses (0.10 mA×20 s and 0.06 mA×20 s per dose of acetylcholine and SNP, respectively). To
avoid the non-specific vasodilatation that is observed whena negative current (necessary for SNP delivery) is appliedto the skin, we used low-intensity voltages and local pre-treatment with a lidocaine cream (Emla; AstraZeneca, Milan,Italy) 5 min before iontophoresis. To control for variabilityon baseline measures, each microvascular response wasexpressed as the per cent change from the baseline.
Assays Plasma insulin was measured by radioimmunoassay(InsKit; Linco Research, St. Charles, MO, USA). Spectro-photometry was employed to measure dROMs (dROMsTest; Diacron, Grosseto, Italy), TAS (TAS Test; Randox,Oceanside, CA, USA), FRAP (according to the method ofBenzie et al. [30]), lipid hydroperoxides (by the method ofWolff [31]) and malonyldialdehyde (LPO-586; Oxis Inter-national, Foster City, CA, USA). Total plasma isoprostane8-iso-prostaglandin F2a (8�iso�PGF2α) levels were assayedusing a commercially available enzyme immunoassay(Assay Designs, Ann Arbour, MI, USA) on samples towhich BHT was added before storage at −80°C. Ex vivoLDL oxidisability was determined as the lag-phase ofconjugated diene formation upon incubation with coppersulphate (at concentrations of 0.25 and 1.0 μmol/l), aspreviously described [32]. ICAM-1 and VCAM-1 concen-trations were measured using commercially availableimmunoenzymatic assays (human sVCAM-1 and humansICAM-1; Biosource International, Camarillo, CA, USA).
Statistical analysis Group differences were tested by χ2,ANOVA or the Kruskal–Wallis test, as appropriate.Changes from baseline were tested by paired t test or two-way ANOVA for repeated measures. A value of p≤0.05was considered as significant. Given this sample size (tenper group) and the inter-individual variability (35%) of thevascular measurements expressed as maximal per centincrement above baseline (data from our laboratory), wecalculated that this study had the power (0.9 at an alphavalue of 0.01) to detect changes caused by glucose ingestion(with respect to fasting) equal or greater than 20%.
Results
RA-EDV study Age, BMI, arterial blood pressure and serumlipids differed across groups as expected from glucosetolerance status (Table 1). Plasma glucose and insulinconcentrations showed the characteristic rise in responseto glucose ingestion (Fig. 1). The plasma glucose gradientbetween baseline and the last 90 min of the OGTT (whenRA-EDV was measured) averaged 1.26±0.18 mmol/l in theNGT group and was twofold and 3.5-fold higher in IGT anddiabetic participants, respectively (p<0.01 for both). Fast-
864 Diabetologia (2008) 51:862–871
ing plasma insulin concentrations were similar acrossgroups; mean values over the last 90 min of the OGTTwere 379±30, 552±75 and 432±54 pmol/l in the NGT,IGT and diabetes groups, respectively; the correspondingincrement above baseline was 50% greater in the IGT thanin the NGT and diabetes groups (p<0.05 for both).
Of the circulating markers, only fasting VCAM-1 andTAS levels were significantly different according to glucosetolerance status. Plasma 8�iso�PGF2α levels were markedlyand similarly elevated in both IGT and diabetic participants(p<0.05 with respect to NGT). Following glucose ingestion,plasma concentrations of ICAM-1, dROMs, lipid hydro-peroxides and malonyldialdehyde, as well as the lag-phaseof copper-induced LDL oxidation did not change signifi-cantly in any of the groups, whereas VCAM-1, TAS andFRAP showed small reductions (−6, −6 and −9%, respec-tively, p<0.05 for all), which were quantitatively similaracross groups (Table 2). Plasma 8�iso�PGF2α showed atendency to increase in response to glucose ingestion;however, due to the large inter-individual variability, thisincrease did not achieve statistical significance, either wheneach group was analysed separately (Mann–Whitney test),or when all participants were considered together (p=0.09by ANOVA for repeated measure).
Pre-test-infusion forearm blood flow rates and haemody-namic parameters were similar across groups and relativelystable throughout the study (Table 3). At the maximalinfusion rates of ACh and SNP, small (5% and 10%respectively) but consistent (p<0.05 for both) declines inblood pressure coupled with a modest increase in heart ratewere observed in all groups, both under fasting conditionsand during the OGTT, thereby justifying the use ofconductance as a measure of local vasodilation.
Under fasting conditions, the vascular response to AChwas blunted in individuals with type 2 diabetes (p<0.05 vs
NGT and IGT), while the response to SNP was similar inthe three groups (Fig. 2). After glucose ingestion, ACh-induced vasodilatation was similar to the response observedunder fasting conditions in all groups; the response to SNPin NGT and diabetic participants was also unaffected byglucose ingestion, whereas it was modestly depressed in theIGT group (p<0.04). In the fasting state as well as afterglucose ingestion, the ratio of ACh to SNP maximalresponses (ACh:SNP) was reduced only in individuals withtype 2 diabetes (p<0.05 vs IGT and NGT). During theOGTT, the ACh:SNP ratio slightly increased in all groups(from 1.47±0.12 to 1.55±0.21, 1.51±0.30 to 1.95±0.38and 1.01±0.13 to 1.38±0.24 in NGT, IGT and diabeticparticipants respectively, p<0.05 for glucose tolerance andOGTT effects by ANOVA for repeated measures).
MV-EDV study The IGT patients undergoing the MV-EDVstudy had similar clinical characteristics to the IGT groupundergoing the RA-EDV study (data not shown). Skinperfusion showed an eightfold increase in maximal re-sponse to local ACh and a fivefold increment in maximalresponse to SNP. At 2 h into the OGTT, no change in theresponse to ACh and an attenuation of the response to SNP(p<0.05) were observed (Fig. 3). The time-course showedthat the response to ACh declined at 60 min (p<0.05) andrecovered thereafter, while the response to SNP wasprogressively attenuated over time (p<0.05; Fig. 4). Con-sequently, the ACh:SNP ratio showed some increase at120 min into the OGTT (p=0.09).
In the participants undergoing the isoglycaemic experi-ment, the plasma glucose profile seen with oral glucose wasclosely matched by the variable intravenous glucoseinfusion. As expected, the increase in plasma insulinconcentrations was markedly (~50%) smaller (Fig. 5). Thetime-course of the ACh:SNP ratio in the group of
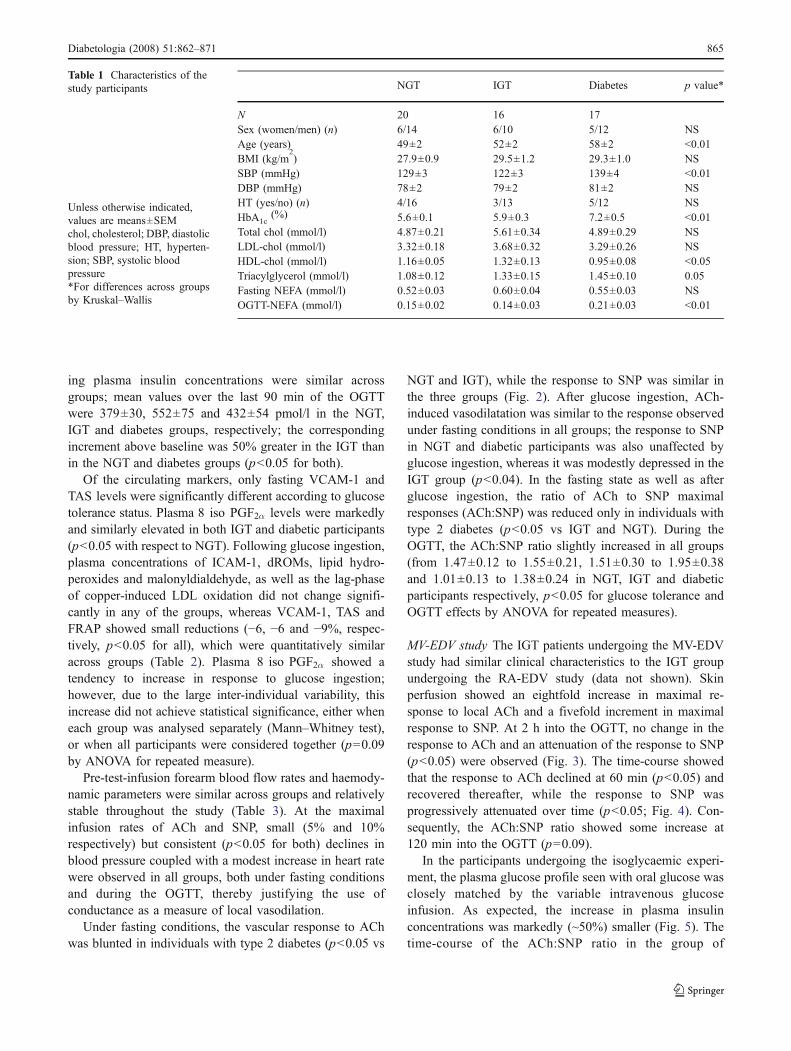
Table 1 Characteristics of thestudy participants
Unless otherwise indicated,values are means±SEMchol, cholesterol; DBP, diastolicblood pressure; HT, hyperten-sion; SBP, systolic bloodpressure*For differences across groupsby Kruskal–Wallis
NGT IGT Diabetes p value*
N 20 16 17Sex (women/men) (n) 6/14 6/10 5/12 NSAge (years) 49±2 52±2 58±2 <0.01BMI (kg/m
2) 27.9±0.9 29.5±1.2 29.3±1.0 NS
SBP (mmHg) 129±3 122±3 139±4 <0.01DBP (mmHg) 78±2 79±2 81±2 NSHT (yes/no) (n) 4/16 3/13 5/12 NSHbA1c
(%) 5.6±0.1 5.9±0.3 7.2±0.5 <0.01Total chol (mmol/l) 4.87±0.21 5.61±0.34 4.89±0.29 NSLDL-chol (mmol/l) 3.32±0.18 3.68±0.32 3.29±0.26 NSHDL-chol (mmol/l) 1.16±0.05 1.32±0.13 0.95±0.08 <0.05Triacylglycerol (mmol/l) 1.08±0.12 1.33±0.15 1.45±0.10 0.05Fasting NEFA (mmol/l) 0.52±0.03 0.60±0.04 0.55±0.03 NSOGTT-NEFA (mmol/l) 0.15±0.02 0.14±0.03 0.21±0.03 <0.01
Diabetologia (2008) 51:862–871 865
participants undergoing the two tests showed that the onlydifference between the two experimental conditions was theresponse at 120 min, at which time the improvement seenwith oral glucose was not observed during intravenousglucose administration (p<0.05).
Discussion
In participants with any degree of glucose tolerance, theacute hyperglycaemia and hyperinsulinaemia elicited byglucose ingestion induced a mild oxidative stress, as
reflected in the reduction of circulating antioxidants andthe tendency of plasma 8�iso�PGF2α to increase. Suchstress, however, did not impair EDV in resistance arteries orthe microcirculation, did not modify LDL resistance to invitro oxidation and did not increase the plasma concentra-tion of vascular adhesion molecules. Indeed, the ratio ofacetylcholine-mediated dilatation to SNP-mediated dilata-
Glu
cose
(m
mol
/l)In
sulin
(pm
ol/l)
Time (min)
Time (min)
∆ G
luco
se (
mm
ol/l)
∆ In
sulin
(pm
ol/l)
0
200
400
600
800
–100 –50 0 50 100 150 200
NGT IGT DM
0
100
200
300
400
500
NGT IGT DM
0.0
2.0
4.0
6.0
a
b
c d
0.0
4.0
8.0
12.0
16.0
–100 –50 0 50 100 150 200
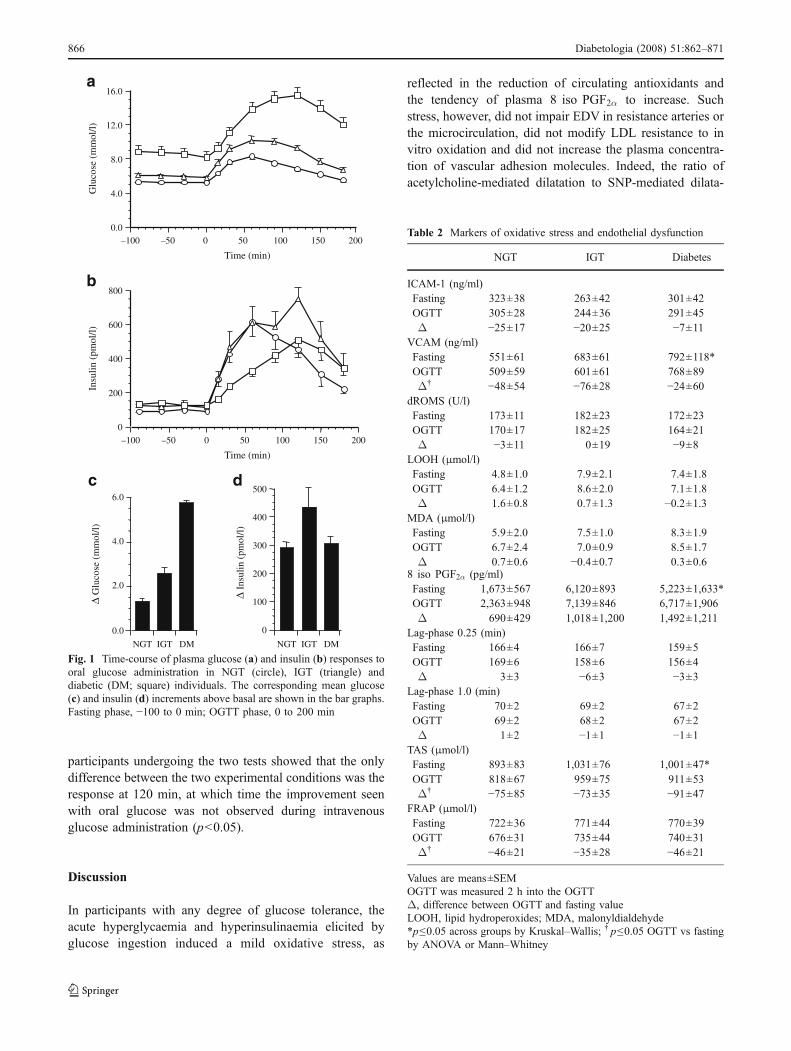
Fig. 1 Time-course of plasma glucose (a) and insulin (b) responses tooral glucose administration in NGT (circle), IGT (triangle) anddiabetic (DM; square) individuals. The corresponding mean glucose(c) and insulin (d) increments above basal are shown in the bar graphs.Fasting phase, −100 to 0 min; OGTT phase, 0 to 200 min
Table 2 Markers of oxidative stress and endothelial dysfunction
NGT IGT Diabetes
ICAM-1 (ng/ml)Fasting 323±38 263±42 301±42OGTT 305±28 244±36 291±45Δ −25±17 −20±25 −7±11
VCAM (ng/ml)Fasting 551±61 683±61 792±118*OGTT 509±59 601±61 768±89Δ† −48±54 −76±28 −24±60
dROMS (U/l)Fasting 173±11 182±23 172±23OGTT 170±17 182±25 164±21Δ −3±11 0±19 −9±8
LOOH (μmol/l)Fasting 4.8±1.0 7.9±2.1 7.4±1.8OGTT 6.4±1.2 8.6±2.0 7.1±1.8Δ 1.6±0.8 0.7±1.3 −0.2±1.3
MDA (μmol/l)Fasting 5.9±2.0 7.5±1.0 8.3±1.9OGTT 6.7±2.4 7.0±0.9 8.5±1.7Δ 0.7±0.6 −0.4±0.7 0.3±0.6
8�iso�PGF2α (pg/ml)Fasting 1,673±567 6,120±893 5,223±1,633*OGTT 2,363±948 7,139±846 6,717±1,906Δ 690±429 1,018±1,200 1,492±1,211
Lag-phase 0.25 (min)Fasting 166±4 166±7 159±5OGTT 169±6 158±6 156±4Δ 3±3 −6±3 −3±3
Lag-phase 1.0 (min)Fasting 70±2 69±2 67±2OGTT 69±2 68±2 67±2Δ 1±2 −1±1 −1±1
TAS (μmol/l)Fasting 893±83 1,031±76 1,001±47*OGTT 818±67 959±75 911±53Δ† −75±85 −73±35 −91±47
FRAP (μmol/l)Fasting 722±36 771±44 770±39OGTT 676±31 735±44 740±31Δ† −46±21 −35±28 −46±21
Values are means±SEMOGTT was measured 2 h into the OGTTΔ, difference between OGTT and fasting valueLOOH, lipid hydroperoxides; MDA, malonyldialdehyde*p≤0.05 across groups by Kruskal–Wallis; † p≤0.05 OGTT vs fastingby ANOVA or Mann–Whitney
866 Diabetologia (2008) 51:862–871
tion was consistently higher during glucose absorption thanin the fasting state in all patient groups, suggesting that theoverall effect of oral glucose ingestion on vascularreactivity was, if any, slightly favourable. Furthermore, thispattern of responses was essentially the same in the
resistance arteries of the forearm and in the microvasculatureof the skin, despite the structural and functional differencesbetween these two regions.
Further information was provided by the difference inresponses to acetylcholine and direct nitric oxide (NO)
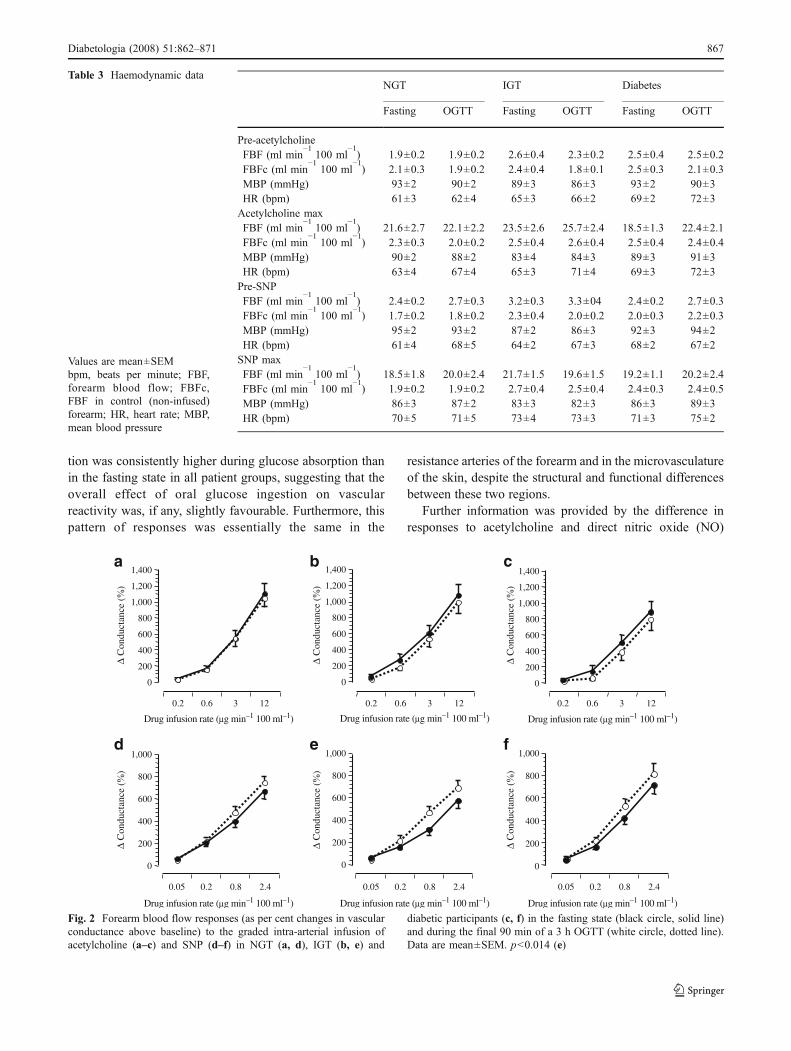
Table 3 Haemodynamic data
Values are mean±SEMbpm, beats per minute; FBF,forearm blood flow; FBFc,FBF in control (non-infused)forearm; HR, heart rate; MBP,mean blood pressure
NGT IGT Diabetes
Fasting OGTT Fasting OGTT Fasting OGTT
Pre-acetylcholineFBF (ml min
−1100 ml
−1) 1.9±0.2 1.9±0.2 2.6±0.4 2.3±0.2 2.5±0.4 2.5±0.2
FBFc (ml min−1
100 ml−1) 2.1±0.3 1.9±0.2 2.4±0.4 1.8±0.1 2.5±0.3 2.1±0.3
MBP (mmHg) 93±2 90±2 89±3 86±3 93±2 90±3HR (bpm) 61±3 62±4 65±3 66±2 69±2 72±3Acetylcholine maxFBF (ml min
−1100 ml
−1) 21.6±2.7 22.1±2.2 23.5±2.6 25.7±2.4 18.5±1.3 22.4±2.1
FBFc (ml min−1
100 ml−1) 2.3±0.3 2.0±0.2 2.5±0.4 2.6±0.4 2.5±0.4 2.4±0.4
MBP (mmHg) 90±2 88±2 83±4 84±3 89±3 91±3HR (bpm) 63±4 67±4 65±3 71±4 69±3 72±3Pre-SNPFBF (ml min
−1100 ml
−1) 2.4±0.2 2.7±0.3 3.2±0.3 3.3±04 2.4±0.2 2.7±0.3
FBFc (ml min−1
100 ml−1) 1.7±0.2 1.8±0.2 2.3±0.4 2.0±0.2 2.0±0.3 2.2±0.3
MBP (mmHg) 95±2 93±2 87±2 86±3 92±3 94±2HR (bpm) 61±4 68±5 64±2 67±3 68±2 67±2SNP maxFBF (ml min
−1100 ml
−1) 18.5±1.8 20.0±2.4 21.7±1.5 19.6±1.5 19.2±1.1 20.2±2.4
FBFc (ml min−1
100 ml−1) 1.9±0.2 1.9±0.2 2.7±0.4 2.5±0.4 2.4±0.3 2.4±0.5
MBP (mmHg) 86±3 87±2 83±3 82±3 86±3 89±3HR (bpm) 70±5 71±5 73±4 73±3 71±3 75±2
Drug infusion rate (µg min–1 100 ml–1)
Drug infusion rate (µg min–1 100 ml–1)
Drug infusion rate (µg min–1 100 ml–1)
Drug infusion rate (µg min–1 100 ml–1)
Drug infusion rate (µg min–1 100 ml–1)
Drug infusion rate (µg min–1 100 ml–1)
∆ C
ondu
ctan
ce (%
)
∆ C
ondu
ctan
ce (%
)∆
Con
duct
ance
(%
)
∆ C
ondu
ctan
ce (%
)∆
Con
duct
ance
(%
)
0.2 0.6 3 12 0.2 0.6 3 12 0.2 0.6 3 12
0
200
400
600
800
1,000
1,200
1,400
0.05 0.2 0.8 2.40.05 0.2 0.8 2.40.05 0.2 0.8 2.4
0
200
400
600
800
1,000
∆ C
ondu
ctan
ce (%
)
0
200
400
600
800
1,000
1,200
1,400
0
200
400
600
800
1,000
1,200
1,400
0
200
400
600
800
1,000
0
200
400
600
800
1,000
a b c
d e f
Fig. 2 Forearm blood flow responses (as per cent changes in vascularconductance above baseline) to the graded intra-arterial infusion ofacetylcholine (a–c) and SNP (d–f) in NGT (a, d), IGT (b, e) and
diabetic participants (c, f) in the fasting state (black circle, solid line)and during the final 90 min of a 3 h OGTT (white circle, dotted line).Data are mean±SEM. p<0.014 (e)
Diabetologia (2008) 51:862–871 867

supply (by SNP) and their time-course. In skin microvessels,the maximal response to ACh was only transiently reduced 1h after glucose ingestion, in phase with the glycaemic peak; itrecovered soon after (Fig. 4). In contrast, responses to SNP
tended to be lower after oral glucose than basally inresistance arteries (Fig. 2) and the skin (Fig. 3), and todecline over time in the skin subsequent to glucoseingestion (Fig. 4). When the glycaemic and insulinaemicstimuli were dissociated, as in the intravenous glucoseexperiment, the ACh:SNP ratio was significantly lowerwith intravenous than with oral glucose, but did not fallbelow its fasting value (Fig. 5). Therefore, we conclude thatphysiological (in size and time-course) changes in plasmaglucose and insulin concentrations exert opposite effects onthe EDV, with hyperinsulinaemia protecting against anyinhibitory action of glucose loading.
These results are consistent with in vitro evidence showingthat insulin stimulates NO release by endothelial cells [33]and with in vivo evidence showing that insulin potentiatesacetylcholine-induced vasodilatation in resistance arteries[27] and in both skin [28] and muscle [29] microcirculation.This specific effect, however, appears attenuated in insulin-resistant states [34], but we have previously shown that, inthese conditions [27], insulin can still improve the vascularresponse to ACh exploiting its hyperpolarising effect.Alternatively, insulin might lose its positive effect onacetylcholine-mediated vasodilatation, which is mainlydependent on endothelial NO synthase activation, but notthe ability to preserve the endothelial cell from the negativeconsequences of hyperglycaemia, which is known to actmainly through oxidative stress. In this regard, it isinteresting to note that a chronic improvement in metaboliccontrol did not modify the response to ACh, but restored theability of insulin to potentiate the vascular response to ACh[35]. Alternatively, insulin might favour EDV by loweringplasma concentrations of NEFA, a substrate that negativelyaffects EDV [36]. Interestingly, in this context, the largestOGTT-induced NEFA gradient was observed in IGTparticipants: 76% vs 68% in NGT and 62% in diabeticparticipants (p<0.01 by Kruskal–Wallis; Table 1).
Provided that we have evaluated only the spectrum ofglucose intolerance from normal to mild diabetes, ourresults do not support the hypothesis that acute physiolog-ical hyperglycaemia causes significant deterioration ofEDV. The well-established tenet that acute hyperglycaemiaimpairs endothelial function is mainly based on in vitrostudies using pharmacological (22 mmol/l or higher)concentrations of glucose [12, 13] without insulin or onex vivo studies using experimental animal models charac-terised by severe hyperglycaemia [14, 15, 37, 38]. Inhumans, support for this notion derives mostly from studiesusing the OGTT as the stimulus, and flow-mediateddilatation of large arteries as the index of endothelialfunction [23–25]. Rather surprisingly, the results of thesestudies are not consistent [17, 19] despite the fact thathyperinsulinaemia itself has been claimed to have aselective, major negative effect on this segment of the
1 32 4 5
1 32 4 5
0
200
400
600
800
1,000
∆ Pe
rfus
ion
(%)
∆ Pe
rfus
ion
(%)
a
0
200
400
600
800
Dose
Dose
b
*
Fig. 3 Dose–responses to acetylcholine (a) and SNP (b) mediatedvasodilatation in the skin microvasculature of IGT participants in thefasting state (black circle, solid line) and during the final 90 min of a 3h OGTT (white circle, dotted lines). *p<0.05
OGTT time (min)
OGTT time (min)
AC
h:SN
P
Fasting 60 120 1800
1
2
3
4
5
Fasting 60 120 180200
400
600
800
1,000
Max
res
pons
e (%
)
*
a
b
Fig. 4 Time-course of (a) maximal response to ACh (solid line) andSNP (dotted line). b Their ratio in the microvasculature of IGTparticipants before and during oral glucose administration. *p<0.05
868 Diabetologia (2008) 51:862–871

vascular tree [39, 40]. The evidence in resistance vessels isscarce [22, 41], comes from a single laboratory anddescribes an inhibitory effect that is small (ACh responsereduced by 20%), only detectable for unphysiologicaldegrees of hyperglycaemia (over 16 mmol/l) maintainedfor 6 h and effectively prevented by a very small gradient(35 pmol/l) of hyperinsulinaemia. Other laboratories havereached opposite conclusions. Houben et al. [16], with theuse of a very similar protocol (local hyperglycaemia ofabout 15 mmol/l), failed to find differences in forearmmicrovessel and resistance vessel reactivity to ACh, SNP,norepinephrine or NO synthase inhibition, despite extend-ing the study time to 24 h. More recently, Reed et al. [21],using a very elegant study design, also concluded that inhealthy participants, when the insulin response is prevented,neither 6 h of moderate hyperglycaemia (2 mmol/l abovefasting values) nor glycaemic excursions reproducingthe OGTT response of IGT patients are capable of de-pressing the forearm vascular response to ACh or SNP.Similar findings were reported by Strey et al. [20] andGudmundsson et al. [9], who measured the forearmvascular response before and after a mixed meal in healthyparticipants and before and after improvement of metaboliccontrol in patients with type 2 diabetes. Overall, thepublished evidence is congruent with our data, whichextend the concept of a balance between hyperglycaemiaand hyperinsulinaemia to the physiological domain, acrossglucose tolerance status and in different vascular districts.
Among the numerous mechanisms through which invitro hyperglycaemia impairs EDV, oxidative stress, bothdirect and indirect, appears to be the favoured one [42, 43].Our finding that oral glucose was associated with a smallreduction in the antioxidant capacity of the plasma confirmswhat has been reported by other laboratories [44, 45].However, as no simultaneous change in malonyldialdehyde,dROMS or lag-phase of LDL oxidisability was observed,the antioxidant response must have been sufficient to bufferthe free radical excess. Alternatively, as suggested by the
tendency of 8�iso�PGF2α (a more sensitive marker of lipidmembrane peroxidation) to increase in response to glucoseingestion, this specific oxidative stress might preferentiallyact upon targets and processes different from vascular NOavailability. The substantial integrity of the endotheliumafter oral glucose is further documented by the lack of anincrease in the shedding of these molecules into thecirculation as commonly observed when the endotheliumis activated in reaction to various harmful agents.
The observed negative impact of glucose loading onendothelium-independent vasodilatation, more evident inIGT (Fig. 2) and confirmed also in the skin microvascula-ture (Fig. 3), is unlikely to be due to hyperglycaemia itself,since the studies using either local or systemic hyper-glycaemia have not reported this effect. It may also beunrelated to hyperinsulinaemia, since neither isolated localhyperinsulinaemia [27] nor intravenous insulin infusion[21] have been shown to affect the vascular response toSNP; however, no study to date has evaluated this responseafter glucose ingestion. The smaller and less persistentdecline in maximal response to SNP observed whenglucose was given intravenously (fasting, 651±111; 60min, 510±88; 120 min, 545±90; 180 min, 671±121%) vsorally (fasting, 760±127; 60 min, 631±89; 120 min, 545±90; 180 min, 549±71%) suggests that factors related togastro-intestinal stimulation are involved.
The baseline reduction in EDV in patients with diabetesremains unexplained. Using the forearm technique, we havepreviously shown that EDV is reduced in diabetic patients inproportion to their degree of insulin resistance [46]. Insulinresistance, however, does not cluster with EDV in non-diabetic normotensive participants [47] or in patients withessential hypertension [48]. Therefore, we must postulatethat long-standing hyperglycaemia on its own or in inter-action with insulin resistance, directly or via accumulation ofAGE compromises endothelium-dependent vascular func-tions. A role for chronic dyslipidaemia or low-grade inflam-mation cannot be ruled out, but remains to be better defined.
Time (min)Time (min)
Insu
lin (
pmol
/l)
–60 0 60 120 1800
200
400
600
800
1,000
Glu
cose
(m
mol
/l)
–60 0 60 120 1804
6
8
10
12a b c
Time (min)
AC
h:SN
P
Fasting 60 120 1800
1
2
3
4
*
Fig. 5 a The plasma glucose and b insulin profiles of theisoglycaemic experiments. c Ratio of ACh to SNP-mediated vasodi-latation in the microvasculature of IGT participants. Oral glucose
administration (black circle, solid line); isoglycaemic intravenousglucose administration (white circle, dotted line). *p<0.05
Diabetologia (2008) 51:862–871 869
In conclusion, oral glucose does not impair EDV, eitherin resistance arteries or in the microcirculation, despiteincreased oxidative stress; the endogenous insulin responseis quantitatively responsible for countering any inhibitoryeffect on vascular function even in diabetic patients, inwhom EDV is compromised. Given the characteristics ofthe diabetic patients enrolled in this study, our conclusionscannot be extended to patients with a more severe disease, amore pronounced fasting and/or post-glucose hyperglycae-mia, and/or a more blunted insulin response. Furthermore,the sample size, the experimental design and the techniqueemployed prevented the detection of changes in resistancearteries EDV that were smaller than 20%, and also of anyshort-duration change occurring in the first 90 min of theOGTT. The results of the laser Doppler technique, althoughconsistent with plethysmography, cannot be directly ex-tended to resistance arteries EDV and are limited to IGTparticipants.
Acknowledgements We wish to thank S. Burchielli and S. Pinnolafor their technical assistance.
Duality of interest The authors declare that there is no duality ofinterest associated with this manuscript.
References
1. Ryden L, Standl E, Bartnik M et al (2007) Guidelines on diabetes,pre-diabetes, and cardiovascular diseases: executive summary: theTask Force on Diabetes and Cardiovascular Diseases of theEuropean Society of Cardiology (ESC) and of the EuropeanAssociation for the Study of Diabetes (EASD). Eur Heart J 28:88–136
2. Natali A, Vichi S, Landi P, Severi S, L'Abbate A, Ferrannini E(2000) Coronary atherosclerosis in Type II diabetes: angiographicfindings and clinical outcome. Diabetologia 43:632–641
3. Stettler C, Allemann S, Juni P et al (2006) Glycemic control andmacrovascular disease in types 1 and 2 diabetes mellitus: meta-analysis of randomized trials. Am Heart J 152:27–38
4. Ting H, Timimi F, Boles K, Creager S, Ganz P, Creager M (1996)Vitamin C improves endothelium-dependent vasodilatation inpatients with non-insulin-dependent diabetes mellitus. J ClinInvest 97:22–28
5. Williams S (1996) Impaired nitric oxide-mediated vasodilation inpatients with non-insulin-dependent diabetes mellitus. J Am CollCardiol 27:567–574
6. Nuttal S, Dunne F, Kendal M, Martin U (1999) Age-independentoxidative stress in elderly patients with non-insulin-dependentdiabetes mellitus. Q J Med 92:33–38
7. Pickup J, Mattock M, Chusney G, Burt D (1997) NIDDM as adisease of the innate immune system: association of acute-phasereactants and interleukin-6 with metabolic syndrome X. Diabeto-logia 41:1241–1248
8. Ceriello A (1998) The emerging role of post-prandial hyper-glycaemic spikes in the pathogenesis of diabetic complication.Diab Med 15:188–193
9. Gudmundsson G, Sinkey C, Chenard C, Stumbo P, Haynes W(2000) Resistance vessel endothelial function in healthy humansduring transient post prandial hypertryglyceridemia. Am J Cardiol85:381–385
10. Ceriello A, Giacomello R, Stel G et al (1995) Hyperglycemia-induced thrombin formation in diabetes. The possible role ofoxidative stress. Diabetes 44:924–931
11. Rodriguez-Manas L, Angulo J, Vallejo S et al (2003) Early andintermediate Amadori glycosylation adducts, oxidative stress, andendothelial dysfunction in the streptozotocin-induced diabetic ratsvasculature. Diabetologia 46:556–566
12. Tesfamariam B, Brown L, Cohen R (1991) Elevated glucoseimpairs endothelium-dependent relaxation by activating proteinkinase C. J Clin Invest 87:1643–1648
13. Du XL, Edelstein D, Dimmeler S, Ju Q, Sui C, Brownlee M(2001) Hyperglycemia inhibits endothelial nitric oxide synthaseactivity by posttranslational modification at the Akt site. J ClinInvest 108:1341–1348
14. Mayhan WG (1989) Impairment of endothelium-dependentdilatation of cerebral arterioles during diabetes mellitus. Am JPhysiol 256:H621–H625
15. Keegan A, Walbank H, Cotter MA, Cameron NE (1995) Chronicvitamin E treatment prevents defective endothelium-dependentrelaxation in diabetic rat aorta. Diabetologia 38:1475–1478
16. Houben AJ, Schaper NC, De Haan CHA et al (1996) Local 24-hhyperglycemia does not affect endothelium-dependent or -independentvasoreactivity in humans. Am J Physiol 270:H2014–H2019
17. Bagg W, Whalley GA, Sathu A, Gamble G, Sharpe N, BraatvedtGD (2000) The effect of acute hyperglycaemia on brachial arteryflow mediated dilatation in normal volunteers. Aust NZ J Med30:344–350
18. SarabiM, FugmannA,KarlstromB, Berne C, Lithell H, Lind L (2001)An ordinary mixed meal transiently impairs endothelium-dependentvasodilation in healthy subjects. Acta Physiol Scand 172:107–113
19. Siafarikas A, Watts K, Beye P, Jones TW, Davis EA, Green DJ(2004) Lack of effect of oral glucose loading on conduit vesselendothelial function in healthy subjects. Clin Sci (Lond) 107:191–196
20. Strey CH, Young J, Collier M, Florkowski CM, Shand BI, ScottRS (2004) The postprandial state does not impair endothelialfunction in women with type 2 diabetes irrespective of glycaemiccontrol. Diabetologia 47:1838–1846
21. Reed AS, Charkoudian N, Vella A, Shah P, Rizza RA, Joyner MJ(2004) Forearm vascular control during acute hyperglycemia inhealthy humans. Am J Physiol 286:E472–E480
22. Williams S, Goldfine A, Timimi F et al (1998) Acute hypergly-cemia attenuates endothelium-dependent vasodilation in humansin vivo. Circulation 97:1695–1701
23. Kawano H, Motoyama T, Hirashima O et al (1999) Hyperglyce-mia rapidly suppresses flow-mediated endothelium-dependentvasodilation of brachial artery. Am J Coll Cardiol 34:146–153
24. Title LM, Cummings PM, Giddens K, Nassar BA (2000) Oralglucose loading acutely attenuates endothelium-dependent vaso-dilation in healthy adults without diabetes: an effect prevented byvitamins C and E. J Am Coll Cardiol 36:2185–2191
25. Ceriello A, Taboga C, Tonutti L et al (2002) Evidence for anindependent and cumulative effect of postprandial hypertriglycer-idemia and hyperglycemia on endothelial dysfunction andoxidative stress generation: effects of short- and long-termsimvastatin treatment. Circulation 106:1211–1218
26. Marchesi S, Lupattelli G, Schillaci G et al (2000) Impaired flow-mediated vasoactivity during post-prandial phase in young healthymen. Atherosclerosis 153:397–402
27. Taddei S, Virdis A, Mattei P, Natali A, Ferrannini E, Salvetti A(1995) Effect of insulin on acetylcholine-induced vasodilation innormal subjects and in patients with essential hypertension.Circulation 92:2911–2918
870 Diabetologia (2008) 51:862–871
28. Serne EH, IJzermam RG, Gans RO et al (2002) Direct evidencefor insulin-induced capillary recruitment in skin of healthysubjects during physiological hyperinsulinemia. Diabetes 51:1515–1522
29. de Jongh RT, Clark AD, IJzermam RG, Serne EH, de Vries G,Stehouwer CD (2004) Physiological hyperinsulinaemia increasesintramuscular microvascular reactive hyperaemia and vasomotionin healthy volunteers. Diabetologia 47:978–986
30. Benzie I, Strain J (1996) The ferric reducing ability of the plasma(FRAP) as a measure of “antioxidant power”: the FRAP assay.Anal Biochem 15:70–76
31. Nourooz-Zadeh J, Tajaddin-Sarmadi J, Wolff SP (1994) Measure-ment of plasma hydroperoxide concentrations by the ferrousoxidation-xylenol orange assay in conjunction with triphenyl-phosphine. Anal Biochem 220:403–409
32. Baldi S, Frascerra S, Ferrannini E, Natali A (2007) LDL resistanceto oxidation: effects of lipid phenotype, autologous HDL andalanine. Clin Chim Acta 379:95–100
33. Zeng G, Nystrom FH, Ravichandran LV et al (2000) Roles forinsulin receptor, PI3-kinase, and Akt in insulin-signaling path-ways related to production of nitric oxide in human vascularendothelial cells. Circulation 101:1539–1545
34. de Jongh RT, Serne EH, IJzermam RG, de Vries G, Stehouwer CD(2004) Impaired microvascular function in obesity: implicationsfor obesity-associated microangiopathy, hypertension, and insulinresistance. Circulation 109:2529–2535
35. Rask-Madsen C, Ihlemann N, Krarup T et al (2001) Insulintherapy improves insulin-stimulated endothelial function inpatients with type 2 diabetes and ischemic heart disease. Diabetes50:2611–2618
36. Steinberg H, Tarshoby M, Monestel R et al (1997) Elevatedcirculating free fatty acid levels impair endothelium-dependentvasodilation. J Clin Invest 100:1230–1239
37. Pieper G, Siebeneich W, Moore-Hilton G, Roza A (1997)Reversal by L-arginine of a dysfunctional arginine-nitric oxidepathway in endothelium of the genetic diabetic BB rat. Diabetologia40:910–915
38. Meininger CJ, Marinos RS, Hatakeyama K et al (2000) Impairednitric oxide production in coronary endothelial cells of thespontaneously diabetic BB rat is due to tetrahydrobiopterindeficiency. Biochem J 349:353–356
39. Arcaro G, Cretti A, Balzano S et al (2002) Insulin causesendothelial dysfunction in humans: sites and mechanisms.Circulation 105:576–582
40. Campia U, Sullivan G, Bryant MB, Waclawiw MA, Quon MJ,Panza JA (2004) Insulin impairs endothelium-dependent vasodi-lation independent of insulin sensitivity or lipid profile. Am JPhysiol 286:H76–H82
41. Beckman J, Goldfine A, Gordon M, Creager M (2001) Ascorbaterestores endothelium-dependent vasodilatation impaired by acutehyperglycemia in humans. Circulation 103:1618–1623
42. Tesfamariam B (1994) Free radicals in diabetic endothelial celldysfunction. Free Radic Biol Med 16:383–391
43. Cosentino F, Hishikawa K, Katusic ZS, Luscher TF (1997) Highglucose increases nitric oxide synthase expression and superoxideanion generation in human aortic endothelial cells. Circulation96:25–28
44. Ceriello A, Bortolotti N, Crescentini A et al (1998) Antioxidantdefenses are reduced during oral glucose tolerance test in normaland non-insulin dependent diabetic subjects. Eur J Clin Invest28:329–334
45. Ma SW, Tomlinson B, Benzie IF (2005) A study of the effect oforal glucose loading on plasma oxidant:antioxidant balance innormal subjects. Eur J Nutr 44:250–254
46. Natali A, Toschi E, Baldeweg S et al (2006) Clustering of insulinresistance with vascular dysfunction and low-grade inflammationin type 2 diabetes. Diabetes 55:1133–1140
47. Utriainen T, Mäkimattila S, Virkamäki A, Bergholm R, Yki-Järvinen H (1996) Dissociation between insulin sensitivity ofglucose uptake and endothelial function in normal subjects.Diabetologia 39:1477–1482
48. Natali A, Taddei S, Quinones-Galvan A et al (1997) Insulinsensitivity, vascular reactivity, and clamp-induced vasodilatationin essential hypertension. Circulation 96:849–855
Diabetologia (2008) 51:862–871 871
Copyright © 2022 FDOKUMEN