EVALUATION OF BLOOD GLUCOSE LEVELS IN UNDER
96
1 EVALUATION OF BLOOD GLUCOSE LEVELS IN UNDER- FIVES PRESENTING AT THE EMERGENCY PAEDIATRIC UNIT OF FEDERAL MEDICAL CENTRE, OWERRI. DISSERTATION SUBMITTED TO THE NATIONAL POST GRADUATE MEDICAL COLLEGE OF NIGERIA, IN PART FULFILMENT OF THE REQUIREMENT FOR THE AWARD OF FELLOWSHIP OF THE COLLEGE IN PAEDIATRICS BY DR OSUJI, AUGUSTINE EMEKA MBBS 2008 (ABSU) MAY 2017
-
Upload
khangminh22 -
Category
Documents
-
view
2 -
download
0
Transcript of EVALUATION OF BLOOD GLUCOSE LEVELS IN UNDER

1
EVALUATION OF BLOOD GLUCOSE LEVELS IN UNDER-
FIVES PRESENTING AT THE EMERGENCY PAEDIATRIC
UNIT OF FEDERAL MEDICAL CENTRE, OWERRI.
DISSERTATION SUBMITTED TO THE NATIONAL POST
GRADUATE MEDICAL COLLEGE OF NIGERIA, IN PART
FULFILMENT OF THE REQUIREMENT FOR THE AWARD OF
FELLOWSHIP OF THE COLLEGE IN PAEDIATRICS
BY
DR OSUJI, AUGUSTINE EMEKA
MBBS 2008 (ABSU)
MAY 2017
2
DECLARATION
It is hereby declared that this work is original unless otherwise acknowledged. It has not been
presented to any other College for a Fellowship, nor has it been submitted elsewhere for
publication. There is no conflict of interest as study was completely self-sponsored and all
equipment and materials were purchased from the open market.
DR OSUJI A.E.
3
CERTIFICATION
The study reported in this dissertation was done by Dr Osuji Augustine Emeka of the
Department of Paediatrics, Federal Medical Centre Owerri under our supervision. We have also
supervised the writing of the dissertation.
………………………………………………………………………………………
Dr. F.U. IREGBU
Consultant Paediatrician
Federal Medical Centre (FMC)
Owerri.
………………………………………………………………………………………….
PROFESSOR O.F. NJOKANMA
Consultant Paediatrcian
Lagos State University Teaching Hospital (LASUTH),
Lagos.
4
TABLE OF CONTENTS
PAGE
Declaration i
Certification ii
Table of contents iii
Dedication v
Acknowledgement vi
List of Abbreviations vii
List of figures viii
List of tables ix
Definition of terms x
Summary xi
Introduction 1
Justification 3
Research questions 5
Literature Review 6
Aim and Objectives 28
Patients and Methods 29
Results 43
Discussion 57
Conclusion 63
Recommendations 64
Limitation 65
Lines of Future Research 66

5
References 67
Appendices 78
6
DEDICATION
This work is dedicated to my beloved Aunty, late Mrs. Echefu Emilia, whose contribution to my
life is immeasurable.
7
ACKNOWLEDGEMENTS
My immense gratitude goes to my supervisors, Professor O.F. Njokanma and Dr. F.U. Iregbu
for their patience and availability throughout the study period. I owe gratitude to the entire
members of Paediatrics Department of Federal Medical Centre (FMC) Owerri. I thank all the
consultants especially Dr E.C. Nwolisa and Dr Nathan Nwokeforo for their mentorship.
I want to thank the registrars and house officers in the emergency room as well as the research
assistants who helped me with sample collection when I was not on call. My thanks also go to
the laboratory scientist Mr. Ezekwesili Cletus who assisted me in laboratory analysis. I also want
to thank Dr Benedict Nwogoh, Dr Ifeoma Ejelonu and Dr Franklin Emerenini for their assistance
in data analysis. Finally, I want to thank the parents/caregivers and the children who participated
in the study.
THANK YOU ALL

8
LIST OF ABBREVIATIONS
AIDS Acquired Immune Deficiency Syndrome
DFLM Duration From Last Meal
DOI Duration Of Illness
EPU Emergency Paediatric Unit
FMC Federal Medical Centre
GCBG Glucometer Capillary Blood Glucose
GVBG Glucometer Venous Blood Glucose
HIV Human Immunodeficiency Virus
IMCI Integrated Management of Childhood Illnesses
IMSUTH Imo State University Teaching Hospital
LabBG Laboratory Blood Glucose
NPV Negative Predictive Value
NADP Nicotinamide Adenine Dinucleotide
OSUTH Osun State University Teaching Hospital
PPV Positive Predictive Value
PEM Protein Energy Malnutrition
SD Standard Deviation
SPSS Statistical Package for Social Sciences
TCA Tricarboxylic Acid cycle
UBTH University of Benin Teaching Hospital
UCTH University of Calabar Teaching Hospital
UPTH University of Port Harcourt Teaching Hospital
χ2 chi Square

9
LIST OF FIGURES
Figures Page
1. A Ring Chain form of D-glucose 7
2. Metabolic Pathways involved in glucose metabolism 9
3. A pathway showing the hormonal control of glucose 12

10
LIST OF TABLES
Table Page
I Gender and Socioeconomic Status of subjects 44
II Frequency of occurrence of clinical diagnosis in the children studied 45
III Mean, median and Ranges of Random Blood glucose 46
IV Comparison of mean blood glucose from One-Touch Glucometer
And laboratory analysis 47
V Correlation among, GCBG, GVBG and LabBG 48
VI Correlations between Blood Glucose estimation and Duration of illness and
Duration from last meal 49
VII False negative, true negative, false positive and true positive readings
by the glucometer for hypoglycaemic patients 51
VIII Sensitivity, Specificity and predictive values of GCBG and GVBG
using glucometer to laboratory method 52
IX Risk factors for hypoglycaemia 54
X Association between Patient Clinical Features and Treatment Outcome 55
XI Association between specific diagnosis and Hypoglycaemia 56
11
DEFINITION OF TERMS
Hypoglycaemia: This is currently defined as plasma glucose value less than 2.6mmol/L
(47mg/dl).3,4
Gastroenteritis: This is as the inflammation of the gastrointestinal
tracthttps://en.wikipedia.org/wiki/Human_gastrointestinal_tract that involves the stomach and small
intestines.110:
Sepsis: This is defined as proven infection or a conglomeration of clinical symptoms/signs and
laboratory findings associated with high probability of infection. Such findings include fever,
hypothermia, tachycardia, tachypnea, localized inflammatory signs, leukocytosis, leukopaenia
and high band neutrophil count.111
Severe sepsis: sepsis plus one of the following:
1. Cardiovascular organ dysfunction.
2. Acute respiratory distress syndrome.
OR sepsis plus two or more organ dysfunctions (respiratory, renal, haematologic or hepatic)
Septic shock: Sepsis plus cardiovascular organ dysfunction.111

12
SUMMARY
Hypoglycaemia is known to complicate many childhood illnesses. It also contributes
significantly to morbidity and mortality. Early diagnosis and treatment are necessary to avoid the
complications.
This study sought to evaluate the prevalence, clinical diagnoses and risk factors associated with
hypoglycaemia at the point of admission into the Emergency Paediatric Unit (EPU) of Federal
Medical Centre (FMC) Owerri. Blood glucose levels obtained with glucometer were compared
to standard laboratory values. Also compared were values obtained from venous blood with
those of capillary blood using the One-Touch Ultra 2® glucometer.
Four hundred children aged one to 59 months admitted consecutively into the EPU of FMC
participated in the study. Blood glucose was analyzed using the glucometer and standard
laboratory techniques. Glucometer analysis for each patient was done using samples from venous
blood as well as from capillary blood. Hypoglycaemia was defined as blood glucose <2.6mmol/L
(47mg/dl).
The subjects included 232 (58%) males and 168 (42%) females with a mean age of 16.9 ± 15.1
months and a median of 12 months. The mean (range) of blood glucose using the glucose
oxidase method was 106 ±53.3 mg/dl (20mg/dl to 461mg/dl). The mean blood glucose using the
13
venous and capillary blood were 110.5 ± 55.7 and 112.5 ± 56.9 respectively. Using the values
from laboratory method, 30 (7.5%) patients were hypoglycaemic. Twenty six (6.5%) patients
were hypoglycaemic by capillary blood and 28 (7.0%) using venous blood. There was a
significant positive correlation between capillary blood glucose and venous blood glucose
estimations (r=0.981, p < 0.001). Similarly, there were significant positive correlations between
capillary and laboratory readings (r = 0.906, p < 0.001) and also between venous and laboratory
readings (r = 0.925, p < 0.001). The sensitivity of capillary and venous blood glucose
measurements relative to the laboratory method was 86.7% and 93.3% respectively. Both
capillary and venous readings had 100% specificity and high positive predictive values for
detecting hypoglycaemia. Protein energy malnutrition, sepsis, gastroenteritis, meningitis and
malaria were the predominant diagnoses associated with hypoglycaemia. Significant risk factors
associated with hypoglycaemia include age < 12 months (χ2 =5.05, p = 0.025) and low
socioeconomic status (χ2 = 9.279, p = 0.002). Hypoglycaemia was significantly associated with
increased mortality (χ2 = 18.488; p < 0.001).
The prevalence of hypoglycaemia in the emergency room dictates the maintenance of a high
index of suspicion, moreso in younger children and those from low socioeconomic classes.
Patients presenting with protein energy malnutrition, suspected sepsis, gastroenteritis, meningitis
or malaria should also receive extra attention. The point of care tool (glucometer) used in the
study produced sufficiently high sensitivity, specificity, positive predictive and negative
predictive values to merit its recommendation for routine use.
14
INTRODUCTION
Glucose is the primary fuel for cellular metabolism.1 Adequate supplies are therefore necessary
to maintain health.2 Hypoglycaemia implies low blood glucose levels and is currently defined as
plasma glucose value less than 2.6mmol/L (47mg/dl).3,4 It is a manifestation of an underlying
abnormality, which is usually related to poor availability, or excessive utilization of glucose in
the body.1 The prevalence of hypoglycaemia in children admitted to the hospital after the
neonatal period ranges between 3.2% to 7.3% in developing countries.5-8
Risk factors for hypoglycaemia include food restriction as usually seen in patients with
diarrhoea because mothers erroneously fear that diarrhoea may worsen with feeding.7 Long
intervals between feeds of up to twelve hours, severe illnesses and age less than five years are
also risk factors.5-7 Diseases like malaria, septicaemia, malnutrition, meningitis and diarrhoea in
developing countries have been associated with hypoglycaemia in childhood.5-7,9,10 In
Southwestern Nigeria, the use of cow’s urine concoction in convulsing patients has been
associated with hypoglycaemia.11
Hypoglycaemia is usually asymptomatic, but symptoms like sweating, jitteriness, anxiety,
nervousness, headache, visual impairment, lethargy, restlessness, mental confusion and
convulsion may occur.12 Long term neurological sequelae like mental retardation, cognitive
dysfunction, recurrent seizures and varying degrees of personality disorders may result from
hypoglycaemia.13-15 The incidences of these sequelae range from 15% to 51%.16 It has been
documented that the mortality associated with hypoglycaemia in hospitalized patients is between

15
20% and 30% in treated patients with hypoglycaemia and up to 100% in untreated
hypoglycaemic patients.5,7 Reliance on symptoms to make a diagnosis may therefore result in
missed diagnosis since symptoms do not usually occur. In order to avoid missed diagnosis and
attendant consequences, deliberate efforts must be made to detect the presence of hypoglycaemia
in acutely ill children presenting to emergency units.17,18
Blood glucose can be estimated in the laboratory using the glucose oxidase method, estimated
with a glucometer using venous or capillary blood. Laboratory analysis of blood glucose is the
gold standard but its use is restricted by poor electricity and water supply obtainable in low-
income economies like Nigeria because laboratory estimation of blood glucose requires constant
electricity and water supply which are not readily available in most health facilities. On the other
hand, point-of-care glucometers provide instant results without the need for electricity supply
and water for washing equipment. Glucometers utilize venous or capillary blood thus providing
options for the clinician.
The prevalence of hypoglycaemia in children aged 1-59 months in Owerri is not known and it is
equally uncertain the clinical conditions associated with hypoglycaemia in these children. It may
be useful to compare blood glucose values obtained by the glucose oxidase method and those
derived through the use of glucometers.
The purpose of the study is to determine the prevalence of and clinical conditions associated
with hypoglycaemia in children aged one to 59 months admitted to the Emergency Paediatric
Unit of Federal Medical Centre Owerri and to compare results from laboratory analysis with
those obtained using point-of-care glucometers.
16
JUSTIFICATION
Hypoglycaemia is common in ill children presenting to emergency units with illnesses like
severe malaria, sepsis, and severe bronchopneumonia.5,19 However, many affected children do
not manifest with symptoms referable to hypoglycaemia and as such, the diagnosis may be
missed.19,20 The presence of hypoglycaemia complicates these illnesses with significant negative
outcome of morbidity or mortality.5,13,15
Estimation of blood glucose is thus an important part of the evaluation of sick children
presenting in the emergency room. This can be done by laboratory analysis21,22 or by using point-
of-care (bedside) glucometers.23-25 The need for urgent and prompt intervention in cases of
hypoglycaemia favours the use of glucometers because of the ease with which results are
obtained. The advantages of rapidity increase when there is a need for repeated analysis. Added
to this, is the non-reliance on manpower and electricity supply. Thus prompt determination as
facilitated by bedside test, improves the chances of early intervention and hence improved
outcome.22
The yearly admission rate into the Emergency Paediatric Unit of Federal Medical Centre Owerri
is about two thousand four hundred and eighty. The prevalence of hypoglycaemia in hospitalized
children in Africa ranges between 3.2% and 7.3%7,8 while in Nigeria, the prevalence is about
6.4%. The prevalence of hypoglycaemia could as well be high in the Emergency Paediatric Unit
of Federal Medical Centre Owerri. This study was designed to find out the exact prevalence in
the centre.
17
Despite the stated advantages, laboratory determination of blood glucose remains the gold
standard for determination of blood glucose. It may be important to assess the performances of
other methods like the glucometers against the standard laboratory method. Also, it may be
important to evaluate the concordance of results obtained using venous and capillary blood.
18
RESEARCH QUESTIONS
1. What is the prevalence of hypoglycaemia in children aged one to 59 months admitted
into the Emergency Paediatric Unit of Federal Medical Centre Owerri?
2. What are the clinical diagnoses commonly associated with hypoglycaemia?
3. What are the probable risk factors associated with hypoglycaemia?
4. Is there any comparison between plasma glucose values obtained with use of glucometer
and standard laboratory measurements using glucose oxidase method?
5. Is there any comparison between glucose values obtained using venous blood and those
from capillary blood using glucometer?
19
LITERATURE REVIEW
BACKGROUND
Glucose is the major free sugar circulating in the blood of higher animals.26 It is the preferred
fuel of the brain. Glucose is a monosaccharide with the chemical formula C6H12O6. It is found in
the nervous system, as well as red blood cells (erythrocytes).26
As a universal substrate (a molecule upon which an enzyme acts) for the production of cellular
energy, glucose is of central importance in the metabolism of all life forms. It is one of the main
products of photosynthesis, the process by which photoautotrophs such as plants and algae
convert energy from sunlight into potential chemical energy to be used by the cell. Glucose is
also a major starting point for cellular respiration, in which the chemical bonds of energy-rich
molecules are converted into energy usable for life processes.22,26
Glucose stands out as a striking example of the complex interplay between plants and animals:
the plant converts solar energy into glucose molecule, and then to more complex forms (starch or
cellulose) that is eaten by animals, which recover the original glucose units, deliver it to their
cells, and eventually use that stored solar energy for their own metabolism. Milk cows, for
example, graze on grass as a source of cellulose, which they break down to glucose using their
four-chambered stomachs. Some of that glucose then goes into the milk we drink.13,26
20
All major dietary carbohydrates contain glucose, either as their only building block, or in
combination with another monosaccharide, as in sucrose (“table sugar”) and lactose, the primary
sugar found in milk.13,22,26
As glucose is vital for the human body and for the brain, it is important to maintain constant
blood glucose levels.
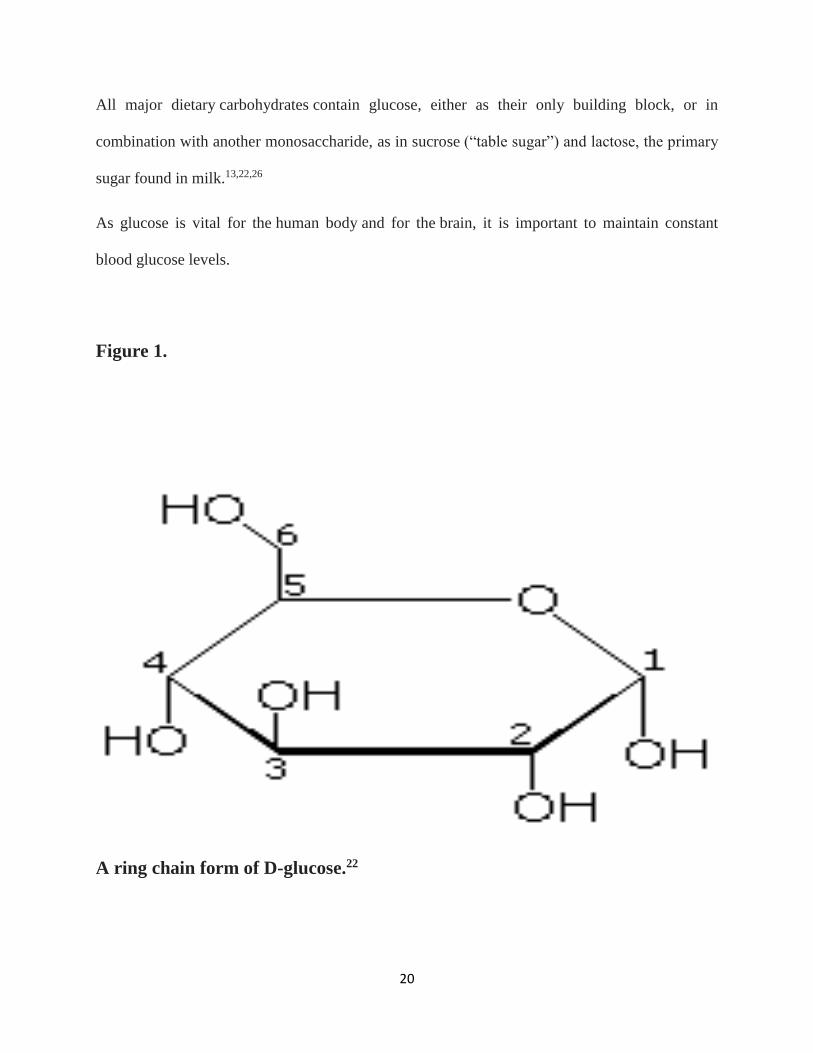
Figure 1.
A ring chain form of D-glucose.22

21
GLUCOSE METABOLISM
The metabolism of the sugar glucose is one of the central metabolic processes in the body.26,27 It
serves to generate energy for the body, as well as provide starting materials for other metabolic
pathways (e.g., the production of nucleic acids, fatty acids, and neurotransmitters).27 In addition,
other metabolic pathways also feed into the reactions that occur during glucose metabolism,
further emphasizing the central roles that the reactions involved in glucose metabolism play in
ensuring the body's functioning and well-being.22,27,28
Glucose metabolism can proceed along several alternative pathways, depending on the body's
needs at the time. The following are three main sets of reactions associated with glucose
metabolism.28
Glycolysis, the citric acid cycle; and the pentose phosphate pathway
During glycolysis, glucose is converted in several reactions into a molecule called pyruvate,
which can be either metabolized further into lactate, that is then transported out of the cell, or
which stays in the cell. Pyruvate is converted (through the actions of the thiamine-dependent
enzyme pyruvate dehydrogenase) into a molecule called acetyl-CoA, which can then be fed into
the second set of reactions, the citric acid cycle (also known as the tricarboxylic acid [TCA]
cycle). Alternatively, acetyl-CoA may serve as a precursor for fatty acid synthesis.28

22
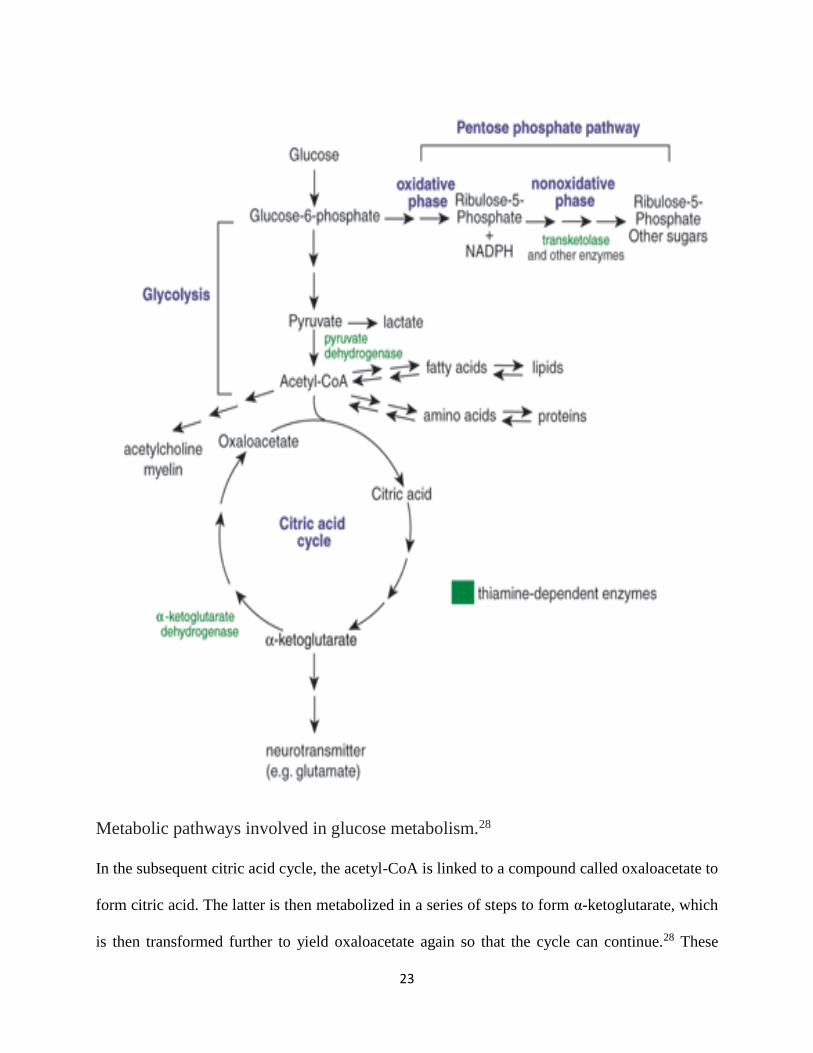
Figure 2
23
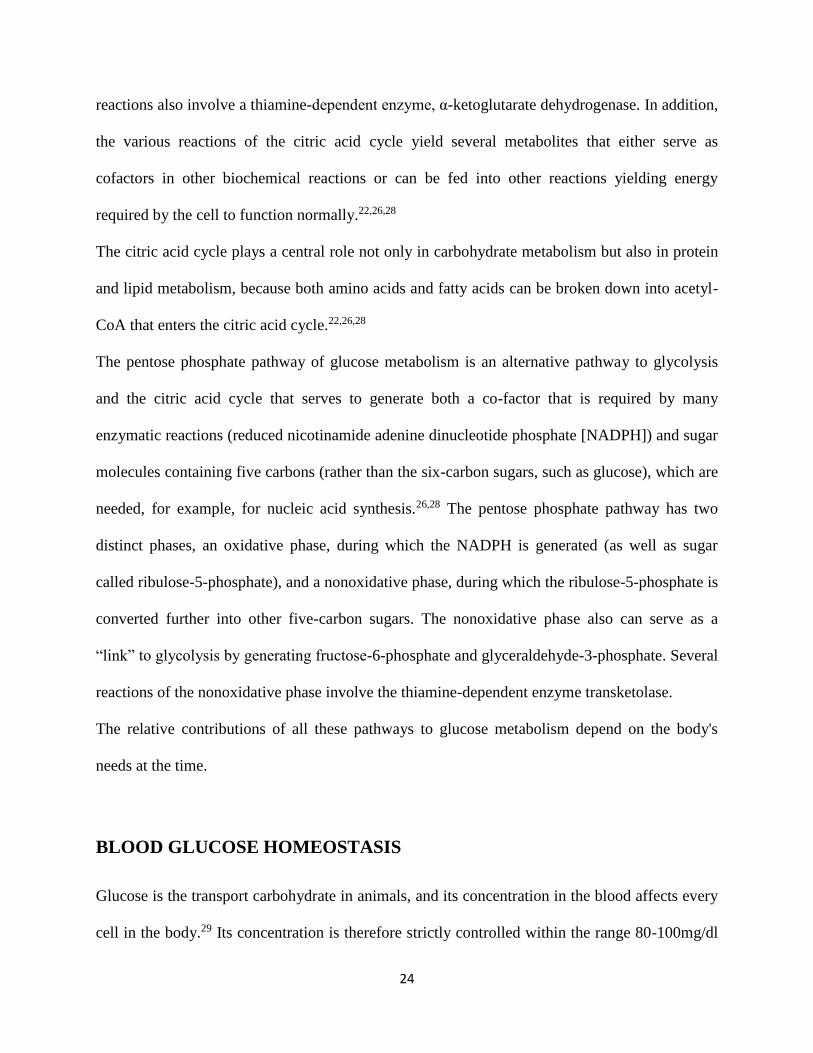
Metabolic pathways involved in glucose metabolism.28
In the subsequent citric acid cycle, the acetyl-CoA is linked to a compound called oxaloacetate to
form citric acid. The latter is then metabolized in a series of steps to form α-ketoglutarate, which
is then transformed further to yield oxaloacetate again so that the cycle can continue.28 These
24
reactions also involve a thiamine-dependent enzyme, α-ketoglutarate dehydrogenase. In addition,
the various reactions of the citric acid cycle yield several metabolites that either serve as
cofactors in other biochemical reactions or can be fed into other reactions yielding energy
required by the cell to function normally.22,26,28
The citric acid cycle plays a central role not only in carbohydrate metabolism but also in protein
and lipid metabolism, because both amino acids and fatty acids can be broken down into acetyl-
CoA that enters the citric acid cycle.22,26,28
The pentose phosphate pathway of glucose metabolism is an alternative pathway to glycolysis
and the citric acid cycle that serves to generate both a co-factor that is required by many
enzymatic reactions (reduced nicotinamide adenine dinucleotide phosphate [NADPH]) and sugar
molecules containing five carbons (rather than the six-carbon sugars, such as glucose), which are
needed, for example, for nucleic acid synthesis.26,28 The pentose phosphate pathway has two
distinct phases, an oxidative phase, during which the NADPH is generated (as well as sugar
called ribulose-5-phosphate), and a nonoxidative phase, during which the ribulose-5-phosphate is
converted further into other five-carbon sugars. The nonoxidative phase also can serve as a
“link” to glycolysis by generating fructose-6-phosphate and glyceraldehyde-3-phosphate. Several
reactions of the nonoxidative phase involve the thiamine-dependent enzyme transketolase.
The relative contributions of all these pathways to glucose metabolism depend on the body's
needs at the time.
BLOOD GLUCOSE HOMEOSTASIS
Glucose is the transport carbohydrate in animals, and its concentration in the blood affects every
cell in the body.29 Its concentration is therefore strictly controlled within the range 80-100mg/dl
25
of blood, and very low levels (hypoglycaemia) or very high levels (hyperglycaemia) are both
serious and can lead to complications.30,31
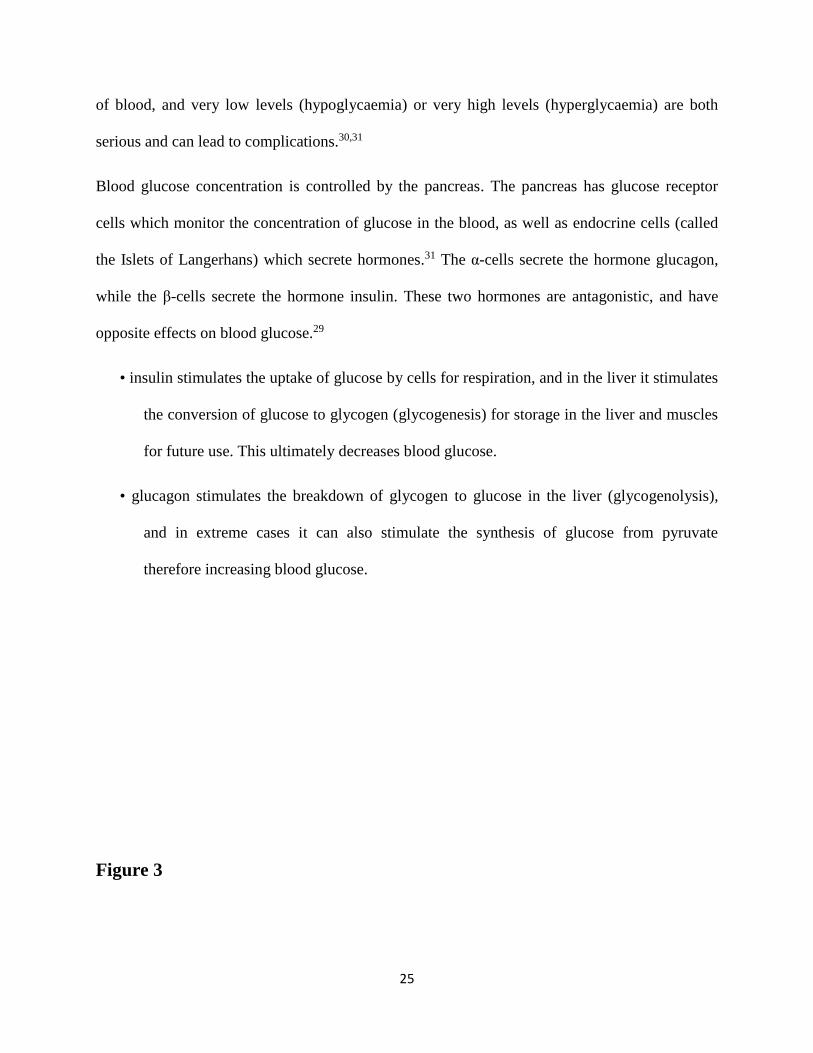
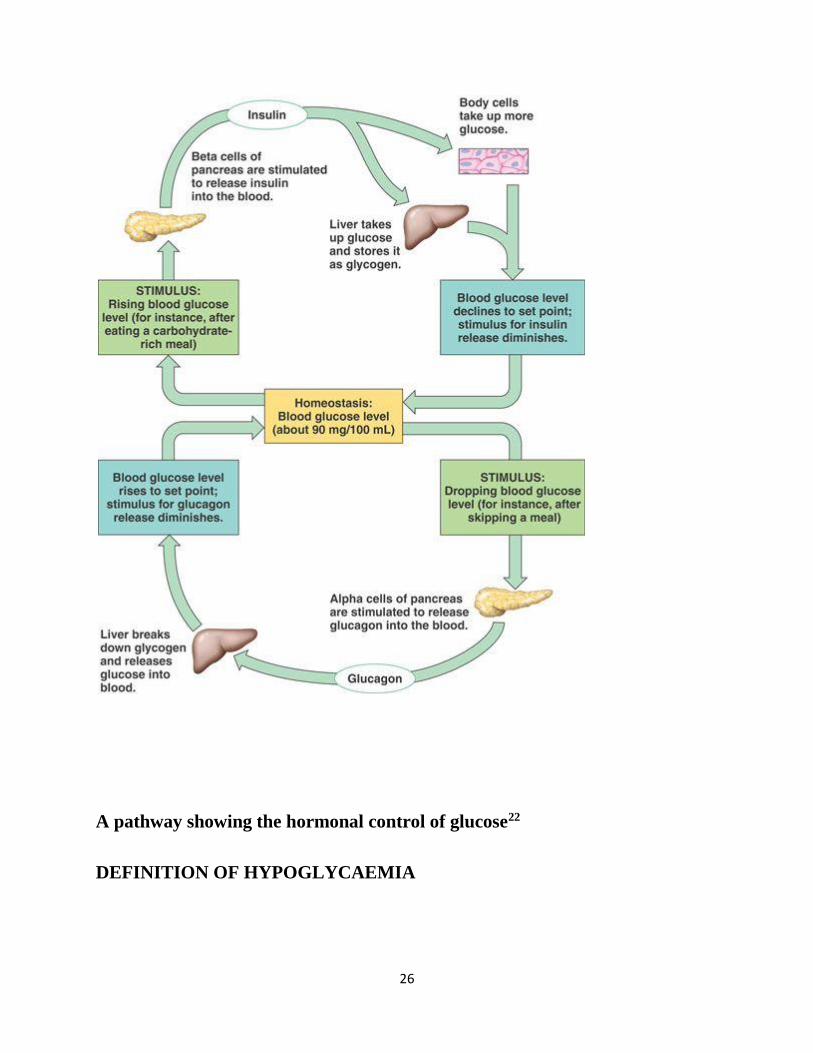
Blood glucose concentration is controlled by the pancreas. The pancreas has glucose receptor
cells which monitor the concentration of glucose in the blood, as well as endocrine cells (called
the Islets of Langerhans) which secrete hormones.31 The α-cells secrete the hormone glucagon,
while the β-cells secrete the hormone insulin. These two hormones are antagonistic, and have
opposite effects on blood glucose.29
• insulin stimulates the uptake of glucose by cells for respiration, and in the liver it stimulates
the conversion of glucose to glycogen (glycogenesis) for storage in the liver and muscles
for future use. This ultimately decreases blood glucose.
• glucagon stimulates the breakdown of glycogen to glucose in the liver (glycogenolysis),
and in extreme cases it can also stimulate the synthesis of glucose from pyruvate
therefore increasing blood glucose.
Figure 3
26
A pathway showing the hormonal control of glucose22
DEFINITION OF HYPOGLYCAEMIA
27
Glucose is the principal substrate for cerebral metabolism.32 It is the most important carbohydrate
for human energy needs with the bulk of carbohydrate being absorbed and used in this form.33
Hypoglycaemia is the most common metabolic problem in critically ill children.34-36
Hypoglycaemia means blood glucose level below normal. There has been a lot of controversies
on the cut off for normal blood glucose level. Older definitions of hypoglycaemia were from
population-based studies that resulted in cut off levels of blood glucose of 20mg/dl and 30 mg/dl
for preterm and term infants respectively.37
Previous definitions factored in age of the patients whereby hypoglycaemia was defined as blood
glucose levels below 1.1mmol/l (20mg/dl) for infants with birth weight below 2,500grammes,
1.7mmol/l (30mg/dl) for normal birth weight infants in the first 72 hours and 2.2mmol/l
(40mg/dl) thereafter.38 Most studies on hypoglycaemia available in the literature are based on
these cut-off values.10,18,33,39 However, these definitions have been abandoned as a result of the
adverse consequences associated with blood sugar level below 2.2mmol/l(40mg/dl) in children
irrespective of weight or postnatal age. There is no evidence that lower postnatal weight confers
any special protection against the consequences of low blood sugar.40
Hypoglycaemia is currently defined as plasma blood glucose concentration below 2.6mmol/L
(47mg/dl) in any age group. This recently proposed definition of hypoglycaemia as a corrected
blood glucose value of less than 2.6mmol/l(47mg/dl )41,42 has become acceptable to several
workers.32,42,43
PREVALENCE OF HYPOGLYCAEMIA IN CHILDREN

28
The prevalence of hypoglycaemia clearly varies with definition chosen, the population studied,
method and timing of feeding and the type of glucose assay utilized44 as well as the pattern of
care. Studies show reduced incidence with increasing age.1,45 In the neonatal period, prevalence
ranges from 9.5 to 38%.22,46,47 Out of 304 neonates studied in the University of Port Harcourt
Teaching Hospital (UPTH)21 between January and May 2006, 86 (28%) were found to be
hypoglycaemic at birth. This gave a prevalence of 28.3%. This study was done in the labour
ward where cord blood specimen were taken from placental end of the cord at delivery and
assayed for plasma glucose. Hypoglycaemia was defined as cord blood glucose level below
2.2mmol/l(40mg/dl).20 A study in Ogun State University Teaching Hospital (OSUTH) Sagamu
in 1994 by Njokanma and Fagbule47 reported an incidence of 9.5% among 675 admitted
newborns. For the study, hypoglycaemia was defined as blood glucose level below 2.2mmol/l.
The OSUTH47 study reported a highest prevalence of 25.8% in babies of gestational age below
32weeks. This was similar to the findings in the Port Harcourt study21 which reported a
prevalence of 29.1% among preterm neonates and 27.9% in low birth weight babies. In an earlier
study at the University of Benin Teaching Hospital (UBTH), Benin City in 1977, Omene19 had
reported an incidence of 6.6% for neonatal hypoglycaemia, with an incidence of 7.9% in low
birth weight babies. This Benin study used an earlier definition of hypoglycaemia as blood sugar
level of 20mg/dl for preterm, 30mg/dl for term infants in the first 72 hours of life and 40mg/dl
thereafter according to Cornblath and Schwartz.3 The lower cut-off levels may account for the
lower incidence reported in the study by Omene.19
The prevalence of hypoglycaemia after the neonatal period was found to be 6.4% among 392
patients by Elusiyan et al5 in 2006. This study was carried out in Paediatric Emergency Ward of
Obafemi Awolowo University Teaching Hospital Ile-Ife. Hypoglycaemia was defined as plasma

29
glucose concentration below 2.5mmol/L. Malaria, septicaemia, pneumonia and protein energy
malnutrition were the leading diagnoses associated with hypoglycaemia in this study. In an
observational study done in Kenya by Osier et al7 in 2003, a prevalence of 7.3% was recorded in
3214 children beyond the neonatal period. Hypoglycaemia was defined as blood glucose
concentration below 2.2mmol/L and severe illness, malnutrition, last meal taken more than 12
hours before evaluation and positive malaria slide were independently associated with
hypoglycaemia. The large sample size and the fact that this study was done in a rural area might
have accounted for the higher prevalence compared to the study by Elusiyan et al.5 This is so
because children in the rural areas are more prone to malnutrition and more likely to present late
for care. The findings in the Ife study by Elusiyan et al5 are comparable to the study by Solomon
et al6 in Mozambique which observed a prevalence of 7.1% in 603 children. The leading cause of
hypoglycaemia in children was malaria. Hypoglycaemia was also found to complicate protein-
energy malnutrition, pneumonia, encephalitis, intestinal parasite infection and nephritic
syndrome.6
The prevalence of hypoglycaemia in specific disease conditions have been studied by some
authors. A study in children with diarrhoea by Bhattacharya et al48 in Calcutta, India done over a
two month period reported a prevalence of 40%. Only 10 out of 79 children that had acute
watery diarrhea were screened and 4 had hypoglycaemia. The small sample size might have
accounted for the high prevalence rate reported. The short duration of the study could also
account for the high prevalence. Onyiriuka et al49 at St Philomena Catholic Hospital, Benin City,
Nigeria reported a prevalence of 7.7% among 183 children aged one month to 59 months who
presented with acute diarrhoea. In 2012, Ntia et al50 in University of Calabar Teaching Hospital
(UCTH), Calabar reported a prevalence of 4% among 150 under-five children presenting with
30
acute watery diarrhoea. This difference in prevalence between the two studies could have been as
a result of the definition of hypoglycaemia used. The Benin study defined hypoglycaemia as
blood glucose levels below 2.6mg/dl in contrast to the Calabar study that used cut off level of
2.2mg/dl and this may explain why Onyiriuka et al49 in Benin reported a higher prevalence.
The prevalence of hypoglycaemia has also been studied in specific disease conditions like
malaria. In a prospective study done in Benin City by Onyiriuka et al51 in 2012, 92 out of 502
children below five years of age that had malaria (18%) were found to be hypoglycaemic. The
cut-off blood glucose level adopted was 2.6mmol/l (47mg/dl) at the point of admission. Out of
the 502 children in that study51, 23% (78 out of 339) were children below 36months compared to
8.6% (14 out of 163) children aged 36months and above. This prevalence value of 18% is
comparable to the 16% prevalence reported by English et al52 in Kenya in 1996 in children with
moderate to severe malaria. The prevalence found by Onyiriuka et al51 is equally comparable to
the value obtained in the study done by Nwosu et al33 among 107 children aged 8 months to 10
years with severe malaria in Lagos University Teaching Hospital in 2001. In this study, a
prevalence of 17% was reported. White et al39 in Gambia in 1983 reported a prevalence 32% in
47 children aged 18 months to eight years with severe chloroquine sensitive falciparum malaria.
The higher prevalence rate reported by White et al39 may be as a result of their small sample size
compared to sample sizes used by Onyiriuka et al49, English et al52 and Nwosu et al.33
RISK FACTORS ASSOCIATED WITH HYPOGLYCAEMIA
Hypoglycaemia is common in critically ill children and is associated with increased mortality
rates.53-55 Faustino et al54 concluded that hypoglycaemia may be a marker of severity of illness
following a finding that hypoglycaemia was associated with worsening organ function. Chisti et
31
al50 also noted that infants with evidence of serious illness like sclerema requiring admission
into the critical care unit in an urban diarrhoea hospital were at risk of having hypoglycaemia. In
another study, Chisti et al56 also reported that patients with enteric encephalopathy having fatal
outcome more often presented with hypoglycaemia.56 In developing countries, documented risk
factors include infectious diseases,5,10,57 last meal more than twelve hours before
presentation,5,7,10 use of herbal mixtures,23,57,58 poor nutritional status10,44,54 and conditions with
alteration of level of consciousness.5,10,23,57 Additional risk factors implicated in hypoglycaemia
in children are long duration of illness,5 and night admission to hospital.5 Oyedeji et al59-61
reported that socioeconomic status may contribute to hypoglycaemia by affecting the health
seeking behavior of the parents hence delaying presentation and prolonging the duration of
illness. Low socioeconomic status also affects child’s nutritional status and feeding thus
increasing the risk of hypoglycaemia.
PATHOPHYSIOLOGY OF HYPOGLYCAEMIA
There are several mechanisms by which hypoglycaemia occurs in different disease states. In
severe malnutrition, there is impaired glucose absorption and this correlates with oxidative stress
in sick children who need admission into the Paediatric critical care unit.62 Severely
malnourished children are prone to infections which may manifest with diarrhoea and
vomiting.63 They also have failure of gluconeogenesis64,65 which potentially may be responsible
for hypoglycaemia.
Malaria causes impaired hepatic gluconeogenesis even in the presence of adequate supply of
precursors like lactate and alanine.52,66,67 White el al66 reported increased levels of lactate and
alanine in hypoglycaemic children with severe malaria which suggested impairment of
32
gluconeogenesis. In Malawi in 1988, 95 children with severe malaria were studied by Taylor et
al67 and increased concentration of lactate, alanine and 5’nucleotidase were found in children
with hypoglycaemia. This observation agrees with the fact that impaired gluconeogenesis
contributes to the pathogenesis of hypoglycaemia in children with malaria.67 Accelerated tissue
metabolism,21 the metabolic requirements of parasites and malabsorption of glucose probably
due to changes in splanchnic blood flow due to heavy parasite load in the vessel also contribute
to hypoglycaemia.68,69 There is sequestration of parasitized red blood cells in the venules and the
capillaries of deep tissues which may reduce local circulation and may stimulate anaerobic
respiration which increases glucose consumption.70-72 Finally, reduced dietary intake, vomiting
and increased metabolic requirement caused by fever in malaria are other suggested
pathophysiologic mechanisms of hypoglycaemia in malaria.66
Filkins and Cornell73 reported that impaired gluconeogenesis was responsible for hypoglycaemia
in children with septicaemia. Endotoxins produced by organisms during an infection have been
reported to cause increased insulin production hence causing hypoglycaemia.18,73,74 Hypotension
in septic shock causes reduced tissue perfusion and a switch to anaerobic respiration which
results in increased glucose utilization.75 There is equally increased metabolism as a result of
fever during an infection; this causes an increased peripheral glucose utilization especially in
neonates with bacteremia.76,77
Children with diarrhoeal diseases are prone to hypoglycaemia because of reduced intake,
hypoxia, malnutrition, ketosis and impairment of gluconeogenesis.10,73 Certain drugs like
quinine4,78-80 and excessive use of salicylates (6g/day),81,82 ethanol12 have been associated with
hypoglycaemia. Three to five percent of children with alcohol intoxication will develop
hypoglycaemia.83 Alcohol exerts a substantial influence on pancreatic microcirculation by

33
evoking massive redistribution of pancreatic blood flow from exocrine pancreas into the
endocrine (insulin producing part) through a mechanism mediated by messenger molecule nitric
oxide and the vagus nerve, augmenting late phase insulin secretion and thereby evoking
hypoglycaemia. Oral hypoglycaemic agents as well as insulin overdose can also cause
hypoglycaemia.84,85 Cow urine concoction widely used in western part of Nigeria with the belief
that it cures convulsion has been associated with severe hypoglycaemia.58,86,87
CLINICAL FEATURES OF HYPOGLYCAEMIA
Hypoglycaemia may be symptomatic or asymptomatic. In asymptomatic hypoglycaemia, there
are no clinical symptoms while in symptomatic ones, symptoms resolve with increased blood
glucose concentration.21,41,43 Clinical features can result from a combination of adrenergic
stimulation or from decreased availability of glucose for the central nervous system.3 Unlike
older children, infants are not able to talk hence they stand at higher risk of hypoglycaemia.88
The older children are able to complain of symptoms like headache, blurring of vision, diplopia,
hence hypoglycaemia can be suspected. The features that are as a result of the activation of the
autonomic nervous system are anxiety, tremulousness, diaphoresis, tachycardia, pallor, hunger,
nausea and vomiting.89 The symptoms that result from neuroglycopenia include headache,
mental confusion, delirium, lethargy, irritability, staring, behavioral changes, difficulty
concentrating, visual disturbances (decreased acuity, diplopia), dysarthria, seizures, ataxia,
somnolence, stroke (hemiplegia, aphasia), coma, paresthesia, dizziness, amnesia, decerebrate or
decorticate posturing.89 Other non specific symptoms include dry mouth, poor coordination,
impatience, nightmares, palpitation, numbness in the mouth and tongue, mouth tingling and
blurred vision.89 Hypoglycaemia is also associated with increased risk of death. This was
supported by a study carried out in Melbourne in Australia by Moritoki et al90 which reported
34
36.6% mortality in children who had hypoglycaemia on admission as against 19.7% in non
hypoglycaemic children. Onyiriuka et al49 in Benin and Ntia et al44 in Calabar reported that
children with hypoglycaemia are at a significantly greater risk of death.
BLOOD GLUCOSE ESTIMATION
Glucose supply to the cells depends on extracellular (plasma) concentrations. It is more
preferable to measure plasma glucose level than that of the whole blood. The whole blood
glucose level is a function of haematocrit.91-93 This is because although glucose is freely
diffusible between plasma and erythrocytes and is in the same concentration in erythrocyte
water, there is a difference between the water content of erythrocytes and plasma; about
72g/100ml in erythrocytes and 94g/100ml in plasma.
Plasma glucose is about 15% higher than whole blood glucose and even more when haematocrit
is higher.88 Arterial and capillary blood sample may overestimate plasma glucose concentration
by 10%.3 Capillary blood samples when used for glucose monitoring usually fall between those
of venous whole blood and venous plasma.91 Capillary samples from cold heel may lead to
underestimation of venous blood glucose level because of stasis. There is as much as a decline in
glucose level by 18mg/dl after one hour of sample collection at room temperature as a result of
ongoing glycolysis.91 This is usually prevented by putting sample into a fluoride oxalate
container to halt glycolysis.
The gold standard technique in the determination of blood glucose level is laboratory analysis
using the glucose oxidase methods.22 Glucose oxidase catalyses the oxidation of glucose to
produce glucuronic acid and hydrogen peroxide.92 The concentration of hydrogen peroxide
produced is measured using a peroxide step coupled to a coloured oxygen acceptor or
35
electrode.94 These reactions are the basis for both reagent strip and bench top glucose electrode
method. This method is specific for glucose and hence results are reliable.92,93
Another method of plasma glucose estimation is the Hexokinase method. The phosphorylation of
glucose by ATP is catalysed by the Hexokinase enzyme. The NADPH/H produced from the
reduction of Glucose-6 phosphate by glucose dehydrogenase is then measured by a
spectrophotometric indicator system. Results obtained by this method are reliable since the
reactions are specific to glucose.43,94
The reductiometric method is based on the reducing property of glucose. This method is
susceptible to positive errors caused by other non glucose-reducing substances in blood. These
non glucose reducing substances include glutathione, creatinine, uric acid, ascorbic acid, some
amino acids and glucuronic acid.93 This method is no longer used in clinical practice since the
enzymatic methods give more reliable results.
The requirements for ideal method for measurement of blood glucose concentrations are
accuracy, precision and rapid analysis of small samples. The method must be as simple as
possible for medical and nursing personnel to carry out without extensive training in laboratory
skills.43 The type of sample used influences the result depending on the type of analysis used.93
Capillary sample is not reliable if peripheral blood flow is reduced.43 Sample must always be
free-flowing because squeezing the extremity causes haemolysis which interferes with the assay
unless deproteinization is performed.
Some substances in the blood can interfere with the enzymatic method and alter the result. A
process called deproteinization is usually performed to remove these substances.43,93,94 When the
methods are applied directly to serum or plasma, the problem of inhibitors is still present.93,94,96
36
Negative errors are caused by ascorbic acid concentrations greater than 5mg/dl and haemolysis.
Uric acid causes negative error of about 1mg/dl for each mg of uric acid/dl.91,93,94
The alcohol used in skin preparation before obtaining sample can contaminate the sample giving
erroneously higher value.94-96 Glucometers are prone to errors that may lead to underestimation
of hypoglycaemia.3,43
Reflectance meters (glucometers) used in the past gave values of blood glucose in whole blood.
Current glucometers in use have inbuilt formulae in them that give values as plasma glucose
which correlates with the gold standard measured in the laboratory. Elusiyan et al25 in evaluating
the validity of bedside method in detecting hypoglycaemia studied 392 hospitalized children.
Venous blood samples were sent to the laboratory for analysis of blood glucose and also
estimated blood glucose in the same sample using glucometer. Hypoglycaemia was noted in 38
(9.7%) children with the glucometer and 25 (6.4%) by laboratory estimation. The glucometer
gave a predictive index of a positive test as 63.12% and of a negative test as 99.72%. The study
concluded that glucometer was highly sensitive and specific and its results correlate with
laboratory methods.
TREATMENT OF HYPOGLYCAEMIA
Hypoglycaemia should be treated as soon as possible to prevent complications of neurologic
damage. Hypoglycaemia is treated with bolus administration of 2-4ml/kg of 10% dextrose water.
This is followed by continuous infusion of 10% dextrose to provide 6-8mg/kg/minute of glucose
(3.4-4.8ml/kg/hr).91,92 Blood sugar should be checked after one hour and if normal, regular and
adequate oral feeds should be commenced. If still abnormally low, a repeat of bolus dextrose
water administration should be given while the concentration of the dextrose infusion should be

37
increased to 12.5% by addition of appropriate volume of 50% dextrose water. Hourly monitoring
of blood glucose should continue until two normoglycaemic results are obtained after which
interval of sampling should be increased serially to 2, 4, 6, 12 and 24 hours.
Patients who require more than 10-12mg/kg/min to maintain blood glucose should be further
investigated for other possible causes and the use of other treatment modalities considered. Other
treatment modalities to be considered include the use of diazoxide, octreotide, glucagon and
surgery.
Diazoxide aims to increase blood glucose by inhibiting pancreatic insulin release and possibly
through an extrapancreatic effect.3 Effect starts within an hour and usually lasts maximum of
eight hours with normal renal function.97 It is given orally at a dose of 25-35mg/kg/day.3
Octreotide is a long-acting analogue of somatostatin that suppresses insulin secretion for short
term management of hypoglycaemia.88,97 It is given subcutaneously at a dose of 20-50ug per
dose 6-12 hourly. Glucagon is used in treatment of hypoglycaemia secondary to
hyperinsulinaemia93. Hydrocortisone 10mg/kg in two divided doses may also be used.12,91 Both
glucagon and hydrocortisone stimulate hepatic gluconeogenesis and glycogenolysis and
ultimately increase blood glucose concentration.
Surgical intervention is considered in severely affected neonates who are unresponsive to
glucose and somatostatin therapy.93 Surgery involves pancreatectomy and removal of
extrapancreatic tumours that cause hypoglycaemia. Dietary management is also an important
adjunct for the management of hypoglycaemia. The use of frequent small feeds will help reduce
the duration of fast. Breast milk is also beneficial in preventing hypoglycaemia as it has a good

38
caloric base.98 The fat component is considered beneficial as fat promotes ketogenesis and
reduces uptake of glucose by cell.98
Specifically, if hypoglycaemia is found to be as a result of starvation (ketotic), glycogen storage
disorders or free fatty acid metabolism defect, frequent feeding or use of specially designed diet
is the mainstay of treatment.91,98 Octreotide, diazoxide or calcium channel blockers like
nifedipine are used in the treatment of hypoglycaemia due to hyperinsulinism.97 Pancreatectomy
is equally indicated for hypoglycaemia due to hyperinsulinism that does not respond to medical
treatment.93 Growth hormone or cortisol is used in the treatment of hypoglycaemia as result of
hypopituitrism or adrenal insufficiency.
PROGNOSIS OF HYPOGLYCAEMIA
The prognosis of hypoglycaemia is good with prompt treatment.91 However hypoglycaemia
recurs in 10-15% of infants after adequate treatment.99 Rebound hypoglycaemia occurs if
intravenous fluid is extravasated or discontinued too abruptly. It may also occur if oral glucose is
not offered after intravenous administration of glucose especially in severe acute malnutrition.93
Remission of congenital hyperinsulinism generally does not occur, but severity of the disease
may reduce with time.3 The prognosis for intellectual function could be worse if the symptoms
stay for prolonged duration and are associated with neurological sequelae.99,100
PREVENTION OF HYPOGLYCAEMIA IN CHILDREN
Hypoglycaemia has long term adverse effects on brain development which makes its prevention
very important. Inadequate food intake and delay in proper treatment of very ill children result in
hypoglycaemia in most cases. Most cases of hypoglycaemia are asymptomatic, therefore,
39
prevention requires a high index of suspicion. In line with this, the Integrated Management of
Childhood illness (IMCI) encourages the use of glucose water and breast milk in ill children
before referral to avoid hypoglycaemia. Elusiyan et al25 also advocated routine blood glucose
monitoring in ill children with a glucometer.
COMPLICATIONS OF HYPOGLYCAEMIA
There are predictable consequences on brain metabolism and growth when the brain is deprived
of its major energy source as a result of hypoglycaemia.13,99,100 The deprivation can lead to such
consequences as increased breakdown of endogenous structural components to release amino
acids and free fatty acids and ultimate destruction of functional membrane integrity.13 All these
factors may cause impaired brain growth and function.
Previous studies have reported a strong association between hypoglycaemia and increased
mortality/morbidity in children.5,6,7 A study done in Ile-Ife Nigeria by Elusiyan et al5 reported
that among 35 patients that died in the study, 10(28%) were hypoglycaemic compared to
15(4.2%) of the 350 that survived. They concluded that patients that had hypoglycaemia were
more likely to die than those with normal glucose level. A study done in Benin City Nigeria by
Onyiriuka et al51 in children with malaria reported that the presence of hypoglycaemia at the
point of admission was associated with a significant increase in case fatality.51 A study done in
children with diarrhoea in Calabar Nigeria by Ntia et al50 reported a 33% case fatality in children
with diarrhoea and hypoglycaemia.
40
In the study by Solomon et al6, seven (16%) out of 43 children who had hypoglycaemia died
compared to 18 (3.2%) of 560 children who had normal glucose levels. This finding is similar to
those in the study by Wintergerst et al101 that reported that 30 (16.5%) of 182 patients who had
blood glucose levels less than 65mg/dl died. Osier et al7 also reported a strong association
between hypoglycaemia and mortality. In their study, almost a third of the children who had
hypoglycaemia died despite a protocol of urgent detection and treatment of hypoglycaemia.
Studies have shown that hypoglycaemia is an indicator of poor prognosis in different disease
conditions.10,33,96,102-104 Nwosu et al33 reported that children who had cerebral malaria and
hypoglycaemia had increased risk of mortality. The most frequently occurring sequelae were
cortical blindness, monoparesis, aphasia and cerebellar ataxia.33 In Kenya, Idro et al103 in a
retrospective study examined the hospital records of 143 children aged six to nine years
previously admitted with cerebral malaria. The children were assessed at least 20 months after
discharge to detect motor, speech, language and other cognitive (memory, attention and non
verbal functioning) impairments. It was found that hypoglycaemia was independently associated
with speech and language impairments and impaired non verbal functioning.101 Taylor et al67
reported a higher morbidity and mortality among patients with cerebral malaria who had
hypoglycaemia before treatment. In this group, seven out of 19 (36.8%) died and five of 12
survivors (41.6%) had sequelae which included hemiparesis in two, generalized hypotonia and
inability to walk in one, decerebrate syndrome with generalized spasticity of the limbs in one and
cerebellar ataxia in one.101-104
Hypoglycaemia has been found to be a major risk factor for mortality in children with
gastrointestinal infection.10 In a study done in Benin on among children with diarrhoea by
Onyiriuka et al49 a very strong association between hypoglycaemia and mortality was reported.
41
Five (62.5%) out of the 8 children that died had hypoglycaemia. The study also compared the
mortality rate between the hypoglycaemic group and normoglycaemic group and it was found to
be 35.7% (5/14) versus 1.8% (3/169). In another study by Bennish et al,10 16 (34.8%) of the 46
patients with diarrhoea who had hypoglycaemia died as compared to three (12%) of 25 who were
normoglycaemic. Two of the 30 hypoglycaemic patients that survived had neurological deficits.
One was blind and the other one had recurrent focal seizures.10
A retrospective multicentre study by Lucas et al32 reported that moderate hypoglycaemia may
have serious developmental consequences if present for more than five days in the first two
months of life. Fluge105 followed up 37 children who had hypoglycaemia in their neonatal
period. Four patients that had symptomatic hypoglycaemia had convulsion after neonatal period,
one had infantile spasm and had severe mental retardation with spastic diplegia and epilepsy.105
There was also a case of blindness as a result of optic nerve atrophy and four cases of cerebral
palsy were detected in this group.105
42
AIM AND OBJECTIVES
AIM
The aim of the study is to evaluate hypoglycaemia in children aged one to 59 months admitted to
the Emergency Paediatric Unit (EPU) of Federal Medical Centre (FMC) Owerri.
SPECIFIC OBJECTIVES
The specific aims of the study are to:
1. determine the prevalence of hypoglycaemia in children aged one to 59 months
admitted into the Emergency Paediatric Unit of Federal Medical Centre Owerri.
2. identify clinical conditions associated with hypoglycaemia.
3. determine probable risk factors associated with hypoglycaemia.
4. compare plasma glucose values obtained with use of glucometer to oxidase method.
5. compare glucose values obtained using venous blood to that from capillary blood
using glucometer.
43
PATIENTS AND METHODS
STUDY LOCATION
The study was carried out at the Federal Medical Centre (FMC) Owerri. Owerri is the Capital of
Imo State in Southeastern Nigeria. The State has a population of about 3.93 million with about
401,873 people living in Owerri.106
Federal Medical Centre (FMC) is located in Owerri Municipal Local Government Area and
provides tertiary health care to people in Imo State and its environs like Abia, Rivers and
Anambra States. The other tertiary health facility in the State is the Imo State University
Teaching Hospital (IMSUTH) Orlu about 40km away. The Emergency Paediatric unit has 34
beds with total annual admissions of about 2480. About 72% of the total admissions per annum
fall between the ages of one month to five years. FMC has modern laboratory facilities with
qualified laboratory personnel.
STUDY DESIGN
The study is prospective and cross sectional.
STUDY DURATION
The present study was carried out over a period of six months (November 2015 to May 2016).
STUDY TIME
Subjects were recruited consecutively round the clock as patients present to the Emergency
Paediatric Unit.

44
MANPOWER FOR RESEARCH
Sample collections were done by the researcher in the Emergency Paediatric Unit of Federal
Medical Centre, Owerri. Some patients were admitted outside normal working hours or when
researcher was not on call. In order to avoid missing these subjects, trained research assistants
and paediatric registrars helped with subject recruitment. In preparation, paediatric registrars
doing their Emergency Paediatric Unit posting were trained. The registrars were trained on
correct administration of the study questionnaire as well as on correct use of the glucometer
using the manufacturer’s manual. Techniques of blood sampling and the need to take enough
samples were stressed.
STUDY POPULATION
The study subjects were children between the ages of one to 59 months admitted to the
Emergency Paediatric Unit during the study period who met the inclusion criteria.
INCLUSION CRITERIA
1. Children aged one to 59 months.
2. Informed parental/care-giver’s consent.
EXCLUSION CRITERIA
1. Use of glucose containing intravenous fluid less than six hours before admission.
2. Children on steroid therapy.
3. Children on drugs like insulin, glucagon etc.
45
N/B: These situations are known to alter glucose homeostasis and hence may alter the outcome
this study if subjects were included.
SAMPLE SIZE
The exact prevalence of hypoglycaemia in Nigerian children aged one to 59 months admitted
into the emergency room is unknown to the author because most studies done in the emergency
rooms focused on children between one month and eighteen years. An assumed rate of 50% was
therefore used to calculate the required sample size for the study.107 A minimum sample size for
the study was calculated using the standard formula for estimation of proportions.107
n = 𝑧2×𝑝(1−𝑝)
𝑑2
n = Sample size
z = Standard normal deviate, 1.96 at 95% confidence interval.
p = Estimated prevalence rate 50% (0.50) because no earlier study was on hypoglycaemia
in children between one month to five years.
d = Absolute precision required on either side of the proportion (5%)
n = (1.96)2 x 0.5 (1-0.5)/ (0.05)2
n = 384
In anticipation of unforeseen circumstances like wastage of samples or inadequate sample, an
attrition rate of 10% built in used and the total sample size was calculated as thus;
46
384 + 38 = 422.
ETHICAL APPROVAL AND INFORMED CONSENT
Ethical approval (appendix I) for the study was obtained from the Ethics Committee of the
Federal Medical Centre, Owerri. Written informed consent (appendix II) was obtained from the
parents/guardians of the study participants.
RECRUITMENT OF STUDY SUBJECTS
All children aged between one to 59 months admitted to the Emergency Paediatric Unit who met
the inclusion criteria were recruited consecutively into the study at the point of admission.
STUDY PROCEDURE: At the point of admission into the Emergency Paediatric Unit, a
proforma (Appendix III) was used to obtain information on personal data, sociodemographic
data, presenting complaints, duration of illness, time of last meal and treatment(s) received
before presentation. Socioeconomic status of the parents were determined using the Oyedeji’s108
social classification system (Appendix IV). Subjects who scored I and II were further classified
as upper class, III as middle class while those that scored IV and V were further classified as
lower class109. Subjects were examined and findings including anthropometric measurements
recorded.
ASSESSMENT OF ANTHROPOMETRIC INDICES OF STUDY SUBJECTS
The anthropometric indices that were obtained included: weight (kilogram), length/height
(centimeter) and mid arm circumference (centimeter). A SALTER weighing scale model 180
47
(England) was used for children that were not yet able to stand. SURGIFIELD stadiometer sm-
160 was used to weigh children that could stand.
Length of children less than twenty four months of age was measured with a non-stretchable tape
with child lying on flat surface, firmly immobilized with the aid of an assistant. For children
above twenty four months, height was obtained using a stadiometer fitted with sliding headpiece
at right angle to the upright which could be lowered onto the child’s head with the aid of an
assistant. Mid-arm circumference was measured using a non-stretchable tape at a point midway
between the acromion and the olecranon process. An average of three measurements of the mid-
arm circumference was recorded.
SAMPLE COLLECTION IN THE EMERGENCY PAEDIATRIC UNIT
A needle prick was made at the patient’s heel or the tip of the thumb after cleansing with alcohol
and capillary blood was obtained for blood glucose estimation using One-Touch Ultra 2®
glucometer. A convenient peripheral vein was punctured to collect about 2mls of blood after
cleansing the overlying skin with alcohol. A drop of this blood was used for blood glucose
estimation using One-Touch Ultra 2® glucometer while the rest was placed in fluoride oxalate
bottle and sent to the Chemical Pathology laboratory of Federal Medical Centre (FMC), Owerri
for blood glucose analysis.
CLINICAL DIAGNOSIS OF STUDY SUBJECTS
The clinical diagnoses expressed in this dissertation were those of the managing team based on
the Departmental protocol and case definitions. For example:
48
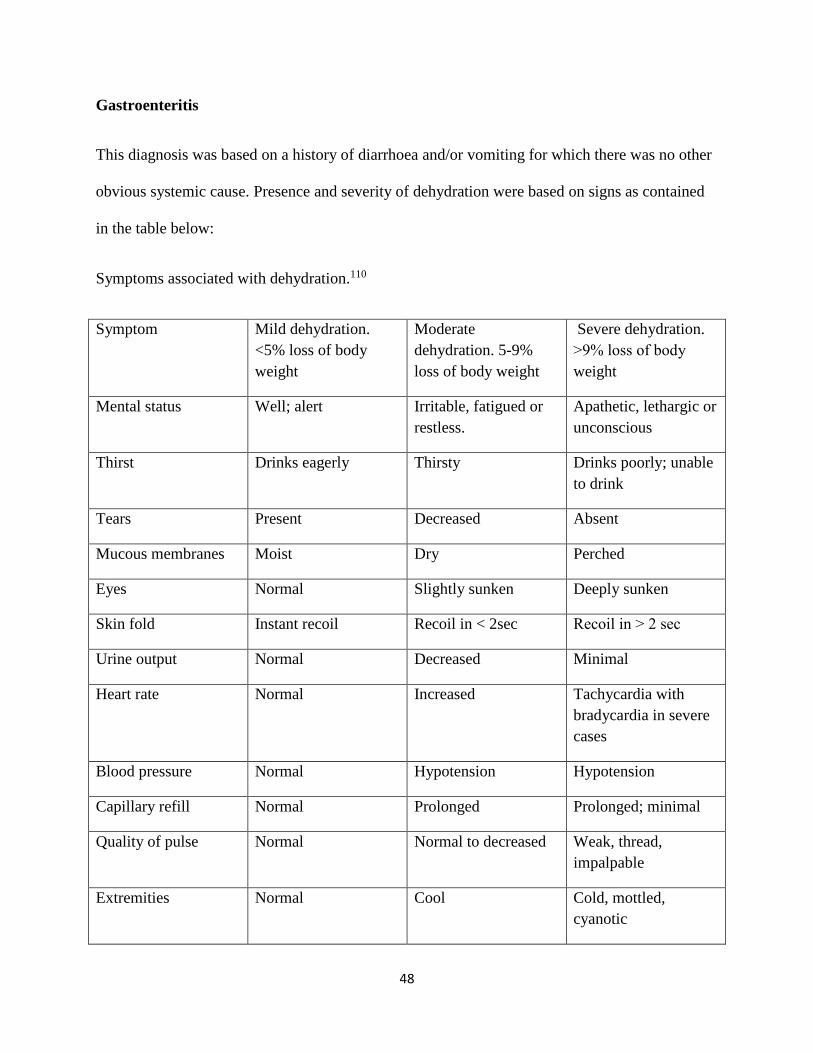
Gastroenteritis
This diagnosis was based on a history of diarrhoea and/or vomiting for which there was no other
obvious systemic cause. Presence and severity of dehydration were based on signs as contained
in the table below:
Symptoms associated with dehydration.110
Symptom Mild dehydration.
<5% loss of body
weight
Moderate
dehydration. 5-9%
loss of body weight
Severe dehydration.
˃9% loss of body
weight
Mental status Well; alert Irritable, fatigued or
restless.
Apathetic, lethargic or
unconscious
Thirst Drinks eagerly Thirsty Drinks poorly; unable
to drink
Tears Present Decreased Absent
Mucous membranes Moist Dry Perched
Eyes Normal Slightly sunken Deeply sunken
Skin fold Instant recoil Recoil in < 2sec Recoil in ˃ 2 sec
Urine output Normal Decreased Minimal
Heart rate Normal Increased Tachycardia with
bradycardia in severe
cases
Blood pressure Normal Hypotension Hypotension
Capillary refill Normal Prolonged Prolonged; minimal
Quality of pulse Normal Normal to decreased Weak, thread,
impalpable
Extremities Normal Cool Cold, mottled,
cyanotic
49
Malaria: A definite diagnosis of malaria was made by demonstration of parasitaemia on
microscopy.
Sepsis: Diagnosis was made based on evidence of systemic inflammatory response syndrome
(SIRS).111
Meningitis: The diagnosis was made based on compatible clinical features and findings in the
cerebrospinal fluid i.e. hypoglycorrhacchia, elevated protein, leukocytosis, finding of pathogens
on Gram stain and positive bacterial culture.
Protein Energy Malnutritioncv (PEM): The modified Wellcome classification112 was used to
diagnose children with PEM and to classify them into marasmus, marasmic kwashiorkor,
underweight kwashiorkor and kwashiorkor.
BLOOD GLUCOSE MEASUREMENTS
At the point of admission, estimation of blood glucose concentration using venous and capillary
blood samples were carried out by the researcher with a glucometer. The laboratory estimation of
blood glucose concentration was done by a qualified medical laboratory personnel who is a staff
of Federal Medical Centre (FMC) Owerri assisted by the researcher. The glucose oxidase method
of glucose estimation is the method used in the laboratory.22 The blood in the fluoride oxalate
bottle was immediately transferred to a test tube and centrifuged at a speed of 4000 revolutions
per minute (rpm) for ten minutes following which the blood separated into natant blood cells and
supernatant plasma.
The test principle: Glucose oxidase is an enzyme extracted from the growth medium of
Aspergillus niger. Glucose oxidase catalyses the oxidation of Beta D- glucose present in the
50
plasma to D glucono -1 ,5 - lactone with the formation of hydrogen peroxide; the lactone is then
slowly hydrolysed to D-gluconic acid, while the hydrogen peroxide produced is then broken
down to oxygen and water by a peroxidase enzyme. Oxygen then reacts with an oxygen acceptor
such as ortho toluidine which itself is converted to a coloured compound, the amount of which
can be measured colorimetrically.
The test procedure: Four test tubes labeled 1, 2, 3 and 4 were used each containing one
milliliter of glucose reagent (glucose oxidase and a buffer). Ten micro liters each of plasma,
standard, control and distilled water were added to each of the test tubes 1, 2, 3 and 4 containing
glucose reagent respectively. The solutions were mixed very well and incubated in a water bath
at a temperature of 37°C for ten minutes. After incubation, the samples were read with a
spectrophotometer at a wavelength of 540nm. The depth of colour change is a function of blood
glucose concentration. The blood glucose concentration is calculated as follows:
𝐵𝑙𝑜𝑜𝑑 𝑔𝑙𝑢𝑐𝑜𝑠𝑒 𝑐𝑜𝑛𝑐𝑒𝑛𝑡𝑟𝑎𝑡𝑖𝑜𝑛 =absorbence of sample
𝑎𝑏𝑠𝑜𝑟𝑏𝑒𝑛𝑐𝑒 𝑠𝑡𝑎𝑛𝑑𝑎𝑟𝑑 x concentration of standard
(The standard has a fixed concentration depending on the reagent.
The blank or distilled water is used to standardize the machine. The blank is usually used to
bring the equipment to zero mark before every use to ensure proper standardization.
The control has known glucose concentration which is used to standardize both the machine and
the reagent.)
The glucometer: The principle behind blood glucose meters is based on reactions that are
analyzed by electrochemical sensors that measure blood glucose concentration according to the
amount of colour change.22 On each strip, there are about 10 layers, including a stiff plastic base
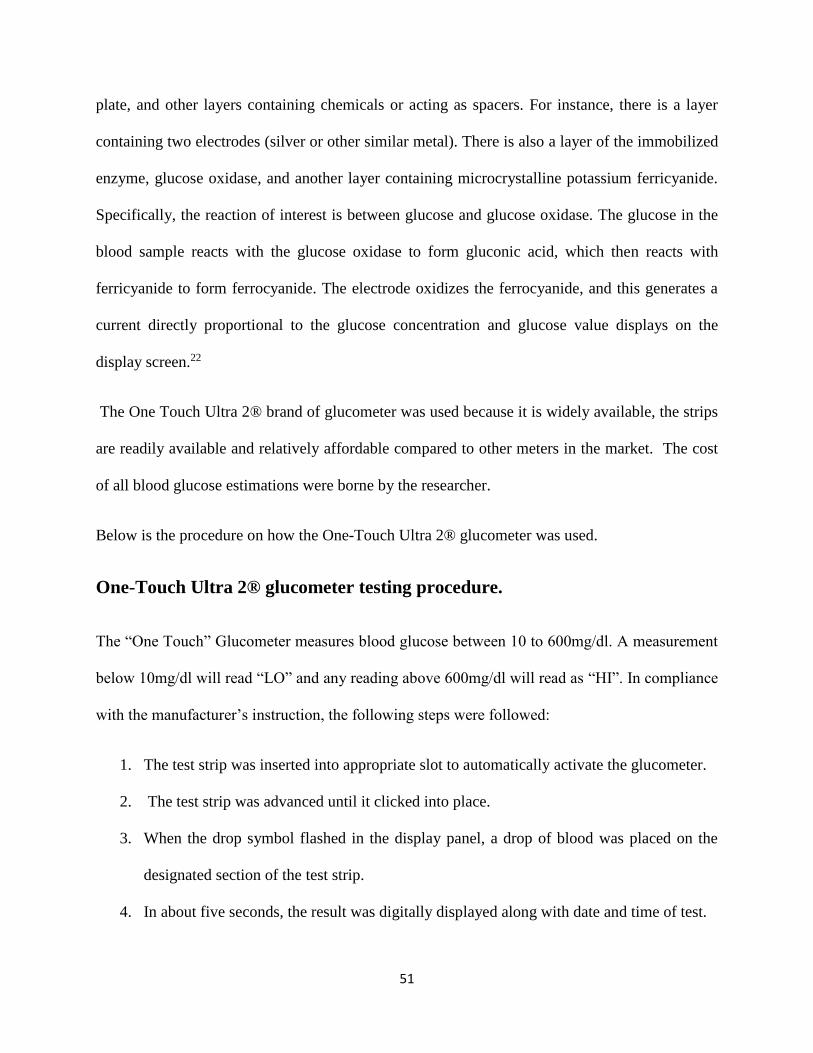
51
plate, and other layers containing chemicals or acting as spacers. For instance, there is a layer
containing two electrodes (silver or other similar metal). There is also a layer of the immobilized
enzyme, glucose oxidase, and another layer containing microcrystalline potassium ferricyanide.
Specifically, the reaction of interest is between glucose and glucose oxidase. The glucose in the
blood sample reacts with the glucose oxidase to form gluconic acid, which then reacts with
ferricyanide to form ferrocyanide. The electrode oxidizes the ferrocyanide, and this generates a
current directly proportional to the glucose concentration and glucose value displays on the
display screen.22
The One Touch Ultra 2® brand of glucometer was used because it is widely available, the strips
are readily available and relatively affordable compared to other meters in the market. The cost
of all blood glucose estimations were borne by the researcher.
Below is the procedure on how the One-Touch Ultra 2® glucometer was used.
One-Touch Ultra 2® glucometer testing procedure.
The “One Touch” Glucometer measures blood glucose between 10 to 600mg/dl. A measurement
below 10mg/dl will read “LO” and any reading above 600mg/dl will read as “HI”. In compliance
with the manufacturer’s instruction, the following steps were followed:
1. The test strip was inserted into appropriate slot to automatically activate the glucometer.
2. The test strip was advanced until it clicked into place.
3. When the drop symbol flashed in the display panel, a drop of blood was placed on the
designated section of the test strip.
4. In about five seconds, the result was digitally displayed along with date and time of test.
52
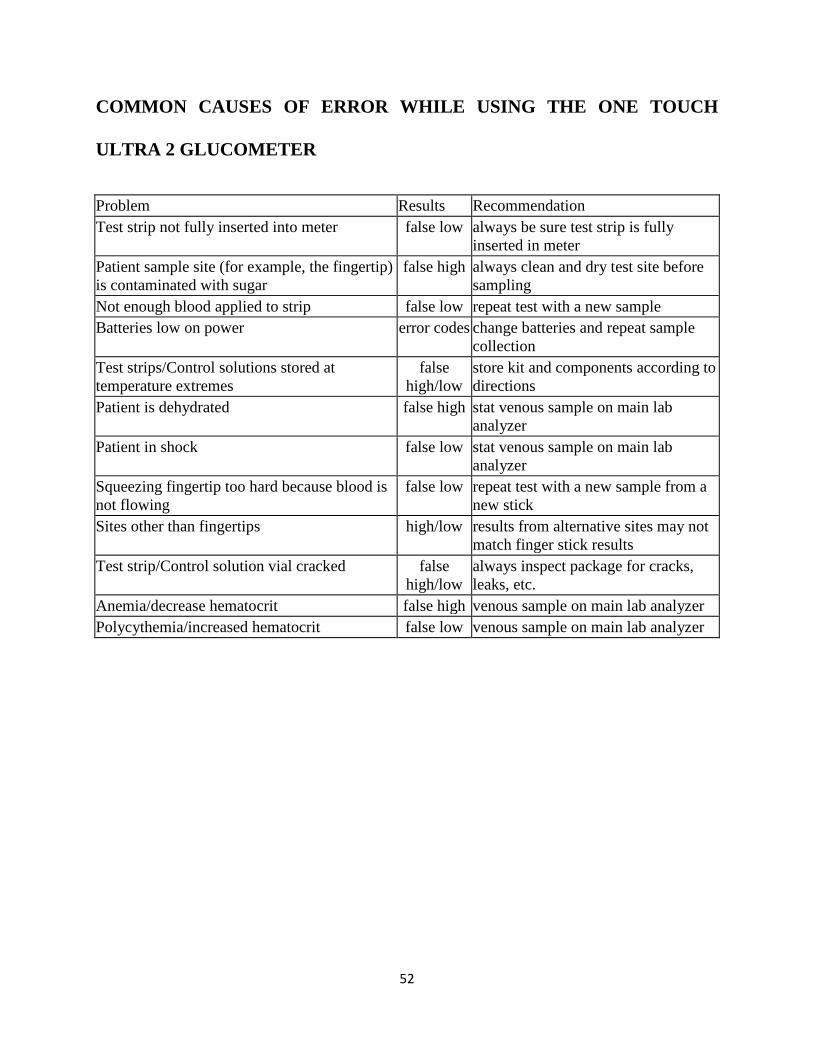
COMMON CAUSES OF ERROR WHILE USING THE ONE TOUCH
ULTRA 2 GLUCOMETER
Problem Results Recommendation
Test strip not fully inserted into meter false low always be sure test strip is fully
inserted in meter
Patient sample site (for example, the fingertip)
is contaminated with sugar
false high always clean and dry test site before
sampling
Not enough blood applied to strip false low repeat test with a new sample
Batteries low on power error codes change batteries and repeat sample
collection
Test strips/Control solutions stored at
temperature extremes
false
high/low
store kit and components according to
directions
Patient is dehydrated false high stat venous sample on main lab
analyzer
Patient in shock false low stat venous sample on main lab
analyzer
Squeezing fingertip too hard because blood is
not flowing
false low repeat test with a new sample from a
new stick
Sites other than fingertips high/low results from alternative sites may not
match finger stick results
Test strip/Control solution vial cracked false
high/low
always inspect package for cracks,
leaks, etc.
Anemia/decrease hematocrit false high venous sample on main lab analyzer
Polycythemia/increased hematocrit false low venous sample on main lab analyzer
53
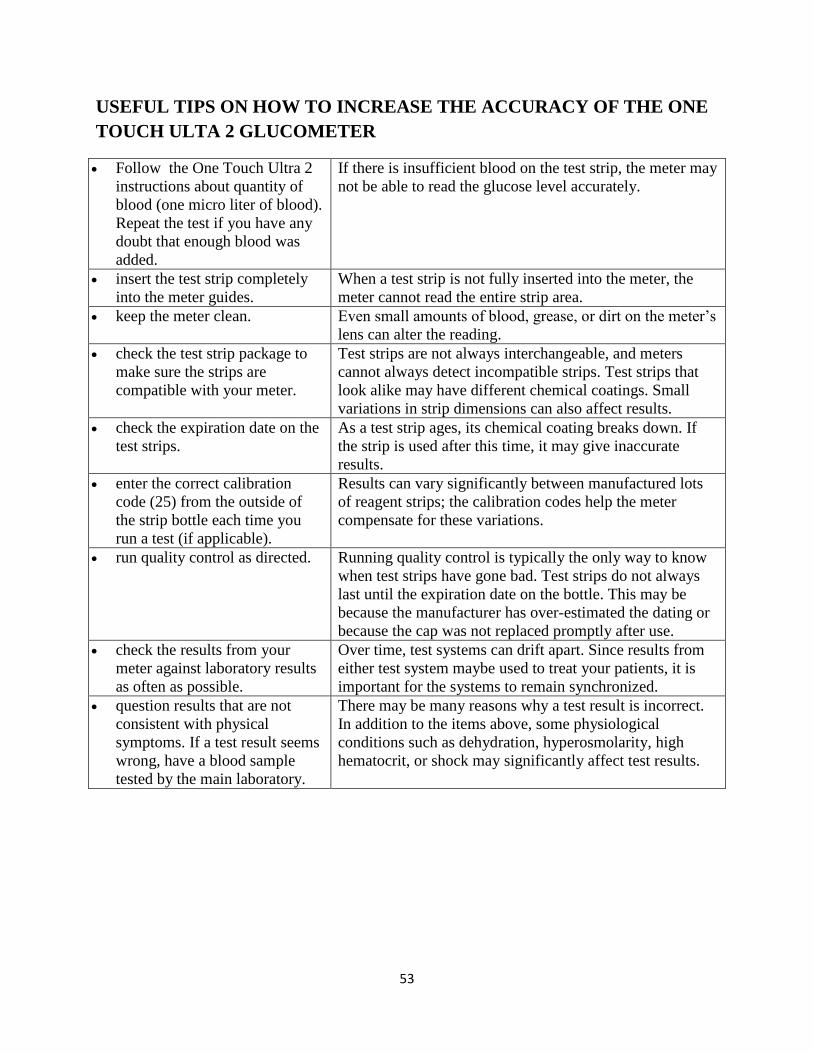
USEFUL TIPS ON HOW TO INCREASE THE ACCURACY OF THE ONE
TOUCH ULTA 2 GLUCOMETER
Follow the One Touch Ultra 2
instructions about quantity of
blood (one micro liter of blood).
Repeat the test if you have any
doubt that enough blood was
added.
If there is insufficient blood on the test strip, the meter may
not be able to read the glucose level accurately.
insert the test strip completely
into the meter guides.
When a test strip is not fully inserted into the meter, the
meter cannot read the entire strip area.
keep the meter clean. Even small amounts of blood, grease, or dirt on the meter’s
lens can alter the reading.
check the test strip package to
make sure the strips are
compatible with your meter.
Test strips are not always interchangeable, and meters
cannot always detect incompatible strips. Test strips that
look alike may have different chemical coatings. Small
variations in strip dimensions can also affect results.
check the expiration date on the
test strips.
As a test strip ages, its chemical coating breaks down. If
the strip is used after this time, it may give inaccurate
results.
enter the correct calibration
code (25) from the outside of
the strip bottle each time you
run a test (if applicable).
Results can vary significantly between manufactured lots
of reagent strips; the calibration codes help the meter
compensate for these variations.
run quality control as directed. Running quality control is typically the only way to know
when test strips have gone bad. Test strips do not always
last until the expiration date on the bottle. This may be
because the manufacturer has over-estimated the dating or
because the cap was not replaced promptly after use.
check the results from your
meter against laboratory results
as often as possible.
Over time, test systems can drift apart. Since results from
either test system maybe used to treat your patients, it is
important for the systems to remain synchronized.
question results that are not
consistent with physical
symptoms. If a test result seems
wrong, have a blood sample
tested by the main laboratory.
There may be many reasons why a test result is incorrect.
In addition to the items above, some physiological
conditions such as dehydration, hyperosmolarity, high
hematocrit, or shock may significantly affect test results.
54
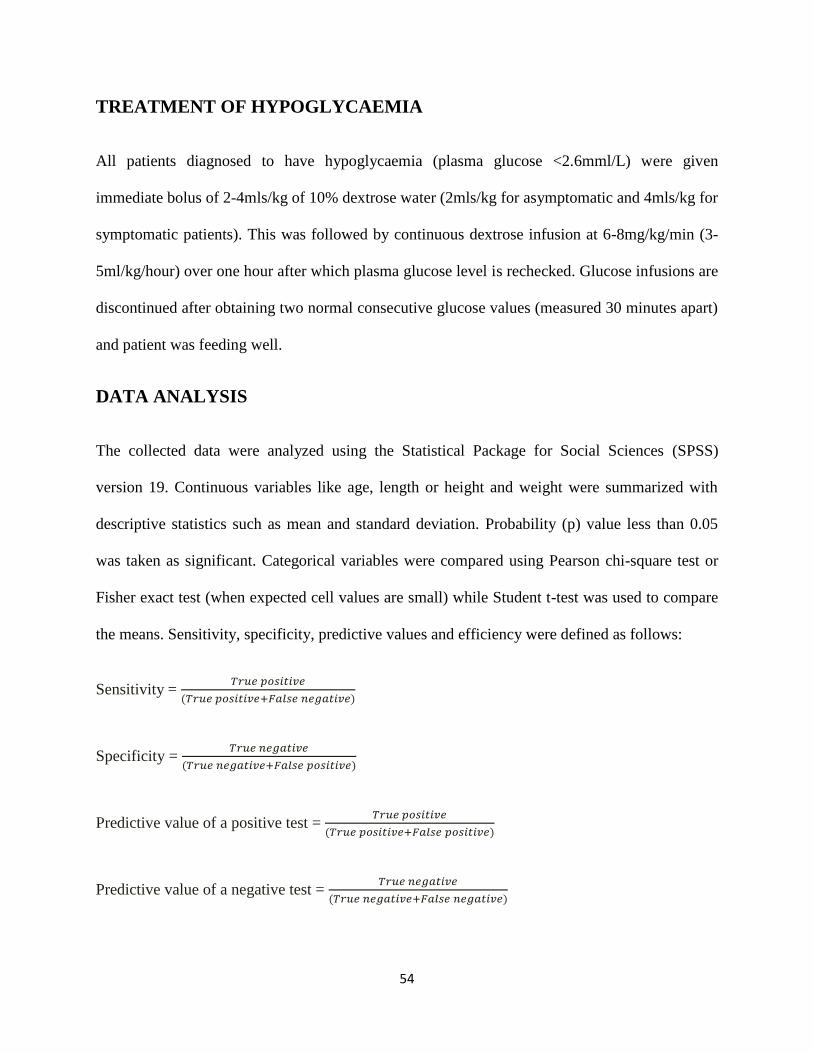
TREATMENT OF HYPOGLYCAEMIA
All patients diagnosed to have hypoglycaemia (plasma glucose <2.6mml/L) were given
immediate bolus of 2-4mls/kg of 10% dextrose water (2mls/kg for asymptomatic and 4mls/kg for
symptomatic patients). This was followed by continuous dextrose infusion at 6-8mg/kg/min (3-
5ml/kg/hour) over one hour after which plasma glucose level is rechecked. Glucose infusions are
discontinued after obtaining two normal consecutive glucose values (measured 30 minutes apart)
and patient was feeding well.
DATA ANALYSIS
The collected data were analyzed using the Statistical Package for Social Sciences (SPSS)
version 19. Continuous variables like age, length or height and weight were summarized with
descriptive statistics such as mean and standard deviation. Probability (p) value less than 0.05
was taken as significant. Categorical variables were compared using Pearson chi-square test or
Fisher exact test (when expected cell values are small) while Student t-test was used to compare
the means. Sensitivity, specificity, predictive values and efficiency were defined as follows:
Sensitivity = 𝑇𝑟𝑢𝑒 𝑝𝑜𝑠𝑖𝑡𝑖𝑣𝑒
(𝑇𝑟𝑢𝑒 𝑝𝑜𝑠𝑖𝑡𝑖𝑣𝑒+𝐹𝑎𝑙𝑠𝑒 𝑛𝑒𝑔𝑎𝑡𝑖𝑣𝑒)
Specificity = 𝑇𝑟𝑢𝑒 𝑛𝑒𝑔𝑎𝑡𝑖𝑣𝑒
(𝑇𝑟𝑢𝑒 𝑛𝑒𝑔𝑎𝑡𝑖𝑣𝑒+𝐹𝑎𝑙𝑠𝑒 𝑝𝑜𝑠𝑖𝑡𝑖𝑣𝑒)
Predictive value of a positive test = 𝑇𝑟𝑢𝑒 𝑝𝑜𝑠𝑖𝑡𝑖𝑣𝑒
(𝑇𝑟𝑢𝑒 𝑝𝑜𝑠𝑖𝑡𝑖𝑣𝑒+𝐹𝑎𝑙𝑠𝑒 𝑝𝑜𝑠𝑖𝑡𝑖𝑣𝑒)
Predictive value of a negative test = 𝑇𝑟𝑢𝑒 𝑛𝑒𝑔𝑎𝑡𝑖𝑣𝑒
(𝑇𝑟𝑢𝑒 𝑛𝑒𝑔𝑎𝑡𝑖𝑣𝑒+𝐹𝑎𝑙𝑠𝑒 𝑛𝑒𝑔𝑎𝑡𝑖𝑣𝑒)

55
Efficiency = 𝑇𝑟𝑢𝑒 𝑝𝑜𝑠𝑖𝑡𝑖𝑣𝑒+𝑇𝑟𝑢𝑒 𝑛𝑒𝑔𝑎𝑡𝑖𝑣𝑒
𝑇𝑜𝑡𝑎𝑙 𝑠𝑢𝑏𝑗𝑒𝑐𝑡𝑠

56
RESULTS
Demographic Parameters and Clinical History
Four hundred and twenty two children one to 59 months enrolled. Twenty two were dropped due
to sample wastages. The 400 subjects who completed the study included 232 (58.0%) males and
168 (42.0%) females; 222 (55.5%) infants (1 – 12 months), 126 (31.5%) toddlers (13 – 36
months) and 52 (13.0%) preschool children (37 – 59 months) making infants the predominant
age group. The mean age of the children was 16.9 ± 15.1 months and a median age of 12 months.
Two hundred and thirty eight (59.5%) subjects belonged to the upper socioeconomic class, 104
(26.0%) and 58 (14.5%) belonged to the middle and lower socioeconomic class respectively.
(Table 1).
The mean ± standard deviation and median duration of illness were 9.8 ± 1.9 hours and 4 hours
respectively while the average ± standard deviation and median duration from the last meal were
3.5 ± 0.2hours and 3.0 hours respectively.
57
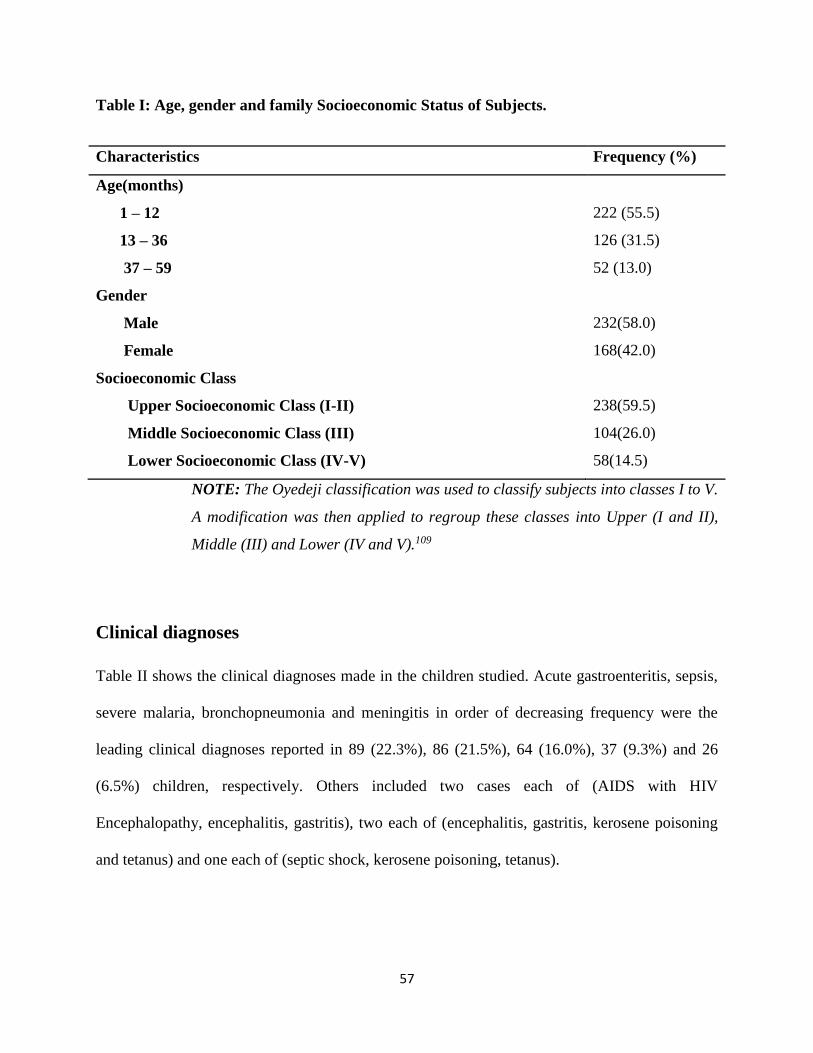
Table I: Age, gender and family Socioeconomic Status of Subjects.
Characteristics Frequency (%)
Age(months)
1 – 12 222 (55.5)
13 – 36 126 (31.5)
37 – 59 52 (13.0)
Gender
Male 232(58.0)
Female 168(42.0)
Socioeconomic Class
Upper Socioeconomic Class (I-II) 238(59.5)
Middle Socioeconomic Class (III) 104(26.0)
Lower Socioeconomic Class (IV-V) 58(14.5)
NOTE: The Oyedeji classification was used to classify subjects into classes I to V.
A modification was then applied to regroup these classes into Upper (I and II),
Middle (III) and Lower (IV and V).109
Clinical diagnoses
Table II shows the clinical diagnoses made in the children studied. Acute gastroenteritis, sepsis,
severe malaria, bronchopneumonia and meningitis in order of decreasing frequency were the
leading clinical diagnoses reported in 89 (22.3%), 86 (21.5%), 64 (16.0%), 37 (9.3%) and 26
(6.5%) children, respectively. Others included two cases each of (AIDS with HIV
Encephalopathy, encephalitis, gastritis), two each of (encephalitis, gastritis, kerosene poisoning
and tetanus) and one each of (septic shock, kerosene poisoning, tetanus).

58
Table II: Frequency of occurrence of clinical diagnosis in the children studied.
Diagnosis Frequency (%)
Gastroenteritis 89 (22.25)
Sepsis 86 (21.50)
Severe Malaria 64 (16.00)
Bronchopneumonia 37 (9.25)
Meningitis 26 (6.50)
Febrile convulsion 13 (3.25)
Bronchiolitis 10 (2.50)
Sickle cell crisis 10 (2.50)
Upper respiratory tract infection 9 (2.25)
Anaemic heart failure 9 (2.25)
Acute severe asthma 8 (2.00)
Intussuception 8 (2.00)
Acute renal failure 6 (1.50)
Haemolytic uraemic syndrome
Gastritis
6 (1.50)
3 (0.75)
Kwashiorkor 3 (0.75)
Nephrotic syndrome 3 (0.75)
Afebrile seizures
AIDS with HIV encephalopathy
Encephalitis
Kersene poisoning
Tetanus
Marasmus
3 (0.75)
2 (0.50)
2 (0.50)
1 (0.25)
1 (0.25)
1 (0.25)
59
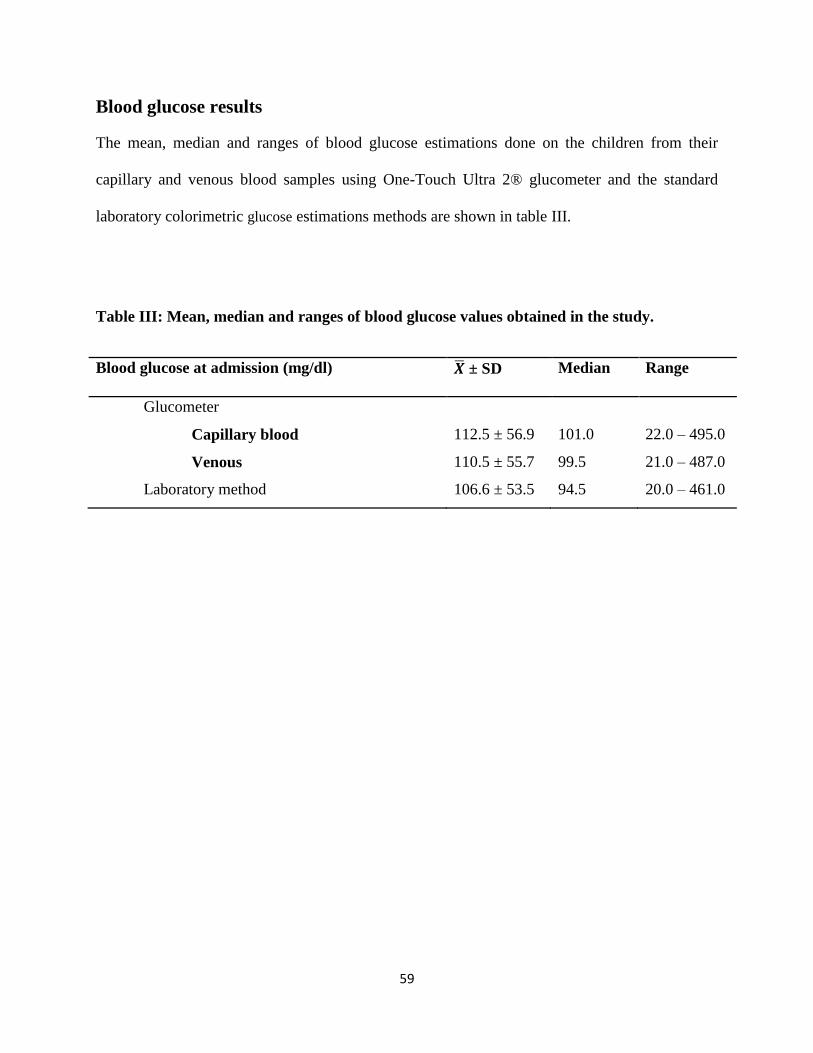
Blood glucose results
The mean, median and ranges of blood glucose estimations done on the children from their
capillary and venous blood samples using One-Touch Ultra 2® glucometer and the standard
laboratory colorimetric glucose estimations methods are shown in table III.
Table III: Mean, median and ranges of blood glucose values obtained in the study.
Blood glucose at admission (mg/dl) �̅� ± SD Median Range
Glucometer
Capillary blood 112.5 ± 56.9 101.0 22.0 – 495.0
Venous 110.5 ± 55.7 99.5 21.0 – 487.0
Laboratory method 106.6 ± 53.5 94.5 20.0 – 461.0

60
comparison of mean blood glucose from One-Touch Glucometer and
Laboratory analyses
Table IV shows the mean blood glucose levels derived from the glucometer (capillary and
venous) and from the laboratory. The mean capillary blood glucose using a glucometer was
higher than that of venous sample, but the difference was not statistically significant (p = 0.73).
The capillary and venous sample blood glucose estimations using glucometer were also higher
than the laboratory method, but the differences were not statistically significant (p = 0.29 and
0.48 respectively).
Table IV: comparison of mean blood glucose from One-Touch Glucometer and Laboratory
analysis
Blood glucose at
admission (mg/dl)
�̅� ± SD
t-test
p-value
GCBG
GVBG
112.5 ± 56.9
110.5 ± 55.7
0.35
0.73
GCBG
LabBG
112.5 ± 56.9
106.6 ± 53.5
1.06
0.29
GVBC
LabBG
110.5 ± 55.7
106.6 ± 53.5
0.71
0.48
GCBG = Glucometer Capillary Blood Glucose.
GVBG = Glucometer Venous Blood Glucose.
LabBG = Laboratory Blood Glucose.
61
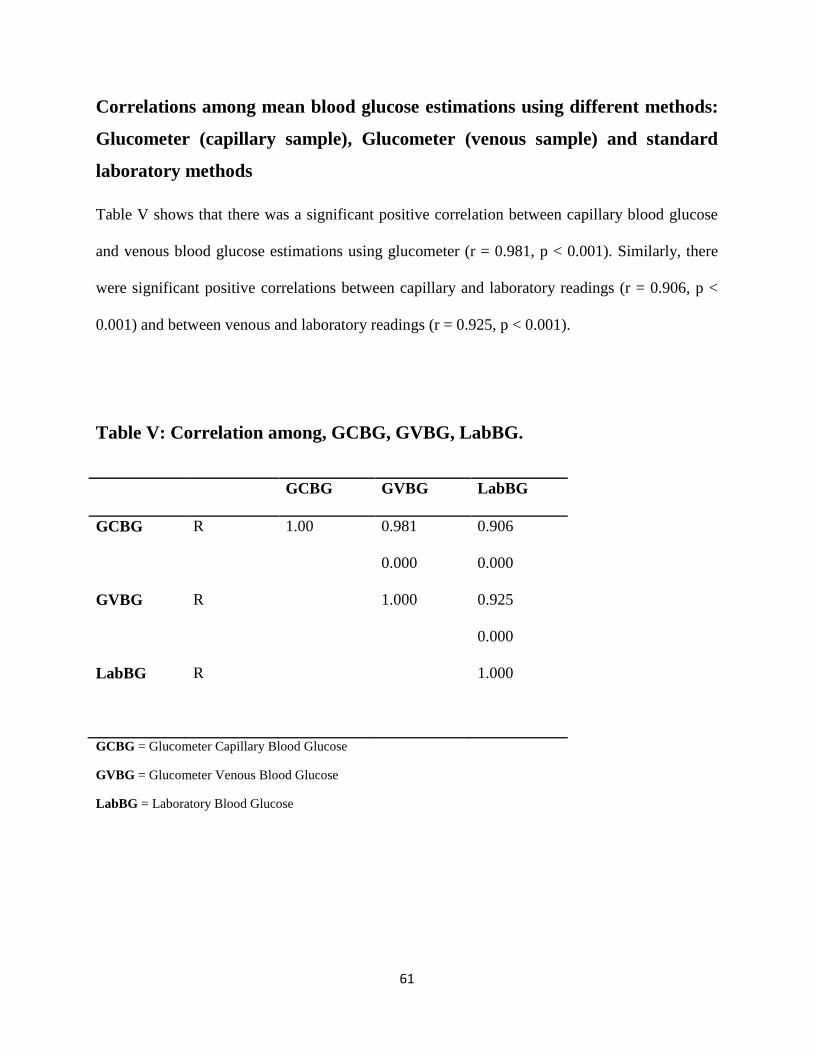
Correlations among mean blood glucose estimations using different methods:
Glucometer (capillary sample), Glucometer (venous sample) and standard
laboratory methods
Table V shows that there was a significant positive correlation between capillary blood glucose
and venous blood glucose estimations using glucometer (r = 0.981, p < 0.001). Similarly, there
were significant positive correlations between capillary and laboratory readings (r = 0.906, p <
0.001) and between venous and laboratory readings (r = 0.925, p < 0.001).
Table V: Correlation among, GCBG, GVBG, LabBG.
GCBG GVBG LabBG
GCBG R 1.00 0.981 0.906
0.000 0.000
GVBG R 1.000 0.925
0.000
LabBG R 1.000
GCBG = Glucometer Capillary Blood Glucose
GVBG = Glucometer Venous Blood Glucose
LabBG = Laboratory Blood Glucose
62
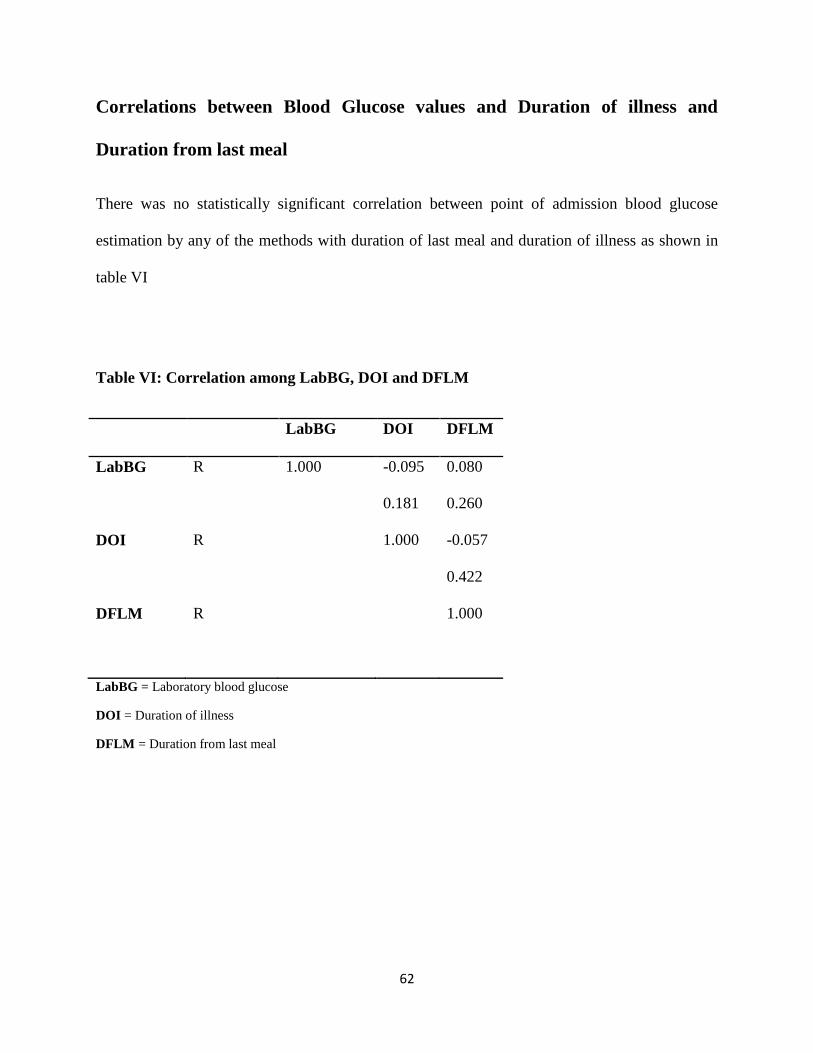
Correlations between Blood Glucose values and Duration of illness and
Duration from last meal
There was no statistically significant correlation between point of admission blood glucose
estimation by any of the methods with duration of last meal and duration of illness as shown in
table VI
Table VI: Correlation among LabBG, DOI and DFLM
LabBG DOI DFLM
LabBG R 1.000 -0.095 0.080
0.181 0.260
DOI R 1.000 -0.057
0.422
DFLM R 1.000
LabBG = Laboratory blood glucose
DOI = Duration of illness
DFLM = Duration from last meal
63
Prevalence of Hypoglycaemia
Using the laboratory method, thirty children had random blood glucose reading less than
2.6mmol/L (47mg/dl) giving a hypoglycaemia prevalence rate of 7.5%. Using One-Touch Ultra
2®, 26 (6.5%) of the capillary and 28 (7.0%) of venous samples had readings in the
hypoglycaemic range. A prevalence of 7.5% as recorded in the laboratory was used in this study.
Capillary samples had four (4) false negatives while venous samples had two (2) false negatives.
Neither the venous nor capillary samples by glucometer estimation had any false positives as
shown in Table VII. The laboratory estimation recorded 43, 40, 38 and 45(mg/dl), the venous
estimation recorded 47, 44, 45 and 52 (mg/dl), while the capillary estimation recorded 49, 50, 51
and 54 (mg/dl respectively) among the four subjects.
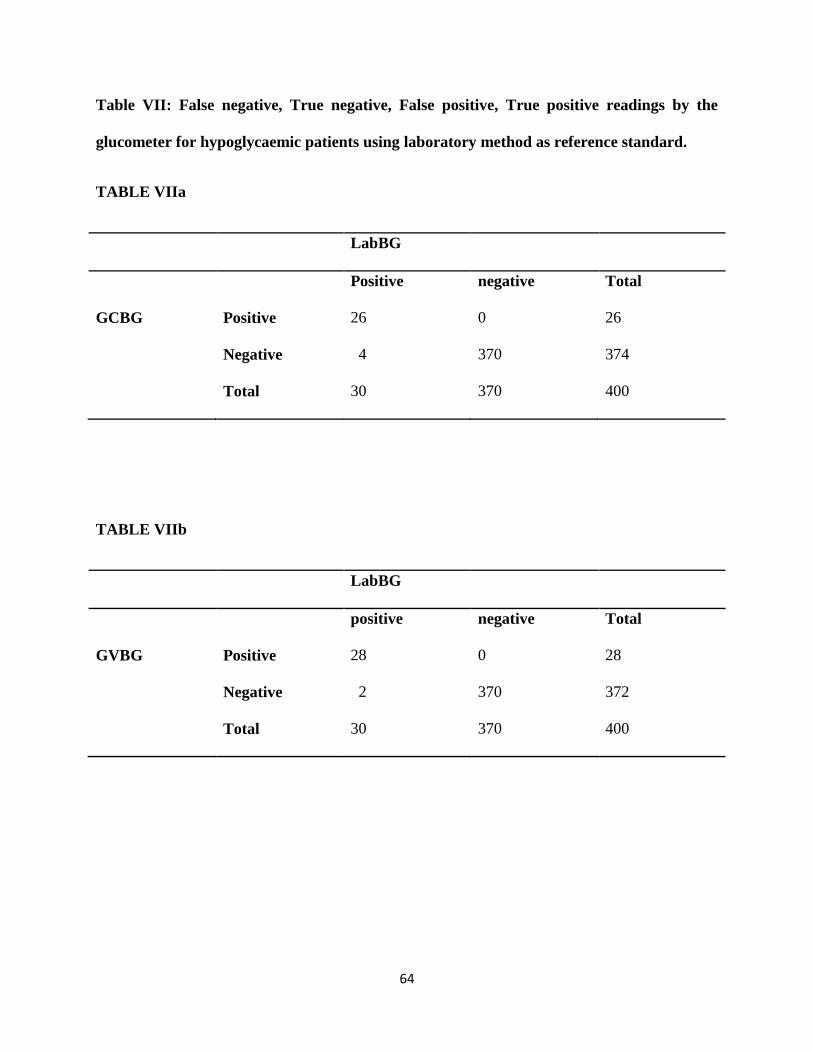
64
Table VII: False negative, True negative, False positive, True positive readings by the
glucometer for hypoglycaemic patients using laboratory method as reference standard.
TABLE VIIa
LabBG
Positive negative Total
GCBG Positive 26 0 26
Negative 4 370 374
Total 30 370 400
TABLE VIIb
LabBG
positive negative Total
GVBG Positive 28 0 28
Negative 2 370 372
Total 30 370 400

65
Table VIII: Sensitivity, specificity and predictive value of capillary and
venous samples comparing values by glucometer to values derived by
laboratory method.
The sensitivities of capillary and venous blood random blood glucose measurement relative to
the laboratory method were therefore 86.7% and 93.3% respectively. Both methods had 100%
specificity and positive predictive values for detecting hypoglycaemia as shown in Table VIII.
Table VIII: Sensitivity, specificity and predictive values of glucometer capillary and venous
samples using laboratory method as standard.
Glucometer Sensitivity Specificity PPV NPV
Capillary sample 86.7% 100.0% 100.0% 98.9%
Venous sample 93.3% 100.0% 100.0% 99.5%
PPV = Positive predictive value
NPV = Negative predictive value
66
Risk factors for hypoglycaemia
Table IX shows the association between hypoglycaemia and age group, sex and socioeconomic
class. The frequency of occurrence of hypoglycaemia decreased with increasing age. None of
the pre-school children was hypoglycaemic. A chi square analysis did not show any significant
age difference [among the three age stratifications] (χ2 = 4.979; p = 0.083). However, infants had
a significantly higher prevalence of hypoglycaemia than preschool children (Fisher exact test: p
= 0.0176). Similarly, toddlers also had a significantly higher prevalence of hypoglycaemia than
preschool children (Fisher exact test: p = 0.0357). On the other hand, the difference between the
prevalence of hypoglycaemia in infants and toddlers was not statistically significant (χ2 =0.017; p
= 0.68).
The frequency of hypoglycaemia was higher in males than females (7.8% versus 7.1%), but the
difference was not statistically significant (χ2 =0.053; p = 0.817). The frequency of
hypoglycaemia was higher in children belonging to the lower socioeconomic class (17.2%). This
prevalence was significantly higher than the figure in the upper and middle classes put together
(χ2 = 9.279; p = 0.002).

67
Table IX: Risk factors for hypoglycaemia
Hypoglycaemic Non
Hypoglycaemic
Total χ2 p value
Age groups
≤12 20 (9.0) 202 (91.0) 222 (100.0)
13 to 36 10 (7.9) 116 (92.1) 126 (100.0) 4.979 0.083
37 to 60 0 (0.0) 52 (100.0) 52 (100.0)
Sex
Male 18 (7.8) 214 (92.2) 232 (100.0) 0.053 0.817
Female 12 (7.1) 156 (92.9) 168 (100.0)
SEC
Upper 16 (6.8) 222 (93.2) 238 (100.0)
Middle 4 (3.8) 100 (96.2) 104 (100.0) 10.142 0.006
Lower 10 (17.2) 48 (82.8) 58 (100.0)
SEC = Socio-economic classification
Association between hypoglycaemia, clinical features and treatment outcome
Table X shows the association between patients’ symptoms, physical findings and treatment
outcome. Hypoglycaemia was found significantly more commonly among patients who had
fever, vomiting, diarrhoea or dehydration. It was also significantly more common among patients
who had convulsed, were unconscious or had ingested herbal concoctions. Of the 30 patients
with hypoglycaemia, two were discharged against medical advice and were lost to follow up. Of
the 28 that were fully treated to conclusion, 12 died giving a case fatality rate of 42.9%. The
corresponding fatality rate among patients without hypoglycaemia was 12.40% (46/370). Thus
the presence of hypoglycaemia was associated with a higher mortality rate (χ2 =18.5; p < 0.001).
Thus overall, a total of 330 (82.5%) subjects responded well to treatment and were discharged,
12 (3.0%) were discharged against medical advice while 58 (14.5%) died in the hospital. The
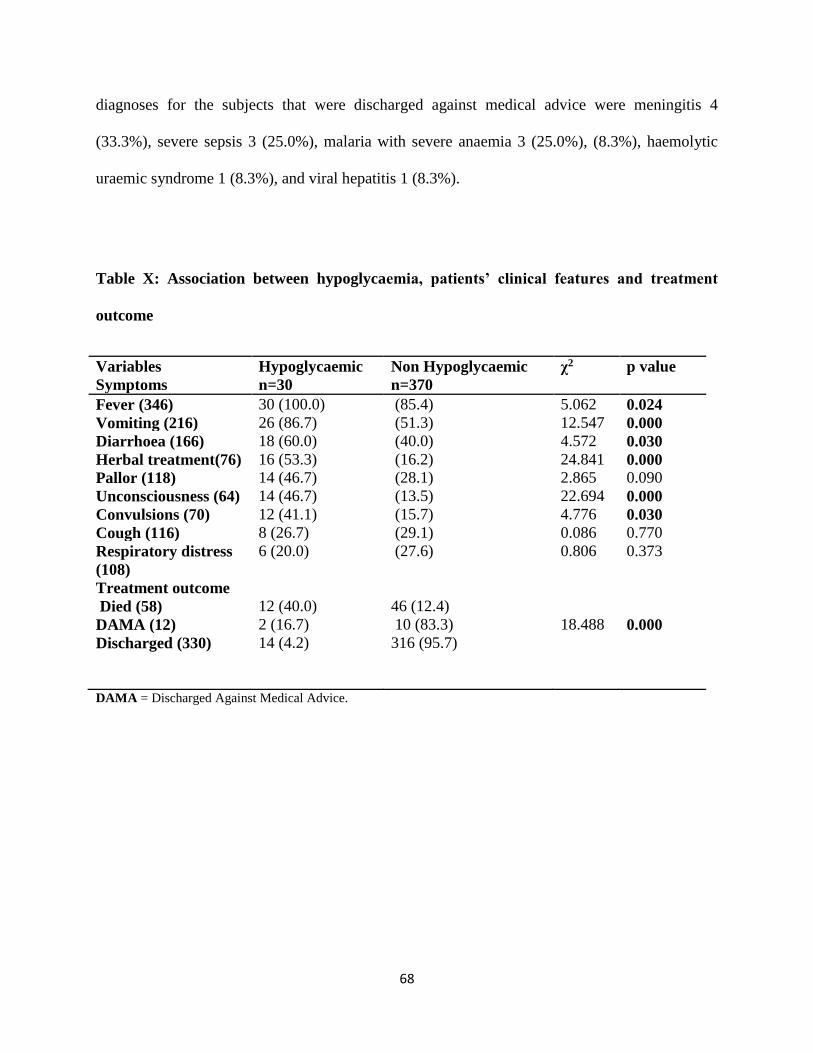
68
diagnoses for the subjects that were discharged against medical advice were meningitis 4
(33.3%), severe sepsis 3 (25.0%), malaria with severe anaemia 3 (25.0%), (8.3%), haemolytic
uraemic syndrome 1 (8.3%), and viral hepatitis 1 (8.3%).
Table X: Association between hypoglycaemia, patients’ clinical features and treatment
outcome
Variables
Symptoms
Hypoglycaemic
n=30
Non Hypoglycaemic
n=370
χ2 p value
Fever (346) 30 (100.0) (85.4) 5.062 0.024
Vomiting (216) 26 (86.7) (51.3) 12.547 0.000
Diarrhoea (166) 18 (60.0) (40.0) 4.572 0.030
Herbal treatment(76) 16 (53.3) (16.2) 24.841 0.000
Pallor (118) 14 (46.7) (28.1) 2.865 0.090
Unconsciousness (64) 14 (46.7) (13.5) 22.694 0.000
Convulsions (70) 12 (41.1) (15.7) 4.776 0.030
Cough (116) 8 (26.7) (29.1) 0.086 0.770
Respiratory distress
(108)
Treatment outcome
Died (58)
DAMA (12)
Discharged (330)
6 (20.0)
12 (40.0)
2 (16.7)
14 (4.2)
(27.6)
46 (12.4)
10 (83.3)
316 (95.7)
0.806
18.488
0.373
0.000
DAMA = Discharged Against Medical Advice.
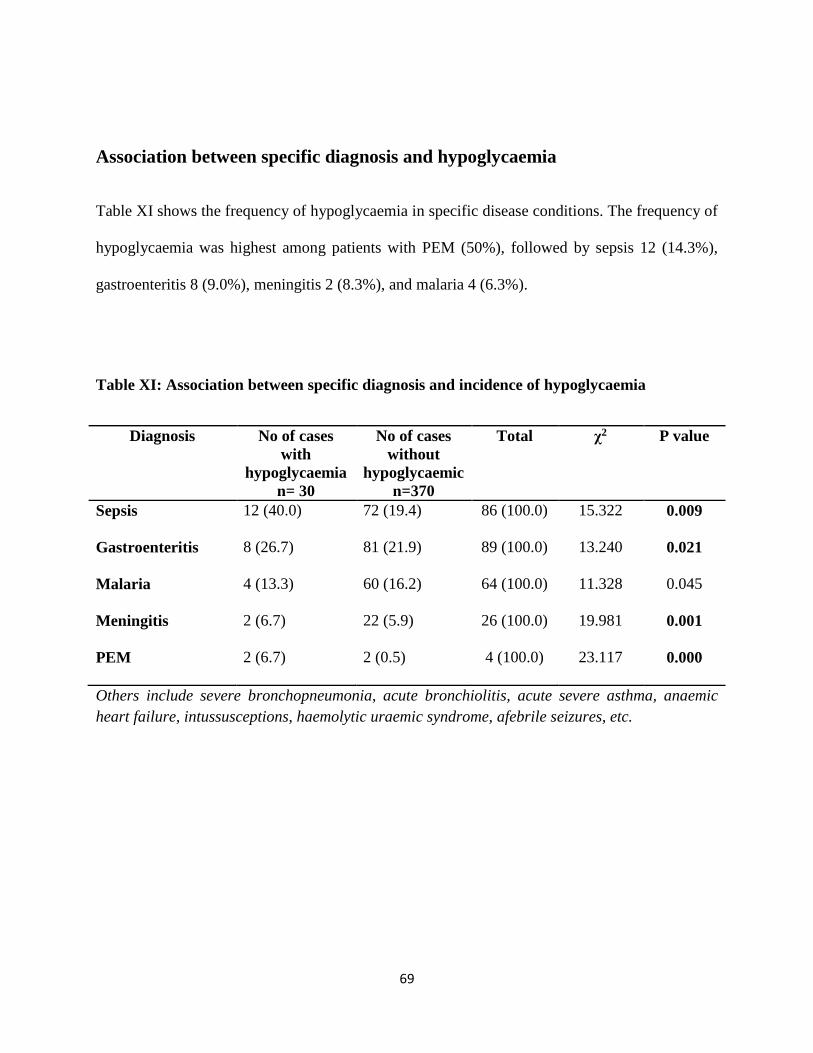
69
Association between specific diagnosis and hypoglycaemia
Table XI shows the frequency of hypoglycaemia in specific disease conditions. The frequency of
hypoglycaemia was highest among patients with PEM (50%), followed by sepsis 12 (14.3%),
gastroenteritis 8 (9.0%), meningitis 2 (8.3%), and malaria 4 (6.3%).
Table XI: Association between specific diagnosis and incidence of hypoglycaemia
Diagnosis No of cases
with
hypoglycaemia
n= 30
No of cases
without
hypoglycaemic
n=370
Total χ2 P value
Sepsis 12 (40.0) 72 (19.4) 86 (100.0) 15.322 0.009
Gastroenteritis 8 (26.7) 81 (21.9) 89 (100.0) 13.240 0.021
Malaria 4 (13.3) 60 (16.2) 64 (100.0) 11.328 0.045
Meningitis 2 (6.7) 22 (5.9) 26 (100.0) 19.981 0.001
PEM 2 (6.7) 2 (0.5) 4 (100.0) 23.117 0.000
Others include severe bronchopneumonia, acute bronchiolitis, acute severe asthma, anaemic
heart failure, intussusceptions, haemolytic uraemic syndrome, afebrile seizures, etc.
70
DISCUSSION
The prevalence of hypoglycaemia of 7.5% found in the present study is comparable to figures
from earlier studies from Nigeria and elsewhere in Africa which ranged from 6.5% to7.3%.5-7 It
is however, much higher than 0.007% reported from Alabama in the United States of
America.113 The marked difference from the Alabama study could be explained by difference in
methodology. While the subjects of the current study were children who were ill enough to be
hospitalized, the Alabama study recruited all children who presented to the Emergency room
irrespective of illness severity. Expectedly, more subjects of the current study would be prone to
more co morbidities like hypoglycaemia.
On the other hand, the prevalence herein reported was much lower than 18.0% found in a
California study.101 This difference probably resulted from the differences in cut-off values used
for the definition of hypoglycaemia. While a level of 2.6mmol/L (47mg/dl) was used to define
hypoglycaemia in the present study, a higher cut-off of 3.6mmol/L (65mg/dl) was adopted in the
California study. The obvious implication is that some subjects who would have been classified
as within normal limits in the current study would have been classified as hypoglycaemic in the
California study. A second explanation is that the California study was conducted in the
Intensive Care Unit among very ill children who were highly prone to co-morbidities like
hypoglycaemia. The California study did not state the age range of the studied subjects. The
prevalence of hypoglycaemia in any given setting depends on the blood glucose level used in the
definition of hypoglycaemia.
Hypoglycaemia was found to be commonly associated with protein energy malnutrition (PEM),
sepsis, gastroenteritis, meningitis and malaria in the present study. This observation is
71
comparable to the findings noted by Oyenusi et al114 in Lagos that reported hypoglycaemia to be
more commonly associated with multisystemic infection (sepsis), severe malaria, gastroenteritis
and respiratory infections. Elusiyan5 in Ile-Ife also reported high prevalence of hypoglycaemia in
children who were diagnosed with severe malaria, septicaemia, pneumonia and PEM and their
observations are in tandem with findings in the present study. Similarly, the common disease
conditions found to have the highest prevalence of hypoglycaemia in the present study are
similar to the range noted in the Mozambique6 study which found the prevalence to be highest in
children with PEM, pneumonia, encephalitis and intestinal parasitic infections. It is therefore
important to screen for hypoglycaemia in children who present to the Emergency Room with
these illnesses.
Specifically, hypoglycaemia was recorded in half of the children with PEM in the present study.
This is comparable to the prevalence rate noted by Elusiyan et al.5 The higher prevalence could
be explained by the depletion of gluconeogenic amino acids in malnourished children as reported
by Bennish et al.10 Furthermore, hypoglycaemia could be caused by a defect in glycogenolytic
pathway and limited lipolysis in malnourished children. Thus it is very important to screen for
hypoglycaemia in malnourished children to allow for prompt correction and subsequent
maintenance of caloric requirement of the patient.
Hypoglycaemia was prevalent in children who had sepsis. The prevalence rate is comparable to
values recorded in the studies in Ile-Ife5 and Lagos.114 Endotoxins produced by organisms during
infection have been reported to cause increased insulin production hence causing
hypoglycaemia.18,73,74 Hypotension in septic shock causes reduced tissue perfusion and a switch
to anaerobic respiration which results in increased glucose utilization.75 There is equally
increased metabolism as a result of fever during an infection; this causes an increased peripheral
72
glucose utilization especially in neonates with bacteremia.76,77 There is need therefore to suspect
and screen for hypoglycaemia in children we suspect to have sepsis.
The current study also reported a high prevalence of hypoglycaemia in children that had
gastroenteritis. This observation is in tandem with what was noted in the study in Benin49 which
reported a prevalence of 7.7%. This observation is however in contrast to what was noted in a
study that was done in Calabar50 which reported a prevalence of 4.0%. The difference in
prevalence could have been as a result of the difference in the definition of hypoglycaemia used.
The cut-off blood glucose used in the Calabar study50 was 2.2mmol/l (40mg/dl) while the current
study used a cut-off of 2.6mmol/l (47mg/dl). The association between hypoglycaemia and
diarrhoeal diseases in the current study is in contrast with the findings noted in the study by
Elusiyan et al5 which documented no hypoglycaemia in all 14 subjects with diarrhoea. Elusiyan
et al attributed their findings to the use of oral rehydration therapy in the subjects. The sample
size was also small in the Elusiyan et al’s study compared to the current study and this may also
account for the findings. A study done in India in children who had diarrhoea reported a higher
prevalence of hypoglycaemia than what is observed in the current study.48 The current study
tested consecutive patients while the Indian study tested 10 out of 28 cases of cholera. The
higher prevalence rate could have been as a result of the fact cholera is more debilitating illness
than simple gastroenteritis, and withholding of feeds is commonly used as a measure in cholera.
Hypoglycaemia is common in children with diarrhoeal diseases because there is reduced food
intake as mothers fear that feeding may worsen diarrhoea. Therefore, the continued promotion of
oral rehydration therapy at home in children who have diarrhoea should be encouraged.
The present study found a hypoglycaemia prevalence rate of 6.3% in children who had severe
malaria. This observation is similar to that noted in a Kenyan7 study which reported a prevalence
73
of hypoglycaemia of 8.4% in children who were diagnosed to have malaria. A significant
association was found between incidence of hypoglycaemia and loss of consciousness. When
children are unconscious, they are made to fast for a prolonged period of time. This prolonged
fasting or the primary disease that led to unconsciousness may predispose them to
hypoglycaemia.
Dehydration was also significantly associated with hypoglycaemia in the present study. This
finding is similar to the report by Ntia et al50 in Calabar study. The occurrence of hypoglycaemia
in dehydrated children may be due to reduced blood supply to the liver and subsequent reduction
in glucose metabolism.53
Age less than twelve months was found to be a risk factor for hypoglycaemia. This is
comparable to the finding by Elusiyan et al5 showing hypoglycaemia to be more in children aged
one to three years. Hypoglycaemia occurs more in younger infants as observed in this study
because their capacity for glucose homeostasis is limited. As compared to older children and
adults, infants have limited reserves of liver glycogen and muscle protein coupled with their
relative higher rate of glucose utilization due to their larger brain to body ratio.12 Assessment of
blood glucose should be done once infants and toddlers present to the emergency room.
Low socioeconomic status was found to be another risk factor for hypoglycaemia. This may be
due to the fact that these are children who are exposed to hunger and malnutrition and hence
reduced liver and muscle glycogen. The stress of illness leads to faster depletion of these
glycogen stores hence increased risk of hypoglycaemia.12 Clinicians should therefore maintain
high index of suspicion of hypoglycaemia when children drawn from low socioeconomic status
present to the Emergency Room.
74
It was observed also that mortality was higher in children who were hypoglycaemic. This is also
in keeping with the contents of previous studies.5,114 The predominant diagnoses with high
mortality in children with hypoglycaemia in the present study were meningitis, acute
gastroenteritis, sepsis, and severe malaria. These are also in keeping with reports from other
previous studies. These diseases are intrinsically associated with high mortality and occurrence
with hypoglycaemia would only have worsened the situation.
The results obtained with a glucometer were comparable with laboratory results. With reference
to the diagnosis of hypoglycaemia, the glucometer compared to glucose oxidase test had 100%
specificity and 100% positive predictive value. The sensitivity and negative predictive values
were also very high for both capillary and venous samples. The overall implication of these is
that the user of a glucometer is assured that a diagnosis of hypoglycaemia using a glucometer is
accurate. It therefore could be used as a tool for bedside diagnosis.
Comparison of the results from capillary blood with venous samples revealed negligible
differences in their values. In the main, capillary sample gave higher results but the differences
were not statistically significant. The implication is that results obtained with either sample are
reliable and the physician is at liberty to choose any of the methods as may be convenient.
In conclusion, the prevalence of hypoglycaemia in the emergency room dictates the maintenance
of a high index of suspicion. The index should be higher in younger children and those from low
socioeconomic classes. Patients presenting with protein energy malnutrition, suspected sepsis,
gastroenteritis, meningitis or malaria should also receive extra attention. The bedside tool
(glucometer) used in the study produced sufficiently high sensitivity, specificity, positive
predictive value and negative predictive value results to merit recommendation for routine use.
75
Both capillary and venous glucometer samples produced reliable results; hence either sample can
be used to assess blood glucose level in the emergency room as may be convenient.
76
CONCLUSIONS
1. The prevalence of hypoglycaemia in children at admission in the Emergency Paediatric
Unit of FMC Owerri is high (7.5%).
2. The prevalence of hypoglycaemia was higher in younger children (aged below three
years).
3. Protein-energy malnutrition, sepsis, gastroenteritis and severe malaria were associated
with high prevalence of hypoglycaemia.
4. Hypoglycaemia is associated with increased mortality.
5. There is a strong positive correlation between capillary blood glucose, venous blood
glucose estimated using glucometer and glucose oxidase method.
6. Venous blood glucose and capillary blood glucose measured with “One-Touch” Ultra 2®
have 100% specificity and high positive predictive values for detecting hypoglycaemia.
They also have high sensitivity values.

77
RECOMMENDATIONS
1. Random blood glucose estimation should be done routinely for all sick under-5 children
on admission in emergency rooms.
2. Glucometers including the One-Touch Ultra 2® is recommended for screening and
monitoring of hypoglycaemia in children admitted into the emergency room.
78
LIMITATION
Children who had received glucose containing intravenous fluids within 6 hours before admision
were excluded from the study.
79
LINES OF FUTURE RESEARCH
1. A study of hyperglycaemia in emergency admissions and evaluation of its effects on
morbidity and mortality is advocated.
2. A longitudinal study incorporating follow up of the patients who had hypoglycaemia
could be invaluable.

80
REFERENCES
1. Depuy AM, Coassolo KM, Carlet JC. Neonatal hypoglycaemia in term, non-diabetic
pregnancies. Am J Obstet Gynecol 2009; 200: 45-51.
2. Mohammod JC, Tahmeed A, Hassan A, Abu SGF, Sayeeda H, Iqbal H. Diabetes-Damages
and Treatments. In Everlon R (ed). Hypoglycaemia in Children Attending Critical Care
Medicine in Developing Countries. 1st (ed). In Tech; China: 2009; 3-41.
3. Cornblath M, Howdon J M, Williams A F. Controversies regarding the definition of neonatal
hypoglycaemia: suggested operational thresholds. Pediatrics 2000; 105: 1141-1145.
4. Koh THHG, Aynsley- Green A, Tarbit M, Eyre JA. Neural dysfunction during
hypoglycaemia. Arch Dis Child 1988; 63: 1353-1358.
5. Elusiyan JBE, Adeyujigbe EA, Adeodu OO. Hypoglycaemia in a Nigerian peadiatric
emergency ward. J Trop Paediatr 2006; 52: 96-102.
6. Solomon T, Felix TM, Samuel M. Hypoglycaemia in paediatric admissions in Mozambique.
Lancet 1994; 343: 149-150.
7. Osier FH, Berkley JA, Saunderson F. Abnormal blood glucose concentration on admission
to a rural Kenya district hospital: prevalence and outcome. . Arch Dis Child 2003; 88: 621-
625.
8. Behzad N, George M, Ben A. Blood glucose as a predictor of mortality in children admitted
to the hospital with febrile illness inTanzania. Am J Trop Med Hyg, 2013; 89: 232-237.
9. Akpede GO, Olomu SC, Shatima DR, Dawodu SO, Olu-Edo AN, Adeodu OO.
Hypoglycaemia in acute bacterial meningitis. Nig J Paediatr 2002; 29: 88-89.
81
10. Bennish ML, Azad AK, Rahman O, Philips RE. Hypoglycaemia during diarrhoea in
childhood. prevalence, pathophysiology and outcome. N Engl J Med 1990; 322:1357-1363.
11. Watson AR, Coovadia HM, Bhoola KD. The clinical syndrome of impilia (Calipes Laureola)
poison in children. Afr J Med 1979; 55: 290-292
12. Thornton TS, Finegold DN, Stanley CA. Hypoglycaemia in the Infant and Child. In: Sperling
MA (ed) Paediatric Endocrinology. 2nd edn. Saunders; Philadelphia: 2002.135-159.
13. Mark AS. Hypoglycaemia. In: Robert M, Kleigman MD (editors) Nelson Textbook of
Pediatrics. 15th edn. WB Suanders; Philadelphia: 1996: 420-430.
14. Cresto AC, Abdenor JP, Bergada I, Martino RI. Long term follow up of persistent
hyperinsulinaemic hypoglycaemia of infancy. Arch Dis Child 1998; 79: 440-444.
15. Duvanel CB, Fawer C, Cotting J. Long term effects of neonatal hypoglycaemia on brain
growth and psychomotor development in a small for gestational age infants. J Pediatr 1999;
134: 492-498.
16. Harworth JC, McRea KN. The neurological and developmental effects of neonatal
hypoglycaemia, a follow up of 22 cases. Canadian Med J 1965; 92: 861-865.
17. World Health Organization. Management of the Child with Serious Infection or Severe
Malnutrition. Guidelines at the First Referral Level in Developing Countries. Geneva 2000;
56-60.
18. Miller SI, Wallace RJ, Musher DM, Septimus EJ, Kohl S, Baughn RE. Hypoglycaemia as a
manifestation of sepsis. Am J Med 1980; 68: 649-654.
19. Omene JA. The incidence of neonatal hypoglycaemia in Benin. Nig J Paediatr 1977; 4: 19-
23.
82
20. Frank-Briggs AI, Ojule AC, Nkanginieme KE. Neonatal hypoglycaemia. Prevalence and
clinical manifestations in Port Harcourt. PHMJ 2008: 2; 166-170.
21. Whipple AO, Fratz DK. Adenoma of islets cells with hyperinsulinism: a review. Ann Surg
1935; 101: 1299-1310.
22. Sacks DB. Carbohydrates. In: Burtis CA, Ashwood ER (eds).Tietz Fundamentals of Clinical
Chemistry. 5th (edn). W B Saunders; London: 2001. 776-785.
23. Scott PA, Wolf LR, Spadafora MP. Acuracy of reagent strip in detecting hypoglycaemia In
emergency department. Ann Emerg Med 1998; 32: 305-309.
24. Ajala MO, Oladipo OO, Fasanmade OO, Adewole TA. Laboratory assessment of three
glucometers. Afr J Med Sci 2003; 32: 279-282.
25. Elusiyan JBE, Adeodu OO, Adejuyigbe EA. Evaluating the validity of a bedside method of
detecting hypoglycaemia in children. Paediatr Emerg Care 2006; 22: 488-490.
26. Stryer L. Glucose Metabolism. In: Jeremy MB, (ed) Lehninger Principle of Biochemistry. 4th
edn. Freeman W; New York: 1995 pp 213-255.
27. Goodacre R, Vaidianathan s, Dunn WF. Acquiring and understanding global metabolite data.
USN Library of Medicine 2004; 22: 245-252.
28. He W, Miao FJ, Lin DC. Citric acid cycle intermediates as ligands for orphan protein-
coupled receptors. Nature. 2004 13; 188-193.
29. Cryer PE, Glucose Homeostasis and Hypoglycaemia. In: Wilson JD, Foster DW. (eds).
Williams Textbook of Endocrinology. WB Saunders 1992; 1223-1253.
30. Drunker DJ. Mini review: the glucagon-like peptides. Endocrinology. 2001; 142: 521-527.
31. Ogawa A, Harris V, McCorkle SK, Luskey KL. Amylin secretion from the rat pancreas and
its selective loss after streptozocin treatment. J Clin Invest. 1990: 85; 973-976.
83
32. Lucas A, Morley R, Cole TJ. Adverse neurodevelopmental outcome of moderate neonatal
hypoglycaemia. Br Med J 1988; 297: 1304-1308.
33. Nwosu SU, Lesi FEA, Mafe AG, Egri-Okwaji MTC. Hypoglycaemia in children with
cerebral malaria seen at Lagos State University Teaching Hospital: predisposing factors. Nig
Med J 2004; 45: 9-13.
34. Adamson SJ, Alessandri LM, Badwi N, Burton PR, Pemberton PJ, Stanley F. Predictors of
neonatal encephalopathy in full term infants. BMJ.1995; 311: 598-602.
35. Tita AT, Landom MB, Spong CY. Timing of elective repeat caesarian delivery at term and
neonatal outcomes, N Engl J Med 2009; 360: 111-120.
36. Alkalay L, Sanart HB, Flores-Sanart L, Elashoff JD, Farber SJ, Simmons CF. (2006).
Population meta-analysis of low plasma glucose thresholds in full term normal newborns.
Am J Perinatol 2006; 23: 115-119.
37. Lubchenco LO, Bard H. Incidence of hypoglycaemia in newborn infants classified by birth
weight and gestational age. Paediatrics 1971; 47:831-838.
38. Cornblath M, Schwartz R. Disorders of Carbohydrate Metabolism in Infancy. 2nd edn. W B
Saunders, Philadelphia, 1976: 3-27.
39. White NJ, Warrel DA, Chanthavanich P, Laoreesuwan S, Warrel MJ, Krishma S, et al.
Severe hypoglycaemia and hyperinsulinaemia in falciparum malaria. N Engl J Med 1983;
309: 61-63.
40. Chan MCK. The Fetus and the Newborn. In: Hendrickse RG, Barr DGD, Mathews TS (eds).
Paediatrics in the Tropics. Blackwell Scientific Publications; London: 1991: 151-212.
41. Srinivasan G, Pildes RS, Cattamanchi G, Voora S, Lilien LD. Plasma glucose values in
normal neonates: a new look J Pediatr 1986; 109: 114-117.

84
42. Pal DK, Manandhar DS, Rajbandari R, Land LM, Patel N, de Costello AM. Neonatal
hypoglycaemia in Nepal: prevalence and risk factors. Arch Dis Child (Fetal Neonate ed).
2000; 82: F46-51.
43. William AF. Hypoglcaemia of the Newborn: Review of the Literature.: WHO; 1997.
44. Guideline (2004) Newborn Nursery QI Committee. Portland (ME): The Barbara Bush
Children’s Hospital at Maine Medical Centre; 2004 Jul. Neonatal hypoglycaemia: Initial and
Follow up Management National Guideline Clearinghouse.
45. Ofovwe EG, Eregie OC. Nutritional status and blood glucose level in African children aged 6
months to five years with severe malaria. CHISA 2004; 1: 13-18.
46. Anderson S, Shakaya KN, Shrestha LN, de Costello AM. Hypoglycaemia: A common
problem among uncomplicated newborn infants in Nepal. J Trop Paediatr 1993; 39: 273-277.
47. Njokanma OF, Fagbule D. Incidence, aetiology and manifestation of neonatal
hypoglycaemia. Nig J Paediatr 1994; 21: 26-31.
48. Bhattacharya SK, Bhattacharya MK, Dutta D, Garg S, Mukhopadhyay AK, Deb M, et al.
Vibrio cholera 0139 in Canada. Arch Dis Child 1994; 71: 161-162.
49. Onyiriuka AN, Awaebe PO, Kouyate M. Hypoglycaemia at point of hospital admission of
under-five children with acute diarrhoea: prevalence and risk factors. Nig J Paediatr 2013;
40: 384-388.
50. Ntia HN, Anah MU, Udo JJ, Ewa AU, Onubi J. Prevalence of hypoglycaemia in under-five
children presenting with acute diarrhoea in University of Calabar Teaching Hospital,
Calabar. Nig J Paediatr 2012; 39: 63-66.
85
51. Onyiriuka NO, Olasimbo OP, Onyiriuka LC, Patience OA, Onyiriuka FU. Point-of-
admission hypoglycaemia among under-five Nigerian children with Plasmodium falciparum
malaria: prevalence, risk factors. Med J Islam Repub Iran. 2012; 26: 78-84.
52. English M, Wale S, Binns G, Mwangi I, Sauerwein H, Maersh K. Hypoglycaemia on and
after admission in Kenyan children with severe malaria. Q J Med 1998; 91: 191-197.
53. Reid S, Losek KJ. Hypoglycaemia complicating dehydration in children with acute
gastroenteritis. J Emerg Med 2005; 2: 141-145.
54. Faustino EV, Bogue WE. Relationship between hypoglycaemia and mortality in critically ill
children. Pediatr Crit Care Care Med 2012; 11: 690-698.
55. Cornblath M, Ichord R. Hypoglycaemia in the neonate. Semin Perinatol, 2000; 24: 136-149.
56. Chisti M J, Bardhan T, Faruque AS, Saha S, Salam MA Islam S. (2009a) Factors associated
with sclerema in infants with diarrheal disease: a matched case-control study. Acta Paediatr,
98: 873-878.
57. Bondi FS. Childhood coma in Ibadan. relationship to socioeconomic factors. Trop. Med
1991; 43: 228-292.
58. Oyebola DDO. Cow’s urine concoction: its chemical composition, pharmacological actions
and mode lethality. Afr J Med Sci 1983; 12: 57-63.
59. Oyedeji GA. The effect of socioeconomic factors on incidence and severity of gastroenteritis
in Nigerian children. Nig Med J 1987; 4: 229-232
60. Oyedeji GA, Oyedeji OA, Ogunlesi TA, Okeniyi JAO. The influence of maternal
socioeconomic on the management of malaria in their children: implication for the ‘Roll
Back Malaria initiative. Nig J Paediatr 2005: 32; 40-46.
86
61. Olusanya O, Okpere E, Ezimokhai M. The importance of socioeconomic class in voluntary
fertility control in a developing country. W Afr J Med 1985; 4: 205-212.
62. Bandsma RH, Mendel M, Spoelstra MN. Mechanism behind decreased endogenous glucose
production in malnourished children. Paediatr Res. 2010; 68: 423-428.
63. Feighn RD, Garg R. Interaction of Infection and Nutrition. In 2nd edn. Textbook of
Paediatric Infections. W B/ Saunders Company, Philaldelphia; 1987: 1743-1744.
64. Bennish Ml, Azad AK, Rahman O, Philip RE. Hypoglycaemia during diarrhoea in childhood.
Prevalence, pathophysiology, and outcome. N Engl J Med.1990; 322: 1357-1363.
65. Butler T, Arnold M, Islam M. (1989). Depletion of hepatic glycogen in the hypoglycaemia
fatal childhood diarrheal illnesses. Trans R Soc Trop Med Hyg, 1989; 83: 839-843.
66. White NJ, Marsh K, Turner RC. Hypoglycaemia in African children with severe malaria.
Lancet 1987; 1: 208-211.
67. Taylor TE, Molyneux ME, Wirima JJ, Fletcher A, Morris K. Blood glucose level in
Malawian children before and during the administration of intravenous quinine for severe
falciparum malaria. N Engl J Med 1988; 319: 1040-1046.
68. Walter WK, Myron JT. Malabsorption in plasmodium falciparum malaria. Am J Trop Med
Hyg 1972; 21: 1-5.
69. Molyneux ME, Looareesuwan S, Menzies IS Grainger SL, Philips RE, Wattanagoon Y,
Thompson R P, Warrell D A. Reduced hepatic blood flow and intestinal malabsorption in
severe falciparum malaria. Am J Trop Med Hyg 1989; 40: 470-476.
70. Luse SA, Miller LH. Plasmodium falciparum malaria: ultrasructure of parasitized
erythrocytes in cardiac vessels. Am J Trop Med Hyg 1971; 20: 655-660.
87
71. Macpherson GG, Warrell MJ, White NJ, Looarreesuwan S, Warrell DA. Human cerebral
malaria: a quantitative ultrastructure analysis of parasitized erythrocyte sequestration. Am J
Pathol 1985: 1; 385-401.
72. White NJ, Looarreesuwan S, Warrell DA, Chinthavanich P, Philip RE, Pongpaew P.
Pathophysiological and prognostic significance of cerebrospinal fluid lactate in cerebral
malaria. Lancet 1985: 1; 776-778.
73. Filkins JP, Cornell RP. Depression of hepatic gluconeogenesis and the hypoglycaemia of
endotoxic shock. Am J Physiol 1974; 227: 778-781.
74. Yelich MR, Filkins JP. Mechanism of hyperinsulinaemic endotoxicosis. Am J Physiol 1980;
239: E156-161.
75. Nelson DL, Cox MM. The Molecular Logic of Life. In: David L, Nelson D L (eds).
Lehninger Principles of Biochemistry. 3rd edn. Worth; New York: 2000: 3-19.
76. Yeung CY. Hypoglycaemia in neonatal sepsis. J Paediatr 1970; 77: 812-817.
77. Yeung CY, Lee VY, Yeung MB. Glucose disappearance rate in neonatal infection. J
Paediatr 1973; 82:486-489.
78. Hall A. Dangers of high dose quinine and over-hydration in severe malaria. Lancet 195; 1:
1453-1455.
79. Okitoloda W, Delacollete C, Malengrea R, Henquin JC. High incidence of hypoglycaemia in
African patients treated with intravenous quinine for severe malaria. BM J 1987; 295: 716-
718.
80. Jones RG, Sue-Ling HM, Kaer C, Wiles PG, Quirk P. Severe symptomatic hypoglycaemia
due to quinine therapy J Roy Soc Med 1986; 79: 426-428.
88
81. Asindi AA. Poisoning. In: Azubuike JC, Nkanginieme KEO, (eds). Paediatrcs and Child
Health in a Tropical Region. African Educational Services; Owerri: 1999: 485-489.
82. Fang V, Foye WO, Robinson SM, Summer M, Robinson T, Howard JJ. Hypoglcaemic
activity and chemical structure of salicylates. J Pharm Sci 1968; 57: 2111-2116.
83. Ernst AA, Jones K, Nick TJ, Sanchez J. Ethanol ingestion and related hypoglycaemia in
paediatric and adolescent emergency department population. Acad Emerg Med 1996; 3: 46-
49.
84. Mayefsky JH, Sarnak AP, Postellon DC, Daniel C. Factitious hypoglycaemia. Paediatrics.
1982; 69: 804-805.
85. Gerich JE. Oral hypoglycaemic agents. N Engl J Med 1989; 321: 1231-1245.
86. Asindi AA. Accidental chemical poisoning in Calabar. Nig J Paediatr 1984; 11: 19-22.
87. Familusi JB, Sinnette CH. Febrile convulsion in Ibadan children. Afr J Med Sci 1971; 2: 135-
149.
88. Cranmer H (2009) Paediatric Hypoglycaemia. In Shanon M, Slapper D, Windle ML,
Wolfram W, Halamek JD, Bachur RD. (eds). eMedicine.
89. Dunne M J, Cosgroove KE, Shephard RM, Aynsley-green A, Lindley KJ. Hyperinsulinism
in infancy: from basic science to clinical disease. Physiol Rev, 2004 84: 239-275.
90. Moritoki E, Ronaldo B, Edward S. Hypoglcaemia and outcome in critically ill patients. Mayo
Clinic Mar 2010; 85: 217-224.
91. Mayne PD. Clinical Chemistry in Diagnosis and Treatment of Hypoglyaemia. 6th edn.
Edward A, London: 1994: p 217.
92. Sacks DB, Carbohydrate In Burtis CA, Ashwood ER, (eds). Tietz Fundamentals of Clinical
Chemistry. 5th edn. WB Saunders, Philadelphia: 2001: 445-446.
89
93. Pileggi VJ, Szustkiewicz CP. Carbohydrate In: Henry RJ, Canon DC, Winkelman JW, eds.
Clinical Chemistry Principles and Techniques. 2nd edn. Harper and Row: Hagerstown, 1974:
1265-1295.
94. Bergmeyer HU. Methods of Enzymatic Analysis Vol 3, 2nd English edn. Florida Verlag
Chemistry International, Deerfield Beach, 1974; 23-87.
95. Grazaitis DM, Sexson WR. Erroneously high dextrostix values caused by isopropyl alcohol.
Paediatrics 1980; 66: 221-222.
96. Togari H, Oda M, Wada Y. Mechanism of erroneous dextrostix readings. Arch Dis Child
1987; 62: 408-409.
97. Fontaine G, Farriaux JP,Hongre JF. Value of dizoxide in treatment of neonatal
hypoglycaemia. Nouv Presse Med, 1972; 1: 50-54.
98. Laditan AAO, Johnson AOK. Nutritional and Nutritional Assessment In: Azubuike JC,
Nkanginieme KEO. eds Paediatics and Child Health in a Tropical Region. African
Educational Services Owerri, Nigeria. 1999: 162-165.
99. Kliegman RM. Problems in Metabolic Adaptation; Glucose, Calcium and Magnesium. In:
Klaus MH, Fanaroff AA, (eds). Care of High-Risk Neonate 5th edn. WB Saunders
Companies, Philadelphia: 2003: 17-18.
100. Volpe JJ. Hypoglycaemia and Brain Iinjury. In: Volpe JJ (ed). Neurology of newborn. 4th
edn. WB Saunders; Philadelphia: 2001: 497-520.
101. Wintergerst KA, Burckingham B, Gandrud L, Wong BJ, Kach S, Wilsom DM. Association
of hypoglycaemia, hyperglycaemia and glucose variability with morbidity and deaths in
paediatric intensive care unit. Paediatric 2006; 118: 173-179.

90
102. Reid SR, Losek JD, Giddeon Bosker (eds). Hypoglycaemia complicating dehydration in
children with acute gastroenteritis. J Emerg Med 2005; 2: 141-145.
103. Idro R, Carter JA, Fegan G, Neville BGR, Newton CRJC. Risk factors for persisting
neurological and cognitive impairments following cerebral malaria. Arch Dis Child 2006; 91:
142-148.
104. Halamek L P, Stevenson D K, Neonatal hypoglycaemia part II: pathophysiology and
therapy. Clin Paeditr, 1998; 37: 11-16.
105. Fluge G. Neurological findings at follow up in neonatal hypoglycaemia. Acta Paediatr Scand
1975; 64: 629-634.
106. Federal Republic of Nigeria Official Gazette Lagos 15th May, 2007; 94.
107. St George’s Hospital Medical School. Statistics Guide for Grant Applicants.
www.sghms.ac.uk/depts/phs/size.
108. Oyedeji GA. Socioeconomic and cultural background of hospitalized children in Ilesha Nig J
Paediatr 1985; 12: 111-117.
109. Ogunlesi TA, Dedeke IOF, Kupuniyi OT. Socio-economic classification of children
attending specialist paediatric centres in Ogun State Nigeria. Nig Med Pract, 2008; 54: 21-25.
110. Zulfiqar AB. Acute Gastroenteritis in Children. In: Robert M, Kleigman MD (eds) Nelson
Textbook of Pediatrics. 18th edn. WB Saunders; Philadelphia: 2011: 1323-1337.
111. Maria AE, Keith RP. Sepsis, Septic Shock and Systemic Inflammatory Response Syndrome.
In: Robert M, Kleigman MD (eds) Nelson Textbook of Pediatrics. 19th edn: WB Saunders;
London: 2011: 637-648.
91
112. Ulasi TO, Ebenebe J. Nutritional Disorders in Childhood. In: Azubuike JC, Nkanginieme
KEO (eds), Paediatrc and Child Health in a Tropical Region. African Educational Services
Owerri, Nigeria. 2007: 250-267.
113. Pershad J, Monroe K, Atchison J.Childhood hypoglycaemia in an urban emergency
department: epidemiology and diagnostic approach to the problem. Paediatr Emerg Care
1998; 14: 268-271.
114. Oyenusi EE, Oduwole AO, Oladipo OO, Njokanma OF, Esezobor CI. Hypoglycaemia in
children aged 1 month to 10 years admitted to children’s emergency centre of Lagos State
University Teaching Hospital. S Afr J CH 2014; 8: 107-111.

92
APPENDIX II
CONSENT FORM
Sir/ Madam,
My name is Dr Osuji Augustine Emeka of the Paediatrics Department of Federal Medical Centre, Owerri.
I am doing a study on Hypoglycaemia also known as low blood sugar in Children admitted into the
Emergency Paediatric Unit of FMC, Owerri. Low blood sugar is common in children who are sick
enough to be admitted and can worsen the final outcome of the illness. In this research, I am trying to find
out the number of admitted patients that have hypoglycaemia. If it is found that your child has
hypoglycaemia, it will be corrected immediately to prevent complications that come with it. This is
because low blood sugar can delay recovery or lead to a poor outcome even after recovery, but if
detected and corrected early, there is usually better outcome. This test will be done once and will not
affect your child’s treatment for the illness that brought him.
I will need to ask questions about you and your family, your child’s illness, how long the child has been
sick and the treatment received before presentation. A needle prick will be made at your child’s heel to
get a drop of blood for blood sugar estimation. I will also collect 2mls of blood, for further blood sugar
estimation. Blood sugar estimation is one of the necessary tests your child should do on admission and it
is safe and will not cause any harm to your child except slight pain from needle prick during blood
collection. Both the test that will be done here and the one that will be done at the laboratory will be at no
cost to you and your child. Please be informed that your child must not take part in this study and not
taking part in the study will not affect his treatment in any way. You are also free to withdraw your child
at any stage of the study.
If you have understood the explanations, and you are willing to allow your child to participate in the
study, kindly sign at the end of this letter. Feel free visit me at the department of Paediatrics, Federal
Medical Centre, Owerri in case you have any question subsequently. You can also contact me through
this number: 08037977010.
Name of Child
……………………………………………………………………………………………………………
Name of parent/ guardian
………………………………………………………………………………………………………………
Signature of parent/ guardian……………………………………………………………………….
Date……………………………………………………………………
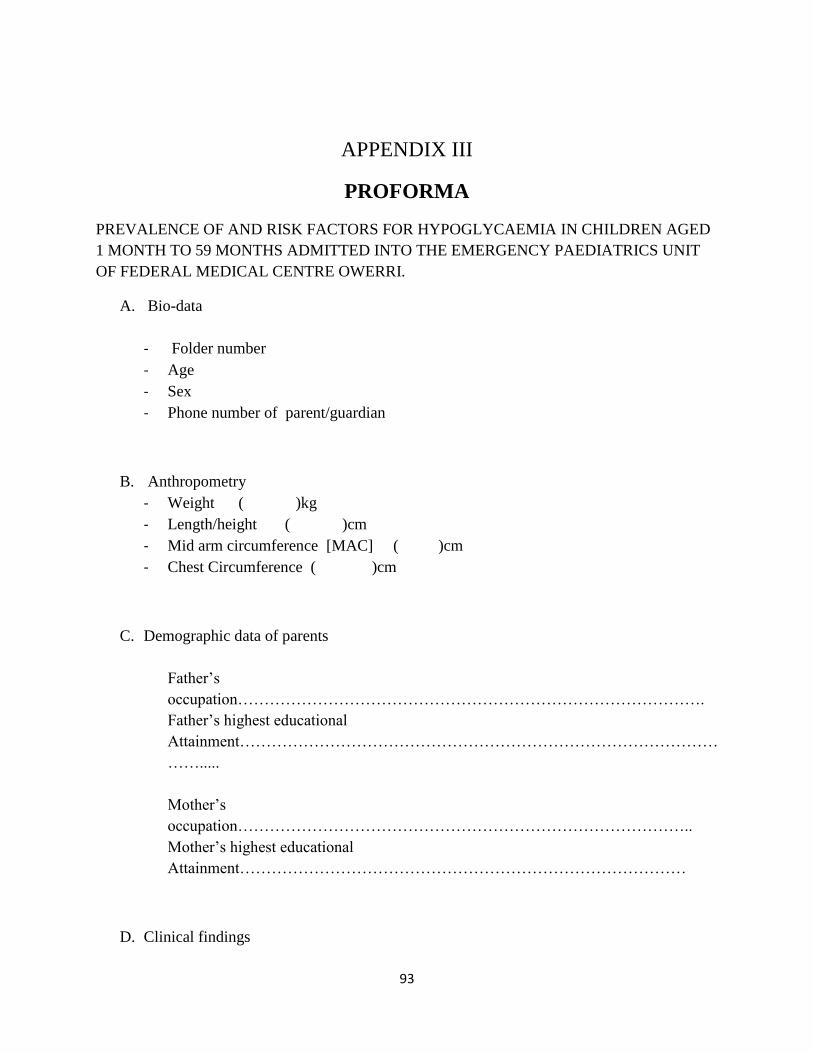
93
APPENDIX III
PROFORMA
PREVALENCE OF AND RISK FACTORS FOR HYPOGLYCAEMIA IN CHILDREN AGED
1 MONTH TO 59 MONTHS ADMITTED INTO THE EMERGENCY PAEDIATRICS UNIT
OF FEDERAL MEDICAL CENTRE OWERRI.
A. Bio-data
- Folder number
- Age
- Sex
- Phone number of parent/guardian
B. Anthropometry
- Weight ( )kg
- Length/height ( )cm
- Mid arm circumference [MAC] ( )cm
- Chest Circumference ( )cm
C. Demographic data of parents
Father’s
occupation…………………………………………………………………………….
Father’s highest educational
Attainment………………………………………………………………………………
…….....
Mother’s
occupation…………………………………………………………………………..
Mother’s highest educational
Attainment…………………………………………………………………………
D. Clinical findings
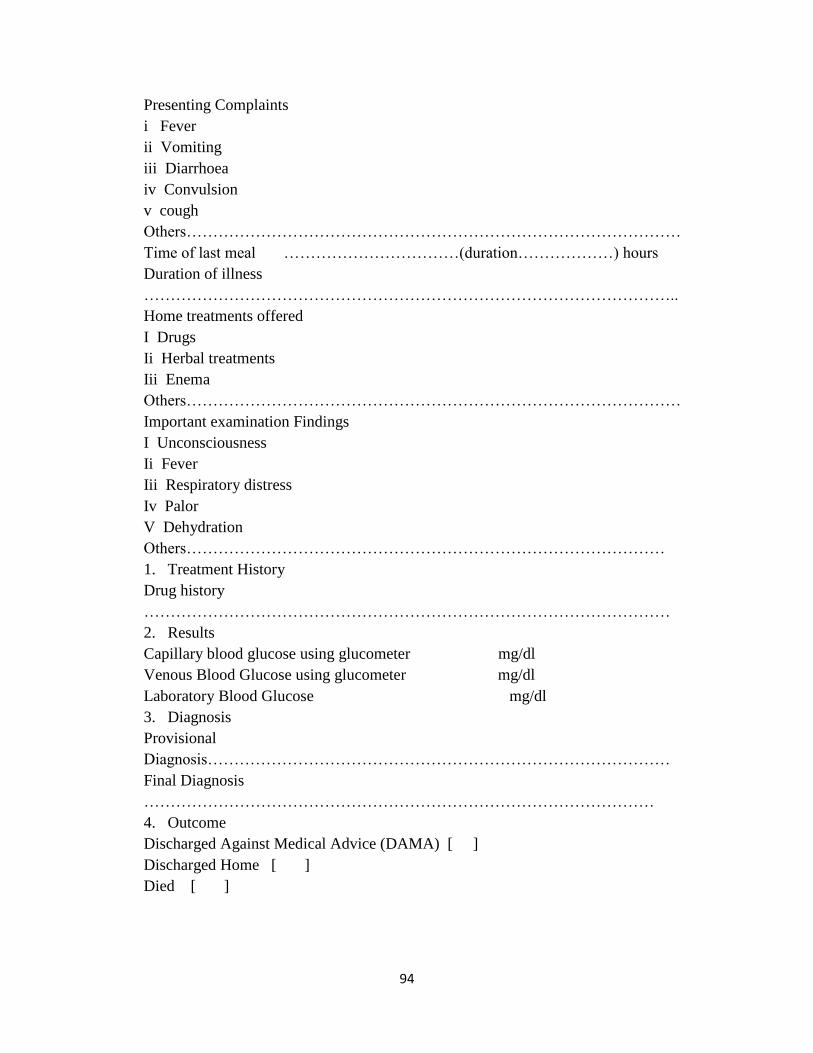
94
Presenting Complaints
i Fever
ii Vomiting
iii Diarrhoea
iv Convulsion
v cough
Others…………………………………………………………………………………
Time of last meal ……………………………(duration………………) hours
Duration of illness
………………………………………………………………………………………..
Home treatments offered
I Drugs
Ii Herbal treatments
Iii Enema
Others…………………………………………………………………………………
Important examination Findings
I Unconsciousness
Ii Fever
Iii Respiratory distress
Iv Palor
V Dehydration
Others………………………………………………………………………………
1. Treatment History
Drug history
………………………………………………………………………………………
2. Results
Capillary blood glucose using glucometer mg/dl
Venous Blood Glucose using glucometer mg/dl
Laboratory Blood Glucose mg/dl
3. Diagnosis
Provisional
Diagnosis……………………………………………………………………………
Final Diagnosis
……………………………………………………………………………………
4. Outcome
Discharged Against Medical Advice (DAMA) [ ]
Discharged Home [ ]
Died [ ]

95
APPENDIX IV
CLASSIFICATION OF SOCIAL CLASS108
A. Demographic data of parents
1. Mother or Father’s occupation
Senior Public Servant (I)
Professional Managers/ Large Scale Trader, Intermediate Grade Public Servants (II)
Senior School Teachers, Junior School Teachers/ Drivers/ ArtisanS (III)
Petty Traders/ Labourers/ Messengers (IV)
Unemployed/ Full Time Housewife/ Students (V)
2. Mother or Father’s Educational Attainment
University Graduate Equivalent (I)
School Certificate Holder with Professional Training (II)
School Certificate or its Equivalent (III)
Modern Junior Secondary 3 and Primary 6 Certificate Holder(IV)
Illiterate (V)
3. Social Class Of Parents
Father’s score (score in 1+score in 2) + Mother’s score (score in 1+score in 2)/4
Social Class = I
Social Class = II
Social Class = III
Social Class = IV
Social Class = V

96