The challenges of genome-wide interaction studies: lessons to learn from the analysis of HDL blood...
13
The Challenges of Genome-Wide Interaction Studies: Lessons to Learn from the Analysis of HDL Blood Levels Elisabeth M. van Leeuwen 1 , Franc ¸oise A. S. Smouter 1 , Tony Kam-Thong 2 , Nazanin Karbalai 2 , Albert V. Smith 3 , Tamara B. Harris 4 , Lenore J. Launer 4 , Colleen M. Sitlani 5 , Guo Li 5 , Jennifer A. Brody 5 , Joshua C. Bis 5 , Charles C. White 6 , Alok Jaiswal 7 , Ben A. Oostra 8 , Albert Hofman 9 , Fernando Rivadeneira 10 , Andre G. Uitterlinden 10 , Eric Boerwinkle 11 , Christie M. Ballantyne 12 , Vilmundur Gudnason 3 , Bruce M. Psaty 13 , L. Adrienne Cupples 6,14 , Marjo-Riitta Ja ¨ rvelin 15,16,17,18,19 , Samuli Ripatti 7,20,21 , Aaron Isaacs 1 , Bertram Mu ¨ ller-Myhsok 2,22,23 , Lennart C. Karssen 1 , Cornelia M. van Duijn 1 * 1 Genetic Epidemiology Unit, Department of Epidemiology, Erasmus Medical Center, Rotterdam, the Netherlands, 2 Max Planck-Institute of Psychiatry, Munich, Germany, 3 Icelandic Heart Association, Kopavogur, Iceland and University of Iceland, Reykjavik, Iceland, 4 Laboratory of Epidemiology, Demography, and Biometry, National Institute on Aging, National Institutes of Health, Bethesda, Maryland, United States of America, 5 Cardiovascular Health Research Unit and Department of Medicine, University of Washington, Seattle, WA, United States of America, 6 Department of Biostatistics, Boston University School of Public Health, Boston, Massachusetts, United States of America, 7 Institute for Molecular Medicine Finland (FIMM), University of Helsinki, Helsinki, Finland, 8 Department of Clinical Genetics, Erasmus Medical Center, Rotterdam, the Netherlands, 9 Department of Epidemiology, Erasmus Medical Center, Rotterdam, the Netherlands, 10 Departments of Epidemiology and Internal Medicine, Erasmus Medical Center, Rotterdam, the Netherlands, 11 University of Texas Health Science Center School of Public Health, Human Genetics Center, Houston, TX, United States of America, 12 Department of Medicine, Baylor College of Medicine, Houston, TX, United States of America, 13 Departments of Epidemiology, Medicine and Health Services, University of Washington, Seattle, WA, United States of America and Group Health Research Institute, Group Health, Seattle, WA, United States of America, 14 Framingham Heart Study, Framingham, Massachusetts, United States of America, 15 Department of Epidemiology and Biostatistics, MRC Health Protection Agency (HPA) Centre for Environment and Health, School of Public Health, Imperial College London, London, United Kingdom, 16 National Institute for Health and Welfare, Oulu, Finland, 17 Biocenter Oulu, University of Oulu, Oulu, Finland, 18 Institute of Health Sciences, University of Oulu, Oulu, Finland, 19 Unit of Primary Care, Oulu University Hospital, Oulu, Finland, 20 Wellcome Trust Sanger Institute, Hinxton, Cambridge, United Kingdom, 21 Hjelt Institute, University of Helsinki, Helsinki, Finland, 22 Munich Cluster fu ¨ r Systems Neurology (Synergy), Munich, Germany, 23 Institute of Translational Medicine, University of Liverpool, Liverpool, United Kingdom Abstract Genome-wide association studies (GWAS) have revealed 74 single nucleotide polymorphisms (SNPs) associated with high- density lipoprotein cholesterol (HDL) blood levels. This study is, to our knowledge, the first genome-wide interaction study (GWIS) to identify SNP 6 SNP interactions associated with HDL levels. We performed a GWIS in the Rotterdam Study (RS) cohort I (RS-I) using the GLIDE tool which leverages the massively parallel computing power of Graphics Processing Units (GPUs) to perform linear regression on all genome-wide pairs of SNPs. By performing a meta-analysis together with Rotterdam Study cohorts II and III (RS-II and RS-III), we were able to filter 181 interaction terms with a p-value,1 ? 10 28 that replicated in the two independent cohorts. We were not able to replicate any of these interaction term in the AGES, ARIC, CHS, ERF, FHS and NFBC-66 cohorts (N total = 30,011) when adjusting for multiple testing. Our GWIS resulted in the consistent finding of a possible interaction between rs774801 in ARMC8 (ENSG00000114098) and rs12442098 in SPATA8 (ENSG00000185594) being associated with HDL levels. However, p-values do not reach the preset Bonferroni correction of the p-values. Our study suggest that even for highly genetically determined traits such as HDL the sample sizes needed to detect SNP 6 SNP interactions are large and the 2-step filtering approaches do not yield a solution. Here we present our analysis plan and our reservations concerning GWIS. Citation: van Leeuwen EM, Smouter FAS, Kam-Thong T, Karbalai N, Smith AV, et al. (2014) The Challenges of Genome-Wide Interaction Studies: Lessons to Learn from the Analysis of HDL Blood Levels. PLoS ONE 9(10): e109290. doi:10.1371/journal.pone.0109290 Editor: Joel S. Bader, Johns Hopkins University, United States of America Received July 28, 2014; Accepted August 29, 2014; Published October 20, 2014 This is an open-access article, free of all copyright, and may be freely reproduced, distributed, transmitted, modified, built upon, or otherwise used by anyone for any lawful purpose. The work is made available under the Creative Commons CC0 public domain dedication. Data Availability: The authors confirm that, for approved reasons, some access restrictions apply to the data underlying the findings. This study makes use of the data of seven cohorts: AGES, ARIC, CHS, ERF, FHS, RS and NFBC66. The genotype and phenotype data of these cohorts cannot be made fully available without restrictions. The genotype and phenotype data of the ARIC (dbGaP Study Accession: phs000280.v2.p1), CHS (dbGaP Study Accession: phs000287.v3.p1), FHS (dbGaP Study Accession: phs000007.v23.p8 ) and NFBC66 (dbGaP Study Accession: phs000276.v2.p1) studies are available via dbGaP. Due to restrictions based on privacy regulations and informed consent of participants, data cannot be made freely available in a public repository for both the Rotterdam Study and the Erasmus Rucphen Family Study. Data of these studies can be obtained upon request. Requests should be directed towards the management team of the Rotterdam Study ([email protected]) or the Erasmus Rucphen Family Study ([email protected]), which has a protocol for approving data requests. Due to Icelandic privacy standards, genotypic information is considered identifiable information and therefore cannot be shared. Data of this study can be obtained upon request. Requests should be directed towards Vilmundur Gudnason ([email protected]). Funding: This project was supported by the CHANCES project funded in the FP7 framework programme of DG-RESEARCH in the European Commission (grant no. 242244) and by BBMRI-NL, a Research Infrastructure financed by the Dutch government (NWO 184.021.007). The Rotterdam Study is funded by Erasmus Medical Center and Erasmus University, Rotterdam, Netherlands Organization for the Health Research and Development (ZonMw), the Research Institute for Diseases in the Elderly (RIDE), the Ministry of Education, Culture and Science, the Ministry for Health, Welfare and Sports, the European Commission (DG XII), and the Municipality of Rotterdam. The generation and management of GWAS genotype data for the Rotterdam Study is supported by the Netherlands Organisation of Scientific Research NWO Investments (nr. 175.010.2005.011, 911-03-012). This study is funded by the Research Institute for Diseases in the Elderly (014-93-015; RIDE2), the Netherlands Genomics Initiative (NGI)/Netherlands Organisation for Scientific Research (NWO) project nr. 050-060-810. The ERF study as a part of EuroSPAN (European Special Populations Research Network) was supported by European Commission FP6 STRP grant number 018947 (LSHG-CT-2006-01947) PLOS ONE | www.plosone.org 1 October 2014 | Volume 9 | Issue 10 | e109290
-
Upload
independent -
Category
Documents
-
view
0 -
download
0
Transcript of The challenges of genome-wide interaction studies: lessons to learn from the analysis of HDL blood...
The Challenges of Genome-Wide Interaction Studies:Lessons to Learn from the Analysis of HDL Blood LevelsElisabeth M. van Leeuwen1, Francoise A. S. Smouter1, Tony Kam-Thong2, Nazanin Karbalai2,
Albert V. Smith3, Tamara B. Harris4, Lenore J. Launer4, Colleen M. Sitlani5, Guo Li5, Jennifer A. Brody5,
Joshua C. Bis5, Charles C. White6, Alok Jaiswal7, Ben A. Oostra8, Albert Hofman9,
Fernando Rivadeneira10, Andre G. Uitterlinden10, Eric Boerwinkle11, Christie M. Ballantyne12,
Vilmundur Gudnason3, Bruce M. Psaty13, L. Adrienne Cupples6,14, Marjo-Riitta Jarvelin15,16,17,18,19,
Samuli Ripatti7,20,21, Aaron Isaacs1, Bertram Muller-Myhsok2,22,23, Lennart C. Karssen1, Cornelia M. van
Duijn1*
1 Genetic Epidemiology Unit, Department of Epidemiology, Erasmus Medical Center, Rotterdam, the Netherlands, 2 Max Planck-Institute of Psychiatry, Munich, Germany,
3 Icelandic Heart Association, Kopavogur, Iceland and University of Iceland, Reykjavik, Iceland, 4 Laboratory of Epidemiology, Demography, and Biometry, National
Institute on Aging, National Institutes of Health, Bethesda, Maryland, United States of America, 5 Cardiovascular Health Research Unit and Department of Medicine,
University of Washington, Seattle, WA, United States of America, 6 Department of Biostatistics, Boston University School of Public Health, Boston, Massachusetts, United
States of America, 7 Institute for Molecular Medicine Finland (FIMM), University of Helsinki, Helsinki, Finland, 8 Department of Clinical Genetics, Erasmus Medical Center,
Rotterdam, the Netherlands, 9 Department of Epidemiology, Erasmus Medical Center, Rotterdam, the Netherlands, 10 Departments of Epidemiology and Internal
Medicine, Erasmus Medical Center, Rotterdam, the Netherlands, 11 University of Texas Health Science Center School of Public Health, Human Genetics Center, Houston,
TX, United States of America, 12 Department of Medicine, Baylor College of Medicine, Houston, TX, United States of America, 13 Departments of Epidemiology, Medicine
and Health Services, University of Washington, Seattle, WA, United States of America and Group Health Research Institute, Group Health, Seattle, WA, United States of
America, 14 Framingham Heart Study, Framingham, Massachusetts, United States of America, 15 Department of Epidemiology and Biostatistics, MRC Health Protection
Agency (HPA) Centre for Environment and Health, School of Public Health, Imperial College London, London, United Kingdom, 16 National Institute for Health and
Welfare, Oulu, Finland, 17 Biocenter Oulu, University of Oulu, Oulu, Finland, 18 Institute of Health Sciences, University of Oulu, Oulu, Finland, 19 Unit of Primary Care, Oulu
University Hospital, Oulu, Finland, 20 Wellcome Trust Sanger Institute, Hinxton, Cambridge, United Kingdom, 21 Hjelt Institute, University of Helsinki, Helsinki, Finland,
22 Munich Cluster fur Systems Neurology (Synergy), Munich, Germany, 23 Institute of Translational Medicine, University of Liverpool, Liverpool, United Kingdom
Abstract
Genome-wide association studies (GWAS) have revealed 74 single nucleotide polymorphisms (SNPs) associated with high-density lipoprotein cholesterol (HDL) blood levels. This study is, to our knowledge, the first genome-wide interaction study(GWIS) to identify SNP6SNP interactions associated with HDL levels. We performed a GWIS in the Rotterdam Study (RS)cohort I (RS-I) using the GLIDE tool which leverages the massively parallel computing power of Graphics Processing Units(GPUs) to perform linear regression on all genome-wide pairs of SNPs. By performing a meta-analysis together withRotterdam Study cohorts II and III (RS-II and RS-III), we were able to filter 181 interaction terms with a p-value,1 ? 1028 thatreplicated in the two independent cohorts. We were not able to replicate any of these interaction term in the AGES, ARIC,CHS, ERF, FHS and NFBC-66 cohorts (Ntotal = 30,011) when adjusting for multiple testing. Our GWIS resulted in the consistentfinding of a possible interaction between rs774801 in ARMC8 (ENSG00000114098) and rs12442098 in SPATA8(ENSG00000185594) being associated with HDL levels. However, p-values do not reach the preset Bonferroni correctionof the p-values. Our study suggest that even for highly genetically determined traits such as HDL the sample sizes needed todetect SNP6SNP interactions are large and the 2-step filtering approaches do not yield a solution. Here we present ouranalysis plan and our reservations concerning GWIS.
Citation: van Leeuwen EM, Smouter FAS, Kam-Thong T, Karbalai N, Smith AV, et al. (2014) The Challenges of Genome-Wide Interaction Studies: Lessons to Learnfrom the Analysis of HDL Blood Levels. PLoS ONE 9(10): e109290. doi:10.1371/journal.pone.0109290
Editor: Joel S. Bader, Johns Hopkins University, United States of America
Received July 28, 2014; Accepted August 29, 2014; Published October 20, 2014
This is an open-access article, free of all copyright, and may be freely reproduced, distributed, transmitted, modified, built upon, or otherwise used by anyone forany lawful purpose. The work is made available under the Creative Commons CC0 public domain dedication.
Data Availability: The authors confirm that, for approved reasons, some access restrictions apply to the data underlying the findings. This study makes use ofthe data of seven cohorts: AGES, ARIC, CHS, ERF, FHS, RS and NFBC66. The genotype and phenotype data of these cohorts cannot be made fully available withoutrestrictions. The genotype and phenotype data of the ARIC (dbGaP Study Accession: phs000280.v2.p1), CHS (dbGaP Study Accession: phs000287.v3.p1), FHS(dbGaP Study Accession: phs000007.v23.p8 ) and NFBC66 (dbGaP Study Accession: phs000276.v2.p1) studies are available via dbGaP. Due to restrictions based onprivacy regulations and informed consent of participants, data cannot be made freely available in a public repository for both the Rotterdam Study and theErasmus Rucphen Family Study. Data of these studies can be obtained upon request. Requests should be directed towards the management team of theRotterdam Study ([email protected]) or the Erasmus Rucphen Family Study ([email protected]), which has a protocol for approving datarequests. Due to Icelandic privacy standards, genotypic information is considered identifiable information and therefore cannot be shared. Data of this study canbe obtained upon request. Requests should be directed towards Vilmundur Gudnason ([email protected]).
Funding: This project was supported by the CHANCES project funded in the FP7 framework programme of DG-RESEARCH in the European Commission (grantno. 242244) and by BBMRI-NL, a Research Infrastructure financed by the Dutch government (NWO 184.021.007). The Rotterdam Study is funded by ErasmusMedical Center and Erasmus University, Rotterdam, Netherlands Organization for the Health Research and Development (ZonMw), the Research Institute forDiseases in the Elderly (RIDE), the Ministry of Education, Culture and Science, the Ministry for Health, Welfare and Sports, the European Commission (DG XII), andthe Municipality of Rotterdam. The generation and management of GWAS genotype data for the Rotterdam Study is supported by the Netherlands Organisationof Scientific Research NWO Investments (nr. 175.010.2005.011, 911-03-012). This study is funded by the Research Institute for Diseases in the Elderly (014-93-015;RIDE2), the Netherlands Genomics Initiative (NGI)/Netherlands Organisation for Scientific Research (NWO) project nr. 050-060-810. The ERF study as a part ofEuroSPAN (European Special Populations Research Network) was supported by European Commission FP6 STRP grant number 018947 (LSHG-CT-2006-01947)
PLOS ONE | www.plosone.org 1 October 2014 | Volume 9 | Issue 10 | e109290
and also received funding from the European Community’s Seventh Framework Programme (FP7/2007-2013)/grant agreement HEALTH-F4-2007-201413 by the
European Commission under the programme ‘‘Quality of Life and Management of the Living Resources’’ of 5th Framework Programme (no.,QLG2-CT-2002-01254).
The ERF study was further supported by ENGAGE consortium and CMSB. High-throughput analysis of the ERF data was supported by a joint grant from the
Netherlands Organisation for Scientific Research and the Russian Foundation for Basic Research (NWO-RFBR 047.017.043). This CHS research was supported by NHLBI
contracts HHSN268201200036C, HHSN268200800007C, N01HC55222, N01HC85079, N01HC85080, N01HC85081, N01HC85082, N01HC85083, N01HC85086; and NHLBI
grants HL080295, HL087652, HL105756, with additional contribution from the National Institute of Neurological Disorders and Stroke (NINDS). Additional support was
provided through AG023629 from the National Institute on Aging (NIA). DNA handling and genotyping at Cedars-Sinai Medical Center was supported in part by the
National Center for Research Resources, grant UL1RR033176, and is now at the National Center for Advancing Translational Sciences, CTSI grant UL1TR000124, in
addition to the National Institute of Diabetes and Digestive and Kidney Disease grant DK063491 to the Southern California Diabetes Endocrinology Research Center.
Samuli Ripatti was supported by Academy of Finland (251217), the Finnish foundation for Cardiovascular Research and the Sigrid Juselius Foundation. Christie M.
Ballantyne was funded by the NIH. None of the funders had a role in study design, data analysis, decision to publish, or preparation of the manuscript.
Competing Interests: Bruce Psaty serves on the DSMB of a clinical trial funded by the manufacturer (Zoll Lifecor) and on the Yale Open Data Access Project fundedby Johnson & Johnson. The other authors have declared that no competing interests exist. This does not alter our adherence to PLOS ONE policies on sharing data andmaterials.
* Email: [email protected]
Introduction
To date, genome-wide association studies (GWAS) have
revealed 95 genetic loci associated with lipid levels in human
plasma. Of these, 74 SNPs were associated with high-density
lipoprotein cholesterol (HDL) levels [1–5]. Together, these 47
SNPs explain approximately 25% of the heritability of HDL levels.
Although the largest meta-analysis of plasma lipid concentrations
[4] to date, already included more than 100,000 individuals of
European descent, it is expected that with increasing sample size
and larger, better reference panels for imputation, more variants
will be found to be associated with HDL levels, probably resulting
in an increase of the explained heritability. Nevertheless, single
SNP effects may not fully explain the heritability of HDL levels.
Genetic processes like DNA methylation, histone modification and
interactions between SNPs are also potential candidates deter-
mining HDL levels [6–9]. A previous large study did not find
evidence of gene-environment interactions influencing HDL
levels, although this might also play a role with other environ-
mental factors [10]. We defined interactions between SNPs as a
departure from a linear statistical model allowing for the additive
marginal effects of both SNPs. Persistent evidence for interacting
loci involved in lipid metabolism comes from experimental animal
research in which various loci interact with each other [11].
Based on the loci for HDL levels identified to date, finding
evidence for SNP6SNP interactions in humans has proven to be
difficult. Ma et al. [8] identified a significant association interaction
between a locus within the HMGCR gene (ENSG00000113161)
and a locus near the LIPC gene (ENSG00000166035) in relation
to HDL cholesterol. Furthermore, Turner et al. [9] found 8
SNP6SNP interactions to be associated with HDL levels of which
the strongest model included an interaction between LPL(ENSG00000175445) and ABCA1 (ENSG00000165029). These
studies suggest that SNP6SNP interactions can indeed also
explain some of the heritability of HDL levels in humans.
However, only loci were studied that had previously been
successfully replicated in GWAS of lipid levels, thus motivating a
genome-wide search for interactions associated with HDL levels.
Genome-wide searches for associations between phenotypes and
SNP6SNP interactions have been hampered by the computation
time needed for testing all unique pairs of SNPs, given by
NSNPs(NSNPs-1)/2, with NSNPs the total number of SNPs.
Consequently, the time for testing all interaction terms is
proportional to NSNPs2, translating into months of computation
time. Modern Graphics Processing Units (GPUs) are optimised for
highly parallel computation tasks and are well-suited to replace
regular processors (Central Processing Units or CPUs) for these
kind of tasks. The GLIDE software package [12] makes use of
GPUs to perform linear regression for all pairs of SNPs. In this
study, we aim to identify SNP6SNP interactions for HDL levels in
the Rotterdam Study cohort I (RS-I) using GLIDE. The most
significant interactions terms in RS-I are first filtered by a meta-
analysis in cohorts II and III of the Rotterdam Study (RS-II and
RS-III, respectively). The resulting interactions were subsequently
sent for replication in the CHARGE cohorts (AGES, ARIC, CHS,
ERF, FHS) and the NFBC-66 cohort. We also tested whether the
identified interaction terms are associated to dyslipidemia treat-
ment within the cohorts of the Rotterdam Study.
Results
GWIS with GLIDE in RS-IFigure 1 shows a flow diagram illustrating the analysis plan. A
total of 495,508 genotyped SNPs that passed quality control, had a
Minor Allele Frequency (MAF) .0.05 in the sample of 2,996
individuals from RS-I, and were also genotyped in RS-II and RS-
III were used to identify SNP6SNP interactions associated with
HDL using GLIDE. For this analysis the HDL levels after
adjustment for sex and age were normalised around zero as this is
a requirement of GLIDE. This resulted in 84,031 SNP6SNP
interactions with an absolute value of the t-score .5 (i.e. p,6.06 ?
1027).
Filtering of interaction terms by a meta-analysis of RS-I,RS-II and RS-III
Using linear regression we calculated the regression coefficient
bint for the interaction term, the standard errors and the p-values
for the 84,031 interaction terms in RS-I (N = 2,996), RS-II
(N = 1,602) and in RS-III (N = 1,621). For these analyses the HDL
levels after adjustment for sex and age were normalised around
zero since this was done in RS-I in the initial analysis with GLIDE
as this is a requirement of GLIDE. The calculated bint and
standard errors were used to meta-analyse the association between
each of the 84,031 interaction terms and HDL levels. After meta-
analysis, 181 interaction terms with a p-value below 1 ? 1028
remain, of which 5 interaction terms with a p-value less than 1 ?
10210. The pooled bint for the 84,031 interaction terms range from
20.507 to 0.746. The 181 interaction terms with a p-value less
than 1 ? 1028 were taken forward for replication, see Table S1.
The number of unique interaction terms for replication was
reduced to 132 by filtering on linkage disequilibrium (LD) between
interaction terms (R2.0.8). Consequently, the p-value for
replication after Bonferroni correction is 3.79 ? 1024. We also
calculated the bint of RS-I, RS-II and RS-III for these 181
interaction terms using linear regression with the unscaled
Genome-Wide Interaction Study of HDL Blood Levels
PLOS ONE | www.plosone.org 2 October 2014 | Volume 9 | Issue 10 | e109290

phenotype to compare these with the bint within the replication
cohorts.
Replication of SNP6SNP interactionsReplication was conducted in 6 cohorts: AGES, ARIC, CHS,
ERF, FHS and NFBC-66. In the replication cohorts only
individuals not on lipid-lowering medication were included, with
the exception of AGES, see Table 1. In AGES, ARIC, CHS, ERF
and FHS, 8, 7, 7, 10 and 7 interaction terms, respectively, could
not be tested for replication since one or both of the SNPs in the
interaction term had not been genotyped or imputed. In NFBC-66
all interaction terms could be tested for replication. A total of 170
out of the 181 interactions could be tested for replication in all six
cohorts. None of the interaction terms reached a significant p-
value after Bonferroni correction (3.79 ? 1024) in any of the
replication cohorts and after meta-analysis of all replication
cohorts. Four interaction terms reached nominal significance at
p = 0.05, see Figure 2. The lowest p-value for bint after
Figure 1. Flow diagram overview of the analysis plan.doi:10.1371/journal.pone.0109290.g001
Genome-Wide Interaction Study of HDL Blood Levels
PLOS ONE | www.plosone.org 3 October 2014 | Volume 9 | Issue 10 | e109290

meta-analysis of all replication cohorts (N = 30,011) was 7.57 ?
1023 for the interaction between rs2315598 (chromosome 2,
position 132,994,224, gene GPR39 (ENSG00000183840)) and
rs2853228 (chromosome 8, position 103,296,258, gene RRM2B(ENSG00000048392)). The second lowest p-value for bint after
meta-analysis of all replication cohorts (N = 30,011) was 8.1 ? 1023
for the interaction between rs6848132 (chromosome 4, position
93,460,610, gene GRID2 (ENSG00000152208)) and rs7863451
(chromosome 9, position 129,112,065, gene GARNL3 (ENS
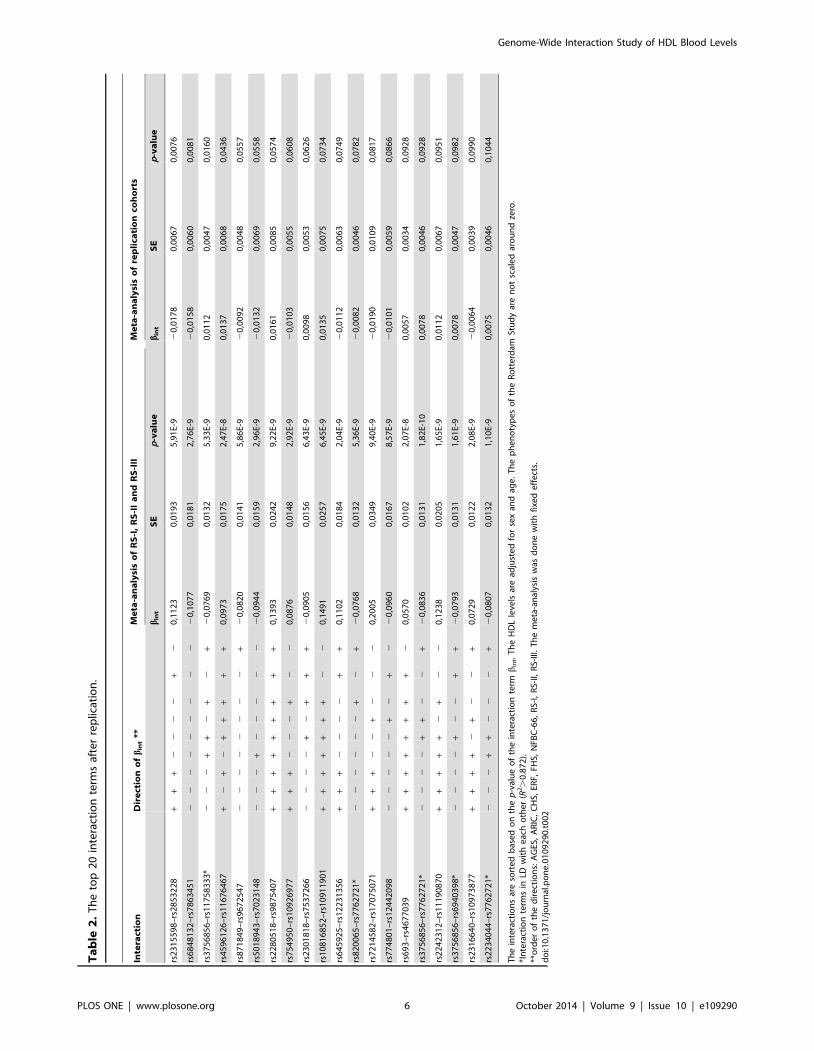
G00000136895)). The bint is negative in all nine cohorts. Table 2
shows the 20 interaction terms with the lowest p-values. Five of
these terms are interactions between an intergenic locus at
chromosome 6, situated between the TCP11 (ENSG0
0000124678) and SCUBE3 (ENSG00000146197) genes, and a
locus at the same chromosome in the SOBP gene
(ENSG00000112320) which are in LD with each other (R2.
0.872).
Individuals with high levels of low-density lipoprotein (LDL) or
low levels of HDL are treated with lipid-lowering medication. The
181 selected interaction terms were also tested to see whether their
presence might explain the use of lipid-lowering medication and
therefore the extreme lipid levels. To this end the individuals of the
Rotterdam Study in the discovery and filtering stage were used as
controls, and the individuals of the Rotterdam Study who use
lipid-lowering medication were used as cases. Table 3 shows the
20 interaction terms with the lowest p-values for bint after testing in
the three cohorts of the Rotterdam Study combined. The
interaction between rs6442460 (chromosome 3, position
14,551,071, gene GRIP2 (ENSG00000144596)) and rs10914332
(chromosome 1, position 31,471,589, gene NKAIN1(ENSG00000084628)) had the lowest p-value (p = 3.98 ? 1023).
Three interaction terms overlap between the top 20 hits after
the replication and the top 20 hits after the case-control test, as
shown in Table 4. None of the SNPs of these interaction terms are
in high LD with each other (R2.0.8). The interaction between
rs754950 and rs10926977 has an opposite effect direction after the
meta-analysis in the Rotterdam Study cohorts compared to the
one after meta-analysis in the replication cohorts and thus will
probably be a false-positive finding. The second interaction term
(between rs2242312 and rs11190870) had a positive effect on
HDL, but increases the risk of lipid lowering medication which is
counter-intuitive and consequently this interaction term is likely a
false-positive finding as well. The third interaction term, however,
between rs774801 (chromosome 3, position 139,413,035, gene
ARMC8 (ENSG00000114098)) and rs12442098 (chromosome 15,
position 95,385,874, close to gene SPATA8 (ENSG00000185594))
has a negative effect on HDL combined with a positive effect on
the use of lipid lowering medication. Although this last interaction
term is not replicated, the directions of the effects are consistent
since this interaction lowers the HDL level and increases the
chance of using lipid lowering medication.
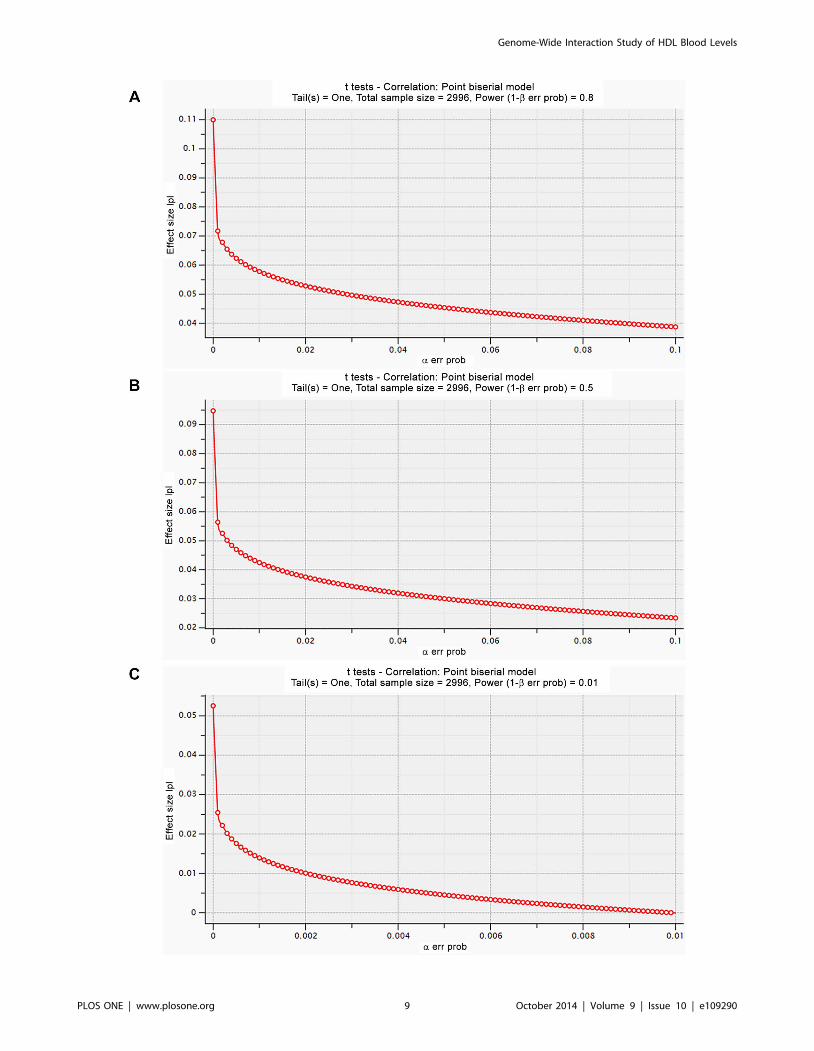
Power calculationsAs none of the findings replicated, we explored the statistical
power of our analyses. Figure 3 shows the power calculations using
the program G*Power [21,22]. With our current sample size of
2,996 individuals the smallest detectable effect will be 0.11, 0.095
and 0.05 when the type I error is less than 1 ? 1027 and the type 2
error is 20% (power is 80%), 50% (power is 50%) and 99% (power
is 1%), respectively.
Discussion
Here we presented the, to our knowledge, first GWIS of HDL
levels in blood. Our study shows that in a single population a
GWIS results in 84,031 SNP6SNP interactions associated with
Table 1. Baseline characteristics for discovery and replication cohorts.
Study Country of origin N (% male)
RS-I Rotterdam Study cohort I Netherlands 2996 (57.7)
RS-II Rotterdam Study cohort II Netherlands 1602 (54.9)
RS-III Rotterdam Study cohort III Netherlands 1621 (58.3)
AGES Age, Gene/Environment Susceptibility Study Iceland 3219 (42.0)
ARIC Atherosclerosis Risk in Communities Study United States 9315 (46.9)
CHS Cardiovascular Health Study Americans of European descent 3175 (40)
ERF Erasmus Rucphen Family study Netherlands 2755 (44.7)
FHS Framingham Heart Study Americans of European descent 7033 (46)
NFBC-66 Northern Finland Brith Cohort 1966 Finland 5243 (47.98)
Mean age (SD), years HDL cholesterol (SD), mmol/L lipid lowering medication users
RS-I 66.2 (7.2) 1.39 (0.39) excluded
RS-II 64.7 (8.1) 1.38 (0.37) excluded
RS-III 55.6 (5.7) 1.47 (0.44) excluded
AGES 76.4 (5.5) 1.58 (0.45) included (22.6%)
ARIC 54.3 (5.7) 1.31 (0.43) excluded
CHS 72.5 (5.4) 1.43 (0.41) excluded
ERF 48.9 (14.4) 1.27 (0.36) excluded
FHS 37.5 (9.6) 1.37 (0.40) excluded
NFBC-66 31 (0) 1.56 (0.38) excluded
doi:10.1371/journal.pone.0109290.t001
Genome-Wide Interaction Study of HDL Blood Levels
PLOS ONE | www.plosone.org 4 October 2014 | Volume 9 | Issue 10 | e109290

HDL levels (p-value,6.06 ? 1027). Our two-step approach to filter
these SNP6SNP interactions using two additional cohorts resulted
in 181 interactions with a p-value below 1 ? 1028. Although some
reached nominal significance, none of these interactions terms
were significantly replicated in a meta-analysis of 30,011 samples
when adjusting for multiple testing. We also did not find a
significant association between any of the interaction terms and
treatment with lipid lowering medication in the cohorts of the
Rotterdam Study after adjustment for multiple testing.
To our knowledge, no other GWIS studies with HDL exist with
which we can compare our results. However, we did try to
replicate previously published SNP6SNP interactions. We adjust-
ed for the same covariates as the authors did, except for smoking,
which was used as a covariate by Turner et al. [9]. Turner et al.published an interaction between rs253 and rs2515614 associated
with HDL, however, the p-values of bint after testing this
interaction term were 0.986, 0.189 and 0.594 in the RS-I, RS-II
and RS-III cohorts, respectively. The p-value of bint after meta-
analysing this interaction term is 0.614. The interaction term
Figure 2. The forest plots for bint of the four most significant interaction terms after meta-analysis of the replication cohorts:rs2315598-rs2853228 (a), rs6848132-rs7863451 (b), rs3756856-rs11758333 (c) and rs4596126-rs11676467 (d). Although the analysisin the discovery and the filtering was done with scaled phenotypes, for these forest plots, the HDL levels are not scaled in the Rotterdam Studycohorts.doi:10.1371/journal.pone.0109290.g002
Genome-Wide Interaction Study of HDL Blood Levels
PLOS ONE | www.plosone.org 5 October 2014 | Volume 9 | Issue 10 | e109290
Ta
ble
2.
Th
eto
p2
0in
tera
ctio
nte
rms
afte
rre
plic
atio
n.
Inte
ract
ion
Dir
ect
ion
of
bin
t**
Me
ta-a
na
lysi
so
fR
S-I
,R
S-I
Ia
nd
RS
-III
Me
ta-a
na
lysi
so
fre
pli
cati
on
coh
ort
s
bin
tS
Ep
-va
lue
bin
tS
Ep
-va
lue
rs2
31
55
98
–rs
28
53
22
8+
++
22
22
+2
0,1
12
30
,01
93
5,9
1E-
92
0,0
17
80
,00
67
0,0
07
6
rs6
84
81
32
–rs
78
63
45
12
22
22
22
22
20
,10
77
0,0
18
12
,76
E-9
20
,01
58
0,0
06
00
,00
81
rs3
75
68
56
–rs
11
75
83
33
*2
22
++
2+
2+
20
,07
69
0,0
13
25
,33
E-9
0,0
11
20
,00
47
0,0
16
0
rs4
59
61
26
–rs
11
67
64
67
+2
+2
++
++
+0
,09
73
0,0
17
52
,47
E-8
0,0
13
70
,00
68
0,0
43
6
rs8
71
84
9–
rs9
67
25
47
22
22
22
22
+2
0,0
82
00
,01
41
5,8
6E-
92
0,0
09
20
,00
48
0,0
55
7
rs5
01
89
43
–rs
70
23
14
82
22
+2
22
22
20
,09
44
0,0
15
92
,96
E-9
20
,01
32
0,0
06
90
,05
58
rs2
28
05
18
–rs
98
75
40
7+
++
++
++
++
0,1
39
30
,02
42
9,2
2E-
90
,01
61
0,0
08
50
,05
74
rs7
54
95
0–
rs1
09
26
97
7+
++
22
2+
22
0,0
87
60
,01
48
2,9
2E-
92
0,0
10
30
,00
55
0,0
60
8
rs2
30
18
18
–rs
75
37
26
62
22
2+
2+
++
20
,09
05
0,0
15
66
,43
E-9
0,0
09
80
,00
53
0,0
62
6
rs1
08
16
85
2–
rs1
09
11
90
1+
++
++
++
22
0,1
49
10
,02
57
6,4
5E-
90
,01
35
0,0
07
50
,07
34
rs6
45
92
5–
rs1
22
31
35
6+
++
22
22
++
0,1
10
20
,01
84
2,0
4E-
92
0,0
11
20
,00
63
0,0
74
9
rs8
20
06
5–
rs7
76
27
21
*2
22
22
2+
2+
20
,07
68
0,0
13
25
,36
E-9
20
,00
82
0,0
04
60
,07
82
rs7
21
45
82
–rs
17
07
50
71
++
+2
2+
22
20
,20
05
0,0
34
99
,40
E-9
20
,01
90
0,0
10
90
,08
17
rs7
74
80
1–
rs1
24
42
09
82
22
22
+2
+2
20
,09
60
0,0
16
78
,57
E-9
20
,01
01
0,0
05
90
,08
66
rs6
93
–rs
46
77
03
9+
++
++
++
+2
0,0
57
00
,01
02
2,0
7E-
80
,00
57
0,0
03
40
,09
28
rs3
75
68
56
–rs
77
62
72
1*
22
22
++
22
+2
0,0
83
60
,01
31
1,8
2E-
10
0,0
07
80
,00
46
0,0
92
8
rs2
24
23
12
–rs
11
19
08
70
++
++
+2
+2
20
,12
38
0,0
20
51
,65
E-9
0,0
11
20
,00
67
0,0
95
1
rs3
75
68
56
–rs
69
40
39
8*
22
22
+2
2+
+2
0,0
79
30
,01
31
1,6
1E-
90
,00
78
0,0
04
70
,09
82
rs2
31
66
40
–rs
10
97
38
77
++
++
2+
22
+0
,07
29
0,0
12
22
,08
E-9
20
,00
64
0,0
03
90
,09
90
rs2
23
40
44
–rs
77
62
72
1*
22
2+
+2
22
+2
0,0
80
70
,01
32
1,1
0E-
90
,00
75
0,0
04
60
,10
44
Th
ein
tera
ctio
ns
are
sort
ed
bas
ed
on
the
p-v
alu
eo
fth
ein
tera
ctio
nte
rmb
int.
Th
eH
DL
leve
lsar
ead
just
ed
for
sex
and
age
.T
he
ph
en
oty
pe
so
fth
eR
ott
erd
amSt
ud
yar
en
ot
scal
ed
aro
un
dze
ro.
*In
tera
ctio
nte
rms
inLD
wit
he
ach
oth
er
(R2.
0.8
72
).**
ord
er
of
the
dir
ect
ion
s:A
GES
,A
RIC
,C
HS,
ERF,
FHS,
NFB
C-6
6,
RS-
I,R
S-II,
RS-
III.
Th
em
eta
-an
alys
isw
asd
on
ew
ith
fixe
de
ffe
cts.
do
i:10
.13
71
/jo
urn
al.p
on
e.0
10
92
90
.t0
02
Genome-Wide Interaction Study of HDL Blood Levels
PLOS ONE | www.plosone.org 6 October 2014 | Volume 9 | Issue 10 | e109290

Ta
ble
3.
Th
eto
p2
0in
tera
ctio
nte
rms
afte
rca
se-c
on
tro
lst
ud
ies
inR
S-I,
RS-
IIan
dR
S-III
sep
arat
ean
dco
mb
ine
d.
Inte
ract
ion
Ca
se-c
on
tro
lin
RS
-IC
ase
-co
ntr
ol
inR
S-I
IC
ase
-co
ntr
ol
inR
S-I
IIC
ase
-co
ntr
ol
RS
com
bin
ed
bin
tS
Ep
-va
lue
bin
tS
Ep
-va
lue
bin
tS
Ep
-va
lue
bin
tS
Ep
-va
lue
rs6
44
24
60
–rs
10
91
43
32
20
,52
27
0,2
86
0,0
67
32
0,4
30
60
,39
60
,27
75
20
,64
54
0,3
05
0,0
34
62
0,5
30
,18
41
0,0
03
98
rs2
14
60
43
–rs
11
12
45
13
20
,25
05
60
,17
20
,14
52
20
,25
57
0,2
49
0,3
03
92
0,3
56
0,1
79
0,0
47
22
0,3
02
0,1
09
70
,00
59
1
rs7
74
80
1–
rs1
24
42
09
8*1
0,3
53
67
0,1
80
,04
97
0,4
15
10
,24
50
,08
98
0,1
70
20
,21
0,4
18
80
,29
30
,11
75
0,0
12
67
rs3
00
64
96
–rs
17
72
90
21
0,2
56
25
0,1
35
0,0
57
90
,19
80
,18
60
,28
72
0,1
34
40
,14
70
,35
90
,20
80
,08
70
,01
69
4
rs7
54
97
0–
rs2
30
64
78
*22
0,1
78
51
0,1
53
0,2
42
22
0,1
70
,18
10
,34
69
20
,24
45
0,1
37
0,0
74
12
0,2
02
0,0
87
10
,02
05
rs7
54
97
0–
rs3
77
59
72
*22
0,1
70
89
0,1
52
0,2
61
42
0,1
67
80
,18
0,3
50
12
0,2
48
20
,13
70
,06
95
20
,19
90
,08
69
0,0
22
26
rs5
77
04
18
–rs
17
23
43
36
20
,94
01
20
,42
20
,02
58
20
,60
81
0,5
30
,25
13
20
,21
22
0,3
18
0,5
04
72
0,4
89
0,2
21
30
,02
70
3
rs7
63
17
34
–rs
12
44
20
98
*10
,31
04
40
,18
10
,08
55
0,4
11
90
,24
70
,09
59
0,1
15
60
,21
10
,58
45
0,2
56
0,1
17
90
,03
00
2
rs2
24
23
12
–rs
11
19
08
70
0,2
42
96
0,2
26
0,2
83
30
,49
27
0,3
23
0,1
27
50
,26
08
0,2
31
0,2
59
40
,30
40
,14
37
0,0
34
62
rs4
86
18
49
–rs
17
12
38
65
20
,04
39
40
,41
50
,91
56
0,8
86
20
,49
90
,07
57
0,7
52
40
,33
80
,02
62
0,4
46
0,2
26
50
,04
90
2
rs7
54
95
0–
rs4
65
85
47
*32
0,1
52
55
0,1
62
0,3
45
12
0,2
09
30
,23
20
,36
72
0,2
08
20
,17
40
,23
14
20
,20
20
,10
45
0,0
53
68
rs1
20
37
91
–rs
10
49
65
56
20
,29
89
70
,15
10
,04
79
20
,05
71
0,1
89
0,7
62
92
0,1
16
40
,15
50
,45
14
20
,16
20
,09
23
0,0
78
65
rs7
54
95
0–
rs1
09
26
97
7*3
20
,15
56
20
,15
90
,32
75
20
,19
23
0,2
29
0,4
00
22
0,1
32
20
,17
0,4
37
22
0,1
72
0,1
02
60
,09
40
9
rs9
00
65
4–
rs1
01
95
13
5*4
0,0
71
14
0,1
61
0,6
59
40
,31
94
0,2
09
0,1
26
70
,24
56
0,1
70
,14
77
0,1
68
0,1
00
60
,09
56
6
rs1
01
95
13
5–
rs1
08
72
67
0*4
0,1
01
60
,16
0,5
24
60
,27
28
0,2
10
,19
47
0,2
19
50
,16
80
,19
20
,16
60
,10
03
0,0
98
04
rs2
91
97
32
–rs
12
75
92
09
20
,18
92
60
,17
10
,26
83
20
,34
77
0,2
17
0,1
08
62
0,0
72
50
,16
40
,65
83
20
,16
80
,10
22
0,1
00
06
rs8
06
45
4–
rs1
75
78
86
80
,22
53
20
,17
0,1
86
10
,38
27
0,2
60
,14
04
0,0
93
0,1
77
0,5
99
20
,18
0,1
10
20
,10
15
5
rs2
01
30
41
–rs
10
51
13
02
0,0
03
45
0,1
43
0,9
80
82
0,1
72
50
,19
0,3
63
20
,30
50
,15
70
,05
18
20
,14
80
,09
11
0,1
05
rs1
04
94
75
7–
rs1
15
20
65
82
1,7
72
49
1,0
13
0,0
80
,22
38
0,6
87
0,7
44
72
0,5
36
0,5
64
0,3
41
62
0,6
08
0,3
83
40
,11
29
2
rs1
42
65
88
–rs
10
24
89
26
0,1
07
30
,14
10
,44
72
0,0
69
40
,19
50
,72
14
0,2
17
60
,14
50
,13
32
0,1
33
0,0
88
90
,13
55
8
rs2
01
30
41
–rs
10
51
13
02
0,0
03
45
0,1
43
0,9
80
82
0,1
72
50
,19
0,3
63
20
,30
50
,15
70
,05
18
20
,14
80
,09
11
0,1
05
rs1
04
94
75
7–
rs1
15
20
65
82
1,7
72
49
1,0
13
0,0
80
,22
38
0,6
87
0,7
44
72
0,5
36
0,5
64
0,3
41
62
0,6
08
0,3
83
40
,11
29
2
rs1
42
65
88
–rs
10
24
89
26
0,1
07
30
,14
10
,44
72
0,0
69
40
,19
50
,72
14
0,2
17
60
,14
50
,13
32
0,1
33
0,0
88
90
,13
55
8
Th
ein
tera
ctio
ns
are
sort
ed
bas
ed
on
the
p-v
alu
eo
fth
eb
int
afte
rth
eca
se-c
on
tro
lstu
dy
inth
eco
mb
ine
dd
ata
set
of
RS-
I,R
S-II
and
RS-
III.T
he
HD
Lle
vels
are
adju
ste
dfo
rse
xan
dag
e,t
he
resi
du
als
are
no
tsc
ale
dar
ou
nd
zero
.Nu
mb
er
of
case
s:4
16
(RS-
I),
24
4(R
S-II)
and
44
7(R
S-III
).N
um
be
ro
fco
ntr
ols
:2
99
6(R
S-I)
,1
60
2(R
S-II)
and
16
21
(RS-
III).
*1–
*4m
ark
the
inte
ract
ion
term
sth
atar
ein
hig
hLD
wit
he
ach
oth
er:
R2.
0.9
13
.d
oi:1
0.1
37
1/j
ou
rnal
.po
ne
.01
09
29
0.t
00
3
Genome-Wide Interaction Study of HDL Blood Levels
PLOS ONE | www.plosone.org 7 October 2014 | Volume 9 | Issue 10 | e109290

between rs3846662 and rs1532085, as published by Ma et al. [8],
only replicated in RS-III (p = 0.0214), but not in RS-I (p = 0.212)
or RS-II (p = 0.162). The p-value of bint after meta-analysing this
interaction term is 0.335.
There can be multiple reasons why we were not able to uncover
SNP6SNP interactions using a hypothesis-free approach. First, in
this study we selected only common variants (MAF.0.05) which
were genotyped in the Rotterdam Study. We chose these variants
to avoid false positive findings in rare variants. Furthermore, the
power to detect interaction terms with rare variants is low since
our sample size in the two-stage discovery phase was 6,219. A
second limitation that we chose to only investigate genotyped
SNPs instead of imputed SNPs. Therefore, we may have missed
true positive causal SNPs which are not on the genotyping array.
However, even with only genotyped SNPs the number of
potentially true positive findings is enormous, resulting in 84,031
suggestive hits at p = 6.06 ? 1027. This prompted us to use a two-
stage discovery phase in which we used the RS-II and RS-III
cohorts to filter out the false positives, reducing the number of
findings from 84,031 to 181. The total number of individuals in
this two-step discovery phase is 6,219. This might be considered
low for the identification of SNP6SNP interactions. As a
commonly used rule-of-thumb, the sample size within a GWIS
should be 3 to 4 times the size of GWAS. As the first GWAS
identifying loci associated with HDL levels [1] included 2,758
individuals, our study is expected to be underpowered by that rule.
To improve power, an alternative approach could have been to
combine the three cohorts of the Rotterdam Study into an one-
step discovery with GLIDE. This, however, still yielded 75,409
interactions with a p-value below our threshold of 6.06 ? 1027 as
compared to the 84,031 interactions seen in the RS-I only GWIS,
see Figure 4. It should be noted that both numbers are well in
keeping with expectations.
The proposed genome-wide significance level for GWIS is 1 ?
10213 [13], however, in this study we used all interaction terms
with a p-value less than 1 ? 1028 for replication. We chose a much
less stringent p-value to prevent us from missing true positives due
to the relatively small sample size. However, none of the 84,031
interaction terms had a p-value below 1 ? 10213 in the separateTa
ble
4.
Th
eo
verl
apb
etw
ee
nth
eto
p2
0in
tera
ctio
nte
rms
afte
rre
plic
atio
nan
dca
se-c
on
tro
lan
alys
is.
Inte
ract
ion
Me
ta-a
na
lysi
so
fR
S-I
,R
S-I
Ia
nd
RS
-III
Me
ta-a
na
lysi
so
fre
pli
cati
on
coh
ort
sC
ase
-co
ntr
ol
inco
mb
ine
dR
S
bin
tS
Ep
-va
lue
bin
tS
Ep
-va
lue
bin
tS
Ep
-va
lue
rs7
54
95
0–
rs1
09
26
97
70
,08
76
0,0
14
82
,92
E-0
09
20
,01
02
80
,00
54
80
,06
07
82
0,1
72
0,1
02
60
,09
40
9
rs2
24
23
12
–rs
11
19
08
70
0,1
23
80
,02
05
1,6
5E-
00
90
,01
12
10
,00
67
10
,09
51
10
,30
40
,14
37
0,0
34
62
rs7
74
80
1–
rs1
24
42
09
82
0,0
96
0,0
16
78
,57
E-0
09
20
,01
00
90
,00
58
80
,08
65
60
,29
30
,11
75
0,0
12
67
do
i:10
.13
71
/jo
urn
al.p
on
e.0
10
92
90
.t0
04
Figure 3. The smallest detectable effect with the currentsample size of 2,996 individuals at 80% (a), 50% (b) and 1%(c) power levels.doi:10.1371/journal.pone.0109290.g003
Genome-Wide Interaction Study of HDL Blood Levels
PLOS ONE | www.plosone.org 8 October 2014 | Volume 9 | Issue 10 | e109290
Genome-Wide Interaction Study of HDL Blood Levels
PLOS ONE | www.plosone.org 9 October 2014 | Volume 9 | Issue 10 | e109290

Rotterdam Study cohorts and after meta-analysis of the three
Rotterdam Study cohorts.
The success of GWAS has been its hypothesis-free approach
and this worked well for studying lipids even in studies we consider
small by today’s standards (1000–3000 individuals). A GWIS is
now technically feasible but needs larger sample sizes. Our study
shows that the number of hits is overwhelming at a p-value of 1 ?
1028. The filtering approach in a similar population did not
resolve this problem. Our GWIS resulted in the consistent finding
of a possible interaction between rs774801 in ARMC8 (ENS
G00000114098) and rs12442098 in SPATA8 (ENSG0000
0185594) being associated with HDL levels, both in the
quantitative analysis and the case-control analysis. However, p-
values do not reach the preset Bonferroni correction of the p-
values. Other major issues related to the sample size and apparent
lack of replication also needs to be overcome.
Methods
Study descriptionsEthics Statement. The AGES Reykjavik Study Genome
Wide Association study was approved by the National Bioethics
Committee (00–063) and the Data Protection Authority. The
ARIC study was approved by ‘The University of Texas Health
Science Center at Houston Committee for the Protection of
Human Subjects’. The CHS study was approved by the following
institutional review boards: Wake Forest University, University of
California (Davis), Johns Hopkins University (Bloomberg School
of Public Health), University of Pittsburgh, University of
Washington, University of Vermont. The ERF study was
approved by the Medical Ethics Committee of the Erasmus MC.
The committee is constituted according to the WMO (National act
medical-scientific research in human beings). The FHS was
approved by the Boston University Medical Campus Institutional
Review Board. The NFBC66 was approved by the Ethical
Committee of the Northern Ostrobothnia Hospital District. The
Rotterdam Study has been approved by the medical ethics
committee according to the Population Study Act Rotterdam
Study, executed by the Ministry of Health, Welfare and Sports of
the Netherlands. A written informed consent was obtained from all
study participants for all cohorts.
Discovery cohort. Rotterdam Study cohort I (RS-I). The
Rotterdam Study is an ongoing prospective population-based
cohort study, focused on chronic disabling conditions of the
elderly. The study comprises an outbred ethnically homogenous
population of Dutch Caucasian origin. The rationale of the study
has been described in detail elsewhere [14]. In summary, 7,983
men and women aged 55 years or older, living in Ommoord, a
suburb of Rotterdam, the Netherlands, were invited to participate
in the first phase. Fasting blood samples were taken during the
participant’s third visit to the research center.
Filtering cohorts. Rotterdam Study cohort II (RS-II). The
Rotterdam Study cohort II prospective population-based cohort
study comprises 3,011 residents aged 55 years and older from the
same district of Rotterdam. The rationale and study designs of this
cohort is similar to that of the RS-I [14]. The baseline
measurements, including the fasting HDL measurements, took
place during the first visit.
Rotterdam Study cohort III (RS-III). The Rotterdam Study
cohort III prospective population-based cohort study comprised
3,932 residents aged 45 years and older from the same district of
Rotterdam. The rationale and study designs of this cohort is
similar to that of the RS-I [14]. The baseline measurements,
including the fasting HDL measurements, took place during the
first visit.
Replication cohorts. Age, Gene/Environment Susceptibility(AGES Reykjavik) Study. The Age, Gene/Environment Suscep-
tibility (AGES Reykjavik) Study was initiated to examine genetic
susceptibility and gene/environment interaction as these contrib-
ute to phenotypes common in old age, and represents a
continuation of the Reykjavik Study cohort begun in 1967. The
study is approved by the Icelandic National Bioethics Committee,
(VSN: 00–063) and the Data Protection Authority. The research-
ers are indebted to the participants for their willingness to
participate in the study.
Atherosclerosis Risk in Communities (ARIC) Study. The
Atherosclerosis Risk in Communities Study (ARIC), sponsored
by the National Heart, Lung, and Blood Institute (NHLBI) is a
prospective epidemiologic study conducted in four U.S. commu-
nities. ARIC is designed to investigate the causes of atherosclerosis
and its clinical outcomes, and variation in cardiovascular risk
factors, medical care, and disease by race, gender, location, and
date. To date, the ARIC project has published over 800 articles in
peer-reviewed journals. ARIC includes two parts: the Cohort
Component and Community Surveillance Component.
The ARIC Cohort Component began in 1987, and each ARIC
field center randomly selected and recruited a cohort sample of
approximately 4,000 individuals aged 45–64 from a defined
population in their community, to receive extensive examinations,
including medical, social, and demographic data. Follow-up also
occurs semi-annually, by telephone, to maintain contact and to
assess health status of the cohort.
In the Community Surveillance Component, the four commu-
nities are investigated to determine the long term trends in
hospitalized myocardial infarction (MI) and coronary heart disease
(CHD) deaths in approximately 470,000 men and women aged
35–84 years.
Cardiovascular Health Study (CHS). The CHS [15] is an
NHLBI-funded observational study of risk factors for cardiovas-
cular disease in adults 65 years or older. Starting in 1989, and
continuing through 1999, participants underwent annual extensive
clinical examinations. Measurements included traditional risk
factors such as blood pressure and lipids as well as measures of
subclinical disease, including echocardiography of the heart,
carotid ultrasound, and cranial magnetic-resonance imaging
(MRI). At six month intervals between clinic visits, and once
clinic visits ended, participants were contacted by phone to
ascertain hospitalizations and health status. The main outcomes
are coronary heart disease (CHD), angina, heart failure (HF),
stroke, transient ischemic attack (TIA), claudication, and mortal-
ity. Participants continue to be followed for these events. CHS
participants who were free of cardiovascular disease at the start of
the study, and who consented to genetic testing, were included in
these analyses.
Erasmus Rucphen Family (ERF) Study. The ERF study has
been described in detail previously [16]. A total of approximately
3,000 participants descend from 22 couples who lived in the
Rucphen region in The Netherlands in the 19th century. The
2,755 individuals with genotype data and lipid measurements were
included in the current analysis.
Figure 4. The overlap between the interaction terms with p-value,3.03 ? 1027 after a GWIS with GLIDE in RS-I only and after a GWISwith GLIDE in RS-I, RS-II and RS-III combined.doi:10.1371/journal.pone.0109290.g004
Genome-Wide Interaction Study of HDL Blood Levels
PLOS ONE | www.plosone.org 10 October 2014 | Volume 9 | Issue 10 | e109290

Framingham Heart Study (FHS). The Framingham Heart
Study (FHS), funded by the National Heart Lung and Blood
Institute, is an observational population-based cohort study
composed of three generations of Framingham (MA) residents
predominately of European descent. The Original cohort
(N = 5,209) was enrolled in 1948. The children and spouses of
the Original cohort comprise the Offspring cohort (N = 5,124),
which was enrolled in 1971–1975 [17]. The Third Generation
(N = 4,095) consists mostly of the children of the Offspring cohort,
and was enrolled in 2002 to 2005 [18]. All participants were
examined every 4–8 years. DNA for surviving participants was
collected in the late 1990s and early 2000s (1995–2005).
Cholesterol and genetic data from 3,464 Offspring subjects and
3,569 Third Generation subjects contribute to this paper.
Northern Finland Brith Cohort 1966 (NFBC-66). The
Northern Finland Birth Cohort 1966 (NFBC-66) study [19] is a
longitudinal one-year birth cohort study designed to study the risk
factors of perinatal deaths and low birth weight. Mothers living in
the two northern-most provinces of Finland were invited to
participate if they had expected delivery dates during 1966.
Individuals still living in Helsinki area or Northern Finland were
asked at age 31 to participate in a detailed examination
(N = 5,923). Extensive data on intermediate phenotypes related
to obesity and behavioral traits have also been collected.
Genotyping and imputationAll cohorts were genotyped using commercially available
Affymetrix or Illumina genotyping arrays, or custom Perlegen
arrays. Quality control was performed independently for each
study. To facilitate meta-analysis, each replication cohort
performed genotype imputation using BIMBAM, IMPUTE, or
MaCH with reference to HapMap or the 1000 Genomes project
data.
The first two cohorts of the Rotterdam Study were genotyped
using the Illumina 550 K chip, the third cohort was genotyped
using the Illumina 610 K and 660 K chip. The following
exclusions were applied to identify a final set of SNPs that was
used in this study: MAF,0.05, SNP callrate ,0.95 and/or HWE
p-value,1 ? 1027. The QC was done per cohort.
In ARIC, genotyping was performed with the Affymetrix 6.0
chip. After genotyping, the following quality control tresholds were
applied: (1) comparison of genotype calls to sample replicates, with
exclusion of samples with greater than 1% mismatch, (2) exclusion
of samples with greater than 5% missing genotypes, (3) exclusion
of samples with a mismatch between reported sex and that
determined by genotyping, (4) exclusion of SNPs with greater than
10% missing genotypes across samples, (5) exclusion of SNPs
monomorphic in both races and (6) exclusion of SNPs (MAF.
0.05) with HWE p-values of less than 1 ? 1026. Prior to
imputations, principal component analysis was performed to
exclude outliers. Imputation to HapMap release 23a was
performed using MaCH v.1.0. After imputation SNPs with an
imputation quality less than 0.90 were excluded. 26.8% of the
SNPs in the replication were genotyped, the rest was imputed.
In AGES only imputed SNPs were used for the replication. The
genotypes originated on Illumina Hu370CNV. For imputation,
only the SNPs were included which were completed in 97% of
individuals and had a MAF above 1%. Imputation was performed
by MaCH against HapMap Release 22. Quality of the imputa-
tions was evaluated by the MaCH R2 metric.
In CHS, genotyping was performed at the General Clinical
Research Center’s Phenotyping/Genotyping Laboratory at Ce-
dars-Sinai using the Illumina 370CNV BeadChip system. Geno-
types were called using the Illumina BeadStudio software. The
following exclusions were applied to identify a final set of 306655
autosomal SNPs that were used for imputation: call rate ,97%,
HWE p,1 ? 1025, .2 duplicate errors or Mendelian inconsis-
tencies (for reference CEPH trios), heterozygote frequency = 0 and
SNP not found in HapMap. Imputation to HapMap release 22
(build 36) was performed using BimBam v.0.99. Most of the
replication SNPs were genotyped (58.4%), the remaining were
imputed.
In ERF genotyping was done on various Illumina and
Affymetrix chips. QC was done for each chip separately. On
average, the following QC criteria were applied: callrate .0.98,
per individual callrate .0.96, HWE p-value.5 ? 1028 and
MAF.0.005. IBS checks, sex chromosome checks and ethnicity
checks were also performed. The imputation to Hapmap 2 release
22 was performed with MaCH and minimac. All SNPs in the
replication were imputed.
In FHS genotyping was done on Affymetrix 250 K Nsp and
250 K Sty mapping arrays and the Affymetrix 50 K supplemental
gene-focused array. The following QC criteria were applied before
imputations: pHWE,1 ? 1026, callrate .0.97, mishap test of non-
random missingness p,1 ? 1029, ,100 Mendelian errors. The
genotyped SNPs were imputed against HapMap (release 22, build
36, CEU population) with MaCH (version 1.0.15). All SNPs in the
replication were imputed.
In NFBC-66 genotyping was done on Illumina 370 K whole-
genome SNP array. The following QC criteria were observed:
SNP clustering probability of genotypes .95%, sample call rate .
95%, SNP call rate .95%, MAF.1% and HWE p-value.1 ?
1026. Heterozygosity, gender check and relatedness checks were
performed and any discrepancies were removed. 10 individuals
with cryptic relatedness were also excluded from the analysis. To
identify a final set of SNPs for imputations, a SNP call rate filter of
.99% was applied to all SNPs with MAF,5%. The imputation to
1000 Genomes Phase I integrated variant set (Mar 2012) was
performed using IMPUTE v2.2.2. After imputation only those
variants with info score .0.9 were analysed. 58.6% of the SNPs in
the replication were genotyped, the rest was imputed.
Study samples and phenotypesA summary of the details of the nine studies participating in this
analysis can be found in Table 1. In all studies, the subjects were
fasting when the HDL levels were measured. The HDL
measurements were adjusted for sex and age, except for NFBC-
66 in which only was adjusted for sex since all individuals are from
the same age. In ERF mmscore (GenABEL version 1.7.0 [20]) was
used to account for family relationships. In ARIC, the HDL levels
were also adjusted for the three ARIC field center with two 0,1
indicator variables. In CHS the HDL was adjusted for study clinic
site as well and in NFBC-66 HDL was also adjusted for 10 PC
components. In FHS the HDL levels were also adjusted for related
individuals with the lmekin function within the coxme package in
R (http://cran.r-project.org/web/packages/coxme/) and adjust-
ed for PCs. In the discovery and filtering stage, the HDL levels
after adjustment for sex and age were normalised around zero as
this is a requirement of GLIDE. To compare the bint in the
discovery and filtering stage with the ßint in the replication stage,
we also calculated the bint in the Rotterdam Study cohorts without
scaling around zero for the most promising interaction terms.
GWIS with GLIDE in RS-ITo systematically search for the epistatic interactions associated
with HDL levels in RS-I we used GLIDE [12]. GLIDE makes use
of the computational power of consumer-grade graphics cards to
detect interactions between SNPs via linear regression. To reduce
Genome-Wide Interaction Study of HDL Blood Levels
PLOS ONE | www.plosone.org 11 October 2014 | Volume 9 | Issue 10 | e109290
computation time, we chose to run GLIDE on genotyped SNPs
only. In order to run GLIDE, the genotype data of RS-I was
stored per chromosome as a text file with one row per SNP and
one column per individual. Individuals using lipid-lowering
medication were excluded. The file does not contain column
headers or row names and the SNPs need to be coded 0
(homozygous for the major allele), 1 (heterozygous) or 2
(homozygous for the minor allele). We only used SNPs with a
MAF (Minor Allele Frequency) .0.05 within the samples of RS-I,
RS-II and RS-III which were used in this study, since the sample
size is not large enough to investigate low-frequency variants.
The names of the SNPs are stored in a separate one-column text
file in the same order as the SNPs in the file with the genotype
data. The values of the scaled residuals are stored in a separate text
file in the same order as the individuals in the file with the
genotype data. GLIDE requires the phenotype to be normalised
around zero. GLIDE uses the files with the genotypes and the file
with the scaled residuals to perform linear regression for all
possible unique SNP6SNP combinations. In order to fit the data
into the GPU’s memory, GLIDE splits up the genotypes in subsets
of SNPs. In this study we chose to split up in subsets of 1000 SNPs.
GLIDE outputs a t-score for each interaction term and a threshold
can be set to only output interactions with a t-score above this
threshold.
The output of GLIDE does not contain the SNP names, but the
number of the chunk and the number of the SNP within a given
chunk. With help of the previously created SNP files, we assigned
SNP names to the interaction terms output by GLIDE. Since
GLIDE handles the data in chunks, interaction terms occur
multiple times in the output of GLIDE, consequently, the results
had to be filtered on unique interaction terms.
Filtering of interaction terms by meta-analysis of RS-I, RS-II and RS-III
To reduce the number of false positive interaction terms, we
filtered the interaction terms with an absolute value of the t-score
.5 (p-value,6.06 ? 1027) by a meta-analysis of RS-I, RS-II and
RS-III. For these interactions, we used linear regression to
determine the ßs, standard errors and p-values in RS-I, RS-II
and RS-III. The HDL levels after adjustment for sex and age were
normalised around zero in all three cohorts. The bs and standard
errors of all three cohorts of the Rotterdam Study were
subsequently meta-analyzed to filter out only those with a p-value
less than 1 ? 1028.
Replication of SNP6SNP interactionsThe interaction terms which had a p-value less than 1 ? 1028
after meta-analysis of the three Rotterdam Study cohorts, were
replicated in 6 cohorts: AGES, ARIC, CHS, ERF, FHS and
NFBC-66. Only individuals that do not use lipid-lowering
medication were included, except for AGES. The linear regression
model for replication was
HDLadj~azb1 SNP1ð Þzb2 SNP2ð Þzbint SNP1|SNP2ð Þze
where HDLadj are the HDL levels adjusted for sex and age. We
meta-analysed the bint from all 6 replication cohorts.
To see if the filtered interaction terms effect the probability of
using lipid-lowering medication, we performed a case-control
study in the three Rotterdam Study cohorts. Those individuals
that have HDL levels available and use lipid-lowering medication
were defined as cases and the individuals in the discovery or
filtering stage were defined as controls. The logistic regression
model for replication was
Medicationyes=no~
azb1 SNP1ð Þzb2 SNP2ð Þzbint SNP1|SNP2ð Þze
We performed the analysis in the three cohorts separately, and
also in the three cohorts combined, in which we included the
cohort number as an additional covariate.
Power calculationsTo estimate the effect we could have detected with the current
sample size, a certain type I error and various type II erros, we
used G*Power [21,22] (version 3.1.9.2).
Supporting Information
Table S1 The 181 interaction terms with a p-value,1 ? 1028
after meta-analysis in RS-I, RS-II and RS-III.
(XLS)
Acknowledgments
We thank the nVidia Academic Partnership Programme for providing the
GPUs. The authors are grateful to the study participants of the different
cohorts for their contributions. We are grateful to P. Veraart for her help in
genealogy, J. Vergeer for the supervision of the laboratory work and P.
Snijders for his help in data collection of the ERF study. We thank Pascal
Arp, Mila Jhamai, Marijn Verkerk, Lizbeth Herrera and Marjolein Peters
for creating the GWAS database of the Rotterdam Study.
Author Contributions
Conceived and designed the experiments: EL FS BO AI BM LK CD.
Performed the experiments: EL FS AS CS GL JAB JCB CW AJ. Analyzed
the data: EL. Contributed reagents/materials/analysis tools: TK NK TH
LL AH FR AU EB CB VG BP LC MJ SR BM CD. Contributed to the
writing of the manuscript: EL TH LL CS JAB AH BP MJ SR AI BM LK
CD. Principal investigator of one of the cohorts: AH FR AU EB CB VG
BP LC MJ SR CD.
References
1. Kathiresan S, Melander O, Guiducci C, Surti A, Burtt NP, et al. (2008) Six new
loci associated with blood low-density lipoprotein cholesterol, high-density
lipoprotein cholesterol or triglycerides in humans. Nat Genet 40: 189–197.
2. Willer CJ, Sanna S, Jackson AU, Scuteri A, Bonnycastle LL, et al. (2008) Newly
identified loci that influence lipid concentrations and risk of coronary artery
disease. Nat Genet 40: 161–169.
3. Aulchenko YS, Ripatti S, Lindqvist I, Boomsma D, Heid IM, et al. (2009) Loci
influencing lipid levels and coronary heart disease risk in 16 European
population cohorts. Nat Genet 41: 47–55.
4. Teslovich TM, Musunuru K, Smith AV, Edmondson AC, Stylianou IM, et al.
(2010) Biological, clinical and population relevance of 95 loci for blood lipids.
Nature 466: 707–713.
5. Global Lipids Genetics Consortium, Willer CJ, Schmidt EM, Sengupta S, Peloso
GM, et al. (2013) Discovery and refinement of loci associated with lipid levels.
Nat Genet 45: 1274–1283.
6. Guay SP, Brisson D, Lamarche B, Marceau P, Vohl MC, et al. (2013) DNA
methylation variations at CETP and LPL gene promoter loci: new molecular
biomarkers associated with blood lipid profile variability. Atherosclerosis 228:
413–420.
7. Pearce MS, McConnell JC, Potter C, Barrett LM, Parker L, et al. (2012) Global
LINE-1 DNA methylation is associated with blood glycaemic and lipid profiles.
Int J Epidemiol 41: 210–217.
8. Ma L, Brautbar A, Boerwinkle E, Sing CF, Clark AG, et al. (2012) Knowledge-
driven analysis identifies a gene-gene interaction affecting high-density
Genome-Wide Interaction Study of HDL Blood Levels
PLOS ONE | www.plosone.org 12 October 2014 | Volume 9 | Issue 10 | e109290
lipoprotein cholesterol levels in multi-ethnic populations. PLoS Genet 8:
e1002714.9. Turner SD, Berg RL, Linneman JG, Peissig PL, Crawford DC, et al. (2011)
Knowledge-driven multi-locus analysis reveals gene-gene interactions influenc-
ing HDL cholesterol level in two independent EMR-linked biobanks. PLoS One6: e19586.
10. Surakka I, Isaacs A, Karssen LC, Laurila PPP, Middelberg RPS, et al. (2011) Agenome-wide screen for interactions reveals a new locus on 4p15 modifying the
effect of waist-to-hip ratio on total cholesterol. PLoS Genet 7: e1002333.
11. Brockmann GA, Karatayli E, Neuschl C, Stylianou IM, Aksu S, et al. (2007)Genetic control of lipids in the mouse cross DU6i x DBA/2. Mamm Genome
18: 757–766.12. Kam-Thong T, Azencott CA, Cayton L, Putz B, Altmann A, et al. (2012)
GLIDE: GPU-based linear regression for detection of epistasis. Hum Hered 73:220–236.
13. Becker T, Herold C, Meesters C, Mattheisen M, Baur MP (2011) Significance
levels in genome-wide interaction analysis (GWIA). Ann Hum Genet 75: 29–35.14. Hofman A, van Duijn CM, Franco OH, Ikram MA, Janssen HLA, et al. (2011)
The Rotterdam Study: 2012 objectives and design update. Eur J Epidemiol 26:657–686.
15. Fried LP, Borhani NO, Enright P, Furberg CD, Gardin JM, et al. (1991) The
Cardiovascular Health Study: design and rationale. Ann Epidemiol 1: 263–276.
16. Pardo LM, MacKay I, Oostra B, van Duijn CM, Aulchenko YS (2005) The
effect of genetic drift in a young genetically isolated population. Ann Hum Genet
69: 288–295.
17. Kannel WB, Feinleib M, McNamara PM, Garrison RJ, Castelli WP (1979) An
investigation of coronary heart disease in families. The Framingham offspring
study. Am J Epidemiol 110: 281–290.
18. Splansky GL, Corey D, Yang Q, Atwood LD, Cupples LA, et al. (2007) The
Third Generation Cohort of the National Heart, Lung, and Blood Institute’s
Framingham Heart Study: design, recruitment, and initial examination.
Am J Epidemiol 165: 1328–1335.
19. Rantakallio P (1969) Groups at risk in low birth weight infants and perinatal
mortality. Acta Paediatr Scand 193: Suppl 193: 1+.
20. Aulchenko YS, Ripke S, Isaacs A, van Duijn CM (2007) GenABEL: an R library
for genome-wide association analysis. Bioinformatics 23: 1294–1296.
21. Faul F, Erdfelder E, Lang A-G, Buchner A (2007) G*Power 3: A flexible
statistical power analysis program for the social, behavioral, and biomedical
sciences. Behavior Research Methods, 39, 175–191.
22. Faul F, Erdfelder E, Buchner A, Lang A-G (2009) Statistical power analyses
using G*Power 3.1: Tests for correlation and regression analyses. Behavior
Research Methods, 41.
Genome-Wide Interaction Study of HDL Blood Levels
PLOS ONE | www.plosone.org 13 October 2014 | Volume 9 | Issue 10 | e109290