On Densities of Subclasses of the Solitary Numbers - KSU Math
Upload
independentCategory
view
0download
0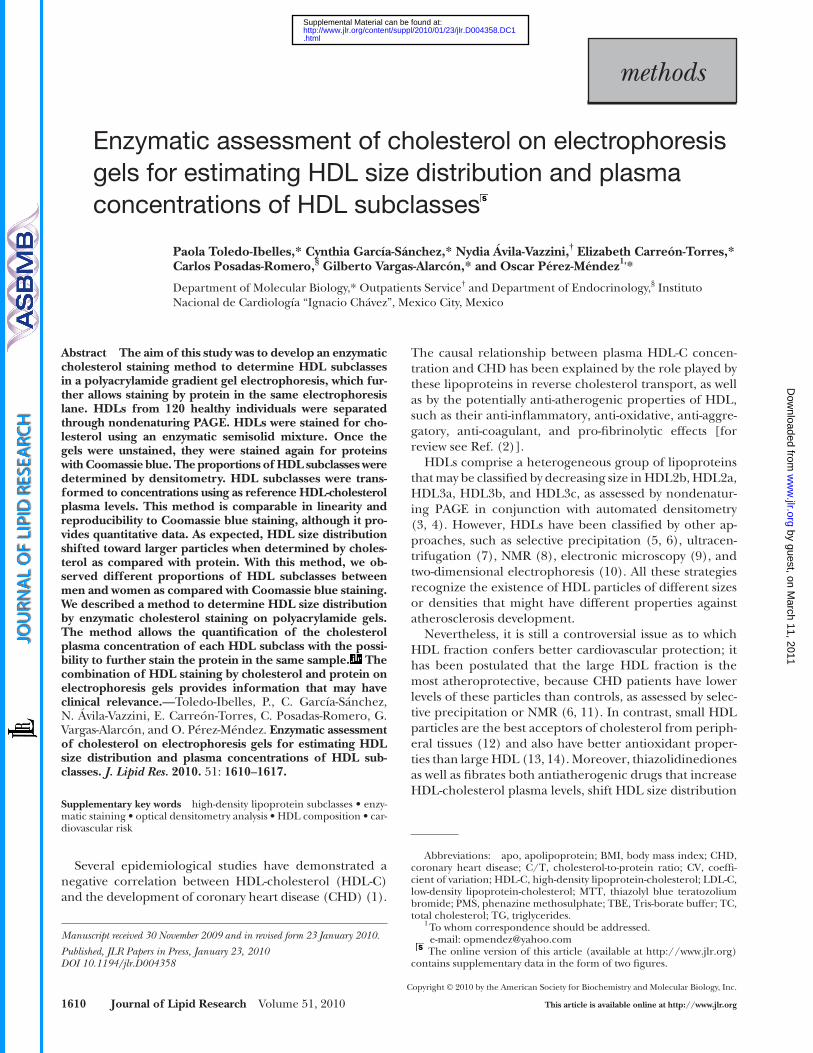
1610 Journal of Lipid Research Volume 51, 2010
Copyright © 2010 by the American Society for Biochemistry and Molecular Biology, Inc.
This article is available online at http://www.jlr.org
The causal relationship between plasma HDL-C concen-tration and CHD has been explained by the role played by these lipoproteins in reverse cholesterol transport, as well as by the potentially anti-atherogenic properties of HDL, such as their anti-infl ammatory, anti-oxidative, anti-aggre-gatory, anti-coagulant, and pro-fi brinolytic effects [for review see Ref. ( 2 )].
HDLs comprise a heterogeneous group of lipoproteins that may be classifi ed by decreasing size in HDL2b, HDL2a, HDL3a, HDL3b, and HDL3c, as assessed by nondenatur-ing PAGE in conjunction with automated densitometry ( 3, 4 ). However, HDLs have been classifi ed by other ap-proaches, such as selective precipitation ( 5, 6 ), ultracen-trifugation ( 7 ), NMR ( 8 ), electronic microscopy ( 9 ), and two-dimensional electrophoresis ( 10 ). All these strategies recognize the existence of HDL particles of different sizes or densities that might have different properties against atherosclerosis development.
Nevertheless, it is still a controversial issue as to which HDL fraction confers better cardiovascular protection; it has been postulated that the large HDL fraction is the most atheroprotective, because CHD patients have lower levels of these particles than controls, as assessed by selec-tive precipitation or NMR ( 6, 11 ). In contrast, small HDL particles are the best acceptors of cholesterol from periph-eral tissues ( 12 ) and also have better antioxidant proper-ties than large HDL ( 13, 14 ). Moreover, thiazolidinediones as well as fi brates both antiatherogenic drugs that increase HDL-cholesterol plasma levels, shift HDL size distribution
Abstract The aim of this study was to develop an enzymatic cholesterol staining method to determine HDL subclasses in a polyacrylamide gradient gel electrophoresis, which fur-ther allows staining by protein in the same electrophoresis lane. HDLs from 120 healthy individuals were separated through nondenaturing PAGE. HDLs were stained for cho-lesterol using an enzymatic semisolid mixture. Once the gels were unstained, they were stained again for proteins with Coomassie blue . The proportions of HDL subclasses were determined by densitometry. HDL subclasses were trans-formed to concentrations using as reference HDL-cholesterol plasma levels. This method is comparable in linearity and reproducibility to Coomassie blue staining, although it pro-vides quantitative data. As expected, HDL size distribution shifted toward larger particles when determined by choles-terol as compared with protein. With this method, we ob-served different proportions of HDL subclasses between men and women as compared with Coomassie blue staining. We described a method to determine HDL size distribution by enzymatic cholesterol staining on polyacrylamide gels. The method allows the quantifi cation of the cholesterol plasma concentration of each HDL subclass with the possi-bility to further stain the protein in the same sample. The combination of HDL staining by cholesterol and protein on electrophoresis gels provides information that may have clinical relevance. —Toledo-Ibelles, P., C. García-Sánchez, N. Ávila-Vazzini, E. Carreón-Torres, C. Posadas-Romero, G. Vargas-Alarcón, and O. Pérez-Méndez. Enzymatic assessment of cholesterol on electrophoresis gels for estimating HDL size distribution and plasma concentrations of HDL sub-classes. J. Lipid Res. 2010. 51: 1610–1617.
Supplementary key words high-density lipoprotein subclasses • enzy-matic staining • optical densitometry analysis • HDL composition • car-diovascular risk
Several epidemiological studies have demonstrated a negative correlation between HDL-cholesterol (HDL-C) and the development of coronary heart disease (CHD) ( 1 ).
Manuscript received 30 November 2009 and in revised form 23 January 2010.
Published, JLR Papers in Press, January 23, 2010 DOI 10.1194/jlr.D004358
Enzymatic assessment of cholesterol on electrophoresis gels for estimating HDL size distribution and plasma concentrations of HDL subclasses
Paola Toledo-Ibelles, * Cynthia García-Sánchez, * Nydia Ávila-Vazzini, † Elizabeth Carreón-Torres, * Carlos Posadas-Romero, § Gilberto Vargas-Alarcón, * and Oscar Pérez-Méndez 1, *
Department of Molecular Biology,* Outpatients Service † and Department of Endocrinology, § Instituto Nacional de Cardiología “Ignacio Chávez” , Mexico City, Mexico
Abbreviations: apo, apolipoprotein; BMI, body mass index; CHD, coronary heart disease; C/T, cholesterol-to-protein ratio; CV, coeffi -cient of variation; HDL-C, high-density lipoprotein-cholesterol; LDL-C, low-density lipoprotein-cholesterol; MTT, thiazolyl blue teratozolium bromide; PMS, phenazine methosulphate; TBE, Tris-borate buffer; TC, total cholesterol; TG, triglycerides.
1 To whom correspondence should be addressed. e-mail: [email protected]
The online version of this article (available at http://www.jlr.org ) contains supplementary data in the form of two fi gures.
methods
by guest, on March 11, 2011
ww
w.jlr.org
Dow
nloaded from
.html http://www.jlr.org/content/suppl/2010/01/23/jlr.D004358.DC1Supplemental Material can be found at:

HDL subclasses determined by cholesterol content 1611
overnight fasting from an antecubital vein after subjects had been seated for 15 min. Samples were centrifuged at 4°C, plasma was separated and analyzed or frozen at � 80°C until analysis. For lipoprotein isolation and plasma lipid profi le (TC, TGs, HDL-C, and LDL-C), samples were processed within 2 h after collection. Plasma glucose, TC, and TGs were deter-mined by commercially available enzymatic methods. The phosphotungstic acid-Mg 2+ precipitation procedure of apoli-poprotein (apo) B-containing lipoproteins was used before quantifying HDL-C. Quality control of lipid measurements was assessed through standardization to the Center for Disease Control and Prevention (Atlanta, GA). LDL-C was estimated using the Friedewald equation modifi ed by De Long ( 19 ). Serum levels of all lipids were determined within 48 h after drawing blood samples.
Isolation of HDL HDLs were separated by ultracentrifugation in a Beckman
optima TLX table centrifuge at 110,000 rpm in 3.2 ml polycar-bonate tubes as described previously ( 20 ). Briefl y, total apo B-containing lipoproteins (density < 1.063 mg/dl) were ob-tained after 2.16 h, whereas total HDL (1.063 < density < 1.21 g/ml) took 2.5 h. Under these conditions, 80 to 85% of total plasma apo A-I was recovered from the HDL fraction without apo B-contamination. HDLs were dialyzed against 0.09 M Tris/0.08 M boric acid/3 mM EDTA (TBE) buffer, pH 8.4.
Enzymatic staining of cholesterol on polyacrylamide gel HDLs were separated by their hydrodynamic diameter in an
8 × 10 × 0.15 cm nondenaturing 3–30% gradient polyacrylamide gel electrophoresis, using TBE during 24 h at 170 V as previously described ( 3, 4, 17 ). Twenty fi ve micrograms of HDL protein sample, corresponding approximately to 10 µg of cholesterol, were deposited per well.
Gels were stained for cholesterol using an enzymatic mixture of cholesterol esterase, cholesterol oxidase, and peroxidase at a fi nal concentration of 0.075 U/ml, 0.05 U/ml, and 0.25 U/ml, respectively, in a 150 mM NaCl, 8.6 mM Na 2 HPO 4 , 1.4 mM NaH 2 PO 4 buffer (PBS), pH 7.4. The reaction mixture also in-cluded 3 mM sodium cholate, 0.1% Triton 100×, 0.4 mM MTT, and 0.6 mM PMS. In a fi rst series of experiments, we directly sub-merged the electrophoresis gels in the reaction mixture. In order to enhance the cholesterol staining, we further added Noble agar at 1.0% or carboxymethylcellulose at 1.4% as viscosant agents to the reaction mixture. For the Noble agar, 100 mg were heated in 10 ml the buffer reaction until dissolution, cooled to about 40°C, and then the enzymes were added. The fi nal concentration of enzymes was as described above. Electrophoresis gels were kept in contact with the reaction mixture containing the viscosant agent during 1 h at 37°C in the dark. At the end of the incubation time, the reaction mixture was removed and the gels were gently washed in PBS to eliminate any remaining residue of agar or carboxymethylcellulose. Electrophoresis gels were then scanned in a GS-670 BioRad densitometer (scan 1), distained with methanol:acetic acid:water 5:2:13, and further restained for pro-teins with Coomassie R-250. Afterwards, gels were again scanned (scan 2). The relative proportions of each HDL subclass deter-mined by protein were estimated by optical densitometry analysis of scan 2, using as reference globular proteins (thyroglobulin, 17 nm; ferritin, 12.2 nm; lactate deshydrogenase, 8.2 nm; and albu-min, 7.1 nm; high-molecular weight calibration kit, Amersham Pharmacia Biotech, Buckimghamshire, UK) that were run in the same gel ( 3, 4, 17 ). Relative proportion of each HDL subclass is expressed as the percentage of the total HDL area under the curve, integrated from 7.94 to 13.59 nm.
toward small HDL particles ( 15, 16 ). In addition, some subjects with severe hypoalphalipoproteinemia who do not develop CHD have a high proportion of small HDL ( 9 ), suggesting an atheroprotective role of these particles.
The existing methods for the estimation of HDL sub-classes involve the determination of at least one of their components. NMR, vertical autoprofi le-II (VAP-II), as well as selective precipitation are based on HDL lipid content for estimating subclasses ( 5, 8, 17, 18 ), whereas protein is the HDL component determined in other methods, such as two-dimensional electrophoresis ( 10 ) and PAGE in na-tive conditions ( 17 ). Because small HDL particles are pro-tein rich and lipid poor, whereas large particles are the contrary, the relative proportion of HDL subclasses is de-pendent on the component determined for the quantifi -cation. The wide variety of methods used for determining HDL subclasses may explain, at least in part, the apparent controversy concerning which is the most antiatherogenic fraction of HDL. Therefore, the aim of this study was to develop an enzymatic cholesterol staining method to de-termine HDL subclasses in a polyacrylamide gradient elec-trophoresis gel, which further allows staining by protein in the same electrophoresis lane. In the fi rst step, the enzy-matic procedure specifi cally stains cholesterol on the gel. In the second step, HDL proteins are stained, and in both cases, the HDL subclasses distribution is determined by optical densitometry. This new method has two main ad-vantages: it could be quantitative, and the HDL subclasses can be estimated also by protein for every sample in the same electrophoresis lane.
MATERIALS AND METHODS
Materials Cholesterol esterase, cholesterol oxidase, and peroxidase
were purchased from MP Biomedicals (Selem, OH). Sodium cholate, Triton 100×, thiazolyl blue teratozolium bromide (MTT), phenazine methosulfate (PMS), carboxymethylcellulose 5-cholesten-3-one, cholesteryl palmitate, and cholesterol were from Sigma-Aldrich (St. Louis, MO). Noble agar was purchased from Becton Dickinson (Franklin Lakes, NJ).
Study subjects One hundred and twenty individuals between 18 and 85 years of
age were recruited in the department of Endocrinology and the Outpatients service of the National Institute of Cardiology, Mex-ico. Volunteers without personal or family history of type 1 or 2 dia-betes, pancreatitis, high blood pressure, angina pectoris, and CHD were accepted. All subjects had a fasting glucose of <110 mg/dl, a body mass index (BMI) of < 32 kg/m 2 , total cholesterol (TC) of < 220 mg/dl, triglycerides (TGs) of < 200 mg/dl, smoked fewer than fi ve cigarettes per day, and had normal hepatic, thyroid, and renal functions, as assessed by routine laboratory analyses. All the partici-pants gave their informed consent to take part in the study that was approved by the Ethics Committee of the National Institute of Cardiology “Ignacio Chávez”, Mexico.
Laboratory assessment All patients were instructed to avoid strenuous exercise and
to eat a light dinner the day before blood drawings were per-formed. Blood samples were obtained in EDTA tubes after 12 h
by guest, on March 11, 2011
ww
w.jlr.org
Dow
nloaded from
.html http://www.jlr.org/content/suppl/2010/01/23/jlr.D004358.DC1Supplemental Material can be found at:

1612 Journal of Lipid Research Volume 51, 2010
HDLs were isolated from this pool by ultracentrifugation and further separated on the basis of their hydrodynamic diameter by nondenaturating electrophoresis in a 3–30% PAGE, as indicated in the Methods section. The enzymatic method for the assessment of the HDL subclasses required a gel-phase reagent to enhance the intensity of the choles-terol staining, because a part of the formed products were washed away by the buffer and the mechanical agitation needed during incubation in an aqueous solution ( Fig. 1 ). Both carboxymethylcellulose and Noble agar enhanced the intensity of the staining signal as compared with the enzymatic mixture in buffer without viscosant agent as it can be observed in the corresponding densitograms ( Fig. 1 ). We fi nally chose carboxymethylcellulose at 1.4%, be-cause the staining intensity is better than that obtained with Noble agar. Moreover, carboxymethylcellulose is sol-uble in the buffer at room temperature, avoiding heating-cooling processes that are necessary for agar solubilization. The best cholesterol staining with the lower background was obtained between 60 to 75 min of incubation (Supple-mentary Fig. I ). This new procedure to stain cholesterol is linear for total HDL between 5 and 30 µg of protein depos-ited by well in the electrophoresis gel ( Fig. 2 ). For HDL subfractions, the method is linear from 5 to 25 µg of pro-tein for HDL 2b, 2a, and 3a, from 5 to 30 µg of protein for HDL3b, and up to 40 µg of protein for HDL3c ( Fig. 2 ).
To rule out the possible infl uence of polyacrylamide gradient on the enzymatic reaction, i.e., the lower the polyacrylamide concentration, the higher conversion of cholesterol to cholestenone, we determined the % of con-version of substrates to products during 1 h using HDL labeled with [ 3 H]cholesterol as described in the Methods section. The mean percentage of cholesterol conversion to cholestenone was 58.9 ± 7.9% for the whole HDL (n = 5). Concerning the HDL subclasses, the mean percentage of conversion was 55.7 ± 6.1, 51.4 ± 5.1, 49.0 ± 8.6, 52.2 ± 12.8, and 56.0 ± 5.2% for HDL2b, 2a, 3a, 3b, and 3c, re-spectively; there was not any signifi cant difference among these values (ANOVA test P = 0.606).
For the assessment of the intra- and inter-assay coeffi -cient, we obtained a pool of plasma from fi ve healthy vol-unteers. HDLs were isolated and separated on the basis of their hydrodynamic diameter by nondenaturating electro-phoresis in a 3–30% PAGE. Cholesterol and protein were sequentially stained, densitograms were obtained, and an-alyzed as mentioned above. Samples were run in duplicate and the reported values are the mean of the two determi-nations. Under these conditions, four samples and the corresponding duplicate of the reference globular pro-teins were run per each electrophoresis gel. The intra-assay coeffi cient of variation (CV) of the method was 6.9% as assessed after 32 repetitions of the same sample in eight independent gels. The mean inter-assay CV was 4.3% as determined with the analysis of the same sample in 25 in-dependent electrophoresis gels.
Once the conditions for this new method were estab-lished, we determined HDL subclasses distribution in 120 subjects without clinical history of CHD. Table 1 shows the lipid profi le and clinical characteristics of the subjects in-
The relative proportion of HDL subclasses by their cholesterol content was determined in scan 1 using the migration distances of the reference globular proteins obtained from the scan 2. Considering that the area under the curve in the densitogram represents 100% of the cholesterol in the HDL, the cholesterol plasma concentration of each HDL subclass was estimated as fol-lows: HDLn-C = (% HDLn determined by cholesterol × HDL-C)/100 where n represents the HDL subclass, and the HDL-C is the HDL cholesterol plasma concentration. For classifi cation of the HDL subclasses, we considered the following size intervals: HDL3c, 7.94–8.45 nm; HDL3b, 8.45–8.98 nm; HDL3a, 8.98–9.94 nm; HDL2a, 9.94–10.58 nm; and HDL2b, 10.58–13.59 nm ( 4 ).
Analysis of the enzymatic reaction homogeneity In order to determine whether the enzymatic reaction is homo-
geneous along the polyacrylamide gradient gel, we used HDL la-beled with [ 3 H]cholesterol as we have previously described ( 4 ). By this procedure, 90% of the radioactive cholesterol within the HDL was esterifi ed, whereas the remaining 10% remained as free cho-lesterol. Radiolabeled HDLs were then separated by electrophore-sis as described above; as a consequence, the radioactive label was distributed along the whole sample in the electrophoresis lane. After the migration time, we monitored the conversion of choles-teryl esters and free cholesterol to cholestenone in the sections of the gel corresponding to the HDL subclasses. For this purpose, polyacrylamide gels were stained for cholesterol using the enzy-matic mixture and scanned as described above. The sections cor-responding to the different HDL subclasses were cut, lipids were extracted with chloroform:methanol 2:1, the organic solvent was evaporated under nitrogen stream, and the sample was resus-pended in 75 µL of toluene. Cholestenone, cholesteryl esters, and free cholesterol were separated by thin layer chromatography in silica gel plates (Sigma Aldrich) using petroleum ether:ethylic ether:acetic acid 90:10:5 as mobile phase. Spots were identifi ed using cold 5-cholesten-3-one (R f =0.07), cholesteryl palmitate (R f =0.71) and cholesterol (R f =0.20) as standards, scratched from the plate, and counted for radioactivity in a liquid scintillation ana-lyzer (TRI-CARB 2200CA, Packard). The rate of conversion of cho-lesterol to cholestenone was estimated by dividing the counted radioactivity of the cholestenone spot by the addition of the radio-activity corresponding to cholestenone, cholesteryl esters, and free cholesterol. The results were expressed as % of conversion.
Statistical analysis Central tendency and dispersion measurements were estimated
by conventional methods. Comparisons between multiple groups were assessed by ANOVA test. Normal distribution of the variables was evaluated by the Kolmogorov-Smirnoff test. The signifi cance of the differences among parameters between men and women was tested by the Student’s t -test for normally distributed variables. TGs values were logarithmically transformed for parametric statistical analysis. Comparisons of nonnormally distributed variables were performed by Mann-Whitney U and Wilcoxon tests for independent groups and paired variables, respectively. Partial correlations ad-justed by age and gender were performed and statistical signifi cance was set at P < 0.05. Unless otherwise indicated, values are expressed as mean ± SD for variables with normal distribution and as median and interquartile interval for nonnormally distributed variables. Statistical analysis was performed using SPSS V 11 software.
RESULTS
For the assessment of the optimal viscosant agent and to test the homogeneity of the enzymatic reaction along the gel, we obtained a pool of plasma from fi ve volunteers.
by guest, on March 11, 2011
ww
w.jlr.org
Dow
nloaded from
.html http://www.jlr.org/content/suppl/2010/01/23/jlr.D004358.DC1Supplemental Material can be found at:

HDL subclasses determined by cholesterol content 1613
portions of HDL subclasses were different as a function of the HDL component used for their quantifi cation (Sup-plementary Fig. IIA ); the HDL size distribution shifted to-ward larger particles when determined by cholesterol as compared with the quantifi cation by protein content (Supplementary Fig. IIA ). The most important differences were observed in HDL2b and HDL3c; when subclasses were assessed by cholesterol, HDL2b were about 60%
cluded in the study. For comparison purposes, data of women and men were analyzed separately.
Concerning the analysis of HDL subclasses, the relative proportion of HDL2a and HDL3c determined by choles-terol did not have a normal distribution. In contrast, the relative proportions of all HDL subclasses determined by protein were normally distributed ( Table 2 ). In agreement with previous observations ( 7, 18, 21, 22 ), the relative pro-
Fig. 1. Electrophoretic scans of HDL 2 and HDL 3 (upper images) isolated from a pool of plasma by ultracentrifugation, further separated by PAGE, and enzymatically stained for cholesterol (left). The re-sults obtained with the enzymatic mixture in buffer without any viscosant agent, with Nobel agar (NA) and with carboxymethylcellulose (CMC) are shown from left to right. HDL 2 and HDL 3 enzymatically stained using CMC are also shown after Coomassie blue staining (right), including the globular pro-teins used as diameter standards (DS). Densitograms for HDL 2 and HDL 3 (lower graphs) correspond to the enzymatic mixture in buffer (solid black line), using Noble agar (dotted line), CMC (dashed line), and stained with Coomassie blue (solid gray line). For enzymatic staining, samples were incubated 1 h at 37°C. OD, optical density.
Fig. 2. Linearity tests for enzymatic staining of cholesterol on electrophoresis gels. Total HDL (HDLt) were run in polyacrylamide 3-30% gradient gel electrophoresis, stained for cholesterol (black triangles) and further for protein (black circles). Plots represent area under the curve (AUC) ob-tained by densitometric analysis for HDLt and HDL subclasses (for details, see Methods section) versus protein deposited by well. For comparison purposes, protein AUC ranges were adjusted.
by guest, on March 11, 2011
ww
w.jlr.org
Dow
nloaded from
.html http://www.jlr.org/content/suppl/2010/01/23/jlr.D004358.DC1Supplemental Material can be found at:

1614 Journal of Lipid Research Volume 51, 2010
cholesterol, whereas HDL2b, 2a, and 3c reached a signifi -cant difference when they were stained by protein ( Table 2 ). HDL2a, 3a, and 3c correlated with the age of the sub-jects when they were determined by protein ( Table 3 ). As a consequence, when we compared the relative propor-tions of HDL3a determined by protein and corrected by age, they reached a signifi cant difference between men and women ( P = 0.001). In contrast, only HDL2a and HDL3c showed a signifi cant correlation with age when they were determined by cholesterol content ( Table 3 ).
We further calculated the cholesterol-to-protein (C/P) ratio as an indicator of HDL composition for each HDL subclass. As expected, HDL2b had the highest C/P ratio, and this value decreased gradually along the HDL sub-classes up to the HDL3c, which had the lowest ratio ( Table 2 ). When we compared the C/P ratio between men and women, we observed that only the HDL2a subclass differed
more abundant, whereas HDL3c were about 35% lower than the relative proportion obtained by protein content ( Table 2 ).
Total HDL2 (expressed as a percentage of the total HDL) was considered to be the summatory of HDL2b and HDL2a, whereas total HDL3 was the summatory of HDL3a, HDL3b, and HDL3c relative proportions (Supplementary Fig. IIB ). Using this estimation, when subclasses were de-termined by cholesterol content, HDL2 represented the most abundant fraction of HDL (62.2% [55.4–67.5]), and HDL3 was the least abundant fraction of total HDL (39.3 ± 11.5%]). In contrast, when they were determined by protein, the HDL3 was the most abundant fraction (56.9 ± 9.8%) whereas HDL2 was the least abundant frac-tion (43.0 ± 9.8%) of HDL (Supplementary Fig. IIB ).
HDL2b, 3b, and 3c subclasses were signifi cantly differ-ent between men and women when gels were stained by
TABLE 1. Demographic data and lipid profi le of the individuals included in the study
All Subjects Men Women p a
n 120 60 60Age (years) 33.4 ± 16.0 29.2 ± 12.0 36.5 ± 17.9 0.012BMI 25.1 ± 4.8 25.2 ± 4.4 25.0 ± 4.2 0.844SBP 111.6 ± 16.1 113.4 ± 14.6 110.1 ± 16.9 0.320DBP 71.7 ± 11.6 71.1 ± 11.1 72.2 ± 13.7 0.659Triglycerides (mg/dl) 108 [71–147] 102.0 [70.4–134.0] 109.5 [71.7–170.5] 0.193Total cholesterol (mg/dl) 169.2 ± 42.9 157.4 ± 35.6 178.5 ± 46.1 0.009LDL-cholesterol (mg/dl) 99.8 ± 34.4 95.1 ± 29.7 103.4 ± 37.5 0.205HDL-cholesterol (mg/dl) 47.3 ± 14.5 42.9 ± 13.1 50.6 ± 14.8 0.006
Data represent mean ± SD for normally distributed variables or median [interquartile interval] for nonnormally distributed variables.
a Student’s t -test or Mann-Whitney U for variables with normal or nonnormal distribution variables, respectively.
TABLE 2. Relative proportions, cholesterol-to-protein ratio, and cholesterol plasma concentrations of HDL subclasses
All Subjects Men Women p a
HDL subclasses by cholesterol (%)HDL2b 46.2 ± 11.2 43.2 ± 11.5 49.7 ± 9.6 0.002HDL2a 13.9 [13.0-15.7] 14.1 [12.6-16.1] 14.1[13.3-15.4] 0.501HDL3a 22.5 ± 4.7 23.3 ± 4.5 21.6 ± 4.9 0.069HDL3b 9.2 ± 3.3 9.7 ± 3.9 8.3 ± 2.6 0.028HDL3c 6.3 [3.3-9.3] 7.8 [4.4-11.1] 5.5 [2.6-7.5] 0.007HDL subclasses by protein (%)HDL2b 28.7 ± 8.6 25.8 ± 8.7 30.5 ± 7.8 0.005HDL2a 14.4 ± 4.39 13.5 ± 4.4 15.2 ± 4.4 0.050HDL3a 28.9 ± 6.5 29.6 ± 8.4 28.7 ± 4.8 0.489HDL3b 14.1 ± 3.3 14.8 ± 3.3 13.7 ± 3.3 0.096HDL3c 13.9 ± 8.0 16.3 ± 9.5 11.9 ± 6.3 0.006Cholesterol-to-protein ratioHDL2b 1.74 ± 0.69 1.88 ± 0.91 1.71 ± 0.44 0.216HDL2a 1.02 [0.90-1.09] 1.07 [0.89-1.19] 0.99 [0.88-1.07] 0.036HDL3a 0.78 ± 0.15 0.80 ± 0.17 0.75 ± 0.13 0.117HDL3b 0.61 [0.53-0.72] 0.62 [0.49-0.72] 0.59 [0.52-0.70] 0.736HDL3c 0.46 [0.36-0.73] 0.45 [0.36-0.68] 0.46 [0.35-0.71] 0.606HDL subclasses -cholesterol plasma
concentrations (mg/dl)HDL2b 19.9 ± 4.8 18.6 ± 4.9 21.4 ± 4.1 0.002HDL2a 6.9 ± 2.5 6.2 ± 2.4 7.3 ± 2.4 0.016HDL3a 9.7 ± 2.0 10.0 ± 1.94 9.3 ± 2.2 0.069HDL3b 3.9 ± 1.4 4.2 ± 1.7 3.6 ± 1.1 0.028HDL3c 2.7 [1.4-4.0] 3.3 [1.9-4.7] 2.3 [1.1-2.4] 0.007
Data represent mean ± SD for normally distributed variables or median [interquartile interval] for nonnormally distributed variables.
a Men versus women Student’s t -test or Mann-Whitney U for variables with normal or nonnormal distribution variables, respectively.
by guest, on March 11, 2011
ww
w.jlr.org
Dow
nloaded from
.html http://www.jlr.org/content/suppl/2010/01/23/jlr.D004358.DC1Supplemental Material can be found at:

HDL subclasses determined by cholesterol content 1615
cholesterol plasma concentrations. There were only three correlations observed between the C/P ratios and the CHD risk factors included in the analysis. Interestingly, the glucose plasma levels did not correlate with any rela-tive proportion of HDL subclass determined by protein, whereas glucose correlated with HDL2a expressed as cho-lesterol plasma concentrations ( r = 0.328, P = 0.001).
DISCUSSION
In the present study, we developed a new method for the specifi c staining of cholesterol on a polyacrylamide gel. The specifi city of the enzymes guarantee that only cholesterol was detected by this method; when cholesterol oxidase or peroxidase was omitted from the reaction mix-ture, there was not any detectable band on the gel (results not shown). By this procedure, we were able to perform a densitometric analysis for the semiquantitative determina-tion of HDL subclasses. Densitometric analysis of Coo-massie blue-stained gels has been extensively used for the quantifi cation of the relative distribution of HDL sub-classes ( 3, 4, 15–17, 20, 23 ). In this context, the enzymatic method developed in the present study allowed choles-terol and protein staining on the same electrophoresis lane.
Because the content of polyacrylamide increases along the gel, it was possible that the substrates could be easily reached by the enzymes at low polyacrylamide concentra-tions as compared with the more concentrated sections of the gel. In order to rule out this possibility, we measured the conversion of cholesteryl esters to cholestenone at 1 h of incubation using a radioactive label. The radioactivity of cholesteryl esters, free cholesterol, and cholestenone was
signifi cantly; men had a slightly higher (about 8%) con-tent of protein than women in this HDL fraction ( Table 2 ). However, the C/P ratios for the other HDL subclasses were comparable between men and women and they were not age dependent (data not shown).
The relative proportions of HDL subclasses determined by cholesterol staining were transformed to plasma con-centrations, as indicated in the Methods section, and the results are shown in Table 2 . Women had higher plasma cholesterol concentrations from large HDL2b and 2a par-ticles, whereas men had signifi cantly higher HDL3b and 3c cholesterol plasma levels.
We additionally investigated for possible statistical asso-ciations between HDL subclasses determined by choles-terol, HDL subclasses-cholesterol plasma concentrations, and C/P ratios with blood pressure, BMI, and waist cir-cumference. HDL relative proportions, HDL subclasses cholesterol plasma levels, and the C/P ratio had different association patterns with the analyzed risk factors ( Table 4 ). The correlations between the waist circumference and the relative proportion of HDL2b, 3a, and 3b were con-served when they were transformed to the corresponding
TABLE 3. Correlation analyses between age and HDL subclasses (%)
Determined by Cholesterol Determined by Protein
Correlation p Correlation p
HDL subclasses (%)HDL2b 0.042 0.679 a � 0.176 a 0.071HDL2a 0.228 0.022 b 0.489 a 0.000HDL3a 0.135 0.179 a 0.316 a 0.001HDL3b � 0.046 0.644 a 0.027 a 0.781HDL3c � 0.301 0.002 b � 0.354 a 0.000
a Pearson´s coeffi cient. b Spearman’s rho.
TABLE 4. Correlation analysis between the relative proportions of HDL subclasses determined by cholesterol content, HDL subclasses cholesterol plasma concentrations, cholesterol-to-protein of HDL subclasses, and some
nonlipidic coronary risk factors
SBP DBP BMI Waist Circumference
CC p † CC p † CC p † CC p †
Relative proportionHDL2b � 0.238 0.023 � 0.211 0.043 � 0.325 0.021 � 0.338 0.007HDL2a* NS 0.216 0.039 NS NSHDL3a 0.250 0.016 0.326 0.002 NS 0.268 0.034HDL3b NS NS 0.319 0.024 0.398 0.001HDL3c* NS NS 0.261 0.039 NSPlasma ConcentrationHDL2b � 0.240 0.020 � 0.210 0.0040 � 0.261 0.038 � 0.4021 0.004HDL2a NS NS � 0.468 0.001 � 0.461 0.001HDL3a 0.249 0.015 0.351 0.003 NS 0.428 0.002HDL3b NS NS 0.301 0.016 0.417 0.003HDL3c* NS NS 0.260 0.040 NSCholesterol-to-protein ratioHDL2b NS NS NS NSHDL2a* NS NS NS NSHDL3a NS NS NS 0.279 0.027HDL3b* NS NS NS NSHDL3c* 0.333 0.001 0.320 0.002 NS NS
Only the correlation coeffi cients (CC) statistically signifi cant ( P < 0.05) are shown. NS, non statistically signifi cant ( P > 0.05). SBP, systolic blood pressure. DBP, diastolic blood pressure.
* Data logarithmically transformed for analysis. † The analysis was corrected by age and gender.
by guest, on March 11, 2011
ww
w.jlr.org
Dow
nloaded from
.html http://www.jlr.org/content/suppl/2010/01/23/jlr.D004358.DC1Supplemental Material can be found at:

1616 Journal of Lipid Research Volume 51, 2010
late when it was determined by cholesterol. These results suggest that HDL3a subclass changes its composition with increasing age. In contrast, HDL2a and 3c correlated with age when they were determined by either cholesterol or protein, suggesting that these subfractions remained of constant composition over time. Therefore , the potential clinical application of HDL subclasses could be higher when both components, protein and cholesterol, are used for their quantifi cation.
Until now, only NMR and selective precipitation have offered quantitative results for HDL subclasses ( 5, 8 ). In this context, another advantage of our new enzymatic method for cholesterol staining on electrophoresis gel is the possibility to generate quantitative results for HDL subclasses. The polyacrylamide gradient gel for the estima-tion of HDL subclasses has been described as a semiquan-titative method ( 17 ), and the relative proportions obtained by this method are interdependent, i.e., when one HDL subclass increases, the others decrease ( 15, 17, 23 ). This interdependence could be considered one of the most im-portant limitations of the quantifi cation of HDL subclasses by PAGE. Therefore, the possibility of transforming the semiquantitative data to plasma cholesterol concentra-tions of HDL subclasses offsets that limitation. For this rea-son, although men had a relative proportion of HDL2a comparable to that of women [14.1 (12.6–16.1) vs. 14.1 (13.3–15.4) %, respectively, P = 0.501] the plasma choles-terol concentrations of this HDL subclass differ by gender (6.2 ± 2.4 vs. 7.3 ± 2.4 mg/dl, for men and women respec-tively, P = 0.016). Therefore, quantitative analysis expressed as plasma concentrations offers more accurate informa-tion about HDL subclasses than that provided by the rela-tive proportions expressed as a percentage of total HDL.
In summary, we described an enzymatic procedure to specifi cally stain cholesterol on electrophoresis gels. By combining this procedure and protein staining with Coo-massie blue, we demonstrated that the relative proportions of HDL subclasses differ as a function of the HDL compo-nent used for quantifi cation. The C/P ratio for each HDL subclass as well as their cholesterol plasma concentration may also be estimated by our enzymatic method. The po-tential clinical applications of this methodology should be tested in future studies.
REFERENCES
1 . Assmann , G. , H. Schulte , A. von Eckardstein , and Y. Huang . 1996 . High-density lipoprotein cholesterol as a predictor of coronary heart disease risk: the PROCAM experience and pathophysiologi-cal implications for reverse cholesterol transport. Atherosclerosis . 124 : S11 – S20 .
2 . Feig , J. E. , R. Shamir , and E. A. Fisher . 2008 . Atheroprotective effects of HDL: beyond reverse cholesterol transport. Curr. Drug Targets . 9 : 196 – 203 .
3 . Blanche , P. J. , E. L. Gong , T. M. Forte , and A. V. Nichols . 1981 . Characterization of human high-density lipoproteins by gradient gel electrophoresis. Biochim. Biophys. Acta . 665 : 408 – 419 .
4 . Huesca-Gómez , C. , E. Carreón-Torres , T. Nepomuceno-Mejía , M. Sánchez-Solorio , M. Galicia-Hidalgo , A. M. Mejía , L. F. Montaño , M. Franco , C. Posadas-Romero , and O. Pérez-Méndez . 2004 . Contribution of cholesteryl ester transfer protein and lecithin:cholesterol acyltranferase to HDL size distribution. Endocr. Res. 30 : 403 – 415 .
measured in the section of the gel that corresponded to the fi ve HDL subclasses. Our results demonstrated that there was not any signifi cant difference in the percentage of substrates converted to products along the electropho-resis gel. Therefore, we concluded that this enzymatic method is homogeneous along the polyacrylamide gel gra-dient and none of the HDL subclasses are over- or sub-estimated.
As has been observed in previous studies using other methodologies, the relative proportion of HDL subclasses determined by cholesterol is notably different from those determined by protein ( 7, 18, 21, 22 ). On the basis of our results, the existing controversy regarding whether the small HDL or the large HDL is the most antiatherogenic fraction ( 6, 11–13, 24, 25 ) could be related to the method that has been used as they may not be comparable. Fur-thermore, this study suggests that both protein and choles-terol should be used for the quantifi cation of HDL subclasses because they potentially offer different informa-tion. The main disadvantage of the protein staining by Coomassie blue is that the method cannot be quantitative; to our knowledge, there is no procedure that selectively assesses HDL-total protein in plasma. The protein frac-tion, particularly apo AI of HDL, has been used for the quantifi cation of HDL subclasses in two-dimensional elec-trophoresis ( 10 ). Other components of HDL such as phos-pholipids and triglycerides may also be used in the quantifi cation of subclasses. Because HDL subclasses dif-fer in lipid composition, the HDL size distribution is ex-pected to be different as a function of the lipidic component used for enzymatic staining. Moreover, HDL subclasses plasma lipid concentrations may provide more relevant information about atherosclerosis risk and about HDL metabolism. The validity of these suggestions should be demonstrated in future studies.
The simultaneous determination of cholesterol and protein allows for the estimation of the C/P ratio of the HDL subclasses. This ratio may be considered as indicative of HDL composition ( 26 ); even though we did not directly demonstrate the validity of this statement, the fact that the C/P ratio gradually decreased from HDL2b to HDL3c is congruent with the notion that large HDLs have a higher content of lipids, whereas small particles are protein-rich ( 13, 26 ).
To explore the potential clinical value of the different parameters generated in this study, we performed a cor-relation analysis between HDL subclasses and some vari-ables associated to the cardiovascular disease risk. Our results clearly showed that the HDL relative proportions, HDL subclasses cholesterol plasma levels, and the C/P ra-tio had different association patterns with the analyzed risk factors; on the basis of these observations, we suggest that the new parameters derived from this study extend the possibilities to better assess the CHD risk. Hence, our study justifi es future research on the potential clinical use-fulness of these new parameters.
Our results also demonstrated that HDL2a, 3a, and 3c subclasses were correlated with age when they were deter-mined by protein, whereas HDL3a subclass did not corre-
by guest, on March 11, 2011
ww
w.jlr.org
Dow
nloaded from
.html http://www.jlr.org/content/suppl/2010/01/23/jlr.D004358.DC1Supplemental Material can be found at:

HDL subclasses determined by cholesterol content 1617
5 . Gidez , L. I. , G. J. Miller , M. Burstein , S. Slagle , and H. A. Eder . 1982 . Separation and quantitation of subclasses of human plasma high density lipoproteins by a simple precipitation procedure. J. Lipid Res. 23 : 1206 – 1223 .
6 . Lamarche , B. , S. Moorjani , and B. Cantin . 1997 . Associations of HDL2 and HDL3 subfractions with ischemic heart disease in men. Prospective results from the Quebec Cardiovascular Study. Arterioscler. Thromb. Vasc. Biol. 17 : 1098 – 1105 .
7 . Kulkarni , K. R. 2006 . Cholesterol profi le measurement by vertical auto profi le method. Clin. Lab. Med. 26 : 787 – 802 .
8 . Otvos , J. D. , E. J. Jeyarajah , and D. W. Bennett . 1991 . Quantifi cation of plasma lipoproteins by proton nuclear magnetic resonance spec-troscopy. Clin. Chem. 37 : 377 – 386 .
9 . Elkhalil , L. , Z. Majd , R. Bakir , O. Perez-Mendez , G. Castro , P. Poulain , B. Lacroix , N. Duhal , J. C. Fruchart , and G. Luc . 1997 . Fish-eye disease: structural and in vivo metabolic abnormalities of high-density lipoproteins. Metabolism . 46 : 474 – 483 .
10 . Asztalos , B. F. , M. Lefevre , T. A. Foster , R. Tulley , M. Windhauser , L. Wong , and P. S. Roheim . 1997 . Normolipidemic subjects with low HDL cholesterol levels have altered HDL subpopulations. Arterioscler. Thromb. Vasc. Biol. 17 : 1885 – 1893 .
11 . Harchaoui , K. , B. J. Arsenault , R. Franssen , J. P. Després , G. K. Hovingh , E. S. Stroes , J. D. Otvos , N. J. Wareham , J. J. Kastelein , K. T. Khaw , et al . 2009 . High-density lipoprotein particle size and concentration and coronary risk. Ann. Intern. Med. 150 : 84 – 93 .
12 . Castro , G. R. , and C. J. Fielding . 1988 . Early incorporation of cell-derived cholesterol into pre-beta-migrating high density lipopro-tein. Biochemistry . 12 : 25 – 29 .
13 . Kontush , A. , S. Chantepie , and M. J. Chapman . 2003 . Small dense HDL particles exert potent protection of atherogenic LDL against oxidative stress. Arterioscler. Thromb. Vasc. Biol. 23 : 1881 – 1888 .
14 . Deakin , S. , I. Leviev , M. Gomaraschi , L. Calabresi , G. Franceschini , and R. W. James . 2002 . Enzymatically active paraoxonase-1 is located at the external membrane of producing cells and released by a high affi nity, saturable, desorption mechanism. J. Biol. Chem. 277 : 4301 – 4308 .
15 . Carreón-Torres , E. , M. Juárez-Meavepeña , G. Cardoso-Saldaña , C. H. Gómez , M. Franco , C. Fievet , G. Luc , M. A. Juárez-Oropeza , and O. Pérez-Méndez . 2005 . Pioglitazone increases the fractional catabolic and production rates of high-density lipoproteins apo AI in the New Zealand White Rabbit. Atherosclerosis . 181 : 233 – 240 .
16 . Huesca , C. , G. Luc , N. Duhal , and O. Pérez-Méndez . 2004 . Ciprofi brate increases synthesis and catabolism of HDL apo AI and AII in patients with hypertriglyceridemia. Atherosclerosis . 5 ( suppl ): 64 .
17 . Warnick , G. R. , J. R. McNamara , C. N. Boggess , F. Clendenen , P. T. Williams , and C. C. Landolt . 2006 . Polyacrylamide gradient gel elec-trophoresis of lipoprotein subclasses. Clin. Lab. Med. 26 : 803 – 846 .
18 . Kulkarni , K. R. , S. M. Marcovina , R. M. Krauss , D. W. Garber , A. M. Glasscock , and J. P. Segrest . 1997 . Quantifi cation of HDL2 and HDL3 cholesterol by the Vertical Auto Profi le-II (VAP-II) method-ology. J. Lipid Res. 38 : 2353 – 2364 .
19 . DeLong , D. M. , E. R. DeLong , P. D. Wood , K. Lippel , and B. M. Rifkind . 1986 . A comparison of methods for the estimation of plasma low- and very low density lipoprotein cholesterol. The Lipid Research Clinics Prevalence Study. JAMA . 256 : 2372 – 2377 .
20 . Huesca-Gómez , C. , M. Franco , G. Luc , L. F. Montaño , F. Massó , C. Posadas-Romero , and O. Pérez-Méndez . 2002 . Chronic hypothy-roidism induces abnormal structure of high-density lipoproteins and impaired kinetics of apolipoprotein A-I in the rat. Metabolism . 51 : 443 – 450 .
21 . Li , Z. , J. R. McNamara , J. M. Ordovas , and E. J. Schaefer . 1994 . Analysis of high density lipoproteins by a modifi ed gradient gel electrophoresis method. J. Lipid Res. 35 : 1698 – 1711 .
22 . Warnick G. R. 2008 . High-density lipoproteins: the neglected step-children whose importance as a risk factor continues to be defi ned. Clin. Lab. Med . 54 : 923 – 924 .
23 . Pérez-Méndez , O. , M. Torres-Tamayo , C. Posadas-Romero , V. Vidaure Garcés , E. Carreón-Torres , E. Mendoza-Pérez , A. Medina Urrutia , C. Huesca-Gómez , J. Zamora-González , and B. Aguilar-Herrera . 2007 . Abnormal HDL subclasses distribution in over-weight children with insulin resistance or type 2 diabetes mellitus. Clin. Chim. Acta . 376 : 17 – 22 .
24 . Linsel-Nitschke , P. , H. Jansen , Z. Aherrarhou , S. Belz , B. Mayer , W. Lieb , F. Huber , W. Kremer , H. R. Kalbitzer , J. Erdmann , et al . 2009 . Macrophage cholesterol effl ux correlates with lipoprotein subclass distribution and risk of obstructive coronary artery disease in pa-tients undergoing coronary angiography. Lipids Health Dis. 8 : 14 .
25 . Otvos , J. D. , D. Collins , D. S. Freedman , I. Shalaurova , E. J. Schaefer , J. R. McNamara , H. E. Bloomfi eld , and S. J. Robins . 2006 . Low-density lipoprotein and high-density lipoprotein particle sub-classes predict coronary events and are favorably changed by gem-fi brozil therapy in the Veterans Affairs High-Density Lipoprotein Intervention Trial. Circulation . 28 : 1556 – 1563 .
26 . Rye , K. A. , N. J. Hime , and P. J. Barter . 1995 . The infl uence of cho-lesteryl ester transfer protein on the composition, size, and struc-ture of spherical, reconstituted high density lipoproteins. J. Biol. Chem. 270 : 189 – 196 .
by guest, on March 11, 2011
ww
w.jlr.org
Dow
nloaded from
.html http://www.jlr.org/content/suppl/2010/01/23/jlr.D004358.DC1Supplemental Material can be found at:
Copyright © 2022 FDOKUMEN