Prudential Investor Day Video ICICI Prudential Life Insurance ...
ORIGINAL ARTICLE
Measuring Changes in Lipid and Blood Glucose Values in theHealth and Wellness Program of Prudential Financial, Inc
Meghan E. Short, MPH, Ron Z. Goetzel, PhD, Jared S. Young, BS, Niranjana M. Kowlessar, PhD,Rivka C. Liss-Levinson, PhD, Maryam J. Tabrizi, MS, Enid Chung Roemer, PhD, Adriano A. Sabatelli, MHSA,
Keith Winick, MA, Myrtho Montes, MD, and K. Andrew Crighton, MD
Objective: To determine the effect of health promotion programs ofPrudential Financial, Inc on biometric measures of blood lipids and glucose.Methods: Using actual biometric and self-reported measures of blood lipidsand glucose values for the employees of Prudential Financial, Inc, weexamined 1) the extent to which self-reported lipid and blood glucose valuescorrelate to laboratory data, 2) whether self-reported and measured lipidvalues differ for physically active and sedentary employees, and 3) whetherparticipation in a disease management program affects employees’ lipidmeasures. Results: We found significant differences in self-reported andmeasured total cholesterol and low-density lipoprotein values, althoughthese differences and those for all lipid and blood glucose values were notclinically meaningful. Supporting previous clinical studies, high-densitylipoprotein values were significantly higher for fitness center users com-pared with sedentary employees. Finally, disease management participantsshowed a significant reduction in total cholesterol and low-density lipopro-tein during a 3-year period compared with nonparticipants. Conclusions:On average, the employees of Prudential Financial, Inc were aware of andaccurately reported their lipid and blood glucose levels. Results from thisstudy support the value of evaluating corporate health promotion programs,using measured biometric outcomes.
There is growing interest among employers in improving thehealth of their workers, so that company health care costs are
better managed and employee performance is improved.1 Conse-quently, many organizations have put in place worksite healthpromotion programs that offer employees opportunities to changepoor health habits and lower their risk for disease.2 These effortsoften involve providing health assessments, behavior change coun-seling, and changing the workplace environment to promote healthylifestyles. At some worksites, employers offer biometric screeningsfor detection of cardiovascular disease with the expectation thatthese screenings may motivate employees to adopt recommendedbehavioral and pharmacological interventions that lower their riskfor adverse outcomes.
Little research has been directed at employer health promo-tion efforts that involve biometric testing. This article focuses onthree areas of interest to employers. First, we examine the extent towhich self-reports of biometric health risk correspond to actuallaboratory values. Second, we explore whether employees whoregularly use a company fitness center also have higher high-
density lipoprotein (HDL) cholesterol levels, which clinical studiessuggest should be affected by regular exercise. Finally, we examinethe extent to which participation in a company-sponsored diseasemanagement program improves biometric values for employeeswho participate in such programs. Throughout this article, weexplore the extent to which more objective biometric laboratoryvalues can be used to assess the benefits of company-sponsoredhealth promotion programs.
Encouraging Individuals to ObtainRisk-Appropriate Clinical Preventive Services
During the past several decades, considerable efforts havebeen made to educate the American public about the importance ofundergoing regular preventive health screenings and understandingthe meaning of screening results. Health improvement goals for thenation, such as those articulated in the Healthy People 2010statement of national health objectives, aim to increase awarenessof risk factors and appropriate use of screening services.3 Severalstudies have demonstrated that individuals who are aware of theirhealth measures, such as weight, blood pressure, blood glucose, andcholesterol, and who are actively engaged in managing those valuesachieve good health outcomes.
Preventive screening rates for conditions such as hypercho-lesterolemia, hypertension, and other conditions associated withheart disease have improved over time, although today 25% ofAmericans aged between 50 and 64 years and 40% of Americansaged 65 years or older do not receive age- and gender-specificpreventive screenings recommended by the U.S. Preventive Ser-vices Task Force.4–10 Several studies have found relatively lowrates of awareness among patients about their lipid values andcardiovascular risk levels.7,11,12 The majority of these studies in-vestigated whether patients are able to accurately report their levelof risk; nevertheless, the literature on the relationship betweenpatients’ knowledge of their high-risk biometric scores and actuallaboratory-reported values is scant. Understanding the relationshipsbetween biometric values and associated health risks has the po-tential to improve adherence to treatment regimens that may in-clude pharmacotherapy and changes in lifestyle.
Furthermore, when assessing employees’ biometric healthrisks, researchers have primarily focused on self-reported changesin these health risks, the most widely used method of collectinghealth status information. Nevertheless, there is relatively littleevidence regarding the validity of self-reported biometric measurescollected in workplace settings and actual laboratory results. Somestudies have found that people tend to consistently underreport totalcholesterol, hypertension, and hyperlipidemia levels, whereas otherstudies have shown higher agreement rates between self-report andactual data.11,13–15
Relating Employee Fitness to Improved BiometricValues
In addition to understanding whether self-reported biomet-rics correlate with actual values, there is also interest in knowingwhether participating in worksite health promotion programs can
From Thomson Reuters (Ms Short, Dr Goetzel, Dr Kowlessar, Ms Tabrizi, MrYoung, Mr Sabatelli), Washington, DC and Newark, NJ; Institute for Healthand Productivity Studies (Dr Chung Roemer), Emory University, Washing-ton, DC; Prudential Financial (Mr Winick, Dr Montes, Dr Crighton), New-ark, NJ.
Address correspondence to: Ron Z. Goetzel, PhD, Thomson Reuters, 4301Connecticut Avenue, NW, Suite 330, Washington, DC 20008; E-mail:[email protected].
Copyright © 2010 by American College of Occupational and EnvironmentalMedicineDOI: 10.1097/JOM.0b013e3181e9ee3c
JOEM • Volume XX, Number X, XXX 2010 1
influence clinical outcomes, particularly those outcomes related tocardiovascular risk. For example, two meta-analyses, and otherstudies, have demonstrated that increasing physical activity cansignificantly reduce health risks related to total cholesterol, low-density lipoprotein (LDL) cholesterol, HDL cholesterol, triglycer-ides, and excess weight.16–19 Nevertheless, no data from worksiteprograms have been analyzed that demonstrate a direct relationshipbetween use of fitness facilities at work and improved biometricmeasures associated with cardiovascular disease, in particular HDLcholesterol levels.
Disease Management Programs’ Effects onBiometric Measures
Disease management programs have also been shown tobe effective in lowering cholesterol levels. Fireman et al foundthat comprehensive disease management programs implementedby The Permanente Medical Group were associated with medianLDL improvement from 125 to 99 among tested patients withcoronary artery disease and median LDL improvement from 132to 108 among tested patients with diabetes. Similarly, Fonarowet al found that implementation of a Cardiac HospitalizationAtherosclerosis Management Program was associated with asignificant increase in the percentage of patients (from 6% to58%) achieving an LDL cholesterol level �100 mg/dL.20,21 Inaddition, the Community Guide Task Force conducted a system-atic review of selected worksite interventions for employeehealth promotion and found a moderate decrease in total cho-lesterol among employees participating in these programs (me-dian reduction in prevalence of 6.6% points).22–33
In summary, various researchers in clinical and worksitesettings have studied the role of biometric measurement becauseit affects workers’ cardiovascular risk factor management andthe effectiveness of worksite interventions in controlling thesemeasures. At Prudential Financial, Inc (hereinafter Prudential),the company’s health promotion program has tracked biometricmeasures for several years with the goal of informing occupa-tional health clinicians and corporate Health and Wellness staffhow to best manage their workers’ cardiovascular risk. Usingmeasured biometric screening data, self-reported biometric data,and participation data from two of Prudential’s Health andWellness programs, the current study explores the reliability ofself-reported blood lipid risks for Prudential employees, theeffect of physical activity on biometric measures on the basis ofuse of the company fitness center, and the effect of participationin disease management on objective laboratory values. In thisarticle, we present the results of three separate analyses thatexplore these issues relevant to the management of Prudential’sHealth and Wellness programs.
METHODS
ObjectivesThe analysis included three distinct components. The goal of
the first analysis was to determine how accurate Prudential employ-ees were in reporting their lipid and blood glucose values on ahealth risk assessment (HRA) when compared with data collectedat a biometric screening conducted within 1 year of the HRAassessment. For the second analysis, we investigated whether,relative to sedentary employees, workers who regularly visited thefitness center were at lower risk on the following measures: total,LDL, and HDL cholesterol, and triglycerides. Finally, we studiedan employee cohort over 3 years, some of whom were engaged ina cardiovascular disease management program and some not, todetermine whether there was a decrease in lipid levels overall and,more in particular, for those employees in the disease managementprogram.
SettingPrudential Financial, Inc (NYSE: PRU), a financial services
company with $641 billion in assets in 2009, has operations in theUnited States, Asia, Europe, and Latin America. Prudential’s busi-nesses offer a variety of financial products and services related tolife insurance, annuities, retirement plans, mutual funds, investmentmanagement, and real estate. Prudential employs �20,000 workersin the United States. Its Health and Wellness department partnerswith Prudential’s business groups to provide programs and servicesaimed at improving worker health and enhancing productivity.Using an integrated approach, Prudential Health and Wellnessoffers a variety of programs and services, including fitness centers,wellness classes, an on-site clinic, HRAs, preventive health screen-ings, health coaching, employee assistance programs, and child andadult care services.
In 2006, Prudential began a wellness initiative that includedan HRA, targeted at supporting healthy lifestyles and promotingappropriate health care utilization. Employees received a $150 cashincentive for completing the HRA and were encouraged to undergoa biometric screening along with the HRA. A 74% participation ratewas achieved during a 2-year period.
In 2007, Prudential introduced “Total Health Management,”a program housed in its on-site clinic aimed at reducing employees’health risks, increasing use of preventive services, improving man-agement of chronic conditions, and enhancing awareness of one’sbiometric values. This program was in place during the period ofanalysis, as were three of Prudential’s other health managementprograms: on-site clinic, fitness centers, and disease management.
At the same time, Health and Wellness provided preventivehealth screenings to employees, including lipid panels and screen-ings for blood glucose, blood pressure, body mass index, and bonedensity. Health and Wellness on-site clinics provided preventivecare, along with “acute interim care,” with the aim of coordinatingcare with employees’ primary care physicians. On the basis of theresults of biometric screenings, employees were risk-stratified andcounseled on specific lifestyle modifications to address their riskfactors. Lifestyle modification counseling was offered through theon-site clinic. Employees found to be at high-risk on the basis oftheir blood pressure readings or lipid panel results were referred totheir primary care physicians, who commonly prescribed antihy-pertensive and lipid lowering drugs. Regardless of risk level,employees were encouraged to return to the clinic at regularintervals for follow-up screenings.
At large sites, Prudential made available “Prufit” fitnesscenters to all employees. Each center employed two full-time staffmembers. The centers were open for extended hours on weekdaysand weekends, and cardio machines, weight equipment, and lockerrooms were made available. Various group exercise classes werealso provided. Employees paid a small fee to join the center, withPrudential subsidizing a portion of the cost. Fitness center partici-pation was tracked by automatic electronic login at each visit.
Disease management programs were made available throughPrudential’s medical benefit programs. Programs targeted patientswith asthma, diabetes, heart disease, lung disease, low back prob-lems, and high-risk maternity. All individuals participating in thedisease management programs received educational materialsabout their medical conditions and had access to relevant websites. In addition, some employees received regular counselingcalls from a nurse. The disease management programs werebased on an “opt-in” model where individuals chose whetherthey wished to participate.
Data ElementsThere were four data sources used in these analyses: 1)
self-reported data from HRAs, 2) laboratory results provided by
2 © 2010 American College of Occupational and Environmental Medicine
Short et al JOEM • Volume XX, Number X, XXX 2010
Prudential’s laboratory vendors, 3) participation data from fit-ness centers and disease management vendors, and 4) eligibilityfiles. All data were obtained from Thomson Reuters AdvantageSuite database and subsequently aggregated, quality-checked,and linked using SAS version 9.2 (SAS, Inc, Cary, NC). Self-reported HRA data were accumulated from surveys administeredbetween September 2007 and September 2008. Laboratory datawere collected through two different means: 1) from screeningsconducted by off-site providers and 2) from screenings at on-siteclinics. Off-site laboratory results were collected and providedto Prudential through its medical plan provider, whereas on-siteclinic results were provided directly to Prudential by an off-sitelaboratory vendor of Prudential. Thus, employees in this studycould have provided laboratory results from either of thesesources.
Lipid (total cholesterol, HDL, LDL, and triglycerides) andblood glucose data were available from 2005 to 2008. Participationdata, including the number of visits an employee made during theyear, were available for on-site fitness centers from 2005 to 2007.Disease management data were available from 2006 to 2007.Finally, the eligibility file contained information about the Pruden-tial population, including demographics (age, gender, and race/ethnicity) and employee characteristics (active status, relationshipto employee, and part-time).
Inclusion/Exclusion CriteriaAnalyses were restricted to active Prudential employees aged
between 18 and 64 years who had non-missing laboratory valuesfrom 2005 to 2008. Other Prudential employees may have beenscreened for cholesterol and blood glucose at different off-sitelocations such as hospitals or physician offices, but Prudentialcollected laboratory results data only if the laboratory test wasprocessed by two off-site laboratory vendors. Data for women withpregnancy-related claims in 2005 through 2008 were removed fromthe sample because cholesterol and blood glucose values canfluctuate during and after pregnancy.
Each analysis segment had additional inclusion criteria. Inthe analysis comparing the relationship between self-reported andmeasured data, women who reported that they were currentlypregnant were removed from subsequent analyses. When compar-ing actual to self-reported biometric values, employees needed toprovide data for both the actual and self-reported measure of ananalytic category to be included in the sample. In the comparison offitness center users to sedentary employees, employees had to either(1) participate in the fitness center (had any record in the file) andindicate on the HRA that they exercised at least 1 day per week, inwhich case they were considered fitness center users, or (2) have norecord in the fitness center database and indicate on the HRA thatthey did not exercise at all in a typical week, in which case theywere considered sedentary. In addition, only 2007 data were used inthe fitness center analysis because sedentary employees were iden-tified using the 2007 HRA data. The cohort analyses requiredemployees to have nonmissing laboratory values for 3 years (2005–2007). The disease management cohort required employees to haveparticipated in any of the following disease management programsat any time during the study period: coronary artery disease,diabetes, or chronic heart failure.
Data CharacteristicsEvaluation of outcomes (total cholesterol, LDL, HDL, trig-
lycerides, and blood glucose) involved examining histograms,skewness, kurtosis, and the modified Park test (to determinewhether the raw scale residuals produced overdispersion), which, inturn, guided the multivariate analyses.34,35 Both measured andself-reported data were examined to determine the appropriatemultivariate models. The evaluation showed that the ordinary least
squares (OLS) models with normal distribution were appropriatefor total cholesterol, HDL, LDL, and triglyceride studies. Thedistributions for self-reported and measured data were similar forall five outcomes.
AnalysesAnalyses were separated into three components: 1) evalua-
tion of the relationship between self-reported and measured labo-ratory data; 2) comparison of lipid values for fitness center usersand sedentary employees; and 3) longitudinal trends in lipid values,overall and for those participating in a disease management pro-gram. Examination of blood glucose data is only presented for thefirst analysis because of the limited number of employees contrib-uting glucose data and the inability to control for type 2 diabetes.The glucose results for the other two analyses are not presented inthis article but are available on request.
Analysis I: Evaluation of Self-Reported and MeasuredLaboratory Values
The first analysis evaluated Prudential employees’ awarenessof and accuracy in reporting their lipid and blood glucose values bycomparing self-reported responses from the HRA to their measuredlaboratory results (with concordance between the two measuresindicating a higher level of accuracy and awareness). To be in-cluded in the analysis, the employee needed to provide self-reportedand measured laboratory data for the particular measure. Thus, anemployee could be included in the analysis of one test (eg, totalcholesterol) but not another (eg, LDL). Self-reported measureswere collected from the 2007 to 2008 HRA, and laboratory valueswere collected during 2006–2008. Because the goal of the analysiswas to determine the accuracy and awareness of employees’ re-sponses on the HRA, the most current measured laboratory resultwas linked to the employee’s HRA response as long as the labo-ratory value was collected before HRA administration. To limitrecall bias, the length of time between self-reported and measuredvalues was calculated (in days), and the sample was restricted toindividuals whose self-reported and biometric values were �1 year(365 days) in length.
The average difference between the two measures was cal-culated by subtracting the self-reported value from the measuredvalue (considered “gold standard”). The average difference was ameasure of how accurately employees remembered their lipid andblood glucose values. To find the percent of employees who wereaccurate, the “percent perfect concordance” was calculated, repre-senting the proportion of employees who remembered their exactlaboratory values. Employees with inaccurate self-report valueswere categorized as either percent overreporting (the HRA valuewas greater than the measured value) or percent underreporting (theHRA value was less than the measured value). Because the require-ment for perfect concordance may be too stringent (people mayremember their approximate values but not the exact values), werelaxed concordance requirements by one half of the standarddeviation (SD) of the measured laboratory value.
Paired t-tests were used to determine whether the differencesbetween self-reported and measured data were significant at P �0.05. A Pearson’s correlation analysis determined the strength ofthe relationship between self-reported and measured values. Be-cause glucose values can fluctuate more for individuals with type 2diabetes, blood glucose values were reported for employees withand without type 2 diabetes (self-reported).
Analysis II: Evaluation of Laboratory Values AmongFitness Center Users and Sedentary Employees
Measured and self-reported laboratory values for 2007were compared with fitness center users and sedentary employ-ees. The sample was limited to employees who worked at a
© 2010 American College of Occupational and Environmental Medicine 3
JOEM • Volume XX, Number X, XXX 2010 Effects of Prudential’s Health Promotion Programs

location with an on-site fitness center. Employees were catego-rized on the basis of fitness center participation data and theirresponse to the HRA question that asked them about theirphysical activity.
Sedentary employees were defined as reporting exercising 0of 7 days (no exercise at all) and with no record of participation inthe fitness center. Physically active employees were defined aspersons reporting exercising at least 1 day per week and having arecord in the fitness center database. There was an additionalrequirement for fitness center users regarding the amount of activ-ity. In a calendar year, two or more visits to the fitness center permonth for at least 1 month in a year constituted participation (ie, aminimum of two visits in 1 year). This liberal criterion was usedbecause employees who travel may be unable to visit the on-sitefitness center regularly. Although fitness center data were availablefrom 2005 to 2007, only data of 2007 were used to be consistentwith the sedentary group (defined by the HRA of 2007). Includingall fitness center participants who said they exercised at least 1 dayper week, the average number of days of physical activity was 3.5days per week. This analysis excluded employees who exercisedbut did not use the fitness center or did not meet the fitness centerusage requirement.
The average values for self-reported and measured lipidlevels were calculated for physically active and sedentary employ-ees. Multivariate OLS regression models were used to determinesignificant differences between the two groups after controlling forthe effects of gender, race/ethnicity, age, and annual salary in 2007.Because the sample sizes for both self-reported and measuredvalues were small, and only the aforementioned potential confound-ing variables were available in the data set, we did not control forany additional factors. Results presented are regression-adjustedvalues controlling for these confounders.
Analysis III: Longitudinal Trends for CohortsThe final analysis focused on a cohort of employees who had
laboratory values for each year during a 3-year period spanning2005 to 2007. Each screening measure (total cholesterol, HDL,LDL, and triglycerides) was analyzed separately. Employees in-cluded in the sample had to have nonmissing values for all 3 yearsto be included in the analysis. As such, an employee with 3 yearsof data for HDL but not for LDL was included in the HDL samplebut was not included in the LDL sample. Changes over timebetween years 1 and 2 and between years 1 and 3 were calculated
by subtracting the earlier year’s value from the more recent year’svalue. To determine significant changes over time, OLS General-ized Estimating Equations models were used for all lipid tests toaccount for repeated measures across time. The models controlledfor baseline (2005) age, gender, race/ethnicity, and annual salary.Results presented below are regression-adjusted for these con-founders.
A further analysis of this cohort group focused on Pruden-tial’s disease management program by comparing results for par-ticipants and nonparticipants. Participation was based on having arecord in the disease management file for the coronary arterydisease, congestive heart failure, or diabetes programs. Participa-tion was defined for the earlier mentioned programs, because theywere the most likely programs to target and potentially influencethe biometric values of interest. If an employee participated in anyother program or did not participate at all, the employee wasclassified as a “nonparticipant.” Disease management data wereavailable for 2006 and 2007. If an employee was a participant ineither 2006 or 2007 (or both), then the employee was considered aparticipant across all 3 years.
A difference-in-differences analysis was used to compare the3-year measured laboratory trends of participants and nonpartici-pants. Because of small sample size and limitations of the data, onlyfour potential confounding variables were included in the OLSmodel: age, gender, race/ethnicity, and annual salary.
RESULTSFigure 1 shows how the inclusion/exclusion criteria were
applied to the Prudential population resulting in the final studysample. Because employees may have contributed laboratory dataacross multiple years, and 2007 was the overlapping year for allthree analyses, eligibility data from 2007 were used to evaluate thesample characteristics. The final sample size, incorporating allemployees with 2007 screening data, was n � 3541. Characteristicsof the entire employee sample are presented in Table 1 for the year2007. As shown, on average, the sample comprised employees whowere white, female, and aged �44 years.
Self-Report Compared With Biometric LaboratoryValues
Table 2 shows the unadjusted results comparing self-reported and measured biometric values. Generally, there were
FIGURE 1. Final sample size on thebasis of inclusion/exclusion criteria for2007.
4 © 2010 American College of Occupational and Environmental Medicine
Short et al JOEM • Volume XX, Number X, XXX 2010
small differences between the self-reported and objective mea-sures. When dichotomizing the blood glucose results using theself-reported indicator of type 2 diabetes, employees who re-ported having the disease underreported their blood glucosevalues by 12.3 points. Total cholesterol, LDL, and HDL allshowed significant differences between self-reported and mea-sured values, despite the small clinical differences between thetwo measures. The average length between self-reported andmeasured values was slightly �4 months, with blood glucosehaving the longest period between when employees werescreened and when they were administered the HRA. Despitesome significant differences, Pearson’s correlation coefficientsrevealed strong relationships between self-report and actualmeasures for each test; the strongest relationship was found forHDL cholesterol at 0.92. Other lipid values had correlationsexceeding 0.80, whereas blood glucose had the lowest overallcorrelation of 0.62, still considered a strong relationship.
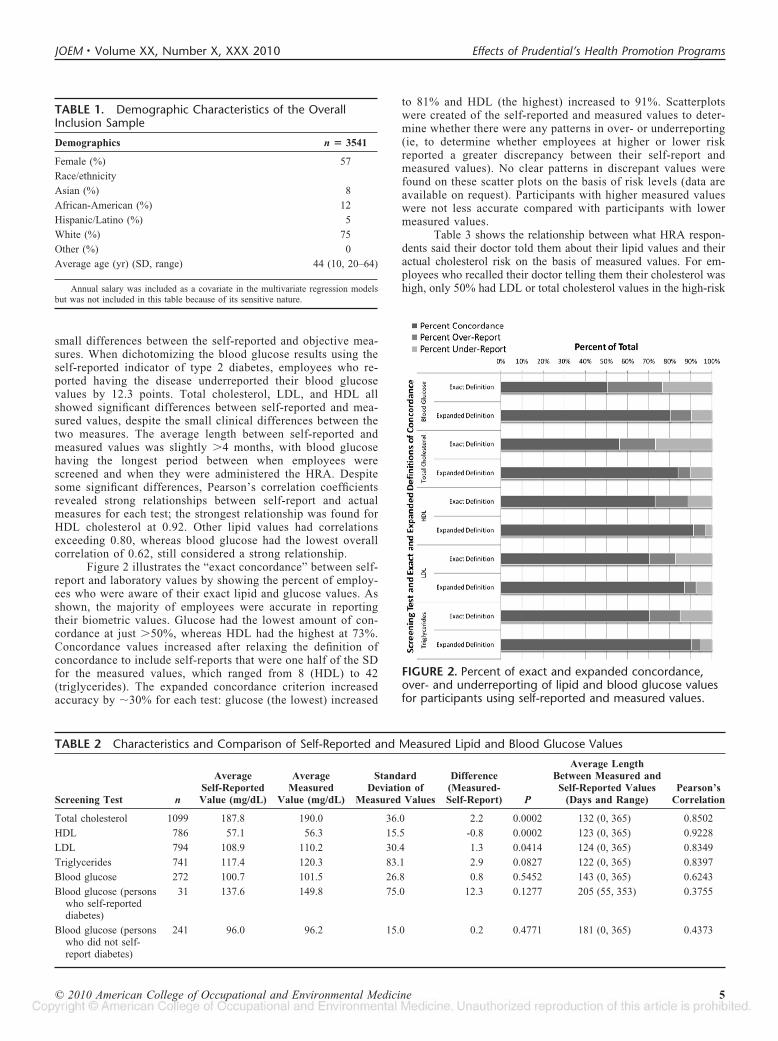
Figure 2 illustrates the “exact concordance” between self-report and laboratory values by showing the percent of employ-ees who were aware of their exact lipid and glucose values. Asshown, the majority of employees were accurate in reportingtheir biometric values. Glucose had the lowest amount of con-cordance at just �50%, whereas HDL had the highest at 73%.Concordance values increased after relaxing the definition ofconcordance to include self-reports that were one half of the SDfor the measured values, which ranged from 8 (HDL) to 42(triglycerides). The expanded concordance criterion increasedaccuracy by �30% for each test: glucose (the lowest) increased
to 81% and HDL (the highest) increased to 91%. Scatterplotswere created of the self-reported and measured values to deter-mine whether there were any patterns in over- or underreporting(ie, to determine whether employees at higher or lower riskreported a greater discrepancy between their self-report andmeasured values). No clear patterns in discrepant values werefound on these scatter plots on the basis of risk levels (data areavailable on request). Participants with higher measured valueswere not less accurate compared with participants with lowermeasured values.
Table 3 shows the relationship between what HRA respon-dents said their doctor told them about their lipid values and theiractual cholesterol risk on the basis of measured values. For em-ployees who recalled their doctor telling them their cholesterol washigh, only 50% had LDL or total cholesterol values in the high-risk
FIGURE 2. Percent of exact and expanded concordance,over- and underreporting of lipid and blood glucose valuesfor participants using self-reported and measured values.
TABLE 1. Demographic Characteristics of the OverallInclusion Sample
Demographics n � 3541
Female (%) 57
Race/ethnicity
Asian (%) 8
African-American (%) 12
Hispanic/Latino (%) 5
White (%) 75
Other (%) 0
Average age (yr) (SD, range) 44 (10, 20–64)
Annual salary was included as a covariate in the multivariate regression modelsbut was not included in this table because of its sensitive nature.
TABLE 2 Characteristics and Comparison of Self-Reported and Measured Lipid and Blood Glucose Values
Screening Test n
AverageSelf-ReportedValue (mg/dL)
AverageMeasured
Value (mg/dL)
StandardDeviation of
Measured Values
Difference(Measured-Self-Report) P
Average LengthBetween Measured andSelf-Reported Values
(Days and Range)Pearson’s
Correlation
Total cholesterol 1099 187.8 190.0 36.0 2.2 0.0002 132 (0, 365) 0.8502
HDL 786 57.1 56.3 15.5 -0.8 0.0002 123 (0, 365) 0.9228
LDL 794 108.9 110.2 30.4 1.3 0.0414 124 (0, 365) 0.8349
Triglycerides 741 117.4 120.3 83.1 2.9 0.0827 122 (0, 365) 0.8397
Blood glucose 272 100.7 101.5 26.8 0.8 0.5452 143 (0, 365) 0.6243
Blood glucose (personswho self-reporteddiabetes)
31 137.6 149.8 75.0 12.3 0.1277 205 (55, 353) 0.3755
Blood glucose (personswho did not self-report diabetes)
241 96.0 96.2 15.0 0.2 0.4771 181 (0, 365) 0.4373
© 2010 American College of Occupational and Environmental Medicine 5
JOEM • Volume XX, Number X, XXX 2010 Effects of Prudential’s Health Promotion Programs

range, and the rest were at moderate or low risk. Seventy-onepercent of employees reporting being at moderate risk were actuallyat moderate risk on the basis of their lipid values. Nevertheless, ofthe employees reporting being at low risk, only 60% were actuallyat low risk, whereas the rest were at moderate (38%) or high risk(1%).
Physically Active Compared With SedentaryEmployees
Comparing biometric values for physically active and sed-entary employees revealed significant differences in HDL levelsbetween the two groups. After adjusting for age, gender, race/ethnicity, and annual salary, self-reported and measured HDLvalues for physically active employees were significantly higherthan for sedentary employees (59.9 versus 52.0, showing regres-sion-adjusted values). Total cholesterol and LDL values were alsohigher among physically active employees than among sedentaryemployees, but not significantly so, whereas triglyceride valueswere lower, but not significant, among fitness center users com-
pared with sedentary employees (P � 0.07). Table 4 provides theOLS regression-adjusted mean values for self-reported and mea-sured biometric values.
Biometric Trends in a 3-Year CohortThe cohort analysis showed significant improvements in
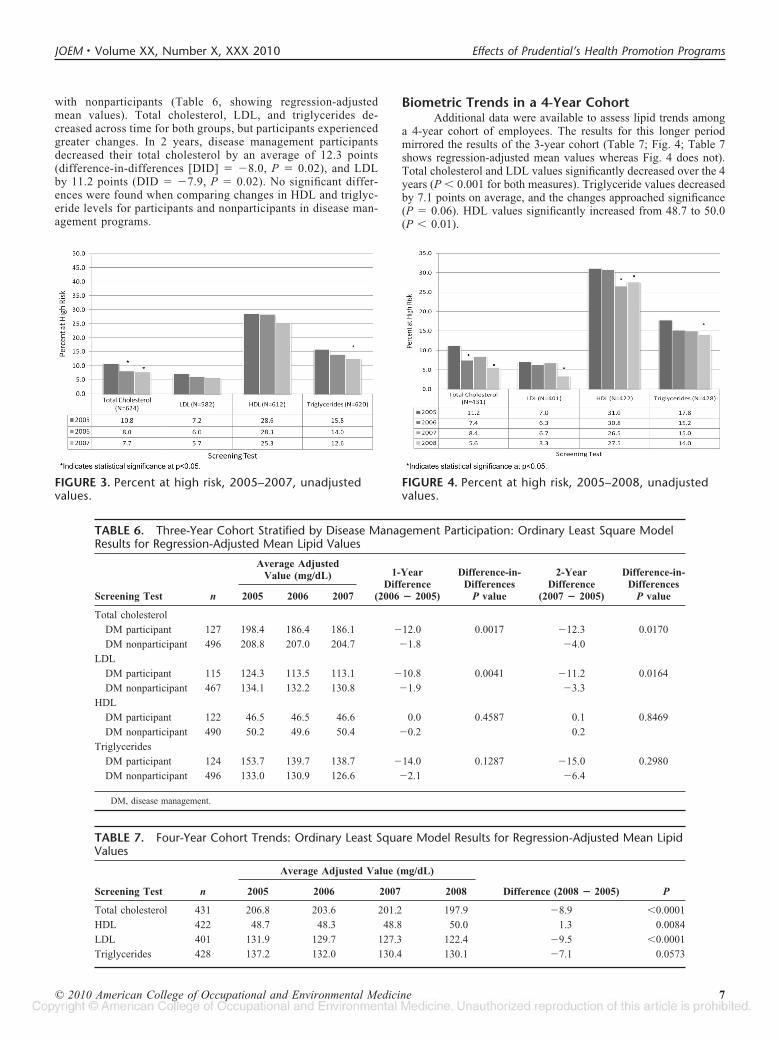
total and LDL cholesterol and triglycerides biometric measuresacross a 3-year period (Table 5; Fig. 3; Table 5 shows regression-adjusted mean values whereas Fig. 3 does not). HDL valuesincreased during the 3-year period, although not significantly. Ingeneral, the percent of employees at high risk for all lipid values(total cholesterol, HDL, LDL, and triglycerides) decreased by twoto three percentage points during the 3-year study period, with asignificant reduction noted in total cholesterol after 1 year and intriglycerides after 2 years.
Participation in Disease Management ProgramsSimilar trends emerged for the 3-year cohort when com-
paring employees engaged in disease management programs
TABLE 3. Percent of Employees at Low, Moderate, and High Risk on the Basis of What They Were Told byTheir Doctor About Their Cholesterol Levels
What have you been told about your Cholesterol? nPercentage at
Low RiskPercentage at
Moderate RiskPercentage at
High Risk
My cholesterol has been high (�240 mg/dL and/or LDL�160 mg/dL).
104 17.3 32.7 50.0
My cholesterol has been moderately high (total cholesterolbetween 200 mg/dL and 240 mg/dL and/or LDLbetween 130 mg/dL and 160 mg/dL)
312 14.1 70.8 15.1
My cholesterol is normal (total cholesterol below 200 mg/dL andLDL below 130 mg/dL)
687 60.3 38.4 1.3
I do not know 15 40.0 53.3 6.7
TABLE 4. Comparison of Ordinary Least Square Model Results for Regression-Adjusted Measured andSelf-Reported Lipid and Blood Glucose Values of Fitness Center Users and Sedentary Employees
Screening Test Values
Fitness Center Users Sedentary Employees
PnAverage Adjusted
Value (mg/dL) nAverage Adjusted
Value (mg/dL)
Total cholesterol Measured 152 212.0 94 209.3 0.5525
Self-reported 152 205.2 94 204.0 0.7983
HDL Measured 105 59.9 58 52.5 0.0010
Self-reported 105 59.9 58 52.0 0.0005
LDL Measured 110 123.5 57 119.2 0.3681
Self-reported 110 121.6 57 120.5 0.8368
Triglycerides Measured 111 150.0 62 168.5 0.0669
Self-reported 111 150.7 62 166.9 0.1232
TABLE 5. Three Year Cohort Trends: Ordinary Least Square Model Results for Regression-Adjusted MeanLipid Values
Screening Test n
Average AdjustedValue (mg/dL) 1-Year
Difference(2006 � 2005) P
2-YearDifference
(2007 � 2005) P2005 2006 2007
Total cholesterol 624 207.4 203.7 202.0 �3.7 0.0025 �5.4 �0.0001
LDL 582 132.8 129.3 127.9 �3.5 0.0019 �4.9 �0.0001
HDL 612 49.6 49.1 49.9 �0.5 0.1064 0.3 0.4022
Triglycerides 620 136.6 132.0 128.2 �4.6 0.1480 �8.4 0.0074
6 © 2010 American College of Occupational and Environmental Medicine
Short et al JOEM • Volume XX, Number X, XXX 2010
with nonparticipants (Table 6, showing regression-adjustedmean values). Total cholesterol, LDL, and triglycerides de-creased across time for both groups, but participants experiencedgreater changes. In 2 years, disease management participantsdecreased their total cholesterol by an average of 12.3 points(difference-in-differences [DID] � �8.0, P � 0.02), and LDLby 11.2 points (DID � �7.9, P � 0.02). No significant differ-ences were found when comparing changes in HDL and triglyc-eride levels for participants and nonparticipants in disease man-agement programs.
Biometric Trends in a 4-Year CohortAdditional data were available to assess lipid trends among
a 4-year cohort of employees. The results for this longer periodmirrored the results of the 3-year cohort (Table 7; Fig. 4; Table 7shows regression-adjusted mean values whereas Fig. 4 does not).Total cholesterol and LDL values significantly decreased over the 4years (P � 0.001 for both measures). Triglyceride values decreasedby 7.1 points on average, and the changes approached significance(P � 0.06). HDL values significantly increased from 48.7 to 50.0(P � 0.01).
FIGURE 3. Percent at high risk, 2005–2007, unadjustedvalues.
FIGURE 4. Percent at high risk, 2005–2008, unadjustedvalues.
TABLE 6. Three-Year Cohort Stratified by Disease Management Participation: Ordinary Least Square ModelResults for Regression-Adjusted Mean Lipid Values
Screening Test n
Average AdjustedValue (mg/dL) 1-Year
Difference(2006 � 2005)
Difference-in-Differences
P value
2-YearDifference
(2007 � 2005)
Difference-in-Differences
P value2005 2006 2007
Total cholesterol
DM participant 127 198.4 186.4 186.1 �12.0 0.0017 �12.3 0.0170
DM nonparticipant 496 208.8 207.0 204.7 �1.8 �4.0
LDL
DM participant 115 124.3 113.5 113.1 �10.8 0.0041 �11.2 0.0164
DM nonparticipant 467 134.1 132.2 130.8 �1.9 �3.3
HDL
DM participant 122 46.5 46.5 46.6 0.0 0.4587 0.1 0.8469
DM nonparticipant 490 50.2 49.6 50.4 �0.2 0.2
Triglycerides
DM participant 124 153.7 139.7 138.7 �14.0 0.1287 �15.0 0.2980
DM nonparticipant 496 133.0 130.9 126.6 �2.1 �6.4
DM, disease management.
TABLE 7. Four-Year Cohort Trends: Ordinary Least Square Model Results for Regression-Adjusted Mean LipidValues
Screening Test n
Average Adjusted Value (mg/dL)
Difference (2008 � 2005) P2005 2006 2007 2008
Total cholesterol 431 206.8 203.6 201.2 197.9 �8.9 �0.0001
HDL 422 48.7 48.3 48.8 50.0 1.3 0.0084
LDL 401 131.9 129.7 127.3 122.4 �9.5 �0.0001
Triglycerides 428 137.2 132.0 130.4 130.1 �7.1 0.0573
© 2010 American College of Occupational and Environmental Medicine 7
JOEM • Volume XX, Number X, XXX 2010 Effects of Prudential’s Health Promotion Programs
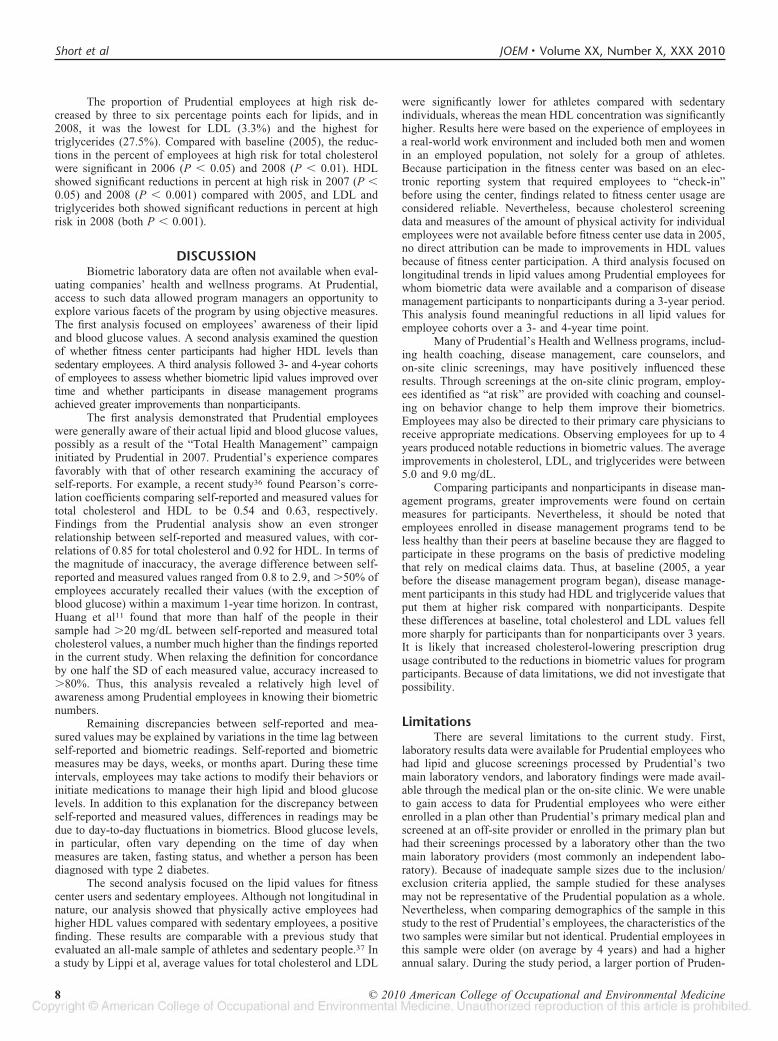
The proportion of Prudential employees at high risk de-creased by three to six percentage points each for lipids, and in2008, it was the lowest for LDL (3.3%) and the highest fortriglycerides (27.5%). Compared with baseline (2005), the reduc-tions in the percent of employees at high risk for total cholesterolwere significant in 2006 (P � 0.05) and 2008 (P � 0.01). HDLshowed significant reductions in percent at high risk in 2007 (P �0.05) and 2008 (P � 0.001) compared with 2005, and LDL andtriglycerides both showed significant reductions in percent at highrisk in 2008 (both P � 0.001).
DISCUSSIONBiometric laboratory data are often not available when eval-
uating companies’ health and wellness programs. At Prudential,access to such data allowed program managers an opportunity toexplore various facets of the program by using objective measures.The first analysis focused on employees’ awareness of their lipidand blood glucose values. A second analysis examined the questionof whether fitness center participants had higher HDL levels thansedentary employees. A third analysis followed 3- and 4-year cohortsof employees to assess whether biometric lipid values improved overtime and whether participants in disease management programsachieved greater improvements than nonparticipants.
The first analysis demonstrated that Prudential employeeswere generally aware of their actual lipid and blood glucose values,possibly as a result of the “Total Health Management” campaigninitiated by Prudential in 2007. Prudential’s experience comparesfavorably with that of other research examining the accuracy ofself-reports. For example, a recent study36 found Pearson’s corre-lation coefficients comparing self-reported and measured values fortotal cholesterol and HDL to be 0.54 and 0.63, respectively.Findings from the Prudential analysis show an even strongerrelationship between self-reported and measured values, with cor-relations of 0.85 for total cholesterol and 0.92 for HDL. In terms ofthe magnitude of inaccuracy, the average difference between self-reported and measured values ranged from 0.8 to 2.9, and �50% ofemployees accurately recalled their values (with the exception ofblood glucose) within a maximum 1-year time horizon. In contrast,Huang et al11 found that more than half of the people in theirsample had �20 mg/dL between self-reported and measured totalcholesterol values, a number much higher than the findings reportedin the current study. When relaxing the definition for concordanceby one half the SD of each measured value, accuracy increased to�80%. Thus, this analysis revealed a relatively high level ofawareness among Prudential employees in knowing their biometricnumbers.
Remaining discrepancies between self-reported and mea-sured values may be explained by variations in the time lag betweenself-reported and biometric readings. Self-reported and biometricmeasures may be days, weeks, or months apart. During these timeintervals, employees may take actions to modify their behaviors orinitiate medications to manage their high lipid and blood glucoselevels. In addition to this explanation for the discrepancy betweenself-reported and measured values, differences in readings may bedue to day-to-day fluctuations in biometrics. Blood glucose levels,in particular, often vary depending on the time of day whenmeasures are taken, fasting status, and whether a person has beendiagnosed with type 2 diabetes.
The second analysis focused on the lipid values for fitnesscenter users and sedentary employees. Although not longitudinal innature, our analysis showed that physically active employees hadhigher HDL values compared with sedentary employees, a positivefinding. These results are comparable with a previous study thatevaluated an all-male sample of athletes and sedentary people.37 Ina study by Lippi et al, average values for total cholesterol and LDL
were significantly lower for athletes compared with sedentaryindividuals, whereas the mean HDL concentration was significantlyhigher. Results here were based on the experience of employees ina real-world work environment and included both men and womenin an employed population, not solely for a group of athletes.Because participation in the fitness center was based on an elec-tronic reporting system that required employees to “check-in”before using the center, findings related to fitness center usage areconsidered reliable. Nevertheless, because cholesterol screeningdata and measures of the amount of physical activity for individualemployees were not available before fitness center use data in 2005,no direct attribution can be made to improvements in HDL valuesbecause of fitness center participation. A third analysis focused onlongitudinal trends in lipid values among Prudential employees forwhom biometric data were available and a comparison of diseasemanagement participants to nonparticipants during a 3-year period.This analysis found meaningful reductions in all lipid values foremployee cohorts over a 3- and 4-year time point.
Many of Prudential’s Health and Wellness programs, includ-ing health coaching, disease management, care counselors, andon-site clinic screenings, may have positively influenced theseresults. Through screenings at the on-site clinic program, employ-ees identified as “at risk” are provided with coaching and counsel-ing on behavior change to help them improve their biometrics.Employees may also be directed to their primary care physicians toreceive appropriate medications. Observing employees for up to 4years produced notable reductions in biometric values. The averageimprovements in cholesterol, LDL, and triglycerides were between5.0 and 9.0 mg/dL.
Comparing participants and nonparticipants in disease man-agement programs, greater improvements were found on certainmeasures for participants. Nevertheless, it should be noted thatemployees enrolled in disease management programs tend to beless healthy than their peers at baseline because they are flagged toparticipate in these programs on the basis of predictive modelingthat rely on medical claims data. Thus, at baseline (2005, a yearbefore the disease management program began), disease manage-ment participants in this study had HDL and triglyceride values thatput them at higher risk compared with nonparticipants. Despitethese differences at baseline, total cholesterol and LDL values fellmore sharply for participants than for nonparticipants over 3 years.It is likely that increased cholesterol-lowering prescription drugusage contributed to the reductions in biometric values for programparticipants. Because of data limitations, we did not investigate thatpossibility.
LimitationsThere are several limitations to the current study. First,
laboratory results data were available for Prudential employees whohad lipid and glucose screenings processed by Prudential’s twomain laboratory vendors, and laboratory findings were made avail-able through the medical plan or the on-site clinic. We were unableto gain access to data for Prudential employees who were eitherenrolled in a plan other than Prudential’s primary medical plan andscreened at an off-site provider or enrolled in the primary plan buthad their screenings processed by a laboratory other than the twomain laboratory providers (most commonly an independent labo-ratory). Because of inadequate sample sizes due to the inclusion/exclusion criteria applied, the sample studied for these analysesmay not be representative of the Prudential population as a whole.Nevertheless, when comparing demographics of the sample in thisstudy to the rest of Prudential’s employees, the characteristics of thetwo samples were similar but not identical. Prudential employees inthis sample were older (on average by 4 years) and had a higherannual salary. During the study period, a larger portion of Pruden-
8 © 2010 American College of Occupational and Environmental Medicine
Short et al JOEM • Volume XX, Number X, XXX 2010
tial employees in the sample enrolled in a Consumer-DirectedHealth Plan, which is more often selected by higher wage earners.
For the comparison of self-reported to measured values,recall bias likely influenced results. As Croyle et al38 demonstrated,as the length of time between measurement and recall of valuesincreases, percent accuracy decreases. According to Croyle et al,recall bias can occur in as short a time span as 3 months. With thistradeoff between adequate sample size and recall bias in mind, thesample was restricted to employees with 365 days or fewer betweenmeasured and self-reported values. Nevertheless, this time framerestriction did not eliminate recall bias. Thus, it is probable thatemployees with longer periods between measurements were morelikely to forget their values or recall them inaccurately.
Small sample sizes and data issues limited the number ofpotential confounding variables that were used in the second andthird analyses. These analyses only controlled for gender, race/ethnicity, annual salary, and age. Other factors may have influencedthe decrease observed in cholesterol values, including increased useof medications (such as statins), weight reduction, improved diet,and physical activity values, which were not available for allemployees.
The lack of the information on cholesterol values andamount of physical activity in previous periods precluded us fromdrawing any conclusions about causality related to improvement inHDL values and fitness center use. The fitness center group mayhave been comprised of healthier people, so the higher HDL levelsmay have been present in already healthy employees regardless oftheir use of the fitness center. Categorization of disease manage-ment participants was an additional limitation. Some employeesparticipated in disease management programs in 2007 but hadreductions in their screening values from 2005 to 2006, whichcannot be attributed to their participation in the program. In addi-tion, disease management participation data were only available for2006 and 2007 and before 2006 Prudential used another diseasemanagement vendor that did not collect participation data. There-fore, it is also possible that employees may have benefited fromtheir previous participation in disease management programs. Par-ticipation in other Prudential Health and Wellness Programs, com-pliance with medications to control cholesterol and blood glucosevalues, and other variables not included in this analysis may alsohave influenced the results. Thus, direct causality cannot be deter-mined for the disease management program. Such a conclusion canonly be drawn using longitudinal data where a clean baseline periodis established for program participants and nonparticipants.
A final study limitation relates to blood glucose and lack ofinformation about testing and disease status. The HRA asked theparticipants to indicate whether they had type 2 diabetes andwhether their most recent blood glucose value was recorded as afasting or nonfasting value, although the measured laboratoryvalues had no indicator for fasting status. For the first series ofanalyses evaluating the relationship between self-reported and mea-sured values, we controlled for self-reported type 2 diabetes as apotential confounder. Thus, inadequate data related to presence ofdisease and fasting or nonfasting status may have skewed resultsrelated to blood glucose.
CONCLUSIONSHaving access to objective biometric data afforded Pru-
dential Health and Wellness staff with valuable insights regard-ing its programs. First, the analysis supported the need forongoing evaluation of program effects using self-report datawhen biometric laboratory results are not readily accessible orare expensive to collect.
Second, the analysis supported the clinically proven findingthat employees who are physically active, and may be so because of
use of the company’s fitness centers, are likely to have better HDLlevels when compared with sedentary employees. This result foundin a real-world setting corroborates clinical studies that have showna similar relationship between physical activity and HDL levels,although we were not able to show that participation in the fitnesscenter caused improvements in HDL levels over time. This findinghas implications for Prudential and other employers that encourageworkers to be more physically active. Future studies may wish togauge the amount and intensity of physical activity because itrelates to biometric measures. Conducting longitudinal studies tocompare multiple-year fitness center users with sedentary employ-ees, including previous activity and screening information, wouldalso add to the knowledge base regarding this relationship.
Third, the analysis examined the association between partic-ipation in disease management programs and lipid levels. We foundevidence that participants experienced significant decreases in totalcholesterol and LDL over time compared with nonparticipants.Although these correlations are promising, and suggest topics forfuture investigation, they do not imply causation. In a real-worldstudy, it is difficult to separate out overlapping exposures to otherintervention programs such as care counseling and increased on-siteawareness programs. To determine the true effects of a diseasemanagement program, random assignment to treatment and controlconditions is necessary, which is often difficult to implement in acorporate health improvement program.
In short, the results of this study provide important insightsabout the accuracy of self-reported measures, fitness center userbiometrics, and changes in laboratory values for multiyear em-ployee cohorts in a corporate setting. Future studies may wish toexpand our methods by incorporating prescription medication use.Some of the decreases shown in the cohort analyses and discrep-ancies between self-reported and biometric values could be due toincreased medication compliance. In addition, the large decreasesin cholesterol and LDL for disease management participants maybe a result of cholesterol-lowering medications, which are oftenadvocated by counselors along with behavior change. Finally, itwould be useful to examine longitudinal trends in measured lipidlevels for fitness center users compared with sedentary employees.
ACKNOWLEDGMENTSPrudential Financial provided funding for the preparation of
the manuscript. The opinions expressed in this article are of theauthors’ and do not necessarily represent the opinions of ThomsonReuters, Emory University, or Prudential Financial, Inc.
REFERENCES1. U.S. Department of Health & Human Services. Prevention Makes common
“cents.” Available at: http://aspe.hhs.gov/health/prevention/. Accessed De-cember 29, 2009.
2. Linnan L, Bowling M, Lindsay G, et al. Results of the 2004 NationalWorksite Health Promotion Survey. Am J Public Health. 2008;98:1503–1509.
3. U.S. Department of Health and Human Services. Healthy People 2010:National Health Promotion and Disease Prevention Objectives. Pub No(PHS) 91–50213. Washington, DC: US Government Printing Office; 2000.
4. Lorig KR, Sobel DS, Stewart AL, et al. Evidence suggesting that a chronicdisease self-management program can improve health status while reducinghospitalization: a randomized trial. Med Care. 1999;37:5–14.
5. Von Korff M, Moore JE, Lorig K, et al. A randomized trial of a layperson-led self-management group intervention for back pain patients inprimary care. Spine. 1998;23:2608–2615.
6. Von Korff M, Gruman J, Schaefer SJ, Curry SJ, Wagner EH. Collaborativemanagement of chronic illness. Ann Intern Med. 1997;127:1097–1102.
7. Nash IS, Mosca L, Blumenthal RS, Davidson MH, Smith SC Jr, PasternakRC. Contemporary awareness and understanding of cholesterol as a riskfactor: results of an American Heart Association national survey. Arch InternMed. 2003;163:1597–1600.
© 2010 American College of Occupational and Environmental Medicine 9
JOEM • Volume XX, Number X, XXX 2010 Effects of Prudential’s Health Promotion Programs

8. Pieper RM, Arnett DK, McGovern PG, Shahar E, Blackburn H, Luepker RV.Trends in cholesterol knowledge and screening and hypercholesterolemiaawareness and treatment, 1980–1992. The Minnesota Heart Survey. ArchIntern Med. 1997;157:2326–2332.
9. Cutler JA, Sorlie PD, Wolz M, Thom T, Fields LE, Roccella EJ. Trends inhypertension prevalence, awareness, treatment, and control rates in UnitedStates adults between 1988–1994 and 1999–2004. Hypertension. 2008;52:818–827.
10. Centers for Disease Control and Prevention, Division of Adult and Com-munity Health, National Center for Chronic Disease Prevention and HealthPromotion. Healthy Aging—Clinical Preventive Services. Available at:http://www.cdc.gov/aging/services/index.htm. Accessed January 5, 2010.
11. Huang PA, Buring JE, Ridker PM, Glynn RJ. Awareness, accuracy, andpredictive validity of self-reported cholesterol in women. J Gen Intern Med.2007;22:606–613.
12. Cheng S, Lichtman JH, Amatruda JM, et al. Knowledge of cholesterol levelsand targets in patients with coronary artery disease. Prev Cardiol. 2005;8:11–17.
13. Marschke LM, Allen GJ, Coble DA, et al. Cardiovascular health status andhealth risk assessment method of preference among worksite employees.J Prim Prev. 2006;27:67–79.
14. Huerta JM, Tormo MJ, Egea-Caparros JM, Ortola-Devesa JB, Navarro C.Accuracy of self-reported diabetes, hypertension, and hyperlipidemia in theadult Spanish population. DINO study findings. Rev Esp Cardiol. 2009;62:143–152.
15. Molenaar EA, Ameijden EJC, Grobbee DE, Numans ME. Comparison ofroutine care self-reported and biometrical data on hypertension and diabetes:results of the Utrecht Health Project. Eur J Public Health. 2007;17:199–205.
16. Kodama S, Tanaka K, Saito K, et al. Effect of aerobic exercise training onserum levels of high-density lipoprotein cholesterol: a meta-analysis. ArchIntern Med. 2007;167:999–1008.
17. Kelley GA, Kelley KS, Tran ZV. Aerobic exercise, lipids and lipoproteins inoverweight and obese adults: a meta-analysis of randomized controlledtrials. Int J Obes (Lond). 2005;29:881–893.
18. Naito MT, Nakayama T, Okamura T, et al. Effect of a 4-year workplace-based physical activity intervention program on the blood lipid profiles ofparticipating employees: the high-risk and population strategy for occupa-tional health promotion (HIPOP-OHP) study. Atherosclerosis. 2008;197:784–790.
19. White K, Jacques PH. Combined diet and exercise intervention in theworkplace: effect on cardiovascular disease risk factors. AAOHN J. 2007;55:109–114.
20. Fireman B, Bartlett J, Selby J. Can disease management reduce health carecosts by improving quality? Health Affairs (Millwood). 2004;23:63–75.
21. Fonarow GC, Gawlinski A, Moughrabi S, Tillisch JH. Improved treatment ofcoronary heart disease by implementation of a Cardiac HospitalizationAtherosclerosis Management Program (CHAMP). Am J Cardiol. 2001;87:819–822.
22. Anderson J, Dusenbury L. Worksite cholesterol and nutrition: an interven-tion project in Colorado. AAOHN J. 1999;47:99–106.
23. Edye BV, Mandryk JA, Frommer MS, Healey S, Ferguson DA. Evaluationof a worksite programme for the modification of cardiovascular risk factors.Med J Aust. 1989;150:574–581.
24. Fries JF, Fries ST, Parcell CL, Harrington H. Health risk changes with alow-cost individualized health promotion program: effects at up to 30months. Am J Health Promot. 1992;6:374–371.
25. Gemson DH, Sloan RP. Efficacy of computerized health risk appraisal as apart of periodic health examination at the worksite. Am J Health Promot.1995;9:462–466.
26. Hanlon P, McEwen J, Carey L, et al. Health checks and coronary risk: furtherevidence from a randomised controlled trial. BMJ. 1995;311:1609–1613.
27. Hartman TJ, Himes JH, McCarthy PR, Kushi LH. Effects of a low-fat,worksite intervention on blood lipids and lipoproteins. J Occup EnvironMed. 1995;37:690–696.
28. Nilsson P, Klasson E, Nyberg P. Life-style intervention at the worksite—reduction of cardiovascular risk factors in a randomized study. Scand J WorkEnviron Health. 2001;27:57–62.
29. Prior JO, van Melle G, Crisinel A, Burnand B, Cornuz J, Darioli R.Evaluation of a multicomponent worksite health promotion program forcardiovascular risk factors—correcting for the regression towards the meaneffect. Prev Med. 2005;40:259–267.
30. Puska P, Niemensivu H, Puhakka P, et al. Results of a one-year worksite andmass media based intervention on health behaviour and chronic disease riskfactors. Scand J Soc Med. 1988;16:241–250.
31. Rodnick JE. Health behavior changes associated with health hazard appraisalcounseling in an occupational setting. Prev Med. 1982;11:583–594.
32. Szymanski L, Pate RR, Dowda M, et al. A comparison of questionnaire andphysiological data in predicting future chronic disease risk factor status in anemployee population. Am J Health Promot. 1991;5:298–304.
33. Williams A, Wold J. Nurses, cholesterol, and small worksites: innovativecommunity intervention comparisons. Fam Commun Health. 2000;23:59 –75.
34. Park R. Estimation with heteroskedastic error terms. Econometrica. 1966;34:88.
35. Manning WG, Mullahy J. Estimating log models: to transform or not totransform? J Health Econ. 2001;20:461–494.
36. St Sauver JL, Hagen PT, Cha SS, et al. Agreement between patient reportsof cardiovascular disease and patient medical records. Mayo Clin Proc.2005;80:203–210.
37. Lippi G, Schena F, Salvagno GL, Montagnana M, Ballestrieri F, Guidi GC.Comparison of the lipid profile and lipoprotein(a) between sedentary andhighly trained subjects. Clin Chem Lab Med. 2006;44:322–326.
38. Croyle RT, Loftus EF, Barger SD, Sun Y-C, Hart M, Gettig J. How Well DoPeople Recall Risk Factor Test Results? Accuracy and Bias Among Cho-lesterol Screening Participants. Health Psychol. 2006;25:425–32.
10 © 2010 American College of Occupational and Environmental Medicine
Short et al JOEM • Volume XX, Number X, XXX 2010
Copyright © 2022 FDOKUMEN