WELLNESS FOREVER MEDICARE LIMITED - BSE
372
DRAFT RED HERRING PROSPECTUS Dated September 30, 2021 (This Draft Red Herring Prospectus will be updated upon filing with the RoC) Please read Section 32 of the Companies Act, 2013 Book Built Offer WELLNESS FOREVER MEDICARE LIMITED Our Company was originally incorporated as ‘Wellness Forever Medicare Private Limited’ , a private limited company under the Companies Act, 1956, Mumbai, Maharashtra, pursuant to a certificate of incorporation da ted February 8, 2008, issued by the Registrar of Companies, Maharashtra at Mumbai. Subsequently, our Company was converted into a public limited company pursuant to a resolution passed by our Shareholders at an extraordinary general meeting held on July 9, 2021 and a fresh certificate of incorporation dated August 5, 2021 was issued by the RoC consequent upon conversion, recording the change in the name of our Company to “Wellness Forever Medicare Limited”. For details of changes in name and registered office of our Company since incorporation, see “History and Certain Corporate Matters”, beginning on page 176. Registered and Corporate Office: 7 th Floor, Wing A, Empire Plaza, IT Park, LBS Marg, Vikhroli (West), Mumbai 400 083, Maharashtra India Contact Person: Nidhi Vora, Company Secretary and Compliance Officer; Tel: +91 22 4354 1722 E-mail: [email protected]; Website: www.wellnessforever.com Corporate Identity Number : U24239MH2008PLC178658 OUR PROMOTERS: ASHRAF MOHAMMED BIRAN, GULSHAN HARESH BAKHTIANI AND MOHAN GANPAT CHAVAN INITIAL PUBLIC OFFER OF UP TO [●] EQUITY SHARES OF FACE VALUE OF ₹ 2 EACH (“EQUITY SHARES”) OF WELLNESS FOREVER MEDICARE LIMITED (“COMPANY” OR “ISSUER”) FOR CASH AT A PRICE OF ₹ [●] PER EQUITY SHARE (INCLUDING A SHARE PREMIUM OF ₹ [●] PER EQUITY SHARE FOR THE FRESH ISSUE) (“OFFER PRICE”) AGGREGATING UP TO ₹ [●] MILLION COMPRISING OF A FRESH ISSUE OF [●] EQUITY SHARES AGGREGATING UP TO ₹ 4,000.00 MILLION (“FRESH ISSUE”) AND AN OFFER FOR SALE OF UP TO 16,044,709 EQUITY SHARES, COMPRISING OF UP TO 720,000 EQUITY SHARES AGGREGATING UP TO ₹ [●] MILLION BY ASHRAF MOHAMMED BIRAN, UP TO 720,000 EQUITY SHARES AGGREGATING UP TO ₹ [●] MILLION BY GULSHAN HARESH BAKHTIANI, UP TO 120,000 EQUITY SHARES AGGREGATING UP TO ₹ [●] MILLION BY MOHAN GANPAT CHAVAN (COLLECTIVELY, “THE PROMOTER SELLING SHAREHOLDERS”); AND UP TO 14,484,709 EQUITY SHARES AGGREGATING UP TO ₹ [●] MILLION BY PERSONS REFERRED TO IN ANNEXURE A (REFERRED TO AS THE “OTHER SELLING SHAREHOLDERS”, TOGETHER WITH THE PROMOTER SELLING SHAREHOLDERS, THE “SELLING SHAREHOLDERS”, AND SUCH EQUITY SHARES, THE “OFFERED SHARES”) AGGREGATING UP TO ₹ [●] MILLION (“OFFER FOR SALE”, AND TOGETHER WITH THE FRE SH ISSUE, THE “OFFER”). THE FACE VALUE OF EQUITY SHARES IS ₹ 2 EACH. THE PRICE BAND AND THE MINIMUM BID LOT SHALL BE DECIDED BY OUR COMPANY IN CONSULTATION WITH THE BOOK RUNNING LEAD MANAGERS AND WILL BE ADVERTISED IN ALL EDITIONS OF [●], AN ENGLISH NATIONAL DAILY NEWSPAPER, ALL EDITIONS OF [●], A HINDI NATIONAL DAILY NEWSPAPER AND REGIONAL EDITION OF [●], A MARATHI NEWSPAPER, MARATHI BEING THE REGIONAL LANGUAGE OF MAHARASHTRA, WHERE OUR REGISTERED OFFICE IS LOCATED, WITH WIDE CIRCULATION, AT LEAST TWO WORKING DAYS PRIOR TO THE BID/OFFER OPENING DATE AND SHALL BE MADE AVAILABLE TO THE BSE LIMITED (“BSE”) AND THE NATIONAL STOCK EXCHANGE OF INDIA LIMITED (“NSE”, AND TOGETHER WITH BSE, THE “STOCK EXCHANGES”) FOR THE PURPOS E OF UPLOADING ON THEIR RESPECTIVE WEBSITES IN ACCORDANCE WITH SECURITIES AND EXCHANGE BOARD OF INDIA (ISSUE OF CAPITAL AND DISCLOSURE REQUIREMENTS) REGULATIONS, 2018, AS AMENDED (THE “SEBI ICDR REGULATIONS”). In case of any revision in the Price Band, the Bid/Offer Period will be extended by at least three additional Working Days after such revision in the Price Band, subject to the Bid/Offer Period not exceeding 10 Working Days. In cases of force majeure, banking strike or similar circumstances, our Company may, for reasons to be recorded in writing, extend the Bid/Offer Period for a minimum of three Working Days, subject to the Bid/Offer Period not exceeding 10 Working Days. Any revision in the Price Band and the revised Bid/Offer Period, if applicable, shall be widely disseminated by notification to the Stock Exchanges, by issuing a public notice, and also by indicating the change on the respective websites of the Book Running Lead Managers and at the terminals of the Syndicate Members and by intimation to Designated Intermediaries and the Sponsor Bank, as applicable. The Offer is being made through the Book Building Process, in terms of Rule 19(2)(b) of the Securities Contracts (Regulation) Rules, 1957, as amended (“ SCRR”) read with Regulation 31 of the SEBI ICDR Regulations and in compliance with Regulation 6(2) of the SEBI ICDR Regulations, wherein not less than 75% of the Offer shall be allocated on a proportionate basis to Qualified Institutional Buyers (“ QIBs”, the “QIB Portion”), provided that our Company may, in consultation with the Book Running Lead Managers, allocate up to 60% of the QIB Portion to Anchor Investors on a discretionary basis in accordance with the SEBI ICDR Regulat ions (“Anchor Investor Portion ”), of which one-third shall be reserved for domestic Mutual Funds, subject to valid Bids being received from domestic Mutual Funds at or above the Anchor Investor Allocation Price. Further, 5% of the QIB Portion (excluding Anchor Investor Portion) (“Net QIB Portion”) shall be available for allocation on a proportionate basis only to Mutual Funds, and the remainder of the Net QIB Portion shall be available for allocation on a proportionate basis to all QIBs, including Mutual Funds, subject to valid Bids being received at or above the Offer Price. However, if the aggregate demand from Mutual Funds is less than 5% of the Net QIB Portion, the balance Equity Shares available for allocation in the Mutual Fund Portion will be added to the remaining Net QIB Portion for proportionate allocation to QIBs. Further, not more than 15% of the Offer shall be available for allocation on a proportionate basis to Non-Institutional Bidders and not more than 10% of the Offer shall be available for allocation to Retail Individual Bidders in accordance with the SEBI ICDR Regulations, subject to valid Bids being received at or above the Offer Price. All potential Bidders (except Anchor Investors) are required to mandatorily utilise the Application Supported by Blocked Amount (“ASBA”) process providing details of their respective ASBA accounts(including UPI ID in case of RIBs using the UPI Mechanism) if applicable, in which the corresponding Bid Amounts will be blocked by the SCSBs or under the UPI Mechanism, as the case may be, to the extent of respective Bid Amounts. Anchor Investors are not permitted to participate in the Offer through the ASBA process. For details, see “ Offer Procedure” beginning on page 338. RISKS IN RELATION TO THE FIRST OFFER This being the first public Offer of our Company, there has been no formal market for the Equity Shares of our Company. The face value of the Equity Shares is ₹ 2. The Floor Price, Cap Price and Offer Price should not be considered to be indicative of the market price of the Equity Shares after the Equity Shares are listed. No assurance can be given regarding an active or sustained trading in the Equity Shares nor regarding the price at which the Equity Shares will be traded after listing. GENERAL RISK Investments in equity and equity-related securities involve a degree of risk and investors should not invest any funds in the Offer unless they can afford to take the risk of losing their entire investment. Investors are advised to read the risk factors carefully before taking an investment decision in the Offer. For taking an investment decision, investors must rely on their own examination of our Company and the Offer, including the risks involved. The Equity Shares in the Offer have not been recommended or approved by the Securities and Exchange Board of India (“ SEBI”), nor does SEBI guarantee the accuracy or adequacy of the contents of this Draft Red Herring Prospectus. Specific attention of the investors is invited to “ Risk Factors” beginning on page 26. OUR COMPANY’S AND THE SELLING SHAREHOLDERS’ ABSOLUTE RESPONSIBILITY Our Company, having made all reasonable inquiries, accepts responsibility for and confirms that this Draft Red Herring Prospe ctus contains all information with regard to our Company and the Offer, which is material in the context of the Offer, that the information contained in this Draft Red Herring Prospectus is true and correct in all material aspects and is not misleading in any material respect, that the opinions and intentions expressed herein are honestly held and that there are no other facts, the omission or inclusion of which makes this Draft Red Herring Prospectus as a whole or any of such information or the expression of any such opinions or intentions misleading in any material respect. Further, each of the Selling Shareholders, severally and not jointly, accept responsibility for and confirm only the Selling Shareholder statements expressly made by such Selling Shareholder in this Draft Red Herring Prospectus to the extent of information specifically pertaining to itself and respective portion of its Offered Shares and assumes responsibility that such statements are true and correct in all material respects and not misleading in any material respect. The Selling Shareholders assume no responsibility for any other statements, including without limitation, any and all statement made by or relating to our Company or the other Selling Shareholders or in relation to our Company’s business in this Draft Red Herring Prospectus. LISTING The Equity Shares offered through the Red Herring Prospectus are proposed to be listed on the Stock Exchanges. Our Company has received ‘in-principle’ approvals from BSE and NSE for the listing of the Equity Shares pursuant to their letters dated [●] and [●], respectively. For the purposes of the Offer, the Designated Stock Exchange shall be [●]. A copy of the Red Herring Prospectus and the Prospectus shall be delivered to t he RoC in accordance with Section 26(4) and 32 of the Companies Act 2013. For details of the material contracts and documents available for inspection from the date of the Red Herring Prospectus up to the Bid/Offer Closing Date, see “Material Contracts and Documents for Inspection” beginning on page 363. BOOK RUNNING LEAD MANAGERS REGISTRAR TO THE OFFER IIFL Securities Limited 10th Floor, IIFL Centre Kamala City, Senapati Bapat Marg Lower Parel (West), Mumbai 400 013 Maharashtra, India Tel: +91 22 4646 4600 E-mail: [email protected] Website: www.iiflcap.com Investor Grievance ID: [email protected] Contact person: Mukesh Garg/Nishita Mody SEBI Registration Number: INM000010940 Ambit Private Limited Ambit House, 449, Senapati Bapat Marg, Lower Parel, Mumbai 400 013 Maharashtra, India Tel: +91 22 6623 3000 E-mail: [email protected] Website: www.ambit.co Investor Grievance ID: [email protected] Contact person: Nikhil Bhiwapurkar / Miraj Sampat SEBI Registration Number: INM000010585 DAM Capital Advisors Limited (Formerly IDFC Securities Limited) One BKC, Tower C, 15 th Floor, Unit No. 1511, Bandra Kurla Complex, Bandra (East), Mumbai 400 051 Maharashtra, India Tel: +91 22 4202 2500 E-mail: [email protected] Website: www.damcapital.in Investor Grievance ID: [email protected] Contact person: Gunjan Jain SEBI Registration Number: MB/INM000011336 HDFC Bank Limited Investment Banking Group Unit No. 401 & 402, 4 th Floor, Tower B, Peninsula Business Park, Lower Parel, Mumbai 400 013, Maharashtra, India Tel: +91 22 3395 8233 E-mail: [email protected] Website: www.hdfcbank.com Investor Grievance ID: [email protected] Contact Person: Harsh Thakkar / Ravi Sharma SEBI Registration Number : INM000011252 Link Intime India Private Limited C 101, 247 Park L.B.S Marg Vikhroli (West), Mumbai 400 083 Maharashtra, India Tel: +91 22 4918 6200 E-mail: [email protected] Website: www.linkintime.co.in Investor Grievance ID: [email protected] Contact Person: Shanti Gopalkrishnan SEBI Registration Number : INR000004058 BID/OFFER PROGRAMME BID/OFFER OPENS ON * [●] BID/OFFER CLOSES ON ** [●] * Our Company in consultation with the Book Running Lead Managers may consider participation by Anchor Investors in accordance with the SEBI ICDR Regulations. The Anchor Investor Bid/Offer Period shall be one Working Day prior to the Bid/Offer Opening Date. ** Our Company in consultation with the Book Running Lead Managers may consider closing the Bid/Offer Period for QIBs one Working Day prior to the Bid/Offer Closing Date in accordance with the SEBI ICDR Regulations.
-
Upload
khangminh22 -
Category
Documents
-
view
0 -
download
0
Transcript of WELLNESS FOREVER MEDICARE LIMITED - BSE

DRAFT RED HERRING PROSPECTUS Dated September 30, 2021
(This Draft Red Herring Prospectus will be updated upon filing with the RoC)
Please read Section 32 of the Companies Act, 2013 Book Built Offer
WELLNESS FOREVER MEDICARE LIMITED Our Company was originally incorporated as ‘Wellness Forever Medicare Private Limited’ , a private limited company under the Companies Act, 1956, Mumbai, Maharashtra, pursuant to a certificate of incorporation da ted February 8,
2008, issued by the Registrar of Companies, Maharashtra at Mumbai. Subsequently, our Company was converted into a public limited company pursuant to a resolution passed by our Shareholders at an extraordinary general meeting held on July 9, 2021 and a fresh certificate of incorporation dated August 5, 2021 was issued by the RoC consequent upon conversion, recording the change in the name of our Company to “Wellness Forever Medicare Limited”. For details of changes in name and registered office of our Company since incorporation, see “History and Certain Corporate Matters”, beginning on page 176.
Registered and Corporate Office: 7th Floor, Wing A, Empire Plaza, IT Park, LBS Marg, Vikhroli (West), Mumbai 400 083, Maharashtra India
Contact Person: Nidhi Vora, Company Secretary and Compliance Officer; Tel: +91 22 4354 1722 E-mail: [email protected]; Website: www.wellnessforever.com
Corporate Identity Number: U24239MH2008PLC178658
OUR PROMOTERS: ASHRAF MOHAMMED BIRAN, GULSHAN HARESH BAKHTIANI AND MOHAN GANPAT CHAVAN
INITIAL PUBLIC OFFER OF UP TO [●] EQUITY SHARES OF FACE VALUE OF ₹ 2 EACH (“EQUITY SHARES”) OF WELLNESS FOREVER MEDICARE LIMITED (“COMPANY” OR “ISSUER”) FOR CASH AT A PRICE OF ₹ [●] PER EQUITY SHARE (INCLUDING A SHARE PREMIUM OF ₹ [●] PER EQUITY SHARE FOR THE FRESH ISSUE) (“OFFER PRICE”) AGGREGATING UP TO ₹ [●] MILLION COMPRISING OF A FRESH ISSUE OF [●] EQUITY SHARES AGGREGATING UP TO ₹ 4,000.00 MILLION (“FRESH ISSUE”) AND AN OFFER FOR SALE OF UP TO 16,044,709 EQUITY SHARES, COMPRISING OF UP TO 720,000 EQUITY SHARES AGGREGATING UP TO ₹ [●] MILLION BY ASHRAF MOHAMMED BIRAN, UP TO 720,000 EQUITY SHARES AGGREGATING UP TO ₹ [●] MILLION BY GULSHAN HARESH BAKHTIANI, UP TO 120,000 EQUITY SHARES AGGREGATING UP TO ₹ [●] MILLION BY MOHAN GANPAT CHAVAN (COLLECTIVELY, “THE PROMOTER SELLING SHAREHOLDERS”); AND UP TO 14,484,709 EQUITY SHARES AGGREGATING UP TO ₹ [●] MILLION BY PERSONS REFERRED TO IN ANNEXURE A (REFERRED TO AS THE “OTHER SELLING SHAREHOLDERS”, TOGETHER WITH THE PROMOTER SELLING SHAREHOLDERS, THE “SELLING SHAREHOLDERS”, AND SUCH EQUITY SHARES, THE “OFFERED SHARES”) AGGREGATING UP TO ₹ [●] MILLION (“OFFER FOR SALE”, AND TOGETHER WITH THE FRESH ISSUE, THE “OFFER”). THE FACE VALUE OF EQUITY SHARES IS ₹ 2 EACH. THE PRICE BAND AND THE MINIMUM BID LOT SHALL BE DECIDED BY OUR COMPANY IN CONSULTATION WITH THE BOOK RUNNING LEAD MANAGERS AND WILL BE ADVERTISED IN ALL EDITIONS OF [●], AN ENGLISH NATIONAL DAILY NEWSPAPER, ALL EDITIONS OF [●], A HINDI NATIONAL DAILY NEWSPAPER AND REGIONAL EDITION OF [●], A MARATHI NEWSPAPER, MARATHI BEING THE REGIONAL LANGUAGE OF MAHARASHTRA, WHERE OUR REGISTERED OFFICE IS LOCATED, WITH WIDE CIRCULATION, AT LEAST TWO WORKING DAYS PRIOR TO THE BID/OFFER OPENING DATE AND SHALL BE MADE AVAILABLE TO THE BSE LIMITED (“BSE”) AND THE NATIONAL STOCK EXCHANGE OF INDIA LIMITED (“NSE”, AND TOGETHER WITH BSE, THE “STOCK EXCHANGES”) FOR THE PURPOSE OF UPLOADING ON THEIR RESPECTIVE WEBSITES IN ACCORDANCE WITH SECURITIES AND EXCHANGE BOARD OF INDIA (ISSUE OF CAPITAL AND DISCLOSURE REQUIREMENTS) REGULATIONS, 2018, AS AMENDED (THE “SEBI ICDR REGULATIONS”). In case of any revision in the Price Band, the Bid/Offer Period will be extended by at least three additional Working Days after such revision in the Price Band, subject to the Bid/Offer Period not exceeding 10 Working Days. In cases of force majeure, banking strike or similar circumstances, our Company may, for reasons to be recorded in writing, extend the Bid/Offer Period for a minimum of three Working Days, subject to the Bid/Offer Period not exceeding 10 Working Days. Any revision in the Price Band and the revised Bid/Offer Period, if applicable, shall be widely disseminated by notification to the Stock Exchanges, by issuing a public notice, and also by indicating the change on the respective websites of the Book Running Lead Managers and at the terminals of the Syndicate Members and by intimation to Designated Intermediaries and the Sponsor Bank, as applicable.
The Offer is being made through the Book Building Process, in terms of Rule 19(2)(b) of the Securities Contracts (Regulation) Rules, 1957, as amended (“SCRR”) read with Regulation 31 of the SEBI ICDR Regulations and in compliance with Regulation 6(2) of the SEBI ICDR Regulations, wherein not less than 75% of the Offer shall be allocated on a proportionate basis to Qualified Institutional Buyers (“QIBs”, the “QIB Portion”), provided that our
Company may, in consultation with the Book Running Lead Managers, allocate up to 60% of the QIB Portion to Anchor Investors on a discretionary basis in accordance with the SEBI ICDR Regulations (“Anchor Investor Portion”), of which one-third shall be reserved for domestic Mutual Funds, subject to valid Bids being received from domestic Mutual Funds at or above the Anchor Investor Allocation Price. Further, 5% of the QIB Portion (excluding Anchor Investor Portion) (“Net QIB Portion”) shall be available for allocation on a proportionate basis only to Mutual Funds, and the remainder of the Net QIB Portion shall be available for allocation on a proportionate basis to all QIBs, including Mutual Funds, subject to valid Bids being received at or above the Offer Price. However, if the aggregate demand fr om Mutual Funds is less than 5% of the Net QIB Portion, the balance Equity Shares available for allocation in the Mutual Fund Portion will be added to the remaining Net QIB Portion for proportionate allocation to QIBs. Further, not more than 15% of the Offer shall be available for allocation on a proportionate basis to Non-Institutional
Bidders and not more than 10% of the Offer shall be available for allocation to Retail Individual Bidders in accordance with the SEBI ICDR Regulations, subject to valid Bids being received at or above the Offer Price. All potential Bidders (except Anchor Investors) are required to mandatorily utilise the Application Supported by Blocked Amount (“ASBA”) process providing details of their respective ASBA accounts(including UPI ID in case of RIBs using the UPI Mechanism) if applicable, in which the corresponding Bid Amounts will be blocked by the SCSBs or under the UPI Mechanism, as the case ma y be, to the extent of respective Bid Amounts. Anchor Investors are not permitted to participate in the Offer through the ASBA process. For details, see “Offer Procedure” beginning on page 338.
RISKS IN RELATION TO THE FIRST OFFER
This being the first public Offer of our Company, there has been no formal market for the Equity Shares of our Company. The face value of the Equity Shares is ₹ 2. The Floor Price, Cap Price and Offer Price should not be considered to be indicative of the market price of the Equity Shares after the Equity Shares are listed. No assurance can be given regarding an active or sustained trading in the Equity Shares nor regarding the price at which the Equity Shares will be traded after listing.
GENERAL RISK
Investments in equity and equity-related securities involve a degree of risk and investors should not invest any funds in the Offer unless they can afford to take the risk of losing their entire investment. Investors are advised to read the risk factors carefully before taking an investment decision in the Offer. For taking an investment decision, investors must rely on their own examination of our Company and the Offer, including the risks involved. The Equity Shares in the Offer have not been recommended or approved by the Securities and Exchange Board of India (“SEBI”), nor does SEBI guarantee the accuracy or adequacy of the contents of this Draft Red Herring Prospectus. Specific attention
of the investors is invited to “Risk Factors” beginning on page 26.
OUR COMPANY’S AND THE SELLING SHAREHOLDERS’ ABSOLUTE RESPONSIBILITY
Our Company, having made all reasonable inquiries, accepts responsibility for and confirms that this Draft Red Herring Prospe ctus contains all information with regard to our Company and the Offer, which is material in the context
of the Offer, that the information contained in this Draft Red Herring Prospectus is true and correct in all material aspects and is not misleading in any material respect, that the opinions and intentions expressed herein are honestly held and that there are no other facts, the omission or inclusion of which makes this Draft Red Herring Prospectus as a whole or any of such information or the expression of any such opinions or intentions misleading in any material respect. Further, each of the Selling Shareholders, severally and not jointly, accept responsibility for and confirm only the Selling Shareholder statements expressly made by such Selling Shareholder in this Draft Red Herring Prospectus to the extent of information specifically pertaining to itself and respective portion of its Offered Shares and assumes responsibility that such statements are true and correct in all material respects and not misleading in any material respect. The Selling Shareholders assume no responsibility for any other statements, including without limitation, any and all statement made by or relating to our Company or the other Selling Shareholders or in relation to our
Company’s business in this Draft Red Herring Prospectus. LISTING
The Equity Shares offered through the Red Herring Prospectus are proposed to be listed on the Stock Exchanges. Our Company has received ‘in-principle’ approvals from BSE and NSE for the listing of the Equity Shares pursuant to
their letters dated [●] and [●], respectively. For the purposes of the Offer, the Designated Stock Exchange shall be [●]. A copy of the Red Herring Prospectus and the Prospectus shall be delivered to the RoC in accordance with Section 26(4) and 32 of the Companies Act 2013. For details of the material contracts and documents available for inspection from the date of the Red Herring Prospectus up to the Bid/Offer Closing Date, see “Material Contracts and Documents for Inspection” beginning on page 363.
BOOK RUNNING LEAD MANAGERS REGISTRAR TO THE OFFER
IIFL Securities Limited
10th Floor, IIFL Centre Kamala City, Senapati Bapat Marg Lower Parel (West), Mumbai 400 013 Maharashtra, India
Tel: +91 22 4646 4600 E-mail: [email protected] Website: www.iiflcap.com Investor Grievance ID: [email protected] Contact person: Mukesh Garg/Nishita
Mody SEBI Registration Number: INM000010940
Ambit Private Limited
Ambit House, 449, Senapati Bapat Marg, Lower Parel, Mumbai 400 013 Maharashtra, India
Tel: +91 22 6623 3000 E-mail: [email protected]
Website: www.ambit.co Investor Grievance ID: [email protected]
Contact person: Nikhil Bhiwapurkar / Miraj Sampat SEBI Registration Number: INM000010585
DAM Capital Advisors Limited
(Formerly IDFC Securities Limited) One BKC, Tower C, 15th Floor, Unit No. 1511, Bandra Kurla Complex, Bandra (East), Mumbai 400 051
Maharashtra, India Tel: +91 22 4202 2500 E-mail: [email protected] Website: www.damcapital.in Investor Grievance ID:
[email protected] Contact person: Gunjan Jain SEBI Registration Number: MB/INM000011336
HDFC Bank Limited
Investment Banking Group Unit No. 401 & 402, 4th Floor, Tower B, Peninsula Business Park, Lower Parel, Mumbai 400 013,
Maharashtra, India Tel: +91 22 3395 8233 E-mail: [email protected] Website: www.hdfcbank.com Investor Grievance ID:
[email protected] Contact Person: Harsh Thakkar / Ravi Sharma SEBI Registration Number: INM000011252
Link Intime India Private Limited
C 101, 247 Park L.B.S Marg Vikhroli (West), Mumbai 400 083 Maharashtra, India
Tel: +91 22 4918 6200 E-mail: [email protected] Website: www.linkintime.co.in Investor Grievance ID:
[email protected] Contact Person: Shanti Gopalkrishnan SEBI Registration Number: INR000004058
BID/OFFER PROGRAMME
BID/OFFER OPENS ON* [●]
BID/OFFER CLOSES ON** [●]
* Our Company in consultation with the Book Running Lead Managers may consider participation by Anchor Investors in accordance with the SEBI ICDR Regulations. The Anchor Investor Bid/Offer Period shall be one Working Day prior to the Bid/Offer Opening Date.
** Our Company in consultation with the Book Running Lead Managers may consider closing the Bid/Offer Period for QIBs one Working Day prior to the Bid/Offer Closing Date in accordance with the SEBI ICDR Regulations.

(This page is intentionally left blank)
i
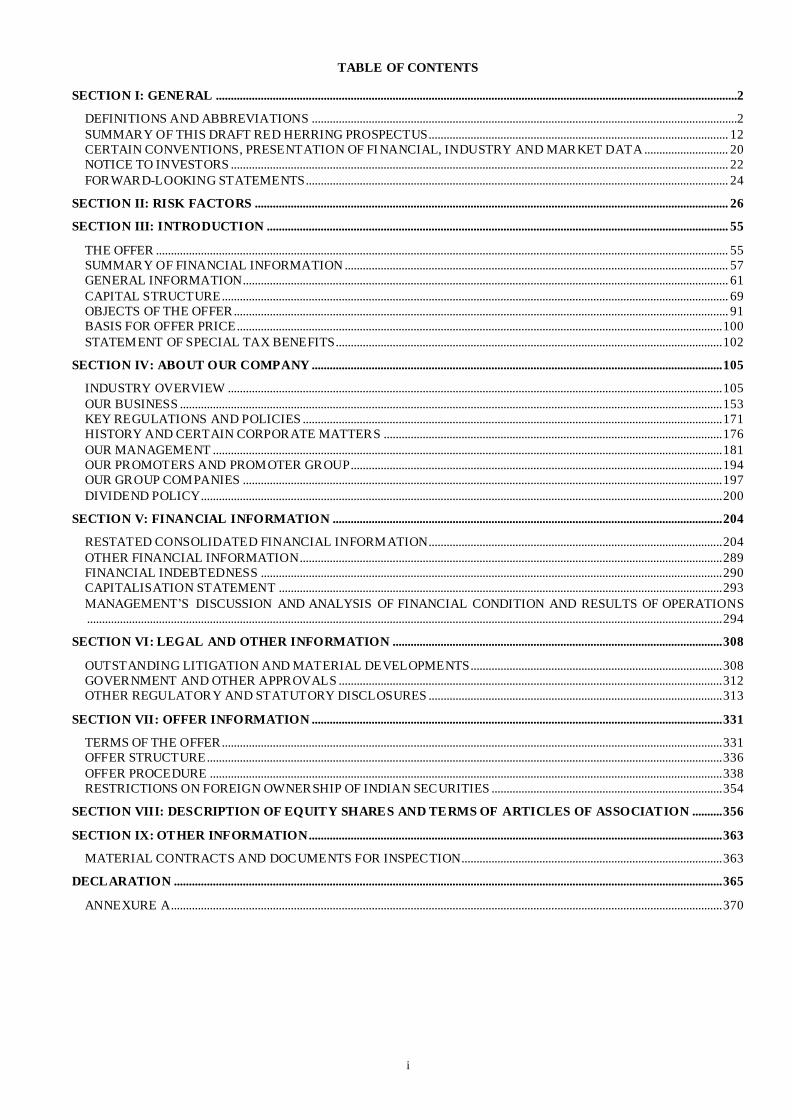
TABLE OF CONTENTS
SECTION I: GENERAL ..............................................................................................................................................................................2
DEFINITIONS AND ABBREVIATIONS ..............................................................................................................................................2 SUMMARY OF THIS DRAFT RED HERRING PROSPECTUS.................................................................................................... 12 CERTAIN CONVENTIONS, PRESENTATION OF FI NANCIAL, INDUSTRY AND MARKET DATA ............................ 20 NOTICE TO INVESTORS ...................................................................................................................................................................... 22 FORWARD-LOOKING STATEMENTS............................................................................................................................................. 24
SECTION II: RISK FACTORS .............................................................................................................................................................. 26
SECTION III: INTRODUCTION .......................................................................................................................................................... 55
THE OFFER ............................................................................................................................................................................................... 55 SUMMARY OF FINANCIAL INFORMATION ................................................................................................................................ 57 GENERAL INFORMATION.................................................................................................................................................................. 61 CAPITAL STRUCTURE......................................................................................................................................................................... 69 OBJECTS OF THE OFFER..................................................................................................................................................................... 91 BASIS FOR OFFER PRICE .................................................................................................................................................................. 100 STATEMENT OF SPECIAL TAX BENEFITS................................................................................................................................. 102
SECTION IV: ABOUT OUR COMPANY ......................................................................................................................................... 105
INDUSTRY OVERVIEW ..................................................................................................................................................................... 105 OUR BUSINESS ..................................................................................................................................................................................... 153 KEY REGULATIONS AND POLICIES ............................................................................................................................................ 171 HISTORY AND CERTAIN CORPORATE MATTERS ................................................................................................................. 176 OUR MANAGEMENT .......................................................................................................................................................................... 181 OUR PROMOTERS AND PROMOTER GROUP............................................................................................................................ 194 OUR GROUP COMPANIES ................................................................................................................................................................ 197 DIVIDEND POLICY.............................................................................................................................................................................. 200
SECTION V: FINANCIAL INFORMATION .................................................................................................................................. 204
RESTATED CONSOLIDATED FINANCIAL INFORMATION.................................................................................................. 204 OTHER FINANCIAL INFORMATION............................................................................................................................................. 289 FINANCIAL INDEBTEDNESS .......................................................................................................................................................... 290 CAPITALISATION STATEMENT .................................................................................................................................................... 293 MANAGEMENT’S DISCUSSION AND ANALYSIS OF FINANCIAL CONDITION AND RESULTS OF OPERATIONS
.................................................................................................................................................................................................................... 294
SECTION VI: LEGAL AND OTHER INFORMATION .............................................................................................................. 308
OUTSTANDING LITIGATION AND MATERIAL DEVELOPMENTS.................................................................................... 308 GOVERNMENT AND OTHER APPROVALS ................................................................................................................................ 312 OTHER REGULATORY AND STATUTORY DISCLOSURES .................................................................................................. 313
SECTION VII: OFFER INFORMATION ......................................................................................................................................... 331
TERMS OF THE OFFER....................................................................................................................................................................... 331 OFFER STRUCTURE............................................................................................................................................................................ 336 OFFER PROCEDURE ........................................................................................................................................................................... 338 RESTRICTIONS ON FOREIGN OWNERSHIP OF INDIAN SECURITIES ............................................................................. 354
SECTION VIII: DESCRIPTION OF EQUITY SHARES AND TERMS OF ARTICLES OF ASSOCIATION .......... 356
SECTION IX: OTHER INFORMATION.......................................................................................................................................... 363
MATERIAL CONTRACTS AND DOCUMENTS FOR INSPECTION....................................................................................... 363
DECLARATION ....................................................................................................................................................................................... 365
ANNEXURE A........................................................................................................................................................................................ 370

2
SECTION I: GENERAL
DEFINITIONS AND ABBREVIATIONS
This Draft Red Herring Prospectus uses certain definitions and abbreviations which, unless the context otherwise indicates or
implies, or unless otherwise specified, shall have the meaning as provided below. References to any legislation, act, regulation,
rules, guidelines or policies shall be to such legislation, act, regulation, rules, guidelines or policies as amended, supple mented
or re-enacted from time to time, and any reference to a statutory provision shall include any subordinate legislation made from
time to time under that provision.
The words and expressions used in this Draft Red Herring Prospectus but not defined herein shall have, to the extent applicable,
the same meaning ascribed to such terms under the SEBI ICDR Regulations, the Companies Act, the SCRA, the Depositories
Act and the rules and regulations made thereunder. Further, Offer related terms used but not defined in this Draft Red Herring
Prospectus shall have the meaning ascribed to such terms under the General Information Document.
Notwithstanding the foregoing, the terms used in “Basis for Offer Price”, “Statement of Special Tax Benefits”, “Industry
Overview”, “Key Regulations and Policies”, “Financial Information”, “Outstanding Litigation and Material Developments”
and “Description of Equity Shares and Terms of Articles of Association” beginning on pages 100, 102, 105, 171, 204, 308 and
356, respectively, shall have the meaning ascribed to them in the relevant section.
General Terms
Term Description
“our Company” or “the Company”
Wellness Forever Medicare Limited, a public limited company incorporated under the Companies Act, 1956 and having its Registered and Corporate Office at 7th Floor, Wing A, Empire Plaza, IT Park, LBS
Marg, Vikhroli (West), Mumbai 400 083, Maharashtra, India
“we”, “us” or “our” Unless the context otherwise indicates or implies or except in terms of our Restated Consolidated Financial Information, refers to our Company together with our Subsidiaries
Company Related Terms
Term Description
Amendment cum Termination
Agreement
Amendment cum termination agreement dated September 30, 2021 entered into among the parties to the
SHA (defined hereinafter)
“Articles of Association” or
“AoA”
Articles of association of our Company, as amended
Audit Committee The audit committee of our Board, constituted in accordance with the applicable provisions of the
Companies Act, 2013 and the SEBI Listing Regulations, and as described in “Our Management –
Committees of our Board of Directors – Audit Committee” on page 185
“Auditors” or “Statutory Auditors”
Statutory auditor of our Company, namely, Deloitte Haskins & Sells LLP
“Board” or “Board of
Directors”
Board of directors of our Company, as described in “Our Management”, beginning on page 181
Business Transfer Agreement Business transfer agreement dated September 2, 2021, pursuant to which the e-commerce business along
with operation, development and maintenance of the website www.wellnessforever.com and “Wellness
Forever” mobile application (including assets, contracts, employees, liabilities and intellectual property) has been transferred to Wellness Forever HealthTech Private Limited on a slump sale basis
Class A equity shares Class A equity shares of face value of ₹10 each of our Company
Class A1 equity shares Class A1 equity shares of face value of ₹10 each of our Company
Class A2 equity shares Class A2 equity shares of face value of ₹10 each of our Company
Class A3 equity shares Class A3 equity shares of face value of ₹10 each of our Company
Company Secretary and
Compliance Officer
The company secretary and compliance officer of our Company, Nidhi Vora. For details, see “Our
Management”, beginning on page 181
Corporate Social
Responsibility Committee
Corporate social responsibility committee of our Board, constituted in accordance with the applicable
provisions of the Companies Act, 2013, and as described in “Our Management – Committees of our Board
of Directors – Corporate Social Responsibility Committee” on page 189
Director(s) Directors on the Board as described in “Our Management”, beginning on page 181
Equity Shares Equity shares of face value of ₹ 2 each, of our Company
ESOP 2018 Wellness Forever Employee Stock Option Plan 2018
ESOP 2020 Wellness Forever Employee Stock Option Plan 2020
ESOP 2021 Wellness Forever Employee Stock Option Plan 2021
Executive Director(s) Executive director(s) on our Board, as described in “Our Management”, beginning on page 181
Group Companies Companies identified as ‘group companies’ of our Company in terms of Regulation 2(1)(t) of the SEBI
ICDR Regulations, namely, RDPL, PBPL, SDPPL and IHPL
IHPL IPC Healthcare Private Limited
Independent Directors Independent directors on our Board, as described in “Our Management”, beginning on page 181
IPO Committee IPO committee of our Board
“Key Managerial Personnel” or “KMP”
Key managerial personnel of our Company identified in accordance with Regulation 2(1)(bb) of the SEBI ICDR Regulations, as described in “Our Management – Key Managerial Personnel” on page 192

3
Term Description
“Memorandum of Association”
or “MoA”
Memorandum of association of our Company, as amended
Nomination and Remuneration
Committee
Nomination and remuneration committee of our Board, constituted in accordance with the applicable
provisions of the Companies Act, 2013 and the SEBI Listing Regulations, and as described in “Our
Management – Committees of our Board of Directors – Nomination and Remuneration Committee” on
page 188
Non-Executive Directors Non-executive directors on our Board, as described in “Our Management”, beginning on page 181
Other Selling Shareholders Persons listed in Annexure A
PBPL Pinnacle Biomed Private Limited
Promoters The promoters of our Company, namely Ashraf Mohammed Biran, Gulshan Haresh Bakhtiani and Mohan
Ganpat Chavan. For details, see “Our Promoters and Promoter Group”, beginning on page 194
Promoter Group Persons and entities constituting the promoter group of our Company in terms of Regulation 2(1)(pp) of
the SEBI ICDR Regulations, as disclosed in “Our Promoters and Promoter Group”, beginning on page
194
Promoter Selling Shareholders Ashraf Mohammed Biran, Gulshan Haresh Bakhtiani, and Mohan Ganpat Chavan
RDPL Rahul Distributors Private Limited
Registered and Corporate
Office
7th Floor, Wing A, Empire Plaza, IT Park, LBS Marg, Vikhroli (West), Mumbai 400 083, Maharashtra
India
“Registrar of Companies” or
RoC”
Registrar of Companies, Maharashtra at Mumbai
Restated Consolidated Financial Information
Restated consolidated financial information of our Company and its Subsidiary i.e. Amore Health Essentials Private Limited (collectively referred to as “Group”) comprising of the restated consolidated
statement of assets and liabilities as at March 31, 2021, March 31, 2020 and March 31, 2019, the restated
consolidated statement of profit and loss (including other comprehensive income), the restated
consolidated statement of cash flows and the restated consolidated statement of changes in equity for the
years ended March 31, 2021, March 31, 2020 and March 31, 2019 and the summary of significant accounting policies and explanatory notes, prepared in terms of the requirements of Section 26 of Part I of
Chapter III of the Companies Act, the SEBI ICDR Regulations and the Guidance Note on Reports in
Company Prospectuses (Revised 2019) issued by the ICAI, as amended from time to time.
Risk Management Committee The risk management committee of our Board, constituted in accordance with the applicable provisions of the SEBI Listing Regulations, and as described in “Our Management – Committees of our Board of
Directors – Risk Management Committee” on page 187
Selling Shareholders Collectively, the Promoter Selling Shareholders and the Other Selling Shareholders
Series A CCPS Series A compulsorily convertible preference shares of face value of ₹10 each of our Company
Series A1 CCPS Series A1 compulsorily convertible preference shares of face value of ₹10 each of our Company
Series A2 CCPS Series A2 compulsorily convertible preference shares of face value of ₹10 each of our Company
Series A3 CCPS Series A3 compulsorily convertible preference shares of face value of ₹10 each of our Company
SHA/ Shareholders’
Agreement
Shareholders’ Agreement dated September 29, 2014 entered into among our Company, Promoters, Ramesh
Shantilal Mehta and certain other Shareholders, as amended by the amendment agreement dated May 12,
2015, addendum to the Shareholders’ Agreement dated July 26, 2016, second addendum to the Shareholders’ Agreement dated November 21, 2017, third addendum to the Shareholders’ Agreement
dated July 17, 2019
Shareholders Holders of Equity Shares of our Company from time to time
SDPPL Shreeji Distributors Pharma Private Limited
SPA 2017 Share Purchase Agreement dated November 21, 2017 entered into among our Company, Promoters, certain Shareholders and persons purchasing the equity shares
SPA 2019 Share Purchase Agreement dated July 17, 2019 entered into among our Company, certain Promoters,
certain Shareholders and persons purchasing the equity shares
Stakeholders’ Relationship
Committee
Stakeholders’ relationship committee of our Board, constituted in accordance with the applicable
provisions of the Companies Act, 2013 and the SEBI Listing Regulations, and as described in “Our
Management – Committees of our Board of Directors – Stakeholders’ Relationship Committee” on page
189
Subsidiaries The subsidiaries of our Company, namely Amore Health Essentials Private Limited and Wellness Forever
HealthTech Private Limited
Offer Related Terms
Term Description
Abridged Prospectus Abridged prospectus means a memorandum containing such salient features of a prospectus as may be
specified by the SEBI in this behalf
Acknowledgement Slip The slip or document issued by the relevant Designated Intermediary to a Bidder as proof of registration
of the Bid cum Application Form
“Allot” or “Allotment” or
“Allotted”
Unless the context otherwise requires, the allotment of Equity Shares to the successful Bidder pursuant to
the Fresh Issue and transfer of Offered Shares pursuant to the Offer for Sale to the successful Bidders
Allotment Advice A note or advice or intimation of Allotment, sent to the successful Bidders who have been or are to be
Allotted the Equity Shares after the Basis of Allotment has been approved by the Designated Stock
Exchange
Allottee A successful Bidder to whom the Equity Shares are Allotted

4
Term Description
Ambit Ambit Private Limited
Anchor Investor A Qualified Institutional Buyer, applying under the Anchor Investor Portion in accordance with the requirements specified in the SEBI ICDR Regulations and the Red Herring Prospectus and who has Bid
for an amount of at least ₹100 million
Anchor Investor Allocation
Price
The price at which Equity Shares will be allocated to the Anchor Investors in terms of the Red Herring
Prospectus and the Prospectus, which will be decided by our Company in consultation with the Book Running Lead Managers during the Anchor Investor Bid/Offer Period
Anchor Investor Application
Form
The application form used by an Anchor Investor to make a Bid in the Anchor Investor Portion and which
will be considered as an application for Allotment in terms of the Red Herring Prospectus
Anchor Investor Bid/Offer
Period
One Working Day prior to the Bid/ Offer Opening Date, on which Bids by Anchor Investors shall be
submitted and allocation to the Anchor Investors shall be completed
Anchor Investor Offer Price The final price at which the Equity Shares will be Allotted to the Anchor Investors in terms of the Red
Herring Prospectus and the Prospectus, which will be a price equal to or higher than the Offer Price but not
higher than the Cap Price.
The Anchor Investor Offer Price will be decided by our Company in consultation with the Book Running Lead Managers
Anchor Investor Portion Up to 60% of the QIB Portion which may be allocated by our Company in consultation with the Book
Running Lead Managers, to the Anchor Investors on a discretionary basis in accordance with the SEBI ICDR Regulations.
One-third of the Anchor Investor Portion shall be reserved for domestic Mutual Funds, subject to valid
Bids being received from domestic Mutual Funds at or above the Anchor Investor Allocation Price, in
accordance with the SEBI ICDR Regulations
Application Supported by
Blocked Amount” or “ASBA”
An application, whether physical or electronic, used by ASBA Bidders to make a Bid and authorizing an
SCSB to block the Bid Amount in the ASBA Account and will include applications made by RIBs using
the UPI Mechanism where the Bid Amount will be blocked upon acceptance of UPI Mandate Request by RIBs using the UPI Mechanism
ASBA Account A bank account maintained with an SCSB by an ASBA Bidder, as specified in the ASBA Form submitted
by ASBA Bidders for blocking the Bid Amount mentioned in the relevant ASBA Form and includes the account of an RIB which is blocked upon acceptance of a UPI Mandate Request made by the RIBs using
the UPI Mechanism
ASBA Bid A Bid made by an ASBA Bidder
ASBA Bidders All Bidders except Anchor Investors
ASBA Form An application form, whether physical or electronic, used by ASBA Bidders to submit Bids, which will be considered as the application for Allotment in terms of the Red Herring Prospectus and the Prospectus
Bankers to the Offer Collectively, Escrow Collection Bank, Public Offer Account Bank, Sponsor Bank and Refund Bank, as the
case may be
Basis of Allotment Basis on which Equity Shares will be Allotted to successful Bidders under the Offer and which is described
in “Offer Procedure”, beginning on page 338
Bid Amount The highest value of Bids indicated in the Bid cum Application Form and, in the case of RIBs Bidding at
the Cut off Price, the Cap Price multiplied by the number of Equity Shares Bid for by such RIBs and
mentioned in the Bid cum Application Form and payable by the Bidder or blocked in the ASBA Account
of the ASBA Bidder, as the case may be, upon submission of the Bid. Bid cum Application Form Anchor Investor Application Form or the ASBA Form, as the context requires
Bid Lot [●] Equity Shares and in multiples of [●] Equity Shares thereafter
Bid/Offer Closing Date Except in relation to any Bids received from the Anchor Investors, the date after which the Designated
Intermediaries will not accept any Bids, which shall be published in all editions of [●], an English national
daily newspaper, all editions of [●], a Hindi national daily newspaper and regional edition of [●], a Marathi
newspaper, Marathi being the regional language of Maharashtra, where our Registered Office is located, each with wide circulation.
Our Company in consultation with the Book Running Lead Managers may, consider closing the Bid/Offer
Period for QIBs one Working Day prior to the Bid/Offer Closing Date in accordance with the SEBI ICDR
Regulations. In case of any revision, the extended Bid/Offer Closing Date shall also be notified on the websites of the Book Running Lead Managers and at the terminals of the Syndicate Members and
communicated to the Designated Intermediaries and the Sponsor Bank, which shall also be notified in an
advertisement in the same newspapers in which the Bid/Offer Opening Date was published, as required
under the SEBI ICDR Regulations
Bid/ Offer Opening Date Except in relation to any Bids received from the Anchor Investors, the date on which the Designated
Intermediaries shall start accepting Bids, which shall be published in all editions of [●], an English national
daily newspaper, all editions of [●], a Hindi national daily newspaper and regional edition of [●], a Marathi
newspaper, Marathi being the regional language of Maharashtra, where our Registered Office is located,
each with wide circulation
Bid/ Offer Period Except in relation to Anchor Investors, the period between the Bid/ Offer Opening Date and the Bid/ Offer
Closing Date, inclusive of both days, during which prospective Bidders can submit their Bids, including
any revisions thereof
“Bid” or “Bidding” An indication to make an offer to subscribe to the Equity Shares at a price within the Price Band (i) by an
ASBA Bidder during the Bid/ Offer Period pursuant to submission of the ASBA Form, or (ii) by an Anchor
Investor during the Anchor Investor Bid/ Offer Period, pursuant to submission of the Anchor Investor
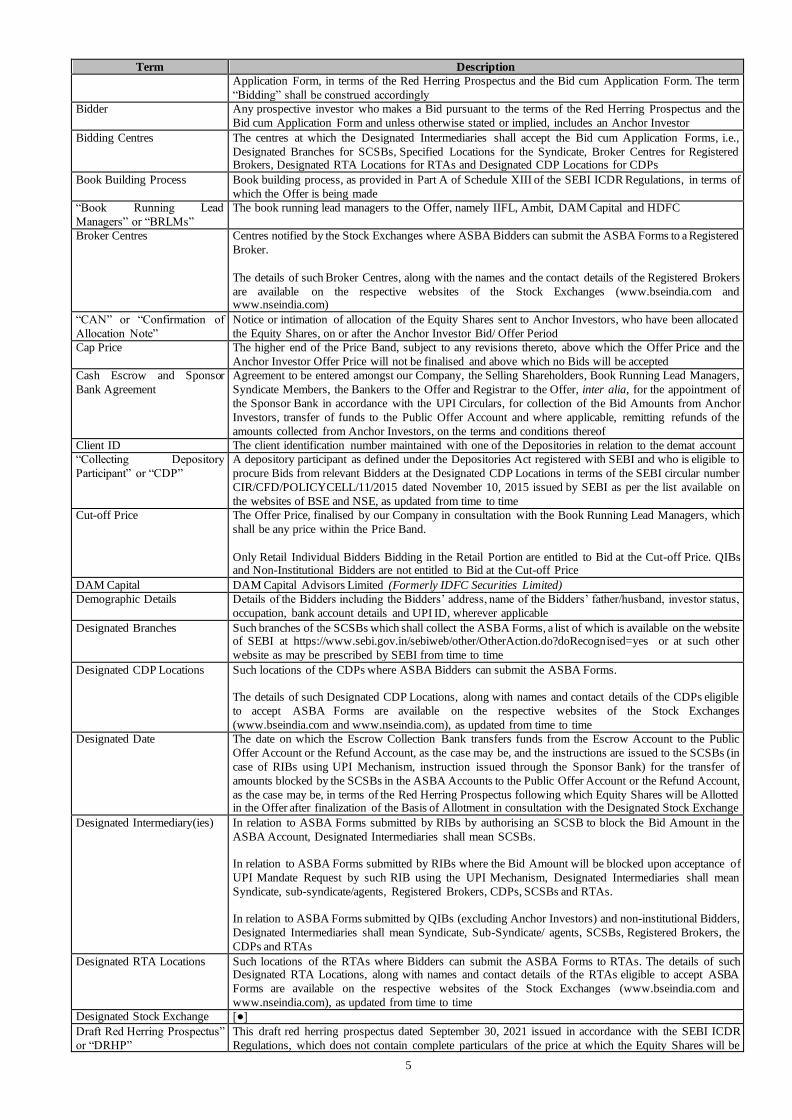
5
Term Description
Application Form, in terms of the Red Herring Prospectus and the Bid cum Application Form. The term
“Bidding” shall be construed accordingly
Bidder Any prospective investor who makes a Bid pursuant to the terms of the Red Herring Prospectus and the
Bid cum Application Form and unless otherwise stated or implied, includes an Anchor Investor
Bidding Centres The centres at which the Designated Intermediaries shall accept the Bid cum Application Forms, i.e.,
Designated Branches for SCSBs, Specified Locations for the Syndicate, Broker Centres for Registered Brokers, Designated RTA Locations for RTAs and Designated CDP Locations for CDPs
Book Building Process Book building process, as provided in Part A of Schedule XIII of the SEBI ICDR Regulations, in terms of
which the Offer is being made
“Book Running Lead
Managers” or “BRLMs”
The book running lead managers to the Offer, namely IIFL, Ambit, DAM Capital and HDFC
Broker Centres Centres notified by the Stock Exchanges where ASBA Bidders can submit the ASBA Forms to a Registered
Broker.
The details of such Broker Centres, along with the names and the contact details of the Registered Brokers
are available on the respective websites of the Stock Exchanges (www.bseindia.com and www.nseindia.com)
“CAN” or “Confirmation of
Allocation Note”
Notice or intimation of allocation of the Equity Shares sent to Anchor Investors, who have been allocated
the Equity Shares, on or after the Anchor Investor Bid/ Offer Period
Cap Price The higher end of the Price Band, subject to any revisions thereto, above which the Offer Price and the
Anchor Investor Offer Price will not be finalised and above which no Bids will be accepted
Cash Escrow and Sponsor
Bank Agreement
Agreement to be entered amongst our Company, the Selling Shareholders, Book Running Lead Managers,
Syndicate Members, the Bankers to the Offer and Registrar to the Offer, inter alia, for the appointment of
the Sponsor Bank in accordance with the UPI Circulars, for collection of the Bid Amounts from Anchor
Investors, transfer of funds to the Public Offer Account and where applicable, remitting refunds of the
amounts collected from Anchor Investors, on the terms and conditions thereof
Client ID The client identification number maintained with one of the Depositories in relation to the demat account
“Collecting Depository
Participant” or “CDP”
A depository participant as defined under the Depositories Act registered with SEBI and who is eligible to
procure Bids from relevant Bidders at the Designated CDP Locations in terms of the SEBI circular number
CIR/CFD/POLICYCELL/11/2015 dated November 10, 2015 issued by SEBI as per the list available on
the websites of BSE and NSE, as updated from time to time
Cut-off Price The Offer Price, finalised by our Company in consultation with the Book Running Lead Managers, which
shall be any price within the Price Band.
Only Retail Individual Bidders Bidding in the Retail Portion are entitled to Bid at the Cut-off Price. QIBs and Non-Institutional Bidders are not entitled to Bid at the Cut-off Price
DAM Capital DAM Capital Advisors Limited (Formerly IDFC Securities Limited)
Demographic Details Details of the Bidders including the Bidders’ address, name of the Bidders’ father/husband, investor status,
occupation, bank account details and UPI ID, wherever applicable
Designated Branches Such branches of the SCSBs which shall collect the ASBA Forms, a list of which is available on the website of SEBI at https://www.sebi.gov.in/sebiweb/other/OtherAction.do?doRecognised=yes or at such other
website as may be prescribed by SEBI from time to time
Designated CDP Locations Such locations of the CDPs where ASBA Bidders can submit the ASBA Forms.
The details of such Designated CDP Locations, along with names and contact details of the CDPs eligible
to accept ASBA Forms are available on the respective websites of the Stock Exchanges
(www.bseindia.com and www.nseindia.com), as updated from time to time
Designated Date The date on which the Escrow Collection Bank transfers funds from the Escrow Account to the Public
Offer Account or the Refund Account, as the case may be, and the instructions are issued to the SCSBs (in
case of RIBs using UPI Mechanism, instruction issued through the Sponsor Bank) for the transfer of
amounts blocked by the SCSBs in the ASBA Accounts to the Public Offer Account or the Refund Account,
as the case may be, in terms of the Red Herring Prospectus following which Equity Shares will be Allotted in the Offer after finalization of the Basis of Allotment in consultation with the Designated Stock Exchange
Designated Intermediary(ies) In relation to ASBA Forms submitted by RIBs by authorising an SCSB to block the Bid Amount in the
ASBA Account, Designated Intermediaries shall mean SCSBs.
In relation to ASBA Forms submitted by RIBs where the Bid Amount will be blocked upon acceptance of
UPI Mandate Request by such RIB using the UPI Mechanism, Designated Intermediaries shall mean
Syndicate, sub-syndicate/agents, Registered Brokers, CDPs, SCSBs and RTAs.
In relation to ASBA Forms submitted by QIBs (excluding Anchor Investors) and non-institutional Bidders,
Designated Intermediaries shall mean Syndicate, Sub-Syndicate/ agents, SCSBs, Registered Brokers, the
CDPs and RTAs
Designated RTA Locations Such locations of the RTAs where Bidders can submit the ASBA Forms to RTAs. The details of such Designated RTA Locations, along with names and contact details of the RTAs eligible to accept ASBA
Forms are available on the respective websites of the Stock Exchanges (www.bseindia.com and
www.nseindia.com), as updated from time to time
Designated Stock Exchange [●]
Draft Red Herring Prospectus”
or “DRHP”
This draft red herring prospectus dated September 30, 2021 issued in accordance with the SEBI ICDR
Regulations, which does not contain complete particulars of the price at which the Equity Shares will be

6
Term Description
Allotted and the size of the Offer, including any addenda or corrigenda thereto
Eligible FPI(s) FPI(s) that are eligible to participate in the Offer in terms of applicable law and from such jurisdictions outside India where it is not unlawful to make an offer / invitation under the Offer and in relation to whom
the Bid cum Application Form and the Red Herring Prospectus constitutes an invitation to purchase the
Equity Shares
Eligible NRI(s) NRI(s) from jurisdictions outside India where it is not unlawful to make an offer or invitation under the Offer and in relation to whom the ASBA Form and the Red Herring Prospectus will constitute an invitation
to subscribe to or to purchase the Equity Shares
Escrow Account(s) Account(s) to be opened with the Escrow Collection Bank and in whose favour the Anchor Investors will transfer money through NACH/direct credit/NEFT/RTGS in respect of the Bid Amount when submitting
a Bid
Escrow Collection Bank Bank which is a clearing member and registered with SEBI as a banker to an issue under the SEBI BTI Regulations and with whom the Escrow Accounts will be opened, in this case being [●]
First Bidder or Sole Bidder Bidder whose name shall be mentioned in the Bid cum Application Form or the Revision Form and in case
of joint Bids, whose name shall also appear as the first holder of the beneficiary account held in joint names
Floor Price The lower end of the Price Band, subject to any revision(s) thereto, not being less than the face value of
Equity Shares, at or above which the Offer Price and the Anchor Investor Offer Price will be finalised and
below which no Bids will be accepted
Fresh Issue Fresh issue of up to [●] Equity Shares aggregating up to ₹ 4,000.00 million by our Company
Fugitive Economic Offender An individual who is declared a fugitive economic offender under Section 12 of the Fugitive Economic
Offenders Act, 2018
“General Information
Document” or “GID”
The General Information Document for investing in public issues prepared and issued in accordance with
the SEBI circular no. SEBI/HO/CFD/DIL1/CIR/P/2020/37 dated March 17, 2020, suitably modified and
updated pursuant to, among others, the circular (SEBI/HO/CFD/DIL2/CIR/P/2020/50) dated March 30, 2020 issued by SEBI and the UPI Circulars, as amended from time to time. The General Information
Document shall be available on the websites of the Stock Exchanges and the Book Running Lead Managers
HDFC HDFC Bank Limited
IIFL IIFL Securities Limited
Monitoring Agency [●]
Monitoring Agency
Agreement
Agreement to be entered between our Company and the Monitoring Agency
Mutual Fund Portion 5% of the Net QIB Portion, or [●] Equity Shares which shall be available for allocation to Mutual Funds
only on a proportionate basis, subject to valid Bids being received at or above the Offer Price
Net Proceeds Proceeds of the Fresh Issue less our Company’s share of the Offer expenses. For further details regarding the use of the Net Proceeds and the Offer expenses, see “Objects of the Offer” beginning on page 91
Net QIB Portion QIB Portion less the number of Equity Shares Allotted to the Anchor Investors
Non-Institutional Bidders All Bidders that are not QIBs or Retail Individual Bidders and who have Bid for Equity Shares for an
amount of more than ₹200,000 (but not including NRIs other than Eligible NRIs)
Non-Institutional Portion The portion of the Offer being not more than 15% of the Offer consisting of [●] Equity Shares which shall be available for allocation on a proportionate basis to Non-Institutional Bidders, subject to valid Bids being
received at or above the Offer Price
Non-Resident Person resident outside India, as defined under FEMA
Offer The initial public offer of [●] Equity Shares comprising of the Fresh Issue and the Offer for Sale
aggregating up to ₹ [●].
Offer Agreement Agreement dated September 30, 2021 entered amongst our Company, the Selling Shareholders and the
Book Running Lead Managers, pursuant to which certain arrangements have been agreed to in relation to
the Offer
Offer for Sale The offer for sale of the Offered Shares, at the Offer Price aggregating up to ₹ [●] offered for sale by the
Selling Shareholders in the Offer
Offer Price The final price at which Equity Shares will be Allotted to ASBA Bidders in terms of the Red Herring
Prospectus and the Prospectus. Equity Shares will be Allotted to Anchor Investors at the Anchor Investor Offer Price, which will be decided by our Company, in consultation with the Book Running Lead
Managers, in terms of the Red Herring Prospectus and the Prospectus.
The Offer Price will be decided by our Company in consultation with the Book Running Lead Managers,
on the Pricing Date in accordance with the Book Building Process and the Red Herring Prospectus
Offer Proceeds Collectively, the proceeds of the Fresh Issue which shall be available to our Company and the proceeds
of the Offer for Sale which shall be available to the Selling Shareholder. For further information about
use of the Offer Proceeds, see “Objects of the Offer” beginning on page 91
Offered Shares Up to 16,044,709 Equity Shares aggregating up to ₹ [●] million being offered for sale by the Selling
Shareholders in the Offer for Sale
Price Band The price band of a minimum price of ₹ [●] per Equity Share (Floor Price) and the maximum price of ₹[●]
per Equity Share (Cap Price) including any revisions thereof.
The Price Band and the minimum Bid Lot size for the Offer will be decided by our Company in consultation
with the Book Running Lead Managers, and will be advertised, at least two Working Days prior to the Bid/Offer Opening Date, in all editions of [●], an English national daily newspaper, all editions of [●], a
Hindi national daily newspaper and regional edition of [●], a Marathi newspaper, Marathi being the
regional language of Maharashtra, where our Registered Office is located, each with wide circulation and
shall be made available to the Stock Exchanges for the purpose of uploading on their respective websites

7
Term Description
Pricing Date The date on which our Company, in consultation with the Book Running Lead Managers, will finalise the
Offer Price
Prospectus The prospectus to be filed with the RoC on or after the Pricing Date in accordance with Section 26 of the
Companies Act, 2013 and the SEBI ICDR Regulations containing, inter alia, the Offer Price that is
determined at the end of the Book Building Process, the size of the Offer and certain other information,
including any addenda or corrigenda thereto
Public Offer Account Bank account to be opened with the Public Offer Bank, under Section 40(3) of the Companies Act, 2013
to receive monies from the Escrow Account and ASBA Accounts on the Designated Date
Public Offer Bank Bank which is a clearing member and registered with SEBI as a banker to an issue and with which the Public Offer Account will be opened, in this case being [●]
QIB Portion The portion of the Offer (including the Anchor Investor Portion) being not less than 75% of the Offer
comprising [●] Equity Shares which shall be allocated to QIBs (including Anchor Investors), subject to valid Bids being received at or above the Offer Price or Anchor Investor Offer Price (for Anchor Investors).
Our Company, in consultation with the Book Running Lead Managers may allocate up to 60% of the QIB
portion to Anchor Investors on a discretionary basis
Qualified Institutional Buyers
or QIBs or QIB Bidders
Qualified institutional buyers as defined under Regulation 2(1)(ss) of the SEBI ICDR Regulations
Red Herring Prospectus or RHP
The red herring prospectus to be issued by our Company in accordance with Section 32 of the Companies Act, 2013 and the provisions of the SEBI ICDR Regulations, which will not have complete particulars of
the Offer Price and the size of the Offer, including any addenda or corrigenda thereto. The Red Herring
Prospectus will be filed with the RoC at least three Working Days before the Bid/Offer Opening Date and
will become the Prospectus upon filing with the RoC after the Pricing Date
Refund Account(s) Account to be opened with the Refund Bank(s), from which refunds, if any, of the whole or part of the Bid
Amount to the Bidders shall be made
Refund Bank(s) Bank(s) which is a clearing member and registered with SEBI as a banker to an issue under the SEBI BTI Regulations and with whom the Refund Account will be opened, in this case being [●]
Registered Brokers Stock brokers registered with SEBI and the stock exchanges having nationwide terminals, other than the
members of the Syndicate and eligible to procure Bids in terms of the SEBI circular number CIR/CFD/14/2012 dated October 4, 2012 issued by SEBI
Registrar Agreement Agreement dated September 30, 2021 entered by and amongst our Company , the Selling Shareholders and
the Registrar to the Offer, in relation to the responsibilities and obligations of the Registrar to the Offer pertaining to the Offer
“Registrar and Share Transfer
Agents” or “RTAs”
Registrar and share transfer agents registered with SEBI and eligible to procure Bids from relevant Bidders
at the Designated RTA Locations as per the list available on the websites of BSE and NSE, and the UPI Circulars
“Registrar to the Offer” or
“Registrar”
Link Intime India Private Limited
“Retail Individual Bidder(s)”
or “RIB(s)”
Individual Bidders, who have Bid for the Equity Shares for an amount not more than ₹200,000 in any of
the bidding options in the Offer (including HUFs applying through their Karta and Eligible NRIs)
Retail Portion Portion of the Offer being not more than 10% of the Offer consisting of [●] Equity Shares which shall be
available for allocation to Retail Individual Bidders (subject to valid Bids being received at or above the
Offer Price), which shall not be less than the minimum Bid Lot subject to availability in the Retail Portion,
and the remaining Equity Shares to be Allotted on a proportionate basis
Revision Form Form used by the Bidders to modify the quantity of the Equity Shares or the Bid Amount in any of their
ASBA Form(s) or any previous Revision Form(s), as applicable.
QIB Bidders and Non-Institutional Bidders are not allowed to withdraw or lower their Bids (in terms of
quantity of Equity Shares or the Bid Amount) at any stage. Retail Individual Bidders can revise their Bids during the Bid/ Offer Period and withdraw their Bids until Bid/ Offer Closing Date
Self-Certified Syndicate
Bank(s) or SCSB(s)
The banks registered with SEBI, which offer the facility of ASBA services, (i) in relation to ASBA, where
the Bid Amount will be blocked by authorising an SCSB, a list of which is available on the website of SEBI at www.sebi.gov.in/sebiweb/other/OtherAction.do?doRecognisedFpi=yes&intmId=34 and updated
from time to time and at such other websites as may be prescribed by SEBI from time to time, (ii) in relation
to RIBs using the UPI Mechanism, a list of which is available on the website of SEBI at
https://sebi.gov.in/sebiweb/other/OtherAction.do?doRecognisedFpi=yes&intmId=40 or such other
website as may be prescribed by SEBI and updated from time to time.
Applications through UPI in the Offer can be made only through the SCSBs mobile applications (apps)
whose name appears on the SEBI website at
www.sebi.gov.in/sebiweb/other/OtherAction.do?doRecognisedFpi=yes&intmId=43. Details of nodal
officers of SCSBs, identified for Bids made through the UPI Mechanism, are available at www.sebi.gov.in.
Share Escrow Agent The share escrow agent to be appointed pursuant to the Share Escrow Agreement namely, [●]
Share Escrow Agreement Share escrow agreement to be entered into between our Company, the Selling Shareholders and the Share Escrow Agent in connection with the transfer of Equity Shares under the Offer for Sale by the Selling
Shareholders for the purposes of credit of such Equity Shares to the demat accounts of the Allottees in
accordance with the Basis of Allotment
Specified Locations Bidding Centres where the Syndicate shall accept ASBA Forms from Bidders
Sponsor Bank [●], being a Banker to the Offer, appointed by our Company to act as a conduit between the Stock
Exchanges and NPCI in order to push the mandate collect requests and / or payment instructions of the

8
Term Description
RIBs using the UPI Mechanism and carry out other responsibilities, in terms of the UPI Circulars
Stock Exchanges Collectively, BSE Limited and National Stock Exchange of India Limited
“Syndicate” or “Members of
the Syndicate”
Collectively, the Book Running Lead Managers and the Syndicate Members
Syndicate Agreement Agreement to be entered amongst our Company, the Selling Shareholders, the Book Running Lead
Managers, the Registrar and the Syndicate Members, in relation to collection of Bids by the Syndicate
Syndicate Members Intermediaries (other than the Book Running Lead Managers) registered with SEBI who are permitted to carry out activities including accepting bids, applications and as an underwriter, namely, [●]
Systemically Important Non-
Banking Financial Company
Systemically important non-banking financial company as defined under Regulation 2(1)(iii) of the SEBI
ICDR Regulations
Technopak Technopak Advisors Private Limited
Technopak Report Report titled “Industry Report on Pharmacy Retail in India” dated September 28, 2021, issued by Technopak and which has been commissioned and paid for by our Company
Underwriters [●]
Underwriting Agreement Agreement to be entered amongst our Company, the Selling Shareholders and the Underwriters to be
entered into on or after the Pricing Date but prior to filing of the Prospectus with the RoC
UPI Unified payments interface which is an instant payment mechanism, developed by NPCI
UPI Circulars SEBI circular no. SEBI/HO/CFD/DIL2/CIR/P/2018/138 dated November 1, 2018, SEBI circular no.
SEBI/HO/CFD/DIL2/CIR/P/2019/50 dated April 3, 2019, SEBI circular no.
SEBI/HO/CFD/DIL2/CIR/P/2019/76 dated June 28, 2019, SEBI circular no.
SEBI/HO/CFD/DIL2/CIR/P/2019/85 dated July 26, 2019 SEBI circular no. SEBI/HO/CFD/DCR2/CIR/P/2019/133 dated November 8, 2019, SEBI circular no.
SEBI/HO/CFD/DIL2/CIR/P/2020/50 dated March 30, 2020, SEBI circular no.
SEBI/HO/CFD/DIL2/CIR/P/2021/2480/1/M dated March 16, 2021, SEBI circular no.
SEBI/HO/CFD/DIL1/CIR/P/2021/47 dated March 31, 2021, SEBI circular no.
SEBI/HO/CFD/DIL2/P/CIR/2021/570 dated June 2, 2021 and any subsequent circulars or notifications issued by SEBI in this regard
UPI ID ID created on the UPI for single-window mobile payment system developed by the NPCI
UPI Mandate Request A request (intimating the RIB by way of a notification on the UPI linked mobile application as disclosed
by SCSBs on the website of SEBI and by way of an SMS on directing the RIB to such UPI linked mobile
application) to the RIB initiated by the Sponsor Bank to authorise blocking of funds on the UPI application
equivalent to Bid Amount and subsequent debit of funds in case of Allotment
UPI Mechanism The bidding mechanism that may be used by an RIB in accordance with the UPI Circulars to make an
ASBA Bid in the Offer
UPI PIN Password to authenticate UPI transaction
Wilful Defaulter A company or person, as the case may be, categorised as a wilful defaulter by any bank or financial
institution or consortium thereof, in accordance with the guidelines on wilful defaulters issued by the RBI
Working Day(s) All days on which commercial banks in Mumbai are open for business provided however, with reference
to (a) announcement of Price Band and (b) Bid/Offer Period, the term Working Day shall mean all days,
excluding Saturdays, Sundays and public holidays, on which commercial banks in Mumbai are open for business and (c) the time period between the Bid/Offer Closing Date and the listing of the Equity Shares
on the Stock Exchanges, “Working Day” shall mean all trading days of the Stock Exchanges, excluding
Sundays and bank holidays, as per circulars issued by SEBI
Technical/Industry Related Terms or Abbreviations
Term Description
“Average order value” or “AOV”
Average cost of an order per bill at our stores
“Average Operating EBITDA” Average Operating EBITDA per store computed as Operating EBITDA for the financial year divided by
average store count for the financial year (Average store count for the year = Store count at the beginning
of the year + Store count at the end of year)/2)
“Average store level
profitability”
Total income less purchases of stock-in-trade, changes of stock-in-trade, employee benefit expense and
other expenses (including rent) store during a given year for all stores operating divided by the average
number of stores in operation.
“B&M stores” Brick and mortar stores
“CAGR” Compounded Annual Growth Rate (as a %)
“C&F” Carry-forward
“Cluster Saturation Model” Cluster Saturation model focuses on maximising the store count in a particular area before expanding in
other geography.
For more details, see “Industry Overview” on page 105.
“CNS” Central nervous system
“COGS” Cost of goods sold
“CPOE” Computerised physician order entry
“CRM” Customer relationship management
“Drugs and Cosmetics Act” or
“DCA”
Drugs and Cosmetics Act, 1940
“Drugs and Cosmetics Rules” Drugs and Cosmetics Rules, 1945

9
Term Description
“EBITDA” or “Operating
EBITDA”
Aggregate of restated profit/(loss) after tax, tax expense, finance cost, depreciation and amortisation
“EBITDA margin” EBITDA divided by total income
“eBR” Electronic batch records
“E-Commerce Marketplace” The E-Commerce marketplace are tech driven platforms with a wide variety of product offering including
of products like electronics, fashion, furniture, home furnishings, and cosmetics.
For more details, see “Industry Overview” on page 105.
“ERP” Enterprise resource planning
“FDI” Foreign Direct Investment
“F&G” Food and Grocery
“FMCG” Fast-moving consumer goods
“FMHG” Fast-moving health goods
“FSSAI” Food Safety and Standards Authority of India
“GPO” Group purchase organisation
“GST” Goods & Services Tax
“Hyperlocal Model” Hyperlocal Model is an inventory light model where the e-pharmacy only provides the online infrastructure
and logistics support.
For more details, see “Industry Overview” on page 105.
“Inventory-led Model” In an inventory-led model the inventory of goods and services is owned by the retail company, which are
sold to the customers directly.
For more details, see “Industry Overview” on page 105.
“KSM” Key starting materials
“THE” Total health expenditure
“MRP” Maximum retail price
“NCD” Non-communicable disease
“NLEM” National list of essential medicine
“NPPA” National Pharmaceutical Pricing Authority
“OTC” Over-the-counter
“PDS” Packaging, distribution and storage
“PG Charge” Payment Gateway cost
Pharmacy Act Pharmacy Act, 1948
“R&D” Research and development
“ROA” Return on assets calculated as net profit after tax divided by total average assets
“ROCE” Return on capital employed calculated as profit before interest and tax divided by total assets less current
liabilities
“Sales margin” Revenue from operations less purchases of stock-in-trade and changes in inventories of stock-in-trade divided by revenue from operations
“Same store sales growth” Total sales generated by existing stores over a year compared to the previous year
“Share of private and premium
label in total sales”
Total private and premium label sales divided by total store sales
“SFA” Sales force automation
“SKU” Store keeping units
“Store numbers state wise and
region wise”
Total sales per state/region divided by net income
“Store level profitability
margin”
Total income less purchases of stock-in-trade, changes of stock-in-trade, employee benefit expense and
other expenses (including rent)) during the year for all stores operating divided by the total revenue for stores operating
“Store level revenue” Store sales
“SWOT” Strength, Weakness, Opportunity, and Threats
“Vintage wise sales at stores” Total sales grouped by opening year for the store
“VMN” Vitamin, mineral and nutrient
“ZEDC” Zero Error Distribution Center
Conventional and General Terms or Abbreviations
Term Description
₹/Rs./Rupees/INR Indian Rupees
AIFs Alternative Investments Funds, as defined in, and registered under the SEBI AIF Regulations
AGM Annual general meeting
BSE BSE Limited
Category I AIF AIFs who are registered as “Category I Alternative Investment Funds” under the SEBI AIF Regulations
Category II AIF AIFs who are registered as “Category II Alternative Investment Funds” under the SEBI AIF Regulations
Category I FPIs FPIs who are registered as “Category I Foreign Portfolio Investors” under the SEBI FPI Regulations
Category III AIF AIFs who are registered as “Category III Alternative Investment Funds” under the SEBI AIF Regulations
Category II FPIs FPIs who are registered as “Category II foreign portfolio investors” under the SEBI FPI Regulations

10
Term Description
CCIL Clearing Corporation of India Limited
CDSL Central Depository Services (India) Limited
CIN Corporate Identity Number
Companies Act or Companies Act, 2013
Companies Act, 2013, along with the relevant rules made thereunder
Companies Act, 1956 Companies Act, 1956, along with the relevant rules made thereunder
Depositories NSDL and CDSL
Depositories Act Depositories Act, 1996
DIN Director Identification Number
DP or Depository Participant A depository participant as defined under the Depositories Act
Adjusted EBITDA Aggregate of restated profit/(loss) after tax, tax expense, finance cost and depreciation and amortisation
less the other income for the year/ period
DP ID Depository Participant’s Identification
DPIIT Department for Promotion of Industry and Internal Trade, Ministry of Commerce and Industry,
Government of India (formerly known as the Department of Industrial Policy and Promotion)
DP ID Depository Participant Identification
DP/ Depository Participant Depository participant as defined under the Depositories Act
EGM Extraordinary General Meeting
EMI Equated Monthly Instalment
EPS Earnings Per Share
FCNR Foreign Currency Non-Resident
FDI Foreign direct investment
FDI Policy Consolidated Foreign Direct Investment Policy notified by the DPIIT by way of circular bearing number
DPIIT file number 5(2)/2020-FDI Policy dated October 15, 2020 effective from October 15, 2020
FEMA The Foreign Exchange Management Act, 1999, read with rules and regulations thereunder
FEMA Non-debt Instruments
Rules
Foreign Exchange Management (Non-debt Instruments) Rules, 2019
FEMA Regulations The Foreign Exchange Management (Non Debt Instruments) Rules, 2019, the Foreign Exchange
Management (Mode of Payment and Reporting of Non Debt Instruments) Regulations, 2019 and the
Foreign Exchange Management (Debt Instruments) Regulations, 2019, as applicable
Financial Year/ Fiscal/Fiscal
Year/ FY
Unless stated otherwise, the period of 12 months ending March 31 of that particular year
FPI(s) Foreign portfolio investors as defined under the SEBI FPI Regulations
FSSA Food Safety and Standards Act, 2006, read with rules and regulations thereunder
FSSAI Food Safety and Standards Authority of India
FVCI(s) Foreign venture capital investors as defined and registered under the SEBI FVCI Regulations
Gazette Gazette of India
GDP Gross domestic product
GoI or Government or Central Government
Government of India
GST Goods and services tax
HUF Hindu Undivided Family
IBC The Insolvency and Bankruptcy Code, 2016
ICAI The Institute of Chartered Accountants of India
ICSI The Institute of Company Secretaries of India
HUF Hindu Undivided Family
IFRS International Financial Reporting Standards
IFSC Indian Financial System Code
IMPS Immediate Payment Service
Ind AS/ Indian Accounting
Standards
Indian Accounting Standards notified under Section 133 of the Companies Act, 2013 read with Companies
(Indian Accounting Standards) Rules, 2015, as amended and other relevant provisions of the Companies
Act, 2013 India Republic of India
Indian GAAP/ IGAAP Accounting Standards notified under Section 133 of the Companies Act, 2013, read together with Rule 7 of the Companies (Accounts) Rules, 2014 and Companies (Accounting Standards) Amendment Rules,
2016
IPO Initial public offering
IST Indian Standard Time
IT Information Technology
IT Act The Income Tax Act, 1961
KYC Know your customer
LIBOR London Interbank Offered Rate
MCA Ministry of Corporate Affairs
MSMEs Micro, Small, and Medium Enterprises
Mutual Funds Mutual funds registered under the Securities and Exchange Board of India (Mutual Funds) Regulations ,
1996
N/A Not applicable
NACH National Automated Clearing House

11
Term Description
NAV Net Asset Value
NBFC Non-banking financial company
NEFT National Electronic Funds Transfer
NPCI National Payments Corporation of India
NRI Person resident outside India, who is a citizen of India or a person of Indian origin, and shall have the
meaning ascribed to such term in the Foreign Exchange Management (Deposit) Regulations, 2016 or an
overseas citizen of India cardholder within the meaning of Section 7(A) of the Citizenship Act, 1955
NSDL National Securities Depository Limited
NSE National Stock Exchange of India Limited
OCB or Overseas Corporate
Body
A company, partnership, society or other corporate body owned directly or indirectly to the extent of at
least 60% by NRIs including overseas trusts, in which not less than 60% of beneficial interest is irrevocably
held by NRIs directly or indirectly and which was in existence on October 3, 2003 and immediately before such date had taken benefits under the general permission granted to OCBs under FEMA. OCBs are not
allowed to invest in the Offer
p.a. Per annum
P/E Price/earnings
P/E Ratio Price to Earnings ratio
PAN Permanent Account Number
PAT Profit after tax
PFA Prevention of Food Adulteration Act, 1954
RBI The Reserve Bank of India
RBI Act The Reserve Bank of India Act, 1934
Regulation S Regulation S under the U.S. Securities Act
RTGS Real Time Gross Settlement
Rule 144A Rule 144A under the U.S. Securities Act
SARFAESI Act The Securitization and Reconstruction of Financial Assets and Enforcement of Security Interest Act, 2002
SCRA Securities Contracts (Regulation) Act, 1956
SCRR Securities Contracts (Regulation) Rules, 1957
SEBI Securities and Exchange Board of India constituted under the SEBI Act
SEBI Act Securities and Exchange Board of India Act, 1992
SEBI AIF Regulations Securities and Exchange Board of India (Alternative Investment Funds) Regulations, 2012
SEBI BTI Regulations Securities and Exchange Board of India (Bankers to an Offer) Regulations, 1994
SEBI FPI Regulations Securities and Exchange Board of India (Foreign Portfolio Investors) Regulations, 2019
SEBI FVCI Regulations Securities and Exchange Board of India (Foreign Venture Capital Investors) Regulations, 2000
SEBI ICDR Regulations Securities and Exchange Board of India (Offer of Capital and Disclosure Requirements) Regulations, 2018
SEBI Listing Regulations Securities and Exchange Board of India (Listing Obligations and Disclosure Requirements) Regulations ,
2015
SEBI Merchant Bankers
Regulations
Securities and Exchange Board of India (Merchant Bankers) Regulations, 1992
SEBI SBEB Regulations Securities and Exchange Board of India (Share Based Employee Benefits and Sweat Equity) Regulations ,
2021
SEBI VCF Regulations Securities and Exchange Board of India (Venture Capital Fund) Regulations, 1996 as repealed pursuant to
the SEBI AIF Regulations
SME Small and Medium Enterprises
Stamp Act The Indian Stamp Act, 1899
State Government The government of a state in India
Stock Exchanges BSE and NSE
STT Securities transaction tax
Systemically Important NBFC Systemically important non-banking financial company as defined under Regulation 2(1)(iii) of the SEBI
ICDR Regulations
Takeover Regulations Securities and Exchange Board of India (Substantial Acquisition of Shares and Takeovers) Regulations ,
2011
TAN Tax deduction account number
U.S. GAAP Generally Accepted Accounting Principles in the United States
U.S. Securities Act United States Securities Act of 1933, as amended
U.S./USA/United States United States of America
USD or US$ United States Dollars
U.S. QIBs “qualified institutional buyers” as defined in Rule 144A under the U.S. Securities Act
VCFs Venture Capital Funds as defined in and registered with SEBI under the SEBI VCF Regulations

12
SUMMARY OF THIS DRAFT RED HERRING PROSPECTUS
The following is a general summary of the terms of the Offer and is neither exhaustive, nor purports to contain a summary of
all the disclosures in this Draft Red Herring Prospectus, or all details relevant to prospective investors . This summary should
be read in conjunction with, and is qualified in its entirety by, the more detailed information appearing elsewhere in this Draft
Red Herring Prospectus, including “Risk Factors”, “Objects of the Offer”, “Industry Overview”, “Our Business”, “Our
Promoters and Promoter Group”, “Restated Consolidated Financial Information” “Outstanding Litigation and Material
Developments”, “Offer Procedure” and “Description of Equity Shares and Terms of Articles of Association” beginning on pages
26, 91, 105, 153, 194, 204, 308, 338 and 356 respectively.
Primary business of our Company
We are India’s third largest retail pharmacy and wellness network by number of stores, with a leading position in Western Ind ia
in terms of total revenues (Source: Technopak Report). We operate a large omni-channel, hyperlocal retail network under our
“Wellness Forever” brand, serving as a one-stop solution for our customers’ wellness needs with most of our stores operating
24x7. We focus on providing our customers with a reta il experience that goes beyond purchasing medicines. We offer a wide
assortment of merchandise including fast-moving consumer goods, fast-moving health goods, nutraceuticals and medical
equipment, among other products, alongside over-the-counter and prescription medicines.
Primary Industry in which our Company operates
The Indian pharmacy retail sector has been witnessing healthy growth over the past few years due to an increasing consumer
base and rising healthcare expenditure. The modern pharmacy retail has been registering healthy growth largely because of
rising demand for OTC and prescription drugs, wellness products and private label products. Modern pharmacy retail is
estimated to grow at a CAGR of 25% in the coming 5 years growing significantly faster than other categories. Entry of new
players, investments in e-commerce and omni-channels platforms is aiding this transition. (Source: Technopak Report)
Names of our Promoters
Our Promoters are Ashraf Mohammed Biran, Gulshan Haresh Bakhtiani, and Mohan Ganpat Chavan.
Offer size
Offer of Equity Shares(1)(2) Up to [●] Equity Shares aggregating up to ₹ [●] million
of which:
(i) Fresh Issue(1) Up to [●] Equity Shares aggregating up to ₹ 4,000.00 million
(ii) Offer for Sale(2) Up to 16,044,709 Equity Shares aggregating up to ₹ [●] million
(1) The Fresh Issue has been authorised by our Board pursuant to resolution passed on July 29, 2021 and by our Shareholders pursuant to a resolution
passed on August 31, 2021. Further, our Board has taken on record the approval for the Offer for Sale by the Sellin g Shareholders pursuant to its resolution dated September 29, 2021.
(2) Each of the Selling Shareholders, severally and not jointly, have specifically confirmed that the Equity Shares being offered by such Selling Shareholder in the Offer for Sale, are eligible to be offered for sale in the Offer in accordance with the SEBI ICDR Regulations. For details on the authorisation of
the Selling Shareholders in relation to the Offered Shares, see “Other Regulatory and Statutory Disclosures” beginning on page 313.
Objects of the Offer
Our Company proposes to utilise the Net Proceeds towards funding the following objects:
Objects Amount (in ₹ million)
Funding capital expenditure for setting up of new stores 702.00
Repayment/prepayment in full or part of all or certain of our borrowings 1,000.00
Funding incremental working capital requirements of our Company 1,218.97
General corporate purposes [●]
Total [●]
For further details, see “Objects of the Offer” beginning on page 91.
Aggregate pre-Offer shareholding of Promoters and Promoter Group
The aggregate pre-Offer shareholding of our Promoters and Promoter Group as a percentage of the pre-Offer paid-up equity
share capital of our Company is set out below:
Sr. No. Name of the Shareholder Number of Equity Shares held Percentage of the pre-Offer paid
up Equity Share capital (%)
Promoters
1. Ashraf Mohammed Biran 11,226,804 22.12
2. Gulshan Haresh Bakhtiani 10,944,582 21.56
3. Mohan Ganpat Chavan 2,604,738 5.13

13
Sr. No. Name of the Shareholder Number of Equity Shares held Percentage of the pre-Offer paid
up Equity Share capital (%)
Total (A) 24,776,124 48.81
Promoter Group
1. Anita Gulshan Bakhtiani 40,548 0.08
Total (B) 40,548 0.08
Total (A)+(B) 24,816,672 48.89
For further details, see “Capital Structure” beginning on page 69.
Pre-Offer shareholding of the Selling Shareholders
The shareholding of the Selling Shareholders as on the date of this Draft Red Herring Prospectus is set forth below:
Sr. No. Selling Shareholder Number of Equity Shares Percentage of the pre-Offer
Equity Share capital (%)
1. Ashraf Mohammed Biran 11,226,804 22.12
2. Gulshan Haresh Bakhtiani 10,944,582 21.56
3. Mohan Ganpat Chavan 2,604,738 5.13
4. Persons listed in Annexure A* 24,033,144 47.35
Total 48,809,268 96.16
*For details in relation to the Other Selling Shareholders, see “Annexure A” on page 370.
Summary of Financial Information
A summary of the financial information of our Company as per the Restated Consolidated Financial Information is as follows:
(in ₹ million except per share data)
Particulars As of and for the Fiscal
March 31, 2021 March 31, 2020 March 31, 2019
Equity share capital 63.37 61.69 57.08
Net worth(1) 2,666.90 1,687.22 1,110.81
Revenue from operations 9,240.21 8,632.51 6,769.80
Loss for the year (348.47) (53.21) (13.33)
Earnings per Share (₹ / share)
- Basic (7.11) (1.16) (0.31)
- Diluted (7.11) (1.16) (0.31)
Net Asset Value per equity share(2) (₹) 54.43 36.64 26.86
Total borrowings (as per balance sheet)(3) 1,023.86 831.53 815.45
(1) Net worth means aggregate of equity share capital, instruments entirely equity in nature and other equity. (2) Net asset value per equity share represents total equity as at the end of the fiscal year, as resta ted, divided by the weighted average number of equity shares used in calculating EPS for the year.
(3) Total borrowings means aggregate of borrowings under Non-Current liabilities, Current liabilities and current maturities of long term loans from banks under other current financial liabilities.
Qualifications by the Statutory Auditors which have not been given effect to in the Restated Consolidated Financial
Information
There are no qualifications by the Statutory Auditors which have not been given effect to in the Restated Consolidated Financial
Statements.
Summary of outstanding litigations
A summary of outstanding litigation proceedings involving our Company, Directors, Promoters, Group Companies and
Subsidiaries, to the extent applicable, as on the date of this Draft Red Herring Prospectus is provided below:
Type of Proceedings Number of cases outstanding Amount involved in such proceedings to the extent
quantifiable
(₹ in million)
Litigation against our Company
Criminal proceedings Nil Not applicable
Tax matters 8 102.04
Actions by statutory or regulatory authorities 2 Not applicable
Other outstanding material litigation Nil Not applicable
Total 10 102.04
Litigation by our Company
Criminal proceedings Nil Not applicable
Tax matters Nil Not applicable
Other outstanding material litigation Nil Not applicable
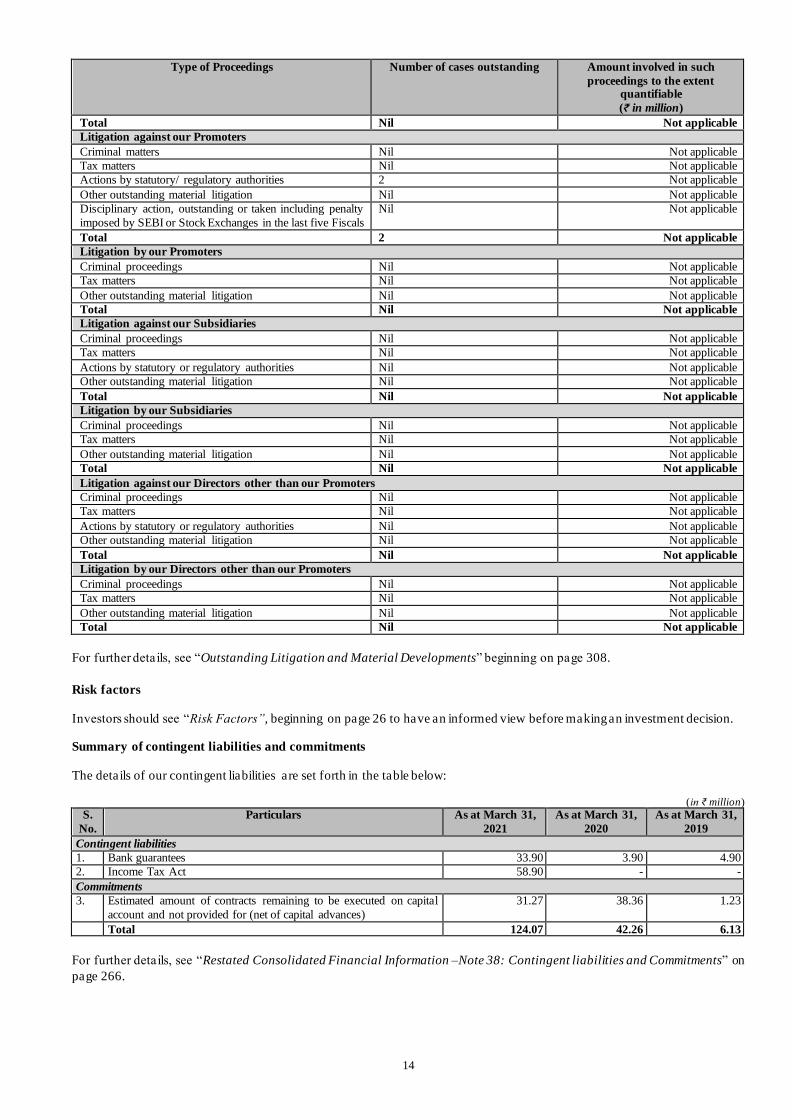
14
Type of Proceedings Number of cases outstanding Amount involved in such
proceedings to the extent quantifiable
(₹ in million)
Total Nil Not applicable
Litigation against our Promoters
Criminal matters Nil Not applicable
Tax matters Nil Not applicable
Actions by statutory/ regulatory authorities 2 Not applicable
Other outstanding material litigation Nil Not applicable
Disciplinary action, outstanding or taken including penalty
imposed by SEBI or Stock Exchanges in the last five Fiscals
Nil Not applicable
Total 2 Not applicable
Litigation by our Promoters
Criminal proceedings Nil Not applicable
Tax matters Nil Not applicable
Other outstanding material litigation Nil Not applicable
Total Nil Not applicable
Litigation against our Subsidiaries
Criminal proceedings Nil Not applicable
Tax matters Nil Not applicable
Actions by statutory or regulatory authorities Nil Not applicable
Other outstanding material litigation Nil Not applicable
Total Nil Not applicable
Litigation by our Subsidiaries
Criminal proceedings Nil Not applicable
Tax matters Nil Not applicable
Other outstanding material litigation Nil Not applicable
Total Nil Not applicable
Litigation against our Directors other than our Promoters
Criminal proceedings Nil Not applicable
Tax matters Nil Not applicable
Actions by statutory or regulatory authorities Nil Not applicable
Other outstanding material litigation Nil Not applicable
Total Nil Not applicable
Litigation by our Directors other than our Promoters
Criminal proceedings Nil Not applicable
Tax matters Nil Not applicable
Other outstanding material litigation Nil Not applicable
Total Nil Not applicable
For further details, see “Outstanding Litigation and Material Developments” beginning on page 308.
Risk factors
Investors should see “Risk Factors”, beginning on page 26 to have an informed view before making an investment decision.
Summary of contingent liabilities and commitments
The details of our contingent liabilities are set forth in the table below:
(in ₹ million)
S.
No.
Particulars As at March 31,
2021
As at March 31,
2020
As at March 31,
2019
Contingent liabilities
1. Bank guarantees 33.90 3.90 4.90
2. Income Tax Act 58.90 - -
Commitments
3. Estimated amount of contracts remaining to be executed on capital
account and not provided for (net of capital advances)
31.27 38.36 1.23
Total 124.07 42.26 6.13
For further details, see “Restated Consolidated Financial Information –Note 38: Contingent liabilities and Commitments” on
page 266.

15
Summary of related party transactions
A. Transactions with the related parties during the Financial Year
(in ₹ million) S.
No. Particulars
Year ended
March 31, 2021
Year ended
March 31, 2020
Year ended
March 31, 2019
A. Details of transactions which are eliminated during the course of consolidation
A.1 Subsidiary Company
I Amore Health Essentials Private Limited
Purchase of material 53.68 53.41 34.95 Sale of material 25.08 83.85 - Inter corporate loan 23.00 76.50 50.99 Interest on inter corporate loan 0.23 12.88 7.03
Equity shares issued on account of repayment of inter
corporate loan - 175.21 -
Lease rental expense 1.08 1.08 0.55 Sale of property, plant and equipment 13.26 - - Reimbursement received 0.08 0.68 0.60 A.2 Holding Company
Wellness Forever Medicare Private Limited
Purchase of material 25.08 83.85 - Sale of material 53.68 53.41 34.95 Inter corporate loan 23.00 76.50 50.99 Interest on inter corporate loan 0.23 12.88 7.03 Inter corporate loan converted to investments - 175.21 - Rent income on sub-leasing 1.08 1.08 0.55 Reimbursement of Expenses 0.08 0.68 0.60 Purchase of property, plant and equipment 13.26 B Key Management Personnel
I Gulshan Bakhtiani
Rental payments for premises 3.66 3.90 0.38 Reimbursement of Expenses - - 0.06 II Ashraf Biran
Rental payments for premises 27.23 19.73 10.52 Deposit payments for premises 5.01 - - Reimbursement of Expenses - - 0.07 C Relatives of Key Management Personnel
I Anita Bakhtiani
Rental payments for premises 5.06 5.40 2.85 Reimbursement of Expenses - - 0.10 II Kanchan Chavan
Rental for premises 5.63 6.00 6.00 Sale of property, plant and equipment - - 0.04 III Shaheen Biran
Rental payments for premises 1.44 1.46 1.16 Deposit payments for premises 0.27 - - IV Fouzia Biran
Commission & brokerage 1.41 1.16 0.48
D Enterprises over which Key Management Personnel is
able to exercise significant influence
I Shree Balaji Medicals
Sale of material 71.51 76.55 61.10 II The Parel Chemist
Purchase of material 22.35 37.80 29.41 Sale of material 21.66 59.43 31.09 Sale of property, plant and equipment 0.02 - - Other Operating Income - - 0.01 III IPC Healthcare Private Limited
Purchase of material 37.68 16.91 6.79 Sale of material 0.13 - - Other Operating Income - - 0.01 IV Rahul Distributors Private Limited
Purchase of material 677.52 396.30 321.35 Sale of material - - 2.92 Other Operating Income 0.06 - 0.02

16
S.
No. Particulars
Year ended
March 31, 2021
Year ended
March 31, 2020
Year ended
March 31, 2019
V Pinnacle Biomed Private Limited
Purchase of material 10.70 13.53 10.43 Rental payments for premises - - 2.50 Deposit refund - - 2.16 Reimbursement of Expenses - - 0.19 VI Shreeji Distributors Pharma Private Limited
Purchase of material 55.68 11.14 14.83 VII Rakhangi Medical Store
Sale of material - 0.00 0.00
B. Transactions with the related parties during the Financial Year
The remuneration of the key management personnel of the Group, is set out below in aggregate for each of the categories
specified in Ind AS 24: (in ₹ million)
Particulars Year ended
March 31, 2021
Year ended
March 31, 2020
Year ended
March 31, 2019
Short-term employee benefits 24.64 27.02 26.28
Share based payment 20.57 15.89 1.43
Total 45.21 42.91 27.71
For further details, see “Restated Consolidated Financial Information – Note 41: Related party disclosures” beginning on page
271.
Financing Arrangements
There have been no financing arrangements whereby our Promoters, members of our Promoter Group, our Directors and their
relatives have financed the purchase by any other person of securities of our Company other than in the normal course of
business of the relevant financing entity, during a period of six months immediately preceding the date of filing of this Draft
Red Herring Prospectus.
Weighted average price at which the Equity Shares were acquired by the Selling Shareholders including Promoters in
the one year preceding the date of this Draft Red Herring Prospectus
Except as disclosed below, the Selling Shareholders have not acquired any Equity Shares in the one year preceding the date of
this Draft Red Herring Prospectus.
The weighted average price at which the Equity Shares were acquired by our Promoters in the one year preceding the date of
this Draft Red Herring Prospectus is:
Name of the Promoter Number of Equity Shares acquired* Weighted average price of acquisition per
Equity Share (in ₹)*
Ashraf Mohammed Biran Nil 0.00
Gulshan Haresh Bakhtiani Nil 0.00
Mohan Ganpat Chavan Nil 0.00
Note: The weighted average price at which Equity Shares were acquired in the last one year has been calculated considering (a) the number of Equity Shares issued on gross basis in the last year (ignoring the number of Equity Shares sold, if any), and (b) the number of Equity Shares arising out of the Equity Shares held under (a), pursuant to (i) sub-division of equity shares with effect from July 9, 2021 and (ii) issue of bonus shares on July 24, 2021.
* As certified by Ramesh M Sheth & Associates. Chartered Accountants, by way of their certificate dated September 30, 2021.
The weighted average price at which the Equity Shares were acquired by the Other Selling Shareholders in the one year
preceding the date of this Draft Red Herring Prospectus is:
Name of the Selling Shareholder Number of Equity Shares acquired* Weighted average price of
acquisition per Equity Share (in ₹)*
ACG Associated Capsules Pvt. Ltd. 505,980 58.73
Aditya Rajendra Sah HUF 18,090 82.43
Ahmed Ali Nalwala 2,268,462 108.07
Akshay Vijay Mansukhani 390,468 68.87
Allana Exports Private Limited 301,914 54.27
Allana Investments and Trading Company Private Limited 67,086 198.67
Anmol Babani 41,202 141.00
Ayesha Vijay Mansukhani 390,468 68.87
Bhavna Dadlani 59,100 82.43
Chinar Arya Mittal 16,872 58.73

17
Name of the Selling Shareholder Number of Equity Shares acquired* Weighted average price of
acquisition per Equity Share (in ₹)*
Dilip Sawant 5,040 198.67
Frigerio Conserva Allana Private Limited - 0.00
Indur Dadlani 181,086 32.92
Jaya Dadlani 59,100 82.43
Karan Singh Thakral 297,000 38.23
Keyur Vinod Gandhi 16,410 64.21
Kunal Babani 41,196 141.00
Laxmi Investments 175,770 37.84
Manisha Pharmoplast Pvt Ltd 105,282 32.92
N Gautam Kumar 240,636 32.92
Nailesh Vinod Gandhi 32,826 64.21
Ned Ventures LLP 67,500 58.73
Nirav Vinod Gandhi 16,410 64.21
Nitin Jain 30,078 32.92
Parikshit Vaid 95,748 69.90
Patni Wealth Advisors LLP 76,194 198.67
Photophone Comel Pvt. Ltd. 94,212 42.25
Pivot Ventures LLP 16,944 58.73
Pooja Deora 7,218 82.43
Prahlad Deora 52,338 39.74
Puneet Deora 61,968 46.38
R S Estates 300,798 32.92
RAAY Global Investments Pvt. Ltd. 523,404 39.75
Rajendra Sah 211,158 32.92
Rajiv Dadlani 101,916 67.81
Riddhymic Technologies Pvt. Ltd. 39,144 62.00
Rising Sun Holdings Private Limited - 0.00
Ritika Arora 45,120 0.00
Serum Institute of India Pvt. Ltd. - 0.00
Sharan Babani 41,202 141.00
Suresh Daragshetti 59,250 32.92
Vijay Mansukhani 666,000$ 0.00
Vikas Choudhury 8,358 58.73
Vivek Rajendra Sah HUF 45,120 82.43
Note: The weighted average price at which Equity Shares were acquired in the last one year has been calculated considering (a) the number of Equity Shares issued on gross basis in the last year (ignoring the number of Equity Shares sold, if any), and (b) the number of Equity Shares arising out of the Equity Shares held under (a), pursuant to (i) sub-division of equity shares with effect from July 9, 2021 and (ii) issue of bonus shares on July 24, 2021.
* As certified by Ramesh M Sheth & Associates. Chartered Accountants, by way of their certificate dated September 30, 2021.
$ Includes 1,000 Equity Shares which were allotted to Vijay Mansukhani but erroneously credited to the demat accounts of Akshay Mansukhani and Ayesha Mansukhani. The Company has applied to NSDL, through its application dated September 29, 2021, for rectifying the error. Accordingly, 500 Equity
Shares each, which were erroneously credited to the demat accounts of Akshay Mansukhani and Ayesha Mansukhani have been excluded from their respective shareholding for the purposes of disclosure in the Draft Red Herring Prospectus.
Average cost of acquisition of Equity Shares by the Selling Shareholders including Promoters
The average cost of acquisition of Equity Shares held by our Promoters set forth in the table below:
S.
No.
Name of Promoter Number of Equity Shares held* Average cost of Acquisition
per Equity Share (in ₹)*
1. Ashraf Mohammed Biran 11,226,804 6.38
2. Gulshan Haresh Bakhtiani 10,944,582 6.72
3. Mohan Ganpat Chavan 2,604,738 7.18 Note: The average cost of acquisition has been calculated by considering the number of Equity Shares acquired on a gross basis (ignoring the number of
Equity Shares sold, if any) and then adjusting the same for the effect of (i) sub-division of the equity share with effect July 9, 2021 and (ii) issue of bonus
shares on July 24, 2021.
* As certified by Ramesh M Sheth & Associates. Chartered Accountants, by way of their certificate dated September 30, 2021.
The average cost of acquisition of Equity Shares held by the Other Selling Shareholders are set forth in the table below:
S.
No.
Name of Selling Shareholder Number of Equity Shares held* Average cost of Acquisition
per Equity Share (in ₹)*
1. ACG Associated Capsules Pvt. Ltd. 510,780 58.73
2. Aditya Rajendra Sah HUF 60,846 82.43
3. Ahmed Ali Nalwala 3,145,674 117.72
4. Akshay Vijay Mansukhani 550,392$ 67.36
5. Allana Exports Private Limited 352,518 58.18

18
S.
No.
Name of Selling Shareholder Number of Equity Shares held* Average cost of Acquisition
per Equity Share (in ₹)*
6. Allana Investments and Trading Company Private
Limited
251,682 198.67
7. Anmol Babani 77,100 125.86
8. Ayesha Vijay Mansukhani 550,392$ 67.36
9. Bhavna Dadlani 60,000 82.43
10. Chinar Arya Mittal 17,022 58.73
11. Dilip Sawant 5,040 198.67
12. Frigerio Conserva Allana Private Limited 3,335,190 299.83
13. Indur Dadlani 182,286 32.92
14. Jaya Dadlani 60,000 82.43
15. Karan Singh Thakral 300,000 36.93
16. Keyur Vinod Gandhi 20,076 67.36
17. Kunal Babani 77,100 125.87
18. Laxmi Investments 220,158 46.56
19. Manisha Pharmoplast Pvt Ltd 106,332 32.92
20. N Gautam Kumar 243,036 32.92
21. Nailesh Vinod Gandhi 40,146 67.36
22. Ned Ventures LLP 68,100 58.73
23. Nirav Vinod Gandhi 20,076 67.36
24. Nitin Jain 30,378 32.92
25. Parikshit Vaid 136,092 95.03
26. Patni Wealth Advisors LLP 151,008 198.67
27. Photophone Comel Pvt. Ltd. 94,812 42.19
28. Pivot Ventures LLP 17,394 58.73
29. Pooja Deora 15,882 82.43
30. Prahlad Deora 69,006 62.46
31. Puneet Deora 95,226 74.10
32. R S Estates 303,798 32.92
33. RAAY Global Investments Pvt. Ltd. 649,794 54.01
34. Rajendra Sah 212,658 32.92
35. Rajiv Dadlani 702,864 80.29
36. Riddhymic Technologies Pvt. Ltd. 45,918 64.86
37. Rising Sun Holdings Private Limited 3,638,460 222.86
38. Ritika Arora 45,570 0.00
39. Serum Institute of India Pvt. Ltd. 6,697,884 67.36
40. Sharan Babani 77,100 125.86
41. Suresh Daragshetti 60,000 32.92
42. Vijay Mansukhani 666,000$ 0.00
43. Vikas Choudhury 8,508 58.73
44. Vivek Rajendra Sah HUF 60,846 82.43
Note: The average cost of acquisition has been calculated by considering the number of Equity Shares acquired on a gross basis (ignoring the number of Equity Shares sold, if any) and then adjusting the same for the effect of (i) sub-division of the equity share with effect July 9, 2021 and (ii) issue of bonus
shares on July 24, 2021.
* As certified by Ramesh M Sheth & Associates. Chartered Accountants, by way of their certificate dated September 30, 2021.
$ Includes 1,000 Equity Shares which were allotted to Vijay Mansukhani but erroneously credited to the demat accounts of Akshay Mansukhani and Ayesha Mansukhani. The Company has applied to NSDL, through its application dated September 29, 2021, for rectifying the error. Accordingly, 500 Equity Shares each, which were erroneously credited to the demat accounts of Akshay Mansukhani and Ayesha Mansukhani h ave been excluded from their respective shareholding for the purposes of disclosure in the Draft Red Herring Prospectus.
For further details of split of equity shares in the last one year, see “Capital Structure – Equity share capital history of our
Company” beginning on page 69.
Details of pre-IPO Placement
Our Company does not contemplate any issuance or placement of Equity Shares from the date of this Draft Red Herring
Prospectus until the listing of the Equity Shares.
Issuance of equity shares for consideration other than cash in the last one year
Except for the allotment of Equity Shares on July 24, 2021 pursuant to bonus issue, our Company has not issued any Equity
Shares for consideration other than cash in the one year preceding the date of this Draft Red Herring Prospectus.
For details, see “Capital Structure - Equity share capital history of our Company” on page 69.

19
Split / Consolidation of Equity Shares in the last one year
Except as disclosed below, our Company has not undertaken a split or consolidation of the Equity Shares in the one year
preceding the date of this Draft Red Herring Prospectus.
Date Particulars
July 9, 2021 Pursuant to a resolution passed by our Shareholders on July 9, 2021, our Company sub-divided the face value of its equity
shares from ₹10 each to ₹ 2 each. Therefore, the cumulative number of issued, subscribed and paid-up equity shares
pursuant to sub-division was 42,296,430 Equity Shares of face value of ₹ 2 each.
20
CERTAIN CONVENTIONS, PRESENTATION OF FINANCIAL, INDUSTRY AND MARKET DATA
Certain Conventions
All references in this Draft Red Herring Prospectus to “India” are to the Republic of India and all references to the “US”, “U.S.”
“USA” or “United States” are to the United States of America.
Unless otherwise specified, any time mentioned in this Draft Red Herring Prospectus is in Indian Standard Time. Unless
indicated otherwise, all references to a year in this Draft Red Herring Prospectus are to a calendar year. Further, unless stated
otherwise, all references to page numbers in this Draft Red Herring Prospectus are to the page numbers of this Draft Red Herr ing
Prospectus.
Financial Data
Unless stated otherwise or the context otherwise requires, the financial data in this Draft Red Herring Prospectus is derived
from the restated consolidated financial information of our Company and its Subsidiary i.e. Amore Health Essentials Private
Limited comprising of the restated consolidated statement of assets and liabilities as at March 31, 2021, March 31, 2020 and
March 31, 2019, the restated consolidated statement of profit and loss (including other comprehensive income), the restated
consolidated statement of cash flows and the restated consolidated statement of changes in equity for the years ended March
31, 2021, March 31, 2020 and March 31, 2019 and the summary of significant accounting policies and explanatory notes,
prepared in terms of the requirements of Section 26 of Part I of Chapter III of the Companies Act, the SEBI ICDR Regulations
and the Guidance Note on Reports in Company Prospectuses (Revised 2019) issued by the ICAI, as amended from time to
time.. For further information on our Company’s financial information, see “Financial Information” beginning on page 204.
There are significant differences between Ind AS, Indian GAAP, US GAAP and IFRS. Our Company does not provide
reconciliation of its financial information to IFRS or US GAAP. Our Company has not attempted to explain those differences
or quantify their impact on the financial data included in this Draft Red Herring Prospectus and it is urged that you consult your
own advisors regarding such differences and their impact on our Company’s financial data. For details in connection with risks
involving differences between Ind AS, US GAAP and IFRS see “Risk Factors – Significant differences exist between Ind AS
and other accounting principles, such as Indian GAAP, IFRS and U.S. GAAP, which may be material to investors’ assessments
of our financial condition” on page 49. The degree to which the financial information included in this Draft Red Herring
Prospectus will provide meaningful information is entirely dependent on the reader’s level of familiarity with Indian accounting
policies and practices, the Companies Act and the SEBI ICDR Regulations. Any reliance by persons not familiar with Indian
accounting policies and practices on the financial disclosures presented in this Draft Red Herring Prospectus should accordingly
be limited. Our Board has approved our financial statements for the year ended March 31, 2021 pursuant to its resolution dated
September 24, 2021. Our Company, in due course, will hold its annual general meeting an d place our audited financial
statements before our Shareholders in accordance with applicable law.
Unless the context otherwise indicates, any percentage or amounts, with respect to financial information of our Company in
this Draft Red Herring Prospectus have been derived from the Restated Consolidated Financial Information.
Our Company’s Financial Year commences on April 1 and ends on March 31 of the next year. Accordingly, all references to a
particular Financial Year, unless stated otherwise, are to the 12-month period ended on March 31 of that year.
In this Draft Red Herring Prospectus, all figures in decimals have been rounded off to the second decimal and all the percentage
figures have been rounded off to two decimal places. Further, any figures sourced from third-party industry sources may be
rounded off to other than two decimal points to conform to their respective sources.
Non-GAAP Financial Measures
The body of generally accepted accounting principles is commonly referred to as “GAAP.” Our management believes that the
presentation of certain non-GAAP measures provides additional useful information to investors regarding our performance and
trends related to our results of operations. Accordingly, we believe that when non -GAAP financial information is viewed with
GAAP financial information, investors are provided with a more meaningful understanding of our ongoing operating
performance and financial results. For this reason, have included in this Draft Red Herring Prospectus certain non -GAAP
financial measures, including EBITDA, EBITDA margin, average store level profitability, store level profitability margin,,
operating EBITDA, sales margin, same store sales growth, ROA, ROCE, share of private and premium label in total sales, store
numbers state wise and region wise, vintage wise sales at stores, store level revenue and certain other statistical information
relating to our operations and financial performance.
We use non-GAAP measures from period to period on a company-wide basis to assess the operational performance of our retail
operations as well as our financial position, financial results and liquidity. In addition, such non-GAAP measures are commonly
used by securities analysts, investors and others to evaluate the financial performance of companies within our industry since
they can allow for a better comparison between our results and the results of other companies within the Indian retail sector .
However, such measures are not measures of operating performance or liquidity defin ed by generally accepted accounting

21
principles, and they are not intended to comply with the reporting requirements of the SEBI or the U.S. SEC and will not be
subject to review by the SEBI or the U.S. SEC. In addition, such non-GAAP measures are not computed on the basis of any
standard methodology that is applicable across the retail industry and therefore may not be comparable to financial measures
and statistical information of similar nomenclature that may be computed and presented by other companies in the retail sector.
Accordingly, such non-GAAP measures have important limitations as analytical tools, and you should not consider them in
isolation or as substitutes for analysis of our financial position or results of operations as reported under GAAP.
Currency and Units of Presentation
All references to:
• “Rupees” or “₹” or “INR” or “Rs.” are to Indian Rupee, the official currency of the Republic of India;
• “USD” or “US$” or “$” are to United States Dollar, the official currency of the United States of America ;
Except otherwise specified, our Company has presented certain numerical information in this Draft Red Herring Prospectus in
“million” and “billion” units. One million represents 1,000,000 and one billion represents 1,000,000,000.
Figures sourced from third-party industry sources may be expressed in denominations other than millions or may be rounded
off to other than two decimal points in the respective sources, and such figures have been expressed in this Draft Red Herrin g
Prospectus in such denominations or rounded-off to such number of decimal points as provided in such respective sources.
Exchange Rates
This Draft Red Herring Prospectus contains conversion of certain other currency amounts into Indian Rupees that have been
presented solely to comply with the SEBI ICDR Regulations. These conversions should not be construed as a representation
that these currency amounts could have been, or can be converted into Indian Rupees, at any particular rate or at all.
The exchange rates for the periods indicated are provided below.
(in ₹) Currency Exchange rate as at
June 30, 2021 March 31, 2021 March 31, 2020 March 31, 2019* 1 USD 74.35 73.50 75.39 69.17
Source: www.rbi.org.in, www.fbil.org.in. * Exchange rate as at March 29, 2019, as March 30, 2019 being a Saturday and March 31, 2019 being a Sunday.
The U.S. dollar equivalent information presented in this Draft Red Herring Prospectus is provided solely for the convenience
of the reader and should not be construed as implying that the Rupee amounts represent, could be or could have been converted
into U.S. dollars at that rate or at any rate at all.
Industry and Market Data
Unless stated otherwise, industry and market data used in this Draft Red Herring Prospectus has been ob tained or derived from
publicly available information as well as industry publication and sources. Further, the information has also been derived from
the report titled “Industry Report on Pharmacy Retail in India” dated September 28, 2021, which has been commissioned and
paid for by our Company from Technopak. For risks in relation to commissioned reports, see “Risk Factors – This Draft Red
Herring Prospectus contains information from industry reports from certain agencies commissioned by us and paid for by us,
including TechnoPak” on page 44.
Industry publications generally state that the information contained in such publications has been obtained from publicly
available documents from various sources believed to be reliable but their accuracy, completeness and underlying assumptions
are not guaranteed and their reliability cannot be assured. Although the industry and market data used in this Draft Red Herring
Prospectus is reliable, the data used in these sources may have been re-classified by us for the purposes of presentation. Data
from these sources may also not be comparable.
In accordance with the SEBI ICDR Regulations, “Basis for Offer Price”, beginning on page 100 includes information relating
to our peer group companies. Such information has been derived from publicly available sources . No investment decision
should be made solely on the basis of such information.
The extent to which the market and industry data used in this Draft Red Herring Prospectus is meaningful depends on the
reader’s familiarity with and understanding of the methodologies used in compiling such data. There are no standard data
gathering methodologies in the industry in which business of our Company is conducted, and methodologies and assumptions
may vary widely among different industry sources.
Such data involves risks, uncertainties and numerous assumptions and is subject to change based on various factors, including
those discussed in “Risk Factors”, beginning on page 26. Accordingly, investment decisions should not be based solely on such
information.

22
NOTICE TO INVESTORS
Notice to Prospective Investors in the United States
The Equity Shares have not been recommended by any U.S. federal or state securities commission or regulatory authority.
Furthermore, the foregoing authorities have not confirmed the accuracy or determined the adequacy of this Prospectus or
approved or disapproved the Equity Shares. Any representation to the contrary is a criminal offence in the United States. In
making an investment decision, investors must rely on their own examination of our Company and the terms of the Offer,
including the merits and risks involved. The Equity Shares have not been and will not be registered under the United States
Securities Act of 1933, as amended (the “U.S. Securities Act”) or any other applicable law of the United States and, unless so
registered, may not be offered or sold within the United States except pursuant to an exemption from, or in a transaction not
subject to, the registration requirements of the U.S. Securities Act and applicable state securities laws. Accordingly, the Equity
Shares are being offered and sold (a) in the United States only to persons reasonably believed to U.S. QIBs in transactions
exempt from the registration requirements of the U.S. Securities Act and (b) outside the United States in “offshore transactions”
(as defined under Regulation S) in compliance with Regulation S and the applicable laws of the jurisdictions where those offers
and sales are made. For the avoidance of doubt, the term “U.S. QIBs” does not refer to a category of institutional investors
defined under applicable Indian regulations and referred to in this Draft Red Herring Prospectus as “QIBs”.
Notice to Prospective Investors in the European Economic Area
This Draft Red Herring Prospectus has been prepared on the basis that all offers of Equity Shares in Member States of the
European Economic Area (“EEA”) (each a “Member State”) will be made pursuant to an exemption under the Prospectus
Regulation from the requirement to produce a prospectus for offers of Equity Shares. The expression “Prospectus Regulation”
means Regulation (EU) 2017/1129 of the European Parliament and Council EC (and amendments thereto). Accordingly, any
person making or intending to make an offer within the EEA of Equity Shares which are the subject of the placement
contemplated in this Draft Red Herring Prospectus should only do so in circumstances in which no obligation arises for the
Company or any of the Book Running Lead Managers to produce a prospectus for such offer. None of the Company or the
Book Running Lead Managers have authorized, nor do they authorize, the making of any offer of Equity Shares through any
financial intermediary, other than the offers made by the Book Running Lead Managers which constitute the final placement
of Equity Shares contemplated in this Draft Red Herring Prospectus.
Information to Distributors (as defined below)
Solely for the purposes of the product governance requirements contained within: (a) EU Directive 2014/65/EU on markets in
financial instruments, as amended (“MiFID II”); (b) Articles 9 and 10 of Commission Delegated Directive (EU) 2017/593
supplementing MiFID II; and (c) local implementing measures (together, the “MiFID II Product Governance
Requirements”) and/or any equivalent requirements elsewhere to the extent determined to be applicable, and discla iming all
and any liability, whether arising in tort, contract or otherwise, which any “manufacturer” (for the purposes of the MiFID II
Product Governance Requirements and/or any equivalent requirements elsewhere to the extent determined to be applicable)
may otherwise have with respect thereto, the Equity Shares the subject of the Issue have been subject to a product approval
process, which has determined that such Equity Shares are: (i) compatible with an end target market of retail investors and
investors who meet the criteria of professional clients and eligible counterparties, each as defined in MiFID II; and (ii) eligib le
for distribution through all distribution channels as are permitted by MiFID II (the “ Target Market Assessment”).
Notwithstanding the Target Market Assessment, Distributors should note that: the price of the Equity Shares may decline and
investors could lose all or part of their investment; the Equity Shares offer no guaranteed income and no capital protection; and
an investment in the Equity Shares is compatible only with investors who do not need a guaranteed income or capital protection,
who (either alone or in conjunction with an appropriate financial or other adviser) are capable of evaluating the merits and risks
of such an investment and who have sufficient resources to be able to bear any losses that may result therefrom. The Target
Market Assessment is without prejudice to the requirements of any contractual, legal or regulatory selling restrictions in re lation
to the Issue. Furthermore, it is noted that, notwithstanding the Target Market Assessment, the Book Running Lead Managers
will only procure investors who meet the criteria of professional clients and eligible counterparties. For the avoidance of d oubt,
the Target Market Assessment does not constitute: (a) an assessment of suitability or appropriateness for the purposes of MiFID
II; or (b) a recommendation to any investor or group of investors to invest in, or purchase, or take any other action whatsoe ver
with respect to the Equity Shares. Each distributor is responsible for undertaking its own target market assessment in respect of
the Equity Shares and determining appropriate distribution channels.
Notice to Prospective Investors in the United Kingdom
In the United Kingdom, this document is being distributed only to, and is directed only at, persons: (A) (i) who have professional
experience in matters relating to investments and who are investment professionals falling within the meaning of Article 19(5 )
of the Financial Services and Markets Act 2000 (Financial Promotions) Order 2005 (the “FSMA Order”), (ii) falling within
Article 49(2)(a) to (d) of the FSMA Order, and (iii) to whom it may otherwise lawfully be communicated; and (B) who are
“qualified investors” within the meaning of Article 2(e) of the Prospectus Regulation (Regulation (EU) 2017/1129) as it forms
part of retained EU law as defined in the European Union (Withdrawal) Act 2018 (all such persons together being referred to
as “relevant persons”). This document must not be acted on or relied on in the United Kingdom, by persons who are not
relevant persons. Any investment or investment activity to which the document relates is available only to, in the United

23
Kingdom, relevant persons. The communication of this Draft Red Herring Prospectus to any person who is not a relevant person
is unauthorized and may contravene the Financial Services and Markets Act 2000, as amended.
Information to Distributors (as defined below)
Solely for the purposes of the product governance requirements of Chapter 3 of the FCA Handbook Product Intervention and
Product Governance Sourcebook (the “UK Product Governance Requirements”) and/or any equivalent requirements
elswhere to the extent determined to be applicable, and disclaiming all and any liability, whether arising in tort, contract or
otherwise, which any “manufacturer” (for the purposes of the UK Product Governance Requirements and/or any equivalent
requirements elsewhere to the extent determined to be applicable) may otherwise have with respect thereto, the Equity Shares
the subject of the Offer have been subject to a product approval process, which has determined that such Equity Shares are: ( i)
compatible with an end target market of retail investors and investors who meet the criteria of professional clients and eligible
counterparties, each as defined in chapter 3 of the FCA Handbook Conduct of Business Sourcebook; and (ii) eligible for
distribution through all permitted distribution channels (the “UK Target Market Assessment”). Notwithstanding the UK
Target Market Assessment, “distributors” (for the purposes of the UK Product Governance Requirements) should note that: the
price of the Equity Shares may decline and investors could lose all or part of their investment; the Equity Shares offer no
guaranteed income and no capital protection; and an investment in the Equity Shares is compatible only with investors who do
not need a guaranteed income or capital protection, who (either alone or in conjunction with an appropriate financial or other
adviser) are capable of evaluating the merits and risks of such an investment and who have sufficient resources to be able to
bear any losses that may result therefrom. The UK Target Market Assessment is without prejudice to the requirem ents of any
contractual, legal or regulatory selling restrictions in relation to the Offer . Furthermore, it is noted that, notwithstanding the
Target Market Assessment, the Book Running Lead Managers will only procure investors who meet the criteria of professional
clients and eligible counterparties. For the avoidance of doubt, the UK Target Market Assessment does not constitute: (a) an
assessment of suitability or appropriateness for the purposes of Chapters 9A or 10A respectively of the FCA Handbook Conduct
of Business Sourcebook; or (b) a recommendation to any investor or group of investors to invest in, or purchase, or take any
other action whatsoever with respect to the Equity Shares. Each distributor is responsible for undertaking its own target market
assessment in respect of the Equity Shares and determining appropriate distribution channels.
Notice to Prospective Investors in Certain Other Jurisdictions
The distribution of this Draft Red Herring Prospectus and the issue of the Equity Shares in certain jurisdictions may be restricted
by law. As such, this Draft Red Herring Prospectus does not constitute, and may not be used for or in connection with, an offer
or solicitation by anyone in any jurisdiction in which such offer or solicitation is not aut horized or to any person to whom it is
unlawful to make such offer or solicitation. In particular, no action has been taken by the Book Running Lead Managers which
would permit an Issue of the Units or distribution of this Draft Red Herring Prospectus in any jurisdiction, other than India.
Accordingly, the Equity Shares may not be offered or sold, directly or indirectly, and neither this Draft Red Herring Prospectus
nor any Issue materials in connection with the Equity Shares may be distributed or published in or from any country or
jurisdiction that would require registration of the Equity Shares in such country or jurisdiction.

24
FORWARD-LOOKING STATEMENTS
This Draft Red Herring Prospectus contains certain “forward -looking statements”. These forward-looking statements generally
can be identified by words or phrases such as “aim”, “anticipate”, “believe”, “expect”, “estimate”, “intend”, “objective”, “p lan”,
“propose”, “project”, “will”, “will continue”, “will pursue” or other words or phrases of similar import. Similarly, statements
that describe our strategies, objectives, plans or goals are also forward-looking statements. All forward-looking statements are
subject to risks, uncertainties, expectations and assumptions about us that could cause actual results to differ materially from
those contemplated by the relevant forward-looking statement.
Actual results may differ materially from those suggested by forward-looking statements due to risks or uncertainties associated
with expectations relating to and including, regulatory changes pertaining to the industries in India in which we operate and our
ability to respond to them, our ability to successfully implement our strategy, our growth and expansion, technological changes,
our exposure to market risks, general economic and political conditions in India which have an impact on its business activities
or investments, the monetary and fiscal policies of India, inflation, deflation, unanticipated turbulence in interest rates, foreign
exchange rates, equity prices or other rates or prices, the performance of the financial markets in India and globally, changes in
domestic laws, regulations and taxes and changes in competition in the industries in which we operate.
Certain important factors that could cause actual results to differ materially from our expectations include, but are not limited
to, the following:
• The COVID-19 pandemic, or a similar public health threat, has had and could impact our business, cash flows, financial
condition and results of operations;
• our ability to successfully implement our organic growth strategy and our growth strategy through acquisitions, including
integrating the acquisitions we have made to date, the opening of new stores and the expansion of our franchise e network;
• general economic, political, social and business conditions in India, particularly in the regions where we operate or plan to
operate;
• changes in laws and regulations applicable to the retail pharmaceutical sector in India, particularly those affecting price
control or selling policies of the pharmaceutical products that we sell;
• increases in competition in the pharmaceutical retail sector in India, including as a result of consolidation of our
competitors;
• eventual liabilities arising from the acquisitions we carried out that were not identified during our due diligence;
• disputes among us and the founding partners or members of our franchisee network;
• changes in the financial conditions or preferences of our customers, as well as changes in the prices we can charge to
customers for the products that we sell;
• inflation, depreciation and/or appreciation of the real and interest rate fluctuations;
• consolidation of pharmaceutical laboratories, drugstores and pharmaceutical product distribution companies;
• our ability to consistently obtain labor, products and services from suppliers at reasonable prices; and
• our ability to maintain satisfactory commercial relationships with pharmaceutical laboratories and pharmaceutical product
distribution companies.
For details regarding factors that could cause actual results to differ from expectations, see “Risk Factors”, “Our Business” and
“Management’s Discussion and Analysis of Financial Condition and Results of Operations”, beginning on pages 26, 153 and
294, respectively. By their nature, certain market risk disclosures are only estimates and could be materially different from what
actually occurs in the future. As a result, actual gains or losses could materially differ from those that have been estimated.
There can be no assurance to Bidders that the expectations reflected in these forward -looking statements will prove to be correct.
Given these uncertainties, Bidders are cautioned not to place undue reliance on such forward -looking sta tements and not to
regard such statements to be a guarantee of our future performance.
Forward-looking statements reflect current views as on the date of this Draft Red Herring Prospectus and are not a guarantee
of future performance. These statements are based on our management’s beliefs and assumptions, which in turn are based on
currently available information. Although we believe the assumptions upon which these forward -looking statements are based
are reasonable, any of these assumptions could prove to be inaccurate, and the forward-looking statements based on these
assumptions could be incorrect. Neither our Company, the Selling Shareholders, our Promoters, our Directors, the Book
Running Lead Managers nor any of their respective affiliates have any obligation to update or otherwise revise any statements

25
reflecting circumstances arising after the date hereof or to reflect the occurrence of underlying events, even if the underly ing
assumptions do not come to fruition. In accordance with the SEBI ICDR Regulations, our Company and the Book Running
Lead Managers will ensure that the Bidders in India are informed of material developments until the time of the grant of list ing
and trading permission by the Stock Exchanges for the Offer.

26
SECTION II: RISK FACTORS
An investment in Equity Shares involves a high degree of risk. Prospective investors should carefully consider all the information
in this Draft Red Herring Prospectus, including the risks and uncertain ties described below, before making an investment in
our Equity Shares. The risks described in this section are not the only ones relevant to us or our Equity Shares but also inc ludes
the industry and segments in which we currently operate or propose to operate. Additional risks and uncertainties not presently
known to us or that we currently deem immaterial may also impair our businesses, results of operations, financial condition
and cash flows. If any of the following risks, or a combination of risks, or other risks that are not currently known or are
currently deemed immaterial, actually occur, our businesses, results of operations, financial condition and cash flows could be
adversely affected, the trading price of our Equity Shares could decline, and you may lose all or part of your investment.
Moreover, the COVID-19 pandemic could adversely affect our business and financial results and could heighten other risks
described in this section. To obtain a complete understanding of our Company, prospective i nvestors should read this section
in conjunction with “Industry Overview”, “Our Business”, and “Management’s Discussions and Analysis of Financial
Condition and Results of Operations” on pages 105, 153 and 294, respectively of this Draft Red Herring Prospectus, as well
as the financial, statistical and other information contained in this Draft Red Herring Prospectus. In making an investment
decision, prospective investors must rely on their own examination of us and the terms of the Offer including th e merits and
risks involved. You should consult your tax, financial and legal advisors about the particular consequences to you of an
investment in our Equity Shares.
Prospective investors should pay particular attention to the fact that our Company is incorporated under the laws of India and
is subject to a legal and regulatory environment, which may differ in certain respects from that of other countries. This Dra ft
Red Herring Prospectus also contains forward-looking statements that involve risks, assumptions, estimates and uncertainties.
Our actual results could differ materially from those anticipated in these forward -looking statements as a result of certain
factors, including the considerations described below and elsewhere in this Draft Red Herring Prospectus. For details, see
“Forward-Looking Statements” on page 24.
Unless the context requires otherwise, the financial information of our Company has been derived from the Restated Financial
Statements included in this Draft Red Herring Prospectus. For further information, see “Summary of Financial Information”
on page 57.
Unless otherwise indicated, industry and market data used in this section has been derived from the report titled “ Industry
Report on Pharmacy Retail in India” dated September 28, 2021 (the “Technopak Report”) prepared and issued by Technopak
Advisors Private Limited and commissioned and paid for by the Company pursuant to its engagement letter dated June 3, 2021.
Unless otherwise indicated, all financial, operational, industry and other related information derived from the Technopak
Report and included herein with respect to any particular year, refers to such information for the relevant year.
Unless specified or quantified in the relevant risk factors below, we are not in a position to quantify the financial or other
implications of any of the risks described in this section.
Internal Risk Factors
1. Our business, financial condition and results of operations may be materially and adversely affected by the effects of
the ongoing coronavirus disease 2019 (“COVID-19”) pandemic or the outbreak of other infectious diseases.
The outbreak of an infectious disease in India or elsewhere, or fear of an outbreak, together with any resulting restrictions
on travel or quarantines imposed, could have a negative impact on the economy and business activity in India and thereby
adversely impact our revenue. Examples of such outbreaks include the outbreaks of avian influenza (also known as bird
flu) in 2004 and 2005, the H1N1 influenza in 2009 and Ebola from 2014 to 2016.
More recently, in December 2019, a human infection initially reported in China was traced to a novel strain of coronavirus
(also known as COVID-19) and has since spread to over 200 countries and territories. The outbreak of COVID-19 was
declared a pandemic by the World Health Organization on March 11, 2020, and as of the dat e of this Draft Red Herring
Prospectus, it is still ongoing and rapidly evolving. Border controls, travel restrictions and quarantine measures have been
imposed by various countries in an effort to contain the spread of the COVID-19 outbreak, which have resulted in a period
of business disruption as well as restrictions on business activity and the movement of people comprising a significant
portion of the world’s population, and a decrease in economic activity in a number of countries, including India. Moreover,
there is no assurance that such measures will be effective in ending or restricting the spread of COVID-19, and many
countries have experienced further COVID-19 outbreaks even after such measures had been eased. Further, India also
experienced an intense second wave of the COVID-19 pandemic from March 2021 to May 2021 which led to various
lockdowns and restrictions in various parts of India, and there could be further disruptions and lockdowns in Fiscal 2022.
The scope, duration, and frequency of such measures and the adverse effects of COVID-19 remain uncertain and could be
severe. Individuals’ ability to travel both within and outside of India have been curtailed through mandated travel
restrictions and may be further limited. These measures have im pacted and may have a further impact on our financial

27
results, operations and business.
As our store operations were considered by the Government of India to be an essential service, we have remained
operational during India’s lockdown in accordance with the guidelines issued by the Ministry of Home Affairs and the
relevant state governments. During this period, our sale of sanitary products such as masks, disinfectant fluid and flu
medicines significantly increased due to the outbreak of COVID-19; however, revenues from our stores located within
hospitals and other healthcare providers experienced a significant decline as potential customers delayed their treatments,
and many hospitals were turned into COVID-19 wards. We also faced difficulty in ensuring inventory of certain essential
medicines during the COVID-19 pandemic during the height of the first and second waves of the COVID-19 outbreak,
which has further challenged our ability to anticipate and adjust our inventory to meet that demand . The COVID-19
pandemic has accelerated sales growth at our e-commerce business. However, these results may not be indicative of our
results for future periods. Conversely, sales at our brick-and-mortar stores were negatively affected as customers were
either unable or hesitant to visit our stores and browse freely through our aisles. Once the impact of the COVID-19
pandemic subsides, particularly as vaccines become more widely available, and customers return to work or school or are
otherwise no longer subject to the aforementioned lockdown measures and similar mandates, a failure by us to continue
capitalizing on growth opportunities may result in declining revenue and future operating results may fall below
expectations.
We have incurred, and may continue to incur, certain increased expenses arising from the COVID-19 pandemic, including
costs associated with measures undertaken for the safety of our employees and the continuity of our operations, such as
increased frequency of deep cleaning and sanitation at each of our stores, enhanced hygiene practices and allowing for
greater social distancing for our employees. In addition, because some of our employees could not or were hesitant to come
to the workplace, we were short of staff at some of our stores which slowed down our logistics operations and impacted
our customer service at our stores.
The COVID-19 pandemic and resulting government actions may also affect our business, results of operations and financial
condition, in the future, in a number of ways such as requiring a complete or partial closure of our operations, disruptions
or restrictions on our ability to conduct our business, pursue partnerships and other business opportunities, result in an
inability to source our products as a result of the temporary or permanent closure of the facilities of suppliers and lead to
non-availability of labor that could result in a slowdown in our operations.
The COVID-19 pandemic has not yet fully subsided, and it is not possible to predict its full impacts on our business. Th e
short-term and long-term impact of pandemics and other public health crises, such as the ongoing COVID-19 pandemic,
on the Indian economy and our business, financial condition, and results of operations will depend on uncertain future
developments, including the duration, spread and intensity of such outbreaks and Government responses to control their
spread, all of which are uncertain and difficult to predict. We cannot predict the evolution of the COVID-19 pandemic in
India, nor any additional restrictions that may need to be imposed in the future. Should additional government restrictions
which affect our counterparties adversely and prevent them from complying with the terms of our agreements, or should
the Government endorse an interpretation of force majeure clauses that excuses our counterparties from discharging their
obligations under our contracts, then our business may be materially and adversely affected. Additionally, although
vaccination efforts are underway in India, there can be no assurance that such vaccination efforts will be successful in
stemming the rate of new COVID-19 infections, especially in light of potential recurrence of infections and virus mutations.
Due to the continuing uncertainty around these factors, the complete impact of the COVID-19 pandemic on our business,
results of operations or financial condition cannot be reasonably estimated at this time.
Any intensification of the current COVID-19 pandemic or any recurrence of SARS, H1N1 influenza, Ebola or other
contagious disease in India or elsewhere may adversely affect our business, financial condition and results of operations.
Further, to the extent the outbreak of any infectious disease, including the current COVID-19 pandemic, adversely affects
our business and financial results, it may also have the effect of exacerbating many of the other risks described in this “ Risk
Factors” section.
2. Changes in economic conditions and consumer confidence in India may influence the wellness retail industry,
consumer preferences and spending patterns.
Our business and revenue growth primarily depend on the level of demand for premium wellness products in India. In
particular, revenue generated from the sale of non-pharmaceutical products constitute a significant percentage of our sales
revenue representing 36.78%, 37.91% and 45.72%, in Fiscals 2019, 2020 and 2021 respectively, of our revenue from
operations, which demand is more elastic than that for pharmaceutical products. As a result, our revenue and profitability
may be negatively affected by changes in national, regional or local economic conditions and consumer confidence in
India. Moreover, as we continue with the expansion of our retail footprint in metropolitan markets, where living standards
and consumer purchasing power are relatively high, our continued success is dependent on changes in economic conditions,
consumer confidence and customer preferences of the urban Indian population , which can affect discretionary consumer
spending.
External factors beyond our control that affect consumer confidence include unemployment rates, levels of personal

28
disposable income, and national, regional or local economic conditions. Changes in economic conditions and consumer
confidence could adversely affect consumer preferences, purchasing power and spending patterns. Although demand for
medicines tends to be relatively price-inelastic, a decrease in overall consumer spending as a result of changes in economic
conditions could adversely affect our sales of non-pharmaceutical products and other wellness products, thus negatively
impacting our profitability. In addition, acts of war or terrorism may cause damage to our facilities, disrupt the supply of
the products and services we offer in our stores, or adversely impact consumer demand. Any changes in the market and
economic conditions of India may also affect the consumers’ disposable income, consumer confidence and hence
discretionary consumer spending, which could have a material adverse effect on our business, financial condition and
results of operations.
3. We may not be able to timely identify or otherwise effectively respond to changing customer preferences, and we may
fail to optimize our product offerings and inventory position.
The retail industry for wellness products in India is rapidly evolving and is subject to rapidly changing customer preferences
that are difficult to predict. Our success depends on our ability to anticipate and identify customer preferences and adapt
our product selection to meet these preferences. In particular, we must optimize our product selection and inventory
positions based on sales trends.
Our business model is focused on meeting the aspirational demands of India’s middle income and upper-middle income
customers, which have shown a growing demand for higher-quality premium wellness products. However, we cannot
assure you that our product selection, especially our selection of curated health and wellness products, will accurately
reflect customer preferences at any given time. Shifts in consumer preferences to other kinds of products could materially
affect our business. For example, our business does not place significant emphasis on retailing generic medicines;
accordingly, an unexpected shift in consumer preferences toward generic medicines could adversely affect our business. If
we fail to accurately anticipate either the market for our products or customers’ purchasing habits or fail to respond to
customers’ changing preferences promptly and effectively, we may not be able to adapt our product selection to customer
preferences or make appropriate adjustments to our inventory positions, which could significantly reduce our revenue and
have a material adverse effect on our business, financial condition and results of operations.
In the past three years we have not had any material instances of overstocking or understocking. But we cannot assure you
that our product selection will accurately reflect customer preferences at any given time. If we fail to accurately anticipate
either the market for our products or purchasing habits of our customers, or fail to respond to customers’ changing
preferences promptly and effectively, we may not be able to effectively adapt our product selection to customer preferences
or make appropriate adjustments to our inventory positions, which could result in overstocking or understocking of
products, reduce customer traffic and our sales significantly and have a material adverse effect on our business, financial
condition and results of operations.
4. Our expansion strategy may not be successful, which could have an adverse effect on our business.
Our growth depends primarily on our ability to successfully open and operate new stores by identifying and negotiating
the rights to operate properties on terms we believe to be adequate. Accordingly, we constantly evaluate the market potential
and return on investment for new locations and negotiate leasing terms. As we expand our retail network, we will be
exposed to various challenges, including those relating to identification of potential markets and suitable locations for our
new stores, obtaining leases for such stores, competition, different cultures and customer preferences, regulatory regimes,
business practices and customs. For details, see “Our Business – Strategies” on page 158.
For example, our expansion capacity may be adversely affected if we are unable to find suitable store locations, or if we
are not able to renew our leases, obtain new leases or are required to change the location of our stores . For example, local
land use regulations and other regulations applicable to the kinds of stores we seek to construct may impact our ability to
find suitable locations and influence the cost of constructing our stores. Furthermore, it could materially and adversely
affect revenue and profitability levels at those stores, and overall our business, financial condition, results of operation, and
prospects. The stores that we plan to open, as well as those that are still in the process of reaching maturity, ma y not reach
the levels of sales and profitability of our existing stores. It is also possible that new stores will fail to attract suffic ient
customers or that changing local demographics at our store locations could adversely affect our profitability. We have
opened 31 stores and closed 3 stores in the fiscal year ended March 31, 2019, opened 35 stores and closed 3 stores in the
fiscal year ended March 31, 2020 and opened 50 stores and closed 4 stores in the fiscal year ended March 31, 2021. With
every new store, we expect our revenues to be above our average store revenue of approximately Rs. 40 million. However,
we can provide no assurance that a newly opened store will reach this expectation. Stores are generally closed either due
to low revenue or margins. In addition, as we open more stores, there is a risk that these new stores could compete with
our own existing stores. If the foregoing risks materialize, our financial and operational performance could be less than
expected or even below current levels.
The opening and operating of new stores will place increased demands on our operational, managerial and administrative
resources. Opening new stores will also require us to maintain increased levels of inventory at acceptable costs, meet the

29
needs of new stores and hire, train and retain skilled sales and other personnel, such as licensed pharmacists. If we are
unable to manage our growth effectively, we may be adversely affected. Furthermore, these increased demands could cause
us to operate our business less effectively, which in turn could cause deterioration in our financial performance.
5. We are subject to risks associated with expanding our business in new markets.
The risks involved in expanding operations by entering new geographic markets may be higher than expected. Since our
experience outside the Indian states of Maharashtra, Karnataka and Goa is limited, we may not be successful in operating
in new markets, it may prove more difficult for us to capitalize on our brand recognition, and we may not have the same
level of familiarity with local contractors, business practices, customs and customer, behavior and preferences as we have
in our current geographies. Therefore, we may not be able to fully leverage o ur experience in the Indian states of
Maharashtra, Karnataka and Goa as we expand our activities in new markets. In addition, when we enter into a new
geographical region, we may face intense competition from enterprises with established presence in those regions. We have
added a net total of 44 stores in tier 2 and tier 3 cities in the past three fiscal years. Particularly as we expand into tie r 2 and
tier 3 cities, we may face difficulties sourcing from local suppliers which could increase our procurement costs, and we
could also face opposition from local trade associations and other more entrenched competitors, which could increase entry
barriers in those markets. By expanding into new geographical regions, we may be exposed to significant liability and
could lose some or all of our investment in such regions, as a result of which our business, financial condition and results
of operations could be adversely affected. If we are unable to effectively manage the risks associated with our geographic
expansion strategies, we may be adversely affected.
6. We are subject to risks generally associated with our lease obligations, and we may be adversely affected if we are unable
to renew our existing leases or find suitable new store locations at acceptable prices and on favorable terms.
As of June 30, 2021, we leased all of the properties on which our stores, fulfilment center, distribution center and registered
office are located. Our lease expenses for the fiscal years 2019, 2020 and 2021, which are depreciated as right-of-use asset
represented 6.30%, 6.42% and 7.04% respectively of our total revenue from operations. We depend on cash flows from
operations to pay our lease expenses and to fulfill our other cash needs; however, if our business does not generate sufficient
cash flow from operating activities, and sufficient working capital financing is not otherwise available to us from third
party lenders or other sources, we may not be able to service our lease expenses or fund our other liquidity and capital
needs, which could require us to close or relocate certain of our retail assets and adversely affect us.
Our stores, fulfilment center and distribution center are located in strategic, carefully selected locations, which is an
important factor in implementing our business model. The properties on which our stores are located are leased either
pursuant to lease agreements or leave and license agreement, most of which are for a period of five years. Most lease
agreements are renewable at our option, while most leave and license agreements are renewable only as mutually agreed
between the parties. With respect to our leases and leave and license agreements relating to stores located within
government hospital premises, such agreements may be unilaterally terminated at will by our hospital landlords.
Considering that sales at our hospital stores generally yield a higher gross margin than sales at our other stores or online
any such unilateral termination could adversely affect us.
We face competition from other retailers in obtaining and maintaining prime commercial locations frequented by our target
customers and strategically located real estate for our logistics centers. In addition, as a result of the competition for
advantageous points-of-sale, some landlords have been demanding more favorable leasing terms while negotiating
renewals of our leases, resulting in a decrease in store profitability for stores owners. In the event we enter into leases
containing such landlord-favorable terms and/or our sales are lower tha n anticipated, our anticipated store profitability
could suffer a significant decrease and our business, financial condition and our operating results will be adversely affected.
Moreover, local land use regulations and other regulations applicable to our stores or logistics centers may impact our
ability to find suitable locations. Accordingly, we cannot assure you that we will be able to renew our existing leases or
obtain new leases on acceptable terms or at all, in which case we might be subjected to significant rent increases or required
to find alternative retail asset locations, close certain stores and logistics centers or revisit our expansion plans.
If we close a store or logistics center in a leased location, we may remain committed to perform ou r obligations under the
applicable lease, which could include, among other things, payment of the base rent for the balance of the lease term,
penalties or other material amounts. If we are not able to renew our leases, obtain new leases or are required to change the
location of our stores or logistics centers, our business, financial condition and our operating results could be adversely
affected. Further waivers and reduction in escalations of rentals which deviate from the leave and license agreements ma y
not be documented at all times, which may pose a threat of litigation for recovery of dues.
Moreover, we are required to post and maintain significant security deposits in cash with our landlords totaling
approximately Rs. 408.00 million as of March 31, 2021. We expect the amounts required for security deposits to increase
as we undertake our expansion plans, complete store openings and expand our business. We do not generally receive
interest on the security deposits made to landlords, and such deposits are subject to the risk of loss as a result of the
creditworthiness or bankruptcy of the party who holds our funds, forfeiture of such security deposit in the event of
prematurely ending our lease deeds or leave and license agreements, as well as the risk from any illegal acts associated
30
with the third party. If these circumstances were to arise, we could find it difficult or impossible to recover all or a portion
of such amounts.
7. If we do not successfully develop and maintain a relevant omnichannel, hyperlocal retail experience for our customers,
our results of operations could be adversely impacted.
Omnichannel retailing is rapidly evolving, and we must keep pace with changing customer expectations and new
developments by our competitors. In India, retail customers have been increasingly using mobile phones, tablets,
computers, and other devices to shop and to interact with us through social media, particularly in the wake of the COVID-
19 pandemic. To compete effectively, we will need to successfully integrate our offline and online shopping experience to
provide a seamless omni-channel, hyperlocal environment for our customers where they are able to shop seamlessly and
conveniently across our various retail platforms. If we fail to adapt and accelerate the development of our digital offerings,
that may adversely impact our ability to compete in our target markets.
We continue to make investments in our technology infrastructure, particularly our website and mobile application, with a
focus on improving our omni-channel distribution strategies. However, we have limited experience and operating history
in the e-commerce business, and we cannot assure you that such efforts will be successful or will enable us to compete
effectively against our competitors, including internet retailers who may have significantly more e -commerce experience
and better technological platforms than we do. In addition, we have incurred, and expect to continue to incur, significant
capital expenses in connection with these investments in our technology infrastructure and omni -channel distribution
strategies, and any failure in managing expenditures and integrating our offline and online shopping could materially and
adversely affect our prospects of competing effectively and recouping the costs of our investments.
8. We have incurred losses in Fiscals 2019, 2020 and 2021. In the event our net loss continues to increase, it may adversely
affect our business and financial condition.
We reported losses of ₹ 13.33 million, ₹ 53.21 million and ₹ 348.47 million in Fiscals 2019, 2020 and 2021, respectively,
that represented negative 0.20%, negative 0.62% and negative 3.77% of our revenue from operations in such periods,
respectively. Our losses in Fiscals 2019 and 2020 were primarily a result of IndAS restatement and our losses in Fiscal
2021 was due to IndAS adjustment, slowdown in our store sales and reduction of our sales margins (which we define as
revenue from operations less purchases of stock-in-trade and changes in inventories of stock-in-trade in percentage terms
divided by revenue from operations) by 1.27%. However, EBITDA (calculated as aggregate of restated profit/(loss) after
tax, tax expense, finance cost, depreciation and amortisation) has been positive for all three fiscal years 2019, 2020 and
2021 at Rs. 734.14 million, Rs 909.43 million and Rs 814.92 million which represented 10.78%, 10.49% and 8.66% of
total income. These sustained losses have resulted in erosion of a portion of Company’s net worth, as of March 31, 2019,
2020, and 2021. For further information on our financial performance, see “Restated Consolidated Financial Information”
and “Management’s Discussion and Analysis on the Financial Condition and Results of Operations” on pages 204 and 294,
respectively.
Further, our operating costs and other expenses may be greater than we anticipate, and our investments to make our business
and our operations more efficient may not be successful. Increases in our costs, expenses and investments may reduce our
margins and materially adversely affect our business, financial condition and results of operations. Our failure to generate
profits may adversely affect the market price of our Equity Shares, restrict our ability to pay dividends and impair our
ability to raise capital and expand our business.
9. Our profit margins are sensitive to our product mix, retail channel and conditions that affect the cost of the products
we sell.
Our results of operation may be affected by adverse shifts in our product mix or retail channel, as well as increases in the
cost of products we purchase to sell. Sales of certain of our merchandise have higher margins than others. For instance,
sales of premium wellness products and private-label products generally yield a higher gross margin than sales of
pharmaceuticals. In addition, sales made at certain retail channels have higher margins than others. For instance, sales at
our hospital stores generally yield a higher gross margin than sales at our other stores or online. If our product mix shifts
too far into lower margin products or retail channels, and we are not able to sufficiently reduce the costs associated with
those lower margins or substantially increase the proportion of higher margin sales, our profitability could be reduced.
Similarly, the loss of one of our hospital stores could disproportionately erode our profitability and overall margins.
In addition, if the margins we are able to obtain from our suppliers and distributors for the merchandise we sell decrease,
our operating profit and results of operations could suffer. The margins we are able to negotiate for the merchandise we
sell can be influenced by general economic conditions, including periods of price deflation or inflation. In addition, our
profitability could be adversely affected by other factors, including inventory control, competitive price pressures, buying
margin negotiations with our suppliers, severe weather conditions and unexpected increases in fuel or other transportation-
related costs, particularly as we expand into the interior of the country, that increa se the cost of the products we sell in our
stores.
31
10. Failure to maintain optimal inventory levels could increase our inventory holding costs or cause us to lose sales, either
of which could have a material adverse effect on our business, financial condition and results of operations.
We need to maintain sufficient inventory levels to operate our retail business successfully as well as meet customer
expectations. However, we must also guard against the risk of accumulating excess inventory which increases our inventory
costs. We are exposed to inventory risks as a result of rapid changes in product life cycles, changing consumer preferences,
uncertainty of the success of product launches and manufacturer backorders and other vendor-related problems. For
example, our stores sell products with specific temperature condition requirements and with expiration dates. We rely on
various suppliers and vendors to provide and deliver our product inventory on a continuous basis. We could suffer
significant product inventory losses due to expiration in the event of the loss of a major supplier or vendor, disruption of
our distribution network, extended power outages, natural disasters or other catastrophic occurrences.
We cannot assure you that we will be able to accurately predict these trends and events and avoid over-stocking or under-
stocking products. Although we have implemented certain systems to ensure our procurement process is in line with
demand, we cannot assure you that our ordering systems will always work efficiently, in particular in connection with the
opening of new stores, which have no, or a limited, ordering history. In addition, we have experienced fluctuating customer
demand for certain products as the COVID-19 pandemic has progressed and customer behavior has changed, which has
further challenged our ability to anticipate and/or adjust our product mix to meet that demand.
In addition, demand for products could change significantly between the time product inventory is ordered and the time it
is available for sale. If we were to over-order, we could suffer inventory losses, which could have a material adverse effect
on us. For example, the maintenance of medicines and food inventory exposes us to the risk of product wastage as such
products tend to be perishable. In the event such products cannot be sold, these products would have to be disposed of,
which could result in losses.
When we begin selling a new product, it is particularly difficult to accurately forecast product demand. The purchase of
certain types of inventory may require significant lead-time. As we carry a broad selection of products and maintain
significant inventory levels for a substantial portion of our merchandise, we may be unable to sell such inventory in
sufficient quantities or during the relevant selling seasons. Carrying excess inventory could increase our inventory holding
costs, and failure to have inventory in stock when a customer orders or purchases it could cause us to lose that order or that
customer, either of which could have a material adverse effect on our business, financial condition and results of operations.
11. Any disruption in, or failure to optimize management of, the operations of our distribution and fulfillment centers may
adversely affect us.
A substantial part of the products we sell in our stores are routed through our distribution center and fulfilment center. If
any of our distribution center or fulfilment center were to experience any substantial damage, including damage caused by
natural disasters, environmental damage, fire or flood, or if our distribution or fulfillment activities were reduced or
interrupted as a consequence of labor disruption or strikes, we could incur significantly higher costs and longer lead times
associated with distributing our products to our stores during the time it takes for us to reopen or replace our distribution
center or fulfillment center. Any such disruption in the operation of our distribution and fulfillment activities could result
in higher costs or longer lead times associated with distributing our products.
Since it is difficult to predict accurate sales volume in our industry, we may be unable to optimize our distribution and
fulfillment activities, which may result in excess or insufficient inventory, warehousing, fulfillment or distribution or
fulfillment capacity. Furthermore, failure to effectively control product damage during the distribution or fulfillment
processes could decrease our operating margins and reduce our profitability. Should we fail to locat e adequate properties
for new distribution centers or fulfillment centers, or fail to effectively integrate new, or expand existing, distribution
centers or fulfillment centers, we may not be able to deliver inventory to our stores in a timely manner, whic h may
materially and adversely affect us. Additionally, our growth strategy contemplates the opening of new stores, which may
require an increase in the capacity of our distribution center and fulfillment centers. If we are unable to optimize
management of our procurement and distribution or fulfillment activities, we may be unable to meet customer demand
while increasing the burden on managing our distribution and fulfillment channels, which could adversely affect us.
12. Changes in prescription drug pricing and commercial terms could adversely affect our operations and financial
performance – specifically in relation to products under the regulation of the Drugs (Prices Control) Order 2013.
The manufacturing and sale of branded pharmaceutical products is highly regulated by various laws and regulations. Any
changes to such legislation could have a material adverse impact on our business, sales and profitability. In addition, we
may incur significant costs in the course of complying with any changes in the regulatory regime affecting prescription
drugs, which may adversely affect our business, financial condition and results of operation.
Sales of prescription drugs, medical devices and drug prices may be affected by changes to the health care industry,
including legislative or other changes that impact patient eligibility, drug product eligibility, the allowable cost of a

32
prescription drug product, the mark-up or channel margin permitted on a given prescription drug product, the amount of
professional or dispensing fees paid by third-party payers or the provision or receipt of manufacturer allowances by
pharmacy and pharmacy suppliers. Moreover, the price at which we sell certain of our pharmaceutical products are
determined by the Drugs (Prices Control) Order, 2013 (“DPCO”), promulgated by the Government of India and
administered by the National Pharmaceutical Pricing Authority (“NPPA”). If a pharmaceutical product falls within the
DPCO, the product’s price could be significantly lower than what its marke t price would be without such price regulation.
Any changes to these prices stipulated by the DPCO, NPPA or other similar authorities, or the inclusion of other of our
pharmaceutical products not currently within the DPCO could adversely impact our sales a nd adversely impact our
business, sales, margins and operations.
13. Our business could be affected by disruptions to our supply chains or the loss of key supplier relationships.
The products we sell are sourced from a wide variety of vendors, substantially a ll of which is sourced domestically, and
our business depends on a reliable supply chain, distribution center and transportation links. Any future disruption in our
supply chain or inability to find qualified vendors and access products that meet requisite quality and safety standards in a
timely and efficient manner could adversely impact our businesses.
The loss or disruption of such supply arrangements for any reason, including for issues such as COVID-19 or other health
epidemics or pandemics, labor disputes, loss or impairment of key manufacturing sites, inability to procure sufficient raw
materials, quality control issues, ethical sourcing issues, a supplier’s financial distress, natural disasters, looting, vand alism
or acts of war or terrorism, trade sanctions, currency exchange rates, transport availability and cost, inflation and other
factors relating to our suppliers and the countries where they are located or other external factors over which we have no
control. In particular, the COVID-19 pandemic has caused disruptions and delays on certain domestic and international
supply chains, which have affected and could continue to negatively affect the flow or availability of certain products. We
may have limited advance warning of such potential supply disruptions, which could impair our ability to purchase
merchandise from alternative sources, or alternative sources might not be available. If any of these or other factors were to
result in supply disruptions or delays, our inventory levels may be reduced or the cost of our products may increase unless
and until alternative supply arrangements can be made. They could also result in our customers seeking and obtaining the
products in question from our competitors.
In addition, competition for relationships with new and existing suppliers is very intense and there can be no assurance we
will be able to grow or maintain these supplier relationships on the same terms as currently, or at all Our largest supplier
is one of our related parties and accounted for approximately Rs. 682.82 million, which constituted 9.86% of our total
purchases for the fiscal year ended March 31, 2021. Our top-ten suppliers collectively accounted for Rs. 2,234.29 million,
which constituted approximately 32.26% of our total purchases for the fiscal year ended March 31, 2021.
Moreover, we usually do not maintain long-term supply agreements with our suppliers; therefore, such suppliers may
discontinue selling to us at any time. In a few instances where we may have long term supply agreements in place with
certain suppliers, including in relation to third-party manufacturing arrangements we have in place for our private-label
products, such arrangements may not be renewed, or may be renewed on terms which are less favorable to us, or such
suppliers may renege on such arrangements, either in response to increased competition for such supplier relationships,
changes in market dynamics or for other reasons.
Our future success depends on our ability to select and purchase quality merchandise at attractive prices not only from
within India but also internationally. In particular, our private-label brands have developed a niche in introducing high-
quality global brands into the Indian market, so it is especially dependent on our international sourcing strategies. However,
our ability to find qualified vendors outside India and access international products in a timely and efficient manner is
particularly challenging. Our procurement of merchandise from outside India is subject to risks associated with political or
financial instability, trade restrictions, tariffs, currency exchange rates, transport capacity and costs and other factors
relating to foreign trade, including costs a nd uncertainties associated with potential sell-through difficulties and reputational
damage that may be associated with our inability to determine the products we sell are manufactured in accordance with
environmental, health, and safety laws for the benefit of workers. Each of the foregoing factors could interrupt product
supply and, if not effectively managed and remedied, have a material adverse impact on our business operations, financial
condition and results of operations.
14. Increasing competition in the Indian retail market may affect our margins and operating results.
The retail industry in India is characterized by competition and increasing pressure on profit margins. Our main competitors
in the brick-and-mortar organized retail space include MedPlus, Noble and Apollo pharmacies. We also face competition
from various other competitors, including independent pharmacies, telephone order prescription providers, supermarkets,
convenience stores and other retailers operating in the e-commerce space. We compete on the basis of price, location,
quality of products, product lines, physical amenities, service, product variety and store conditions.
The retail sector in which we operate is growing and consolidating, and some of our competitors have strong competitive

33
positions and access to significant financial resources. Moreover, as foreign companies expand their operations in India or
new companies enter the market, competition will continue to intensify.
An increase in competitive pressures in the markets in which we operate, whether through new competitors or existing
competitors expanding their operations, may exert downward pressures on the prices we are able to charge to our customers,
which could negatively impact our profit margins. Our competitors may be able to offer larger discounts on competing
products, and we may not be able to profitably match those discounts. Furthermore, our competitors may offer products
that are more attractive to our customers or that render our products uncompetitive. This may decrease our market share
and require us to change our strategy, delay our expansion plans or be more selective in opening new stores.
A material increase in competition in the markets in which we operate, either through the entrance of new competitors or
expansion by current competitors, may require us to expend additional resources to offer a more attractive value proposition
to our customers, including by anticipating, predicting and meeting the preferences of our customers. However, we may be
unable to offer products similar to, or more desirable than, those offered by our competitors, market our products as
effectively as our competitors, or otherwise respond successfully to competitive pressures. If we are unable to respond
effectively to competitive pressures and changes in our markets, we may lose revenue and market share to our competitors,
which could materially and adversely affect us or cause us to lose market share.
15. The e-commerce industry is highly competitive, and any inability to compete successfully against current and future
competitors may adversely affect our business, financial condition and results of operation.
We are witnessing an increase in competition from online retailers who have been able to offer products at competitive
prices. The COVID-19 pandemic has changed consumer behaviours and accelerated the advancement of disruptive
technologies that has resulted in a significant increase in e-commerce competition. Disruptive innovation by existing or
new competitors potentially in the nature of a more user-friendly, innovative online channel or other such sales channel
could significantly alter the competitive landscape in the future. For instance, in recent years, various online pharmacy
services have been launched across India. In order to compete with such online pharmacy service providers and other
potential new competitors, we may have to incur additional expenditure towards enhancing our online presence and
optimizing our omni-channel platform, and may be required to alter our business strategy. However, we may be unable to
keep up with the pace of such behavioural changes or technological advancements, and this could adversely affect our
operations and our financial performance.
In the online retail space, we face competition, primarily from Pharmeasy, Tata 1mg and Netmeds, among others. Due to
various factors, including efficient logistics management and st rategic tie ups, online retailers are not only able to offer
more discounts and price their merchandise at lower price points, but also a wide range of products. Moreover, we have
limited experience running our e-commerce business. There is no assurance that we would be able to effectively offset the
advantages that our competitors may have and grow our business, or that the competition we face would not drain our
financial or other resources.
16. Our success depends on key members of our management and other essential personnel, and our business, prospects
and results of operations could be adversely affected if such individuals are unable or unwilling to continue under our
employment.
Our success depends largely on the efforts and strategic vision of our execu tive management team and board of directors.
The loss of the services of some or all of our executive management and members of our board of directors could have a
material adverse effect on our business.
The execution of our business plan also depends on our ongoing ability to attract and retain other qualified employees,
including licensed pharmacists, and our ability to maintain good relationships with them. If we are unable to hire, train and
retain qualified employees at a reasonable cost, we may be unable to successfully operate our business or reach full planned
operational levels in a timely manner and, as a result, our business could be adversely affected. Moreover, our pharmacists
and other qualified personnel may terminate their employment with us at any time. If we are unable to successfully maintain
good relationships with them, our ability to provide medical services may be adversely affected.
17. Our future financial results are expected to be affected directly by the operating results of franchisees and agents, over
whom we do not have direct control.
Our future growth plans rely significantly on the financial success and cooperation of franchisees, yet our franchise network
is a recent endeavor for our business and we have limited influence over our franchisees’ operations. We generate revenue
in the form of franchise fees, royalties and margin on sale of products by us to the franchisees. Accordingly, our financial
results depend upon the operational and financial success of our franchisees. Problems inherent to the franchise business,
such as difficulties in our relationships with franchisees or in expanding our franchisee network, may become manifest,
damaging our franchise brand, our brand and generating negative repercussions in our franchisee s and results. These
problems may lead to decreases in our number of franchises or their sales. Should this occur, our economies of scale may

34
be reduced, affecting our geographic footprint, expansion plans (including our franchise growth strategies) and re sults of
operations.
If industry trends or economic conditions are not sustained or do not continue to improve, or if we fail to open franchise
stores in well-suited locations, our franchisees’ financial results may worsen and our revenue may decline. We m ay also
have to terminate franchisees due to non-reporting and non-payment. Further, if franchisees fail to renew their franchise
agreements, or if we decide to restructure franchise agreements in order to induce franchisees to renew these agreements,
then our revenues may decrease, and profitability from new franchisees may be lower than in the past due to reduced
ongoing fees and other non-standard incentives we may need to provide. Further, despite contractual restrictions, a
franchisee may decide to breach the contract and not pay royalty in case the business picks up. This risk may be higher
when the location of the store is owned by a franchisee.
We rely in part on our franchisees and the manner in which they operate their locations to develop and promote our business.
Although we have developed criteria to evaluate and screen prospective franchisees, we cannot be certain that our
franchisees will have the business acumen or financial resources necessary to operate successful franchises in their
franchise areas and may limit our ability to terminate or modify these franchise agreements. Moreover, despite our training,
support and monitoring, franchisees may not successfully operate in a manner consistent with our standards and
requirements, or may not hire and train qualified personnel. Our operating performance could also be negatively affected
if our franchisees experience operational problems or project an image inconsistent with our brand and values, particularly
if our contractual and other rights and remedies are limited, costly to exercise or subjected to litigation. If franchisees do
not successfully operate stores in a manner consistent with our required standards, the image and reputation of our brands
could be harmed, which in turn could materially adversely affect our business and operating results.
18. We rely on third-party manufacturers for the supply of our private-label products, and a failure by manufacturers to
meet high product quality standards could harm the reputation of our private-label brands.
We offer our customers many products under various private-label brands that are available at our stores and omni-channel
retail platforms. These products generally carry higher margins than third-party manufacturer branded products of
comparable quality that we carry in our stores, and are a strategic business vertical for us. Our sales of private-label products
was Rs. 187.48 million in fiscal year 2020 and Rs. 158.42 million in fiscal year 2021. Our portfolio of private-label products
subjects us to unique risks, including potential product liability risks and mandatory or voluntary product recalls, our ability
to successfully protect our intellectual property rights and the rights of applicable third parties, and other risks generally
encountered by entities that source, market and sell private-label products.
In particular, all of our private-label products are sourced by us from third-party manufacturers on a contract-manufacturing
basis. As a result, any withdrawal of services from such manufacturers may adversely affect our result of operations and
future prospects. Although we have put in place strict quality control measures for all private label products manufactured
for us on a contract ba sis, we cannot assure that our private label products will always be able to satisfy our customers’
quality standards. Any failure by the manufacturers to maintain high quality standards may affect adversely our business
and any resulting negative publicity regarding our business or our private label products.
We believe maintaining consistent product quality, competitive pricing and availability of our private-label branded
products is essential to developing and maintaining customer loyalty to our private-label brands. Failure to do so could
result in damage to our more brand, which could diminish customer loyalty and lead to a loss of customer acceptance or
confidence, each of which could adversely affect our revenues and profitability. Additionally, an increase in the sales of
our private label brands may negatively affect our sales of third-party branded products which consequently, could
adversely impact certain of our supplier relationships.
19. Drug safety concerns and related unfavorable publicity may adversely affect us.
We could be materially adversely affected if consumers lose confidence in the safety or quality of the drugs we sell.
Counterfeit products have continued to make their way into the Indian pharmaceutical market. Counterfeit products are
generally sold at lower prices compared to their authentic counterparts due to their low production costs, and in some cases
may be very similar in appearance to their authentic counterparts. Counterfeit pharmaceuticals may or may not have the
same chemical content as their authentic counterparts, and are typically manufactured without proper licenses or approvals
as well as fraudulently mislabelled with respect to their content and/or manufacturer. Any unintentional sale of counterfeit
products may subject us to negative publicity, fines and/or other administrative penal-ties, or may even result in litigation
against us. Moreover, the increased distribution of counterfeit products and other products in recent years may reinforce
the negative image of drug distributors among consumers in India. The continued proliferation of counterfeit products in
India could have a material adverse effect on our business financial condition, and results of operation. Adverse publicity
about such concerns, whether or not ultimately based on fact, and whether or not involving products sold at our stores,
could discourage consumers from buying our products. To the extent that we are unable to maintain appropriate sanitation
and quality standards in our stores and distribution center, drug safety and quality issues could cause expense and damage
to our various brand names.

35
Additionally, concerns about the safety or effectiveness of certain drugs or negative publicity surrounding certain categorie s
of drugs may have a negative impa ct on our pharmacy sales. Products that we sell could become subject to contamination,
product tampering, mislabelling, recall or other damage. In addition, errors in the dispensing and packaging of
pharmaceuticals could lead to serious injury. Product lia bility or personal injury claims may be asserted against us with
respect to any of the products or pharmaceuticals we sell or services we provide across the various jurisdictions in which
we operate. Damage to our reputation and any costs arising from a product liability or personal injury claim or judgment
against us, or a product recall, could have an adverse effect on our business.
20. Our success depends on our ability to establish effective advertising, marketing and promotional programs.
Our success depends on our ability to establish effective advertising, marketing and promotional programs, including
pricing strategies implemented in response to competitive pressures and/or to drive demand for our products, increase our
customer base and increase our market share. Our advertisement and sales promotion expenses were Rs.75.31 million, Rs.
48.03 million and Rs. 50.62 million, respectively for the fiscal years ended March 31, 2021, March 31, 2020 and March
31, 2019.
Our advertisements are designed to promote our brand, our corporate image and the prices of products available for sale in
our stores or through our website or mobile application. Our pricing strategies and value propositions must be appropriate
for our target customers. If we are not able to maintain and increase the awareness of our pharmacy’s brand and the products
and services we provide, we may not be able to attract and retain customers and our reputation may also suffer. We expect
to incur substantial expenses in our marketing and promotional efforts to both attract and retain customers. However, our
marketing, branding and promotional activities may be less successful than we anticipate, and may not be effective at
building our brand awareness and customer base. We cannot provide assurance that our current and proposed budget for
marketing activities will be adequate to support our future growth. Failure to successfully execute our advertising,
marketing and promotional programs may result in material decreases in our revenue and profitabil ity.
21. We generate our sales from our stores in Western India in the States of Maharashtra, Karnataka and Goa and any
adverse developments affecting our operations in these states could have an adverse impact on our revenue and results
of operations.
Our stores are primarily concentrated in the Indian states of Maharashtra, Karnataka and Goa. Consequently, all of our
revenue is generated from these states. As of March 31, 2021, 2020 and 2019, the revenue generated from our stores in the
state of Maharashtra were Rs. 7,359.09 million, Rs. 6,753.91 million and Rs. 5,553.53 million, respectively, which
represented 79.64%, 78.24% and 82.03% of total revenue from operations respectively; the revenue generated from our
stores in the state of Karnataka were Rs. 747.22 million, Rs. 798.45 million and Rs. 650.07 million, respectively, which
represented 8.09%, 9.25% and 9.60% of total revenue from operations, respectively; and the revenue generated from our
stores in the state of Goa were Rs. 812.13 million, Rs. 682.95 million and Rs. 340.17 million, respectively, which
represented 8.79%, 7.91% and 5.02% of total revenue from operations respectively.
Regional factors that impact our profitability include: (i) the growth in population, income levels, and deposits i n these
States, (ii) general economic and political conditions in the region, (iii) laws and regulations, and (iv) the favorability of
these states as investment destinations. As a result, our operations may be more adversely affected than banks that have
greater geographic diversity. Any one of these events may result in a material adverse change in our business, financial
condition, results of operations and cash flows.
22. Interruption or failure in our information technology systems or our mobile application may adversely affect us.
Technology and computer systems are critical to many aspects of our retail and e-commerce businesses. As all of our stores
and logistics centers are integrated through our information management systems, the success of our opera tions depends
significantly on the performance of those information management systems. Our activities are dependent on the
functionality, availability, integrity and operational stability of our data center and various additional systems, including
our point of sale terminals, communication infrastructure, logistics system, inventory management and other software
applications used to control our inventories and general financial and sales performance reports. In particular, we rely on
computer software and hardware systems in managing our online sales and delivery, as well as our pricing and other
processes, the capacity of which may restrict our growth.
We could be adversely affected if one of these systems is interrupted or damaged by unforeseen events or long-term failures,
including those caused by third-parties, fire, natural disasters, systems failures, viruses and security breaches. The failure
of these systems may negatively affect the processing of our sales information or the availability of accounting, commercial
or financial reports or our capacity to adequately forecast and achieve our operating results and cash requirements. We
could also be adversely impacted by any significant disruptions in, or security breaches of, the systems and technolog y of
third-party suppliers or processors we interact with, including key players and vendors with whom we may share
information.

36
Significant or ongoing interruptions in any of these systems may prevent our customers from accessing our products and
services, which could lead these customers to purchase products from our competitors. Furthermore, in order to generate
the growth expected from our business, we may be required to improve our operating and financial systems. Any such
changes that we may undertake in the future may create integration or other operational problems and therefore adversely
affect our business.
If our systems are damaged, fail to function properly or otherwise become unavailable, we may incur substantial costs to
repair or replace them, and may experience loss of critical data and interruptions or delays in our ability to perform critical
functions, which could adversely affect our business and results of operations. Further, while we have some backup data-
processing systems that could be used in the event of a catastrophe or a failure of our primary systems, we do not yet have
an integrated disaster recovery plan. While we endeavor to prepare for failures of our network by providing backup systems
and procedures, we cannot guarantee that our current backup systems and procedures will operate satisfactorily in the event
of a regional emergency. Any substantial failure of our back-up systems to respond effectively or on a timely basis could
have a material adverse effect on our business.
To effectively compete with our competitors and continue business partner relations, we must constantly invest in and
update our technology and computer systems. In addition, as the regulatory environment related to information security,
data collection and use, and privacy becomes increasingly rigorous, with new and constantly changing requirements
applicable to our business, compliance with those requirements could also result in additional costs. We must ensure that
our security operations are current and that our technology can properly interface with our business partners. These
investments are costly, long-term, and unpredictable. There are risks that our technology investments will not be successful,
will not provide a return on investment, and/or may fail or never be deployed. Oftentimes, we are implementing multiple
updates or technology changes at the same time. There can be no assurance that we will be able to implement this
technology on its intended timeline or that it will achieve its in tended benefits.
23. A cyber-security breach could adversely affect our operations.
We are subject to data privacy laws, rules and regulations that regulate the use of customer data. Compliance with these
laws, rules and regulations may restrict our business activities, require us to incur increased expense and devote
considerable time to compliance efforts. The existing and emerging data privacy regulations limit the extent to which we
can use personal identifiable information and limit our ability to use third-party firms in connection with customer data.
Certain of these laws, rules and regulations are relatively new and their interpretation and application remain uncertain and
are also subject to change and may become more restrictive in the future. For instance, the Personal Data Protection Bill,
2018 (“PDP Bill”) applies to processing of personal data, which has been collected, disclosed, shared or processed within
India. Compliance with such data privacy norms may require us to incur significant expenditure, which may adversely
impact our financial condition and cash flows. Further, failure to maintain the integrity of internal or customer data could
result in harm to our reputation or subject us to costs, liabilities, fines or lawsuits.
In the ordinary course of business, we collect and store certain personal information that our customers provide to purchase
products or services, enroll in promotional programs, register on our web site, or otherwise communicate and interact with
us, including in connection with our administration of COVID-19 vaccines. We may collect, maintain, and store
information about our associates in the normal course of business and contract with third party business associates and
vendors to accomplish these tasks. We may share information about such persons with vendors that assist with certain
aspects of our business. Despite instituted safeguards for the protection of such information, security could be
compromised, and confidential customer or business information misappropriated. Data breaches or violations of data
protection laws may result in liability for us, even if caused, in whole or in part, by a business associate, vendor, or other
third party. The unlawful handling or disclosure of sensitive personal information could also pose a serious risk to our
customers’ trust in us, including the unlawful handling or disclosure due to security breaches of the systems and technology
of third-party suppliers or processors that we interact with, including key players and vendors with whom we may share
information. Ransomware attacks or loss of customer or business information could disrupt our operations, damage our
reputation, and expose us to claims from customers, financial institutions, payment card associations and other persons, o r
result in governmental investigation and enforcement, sanctions, fines, and/or penalties, any of which could have an adverse
effect on our business, financial condition and results of operations. In addition, compliance with more rigorous privacy
and information security laws and standards may result in significant expense due to increased investment in technology
and the development of new operational processes. Our brand, reputation, and customer loyalty may be negatively impacted
in the event of any personal information security failures. The occurrence or scope of any future data security failures are
unpredictable, and it may prove difficult or impossible to fully mitigate or remediate their negative consequences. If we
fail to comply or are alleged to have failed to comply with applicable data protection and privacy laws and regulations, we
could be subject to government enforcement actions or private lawsuits.
Although we deploy an information security program designed to protect confidential information against data security
breaches through a multi-layered approach to address information security threats and vulnerabilities, including ones from
a cyber-security standpoint, a compromise of our information security controls or of those businesses wit h whom we
interact, which results in confidential information being accessed, obtained, damaged or used by unauthorized or improper

37
persons, could harm our reputation and expose us to regulatory actions and claims from customers and clients, financial
institutions, payment card associations and other persons, any of which could adversely affect our business, financial
position and results of operations. Moreover, a data security breach could require that we expend significant resources
related to our information systems and infrastructure and could distract management and other key personnel from
performing their primary operational duties. Any compromise or breach of our data security, whether external or internal,
or misuse of customer, associate, supplier or our data could also result in a violation of applicable privacy, information
security, and other laws, significant legal and financial exposure, fines or lawsuits, damage to our reputation, loss or misu se
of the information and a loss of confidence in our security measures, which could harm our business. Although we maintain
cyber security insurance, we cannot assure you that the coverage limits under our insurance program will be adequate to
protect us against future claims.
24. Future acquisitions, joint ventures, investments and other collaborations are expected to be a part of our growth
strategy, which could expose us to significant business risks.
As part of our growth and expansion strategy, we may consider investing in, or acquiring, stores and store chains that can
be integrated with our existing regional operations or developed into new regional operations . We may also seek suitable
investments and business partnerships where opportunities arise, including establishing alliances and joint ventures with
potential partners that offer ancillary products or services complementary to ours. However, we cannot assure you that we
will be able to identify and secure suitable opportunities for acquisition, joint ventures, investments and other
collaborations, or that we will succeed at effectively managing their operation.
The likelihood that our acquisitions will contribute to our growth and add value to our business depends on a variety of
factors, including our ability to identify companies or assets to acquire, negotiate suitable prices, create synergies and
integrate and maintain the operating level of the acquired companies or assets is limited. Future acquisitions may also
expose us to other potential risks, including risks associated with:
• the integration of new operations, services and personnel;
• unforeseen or hidden liabilities;
• the diversion of financial or other resources from our existing businesses;
• difficulties in entering markets or lines of business in which we have no or limited direct prior experience;
• our inability to generate sufficient revenue to recover costs and expenses of the acquisitions; and
• potential loss of, or harm to, relationships with employees or customers.
Moreover, the success of our investments and partnerships may depend on the efforts and abilities of our part ners to varying
degrees. If our partners or companies in which we have invested are unable to manage their businesses, the value of our
investments and partnerships could be adversely affected. In addition, we and those partners may have disagreements with
respect to strategic directions or other aspects of business or may otherwise be unable to coordinate or cooperate with each
other, any of which could materially and adversely affect our operations in such businesses.
Our business may be negatively impacted if we fail to successfully integrate or realize the anticipated benefits of such
transactions.
25. Our Company has undertaken a transfer of its e-commerce business to one of its Subsidiaries pursuant to a business
transfer agreement which could affect our e-commerce business operations.
Pursuant to a business transfer agreement dated September 2, 2021 entered into between our Company and one of its
Subsidiaries, Wellness Forever HealthTech Private Limited, and as part of our internal restructuring our Company has
transferred to Wellness Forever HealthTech Private Limited, on a slump sale basis and as a going concern, our e -commerce
business along with operation, development and maintenance of the website www.wellnessforever.com and “We llness
Forever” mobile application (including assets, contracts, employees, liabilities and intellectual property) (“ E-commerce
Transfer”).
Although the E-Commerce Transfer has been completed on September 22, 2021, certain contracts pertaining to third -party
online delivery partners continue to be in effect with our Company and Wellness Forever HealthTech Private Limited may
not be able to enter into contracts with said third parties on the same commercial terms and conditions. Further, in terms of
Companies Act, 2013 read with rules notified thereunder, Wellness Forever HealthTech Private Limited shall become a
related party to our Company and the transactions entered into with Wellness Forever HealthTech Private Limited shall
have to be at arm’s length basis and in accordance with applicable laws. Accordingly, even though Wellness Forever
HealthTech Private Limited has appointed qualified personnel and obtain all the relevant approvals to undertake all the
activities required for smooth functioning of our e-commerce platforms, we cannot assure you whether the all the
components transferred pursuant to the E-Commerce Transfer will be smoothly run by our Subsidiary and the changing
regime of regulations on the e-commerce will not have any impact on such transfer. For details, see “Management’s
Discussion and Analysis of Financial Position and Result of operations - Significant Developments Occurring after March
31, 2021” on page 306.

38
26. We are subject to electronic payment-related risks that could increase our operating costs, expose us to fraud or theft,
subject us to potential liability and potentially disrupt our business.
We accept payments using a variety of methods, including cash, checks, credit and debit cards, gift cards and mobile
payment technology, and we may accept new forms of payment over time. Acceptance of these payment options subjects
us to rules, regulations, contractual obligations and compliance requirements including payment network rules and
operating guidelines, data security standards and certification requirements, and rules governing electronic funds transfers.
These requirements may change over time or be reinterpreted, making compliance more difficult or costly. For certain
payment methods, including credit and debit cards, we pay interchange and other fees, which may increase over time and
raise our operating costs. We rely on third parties to provide payment processing and cash management services, including
the processing of credit cards, debit cards, and other forms of electronic payment. If these companies become unable to
provide these services to us, or if their systems are compromised, it could potentially disrupt our business. The payment
methods that we offer also subject us to potential fraud and theft by criminals, who are b ecoming increasingly more
sophisticated, seeking to obtain unauthorized access to or exploit weaknesses that may exist in the payment systems. If we
fail to comply with applicable rules or requirements for the payment methods we accept, or if payment -related data is
compromised due to a breach or misuse of data, we may be liable for costs incurred by payment card issuing banks and
other third parties or subject to fines and higher transaction fees, or our ability to accept or facilitate certain types of
payments may be impaired. In addition, our customers could lose confidence in certain payment types, which may result
in a shift to other payment types or potential changes to our payment systems that may result in higher costs. As a result,
our business and operating results could be adversely affected.
27. Inability to manage losses due to fraud, employee negligence, theft or similar incidents may have an adverse impact on
us.
Our business and the industry we operate in are vulnerable to the problem of product shrinkage. Shrinkage at our stores or
our distribution center may occur through a combination of shoplifting by customer, pilferage by employee, damage,
obsolescence and expiry and error in documents and transactions that go un -noticed. The retail industry also typically
encounters some inventory loss on account of employee theft, shoplifting, vendor fraud, credit card fraud and general
administrative error. Our business operations also involve a majority of cash transactions. Although we have set up various
security measures, we have in the past experienced such incidents. An increase in product shrinkage levels at our existing
and future stores or our distribution center may force us to install additional security and surveillance equipment, which
will increase our operational costs and may have an adverse impact on our profitability. Further, we cannot assure you
whether these measures will successfully prevent product shrinkage. Furthermore, although we have cash management
procedures and controls in place, there are inherent risks in cash management including, theft and robbery, employee fraud
and the risks involved in transferring cash from our stores to banks. Finally, there have been instances of employee
dishonesty in the past and we cannot assure you that we will be able to completely prevent such incidents in the future.
Additionally, in case of losses due to theft, fire, breakage or damage caused by other casualties, there can be no assurance
that we will be able to recover from our insurer the full amount of any such loss in a timely manner, or at all. In addition,
if we file claims under an insurance policy it could lead to increases in the insurance premiums payable by us or the
termination of coverage under the relevant policy.
28. The Company may not be able to prevent its officers, employees or third parties acting on its behalf from engaging in
situations that qualify as corruption, fraud or other misconduct which could expose the Company to administrative
and judicial sanctions, as well as reputational damage.
The Company’s governance and compliance procedures may not prevent breaches of law, accounting and/or governance
standards, and there can be no assurance that the Company’s employees, agents, and the companies to which the Company
outsources certain of its business operations, will not take actions in violation of the Company’s policies, for which the
Company may be ultimately held responsible.
The Company’s policies and procedures are aimed at detecting and preventing corruption, fraud or ot her misconduct by
the Company’s employees and agents, they may not completely eliminate instances where the Company’s employees may
engage in such illegal or improper activities. Any future misconduct by individuals working for the Company could occur,
which could adversely affect the Bank.
29. Certain of our Promoters, Directors and Key Managerial Personnel have interests in our Company in addition to their
normal remuneration or benefits and reimbursement of expenses incurred.
Certain of our Promoters, Directors and Key Managerial Personnel have interests in our Company that are in addition to
reimbursement of expenses and normal remuneration payable to them. Our Promoter, Directors and Key Managerial
Personnel may be deemed to be interested to the extent of Equity Shares held by them, as well as to the extent of any
dividends, bonuses, other distributions on such Equity Shares or rental income received from the Company for the
properties owned by them. We cannot assure you that our Promoter, Directors and our Key Management Personnel will
exercise their rights as shareholders to the benefit and best interest of our Company. Some of our promoters and their

39
relatives have licensed properties to the Company and as such the promoters may be considered to be interes ted to the
extent of the license fee payable by the Company. For further details of such interests, see “Our Management” and
“Restated Consolidated Financial Information” beginning on pages 181 and 204, respectively. For further details of our
Promoters, see “Our Promoter and Promotor Group” beginning on page 194.
30. Any related party transactions that are not on an arm's length basis may adversely affect our business, results of
operation and financial condition.
In the ordinary course of business, we have entered into and continue to enter into transactions with certain related parties.
While we believe that all such transactions have been conducted on an arm’s length basis, there can be no assurance that
we could not have achieved more favorable terms had such transactions been entered into with non-related parties. For
example, our largest supplier is a related party entity and accounted for 9.86% of our total purchases for the fiscal year
ended March 31, 2021. In addition, certain of our promoters, and their relatives, receive rental payments from us in
connection with four properties that have been licensed to the Company. We cannot assure you that such transactions,
individually or in the aggregate, will not materially and adversely affect our business, financial condition, results of
operations and prospects. For more information regarding related party transactions, see “Summary of Related Party
Transactions” on page 15.
31. Our operations require a number of permits, licenses and certifications, and our failure to obtain and maintain all of
the necessary licenses, permits and certifications could adversely affect us.
We are required to obtain certain permits and licenses from various governmental authorities, including food and drugs
licenses, shops and establishment registrations. We are also required to obtain food hygiene certificates for the distribution
of nutritional supplements and food products. In order to operate our stores in India, our Company requires various
approvals and/or licenses under various state and central laws, rules and regulations. These approvals and/or licenses, inter
alia, include (a) licenses under the FSSA, (b) licenses under Insecticides Act, 1968, (c) licenses under the Drugs and
Cosmetics Act, 1940, (d) licenses under Narcotic Drugs and Psychotropic Substances Act, 1985, and (e) trade, health and
board licenses under state municipality rules. We cannot assure you that we will be able to maintain all required licenses,
permits and certifications to carry on our business at all times, and from time to time we may have not been in the past, or
may not be in the future, in compliance with all such required licenses, permits and certifications. Moreover, these licenses,
permits and certifications are subject to periodic renewal and/or reassessment by the relevant governmental authorities and
the standards of such renewal or reassessment may change from time to time. Although we usually apply for renewal of
these licenses, permits and certifications when required by applicable laws and regulations, any failure by us to obtain and
maintain all licenses, permits and certifications necessary to carry on our business at any time could have a material adverse
effect on our business, financial condition and results of operations. In addition, any inability to renew any of these licenses,
permits and certifications could severely disrupt our business, and prevent us from continuing to carry on our business.
Any changes in the standards used by governmental authorities in considering whether to renew or reassess our business
licenses, permits and certifications, as well as any enactment of new regulations that may restrict the conduct of our
business, may also decrease our revenue and/or increase our costs, materially redu cing our profitability and prospects.
Furthermore, if the interpretation or implementation of existing laws and regulations changes or if new regulations come
into effect requiring us to obtain any additional licenses, permits or certifications that were p reviously not required to
operate our existing businesses, we cannot provide assurance that we can successfully obtain such licenses, permits or
certifications. For details, see “Government and Other Approvals” on page 312.
32. Non-compliance with existing regulatory requirements or new requirements applicable to our operations we sell may
adversely affect us.
Our business is subject to extensive governmental regulation, as well as laws and regulations applicable to environmental,
health and safety measures. In addition, our operations may be subject to special, state or municipal regulations, such as
zoning laws and restrictions on advertising and marketing. For a more detailed description of our regulatory framework,
including as recent and proposed changes that may adversely affect us, see “Key Regulations and Policies” on page 171.
We cannot assure you that a regulatory agency or court of law would determine that we are fully compliant with such laws
and regulations. Non-compliance, or untimely compliance, with applicable laws and regulations could result in the
imposition of civil, regulatory and criminal penalties, temporary store closings, cancellation of licenses and revocation of
permits or authorizations, among other sanctions.
In addition, changes in these laws and regulations may restrict our existing operations, limit the expansion of our business
and require extensive system and operating changes that may be difficult or costly to implement. Public authorities may
issue new and stricter standards or enforce or interpret existing laws and regulations in a more restrictive manner, which
may force us to make expenditures to comply with such new rules and materially and/ or financially harm our results of
operations.
33. As a distributor of pharmaceutical, food and other healthcare products, we are exposed to inherent risks relating to

40
product liability and personal injury claims.
Distributors of pharmaceutical, food and other healthcare products are exposed to risks inherent in the packaging and
distribution of such products. Such risks include unintentional distribution of counterfeit, mislabeled or contaminated
drugs, and, with respect to our stores. Errors in the packaging or dispensing of pharmaceuticals could lead to serious injury
or death. Furthermore, the applicable Indian laws, rules and regulations require our in -store pharmacists to offer counseling
to our customers, without additional charge, about medication, dosage, delivery systems, common side effects, and other
information the in-store pharmacists deem significant. Our in-store pharmacists sometimes also have a duty to warn
customers regarding any potential negative effects of a prescription drug if the warning could reduce or negate these effects,
and we may be liable for claims arising from any advice given by our in -store pharmacists. In addition, we cannot ensure
that products are not consumed by consumers subsequent to the expiry of the shelf life, which may lead to health hazards.
While we display the shelf life in the packing of our products, we may face claims for damages or other litigation in the
event our products are sold and consumed subsequent to expiry of their shelf life. Any o r all of these factors could adversely
affect our reputation, and consequently our business, prospects and financial performance.
Product liability or personal injury claims may be asserted against us with respect to any of the products or pharmaceuticals
we sell or services we provide, and we may be required to pay for substantial monetary damages for any successful product
liability or personal injury claim against us. For instance, there have been claims against us and our employees under the
FSS Act and the Legal Metrology Act. For details see, “Outstanding Litigations and Material Developments” on page 308.
Even if we successfully defend ourselves against this type of claim, we could be required to spend significant management,
financial and other resources in the process, which could disrupt our business. Our reputation and our brand names may
also suffer as a result of any product liability or personal injury claims against us. Like many other similar companies in
India, we do not carry product liability insurance. A product recall or damage to our reputation in the event of a product
liability or personal injury claim or judgment against us could have a material adverse effect on our business, financial
condition and results of operations.
34. We may not be able to generate or obtain the capital we need for further expansion.
We expect to continue to have substantial liquidity and capital resource requirements to finance our business. We intend to
rely upon internally generated cash from our operations and, if necessary, the proceeds of debt and/or equity offerings in
the domestic and international capital markets as well as bank debt. We cannot assure you, however, that we will be able
to generate sufficient cash flows from operations or obtain sufficient funds from external sources to fund our capital
expenditure requirements.
Our future ability to access financial markets in sufficient amounts and at acceptable costs and terms to finance future
operations and capital expenditures will depend to a large degree on prevailing capital and financial market conditions over
which we have no control, and accordingly we cannot assure you that we will be able to do so. Recent economic conditions
and general market volatility have had a negative impact on the liquidit y of financial markets. Our failure to generate
sufficient cash flows from operations or to be able to obtain third-party financing could cause us to delay or abandon some
or all of our planned expansion, including capital expenditures, which, in turn, cou ld have a material adverse effect on our
growth strategy.
35. Our financing agreements entail interest at variable rates and any increase in interest rates may adversely affect our
results of operation and financial condition.
As of August 31, 2021, we had a total indebtedness of Rs. 1,537.82 million, 97.10% of which was subject to the floating
MCLR interest rate. For more information, see “Financial Indebtedness” on page 290. Therefore, we are susceptible to
changes in interest rates and the risks arising out of our floating rate indebtedness.
Any increase in interest rates in India would be expected to result in an increase in our interest expenses. Further, in rece nt
years, the Government of India has taken measures to control inflation, which have included tightening the monetary policy
by raising interest rates. Any increase in interest rates may have an adverse effect on our results of operations and financi al
condition.
36. Our existing insurance coverage may be insufficient and future coverage may be difficult or expensive to obtain.
Although we believe that our insurance policies provide adequate coverage for the risks inherent in our businesses, these
insurance policies typically exclude certain risks and are subject to certain thresholds and limits. We cannot assure you that
our property, equipment and inventories will not suffer damages due to unforeseen events or that the proceeds available
from our insurance policies will be sufficient to protect us from all possible loss or damage resulting from such events. We
renew our insurance policies on an annual basis. The cost of coverage may increase to an extent that we may choose to
reduce our policy limits or agree to certain exclusions from our coverage. Among other factors, adverse political
developments, security concerns and natural disasters may materially adversely affect available insurance coverage and
result in increased premiums for available coverage and additional exclusions from coverage. As a result, our insurance

41
coverage may prove to be inadequate for events that may cause significant disruption to our operations, which may have a
material adverse effect on our business.
Pharmacies and distribution centers are exposed to risks inherent in the dispensing and distribution of pharmaceuticals and
other healthcare products. Product liability claims may be asserted against us with respect to any of the products or
pharmaceuticals we sell and services we provide. The coverage limits under our insurance policies may not be adequate to
protect us against future claims, and in the future we may not be able to maintain our insurance policies on acceptable
terms. A product liability judgment against us or a product recall could damage our reputation and have an adverse effect
on our business.
37. We are involved in a number of legal and regulatory proceedings that, if determined against us or them, could have a
material adverse impact on our profitability, reputation, business, results of operations, financial condition and cash
flows.
In the ordinary course of business, we, our subsidiaries and certain of our directors and officers may become involved in
certain legal or regulatory proceedings, regulatory investigations, audits or other inspections in the ordinary course which
could result in judgments, fines, reprimands and damage to our reputation.
The list of material outstanding legal proceedings as on the date of this Draft Red Herring Prospectus is se t out below:
Type of Proceedings Number of cases outstanding Amount involved in such
proceedings to the extent
quantifiable
(₹ in million)
Litigation against our Company
Criminal proceedings Nil Not applicable
Tax matters 8 102.04
Actions by statutory or regulatory authorities 2 Not applicable
Other outstanding material litigation Nil Not applicable
Total 10 102.04
Litigation by our Company
Criminal proceedings Nil Not applicable
Tax matters Nil Not applicable
Other outstanding material litigation Nil Not applicable
Total Nil Not applicable
Litigation against our Promoters
Criminal matters Nil Not applicable
Tax matters Nil Not applicable
Actions by statutory/ regulatory authorities 2 Not applicable
Other outstanding material litigation Nil Not applicable
Disciplinary action, outstanding or taken including
penalty imposed by SEBI or Stock Exchanges in the
last five Fiscals
Nil Not applicable
Total 2 Not applicable
Litigation by our Promoters
Criminal proceedings Nil Not applicable
Tax matters Nil Not applicable
Other outstanding material litigation Nil Not applicable
Total Nil Not applicable
Litigation against our Subsidiaries
Criminal proceedings Nil Not applicable
Tax matters Nil Not applicable
Actions by statutory or regulatory authorities Nil Not applicable
Other outstanding material litigation Nil Not applicable
Total Nil Not applicable
Litigation by our Subsidiaries
Criminal proceedings Nil Not applicable
Tax matters Nil Not applicable
Other outstanding material litigation Nil Not applicable
Total Nil Not applicable
Litigation against our Directors other than our Promoters
Criminal proceedings Nil Not applicable
Tax matters Nil Not applicable
Actions by statutory or regulatory authorities Nil Not applicable
Other outstanding material litigation Nil Not applicable

42
Type of Proceedings Number of cases outstanding Amount involved in such
proceedings to the extent
quantifiable
(₹ in million)
Total Nil Not applicable
Litigation by our Directors other than our Promoters
Criminal proceedings Nil Not applicable
Tax matters Nil Not applicable
Other outstanding material litigation Nil Not applicable
Total Nil Not applicable
The costs and resources required to defend ourselves from these proceedings may be substantial, and adverse decisions can
reach significant amounts, which may significantly and adversely us and may also damage our reputation. We cannot assure
you that the judgments in any of the litigation or regulatory proceedings in which we, our subsidiaries and certain of our
directors and officers are involved will be favorable to us or that, in case of unfavorable judgments, our provisioning would
be adequate relative to actual losses. Moreover, such proceedings also divert management time and attention, which could
materially affect our performance.
Any adverse outcome of litigation or regulatory proceedings could have a material adverse ef fect on our business, future
financial performance and the trading price of the Equity Shares. For further information on our legal proceedings involving
us and our subsidiaries, officers and directors, see “ Outstanding Litigation and Material Developments” on page 308.
38. If we are unable to protect our brand names and other intellectual property from infringement, our business and
prospects may be harmed.
As on date of June 30, 2021, we have 90 registered trademarks and 54 trademarks which are pending registration under the
Trade Marks Act, 1999.
We believe our brand names and related intellectual property , particularly our “Wellness Forever” brand name, are valuable
assets which are important to our continued success and the marketing and sale of our products. However, we may be
unable to prevent third parties from using such brand names without authorization, which may adversely affect our business
and reputation, including the perceived quality and reliability of our product s and services.
We attempt to protect our brand names and related intellectual property by exercising our rights under applicable trademark
and copyright laws. Litigation may be necessary in the future to enforce our intellectual property rights or to det ermine the
validity and scope of the intellectual property rights of others. Any infringement of our intellectual property rights in India
would likely result in a commitment of our time and resources to protect these rights through litigation or otherwise , which
could be expensive and time-consuming. For example, if we were to enforce a claim that a third party was using our brand
names, such efforts could be expensive and time-consuming, and the outcome unpredictable.
We rely on trade secrets to protect our know-how and other proprietary information, including pricing, purchasing,
promotional strategies, customer lists and/or suppliers lists. However, trade secrets are difficult to protect. For example, if
our competitors independently develop information that is equivalent to our trade secrets or other proprietary information,
we have little recourse to enforce our rights, and our business and prospects could be harmed. While we believe we use
reasonable efforts to protect our trade secrets, our employees, consultants, contractors or advisors may unintentionally or
wilfully disclose our information to competitors. In addition, confidentiality agreements executed by the aforementioned
individuals may not be enforceable or provide meaningful protection for o ur trade secrets or other proprietary information
in the event of unauthorized use or disclosure.
If we are unable to protect our trade names, trade secrets and other propriety information from infringement, our business,
financial condition and results of operations may be materially and adversely affected.
39. Our inability to meet our obligations, including financial and other covenants under our debt financing arrangements
could adversely affect our business and results of operations.
As of August 31, 2021, we had total outstanding borrowings of ₹ 1,537.82 million. Our ability to meet our debt service
obligations and repay our outstanding borrowings will depend primarily on the cash generated by our business. Our
financing agreements contain certain restrictive covenants that limit our ability to undertake certain types of transactions,
including any change in our shareholding pattern or management or undertaking any new project, which could adversely
affect our business and financial condition. For details, see “Financial Indebtedness” on page 290.
In addition, certain of our borrowings require us to maintain certain financial ratios and certain other information covenants,
which are tested at times typically on a quarterly, half yearly or annual basis. In the event we breach any financial or other
covenants contained in any of our financing arrangements or in the event we had breached any terms in the past which is
43
noticed in the future, we may be required to, inter alia, immediately repay our borrowings either in whole or in part,
together with any related costs. Furthermore, our Promoters have provided guarantees to our lenders for certain of our
borrowings which may be enforced by such lenders in the event of any default in repayment of such borrowings by u s. For
details, see “History and certain Corporate Matters – “Details of guarantees given to third parties by the Promoter Selling
Shareholders”.
Some of our financing arrangements may become due for renewal and we cannot guarantee that the facilities avai led under
such arrangements will be renewed on the previously agreed terms and conditions, or conditions which are not more
onerous on us. Further, under certain of our existing financing arrangements, we are required to obtain prior consent from
our lenders for, inter alia, change in constitutional documents, change in the shareholding pattern of the Company, change
in composition of the management or our Board of Directors, dilution of the shareholding of the promoters, undertake the
Offer or undertake any new project or expansion. Although we have obtained consent from our lenders for undertaking the
Offer, any failure to meet our other obligations under the debt financing agreements could have an adverse effect on our
business, results of operations and financial condition.
40. Any deterioration in our labor relations may have a material adverse effect on us.
As of June 30, 2021, we had a total of 4,691 employees. Although we currently enjoy satisfactory relations with our
employees and had no outstanding disputes with our employees in the past three financial years , we cannot assure you that
labor relations will continue to be positive. Any future deterioration in labor relations could lead to work stoppages and
other labor disturbances or loss of productivity which could negatively impact our business.
41. We are dependent on third party transportation for the delivery of products in certain areas, and any disruption in their
operations or a decrease in the quality of their services could affect our reputation and results of operations.
We are largely dependent on third party transportation providers to facilitate the delivery of our products. Although our
business has not experienced any significant disruptions due to transportation st rikes in the past, any future transportation
strikes may have an adverse effect on our business. At times, these transportation facilities may not be adequate to support
our existing and future operations. In addition, products being delivered through these transportation facilities may be lost
or damaged in transit for various reasons including occurrence of accidents or natural disasters. We have had no instances
of material disruption in deliveries by third party service providers in past three years but there may be delay in delivery
of products which may also affect our business and results of operation negatively in the future.
Furthermore, disruptions to transportation services due to weather-related problems, strikes, lockouts, inadequacies in the
road infrastructure and port facilities, or other events could impair ability to deliver goods on time. Any such disruptions
could materially and adversely affect our business, financial condition and results of operations.
42. Credit rating downgrades may increase our cost of capital and restrict our access to the capital markets.
Any downgrade in our credit rating could adversely affect our ability to raise additional financing and the interest rates and
other commercial terms at which such additional financing is available. Credit ratings are based on a number of factors,
including an issuer’s financial strength, as well as factors that may not be within our control, such as macroeconomic
conditions and the rating agencies’ perception of the industries in which we operate and the products we offer. These ratings
also reflect the various methodologies and assumptions used by the rating agencies, which are subject to change and could
adversely affect our ratings. A downgrade in our credit ratings (or investor concerns that a downgrade may occur) could
materially increase the cost of our funding from, and restrict our access to, the capital markets.
43. Certain of our significant shareholders and other affiliates may take actions which are not necessarily in our interest
or in the interest of our other shareholders.
Certain of our significant shareholders and other affiliates are engaged in business activities which are similar to those
undertaken by us and our subsidiaries, or have interests in other companies which are in businesses similar to ours, which
may result in conflicts of interest. Accordingly, the interests of certain of our significant shareholders and other affiliates
may be different from, and conflict with, our interests or the interest of our other shareholders, and we cannot assure you
that they will not in the future exercise influence over our business and major policy decisions. Our significant shareholders
and other affiliates may also enable a competitor to take advantage of a corporate opportunity at our expense. Accordingly,
there can be no assurance that our significant shareholders and other affiliates will not take actions or implement policies
that are adverse to investors in our Equity Shares.
Further, conflicts of interest may also arise out of common business objectives shared by us and certain of our Promoters. We
cannot assure you that certain of our significant shareholders and other affiliates will act to resolve any conflicts of interest
in our favor, or they may take actions that are not in our best interest or that of our other shareholders. For example, one of
our Promoters has an equity interest in another retail chain business pursuits of which may overlap wit h certain of our
strategies. Such significant shareholders and other affiliates could compete with us and have no obligation to direct any

44
opportunities to us. Therefore, we cannot assure you that these or other conflicts of interest will be resolved in an impartial
manner.
44. Our ability to pay dividends in the future will depend on our earnings, financial condition, working capital requirements,
capital expenditures and restrictive covenants of our financing arrangements.
Our ability to pay dividends in the future will depend on our earnings, financial condition, cash flow, working capital
requirements, capital expenditure and restrictive covenants of our financing arrangements. Any future determination as to
the declaration and payment of dividends will be at the discretion of our Board and will depend on factors that our Board
deems relevant, including among others, our future earnings, financial condition, cash requirements, business prospects
and any other financing arrangements. We may decide to retain all of our earnings to finance the development and
expansion of our business and, therefore, may not declare dividends on our Equity Shares. We cannot assure you that we
will be able to pay dividends in the future. For details of dividend paid by our Company in the past, see “Dividend Policy”
on page 200.
45. We may be unable to enforce our rights under some of our agreements on account of inadequate stamping and not
registering the agreements or other reasons.
We regularly enter into agreements with third parties, in relation to leasing or acquisition of land, purchase of
wellness/pharmaceutical products, raw materials, among others. The terms, tenure and the nature of the agreements vary
depending on, amongst other things, the subject matter of the agreement and the third party involved. Although we duly
execute our documents, some of the agreements executed by us may be inadequately stamped or not registered or may not
otherwise be enforceable. Such inadequately stamped or not registered documents may not be admissible in evidence in a
court of law until the applicable stamp duty, with penalty, has been paid and registered, which could, therefore, impact our
ability to enforce our rights under the agreements in a timely manner or at all.
46. This Draft Red Herring Prospectus contains information from industry reports from certain agencies commissioned by
us and paid for by us, including TechnoPak.
This Draft Red Herring Prospectus contains information from industry reports from certain agencies commissioned by us
and paid for by us, including TechnoPak. The reports use certain methodology for marketing and forecasting. While we
believe such data to be true, we cannot assure you that such information is completely reliable. Accordin gly, investors
should read the industry-related disclosure in this Draft Red Herring Prospectus in this context.
Industry sources and publications are also prepared based on information as of specific dates and may no longer be current
or reflect current trends. Industry sources may also base their information on estimates, projections, forecasts and
assumptions that may prove to be incorrect. While industry sources take due care and caution while preparing their reports,
they do not guarantee the accuracy, adequacy or completeness of the data. Accordingly, investors should not place undue
reliance on, or base their investment decision solely on this information.
47. We have issued Equity Shares at prices that may be lower than the Offer Price in the last 12 months.
We have converted certain CCPS to 2,122,377 Equity Shares on June 30, 2021 at a price which may be lower than the
Offer Price. The price at which Equity Shares have been issued by our Company in the preceding one year is not indicative
of the price at which they will be issued or traded. For further details, see “Capital Structure –Notes to the capital structure
–Share capital history of our Company –Equity Share capital” on page 69.
48. Our funding requirements and proposed deployment of the Net Proceeds of the Offer have not been appraised by a bank
or a financial institution.
We intend to use the Net Proceeds of the Fresh Issue for the purposes described in “Objects of the Offer” on page 91. The
objects of the Fresh Issue have not been appraised by any bank or financial institution. The proposed utilisation of Net
Proceeds is based on current conditions, internal management estimates, contracts and are subject to changes in external
circumstances or costs, or in other financial condition, business or strategy, as discussed further below. Based on the
competitive nature of our industry, we may have to revise our business plan and/ or management estimates from time to
time and consequently our funding requirements may also change. Our internal management estimates may exceed fair
market value or the value that would have been determined by third party appraisals, which may have an adverse impact
on our business, financial condition, results of operations and cash flows.
Further, pending utilization of Net Proceeds towards the Objects of the Offer, our Company will have the flexibility to
deploy the Net Proceeds and to deposit the Net Proceeds them temporarily in deposits with one or more scheduled
commercial banks included in Second Schedule of Reserve Bank of India Act, 1939. Accordingly, prospective investors in
the Offer will need to rely upon our management’s judgment with respect to the use of Net Proceeds.

45
49. If there are delays or cost overruns in utilization of Net Proceeds, our business, financial condition and results of
operations may be adversely affected.
We intend to utilize the Net Proceeds of the Offer as set forth in “Objects of the Offer”, with respect to funding the setting
up of new Company-owned stores, funding working capital requirements, repayment of outstanding debt, in part or full
and general corporate purposes. The funding requirements mentioned as a part of the objects of the Offer are based on
internal management estimates which in turn, is based on current conditions and is subject to change in light of changes in
external circumstances, costs, other financial condition or business strategies. We are also yet to identify the exact location
of our new stores or enter into agreements for lease of property for these stores and are yet to obtain necessary approvals
that may be required. We have also not placed any definitive orders for constructions related items, furniture and fixtures
for the stores we plan to set-up. We have relied on past expenditure in setting up stores for the purp oses of estimating
utilization of the Net Proceeds in the future. As a consequence of any increased costs, our actual deployment of funds may
be higher than our management estimates and may cause an additional burden on our finance plans, as a result of wh ich,
our business, financial condition, results of operations and cash flows could be materially and adversely impacted.
Furthermore, we may need to vary the objects of the Offer due to several factors or circumstances including competitive
and dynamic market conditions, variation in cost structures, changes in estimates due to cost overruns or delays, which
may be beyond our control. Pursuant to Section 27 of the Companies Act, 2013, any variation in the objects of the Offer
would require a special resolution of our Shareholders. If our shareholders do not agree to such variation, it may impact
our business, financial condition, results of operations and cash flows.
50. We intend to utilise a portion of Net Proceeds for funding our capital expenditure requirements and funding our
incremental working capital requirements. However, we are yet to place orders for such capital expenditure
requirements.
We propose to utilize ₹ 702 million of our Net Proceeds towards expansion of our stores and certain cost components
attached to it for which we are yet to place the orders. Furthermore, we aim to utilize ₹ 1,218.97 million to fund our
incremental working capital requirements. We have not entered into any definitive agreements to utilize the Net Proceeds
for this object of the Offer and have relied on the quotations received from third parties for estimation of the cost. While
we have obtained the quotations from various vendors in relation to such capital expenditure, most of these quotations are
valid for a certain period of time and may be subject to revisions, and other commercial and technical factors. We cannot
assure you that we will be able to undertake such capital expenditure within the cost indicated by such quotations or that
there will not be any cost escala tions until the time we have access to the Net Proceeds.
The purpose of funding our incremental working capital requirements for which our Net Proceeds will be utilized are based
on our past practices and future estimates (which may change in the future). Our management, therefore, will have a broad
discretion to use the Net Proceeds and you will be relying on the judgment of our management regarding the application
of these Net Proceeds for working capital requirements. For details, see “Objects of the Offer” on page 91.
51. Contingent liabilities could adversely affect our financial condition.
As of March 31, 2021, our contingent liabilities totalled Rs. 92.80 million, and primarily related to the following:
Particulars As of March 31, 2021
Contingent Liabilities
(i) Income Tax Act 58.90
(ii) Bank guarantees 33.90
Our contingent liabilities may become actual liabilities. In the event that any of our contingent liabilities materialize, our
business, results of operations, financial condition and prospects may be adversely affected. Furthermore, there can be no
assurance that we will not incur similar or increased levels of contingent liabilities in the current fiscal year or in the future.
For further details regarding contingent liabilities, please see the chapter “Restated Consolidated Financial Information”
beginning on page 204.
52. Our Promoters have pledged certain of their Equity Shares and provided guarantees in favour of certain our lenders.
Enforcement of such pledge or guarantees by the lenders may affect our business, results of operations and financial
condition.
As of the date of this Draft Red Herring Prospectus, our Promoters have pledged 2,510,500 Equity Shares in favour of our
lenders, aggregating to 4.95% of our Company’s pre-Offer Equity Share capital. This pledge is against a total loan of ₹
1,585.50 million availed by our Company. However, such pledged Equity Shares do not form part of the Equity Shares
offered in the Offer for Sale by our Promoters. For details, see “Capital Structure – Details of shareholding of our
Promoters and members of the Promoter Group in our Company” on page 76.
Any default under the arrangement pursuant to which these Equity Shares have been pledged will entitle our lenders t o

46
enforce a pledge over these Equity Shares. In such an event, the shareholding of our Promoters may be diluted, and we
may face certain impediments in taking decisions on certain key, strategic matters involving our Company. As a result, we
may not be able to conduct our business or implement our strategies as currently planned, which may adversely affect our
business and financial condition. Furthermore, any rapid sale of Equity Shares by such third parties may adversely affect
the price of the Equity Sha res.
External Risk Factors
Risks Relating to India
53. A slowdown in economic growth in India could have an adverse effect on our business, results of operations, financial
condition and cash flows.
Our performance and growth are, and will be, dependent to a large extent on the health of the Indian economy and
consumption spending by households. Economic growth in India is affected by various factors including domestic
consumption and savings, rate of inflation in India, balance of trade movements, and global economic uncertainty. All of
our assets and employees are located in India, and we intend to continue to develop and expand in India. India’s real growth
rate declined to 4% in fiscal year 2020 and is estimated to have contracted by 9.8% in fiscal year 2021 due to the outbreak
of COVID-19 pandemic which led to the imposition of lockdowns the towards the last quarter of fiscal year 2020 and a
major part of the first quarter of fiscal year 2021 causing a contraction in the economy .
Our revenue is generated primarily from the sale of pharmaceutical and non-pharmaceutical wellness products (consisting
mainly of food and personal care products). Consumption of these products has increased as a function of increased
affluence and purchasing power of retail customers in India, which has been positively and materially affecting our
operating results. Consequently, future changes in the Indian economy, especially the purchasing power of consumers, is
expected to directly impact our revenues and results of operations.
Further, India has in the past experienced high rates of inflation. In addition, from time to time, the Government of India
has taken measures to control inflation, which have included tightening monetary policy by raising interest rates, restricting
the availability of credit and inhibiting economic growth.
Inflation, measures to combat inflation and public speculation about possible governmen tal actions to combat inflation
have also contributed significantly to economic uncertainty in India and heightened volatility in the Indian capital markets.
Periods of higher inflation may also slow the growth rate of the Indian economy and increase some of our costs and
expenses. To the extent that the demand for our products decreases or costs and expenses increase, and we are not able to
pass those increases in costs and expenses on to our customers, our operating margins and operating income may be
adversely affected, which could have a material adverse effect on our business, financial condition and results of operations.
54. Political instability or significant changes in the economic liberalization and deregulation policies of the Government,
or in the government of the States where we operate, could disrupt our business.
We are incorporated in India and our assets are located in India. Consequently, our performance and liquidity of the Equity
Shares may be affected by any changes in exchange rates and controls, interest rates, government policies, taxation, social
and ethnic instability and other political and economic developments affecting India.
In recent years, the Indian governments have generally pursued a course of economic liberalization and dereg ulation aimed
at accelerating the pace of economic growth and development. This has included liberalizing rules and limits for foreign
direct investment in a number of important sectors of the Indian economy, including infrastructure, railways, services,
pharmaceuticals and insurance. In addition, the current Indian government has pursued a number of other economic
reforms, including the introduction of a goods and services tax and reduced corporate taxation.
There can be no assurance that the government’s policies will succeed in their aims, including facilitating high rates of
economic growth. There may be change in the existing framework of policies. New or amended policies may be
unsuccessful or have detrimental effects on economic growth. In the past, government corruption scandals and protests
against economic reforms, as well as social and ethnic instability and terrorist incidents have hampered the implementation
of economic reform.
The government policies have impacted sentiments and the economy and the rate of economic liberalization could change,
and specific laws and policies affecting foreign investment, currency exchange rates and other matters affecting investment
in India could change as well. A significant change in India’s economic liberalization and deregulation policies, in
particular, those relating to the businesses in which we operate, could disrupt business and economic conditions in India
generally and our business in particular.

47
55. Changing laws, rules and regulations and legal uncertainties, including adverse application of tax laws, may adversely
affect our business, prospects and results of operations.
The regulatory and policy environment in which we operate is evolving and subject to change. The government of India
(“GoI”) may implement new laws or other regulations and policies that could affect the pharmacy and e -commerce
industry, which could lead to new compliance requirements, including requiring us to obtain approvals and licenses from
the Government and other regulatory bodies, or impose onerous requirements. Any changes to such laws, including the
instances mentioned below, may adversely affect our business, results of operations and prospects, to the extent that we are
unable to suitably respond to and comply with any such changes in applicable law and policy.
For instance, as per the amended IT Act to provide an option to the domestic companies to pay a reduced statutory corporate
income tax of 22%, plus applicable surcharge and cess (as compared to a normal corporate tax of 25% or 30%), provided
such companies do not claim certain specified deduction or exemptions. Further, where a company has opted to pay the
reduced corporate tax rate of 22%, the minimum alternate tax provisions would not be applicable.
Earlier, distribution of dividends by a domestic company was subject to Dividend Distribution Tax (“DDT”), in the hands
of the company at an effective rate of 20.56% (inclusive of applicable surcharge and health and education cess). Such
dividends were generally exempt from tax in the hands of the shareholders. However, GOI has amended the IT Act to
abolish the DDT regime. Accordingly, any dividend distributed by a domestic company is subject to tax in the hands of the
investor at the applicable rate. Additionally, the company is required to withhold tax on su ch dividends distributed at the
applicable rate.
Further, the General Anti-Avoidance Rules (“GAAR”) provisions have been introduced to catch arrangements declared as
“impermissible avoidance arrangements”, which is any arrangement, the main purpose of wh ich is to obtain a tax benefit
and which satisfy at least one of the following tests (i) creates rights or obligations which are not ordinarily created between
persons dealing at arm’s length; (ii) results, directly or indirectly, in misuse, or abuse, of t he provisions of the IT Act; (iii)
lacks commercial substance or is deemed to lack commercial substance, in whole or in part; or (iv) is entered into, or
carried out, by means, or in a manner, which are not ordinarily employed for bona fide purposes. The t ax consequences of
the GAAR provisions being applied to an arrangement could result in denial of tax benefit, amongst other consequences.
As the GAAR provisions are relatively untested, the consequential effects on the Company cannot be determined as of
now. If the GAAR provisions are made applicable to us, they may have an adverse tax impact on the Company.
As such, there is no certainty on the impact that the aforementioned provisions may have on our Company’s business and
operations. Further, our Company cannot predict whether any tax laws or other regulations impacting it will be enacted or
predict the nature and impact of any such laws or regulations or whether, if at all, any laws or regulations would have a
material adverse effect the Company’s business, results of operations and financial condition.
Further, on June 21, 2021, the Department of Consumer Affairs, Ministry of Consumer Affairs, Food & Public Distribution
has proposed amendments to the Consumer Protection (E-Commerce) Rules, 2020 which currently propose restrictions on
related parties to be selling on a group platform and prohibits e-commerce entities to indulge in flash sale, among others.
We are in the process or evaluating this might have on our e-commerce operations. Once notified, this may lead to
additional compliance requirements and imposition of restrictions which may restrict our ability to grow our e-commerce
business in India.
As such, there is no certainty on the impact that the aforementioned provisions may have on our Company’s business and
operations. Further, our Company cannot predict whether any tax laws or other regulations impacting it will be enacted or
predict the nature and impact of any such laws or regulations or whether, if at all, any laws or regulations would have a
material adverse effect the Company’s business, results of operations and financial condition.
56. Investors may not be able to enforce a judgment of a foreign court against our Company.
Our Company is incorporated under the laws of India, and all of our Directors Promoters, Key Management Personnel and
senior management personnel reside in India. All of our assets, and the assets of certain of our Promoters, Directors, Key
Management Personnel and other senior management, are also located in India. As a result, it may not be possible for
investors to effect service of process upon our Company or such persons in jurisdictions outside India, or to enforce against
them judgments obtained in courts outside India.
Recognition and enforcement of foreign judgments is provided for under Section 13 of Civil Code on a statutory basis.
Section 13 of the Civil Code provides that foreign judgments shall be conclusive regarding any matter directly adjudicated
upon, except: (i) where the judgment has not been pronounced by a court of competent jurisdiction; (ii) where the judgment
has not been given on the merits of the case; (iii) where it appears on the face of the proceedings that the judgment is
founded on an incorrect view of international law or a refusal to recognize the law of India in cases to which such law is
applicable; (iv) where the proceedings in which the judgment was obtained were opposed to natural justice; (v) where the
judgment has been obtained by fraud; and (vi) where the judgment sustains a claim founded on a breach of any law then
in force in India. Under the Civil Code, a court in India shall, upon the production of any document purporting to be a

48
certified copy of a foreign judgment, presume that the judgment was pronounced by a court of competent jurisdiction,
unless the contrary appears on record. However, under the Civil Code, such presumption may be displaced by proving that
the court did not have jurisdiction.
India is not a party to any international treaty in relation to the recognition or enforcement of foreign judgments. Section
44A of the Civil Code provides that where a foreign judgment has been rendered by a superior court, within the meaning
of that Section, in any country or territory outside of India which the Central Government has by notification declared to
be in a reciprocating territory, it may be enforced in India by proceedings in execution as if the judgment had been rendered
by the relevant court in India. However, Section 44A of the Civil Code is applicable only to monetary decrees not being of
the same nature as amounts payable in respect of taxes, other charges of a like nature or of a fine or other penalties.
Currently, the United States and India do not currently have a treaty providing for reciprocal recognition and enforcement
of judgments, other than arbitration awards, in civil and commercial matters. Therefore, a final judgment for the payment
of money rendered by any federal or state court in the United States on civil liability, whether or not predicated solely upon
the federal securities laws of the United States, would not be enforceable in India. However, the party in whose favour such
final judgment is rendered may bring a new suit in a competent court in India based on a final judgment that has been
obtained in the United States. The suit must be brought in India wi thin three years from the date of the judgment in the
same manner as any other suit filed to enforce a civil liability in India.
It is unlikely that a court in India would award damages on the same basis as a foreign court if an action was brought in
India. Furthermore, it is unlikely that an Indian court would enforce a foreign judgment if that court were of the view that
the amount of damages awarded was excessive or inconsistent with public policy or Indian practice. It is uncertain as to
whether an Indian court would enforce foreign judgments that would contravene or violate Indian law. However, a party
seeking to enforce a foreign judgment in India is required to obtain approval from the RBI under the Indian Foreign
Exchange Management Act, 1999, to execute such a judgment or to repatriate any amount recovered.
57. The market value of the Equity Shares may fluctuate due to the volatility of the Indian securities markets.
Indian securities markets may not be comparable to, the securities markets in certain countries with more developed
economies and capital markets than India. Indian stock exchanges have, in the past, experienced fluctuations in the prices
of listed securities. Indian stock exchanges may have experienced problems which, if such or similar pro blems were to
continue or recur, could affect the market price and liquidity of the securities of Indian companies, including the Equity
Shares. In addition, the governing bodies of Indian stock exchanges have, from time to time, imposed restrictions on trading
in certain securities, limitations on price movements and margin requirements. Further, from time to time, disputes may
have occurred between listed companies, stock exchanges and other regulatory bodies, which in some cases may have a
negative effect on market sentiment.
58. Financial instability in other countries may cause increased volatility in Indian financial markets.
The Indian market and the Indian economy are influenced by economic and market conditions in other countries,
particularly emerging market countries in Asia. Although economic conditions are different in each country, investors’
reactions to developments in one country can have adverse effects on the securities of companies in other countries,
including India. A loss of investor confidence in the financial systems of other emerging markets may cause increased
volatility in Indian financial markets and, indirectly, in the Indian economy in general. Any worldwide financial instability
could also have a negative impact on the Indian economy. Financial disruptions may occur again and could harm our
business, our future financial performance and the prices of the Equity Shares.
59. Any downgrading of India’s credit rating by an international rating agency could have a negative impact on our
business and the trading price of the Equity Shares.
India’s sovereign rating could be downgraded due to various factors, including changes in tax or fiscal policy or a decline
in India’s foreign exchange reserves, which are outside our Company’s control. As of the date of this Draft Red Herring
Prospectus, India was rated Baa3 (Negative) by Moody’s, BBB- (Negative) by Fitch and BBB- (Stable) by S&P. S&P
stated that its rating reflects the Indian economy’s above-average long-term real GDP growth, sound external profile, and
evolving monetary settings. Going forward, the sovereign ratings outlook will remain dependent on whether the
Government is able to transition the economy out of a low-growth and high inflation environment, as well as exercise
adequate fiscal restraint. However, in the event of a major economic slowdown, S&P had indicated that India may have its
debt downgraded.
Any adverse revisions to India’s credit ratings for domestic and international debt by international rating agencies may
adversely affect our ratings, the rating of the Equity Shares and the terms on which we are able to finance future capital
expenditure or refinance any existing indebtedness. This could have an adverse effect on our capital expenditure plans,
business, cash flows and financial performance, and the trading price of the Equity Shares.

49
60. We may be affected by competition law in India and any adverse application or interpretation of the Competition Act
may in turn adversely affect our business.
The Competition Act, was enacted for the purpose of preventing practices that have or are likely to have an adverse effect
on competition in India and has mandated the Competition Commission of India to prevent such practices. Under the
Competition Act, any arrangement, understanding or action, whether formal or informal, which causes or is likely to cause
an appreciable adverse effect on competition is void and attracts substantial penalties. Further, any agreement among
competitors which, directly or indirectly, involves determination of purchase or sale prices, limits or controls production,
or shares the market by way of geographical area or number of subscribers in the relevant market is presumed to have an
appreciable adverse effect in the relevant market in India and shall be void. The Competition Act also prohibits abuse of a
dominant position by any enterprise. On March 4, 2011, the Indian central government notified and brought into force the
combination regulation (merger control) provisions under the Competition Ac t with effect from June 1, 2011. These
provisions require acquisitions of shares, voting rights, assets or control or mergers or amalgamations that cross the
prescribed asset-and turnover-based thresholds to be mandatorily notified to, and pre-approved by, the CCI. In addition, on
May 11, 2011, the CCI issued the Competition Commission of India (Procedure for Transaction of Business Relating to
Combinations) Regulations, 2011, as amended, which sets out the mechanism for implementation of the merger control
regime in India. The Competition Act aims to, among other things, prohibit all agreements and transactions which may
have an appreciable adverse effect in India. Consequently, all agreements entered into by us could be within the purview
of the Competition Act. Further, the CCI has extra-territorial powers and can investigate any agreements, abusive conduct
or combination occurring outside of India if such agreement, conduct or combination has an appreciable adverse effect in
India. However, the impact of the provisions of the Competition Act on the agreements entered into by us cannot be
predicted with certainty at this stage. We are not currently party to any outstanding proceedings, nor have we received
notice in relation to non-compliance with the Competition Act or the agreements entered into by us. However, if we are
affected, directly or indirectly, by the application or interpretation of any provision of the Competition Act, or any
enforcement proceedings initiated by the CCI, or any adverse publicity that may be generated due to scrutiny or prosecution
by the CCI or if any prohibition or substantial penalties are levied under the Competition Act, it may adversely affect our
business, financial condition, cash flows, results of operations and prospects.
61. Anti-takeover provisions under Indian law could prevent or deter an entity from acquiring us .
The Takeover Regulations contain certain provisions that may delay, deter or prevent a future takeover or change in control.
These provisions may discourage a third party from attempting to take control over our business, even if change in control
would result in the purchase of our Equity Shares at a premium to the market price or would otherwise be beneficial to the
investor.
62. Significant differences exist between Ind AS and other accounting principles, such as Indian GAAP, IFRS and U.S.
GAAP, which may be material to investors’ assessments of our financial condition.
Our financial information presented in this Draft Red Herring Prospectus has been derived from our financial statements
contained elsewhere in this Draft Red Herring Prospectus, which have been prepared under Ind AS. US GAAP and IFRS
differ in significant respects from Ind AS. Accordingly, the degree to which our financial information presented in this
Draft Red Herring Prospectus, as well as our financial statements contained elsewhere in this Draft Red Herring Prospectus,
will provide meaningful information is entirely dependent on the reader’s level of familiarity with generally accepted
accounting principles including Ind AS. Any reliance by persons not familiar with Indian accounting practices on the
financial disclosures presented in this Draft Red Herring Prospectus should accordingly be limited.
63. The occurrence of natural or man-made disasters could adversely affect our results of operations, cash flows and
financial condition. Hostilities, terrorist attacks, civil unrest and other acts of violence could adversely affect the
financial markets and our business.
The occurrence of natural disasters including cyclones, storms, floods, earthquakes, tsunamis, tornadoes, fires, explosions,
pandemic disease, man-made disasters including actual or threatened acts of terrorism or war, geo-political crisis, civil
unrest and military actions, and travel-related accidents or industrial actions, could reduce demand for pharmaceuticals and
wellness products which contribute significantly to our profits, and could adversely affect our results of operations, cash
flows or financial condition. In particular, increased political instability, evidenced by the threat or occurrence of terrorist
attacks, enhanced national security measures, conflicts in several regions in which we operate, strained relations arising
from these conflicts and the related decline in customer confidence may hinder our ability to do business and adversely
affect the Indian securities markets. In addition, any deterioration in international relations, especially between India and
its neighboring countries, may result in investor concern regarding regional stability which could adversely affect the price
of the Equity Shares. In recent years, India has witnessed local civil disturbances and it is possible that future civil unre st
as well as other adverse social, economic or political events in India could have an adverse effect on our business.
These events have had, and may continue to have, an adverse impact on the Indian and the global economy and customer
confidence and sentiments, which could, in turn, lead to a decrease in the demand for p harmaceutical and non-

50
pharmaceutical wellness products and adversely impact our operations and financial results. Such incidents could also
create a greater perception that investment in Indian companies involves a higher degree of risk and could have an a dverse
effect on our business and the market price of the Equity Shares.
Risks relating to the Offer and Investments in Our Equity Shares
64. The Offer Price of the Equity Shares may not be indicative of the market price of the Equity Shares after the Offer.
Prior to the Offer, there has been no public market for the Equity Shares, and an active trading market on the Stock
Exchanges may not develop or be sustained after the Offer. Listing and quotation does not guarantee that a market for the
Equity Shares will develop, or if developed, the liquidity of such market for the Equity Shares. The Offer Price of the
Equity Shares is proposed to be determined through a book-building process in accordance with the SEBI ICDR
Regulations and may not be indicative of the market price of the Equity Shares at the time of commencement of trading of
the Equity Shares or at any time thereafter. The market price of the Equity Shares may be subject to significant fluctuations
in response to, among other factors, variations in our operating results of our Company, market conditions specific to the
industry we operate in, developments relating to India, volatility in securities markets in jurisdictions other than India,
variations in the growth rate of financial indicators, variations in revenue or earnings estimates by research publications,
and changes in economic, legal and other regulatory factors.
65. Fluctuation in the exchange rate between the Indian Rupee and foreign currencies may have an adverse effect on the
value of our Equity Shares, independent of our operating results.
On listing, our Equity Shares will be quoted in Indian Rupees on the Stock Exchanges. Any dividends in respect of our
Equity Shares will also be paid in Indian Rupees and subsequently converted into th e relevant foreign currency for
repatriation, if required. Any adverse movement in currency exchange rates during the time that it takes to undertake such
conversion may reduce the net dividend to foreign investors. In addition, any adverse movement in currency exchange
rates during a delay in repatriating outside India the proceeds from a sale of Equity Shares, for example, because of a delay
in regulatory approvals that may be required for the sale of Equity Shares may reduce the proceeds received by Equity
Shareholders. For example, the exchange rate between the Rupee and the U.S. dollar has fluctuated substantially in recent
years and may continue to fluctuate substantially in the future, which may have an adverse effect on the trading price of
our Equity Shares and returns on our Equity Shares, independent of our operating results.
66. You may not be able to sell, any of the Equity Shares you purchase in the Offer immediately on an Indian stock
exchange.
The Equity Shares will be listed on the Stock Exchanges in India. Pursuant to the applicable Indian laws, certain actions
must be completed before the Equity Shares can be listed and before commencement of the trading in the Equity Shares.
The Allotment of Equity Shares in this Offer and the credit of such Equity Shares to the applicant’s demat account with
depository participant and listing is expected to commence within the period as may be prescribed under applicable law.
There could be a failure or delay in listing of the Equity Shares on the Stock Exchang es. Any failure or delay in obtaining
the approval or otherwise commence trading in the Equity Shares would restrict investors’ ability to dispose of their Equity
Shares. We cannot assure you that the Equity Shares will be credited to investors’ demat acco unts, or that trading in the
Equity Shares will commence, within the prescribed time periods or at all which could restrict your ability to dispose of
the Equity Shares.
67. Holders of Equity Shares may be restricted in their ability to exercise pre-emptive rights under Indian law and thereby
suffer future dilution of their ownership position.
Under the Companies Act, a company having share capital and incorporated in India must offer its equity shareholders pre -
emptive rights to subscribe and pay for a proportionate number of equity shares to maintain their existing ownership
percentages prior to issuance of any new equity shares, unless the pre-emptive rights have been waived by the adoption of
a special resolution by the equity shareholders of such company.
However, if the law of the jurisdiction that you are located in does not permit the exercise of such pre -emptive rights
without our filing an offering document or registration statement with the applicable authority in such jurisdiction, you will
be unable to exercise such pre-emptive rights, unless we make such a filing. If we elect not to file an offering document or
a registration statement, the new securities may be issued to a custodian, who may sell them for your benefit. The value
the custodian receives on the sale of such securities and the related transaction costs cannot be predicted. In addition, to
the extent that you are unable to exercise pre-emptive rights granted in respect of our Equity Shares, your proportional
interests in our Company may be reduced.

51
68. Any future issuance of our Equity Shares may dilute prospective investors’ shareholding, and sales of our Equity Shares
by our major shareholders may adversely affect the trading price of our Equity Shares .
We may be required to finance our growth through future equity offerings. Any future equity issuances by us, including a
primary offering, may lead to the dilution of investors’ shareholdings in us. Upon completion of the Offer, our major
shareholders will continue to own an aggregate of [●]% of our Equity Shares. Any future issuances of Equity Shares
(including under our ESOP Scheme) or the disposal of Equity Shares by our major shareholders or any other change in our
shareholding structure to comply with minimum public shareholding norms appl icable to listed companies in India or the
perception that such issuance or sales may occur, may adversely affect the trading price of the Equity Shares, which may
lead to other adverse consequences including difficulty in raising capital through offering of the Equity Shares or incurring
additional debt. There can be no assurance that we will not issue further Equity Shares or that the shareholders will not
dispose of the Equity Shares (subject to compliance with the lock-in provisions under the SEBI ICDR Regulations) or
pledge or encumber their Equity Shares. Any future issuances could also dilute the value of your investment in the Equity
Shares. Such securities may also be issued at prices below the Offer Price. We may also issue convertible debt securities
to finance our future growth or fund our business activities. In addition, any perception by investors that such issuances or
sales might occur may also affect the market price of the Equity Shares.
69. Shareholders may be subject to Indian taxes arising out of capital gains on the sale of our Equity Shares.
Under current Indian tax laws, unless specifically exempted, capital gains arising from the sale of equity shares is generally
taxable in India. Any gain realized on the sale of listed equity shares on or before March 31, 2018, on a stock exchange
held for more than 12 months will not be subject to long term capital gains tax in India if securities transaction tax, or ST T,
has been paid on the sale transaction and, as stipulated by the Finance Act , 2017, STT had been paid at the time of
acquisition of such equity shares on or before October 1, 2004, except in the case of such acquisitions of such equity shares
which are not subject to STT, as notified by the Central Government under notification no . 43/2017/F. No. 370142/09/2017-
TPL on June 5, 2017. However, the Finance Act, 2018, has now levied taxes on such long -term capital gains arising from
sale of equity shares on or after April 1, 2018. However, where specified conditions are met, such long -term capital gains
are only taxed to the extent they exceed Rs. 100,000 and unrealised capital gains earned up to January 31, 2018 continue
to be exempt. Accordingly, you may be subject to payment of long-term capital gains tax in India, in addition to the payment
of STT, on the sale of Equity Shares held for more than 12 months. STT will be levied on and collected by a domestic stock
exchange on which our Equity Shares are sold.
Further, any gain realized on the sale of our Equity Shares held for a period o f 12 months or less will be subject to short
term capital gains tax in India. Capital gains arising from the sale of the Equity Shares will be exempt from taxation in
India in cases where the exemption from taxation in India is provided under a treaty between India and the country of
which the seller is a resident. Generally, Indian tax treaties do not limit India’s ability to impose tax on capital gains. As a
result, residents of other countries may be liable for tax in India as well as in their own jurisd iction on a gain upon the sale
of Equity Shares.
The Finance Act, 2019 has also clarified that, in the absence of a specific provision under an agreement, the liability to pa y
stamp duty in case of sale of securities through stock exchanges will be on the buyer, while in other cases of transfer for
consideration through a depository, the onus will be on the transferor. The stamp duty for transfer of securities other than
debentures, on a delivery basis is specified at 0.015% and on a non-delivery basis is specified at 0.003% of the consideration
amount.
Further, the Government of India has announced the union budget for the fiscal 2022, pursuant to which the Finance Bill
has introduced various amendments. The Finance Bill has received assent from the President of India on March 28, 2021
and has been enacted as the Finance Act. We have not fully determined the impact of these recent and proposed laws and
regulations on our business. We cannot predict whether any amendments made pursuant to the Finance Act would have an
adverse effect on our business, financial condition and results of operations. Unfavourable changes in or interpretations of
existing, or the promulgation of new, laws, rules and regulations including foreign investment and stamp duty laws
governing our business and operations could result in us being deemed to be in contravention of such laws and may require
us to apply for additional approvals.
Generally, Indian tax treaties do not limit India’s ability to impose tax on capital gains. As a result, residents of other
countries may be liable for tax in India as well as in their own jurisdictions on gains arising from a sale of the shares sub ject
to relief that may be available under the applicable tax treaty or under the laws of their own jurisdiction.
70. Our ability to raise foreign capital may be constrained by Indian law, including in relation to the Offer.
As an Indian company, we are subject to exchange controls that regulate borrowing in foreign currencies, including those
specified under FEMA and the rules and regulations prescribed thereunder. Such regulatory restrictions limit our financing
sources for our projects under development and hence could constrain our ability to obtain financing on competitive terms
and refinance existing indebtedness. In addition, we cannot assure you that any required regulatory approvals for borrowing
52
in foreign currencies will be granted to us without onerous conditions, or at all. Further, limitations on foreign debt may
have an adverse effect on our business, results of operations, cash flows and financial condition. Foreign investors are
subject to foreign investment restrictions under Indian laws that may limit our ability to attract foreign investors, which
may have an adverse effect on the market price of the Equity Shares.
Our Company operates a large omni-channel, hyperlocal retail network and operates in the multi -brand retail trading sector.
While, in terms of the FEMA Non-debt Instruments Rules and the FDI Policy, FDI up to 51% is permitted in the multi
brand retail trading sector, we require the prior approval of the Government to receive such FDI and are also required to
meet certain conditionalities set out in the FEMA Non-debt Instruments Rules and the FDI Policy. Furthermore, our
Subsidiary, Wellness Forever HealthTech Private Limited, operates our website and e-commerce business, a sector in which
foreign investment is subject to sectoral conditionalities. Presently, our Company is owned (with shareholding of non -
residents being less than 50%) and controlled by resident Indian citizens, and accordingly any foreign investment in our
Company is not considered to be ‘indirect’ or ‘downstream’ foreign investment in our Subsidiaries. However, since certain
of our Subsidiaries undertake businesses that are under the Approval Route or where FDI is not permitted, the total foreign
investment in our Company cannot equate to 50% or more of our Company’s share capital, and non -residents cannot be
deemed to own or control our Company. This may restrict our ability to raise capital in the future or in the ability of foreign
investors to purchase Equity Shares, including in the Offer.
In accordance with the FEMA Non-debt Instruments Rules, participation by non-residents in the Offer is restricted to
participation by (i) FPIs under Schedule II of the FEMA Non-debt Instruments Rules, in the Offer subject to limit of the
individual holding of an FPI below 10% of the post-Offer paid-up capital of our Company and the aggregate limit for FPI
investment currently not exceeding 49.9%; and (ii) Eligible NRIs only on non-repatriation basis under Schedule IV of the
FEMA Non-debt Instruments Rules. Further, other non-residents such as FVCIs and multilateral and bilateral development
financial institutions are not permitted to participate in the Offer. As per the existing policy of the Government, OCBs
cannot participate in this Offer. For more information on bids by FPIs and Eligible NRIs, see “ Restrictions on Foreign
Ownership of Indian Securities” on page 354.
Under the foreign exchange regulations currently in force in India, transfers of shares between non -residents and residents
are freely permitted (subject to certain exceptions) if they comply with the pricing guidelines and reporting requirements
specified by the RBI. If the transfer of shares is not in compliance with such pricing guidelines or reporting requirements
or falls under any of the exceptions referred to above, then the prior approval of the RBI will be required. In addition,
shareholders who seek to convert the Indian rupee proceeds from a sale of shares in India into foreign currency and
repatriate that foreign currency from India will require a no objection or a tax clearance certificate from the income tax
authority. The Government may also impose foreign exchange restrictions in certain emergency situations, including
situations where there are sudden fluctuations in interest rates or exchange rates, where the Government experiences
extreme difficulty in stabilizing the balance of payments or where there are substantial disturbances in the financial and
capital markets in India. These restrictions may require foreign investors to obtain the Government’s approval before
acquiring Indian securities or repatriating the interest or dividends from those securi ties or the proceeds from the sale of
those securities. We cannot assure investors that any required approval from the RBI or any other Government agency can
be obtained on any particular terms or at all.
71. The requirements of being a publicly listed company may strain our resources.
We are not a publicly listed company and have not, historically, been subjected to the increased scrutiny of our affairs by
shareholders, regulators and the public at large that is associated with being a listed company. As a listed company, we will
incur significant legal, accounting, corporate governance and other expenses that we did not incur as an unlisted company.
We will be subject to the Listing Regulations which will require us to file audited annual and unaudited quarterly reports
with respect to our business and financial condition. If we experience any delays, we may fail to satisfy our reporting
obligations and/or we may not be able to readily determine and accordingly report any changes in our results of operations
as promptly as other listed companies.
Further, as a publicly listed company, we will need to maintain and improve the effectiveness of our disclosure controls
and procedures and internal control over financial reporting, including keeping adequate records of daily transactions. In
order to maintain and improve the effectiveness of our disclosure controls and procedures and internal control over financial
reporting, significant resources and management attention will be required. As a result, our management’s attention may
be diverted from our business concerns, which may adversely affect our business, prospects, financial condition and results
of operations. In addition, we may need to hire additional legal and accounting staff with appropriate experience and
technical accounting knowledge, but we cannot assure you that we will be able to do so in a timely and efficient manner.
72. Rights of shareholders under Indian laws may be more limited than under the laws of other jurisdictions.
Indian legal principles related to corporate procedures, directors’ fiduciary duties and liabilities, and shareholders’ rights
may differ from those that would apply to a company in another jurisdiction. Shareholders’ rights including in relation to
class actions, under Indian law may not be as extensive as shareholders’ rights under the laws of other countries or

53
jurisdictions. Investors may have more difficulty in asserting their rights as shareholder in an Indian company than as
shareholder of a corporation in another jurisdiction.
73. QIBs and Non-Institutional Investors are not permitted to withdraw or lower their bids (in terms of quantity of Equity
Shares or the bid amount) at any stage after submitting a bid, and Retail Individual Investors are not permitted to
withdraw their bids after Bid/Offer Closing Date.
Pursuant to the SEBI ICDR Regulations, QIBs and Non-Institutional Investors are required to block the bid amount on
submission of the bid and are not permitted to withdraw or lower their bids (in terms of quantity of equity shares or the bid
amount) at any stage after submitting a bid. Similarly, Retail Individual Investors can revise or withdraw their bids at any
time during the bid/offer period and until the bid/offer closing date, but not thereafter. The refore, QIBs and Non-
Institutional Investors will not be able to withdraw or lower their bids following adverse developments in international or
national monetary policy, financial, political or economic conditions, our business, results of operations, cas h flows or
otherwise at any stage after the submission of their bids.
74. We will not receive any proceeds from the Offer for Sale. The Selling Shareholders will receive the net proceeds from
the Offer for Sale.
The Offer consists of an Offer for Sale. The Selling Shareholders shall be entitled to the net proceeds from the Offer for
Sale, which comprise proceeds from the Offer for Sale net of Offer expenses shared by the Selling Shareholders, and our
Company will not receive any proceeds from the Offer for Sale.
75. Our Equity Shares have never been publicly traded and may experience price and volume fluctuations following the
completion of the Offer, an active trading market for the Equity Shares may not develop, the price of our Equity Shares
may be volatile, and you may be unable to resell your Equity Shares at or above the Offer Price or at all.
Prior to the Offer, there has been no public market for our Equity Shares, and an active trading market may not develop or
be sustained after the Offer. Listing and quotation does not guarantee that a market for our Equity Shares will develop or,
if developed, the liquidity of such market for the Equity Shares. The Offer Price of the Equity Shares is proposed to be
determined through a book building process. This price wil l be based on numerous factors, a s described in “Basis for Offer
Price” on page 100. This price may not necessarily be indicative of the market price of our Equity Shares after the Offer is
completed. You may not be able to re-sell your Equity Shares at or above the Offer price and may as a result lose all or part
of your investment.
Our Equity Shares are expected to trade on the Stock Exchanges after the Offer, but we cannot assure you that active trading
in our Equity Shares will develop after the Offer, or if such trading develops, that it will continue. Investors may not be
able to sell our Equity Shares at the quoted price if there is no active trading in our Equity Shares. There has been signifi cant
volatility in the Indian stock markets in the recent past, and the trading price of our Equity Shares after this Offer could
fluctuate significantly as a result of market volatility or due to various internal or external risks, including but not limi ted
to those described in this Draft Red Herring Prospectus. The market price of our Equity Shares may be influenced by many
factors, some of which are beyond our control, including:
• developments with respect to the spread or worsening of the COVID-19 pandemic;
• the effect of COVID-19 on our business operations and our ability to be able to service customers, and the
consequential effect on our operating results;
• actual or anticipated fluctuations in our operating results;
• announcements about our earnings that are not in line with analyst expectations;
• the public’s reaction to our press releases, other public announcements and filings with the regulator;
• significant liability claims, complaints from our customers, shortages or interruptions in the availability of vehicles,
or reports of incidents of tampering of vehicles;
• changes in senior management or key personnel;
• macroeconomic conditions in India;
• fluctuations of exchange rates, the imposition of currency controls and restrictions on the right to convert or repatriate
currency or export assets;
• the operating and stock price performance of comparable companies;

54
• changes in our shareholder base;
• changes in our dividend policy;
• issuances, exchanges or sales, or expected issuances, exchanges or sales;
• changes in accounting standards, policies, guidance, interpretations or principles; and
• changes in the regulatory and legal environment in which we operate.
Any of these factors may result in large and sudden changes in the volume and trading price of the Equity Shares. In t he
past, following periods of volatility in the market price of a company’s securities, shareholders have often instituted
securities class action litigation against that company. If we were to be involved in a class action suit, it could divert th e
attention of management, and, if adversely determined, have a material adverse effect on our business, results of
operations, cash flows and financial condition.

55
SECTION III: INTRODUCTION
THE OFFER
The following table summarizes the Offer details:
Offer of Equity Shares(1)(2)(3) Up to [●] Equity Shares, aggregating up to ₹ [●]
The Offer consists of:
Fresh Issue(1) Up to [●] Equity Shares aggregating up to ₹ 4,000.00 million
Offer for Sale(2) Up to 16,044,709 Equity Shares aggregating up to ₹ [●]
Of which:
QIB Portion(4) Not less than [●] Equity Shares
which consists of:
- Anchor Investor Portion Up to [●] Equity Shares
- Net QIB Portion (assuming the Anchor Investor Portion is fully
subscribed)
[●] Equity Shares
of which:
- Mutual Fund Portion [●] Equity Shares
- Balance for all QIBs including Mutual Funds [●] Equity Shares
Non-Institutional Portion Not more than [●] Equity Shares
Retail Portion Not more than [●] Equity Shares
Pre-Offer and post-Offer Equity Shares
Equity Shares outstanding prior to the Offer (as on the date of this
Draft Red Herring Prospectus)
50,755,716 Equity Shares
Equity Shares outstanding after the Offer [●] Equity Shares
Use of Net Proceeds See “Objects of the Offer” beginning on page 91 for information about the use of the proceeds from the Fresh Issue. Our Company
will not receive any proceeds from the Offer for Sale.
(1) The Fresh Issue has been authorised by our Board of Directors and our Shareholders pursuant to the resolutions passed at th eir meetings dated July 29,
2021 and August 31, 2021, respectively. Further, our Board has taken on record the approval for the Offer for Sale by the Selling Shareholders pursuant
to its resolution dated September 29, 2021.
(2) Each of the Selling Shareholders severally and not jointly, have specifically confirmed that the Equity Shares being offered by such Selling Shareholder have been held for a period of at least one year immediately preceding the date of filing this Draft Red Herring Prospectus with the SEBI, and are otherwise eligible for being offered for sale pursuant to the Offer in terms of the SEBI ICDR Regulations. Each of the Selling Shareholders, severally and not jointly, confirms that it has authorised and consented to participate in the Offer for Sale, and to offer such number of Equity Shares as may
cumulatively aggregate up to ₹ [●] million, as part of the Offer for Sale in the manner set out below:
(₹ in million)
Sr. No.
Selling Shareholder Aggregate amount of Offer for Sale (₹)
Number of Equity Shares offered in the
Offer for Sale
Date of board resolution Date of consent letter
1. Ashraf Mohammed Biran Up to [●] million Up to 720,000 Equity
Shares
- September 29, 2021
2. Gulshan Haresh Bakhtiani Up to [●] million Up to 720,000 Equity Shares
- September 29, 2021
3. Mohan Ganpat Chavan Up to [●] million Up to 120,000 Equity
Shares
- September 29, 2021
4. Persons listed in Annexure A* Up to [●] million Up to 14,484,709
Equity Shares
See Annexure A on
page 370
See Annexure A on
page 370
*For details in relation to the Other Selling Shareholders, see “Annexure A” on page 370.
(3) Our Company in consultation with the Book Running Lead Managers, may allocate up to 60% of the QIB Portion to Anchor Investors on a discretionary basis. One-third of the Anchor Investor Portion shall be reserved for domestic Mutual Funds, subject to valid Bids being received from d omestic Mutual Funds at or above the Anchor Investor Allocation Price. In the event of under-subscription in the Anchor Investor Portion, the remaining Equity Shares shall be added to the Net QIB Portion. Further, 5% of the Net QIB Portion shall be available for allocation on a proportionate basis to Mutual Funds
only, and the remainder of the QIB Portion shall be available for allocation on a proportionate basis to all QIB Bidders (other than Anchor Investors), including Mutual Funds, subject to valid Bids being received at or above the Offer Price. However, if the aggregate demand from Mutual Funds is less than 5% of the Net QIB Portion, the balance Equity Shares available for allotment in the Mutual Fund Portion will be added to the Net QIB Portion and
allocated proportionately to the QIB Bidders (other than Anchor Investors) in proportion to their Bids. For details, see “Offer Procedure” beginning on page 338.
(4) Subject to valid Bids being received at or above the Offer Price, under-subscription, if any, in the Non-Institutional Portion or the Retail Portion, would be allowed to be met with spill over from any other category or combination of categories of Bidders at the discretion of our Company in consultation with the Book Running Lead Managers and the Designated Stock Exchange. Under-subscription, if any, in the QIB Portion would not be allowed to be
met with spill-over from other categories or a combination of categories. Under subscription, if any, in any category except the QIB Portion, would be allowed to be met with spill-over from any other category or combination of categories at the discretion of the Company, the Book Running Lead Managers and the Designated Stock Exchange. In the event of under-subscription in the Offer, subject to receiving minimum subscription for 90% of the Fresh Issue and compliance with Rule 19(2)(b) of the Securities Contracts (Regulation) Rules, 1957, the Allotment for the valid Bids will be made in the
first instance towards subscription for 90% of the Fresh Issue. For further details, see “Offer Structure” beginning on page 336.

56
Allocation to Bidders in all categories except the Anchor Investor Portion and the Reta il Portion, shall be made on a
proportionate basis subject to valid Bids received at or above the Offer Price. The allocation to each RIB shall not be less than
the minimum Bid Lot, subject to availability of Equity Shares in the Retail Portion, and the remaining available Equity Shares,
if any, shall be allocated on a proportional basis. Allocation to Anchor Investors shall be done on a discretionary basis in
accordance with the SEBI ICDR Regulations. For further details, see “Offer Procedure” beginning on page 338.
For details of the terms of the Offer, see “Terms of the Offer”, beginning on page 331.

57
SUMMARY OF FINANCIAL INFORMATION
The summary financial information presented below should be read in conjunction with “ Financial Information” and
“Management’s Discussion and Analysis of Financial Condition and Results of Operations” beginning on pages 204 and 294,
respectively.
(The remainder of this page is intentionally left blank)

58
RESTATED CONSOLIDATED STATEMENT OF ASSETS AND LIABILITIES
(₹ in millions, except for share data and if otherwise stated)
Particulars As at March 31,
2021 As at March 31,
2020
As at March 31, 2019
(Proforma)
ASSETS
Non-current assets
(a) Property, plant and equipment 791.04 625.00 520.99 (b) Right-of-use assets 1,773.14 1,741.77 1,455.98 (c) Capital work in progress 5.29 - - (d) Intangible assets 83.61 60.05 46.43 (e) Financial assets
(i) Investments - - - (ii) Loans 244.83 192.38 159.22 (iii) Other financial assets 93.03 10.11 9.55 (f) Non-current tax assets (net) 15.74 6.62 6.51 (g) Deferred tax assets (net) 172.40 62.03 68.83 (h) Other non-current assets 33.17 47.22 -
Total non – current assets 3,212.25 2,745.18 2,267.51
Current assets
(a) Inventories 1,554.69 1,299.71 1,063.88 (b) Financial assets
(i) Investments 80.09 - - (ii) Trade receivables 285.96 232.23 210.28 (iii) Cash and cash equivalents 170.11 162.43 59.42 (iv) Bank balances other than (iii) above 467.55 56.70 53.16 (v) Loans 74.18 115.01 79.64 (vi) Other financial assets 62.33 40.78 23.70 (c) Right-to-returned-goods asset 3.88 2.72 2.19 (d) Other current assets 176.51 111.21 63.25
Total current assets 2,875.30 2,020.79 1,555.52
Total assets 6,087.55 4,765.97 3,823.03
EQUITY AND LIABILITIES
Equity
(a) Equity share capital 63.37 61.69 57.08 (b) Instruments entirely equity in nature 21.22 15.55 15.55 (c) Other equity 2,582.31 1,609.98 1,038.18
Total equity 2,666.90 1,687.22 1,110.81
Liabilities
Non-current liabilities
(a) Financial liabilities
(i) Borrowings 327.25 159.10 131.66 (ii) Lease liabilities 1,105.53 1,110.35 973.56 (iii) Other financial liabilities 1.91 1.91 - (b) Provisions 29.80 18.51 7.16
Total non – current liabilities 1,464.49 1,289.87 1,112.38
Current liabilities
(a) Financial Liabilities
(i) Borrowings 604.99 607.70 646.98 (ii) Trade payables
- Total outstanding dues of small enterprises and micro enterprises
25.82 28.54 23.43
- Total outstanding dues of creditors other than small
enterprises and micro enterprises 407.77 365.91 313.32
(iii) Lease liabilities 750.77 659.45 523.80 (iv) Other financial liabilities 109.82 77.36 41.90 (b) Other current liabilities 35.81 35.60 30.91 (c) Provisions 21.18 14.06 13.70 (d) Current tax liabilities (net) - 0.26 5.80
Total current liabilities 1,956.16 1,788.88 1,599.84
Total equity and liabilities 6,087.55 4,765.97 3,823.03

59
RESTATED CONSOLIDATED STATEMENT OF PROFIT AND LOSS
(₹ in millions, except for share data and if otherwise stated)
Particulars For the year ended March 31,
2021
For the year ended March 31,
2020
For the year ended March 31,
2019
I Revenue from operations 9,240.21 8,632.51 6,769.80
II Other Income 173.38 38.48 39.64
III Total Income (I + II) 9,413.59 8,670.99 6,809.44
IV EXPENSES
(a) Purchases of Stock-in-trade 6,978.84 6,407.67 4,998.75
(b) Changes in inventories of stock-in-trade (254.98) (235.83) (157.62)
(c) Employee benefit expense 1,085.47 985.10 764.64
(d) Finance costs 301.69 275.19 245.93
(e) Depreciation and amortisation expense 969.90 675.86 518.15
(f) Other expenses 789.34 604.61 469.53
Total Expenses (IV) 9,870.26 8,712.60 6,839.38
V Loss Before Tax (III – IV) (456.67) (41.61) (29.94)
VI Tax Expense
(1) Current tax - 42.47 39.70
(2) Deferred tax (109.67) (30.87) (56.30)
(3) Short Provision for tax relating earlier years 1.47 - -
Total Tax Expense (VI) (108.20) 11.60 (16.60)
VII Loss for the year (V -VI) (348.47) (53.21) (13.33)
VII
I
Other Comprehensive Income
A Items that will not be reclassified to profit or loss
(a) Remeasurements of the defined benefit liabilities
/ (asset)
(2.63) 0.43 (3.73)
(b) Income tax on above 0.70 (0.07) 1.30
Total Other Comprehensive Income for the year (1.93) 0.36 (2.42)
IX Total Comprehensive Income for the year (VII+VIII) (350.40) (52.84) (15.75)
X Earnings per equity share - (Face Value Rs. 2/- per
share)
(1) Basic (Rs.) (7.11) (1.16) (0.31)
(2) Diluted (Rs.) (7.11) (1.16) (0.31)

60
RESTATED CONSOLIDATED STATEMENT OF CASH FLOWS
(₹ in millions, except for share data and if otherwise stated)
Particulars For year ended
March 31, 2021
For year ended
March 31, 2020
For the year ended March 31, 2019
(Proforma)
Cash flows from operating activities
Loss before tax (456.67) (41.61) (29.94)
Adjustments for:
Finance costs recognised in Statement of Profit or Loss 301.69 275.19 245.93
Interest income recognised in Statement of Profit or Loss (53.07) (30.28) (22.81)
Loss on disposal / discard of property, plant and equipment (net) 10.80 6.70 18.82
Fair value gain on investments (0.09) - -
Depreciation and amortisation expenses 969.90 675.86 518.15
Expense recognised in respect of equity-settled share-based
payments 41.31 29.57 4.51
Sundry balances written back (64.26) (0.03) (0.00)
Sundry balances written off 61.44 8.46 3.23
Lease rent concessions (41.26) (5.64) (1.92)
Provision for expected credit loss 4.86 1.50 1.77
Provision for doubtful deposits 19.15 - -
Provision for doubtful balances 9.27 - -
Rental income (1.92) (1.05) (1.01)
Income from Redemption of Mutual Fund (2.00) - -
Operating profit before working capital changes 799.15 918.67 736.73 Adjustments for:
(Increase)/Decrease in Operating Assets:
Trade Receivables (58.59) (23.45) (14.90)
Inventories (254.98) (235.83) (157.66)
Other Financial Assets [Non-Current and Current] (176.29) (127.07) (46.67)
Other Assets [Non-Current and Current] (127.89) (56.95) 13.27
Increase/(Decrease) in Operating Liabilities:
Trade Payables 94.12 45.46 (29.38)
Provisions [Non-Current and Current] 15.79 12.14 15.03
Other Financial Liabilities [Non-Current and Current] 1.39 1.91 0.03
Other Current Liabilities 0.20 4.70 13.88
Changes in Working Capital (506.25) (379.08) (206.40)
Cash generated from operations 292.91 539.58 530.33
Income taxes paid (Net of Refund) (10.85) (48.12) (60.13)
Net cash generated by operating activities 282.06 491.47 470.20 Cash flows from investing activities
Payments to acquire financial assets (742.85) (3.55) (53.16)
Proceeds on sale of financial assets 254.01 - -
Interest received 23.51 23.96 4.01
Payments for property, plant and equipment and intangible assets (512.06) (287.73) (222.97)
Proceeds from disposal of property, plant and equipment 4.92 2.16 2.95
Rent received 1.92 1.04 1.01
Net cash used in investing activities (970.55) (264.10) (268.16) Cash flows from financing activities
Proceeds from issue of equity instruments 1,286.93 543.57 -
Proceeds from issue of Instruments entirely equity in nature 5.67 - -
Proceeds from long term borrowings 261.10 540.00 556.68
Repayment of long term borrowings (64.73) (484.81) (484.82)
Repayment of short term borrowings (net) (6.16) (39.29) 237.45
Payment of lease liabilities (695.88) (595.83) (461.80)
Dividends paid (3.84) (3.52) (0.85)
Interest paid (86.92) (84.47) (76.83)
Net cash (used in) / generated by financing activities 696.17 (124.35) (230.17) Net increase/(decrease) in cash and cash equivalents 7.68 103.01 (28.13)
Cash and cash equivalents at the beginning of the year 162.43 59.42 87.55
Cash and cash equivalents at the end of the year 170.11 162.43 59.42
61
GENERAL INFORMATION
Registered and Corporate Office of our Company
Wellness Forever Medicare Limited
7th Floor, Wing A,
Empire Plaza, IT Park,
LBS Marg, Vikhroli (West),
Mumbai 400 083
Maharashtra, India
Corporate Identity Number: U24239MH2008PLC178658
Registration Number: 178658
Website: www.wellnessforever.com
Address of the RoC
Our Company is registered with the RoC situated at the following address:
Registrar of Companies, Maharashtra at Mumbai
100, Everest,
Marine Drive,
Mumbai 400 002
Maharashtra, India
Board of Directors
As on the date of this Draft Red Herring Prospectus, our Board of Directors of the Comp any comprises the following:
Name Designation DIN Address
Ashraf Mohammed Biran Whole-Time Director 01716606 1801/1802, Rizvi Heights, L.J. Road, Mahim West, near
Paradise Cinema, Mumbai 400 016
Gulshan Haresh Bakhtiani Whole-Time Director 00172374 133A, Kalpataru Residency, 107 Kamani Marg, opposite
Cinemax, Sion East, Mumbai 400 022
Mohan Ganpat Chavan Whole-Time Director 00249979 4604, 46th Floor, Tower 5, Crescent Bay, Jerbai Wadia
Road, Bhoiwada, Parel, near Mahatma Phule Education
Society, Mumbai 400 012
Avani Vishal Davda Independent Director 07504739 82/B, 8th Floor, Heera Panna Building, Bhulabhai Desai
Road, Haji Ali, Mumbai 400 026
Ranjit Gobindram Shahani Independent Director 00103845 Flat No. 56, Hill Park, A.G. Road, opposite Malabar
Telephone Exchange, Malabar Hill, Mumbai 400 006
Kewal Handa Independent Director 00056826 Nair House, 9th Floor, 14th B Road, behind Mahavir
Hospital, Khar West, Mumbai 400 052
For further details of our Directors, see “Our Management” beginning on page 181.
Company Secretary & Compliance Officer
Nidhi Vora
7th Floor, Empire Plaza 1
IT Park, LBS Marg
Vikhroli (West)
Mumbai 400 083
Tel: +91 22 4354 1722
E-mail: [email protected]
Book Running Lead Managers
IIFL Securities Limited
10th Floor, IIFL Centre, Kamala City
Senapati Bapat Marg, Lower Parel (West)
Mumbai 400 013
Maharashtra, India
Tel: +91 22 4646 4600
E-mail: [email protected]
Website: www.iiflcap.com
Ambit Private Limited
Ambit House,
449, Senapati Bapat Marg, Lower Parel,
Mumbai 400 013
Maharashtra, India
Tel: +91 22 6623 3000
E-mail: [email protected]
Website: www.ambit.com

62
Investor grievance E-mail: [email protected]
Contact person: Mukesh Garg/Nishita Mody
Investor Grievance ID: [email protected]
Contact person: Nikhil Bhiwapurkar/Miraj Sampat
DAM Capital Advisors Limited
(Formerly IDFC Securities Limited)
One BKC, Tower C, 15 th Floor,
Unit No. 1511, Bandra Kurla Complex,
Bandra (East) Mumbai – 400 051
Maharashtra, India
Tel: +91 22 4202 2500
E-mail: [email protected]
Website: www.damcapital.in
Investor Grievance ID: [email protected]
Contact person: Gunjan Jain
HDFC Bank Limited
Investment Banking Group
Unit No. 401 & 402, 4th Floor,
Tower B, Peninsula Business Park,
Lower Parel, Mumbai 400 013
Maharashtra, India
Tel: +91 22 3395 8233
E-mail: [email protected]
Website: www.hdfcbank.com
Investor Grievance ID: [email protected]
Contact Person: Harsh Thakkar / Ravi Sharma
Legal Counsel to our Company as to Indian law
Cyril Amarchand Mangaldas
Peninsula Chambers
Peninsula Corporate Park, Ganpatrao Kadam Marg
Lower Parel, Mumbai 400 013
Maharashtra, India
Tel: +91 22 2496 4455
Legal Counsel to the Book Running Lead Managers as to Indian law
IndusLaw
#107, 1st Floor, Mistry Mansion,
M.G. Road, Fort,
Mumbai - 400001,
Maharashtra, India
Tel: +91 22 40074400
International Legal Counsel to the Book Running Lead Managers
Linklaters Singapore Pte. Ltd.
One George Street
#17-01, Singapore 049 145
Tel: +65 6692 5700
Registrar to the Offer
Link Intime India Private Limited
C 101, 247 Park
1st Floor, L.B.S. Marg, Vikhroli (West)
Mumbai 400 083
Maharashtra, India
Tel: +91 22 4918 6200
Fax: +91 22 4918 6195
E-mail: [email protected]
Investor Grievance E-mail: [email protected]
Website: www.linkintime.co.in
Contact Person: Shanti Gopalkrishnan
SEBI Registration Number: INR000004058
Statutory Auditor to our Company
Deloitte Haskins & Sells LLP
Chartered Accountants
One International Centre,
Tower 3, Elphinstone Mill Compound,
Senapati Bapat Marg,
Elphinstone Road (West),
Mumbai, Maharashtra 400013
Tel: +91 22 6185 4000
Email: [email protected]

63
Peer Review Certificate Number: 013179
Firm Registration Number: 117366W/W100018
Bankers to the Offer
Escrow Collection Bank(s)
[●]
Refund Bank(s)
[●]
Public Offer Bank(s)
[●]
Sponsor Bank
[●]
Bankers to our Company
Yes Bank Limited
Yes Bank House, 6 th Floor,
#6094, South Wing, Santacruz (E),
Mumbai 400 055
Tel: +91 22 6507 7323
E-mail: [email protected]
Website: www.yesbank.in
Contact person: Rahul Lala
IDFC FIRST Bank Limited
KRM tower, 7th Floor,
No. 1 Harrington Road, Chetpet,
Chennai 600 031
Tel: +91 44 4564 4000
E-mail: [email protected]
Website: www.idfcfirstbank.com
Contact person: Satish Gaikwad
HDFC Bank Limited
4th Floor, Tower B, Peninsula Business Park,
Senapati Bapat Marg, Lower Parel (W)
Mumbai 400 013
Tel: +91 22 3395 8093
E-mail: [email protected]
Website: www.hadfcbank.com
Contact person: Prateek Gattani
Axis Bank Limited
Corporate Banking Branch Mumbai,
12 A Mittal Tower, 1st Floor, Nariman Point
Mumbai 400 021
Tel: +91 22 2289 5115/5226
E-mail: [email protected]/
Website: www.axisbank.com
Contact person: Deepak Modani/Gaurav Lohiya
Syndicate Members
[●]
IPO Grading
No credit agency registered with SEBI has been appointed in respect of obtaining grading for the Offer.
Monitoring Agency
Our Company will appoint a monitoring agency for monitoring the utilisation of the Net Proceeds prior to the filing of the Red
Herring Prospectus in accordance with Regulation 41 of SEBI ICDR Regulations. For details in relation to the proposed
utilisation of the Net Proceeds, see “Objects of the Offer” on page 91.
Appraising Entity
None of the objects for which the Net Proceeds will be utilised have been appraised by any agency.
Credit Rating
As this is an Offer of Equity Shares, there is no credit rating required for the Offer.
Debenture Trustee
As this is an offer of Equity Shares, the appointment of a debenture trustee is not required.
Green Shoe Option

64
No green shoe option is contemplated under the Offer.
Changes in auditors
Except as disclosed below, there have been no changes to our statutory auditors in the last three years:
Particulars Date of change Reason for change
RCS & Associates
Chartered Accountants
1307, Mayuresh Cosmos Towers
Sarovar Vihar Road Sector – 11, CBD Belapur,
Navi Mumbai 400 614
Email: [email protected]
Firm Registration Number: 124285W
September 27, 2019 Cessation due to completion of term as
statutory auditor of our Company
S Dayma & Co. Chartered Accountants
602, Prestige Industrial Estate Co-op Premises Society
Ltd.
Bawdi Cross Lane, Malad West
Mumbai 400 064 Email: [email protected]
Firm Registration Number: 129986W
September 27, 2019 Appointment as statutory auditor of our Company
S Dayma & Co.
Chartered Accountants
602, Prestige Industrial Estate Co-op Premises Society
Ltd.
Bawdi Cross Lane, Malad West Mumbai 400 064
Email: [email protected]
Firm Registration Number: 129986W
June 1, 2021 Resignation as statutory auditor of our
Company
Deloitte Haskins & Sells LLP
Chartered Accountants
One International Centre,
Tower 3, Elphinstone Mill Compound, Senapati Bapat Marg,
Elphinstone Road (West),
Mumbai, Maharashtra 400013
Tel: +91 22 6185 4000
Email: [email protected]
Firm Registration Number: 117366W/W100018
June 4, 2021 Appointment as statutory auditors of the
Company
Designated Intermediaries
Self Certified Syndicate Banks
The banks registered with SEBI, which offer the facility of ASBA services in relation to ASBA, where the Bid Amount will be
blocked by authorising an SCSB, a list of which is available on the website of SEBI at
https://www.sebi.gov.in/sebiweb/other/OtherAction.do?doRecognised=yes and updated from time to time and at such other
websites as may be prescribed by SEBI from time to time.
A list of the Designated SCSB Branches with which an ASBA Bidder (other than a RIB using the UPI Mechanism), not Bidding
through Syndicate / Sub Syndicate or through a Registered Broker, RTA or CDP may submit the ASBA Forms, is av ailable at
https://www.sebi.gov.in/sebiweb/other/OtherAction.do?doRecognisedFpi=yes&intmId=34 , and at such other websites as may
be prescribed by SEBI from time to time.
Further, the branches of the SCSBs where the Designated Intermediaries could submit the ASBA Form(s) of Bidders (other
than RIBs) is provided on the website of SEBI at
https://www.sebi.gov.in/sebiweb/other/OtherAction.do?doRecognisedFpi=yes&intmId=35 which may be updated from time to
time or at such other website as may be prescribed by SEBI from time to time.
Details of noda l officers of SCSBs, identified for Bids made through the UPI Mechanism, are available at www.sebi.gov.in.
Self-Certified Syndicate Banks eligible as Issuer Banks for UPI
The list of SCSBs through which Bids can be submitted by RIBs using the UPI Mechanism , including details such as the eligib le

65
Mobile Apps and UPI handle which can be used for such Bids, is available on the website of the SEBI at
https://www.sebi.gov.in/sebiweb/other/OtherAction.do?doRecognisedFpi=yes&intmId=40 and
https://www.sebi.gov.in/sebiweb/other/OtherAction.do?doRecognisedFpi=yes&intmId=43, which may be updated from time
to time or at such other website as may be prescribed by SEBI from time to time.
Applications through UPI in the Offer can be made only through the SCSBs mobile applications (apps) whose name appears
on the SEBI website. A list of SCSBs and mobile application, which, are live for applying in public issues using UPI mechanism
is appearing in the “list of mobile applications for using UPI in public issues” displayed on t he SEBI website. Details of nodal
officers of SCSBs, identified for Bids made through the UPI Mechanism, are available at www.sebi.gov.in.
Syndicate SCSB Branches
In relation to Bids (other than Bids by Anchor Investor) submitted under ASBA process to a member of the Syndicate, the list
of branches of the SCSBs at the Specified Locations named by the respective SCSBs to receive deposits of Bid cum Application
Forms from the members of the Syndicate is available on the website of the SEBI
(https://www.sebi.gov.in/sebiweb/other/OtherAction.do?doRecognisedFpi=yes&intmId=35) as updated from time to time. For
more information on such branches collecting Bid cum Application Forms from the Syndicate at Specified Locations, see the
website of the SEBI (https://www.sebi.gov.in/sebiweb/other/OtherAction.do?doRecognisedFpi=yes&intmId=35) or any such
other website as may be prescribed by SEBI from time to time.
Registered Brokers
The list of the Registered Brokers eligible to accept ASBA forms, including details such as postal address, telephone number
and e-mail address, is provided on the websites of the Stock Exchanges at www.bseindia.com and www.nseindia.com,
respectively, as updated from time to time.
Registrar and Share Transfer Agents
The list of the RTAs eligible to accept ASBA Forms at the Designated RTA Locations, including details such as address,
telephone number and e-mail address, is provided on the websites of Stock Exchanges at
http://www.bseindia.com/Static/Markets/PublicIssues/RtaDp.aspx? and
http://www.nseindia.com/products/content/equities/ipos/asba_procedures.htm, respectively, as updated from time to time.
Collecting Depository Participants
The list of the CDPs eligible to accept ASBA Forms at the Designated CDP Locations, including details such as name and
contact details, is provided on the websites of BSE at http://www.bseindia.com/Static/Markets/PublicIssues/RtaDp.aspx? and
on the website of NSE at http://www.nseindia.com/products/content/equities/ipos/asba_procedures.htm, as updated from time
to time.
Inter-se allocation of responsibilities among the Book Running Lead Managers
The following table sets forth the inter-se allocation of responsibilities for various activities among the Book Running Lead
Managers:
Sr. No. Activity Responsibility Co-ordinator
1. Capital structuring, due diligence of Company including its operations /
management / business plans / legal etc., Drafting and design of Draft Red Herring Prospectus, Red Herring Prospectus and Prospectus. Ensure
compliance and completion of prescribed formalities with the Stock Exchanges,
SEBI and RoC including finalisation of RHP, Prospectus, Offer Agreement,
Syndicate and Underwriting Agreements and RoC filing
BRLMs IIFL
2. Drafting and approval of all statutory advertisements BRLMs IIFL
3. Drafting and approval of all publicity material other than statutory
advertisements as mentioned in point 2 above, including corporate advertising and brochures and filing of media compliance report.
BRLMs HDFC
4. Appointment of intermediaries - Registrar to the Offer, advertising agency,
printer (including coordination of all agreements)
BRLMs IIFL
5. Appointment of all other intermediaries, including Sponsor Bank, monitoring
agency, etc. (including coordination of all agreements)
BRLMs Ambit
6. Preparation of road show presentation and FAQs BRLMs DAM
7. International institutional marketing of the Offer, which will cover, inter alia:
• Marketing strategy
• Finalising the list and division of international investors for one-to-one
meetings
Finalising international road show and investor meeting schedules
BRLMs IIFL

66
Sr. No. Activity Responsibility Co-ordinator
8. Domestic institutional marketing of the Offer, which will cover, inter alia:
• Marketing Strategy
• Finalising the list and division of domestic investors for one-to-one meetings
Finalising domestic road show and investor meeting schedules
BRLMs Ambit
9. Conduct non-institutional marketing of the Offer BRLMs DAM
10. Conduct retail marketing of the Offer, which will cover, inter-alia:
• Finalising media, marketing, public relations strategy and publicity
budget, frequently asked questions at retail road shows
• Finalising brokerage, collection centres
• Finalising centres for holding conferences for brokers etc.
Follow-up on distribution of publicity and Offer material including form, RHP/
Prospectus and deciding on the quantum of the Offer material
BRLMs HDFC
11. Coordination with Stock Exchanges for Anchor coordination, Anchor CAN and
intimation of anchor allocation, book building software, bidding terminals and
mock trading and deposit of 1% security deposit with the designated stock
exchange
BRLMs HDFC
12. Managing the book and finalization of pricing in consultation with Company
and Selling Shareholders
BRLMs DAM
13. Post-Offer activities – management of escrow accounts, finalisation of the basis
of allotment based on technical rejections, post Offer stationery, essential
follow-up steps including follow-up with bankers to the Offer and Self Certified
Syndicate Banks and coordination with various agencies connected with the
post-offer activity such as registrar to the offer, bankers to the offer, Self-Certified Syndicate Banks etc. listing of instruments, demat credit and refunds/
unblocking of monies, announcement of allocation and dispatch of refunds to
Bidders, etc., payment of the applicable STT on behalf of Selling Shareholders,
coordination for investor complaints related to the Offer, including
responsibility for underwriting arrangements, submission of final post issue report and coordination with SEBI and Stock Exchanges for refund of 1%
security deposit.
BRLMs Ambit
Filing
A copy of this Draft Red Herring Prospectus has been filed electronically on the SEBI’s online portal and at cfd [email protected],
in accordance with the instructions issued by the SEBI, in relation to “Easing of Operational Procedure – Division of Issues
and Listing – CFD” and has also been uploaded on the SEBI intermediary portal at https://siportal.sebi.gov.in as specified in
Regulation 25(8) of the SEBI ICDR Regulations and the SEBI circular no. SEBI/HO/CFD/DIL1/CIR/P/2018/011 dated January
19, 2018.
A copy of the Red Herring Prospectus, along with the material contracts and documents required to be filed under Section 32
of the Companies Act would be filed with the RoC and a copy of the Prospectus to be filed under Section 26 of the Companies
Act, 2013 would be filed with the RoC at its office.
Experts
Except as stated below, our Company has not obtained any expert opinions:
Our Company has received written consent dated September 30, 2021 from Deloitte Haskins & Sells LLP, Chartered
Accountants to include their name as required under Section 26 (1) of the Companies Act, 2013 read with SEBI ICDR
Regulations, in this Draft Red Herring Prospectus and as an “expert” as defined under Section 2(38) of the Companies Act,
2013 to the extent and in their capacity as our Statutory Auditors, and in respect of their examination report, dated September
27, 2021 on our Restated Consolidated Financial Information; and such consent has not been withdrawn as on the date of this
Draft Red Herring Prospectus. However, the term “expert” and the consent thereof shall not be construed to mean an “expert”
or consent within the meaning as defined under the U.S. Securities Act.
Our Company has received written consent dated September 29, 2021, from the independent chartered accountant, namely
Ramesh M Sheth & Associates, to include their name in this Draft Red Herring Prospectus and as an “expert” as defined under
Section 2(38) of the Companies Act, 2013 in respect of their statement of special tax benefits available to the Company and its
shareholders dated September 29, 2021, included in this Draft Red Herring Prospectus, and such consent has not been
withdrawn as on the date of this Draft Red Herring Prospectus. However, the term “expert” and the consent thereof shall not
be construed to mean an “expert” or consent within the meaning as defined under the U.S. Securities Act.
67
Book Building Process
The book building, in the context of the Offer, refers to the process of collection of Bids from investors on the basis of the Red
Herring Prospectus and the Bid cum Application Forms and the Revision Forms within the Price Band. The Price Band and the
minimum Bid Lot will be decided by our Company, in consultation with the Book Running Lead Managers, and shall be
advertised in all editions of [●], an English national daily newspaper, all editions of [●], a Hindi national daily newspaper and
regional edition of [●], a Marathi newspaper, Marathi being the regional language of Maharashtra, where our Registered Office
is located, each with wide circulation, at least two Working Days prior to the Bid/ Offer Opening Date and shall be made
available to the Stock Exchanges for the purpose of uploading on their respective websites. The Offer Price shall be determined
by our Company in consultation with the Book Running Lead Managers after the Bid/ Offer Closing Date. For details, see
“Offer Procedure” beginning on page 338.
All Bidders, except Anchor Investors, are mandatorily required to use the ASBA process for participating in the Offer
by providing details of their respective ASBA Account in which the corresponding Bid Amount will be blocked by
SCSBs. In addition to this, the RIBs may participate through the ASBA process by either (a) providing the details of
their respective ASBA Account in which the corresponding Bid Amount will be blocked by the SCSBs; or (b) through
the UPI Mechanism. Anchor Investors are not permitted to participate in the Offer through the ASBA process.
In accordance with the SEBI ICDR Regulations, QIBs and Non-Institutional Bidders are not allowed to withdraw or
lower the size of their Bids (in terms of the quantity of the Equity Shares or the Bid Amount) at any stage. RIBs (subject
to the Bid Amount being up to ₹ 200,000). Further, Anchor Investors cannot withdraw their Bids after the Anchor
Investor Bid/ Offer Period. Allocation to QIBs (other than Anchor Investors) and Non-Institutional Investors will be on
a proportionate basis while Allocation to the Anchor Investors will be on a discretionary basis.
For further details on the method and procedure for Bidding and book building process, see “Offer Structure” and “Offer
Procedure” beginning on pages 336 and 338, respectively.
The process of Book Building under the SEBI ICDR Regulations and the Bidding Process are subject to change from
time to time and the investors are advised to make their own judgment about investment through this process prior to
submitting a Bid in the Offer.
Bidders should note the Offer is also subject to (i) obtaining final listing and trading approvals of the Stock Exchanges, which
our Company shall apply for after Allotment; and (ii) filing of the Prospectus with the RoC.
Each Bidder, by submitting a Bid in the Issue, will be deemed to have acknowledged the above restrictions and the terms of the
Issue.
Underwriting Agreement
After the determination of the Offer Price and allocation of Equity Shares, but prior to the filing of the Prospectus with the RoC,
our Company and the Selling Shareholders shall enter into an Underwriting Agreement with the Underwriters for the Equity
Shares offered in the Offer. The extent of underwriting obligations and the Bids to be underwritten in the Offer shall be as per
the Underwriting Agreement. The Underwriting Agreement will be dated [●]. Pursuant to the terms of the Underwriting
Agreement, the obligations of each of the Underwriters will be several and will be subject to certain conditions specified th erein.
The Underwriters have indicated their intention to underwrite the following number of Equity Shares:
(This portion has been intentionally left blank and will be filled in before filing of the Prospectus with the RoC.)
Name, Address, Telephone number and E-mail
address of the Underwriters
Indicative Number of Equity Shares
to be Underwritten
Amount Underwritten
(in ₹ million)
[●] [●] [●]
[●] [●] [●]
[●] [●] [●]
[●] [●] [●]
[●] [●] [●]
[●] [●] [●]
The above-mentioned underwriting commitments are indicative and will be finalised after determination of Offer Price and
Basis of Allotment and subject to the provisions of the SEBI ICDR Regulations.
In the opinion of our Board (based on representations m ade to our Company by the Underwriters), the resources of the
aforementioned Underwriters are sufficient to enable them to discharge their respective underwriting obligations in full. The
aforementioned Underwriters are registered with SEBI under Section 12(1) of the SEBI Act or registered as brokers with the
Stock Exchanges. Our Board/ IPO Committee, at its meeting held on [●], has accepted and entered into the Underwriting
Agreement mentioned above on behalf of our Company.

68
Allocation among the Underwriters may not necessarily be in proportion to their underwriting commitment set forth in the table
above.
Notwithstanding the above table, the Underwriters shall be severally responsible for ensuring payment with respect to the Equ ity
Shares allocated to investors respectively procured by them in accordance with the Underwriting Agreement. In the event of
any default in payment, the respective Underwriter, in addition to other obligations defined in the Underwriting Agreement,
will also be required to procure subscribers for or subscribe the Equity Shares to the extent of the defaulted amount in accordance
with the Underwriting Agreement. The Underwriting Agreement has not been executed as on the date of this Draft Red Herring
Prospectus and will be executed after determination of the Offer Price and allocation of Equity Shares, but prior to the filing of
the Prospectus with the RoC.
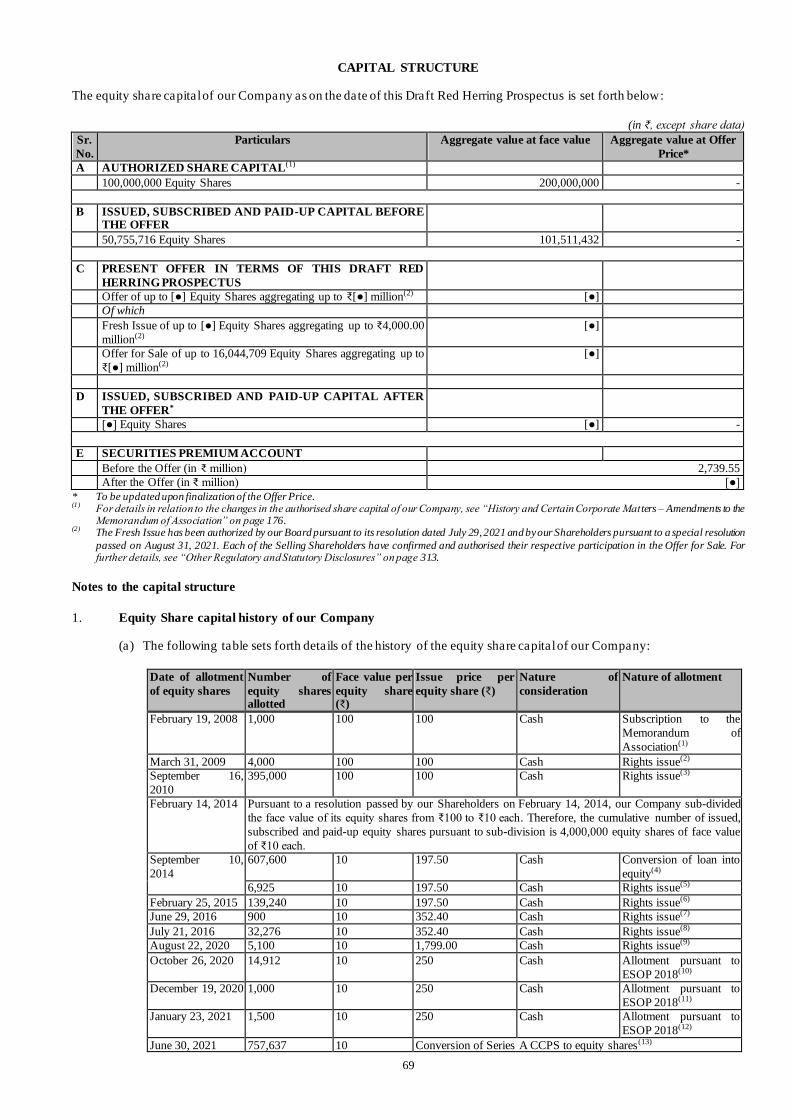
69
CAPITAL STRUCTURE
The equity share capital of our Company as on the date of this Draft Red Herring Prospectus is set forth below:
(in ₹, except share data)
Sr.
No.
Particulars Aggregate value at face value Aggregate value at Offer
Price*
A AUTHORIZED SHARE CAPITAL(1)
100,000,000 Equity Shares 200,000,000 -
B ISSUED, SUBSCRIBED AND PAID-UP CAPITAL BEFORE THE OFFER
50,755,716 Equity Shares 101,511,432 -
C PRESENT OFFER IN TERMS OF THIS DRAFT RED
HERRING PROSPECTUS
Offer of up to [●] Equity Shares aggregating up to ₹[●] million(2) [●]
Of which
Fresh Issue of up to [●] Equity Shares aggregating up to ₹4,000.00
million(2)
[●]
Offer for Sale of up to 16,044,709 Equity Shares aggregating up to
₹[●] million(2)
[●]
D ISSUED, SUBSCRIBED AND PAID-UP CAPITAL AFTER
THE OFFER*
[●] Equity Shares [●] -
E SECURITIES PREMIUM ACCOUNT
Before the Offer (in ₹ million) 2,739.55
After the Offer (in ₹ million) [●]
* To be updated upon finalization of the Offer Price. (1) For details in relation to the changes in the authorised share capital of our Company, see “History and Certain Corporate Matters – Amendments to the
Memorandum of Association” on page 176. (2) The Fresh Issue has been authorized by our Board pursuant to its resolution dated July 29, 2021 and by our Shareholders pursuant to a special resolution
passed on August 31, 2021. Each of the Selling Shareholders have confirmed and authorised their respective participation in the Offer for Sale. For further details, see “Other Regulatory and Statutory Disclosures” on page 313.
Notes to the capital structure
1. Equity Share capital history of our Company
(a) The following table sets forth details of the history of the equity share capital of our Company:
Date of allotment
of equity shares
Number of
equity shares allotted
Face value per
equity share (₹)
Issue price per
equity share (₹)
Nature of
consideration
Nature of allotment
February 19, 2008 1,000 100 100 Cash Subscription to the
Memorandum of
Association(1)
March 31, 2009 4,000 100 100 Cash Rights issue(2)
September 16,
2010
395,000 100 100 Cash Rights issue(3)
February 14, 2014 Pursuant to a resolution passed by our Shareholders on February 14, 2014, our Company sub-divided
the face value of its equity shares from ₹100 to ₹10 each. Therefore, the cumulative number of issued,
subscribed and paid-up equity shares pursuant to sub-division is 4,000,000 equity shares of face value
of ₹10 each.
September 10,
2014
607,600 10 197.50 Cash Conversion of loan into
equity(4)
6,925 10 197.50 Cash Rights issue(5)
February 25, 2015 139,240 10 197.50 Cash Rights issue(6)
June 29, 2016 900 10 352.40 Cash Rights issue(7)
July 21, 2016 32,276 10 352.40 Cash Rights issue(8)
August 22, 2020 5,100 10 1,799.00 Cash Rights issue(9)
October 26, 2020 14,912 10 250 Cash Allotment pursuant to
ESOP 2018(10)
December 19, 2020 1,000 10 250 Cash Allotment pursuant to
ESOP 2018(11)
January 23, 2021 1,500 10 250 Cash Allotment pursuant to
ESOP 2018(12)
June 30, 2021 757,637 10 Conversion of Series A CCPS to equity shares(13)
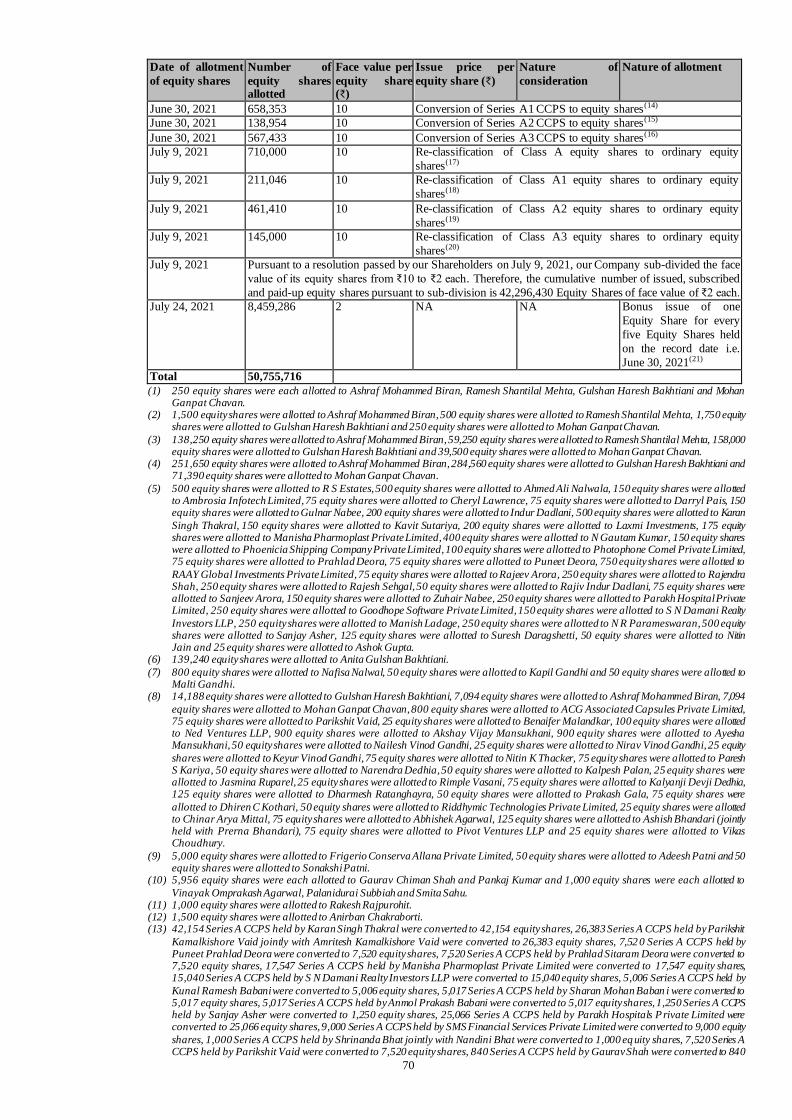
70
Date of allotment
of equity shares
Number of
equity shares allotted
Face value per
equity share (₹)
Issue price per
equity share (₹)
Nature of
consideration
Nature of allotment
June 30, 2021 658,353 10 Conversion of Series A1 CCPS to equity shares(14)
June 30, 2021 138,954 10 Conversion of Series A2 CCPS to equity shares(15)
June 30, 2021 567,433 10 Conversion of Series A3 CCPS to equity shares(16)
July 9, 2021 710,000 10 Re-classification of Class A equity shares to ordinary equity
shares(17)
July 9, 2021 211,046 10 Re-classification of Class A1 equity shares to ordinary equity
shares(18)
July 9, 2021 461,410 10 Re-classification of Class A2 equity shares to ordinary equity
shares(19)
July 9, 2021 145,000 10 Re-classification of Class A3 equity shares to ordinary equity
shares(20)
July 9, 2021 Pursuant to a resolution passed by our Shareholders on July 9, 2021, our Company sub-divided the face
value of its equity shares from ₹10 to ₹2 each. Therefore, the cumulative number of issued, subscribed
and paid-up equity shares pursuant to sub-division is 42,296,430 Equity Shares of face value of ₹2 each.
July 24, 2021 8,459,286 2 NA NA Bonus issue of one
Equity Share for every
five Equity Shares held
on the record date i.e.
June 30, 2021(21)
Total 50,755,716
(1) 250 equity shares were each allotted to Ashraf Mohammed Biran, Ramesh Shantilal Mehta, Gulshan Haresh Bakhtiani and Mohan Ganpat Chavan.
(2) 1,500 equity shares were allotted to Ashraf Mohammed Biran, 500 equity shares were allotted to Ramesh Shantilal Mehta, 1,750 equity shares were allotted to Gulshan Haresh Bakhtiani and 250 equity shares were allotted to Mohan Ganpat Chavan.
(3) 138,250 equity shares were allotted to Ashraf Mohammed Biran, 59,250 equity shares were allotted to Ramesh Shantilal Mehta, 158,000 equity shares were allotted to Gulshan Haresh Bakhtiani and 39,500 equity shares were allotted to Mohan Ganpat Chavan.
(4) 251,650 equity shares were allotted to Ashraf Mohammed Biran, 284,560 equity shares were allotted to Gulshan Haresh Bakhtiani and 71,390 equity shares were allotted to Mohan Ganpat Chavan.
(5) 500 equity shares were allotted to R S Estates, 500 equity shares were allotted to Ahmed Ali Nalwala, 150 equity shares were allotted to Ambrosia Infotech Limited, 75 equity shares were allotted to Cheryl Lawrence, 75 equity shares were allotted to Darryl Pais, 150 equity shares were allotted to Gulnar Nabee, 200 equity shares were allotted to Indur Dadlani, 500 equity shares were allotted to Karan
Singh Thakral, 150 equity shares were allotted to Kavit Sutariya, 200 equity shares were allotted to Laxmi Investments, 175 equity shares were allotted to Manisha Pharmoplast Private Limited, 400 equity shares were allotted to N Gautam Kumar, 150 equity shares were allotted to Phoenicia Shipping Company Private Limited, 100 equity shares were allotted to Photophone Comel Private Limited, 75 equity shares were allotted to Prahlad Deora, 75 equity shares were allotted to Puneet Deora, 750 equity shares were allotted to
RAAY Global Investments Private Limited, 75 equity shares were allotted to Rajeev Arora, 250 equity shares were allotted to Rajendra Shah, 250 equity shares were allotted to Rajesh Sehgal, 50 equity shares were allotted to Rajiv Indur Dadlani, 75 equity shares were allotted to Sanjeev Arora, 150 equity shares were allotted to Zuhair Nabee, 250 equity shares were allotted to Parakh Hospital Private Limited, 250 equity shares were allotted to Goodhope Software Private Limited, 150 equity shares were allotted to S N Damani Realty
Investors LLP, 250 equity shares were allotted to Manish Ladage, 250 equity shares were allotted to N R Parameswaran, 500 equity shares were allotted to Sanjay Asher, 125 equity shares were allotted to Suresh Daragshetti, 50 equity shares were allotted to Nitin Jain and 25 equity shares were allotted to Ashok Gupta.
(6) 139,240 equity shares were allotted to Anita Gulshan Bakhtiani.
(7) 800 equity shares were allotted to Nafisa Nalwal, 50 equity shares were allotted to Kapil Gandhi and 50 equity shares were allotted to Malti Gandhi.
(8) 14,188 equity shares were allotted to Gulshan Haresh Bakhtiani, 7,094 equity shares were allotted to Ashraf Mohammed Biran, 7,094
equity shares were allotted to Mohan Ganpat Chavan, 800 equity shares were allotted to ACG Associated Capsules Private Limited, 75 equity shares were allotted to Parikshit Vaid, 25 equity shares were allotted to Benaifer Malandkar, 100 equity shares were allotted to Ned Ventures LLP, 900 equity shares were allotted to Akshay Vijay Mansukhani, 900 equity shares were allotted to Ayesha Mansukhani, 50 equity shares were allotted to Nailesh Vinod Gandhi, 25 equity shares were allotted to Nirav Vinod Gandhi, 25 equity
shares were allotted to Keyur Vinod Gandhi, 75 equity shares were allotted to Nitin K Thacker, 75 equity shares were allotted to Paresh S Kariya, 50 equity shares were allotted to Narendra Dedhia, 50 equity shares were allotted to Kalpesh Palan, 25 equity shares were allotted to Jasmina Ruparel, 25 equity shares were allotted to Rimple Vasani, 75 equity shares were allotted to Kalyanji Devji Dedhia, 125 equity shares were allotted to Dharmesh Ratanghayra, 50 equity shares were allotted to Prakash Gala, 75 equity shares were
allotted to Dhiren C Kothari, 50 equity shares were allotted to Riddhymic Technologies Private Limited, 25 equity shares were allotted to Chinar Arya Mittal, 75 equity shares were allotted to Abhishek Agarwal, 125 equity shares were allotted to Ashish Bhandari (jointly held with Prerna Bhandari), 75 equity shares were allotted to Pivot Ventures LLP and 25 equity shares were allotted to Vikas Choudhury.
(9) 5,000 equity shares were allotted to Frigerio Conserva Allana Private Limited, 50 equity shares were allotted to Adeesh Patni and 50 equity shares were allotted to Sonakshi Patni.
(10) 5,956 equity shares were each allotted to Gaurav Chiman Shah and Pankaj Kumar and 1,000 equity shares were each allotted to
Vinayak Omprakash Agarwal, Palanidurai Subbiah and Smita Sahu. (11) 1,000 equity shares were allotted to Rakesh Rajpurohit. (12) 1,500 equity shares were allotted to Anirban Chakraborti. (13) 42,154 Series A CCPS held by Karan Singh Thakral were converted to 42,154 equity shares, 26,383 Series A CCPS held by Parikshit
Kamalkishore Vaid jointly with Amritesh Kamalkishore Vaid were converted to 26,383 equity shares, 7,52 0 Series A CCPS held by Puneet Prahlad Deora were converted to 7,520 equity shares, 7,520 Series A CCPS held by Prahlad Sitaram Deora were converted to 7,520 equity shares, 17,547 Series A CCPS held by Manisha Pharmoplast Private Limited were converted to 17,547 equity shares, 15,040 Series A CCPS held by S N Damani Realty Investors LLP were converted to 15,040 equity shares, 5,006 Series A CCPS held by
Kunal Ramesh Babani were converted to 5,006 equity shares, 5,017 Series A CCPS held by Sharan Mohan Baban i were converted to 5,017 equity shares, 5,017 Series A CCPS held by Anmol Prakash Babani were converted to 5,017 equity shares, 1,250 Series A CCPS held by Sanjay Asher were converted to 1,250 equity shares, 25,066 Series A CCPS held by Parakh Hospitals Private Limited were converted to 25,066 equity shares, 9,000 Series A CCPS held by SMS Financial Services Private Limited were converted to 9,000 equity
shares, 1,000 Series A CCPS held by Shrinanda Bhat jointly with Nandini Bhat were converted to 1,000 eq uity shares, 7,520 Series A CCPS held by Parikshit Vaid were converted to 7,520 equity shares, 840 Series A CCPS held by Gaurav Shah were converted to 840

71
equity shares, 75,199 Series A CCPS held by RAAY Global Investments Private Limited were converted to 75,199 equity shares, 5,013
Series A CCPS held by Nitin Jain were converted to 5,013 equity shares, 7,520 Series A CCPS held by Vivek Sah were converted to 7,520 equity shares, 50,133 Series A CCPS held by Ramesh J Babani were converted to 50,133 equity shares, 9,875 Series A CCPS held by Suresh Daragshetti were converted to 9,875 equity shares, 840 Series A CCPS held by Dilip Sawant were converted to 840 equity shares, 3,320 Series A CCPS held by Allana Investments and Trading Company Private Limited were converted to 3,320 equity
shares, 10,027 Series A CCPS held by Photophone Comel Private Limited were converted to 10,027 equity shares, 7,520 Series A CCPS held by Ritika Arora were converted to 7,520 equity shares, 5,014 Series A CCPS held by Rajiv Indur Dadlani were converted to 5,014 equity shares, 30,181 Series A CCPS held by Indur Dadlani were converted to 30,181 equity shares, 15,040 Series A CCPS held by Zuhair Nabee were converted to 15,040 equity shares, 15,040 Series A CCPS held by Gulnar Nabee were converted to 15,040 equity
shares, 9,750 Series A CCPS held by SMS Financial Services Private Limited were converted to 9,750 equity shares, 15,040 Series A CCPS held by Kavit Sutariya were converted to 15,040 equity shares, 14,000 Series A CCPS held b y Manish Ladage were converted to 14,000 equity shares, 4,000 Series A CCPS held by Nallepilly Parameshwaran were converted to 4,000 equity shares, 40,106 S eries A CCPS held by Gautam Nedurumalli were converted to 40,106 equity shares, 840 Series A CCPS he ld by Kingshuk Basu were
converted to 840 equity shares, 1,241 Series A CCPS held by Ashok Gupta were converted to 1,241 equity shares, 6,524 Series A CCPS held by Riddhymic Technologies Private Limited were converted to 6,524 equity shares, 840 Series A CCPS held by Smita Sahu were converted to 840 equity shares, 840 Series A CCPS held by Gopal Bhardwaj were converted to 840 equity shares, 25,066 Series A
CCPS held by Ria Selwani were converted to 25,066 equity shares, 35,193 Series A CCPS held by Rajendra Sah were converted to 35,193 equity shares, 151,025 Series A CCPS held by Ahmed Ali Nalwala were converted to 151,025 equity shares, 30,130 Series A CCPS held by Rajesh Sehgal were converted to 30,130 equity shares and 3,924 Series A CCPS held by Patni Wealth Advisors LLP were converted to 3,924 equity shares.
(14) 4,256 Series A1 CCPS held by Karan Singh Thakral were converted to 4,256 equity shares, 5,625 Series A1 CCPS held by Narendra Dedhia jointly with Dina Dedhia were converted to 5,625 equity shares, 1 ,394 Series A1 CCPS held by Rimple Vasani were converted to 1,394 equity shares, 2,053 Series A1 CCPS held by Kalyanji Devji Dedhia were converted to 2,053 equity shares, 14,188 Series A1 CCPS held by Parakh Hospitals Private Limited were converted to 14,188 equity shares, 14,063 Series A1 CCPS held by Vijay Bhandari
were converted to 14,063 equity shares, 11,250 Series A1 CCPS held by Ned Ventures LLP were converted to 11,250 equity shares, 8,438 Series A1 CCPS held by Parikshit Vaid were converted to 8,438 equity shares, 84,330 Series A1 CCPS held by ACG Associated Capsules Private Limited were converted to 84,330 equity shares, 4,206 Series A1 CCPS held by Kapil Gandhi jointly with Malti Gandhi were converted to 4,206 equity shares, 4,206 Series A1 CCPS held by Malti Gandhi jointly with Girish Gandhi were converted
to 4,206 equity shares, 2,785 Series A1 CCPS held by Kalpesh Palan were converted to 2,785 equity shares, 5,925 Series A1 CCPS held by Nitin K Thacker were converted to 5,925 equity shares, 4,206 Series A1 CCPS held by Nailesh Gandhi jointly with Sonal Gandhi were converted to 4,206 equity shares, 2,103 Series A1 CCPS held by Keyur Gandhi jointly with Ami Gandhi were converted to 2,103
equity shares, 2,103 Series A1 CCPS held by Nirav Gandhi jointly with Aditi Gandhi were converted to 2,103 equity shares, 43,416 Series A1 CCPS held by Allana Exports Private Limited were converted to 43,416 equity shares, 5,613 Series A1 CCPS held by Allana Investments and Trading Company Private Limited were converted to 5,613 equity shares, 2,206 Series A1 CCPS held by Prakash Gala jointly with Bhavya Gala were converted to 2,206 equity shares, 1,393 Series A1 CCPS held by Vikas Choudhury were converted to
1,393 equity shares, 5,675 Series A1 CCPS held by Photophone Comel Private Limited were converted to 5,675 equity shares, 2,812 Series A1 CCPS held by Chinar Mittal were converted to 2,812 equity shares, 8,438 Series A1 CCPS held by Abhishek Agarwal were converted to 8,438 equity shares, 1,390 Series A1 CCPS held by Jasmina Ruparel were converted to 1,390 equity shares, 2,824 Series A1 CCPS held by Pivot Ventures LLP were converted to 2,824 equity shares, 37,243 Series A1 CCPS held by Akshay Vijay Mansukhani
were converted to 37,243 equity shares, 2,812 Series A1 CCPS held by Benaifer Malandkar were converted to 2,812 equity shares, 111,000 Series A1 CCPS held by Vijay Mansukhani jointly with Marissa Mansukhani were converted to 111,000 equity shares, 37,243 Series A1 CCPS held by Ayesha Mansukhani were converted to 37,243 equity shares, 2,763 Series A1 CCPS held by Paresh S Kariya jointly with Purvi Kariya were converted to 2,763 equity shares, 223,034 Series A1 CCPS held by Ahmed Ali Nalwala were converted
to 223,034 equity shares and 8,775 Series A1 CCPS held by Patni Wealth Advisors LLP were converted to 8,775 equity shares. (15) 3,090 Series A2 CCPS held by Karan Singh Thakral were converted to 3,090 equity shares, 2,912 Series A2 CCPS held by Parikshit
Kamalkishore Vaid jointly with Amritesh Vaid were converted to 2,912 equity shares, 1,203 Series A2 CCPS held by Pooja Deora were converted to 1,203 equity shares, 2,808 Series A2 CCPS held by Puneet Deora were converted to 2,808 equity shares, 1,203 Series A2
CCPS held by Prahlad Deora were converted to 1,203 equity shares, 2,407 Series A2 CCPS held by S N Damani Realty Investors LLP were converted to 2,407 equity shares, 10 Series A2 CCPS held by Kunal Ramesh Babani were converted to 10 equity shares, 674 Series A2 CCPS held by Siddharth Gala jointly with Prakash Gala were converted to 674 equity shares, 4,814 Series A2 CCPS held by
Rajesh Sehgal were converted to 4,814 equity shares, 12,035 Series A2 CCPS held by RAAY Global Investments Private Limited were converted to 12,035 equity shares, 3,015 Series A2 CCPS held by Aditya Sah were converted to 3,015 equity shares, 1,265 Series A2 CCPS held by Nailesh Gandhi jointly with Sonal Gandhi were converted to 1,265 equity shares, 632 Series A2 CCPS held by Keyur Gandhi jointly with Ami Gandhi were converted to 632 equity shares, 632 Series A2 CCPS held by Nirav Gandhi jointly with Aditi
Gandhi were converted to 632 equity shares, 6,903 Series A2 CCPS held by Allana Exports Private Limited were converted to 6,903 equity shares, 2,248 Series A2 CCPS held by Allana Investments and Trading Company Private Limited were converted to 2,248 equity shares, 11,972 Series A2 CCPS held by Rajiv Indur Dadlani were converted to 11,972 equity shares, 9,850 Series A2 CCPS held by Jaya Dadlani were converted to 9,850 equity shares, 9,850 Series A2 CCPS held by Bhavna Dadlani were converted to 9,850 equity
shares, 27,835 Series A2 CCPS held by Akshay Vijay Mansukhani were converted to 27,835 equity shares, 844 Series A2 CCPS held by Benaifer Malandkar were converted to 844 equity shares, 27,835 Series A2 CCPS held by Ayesha Mansukhani were converted to 27,835 equity shares and 4,018 Series A2 CCPS held by Ahmed Ali Nalwala were converted to 4,018 equity shares.
(16) 550,865 Series A3 CCPS held by Frigerio Conserva Allana Private Limited were converted to 550,865 equity shares, 1,850 Series A3
CCPS held by Kunal Ramesh Babani were converted to 1,850 equity shares, 1,850 Series A3 CCPS held by Sharan Mohan Babani were converted to 1,850 equity shares, 1,850 Series A3 CCPS held by Anmol Prakash Babani were converted to 1,850 equity shares, 5,509 Series A3 CCPS held by Sonakshi Arihant Patni were converted to 5,509 equity shares and 5,509 Series A3 CCPS held by Adeesh Patni
were converted to 5,509 equity shares. (17) 710,000 Class A equity shares held by Serum Institute of India Private Limited were re-classified to 710,000 equity shares. (18) 211,046 Class A1 equity shares held by Serum Institute of India Private Limited were re-classified to 211,046 equity shares. (19) 461,410 Class A2 equity shares held by Rising Sun Holdings Private Limited were re-classified to 461,410 equity shares.
(20) 145,000 Class A3 equity shares held by Rising Sun Holdings Private Limited were re-classified to 145,000 equity shares. (21) 1,824,097 Equity Shares were allotted to Gulshan Haresh Bakhtiani, 1,871,134 Equity Shares were allotted to Ashraf Mohammed
Biran, 434,123 Equity Shares were allotted to Mohan Ganpat Chavan, 6,758 Equity Shares were allotted to Anita Gulshan Bakhtiani, 50,633 Equity Shares were allotted to R S Estates, 12,850 Equity Shares were allotted to Kunal Babani, 12,850 Equity Shares were
allotted to Anmol Babani, 12,850 Equity Shares were allotted to Sharan Babani, 524,279 Equity Shares were allotted to Ahmed Ali Nalwala, 15,190 Equity Shares were allotted to Gulnar Nabee, 15,190 Equity Shares were allotted to Zuhair Nabee, 30,381 Equity Shares were allotted to Indur Dadlani, 117,144 Equity Shares were allotted to Rajiv Indur Dadlani, 10,000 Equity Shares were allotted to Jaya Dadlani, 10,000 Equity Shares were allotted to Bhavna Dadlani, 50,000 Equity Shares were allotted to Karan Singh Thakral,
15,190 Equity Shares were allotted to Kavit Sutariya, 36,693 Equity Shares were allotted to Laxmi Investments, 22,682 Equity Shares were allotted to Parikshit Vaid, 17,722 Equity Shares were allotted to Manisha Pharmoplast Private Limited, 11,501 Equity Shares were allotted to Prahlad Deora, 15,871 Equity Shares were allotted to Puneet Deora, 2,647 Equity Shares were allotted to Pooja Deora,
58,753 Equity Shares were allotted to Allana Exports Private Limited, 41,947 Equity Shares were allotted to Allana Investments and

72
Trading Company Private Limited, 555,865 Equity Shares were allotted to Frigerio Conserva Allana Private Limited, 15,802 Equity
Shares were allotted to Photophone Comel Private Limited, 108,299 Equity Shares were allotted to RAAY Global Investments Private Limited, 5,468 Equity Shares were allotted to Benaifer Malandkar, 25,168 Equity Shares were allotted to Patni Wealth Advisors LLP, 5,559 Equity Shares were allotted to Adeesh Patni, 5,559 Equity Shares were allotted to Sonakshi Patni, 7,595 Equity Shares were allotted to Ritika Arora, 35,194 Equity Shares were allotted to Rajesh Sehgal, 39,504 Equity Shares were allotted to Parakh Hospital
Private Limited, 6,000 Equity Shares were allotted to Nitin K Thacker, 2,838 Equity Shares were allotted to Paresh S Kariya, 2,835 Equity Shares were allotted to Kalpesh Palan, 1,415 Equity Shares were allotted to Jasmina Ruparel, 2,128 Equity Shares were allotted to Kalyanji Devji Dedhia, 2,864 Equity Shares were allotted to Prakash Gala, 7,775 Equity Shares were allotted to Narendra Dedhia, 1,419 Equity Shares were allotted to Rimple Vasani, 25,316 Equity Shares were allotted to Ria Sewlani, 20,485 Equity Shares were
allotted to S N Damani Realty Investors LLP, 14,250 Equity Shares were allotted to Manish Ladage, 4,250 Equity Shares were allotted to N R Parameswaran, 1,500 Equity Shares were allotted to Sanjay Asher, 19,000 Equity Shares were allotted to SMS Financial Services Private Limited, 1,000 Equity Shares were allotted to Srinanda Bhat, 1,266 Equity Shares were allotted to Ashok Gupta, 10,000 Equity Shares were allotted to Suresh Daragshetti, 5,063 Equity Shares were allotted to Nitin Jain, 85,130 Equity Shares were allotted to ACG
Associated Capsules Private Limited, 1,116,314 Equity Shares were allotted to Serum Institute of India Private Limited, 606,4 10 Equity Shares were allotted to Rising Sun Holdings Private Limited, 40,506 Equity Shares were allotted to N Gautam Kumar, 11,350 Equity Shares were allotted to Ned Ventures LLP, 92,232 Equity Shares were allotted to Akshay Vijay Mansukhani, 92,232 Equity Shares were
allotted to Ayesha Mansukhani, 110,000 Equity Shares were allotted to Vijay Mansukhani, 6,691 Equity Shares were allotted to Nailesh Gandhi, 3,346 Equity Shares were allotted to Nirav Gandhi, 3,346 Equity Shares were allotted to Keyur Gandhi 4,256 Equity Shares were allotted to Kapil Gandhi, 4,256 Equity Shares were allotted to Malti Gandhi, 7,653 Equity Shares were allotted to Riddhymic Technologies Private Limited 2,837 Equity Shares were allotted to Chinar Mittal, 8,438 Equity Shares were allotted to Abhishek
Agarwal, 14,188 Equity Shares were allotted to Vijay Bhandari, 2,899 Equity Shares were allotted to Pivot Ventures LLP, 1,418 Equity Shares were allotted to Vikas Choudhury, 10,141 Equity Shares were allotted to Vivek Rajendra Sah HUF, 10,141 Equity Shares were allotted to Aditya Rajendra Sah HUF, 35,443 Equity Shares were allotted to Rajendra Sah 875 Equity Shares were allotted to Siddharth Gala, 2,098 Equity Shares were allotted to Chetan Dalal¸ 11,572 Equity Shares were allotted to Kajal Fabiani 840 Equity Shares were
allotted to Gopal Bhardwaj¸ 6,796 Equity Shares were allotted to Gaurav Shah 840 Equity Shares were allotted to Kingshuk Babu 1,840 Equity Shares were allotted to Smita Sahu¸ 840 Equity Shares were allotted to Dilip Sawant, 5,956 Equity Shares were al lotted to Pankaj Kumar, 1,000 Equity Shares were allotted to Vinayak Agarwal, 1,000 Equity Shares were allotted to Palanidurai Subbiah 1,000 Equity Shares were allotted to Rakesh Rajpurohit and 1,500 Equity Shares were allotted to Anirban Chakraborti.
(b) The following table sets forth details of the history of the Class A equity share capital of our Company:
Date of allotment
of Class A equity shares
Number of Class
A equity shares allotted
Face value per
Class A equity share (₹)
Issue price per Class A
equity share (₹)
Nature of
consideration
Nature of
allotment
June 29, 2016 710,000 10 352.40 Cash Rights issue(1)
July 9, 2021 (710,000) 10 Re-classification of Class A equity shares to ordinary equity shares(2)
(1) 710,000 Class A equity shares were allotted to Serum Institute of India Private Limited. (2) 710,000 Class A equity shares held by Serum Institute of India Private Limited were re-classified to 710,000 ordinary equity shares
pursuant to re-classification of the authorised share capital of our Company. For details, see “History and Certain Corporate Matters – Amendments to the Memorandum of Association” on page 176.
(c) The following table sets forth details of the history of the Class A1 equity share capital of our Company:
Date of allotment
of Class A1
equity shares
Number of Class
A1 equity shares
allotted
Face value per
Class A1
equity share
(₹)
Issue price per Class A1
equity share (₹)
Nature of
consideration
Nature of
allotment
November 24,
2017
211,046 10 494.56 Cash Rights issue(1)
July 9, 2021 (211,046) 10 Re-classification of Class A1 equity shares to ordinary equity
shares(2)
(1) 211,046 Class A1 equity shares were allotted to Serum Institute of India Private Limited. (2) 211,046 Class A1 equity shares held by Serum Institute of India Private Limited were re-classified to 211,046 ordinary equity shares
pursuant to re-classification of the authorised share capital of our Company. For details, see “History and Certain Corporate Matters
– Amendments to the Memorandum of Association” on page 176.
(d) The following table sets forth details of the history of the Class A2 equity share capital of our Company:
Date of allotment
of Class A2
equity Shares
Number of Class
A2 equity shares
allotted
Face value per
Class A2
equity share (₹)
Issue price per Class A2
equity share (₹)
Nature of
consideration
Nature of
allotment
May 11, 2019 461,410 10 1,192 Cash Rights issue(1)
July 9, 2021 (461,410) 10 Re-classification of Class A2 equity shares to ordinary equity
shares(2)
(1) 461,410 Class A2 equity shares were allotted to Rising Sun Holdings Private Limited. (2) 461,410 Class A2 equity shares held by Rising Sun Holdings Private Limited were re-classified to 461,410 ordinary equity shares
pursuant to re-classification of the authorised share capital of our Company. For details, see “History and Certain Corporate Matters
– Amendments to the Memorandum of Association” on page 176.
(e) The following table sets forth details of the history of the Class A3 equity share capital of our Company:

73
Date of allotment
of Class A3 equity shares
Number of Class
A3 equity shares allotted
Face value per
Class A3 equity share
(₹)
Issue price per Class A
equity share (₹)
Nature of
consideration
Nature of
allotment
August 22, 2020 145,000 10 1,799.00 Cash Rights issue(1)
July 9, 2021 (145,000) 10 Re-classification of Class A3 equity shares to ordinary equity
shares(2)
(1) 145,000 Class A3 equity shares were allotted to Rising Sun Holdings Private Limited. (2) 145,000 Class A3 equity shares held by Rising Sun Holdings Private Limited were re-classified to 145,000 ordinary equity shares
pursuant to re-classification of the authorised share capital of our Company. For details, see “History and Certain Corporate Matters – Amendments to the Memorandum of Association” on page 176.
2. Issue of Equity Shares for consideration other than cash or out of revaluation reserves
Except as set out below, our Company has not issued equity shares through bonus issue or for consideration other than
cash. Our Company has not issued any Equity Shares out of revaluation reserves since incorporation.
Date of allotment Number of
Equity Shares
allotted
Face value per
Equity Share
(₹)
Issue price per
Equity Share
(₹)
Reason for allotment(1) Benefits accrued to our
Company
July 24, 2021 8,459,286 2 NA Bonus issue of one Equity
Share for every five Equity
Shares held on the record
date i.e. June 30, 2021
-
(1) For details, see “- Equity Share capital history of our Company” on page 69.
3. Issue of Equity Shares under Sections 230 to 234 of the Companies Act or Sections 391 to 394 of the Companies
Act, 1956.
Our Company has not allotted any Equity Shares pursuant to any scheme approved under Sections 391 to 394 of the
Companies Act, 1956 or Sections 230 to 232 of the Companies Act, 2013 .
4. Issue of Equity Shares at a price lower than the Offer Price in the last year
Except as disclosed above in “Capital Structure - Equity Share capital history of our Company” on page 69, our
Company has not issued any Equity Shares at a price which may be lower than the Offer Price during a period of one
year preceding the date of this Draft Red Herring Prospectus.

74
5. Shareholding Pattern of our Company
The table below presents the shareholding pattern of our Company as on the date of this Draft Red Herring Prospectus:
Category (I)
Category of
Sharehold
er
(II)
Number of
Share
holde
rs
(III)
Number of fully paid
up Equity
Shares held
(IV)
Number of
partly
paid-
up
Equity Shares
held
(V)
Number of Equity
Shares
underlyi
ng
Depository
Receipts
(VI)
Total number of
Equity
Shares held
(VII)
=(IV)+(V)+ (VI)
Shareholding as a
% of
total
number
of Equity Shares
(calculat
ed as per
SCRR,
1957) (VIII) As
a % of
(A+B+C
2)
Number of voting rights held in each class of securities
(IX)
Number of
Equity
Shares
underlyi
ng outstan
ding
converti
ble
securities
(includi
ng
warrant
s) (X)
Shareholding, as a %
assuming full
conversion of
convertible
securities (as a percentage of
diluted equity
share capital)
(XI)=
(VII)+(X) As a % of
(A+B+C2)
Number of locked
in Equity
Shares
(XII)
Number of Equity Shares
pledged or
otherwise
encumbered
(XIII)
Number of Equity
Shares
held in
dematerial
ized form (XIV) Number of Voting Rights Total as a
% of
(A+B+ C)
Nu
mb
er (a)
As a
% of
total Equ
ity
Sha
res
held (b)
Number
(a)
As a
% of
total Equit
y
Share
s held
(b)
Class e.g.: Equity
Shares
Class
e.g.:
othe
rs
Total
(A) Promoter
and Promoter
Group
4 24,816,672 - - 24,816,672 48.89 4 - 4 48.89 - 48.89 - - 2,510,500 4.95 24,816,672
(B) Public 84 25,939,044 - - 25,939,044 51.11 84 - 84 51.11 - 51.11 - - - - 25,939,044
(C) Non-
Promoter
– Non
Public
- - - - - - - - - - - - - - -
(C1) Equity
Shares
underlying
depository
receipts
- - - - - - - - - - - - - - - - -
(C2) Equity
Shares
held by
employee
trusts
- - - - - - - - - - - - - - - - -
Total 88 50,755,716 - - 50,755,716 100.00 88 - 88 100.00 - 100.00 - - 2,510,500 4.95 50,755,716

75
6. Other details of shareholding of our Company
(a) Set forth below is a list of Shareholders holding 1% or more of the paid -up Equity Share capital of our
Company on a fully diluted basis, as on the date of this Draft Red Herring Prospectus:
Sr.
No. Name of the Shareholder
Number of Equity
Shares^
Percentage of the fully
diluted Equity Share
capital (%)*
1. Ashraf Mohammed Biran 11,226,804 22.12
2. Gulshan Haresh Bakhtiani 10,944,582 21.56
3. Serum Institute of India Private Limited. 6,697,884 13.20
4. Rising Sun Holdings Private Limited 3,638,460 7.17
5. Frigerio Conserva Allana Private Limited 3,335,190 6.57
6. Ahmed Ali Husain Nalwala 3,145,674 6.20
7. Mohan Ganpat Chavan 2,604,738 5.13
8. Rajiv Dadlani 702,864 1.38
9. Vijay Mansukhani 666,000$ 1.31
10. RAAY Global Investments Private Limited 649,794 1.28
11. Akshay Vijay Mansukhani 550,392$ 1.09
12. Ayesha Vijay Mansukhani 550,392$ 1.09
13. ACG Associated Capsules Pvt Ltd 510,780 1.01
Total 45,223,554 89.09
^Based on the beneficiary position statement dated September 29, 2021. *Assuming exercise of vested stock options to the extent applicable. $ includes 1,000 Equity Shares which were allotted to Vijay Mansukhani but erroneously credited to the demat accounts of Akshay
Mansukhani and Ayesha Mansukhani. The Company has applied to NSDL, through its application dated September 29, 2021, for rectifying the error. Accordingly, 500 Equity Shares each, which were erroneously credited to the demat accounts of Akshay Mansukhani and Ayesha Mansukhani have been excluded from their respective shareholding for the purposes of disclosure in the Draft Red Herring
Prospectus.
(b) Set forth below is a list of Shareholders holding 1% or more of the paid -up Equity Share capital of our
Company on a fully diluted basis, as of ten days prior to the date of this Draft Red Herring Prospectus:
Sr.
No. Name of the Shareholder
Number of Equity
Shares^
Percentage of the fully diluted Equity Share
capital (%)*
1. Ashraf Mohammed Biran 11,226,804 22.12
2. Gulshan Haresh Bakhtiani 10,944,582 21.56
3. Serum Institute of India Private Limited. 6,697,884 13.20
4. Rising Sun Holdings Private Limited 3,638,460 7.17
5. Frigerio Conserva Allana Private Limited 3,335,190 6.57
6. Ahmed Ali Husain Nalwala 3,145,674 6.20
7. Mohan Ganpat Chavan 2,604,738 5.13
8. Rajiv Dadlani 702,864 1.38
9. Vijay Mansukhani 666,000$ 1.31
10. RAAY Global Investments Private Limited 649,794 1.28
11. Akshay Vijay Mansukhani 550,392$ 1.09
12. Ayesha Vijay Mansukhani 550,392$ 1.09
13. ACG Associated Capsules Pvt Ltd 510,780 1.01 Total 45,223,554 89.09
^Based on the beneficiary position statement dated September 20, 2021.
*Assuming exercise of vested stock options to the extent applicable. $ includes 1,000 Equity Shares which were allotted to Vijay Mansukhani but erroneously credited to the demat accounts of Akshay Mansukhani and Ayesha Mansukhani. The Company has applied to NSDL, through its application dated September 29, 2021, for rectifying the error. Accordingly, 500 Equity Shares each, which were erroneously credited to the demat accounts of Akshay Mansukhani
and Ayesha Mansukhani have been excluded from their respective shareholding for the purposes of disclosure in the Draft Red Herring Prospectus.
(c) Set forth below is a list of Shareholders holding 1% or more of the paid -up equity share capital of our
Company, on a fully diluted basis, as of one year prior to the date of this Draft Red Herring Prospectus:
Sr.
No. Name of the Shareholder
Number of equity
shares^*
Percentage of the fully
diluted equity share
capital (%)*
1. Ashraf Mohammed Biran 1,871,134 24.22
2. Gulshan Haresh Bakhtiani 1,824,097 23.61
3. Serum Institute of India Private Limited(1) 1,116,314 14.45
4. Rising Sun Holdings Private Limited(2) 606,410 7.06
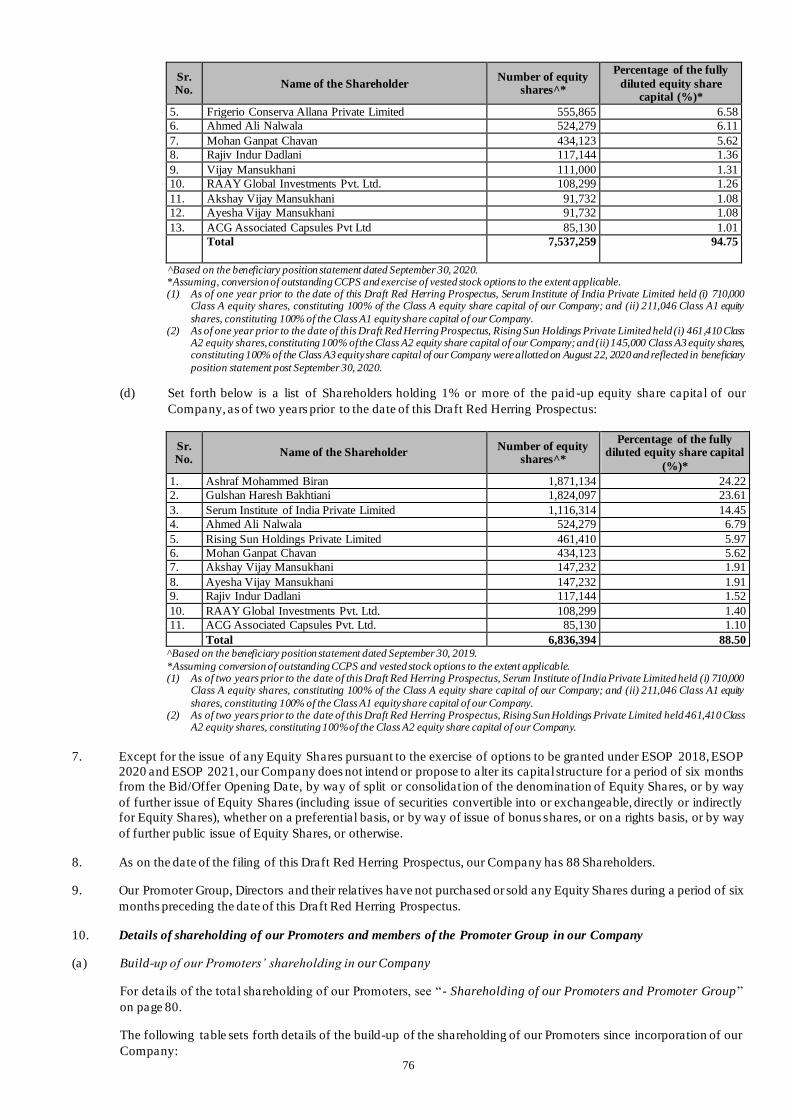
76
Sr. No.
Name of the Shareholder Number of equity
shares^*
Percentage of the fully
diluted equity share capital (%)*
5. Frigerio Conserva Allana Private Limited 555,865 6.58
6. Ahmed Ali Nalwala 524,279 6.11
7. Mohan Ganpat Chavan 434,123 5.62
8. Rajiv Indur Dadlani 117,144 1.36
9. Vijay Mansukhani 111,000 1.31
10. RAAY Global Investments Pvt. Ltd. 108,299 1.26
11. Akshay Vijay Mansukhani 91,732 1.08
12. Ayesha Vijay Mansukhani 91,732 1.08
13. ACG Associated Capsules Pvt Ltd 85,130 1.01
Total 7,537,259
94.75
Based on the beneficiary position statement dated September 30, 2020. *Assuming, conversion of outstanding CCPS and exercise of vested stock options to the extent applicable. (1) As of one year prior to the date of this Draft Red Herring Prospectus, Serum Institute of India Private Limited held (i) 710,000
Class A equity shares, constituting 100% of the Class A equity share capital of our Company; and (ii) 211,046 Class A1 equity
shares, constituting 100% of the Class A1 equity share capital of our Company. (2) As of one year prior to the date of this Draft Red Herring Prospectus, Rising Sun Holdings Private Limited held (i) 461,410 Class
A2 equity shares, constituting 100% of the Class A2 equity share capital of our Company; and (ii) 145,000 Class A3 equity shares, constituting 100% of the Class A3 equity share capital of our Company were allotted on August 22, 2020 and reflected in beneficiary
position statement post September 30, 2020.
(d) Set forth below is a list of Shareholders holding 1% or more of the paid -up equity share capital of our
Company, as of two years prior to the date of this Draft Red Herring Prospectus:
Sr. No.
Name of the Shareholder Number of equity
shares^*
Percentage of the fully diluted equity share capital
(%)*
1. Ashraf Mohammed Biran 1,871,134 24.22
2. Gulshan Haresh Bakhtiani 1,824,097 23.61
3. Serum Institute of India Private Limited 1,116,314 14.45
4. Ahmed Ali Nalwala 524,279 6.79
5. Rising Sun Holdings Private Limited 461,410 5.97
6. Mohan Ganpat Chavan 434,123 5.62
7. Akshay Vijay Mansukhani 147,232 1.91
8. Ayesha Vijay Mansukhani 147,232 1.91
9. Rajiv Indur Dadlani 117,144 1.52
10. RAAY Global Investments Pvt. Ltd. 108,299 1.40
11. ACG Associated Capsules Pvt. Ltd. 85,130 1.10
Total 6,836,394 88.50 ^Based on the beneficiary position statement dated September 30, 2019.
*Assuming conversion of outstanding CCPS and vested stock options to the extent applicable. (1) As of two years prior to the date of this Draft Red Herring Prospectus, Serum Institute of India Private Limited held (i) 710,000
Class A equity shares, constituting 100% of the Class A equity share capital of our Company; and (ii) 211,046 Class A1 equity
shares, constituting 100% of the Class A1 equity share capital of our Company. (2) As of two years prior to the date of this Draft Red Herring Prospectus, Rising Sun Holdings Private Limited held 461,410 Class
A2 equity shares, constituting 100% of the Class A2 equity share capital of our Company.
7. Except for the issue of any Equity Shares pursuant to the exercise of options to be granted under ESOP 2018, ESOP
2020 and ESOP 2021, our Company does not intend or propose to alter its capital structure for a period of six months
from the Bid/Offer Opening Date, by way of split or consolidat ion of the denomination of Equity Shares, or by way
of further issue of Equity Shares (including issue of securities convertible into or exchangeable, directly or indirectly
for Equity Shares), whether on a preferential basis, or by way of issue of bonus shares, or on a rights basis, or by way
of further public issue of Equity Shares, or otherwise.
8. As on the date of the filing of this Draft Red Herring Prospectus, our Company has 88 Shareholders.
9. Our Promoter Group, Directors and their relatives have not purchased or sold any Equity Shares during a period of six
months preceding the date of this Draft Red Herring Prospectus.
10. Details of shareholding of our Promoters and members of the Promoter Group in our Company
(a) Build-up of our Promoters’ shareholding in our Company
For details of the total shareholding of our Promoters, see “- Shareholding of our Promoters and Promoter Group”
on page 80.
The following table sets forth details of the build-up of the shareholding of our Promoters since incorporation of our
Company:

77
Date of allotment /
transfer
Nature of
consideration
Nature of
transaction
No. of equity
shares allotted / transferred
Face
value per equity
share
(₹)
Offer /
acquisition price (₹)
Percentage
of the pre-Offer
capital
(%)
Percentag
e of the post-Offer
capital
(%)
Ashraf Mohammed Biran
February 19, 2008 Cash Subscription to the
Memorandum of
Association
250 100 100 0.02 [●]
March 31, 2009 Cash Rights issue 1,500 100 100 0.15 [●]
September 16, 2010 Cash Rights issue 138,250 100 100 13.62 [●]
February 14, 2014 Pursuant to a resolution passed by our Shareholders on February 14, 2014, our Company sub-divided the face
value of its equity shares from ₹100 to ₹10 each. Therefore, the cumulative number of issued, subscribed and
paid-up equity shares held by Ashraf Mohammed Biran pursuant to sub-division is 1,400,000 equity shares of face value of ₹10 each.
April 7, 2014 Cash Transfer from
Ramesh Shantilal Mehta
507,700 10 33 5.00 [●]
September 10, 2014 Cash Conversion of loan
into equity
251,650 10 197.50 2.48 [●]
July 21, 2016 Cash Rights issue 7,094 10 352.40 0.07 [●]
July 4, 2017 - Gift to Rajiv Indur Dadlani
(29,310) 10 - (0.29) [●]
September 28, 2017 Cash Transfer to other
shareholders(1)
(39,684) 10 494.56 (0.39) [●]
October 6, 2017 Cash Transfer to other
shareholders(2)
(6,888) 10 494.56 (0.07) [●]
October 10, 2017 Cash Transfer to Nailesh
Gandhi
(1,170) 10 494.56 (0.01) [●]
October 24, 2017 Cash Transfer to other shareholders(3)
(17,170) 10 494.56 (0.17) [●]
October 31, 2017 Cash Transfer to other
shareholders(4)
(12,839) 10 494.56 (0.13) [●]
November 21, 2017 Cash Transfer to Serum
Institute of India
Private Limited
(97,634) 10 494.56 (0.96) [●]
November 23, 2017 Cash Transfer to Laxmi
Investments
(3,618) 10 494.56 (0.04) [●]
December 5, 2017 Cash Transfer to Prahlad
Deora
(1,444) 10 494.56 (0.01) [●]
December 7, 2017 Cash Transfer to Pooja
Deora
(1,444) 10 494.56 (0.01) [●]
December 11, 2017 Cash Transfer to S N
Damani Realty
Investors LLP
(2,888) 10 494.56 (0.03) [●]
December 20, 2017 Cash Transfer to RAAY
Global Investments
Private Limited
(7,221) 10 494.56 (0.07) [●]
June 6, 2019 Cash Transfer to other
shareholders(5)
(4,823) 10 1,192 (0.05) [●]
June 10, 2019 Cash Transfer to other
shareholders(6)
(18,131) 10 1,192 (0.18) [●]
June 18, 2019 Cash Transfer to Allana Investments and
Trading Company
Private Limited
(4,200) 10 1,192 (0.04) [●]
June 21, 2019 Cash Transfer to other shareholders(7)
(37,703) 10 1,192 (0.37) [●]
June 22, 2019 Cash Transfer to other
shareholders(8)
(3,357) 10 1,192 (0.03) [●]
July 6, 2019 Cash Transfer to Kajal
Kamal Fabiani
(5,786) 10 1,192 (0.06) [●]
July 9, 2021 Pursuant to a resolution passed by our Shareholders on July 9, 2021, our Company sub-divided the face value
of its equity shares from ₹10 to ₹2 each. Therefore, the cumulative number of issued, subscribed and paid-up
equity shares held by Ashraf Mohammed Biran pursuant to sub-division is 9,355,670 Equity Shares of face
value of ₹2 each.
July 24, 2021 NA Bonus issue of one
Equity Share for
every five Equity
Shares
1,871,134 2 NA 3.69 [●]

78
Date of allotment /
transfer
Nature of
consideration
Nature of
transaction
No. of equity
shares allotted / transferred
Face
value per equity
share
(₹)
Offer /
acquisition price (₹)
Percentage
of the pre-Offer
capital
(%)
Percentag
e of the post-Offer
capital
(%)
Total 11,226,804 - - 22.12 [●]
(1) 4,836 equity shares were transferred to Aditya Rajendra Sah HUF and 34,848 equity shares were transferred to Ahmed Ali
Nalwala.
(2) 2,296 equity shares were each transferred to Kunal Ramesh Babani, Anmol Prakash Babani and Sharan Mohan Babani. (3) 8,585 equity shares were each transferred to Akshay Vijay Mansukhani and Ayesha Mansukhani.
(4) 12,539 equity shares were transferred to Rajiv Indur Dadlani (jointly held with Indur Dadlani and Jaya Dadlani) and 150
equity shares were each transferred to Bhavana Rajiv Dadlani and Jaya Dadlani (jointly held with Indur Dadlani and Rajiv
Indur Dadlani).
(5) 799 equity shares were transferred to Benaifer Malandkar, 1,342 equity shares were transferred to Kunal Ramesh Babani, 1,341 equity shares were transferred to Anmol Prakash Babani and 1,341 equity shares were transferred to Sharan Mohan
Babani.
(6) 11,896 equity shares were transferred to Allana Investments and Trading Company Limited and 6,235 equity shares were
transferred to Patni Wealth Advisors LLP.
(7) 36,656 equity shares were transferred to Ahmed Ali Nalwala and 1,047 equity shares were transferred to Chetan Surendra Dalal.
(8) 1,259 equity shares were transferred to Prahlad Deora and 2,098 equity shares were transferred to Puneet Deora.
Gulshan Haresh Bakhtiani
February 19, 2008 Cash Subscription to the
Memorandum of
Association
250 100 100 0.02 [●]
March 31, 2009 Cash Rights issue 1,750 100 100 0.17 [●]
September 16, 2010 Cash Rights issue 158,000 100 100 15.56 [●]
February 14, 2014 Pursuant to a resolution passed by our Shareholders on February 14, 2014, our Company sub-divided the face
value of its equity shares from ₹100 to ₹10 each. Therefore, the cumulative number of issued, subscribed and
paid-up equity shares held by Gulshan Haresh Bakhtiani pursuant to sub-division is 1,600,000 equity shares of face value of ₹10 each.
April 7, 2014 Cash Transfer from
Ramesh Shantilal Mehta
92,300 10 33 0.91 [●]
September 10, 2014 Cash Conversion of loan
into equity
284,560 10 197.50 2.80 [●]
July 21, 2016 Cash Rights issue 14,188 10 352.40 0.14 [●]
June 7, 2017 - Gift to Rajiv Indur Dadlani
(33,433) 10 - (0.33) [●]
September 27, 2017 Cash Transfer to other
shareholders(1)
(4,836) 10 494.56 (0.05) [●]
September 28, 2017 Cash Transfer to Parikshit
Vaid
(2,379) 10 494.56 (0.02) [●]
October 5, 2017 Cash Transfer to other
shareholders(2)
(6,888) 10 494.56 (0.07) [●]
October 24, 2017 Cash Transfer to other
shareholders(3)
(17,170) 10 494.56 (0.17) [●]
October 31, 2017 Cash Transfer to Rajiv
Indur Dadlani
(jointly with Indur Dadlani and Jaya
Dadlani)
(12,995) 10 494.56 (0.13) [●]
December 8, 2017 Cash Transfer to other shareholders(4)
(6,950) 10 494.56 (0.07) [●]
December 20, 2017 Cash Transfer to RAAY
Global Investments
Private Limited
(7,221) 10 494.56 (0.07) [●]
January 29, 2018 Cash Transfer to
Riddhymic
Technologies Private Limited
(1,079) 10 494.56 (0.01) [●]
June 10, 2019 Cash Transfer to Allana
Investments and Trading Company
Private Limited
(11,897) 10 1,192 (0.12) [●]
June 13, 2019 Cash Transfer to other
shareholders(5)
(18,610) 10 1,192 (0.18) [●]
June 21, 2019 Cash Transfer to other
shareholders(6)
(37,707) 10 1,192 (0.37) [●]
July 6, 2019 Cash Transfer to Kajal
Kamal Fabiani
(5,786) 10 1,192 (0.06) [●]

79
Date of allotment /
transfer
Nature of
consideration
Nature of
transaction
No. of equity
shares allotted / transferred
Face
value per equity
share
(₹)
Offer /
acquisition price (₹)
Percentage
of the pre-Offer
capital
(%)
Percentag
e of the post-Offer
capital
(%)
July 9, 2021 Pursuant to a resolution passed by our Shareholders on July 9, 2021, our Company sub-divided the face value
of its equity shares from ₹10 to ₹2 each. Therefore, the cumulative number of issued, subscribed and paid-up
equity shares held by Gulshan Haresh Bakhtiani pursuant to sub-division is 9,120,485 Equity Shares of face
value of ₹2 each.
July 24, 2021 NA Bonus issue of one
Equity Share for
every five Equity
Shares
1,824,097 2 NA 3.59 [●]
Total 10,944,582 - 21.56 [●]
(1) 2,546 equity shares were transferred to Vivek Rajendra Sah HUF and 2,290 equity shares were transferred to Aditya Rejendra Sah HUF.
(2) 2,296 equity shares were each transferred to Kunal Ramesh Babani, Anmol Prakash Babani and Sharan Mohan Babani.
(3) 8,585 equity shares were each transferred to Akshay Vijay Mansukhani and Ayesha Mansukhani.
(4) 3,580 equity shares were transferred to Laxmi Investments and 3,370 equity shares were transferred to Puneet Deora.
(5) 6,234 equity shares were transferred to Patni Wealth Advisors LLP, 2,100 equity shares were transferred to Narendra Dedhia, 5,873 equity shares were transferred to RAAY Global Investments Private Limited, 208 equity shares were transferred to
Benaifer Malandkar and 4,195 equity shares were transferred to Parikshit Vaid.
(6) 36,656 equity shares were transferred to Ahmed Ali Nalwala and 1,051 equity shares were transferred to Chetan Surendra
Dalal.
Mohan Ganpat Chavan
February 19, 2008 Cash Subscription to the
Memorandum of Association
250 100 100 0.02 [●]
March 31, 2009 Cash Rights issue 250 100 100 0.02 [●]
September 16, 2010 Cash Rights issue 39,500 100 100 3.89 [●]
February 14, 2014 Pursuant to a resolution passed by our Shareholders on February 14, 2014, our Company sub-divided the face
value of its equity shares from ₹100 to ₹10 each. Therefore, the cumulative number of issued, subscribed and paid-up equity shares held by Mohan Ganpat Chavan pursuant to sub-division is 400,000 equity shares of
face value of ₹10 each.
September 10, 2014 Cash Conversion of loan into equity
71,390 10 197.50 0.70 [●]
July 21, 2016 Cash Rights issue 7,094 10 352.40 0.07 [●]
June 27, 2017 - Gift to Rajiv Indur
Dadlani
(8,361) 10 - (0.08) [●]
October 9, 2017 Cash Transfer to Phoenicia Shipping
Company Private
Limited
(8,284) 10 494.56 (0.08) [●]
October 13, 2017 Cash Transfer to Prakash
Gala
(608) 10 494.56 (0.01) [●]
October 16, 2017 Cash Transfer to
Siddharth Gala
(201) 10 494.56 Negligible [●]
October 24, 2017 Cash Transfer to other
shareholders(1)
(17,168) 10 494.56 (0.17) [●]
October 26, 2017 Cash Transfer to other
shareholders(2)
(1,172) 10 494.56 (0.01) [●]
October 31, 2017 Cash Transfer to Rajiv Indur Dadlani
(jointly with Indur
Dadlani and Jaya
Dadlani)
(3,470) 10 494.56 (0.03) [●]
November 6, 2017 Cash Transfer to other
shareholders(3)
(4,317) 10 494.56 (0.04) [●]
November 27, 2017 Cash Transfer to Benaifer
Malandkar
(780) 10 494.56 (0.01) [●]
July 9, 2021 Pursuant to a resolution passed by our Shareholders on July 9, 2021, our Company sub-divided the face value
of its equity shares from ₹10 to ₹2 each. Therefore, the cumulative number of issued, subscribed and paid-up equity shares held by Mohan Ganpat Chavan pursuant to sub-division is 2,170,615 Equity Shares of face
value of ₹2 each.
July 24, 2021 NA Bonus issue of one Equity Share for
every five Equity
Shares
434,123 2 NA 0.86 [●]
Total 2,604,738 [●] - 5.13 [●]
(1) 8,584 equity shares were each transferred to Akshay Vijay Mansukhani and Ayesha Mansukhani.
(2) 586 equity shares were each transferred to Nirav Gandhi and Keyur Gandhi.

80
Date of allotment /
transfer
Nature of
consideration
Nature of
transaction
No. of equity
shares allotted / transferred
Face
value per equity
share
(₹)
Offer /
acquisition price (₹)
Percentage
of the pre-Offer
capital
(%)
Percentag
e of the post-Offer
capital
(%)
(3) 1,619 equity shares were transferred to Abhishek Agarwal and 1,349 equity shares were each transferred to Sneh Bhandari
and Vijay Bhandari.
All the Equity Shares held by our Promoters were fully paid-up on the respective dates of allotment or transfer of such
Equity Shares.
Other than the following Equity Shares, none of the Equity Shares held by our Promoters are pledged or otherwise
encumbered. :
(i) 213,140 Equity Shares held by Ashraf Mohammed Biran, of which 71,320 Equity Shares have been pledged
pursuant to a pledge agreement dated July 2, 2020 in relation to a facility availed from Axis Bank Limited,
71,820 Equity Shares have been pledged pursuant to a deed of pledge dated October 29, 2018 in favour of
IDFC Bank Limited and 70,000 Equity Shares have been pledged pursuant to a deed of pledge dated January
4, 2017 and supplemental deed of pledge dated February 20, 2018 in relation to a facility availed from Yes
Bank Limited. Pursuant to a resolution passed by our Shareholders on July 9, 2021, our Company sub-divided
the face value of its equity shares from ₹10 to ₹2 each . Therefore, as on date of this Draft Red Herring
Prospectus, 1,065,700 Equity Sha res held by Ashraf Mohammed Biran, which constitutes 2.10% of the pre-
Offer paid-up Equity Share capital of our Company have been pledged;
(ii) 213,140 Equity Shares held by Gulshan Haresh Bakhtiani, of which 71,320 Equity Shares have been pledged
pursuant to a pledge agreement dated July 2, 2020 in relation to a facility availed from Axis Bank Limited,
71,820 Equity Shares have been pledged pursuant to a deed of pledge dated October 29, 2018 in favour of
IDFC Bank Limited and 70,000 Equity Shares have been pledged pursuant to a deed of pledge dated January
4, 2017 and supplemental deed of pledge dated February 20, 2018 in relation to a facility availed from Yes
Bank Limited. Pursuant to a resolution passed by our Shareholders on July 9, 2021, our Company sub-divided
the face value of its equity shares from ₹10 to ₹2 each . Therefore, as on date of this Draft Red Herring
Prospectus, 1,065,700 Equity Shares held by Gulshan Haresh Bakhtiani, which constitutes 2.10% of the pre-
Offer paid-up Equity Share capital of our Company have been pledged;
(iii) 75,820 Equity Shares held by Mohan Ganpat Chavan , of which 27,360 have been pledged pursuant to a
pledge agreement dated July 2, 2020 in relation to a loan availed from Axis Bank Limited, 27,360 Equity
Shares have been pledged pursuant to a deed of pledge dated October 29, 2018 in favour of IDFC Bank
Limited and 21,100 Equity Shares have been pledged pursuant to a deed of pledge dated January 4, 2017 and
supplemental deed of pledge dated February 20, 2018 in relation to a facility availed from Yes Bank Limited.
Pursuant to a resolution passed by our Shareholders on July 9, 2021, our Company sub-divided the face value
of its equity shares from ₹10 to ₹2 each . Therefore, as on date of this Draft Red Herring Prospectus, 379,100
Equity Shares held by Mohan Ganpat Chavan, which constitutes 0.75% of the pre-Offer paid-up Equity Share
capital of our Company have been pledged;
(b) Shareholding of our Promoters and Promoter Group
The details of the shareholding of our Promoters and the members of the Promoter Group as on the date of this Draft
Red Herring Prospectus are set forth in the table below:
Sr. No. Name of the Shareholder Pre-Offer Post-Offer*
No. of Equity Shares % of total Share-
holding
No. of Equity
Shares
% of total
Share-holding
Promoters
4. Ashraf Mohammed Biran# 11,226,804 22.12 [●] [●]
5. Gulshan Haresh Bakhtiani# 10,944,582 21.56 [●] [●]
6. Mohan Ganpat Chavan# 2,604,738 5.13 [●] [●]
Total (A) 24,776,124 48.81 [●] [●]
Promoter Group
2. Anita Gulshan Bakhtiani 40,548 0.08 [●] [●]
Total (B) 40,548 0.08 [●] [●]
Total (A)+(B) 24,816,672 48.89 [●] [●] * Subject to finalisation of Basis of Allotment.
# Also the Promoter Selling Shareholders.
11. Details of Promoters’ contribution and lock-in

81
(a) Pursuant to Regulations 14 and 16 of the SEBI ICDR Regulations, an aggregate of 20% of the post -Offer equity share
capital of our Company held by our Promoters (on a fully diluted basis) shall be locked in for a period of eighteen
months, or such other period as prescribed under the SEBI ICDR Regulations, as minimum promoters’ contribution
from the date of Allotment (“Promoters’ Contribution”), and our Promoters’ shareholding in excess of 20% of the
post-Offer equity share capital shall be locked in for a period of six months from the date of Allotment.
(b) Details of the Equity Shares to be locked-in for eighteen months, or such other period as prescribed under the SEBI
ICDR Regulations from the date of Allotment as Promoters’ Contribution are set forth in the table below.
Name of
Promoter
Number
of Equity Shares
Locked-
in(1)(2)
Date of
Allotment/ Transfer*
Nature of
Transaction
Face
Value (₹)
Issue/
Acquisition Price per Equity
Share (₹)
Percentage of
pre-Offer paid-up equity share
capital
Percentage of
post-Offer paid-up equity share
capital
[●] [●] [●] [●] [●] [●] [●] [●]
* Subject to finalisation of Basis of Allotment (1) For a period of eighteen months, or such other period as prescribed under the SEBI ICDR Regulations from the date of Allotment (2) All Equity Shares were fully paid-up at the time of allotment
Our Promoters have given their consent to include such number of Equity Shares held by them as disclosed above,
constituting 20% of the post-Offer equity share capital of our Company (assuming full conversion of vested options,
if any, under ESOP 2018, ESOP 2020 and ESOP 2021) as Promoters’ Contribution and have agreed not to sell, transfer,
charge, pledge or otherwise encumber in any manner the Promoters’ Contribution from the date of filing this Draft
Red Herring Prospectus, until the expiry of the lock-in period specified above, or for such other time as required under
SEBI ICDR Regulations, except as may be permitted, in accordance with the SEBI ICDR Regulations.
(c) Our Company undertakes that the Equity Shares that are being locked -in are not ineligible for computation of
Promoters’ Contribution in terms of Regulation 15 of the SEBI ICDR Regulations. In this connection, we confirm that
the Equity Shares considered as Promoters’ Contribution:
(i) have not been acquired during the immediately preceding three years from the date of this Draft Red Herring
Prospectus for consideration other than cash, involving any revaluation of assets or capitalisation of intangible
assets;
(ii) did not result from a bonus issue during the immediately preceding three years from the date of this Draft Red
Herring Prospectus, by utilisation of revaluation reserves or unrealised profits of the Company, or from bonus
issue against Equity Shares which are otherwise ineligible for Promoters’ Contribution;
(iii) are not acquired or subscribed to during the immediately preceding year from the date of this Draft Red
Herring Prospectus at a price lower than the price at which the Equity Shares are being offered to the public
in the Offer; and
(iv) are not subject to any pledge or any other encumbrance.
All Equity Shares held by our Promoters are held in dematerialized form prior to filing of this Draft Red Herring
Prospectus.
Further, our Company has not been formed by conversion of a partnership firm or a limited liability partnership firm
into a company.
12. Details of other lock-in
In addition to the 20% of the post-Offer shareholding of our Company held by our Promoters and locked in for eighteen
months as specified above, in terms of the SEBI ICDR Regulations, the entire pre-Offer equity share capital of our
Company will be locked-in for a period of six months from the date of Allotment except for (i) the Equity Shares
offered pursuant to the Offer for Sale; and (ii) any Equity Shares held by the eligible employees (whether currently
employees or not) of our Company arising out of options granted under the ESOP 2018, ESOP 2020 and ESOP 2021.
As required under Regulation 20 of the SEBI ICDR Regulations, our Company shall ensure that the details of the
Equity Shares locked-in are recorded by the relevant Depository.
In terms of Regulation 22 of the SEBI ICDR Regulations, the Equity Shares held by our Promoters, which are locked -
in may be transferred to and among the members of our Promoter Group or to any new promoter of our Company,
subject to continuation of the lock-in in the hands of the transferees for the remaining period (and such transferees
shall not be eligible to transfer until the expiry of the lock-in period) and compliance with the Takeover Regulations,
as applicable.

82
Pursuant to Regulation 21(a) of the SEBI ICDR Regulations, the Equity Shares held by our Promoters, which are
locked-in for a period of eighteen months from the date of Allotment may be pledged as collateral security for loans
granted by scheduled commercial banks, public financial institutions, NBFC-SI or housing finance companies,
provided that such loans have been granted by such bank or institution f or the purpose of financing one or more of the
objects of the Offer and pledge of the Equity Shares is a term of sanction of such loans.
Pursuant to Regulation 21(b) of the SEBI ICDR Regulations, the Equity Shares held by our Promoters which are
locked-in for a period of six months from the date of Allotment may be pledged only with scheduled commercial
banks, public financial institutions, NBFC-SI or housing finance companies as collateral security for loans granted by
such banks or public financial institutions, provided that such pledge of the Equity Shares is one of the terms of the
sanction of such loans.
The Equity Shares held by any person other than our Promoters and locked -in for a period of six months from the date
of Allotment in the Offer may be transferred to any other person holding the Equity Shares which are locked -in, subject
to continuation of the lock-in in the hands of transferees for the remaining period (and such transferees shall not be
eligible to transfer until the expiry of the lock-in period) and compliance with the Takeover Regulations.
13. Lock-in of the Equity Shares to be allotted, if any, to the Anchor Investors
Any Equity Shares Allotted to Anchor Investors shall be locked-in for a period of 30 days from the date of Allotment.
14. Neither our Company, nor the Directors have entered into any buy-back arrangements for purchase of Equity Shares
from any person. Further, the Book Running Lead Managers have not entered into any buy -back arrangements for
purchase of Equity Shares from any person.
15. Except as disclosed in “Our Management” beginning on page 181, none of our Directors or Key Managerial Personnel
hold any Equity Shares of our Company.
16. Except as disclosed in “- Employee Stock Option Scheme” on page 82, our Company has no outstanding warrants,
options to be issued or rights to convert debentures, loans or other convertible instruments into Equity Shares as on the
date of this Draft Red Herring Prospectus.
17. All Equity Shares offered and Allotted pursuant to the Offer shall be fully paid-up at the time of Allotment.
18. As on the date of this Draft Red Herring Prospectus, the Book Running Lead Managers and their associates (as defined
under the Securities and Exchange Board of India (Merchant Bankers) Regulations, 1992) do not hold any Equity
Shares of our Company.
19. There have been no financing arrangements whereby our Promoters, members of our Promoter Group, our Directors
and their relatives have financed the purchase by any other person of securities of our Company (other than in the
normal course of the business of the relevant financing entity) during a period of six months immediately preceding
the date of filing of this Draft Red Herring Prospectus.
20. No person connected with the Offer, including, but not limited to, the Book Running Lead Managers, the members of
the Syndicate, our Company, Directors, Promoters, and member of our Promoter Group shall offer any incentive,
whether direct or indirect, in the nature of discount, commission and allowance, except for fees or commission for
services rendered in relation to the Offer, in any manner, whether in cash or kind or services or otherwise to any Bidder
for making a Bid.
21. Our Company shall ensure that there shall be only one denomination of the Equity Shares, unless otherwise permitted
by law.
22. Our Promoters and their respective Promoter Groups shall not participate in the Offer and shall not receive any
proceeds from the Offer, except to the extent of the Offer for Sale.
23. Our Company shall ensure that transactions in Equity Shares by our Promoters and our Promoter Group du ring the
period between the date of filing of this Draft Red Herring Prospectus and the date of closure of the Offer shall be
reported to the Stock Exchanges within 24 hours of such transaction.
24. Employee Stock Option Scheme
ESOP 2018
Our Company, pursuant to the resolutions passed by our Board on November 12, 2018 and our Shareholders on
November 26, 2018, adopted ESOP 2018, which has since been amended pursuant to resolutions passed by our Board
on March 11, 2020 and September 1, 2021 and resolution passed by our Shareholders on September 23, 2021 The
objective of ESOP 2018 is to reward key employees for their past association and performance, motivate them to

83
contribute to the growth and profitability of our Company and attract and retain talent in the organization.
Under ESOP 2018, the total number of options available shall be as determined by our Board or a committee duly
constituted by our Board to implement, administer and supervise ESOP 2018 (“ESOP Committee”) from time to time
and shall be issued to key employees with each option conferring a right upon such employee to apply for one fully
paid-up Equity Share of our Company. The options granted under ESOP 2018 shall vest on the date on which (i) our
Company files this Draft Red Herring Prospectus with SEBI; (ii) a liquidity event which result s in our Promoters’
shareholding falling below 26% of the Equity Share capital of our Company is approved by our Board; or (iii) our
Company achieves a topline of ₹ 12,600 million and an EBITDA of ₹ 1,000 million during a particular financial year,
subject to the grantee having completed 60 months of employment with our Company (“ Vesting Conditions”),
whichever is earlier. In the event that none of the Vesting Conditions have occurred on or before March 31 of each
financial year, 20% or such other number as determined by our Board or the ESOP Committee shall automatically vest
on April 1 of such financial year subject to the grantee, as on March 31 of the previous financial year, (i) completing
one year of employment; (ii) one year since the grant of options; and (iii) having been on our Company’s payroll and
not having served any notice of termination of employment. The exercise price shall be as determined by the ESOP
Committee or our Board from time to time, in accordance with applicable laws.
As on the da te of this Draft Red Herring Prospectus, there are no outstanding options which are to be granted under
ESOP 2018.
The ESOP 2018 is in compliance with the SEBI SBEB Regulations.
The details of ESOP 2018, as certified by Ramesh M Sheth & Associates, Chartered Accountants, through a certificate
dated September 30, 2021 are as follows:
Particulars Total*
Options granted 2,03,692
Options vested (excluding options that have been exercised) 5,000
Options exercised 17,412
Total number of Equity Shares that would arise as a result of full exercise of options granted (net
of cancelled options)
96,564
Options forfeited/lapsed/cancelled 1,07,128
Money realised by exercise of options 43,53,000
Total number of options in force 79,152
Particulars Financial Year 2019
Financial Year 2020
Financial Year 2021
For the period from April 1,
2021 till the date
of this Draft Red
Herring
Prospectus*
Options granted 1,53,692 25,000 5,000 20,000
Options vested 0 0 17,412 5,000
Options exercised 0 0 17,412 0
Exercise price (in ₹) 250 250 250 250
Options forfeited/ lapsed/ cancelled 10,000 44,564 43,564 9,000
Total number of Equity Shares that would
arise as a result of full exercise of options
granted (net of forfeited/ lapsed/ cancelled
options)
1,43,692 1,24,128 85,564 96,564
Variation in terms of options N.A. Change in Vesting
Conditions, giving
the Committee
right to vest 20% or such other
number of options
as may be
determined by
them on April 01 of each year, with
the first such
vesting taking
place on April 01,
2020 based on the conditions
mentioned.
N.A. Change in Plan to
align the same
with SEBI SBEB
Regulations.
Money realised by exercise of options 0 0 43,53,000 0
Total number of options in force 1,43,692 1,24,128 68,152 79,152
Employee wise details of options

84
Particulars Financial Year
2019
Financial Year
2020
Financial Year
2021
For the period
from April 1, 2021 till the date
of this Draft Red
Herring
Prospectus*
granted to
(i) Key Managerial Personnel
Name of
Key
Managerial
Personnel
Financial
Year 2019
Financial
Year 2020
Financial
Year 2021
For the
period from
April 1,
2021 till the date of this
Draft Red
Herring
Prospectus
Gaurav Shah 17,282 Nil 2,500 10,000
Pankaj
Kumar
17,282 Nil 2,500 10,000
(ii) Any other employee who received a grant in any one year of options amounting
to 5% or more of the options granted
during the year
Name of
employee
Financial
Year
2019
Financial
Year 2020
Financial
Year
2021
For the
period from
April 1, 2021
till the date
of this Draft Red Herring
Prospectus
Sudhakar Sharma 34,564 Nil Nil Nil
Kingshuk Basu 34,564 Nil Nil Nil
Ashish Sharma 10,000* Nil Nil Nil
Palani Durai 10,000 Nil Nil Nil
Vinayak Agarwal 10,000 Nil Nil Nil
Ajit Jadhav 10,000 Nil Nil Nil
Rakesh Rajpurohit 10,000 Nil Nil Nil
Smita Sahu Nil 10,000 Nil Nil
Anirban
Chakraborti
Nil 10,000 Nil Nil
Zahud Ali Nil 5,000 Nil Nil
*This was subsequently cancelled during the same financial year.
(iii) Identified employees who are granted options, during any one year equal to or
exceeding 1% of the issued capital
(excluding outstanding warrants and
conversions) of our Company at the time
of grant
None
Fully diluted EPS on a pre-Offer basis
pursuant to the issue of Equity Shares on
exercise of options calculated in accordance with the applicable accounting
standard on ‘Earnings per Share’ (in ₹)
Financial Year
2019
Financial Year
2020
Financial Year
2021
For the period
from April 1,
2021 till the date of this Draft Red
Herring
Prospectus
(0.31) (0.82) (6.72) N.A.
Difference between employee
compensation cost calculated using the
intrinsic value of stock options and the employee compensation cost that shall
have been recognised if the Company had
used fair value of options and impact of
this difference on profits and EPS of the
Company
Had the compensation for the stock options granted under the scheme been
determined based on fair value approach the Company’s net profit/(loss) and
earnings per share would have been as per the pro-forma amounts indicated herein:
Particulars March 31,
2019
March 31,
2020
March 31,
2021
Net Profit/ (loss) as reported 32.52 87.90 (348.47)
Add: Stock Based Employee
compensation Expenses
included in Net profit
0 0 29.38
Less: Stock based Employee
Compensation Determined
under fair value based method (Pro Forma)
(4.50) (29.57) (29.38)
Net Profit/ (loss) (Pro-forma) 28.02 58.32 (348.47)

85
Particulars Financial Year
2019
Financial Year
2020
Financial Year
2021
For the period
from April 1, 2021 till the date
of this Draft Red
Herring
Prospectus*
Basic Earnings per share of
Rs.10 Each (as reported) (Rs)
5.70 14.24 (7.11)
Basic Earnings per share of
Rs.10 Each (Pro-forma) (Rs)
4.90 9.53 (7.71)
Description of the pricing formula and the
method and significant assumptions used
during the year to estimate the fair values
of options, including weighted-average information, namely, risk-free interest
rate, expected life, expected volatility,
expected dividends and the price of the
underlying share in market at the time of
grant of the option
The fair value of options used to compute Proforma net profit / (loss) and the
earnings per Equity Share have been estimated on the date of the grant using
Black-Scholes model.
The key assumptions used in Black-Scholes model for calculating fair value as on
the date of the grant are: Financial Year 2019
Financial Year 2020
Financial Year 2021
For the period from April 1,
2021 till the date
of this Draft Red
Herring
Prospectus
- Expected life of options (years) Between 3.00
years to 3.95
years
Between 3.00
years to 4 years
1.42 years -
- Volatility (% p.a.) Between 12% to
13.36%
Between 16.82%
to 17.99%
Between 26.17%
to 26.18%
-
- Risk Free Rate of Return (%) Between 6.70 %
to 6.80%
Between 5.49% to
5.70%
Between 3.85% to
3.91%
-
- Dividend Yield (% p.a.) 0 0 0 -
- Exercise price per share (₹) 250 250 250 -
The weighted average share price (Exercise Price) on the date of grant (₹)
NA NA 250 -
Impact on profits and EPS of the last three
years if the Company had followed the accounting policies specified in the SEBI
SBEB Regulations in respect of options
granted in the last three years
Particulars Financial
Year 2019
Financial
Year 2020
Financial
Year 2021
Net Profit/ (loss) as reported 32.52 87.90 (348.47)
Add: Stock Based
Employee compensation
Expenses included in Net
profit (of Plan A)
0 0 29.38
Less: Stock based
Employee Compensation
Determined under fair value based method (Pro Forma)
(4.50) (29.57) (29.38)
Net Profit/ (loss) (Pro-
forma)
28.02 58.32 (348.47)
Basic Earnings per share of
Rs.10 Each (as reported)
(Rs)
5.70 14.24 (7.11)
Basic Earnings per share of
Rs.10 Each (Pro-forma)
(Rs)
4.90 9.53 (7.71)
Intention of the Key Managerial Personnel
and whole-time directors who are holders
of Equity Shares allotted on exercise of options granted under an employee stock
option scheme or allotted under an
employee stock purchase scheme, to sell
their Equity Shares within three months
after the date of listing of the Equity Shares in the Offer (aggregate number of
Equity Shares intended to be sold by the
holders of options), if any
The key managerial personnel of the Company have represented to the company
that they may sell the equity shares allotted to them on exercise of options granted
under the employee stock option Scheme, within three months after the date of listing of Equity Shares pursuant to the Offer.
Intention to sell Equity Shares arising out
of an employee stock option scheme or
allotted under an employee stock purchase
scheme within three months after the date
of listing, by Directors, senior managerial personnel and employees having Equity
Shares issued under an employee stock
option scheme or employee stock purchase
There are no Directors, senior management personnel and employees having
Equity Shares arising out of the employee stock option scheme, amounting to more
than 1% of the issued capital.

86
Particulars Financial Year
2019
Financial Year
2020
Financial Year
2021
For the period
from April 1, 2021 till the date
of this Draft Red
Herring
Prospectus*
scheme amounting to more than 1% of the
issued capital (excluding outstanding
warrants and conversions) of the Company
* Prior to considering (i) subdivision of Equity Shares of face value of ₹ 10 each to ₹ 2 each done by the Company on July 9, 2021
and (ii) equity bonus issue in the ratio of one equity share for every five equity shares held done by the Company on July 24, 2021.
ESOP 2020
Our Company, pursuant to the resolutions passed by our Board on October 7, 2020 and our Shareholders on October
15, 2020, adopted ESOP 2020, which has since been amended pursuant to a resolution passed by our Board on
September 1, 2021 and resolutions passed by our Shareholders on September 23, 2021 . The objective of ESOP 2020
is to reward key employees for their past association and performance, motivate them to contribute to the growth and
profitability of our Company and attract and retain talent in the organization.
Under ESOP 2020, the total number of options available shall be as determined by our Board or a committee duly
constituted by our Board to implement, administer and supervise ESOP 2020 (“ESOP Committee”) from time to time
and shall be issued to key employees with each option conferring a right upon such employee to apply for one fully
paid-up Equity Share of our Company. The options granted under ESOP 2020 shall vest on the date on which (i) our
Company files this Draft Red Herring Prospectus with SEBI; (ii) a liquidity event which results in our Promoters’
shareholding falling below 26% of the Equity Share capital of our Company is approved by our Board; or (iii) our
Company achieves a topline of ₹ 27,000 million and an EBITDA of ₹ 2,160 million during a particular financial year,
subject to the grantee having completed 60 months of employment with our Company (“ Vesting Conditions”),
whichever is earlier. In the event that none of the Vesting Conditions have occurred on or before March 31 of each
financial year, 20% or such other number a s determined by our Board or the ESOP Committee shall automatically vest
in the second quarter of such financial year (with the first vesting taking place in Fiscal 2023) and subject to the grantee,
as on March 31 of the previous financial year, (i) completing one year of employment; (ii) completing one year since
the grant of options; and (iii) having been on our Company’s payroll and not having served any notice of termination
of employment. The exercise price shall be as determined by the ESOP Committee or our Board from time to time, in
accordance with applicable laws.
As on the date of this Draft Red Herring Prospectus, there are no outstanding options which are to be granted under
ESOP 2020.
The ESOP 2020 is in compliance with the SEBI SBEB Regulations.
The details of ESOP 2020, as certified by Ramesh M Sheth & Associates, Chartered Accountants, through a certificate
dated September 30, 2021 are as follows:
Particulars Total
Options granted 54,782
Options vested (excluding options that have been exercised) Nil
Options exercised Nil
Total number of Equity Shares that would arise as a result of full exercise of options granted (net
of cancelled options)
54,782
Options forfeited/lapsed/cancelled Nil
Money realised by exercise of options Nil
Total number of options in force 54,782
Particulars Financial Year 2019
Financial Year 2020
Financial Year 2021
For the period from April 1,
2021 till the date
of this Draft Red
Herring
Prospectus
Options granted - - 47,282 7,500
Options vested - - 0 0
Options exercised - - 0 0
Exercise price (in ₹) - - 900 900
Options forfeited/ lapsed/ cancelled - - 0 0
Total number of Equity Shares that
would arise as a result of full exercise of
options granted (net of forfeited/ lapsed/
- - 47,282 54,782

87
Particulars Financial Year
2019
Financial Year
2020
Financial Year
2021
For the period
from April 1, 2021 till the date
of this Draft Red
Herring
Prospectus
cancelled options)
Variation in terms of options - - N.A. Change in Plan to
align the same with SEBI SBEB
Regulations.
Money realised by exercise of options - - 0 0
Total number of options in force - - 47,282 54,782
Employee wise details of options granted to
(i) Key Managerial Personnel Name of KMP Financial
Year 2019
Financial
Year 2020
Financial
Year 2021
For the
period from
April 1,
2021 till the
date of this Draft Red
Herring
Prospectus
Arindam Dutta Nil Nil 17,282 Nil
(ii) Any other employee who received a
grant in any one year of options
amounting to 5% or more of the options
granted during the year
Name of
Employee
Financial
Year 2019
Financial
Year 2020
Financial
Year 2021
For the
period from
April 1,
2021 till the date of this
Draft Red
Herring
Prospectus
Robbin
Payapalli
Nil Nil 10,000 Nil
Shashank Chakarwarti
Nil Nil 10,000 Nil
Zahid Shaikh Nil Nil 10,000 Nil
Haarshal
Thaker
Nil Nil Nil 7,500
(iii) Identified employees who are
granted options, during any one year equal to or exceeding 1% of the issued
capital (excluding outstanding warrants
and conversions) of our Company at the
time of grant
None
Fully diluted EPS on a pre-Offer basis
pursuant to the issue of Equity Shares on
exercise of options calculated in
accordance with the applicable accounting standard on ‘Earnings per
Share’ (in ₹)
Financial Year
2019
Financial Year
2020
Financial Year
2021
For the period
from April 1,
2021 till the date
of this Draft Red Herring
Prospectus
- - (7.11) N.A
Difference between employee
compensation cost calculated using the
intrinsic value of stock options and the
employee compensation cost that shall have been recognised if the Company
had used fair value of options and impact
of this difference on profits and EPS of
the Company
Not applicable as Company has followed similar accounting policies for Financial
Year 2021, as mentioned in the Securities and Exchange Board of India (Share Based
Employee Benefits and Sweat Equity) Regulations, 2021.
Description of the pricing formula and
the method and significant assumptions
used during the year to estimate the fair
values of options, including weighted-average information, namely, risk-free
interest rate, expected life, expected
The fair value of options used to compute Proforma net profit / (loss) and the earnings
per Equity Share have been estimated on the date of the grant using Black-Scholes
model.
The key assumptions used in Black-Scholes model for calculating fair value as on
the date of the grant are:

88
Particulars Financial Year
2019
Financial Year
2020
Financial Year
2021
For the period
from April 1, 2021 till the date
of this Draft Red
Herring
Prospectus
volatility, expected dividends and the
price of the underlying share in market
at the time of grant of the option
Financial Year
2019
Financial Year
2020
Financial Year
2021
For the period
from April 1,
2021 till the date
of this Draft Red Herring
Prospectus
- Expected life of options (years) - - 1.42 years -
- Volatility (% p.a.) - - Between 26.17%
to 26.18%
-
- Risk Free Rate of Return (%) - - Between 3.85% to
3.91%
-
- Dividend Yield (% p.a.) - - 0 -
- Exercise price per share (₹) - - 900 -
The weighted average share price (Exercise Price) on the date of grant (₹)
- - 900 -
Impact on profits and EPS of the last
three years if the Company had followed
the accounting policies specified in the SEBI SBEB Regulations in respect of
options granted in the last three years
Not applicable as Company has followed similar accounting policies for Financial
Year 2021, as mentioned in the Securities and Exchange Board of India (Share Based
Employee Benefits and Sweat Equity) Regulations, 2021.
Intention of the Key Managerial
Personnel and whole-time directors who
are holders of Equity Shares allotted on
exercise of options granted under an
employee stock option scheme or allotted under an employee stock
purchase scheme, to sell their Equity
Shares within three months after the date
of listing of the Equity Shares in the
Offer (aggregate number of Equity Shares intended to be sold by the holders
of options), if any
The key managerial personnel of the Company have represented to the Company that
they may sell the equity shares allotted to them on exercise of options granted under
the employee stock option Scheme, within three months after the date of listing of
Equity Shares pursuant to the Offer.
Intention to sell Equity Shares arising out of an employee stock option scheme
or allotted under an employee stock
purchase scheme within three months
after the date of listing, by Directors,
senior managerial personnel and employees having Equity Shares issued
under an employee stock option scheme
or employee stock purchase scheme
amounting to more than 1% of the issued
capital (excluding outstanding warrants and conversions) of the Company
There are no Directors, senior management personnel and employees having Equity Shares arising out of the employee stock option scheme, amounting to more than 1%
of the issued capital.
ESOP 2021
Our Company, pursuant to the resolutions passed by our Board on July 15, 2021 and our Shareholders on July 23,
2021, adopted ESOP 2021, which has since been amended pursuant to a resolution passed by our Board on September
1, 2021 and resolutions passed by our Shareholders on September 23, 2021 . The objective of ESOP 2021 is to reward
key employees for their past association and performa nce, motivate them to contribute to the growth and profitability
of our Company and attract and retain talent in the organization. The total number of options available under ESOP
2021 is 1,088,946.
Under ESOP 2021, the total number of options available shall be not more than 1,088,946 options and shall be issued
to key employees with each option conferring a right upon such employee to apply for one fully paid -up Equity Share
of our Company. The options granted under ESOP 2021 shall vest in accordance with applicable law after the expiry
of 12 months from the grant date and shall vest in equal instalments of 25% each year, or such other percentage as may
be determined by our Board or a committee duly constituted by our Board to implement, administer and s upervise
ESOP 2021 (“ESOP Committee”). The exercise price shall be as determined by the ESOP Committee or our Board
from time to time, in accordance with applicable laws.
As on the date of this Draft Red Herring Prospectus, there are 851,346 outstanding options which are to be granted

89
under ESOP 2021.
The ESOP 2021 is in compliance with the SEBI SBEB Regulations.
The details of ESOP 2021, as certified by Ramesh M Sheth & Associates, Chartered Accountants, through a certificate
dated September 30, 2021 are as follows:
Particulars Total
Options granted 2,37,600
Options vested (excluding options that have been exercised) 0
Options exercised 0
Total number of Equity Shares that would arise as a result of full exercise of options granted (net
of cancelled options)
2,37,600
Options forfeited/lapsed/cancelled 0
Money realised by exercise of options 0
Total number of options in force 2,37,600
Particulars Financial Year 2019
Financial Year 2020
Financial Year 2021
For the period from April 1,
2021 till the date
of this Draft Red
Herring
Prospectus
Options granted - - - 237,600
Options vested - - - 0
Options exercised - - - 0
Exercise price (in ₹) - - - 166.67
Options forfeited/ lapsed/ cancelled - - - 0
Total number of Equity Shares that would
arise as a result of full exercise of options
granted (net of forfeited/ lapsed/ cancelled
options)
- - - 237,600
Variation in terms of options - - - Change in Plan to
align the same with
SEBI SBEB
Regulations.
Money realised by exercise of options - - - 0
Total number of options in force - - - 237,600
Employee wise details of options
granted to
(i) Key Managerial Personnel
Name of KMP For the period from April 1,
2021 till the date of this Draft
Red Herring Prospectus
Nidhi Vora 6,000
(ii) Any other employee who received a
grant in any one year of options amounting
to 5% or more of the options granted during the year
Name of Employee For the period from April 1, 2021 the
date of this Draft Red Herring
Prospectus
Kaustubh Lahiri 18,000
Vinayak Bhivare 13,200
Maqsood Mirza 18,000
Deepanjan Dey 13,200
(iii) Identified employees who are granted
options, during any one year equal to or
exceeding 1% of the issued capital
(excluding outstanding warrants and
conversions) of our Company at the time of grant
Nil
Fully diluted EPS on a pre-Offer basis
pursuant to the issue of Equity Shares on exercise of options calculated in
accordance with the applicable accounting
standard on ‘Earnings per Share’ (in ₹)
Financial Year
2019
Financial Year
2020
Financial Year
2021
For the period
from April 1, 2021 till the date
of this Draft Red
Herring
Prospectus
- - - NA

90
Particulars Financial Year
2019
Financial Year
2020
Financial Year
2021
For the period
from April 1, 2021 till the date
of this Draft Red
Herring
Prospectus
Difference between employee
compensation cost calculated using the
intrinsic value of stock options and the
employee compensation cost that shall have been recognised if the Company had
used fair value of options and impact of
this difference on profits and EPS of the
Company
NA
Description of the pricing formula and the
method and significant assumptions used
during the year to estimate the fair values
of options, including weighted-average
information, namely, risk-free interest rate, expected life, expected volatility,
expected dividends and the price of the
underlying share in market at the time of
grant of the option
NA
Financial Year
2019
Financial Year
2020
Financial Year
2021
For the period
from April 1, 2021 till the date
of this Draft Red
Herring
Prospectus
- Expected life of options (years) - - - NA
- Volatility (% p.a.) - - - NA
- Risk Free Rate of Return (%) - - - NA
- Dividend Yield (% p.a.) - - - NA
- Exercise price per share (₹) - - - NA
The weighted average share price
(Exercise Price) on the date of grant (₹)
- - - NA
Impact on profits and EPS of the last three
years if the Company had followed the accounting policies specified in the SEBI
SBEB Regulations in respect of options
granted in the last three years
Financial Year
2019
Financial Year
2020
Financial Year
2021
For the period
from April 1, 2021 till the date
of this Draft Red
Herring
Prospectus
- - - NA
Intention of the Key Managerial Personnel and whole-time directors who are holders
of Equity Shares allotted on exercise of
options granted under an employee stock
option scheme or allotted under an
employee stock purchase scheme, to sell their Equity Shares within three months
after the date of listing of the Equity
Shares in the Offer (aggregate number of
Equity Shares intended to be sold by the
holders of options), if any
The key managerial personnel of the Company have represented to the Company that they may sell the equity shares allotted to them on exercise of options granted under
the employee stock option Scheme, within three months after the date of listing of
Equity Shares pursuant to the Offer.
Intention to sell Equity Shares arising out
of an employee stock option scheme or
allotted under an employee stock purchase
scheme within three months after the date of listing, by Directors, senior managerial
personnel and employees having Equity
Shares issued under an employee stock
option scheme or employee stock purchase
scheme amounting to more than 1% of the issued capital (excluding outstanding
warrants and conversions) of the Company
Not Applicable

91
OBJECTS OF THE OFFER
The Offer comprises of a Fresh Issue of up to [●] Equity Shares aggregating up to ₹ 4,000.00 million by our Company and an
Offer for Sale of up to 16,044,709 Equity Shares aggregating up to ₹ [●] million by the Selling Shareholders. For details, see
“The Offer” on page 55, respectively.
The Selling Shareholders will be entitled to their respective portion of the proceeds of the Offer for Sale after deducting t heir
proportion of Offer expenses and relevant taxes thereon. Our Company will not receive any proceeds from the Offer for Sale
and the proceeds received from the Offer for Sale will not form part of the Net Proceeds. Other than the listing fees and stamp
duty payable on issue of Equity Shares pursuant to Fresh Issue, which will be borne by our Company, all cost, fees and expenses
(including all applicable taxes) in respect of the Offer will be shared amongst our Company and the Selling Shareholders on a
pro-rata basis, in proportion to the Equity Shares issued and allotted by our Company in the Fresh Issue and the Offered Shares
sold by the Selling Shareholders in the Offer for Sale, upon successful completion of the Offer unless the Offer is withdrawn
or abandoned on account of an act or omission which is solely and directly attributable to a Selling Shareholder.
The Fresh Issue
Our Company proposes to utilise the Net Proceeds towards funding of the following objects:
1. Funding capital expenditure for setting up of new stores;
2. Repayment/prepayment, in part or full, of all or certain of our borrowings;
3. Funding incremental working capital requirements of our Company; and
4. General corporate purposes.
(collectively, referred to herein as the “Objects”).
The main objects and objects incidental and ancillary to the main objects set out in the Memorandum of Association enable us
(i) to undertake our existing business activities; and (ii) to undertake the activities proposed to be funded from the Net Proceeds
and funds earmarked towards general corporate purposes shall be utilized. Further, our Company expects to receive the benefits
of listing of the Equity Shares, including to enhance our visibility and our brand image among our existing and potential
customers and creating a public market for our Equity Shares in India.
Net Proceeds
The details of the proceeds from the Fresh Issue are summarised in the following table:
Particulars Estimated amount (₹ in million)
Gross Proceeds of the Fresh Issue 4,000.00
(Less) Offer related expenses in relation to the Fresh Issue(1) [●]
Net Proceeds(1) [●] (1) To be finalised upon determination of the Offer Price and updated in the Prospectus prior to filing with the RoC.
Utilisation of Net Proceeds
The Net Proceeds are proposed to be utilised in accordance with the details provided in the following table:
Particulars Amount (₹ in million)
Funding capital expenditure for setting up of new stores 702.00
Repayment/prepayment, in part or full, of all or certain of our borrowings 1,000.00
Funding incremental working capital requirements of our Company 1,218.97
General corporate purposes(1) [●]
Total(1) [●] (1)
To be finalised upon determination of the Offer Price and updated in the Prospectus prior to filing with the RoC. The amount utilised for general corporate
purposes shall not exceed 25% of the Gross Proceeds.
Proposed schedule of implementation and deployment of Net Proceeds
We propose to deploy the Net Proceeds towards the Objects in accordance with the estimated schedule of implementation and
deployment of funds as follows: (₹ in million)
Particulars Amount to be funded from the Net
Proceeds
Estimated deployment of the Net Proceeds in Fiscals 2022 2023 2024
Funding capital expenditure for setting
up of new stores
702.00 78.00 273.00 351.00
Repayment/prepayment, in part or full, 1,000.00 1,000 - -
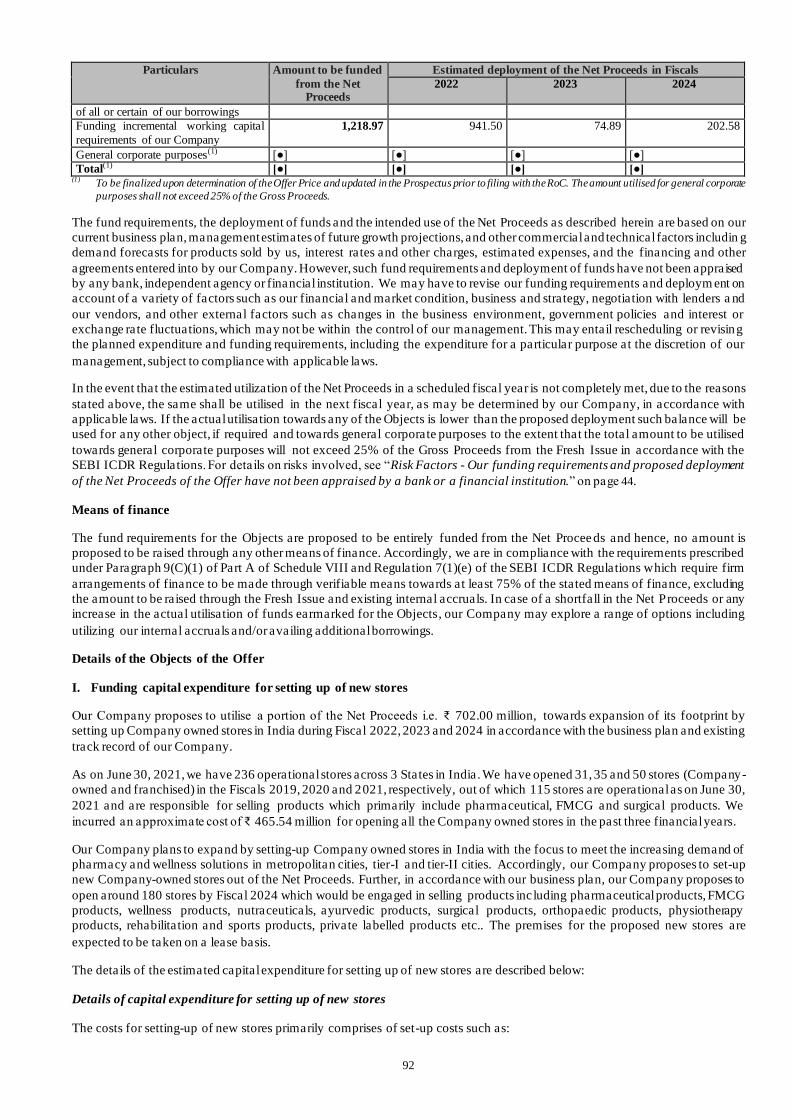
92
Particulars Amount to be funded
from the Net Proceeds
Estimated deployment of the Net Proceeds in Fiscals 2022 2023 2024
of all or certain of our borrowings
Funding incremental working capital
requirements of our Company
1,218.97 941.50 74.89 202.58
General corporate purposes(1) [●] [●] [●] [●]
Total(1) [●] [●] [●] [●] (1) To be finalized upon determination of the Offer Price and updated in the Prospectus prior to filing with the RoC. The amount utilised for general corporate
purposes shall not exceed 25% of the Gross Proceeds.
The fund requirements, the deployment of funds and the intended use of the Net Proceeds as described herein are based on our
current business plan, management estimates of future growth projections, and other commercial and technical factors includin g
demand forecasts for products sold by us, interest rates and other charges, estimated expenses, and the financing and other
agreements entered into by our Company. However, such fund requirements and deployment of funds have not been appraised
by any bank, independent agency or financial institution. We may have to revise our funding requirements and deploym ent on
account of a variety of factors such as our financial and market condition, business and strategy, negotiation with lenders a nd
our vendors, and other external factors such as changes in the business environment, government policies and interest or
exchange rate fluctuations, which may not be within the control of our management. This may entail rescheduling or revising
the planned expenditure and funding requirements, including the expenditure for a particular purpose at the discretion of our
management, subject to compliance with applicable laws.
In the event that the estimated utilization of the Net Proceeds in a scheduled fiscal year is not completely met, due to the reasons
stated above, the same shall be utilised in the next fiscal year, as may be determined by our Company, in accordance with
applicable laws. If the actual utilisation towards any of the Objects is lower than the proposed deployment such balance will be
used for any other object, if required and towards general corporate purposes to the extent that the total amount to be utilised
towards general corporate purposes will not exceed 25% of the Gross Proceeds from the Fresh Issue in accordance with the
SEBI ICDR Regulations. For details on risks involved, see “Risk Factors - Our funding requirements and proposed deployment
of the Net Proceeds of the Offer have not been appraised by a bank or a financial institution.” on page 44.
Means of finance
The fund requirements for the Objects are proposed to be entirely funded from the Net Procee ds and hence, no amount is
proposed to be raised through any other means of finance. Accordingly, we are in compliance with the requirements prescribed
under Paragraph 9(C)(1) of Part A of Schedule VIII and Regulation 7(1)(e) of the SEBI ICDR Regulations which require firm
arrangements of finance to be made through verifiable means towards at least 75% of the stated means of finance, excluding
the amount to be raised through the Fresh Issue and existing internal accruals. In case of a shortfall in the Net Proceeds or any
increase in the actual utilisation of funds earmarked for the Objects, our Company may explore a range of options including
utilizing our internal accruals and/or availing additional borrowings.
Details of the Objects of the Offer
I. Funding capital expenditure for setting up of new stores
Our Company proposes to utilise a portion of the Net Proceeds i.e. ₹ 702.00 million, towards expansion of its footprint by
setting up Company owned stores in India during Fiscal 2022, 2023 and 2024 in accordance with the business plan and existing
track record of our Company.
As on June 30, 2021, we have 236 operational stores across 3 States in India. We have opened 31, 35 and 50 stores (Company-
owned and franchised) in the Fiscals 2019, 2020 and 2021, respectively, out of which 115 stores are operational as on June 30,
2021 and are responsible for selling products which primarily include pharmaceutical, FMCG and surgical products. We
incurred an approximate cost of ₹ 465.54 million for opening all the Company owned stores in the past three financial years.
Our Company plans to expand by setting-up Company owned stores in India with the focus to meet the increasing demand of
pharmacy and wellness solutions in metropolitan cities, tier-I and tier-II cities. Accordingly, our Company proposes to set-up
new Company-owned stores out of the Net Proceeds. Further, in accordance with our business plan, our Company proposes to
open around 180 stores by Fiscal 2024 which would be engaged in selling products inc luding pharmaceutical products, FMCG
products, wellness products, nutraceuticals, ayurvedic products, surgical products, orthopaedic products, physiotherapy
products, rehabilitation and sports products, private labelled products etc.. The premises for the proposed new stores are
expected to be taken on a lease basis.
The details of the estimated capital expenditure for setting up of new stores are described below:
Details of capital expenditure for setting up of new stores
The costs for setting-up of new stores primarily comprises of set-up costs such as:

93
(a) Furniture, fixtures, electrical works and electronic items;
(b) Civil and interior works; and
(c) Information technology infrastructure costs.
Methodology for computation of estimated costs
The size of our existing stores range from 120 square feet to 3,000 square feet depending upon certain factors including
locations, lease rentals, localities, demographics, target customers etc. We have considered an average store size of 840 square
feet (“Average Size”) for arriving at the estimated costs for setting up stores. Our estimate of costs mentioned below are based
on (i) quotations received from our empanelled contractors or from vendors from whom our Company has purchased similar
items for our stores in the past; and; (ii) our internal estimates for specifications and item requirements based on our prior
experience of setting-up stores of similar size.
Our Company may, during the period of scheduled deployment, consider setting up additional st ores over and above the number
of stores proposed to be set-up from the proposed utilisation of the Net Proceeds. The requirement of funds for setting-up such
additional store will be met by way of internal accruals or by seeking additional borrowings from existing and future lenders or
such other means as available to our Company. Further, our Company may decide to accelerate the estimated expansion and
opening of new stores by the Company ahead of the schedule specified above.
The table below sets forth the total estimated costs for setting-up of a new store of Average Size:
Particulars Amount (In ₹ million)
Furnitures, fixtures, electrical works and electronic items 1.75
Civil and interior works 1.50
Information technology infrastructure costs 0.65
Total estimated cost per store of Average Size 3.90
The detailed break-up of these estimated costs is as below:
(a) Furniture, fixtures, electrical works and electronic items: These costs would include, inter alia, the costs in relation to
furniture including shelves, drawers etc. and fixtures and electronics including cassette air conditioner, Hi wall air
conditioners, refrigerators, lights, fans, televisions and other related equipment. The table below sets forth the basis of
our estimation for these items:
Particulars Total estimated costs (in ₹ million)
Furniture and fixtures (shelves, drawers shelf brackets, upright connectors) (1) 1.00
Electrical works (Wiring, fans, LED lights, telephone points)(2) and electronic items
(cassette air conditioner, Hi wall air conditioners, refrigerators, lights, fans, televisions)
and other related equipment (3)
0.75
Total estimated costs per store of Average Size 1.75 (1) Based on quotation dated August 11, 2021 received from Pacific Interio and the quotation is valid for a period of six months from the date of
quotation. (2) Based on quotation dated August 10, 2021 received from Pacific Interio and the quotation is valid for a period of six months from the date of
quotations. (3) Based on quotations received from multiple vendors for different equipment and the quotations are for various dates and are valid for a period
of six months from the date of respective quotations.
(b) Civil and interior works: These costs would include, inter alia, the costs in relation to (a) construction, renovation, and
repairs; (b) interior works including wooden works and carpentry, glass works, painting, plumbing and (c) signage costs.
The table below sets forth the basis of our estimation for the civil and interior costs:
Particulars Total estimated costs (in ₹ million)
Construction, renovation, and repairs (including dismantling work) (1) 0.09
Interior works (including wooden works and carpentry, glass works, painting, plumbing)(1) 1.23
Signage costs(2) 0.18
Total estimated costs per store of Average Size 1.50 (1) Based on quotation dated August 10, 2021 received from Pacific Interio and the quotation is valid for a period of six months from the date of
quotations. (2) Based on quotations each dated September 1, 2021 received from Clique Brand India LLP and the quotations are valid for a period of six
months from the date of quotations.
(c) Information technology infrastructure costs: These costs would include, inter alia, the costs for purchasing and installing
information technology equipment such as servers, desktops, monitors, tablets, printers, scanners and purchasing
software licenses. The table below sets forth the basis of our estimation for these costs:
Particulars Total estimated costs (in ₹ million)
Information technology equipment costs (including servers, desktops, monitors, tablets, 0.55

94
Particulars Total estimated costs (in ₹ million)
printers, scanners)(1)
Software license costs (2) 0.10
Total estimated costs per store of Average Size 0.65 (1) Based on quotation dated September 3, 2021 received from Get I.T. Solutions and the quotation is valid for a period of six months from the
date of quotation. (2) Based on quotation dated September 1, 2021 received from C-Square Info-Solutions Private Limited and the quotation is valid for a period of
six months from the date of quotation.
All quotations specified above are excluding the applicable taxes including goods and services tax and are valid as on date of
this Draft Red Herring Prospectus. Our Company may not have entered into any definitive agreements with any or all of these
contractors/vendors and there can be no assurance that the same contractors/vendors would be engaged to eventually supply
the materials. In the event of expiry of the existing quotations, our Company may engage vendors other than the ones from
whom we have obtained valid quotations. Accordingly, the costs quoted by such vendors may diff er from the current estimates.
None of our Promoter, Directors or KMPs have any interest in the proposed procurements, as stated above.
II. Repayment/prepayment, in part or full, of all or certain borrowings of our Company
Our Company has entered into various financial arrangements with banks, financial institutions and other entities. The loan
facilities entered into by our Company include borrowing in the form of, inter alia, term loans and working capital facilities.
For further details, see “Financial Indebtedness” beginning on page 290. As on August 31, 2021, the aggregate outstanding
borrowings of our Company (on a consolidated level) is ₹ 1,537.82 million.
Our Company proposes to utilise an estimated amount of ₹ 1,000.00 million from the Net Proceeds towards repayment/
prepayment, in part or full, of all or a portion of certain borrowings availed by our Company. The repayment/ prepayment, wil l
help reduce our outstanding indebtedness, debt servicing costs, assist us in maintaining a favourable debt-equity ratio and enable
utilisation of funds from our internal accruals for further investment in business growth and expansion. In addition, we believe
that this will enable us to raise further resources at competitive rates and additional funds / capital in the future to fund potential
business development opportunities and plans to grow and expand our business in the future. Further, our Company shall pay
the prepayment charges, if any, on the loans identified below, out of the portion of Net Proceeds available for repayment/
prepayment, in part or full, of all or a portion of certain borrowings.
Owing to nature of our business, we may avail additional facilities or repay certain instalments of our borrowings after the filing
of the Draft Red Herring Prospectus. Accordingly, our Company may choose to repay/ prepay certain borrowings availed by
our Company, other than those identified in the table below, which may include such additional borrowings, and the details
herein shall be suitably updated in the Red Herring Prospectus. Given the nature of these borrowings and the terms of
repayment/prepayment, the aggregate outstanding borrowing amounts may vary from time to time. Further, the amounts
outstanding under these borrowings as well as the sanctioned limits are dependent on several factors and may vary with our
business cycle with multiple intermediate repayments, drawdowns and enhancement of sanctioned limits. However, the
aggregate amount to be utilised from the Net Proceeds towards repayment/ prepayment of certain borrowings, in part or in full,
would not exceed ₹ 1,000.00 million.
The following table sets forth details of certain borrowings availed by our Company, out of which our Company may
repay/prepay, all or a portion of, any or all of the borrowings:
Sr.
No.
Name of
the
lender
Nature of
borrowing
Amount
availed
Amount
outstanding
as on August
31, 2021
Applicable
rate of
interest as on
August 31, 2021
Tenor Purpose* Prepayment
penalty/
conditions
(in ₹ million unless
otherwise mentioned)
1. IDFC
First
Bank
Limited
Term Loan 140.00 136.45 2.25% + 1 year
IDFC Bank Ltd
MCLR
60 months Capital
Expenditure
2% of amount
being prepaid, to be
calculated from the
date of payment till the maturity of the
loan
2. YES
Bank Limited
Term Loan 65.50 65.50 0.3% + 1 year
Yes Bank Ltd MCLR, subject
to cap of 9.25%
p.a.
60 months Working
Capital
NA
3. IDFC
First
Bank
Limited
Term Loan 55.60 55.60 0.45% + 1 year
IDFC Bank Ltd
MCLR
60 months Working
Capital
NA
4. HDFC
Bank
Term Loan 49.00 49.00 0.6% + 1 year
HDFC Bank
60 months Working
Capital
NA

95
Sr.
No.
Name of
the lender
Nature of
borrowing
Amount
availed
Amount
outstanding as on August
31, 2021
Applicable
rate of interest as on
August 31,
2021
Tenor Purpose* Prepayment
penalty/ conditions
(in ₹ million unless otherwise mentioned)
Limited Ltd MCLR
5. HDFC
Bank
Limited
Working
Capital
Demand
Loan
249.00 249.00 6.75% Facilities are
valid for 180
days from the
date of
sanction, or payable on
demand
Working
Capital
NA
6. YES Bank
Limited
Working Capital
Demand
Loan
230.00 230.00 0.05% + 1 month YES
Bank MCLR
90 days, revolving
Working Capital
NA
7. IDFC First
Bank
Limited
Working Capital
Demand
Loan
240.00 240.00 2%+ 3 months IDFC Bank
MCLR
180 days, revolving
Working Capital
Prepayment penalty of 2% of
the amount prepaid
8. Axis
Bank
Limited
Foreign
Currency
Term Loan
200.00
(US$
2.69
million)
200.00
(US$ 2.69
million)
7.75% 1 year from
date of
sanction
Working
Capital
NA
Total 1,240.10 1,225.55
For details on the borrowings, see “Financial Indebtedness” on page 290. * Pursuant to a report dated September 29, 2021, issued by our Statutory Auditor, they have reported that the amounts drawn-down under the aforementioned borrowings have been utilised towards the purpose for which such borrowings have been sanctioned as per the procedures performed by them detailed in their
report.
The selection of borrowings proposed to be repaid/ prepaid out of the borrowings provided above, shall be based on various
factors including (i) cost of the borrowings to our Company, including applicable interest rates, (ii) any conditions attached to
the borrowings restricting our ability to prepay the borrowings and time taken to fulfil such requiremen ts, (ii) receipt of consents
for prepayment or waiver from any conditions attached to such prepayment from our respective lenders, prior to completion of
the Offer (iii) terms and conditions of such consents and waivers, (iv) levy of any prepayment penalties and the quantum thereof,
(v) provisions of any law, rules, regulations governing such borrowings, and (vi) other commercial considerations including,
among others, the interest rate on the loan facility, the amount of the loan outstanding and the remain ing tenor of the loan.
Payment of interest, prepayment penalty or premium, if any, and other related costs shall be made by us out of the Net Proceeds
of the Offer.
There has been no instance of delays, defaults and rescheduling/restructuring of the aforementioned borrowings of the
Company.
III. Funding incremental working capital requirements of our Company
We fund a majority of our working capital requirements in the ordinary course of business from various banks and in ternal
accruals. As on August 31, 2021, the outstanding amount under the fund based working capital facilities of our Company was
₹ 970.65 million and the outstanding amount under non-fund based facilities availed by our Company, was ₹ 34.90 million. For
details, see “Financial Indebtedness” beginning on page 290.
Our Company requires additional working capital for funding its incremental working capital requirements in Fiscals 2022,
2023 and 2024. The funding of the incremental working capital requirements of our Company will lead to a consequent increase
in our profitability and achieving the proposed targets as per our business plan.
Basis of estimation of incremental working capital requirement
The details of our Company’s composition of net current assets or working capital as at March 31, 2021, March 31, 2020 and
March 31, 2019 on the basis of audited standalone financial statements for the financial year ended March 31, 2021 (including
audited standalone financial statements for financial year ended on March 31, 2019 and March 31, 2020, which have been
subjected to proforma Ind AS adjustments) were as under:
(₹ in million)
S. No. Particulars As at March 31,
2021
As at March 31,
2020
As at March 31,
2019
I. Current Assets
1 Inventories 1,533.06 1,246.78 1,051.19
2 Financial assets

96
S. No. Particulars As at March 31,
2021
As at March 31,
2020
As at March 31,
2019
(i) Investments 80.09 - -
(ii) Trade receivables 286.26 264.15 209.36
(iii) Cash and cash equivalents 167.23 154.27 58.61
(iv) Bank balances other than (iii) above 467.05 56.70 53.16
(v) Loans 97.01 114.34 166.76
(vi) Other financial assets 64.64 43.07 25.17
3 Right-to-returned-goods asset 3.47 2.37 1.88
4 Other current assets 167.79 93.46 58.27
Total current assets (A) 2,866.59 1,975.14 1,624.40
Total Current Assets excluding Cash, Bank Balance and
Investments
2,152.22 1,764.18 1,512.63
II. Current Liabilities
1 Financial liabilities
(i) Borrowings 604.79 607.50 646.78
(ii) Trade payables - - -
- Dues of Micro and Small Enterprises 23.54 11.09 21.90
- Dues of other than Micro and Small Enterprises 406.62 367.12 326.13
(iii) Other financial liabilities 118.28 77.36 41.90
(iv) Lease liabilities 749.74 651.91 521.18
2 Other current liabilities 35.61 32.22 28.04
3 Provisions 20.69 13.62 13.29
4 Current tax liabilities (net) - 0.26 5.80
Total current liabilities (B) 1,959.26 1,761.08 1,605.02
Total Current Liabilities excluding borrowings 1,236.20 1,076.22 916.34
III. Working Capital Requirements (A - B) 916.02 687.96 596.30
IV. Funding Pattern
(i) Current Liabilities
-Financial Liabilities
-Borrowings 604.79 607.50 596.30
(ii) Internal Accruals (balancing figure) 311.23 80.46 -
Total Means of Finance 916.02 687.96 596.30
As certified by Ramesh M Sheth & Associates. Chartered Accountants by a certificate dated September 30, 2021.
For reference in relation to the audited standalone financial statements, see the section “ Other Financial Information”,
beginning on page 289.
The details of our Company’s projected working capital requirements for the Fiscals 2022, 2023 and 2024 on the basis of
audited standalone financial statements for the financial year ended March 31, 2021 (including audited standalone financial
statements for financial year ended on March 31, 2019 and March 31, 2020, which have been subjected to proforma Ind AS
adjustments), management estimates and the incremental and proposed working capital requirements, as approved by the Board
of Directors of our Company pursuant to a resolution passed in its meeting dated September 29, 2021 are set out below: (₹ in million)
S. No. Particulars As at March 31,
2024
As at March 31,
2023
As at March 31,
2022
I. Current Assets
1 Inventories 4,560.37 3,302.95 2,277.69
2 Trade Receivables 836.07 605.54 417.58
3 Other financial and current assets 988.08 715.64 493.50
Total current assets (A) 6,384.52 4,624.13 3,188.77
II. Current Liabilities
1 Trade Payables 1,216.10 880.79 607.38
2 Lease Liabilities 2,204.18 1,596.43 1,100.88
3 Other financial and current liabilities 456.04 330.30 227.77 Total current liabilities (B) 3,876.32 2,807.51 1,936.04
III. Working Capital Requirements (A - B) 2,508.20 1,816.62 1,252.73
IV. Funding Pattern
Short-term borrowings 500.00 300.00 -
Equity + Internal Accruals + Others 789.23 800.23 311.23
Use of Proceeds 1,218.97 1,016.39 941.50
Ramesh M Sheth & Associates. Chartered Accountants by a certificate dated September 30, 2021 certified the working capital requirements of the Company.

97
Our Company proposes to utilize ₹ 1,218.97 million from the Net Proceeds towards funding our incremental working capital
requirements. In addition to the Net Proceeds, our Company expects that the funding pattern for working capital requirements
for Fiscals 2022, 2023 and 2024 will comprise of working capital facilities and internal accruals.
Key assumptions for working capital projections made by our Company:
Holding levels
The details of the holding levels (days) as at March 31, 2021, March 31, 2020 and March 31, 2019 on the basis of audited
standalone financial statements for the financial year ended March 31, 2021 (including audited standalone financial statements
for financial year ended on March 31, 2019 and March 31, 2020, which have been subjected to proforma Ind AS adjustments)
and the estimated holding levels (days) for the projected Fiscals 2022, 2023 and 2024 are as under:
Particulars
Number of days for the Fiscal ended
As at March
31, 2024
As at March
31, 2023
As at March
31, 2022
As at March
31, 2021
As at March
31, 2020
As at April
01, 2019
Inventory Days 60 60 60 61 53 57
Trade Receivable / Debtors Days
11 11 11 11 11 11
Other financial and current
assets
13 13 13 13 11 14
Trade Payable / Creditor Days 16 16 16 17 16 19
Lease Liabilities 29 29 29 30 28 28
Other financial and current
liabilities
6 6 6 7 5 5
As certified by Ramesh M Sheth & Associates. Chartered Accountants by a certificate dated September 30, 2021.
Key justification for holding levels
Sr No. Particulars Assumptions
1. Inventories Historically, the inventory days have ranged from 53 to 61. Given that the Company plans to open a large number of stores where they would need to invest in the inventory, the expected
inventory days are estimated to be on the higher end at 60 days.
2. Trade Receivable Historically, the trade receivables days have ranged from 10 to 12. Thus, this trend is estimated to be continued at 11 days
3. Other financial and current
assets
Other financial and current assets majorly comprise of short term loans, GST receivables and
advances to suppliers which are expected to be continued at similar levels in terms of days
4. Trade Payables Historically, the trade payable days have ranged from 16 to 19. Thus, this trend is expected to
be continued and hence, Trade payables days are estimated at 16.
5. Lease Liabilities Historically, the lease liabilities days have ranged from 28 to 30. Thus, this trend is expected
to be continued and hence, lease liabilities days are estimated at 29.
6. Other financial and current
liabilities and provisions
Other current liabilities consist of statutory remittances and provisions which are expected to
be continued at similar levels in terms of days As certified by Ramesh M Sheth & Associates. Chartered Accountants by a certificate dated September 29, 2021.
Our Statutory Auditors have provided no assurance on the prospective financial information or projections and have performed
no service with respect to it.
IV. General corporate purposes
Our Company proposes to deploy the balance Net Proceeds aggregating to ₹ [●] million towards general corporate purposes,
subject to such amount not exceeding 25% of the Gross Proceeds from the Fresh Issue, in compliance with the SEBI ICDR
Regulations. The general corporate purposes for which our Company proposes to utilise Net Proceeds include strategic
initiatives, funding growth opportunities, fuel growth engines for our brands, including meeting exigencies, brand building,
meeting expenses incurred by our Company in the ordinary course of business, as may be applicable.
In addition to the above, our Company may utilise the Net Proceeds towards other expenditure considered expedient and as
approved periodically by our Board, subject to compliance with necessary provisions of the Companies Act. The quantum of
utilisation of funds towards each of the above purposes will be determined by our Board, based on the amount actually available
under this head and the business requirements of our Company, from time to time.
Offer Expenses
The total expenses of the Offer are estimated to be approximately ₹ [●] million.
The Offer related expenses primarily include fees payable to the Book Running Lead Managers and legal counsels, fees payable

98
to the Auditors, brokerage and selling commission, underwriting commission, commission payable to Registered Brokers,
RTAs, CDPs, SCSBs’ fees, Sponsor Bank’s fees, Registrar’s fees, printing and stationery expenses, advertising and marketing
expenses and all other incidental and miscellaneous expenses for listing the Equity Shares on the Stock Exchanges.
Except for (a) listing fees and stamp duty payable on issue of Equity Shares pursuant to Fresh Issue which will be borne by our
Company; and (b) stamp duty payable on transfer of the Offered Shares and fees and expenses in relation to the legal counsel
to the Selling Shareholders which shall be borne by the respective Selling Shareholders, all Offer expen ses will be shared, upon
successful completion of the Offer, between our Company and the Selling Shareholders on a pro -rata basis in proportion to the
Equity Shares issued and allotted by our Company in the Fresh Issue and the Equity Shares sold by each of the Selling
Shareholders in the Offer for Sale, respectively and in accordance with applicable law unless the Offer is withdrawn or
abandoned on account of an act or omission which is solely and directly attributable to a Selling Shareholder. Any such Offer
expenses paid by our Company on behalf of the Selling Shareholders in the first instance will be reimbursed to our Company,
by the Selling Shareholders to the extent of its respective proportion of Offer related expenses upon the successful completion
of the Offer. The estimated Offer related expenses are as under:
Activity Estimated expenses(1)
(in ₹ million)
As a % of the total
estimated Offer expenses(1)
As a % of the total
Offer size(1)
Book Running Lead Managers’ fees (including brokerage
and selling commission)
[●] [●] [●]
Commission/processing fee for SCSBs, Sponsor Bank and
Bankers to the Offer. Brokerage and selling commission
and bidding charges for Members of the Syndicate,
Registered Brokers, RTAs and CDPs (2)(3)(4)(5)
[●] [●] [●]
Fees payable to the Registrar to the Offer [●] [●] [●]
Fees payable to the other advisors to the Offer [●] [●] [●]
Others
- Listing fees, SEBI filing fees, upload fees, BSE &
NSE processing fees, book building software fees
and other regulatory expenses
[●] [●] [●]
- Printing and stationery [●] [●] [●]
- Advertising and marketing expenses [●] [●] [●]
- Fee payable to legal counsels [●] [●] [●]
- Miscellaneous [●] [●] [●]
Total estimated Offer expenses [●] [●] [●] (1) Amounts will be finalised and incorporated in the Prospectus on determination of Offer Price (2) Selling commission payable to the SCSBs on the portion for Retail Individual Bidders and Non-Institutional Bidders, which are directly procured by the
SCSBs, would be as follows:
Portion for Retail Individual Bidders* [●]% of the Amount Allotted* (plus applicable taxes)
Portion for Non-Institutional Bidders* [●]% of the Amount Allotted* (plus applicable taxes) *
Amount Allotted is the product of the number of Equity Shares Allotted and the Offer Price (3) No processing fees shall be payable by our Company and the Selling Shareholders to the SCSBs on the applications directly procured by them.
Processing fees payable to the SCSBs on the portion for Retail Individual Bidders and Non-Institutional Bidders which are procured by the members of the Syndicate/sub-Syndicate/Registered Broker/RTAs/ CDPs and submitted to SCSB for blocking, would be as follows:
Portion for Retail Individual Bidders* ₹[●] per valid Bid cum Application Form (plus applicable taxes)
Portion for Non-Institutional Bidders* ₹[●] per valid Bid cum Application Form (plus applicable taxes) * Amount Allotted is the product of the number of Equity Shares Allotted and the Offer Price
(4) The Processing fees for applications made by Retail Individual Bidders using the UPI Mechanism would be as follows:
Sponsor Bank ₹[●] per valid Bid cum Application Form* (plus applicable taxes) The Sponsor Bank shall be responsible for making payments to the third parties
such as remitter bank, NCPI and such other parties as required in connection with the performance of its duties under the SEBI circulars, the Syndicate Agreement and other applicable laws.
* For each valid application (5) Selling commission on the portion for Retail Individual Bidders and Non-Institutional Bidders which are procured by members of the Syndicate (including
their sub-Syndicate Members), Registered Brokers, RTAs and CDPs would be as follows:
Portion for Retail Individual Bidders* [●]% of the Amount Allotted* (plus applicable taxes) Portion for Non-Institutional Bidders* [●]% of the Amount Allotted* (plus applicable taxes)
* Amount Allotted is the product of the number of Equity Shares Allotted and the Offer Price
Interim use of Net Proceeds
Our Company, in accordance with the policies formulated by our Board of Directors from time to time, will have flexibility to
deploy the Net Proceeds. Pending utilisation of the Net Proceeds for the purposes described above, our Company will
temporarily invest the Net Proceeds in deposits in one or m ore scheduled commercial banks included in the Second Schedule
of Reserve Bank of India Act, 1934, as may be approved by our Board. In accordance with Section 27 of the Companies Act,
2013, our Company confirms that it shall not use the Net Proceeds for bu ying, trading or otherwise dealing in shares of any
other listed company or for any investment in the equity markets.

99
Appraising entity
None of the objects for which the Net Proceeds will be utilised have been appraised by any agency.
Bridge financing facilities
Our Company has not raised any bridge loans from any bank or financial institution as on the date of this Draft Red Herring
Prospectus, which are proposed to be repaid from the Net Proceeds.
Monitoring of utilisation of funds
In accordance with Regulation 41 of the SEBI ICDR Regulations, our Company shall appoint [●] as the monitoring agency,
prior to the filing of the Red Herring Prospectus, for monitoring the utilisation of Net Proceeds, as the proposed Fresh Issu e
exceeds ₹ 1,000.00 million. Our Company will disclose the utilisation of the Net Proceeds, including interim use under a
separate head in our balance sheet for such fiscals as required under applicable law, specifying the purposes for which the Net
Proceeds have been utilised. Our Company will also, in its balance sheet for the applicable fiscals, provide details, if any, in
relation to all such Net Proceeds that have not been utilised, if any, of such currently unutilised Net Proceeds. Our Company
will indicate investments, if any, of unutilised Net Proceeds in the balance sheet of our Company for the relevant fiscals
subsequent to receipt of listing and trading approvals from the Stock Exchanges.
Pursuant to Regulation 32(3) of the SEBI Listing Regulations, our Company shall, on a quarterly basis, disclose to the Audit
Committee the uses and applications of the Net Proceeds. On an annual basis, our Company shall prepare a statement of funds
utilised for purposes other than those stated in this Draft Red Herring Prospectus and place it before the Audit Committee and
make other disclosures as may be required until such time as the Net Proceeds remain unutilised. Such disclosure shall be made
only until such time that all the Net Proceeds have been utilised in full. The statement shall be certified by the statutory auditor
of our Company. Furthermore, in accordance with Regulation 32(1) of the SEBI Listing Regulations, our Company shall furnish
to the Stock Exchanges on a quarterly basis, a statement indicating (i) deviations, if any, in the actual utilisation of the proceeds
of the Fresh Issue from the objects of the Fresh Issue as stated above; and (ii) details of category wise variations in the a ctual
utilisation of the proceeds of the Fresh Issue from the objects of the Fresh Issue as stated above. This information will also be
published in newspapers simultaneously with the interim or annual financial results and explanation for such variation (if any)
will be included in our Director’s report, after placing the same before the Audit Committee.
Variation in Objects
In accordance with Sections 13(8) and 27 of the Companies Act and applicable rules, our Company shall not vary the objects
of the Offer without our Company being authorised to do so by the Shareholders by way of a special re solution in accordance
with the applicable law. In addition, the notice issued to the Shareholders in relation to the passing of such special resolu tion
(the “Notice”) shall specify the prescribed details, including justification for such variation and be published and placed on
website of our Company, in accordance with the Companies Act, 2013, read with relevant rules.
The Notice shall simultaneously be published in the newspapers, one in English and one in Marathi, the vernacular language of
the jurisdiction where our Registered Office is situated. Pursuant to Section 13(8) of the Companies Act, 2013, our Promoters
or controlling shareholders will be required to provide an exit opportunity to the Shareholders who do not agree to such prop osal
to vary the objects, subject to the provisions of the Companies Act, 2013 and in accordance with such terms and conditions,
including in respect of pricing of the Equity Shares, in accordance with our Articles of Association, the Companies Act, 2013
and the SEBI ICDR Regulations.
Other confirmations
Except to the extent of the proceeds received pursuant to the Offer for Sale, none of our Promoters, Directors, KMPs , Promoter
Group or Group Companies will receive any portion of the Offer Proceeds and there are no materia l existing or anticipated
transactions in relation to utilization of the Net Proceeds with our Promoters, Directors, KMPs, Promoter Group or Group
Companies.
Further, pursuant to the Offer, the Net Proceeds received by our Company shall only be utilised for objects identified by our
Company and for general corporate purposes and none of our Promoters, Promoter Group , Group Companies and associates of
our Company, as applicable, shall receive a part of or whole Net Proceeds directly or indirectly.

100
BASIS FOR OFFER PRICE
The Offer Price will be determined by our Company in consultation with the Book Running Lead Managers, on the basis of
assessment of market demand for the Equity Shares offered through the Book Building Process and on the basis of q uantitative
and qualitative factors as described below. The face value of the Equity Shares is ₹ 2 each and the Offer Price is [●] times the
Floor Price and [●] times the Cap Price of the Price Band. Bidders should also see “Risk Factors”, “Our Business”, and
“Financial Information” and “Management’s Discussion and Analysis of Financial Condition and Results of Operations”
beginning on pages 26, 153, 204 and 294, respectively, to have an informed view before making an investment decision.
Qualitative Factors
Some of the qualitative factors and our strengths which form the basis for computing the Offer Price are:
• Unique retail platform within India’s fast-growing pharmaceutical retail sector
• Demonstrated track record of retail footprint expansion
• Omni-channel, hyper-local presence increasing customer touch points
• Valuable and trusted “Wellness Forever” brand
• Growth-ready, technology-backed infrastructure platform
• Led by a dynamic and experienced management team
For details, see “Our Business – Our Competitive Strengths” beginning on page 155.
Quantitative Factors
Some of the information presented below relating to our Company is derived from the Restated Consolidated Financial
Information. For details, see “Restated Consolidated Financial Information”, beginning on page 204.
Some of the quantitative factors which may form the basis for computing the Offer Price a re as follows:
A. Basic and Diluted Earnings Per Share (“EPS”) at face value of ₹ 2, as adjusted for change in capital:
Financial Year ended Basic EPS (in ₹) Diluted EPS (in
₹)
Weight
March 31, 2021 (7.11) (7.11) 3
March 31, 2020 (1.16) (1.16) 2
March 31, 2019 (0.31) (0.31) 1
Weighted Average (3.99) (3.99)
Notes:
(1) Weighted average = Aggregate of year-wise weighted EPS divided by the aggregate of weights i.e. (EPS x Weight) for each year/total of weights.
(2) Pursuant to a resolution passed by the shareholders of the Company dated July 9, 2021,(a) Compulsorily Convertible Preference Shares (CCPS) were converted to equity shares in the ratio 1:1 (b) Each equity share of the Company of face value of ₹ 10 was split into 5 equity
shares of face value of ₹ 2 each (c) Bonus shares issued in the ratio 1:5. All per share data ha s been calculated after giving effect to such stock split and bonus issue in accordance with principles of Ind AS 33-“Earnings per share”. The face value of each Equity Share is ₹ 2 each.
(3) Earnings per Share (₹) = Profit attributable to equity shareholders for the year/weighted average number of equity shares at the end of the year
(4) Basic and diluted earnings/ (loss) per equity share: Basic and diluted earnings/ (loss) per equity share are computed in accordance with Ind AS 33 notified under the Companies (Indian Accounting Standards) Rules, 2015 (as amended).
B. Price/Earning (“P/E”) ratio in relation to the in relation to Price Band of ₹[●] to ₹[●] per Equity Share:
Particulars P/E at the lower end of the
Price Band (no. of times)
P/E at the higher end of the
Price Band (no. of times)
Based on basic EPS for year ended March 31, 2021 [●] [●]
Industry Peer Group P/E ratio
We believe that there are no listed companies in India that are engaged in a business similar to that of our Company
C. Return on Net Worth (“RoNW”)
Derived from the Restated Consolidated Financial Information:

101
Financial Year ended RoNW (%) Weight
March 31, 2021 (13.35) 3
March 31, 2020 (3.22) 2
March 31, 2019 (1.21) 1
Weighted Average (7.95)
Notes:
1) Return on Net Worth ratio: Profit/ (loss) (before other comprehensive income) for the year attributable to equity shareholders of the Company divided by the total equity of the Company at the end of the year.
2) “Net worth” means the aggregate of Capital and Reserves and Surplus (excluding shares options outstanding account)
3) The Weighted Average Return on Net Worth is a product of Return on Net Worth and respective assigned weight, dividing the resultant by
total aggregate weight.
4) Net Asset Value (“NAV”) per Equity Share
Financial Year ended/ Period ended NAV per Equity Share (₹)
As on March 31, 2021 51.42
After the completion of the Offer At Floor Price: [●]
At Cap Price: [●]
Offer Price [●] Notes: (1) Offer Price per Equity Share will be determined on conclusion of the Book Building Process (2) Net Asset Value per equity share represents net worth attributable to equity shareholders, as restated, divided by the number of equity shares
outstanding including CCPS and along with dilutive potential equity shares. (3) “Net worth” means the aggregate of Capital and Reserves and Surplus (excluding shares options outstanding account).
5) Comparison with Listed Industry Peers
There are no listed companies in India that are comparable in all aspects of business and services that we provide.
Accordingly, it is not possible to provide an industry comparison in relation to our Company.
6) The Offer Price is [●] times of the face value of the Equity Shares
The Offer Price of ₹ [●] has been determined by our Company in consultation with the Book Running Lead Managers,
on the basis of market demand from investors for Equity Shares through the Book Building Process and is justified in
view of the above qualitative and quantitative parameters.
Investors should read the above mentioned information along with “Risk Factors”, “Our Business”, “Financial
Information” and “Management’s Discussion and Analysis of Financial Condition and Results of Operations” on
pages 26, 153, 204 and 294, respectively, to have a more informed view.
The trading price of the Equity Shares could decline due to the factors mentioned in the “ Risk Factors” on page 26
and you may lose all or part of your investment.

102
STATEMENT OF SPECIAL TAX BENEFITS
To,
The Board of Directors,
Wellness Forever Medicare Limited
7th Floor, Wing A, Empire Plaza, IT Park, LBS
Marg, Vikhroli (West),
Mumbai – 400083,
Maharashtra, India.
Re: Proposed initial public offering of equity shares of face value of Rs.2/- each (the “Equity Shares” and such offering
, the “Offer”) of Wellness Forever Medicare Limited (the “Company”)
Dear Sir(s)/Ma’am(s),
We report that the enclosed statement in the Annexure, states the possible special tax benefits under direct and indirect tax
laws presently in force in India, available to the Company and its shareholders. Several of these benefits are dependent on t he
Company or its shareholders as the case may be, fulfilling the conditions prescribed under the relevant provisions of the
statute. Hence, the ability of the Company or its shareholders to derive the special tax benefits is dependent upon their fulfilling
such conditions, which based on business imperatives the Company and its shareholders faces in the future, the Company and
its shareholders may or may not choose to fulfill.
The benefits discussed in the enclosed Annexure are not exhaustive. This statement is only intended to provide general
information to the investors and is neither designed nor intended to be a substitute for professional tax advice. In view of the
individual nature of the tax consequences and the changing tax laws, each investor is advised to consult his or her own tax
consultant with respect to the specific tax implications arising out of their participation in the Offer. Neither are we suggesting
nor advising the investor to invest in the Offer based on this statement.
We do not express any opinion or provide any assurance as to whether:
(i) the Company or its shareholders will continue to obtain these benefits in future; or
(ii) the conditions prescribed for availing the benefits have been/would be met with; or
(iii) the revenue authorities will concur with the views expressed herein.
The contents of the enclosed statement are based on information, explanations and representations obtained from the Company
and on the basis of our understanding of the business activities and operations of the Company.
We hereby give consent to include this statement of special tax benefits in the draft red herring prospectus, red herring
prospectus, prospectus and in any other material used in connection with the Offer (together, the “Offer Documents”).
This report may be relied on by the Book Running Lead Managers, their affiliates and legal counsel in relation to the Offer.
Yours faithfully,
Ramesh M Sheth & Associates
Chartered Accountants
ICAI FRN: 111883W
Mehul R. Sheth
Partner
Membership No.: 101598
UDIN: 21101598AAAAJA6039
Place: Mumbai
Date: September 29, 2021
Encl: As above

103
ANNEXURE
ANNEXURE TO THE STATEMENT OF POSSIBLE SPECIAL TAX BENEFITS AVAILABLE TO THE COMPANY
AND ITS SHAREHOLDERS UNDER THE APPLICABLE DIRECT AND INDIRECT TAX LAWS (“TAX LAWS”)
IN INDIA
Details of Tax Laws
1. Income Tax Act, 1961 (“IT Act”)
2. Central Goods and Services Tax Act, 2017
3. Integrated Goods and Services Tax Act, 2017
4. Respective State Goods and Services Tax Act, 2017
Outlined below are the possible special tax benefits available to the Company and it’s shareholders under the Tax Laws. These
possible special tax benefits are dependent on the Company and it’s shareholders fulfilling the conditions prescribed under t he
Tax Laws. Hence, the ability of the Company and it’s shareholders to derive the possible special tax benefits is dep endent upon
fulfilling such conditions, which are based on business imperatives it faces in the future, it may or may not choose to fulfill.
UNDER THE TAX LAWS
A. Special tax benefits available to the Company
The following special tax benefits may be available to the Company after fulfilling the conditions as per the respective
provisions of the tax laws identified supra:
1. Section 115BAA of the IT Act, as inserted vide The Taxation Laws (Amendment) Act, 2019, provides that the domestic
company can opt for a rate of tax of 22% (plus applicable surcharge and cess) for the Financial Year 2019 -20 (relevant
to Assessment Year 2020-21) onwards, provided the total income of the company is computed without claiming certain
specified incentives/ deductions or carry forward and set-off of certain losses, additional depreciation etc. and claiming
depreciation determined in the prescribed manner. In case the Company opts for Section 115BAA of the IT Act,
provisions of Minimum Alternate Tax (‘MAT’) under Section 115JB of the IT Act would not be applicable and MAT
credit of the earlier year(s) will not be available for set-off. The option needs to be exercised on or before the due date
of filing the tax return. Option once exercised, cannot be subsequently withdrawn for the same or any other tax year.
This beneficial tax treatment is available to company assessee in general.
In case where a Company does not opt for the lower tax rate, the Company would be liable to pay tax @ 25% or 30%
depending upon the prescribed turnover threshold (plus applicable surcharge and health and education cess).
2. In accordance with the provisions of Section 80M of the IT Act, dividend received by the company from any other
domestic company or a foreign company or a business trust, a deduction of an amount equal to so much of the amount
of income by way of dividends received from such other domestic company or foreign company or business trust as
does not exceed the amount of dividend distributed by the company on or before one month prior to due date of
furnishing the income-tax return under Section 139(1) for the relevant year, be allowed.
Further, any deduction, in respect of the amount of dividend distributed by the domestic company, has been allowed
under Section 80M(1) of the IT Act in any previous year, no deduction shall be allowed in respect of such amount in
any other previous year.
3. In accordance with and subject to fulfilment of conditions as laid out under Section 35D of the IT Act, the Company
may be entitled to amortize preliminary expenditure, being expenditure incurred in connection with the issue for public
subscription or in connection with expenditure as prescribed under Section 35D of the IT Act, subject to the limit
specified in Section 35D of the IT Act. The deduction is allowable for an amount equal to one-fifth of such expenditure
for each of five successive previous years beginning with the previous year in which the business commences or as the
case may be, the previous year in which the extension of the undertaking is completed, or the new unit commences
production or operation.
B. Special tax benefits available to the shareholders of the Company
Apart from the tax benefits available to each class of shareholders in general as such, there are no special tax benefits
available to the shareholders of the Company under the Tax Laws identified supra.
NOTES:
1. The above is as per the current tax laws, as amended by the Finance Act, 2021.

104
2. The above Statement of possible special tax benefits sets out the provisions of Tax Laws in a summary manner only
and is not a complete analysis or listing of all the existing and potential tax consequences of the purchase, ownership,
and disposal of equity shares of the Company.
3. The possible special tax benefits are subject to conditions and eligibility criteria which need to be examined for tax
implications.
4. This Statement does not discuss any tax consequences in any country outside India of an investment in the equity
shares of the Company. The shareholders / investors in any country outside India are advised to consult their own
professional advisors regarding possible income tax consequences that apply to them under the laws of such
jurisdiction.
5. The tax benefits discussed in the Statement are not exhaustive and are only intended to provide general information to
the investors and hence, is neither designed nor intended to be a substitute for professional tax advice. In view of the
individual nature of the tax consequences and the changing tax laws, each investor is advised to consult his or her own
tax consultant with respect to the specific tax implications arising out of their participation in the issue.
6. In respect of non-residents, the tax rates and the consequent taxation shall be further subject to any benef its available
under the applicable double taxation avoidance agreement, if any, between India and the country in which the non -
resident has fiscal domicile.
7. Surcharge is to be levied on domestic companies @ 7% where the income exceeds INR 1 crore but does not exceed
INR 10 crores and @ 12% where the income exceeds INR 10 crores. If the Company opts for concessional income tax
rate under section 115BAA, surcharge shall be levied @ 10%. Health and Education Cess @ 4% on the tax and
surcharge is payable by all category of taxpayers.
8. Above views are based on the existing provisions of the IT Act and its interpretation, which are subject to change from
time to time. We do not assume responsibility to update the views consequent to such changes.

105
SECTION IV: ABOUT OUR COMPANY
INDUSTRY OVERVIEW
The information contained in this section, unless otherwise specified, is derived from a report titled “ Industry Report on
Pharmacy Retail in India” dated September 28, 2021 prepared and issued by Technopak Advisors Private Limited (the
“Technopak Report”) commissioned by and paid for by us in connection with the Offer. Industry sources and publications
generally state that the information contained therein has been obtained from sources generally b elieved to be reliable, but
that their accuracy, completeness and underlying assumptions are not guaranteed and their reliability cannot be assured.
Industry publications are also prepared based on information as at specific dates and may no longer be curr ent or reflect
current trends. Accordingly, investment decisions should not be based on such information. See “Certain Conventions,
Presentation of Financial, Industry and Market Data and Currency of Presentation – Industry and Market Data” on page 21.
INDIA’S GDP GROWTH
Since FY 2005, Indian economy's growth rate has been twice as that of the world economy and it is expected to sustain this
growth momentum in the long term. In the wake of COVID-19, India 's nominal GDP has contracted by approximately 3% in
FY 2021 and is expected to bounce back and reach US$ 4 Tn by FY 2025. It is also expected that the growth trajectory of India n
economy will enable India to be among the top 3 global economies by FY 2050 .
Several structural factors are likely to contribute to economic growth in the long run. These include favorable demographics,
reducing dependency ratio, rapidly rising education levels, steady urbanization, growing young & working population, IT
revolution, increasing penetration of mobile & internet infrastructure, increasing aspirations and affordability etc.
COVID-19 had a massive impact on Indian economy in FY 2021, with GDP in Q1 FY 2021 contracting 24% as compared to
same period last year. The contraction in Q1 FY 2021 was not uniform; it varied from state to state and sector to sector. Aviation
sector was worst hit followed by tourism, realty, food services etc. But as government eased lockdown restrictions and economy
started to open up, the economic trajectory witnessed a growth revival by end of Q1 2021. In FY 22, the Indian GDP was
expecting a faster recovery and projected to grow at 14.5 - 15% (in nominal terms). However, given the current surge in the
Covid pandemic that has resulted in wide-spread disruption and diversion of attention and resource to mitigate it, the projected
growth of Indian GDP in the Q1 of FY 22 appears to be facing head winds and the annual growth many be restricted to 13.5%.
India's Nominal GDP in FY (US$ Bn)
Note: U.S.$1 = Rs. 75. White boxes at the top refer to India’s GDP rank on a global basis.
Historical GDP Growth (%)
77 137 265 425
848 1,662
2,279 2,518 2,713 2,633 2,987 4,049
1991 1995 2000 2005 2010 2015 2018 2019 2020 2021P 2022P 2025P
Nominal GDP
India's Rank in World GDP
-3.0% 13.5% 10.7%
15 13 13 9 7 7 5 6 6 7 5 17
YOY Growth/
CAGR
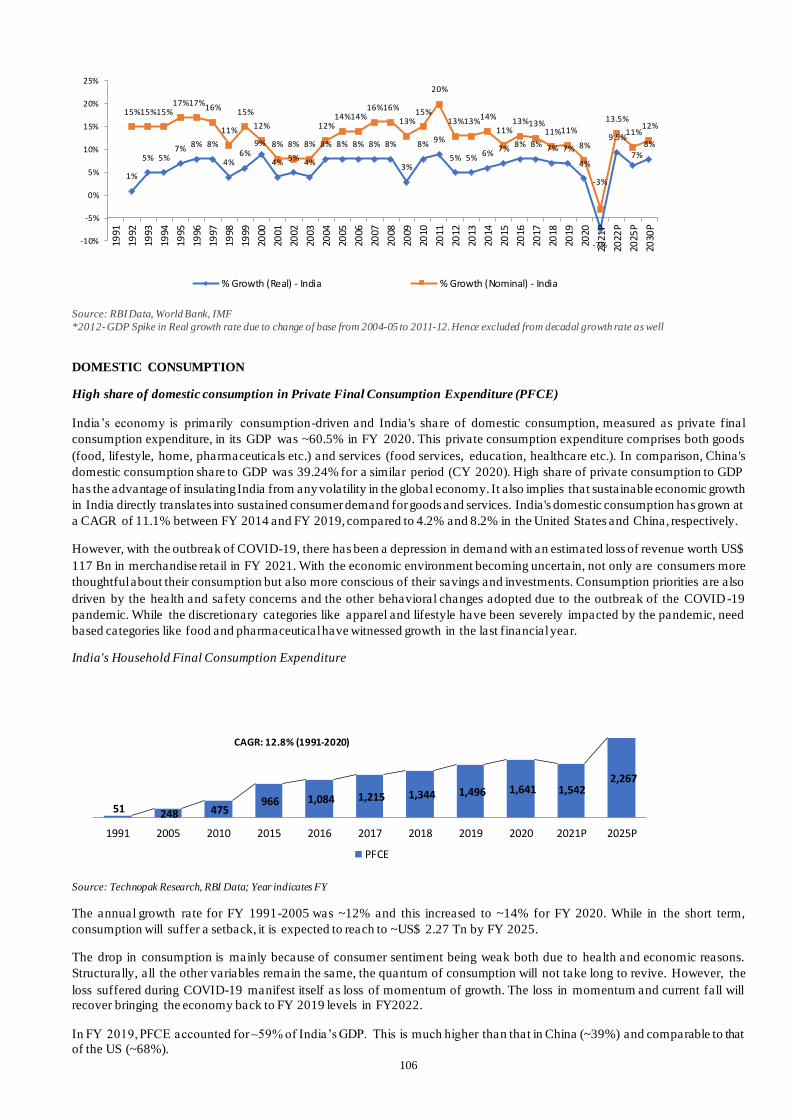
106
Source: RBI Data, World Bank, IMF
*2012- GDP Spike in Real growth rate due to change of base from 2004-05 to 2011-12. Hence excluded from decadal growth rate as well
DOMESTIC CONSUMPTION
High share of domestic consumption in Private Final Consumption Expenditure (PFCE)
India’s economy is primarily consumption-driven and India 's sha re of domestic consumption, measured as private final
consumption expenditure, in its GDP was ~60.5% in FY 2020. This private consumption expenditure comprises both goods
(food, lifestyle, home, pharmaceuticals etc.) and services (food services, education, healthcare etc.). In comparison, China's
domestic consumption share to GDP was 39.24% for a similar period (CY 2020). High share of private consumption to GDP
has the advantage of insulating India from any volatility in the global economy. It also implies that sustainable economic growth
in India directly translates into sustained consumer demand for goods and services. India 's domestic consumption has grown at
a CAGR of 11.1% between FY 2014 and FY 2019, compared to 4.2% and 8.2% in the United States and China, respectively.
However, with the outbreak of COVID-19, there has been a depression in demand with an estimated loss of revenue worth US$
117 Bn in merchandise retail in FY 2021. With the economic environment becoming uncertain, not only are consumers more
thoughtful about their consumption but also more conscious of their savings and investments. Consumption priorities are also
driven by the health and safety concerns and the other behavioral changes adopted due to the outbreak of the COVID -19
pandemic. While the discretionary categories like apparel and lifestyle have been severely impacted by the pandemic, need
based categories like food and pharmaceutical have witnessed growth in the last financial year.
India's Household Final Consumption Expenditure
Source: Technopak Research, RBI Data; Year indicates FY
The annual growth rate for FY 1991-2005 was ~12% and this increased to ~14% for FY 2020. While in the short term,
consumption will suffer a setback, it is expected to reach to ~US$ 2.27 Tn by FY 2025.
The drop in consumption is mainly because of consumer sentiment being weak both due to health and economic reasons.
Structurally, all the other variables remain the same, the quantum of consumption will not take long to revive. However, the
loss suffered during COVID-19 manifest itself as loss of momentum of growth. The loss in momentum and current fall will
recover bringing the economy back to FY 2019 levels in FY2022.
In FY 2019, PFCE accounted for ~59% of India’s GDP. This is much higher than that in China (~39%) and comparable to that
of the US (~68%).
1%
5% 5%7%
8% 8%
4%6%
9%
4%5%
4%
8% 8% 8% 8% 8%
3%
8%9%
5% 5%6%
7%8% 8% 7% 7%
4%
-7%
9.5%
7%8%
15%15%15%17%17%
16%
11%
15%
12%
8% 8% 8%
12%14%14%
16%16%
13%15%
20%
13%13%14%
11%13%13%
11%11%
8%
-3%
13.5%
11%12%
-10%
-5%
0%
5%
10%
15%
20%
25%
1991
1992
1993
1994
1995
1996
1997
1998
1999
2000
2001
2002
2003
2004
2005
2006
2007
2008
2009
2010
2011
2012
2013
2014
2015
2016
2017
2018
2019
2020
2021
P
2022
P
2025
P
2030
P
% Growth (Real) - India % Growth (Nominal) - India
51 248 475 966 1,084 1,215 1,344 1,496 1,641 1,542
2,267
1991 2005 2010 2015 2016 2017 2018 2019 2020 2021P 2025P
PFCE
CAGR: 12.8% (1991-2020)

107
Total Private Final Consumption Expenditure (Current Prices US $ Bn)
Country CY 2010
CY 2011
CY 2012
CY 2013
CY 2014
CY 2015
CY 2016
CY 2017
CY 2018
CY 2019
CY 2020P
CY 2021P
Contribution to GDP
(2019)
CAGR 2014-
2019
U.S. 10,186 10,641 11,007 11,317 11,823 12,297 12,770 13,340 13,993 14,545 13,544 14,347 67.87% 4.23%
Brazil 1,330 1,577 1,514 1,526 1,546 1,153 1,154 1,330 1,220 1,195 1,128 1,230 66.37% -5.03%
Italy 1,296 1,401 1,279 1,304 1,309 1,116 1,128 1,182 1,259 1,205 1,042 1,108 60.25% -1.63%
India* 411** 447** 749 863 966 1,084 1,215 1,344 1,496 1,641 1,542 1,718 57.5% 11.1%
Indonesia 424 495 518 519 509 495 539 582 594 648 630 723 58.94% 4.96%
Malaysia 123 143 156 167 177 163 165 177 206 218 200 226 60.60% 4.25%
France 1,463 1,573 1,469 1,536 1,549 1,318 1,341 1,401 1,502 1,459 1,270 1,394 54.04% -1.19%
Germany 1,872 2,036 1,937 2,036 2,075 1,778 1,829 1,925 2,073 2,023 1,884 1,924 53.23% -0.51%
Thailand 178 196 212 221 214 206 207 223 248 272 251 259 50.39% 4.90%
China 2,090 2,637 3,019 3,429 3,845 4,178 4,344 4,745 5,353 5,586 5,468 6,347 39.06% 7.75%
Source: World Bank, RBI, Technopak Research & Analysis 2020P: The projections have been arrived at by considering impact of COVID-19 * For India, CY 2020P means FY 2021P
** For CY 2010 & CY 2011, base year was 2004-05; U.S.$1 = Rs. 75
India's GDP Per Capita (₹) (Current Prices)
Year indicates CY Source: IMF projections Note: Numbers for 2021-2025 are Provisional
The per capita income of India has been showing an increasing trend since 2012; growing at a healthy CAGR of approximately
10%, the per capita income reached ₹1,48,726 in CY 19. Given the impact of COVID-19, it is projected to decrease to ₹1,37,913
in CY 20. However, it is expected to bounce back to ₹1,52,936 in the subsequent year and continue its growth journey at a
CAGR of 10.5%.
SPEND ON HEALTHCARE IN INDIA
Per capita healthcare expenditure is predominantly higher in developed countries than in developing or under-developed
countries. While per capita healthcare spends in USA in Calendar Year (“CY”) 2018 was $10,624, it was only $73 in India for
the corresponding period. Similarly, the per capita pharmaceutical spend in India was only $16 in CY 2018 as compared to
$1,554 in the United States and the global average of $156. Health care as a category has huge growth opportunity in India.
Per Capita healthcare expenditure of Key Countries (Current US$)
1,05,117 1,16,207 1,27,727
1,40,256 1,48,726 1,37,913
1,52,936
1,69,552 1,87,550
2,07,020
2,28,222
2 0 1 5 2 0 1 6 2 0 1 7 2 0 1 8 2 0 1 9 2 0 2 0 2 0 2 1 P 2 0 2 2 P 2 0 2 3 P 2 0 2 4 P 2 0 2 5 P
10.55% 9.91% 9.81%6.04%
-7.27%
10.89% 10.86% 10.61% 10.38% 10.24%
-10.00%
-5.00%
0.00%
5.00%
10.00%
15.00%
2016 2017 2018 2019 2020 2021 2022 2023 2024 2025
Percentage growth
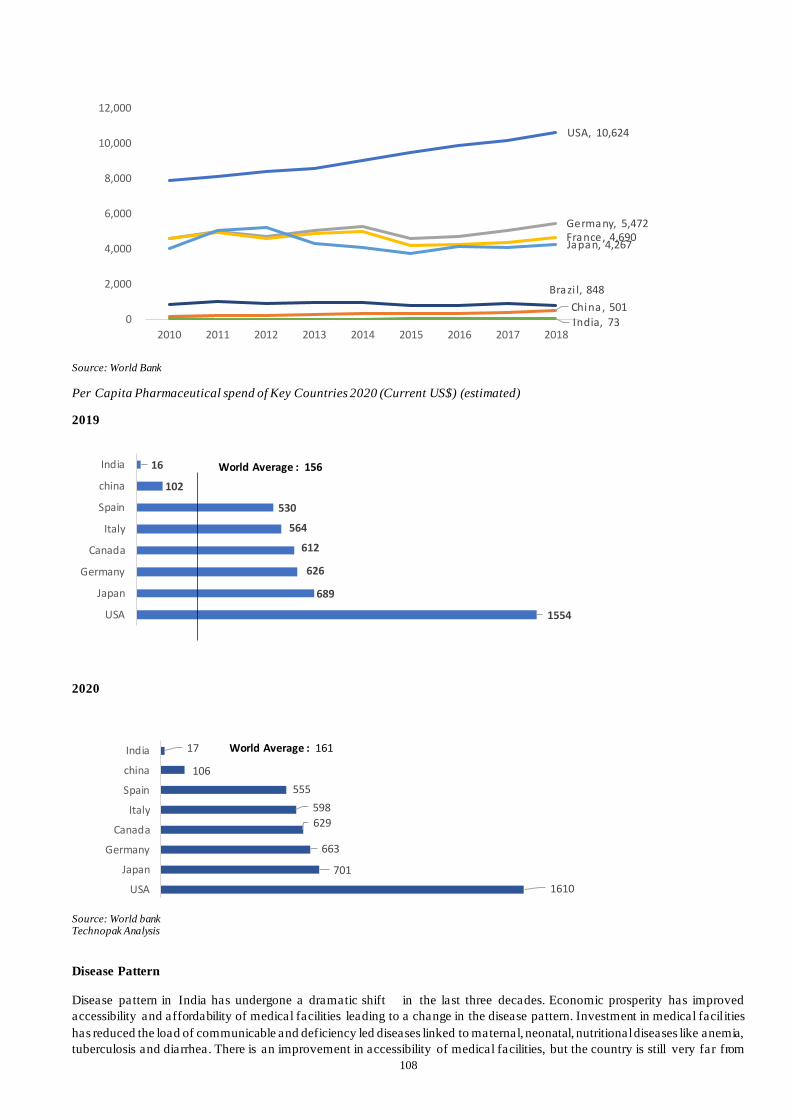
108
Source: World Bank
Per Capita Pharmaceutical spend of Key Countries 2020 (Current US$) (estimated)
2019
2020
Source: World bank Technopak Analysis
Disease Pattern
Disease pattern in India has undergone a dramatic shift in the last three decades. Economic prosperity has improved
accessibility and affordability of medical facilities leading to a change in the disease pattern. Investment in medical facilities
has reduced the load of communicable and deficiency led diseases linked to maternal, neonatal, nutritional diseases like anemia,
tuberculosis and diarrhea. There is an improvement in accessibility of medical facilities, but the country is still very far from
USA, 10,624
China , 501
Germany, 5,472 France, 4,690 Japan, 4,267
India, 73
Brazi l, 848
0
2,000
4,000
6,000
8,000
10,000
12,000
2010 2011 2012 2013 2014 2015 2016 2017 2018
1554
689
626
612
564
530
102
16
USA
Japan
Germany
Canada
Italy
Spain
china
India World Average : 156
1610
701
663
629
598
555
106
17
USA
Japan
Germany
Canada
Italy
Spain
china
India World Average : 161

109
universal health coverage. share of communicable diseases may be going down but its share is still very high accounting for
about one-third of all deaths in the country.
One of the desirable effects of economic prosperity is higher life expectancy. Another cha nge due to economic prosperity is
growing prevalence of sedentary living due to changing lifestyles which has led to very high growth of medical conditions lik e
diabetes, obesity, cancer and heart diseases. These trends are leading to growth of chronic the rapies which are non-
communicable in nature and may lead to a long term or a lifelong use of medicines.
Developed and developing countries have similar trends in disease pattern with positive interplay of income growth,
demographic factors and rising investment in medical facilities. As these trends grow stronger the share of chronic ailments in
overall diseases shows higher growth and contribution.
Transition in Disease Profile in India
Transition in Disease Profile 1990 2016
Share of Communicable, Maternal, Neonatal & Nutritional Diseases 53.60% 27.50%
Share of Non-Communicable Diseases 37.90% 61.80%
Share of Injuries 8.50% 10.70%
Source: ICMR, Secondary Research
OVERVIEW OF PHARMACEUTICAL MARKET IN INDIA
Indian Pharmaceutical Industry
Indian Pharmaceutical industry is the world’s 3rd largest by volume and 14th largest by value. Indian pharmaceutical market
with a turnover of INR 2,90,000 crore in FY 2020 is almost equally divided between the export and domestic market. India
supplies 40% of generics to United States and 25% of prescription drugs to United Kingdom. It also supplies 60% of the global
vaccine market making it one of the pharmaceutical hubs of the world.
Domestic Pharmaceutical Market
India’s domestic pharmaceutical market was estimated at INR 150,000 Crore in FY 2020 having grown at a CAGR of
approximately 10% in the last five years and is expected to grow at a similar rate (~11%) going forward to reach INR 2,53,000
crores in FY 2025. Domestic market has grown by almost twice the average growth of 3-6% of the world market. Domestic
pharma market has witnessed limited growth of 4% in FY 20-21 due to balancing of factors of COVID-19 pandemic. However,
share of Indian pharmaceutical market is less than 2% of the world pharmaceutical market. As per national health accounts FY
2016-17, 36.8% of the current health expenditure goes into pharmaceuticals including both for hospital consumption as well as
the retail pharmacy. The key market characterist ics of domestic pharmaceutical market include low per capita health
expenditure, high share of private out of pocket expenses (which includes purchases from pharmacies), lower penetration across
rural areas and a growing trend of private sector led integra ted approach to treatment. The sector has high opportunity of growth
given the limited penetration of health services both in rural and urban areas. There are gaps across awareness, access,
affordability and acceptability of product and services.
The middle and upper middle class in India is largely serviced by the privately held institutions. The private sector has sustained
medical services with help of doctors turned entrepreneurs working through parts of the value chain. There is renewed activit y
in the sector to consolidate services across the value chain and offer innovative and integrated services leveraging technology
with an aspirational customer at the center of the opportunity.
Indian Domestic Pharmaceutical Market size and Growth (INR Crore)

110
Source: Dept of Pharmaceuticals, Govt of India; Annual Reports; Technopak Analysis
Segmenting Domestic Pharmaceutical Market
Indian Pharmaceutical market dominated by Branded Generics
Domestic pharmaceutical market is dominated by branded generic medicines contributing 75% of the total market. Branded
generics attach proprietary names to generic drug molecules whereas ordinary generic drugs are known by their chemical names.
The contribution of over the counter (“OTC”) and patented products is 18% and 7% respectively.
Source: Technopak Analysis
Domestic pharmaceutical market by type of drugs
The domestic pharmaceutical market can be segmented on the type of drugs sold, which includes prescription drugs and OTC
drugs. Prescription drugs further comprise of generic drugs (including branded generics and ordinary generics) and branded
patented drugs. Branded generics attach proprietary names to generic drug molecules whereas ordinary generic drugs are known
by their chemical names. As of FY 2020, generic drugs accounted for 75% of the total domestic market, with OTC drugs and
branded patented drugs accounting 18% and 7%, respectively.
Prescription drugs as the name suggests are drugs which can be sold only through a valid medical prescription from a registered
doctor. OTC drugs can be dispensed without any prescription and sold at regular retail stores as well. Pricing for only a select
number of prescription drugs in the National list of essential medicine (“NELM”) is regulated by the government through
National Pharmaceutical Pricing Authority. As per NELM 2015 there are 376 formulations under essential list, that account for
~15-17% of total Indian domestic pharmaceutical market.
OTC drugs are free from any prescription or pricing regulation. OTC drugs are of two types including drugs which have moved
from prescription to OTC or directly launched as an OTC product. OTC drugs need a varied marketing approach more like
FMCCG as product need to be pushed directly to the customer whereas in ca se of prescription drugs marketing inputs are
around medical practitioners.
92,388
1,50,000
2,53,000
FY 2015 FY 2020 FY 2025
75%
18%
7%
Indian Domestic Pharmaceutical Market FY 19-20
Generics OTC Patented

111
Source: Technopak Analysis
Domestic Market by Therapy
Pharmaceutical market is also segmented basis therapy including acute therapy and chronic therapy. Acute conditions are
generally severe and sudden in onset and therefore patients require medications urgently. This could describe anything from a
broken bone to an asthma attack. The major acute therapies are anti-infectives, gastrointestinal, dermatology and
vitamin/Nutrient. Anti -infective is the largest therapy by size and respiratory is the fastest growing category.
A chronic condition, by contrast is a long-developing syndrome, such as osteoporosis or asthma. Chronic therapies are
dominated by cardiac, anti-diabetic and Neuro/CNS therapies. The contribution of chronic therapy is going to increase as
lifestyle diseases show higher prevalence and the age profile of the population moves to higher side. Vitamin, mineral and
nutrient (“VMN”) or deficiency category of product are benefiting from the increasing focus on prevention, self -care, health &
wellness. As of FY 2020, Acute therapies account for 63% of the domestic pharmaceutical market.
Share of chronic diseases at modern pharmacy stores show a higher contribution or higher growth as these are planned purchases
and patients can buy from stores offering more benefits.
Therapy View to Indian Pharmaceutical Market FY 2015 to FY 2020
18%
82%
OTC vs prescription drugs share India Pharmaceutical market FY20
OTC Prescription
70.00%
30.00%
2015
63.00%
37.00%
2020
Acute
Chronic

112
Source: Annual reports
Technopak Analysis
Source: Annual reports; Technopak Analysis
Major Players in Indian Pharmaceutical Market
The domestic pharmaceutical market is highly fragmented with the top 10 companies (primarly branded generics companies)
contributing less than 50% of the share, and the top 150 companies accounting for close to 96% of share. The market is
dominated by Indian companies with close to 80% of the market share. Indian companies leverage better pricing with their
expertise in developing formulations and investment in supply chain. The contribution of international revenues in top domestic
companies is more than 50% of the total revenues. There are focus therapy areas for each company even though they may have
a large portfolio across all major therapies. Multinational companies have higher share in specialized therapies and paid
vaccines.
Top Pharmaceutical Companies by Revenue in Domestic Market, 2019-20 (Value in INR Crore)
Company India Formulation Revenues
Sun Pharmaceutical 9,700
CIPLA 6,741
Alkem 5,606
Mankind Pharmaceutical 5,100
Lupin 5,148
Intas 4,600
Abbot 3,787
Zydus Cadila 3,714
29%
19%16%
12%
24%
Breakup of Chronic therapy to Indian pharmaceutical market FY2020
Cardiac Anti Diabetic Respiratory Neuro Other
20%
17%
13%13%
12%
25%
Breakup of acute therapy in Indian Pharmaceutical market FY2020
Anti Infective Gastro VMN Pain/Analgesic Dermatology Other

113
Company India Formulation Revenues
Torrent Pharmaceutical 3,517
Glenmark 3,202
GSK 2,677
Dr Reddy’s Laboratory 2,890
Aurobindo Pharmaceutical 1,848
Alembic Pharmaceutical 1,497
Grand Total 60,027
Source: Annual reports, Technopak Analysis
Market Wise Segmentation
Northern states have the highest contribution to the pharmaceutical retail followed by east and south. Metros, Mini metros and
Tier 1 cities contribute close to 65% of the total market.
Zonal Share of Domestic Pharmaceutical Market
Source: National health account 2016-17, Ministry of Health & Welfare, Govt of India Technopak Analysis
Source: Technopak Analysis
Per capita health expenditure in INR (FY 2019-20) (estimated)
25%
31%
25%
19%
FY2020 (INR 150,000 Crore)
East North South West
32%
32%
36%
City wise share of Domestic Pharmaceutical Market FY 2019-20 (estimated)
Metro & Mini Metro Tier 1 Cities Rest of India

114
Source: National Health Accounts, Ministry of Health & Welfare
Technopak analysis
KEY TRENDS AND GROWTH DRIVERS
The profile of the customer of the Indian Pharmaceutical sector has been going through a change underpinned with demographic
changes. The customer is now more aware of the treatment options available in the market. Access to healthcare and
affordability has witnessed growth. This is leading to an opportunity to grow the size and penetration of the market.
Low base of health expenditure
India has a very low base of health expenditure as compared to the other markets of the world. The share of current medical
expenditure as % of GDP is almost half of the world average. The share of private out of pocket expense is also one of the
highest in the world.
Increasing Income level
There has been a steady growth of income with India being one of the fastest growing economy post liberalization. This has
increased the accessibility to medicines. The growing size of Indian middle class is one of the primary drivers of the overall
growth.
Increasing urbanization and growth of mega cities
The growing trend in urbanization and growth of mega cities has led to a large part of population residing in urban areas wit h
access to healthcare. This has helped bring down the cost of reaching the customer.
Increasing Population and Age profile of the population
India’s population will continue to grow at close to 1% per annum. As per the ageing profile almost 14% of population is at
the age of 54 of above. Increasing population as well as the ageing of the population will increase the patient pool leading to
growth opportunities.
Increasing Prevalence of Chronic Lifestyle Diseases
The share of non-communicable chronic diseases which require continuous medication will increase in the overall mix. As per
govt survey prevalence of Diabetes is already at 11.8%. Prevalence of Diabetes and cancer will go up by 20 -25%.
Enhanced Medical Infrastructure
There is a growing trend in increased investment on medical infrastructure leading to higher access and a bigger market for
medicines. The overall govt expenditure on health sector is very low. Current share of government expenditure on health is
close to 1% of GDP. As per the 15th finance commission recommendation, government to target expenditure equivalent to
2.5% of GDP by 2025. Government has taken multiple initiatives to improve access to medical facilities specially in tier II &
rural markets.
Growth in Health Insurance
6687
52084778
4051
South West North East
India Average: INR 5,518

115
Health insurance in India is growing at a fast clip with gross premium showing a CAGR of 20% in the last five years. There is
innovation across health insurance product with pre admission and post admission medicine expenses also covered under many
policies. Further innovation in this space can increase the access of medicine to a larger population and lead to growth in
category.
Health insurance Gross premium in India (value in Rs Crore)
Source: IRDAI, Technopak Research
Health insurance (No. of people insured in millions)
Source: IRDAI, Technopak Research
Growing Prevalence of Self -Care to drive OTC segment
As per industry estimates more than 50% of population is practicing self -care which is a big opportunity for health care products
available without prescription. The consumer healthcare segment has the potential to show growth in double digits provided
pharmaceutical companies can differentiate the product and the range can be made available to the customer
Growth in Specialized and Upcoming Categories
The market for specialized products including patented products, biologics and adult vaccines are opportunities for high growth.
Market shaping activity by pharmaceutical companies will increase the acceptability of new age medicines and drive ov erall
category growth.
KEY CHALLENGES AND OPPORTUNITIES
Challenges
Low health expenditure leading limited infrastructure
India has a very low base of health expenditure as compared to world average as well as countries with similar income profile .
The comparison over key indicators including number of hospital beds, Nursing and medical doctors per 10,000 people is below
peer nations. The disparity in access between urban and rural areas is very high. Rural areas have access to only primary care
services.
Health infrastructure indicators (per’000 people) CY 2017
Country Hospital beds Physicians Nurses & Midwives
Russian Federation 8.1 4.1 8.5
United States 2.9 2.6 14.5
2263727457
3452741981
5083456865
2014-15 2015-16 2016-17 2017-18 2018-19 2019-20
288359
437482 472 499
2014-15 2015-16 2016-17 2017-18 2018-19 2019-20

116
Country Hospital beds Physicians Nurses & Midwives
Japan 13.1 2.5 12.1
Brazil 2.1 2.2 9.7
China 4.3 2.0 2.7
India 0.5 0.8 2.1 Source: World Bank, Technopak Analysis
Price regulation of medicines
Pricing of medicines under national essential medicine list are regulated by the government. The list under revision may lead
to business loss.
Lower profitability
India is the pharmaceutical capital of the world. The domestic players have built capacity to provide formulations at a very low
cost as compared to the western counterparts. There will always be pricing pressure in the mass therapies.
Opportunities
Increase in access, awareness and affordability of medical services
India is going through a period of sustained growth and positive play of demographic factors. Urbanization is also helping in
consolidation of markets. These factors are leading to higher awareness, access and affordability of medical services. India is
already one of the fastest growing pharmaceutical markets of the world.
Higher investment by Government in health care
The government contribution to health expenditure is less than 1 % which is one of the lowest in the world. The government
is committed to increase it to 2.5%. This will open up a new opportunity for markets to grow.
Increasing prevalence of lifestyle diseases
There is an increasing trend of lifestyle induced diseases due to sedentary lifestyle. India has one of the highest numbers o f
Diabetic patients in the world. There is and Increasing prevalence of obesity and related diseases. These trends are leading to
changing medical needs of the customer which may become the biggest segment.
Growing aspiration of customer with focus on Prevention, Immunity and Self care
The aspirations of the customers are going through change, and this has been accelerated due to current pandemic. There is a
marked shift from sick care to health care. There is more focus on preventive health care, immunity and self -care. Growing
awareness is leading to an increasing trend of self -medication with close to 50% of patients indulging in self -care. Vitamins,
minerals and nutrients is one of the fastest growing categories in medication therapies.
Growth of Pharmacy chains
Pharmaceutical chains can earn the trust of the customers with better services including reliable products, longer working hours,
better availability, discounts on products, extended range, customer service, loyalty program and value -added services.
PHARMACEUTICAL SUPPLY CHAIN IN INDIA
India is an integral part of the global pharmaceutical supply chain and accounts for exports and imports with more than 200
countries in the world. The pharmaceutical supply chain consists of manufacturing plants, intermediary product suppliers,
logistics partners and technology partners. The domestic market consists of a large network of more than 500 medium and large
companies (that manufacture/contract manufacture), ~60,000 distributors and ~8,00,000 pharmacy retail outlets. There are more
than 1,00,000 brands in the market given it’s a branded generics market. Doctors are at the center of the pharmaceutical supply
chain and one of the key parameters of review for a pharmaceutical company is access to doctors. Top companies maintain
field force of 4,000 to 10,000 claiming access to close to 4,00,000 doctors out of the total pool of 8,00,000 doctors in the
country.
The domestic pharmaceutical supply chain typically involves a company appointed carry -forward (“C&F”) Agent, responsible
for handling warehousing and transportation of drugs at company operated or self -operated warehouse. The C&F agent supplies
stock to distributors who in turn supply to stand alone pharmacies, chain pharmacies and hospitals. There are multiple variat ions
to this basic chain where a distributor may also distribute through a sub distributor. Exclusive distributor can also be appointed
for a particular channel or customer or specialized therapy. In some cases, manufacturers supply directly or through exclusiv e
intermediaries to hospitals and chain pharmacies.

117
Margin spread across the chain varies with retailer working at average margin of 15 -20%, distributor margin at 8-10% and C&F
agent at an average margin of 2-5%. Hospitals and modern pharmacy chains are driving better m argins by dealing directly with
the manufacturers for a large of their procurement.
Domestic Pharmaceutical Retail Supply Chain
Indicative margin Spread in bracket
Source: Technopak Research
IMPACT OF COVID-19
Pharmaceutical industry by virtue of being an essential service has performed better than most of the sectors. The domestic
market has recovered from initial loss of business at the onset of lockdowns to achieve growth in 2019 -20. However, a downturn
in the economic outlook could negatively impact pharmaceutical spending in countries like India with high o ut-of-pocket
medical expenditure. Potential API and generic shortages challenged pharmaceutical companies to step up their supply chain
play to guard against medium-term price increases. Postponement of non-urgent treatment may lead to a short-term deceleration
in volume growth and the pandemic will seriously affect medical tourism via travel restrictions. There is a marginal reductio n
in consumption of pharmaceutical products across hospitals and selected pharmaceutical outlets.
COVID-19 outbreak has also presented Indian pharmaceutical companies an opportunity to become a preferred alternate hub
for manufacturing APIs and intermediates. Having recognized this opportunity and declaring Indian pharmaceutical’s over -
dependence on Imported APIs/Intermediates/Key starting materials a threat to national security, the central government has
approved a slew of measures to promote manufacturing of APIs and KSMs within the country
Covid-19 has also accelerated the adoption of E pharmacy. The reach of E- pharmacy increased from 3.5 million homes to close
to 9 million homes during pandemic. Chain pharmacy have also adapted to an omnichannel approach leveraging their physical
store presence in nearby neighborhood to deliver medicines at short notice. Omni channel players leverage store network to
reach their customers more efficiently than pure play online players.
Effect of Covid-19 on Pharmaceutical categories
Category Effect of Covid
Chronic Therapy Unaffected, patient buying in bulk to manage stock
Preventive & Wellness Increased prevalence of self-cure. Higher growth in category
Others including planned surgery Postponement for a limited period.
Manufacturer
Modern
Pharmacy
(20-25%)
Hospital
(20-25%)
Standalone
Pharmacy
(15-20%)
Distributor
(8-10%)
C & F Agent
(2-5%)

118
Source: SME interview
OVERVIEW OF NUTRACEUTICALS MARKET IN INDIA
Nutraceuticals are products derived from herbal products, minerals and other dietary substances. Developed economies
including USA, Europe and Japan account for close to 90% of the market. However, developing countries are sh owing higher
growth than developed countries as developed economies are saturated, leading to a shift in focus of the nutraceutical player s.
Asia pacific including India is one of the focus regions in the category. People becoming more conscious of health and a rise in
demand of processed food is driving food and beverage players to improve the nutritional content in their products leading to
new growth avenues. The growing importance of nutraceutical categories is linked to the increasing prevalence of lif estyle
diseases and people seeking preventive healthcare. Developed markets like the United States and Europe, are discovering the
untapped segment of customized products based on health claims.
Indian Nutraceuticals Retail Market
Indian nutraceutical market is estimated to be around INR 51,750 crores in FY 2020 with close to 2% share of the global market.
It is the fastest growing segment in Indian FMCG segment with a 6% share in the Indian FMCG markets. It is projected to reach
approx. INR 127,500 crores by FY 2025, growing at a high CAGR of 20% leveraging rising demand for dietary supplements
from middle and upper middle class.
Nutraceuticals Retail Market in India (INR Cr)
Source: Technopak Analysis
FMCG Segment Growth (2020-2025) (INR lakh Cr.)
Mark
et Size Share
in
FY20
15
Market
Size
Share in
FY2020
Market
Size
Share in
FY2025
CAGR (FY2020-
FY2025) FY201
5 FY2020 FY2025
(INR
Cr.) (INR Cr.) (INR Cr.)
Packaged Staples 1,51,0
00 35% 2,26,000 33% 3,54,000 32% 9.3%
Other Packaged Food 1,19,7
50 28% 1,94,450 29% 3,43,250 31% 12.0%
Non-Food FMCG 96,000 22% 1,38,800 21% 1,97,000 18% 7.4%
Other Packaged Beverages 30,000 7% 48,000 7% 77,000 7% 11.5%
Nutraceuticals (Dietary) 12,750 3% 31,500 5% 77,250 7% 20.1%
Nutraceuticals (Functional
Food) 8,250 2% 21,750 3% 51,750 5% 18.9%
Meat 12,000 3% 15,000 2% 20,000 2% 4.7%
Total 4,29,7
50 6,75,500 11,20,250 10.6%
Source: Secondary Research, Technopak Analysis. Note: Packaged Fresh Dairy not included in FMCG
21000
51750
62618
75767
127500
FY 2015 FY 2020 FY 2021 (P) FY 2022 (P) FY 2025 (P)
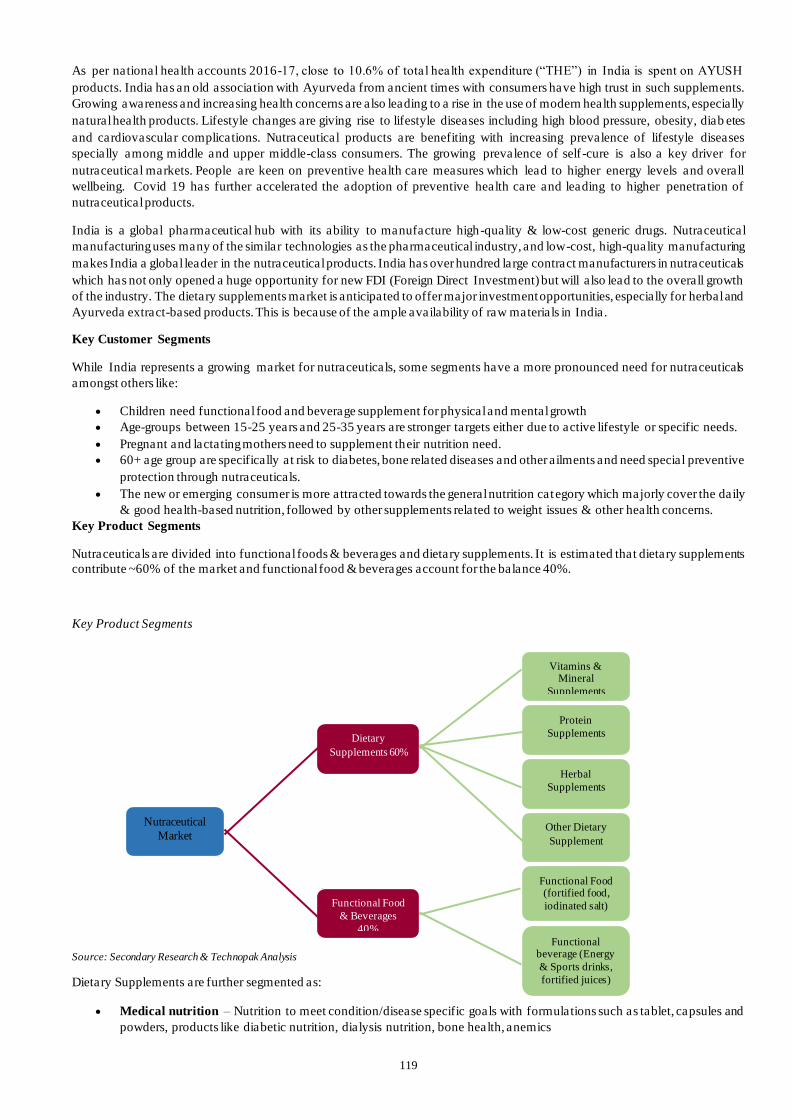
119
As per national health accounts 2016-17, close to 10.6% of total health expenditure (“THE”) in India is spent on AYUSH
products. India has an old association with Ayurveda from ancient times with consumers have high trust in such supplements.
Growing awareness and increasing health concerns are also leading to a rise in the use of modern health supplements, especially
natural health products. Lifestyle changes are giving rise to lifestyle diseases including high blood pressure, obesity, diab etes
and cardiovascular complications. Nutraceutical products are benefiting with increasing prevalence of lifestyle diseases
specially among middle and upper middle-class consumers. The growing prevalence of self -cure is also a key driver for
nutraceutical markets. People are keen on preventive health care measures which lead to higher energy levels and overall
wellbeing. Covid 19 has further accelerated the adoption of preventive health care and leading to higher penetration of
nutraceutical products.
India is a global pharmaceutical hub with its ability to manufacture high-quality & low-cost generic drugs. Nutraceutical
manufacturing uses many of the similar technologies as the pharmaceutical industry, and low-cost, high-quality manufacturing
makes India a global leader in the nutraceutical products. India has over hundred large contract manufacturers in nutraceuticals
which has not only opened a huge opportunity for new FDI (Foreign Direct Investment) but will also lead to the overall growth
of the industry. The dietary supplements market is anticipated to offer major investment opportunities, especially for herbal and
Ayurveda extract-based products. This is because of the ample availability of raw materials in India.
Key Customer Segments
While India represents a growing market for nutraceuticals, some segments have a more pronounced need for nutraceuticals
amongst others like:
• Children need functional food and beverage supplement for physical and mental growth
• Age-groups between 15-25 years and 25-35 years are stronger targets either due to active lifestyle or specific needs.
• Pregnant and lactating mothers need to supplement their nutrition need.
• 60+ age group are specifically at risk to diabetes, bone related diseases and other ailments and need special preventive
protection through nutraceuticals.
• The new or emerging consumer is more attracted towards the general nutrition category which majorly cover the daily
& good health-based nutrition, followed by other supplements related to weight issues & other health concerns.
Key Product Segments
Nutraceuticals are divided into functional foods & beverages and dietary supplements. It is estimated that dietary supplements
contribute ~60% of the market and functional food & beverages account for the balance 40%.
Key Product Segments
Source: Secondary Research & Technopak Analysis
Dietary Supplements are further segmented as:
• Medical nutrition – Nutrition to meet condition/disease specific goals with formulations such as tablet, capsules and
powders, products like diabetic nutrition, dialysis nutrition, bone health, anemics
Vitamins & Mineral
Supplements
Functional beverage (Energy
& Sports drinks,
fortified juices)
Functional Food (fortified food,
iodinated salt)
Other Dietary
Supplement
Herbal
Supplements
Protein
Supplements
Nutraceutical
Market
Functional Food
& Beverages
40%
Dietary
Supplements 60%

120
• Sports nutrition – Nutrition to meet performance enhancement goals with formulations like protein powders,
capsules and liquids, products like, energy supplements and mass/muscle gainers.
• General nutrition – Nutrition for overall health & general wellness with formulations like tablet, capsules and
powders, products like weight management, multi-vitamins & beauty products for men & women.
Consumers looking for good health and daily nutrition are the major buyers in the nutraceutical segments followed by
consumers with health concerns and weight issues.
Functional Food and Beverages: There is an overlap between the functional food and beverages market in nutraceuticals and
FMCG food. While functional foods contribute a share of 65% in the category, balance 35% is contributed by functional
beverages. Key contributors are fortified products like oats and fortified cereals, soy, flaxseed, nutrition bars, probiotic yogurt
and dairy products, baked goods and edible oils. Functional beverages are growing at a faster pace and are expected to gain
market share in the coming years. The share of beverages has been widening due to the introduction of fortified juices and
energy drinks. Major players like Pepsi expanded its portfolio by launching hydrotonic drink which contains vitamins,
electrolytes that help consumers rehydrate and refresh. The entry of Indian brands like Patanjali, Dabur, Himalaya in ayurvedic
products has also contributed to the growth in recent years.
Key Challenges
• Fragmented Industry: Fragmented nature of the market both from demand & supply perspective. Market players have
identified niche for themselves.
• Regulatory Challenges: Fluidity in policy from product definitions and approvals to health claims and manufacturing
standards.
• Counterfeit products: The Indian nutraceutical market grapples with a problem of counterfeit and fraudulent products
which confuse the consumer and dents their trust for such products.
• Pricing: High prices limit their adoption in the Indian market and restrict it to the urban markets.
• Mis-selling: Retailers do not provide customers with enough information on the products including ingredients,
benefits, doses and side effects. There is lack of knowledge within the industry which may lead to inefficient outcomes.
• Tailored products: The Indian consumer preferences include vegetarianism, Halal or Hindu dietary practices and the
traditional remedies reflecting social and cultural diversity. It is important for brands to be mindful that the demand
for a product may vary according to dietary preference or religion.
Key Emerging Trends
• Transparent and Effective Education for consumers: The nutraceutical manufacturers & sellers are undertaking the
task of educating the consumers by sharing detailed information about the products and the advantages and functions,
while also bringing about a clarity and reliability among the current as well as future customers.
• Consistent Product Improvement: Nutraceutical manufacturers are also working on number of factors like enhanced
quality levels of the product, improved transparency, and aggressive pricing to widen the consumption. Manufacturers
are coming up with new and better products that are 100% natural, vegetarian, without artificial colors, flavors &
preservatives, has plant-based nutrition with no side effects.
• Opportunity for new players: High cost and long-time frames of product development are entry barriers for new
players. However, the Food Safety and Standards Authority of India (“FSSAI”) have been working on regulations for
nutraceuticals in India which are at par with international standards. This is expected to open avenues for new
entrepreneurs to enter the nutraceutical field. It will also open opportunities for foreign investments.
Growth Drivers
• Increase in Awareness: Increased awareness regarding nutritional care has made the nutraceutical market more
visible.
o Rapid digitalization and increase in social media usage have led to h igh growth in the sector
o Players and influencers have extensively used the social media platforms for product advocacy.
o Players like Healthkart, a dietary supplements & health devices online store has promoted largely through online
media advertisement (Facebook, Google & other ad networks).
o Companies have invested in manpower as well as digital media so that the customers can be properly informed
about the benefits of the range of products. The additional information also helps customers take an informed
view and also leads to trust in the channel of sales.

121
• Growing Prevalence of Self-Care: Growing awareness about body and health issues is leading to growth in self -care.
As per industry estimates close to 50% of patients indulge in self -care. There is more focus towards preventive
healthcare leading to increase in consumption of dietary supplements, meal replacement with healthy products and
acceptability of a range of healthy products.
• Urbanization: The urban population have become more health conscious with increased interest in sports activities,
yoga, health clubs, etc. contributing the demand in nutraceutical business.
• Changing lifestyle: Paucity of time and inability to adhere to a nutritionally balanced diet has resulted in multiple
deficiencies leading to an increased demand for nutraceuticals as compensation to overall health and wellbeing.
There is also an increased demand of functional foods which combine the benefit of food and nutrients.
• Growth in Non-Communicable Chronic Lifestyle Diseases: The rise in incidences of heart diseases, lifestyle
disorders, cancer, respiratory disease & diabetes coupled with increasing share of nutra ceuticals in doctor’s
prescription have led to increase in consumption.
• Impact of COVID-19: The growing demand for natural immunity-boosting products during the COVID-19 has
accelerated the growth of the nutraceuticals industry during this period. High growth was registered during FY 2021
in the sales of vitamins & minerals especially with vitamin C & D that help in boosting immunity.
• Growth of Modern Pharmacies including e-Pharmacy: Growth in modern pharmacies is one of the key levers for
nutraceutical market as consumers are product gets higher participation in category space. Products are highlighted
and consumers are educated about the product range.
• Government Policy Push towards Manufacturing : Under ‘Make in India’ initiative, the government has been
focusing on creating pharma manufacturing infrastructure and scale within India thereby reducing imports and
bolstering India’s strength of manufacturing.
PHARMACY RETAIL IN INDIA
Pharmacy retail comprises of the sale of pharmaceutical products, which include over the counter (OTC) drugs and prescription
drugs. Pharmacy retail stores also sell various FMCG products including nutraceutical products, consumables and medical
devices along with pharmaceutical products and related services. Pharma retail is estimated to be INR 1,72,500 Cr in FY 2020
and is expected to grow at a CAGR of 10% in the coming 5 years. The modern retail which is currently INR 17,250 Cr is
expected to grow at a rate of 25% in the coming 5 years to outpace the growth of the overall segment.
The Indian pharmacy retail sector has been witnessing healthy growth over the past few years due to an increasing consumer
base and rising healthcare expenditure. Indian pharmacy retail space offers attractive opportunities for significant growth based
on its India’s favorable demographic trends (such as increasing life expectancy), growing levels of disposable income, increa sed
levels of digitization, greater prevalence of chronic diseases, higher access to healthcare coverage and increased overall demand
for pharmaceuticals and wellness products.
The modern pharmacy retail has been registering healthy growth largely because of rising demand for OTC and prescription
drugs, wellness products and private label products. Growth in demand of products related to mother and baby care, elderly
care, sports nutrition, sexual wellness and natural products are giving way to special focus on these categories. These categories
are not only gaining share in the overall assortment of retail pharmacies buts also driving premiumization.
In the entire healthcare value chain, pharmacy retail is one of the most fragmented sub -segments. There is an estimated total of
7-8 lac retail pharmacies (chemists) in India. The number of branded organized pharmacy stores is less than 10,000. Apollo
Pharmacy Private Limited, MedPlus Health Services Private, Wellness Forever Medicare, and Emami Frank Ross Limited are
some of the major players operating in the Indian pharmacy retail market.
Share of Key Players in Modern B&M Pharmacy Outlets (FY 2021)
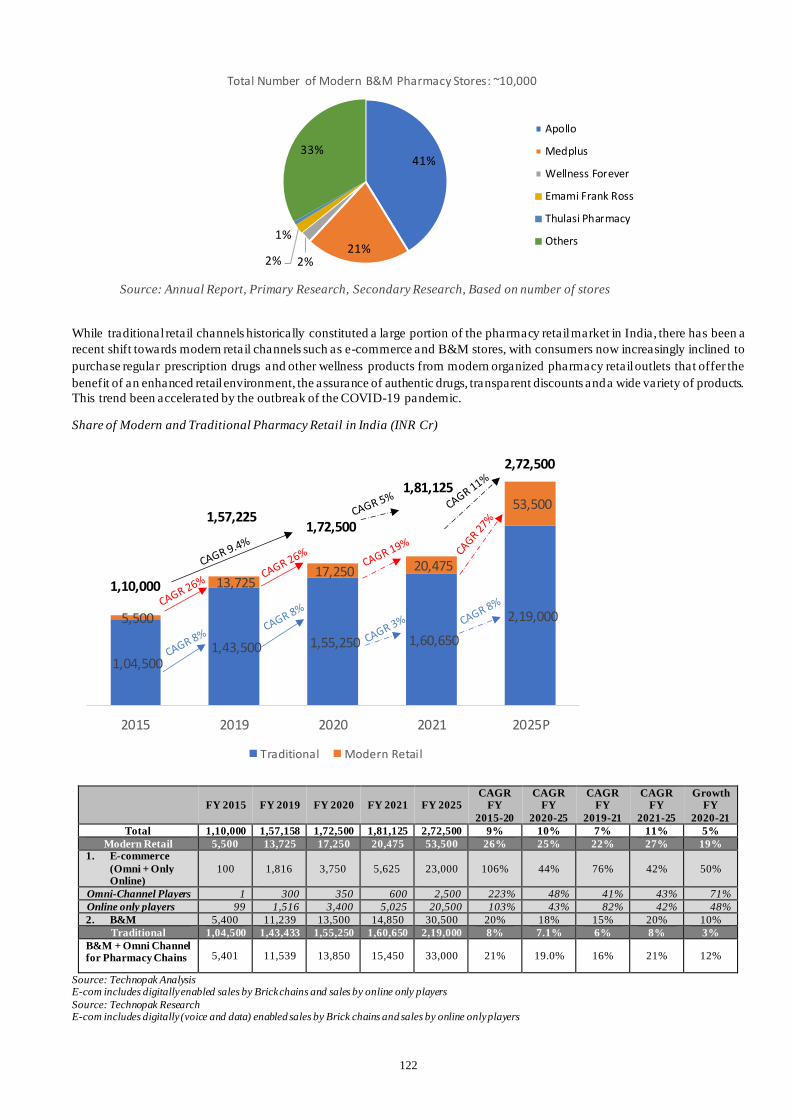
122
Source: Annual Report, Primary Research, Secondary Research, Based on number of stores
While traditional retail channels historically constituted a large portion of the pharmacy retail market in India, there has been a
recent shift towards modern retail channels such as e-commerce and B&M stores, with consumers now increasingly inclined to
purchase regular prescription drugs and other wellness products from modern organized pharmacy retail outlets that offer the
benefit of an enhanced retail environment, the assurance of authentic drugs, transparent discounts and a wide variety of products.
This trend been accelerated by the outbreak of the COVID-19 pandemic.
Share of Modern and Traditional Pharmacy Retail in India (INR Cr)
FY 2015 FY 2019 FY 2020 FY 2021 FY 2025 CAGR
FY
2015-20
CAGR FY
2020-25
CAGR FY
2019-21
CAGR FY
2021-25
Growth FY
2020-21
Total 1,10,000 1,57,158 1,72,500 1,81,125 2,72,500 9% 10% 7% 11% 5%
Modern Retail 5,500 13,725 17,250 20,475 53,500 26% 25% 22% 27% 19% 1. E-commerce
(Omni + Only Online)
100 1,816 3,750 5,625 23,000 106% 44% 76% 42% 50%
Omni-Channel Players 1 300 350 600 2,500 223% 48% 41% 43% 71%
Online only players 99 1,516 3,400 5,025 20,500 103% 43% 82% 42% 48%
2. B&M 5,400 11,239 13,500 14,850 30,500 20% 18% 15% 20% 10%
Traditional 1,04,500 1,43,433 1,55,250 1,60,650 2,19,000 8% 7.1% 6% 8% 3%
B&M + Omni Channel for Pharmacy Chains 5,401 11,539 13,850 15,450 33,000 21% 19.0% 16% 21% 12%
Source: Technopak Analysis E-com includes digitally enabled sales by Brick chains and sales by online only players
Source: Technopak Research E-com includes digitally (voice and data) enabled sales by Brick chains and sales by online only players
41%
21%2%2%
1%
33%
Total Number of Modern B&M Pharmacy Stores: ~10,000
Apollo
Medplus
Wellness Forever
Emami Frank Ross
Thulasi Pharmacy
Others
1,04,500 1,43,500 1,55,250 1,60,650
2,19,000 5,500
13,725 17,250 20,475
53,500
2015 2019 2020 2021 2025P
Traditional Modern Retail
1,10,000
1,57,2251,72,500
1,81,125
2,72,500

123
Impact of the Covid-19 pandemic on Pharmacy Retail in India
By virtue of being an essential service, pharmacy retail in India has performed better than most other sectors over the last 18
months. The domestic market has recovered from initial loss of business at the onset of lockdowns to ac hieve growth in FY
2021.
As a whole, the COVID-19 pandemic is driving growth in the market segments such as preventive healthcare and personal
hygiene with consumers increasingly likely to purchase preventive healthcare products such as multivitamins and a yurvedic
supplements to boost immunity. Personal hygiene products have gained prominence.
Pharmacy Retail Formats
Traditional Retail Channels
India is dominated by the traditional retail in this segment. The traditional Indian pharmacy retail segment predominantly
consists of retail stores operating as family run medical stores typically having a store size in the range of 150 -1000 sq. ft. As
of FY 2021, there were around 8,00,000 pharmacy retail stores operating across the country. It is a highly fragmented space
with challenges related to traditional retail including lack of documentation/tracking, inadequate retail environment, poor
inventory management, non-availability of medicines due to SKU proliferation and in some cases stocking of unre liable
medicines. They can be broadly classified basis their scale of business, store size and merchandise mix.
• Class A: The large-scale traditional pharmacists typically of a larger store size usually located in the prominent
locations such as main markets of the cities or in the vicinity of key hospitals stocking a wider SKU range including
specialty products, food and non-food FMCG products, medical devices, wellness products along with adequate depth
of pharmaceutical products.
• Class B: These pharmacies are located in the neighborhood markets and usually operate out of a small size store and
carry fast moving merchandise.
• Class C: These pharmacies are also located in the neighborhood markets and usually operate out of a 100 -200 sq ft
store and carry the need-based products of that vicinity with a focus on pharmaceutical products.
Modern Retail Channels
• Brick and Mortar led Formats: The organized pharmacy retail sector primarily comprises of B&M stores operated
by established players such as Apollo Pharmacy, MedPlus and Wellness Forever, and other smaller players like Emami
Frank Ross Pharmacy, Thulasi Pharmacy, and Sagar Drugs & Pharmaceuticals (Planet Health) to name a few. These
players continue to drive growth in the organized segment by establishing a fast-emerging pan-India presence primarily
through B&M stores and select players also operate an omnichannel platform.
While chains like Medplus, Wellness Forever and Apollo have established a national/ fast emerging national presence
with a store count in the range of 200-4000, players like Thulasi Pharmacy and Emami Frank Ross Pharmacy focused
on south and east India servicing in specific territories.
• E-commerce Formats: There has also been a rise in sales through the e-commerce channel with several players such
as NetMeds, Tata 1MG and PharmEasy operating in this segment through an online only model (“ e-pharmacy”)
alongside omnichannel platforms of B&M retailers such as Apollo Pharmacy, MedPlus, Wellness Forever etc. Online
sales in pharmacy retail is a combination of sales made through e-commerce first platforms and through digitally
enabled platforms of the brick-and-mortar players.
Format Types - Key Characteristics
Modern B&M
Pharmacy
Class A Class B Class C E-Pharmacy
Revenue Contribution to
Pharmacy Retail
Market Size
~8% ~8% ~42% ~40% ~2%
Store Size (sq ft) 500-1000 2500-4000 500-800 150-250 -
Location Neighborhood
Markets
Hospitals
Malls
Airports
Main Markets
Neighborhood
Markets
Neighborhood
Markets
-

124
SKU Range at the
Store 5,000-15,000 20,000-30,000 5,000-8,000 3,000-4,000 50,000+
Merchandise Mix OTC:10-15%
Prescription: 60-
70% Consumables &
Medical Devices:
5-10%
Food &
Non-Food FMCG: 15-20%
OTC:10-15%
Prescription: 60-
70% Consumables &
Medical Devices:
5-10%
Food &
Non-Food FMCG: 15-20%
OTC:10%
Prescription:78%
Food & Non-Food
FMCG/Devices:
12%
OTC:10%
Prescription:78%
Food & Non-Food FMCG:
12%
OTC:10%
Prescription: 55%
Consumables & Medical Devices:
10%
Food &
Non-Food FMCG:
25%
Service Mix Few players offer
doctor’s
consultation and lab
tests
Few outlets offer
doctor consultation
- - Offer doctor’s
consultation and lab
tests
Annual Revenue
(INR Cr)
1-4 1-5 0.4-1 0.1-0.4 -
Procurement Direct &
Distributor
Distributor Distributor Distributor &
Wholesaler
Direct &distributors
Gross Margin
Structure
25-30% 20-30% 15-20% 15-20% 20-30%
Source: Technopak Analysis
Format Types – SWOT Analysis
Modern B&M Pharmacy Traditional Pharmacy E-Pharmacy
Strength • Improved retail environment and
customer experience
• Assisted selling
• Wide SKU range with wellness
and beauty options
• Transparent discount and lower pricing to customer
• Better availability of brands and
prescription fulfilment
• Payment options
• Loyalty programs & customer
service
• Higher gross margins due to scale advantage and vertical integration
• Well entrenched
• High inventory turns reduces the working capital needs
• Assisted selling
• Personalized selling
• Credit to the customer
• Serviceability
• Range of offering (drug sale, medical equipment and other
gadgets, lab consultations) • Convenience • Discounts • Personalized
• Auto refills
Weakness • Limited presence • Poor retail environment
• Limited assortment due to SKU
proliferation (over 100K SKUs
sold in Indian market) resulting in lower fill rates
• Limited discounts based on
relationship and negotiation
• Limited assisted selling
• Limited scope for cross sell
• Difficulty in catering to acute
segment which is more profitable as it is less price-
sensitive (60%+ of the market
which requires quick service)
as well as Tier 2 and beyond
cities due to higher turnaround time
• Lack of profitability till date
Opportunity • Changing retail preferences in
favor of modern retail
• Ability to ensure COVID
appropriate behavior
• Growth in demand for wellness
products
• Greater proliferation of private
labels
• Omni channel offering
• Allied offerings like diagnostics
• Demand bedrocked in
traditional retail with 90%
sales growing at a CAGR of 7%
• Acceleration in growth due to
COVID-19
• Growth in internet penetration
leading to wider adoption of e-
commerce
• Ability to cross sell related products and services
Threats • Non tech led companies could
mismanage inventory resulting in
• COVID-19 has posed a serious
threat to the brick-and-mortar
retailers
• Competition from physical
retail stores

125
lower turns and lower fulfilment
rate
• Competition from e-pharmacy
• Fluidity in regulatory
framework
Source: Technopak Analysis
STATEWISE SPEND ON PHARMACY AND WELLNESS
Retail Spending in Select States – Category Split (US$ Bn)
State Wise Split of Retail market size of Pharmacy & Wellness Category
States
Pharmacy &
Wellness Retail Market Size for FY 2020 (USD
Billion)
% of Pharmacy & Wellness Retail
Market Size - FY 2020
Pharmacy &
Wellness Retail Market Size for
FY 2025(P)
(USD Billion)
% of Pharmacy & Wellness Retail Market Size -
FY2025(P)
CAGR FY 2020 -FY2025
Maharashtra 3.4 15% 5.2 14% 9%
UP 1.6 7% 2.4 7% 8%
AP 0.9 4% 1.3 4% 8%
Telangana 0.9 4% 1.5 4% 11%
Tamil Nadu 1.8 8% 2.8 8% 9%
West Bengal 1 4% 1.5 4% 8%
Gujarat 1.4 6% 2.1 6% 8%
Karnataka 1.6 7% 2.6 7% 10%
Rajasthan 0.9 4% 1.4 4% 9%
Kerala 0.8 3% 1.2 3% 8%
MP 0.7 3% 1.2 3% 11%
Delhi 1 4% 1.5 4% 8%
Haryana 0.9 4% 1.4 4% 9%
Bihar 0.7 3% 1.4 4% 15%
Punjab 0.6 3% 0.8 2% 6%
Orissa 0.4 2% 0.7 2% 12%
Jharkhand 0.3 1% 0.5 1% 11%
North Eastern States 0.4 2% 0.9 3% 18%
Others 3.7 16% 5.6 16% 9%
Total 23.0 100% 36.0 100% ~10%
Source: Technopak Analysis
MARKET WISE SEGMENTATION
In FY 2021, the penetration of the organized pharmacy retail market at a PAN-India level is estimated to be ~12%. However,
the presence of organized pharmacy retail is concentrated in the metros and mini metros. The top 8 cities contribute a share of
close to 32% to the total pharmacy retail market and 62% to the total organized pharmacy market in India in FY 2021 suggestin g
a penetration level of 22%. In the rest of India, the penetration is very low suggesting a huge white space considering these
cities contribute 68% to the overall pharmacy retail. Penetration of modern pharmacy retail is at ~60 -70% in United States,
~35-40% in European Union, and ~30-40% in China which further indicates the potential for increase in organized pharmacy
market growth.
Penetration of Organised Retail across City-Types
City -Type Overall Pharmacy Retail Market
(INR Cr) – FY 2021
Organized Pharmacy Retail
Market
(INR Cr) – FY 2021
Penetration of Organized Retail
Metro & Mini metros 57,960 12,648 22%
Tier I 57,960 4,140 7%
Tier II & beyond 65,205 3,686 6%
Total 1,81,125 20,475 11%
Source: Technopak Analysis

126
Penetration of Organised Retail across Metros & Mini-Metros
City Population in Mn (2021)
Pharmacy Retail
Market (INR Cr) - FY
2021
Organized Pharmacy
Retail Market (INR
Cr) - FY 2021
Penetration of
Organized Retail
Greater Mumbai 28 12,625 3,156 25%
Delhi NCR 30 13,561 1,627 12%
Kolkata 20 8,806 1,585 18%
Chennai 12 5,246 1,836 35%
Hyderabad 10 4,674 1,683 36%
Bangalore 12 5,127 1,846 36%
Ahmedabad 9 3,832 383 10%
Pune 9 4,089 532 13%
Total 130 57,960 12,648 22%
Source: Technopak Analysis
Modern B&M pharmacy retail outlets in the southern states contribute a share of more than 50% to the total number of to the
modern pharmacy outlets in the country. While modern pharmacy outlets in the metros, mini metros and tier 1 cities contribute
close to 68% of the total number of the modern pharmacy outlets in the country, they are yet to increase penetration into the
other markets across the country. While the value proposition of discounted prices, availability, fill rates, low turnaround time
is relevant for Tier 2 cities and beyond, penetration of the organized pharmacy retail is remains quite low in these cities,
indicating a headroom for growth in these cities.
Zonal Share of Organised Pharmacy Retail Outlets
Source: Technopak Analysis
City Type share of Organised Pharmacy Retail Outlets
Source: Technopak Analysis
Key Trends
• Pharma Retail gradually transitioning towards Modern Formats. Penetration of modern retail in pharmacy is
relatively lower than most other categories except food and grocery. However modern pharmacy retail is estimated to
12%
19%
15%
53%
Tota l : ~10,000 Outlets
North East West South
50%
18%
32%
Tota l : ~10,000 Outlets
Metro & Mini Metro Tier I Rest of India

127
grow at a CAGR of 25% in the coming 5 years growing signif icantly faster than other categories. Entry of new players,
investments in e-commerce and omni-channels platforms is aiding this transition. Inclination towards modern
pharmacy is being witnessed on account of better customer experience, wider product range, value added services and
transparent discounts.
Organized Penetration across Key Categories
Categories 2015 2020 2025 (P)
Total Organized Retail (US$ bn) 41 94 210
Food and Grocery 3% 4.5% 9.0%
Jewellery & Watches 27% 32% 40%
Apparel & Accessories* 23% 32% 45%
Footwear 9% 30% 35%
Pharmacy & Wellness 5% 10% 20%
Consumer Electronics 26% 32% 45%
Home & Living 9% 15% 30%
Others 11% 14% 22%
*Accessories include Bags, Belts, and Wallets; Others include Books & Stationery, Toys, Eyewear, Sports Goods, Alcoholic Beverages & Tobacco etc.
• Rapid development of online pharma retail. Within modern pharmacy retail, e-commerce and omni channel retailing
is expected to grow at a CAGR of ~45% and is well poised to contribute to the growth significantly. Amongst all the
retail categories, pharmacy e-commerce is expected to be one of the fastest growing segments next to only food and
grocery. B&M stores are in position to capitalize on this growth with a their digitally enabled platform linked with the
physical stores and warehouses is which will allowing them to grow at faster pace. While the offline sales of
omnichannel model are included in the brick-and-mortar sales, the online sales of omnichannel players are included
in the e-commerce retail.
Share of Brick & Mortar and E-commerce across Categories
FY 2020 FY 2025 (P)
Share of Retail
Retail Size (US$ Bn)
Share of traditional retail
Share of B&M Retail
Share of E-commerce
Share of Retail
Retail Size (US$ Bn)
Share of traditional retail
Share of B&M Retail
Share of E-Commerce
Food and Grocery 66.1% 526 95.5% 4.0% 0.5%
63.3% 682 91% 5% 4% Jewellery & Watches 7.9% 63 68% 28% 4% 8.7% 94 60% 33% 7%
Apparel & Accessories* 7.9% 63 68% 14.5% 18% 9.0% 96 55% 23% 22%
Footwear 1.2% 10 70% 14.2% 15.8% 1.1% 12 65% 10% 25% Pharmacy &
Wellness 2.9% 23 90% 7.8% 2.2% 3.3% 36 80% 11% 9%
Consumer Electronics 6.4% 51 68% 4.7% 27.3% 7.1% 77 55% 9% 36%
Home & Living 4.3% 34 85% 7.7% 7.3% 4.4% 47 70% 11% 19%
Others 3.2% 25 86% 5.3% 8.7% 3.1% 33 78% 10% 11%
Total 100% 796 100% 1077 *Accessories include Bags, Belts, and Wallets Source: Technopak Analysis
• Pharmacy Retail operates with better unit economics. It operates at high inventory turns reducing the holding cost,
improving the sales per square foot and working capital efficiency. Lifestyle retailers selling apparel and footwear
clock an inventory turn of 4 to 6. It is further lower for jewelry retail and high for need based categories suc h as food
and grocery and pharmaceutical products.
Unit Economics for Retail Segments (Modern Formats)
Pharmacy
Retailing
Food & Grocery
Retailing
Jewellery
Retailing
Apparel
Retailing
Food Services
(QSR)
Typical order Value (INR) 250-500 500-1000 20,000-1,00,000 2,000-3,000 500-550
Typical store Area (sq ft) ~500 1,500-2,500 3,000-5,000 1,000-1,500 1,200-1,600
Typical store Revenue per
month (INR) 10-15 Lakhs 30-50 Lakhs 4-6 Cr 15-25 Lakhs 25-35 Lakhs

128
Average Revenue per sq ft
per year (INR) 30,000-50,000 ~24,000 ~1,40,000 ~20,000 ~26,000
Inventory Cost (INR) 10-20 Lakhs 28-30 Lakhs 30 Cr-40 Cr ~70 Lakhs 10-15 Lakhs
Inventory Turns 9-15 times 12-15 times 2 times 3-4 times 24
Promotional expense as % of
store revenue ~1% 1-2% 1-3% 5-7% 4-5%
Employee Cost as % of store
revenue 3-5% 5-8% 1-2% 8-10% 9-12%
Capex per store (INR) 4-8 Lakhs 32-35 Lakhs 3-4 Cr 30-35 Lakhs 1.5 -2.5 Cr.
Share of Private Labels 5-10% 15-20% 100% Varies 100%
Number of SKUs 5,000-15,000 4,000-5,000 1000-1500 500-600* 35-40**
Store-level Pay Back Period ~3 years ~3 years ~3-4 years ~2-4 years ~3-4 years
Steady State Store-level
RoCE 45-50% 30-35% 20-25% 25-40% 25-35%
Omni-channel Readiness High High Low Medium Medium
Sources: Secondary research, Primary Interviews, Technopak Analysis *SKUs for clothing does not include size variants. Only colour and style options
• Players adopting omnichannel approach as a response to the changing healthcare needs. The sector lends itself very
well for omni channel retailing with the prevalence of the neighborhood format stores. Tech enabled architecture with
unified view of inventory has enabled companies like Medplus to have a strong omni channel presence. Medplus is
the first pharmacy retailer in India to offer an omni-channel platform since 2015. Players with an established network
of stores are leveraging the stores using them as hubs to service the orders received on their transactional websites
established in the recent past, combining the strengths of the offline healthcare retail infrastructure with their digital
offerings. Omni-channel makes it imperative for retailers to have a centralized data management in order to
synchronize existing channels. Commencing in first pharmacy retailer in India to offer an omni-channel platform the
year 2015, Medplus was the first pharmacy retailer in India to offer an omni-channel platform. Non-walkin retail
accounted for 7% and 9% of overall retail revenue for the company in FY 2020 and FY 2021 respectively. Similarly,
non – walkin sales accounted for 11-12% of sales for Wellness Forever in FY 2021. On the other hand, the e-pharmacy
players are also benefitting from a well-established supply-chain and leveraging it to launch their presence in the brick-
and-mortar space. Online pharmacy like Netmeds.com piloted its first brick-and-mortar store in Karnataka's Belgaum
in 2019 and plans to roll out 20 such stores. COVID-19 has accelerated the need for flexibility that is built on a
hyperlocal framework combining the virtues of brick and online mediums in switching the channels.
The “brick-and-mortar” players have an edge over “the online only” players in adopting omni-channel approach and rolling out
such a framework given the fa ct that they have an existing network of stores to service the local cluster, stocking of inventory
at cluster level to address the demand faster and an optimized cost structure. Many modern retailers with store led order
fulfilment can also deliver the order within a shorter timeframe at a much lower delivery cost vis-à-vis digital natives. Omni-
channel players can better address the acute therapy demand because of faster response mechanism. Delivery cost for omni-
channel players is lower due to the dense offline network. These advantages particularly play out strongly in Tier II/III cities
where the online only players require a longer response time. Omni-channel helps in customer acquisition and retention and
increases loyalty. It also allows players to offer discounts comparable to that offered at e-pharmacies profitably because of their
low cost of delivery. Walgreens’ and CVS’s omnichannel initiatives have played out well for the developed markets. Walgreens
Boots Alliance’s partnership with Microsoft a nd Adobe to launch a digital experience and customer insights platform testifies
their confidence in this approach.
Omnichannel Sales Contribution – Pre-COVID and Post COVID Comparison
Year of start of
Omnichannel selling
Contribution to Sales
FY 2020
(Pre-COVID)
Contribution to Sales
FY 2021
(Post-COVID)
Medplus 2015 7% 9%
Apollo 2019 1-2% 2-5%
Wellness Forever 2016 9.5% 11.7%
Sources: Secondary research, Primary Interviews
• Cluster approach of expansion. Pharmacy chains follow a cluster approach for expansion. Pharmacy chains select a
cluster basis the potential and supply parameters to open a number of stores within that cluster. This allows them to
capture a sizeable share of the market by saturating its presence within the cluster’s geography. This approach helps
the players to understand the specificities of that market in terms of consumers behavior, nature of demand, visibility
for products and services & drivers of operational costs.

129
• Emergence of nutraceuticals. At present, USA, Japan and Europe account for more than 90% of the total global
nutraceutical market. Globally, nutraceuticals have gained importance and become a part of the consumer’s daily diet
particularly among the aspirational consumer segments across key markets. The major reasons for this change have
been the increasing prevalence of lifestyle diseases and people consciously taking preventive healthcare measures.
With the existing dominating markets now maturing and the rising awareness of nutraceut icals among the aspirational
class across the world, the focus of nutraceutical players has now shifted towards under-penetrated markets in
developing economies, especially those across Asia Pacific, including India. Accounting for almost 2% of the global
nutraceutical market, the Indian nutraceutical market is estimated to be around INR 51,750 crores in FY 2020 and is
expected to reach approx. INR 127,500 crores by FY 2025, growing at a high CAGR of 20%. The key factor driving
growth in this segment are:
• Compensation for unhealthy lifestyles. Failure to adhere to a nutritionally balanced diet has resulted in an
increased demand for nutraceuticals to meet nutritional needs. Along with surge in demand for dietary
supplements to address various deficiencies, there is an increased demand of functional foods which combine
the benefit of food and nutrients.
• Growth in Non-Communicable Disease. The rise in incidences of heart diseases, lifestyle disorders, cancer,
respiratory disease & diabetes coupled with increa sing share of nutraceuticals in doctor’s prescription have
led to increase in consumption.
• Impact of COVID-19. The growing demand for natural immunity-boosting products during the COVID-19
has accelerated the growth of the nutraceuticals industry during th is period. High growth was registered
during FY 2021 in the sales of vitamins & minerals especially with vitamin C & D that help in boosting
immunity.
• Increase in Awareness. Increased awareness regarding nutritional care through rapid digitization, increa se in
social media usage, advertisements by players, advocacy through influencers like nutritionists, dietitians and
doctors and has made the nutraceutical products more visible and has urged the consumers to take preventive
care.
• Urbanization and Growing Income Levels. The urban population have become more health conscious with
increased interest in sports activities, yoga, health clubs, etc. contributing to the demand in nutraceutical
business.
• Growth in non-food wellness products. Along with functional food and beverages, there has been a growing demand
for wellness products in personal and home care products such as herbal products, elderly care products, sexual
wellness products. COVID-19 has accelerated this trend. International and domestic brands have been steadily
launching new products and exploring chain pharmacies and e-pharmacies for their distribution and exclusive
partnerships. This segment is also driving premiumization in pharmacy retail. Pharmacy chains are also developing
new products in personal and home care through their own private labels.
• Pharmacies becoming an integral sales channel for food and non-food FMCG. Food and non-food products pertaining
to wellness have recognized pharmacy retail an as integral channel of sales. Modern pharmacies especially have
rendered an appropriate retail environment for FMCG food and non-food products. This offer is curated to blend with
the overall merchandise assortment at pharmacies. While within packaged food and beverages, functional food and
beverages have found shelf space in pharmacies, in personal care and home hygiene, speciality products targeting to
address a specific condition have been added to the offer. In modern pharmacies, the share of food and non -food
FMCG products in the overall store revenue is found to be in the range of 15-20%. This share is ~40% for Wellness
Forever which has created a niche product offering on the platform of wellness. In traditional pharmacies, it is in the
range of 15-16%. On the other hand, for FMCG companies, pharmacies contribute around 6-7% of their total retail
sales. Hindustan Unilever acquiring GlaxoSmithKline Consumer, a distribution partner for GSK products portends the
significance of access to the key pharmacy channel for the FMCG companies.
On the back of high growth in these categories and growing share of organized pharmacy retail, the offtake of these
categories from pharmacy retail is expected to grow at a rate of 12% in the coming 5 years, outpacing the overall
growth in pharmacy retail estimated at 10% suggesting the growing significance of food and non -food FMCG for the
pharmacy retail.
Share of Sales of food and non-food FMCG products from Grocery and Pharmacy Formats
Market Size (INR Cr)
– FY 2020
CAGR
(FY 2020-2025)
Share of Sales from
Grocery Formats
Share of Sales from
Pharmacy Formats

130
Functional Food & Beverages 21,750 19% 85% 15%
Dietary Supplements 31,500 20% 35% 65%
Personal care & Home
Hygiene 1,38,800
7% 96% 4%
Sources: Secondary research, Primary Interviews
• Emergence of self-diagnostic devices: Manufacturers of health-tech devices that allow users to self-diagnose ailments
and monitor health risks have been seeing a surge in sales growth. The trend has got further accelerated amid the
coronavirus pandemic. While traditionally blood pressure monitors, diabetes kits, weighing machines, thermometers
have formed the bulk of the demand, the pandemic caused a spike in demand for oximeters and pulse monitors. Industry
players are focusing their efforts on R&D to develop superior quality self -diagnostic medical devices. The modern
pharmacy channels are benefitting from this trend on two counts. Firstly, modern chains and e -pharmacies have proven
to be a better channel for its off-take as compared to traditional channels resulting in the category gaining a share of
sales. Secondly, given the brand agnosticism associated with this category, it is a preferred category for private labels.
• Loyalty programs aiding customer retention: Players like Apollo and Medplus have developed a customer loyalty
platform for greater customer acquisition and improved customer retention by offering discounts and leveraging
loyalty driven behavior to up-sell and cross-sell, using advanced analytics. Wellness Forever is also in the process of
developing a robust loyalty program.
• Ecosystem play: Besides dispensing pharmaceutical and FMCG products, modern pharmacies are now building up a
complete ecosystem of related services in order to acquire customers. They have augmented their proposition by
offering a wide range of value-added services like appointments for doctors, online consultation, health blogs,
medicine reminders & refills alerts, tie ups with diagnostic centers.
• Private labels focus to drive higher margins: Private label in modern pharmacy in India is an evolving growth story.
Major modern pharmacy retailers, like F&G modern retailers, view private label for margin enhancement, product
differentiation and customer loyalty. While there are private label opportunities across the product range including
prescription drugs, OTC drugs, wellness and beauty product and high throughput FMCG product, it is important to
understand the construct of these product categories that define Modern Pharmacy retail. Factors that influence private
label opportunities differ across these categories. While a few of these factors are like that of F&G modern retailers
that evaluate private label, other factors are unique to pharmacy retail.
Categories in Pharmacy Retail and their respective private label leverage
Prescription OTC Wellness
Consumables
Devices &
Consumables
Consumer
Food
Consumer Non-
Food Split of total Retail store
sales
60% 15% 5% 3% 7% 10%
Example
• Non-Generics – Cancer drugs, Antibiotics
• Branded Generics – Dolo
• Generic Generic – paracetamol
•
• Digestives
• Inhalers
• Antacids
• Multivitamins
• Nutraceuticals
• Oximeter
• Thermometers
• Surgical Cotton
• Baby food
• Digestive Biscuits
• Women Hygiene
• Male contraceptives
• Mosquito repellants
• Hair Oil
Product Margins
• 25-35% in IP medicines
• 25-30% in branded Generics
• 30-70% in Generic Generic
• 18-25% • 35%-60% • 35%-60% • 12%-25% • 12% -35%
Brand Pull
of distribution brands
• Very high in IP based drugs and driven by
doctor’s prescription
• Medium to high in
• Medium to High
• Low to Medium
• Low • High
across categories
• Medium to High

131
Branded
Generics due to brand’s own marketing efforts with
retail chains
National
Modern Pharmacy Retailer’s private label
focus
• High in Generic
Generics
• Low to
medium
• High like Nutraceuticals
• High viz. devices like BP machines,
• Medical consumables
• Low
• Medium to High viz. Home
Care
Source: Technopak Research
Market characteristics including a highly fragmented pharmaceutical market, unorganized pharmacies focusing on prescription
drugs and an increasingly aware customer base with higher aspirations are key drivers for private label in modern pharmacy.
However, each product category is unique with its own key drivers. Private label sales contribution is in the range of 8-10% in
leading modern pharmacy retail chains. This share of private label is projected to reach 12% by 2025. Going forward there will
be higher thrust towards self-cure, preventive healthcare, wellness and beauty products. These trends are expected to play out
as key drivers for the growth of private label among leading modern pharmacy retailers. As the modern pharmacy companies
scale up to be national and strong regional player with higher economy of scale, the opportu nity to develop private label products
across a much larger range of products will emerge as minimum order quantities will cease to be a challenge.
Split of private label across categories for different Modern Pharmacy Retailers FY 2021
Split of private label sales across categories Share of Private label (% of total sales)
Key Players
Wellness Forever ~2%
Medplus 10.4%
Apollo ~10%
Source: Technopak Research
Pan India / Pan Regional chains’ private labels are present across a range of categories and depending upon the player’s
individual market positioning and interplay of sub-categories, focus is accordingly established. For instance, the private label
mix is different for Medplus and Wellness for this is guided by uniqueness in the positioning of these players in their respective
markets and customer segments. Nonetheless by virtue of their size, leading modern pharmacy retailers can leverage scale and
explore multiple sub-categories for private label activation. This option is restricted to regional and local chains.
Pharmacy chains are adopting different strategy to grow the private label business which is also a reflection of their overall
strategy. Chains like Medplus with higher contribution of prescription drugs have a range of private label products in
prescription drugs with a healthy contribution of close to 6% in the prescription drugs category. Given the fragmented nature
of pharmaceutical drugs market in India with market leader having a share of less than 10% prescription drugs is a big
opportunity. Availability of contract manufacturers can also help drive private label in prescription drugs. However, there a re
structural issues with pharmaceutical companies driving sales through incentives and collaboration wit h doctors. Pharmacy
chains can counter this structure by leveraging the trust of customers in the pharmacists at the store. Pharmacists can educa te
customers on equivalent drug outcomes at a price differential as applicable. The government driving sales of generic products
can also make patients more amenable to generic products and the category can become very big in the future.
Modern pharmacy chains are also positioning themselves as a health and wellness destination. Chains are looking at healthy
products across OTC, food, and nonfood segments with natural ingredients as a growth opportunity for the private label
products. Growing awareness towards health and preventive care is driving wellness category. Nutraceutical products both in
supplement category as well as functional foods have traditionally been sold in pharmacy retails. Modern pharmacy companies
are positioning themselves as destination stores for nutraceutical products and developing a complete range of products in th e
category.
Chains like Wellness forever with a lower contribution of prescription drugs see opportunity in driving sales of exclusive range
of health in beauty products through collaboration and in house development. This can be a natural extension for a pharmacy
stores on health and wellness platform. The niche nature of the category and limited brand recognition in these categories are
an opportunity area. Private label products under OTC and wellness range is an important range to build the imagery of the
chain.
Medical devices are another opportunity for growth in private label for pharmacy stores. Growing awareness, prevalence of
self-cure and growth of chronic diseases are key drivers for the category. Pharmacy chains face competition from other modern
retail chains in this category. Online retail companies are already selling a range of medical devices.
Exclusive collaborations including imported products by modern pharmacy companies across a range of categories has helped
drive sales and loyalty at the store. Modern pha rmacies are using collaborations to bring a full range of products in health and

132
wellness as well as FCMG categories. These include premium labels and clean labels which are niche in nature. Private label
products across FMCG segment in pharmacy retail is a function of saliency, scale and margin profile to the store. The range
needs to be efficiently build looking at category adjacency, customer adoption opportunity and overall profitability. Chains
have come up with me too products in the category which are top up opportunities for the customers.
Technology plays an important role in success of modern pharmacy companies. Modern pharmacy chains have invested in
technology which helps in tracking and tracing of products Modern tools are being used to understand gap in product assortment.
It also drives review of products across key supply chain metrics.
Private label program at modern pharmacy stores leverage technology to review and refocus strategy. Products may get out of
stock or may lead to higher inventory with both leading to loss. Key inputs in terms of availability, pricing tables and related
saliency and overall marketing input is driven by technology.
Unit Economics Comparison of Private label and Distribution Brands
Margin Play
Private Label * Brand
Brand margin 20-30%
Distributor margin 8-12% 8-12%
Retailer Margin 20-25% 20-25%
Total Margin to Retailer 48-67%` 28-37%
Source: SME interviews, Annual reports of companies, Technopak Research *In the case of private label brand margins are retained by the modern pharmacy retail. This margin is the incremental advantage of private label over distribution brands
Private label has traditionally been positioned as margin driver in modern retail stores. In a priva te label product, the value-
added activities of retailers, distributors and the brand owners or manufacturers are all taken over by the retail chain and
naturally the margin spread in the supply chain is transferred to the retail chain. The difference in m argin spread across
categories is a function of the trade characteristics including competition, supply and demand factors, product novelty and
business risk as involved in the product.
Private label margins are higher as compared to that of distribution led brands across product categories. Higher margin is an
opportunity to drive profitability as retail chains assess their ability to drive sales for a given range of products based o n factors
including customer profile at stores, category behaviour and product value proposition. High margin categories give additional
incentive to retail chain as higher resources including staff incentives are allocated to increase sales contribution. As the sales
contribution of high margin private label categories increa se, stores aim to improve their profitability.
Growth Drivers for Pharmacy Retail
• Increased Spending on Pharmaceutical Products: Medicine spending in India is expected to increase at a 9-12%
CAGR, driven by increasing consumer spending, rapid urbanization, rise of non-communicable disease (NCDs) and
raising healthcare insurance among others, leading to the growth of pharmacy retail in India.
• Growth in demand for Preventive Healthcare and Wellness Products: With growing demand for wellness products
such as functional food and beverages, herbal products, elderly care products, sexual wellness products, personal care
products, pharmacies besides grocery formats have become a significant channel of sales for such products. Given the
high value of such products, it has resulted in an increased throughput per pharmacy. Pharmacies have also therefore
changed their focus by offering consumers an appropriate range of such products. This segment is also driving
premiumization in pharmacy reta il.
• Growth in demand of non-food segments of FMCG sector (personal care and home care): The demand for personal
and home care products have been growing at a CAGR of 7-8%. While off-take of these products is largely through
the grocery formats, pharmacies have also witnessed growth in contribution from these products especially products
related to wellness.
• Growing Number of Chronic Therapies: While the contribution of acute therapies is estimated at 63% with 37% for
chronic therapy in FY 2020, the contribution of chronic therapy is going to increase as lifestyle diseases show higher
prevalence and the age profile of the population moves to higher side. Chronic therapies are dominated by cardiac,
anti-diabetic and Neuro/CNS therapies. This increase in lifestyle diseases generates a regular and sustained demand
for drugs. While the demand of pharmaceutical products for acute therapies is well serviced by the hospitalized and
specialized clinics, pharmacy retail outlets are a significant channel for chronic therapy needs.

133
Challenges
• Spurious Trade: One out of ten medicine sold in developing countries is not an original product. Trade has suffered
from sale of counterfeit and fake medicines which can lead to serious complications.
• Mishandling of Medicines: Medicines going through rough handling and lack of storage issues across the supply chain
may lead to variance from the desired outcome of medication.
• Lack of Visibility of Medicines: Lack of inventory management system at the stores and lack of integra tion with the
value chain leading to stores stuck with unsold and low shelf -life inventory.
• Medicines sold without prescription and bill: Abuse of medicines in cases where it is sold without prescription. Also,
loss of revenue to the government as sales can go unreported in the tax system.
• Limited SKUs & Discounts: Traditional pharmacies are serving the immediate needs of the customer. The opportunity
to sell a complete range/SKUs of products from adjacent categories is not explored. Minimum incentive to the
customer in terms of discounts or other promotion scheme is offered.
• Lack of qualified pharmacists at retail outlets: Pharmacists have a critical role in dispensing of prescription medicines.
As per regulations, at every pharmacy, there should be a pharmacist who will be responsible for the observance of
proper standards of conduct. Traditional pharmacies often avoid appointing certified pharmacists to cut costs. This
inadequacy if firmly being addressed by the modern retail players.
COMPARISON WITH DEVELOPED AND OTHER DEVELOPING COUNTRIES
Amongst the country/country groups compared, the USA displays the highest penetration of modern retail in pharmaceuticals
sale. While Walgreens started its operations in early 1900s, CVS Pharmacy launched its first pharmacy in 1963. Both Walgreens
and CVS now have a retail footprint of almost 9000-10,000 stores. A high penetration of modern pharmacy retail in the USA
along with accelerated growth of organized pharma -retail in India suggests that India is well prepared to follow a similar path
albeit gradually.
Pharmacy Retail Comparison
USA EU China India
Pharmacy Retail Market
Size FY 2020 (USD Bn) ~300 ~200 ~52 ~21
Penetration of Modern
Pharmacy Retail ~60-70% ~35-40% ~30-40% 10%
Internet penetration 87% 91% 70% 50%
Key Players CVS, Walgreens,
Health Mart
Phoenix Group,
Dr.Max, Walgreens
Boots Alliance
GuoDa Drugstore, YiXinTang Pharmacy,
LBX Pharmacy
Apollo, MedPlus,
Wellness Forever
Industry Structure Largely Privately
Owned
Largely Privately
Owned
Largely Controlled by
Government
Largely Privately
Owned
Dominance Offline stores Offline stores Hospitals based retail Offline stores
Degree of Consolidation
CVS and Walgreens
dominate the modern retail market
Fragmented market
with over 130,000 independent stores
Most distributors are
focused on hospital
business and very few are specialized in retail
business
Fragmented market with
over 850,000 independent stores
Regulatory Complexity High Medium Medium Medium
Regulatory Enforcement High High - Medium High - Medium Low
Sources: Secondary research
Value Chain
The domestic retail pharma market is huge with over 3,000 companies operating in the pharmaceutical industry and about
10,500 manufacturing units catering to the approx. 7-8 lakh retail pharmacies, hospitals, government agencies and doctors.
Doctors are at the center of the pharmaceutical supply chain and one of the key parameters of review for a pharmaceutical
company is access to doctors. There are approximately 12.5 Lacs doctors in India.
The typical value chain for supply of medicine involves the drug manufacture to engage a C&F agent to handle the bulk sales
of the products. The C&F agent supplies the stock of medicines to regional/speciality or local/sub distributor who in turn su pply
to pharmacies. In case of the chain pharmacies, the medicines are usually supplied directly by central company warehouse or
the C&F agent as they buy in bulk to offer discounts to their consumers.
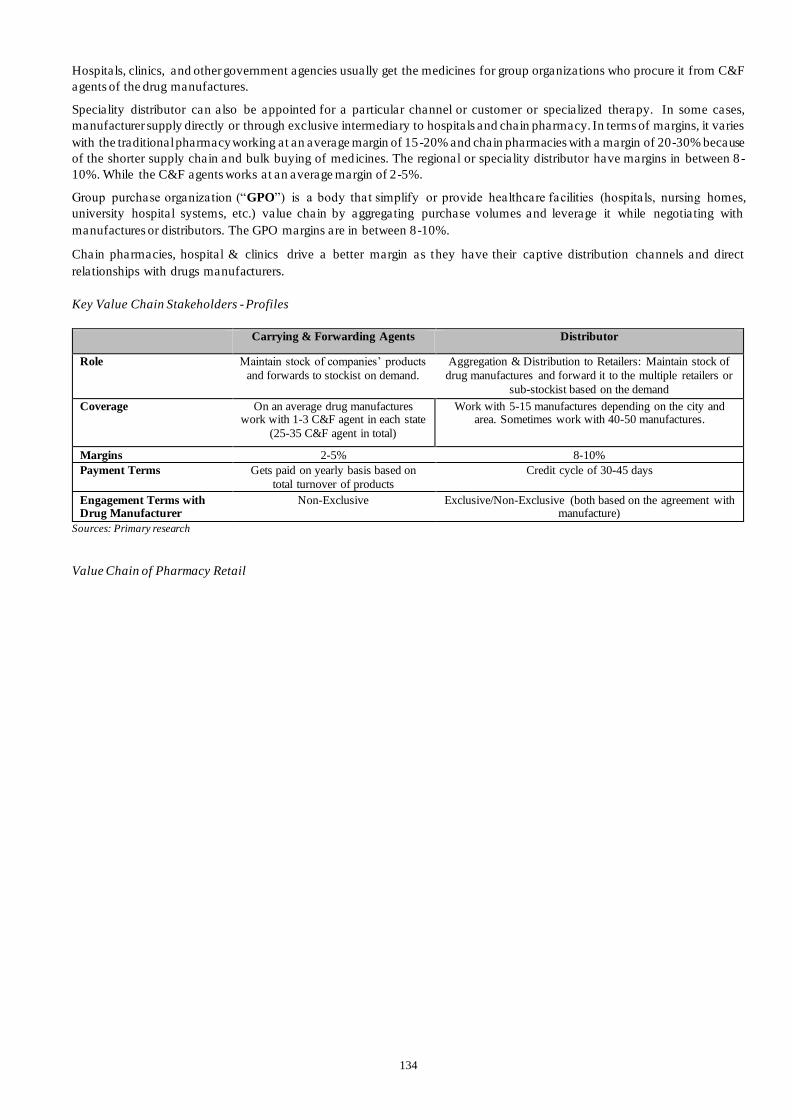
134
Hospitals, clinics, and other government agencies usually get the medicines for group organizations who procure it from C&F
agents of the drug manufactures.
Speciality distributor can also be appointed for a particular channel or customer or specialized therapy. In some cases,
manufacturer supply directly or through exclusive intermediary to hospitals and chain pharmacy. In terms of margins, it varies
with the traditional pharmacy working at an average margin of 15-20% and chain pharmacies with a margin of 20-30% because
of the shorter supply chain and bulk buying of medicines. The regional or speciality distributor have margins in between 8 -
10%. While the C&F agents works at an average margin of 2-5%.
Group purchase organization (“GPO”) is a body that simplify or provide healthcare facilities (hospitals, nursing homes,
university hospital systems, etc.) value chain by aggregating purchase volumes and leverage it while negotiating with
manufactures or distributors. The GPO margins are in between 8-10%.
Chain pharmacies, hospital & clinics drive a better margin as they have their captive distribution channels and direct
relationships with drugs manufacturers.
Key Value Chain Stakeholders - Profiles
Carrying & Forwarding Agents Distributor
Role Maintain stock of companies’ products
and forwards to stockist on demand.
Aggregation & Distribution to Retailers: Maintain stock of
drug manufactures and forward it to the multiple retailers or
sub-stockist based on the demand
Coverage On an average drug manufactures work with 1-3 C&F agent in each state
(25-35 C&F agent in total)
Work with 5-15 manufactures depending on the city and area. Sometimes work with 40-50 manufactures.
Margins 2-5% 8-10%
Payment Terms Gets paid on yearly basis based on
total turnover of products
Credit cycle of 30-45 days
Engagement Terms with Drug Manufacturer
Non-Exclusive Exclusive/Non-Exclusive (both based on the agreement with manufacture)
Sources: Primary research
Value Chain of Pharmacy Retail

135
Indicative Gross margin spread in bracket
Source: Primary Research
ROLE OF DIGITALIZATION AND TECHNOLOGY
Currently the industry is oriented in the direction of seamless retail which leverages technology, data, and cloud computing
through integrated systems. These systems are enablers of omni-channel retail in pharmacy and other consumer retail categories.
Key areas where technology has positively impacted the pharmacy retail are access to customer intelligence, inventory
management and digitally enabled sales.
• Customer Intelligence: Access to customer intelligence helps predict consumption based on past purchases, offer
superior CX, record medical history and alert the consumers for impending purchases.
• Inventory Management: Through the application of data backed systems in merchandise and inventory management,
logistics and supply chains, brick and mortar and e-pharmacies are keeping a track of total purchase orders, expiry
date management, organize and manage inventory in warehouses and ensure the company has enough stock - especially
when products are in high demand. Technology and data backed systems are helping optimize inventory turns while
ensuring high fulfilment rate.
• Digitally enabled channels: Companies have employed concepts of Artificial Intelligence and Machine Learning to
bring the best results in their businesses. Many e-commerce players have also been experimenting with Machine
Learning in areas like voicebots and chatbots, product recommendation, and prevention of fraud orders.
• Omni channel retailing: Select organized B&M retailers leverage their vast neighborhood store network, unified view
of inventory, well connected business architecture and rich customer data to offer omni channel retailing experience

136
to their end customers. While app-based interfaces are being developed for digital transactions, platforms like
WhatsApp and tele-calling are also being engaged for order placement and payment for the benefit of consumers who
may not be attuned to use apps.
• Store opening and operations: Select organized B&M retailers ha ve leveraged rich data, data analytics to decide on
the store location and the merchandizing required at these locations
There are various automated technology systems available like computerized physician order entry (“ CPOE”), enterprise
resource planning (“ERP”), customer relationship management (“CRM”), sales force automation (“SFA”), electronic batch
records (“eBR”) to name a few. Each of the automated application has a specific area of function and helps in storage,
maintaining, analysis of data related to the specific function area.
Technology is also leading to formalization of manpower through IT introduction in key processes of supply chain management
and logistics, store operations, inventory management, sales management, taxation and customer management.
Dedicated tools and products are available for the smaller businesses for managing their inventory, accounts, purchase orders
and sales.
KEY GOVERNMENT REGULATIONS AND POLICIES RELATED PHARMACY RETAIL AND E-PHARMACY
IN INDIA
• Retail Pharmacy: The retail pharmacy in India is a regulated business requiring a drug sale license from respective state
government. In addition to the infrastructure requirements like space, refrigerator etc., it is essential to employ a
registered pharmacist for every pharmacy. Drugs & Cosmetics Act and Rules, and Pharmacy Act regulate the retail
business of pharmacy. The drug inspector (Drugs & Cosmetic Act and Rules) is accountable to inspect the pharmacy to
certify the conditions of license for sale. The conditions of sale license are maintaining the purchase records, records of
purchase from licensed wholesaler, sales records either in register or cash memo, sale of schedule medicines (Schedule
H and X) only under the prescription of registered medical practitioner, prescription confirmation after sale of Scheduled
H and X drugs etc.
It is required that the prescription medicines only to be sold under the supervision of a registered pharmacist. The
pharmacist is expected to advise the patients or medicine buyers on safe and effective use of medicines.
There are few specifications and regulations which are required to be followed by a pharmacy and wholesale distributor
to obtain the drug license to start the drug sale.
Key Regulations and Licenses required for Pharmacy Retail
Criteria Retail Drug License Wholesale/Distributor Drug License
Facility Pharmacy store can be in a mixed land use area or a
commercial complex
Wholesale/Distributor pharmacy store can only be
located at a commercial complex.
Minimum area
requirement
A minimum carpet area of 10 sqm. with a height of
2.75 meters is required for retail pharmacy.
A minimum carpet area of 10 sqm. with a height
of 2.75 meters is required for
wholesaler/distributor pharmacy store.
Approach Road It must be facing a minimum road width prescribed
by the municipality of the area for mixed land use.
Approach road much be broad enough to facilitate
the loading and unloading of medicines. (Minimum road width of 18 meters or more)
Furniture Racks, Storage almirahs and table chairs Racks, Storage almirahs and table chairs
Equipment’s
Computers, Printer to generate invoices, Refrigerator
& Air conditioner is essential for grant of a drug
license in India since some medicines/drug, particularly the vaccines, need to be stored in a low
temperature.
Computers, Printer to generate invoices,
Refrigerator & Air conditioner is essential for
grant of a drug license in India since some medicines/drug, particularly the vaccines, need to
be stored in a low temperature.
Certificates/Documents Rent agreement if any, blueprint of the facility, GST
certificate, professional tax certificate etc.
Rent agreement if any, blueprint of the facility,
GST certificate, professional tax certificate etc.
Source: Ministry of Health and Family Welfare (Department of Health)
• E-Pharmacy: The Government of India has proposed a draft policy around e-pharmacy regulations in the year 2018.
The proposed draft contains provisions for safety of personal data and confidentiality of the patients/customers.
The guidelines issued by the Ministry of Health and Family Welfare under draft rules are:
1) Mandatory for e-pharmacies to register themselves with a central authority.
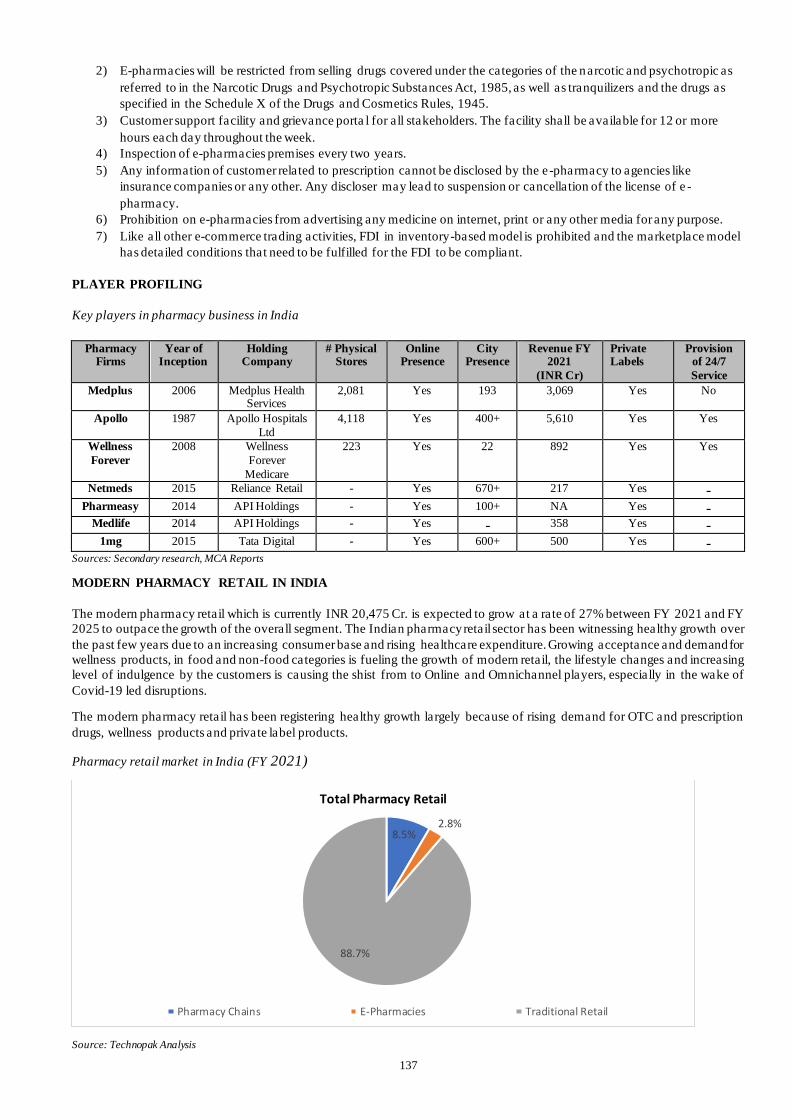
137
2) E-pharmacies will be restricted from selling drugs covered under the categories of the narcotic and psychotropic as
referred to in the Narcotic Drugs and Psychotropic Substances Act, 1985, as well as tranquilizers and the drugs as
specified in the Schedule X of the Drugs and Cosmetics Rules, 1945.
3) Customer support facility and grievance porta l for all stakeholders. The facility shall be available for 12 or more
hours each day throughout the week.
4) Inspection of e-pharmacies premises every two years.
5) Any information of customer related to prescription cannot be disclosed by the e-pharmacy to agencies like
insurance companies or any other. Any discloser may lead to suspension or cancellation of the license of e -
pharmacy.
6) Prohibition on e-pharmacies from advertising any medicine on internet, print or any other media for any purpose.
7) Like all other e-commerce trading activities, FDI in inventory-based model is prohibited and the marketplace model
has detailed conditions that need to be fulfilled for the FDI to be compliant.
PLAYER PROFILING
Key players in pharmacy business in India
Pharmacy
Firms Year of
Inception Holding
Company # Physical
Stores Online
Presence City
Presence Revenue FY
2021
(INR Cr)
Private Labels
Provision of 24/7
Service
Medplus 2006 Medplus Health Services
2,081 Yes 193 3,069 Yes No
Apollo 1987 Apollo Hospitals
Ltd 4,118 Yes 400+ 5,610 Yes Yes
Wellness
Forever 2008 Wellness
Forever
Medicare
223 Yes 22 892 Yes Yes
Netmeds 2015 Reliance Retail - Yes 670+ 217 Yes -
Pharmeasy 2014 API Holdings - Yes 100+ NA Yes -
Medlife 2014 API Holdings - Yes - 358 Yes -
1mg 2015 Tata Digital - Yes 600+ 500 Yes -
Sources: Secondary research, MCA Reports
MODERN PHARMACY RETAIL IN INDIA
The modern pharmacy retail which is currently INR 20,475 Cr. is expected to grow at a rate of 27% between FY 2021 and FY
2025 to outpace the growth of the overall segment. The Indian pharmacy retail sector has been witnessing healthy growth over
the past few years due to an increasing consumer base and rising healthcare expenditure. Growing acceptance and demand for
wellness products, in food and non-food categories is fueling the growth of modern retail, the lifestyle changes and increasing
level of indulgence by the customers is causing the shist from to Online and Omnichannel players, especially in the wake of
Covid-19 led disruptions.
The modern pharmacy retail has been registering healthy growth largely because of rising demand for OTC and prescription
drugs, wellness products and private label products.
Pharmacy retail market in India (FY 2021)
Source: Technopak Analysis
8.5%2.8%
88.7%
Total Pharmacy Retail
Pharmacy Chains E-Pharmacies Traditional Retail

138
Retail across the categories have aligned with the changing trends and increasing acceptance of digital infrastructure and re tail
opportunities. Similarly, digital enablement is one such technological advancement in pharmacy retail in India. It is improving
consumer convenience and access benefiting chronic elderly patients living in nuclear families, and patients unable to visit
physical store and seeking convenience for their pharma and wellness needs. The online penetration has come a long way in
the past years and expected to further gain a significant share in the overall pharma retail
Opportunities
Pharmacy retail is largely dominated by traditional retail. The penetration of organized is the only relatively low as compared
to other categories. Large opportunity size in the form of traditional retail, entry and growth of new e -pharmacies and physical
store chains players backed by private equity funds and conglomerates such as Tata and Reliance bodes well for a steady growt h
of organized play in this retail segment.
Challenges
• Policy Uncertainties: Similar to other categories, there are policy uncertainties around ecommerce related to
pharmacy retail. Ecommerce policy in retail is in a flux and is expected to stabilize going forward. Till such time that
it stabilizes, it will also impact pharmacy retail as it will to other sectors like food & grocery retail, apparel retail etc .
• Low Entry Barriers & High Competitive Intensity: Since entry barriers are still low in this industry, competition
from traditional retail will continue to remain strong similar to food and grocery retail. Modern Pharmacies will have
to continue to drive efficiencies and more product differentiation to grow.
Transition towards modern retail is expected to be a gradual process and not a disruptive affair. Entry barriers continues
to remain low and the market structure is equally poised to support both traditional and modern pharmacy retail. Co -
existing space has emerged in the food and grocery retail and both are growing in a complementary fashion. Same
trajectory is expected to unfold in the retail space as well.
• Structural Challenge for e-Pharmacy: Ticket value for pharmacy retail is low per transaction. Therefore, the
challenge for modern retail is to be extremely efficient in its processes to manage its costs effectively. Any deviation
makes the model vulnerable to leakages. Thus, it becomes imperative for players to introduce technology at a faster
pace, continuously improve their offer that can allow customer stickiness and increase the ticket value. The ability
to provide cost effective and express delivery will be a key success factor in future. Cost of delivery remain similar
irrespective of the order size which is relatively low in case of pharmacy reta il.
Online Orders Pharma Retailing
Food &
Grocery Retailing
Jewelry Retailing Apparel Retailing Footwear retailing
Typical online order Value
(INR) 950-1050 800-1,200 5,000-20,000 1,200-1,500 800-1,500
• Fulfilment challenges for e-Pharmacy
Delivery time taken by pharmacies has been a major challenge for the growth of e -pharmacies, only few companies are
able to service customers within 2-4 hours of ordering, in key geographies. E-pharmacies have faced headwinds in
providing same day deliver, limiting their sales to chronic medicines. The delivery time for Tier 2 and Tier 3 cities are eve n
higher leading to frequent returns due to delay in servicing the order.
NEW ENTRANTS IN E-PHARMACY LANDSCAPE ON ACCOUNT OF INCREASED DEMAND DURING COVID-
19 PANDEMIC
Covid-19 induced lockdown disrupted the pharmacy retail space leading to consolidation in Indian E -pharmacy space, the
disruption also provided opportunity for existing B&M retailers and e-commerce players to enter in e-pharmacy retail, new
entrants in E-pharmacy during the recent years are:
Apollo 24/7: During Covid-19 pandemic, Apollo pharmacies launched Apollo 24/7 in which they started online doctor
consultations. They also started doorstep delivery of medicines and doorstep lab tests while maintaining the safety precautions
prioritizing the safety of the customer. The app Apollo 24/7 offers a full suite digital healthcare integrated to track a com plete
medical health and wellness journey, provide virtual consultations and help keep health records diagnostics, consultation and
treatment services.
Wellness Forever: Wellness Forever launched their online ordering platform for home delivery of medicines. The company
introduced a separate category of Covid essentials named Covid Kit where customers could purchase masks, sanitizer and other
immunity booster products.

139
Amazon Pharmacy: E-commerce giant Amazon launched Amazon Pharmacy marking its entry into the online medicine,
medical devices and wellness products amid the COVID-19 pandemic. The company is running its pilot project in Bengaluru
allowing customers to order prescription-based medication, in addition to over-the-counter medicines, basic health devices and
Ayurveda medication from certified sellers
M&A AND PRIVATE EQUITY TRANSACTION IN MODERN PHARMACY RETAIL IN INDIA
Indian e-pharmacy space has seen consolidation in past 2-3 years, covid-19 induced lockdowns further increased the pace of
consolidation, retail majors entered in pharmacy retail through acquisition, while other players are entering in mergers and JV
to retain market leadership as they faced challenges raising capital.
Pharmeasy inorganically growing online pharma space:
In July 2021, PharmEasy has acquired diagnostic cha in Thyrocare Technologies for $612 million. aiming to provide
information, consult, test and treatment to its customers.
PharmEasy is the largest player in in e-pharmacy sector. In May 2021, PharmEasy has acquired Medlife forming a consolidated
entity having a 60-70% of e-pharma market share, Medlife's retail partners were onboarded on PharmEasy continuing their
journey with the brand
In May 2019, Medlife acquired Bengaluru-based medicine-delivery startup Myra to gain access to express delivery segment of
the company and expand its service
In Jan 2019, Medlife has acquired Medlabz, a digital healthcare platform and ‘diagnostics at home’ provider to help the compa ny
to make a stronger push into the diagnostics segment
Tata acquires stake in 1MG establishing app-based retail chain: In June 2021, Tata Group has signed a definitive agreement
to buy nearly 65% stake in the e-pharmacy startup 1mg. 1mg is focusing to bring express delivery of medicines to consumers
Tata is building a super app under Tata Digital, planning to bring all consumer products and services including food, grocery,
consumer durables, jewelry, financial services on one platform and leverage the strength of existing businesses and its group
companies
Reliance Retail acquires stake in Netmeds: In August 2020, Reliance Retail acquired 60 per cent stake in Vitalic Health Pvt.
Ltd the holding company Netmeds, for a cash investment of INR 620 Crores.
Reliance retail is entering the pharmacy retail and integrate it with its JIOMart operations to consolidating its presence in Indian
retail and provide superior Omni-channel experience to consumers across retail categories.
MedPlus: In February 2021, Warburg Pincus and PremjiInvest made an investment in healthcare services company MedPlus.
The company raised INR 1000 Mn in the deal to help its expansion in online and offline retail of Pharmacy products, the
company is one of the largest omnichannel retailer of pharmacy products.
Wellness Forever: In November 2020, Wellness Forever raised investm ent from Allana Group and vaccine maker Serum
Institute of India.
The company raised INR 1300 Mn to fund its expansion, open newer stores and strengthen its portfolio of profitable private
label brands, the company has entered into online-to-offline retail and stated hyperlocal delivery to expand its e-commerce and
tele-commerce businesses.
Recent Mergers and Acquisitions and Investments in Pharmacy and Healthcare
S.No. Company Investor Investment
(INR Mn) Year
Mergers and Acquisitions
1 Thyrocare Technology PharmaEasy Diagnostics 45,460 2021
2 Medlife PharmaEasy Online Pharma Retail 18,000 2021
3 1MG Tata Digital Online Pharma Retail 7,800 2021
4 Netmeds Reliance Retail Online Pharma Retail 6,200 2020
5 Myra Medlife Medical Delivery 2019
6 Medlabz Medlife Diagnostics 2019
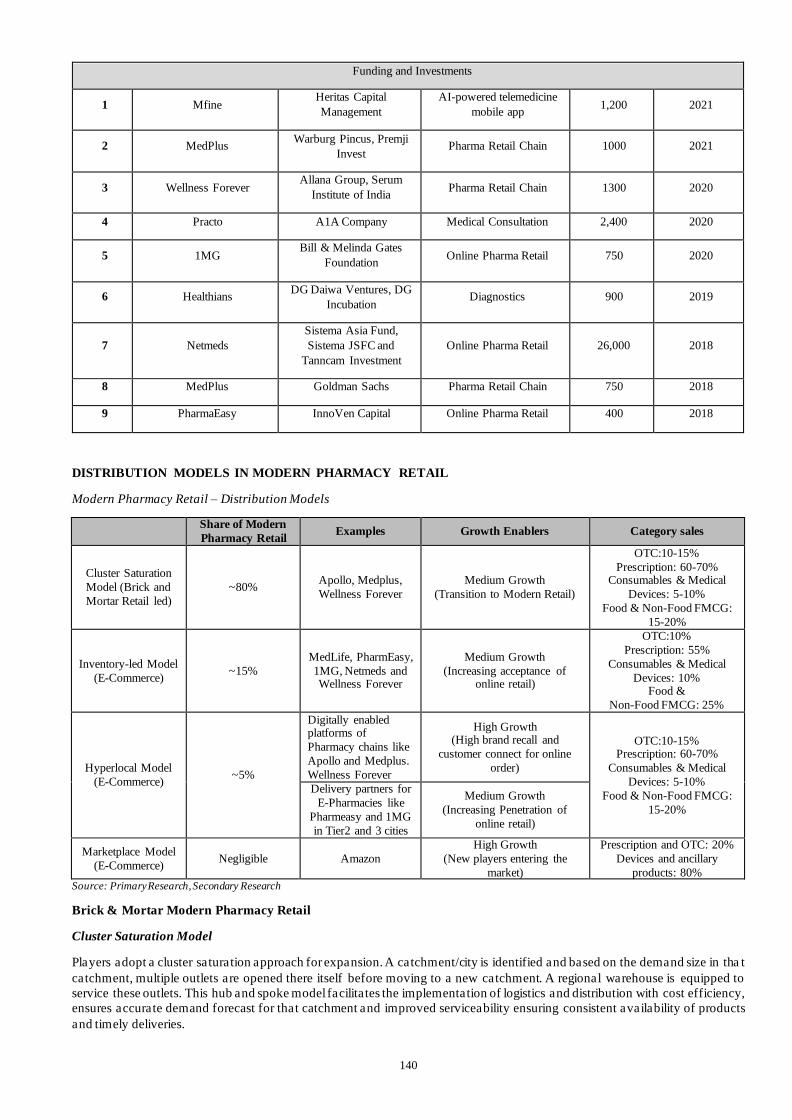
140
Funding and Investments
1 Mfine Heritas Capital
Management
AI-powered telemedicine
mobile app 1,200 2021
2 MedPlus Warburg Pincus, Premji
Invest Pharma Retail Chain 1000 2021
3 Wellness Forever Allana Group, Serum
Institute of India Pharma Retail Chain 1300 2020
4 Practo A1A Company Medical Consultation 2,400 2020
5 1MG Bill & Melinda Gates
Foundation Online Pharma Retail 750 2020
6 Healthians DG Daiwa Ventures, DG
Incubation Diagnostics 900 2019
7 Netmeds
Sistema Asia Fund,
Sistema JSFC and
Tanncam Investment
Online Pharma Retail 26,000 2018
8 MedPlus Goldman Sachs Pharma Retail Chain 750 2018
9 PharmaEasy InnoVen Capital Online Pharma Retail 400 2018
DISTRIBUTION MODELS IN MODERN PHARMACY RETAIL
Modern Pharmacy Retail – Distribution Models
Share of Modern
Pharmacy Retail Examples Growth Enablers Category sales
Cluster Saturation
Model (Brick and
Mortar Retail led)
~80% Apollo, Medplus,
Wellness Forever
Medium Growth
(Transition to Modern Retail)
OTC:10-15%
Prescription: 60-70% Consumables & Medical
Devices: 5-10%
Food & Non-Food FMCG:
15-20%
Inventory-led Model
(E-Commerce) ~15%
MedLife, PharmEasy,
1MG, Netmeds and Wellness Forever
Medium Growth
(Increasing acceptance of online retail)
OTC:10%
Prescription: 55%
Consumables & Medical
Devices: 10% Food &
Non-Food FMCG: 25%
Hyperlocal Model
(E-Commerce) ~5%
Digitally enabled platforms of
Pharmacy chains like
Apollo and Medplus.
Wellness Forever
High Growth (High brand recall and
customer connect for online
order)
OTC:10-15% Prescription: 60-70%
Consumables & Medical
Devices: 5-10%
Food & Non-Food FMCG:
15-20%
Delivery partners for
E-Pharmacies like
Pharmeasy and 1MG
in Tier2 and 3 cities
Medium Growth
(Increasing Penetration of
online retail)
Marketplace Model
(E-Commerce) Negligible Amazon
High Growth
(New players entering the
market)
Prescription and OTC: 20%
Devices and ancillary
products: 80% Source: Primary Research, Secondary Research
Brick & Mortar Modern Pharmacy Retail
Cluster Saturation Model
Players adopt a cluster saturation approach for expansion. A catchment/city is identified and based on the demand size in tha t
catchment, multiple outlets are opened there itself before moving to a new catchment. A regional warehouse is equipped to
service these outlets. This hub and spoke model facilitates the implementation of logistics and distribution with cost efficiency,
ensures accurate demand forecast for that catchment and improved serviceability ensuring consistent availability of products
and timely deliveries.
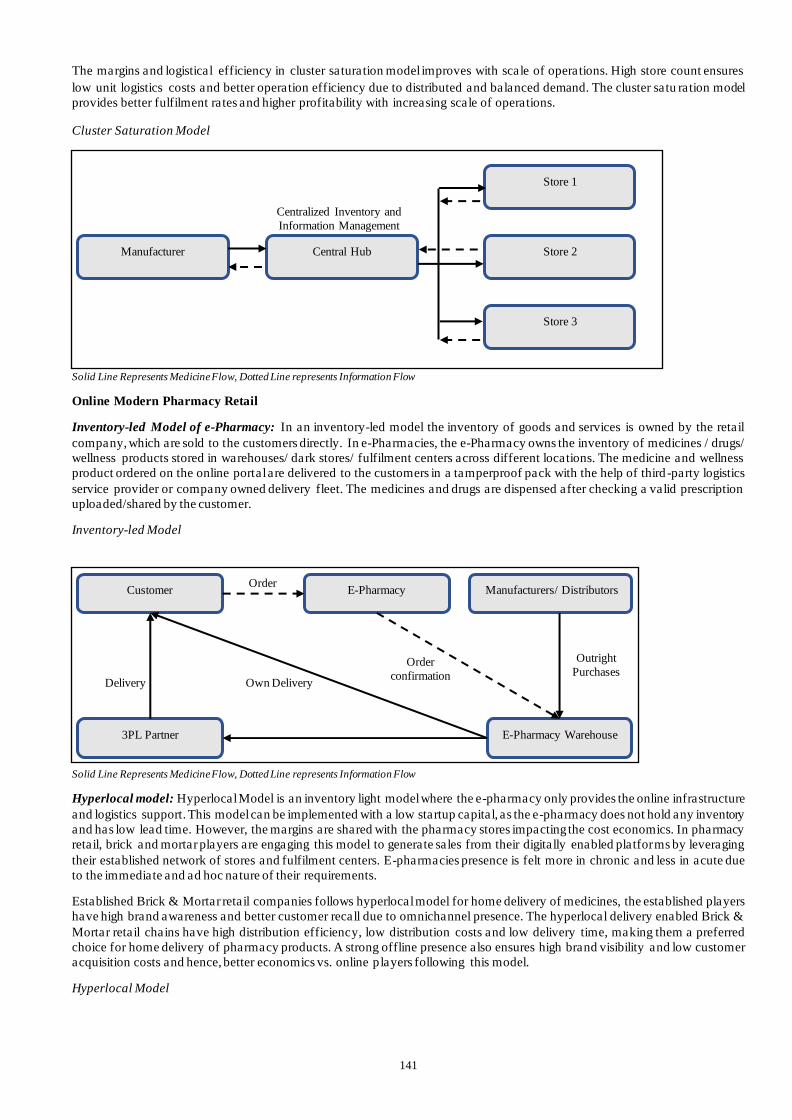
141
The margins and logistical efficiency in cluster saturation model improves with scale of operations. High store count ensures
low unit logistics costs and better operation efficiency due to distributed and balanced demand. The cluster satu ration model
provides better fulfilment rates and higher profitability with increasing scale of operations.
Cluster Saturation Model
Solid Line Represents Medicine Flow, Dotted Line represents Information Flow
Online Modern Pharmacy Retail
Inventory-led Model of e-Pharmacy: In an inventory-led model the inventory of goods and services is owned by the retail
company, which are sold to the customers directly. In e-Pharmacies, the e-Pharmacy owns the inventory of medicines / drugs/
wellness products stored in warehouses/ dark stores/ fulfilment centers across different locations. The medicine and wellness
product ordered on the online portal are delivered to the customers in a tamperproof pack with the help of third -party logistics
service provider or company owned delivery fleet. The medicines and drugs are dispensed after checking a valid prescription
uploaded/shared by the customer.
Inventory-led Model
Solid Line Represents Medicine Flow, Dotted Line represents Information Flow
Hyperlocal model: Hyperlocal Model is an inventory light model where the e-pharmacy only provides the online infrastructure
and logistics support. This model can be implemented with a low startup capital, as the e-pharmacy does not hold any inventory
and has low lead time. However, the margins are shared with the pharmacy stores impacting the cost economics. In pharmacy
retail, brick and mortar players are engaging this model to generate sales from their digitally enabled platforms by leveraging
their established network of stores and fulfilment centers. E-pharmacies presence is felt more in chronic and less in acute due
to the immediate and ad hoc nature of their requirements.
Established Brick & Mortar retail companies follows hyperlocal model for home delivery of medicines, the established players
have high brand awareness and better customer recall due to omnichannel presence. The hyperlocal delivery enabled Brick &
Mortar retail chains have high distribution efficiency, low distribution costs and low delivery time, making them a preferred
choice for home delivery of pharmacy products. A strong offline presence also ensures high brand visibility and low customer
acquisition costs and hence, better economics vs. online players following this model.
Hyperlocal Model
Customer E-Pharmacy Manufacturers/ Distributors
E-Pharmacy Warehouse 3PL Partner
Delivery Own Delivery
Outright
Purchases
Order
Order
confirmation
Manufacturer
Store 1
Store 2 Central Hub
Centralized Inventory and
Information Management
Store 3

142
Solid Line Represents Medicine Flow, Dotted Line represents Information Flow
E-Commerce Marketplace: ECommerce marketplace are tech driven platforms with a wide variety of product offering
including of products like electronics, fashion, furniture, home furnishings, and cosmetics. Marketplace players are trying to
enter in pharmacy retail but are facing regulatory challenges. However, marketplace models are very active in retailing welln ess
products.
E-Commerce Marketplace Model
Solid Line Represents Medicine Flow, Dotted Line represents Information Flow
COMPARISON OF BUSINESS MODELS WITH CHALLENGES
Cluster Saturation Model: Cluster Saturation model focuses on maximizing the store count in a particular area before
expanding in other geography. The company also sets up a warehouse to cater the distribution and supply chain for the newly
opened stores. The main challenge for Cluster Saturation Model is its asset heavy nature. The investment required in the business
model is higher than other business model. The margins are scaled based and hence the return on investment depends on the
operating efficiency of the retail business
Inventory-led Model of e-Pharmacy: In Inventory-led Model of e-Pharmacy, the e-pharmacy owns the inventory stores at
warehouses/Cold chains owned by retailers. To maintain economies of scale, the e-pharmacy has to purchase the medicine in
bulk leading to a high inventory cost compared to other business models. The company has to stock inventory and build a robust
supply chain and demand forecasting, deviation in forecasted demand and actual demands leads to excess inv entory cost and
management challenges.
Hyperlocal model: An inventory light model such as a hyperlocal model depend on the existing traditional pharma players or
pharmacy chains for various SKUs for medicines. Thus, the onus of inventory management lies o n the pharmacy. Also, the
consumer served from hyperlocal model are prone to spurious trade, where sellers supply counterfeit medicines, it might lead
to serious health complications for consumers.
E-Commerce Marketplace: E-commerce Marketplace faces a major challenge of advocacy from Tier-2 and Tier-3 cities in
India as the acceptance of new technology is low. Regulatory challenges from government are also a major challenge faced as
there is no sperate law for e-Pharmacy players in India. E-pharmacies follow the Pharmacy act which was aimed to regulate
Retail Pharmacy in India. Marketplace faces regulatory challenges in launching home delivery of medicine in absence of
regulatory laws pertaining to e-pharmacy space.
UNIT ECONOMICS OF PHARMACY PLAYERS
Pharma and wellness retail in India is largely a traditional retail dominated by Brick & Mortar retail stores, the modern retail
network is dominated by pharmacy store, situated near residential market areas, and hospital to ensure visibility.
Customer E-Pharmacy
Pharmacy Store E-pharmacy Personnel/ 3PL
Partner
Delivery
Order
Order
confirmation
Pick-up from stores
Customer E-Marketplace
Retailer Marketplace Delivery/ 3PL Partner
Delivery
E-Marketplace Managed /
Self-Managed Delivery
Order
Order
confirmation

143
Unit economics of Pharmacy chains and independent Pharmacy stores (Share Net Revenue)
Heads (Share of Net Sales) Pharmacy led Retail Chains Independent Pharmacy
COGS 78-83% 86-88%
Gross Margins 17-22% 12-14%
Employee Benefit Expense 3-5% 3-5%
Advertisement 0-1% 0-1%
Rent Expense 1-3% 1-3%
Other Store Level Expenses 1-2% 2-4%
Store Level Operating EBITDA 9-12% 3-6%
Retail Discounts (On MRP Sales)* 0-20% 0-10%
Capex for Initial Build and Opening 4-8 Lacs 1-4 Lacs
Store Size (in sq. ft.) 200-700+ 150-500+
Average sales /Day** 30,000-50,000 20,000-50,000
SKUs 4,000-10,000 2,000-6,000
Source: Primary Research, Secondary Research, Company filings, Technopak Analysis All Values based on customer price of sale
*Discounts based on MRP of products retailed from pharmacy **Based on per stores metrices for major retailers
UNIT ECONOMICS OF ONLINE DELIVERY FOR E-PHARMACIES
The Online pharmacy delivery is in a nascent stage in the country and yet to see profitable growth. High customer acquisition
cost and delivery cost which in the industry is projected to rationalize in future. A unit sale from online pharmacy provides a
contribution margin of -4-5% but has additional costs of returns and customer acquisition.
Contribution Margins on e-pharmacy order (On MRP Sales)
Source: Primary Research, Secondary Research, Technopak Analysis Contains Variable Costs, fixed costs such as corporate overheads and investments are not included
AOV – Average order value for online sales currently stands at 950-1050 (on MRP sales), Online sales in skewed towards
chronic medicine demand due to regular purchase by customer
Delivery charge – Charge levied for delivery on online order, the delivery charge levied currently ranges from 20-40 Rs per
order
Discounts – Discounts are offered by e-pharmacies to customers on MRP of the order value, these discounts are in -line with
major pharmacy retail chains and other e-pharmacy players to compete against other players
GST – Goods & Service Tax, the indirect taxes levied one sales of pharmacy products.
COGS – Cost of Goods Sold, is the cost of medicine at which the pharmacy player procures products from the manufacturing
companies

144
PG Charge – Payment Gateway cost, associated with online transaction for an order
PDS Expenses – Packaging, distribution and storage expenses (warehouse costs) associated with handling an online order by a
E-pharmacy.
Fulfilment Cost – Fulfilment and delivery cost associated with online order, the delivery cost per order is approximately INR
85-115, the average deliver time for Metro cities is 18-36 hours, while the same for Tier 1 and Tier 2 cities is 48-72 hours, also
includes margins shared with retailer partner in hyperlocal delivery model.
Returns – Cost incurred for return orders, current returns stand at 15-20% of the orders are returned, incurring a cost of INR
180 in the return logistics, payment reprocessing and fulfilment cost. The main reasons for returns are delay in delivery , wrong
product etc.
Marketing Cost –Includes the marketing and online promotion costs to acquire customers. Marketing cost is apportioned over
the repeat purchases made by the customer.
UNIT ECONOMICS OF ONLINE DELIVERY FOR OFFLINE CHAINS
The Online pharmacy delivery is an early entrant in the country and is been aided by the presence of physical retail stores. The
margin stands at 8-9%.
Contribution Margins on online pharmacy order (On MRP Sales)
Source: Primary Research, Secondary Research, Technopak Analysis
Contains Variable Costs, fixed costs and investments are not included
AOV – Average order value for online sales currently stands at 950-1050 (on MRP sales), Online sales in skewed towards
chronic medicine demand due to regular purchase by customer
Delivery charge – Charge levied for delivery on online order, the delivery charge levied currently ranges from 20 -40 Rs per
order
Discounts – Discounts are offered by pharmacies to customers on MRP to retain customers and compete against other pharmacy
retail players and formats
GST – Goods & Service Tax, the indirect taxes levied one sales of pharmacy products.
COGS – Cost of Goods Sold, is the cost of medicine at which the pharmacy player procures produ cts from the manufacturing
companies
PG Charge – Payment Gateway cost, associated with online transaction for an order
P&D Expenses – Packaging, distribution and Delivery Expense expenses associated with handling an online order and delivery
it to customer’s location. the average deliver time for such orders is 2 -4 hours, the serviceability of the order is limited by the
geographical reach of the retail chain
UNIT ECONOMICS OF OFFLINE ORDER
Brick and Mortar led retail is the well accepted by Indian customers, a unit economics of offline order represent the cost
economics for an order where the customer visits the pharmacy store to buy th e required medical supplies. A unit sale per
offline order provides a positive margin of 12-14% to the pharmacy retailer.
Contribution Margin 9%
8-9%

145
Contribution Margins on store-based retail order (On MRP Sales)
Source: Primary Research, Secondary Research, Technopak Analysis Contains Variable Costs, fixed costs and investments are not included
AOV – Average order value, varies according to store location and format and varies between 200 and 400 (on MRP sales)
Discounts – Discounts are offered by pharmacies to customers on MRP to retain customers and compete against other pharmacy
retail players and formats
GST – Goods & Service Tax, the indirect taxes levied one sales of pharmacy products.
COGS – Cost of Goods Sold, is the cost of medicine at which the pharmacy player procures products from the manufacturing
companies
Other Costs – Includes Advertisement and Promotion expenses, packaging charges, and other variable cost associated with
running a pharmacy store including logistics, electricity, packaging, inventory losses etc.
Employee Expenses – Includes Employee salaries and other staff welfare expense
Rent – The rent paid for the retail store
How Covid led to growth in the market size of modern pharmacy retail
After the covid-19 induced lockdown pharmacy players with an established network of stores are leveraging the stores using
them as hubs to service the orders received on their transactional websites established in the recent past, combining the strengths
of the offline healthcare retail infrastructure with their digital offerings. Omni-channel makes it imperative for retailers to have
a centralized data management in order to synchronize existing channels. Medplus has developed a strong omnichannel retail
and non-store retail accounted for 7% and 9% of overall retail revenue for the company in FY 2020 and FY2021 respectively.
Similarly, non - store sales accounted for ~12% of sales for Wellness Forever in FY 2021. On the other hand, the e -pharmacy
players are also benefitting from a well-established supply-chain and leveraging it to launch their presence in the brick-and-
mortar space. Online pharmacy like Netmeds.com piloted its first brick-and-mortar store in Karnataka's Belgaum in 2019 and
plans to roll out more such stores. COVID-19 has accelerated the need for flexibility that is built on a hyperlocal framework
combining the virtues of brick a nd online mediums in switching the channels. The “brick -and-mortar” players have an edge
over “the online only” players in adopting omni-channel approach and rolling out such a framework given the fact that they
have an existing network of stores to service the local cluster, stocking of inventory at cluster level to address the demand faster
and an optimised cost structure. These advantages particularly play out strongly in Tier II/III cities where the online only players
require a longer response time.
Omnichannel Sales Contribution – Pre-COVID and Post COVID Comparison
Year of start of Omnichannel
selling
Contribution to Sales FY 2020
(Pre-COVID)
Contribution to Sales FY 2021
(Post-COVID)
Medplus 2015 7% 9%
Apollo 2019 1-2% 2-5%
Wellness Forever 2016 9.5% 11.7%
Sources: Secondary research, Primary Interviews; Include data and voice enable sales
The growing demand for natural immunity-boosting products during the COVID-19 has accelerated the growth of the
nutraceuticals industry during this period. High growth was registered during FY 2021 in the sales of vitamins & minerals
especially with vitamin C & D that help in boosting immunity.
Contribution Margin 12-14% Apportioned to per order based
on overall store sales

146
e-pharmacy sector saw ~2.5x growth in households in the COVID-19 lockdown period, reaching to ~8.8 Mn households during
the lockdown. Affordable & convenient service provided by e-pharmacy platforms lead to increase acceptance among the
consumers. Almost 70% customer onboarded on the e-pharmacy platforms during the covid -19 lockdowns are expected to
stick to e-pharmacy platforms in the post-COVID-19 world, because of the remarkable experience with the platforms.
While players like Medplus and Apollo Pharmacy’s omnichannel sales is through digital/ecommerce, a large share of
omnichannel sales for Wellness Forever is through voice enabled medium. E-commerce sales for Wellness Forever represented
only 0.49% and 1.67% of their total revenue in FY 2020 and FY 2021 respectively which is lower than other modern chains in
the industry.
Brick Led Modern Retail in combination with Hyperlocal Model is becoming dominant and creating an Omnichannel
Umbrella in Pharmacy Segment
B&M stores adopting the hyperlocal model and operating an omnichannel retail platform are emerging as important players in
the pharmacy retail market. This is primarily due to the multichannel approach to sales through a combination of B&M chain
outlets with digital hyperlocal enablement that focus on providing seamless customer experience whether the client is shoppin g
online from an internet enabled device, tele calling or visiting a physical (B&M) store. This allows a faster delivery of products
to customers as compared to centralised distribution centre. The target delivery time through the omnichannel platform can be
as low as 2-6 hours vis a vis 12-48 hours through centralised distribution model undertaken by online only player
The benefits of operating an omnichannel retail approach are the ability to deliver a consistent brand experience, irrespective
of the channel used, to meet the customer demand and builds a relationship that transcend channels. Typically, part of the
customer stickiness to a store format is because of the importance of the customer’s immediate need of pharma products unlike
other categories which is managed more efficiently by the hyperlocal model than digital only model. Also, physical presence
creates the brand connect and build trust with customers which coupled with efficient delivery and convenience helps build th e
brand around trust and quality.
Omnichannel delivery model
Solid Line Represents Medicine Flow, Dotted Line represents Information Flow
Further, omnichannel retail platform assists in optimizing the business through channel diversification and comprehensive
integration of data and systems across the channels to have a seamless experience, allowing for higher customer retention and
higher wallet share. Omnichannel retail is enabled by strong focus and integration of supply chain, logistics, warehousing,
technology and inventory across the channels. It enables marketing to be more efficient - with offers relative to a specific
consumer based on purchase pattern, social network affinities, web site visits, and loyalty programs.
Functional Building Blocks of an Omni-Channel Retailing:
Single View of Product: Single definition of products for backend processes and also a common Content Management System
across channels. Retailers need to invest in technologies like QR codes, store kiosks and mobile apps to provide a consistent
digital experience.
Enterprise Inventory Visibility: A single pool of inventory allows customers to check availability, find alterna te locations of
availability, place orders and pick up items from a location of their choice
In-store Mobility: Mobile applications of the retailers should provide social engagement, competitive pricing information,
product reviews and recommendations to customers. They can also provide features like ‘Click to Chat’ or ‘Click to Call’ which
will allow customers to get additional support and expedite buying decisions
Rich data analytics and Personalized Engagement: Retailers would need to have a common CRM system which provides a
unified view of the customers, irrespective of the channel of engagement and Capture data effectively. There should also be a
common loyalty program which should be applicable for transactions made across channels.
Customer Online portal
Pharmacy Store / Distribution Hub Delivery fleet / 3PL
Delivery
Order
Order
confirmation
Pick-up

147
Seamless Channel Commerce: The core purpose of Omni-Channel experience is to provide customers with seamless
commerce across channels. This means customers can start a transaction from any channel and take it forward to completion
from any other channel of interaction.
COMPETITIVE LANDSCAPE
KEY MODERN PHARMACY RETAIL CHAINS IN INDIA
Apollo Pharmacies: Apollo Pharmacies is the pharmacy retail arm of Apollo Hospitals and is the largest pharmacy retailer in
India in terms of revenue from operations and no of stores, with geographical presence in over 21 states & 4 Union Territorie s
across India in ~400 cities with 4118 stores, and a strong focus on South India. The average size of Apollo pharmacy stores is
~500 sq. ft. Apollo has developed an extensive distribution network catering to its retail stores, following an asset light m odel
depending on data analytics, the company has also launched omnichannel retail with its platform Apollo 24/7. The company
has a strong focus on private labels. Apollo pharmacy has a procurement advantage being the largest pharmacy chain in India.
MedPlus: MedPlus is a value pharmacy retailer in India, on back of strong technology, enabling demand forecasting,
procurement and logistics, analytics, real time sales monitoring across channels and store opening. High inventory turnover a nd
fulfilment rates helps the company to provide high discounts ranging from up to 20% across all products. The discounts provided
by MedPlus is one of the highest in both offline and online pharmacy retail. The company has also developed a strong
omnichannel retail which offers same-day delivery, non-store retail accounted for ~9% and ~7% of overall retail revenue for
the company in FY 2020 and FY 2021 respectively. The company has a strong focus on private labels, which contributes
~10.4% share in overall retail in FY 2021 (including trade generics). Medplus is the second largest pharmacy retail chain in
India in terms of revenue from operations for the financial year 2021 and number of stores as of March 31, 2021. The company
has maintained a strong focus on scaling up their store network, having grown from operating their 48 stores in Hyderabad at
the conception of their business to operating India’s second largest pharmacy retail network. The company has over 2000
pharmacy stores with geographical presence in 193 cities across India as of March 31, 20 21. The 2000+ stores are distributed
across Tamil Nadu, Andhra Pradesh, Telangana, Karnataka, Odisha, West Bengal and Maharashtra. Medplus is the largest
pharmacy retailer in Andhra Pradesh and West Bengal, and in key cities of Hyderabad, Bangalore and Che nnai. The average
size of Medplus stores is ~600 sq. ft., these stores are serviced by 18 distribution hubs owned by the company, the company
focuses on maintaining stock and avoiding wastage in theft, damage or pilferage. MedPlus sources its products dire ctly from
reputed manufacturers or their authorized representatives ensuring fresh medicines and quality medicines to its customers. Th e
company has also developed its cold chain logistics for temperature sensitive drugs, vaccines and diagnostics services. MedPlus
also offers 2-hours delivery and same-day delivery. FlexiRewards, a loyalty program enables customers to accrue points for
purchases across various MedPlus businesses, translating into high discounts.
The company’s pharmacy retail network comprises physical stores located across Tamil Nadu, Andhra Pradesh, Telangana,
Karnataka, Odisha, West Bengal and Maharashtra, and an online channel through its website and mobile application. Medplus
has been focusing on growing their business across key cities like Chennai, Hyderabad, Bangalore and Kolkata. Based on
revenue from operations, they had a market share of 30% in Chennai, 29% in Bangalore, 30% in Hyderabad and 22% in Kolkata
of the total organized pharmacy retail market in these cities in FY 2021. In terms of number of stores as of March 31, 2021,
Medplus ranked 1st in Chennai and Bangalore, and 2nd in Hyderabad and Kolkata. In FY 2021, Medplus had an aggregate
share of approximately 8% of the INR 24,000 Cr. pharmacy retail market for the i 4 keys cities comprising of Hyderabad,
Bangalore, Chennai and Kolkata. Medplus achieved INR 276 Cr of revenue from online sales which accounts for ~5% of the
total online pharmacy market in India.
Most outlets are in the vicinity of neighborhoods, MedPlus also offers same day as well as 2 hour delivery on order through its
online channel. The company also provides FlexiRewards, a loyalty program that enables customers to accrue points for
purchases across various MedPlus businesses, translating into high discounts.
MedPlus branches into various sub-brands in pharma space including MedPlus Pharmacy, MedPlusMart, MedPlusLab,
MedPlus Lens and RiteCure. The combined offerings include prescription and OTC medicines, lab testing services, optical
frames and lenses, medical, pharmaceutical and surgical supplies, and FMCG and nutrition products. MedPlus has raised capital
from prominent investments firms such as Lavender Rose (belonging to the Warburg Pincus group), TVS Capital Funds, Mount
Kellet Capital Management and PremjiInvest.
Wellness Forever: Founded in 2008, Wellness forever is a Mumbai based pharmacy retail chain operating in Maharashtra,
Goa and Karnataka. ‘Wellness Forever’ brand is a trusted and recognizable wellness brand in Western India . The brand is
positioned as a premium, aspirational wellness brand offering customers high quality, genuine products through our omni-
channel and hyper-local presence. Wellness Forever is an experiential pharmacy retail chain which focuses on customer
convenience. The company operates its stores 24x7 and focuses on health and wellness FMCG products in their overall
portfolio.
The company generates a strong 40% revenue share from non-medicine products. The company also retails premium wellness
products. Sales of premium wellness products (products featuring higher gross margins than 30%) represented 10.70%, 12.20%
and 16.32%, respectively, of the company’s revenue from operations for the FY 2019, FY 2020 and FY 2021. Their target
customer demographics include primarily India’s middle income and upper-middle income customers, who exhibit higher per-
sale ticket costs and have shown a growing demand for higher-quality, premium wellness products.

148
The company also offers a hyperlocal, omni-channel retail experience that goes beyond the traditional drugstore model of
simply purchasing medicines and key necessities. The stores provide a relatively quicker base for fulfilling omni-channel orders
as compared to a centralized distribution center. The company has also developed a strong omnichannel retail which offers 2-
6 hours delivery. Non store sales accounted for 11-12% of overall retail revenue for the company in FY2021.
Wellness forever is the third largest pharmacy retail chain in India in terms of revenue from operations and no of stores with a
leading position in Western India in terms of total revenues. Wellness forever has 221 company operated stores and 2 Franchised
stores as on 31 March 2021. The average size of ‘Wellness Forever’ store is ~900 square feet of retail floor space with the
largest retail store featuring 2,300 square feet of retail floor space against the average of 250 -500 square feet store in the modern
retail pharmacy segment. The stores are serviced by 4 distribution centers, a 100000 square feet central warehouse in Bhiwandi
and one dark store/fulfilment center catering to the omni channel business. Wellness Forever follows a hub and spoke model.
Wellness Forever has raised around $21 Million till date from 3 funding rounds with prominent investors, Serum Institute,
Singapore Angel network, Amit Patni, Rajiv Dadlani and Adar Poonawala. They currently operate in retail pharmacies, hospital
pharmacy, Wellness Stores and e-retail giving them an omnichannel presence.
Thulasi Pharmacy: Thulasi Pharmacy is a regional Pharmacy retail chain in South India with 69 branches in 27 cities. The
company has stores across Tamil Nadu and presence in Bangalore and Palakkad. The company has a history of 20 years of
operations. It is the first pharmacy retail chain to introduce private label prescription at subsidised prices, they are also the first
player to introduce patient counselling.
Thulasi’s focus on spacious air-conditioned interiors for their stores which are ~1000 sq.ft. in size. Thulasi’s stores are situated
far from hospitals and are located near communities which is more accessible for consumers, they offer affordable proprietary
label products, free delivery, patient counselling, and in-house pharmacists in stores, along with other initiatives like blood and
eye donor club, health checkups. Thulasi Pharmacy is the first Retail Pharmacy store maintaining a temperature of 25°C, an
ideal temperature for storing medicines.
Thulasi pharmacy has partnered with StayHappi pharmacy to offer StayHappi generic medicines at t heir retail outlets.
Emami Frank Ross: Established in 1906, Frank Ross is one of the oldest pharmaceutical chain in East India, acquired by the
Emami Group in 1993. Emami Frank Ross has 191 stores with an average size~300 sq. ft. in and around Kolkata and Howrah,
making it the largest pharmaceutical chain in the region. Emami Frank Ross is also present in the online channel, giving them
an omnichannel presence where customers can upload their prescription and have their medicines delivered to their doorstep
within 24 hrs.
Emami Frank Ross also offers an extended product range with a huge selection of medical devices, personal care products,
baby care products, health food and drinks, sexual wellness products, ayurvedic, herbal and natural products. To furth er
penetrate in the Retail Pharmaceutical sector, Emami Frank Ross also operates through franchisee model for stores in Siliguri,
Bangalore and other regions. Emami Frank Ross helps the franchisee in licensing, staff training, the supply of products, IT
infrastructure, and provide marketing and promotion.
Zeno Health: Previously known as Generico (Rebranded in December 2020), Zeno Health was established in 2017 in Mumbai.
The company has focuses on affordable and accessible in India, Zeno health are current ly the fastest growing retail pharmacy
chain in India with 89 stores in Mumbai Metropolitan Region. The company has a reach to 10,00,000 customers.
Zeno Health focuses on generic medicines, providing cost effective healthcare to its customers. The company operates a 30,000
sq. ft. warehouse in Mumbai, stocking more than 30,000 generic and branded SKUs sourced directly from pharmaceutical
companies. Zeno healthcare was provided cost effective generic medicines during coronavirus induced lockdowns on back of
strong procurement and sourcing capabilities
Till date, Zeno Health has raised $15.4 M in 3 funding rounds from investors like Alteria Capital, Tomorrow Capital and
Whiteboard Capital.
Medkart: Medkart is Ahmedabad based retail pharmacy chain, founded in 2014, focused on retailing generic medicines. These
generic medicines are available at a subsidized rate and Medkart claims that these medicines reduce the medicine bills by about
60%-70%. Currently the company is present in 22 cities, with 74 stores across India, with an average size~250-300 sq. ft. The
company has a reach to 3,00,000 customers and a customer retention rate of 85%
Medkart is an omnichannel medical store and provides services like order placement, availability enquiry on its mobile app.
Medkart also operates on a franchise model and currently ~50% of Medkart stores are franchised. Medkart then helps in
marketing & promotion, supply chain and staff training for the franchisee on back of strong supply chain management, cost
effective procurement and data analytics.
Store mix across regions for retail chains (March 2021)

149
Source: Primary Research, Secondary Research, Company filings, Company websites and Technopak Analysis Numbers in bracket represents total number of stores in India as per latest numbers on 31st March 2021. Regional mix based on stores given on company’s website
Focus cities for different pharmacy chains in India
Player Focus Cities
Apollo Pharmacy Hyderabad, Bangalore, Chennai, Kolkata, Vizag, Ahmedabad, Delhi - NCR, Mumbai - MMR
MedPlus Hyderabad, Bangalore, Chennai, Kolkata, Bhubaneshwar, Vijayawada, Cuttack, Nagpur, Mysore
Wellness Forever Mumbai – MMR, Nasik, Pune, Goa
Zeno Health Mumbai – MMR
Emami Frank Ross Kolkata
Medkart Ahmedabad, Vadodara
Thulasi Pharmacy Coimbatore, Chennai, Tiruchirappalli
Source: Primary Research, Secondary Research, Company filings, Technopak Analysis
Revenue
In FY 2021, Apollo Pharmacy accounted for the highest and MedPlus accounted for the second-highest revenue from operations
amongst major pharmacy retailers in India. For FY 2021, Apollo Pharmacy and Medplus’s total revenue from operations
represented approximately 27% and 15% share of the organized pharmacy retail market in India.
Revenue of Key Pharmacy Chains in India (INR Crores)
Player FY 2019 FY 2020 FY 2021 CAGR (2019-
2021)
Apollo Pharmacy 3886 4821 5610# 20.2%
MedPlus 2283 2871 3069 16.2%
Wellness Forever 684 868 937 17.04%
Emami Frank Ross 405 447 NA 10.4%*
Thulasi Pharmacy 125 139 NA 11.5%*
Source: Primary Research, Secondary Research, Company filings, Technopak Analysis * CAGR for Emami Frank Ross and Thulasi Pharmacy computed for FY 2019 to FY 2020 period as FY 2021 data was not available
Note: 1 crore = 10 million
# Revenue for Apollo Pharmacy for FY2021 reported on like-for-like basis to its FY 2020 revenue without taking into consideration the restructuring that the
company undertook in September 2020
Store Count
Indian pharmacy players have been in expa nsion phase in past 3 years, the expansion being led by ability of modern retail
players to ensure availability of quality medicines to customer, higher convenience and brand recall among customers and
control on back of technological integration.
The pharmacy players have focused on company managed stores in the expansionary phase due to high store level profitability,
established management practices, and ever-increasing demand for pharmacy and wellness products. Some Players have also
opted for franchisee stores. however, they are limited to Tier 2 and Tier3 cities with low demand, franchisee store forms a share
of 4%-5% of total store for the pharmacy chains.
5%
11%
85%
12%
14%
95%
100%
93%
8%
9%
100%
15%
7%
80%
67%
Thulasi
Medkart
Zeno
Emami FrankRoss
Wellness Forever
MedPlus
Apollo
North East West South
4118
223
2081
191
89
74
68

150
As of March 31, 2021, MedPlus had 2,081 stores across India, and was the second largest pharma cy retailer after Apollo
Pharmacy.
Store Count of Key Pharmacy Chains in India
Player
Store count as of March
31, 2018
Store count as of March 31,
2019
Store count as of March 31,
2020
Store count as of March 31,
2021
CAGR (March 31,
2019 to March
31, 2021)
Net Store Additions (from
March 31, 2019 to
March 31, 2021)
Apollo Pharmacy 3021 3428 3766 4118 9.6% 690
MedPlus 1488 1653 1775 2081 12.2% 428
Wellness Forever 107 144 176 222 26.7% 83
Source: Primary Research, Secondary Research, Company filings, Technopak Analysis Store count based on as on 31 March of the Financial Year
While average revenue per store in the domestic pharmacy retail industry in FY 2021 was estimated INR 0.23 Cr., players
like Wellness Forever and Medplus achieved the average revenue per store of INR 4.52 Cr and INR 1.59 Cr. respectively.
Average Revenue Per Store (INR Crores) (Basis Total revenue of Retail Chain and average Stores Present)
Player FY 2019 FY 2020 FY 2021
Apollo Pharmacy 1.21 1.34 1.42#
MedPlus 1.45 1.67 1.59
Wellness Forever 5.02 5.42 4.70
Source: Primary Research, Secondary Research, Company filings, Technopak Analysis Computed as revenue for the financial year divided by average store count for the financial year (Average store count for the year = Store count at the
beginning of the period + Store count at the end of period)/2) Note: 1 crore = 10 million # Average revenue per store for Apollo Pharmacy for FY2021 reported on like-for-like basis to its FY 2020 average revenue per store without taking into consideration the restructuring that the company undertook in September 2020
Average Operating EBITDA Per Store (INR Lakhs)
Player FY 2019 FY 2020 FY 2021
Apollo Pharmacy 6.26 8.04 9.11#
MedPlus 4.18 5.78 9.08
Wellness Forever 39.19 61.2 42.21
Source: Primary Research, Secondary Research, Company filings, Technopak Analysis Note: Average Operating EBITDA per store computed as Operating EBITDA for the financial year divided by average store count for the financial year (Average store count for the year = Store count at the beginning of the year + Store count at the end of year)/2)
Note: 10 lakhs = 1 million # Average Operating EBITDA per store for Apollo Pharmacy for FY2021 reported on like-for-like basis to its FY 2020 average Operating EBITDA per store without taking into consideration the restructuring that the company undertook in September 2020.
Established pharmacy chains have high brand recall and customer connect. This has provided pharmacy retail an opportunity
to introduce private label products in OTC drugs, medical devices and wellness product. Value driven pharmacy chains have
focused on private labels in OTC drugs and medical devices to aid margin while o ther premium chains retail premium label
products in wellness categories apart from OTC and prescription drugs and devices. The premium label products are either
private labels or international brands exploring direct distribution in India, thus providing higher margins to the retailers.
Share of Private Label in Total Revenue
Player FY 2019 FY 2020 FY 2021
Apollo Pharmacy ~6% ~8% ~10%
MedPlus# 4.5% 5.7% 10.4%
Wellness Forever ~1.03% ~2.28% ~1.77%
Source: Primary Research, Secondary Research, Company filings, Technopak Analysis Wellness Forever Private Label Launched in 2018, # includes trade generics
Operating EBIDTA and Operating EBIDTA Margins for Key Pharmacy Chains in India
Player FY 2019 FY 2020 FY 2021 CAGR
(2019-2021)
Apollo Pharmacy 202 289 359# 33.3%
Margin 5.20% 6.00% 6.40%
MedPlus 66 99 175 63.2%
Margin 2.89% 3.45% 5.70%
Wellness Forever 30 95 83 19.7%*
Margin 3.43% 10.16% 9.05%

151
Emami Frank Ross 40 46 NA 15.7%*
Margin 9.86% 10.34% NA
Thulasi Pharmacy 3 4.7 NA 56.7%*
Margin 2.40% 3.37% NA
Source: Primary Research, Secondary Research, Company filings, Technopak Analysis Note 1: Operating EBITDA for Wellness Forever, Emami Frank Ross and Thulasi Pharmacy are computed from company filings as pro fit after tax plus tax
expenses, depreciation and amortization expense, and finance costs minus interest income is excluded. Operating EBITDA for Apollo Pharmacy is as per the EBITDA Pre Ind As 116 as reported by the company in its quarterly filings. Operating EBITDA for Medplus is calculated as EBITDA plus Employees stock option compensation expenses and Net loss on fair value changes, minus interest income and Rental expenses. Rental expenses represent actual rental expenses
incurred by the Company in the respective years without giving effect of Ind AS 116. Upon adoption of IND AS 116 by the Company rental expenses under other expenses are now recognized as finance costs amounting to ₹ 465.34, ₹ 402.24, ₹ 338.76 for the financial year ended 31 March 2021, 2020 and 2019 respectively and depreciation and amortization expenses amounting to ₹ 708.47, Rs 589.34, Rs 446.33 for the financial year ended 31 March 2021, 2020 and 2019 respectively. Operating EBITDA Margin is the percentage of Operating EBITDA divided by revenue from operations. We believe Operating EBITDA
and Operating EBITDA Margin are better measures of the operating performance of pharmacy retail businesses given the large retail footprint involving rental expenses. 2020 Operating EBITDA without taking into consideration the restructuring that the company undertook in September 2020. Note 2: 1 crore = 10 million #Apollo Pharmacy Operating EBITDA numbers are reported on a like-for-like basis to its FY 2020 Operating EBITDA without taking into consideration the
restructuring that the company undertook in September 2020. Further, Apollo Pharmacy Operating EBITDA numbers don’ t include operating costs related to their Digital Offering called ‘24/7’
Gross Profit and Gross Profit Margins for pharmacy chains in India
Player FY 2019 FY 2020 FY 2021 CAGR
(2019-2021)
Apollo Pharmacy NA NA NA -
Margin - - -
MedPlus 441 540 645 20.92%
Margin 19.32% 18.70% 21.01%
Wellness Forever 196 249 266 -
Margin 22.60% 26.53% 28.89%
Emami Frank Ross 128 123 NA -
Margin 31.80% 27.49% -
Thulasi Pharmacy 22 25 NA -
Margin 17.73% 17.85% -
Source: Primary Research, Secondary Research, Company filings, Technopak Analysis
Revenue per retail square feet for pharmacy chains in India (INR)
Player FY 2016 FY 2018 FY 2020 FY 2021
Apollo Pharmacy* 24-27,000 20-23,000 24-27,000 26-29,000
MedPlus 29,752 31,449 31,527 27,983
Wellness Forever 68,381 59,445 64,565 57,291
Source: Estimations, Primary Research, Secondary Research, Company filings, Technopak Analysis * Apollo Pharmacy Sales - based on average store size of 500 Sq Ft.
Same Store Sales Growth
Player FY 2016 FY 2018 FY 2020 FY 2021
Apollo Pharmacy NA NA 13% NA
MedPlus 21.4% 9.8% 21.8% 0.1%
Wellness Forever 4.2% 4.2% 7.7% -4.6%
Source: Primary Research, Secondary Research, Company filings, Technopak Analysis
Established pharmacy chains have high brand recall and customer connect. This has provided pharmacy retail an opportunity
to introduce private label products in OTC drugs, medical devices and wellness product. Value driven pharmacy chains have
focused on private labels in OTC drugs and medical devices to aid margin while other premium chains retail premium label
products in wellness categories apart from OTC and prescription drugs and devices. The premium label products are either
private labels or international brands exploring direct distribution in India, thus providing higher margins to the retailers.
Share of Retail Sales (FY 2021)

152
Non-Pharma Includes offerings in FMCG, personal care and Surgical products
Source: Primary Research, Secondary Research, Company Website
Pharmacy retail provides unique opportunity for the players to enter in pharma and healthcare services like diagnostics and
medical consultation on back of strong connects with the customers and increasing focus on diagnostics and preventive
healthcare care. Healthcare today has moved beyond curative healthcare to preventive healthcare and nutrition. Modern
pharmacy retail has benefited from this shift. Large players like Apollo Hospitals offers a basket of services including hosp itals,
clinics, diagnosis and pharmacies. MedPlus has also forayed in testing services. Currently services accounts for less than 1%
of the revenue for the company, which is steadily growing.
A curated product basket boosts growth and profitability for pharmacy retail chains
Player
Apollo Pharmacy Apollo Hospitals launched 24/7 omnichannel platform for various healthcare and diagnostics services, the
platform also integrates Apollo pharmacy to ensure doorstep delivery of medicines in 2-3 Hours to customers
MedPlus
Medplus operates a medicine delivery platform through MedPlus Mart website, it accounts for 13% of the total
sales of the company.
MedPlus Stocks 50,300+ SKUs in its stores and provides 40,900+ SKUs through online delivery channel
Wellness Forever
Wellness Forever focuses on customer convenience and operates an omnichannel retail format, which allows ordering through tele calling and its website
Tele-calling accounts for 10.3% and online accounts for 1.3% of the overall sales of the company.
Wellness Forever Stocks 145000+ SKUs in its stores, average 19,000 per store and provides 60,000+ SKUs
through online delivery.
Source: Primary Research, Secondary Research, Company filings, Technopak Analysis
46%
18%
10%
54%
82%
90%
Wellness Forever
MedPlus
Apollo Pharmacy
Non - Pharma OTC and Prescription Drugs

153
OUR BUSINESS
Some of the information in this section, including information with respect to our business plans and strategies, contain
forward-looking statements that reflect the current view of our management and involve risks and uncertainties. Investors
should read “Forward-Looking Statements” on page 24 for a discussion of the risks and uncertainties related to those
statements and also “Risk Factors”, “Restated Consolidated Financial Information” and “Management’s Discussion and
Analysis of Financial Condition and Results of Operations” beginning on pages 26, 204 and 294, respectively, for a discussion
of important factors that may affect our business, financial condition or results from operations. Our actual results may dif fer
materially from those expressed in or implied by these forward-looking statements.
Our Company’s financial year commences on April 1 and ends on March 31 of the immediately subsequent year, and references
to a particular fiscal year are to the 12 months ended March 31 of that particular year. Unless otherwise indicated or the
context otherwise requires, the financial information included herein is based on or derived from our Restated Financial
Statements included in this Draft Red Herring Prospectus. For further information, see “Restated Consolidated Financial
Information” beginning on page 204. Additionally, please refer to “Definitions and Abbreviations” on page 2 for certain terms
used in this section.
Unless the context otherwise requires, in this section, references to “our Company” or “the Company”, refers to Wellness
Forever Medicare Limited and references to “we”, “us”, “our”, refers to Wellness Forever Medicare Limited on a
consolidated basis.
Unless otherwise indicated, industry and market data used in this section has been derived f rom the report titled “Industry
Report on Pharmacy Retail in India” dated September 28, 2021 prepared and issued by Technopak Advisors Pvt. Ltd. (the
“Technopak Report”) commissioned by and paid for by us in connection with the Offer. Unless otherwise indi cated, all
financial, operational, industry and other related information derived from the Technopak Report and included herein with
respect to any particular year refers to such information for the relevant fiscal. For more information, see “Risk Factors – This
Draft Red Herring Prospectus contains information from industry reports from certain agencies commissioned by us including
Technopak.” on page 44. Also see, “Certain Conventions, Presentation of Financial, Industry and Market Data and Currency
of Presentation – Industry and Market Data” on page 21.
Overview
We are India’s third largest retail pharmacy and wellness network by number of stores, with a leading position in Western Ind ia
in terms of total revenues, according to Technopak We operate a large omni-channel, hyperlocal retail network under our
“Wellness Forever” brand, serving as a one-stop solution for our customers’ wellness needs with most of our stores operating
24x7. We opened our first drugstore in 2008, and we have expanded our retail fo otprint to a total 236 stores in 23 cities across
the Indian states of Maharashtra, Karnataka and Goa serving a registered customer base of 6.7 million customers as of June 30 ,
2021. As a testament of our success, Technopak estimates that we generated the highest revenue per retail square foot in the
Indian pharmaceutical retail industry for fiscal years 2020 and 2021.
We focus on providing our customers with a retail experience that goes beyond simply purchasing medicines and key
necessities. We offer a wide assortment of merchandise comprising approximately 91,500 pharmaceutical and wellness
products, and each of our stores features an average of approximately 13,000 products per store, including fast -moving
consumer goods (“FMCG”), fast-moving health goods (“FMHG”), nutraceuticals and medical equipment, among other
products, alongside over-the-counter and prescription medicines. For the fiscal years 2019, 2020 and 2021, our revenues derived
from the sale of non-pharmaceutical products was Rs 2,407.18 million, Rs 3,122.44 million and Rs 4,087.62 million,
constituting 36.78%, 37.91% and 45.72%, of our total revenues respectively, which is significantly higher than our main
competitors in fiscal year 2021, according to Technopak.
In addition to the vast breadth and depth of our inventory, we also differentiate our brand by our selection of premium wellness
products, which we offer through various third-party industry labels as well as our private label brands. Sales of premium
wellness products (which we define as products featuring gross margins higher than 30%), was Rs 684.92 million, Rs 1,005.42
million and Rs 1,458.63 million, respectively representing 10.47%, 12.21% and 16.32%, respectively, of our revenue from
operations for the fiscal years ended March 31, 2019, 2020 and 2021.
Our stores deliver a distinctive shopping environment and ambience for our customers. Our stores are strategically located,
most are open 24-hours a day and are on an average considerably larger in size than those of our main comp etitors, according
to Technopak. Most of our stores are designed in a differentiated, self -browsing format and feature qualified pharmacists
available at all times. We believe these features promote an aspirational element and help to position ourselves as a premium
wellness brand.
Our brick-and-mortar store network is complemented by our omni-channel, hyperlocal digital retail platforms, including our
website, easy-to-use mobile app and toll-free call center. We utilize our brick-and-mortar stores as a relatively quicker base for
fulfilling omni-channel orders as compared to a centralized distribution center, which allows us to target delivery of products
to our customers within two to six hours from when the order is placed. This provides our customers with the convenience of
seamlessly shopping through our omni-channel platforms around the clock and from the convenience of their homes. It also

154
allows us to generate synergies between our brick-and-mortar stores and our omni-channel platforms and helps to market our
brands across various retail channels.
Our business is technology-focused and supported by our IT-enabled distribution, fulfilment and other logistics capabilities. In
2014, we developed and commissioned what we refer to as our “Zero Error Dist ribution Center” (“ZEDC”), which is our
principal, distribution center with an area spanning over 100,000 square feet. Moreover, o ur core information technology
systems are fully integrated, modern and sophisticated, which allows us to handle large volumes of merchandise and provides
efficient supply chain management that meets the complexities of our business. Our inventory management system uses
statistical systems and calculations to decide when to purchase and replenish inventory at our distribution cen ter, fulfilment
center and each of our stores.
Our retail network encompasses both our owned stores as well as our franchise network. We initiated expansion through the
franchise model in fiscal year 2020, and we had a total of three franchise stores as of June 30, 2021. Our franchise network
enables us to leverage the strength of our brand and accelerate our brand’s exposure to new customers at a lower cost of capi tal.
In addition, we believe that building out a broad franchise network can significantly en hance our fulfilment capabilities under
our omni-channel retail strategy, with each new store serving as an additional fulfillment center for omni-channel orders.
We have added 116 new stores to our network during the past three fiscal years. Our total rev enue from operations increased
from Rs. 6,769.80 million in fiscal year 2019 to Rs. 9,240.21 million in fiscal year 2021 at a CAGR (calculated as the mean
annual growth rate of an investment over a specified period of time longer than one year) of 16.83% a nd our EBITDA
(calculated as aggregate of restated profit/(loss) after tax, tax expense, finance cost , depreciation and amortisation) increased
from Rs. 734.14 million in fiscal year 2019 to Rs. 814.92 million in fiscal year 2021 at a CAGR (calculated as the mean annual
growth rate of an investment over a specified period of time longer than one year) of 5.36%. Similarly, our sales margins (which
we define as revenue from operations less purchases of stock-in-trade and changes in inventories of stock-in-trade divided by
revenue from operations) have been at 28.49% for fiscal year 2019 to 27.23% for fiscal year 2021.
We seek to become India 's most respected chain of pharmacies and wellness stores. According to Technopak, the Indian
pharmacy retail space offers attractive opportunities for significant growth based on its India’s favorable demographic trends
(such as increasing life expectancy), growing levels of disposable income, increased levels of digitization, greater prevalence
of chronic diseases, higher access to healthcare coverage and increased overall demand for pharmaceuticals and wellness
products. For more information, see “Industry Overview” on page 105. We believe we are well positioned to leverage our
competitive strengths and technological innovations to solidify our leadership in our existing markets, capitalize on India’s
growing digital health ecosystem and become a health and wellbeing partner of choice for our customers as we expand our
operations.
The table below sets forth certain key performance metrics for the periods presented:
As of / For the year ended
March 31, 2019 March 31, 2020 March 31, 2021
Number of stores
Of which:
Owned stores.................................... 130 160 203
Franchisee stores .............................. 0 2 2
In-hospital pharmacies...................... 14 14 17
Total......................................................... 144 176 222
Net stores opened(1)
Of which:
Owned stores.................................... 28 30 43
Franchisee stores .............................. 0 2 0
Hospital pharmacies ......................... 1 0 3
Total ........................................................ 29 32 46

155
Total employees ...................................... 3,129 2,975 3,640
Of which:
Pharmacists....................................... 720 532 670
Average pharmacists per store(2) ......... 4.9 2.9 2.6
Total retail space (sq. ft.) ...................... 117,277 141,230 182,415
Sales margin(3) ....................................... 28.49% 28.50% 27.23%
EBITDA(4) .............................................. 734.14 909.43 814.92
Inventory days(5) ................................... 73 69 76
Revenue per sq. ft. (in Rs.)(6) ................ 65,387 64,565 57,291
Average revenue per store(7) ................ 50,272,255 51,821,564 46,389,817
Average Store Level Profitability ( per
store)(8) ................................................... 3,919,465 3,798,433 2,789,713
(1) We calculate net stores opened as the total number of store closings during a period, net of the number of store openings during that same
period.
(2) We calculate average pharmacists per store as total pharmacists divided by the number of stores at the end of the period.
(3) We calculate sales margin as revenue from operations less purchases of stock-in-trade and changes in inventories of stock-in-trade divided
by revenue from operations .
(4) We calculate EBITDA as aggregate of restated profit/(loss) after tax, tax expense, finance cost, depreciation and amortisation.
(5) We calculate inventory days as the average inventory balances during the period divided by cost of revenue (which is purchases less
changes in inventory) and multiplied by the number of days in the period.
(6) We calculate revenue per square foot as total revenues for a given period divided by our average total retail space during the year over
that period at the end of that period.
(7) We calculate average revenue per store as the sales from own stores (which includes online sales) during a given year for all stores
operating divided by the average months of in operation.
(8) We calculate average store level profitability as the total income less purchases of stock-in-trade, changes of stock-in-trade, employee
benefit expense and other expenses (including rent) store during a given year for all stores operating divided by the average number of
stores in operation.
Our Competitive Strengths
We believe our competitive advantages include the following strengths:
Unique retail platform within India’s fast-growing pharmaceutical retail sector
We offer a hyperlocal, omni-channel retail experience that goes beyond the traditional drugstore model of simply purchasing
medicines and key necessities. We provide our customers with a wide selection of both pharmaceutical and wellness products
comprising approximately 91,500 items in inventory, with each of our stores featuring an average of approximately 13,000
items per store, including FMCG, FMHG, nutraceuticals and medical equipment, among other products, alongside over-the-
counter and prescription medicines. Our inventory of wellness products is tailored to meet the needs of customers across varied
age groups, which helps to drive customer spends and same-store sales growth.
We have a strong focus on non-pharmaceutical sales, premium wellness products with higher margins. Sales of non -
pharmaceutical products represented 36.78%, 37.91% and 45.72%, respectively, of our revenue from operations, for the fiscal
years ended March 31, 2019, 2020 and 2021, which is significantly higher than our main competitors in fiscal year 2021,
according to Technopak. Our target customer demographics include primarily India’s middle income and upper-middle income
customers, who exhibit higher per-sale ticket costs and have shown a growing demand for higher-quality, premium wellness
products. Sales of premium wellness products (which we define as products featuring gross margins higher than 30%)
represented 10.47%, 12.21% and 16.32%, respectively, of our revenue from operations for the fiscal years ended March 31,
2019, 2020 and 2021.

156
Our stores are strategically located, combining good visibility with consistent, attractive storefronts that are easily recognizable
by our customers. Most of our stores stay open 24-hours, seven days a week and features ambient air-conditioning, which we
believe help to position our brand as a distinct, premium wellness brand in Western India. Most of our stores feature a customer
friendly, self-browsing format whereby most products are visibly displayed at the customer’s reach, which we believe may help
to promote an aspirational element and encourages higher spends per customer. In addition, our stores are larger than those of
our main competitors, according to Technopak, featuring an average 840 square feet of retail space. We believe that our
differentiated, self-browsing format strengthens our premium positioning relative to our primary competitors and enhances our
customers’ overall shopping experience. Our value proposition is further strengthened by our well-trained and qualified team
members, offering a service-oriented experience for our customers. In particular, all our stores feature qualified pharmacists,
most of which are available 24x7, enabling us to offer qualified recommendations to customers and enhancing our ability to
cross-sell additional products.
Demonstrated track record of retail footprint expansion
Having opened our first drugstore in 2008, we have a proven track record of undergoing significant expansion while delivering
shareholder value. We have grown our store network from 144 stores as of March 31, 2019 to 236 stores as of June 30, 2021,
at a CAGR of 24.54% over that period. Over the same period, our total retail space increased from 117,277 square feet for the
fiscal year 2019 to 141,230 square feet for the fiscal year 2020 and 182,415 square feet for the fiscal year 2021 at a CAGR of
24.72% over that period.
We have also generated strong cash flows from operations which have allowed us to fund our expansion primarily through
internally generated cash flows from operating activities. Our net cash generated from operational activities were Rs. 470.20
million for the fiscal year ended March 31, 2019 and Rs. 491.47 million and Rs. 282.06 million for the fiscal years ended March
31, 2020 and 2021, respectively. This has also allowed us to maintain our debt levels relatively under control even in the wa ke
of our rapid store expansion over the last three years.
Our total revenue from operations increased from Rs. 6,769.80 million in fiscal year 2019 to Rs. 9,240.21 million in fiscal year
2021 at a CAGR of 16.83% and our EBITDA (calculated as aggregate of restated profit/(loss) after tax, tax expense, finance
cost, depreciation and amortisation) increased from Rs. 734.14 million in fiscal year 2019 to Rs. 814.92 million in fiscal year
2021 at a CAGR (calculated as the mean annual growth rate of an investment over a specified period of time longer than one
year) of 5.36%. Similarly, our sales margins (which we define as revenue from operations less purchases of stock-in-trade and
changes in inventories of stock-in-trade divided by revenue from operations) have been at 28.49% for fiscal year 2019 to 27.23%
for fiscal year 2021.
Similarly, our same-store sales growth has been 7.81% in fiscal year 2019, 7.75% in fiscal year 2020 and negative 4.60% in
fiscal year 2021; our average ticket size, which we define as average revenue per store divided by the average number of bills
per store was Rs. 286.5 in fiscal year 2020 and Rs. 333 in fiscal year 2021; and our sales margin (which we define as revenue
from operations less purchases of stock-in-trade and changes in inventories of stock-in-trade divided by revenue from
operations) have been 28.49% in fiscal year 2019 to 28.50% in fiscal year 2020 and 27.23% in fiscal year 2021.
We believe our proven track record of undergoing significant growth should enable us to continue expanding our operations.
Omni-channel, hyper-local presence increasing customer touch points
We have an omni-channel, hyper-local retail strategy that provides a seamless approach to our customers’ shopping experience,
allowing them to interact with our brand whenever and however they find most convenient. We see our omni-channel retail
platform as an extension of our brick-and-mortar stores, and we seek to maintain an extensive selection of our newest and best
merchandise assortments online, providing our customers with a complete shopping experience across retail channels. By
presenting a uniform front across all our retail channels, we are able to leverage each channel's strengths and present ou rselves
seamlessly to our customers as one cohesive and consistent brand. Each channel in which we are present represents an
opportunity for us to connect with customers and deliver a consistent and positive shopping experience.
Our simultaneous presence across online and offline channels allows us to diversify risks associated with, and generate
synergies across, each of our retail channels. All our owned stores and franchise stores are fully integrated into our omni-
channel retail platform. Rather than relying on centralized warehouses, our omni-channel, hyper-local retail strategy relies on
our brick-and-mortar stores as the centerpiece of our e-commerce strategy, serving as fulfillment centers to fulfill orders that
originate from our digital platforms. In addition, our sales associates are able to sell a product that may be unavailable locally
by selecting merchandise from our fulfillment center for shipment to the customer's door. Our stores provide a relatively quicker
base for fulfilling omni-channel orders as compared to a centralized distribution center. This allows us to target delivery of
products to our customers within two to six hours from when the order is placed, as compared to an average delivery time of
18 to 36 hours in metro cities and 48 to 72 hours in Tier 1 and Tier 2 cities in the e-pharmacy industry in India, according to
Technopak. We are also capable of fulfilling orders originating via our retail partners’ online platforms, such as Doctorvahini
and DigiScribe, for which we pay a prescribed fee to certain partners. In addition to enabling us to generate operating synergies
across our various retail channels, we believe these strategies provide an added convenience to our customers allowing them t o
shop with us from the convenience of their homes.

157
The onset of the COVID-19 pandemic has significantly increased demand for our omni-channel platforms. As a result, we have
accelerated our investments in these retail channels and made several enhancements to online and mobile application platforms
that we believe have meaningfully improved the overall customer experience and allowed us to drive growth. Within a short
span of re-launching our e-commerce platform in July 2020, we have already reached average volumes of over 2,528
transactions per day across all of our omni-channel platforms over the six months ended June 30, 2021, and we had
approximately 227,982 registered online customers as of June 30, 2021. Solely with respect to our mobile application, which
we re-launched in July 2020, we have reached average volumes of over 923 transactions per day over the six months ended
June 30, 2021.
Valuable and trusted “Wellness Forever” brand
Our brand, reputation and customer satisfaction are critical factors in developing our business. Over the years, we have built a
reputation for selling quality, trusted and genuine products by dealing strictly with reputed manufacturers and authorized
distributors. By combining these strategies with our customer-focused orientation, we have been able to build a brand in the
Indian pharmaceutical retail industry.
Today, the “Wellness Forever” brand is a trusted and recognizable wellness brand in Western India .
As a testament to the strength of our brands, we have been recognized as India’s “Most Admired Omni-Channel Retailer of the
Year” at the Indian Retail Tech Awards in 2019; earned an “Excellence in Pharmacy – Mumbai” award at the India Today
Excellence Healthcare awards in 2018; and earned a “Specialty Retail Award” by India’s Retail Champions awards in 201 9.
As of June 30, 2021, we had approximately 6.7 million registered customers. Approximately 2.5 million visited our stores
during the fiscal year ended March 31, 2021, reflecting a high degree of customer loyalty to our brand.
Growth-ready, technology-backed infrastructure platform
Our business is supported by our strong technological capabilities as well as our IT-enabled, centralized logistics, fulfillment
and distribution infrastructure.
In recent years, we have made significant investments in talent, technology, fulfillment capacity, infrastructure and marketing
in order to deliver on our ambitious future expansion plans. In 2014, we developed and commissioned our ZEDC, which is our
principal, distribution center with an area spanning over 100,000 square feet. Our ZEDC distribution center significantly
improves our ability to manage the supply, logistics, and cold chain parameters of the products we procure and sell to our
customers. The ZEDC has demonstrated a high capability of fulfilling the need s of our retail channels, having exhibited a fill
rate which we define as the percentage of orders from our distribution centers that were successfully filled of 86.81%, 86.89 %
and 79.04% for the fiscal years 2019, 2020 and 2021. In addition, the ZEDC was designed to handle significantly greater
transaction volumes across a much larger network of stores than we currently have, suggesting that our infrastructure provides
room for expanding our operations before we are required to make further capital investm ents.
Our logistics, fulfillment and distribution infrastructure is technology-focused and supported by our fully integrated IT
capabilities. We have an inventory management system that provides us with up-to-date product availability information, which
allows us to efficiently handle large volumes of merchandise amidst the complexities of our business. Moreover, our inventory
management system uses statistical systems and calculations to decide when to purchase and replenish inventory at our
distribution center, fulfilment center and each of our stores. Our inventory days have been 73 days for the fiscal year 2019 to
69 days for the fiscal year 2020 and 76 days for the fiscal year 2021. We believe that these initiatives make us well-placed to
efficiently implement our continued goals of further large-scale expansion and efficiency of service delivery.
Led by a dynamic and experienced management team
Our management team consists of skilled professionals who have been instrumental in successfully executing our business and
expansion plans efficiently and profitably. Our management team retains day -to-day operating control of our Company and
brings a strong vision and direction to the business backed by an in-depth knowledge of the business model, the market and its
customers. Our co-founders and directors, Mr. Ashraf M. Biran, Mr. Gulshan Bakhtiani and Mr. Mohan Chavan, each have
significant experience in the pharmacy and/or retail industries. Moreover, each of our Key Managerial Personnel has in-depth
knowledge of our operations and has been instrumental in executing our growth strategies while generating shareholder value.
We also continue to invest in developing talent and strengthening our management team. We made significant investments in
our management team over the last 24 months by way of hiring senior level management across various growing functions and
building our back-end teams to support our growth, and we have also strengthened several of our head office teams to support
our ambitious expansion plans.
We believe that this track record and depth of expertise, coupled with the commitment of our management team and an
entrepreneurial spirit, have been significant factors in helping us become one of the leading retail pharmacy and wellness stores
in India and will continue contributing to our future growth and success.

158
Strategies
We believe that we are uniquely positioned to capitalize on India’s growth opportunities by leveraging our competitive strengths
and pursuing the following strategies:
Continue to build and strengthen our value leadership
We intend to consolidate our position in the retail pharmaceutical and wellness products markets in the regions in which we
operate, in order to attain, and keep attaining, synergies and economies of scale, and generate a growing and consistent
profitability as more stores are added to our portfolio and existing stores mature. We seek to maximize our average same-store
sales by offering new, high-margin products, including exclusive and proprietary branded merchandise, across a broad
assortment of high-quality premium categories, increasing our brand awareness through our multi-pronged marketing strategies,
providing an authentic in-store and online experience for our core customers, and maintaining a high level of customer service.
In addition to offering a broad selection of quality pharmaceutical products and wellness products to our customers, we also
curate our products, where our pharmacists and subject matter experts in different facilities use their knowledge curate products
that create value for our customers by achieving the right mix of pharmaceutical products (both chronic and acute) and wellness
products. An essential tool in these strategies will be leveraging our portfolio of private label brands to offer new, on-trend
aspirational products to our customers. We will also focus on increasing our operational efficiency in our existing stores by
relocating or remodelling certain stores to further enhance our customers’ shopping experience.
We plan to further improve our operating efficiency and gross margins, and ensure efficient supply chain management by:
continuing to refine our store operating systems based on the performance of our stores and feedback from our customers and
local management teams. We also plan to make further investments in our IT and data management systems to improve our
productivity.
Deepen penetration in existing markets and expand presence in new territories through new stores and franchise stores.
We believe that the size and scale of our owned store operations and franchisee network has provided us, and will continue to
provide us in the future, with significant bargaining power with our suppliers and also greater distribution capacity for our
products. Our expansion strategy involves primarily strengthening our position in places where we are already present and
increasing our geographic presence by entering new, neighboring regions. Our current business plans contemplate utilizing part
of the Offer proceeds for our retail network expansion over a period from fiscal year 2022 to fiscal year 2024. For more
information, see “Objects of the Offer - Funding capital expenditure for setting up of new stores” on page 92.
We intend to expand our network by increasing the number of stores in the areas in which we currently operate and that have a
high-growth potential or unsatisfied demand. In particular, we intend to focus on the expansion of our retail footprint in
metropolitan markets where living standards and consumer purchasing power are relatively high, as well as in relatively more
affluent areas within tier II and selective tier III cities. We also plan to open new stores in cities where we currently do not
operate, targeting primarily cities within the Indian states of Maharashtra, Karnataka and Goa where we currently operate , or
other adjacent states, focusing on those cities with high growth potential, unsatisfied demand or limited competition primarily
being serviced by small, independent (often family-owned and run) stores. We expect that focusing our expansion in selected
neighboring states would reduce our execution risk and decrease our customer acquisition costs, while generating significant
benefits in terms of supply chain efficiencies due to relative proximity.
A central part of our expansion strategy will be focusing on expanding through the franchisee model, which allows us to leverage
the strength of our brand and increase our exposure to new customers at relatively lower levels of committed capital. We also
expect to open a significant number of owned stores as well, which are directly managed by our management teams who have
deep industry knowledge and will remain a critical part of our business model.
We believe that combining the economies of scale in procurement with the integration of administrative activities will provid e
us with greater operating efficiency leading to higher profit margins and will allow us to achieve synergies in connection with
the acquisition of new store chains and promote sustainable growth through greater operating efficiency . A wider geographic
footprint should also allow us to more easily expand our current line of private label products and enhances our fulfilment
capabilities under our omni-channel retail strategy, with each new store serving as an additional fulfillment center for omni-
channel orders.
Continue growing our e-commerce footprint and consolidating our omni-channel, hyperlocal model
According to Technopak, pharmacy e-commerce is expected to be one of the fastest growing segments by fiscal year 2025
among all the various retail categories, estimated to grow at a CAGR of approximately 45%.
We believe that we are in a favorable position to capitalize on attractive growth opportunities through the expansion of our
selling area and geographic footprint in emerging regions that we believe offer good growth potential, while leveraging on ou r
omni-channel business model. E-commerce sales generated from our mobile app and website collectively grew by 263% from
fiscal year 2020 to fiscal year 2021. Although we believe that a significant portion of this increase was driven by changing

159
consumer behaviors associated with the COVID-19 pandemic and resultant lockdowns imposed across India.
Even so, our e-commerce sales still represent a relatively small portion of our overall revenues, signaling significant room for
growth from this distribution cha nnel. For the fiscal years 2020 and 2021, our e-commerce sales represented only 0.49% and
1.66%, respectively, of our total revenues. In addition, as of June 30, 2021, we only had approximately 227,982 registered
online customers, as compared to approximately 6.7 million registered customers at our brick-and-mortar retail network.
Therefore, we believe we have significant room for growth by investing in our digital sales platforms and deepening their
integration with our stores.
Finally, we expect to continue to expand digital marketing efforts, customer loyalty, and build brand awareness in the
communities surrounding our existing stores to drive growth in both brick -and-mortar and e-commerce sales. In particular, we
expect to drive growth by continuing our catalog, online and mobile application marketing efforts, enhancing the efficiency and
responsiveness of our digital capabilities, and supplementing the assortment available in our brick -and-mortar stores with
additional products from our online catalog. To that end, we have already scaled-up our e-commerce sales teams and engaged
a third-party marketing agency to help drive our mobile application sales and e-commerce sales. We have transferred our e-
commerce business to one of our Subsidiaries, Wellness Forever HealthTech Limited, to streamline focus on online aspect of
our business and ensure compliances with the applicable laws.
We also intend to continue expanding and upgrading our distribution and fulfilment centers to improve the efficiency of our
inventory and supply management and decrease fulfilment times for online orders. For example, our current plans include
opening additional distribution centers and fulfilment centers so as to support the increasing scope of our operations.
Continuing to invest in, and leverage, our technology platforms across our business
We strive to significantly expand our retail footprint predominantly in the States of Maharashtra, Karnataka and Goa, and we
have invested in talent, technology, fulfillment capacity, infra structure and marketing in order to deliver on our ambitious
expansion plans. To continue fueling our growth, we plan to continue investing further in our IT systems to improve our
operating efficiencies and ensure efficient supply chain management.
Such efforts would include investments in improving productivity and improving our demand forecasting and pricing
capabilities. In particular, we plan to continue improving our systems’ predictive analytical capabilities to increase the accuracy
of our demand forecasts, customer engagement, supply chain efficiency and inventory tracking. For example, we have begun
experimenting with demand-focused artificial intelligence engagement software to further increase our predictive and analytical
capabilities to increase the accuracy of our demand forecasts. We expect that by being able to analyze several layers of customer
and sales data to analyze spending behavior, we will be better able to manage our inventory at different stores, respond to
changing demand, provide a customized selection of merchandise at each store location and improve our pricing strategies.
We believe that by improving our analytical capabilities and supply chain management we will be able to optimize in -store
availability of products, and consequently meet customer demands effectively. We have also been working with niche
consultancies in order to improve the user interface on our mobile application in order to improve overall customer satisfaction
as part of an overall upgrading of our mobile application.
Pursue growth through selective, value accretive acquisitions and joint ventures and partnership opportunities in the
broader healthcare industry
A key part of our growth strategy includes the consummation of selective, strategic acquisitions and entry into synergistic j oint
ventures, partnerships and agreements that will enable us to expand our retail footprint into regions where we do not current ly
operate and increase the exposure of our brands.
We believe there is a high potential for growth through acquisitions in this sector for large, organized players like us, giv en the
superior scale of our operations and the fragmented nature of the industry. Therefore, we may also consider selective, value
accretive strategic acquisition opportunities in order to quickly achieve our expansion strategy , such as acquiring autonomous
stores and store chains, along with their personnel, who may possess significant regional and operating expertise.
For strategic reasons, we may also seek suitable investments and business partnerships where opportunities arise, including
establishing alliances and joint ventures with potential partners that offer ancillary products or services complementary to ours.
These may include investments in, or partnerships with, key healthcare service brands that can support the proliferation and
distribution of our retail brands.
We believe that these strategies will enable us to expand our strong market position and further strengthen our brand.
Our Business Operations
We operate the largest retail pharmacy network in Western India in terms of total revenues and the third largest retail pharmacy
network in India, in terms of the number of stores, according to the Technopak Report. Technopak estimates that we generated

160
the highest revenue per retail square foot in the Indian pharmaceutical retail industry for fiscal years 2020 and 2021.
Since opening our first drugstore in 2008, we have carried out an aggressive expansion plan in terms of new store openings
having reached a total of 236 stores as of June 30, 2021. Our stores network is now present in 23 cities spread across the In dian
states of Maharashtra, Karnataka and Goa as of June 30, 2021.
The map below shows our area of activity and number of stores in our network per state as of June 30, 2021:
We carry out our business through a single operating segment, through which we generate revenue from the sales of branded
pharmaceutical products, generic pharmaceutical products, non-pharmaceutical wellness products (including personal hygiene
and beauty products, skincare, baby care, men’s grooming and convenience products). We also generate revenue from our
franchisee network, which is determined as a percentage of franchise store revenues, franchisee opening fees, and other ancillary
fees.
Our Products
Our stores feature a wide selection of carefully curated pharmaceutical and wellness products tailored to meet the needs of
customers across varied age groups. We offer a wide assortment of merchandise comprising approximately 91,500
pharmaceutical and wellness products, and each of our stores features an average of approximately 13,000 products per store.
The major categories of products that we sell at our stores include:
• Pharmaceutical products, which include both over-the-counter and prescription medicines for chronic and non-
chronic conditions.
• Fast-moving consumer goods, which include foods, baby care products, personal care products and cosmetics, among
others.
• Surgical products, which comprise medical devices like nebulizers, thermometers, pulse oxymeters and orthopedic
products like splints, brace, collars, slings, among others.
• Premium Label products, which comprise of pharmaceutical products and FMCG products which have a margin of
over 30%.
Our integrated, data enabled approach enables us to constantly monitor and optimize our products mix at each of our stores
allowing us to focus on offering more higher-margin, premium wellness products to our target customer demographics, thus
significantly improving our overall margins.
The table below sets forth the revenue split of our main product categories for the periods presented:
For the year ended
March 31, 2019 March 31, 2020 March 31, 2021
(Rs. millions) (%) (Rs. millions) (%) (Rs. millions) (%)

161
Pharmaceuticals 4,137.23 63.22% 5,113.59 62.08% 4,852.28 54.27%
FMCG 1,561.58 23.85% 1,902.38 23.10% 2,314.11 25.89%
Surgical 160.67 2.46% 214.64 2.61% 314.87 3.52%
Premium Label 684.92 10.47% 1,005.42 12.21% 1,458.63 16.32%
Our target customer demographics include primarily India’s middle income and upper-middle income customers, who exhibit
higher per-sale ticket costs and have shown a growing demand for higher-quality, premium wellness products. Sales of premium
wellness products (which we define as products featuring gross margins higher than 30%), represented 10.47%, 12.21% and
16.32%, respectively, of our revenue from operations for the fiscal years ended March 31, 2019, 2020 and 2021.
Private-Label Products
We launched our first private label brand product in 2018. Since then, our private label portfolio has increased to 107 produ cts
marketed under two main exclusive brands featuring 63 sub-brands, covering an extensive range of premium lifestyle products
focused on herbal formulations and natural ingredients, including proprietary ayurvedic medicines, organic dietary
supplements, personal care and skin care products. We have also introduced high -quality global products into the Indian market
under our private labels. Sales of our private label products have increased from Rs. 67.59 million for the fiscal year ended
March 31, 2019 to Rs. 187.48 million and Rs. 158.42 million for the fiscal years ended March 31, 2020 and 2021, respectively ,
representing a CAGR of 53.10% over that period.
Our private label portfolio focuses on meeting the aspirational demands of India’s middle income and upper-middle income
customers, which have shown a growing demand for higher-quality premium wellness products. Our private-label products
provide a significant gross margin advantage over other similar third-party industry products, primarily because they eliminate
much of manufacturers’ promotional costs and distributors’ profit margins in the traditional merchandise supply chain. Profit
margins associated with our private-label products increased from 55.44% for the fiscal year ended March 31, 2019 to 63.88%
and 66.14% for the fiscal years ended March 31, 2020 and 2021. As our private-label revenues grow across product categories,
our overall gross margin is expected to improve.
Our private-label products are developed by outsourced research and development teams and manufactured by third -party
manufacturers pursuant to our specifications and designs. We have agreements in place with various third-party manufacturers
for the production of our private-label products for sale at our stores. Accordingly, our portfolio of private-label products also
provides us with better control over quality and pricing, better control over our supply chain and more efficient inventory
management. We see our pricing strategies as an important tool in our brand management, and we carefully benchmark our
private-label products against other market offerings in order to maximize their long-term brand perception.
Going forward, we plan to increase the contribution of private labels in our pharmacy business, including by adding new health
and wellness products to the private label portfolio and entering into additional tie ups with international brands.
Our Stores
The majority of our stores are retail stores, 215 of which are owned stores and 3 are franchise stores. As of June 30, 2021, our
standalone stores network comprised 92% of our total stores. The remainder of our stores are hospital pharmacies, totaling 18
pharmacies as of June 30, 2021, all of which were owned stores.
The table below sets forth the breakdown in our stores network for the periods presented:
As of March 31, As of June 30,
Number of stores 2019 2020 2021 2021
Retail stores ........................... 144 176 222 236
Of which:
Owned stores.................. 130 160 203 215
Franchise stores.............. 0 2 2 3
Hospital pharmacies ............... 14 14 17 18
Total ...................................... 144 176 222 236

162
Tier 1...................................... 113 132 155 160
Tier 2...................................... 18 28 46 48
Tier 3...................................... 13 16 21 28
Total ...................................... 144 176 222 236
Maharashtra............................ 130 158 192 203
Karnataka................................ 8 9 15 18
Goa......................................... 6 9 15 15
Total ...................................... 144 176 222 236
The table below sets forth the breakdown of vintage wise sales at our stores and store level profitability margin for the periods
presented. We calculate store level profitability margin as the total income less purchases of stock -in-trade, changes of stock-
in-trade, employee benefit expense and other expenses (including rent)) during the year for all stores operating divided by the
total revenue for stores operating.
Opening
Year for
Stores
Revenue from stores
as on 31 March, 2019
Store
Level
Profit %
Revenue from stores
as on 31 March, 2020
Store
Level
Profit %
Revenue from stores
as on 31 March, 2021
Store
Level
Profit %
Up to 16 4,123.5 8.37% 4,333.5 7.65% 3,745.3 5.43%
FY17 996.3 6.83% 1,086.0 7.72% 1,143.5 8.77%
FY18 901.1 5.28% 1,068.2 5.98% 1,055.0 6.96%
FY19 522.9 9.56% 1,314.4 10.19% 1,499.3 10.26%
FY20 - - 433.3 -1.91% 1,079.1 3.75%
FY21 - - - - 396.3 -8.91%
Total 6,543.8 7.80% 8,235.3 7.33% 8,918.4 6.01%
Store Layout
Most of our stores are designed in a customer friendly, self -browsing format featuring ambient air conditioning and stay open
24-hours, seven days a week.
More importantly, our stores feature an average retail store size of 840 square feet of retail floor space, with our largest retail
store featuring 2,300 square feet of retail floor space which, according to Technopak, is significantly larger than the average
store size of our main competitors. The larger size of our stores enables us to arrange our reta il facing areas in a self-browsing
format, with aisles of non-pharmaceutical merchandise, such as consumer, personal care and nutritional products, on full display
and easily accessible to our browsing customers. We believe this enhances our customers’ ove rall shopping experience,
encourages a greater number of customer trips to our stores and results in higher average same-store sales.
The images below depict examples of our storefronts and self -browsing store layout:

163
Our self-browsing store format contrasts with the typical format for other Indian stores, where all pharmaceutical and non-
pharmaceutical products are located behind a sales counter out of the customer’s view, requiring the assistance of a store
assistant before the customer can complete any purchases. At our stores, only prescription medicines and related products are
sold behind the sales counter, where customers are assisted by qualified store pharmacists that are available at all times.
We see our stores as community assets, which helps to instill our customers with a sense of trust and reliability in our brand.
Each store is staffed, on average, with between two and three dedicated pharmacists, along with other highly -trained sales
assistants. Beyond simply assisting our customers with their desired medicines, our pharmacists are also trained to identify
additional needs and offer complementary products that may suit the customer’s needs. Accordingly, we believe that our
differentiated self-browsing format and availability of qualified pharmacist at all times enhances our value proposition for the
customers while increasing our ability to cross-sell our products.
Store Locations
All of our stores are strategically located in premium or nea r-premium locations with high traffic and visibility. A few of our
stores, such as our Powai and Napean Sea Road locations in Mumbai where we maximize customer exposure to our brand to
further cultivate customer loyalty and recognition. In addition, our stores combine good visibility with consistent, attractive
storefronts that are easily recognizable by our customers. We believe these features help to position our brand a distinct,
premium wellness brand in India.
We have a specialized store opening team comprised of 39 professionals as of June 30, 2021. Each store location is carefully
chosen by our specialized team that evaluates potential locations, placing particular emphasis on the local demographics and
purchasing power, competition and prospects for growth in the area. As most of our stores feature relatively standardized store
layouts, floor space and product selection, we have been able to implement a similarly standardized new store opening process
which diminishes the costs and resources capital required for new store openings. Based on our prior experience, our store
opening process usually takes approximately five months on average. As a hallmark of our success in choosing our store
locations, only 15 of our stores have been closed in the last five years.
The table below provides a breakdown of our expansion, in terms of net stores opened and total retail space, over periods
presented:
As of / For the fiscal year ended
As of / For the fiscal
year ended
March 31, 2019 March 31, 2020 March 31, 2021 June 30, 2021
Net stores
opened(1) Total
retail space
Net stores
opened(1) Total
retail space
Net stores
opened(1) Total
retail space
Net stores
opened(1) Total
retail space

164
(sq. ft.) (sq. ft.) (sq. ft.) (sq. ft.)
Maharashtra..................... 130 102,928 158 124,219 192 154,098 203 163,761
Karnataka......................... 8 9,237 9 10,330 15 16,499 18 19,664
Goa.................................. 6 5,112 9 6,681 15 11,818 15 11,818
Total ............................... 144 117,277 176 141,230 222 182,415 236 195,243
(1) We calculate net stores opened as the total number of store closings during a period, net of the number of store openings during that same
period.
In each case, prior to establishing a new store, we analyze the regional consumer market, taking into consideration potential
competition and the estimated operating costs. After the general region is selected, a specialized team analyzes relevant factors
such as type of locality (residential/commercial), doctors and hospitals, competition, pedestrian flow and the visibility of
potential new store locations. Once a specific store location is chosen, our engineers and architects design custom -made floor
plans that both utilizes the commercial space available and creates a friendly and inviting ambiance for customers, in each c ase
using our standardized layouts.
We closely monitor each newly-opened store, so that necessary adjustments can be made to better meet the demands of the
local market. For example, adjustments are made as needed to the product mix (i.e., the variety of products in each store’s
inventory). We also monitor the profitability of each existing store location, and stores with minimal growth prospects are
evaluated as potential candidates for being eventually closed. Our systems are standardized for tracking the viability of each
store in terms of its profitability and various related operating metrics, such as revenue breakdowns, margins and lease
expenditures.
The table below shows the number of stores that we have opened and closed during each of the last five years:
Fiscal year ended March 31,
Three
months
ended
June 30,
2017 2018 2019 2020 2021 2021
Number of stores (beginning of the
year)
70 94 115 144 176 222
Stores opened 25 26 31 35 50 14
Stores closed 1 5 2 3 4 0
Number of stores (end of the year) 94 115 144 176 222 236
As evidence of our accelerating store growth, we have opened 35 new stores from January 2021 to June 2021. Since June 30,
2021 (through the date of this Draft Red Herring Prospectus), we have opened 24 new retail stores and franchisee stores.
Additionally, as of June 30, 2021, we had 13 retail stores and franchisee stores under construction that we expect to open over
the next 60 days.
Hospital Stores
Part of our strategy is also to take advantage of other complementary platforms, primarily hospitals, where we can take
advantage of synergistic opportunities. As of June 30, 2021, we operated 18 hospital pharmacies, out of which 2 stores are
located near the premises of our other healthcare platform partners. We believe this provides us with access t o these hospitals’
customer base that is drawn to our convenient location within hospital premises, thus enabling us to generate higher margins
from these locations and increase the stability of our revenues.
Unlike our stores, our hospital stores are laid out in a more classic drugstore format where all pharmaceutical and non -
pharmaceutical products are located behind a sales counter.

165
We are also developing a hospital division which will be consolidating and increasing the number of hospital under operations
and will also cater to hospitals and nursing home for their inventory supplies.
Franchisee Stores
We opened our first franchise store in fiscal year 2020. As of June 30, 2021, we had three franchise stores.
Our franchisee stores operate under our sole “Wellness Forever” brand indistinguishably from our owned stores. All of our
franchisees operate on a “franchise-owned, franchisee-operated”, which provides our franchisees hands-on opportunity to
manage the daily operations of the franchise. Accordingly, unlike our owned stores, which are directly managed by our
management teams and staffed by our employees, our franchisee stores are managed by our franchisees themselves and staffed
by their respective employees.
After joining our franchisee network, a franchisee must comply with certain management policies and maintain established
standards at its physical stores. Franchisees bear all store opening costs. Once the store has been opened, f ranchisees pay us a
portion of their revenue for use of “Wellness Forever” brand and marketing expenses, along with additional fees for extra
services such as the use of our information technology network and distribution network.
Our franchise stores are fully integrated into our overall distribution network and utilize the same IT systems as our owned
stores, thus enabling them to operate as fulfilment centers for our omni-channel distribution network in the same way that our
owned stores. Both our owned stores and franchisee stores are f ully integrated into our digital retail platform, serving as
fulfillment centers to fill orders that originate online, via computers or mobile devices. As a result, for online sale of ou r
products, our store clerks are able to sell products that may be una vailable at the local store by selecting merchandise from our
other stores or online fulfillment centers for shipment to the customer.
We expect that the significant expansion we have planned for our franchisee stores will increase the number of customer
interactions with our brand in a greater number of geographical locations and also increase our media exposure, further
enhancing the value of our brand. In addition, we also expect to benefit from increased economies of scale across our network ,
primarily in connection with the use of IT systems and employee training. We also expect that a larger network will increase
our bargaining power relative to our suppliers, allowing us to obtain our merchandise at better pricing terms.
Our franchisee network also sells all of the merchandise we carry at our stores. However, franchisees are not necessarily required
to procure that merchandise directly from us. In particular, our franchise stores carry our private label products, which exhibits
a significant gross margin advantage for us over other third-party branded products. Expansion of our private-label products is
a key strategy for our business, and we believe that by expanding the number of retail touchpoints for our private -label products
through additional franchisee stores will be key in strengthening the brand and increasing customer loyalty.
We are also looking to expand our franchisee network by creating a micro franchisee network where we plan to onboard
individuals as part of our sales team and penetrate into other geographies including rural India. Individuals can place their orders
through our App and the products will be delivered the following day. We plan to leverage our existing App platform and our
stores as fulfillment centers.
Omni-Channel Retail and Distribution
Our brick-and-mortar store network is complemented by our omni-channel, hyperlocal digital retail platforms, including our
website, easy-to-use mobile app and toll-free call center. This provides our customers with the convenience of sea mlessly
shopping at our stores or through our digital platforms around the clock.
Our omni-channel concept refers to combining in-store, online, mobile and social media channels as used by our customers.
We recognize the growing shift in our economy to a d igital and cashless society, which continues to change our customers’
buying habits. Customers expect convenience and speed in their transactions and service. We have therefore invested in
establishing our omni-channel retail platform, whereby customers ca n choose to purchase either through our main channel of
offline stores, or via online platforms including “www.wellnessforever.com” and the Wellness Forever application on mobile
platforms, or through our sales representatives via our call center.
We see our online retail channel as an integral part of our holistic, omni-channel online and offline platform. Our store clerks
are able to sell a product that may be unavailable locally by selecting merchandise from our online fulfillment centers for
shipment to the customer's door. We also have a back-end call center that we call our “Command Center”, which is dedicated
to verifying doctors’ prescriptions in connection with sales originating from our telesales and mobile application.
Within a short span of relaunching our e-commerce platform, we have already reached average volumes of over 2,528
transactions per day across all of our omni-channel platforms over the six months ended June 30, 2021, and we had
approximately 227,982 registered online customers as of June 30, 2021. Online sales accounted for 0.49% and 1.66% of our
total revenue for the fiscal years ended March 31, 2020 and 2021, respectively. As of June 30, 2021, our customers can purcha se
more than 42,000 different items across all our product categories through our app and website.

166
The image below sets forth a representation of the design of our e-commerce website:
Solely with respect to our mobile application, which we re-launched in July 2020, we have reached average volumes of over
923 transactions per day over the six months ended June 30, 2021. As of June 30, 2021, we had 13 employees dedicated
exclusively to our mobile application.
Rather than relying on centralized warehouses, our omni-channel, hyper-local retail strategy relies on our brick-and-mortar
stores as the centerpiece of our e-commerce strategy, serving as fulfillment centers to fill orders that originate from our digital
platforms. Our stores provide a relatively quicker base for fulfilling omni-channel orders as compared to a centralized
distribution center, which allows us to target delivery of products to our customers within two to six hours from when the order
is placed as compared to an average delivery time of 18 to 36 hours in metro cities and 48 to 72 hours in Tier 1 a nd Tier 2 cities
in the e-pharmacy industry in India, according to Technopak. We are also capable of fulfilling orders originated via our retail
partners’ online platforms, such as Doctorvahini and DigiScribe, for which we pay a prescribed fee to certain p latforms. We
believe these strategies stimulate higher customer spends, drive additional traffic to our stores and increase sales opportun ities
with customers who come to our stores to pick up their online orders.
The COVID-19 pandemic led to a very significant growth in demand for online shopping. Our omni-channel, non-store sales
accounted for 10.06% and 10.56% of our total revenue for the fiscal years ended March 31, 2020 and 2021, respectively. In
response, we expended significant resources to expand the capacity and efficiency of our omni-channel infrastructure. As a
result, we have introduced more flexible delivery and pick-up options, introduced new payment mechanisms, expanded our
online catalogue and updated our order management information technology to optimize our fulfillment capacity. Our sales,
logistics and communications platforms and are now fully integrated, which allows us to retrieve information of the content
accessed by each customer and its transactions history.
Logistics and Technology
We currently operate one distribution center and one fulfillment center featuring a modern, IT-enabled infrastructure enabling
us to create a high performance distribution operation. We use vehicles from third party logistics providers for delivering
inventory across all our stores in the three states of Maharashtra, Karnataka and Goa.

167
These automated facilities use equipment, such as high speed sorters, automated picking and storage material handling
equipment and automation management systems. Our distribution center and fulfillment center allow high volume and accurate
order fulfilment, productivity metrics and real time enterprise integration for our high-volume procurement operations. The
engineering, process flow and technology for our distribution center and fulfillment center have been designed to achieve high
productivity standards.
We developed and commissioned our ZEDC in 2014, which is our principal distribution center with an area spanning over
100,000 square feet where we manage the supply, logistics, and cold chain parameters of the products we procure and sell to
our customers.
The images below depict our ZEDC:
Most of our suppliers deliver merchandise directly to our ZEDC, which in turn services our stores using third party logistics
services. We also get supplies from certain suppliers directly to our stores. We hire a small fleet of trucks to deliver products to
our stores and we replenish merchandise for each of our store on a periodic basis. Stores located in close proximity to our
distribution center are replenished by the ZEDC on a daily basis, while other stores are replenish ed by the ZEDC on a twice-
weekly basis.
We continuously invest to improve, especially through the use of technology, our supply , distribution and fulfilment chains.
We have made significant investments to develop an IT-enabled supply, distribution and fulfilment platform that is modern and
sophisticated, with capacity to support our future growth. For example, our supply chain and logistics platforms currently handle
an average of approximately Rs. 550 million dispatched orders per month. In addition, the ZEDC was designed to handle
significantly greater transaction volumes across a much larger network of stores than we currently have, suggesting that our
infrastructure provides room for expanding our operations before we are required to make further capital investments. We
believe this gives us the operating leverage to support the expansion of our business.
Inventory Management
We carefully manage our inventory in order to maintain sufficient inventories available to operate our business and meet
customer expectations, while minimizing overstock at our stores and fulfillment center, which increases our inventory costs.
We own most of our inventory. As a result, we maintain strict controls to efficiently determine our inventory needs based mostly
on actual sales and to a lesser extent on projected demand. We manage our inventory on a comprehensive basis across our entire
network of stores, which we believe enables us maximize the scale of our operations and allocate our resources more efficiently .
Our systems also allow us to manage inventory in real time and provide a customized selection of merchandise at each of our
store locations. Each of our stores is equipped with computer terminals that are connected with our inventory management
systems, and each product we sell at our stores is coded with a unique bar-coded item number for its identification in the store
point-of-sale system. Once the item is sold and the bar code is scanned by the cashier, the information is updated in our system
in real time. This enables us to quickly collect sales information, track and analyze inventory levels and sales trends, and helps
us to optimize our merchandise levels and product mix. Our system also tracks the expiration dates of our merchandise and
informs our team whenever the expiration dates are approaching, also notifying us in case such products have expired so that
they may be separated and discarded.
In addition, we use statistical systems and calculations to decide when to purchase and replenish invento ry at our fulfillment
center and each of our stores. In line with this strategy, our current systems have the technology to manage our inventory and
supply chain. Our systems are working towards building predictive analytical capabilities to increase the a ccuracy of our
demand forecasts, thus enabling us to better respond to changing demands for healthcare and wellness products. In addition,
maintaining a strong relationship with our suppliers has enabled us, and we believe will continue to enable us, to sa tisfy demand
in case of any out-of-stock products.
Our inventory days have been 73 days for the fiscal year 2019, 69 days for the fiscal year 2020 and 76 days for the fiscal year
2021. We have also collected a large database of our customers’ buying behavior, which we hope to capitalize on by developing
demand-focused artificial intelligence software to further increase our predictive and analytical capabilities.

168
Marketing
We market ourselves as a one stop, self-browsing wellness destination for our customers’ wellness-related needs. Our brand is
positioned as a premium, aspirational wellness brand offering customers high quality, genuine products through our omni-
channel and hyper-local presence.
A few of our stores, such as our Powai and Nepean Sea Road locations in Mumbai, are considered to be our premium stores,
where we maximize customer exposure to our brand to further cultivate customer loyalty and recognition. In addition, our stores
combine good visibility with consistent, attractive storefronts that are easily recognizable by our customers. Most of our st ores
feature air conditioning, highly trained, uniformed staff and the support of qualified pharmacists. We believe these features help
to position our brand a distinct, premium wellness brand in India.
We promote our brands and our products through a variety of mediums, ranging from television and in -store demonstrations to
our company websites and social media platforms with a view to connect with consumers from all age groups. We see our
employees as one of our biggest marketing assets, and we offer our sales staff commission -based incentives to drive our in-
store sales in accordance with our incentive compensation plan. In addition, our marketing department develops specific
marketing campaigns and promotions to stimulate sales at our stores and to strengthen our brand.
We have a large database of information on our registered customers, and we are currently working towards developing our
capabilities to carry out targeted promotional campaigns and strategies based on the primary consumer market in the areas
where our stores are located. We are also working toward developing our own loyalty rewards program, with the expectation
of launching it within fiscal year 2022.
Our “Wellness Forever” brand is a highly recognized and trusted brand in Western India.
As a testament to the strength of our brands, we have earned an “Excellence in Pharmacy – Mumbai” award at the India Today
Excellence Healthcare awards in 2018; and earned a “Specialty Retail Award” by India’s Retail Champions awards in 2019.
Both our brand recognition and consumer trust allow us to cultivate customer loyalty, generate increased traffic at our stores
and sell higher amounts of exclusive private-label products, which generally increases our profit margins.
Competition
The market for retail pharmacies and wellness stores in India is intensely competitive, rapidly evolving and highly fragmented,
having exhibited increasing pressure on profit margins in recent years. We compete on the basis of price, location, quality o f
products, product lines, physical amenities, service, product variety and store conditions. Our main competitors in the physical
stores space include MedPlus and Apollo Pharmacy, among others. We also face competition from various other competitors,
including independent pharmacies, telephone order prescription providers, supermarkets, convenience stores and other retailers
operating in the e-commerce space.
The retail sector in which we operate is growing and consolidating, and some of our competitors have strong competitive
positions and access to significant financial resources. Some of these competitors may have substantially greater logistics
capacities and more financial resources, as well as more industry-relevant experience, than us.
The online pharmacy business is still an emerging concept in India. In recent years, we have witnessed an increase in
competition from online retailers who have been able to offer many of the same products we sell at competitive prices. In the
online retail space, we face competition primarily from Pharmeasy, 1mg and Netmeds, among others. Due to various factors,
including efficient logistics management and strategic tie ups, online retailers are not only able to offer more discounts, b ut also
a wide range of products. In addition, some of these online retailers may be supported by major store chains. In order to compete
effectively, we have invested, and are continuing to invest, significant resources in developing our IT platforms and omni-
channel distribution system, including our online-to-offline integration.
Suppliers
Through our procurement policy, we aim to establish business partnerships and maintain adequate levels of inventory turnover
in order to achieve high levels of service and margins consistent with our targets and projected profitability. We generally place
orders with suppliers based on recent sales trends, future estimates of short -term sales and expected inventory levels.

169
For the fiscal year ended March 31, 2021 and the three months ended June 30, 2021, we purchased our products from
approximately 3,255 suppliers (excluding private-label products) from within India as well as internationally. Our largest
supplier accounted for approximately 9.86% of our total purchases for the fiscal year ended March 31, 2021. Our top-ten
suppliers collectively accounted for approximately 32.26% of our total purchases for the fiscal year ended March 31, 2021.
We use a centralized purchasing system to record the purchases for most of the products which we sell across our owned stores;
our stores also locally purchase certain products which are locally available. We believe that this increases the scale of our
purchases and maximizes our bargaining power relative to our suppliers. We believe that the terms of our supplier arrangements
tend to be at least as favorable as those generally available to the industry.
In our past experience, whenever one of our suppliers does not have certain products available, we are usually able to procure
such products from other alternative suppliers at reasonable terms. Other than during peak periods during the first and the
second waves of the COVID-19 pandemic in India, we have not experienced any difficulty in obtaining the types or quantities
of products we require on a timely manner during the past three fiscal years.
Our Customers
We specialize in retail sales of merchandise to the general public. As of June 30, 2021, we had 6.7 million registered custom ers,
and an average 73,500 customers are served at all of our stores each day during the financial year ended March 31, 2021. As a
result, we have no main customers that concentrate a significant percentage of our consolidated sales and we do not rely on a
particular product that represents more than 10% of our total sales.
Our wellness business primarily targets middle income and upper-middle income customers, which are fast-growing customer
segments India. These customer segments exhibit higher per-sale ticket costs than less affluent segments, and have shown a
growing demand for higher-quality premium wellness products.
We believe that customer service in is a key factor in establishing a loyal and growing clientele , and we are focused on offering
superior customer service at our stores as well as online. In 2018, we commissioned our centralized customer care service
infrastructure, which has been essential in promoting consistent and quality customer service and providing faster, more
accurate resolution in real time to our customers.
Employees
As of June 30, 2021, we had 4,691 full-time employees. The table below sets forth a breakdown of our full-time employees by
function as of the dates indicated:
As of March 31, As of June 30,
Function 2019 % 2020 % 2021 % 2021 %
Corporate / Headquarters ............ 225 7% 265 8% 350 8% 410 8%
IT / technology staff ............... 24 1% 24 1% 41 1% 46 1%
Stores (including pharmacists) .... 2,642 82% 2,490 84% 3,003 81% 3,917 83%
Store Pharmacists ................... 720 22% 482 16% 656 18% 1,007 21%
Store Assistants & Managers . 1,922 60% 2,008 68% 2,347 63% 2,934 62%
Distribution Centers .................... 285 9% 183 6% 244 7% 253 5%
Call Center ................................... 20 1% 37 1% 43 1% 87 2%
Total............................................... 3,129 100% 2,975 100% 3,640 100% 4691 100%
All of our employees are located in India. Outsourced personnel and personnel at our franchisee network are not considered ou r
employees.
We believe that we have satisfactory working relationships with our employees and have not experienced any significant labor
disputes or work stoppages.
We strongly emphasize the quality of our employees at all levels, including in -store pharmacists and store staff who directly
interact with our customers. Through our learning and development initiative, we provide training for newly recruited
employees in the first months of their employment. We have also established an online training platform, which is robust and
cost effective. The training is designed to encompass a number of areas, such as knowledge of our products and effective
customer service. In addition, we regularly carry out training programs on medicinal information, nutritional information, and
selling skills for our store staff and in-store pharmacists. We believe these programs have played an important role in
strengthening the capabilities of our employees.

170
Training and Development
Through our training center “Ek Unlearn Campus”, we focus on various development programs for knowled ge-based selling,
health assistant programs, patient counselling and pleasant retail experience, which is a hallmark of our wellness operations .
Research and Development
We engage a third-party research and development team that is responsible for our product development processes relating to
our private label brands. Our research and development effort are focused on creating products that foster customer stickiness
and stimulate repeat purchases.
Intellectual Property
We have applied for trademarks, copyrights and designs as measures to protect our intellectual property.
Our most important brands, slogans and logos are protected by trademarks in India. Our main trademarks include our “Wellness
Forever” brand. We have also applied for a trademark for our “Amore” brand.
As of June 30, 2021, we have 90 registered trademarks under the Trademarks Act, and 54 applications are pending for
registration with the Registrar of Trademarks.
Property, Plant and Equipment
As of the date of this Draft Red Herring Prospectus, we lease the property where our registered office, fulfilment center and
ZEDC are based. The lease agreement relating to our ZEDC features a term of five years expiring in June 2024.
In addition, we also lease the premises out of which we operate all of our stores. The properties in which our stores are located
are leased either pursuant to lease agreements or leave and license agreement, most of which are for a period of 5 years. Most
of these lease agreements are renewable at our option, while most leave and license agreements are renewable only as mutually
agreed between the parties.
The properties in which our hospital stores are located are leased pursuant to lease agreements or leave and license agreement,
most of which are for a period of 5 years. Our leases and leave and license agreements relating to government hospitals may be
unilaterally terminated at will by our hospital landlords.
Insurance
We maintain the types and amounts of insurance covera ge that we believe are consistent with customary industry practices in
India and consider our insurance coverage to be adequate for our business. Our insurance policies cover employee -related
accidents and injuries, fire and special perils. We maintain a cargo policy against losses during transportation or delivery. We
also maintain directors’ and officers’ liability insurance.

171
KEY REGULATIONS AND POLICIES
The following description is a summary of certain sector specific and other relevant laws and regulations in India, which are
applicable to our Company. The information detailed in this section has been obtained from publications available in the publ ic
domain. The regulations set out below may not be exhaustive and are only intended to provide general information to the
investors and are neither designed nor intended to substitute for professional legal advice. The statements below are based on
the current provisions of the Indian law and the judicial, regulatory and administrative interpretations thereof, which are
subject to change or modification by subsequent legislative actions, regulatory, administrative, quasi -judicial, or judicial
decisions.
For details of government approvals obtained by the Company, see “Government and other Approvals” on page 312.
FSSA and regulations framed thereunder
The FSSA was enacted with a view to consolidate the laws relating to food and to establish the Food Safety and Standards
Authority of India (“FSSAI”) for laying down scientific standards for articles of food and to regulate their manufacture, storage,
distribution, sale and import to ensure availability of safe and wholesome food for human consumption. The FSSAI is required
to provide scientific advice and technical support to the GoI and the state govern ments in framing the policy and rules relating
to food safety and nutrition. The FSSA also sets out requirements for licensing and registering food businesses, general
principles for food safety, and responsibilities of the food business operator and liability of manufacturers and sellers, and
adjudication by the Food Safety Appellate Tribunal. The FSSA also lays down penalties for various offences (including recall
procedures).
In exercise of powers under the FSSA, FSSAI has framed, inter alia, the Food Sa fety and Standard Rules, 2011 (“FSSR”). The
FSSR sets out the enforcement structure of ‘commissioner of food safety’, ‘food safety officer’ and ‘food analyst’ and
procedures of taking extracts of books of accounts and other relevant documents, seizure of f ood articles, sampling of food
articles and analysis. The Food Safety and Standards (Licensing and Registration of Food Businesses) Regulations, 2011
provide for the conditions and procedures for registration and licensing process for food business.
In an attempt to regulate the activities of the e-commerce Food Business Operators (“FBOs”) and to ensure quality and safety
of the food and in consumer interests, FSSAI in February 2017 formulated and enforced Guidelines for operations of e-
Commerce FBOs pursuant to the Food Safety and Standards (Licensing and Registration of Food Business) Amendment
Regulations, 2018 (“FBO Guidelines”). The Guidelines lay down mandatory licensing requirements and other responsibilities
of an e-commerce FBO, licensing conditions to be adhered to by an e-commerce FBO, as well as standards for hygiene and
manufacturing processes to be followed by licensed FBOs engaged in catering/ food-service operations (including food
packaging and transportation). Further, an e-commerce FBO (which includes sellers and brand owners who display or offer
their food products through e-commerce, and providers of transportation services for the food products and/or providing last
mile delivery transportation to the end consumers), is required to obtain central/state license from the concerned central/state
licensing authority. The FBO Guidelines are applicable to all e-commerce FBOs that carry on any activity in relation to
manufacture, processing, packaging, storage, transportation, distribution and/or import of food, and also includes food services,
catering services, sale of food or food ingredients, through the medium of e-commerce. The e-commerce FBOs must comply
with, inter alia, rules on listing and delisting of FBOs on their platform, display of information regarding food items available
for order on their websites as well as expiry dates of pre-packaged food items
Further, FSSAI has issued guidance note on ‘Food Hygiene and Safety Guidelines for Food Businesses during Coronavirus
Disease (COVID-19) Pandemic’ (“Guidance Note”) with an intent to provide guidance to food businesses, including their
personnel involved in handling of food and other employees to prevent spread of COVID-19 in the work environment and any
incidental contamination of food/food packages. It, inter alia, mandates that employers should have a COVID-19 screening
protocol in place to screen all personnel entering the premise. The Guidance Note prescribes guidelines for the management of
the food establishment to handle a Covid-19 suspect/positive case in accordance with the guidelines issued by Ministry of
Health and Family Welfare and clean and disinfect the premises accessed by the suspected Covid -19 case.
The Guidance Note further mandates strict adherence to General Hygiene Practices specified under Schedule 4 of Food Safety
and Standards (Licensing and Registration of Food Businesses) Regulation, 2011 (“Schedule”). The Schedule enumerates
multiple compulsory measures to be adopted by food business operators in the interest of human nutrition, safety and hygiene.
Legal Metrology Act, 2009 (the “Legal Metrology Act”)
The Legal Metrology Act came into effect on January 14, 2010 and has repealed and replaced the Standards of Weights and
Measures Act, 1976 and the Standards of Weights and Measures (Enforcement) Act, 1985. The Legal Metrology Act seeks to
establish and enforce standards of weights and measures, regulate trade and commerce in weights, measures and other goods
which are sold or distributed by weight, measure or number and for matters connected therewith or incidental thereto.
The Legal Metrology Act provides that for prescribed specifications for all weights and measures used by an entity to be based
on metric system only. Such weights and measures are required to be verified and re-verified periodically before usage through
government approved test centres. Under the provisions of the Legal Metrology Act, pre -packaged commodities are required

172
to bear statutory declarations and entities are required to obtain a registration of the instruments used before import of any
weight or measure. Approval of model is required before manufacture or import of any weight or measure.
Legal Metrology (Packaged Commodities) Rules, 2011 (the “Packaged Commodities Rules”)
The Packaged Commodities Rules was framed under Section 52(2) (j) and (q) of the Legal Metrology Act and lays down
specific provisions applicable to packages intended for retail sale, whole sale and for export and import. A “pre-packaged
commodity” means a commodity which without the purchaser being present is placed in a package of a pre -determined quantity.
The key provisions of the Packaged Commodities Rules are:
• It is illegal to manufacture, pack, sell, import, distribute, deliver, offer, expose or possess for sale any pre-packaged
commodity unless the package is in such standard quantities or number and bears thereon such declarations and
particulars as prescribed;
• All pre-packaged commodities must conform to the declarations provided thereon as per the requirement of Section
18(1) of the Legal Metrology Act; and
• No pre-packaged commodity shall be packed with error in net quantity beyond the limit prescribed in the first schedule
of the Packaged Commodity Rules.
Shops and Establishments Legislations
Under the provisions of local shops and establishments legislations applicable in the states in which establishments are set up,
establishments are required to be registered. Such legislations regulate the working and employment conditions of the workers
employed in shops and establishments including commercial establishments and provide for fixation of working hours, rest
intervals, overtime, holidays, leave, termination of service, maintenance of shops and establishme nts and other rights and
obligations of the employers and employees. Our stores, distribution and packing centres have to be registered under the shop s
and establishments legislations of the states where they are located.
Drugs and Cosmetics Act, 1940 (the “DCA”) and the Drugs and Cosmetics Rules, 1945 (“DC Rules”)
The DCA regulates the import, manufacture, distribution and sale of drugs and cosmetics. In view of the provisions of the DCA,
no person can import, manufacture, distribute, stock and sell any drugs and cosmetics, except under the license granted for
respective operations by the authority notified under the DCA. The DCA prescribes the standards for purity, identity and
strength of drugs and cosmetics while also prohibiting the import of certain ca tegories of drugs and cosmetics. The DCA
mandates that every person holding a license must keep and maintain such records, registers and other documents as may be
prescribed which may be subject to inspection by the relevant authority.
The DC Rules have been enacted to give effect to the provisions of the DCA to regulate the manufacture, distribution and sale
of drugs and cosmetics in India. The DC Rules also prescribe the drugs or classes of drugs or cosmetics or classes of cosmetics
for the import of which a license is required, prescribe the form and conditions of such licenses, the authority empowered to
issue the same and the fees payable therefor.
The DC Rules provide for the cancellation or suspension of such license in any case where any provisions or rule applicable to
the import of drugs and cosmetics is contravened or any of the conditions subject to which the license is issued is not complied
with. The DC Rules further prescribe the manner of labelling and packaging of drugs.
Narcotic Drugs and Psychotropic Substances Act, 1985 (“Narcotic Act”)
The Narcotic Act sets out the statutory framework for drug law enforcement in India. It prohibits, inter alia, the cultivatio n,
production, manufacture, possession, sale, purchase, transportation, warehousing, consumption, inter-state movement,
transhipment and import and export of narcotic drugs and psychotropic substances, except for medical or scientific purposes. It
also controls and regulates controlled substances which can be used in the manufacturing of narcotic drugs and psychotropic
substances. Offences under the Narcotic Act are essentially related to violations of the various prohibitions imposed under t he
Narcotic Act, punishable by both imprisonment and monetary fines. The Narcotic Act was amende d in 1989 to mandate death
penalty for second offences relating to contraventions involving more than certain quantities of specified narcotic drugs
andpsychotropic substances. Subsequently, the Narcotic Act was amended to remove restrictions on certain drugs called
‘essential narcotic drugs’ (narcotic drugs which have been notified for medical and scientific use) and to improve treatment and
care for people dependent on drugs.
Drugs (Prices Control) Order, 2013 (“DPCO”)
The DPCO prescribes inter alia the ceiling price of scheduled formulations, retail price of a new drug for existing manufacturers
of scheduled formulations, maximum retail price of scheduled formulations. Under the DPCO, the Central Government may
issue directions to the manufacturers of active pharmaceutical ingredients or bulk drugs and formulations to increase production
or sell such active pharmaceutical ingredient or bulk drug to such manufacturers of formulations and direct the formulators t o

173
sell the formulations to institutions, hospitals or any agency. The DPCO procedures for fixing the ceiling price of scheduled
formulations of specified strengths or dosages, retail price of new drug for existing manufacturers of scheduled formulations,
method of implementation of prices fixed by Central Government and penalties for contravention of its provisions. The National
Pharmaceutical Pricing Authority vide Notification dated March 31, 2020 in pursuance of Notification No. SO 648(E), dated
February 11, 2020, stated that all medical devices sha ll be governed under the provisions of the Drugs (Prices Control) Order,
2013 (DPCO, 2013) with effect from April 1, 2020
The Essential Commodities Act, 1955 (the “ECA”)
The ECA gives powers to the Central Government, to control production, supply and distribution of, and trade and commerce
in certain essential commodities for maintaining or increasing supplies and for securing their equitable distribution and
availability at fair prices or for securing any essential commodity for the defence of India or the efficient conduct of military
operations. Using the powers under it, various ministries/ departments of the Central Government have issued control orders
for regulating production, distribution, quality aspects, movement and prices pertaining to the commodities which are essential
and administered by them.
The State Governments have also issued various control orders to regulate various aspects of trading in essential c ommodities
such as food grains, edible oils, sugar and drugs. Penalties in terms of fine and imprisonment are prescribed under the ECA f or
contravention of its provisions.
Insecticides Act, 1968 (the “Insecticides Act”)
The Insecticides Act regulates the import, manufacture, sale, transport, distribution and use of insecticides with a view to prevent
risk to human beings or animals, and matters connected therein. Any person who desires to manufacture or sell or exhibit for
sale or distribute any insecticides or undertake commercial pest control operations with the use of insecticides needs to make
an application to the licensing officer for the grant of the license. The Act contains various prohibitions regarding the imp ort,
manufacture and sale of insecticides.
Consumer Protection Act, 2019 (“COPRA”) and Consumer Protection (E -Commerce) Rules, 2020 (“E-Commerce Rules”)
The COPRA has superseded Consumer Protection Act, 1986 and came into force on July 20, 2020. The COPRA has been
promulgated to provide for the protection of consumers’ interests, to establish authorities for timely and effective administration
and settlement of consumers’ disputes and other connected matters. The COPRA provides for establishment of the Central
Consumer Protection Council to render advice on promotion and protection of consumers’ rights and the Central Consumer
Protection Authority to regulate matters relating to violation of rights of consumers, unfair trade practices and false or
misleading advertisements which are prejudicial to the interests of public and consumers, and to protect, promote and enforce
the rights of the consumers. The COPRA also provides for the establishment of the Consumer Disputes Redressal Commissions
at the district, state and national level. The E-Commerce Rules have brought e-commerce entities and their customers under its
purview including providers of technologies or processes for advertising or selling, online market place or online auction sites.
The COPRA also provides for referring the disputes to m ediation for early settlement of the disputes between the parties and
also prescribes the offences and the penalties for such offences.
Local Municipal Laws
Our Company is subject to various laws framed by the municipal corporations of the states in which our stores and distibution
and packing centres are located, which regulate and require us to obtain licenses for, among others, selling certain kinds of food
products, quantity of products which can be stocked, sold and packed and usage of hoardings.
The Pharmacy Act, 1948 (“Pharmacy Act”)
The Pharmacy Act governs the regulation of the profession, practice of pharmacy and pharmacy councils. The function of
pharmacy council which inter-alia, includes minimum standard of education laid down by Pharmacy Council of India known
as the Education Regulation, minimum qualification for admission and condition to be fulfilled by university, approval of
institute providing course and examination for the pharmacists and withdrawal of approval. The State Pharmacy Council
maintains up-to-date register of pharmacists after collection of requisite fees. Under Section 42 of the Pharmacy Act, no person
other than a registered pharmacist shall compound, prepare, mix, or dispense any medicine on the prescription o f a medical
practitioner.
Pharmaceutical Policy, 2002
The Pharmaceutical Policy was enacted with the objectives including, inter alia, abundant availability of good quality essential
pharmaceuticals at reasonable prices, strengthening the system of quality control over drug and pharmaceutical production and
distribution and creating an incentive framework for the pharmaceutical industry which promotes new investment into
pharmaceutical industry and encourages the introduction of new technologies and new dru gs
Intellectual Property Laws

174
Certain laws relating to intellectual property rights such as copyright protection under the Copyright Act, 1957 and trademark
protection under the Trade Marks Act, 1999 are applicable to us.
The Copyright Act, 1957 (the “Copyright Act”) governs copyright protection in India. Even while copyright registration is not
a prerequisite for acquiring or enforcing a copyright in an otherwise copyrightable work, registration under the Copyright Ac t
acts as a prima facie evidence of the particulars entered therein and helps expedite infringement proceedings and reduce delay
caused due to evidentiary considerations.
The Trademarks Act, 1999 (the “Trademarks Act”) provides for the process for making an application and obtaining
registration of trademarks in India. The purpose of the Trademarks Act is to grant exclusive rights to marks such as a brand,
label, heading and to obtain relief in case of infringement for commercial purposes as a trade description. The Trademarks Ac t
prohibits registration of deceptively similar trademarks and provides for penalties for infringement, falsifying and falsely
applying trademarks.
The Information Technology Act, 2000 (the “IT Act”) and the rules made thereunder
The IT Act seeks to: (i) provide legal recognition to transactions carried out by various means of electronic data interchange
involving alternatives to paper-based methods of communication and storage of information; (ii) facilitate electronic filing of
documents; and (iii) create a mechanism for the authentication of electronic documentation through digital signatures. The IT
Act provides for extraterritorial jurisdiction over any offence or contravention under the IT Act committed outside India by any
person, irrespective of their nationality, if the act or conduct constituting the offence or contravention involves a computer,
computer system or computer network located in India. Additionally, the IT Act empowers the Government of India to direct
any of its agencies to intercept, monitor or decrypt any information in the interest of sovereignty, integrity, defence and security
of India, among other things. The Information Technology (Procedure and Safeguards for Blocking for Access of Information
by Public) Rules, 2009 specifically permit the Government of India to block access of any information generated, transmitted,
received, stored or hosted in any computer resource by the public, the reasons for which are required to be recorded by it in
writing.
The IT Act facilitates electronic commerce by recognizing contracts concluded through electronic means, protects
intermediaries in respect of third-party information liability and creates liability for failure to protect sensitive personal data.
The IT Act also prescribes civil and criminal liability including fines and imprisonment for computer related offences including
those relating to unauthorized access to computer systems, tampering with or unauthorised manipulation of any computer,
computer system or computer network and damaging computer systems, and creates liability for negligence in dealing with or
handling any sensitive personal data or information in a computer resource and in maintaining reasonable security practices a nd
procedures in relation thereto, among others.
The IT Act empowers the Government of India to formulate rules with respect to reasonable security practices and procedures
and sensitive personal data. In exercise of this power, the Department of Information Technology, (“ DoIT”) Ministry of
Electronics and Information Technology, Government of India, in April 2011, notified the Information Technology (Reasonable
Security Practices and Procedures and Sensitive Personal Data or Information) Rules, 2011 (“ IT Security Rules”) which
prescribe directions for the collection, disclosure, transfer and protection of sensitive personal data by a body corporate or any
person acting on behalf of a body corporate. The IT Security Rules require every such body corporate to provide a privacy
policy for handling and dealing with personal information, including sensitive personal data, ensuring security of all personal
data collected by it and publishing such policy on its website. The IT Security Rules further require that all such personal data
be used solely for the purposes for which it was collected, and any third party disclosure of such data is made with the prior
consent of the information provider, unless contractually agreed upon between them or where such disclosure is mandated by
law.
The DoIT also notified the Information Technology (Intermediaries Guidelines and Digital Media Ethics Code) Rules, 2021
(“IT Intermediary Rules”) requiring intermediaries receiving, storing, transmitting, or providing any service with respect to
electronic messages to not knowingly host, publish, transmit, select or modify any information prohibited under the IT
Intermediaries Rules, to disable hosting, publishing, transmission, selection or modification of such information once they
become aware of it, as well a s specifying the due diligence to be observed by intermediaries.
The National Digital Communications Policy, 2018 (the “NDCP 2018”)
The NDCP 2018 was notified by the Ministry of Communications, Department of Telecommunications vide gazette
notification dated October 22, 2018. The policy seeks to support India’s transition to a digitally empowered economy and
society. The NDCP 2018 aims to accomplish the following strategic objectives by 2022: (i) provision of broadband for all; (ii )
creating four million additional jobs in the digital communications sector; (iii) enhancing the contribution of the digital
communications sector to eight percent of India’s GDP; (iv) propelling India to the top 50 nations in the ICT Development
Index published by the United Na tions International Telecommunication Union; (v) enhancing India’s contribution to global
value chains; and (vi) ensuring digital sovereignty. The NDCP 2018 further also contemplates, among others, (i) establishment
of a national digital grid by creating a National Fibre Authority; (ii) establishing common service ducts and utility corridors in
all new cities and highway road projects; (iii) creating a collaborative institutional mechanism between the central governme nt,
the state governments and the local bodies for common rights of way, (iv) standardization of costs and timelines; (v) removal

175
of barriers to approvals; and (vi) facilitating development of open access next generation networks.
Foreign Investment Laws
We are also governed by foreign exchange related laws and the regulations applicable on investments outside India including
FEMA and the rules made thereunder. For further details, see “Restrictions on Foreign Ownership of Indian Securities” on
page 354.
Other Indian laws
In addition to the aforementioned material legislations which are applicable to our Company, some of the tax legislations that
may be applicable to the operations of our Company include the Income Tax Act 1961, the Income Tax Rules, 1962, as amended
by the Finance Act in respective years; Central Goods and Service Tax Act, 2017, the Central Goods and Service Tax Rules,
2017 and various state-wise legislations made thereunder; Integrated Goods and Service Tax Act, 2017 and rules thereof;
professional tax-related state-wise legislations; and Indian Stamp Act, 1899 and various state-wise legislations made thereunder.
A wide variety of labour laws are also applicable to our Company and our Subsidiaries, including the Contract Labour
(Regulation and Abolition) Act, 1970, Employees’ Provident Funds and Miscellaneous Provisions Act, 1952, the Employees’
State Insurance Act, 1948, the Industrial Disputes Act, 1947 and Industrial Disputes (Central) Rules, 1957, Maternity Benefit
Act, 1961, Minimum Wages Act, 1948, Payment of Bonus Act, 1965, the Payment of Gratuity Act, 1972, Payment of Wages
Act, 1936, Equal Remuneration Act, 1976 and the Workmen’s Compensation Act, 1923, Industrial Employment (Standing
Orders) Act, 1946, Apprentices Act, 1961 and Child Labour (Prohibition Regulation) Act, 1986 and Sexual Harassment of
Women at Workplace (Prevention, Prohibition and Redressal) Act , 2013 and Factories Act, 1948.

176
HISTORY AND CERTAIN CORPORATE MATTERS
Brief history of our Company
Our Company was incorporated as ‘Wellness Forever Medicare Private Limited’ on February 8, 2008 in Mumbai, Maharashtra
as a private limited company under the Companies Act, 1956. Subsequently, our Company was converted into a public limited
company pursuant to a resolution passed by our Shareholders at a n extraordinary general meeting held on July 9, 2021 and a
fresh certificate of incorporation dated August 5, 2021 was issued by the RoC consequent upon conversion, recording the
change in the name of our Company to Wellness Forever Medicare Limited.
Change in the registered office
The following table sets forth details of the change in the registered office of our Company since the date of its incorporation:
Date of change Details of change in the address of the registered office Reasons for change in the address of the registered office
January 10, 2019 The registered office of our Company was changed from Room No.
12, 1st Floor, Lahar Bros. Mansion, Opposite Kem Hospital, Dr. E.
Borges Marg, Parel, Mumbai 400 012, Maharashtra to 7th Floor,
Wing A, Empire Plaza, IT Park, LBS Marg, Vikhroli (West),
Mumbai 400 083, Maharashtra
Administrative convenience
Main objects of our Company
The main objects contained in our Memorandum of Association are as follows:
To carry on in India or outside India, the business as formulators, manufacturers, producers, processors, packers, exporters,
importers, buyers, sellers, resellers, stockiest, agent, wholesalers, retailers, distributors, collaborators, suppliers, merchants,
contractors, consultants, traders and dealers in all types, forms, and kinds of drugs, medicines, medicated ointments, medica ted
rubs, medicated powder, medicated cream & lotion, surgical, cosmetics, beauty care products restoratives, laboratory
chemicals, and other healthcare allied products, or their raw materials, intermediaries material whether allopathic, ayurvedic,
unani, homeopathic, herbal, pharmaceuticals and any other kind whatsoever and to act as general chemist and druggist
including opening of Medical and Convenience Stores.
The main objects as contained in our Memorandum of Association enable our Company to carry on the busin ess presently being
carried out and proposed to be carried out by it.
Amendments to the Memorandum of Association
Set out below are the amendments to our Memorandum of Association in the last 10 years:
Date of Shareholders’
resolution/ Effective date
Particulars
February 14, 2014 Sub-division of equity shares of face value of ₹100 each into equity shares of face value of ₹10 each
Clause V of our Memorandum of Association was amended to reflect increase in the authorised share
capital of our Company from ₹40,000,000 divided into 400,000 equity shares of ₹100 each to
₹200,000,000 divided into 20,000,000 equity shares of ₹10 each
August 25, 2014
Clause V of our Memorandum of Association was amended to reflect reclassification in the authorised
share capital of our Company from ₹200,000,000 divided into 20,000,000 equity shares of ₹10 each to
₹200,000,000 divided into 15,000,000 equity shares of ₹10 each and 5,000,000 cumulative convertible
preference share capital of ₹10 each
June 15, 2016
Clause V of our Memorandum of Association was amended to reflect reclassification in the authorised
share capital of our Company from ₹200,000,000 divided into 15,000,000 equity shares of ₹10 each and
5,000,000 cumulative convertible preference shares of ₹10 each to ₹200,000,000 divided into 14,000,000 equity shares of ₹10 each, 1,000,000 class A equity shares of ₹10 each and 5,000,000 cumulative
convertible preference share capital of ₹10 each
July 26, 2016 Adoption of the Memorandum of Association in substitution of the existing memorandum of association
by merging the objects of the Company mentioned under clause III (C) – Other Objects with clause III (B) – Objects incidental or ancillary to the attainment of Main Objects, in accordance with the requirements
set out under Companies Act 2013
August 28, 2019 Clause V of our Memorandum of Association was amended to reflect reclassification in the authorised share capital of our Company from ₹200,000,000 divided into 14,000,000 equity shares of ₹10 each,
1,000,000 class A equity shares of ₹10 each and 5,000,000 cumulative convertible preference shares of
₹10 each to ₹200,000,000 divided into 12,000,000 equity shares of ₹10 each, 1,000,000 class A equity
shares of ₹10 each, 215,000 class A1 equity shares of ₹10 each, 1,785,000 class A2 equity shares ₹10 each,
4,194,170 series A CCPS of ₹10 each, 667,770 series A1 CCPS of ₹10 each and 138,060 series A2 CCPS of ₹10 each

177
Date of Shareholders’
resolution/ Effective date
Particulars
July 29, 2020 Clause V of our Memorandum of Association was amended to reflect reclassification in the authorised
share capital of our Company from ₹200,000,000 divided into 12,000,000 equity shares of ₹10 each,
1,000,000 class A equity shares of ₹10 each, 215,000 class A1 equity shares of ₹10 each, 1,785,000 class A2 equity shares ₹10 each, 4,194,170 series A CCPS of ₹10 each, 667,770 series A1 CCPS of ₹10 each
and 138,060 series A2 CCPS of ₹10 each to ₹200,000,000 divided into 13,472,544 equity shares of ₹10
each, 710,000 class A equity shares of ₹10 each, 211,046 class A1 equity shares of ₹10 each, 461,410 class
A2 equity shares of ₹10 each, 145,000 class A3 equity shares of ₹10 each, 757,637 series A CCPS of ₹10
each, 658,353 series A1 CCPS of ₹10 each, 138,954 series A2 CCPS of ₹10 each and 3,445,056 series A3 CCPS of ₹10 each
July 9, 2021
Clause V of our Memorandum of Association was amended to reflect reclassification in the authorised
share capital and sub-division of equity shares of our Company from ₹200,000,000 divided into 13,472,544
equity shares of ₹10 each, 710,000 class A equity shares of ₹10 each, 211,046 class A1 equity shares of ₹10 each, 461,410 class A2 equity shares of ₹10 each, 145,000 class A3 equity shares of ₹10 each, 757,637
series A CCPS of ₹10 each, 658,353 series A1 CCPS of ₹10 each, 138,954 series A2 CCPS of ₹10 each
and 3,445,056 series A3 CCPS of ₹10 each to ₹200,000,000 divided into 100,000,000 Equity Shares of ₹2
each
Adoption of a fresh Memorandum of Association to reflect the change in the name of our Company from
‘Wellness Forever Medicare Private Limited’ to ‘Wellness Forever Medicare Limited’, consequent upon
conversion from a private limited company to a public limited company and to ensure compliance with
the provisions required by the public limited company under the Companies Act, 2013
Major events and milestones of our Company
The table below sets forth some of the key events in the history of our Company:
Calendar year Event
2008 Launch of first retail store in Thane
2010 Launch of premium flagship store at Hinduja Hospital, Mumbai
2012 Expanded the business in Karnataka by opening a retail store
2014 Commission of Zero Error Distribution Centre
2015 Started a training centre in Mumbai
2017 Established the subsidiary, Amore Health Essentials Private Limited
2019 Raised ₹ 550 million from Rising Sun Holdings Limited
2020 Launched the franchisee network
Awards, accreditations and recognitions received by our Company
Calendar year Awards
2015 “Regional Retailer – West" in the Indian Retail Awards 2015
2018 “Emerging Healthcare Delivery Brand” in the 5th IHW Awards
2018 “Excellence in Pharmacy – Mumbai” in the India Today Excellence Healthcare Awards 2018
2018 “Best Learning Strategy of the Year” in the 2nd edition of Future of L&D Summit and Awards
2018 “Excellence in Pharmacy Retail Chain” in the Mumbai City Icon 2018
2018 “Fastest Growing Retail Pharmacy Chain” in the Retail & Hospitality Awards 2018
2019 “Speciality retail” in the India’s Retail Champions 2019
Time and cost over-runs
There have been no time and cost over-runs in respect of our business operations.
Defaults or re-scheduling, restructuring of borrowings with financial institutions or banks
There have been no defaults or re-scheduling/ re-structuring in relation to borrowings availed by our Company from any
financial institutions or banks.
Launch of key products or services, entry into new geographies or exit from existing markets
For details of key products or services launched by our Company, entry into new geographies or exit from existing markets,
see “Our Business” on page 153.
Our Holding Company
As of the date of this Draft Red Herring Prospectus, our Company has no holding company.
Our Subsidiaries
As on the date of this Draft Red Herring Prospectus, our Company has two Subsidiaries.

178
Amore Health Essentials Private Limited
Corporate Information
Amore Health Essentials Private Limited (“Amore”) was incorporated on March 20, 2017 as a company limited by shares
under the Companies Act, 2013. Its corporate identification number is U74999MH2017PTC292665. It has its registered office
at 7th Floor, Wing A, Empire Plaza, IT Park, LBS Marg, Vikhroli (West), Mumbai 400 083, Maharashtra.
Amore is authorised to engage in the business of among other things, purchase, sale, supply and distribution of drugs, medicines,
surgical cosmetics, beauty care products, laboratory chemicals and pharmaceuticals and to act as general chemist and druggist
under the objects clause of its memorandum of association.
Capital Structure
The authorised share capital of Amore is ₹20,000,000 divided into 2,000,000 equity shares of ₹10 each. The issued and paid-
up share capital of Amore is ₹11,866,850 divided into 1,186,685 equity shares of ₹10 each.
Shareholding
As of the date of this Draft Red Herring Prospectus, the shareholding pattern of Amore is as follows:
Name of the shareholder Number of equity shares held Percentage of the total shareholding
(%)
Wellness Forever Medicare Limited 1,186,684 99.99
Gulshan Haresh Bakhtiani* 1 0.01
Total 1,186,685 100.00
* Nominee shareholder of our Company
Wellness Forever HealthTech Private Limited
Corporate Information
Wellness Forever HealthTech Private Limited (“WFHPL”) was incorporated on July 23, 2021 as a company limited by shares
under the Companies Act, 2013. Its corporate identification number is U52311MH2021PTC364475. It has its registered office
at 7th Floor, Wing A, Empire Plaza, IT Park, LBS Marg, Vikhroli (West), Mumbai 400 083, Maharashtra.
WFHPL is authorised to engage in the business of among other things, establishing, running and maintaining a portal for
receiving and serving customer orders and selling pharma and non-pharma products as authorized under the objects clause of
its memorandum of association
Capital Structure
The authorised share capital of WFHPL is ₹ 451,000,000 divided into 100,000 equity shares of ₹10 each and 45,000,000
optionally convertible redeemable preference shares of ₹ 10 each . The issued and paid-up share capital of WFHPL is ₹
300,100,000 divided into 10,000 equity shares of ₹10 each and 30,000,000 optionally convertible redeemable preference shares
of ₹ 10 each.
Shareholding
As of the date of this Draft Red Herring Prospectus, the shareholding pattern of WFHPL is as follows:
Name of the Shareholder Number of equity shares
held
Number of preference
shares held
Percentage of the total
shareholding (%)
Wellness Forever Medicare Limited 9,999 30,000,000 99.99
Gulshan Haresh Bakhtiani* 1 0 0.01
Total 10,000 30,000,000 100.00
*Nominee shareholder of our Company
Joint Venture and Associate
As of the date of this Draft Red Herring Prospectus, our Company does not have any joint ventures or associate.
Amount of accumulated profits or losses
As on the date of this Draft Red Herring Prospectus, there are no accumulated profits or losses of any of our Subsidiaries that
have not been accounted for by our Company.
179
Details regarding material acquisitions or divestments of business/undertakings, mergers, amalgamations or any
revaluation of assets, in the last 10 years
Our Company has not acquired or divested from any business or undertaking and has not undertaken any merger, amalgamation
or revaluation of assets in the last 10 years.
Significant financial or strategic partners
As on the date of this Draft Red Herring Prospectus, our Company does not have any significant financial or strategic partners.
Shareholders’ agreements and other agreements
Key terms of subsisting shareholders’ agreements
Shareholders’ Agreement dated September 29, 2014 (“Shareholders’ Agreement”) entered into among our Company,
Promoters, Ramesh Shantilal Mehta and certain other shareholders, as amended by the amendment to Shareholders’
Agreement dated May 12, 2015 (“Shareholders’ Amendment Agreement”), addendum to the Shareholders’ Agreement dated
July 26, 2016 (“Addendum Agreement 1”), second addendum to the Shareholders’ Agreement dated November 21, 2017
(“Addendum Agreement 2”), third addendum to the Shareholders’ Agreement dated July 17, 2019 (“Addendum Agreement
3”) and fourth addendum to the Shareholders’ Agreement dated August 13, 2020 (“Addendum Agreement 4”, together with
Shareholders’ Agreement, Shareholders’ Amendment Agreement, Addendum Agreement 1, Addendu m Agreement 2, Addendum
Agreement 3 and Addendum Agreement 4, “SHA”)
Our Company, Promoters, Ramesh Shantilal Mehta and certain other shareholders have entered into the Shareholders’
Agreement to govern, inter alia, their rights and obligations in our Company, and certain parties have entered into amendment
agreement and addendums to the Shareholders’ Agreement capturing the investment of new investors and their rights. Pursuant
to the SHA, investors are entitled to certain rights, inter alia (a) to nominate directors and observers on the Board, (b) rights to
freely transfer the securities subject to certain restrictions, and (c) exit rights including through initial public offer. Further, the
SHA provides certain information and inspection rights to the investors, including the right to inspect books of accounts, records
and other documents of the Company. The SHA also provides rights and obligations with respect to the appointment of directors
and corporate governance.
The parties to the SHA have entered into the amendment cum termination agreement dated September 30, 2021 to the SHA
(“Amendment cum Termination Agreement”), the parties have agreed that if the listing of Equity Shares on the Stock
Exchanges occurs on or prior to the cut-off date i.e. November 30, 2022, the SHA shall stand automatically terminated as on
the date of listing and commencement of trading of Equity Shares, without any further act or deed required on the part of any
party. Accordingly, all the rights available to the parties to the SHA, including the ones set out above, shall fall away upon
listing of the Equity Shares. Further, the parties to the SHA have suspended or waived certain rights available to them under
the SHA including rights to nominate directors on the Board, exit available to the existing Shareholders and restrictions on
transferability of Equity Shares, among others, until the date of listing and commencement of trading of Equity Shares on the
Stock Exchanges. The Amendment cum Termination Agreement shall automatically stand terminated if the Offer is not
completed any time until the cut-off date i.e. November 30, 2022.
Key terms of share purchase agreements
Share Purchase Agreement dated July 17, 2019 entered into among our Company, certain Promoters, certain Shareholders
and persons purchasing the equity shares. (“SPA 2019”)
Certain Promoters of our Company, certain other shareholders, our Company and prospective purchasers of equity shares of
our Company entered into the SPA 2019 pursuant to which 231,380 equ ity shares of our Company were transferred to certain
persons for a consideration of ₹ 275.80 million .
Share Purchase Agreement dated November 21, 2017 entered into among our Company, Promoters, certain Shareholders and
persons purchasing the equity shares. (“SPA 2017”)
Promoters of our Company, certain other shareholders, our Company and prospective purchasers of equity shares of our
Company entered into the SPA 2017 pursuant to which 523,039 equity shares of our Company were transferred to certain
persons for a consideration of ₹ 258.67 million .
Key terms of other subsisting material agreements
Our Company has not entered into any other material agreements, including with strategic partners or financial partners, othe r
than in the ordinary course of business.
Agreements with Key Managerial Personnel, Directors, Promoters or any other employee
As on the date of this Draft Red Herring Prospectus, there are no agreements entered into by our Key Managerial Personnel or

180
Directors or Promoters or any other employee of our Company, either by themselves or on behalf of any other person, with any
shareholder or any other third party with regard to compensation or profit sharing in connection with dealings in the securit ies
of our Company.
Details of guarantees given to third parties by the Promoter Selling Shareholders
Except as disclosed below, no guarantees have been issued by the Promoter Selling Shareholders which are outstanding as on
the date of this Draft Red Herring Prospectus:
(a) letter of continuing guarantee issued by the Promoter Selling Shareholders dated Sept ember 23, 2016 in favour of
HDFC Bank Limited in relation to the credit facility of ₹ 365.10 million availed by our Company;
(b) deed of guarantee issued by the Promoter Selling Shareholders dated May 30, 2018 in favour of Yes Bank Limited in
relation to the term loan of ₹ 150 million, cash credit facility of ₹ 230 million and a working capital demand loan of ₹
230 million availed by our Company;
(c) deed of guarantee issued by the Promoter Selling Shareholders dated October 26, 2018 in favour of IDFC Bank Limited
in relation to the working capital facility of ₹ 200 million and term loan of ₹ 150 million availed by our Company,
read with (i) supplemental deed of guarantee dated August 6, 2020 in relation to working capital facility of ₹ 250
million, term loan of ₹ 260 million and bank guarantee (cash backed limits) of ₹ 50 million , and (ii) supplemental deed
of guarantee dated August 23, 2021 in relation to working capital facility of ₹ 250 million, term loan of ₹ 417 million
and bank guarantee (cash backed limits) of ₹ 50 million;
(d) deed of guarantee issued by the Promoter Selling Shareholders dated July 2, 2020 in favour of Axis Bank Limited in
relation to the cash credit facility of ₹ 200 million and working capital demand loan of ₹ 200 million availed by our
Company; and
(e) deed of guarantee issued by the Promoter Selling Shareholders dated July 5, 2021 in favour of Axis Bank Limited in
relation to the term loan of ₹ 200 million availed by our Company.
The aforementioned guarantees are effective for a period till the underlying facilities are repaid by our Company. In the eve nt
of any default by our Company towards payment of the aforementioned facilities, the Promoter Selling Shareholders shall be
liable for the payment of the outstanding amount, including expenses incurred by the bank and any loss suffered by reason of
such default. The Promoter Selling Shareholders may also be liable for the payment of default interest at the rate specified by
the relevant lenders, as applicable. For further details, see “Restated Consolidated Financial Information – Note 23:
Borrowings” on page 258.

181
OUR MANAGEMENT
Board of Directors
In terms of Companies Act, 2013 and our Articles of Association, our Company is required to have a minimum of three Directors
and a maximum of 15 Directors. As on the date of this Draft Red Herring Prospectus, our Board of Directors comprises of 6
Directors, including 3 Executive Directors and 3 Independent Directors. Our Board comprises o f one woman director.
Details regarding our Board of Directors as on the date of this Draft Red Herring Prospectus are set forth below:
Sr.
No.
Name, designation, term, period of directorship,
address, occupation, date of birth and DIN
Age
(years)
Other directorships
1. Ashraf Mohammed Biran
Designation: Whole-Time Director
Term: Three years with effect from July 12, 2021 and
liable to retire by rotation
Period of Directorship: Director since February 8, 2008
Address: 1801/1802, Rizvi Heights, L.J. Road, Mahim
West, near Paradise Cinema, Mumbai 400 016
Occupation: Business
Date of Birth: November 25, 1962
DIN: 01716606
58 • Amore Health Essentials Private Limited
• KB Cycles Private Limited
• Volcano Enterprises Private Limited
• Wellness Forever Healthtech Private Limited
2. Gulshan Haresh Bakhtiani
Designation: Whole-Time Director
Term: Three years with effect from July 12, 2021 and
liable to retire by rotation
Period of Directorship: Director since February 8, 2008
Address: 133A, Kalpataru Residency, 107 Kamani Marg,
opposite Cinemax, Sion East, Mumbai 400 022
Occupation: Business
Date of Birth: June 10, 1965
DIN: 00172374
56 • Amore Health Essentials Private Limited
• Gout and Arigato Private Limited
• Lilac Insights Private Limited
• Pinnacle Biomed Private Limited
• Wellness Forever Healthtech Private Limited
• ZJ Biosys Private Limited
3. Mohan Ganpat Chavan
Designation: Whole-Time Director
Term: Three years with effect from July 12, 2021 and
liable to retire by rotation
Period of Directorship: Director since February 8, 2008
Address: 4604, 46th Floor, Tower 5, Crescent Bay, Jerbai Wadia Road, Bhoiwada, Parel, near Mahatma Phule
Education Society, Mumbai 400 012
Occupation: Business
Date of Birth: September 28, 1969
DIN: 00249979
52 • Amore Health Essentials Private Limited
• IPC Healthcare Private Limited
• Rahul Distributors Private Limited
• RNS Pharmaceuticals Private Limited
• Wellness Forever Healthtech Private Limited
4. Avani Vishal Davda
Designation: Independent Director
42 • Mahindra Logistics Limited
• NIIT Limited

182
Sr.
No.
Name, designation, term, period of directorship,
address, occupation, date of birth and DIN
Age
(years)
Other directorships
Term: Five years with effect from July 12, 2021
Period of Directorship: Director since July 12, 2021
Address: 82/B, 8th Floor, Heera Panna Building, Bhulabhai
Desai Road, Haji Ali, Mumbai 400 026
Occupation: Service
Date of Birth: February 9, 1979
DIN: 07504739
5. Ranjit Gobindram Shahani
Designation: Independent Director
Term: Five years with effect from July 12, 2021
Period of Directorship: Director since July 12, 2021
Address: Flat No. 56, Hill Park, A.G. Road, opposite
Malabar Telephone Exchange, Malabar Hill, Mumbai 400
006
Occupation: Senior Advisor
Date of Birth: August 18, 1949
DIN: 00103845
72 • Ambuja Cements Limited
• Hikal Limited
• J B Chemicals and Pharmaceuticals Limited
• Octopus Steel Private Limited
6. Kewal Handa
Designation: Independent Director
Term: Five years with effect from September 1, 2021
Period of Directorship: Director since September 1, 2021
Address: Nair House, 9th Floor, 14th B Road, behind
Mahavir Hospital, Khar West, Mumbai 400 052
Occupation: Professional
Date of Birth: August 22, 1952
DIN: 00056826
69 • Borosil Limited
• Clariant Chemicals (India) Limited
• Conexus Social Responsibility Services
Private Limited
• Ganga Care Hospital Limited
• Greaves Cotton Limited
• Infiiloom India Private Limited
• Mukta Arts Limited
• Oaknet Healthcare Private Limited
• Omsav Pharma Research Private Limited
• Quality Care India Limited
• R M Drip and Sprinklers Systems Limited
• Ramkrishna Care Medical Sciences Private
Limited
• Resilient Innovations Private Limited
• Salus Lifecare Private Limited
Relationship between our Directors and Key Managerial Personnel
None of our Directors or Key Managerial Personnel are related to each other or to any of the Key Managerial Personnel.

183
Arrangements or understandings with major shareholders, customers, suppliers or others
There is no arrangement or understanding with the major shareholders, customers, suppliers or others, pursuant to which any
of our Directors were appointed on the Board.
Brief biographies of Directors
Ashraf Mohammed Biran is a Whole-Time Director of our Company. He holds a diploma in pharmacy from the Board of
Technical Examinations, Maharashtra. He has experience in the manufacture and distribution of customer products,
pharmaceutical products, minerals and mining products and in the business of general stores. He has been associated with
Rakhangi General Store and New Rakhangi General Store as a partner and Pundol Medical NX and New Pundol Medical as a
proprietor. He is also a director of Volcano Enterprises Private Limited and K.B. Cycles Private Limited. He was appointed to
our Board of Directors with effect from February 8, 2008.
Gulshan Haresh Bakhtiani is a Whole-Time Director of our Company. He holds a bachelor’s degree in science from the
University of Bombay. He has experience in the manufacture, wholesale and retail of medicines and surgical products. He has
been associated with The Parel Chemist as a partner since 1996 and is also as a director of Pinnacle Biomed Private Limited,
Jimme Foundation, Gout and Arigato Private Limited and ZJ Biosys Private Limited. He was appointed to our Board of
Directors with effect from February 8, 2008.
Mohan Ganpat Chavan is a Whole-Time Director of our Company. He has completed his education up to higher secondary
certificate level. He has experience in the manufacture, marketing and distribution of consumer and pharmaceutical products.
He has been associated with Rahul Pharma as a partner since 2000 and is also a director of Rahul Distributors Private Limited
and IPC Healthcare Private Limited. He was appointed to our Board of Directors with effect from February 8, 2008.
Avani Vishal Davda is an Independent Director of our Company. She holds a bachelor’s degree in commerce from H.R.
College of Commerce and Economics, University of Mumbai. She is currently a director of Mahindra Logistics Limited and
NIIT Limited. Previously, she was the managing director of Godrej Nature’s Basket Limited and chief executive officer of Tata
Starbucks Limited. She was awarded the Uma Jain Award for a Young Woman Achiever by the Rotary Club of Bombay in
2014. She was appointed to our Board of Directors with effect from July 12, 2021.
Ranjit Gobindram Shahani is an Independent Director of our Company. He holds a bachelor’s degree of technology in
mechanical engineering from the Indian Institute of Technology, Kanpur and passed the examination for the diploma in
industrial management from the University of Bombay. He has also completed a business leadership program at Harvard
University. Previously, he was associated with Novartis India as vice chairman and managing director. He was appointed to
our Board of Directors with effect from July 12, 2021.
Kewal Handa is an Independent Director of our Company. He is a qualified company secretary and has passed the final
examinations held by the Institute of Cost and Works Accountants of India (currently known as the Institute of Cost and
Management Accountants of India). He has also passed the final examination for a master’s degree in commerce from the
University of Bombay. Previously, he was the managing director of Pfizer Limited, India and Wyeth Limited, India and the
non-executive chairman and part-time non-official director of Union Bank of India. He was appointed to our Board of Directors
with effect from September 1, 2021.
Confirmations
None of our Directors is or was a director of any listed company whose shares have been or were suspended from being traded
on any stock exchanges during the term of their directorship in such companies, in the last five years preceding the date of this
Draft Red Herring Prospectus.
None of our Directors is or was a director of any listed company which has been or was delisted from any stock exchanges
during the term of their directorship in such companies.
None of our Directors have been declared as wilful defaulters.
Terms of appointment of our Executive Directors
Ashraf Mohammed Biran, Gulshan Haresh Bakhtiani and Mohan Ganpat Chavan are the Whole -Time Directors of our
Company. Our Board of Directors in its meeting held on June 30, 2021 and our Shareholders in the EGM held on July 9, 2021
approved the appointment of Ashraf Mohammed Biran, Gulshan Haresh Bakhtiani and Mohan Ganpat Chavan as Whole-Time
Directors with effect from July 12, 2021 for a period of three years.
Our Whole-Time Directors are each entitled to an annual remuneration of ₹3.6 million from our Company with effect from July
12, 2021. The remuneration payable to our Whole-Time Directors shall include basic salary and our Company’s contribution
to its provident fund and gratuity fund. The annual basic salary and increments for further years payable to our Whole -Time
Directors will be decided by the Nomination and Remuneration Committee or our Board of Directors, depending on the
performance of our Whole-Time Directors, profitability of our Company and other relevant factors.
184
Payment or benefit to Directors of our Company
Other than as disclosed, our Company has not paid any compensation or granted any benefit to any of our Directors (including
contingent or deferred compensation) in all capacities in Fiscal 2021. For payments made in relation to related party
transactions, please see “Other Financial Information – Related Party Transactions” on page 289. Further, there is no
contingent or deferred compensation payable to any of our Directors which accrued in Fiscal 2021.
Remuneration to our Directors
The remuneration paid to our Directors in Fiscal 2021 is as follows:
Remuneration to Executive Directors
The following table sets forth details of the remuneration paid to the Executive Directors of our Company for Fiscal 2021:
S. No. Name of the Director Remuneration (in ₹ million)
1. Ashraf Mohammed Biran 3.42
2. Gulshan Haresh Bakhtiani 3.42
3. Mohan Ganpat Chavan 3.42
Remuneration to Non-Executive Directors
Our Company has paid no remuneration to our Independent Directors in Fiscal 2021. Our Independent Directors are entitled to
receive sitting fees for attending meetings of our Board of Directors or any of its committees. Pursuant to the resolutions p assed
by our Board of Directors on June 30, 2021 and August 9, 2021, our Independent Directors are entitled to sitting fees of (i)
₹60,000 for attending each meeting of the Board of Directors, (ii) ₹40,000 for attending each meeting of the Audit Committee,
(iii) ₹30,000 for attending each meeting of the Nomination and Remuneration Committee and the Corporate Social
Responsibility Committee and (iv) ₹20,000 for attending each meeting of the Stakeholders’ Relationship Committee and other
meetings. Our Independent Directors are also entitled to professional fees of ₹1.5 million per annum.
Remuneration paid to our Directors by our Subsidiaries
As on the date of this Draft Red Herring Prospectus, none of our Directors are entitled to remuneration from our Subsidiaries.
None of our Directors received any remuneration from our Subsidiaries in Fiscal 2021. Further, there is no contingent or
deferred compensation payable to any of our Directors by our Subsidiaries which accrued in Fiscal 2021.
Bonus or profit sharing plan of our Directors
Our Company does not have any bonus or profit sharing plan for our Directors. For details of the performance bonus payable
to them as a part of their respective remuneration, see “Our Management - Terms of appointment of our Executive Directors”
on page 183.
Shareholding of Directors in our Company
Except as disclosed below, as on the date of this Draft Red Herring Prospectus, none of our Directors hold any Equity Shares:
Name of the Director Number of Equity Shares Held
Ashraf Mohammed Biran 11,226,804
Gulshan Haresh Bakhtiani 10,944,582
Mohan Ganpat Chavan 2,604,738
Our Articles of Association do not require our Directors to hold any qualification shares.
Shareholding of Directors in our Subsidiaries
Except as disclosed below, as on the date of this Draft Red Herring Prospectus, none of our Directors hold any equity shares in
our Subsidiary:
Name of the Director Name of the Subsidiary Number of Equity Shares Held
Gulshan Haresh Bakhtiani* Amore Health Essentials Private Limited 1
Gulshan Haresh Bakhtiani* Wellness Forever HealthTech Private Limited 1
* Holding shares as a nominee of our Company
Interests of Directors
Our Directors may be deemed to be interested to the extent of remuneration and reimbursement of expenses, if any, payable to
them by our Company as well as sitting fees, if any, payable to them for attending meetings of our Board or Committees thereof.
185
For further details, see “ – Terms of Appointment of our Executive Directors”, “ – Payment or benefit to Directors of our
Company”, each on page 184.
Certain of our Directors may also be interested to the extent of Equity Shares, if any (together with dividends and other
distributions in respect of such Equity Shares), held by them or that may be held by the companies, firms and trusts, in whic h
they are interested as directors, members, partners, trustees and promoters. Certain of our Directors may also be regarded as
interested in the Equity Shares held by them or that may pursuant to the Offer, be subscribed by or allotted to them, their
relatives or to the companies, firms and trusts, in which they are also interested as directors, members, partners, trustees and
promoters.
Other than Ashraf Mohammed Biran, Gulshan Haresh Bakhtiani, and Mohan Ganpat Chavan, none of our Directors have an
interest in the promotion or formation of our Company.
No consideration in cash or shares or otherwise has been paid or agreed to be paid to any of our Directors or to the firms or
companies in which they are interested by any person either to induce them to become or to help them qualify as a Director, or
otherwise for services rendered by them or by the firm or company in which they are interested, in connection with the
promotion or formation of our Company.
Our Directors do not have any other interest in our Company or in any transaction by our Company including, for acquisition
of land, construction of buildings or supply of machinery. For details on interest of Ashraf Mohammed Biran, Gulshan Haresh
Bakhtiani, and Mohan Ganpat Chavan, see “Our Promoters and Promoter Group – Interests of Promoters and Common
Pursuits” on page 194.
Changes in our Board of Directors in the last three years
Name Date of Appointment/ Change/
Cessation
Reason
Rajiv Indur Dadlani August 5, 2019 Resigned as Nominee Director
Ashraf Mohammed Biran July 12, 2021 Appointed as a Whole-Time Director
Gulshan Haresh Bakhtiani July 12, 2021 Appointed as a Whole-Time Director
Mohan Ganpat Chavan July 12, 2021 Appointed as a Whole-Time Director
Avani Vishal Davda July 12, 2021 Appointed as an Independent Director
Ranjit Gobindram Shahani July 12, 2021 Appointed as an Independent Director
Kewal Handa September 1, 2021 Appointed as an Independent Director
Borrowing powers of our Board of Directors
Our Board is empowered to borrow money in accordance with Section 179 and Section 180 of the Companies Act and our
Articles of Association.
Corporate Governance
The provisions of the SEBI Listing Regulations with respect to corporate governance will be applicable to us immediately upon
the listing of the Equity Shares with the Stock Exchanges. We are in compliance with the requirements of the applicable
provisions of the SEBI Listing Regulations, and the Companies Act, 2013, in respect of corpora te governance including
constitution of our Board of Directors and committees thereof.
Our Board of Directors has been constituted in compliance with the Companies Act, 2013 and the SEBI Listing Regulations.
Our Board of Directors function either as a full board or through various committees constituted to oversee specific functions.
Currently, our Board of Directors has 6 Directors. In compliance with the requirements of the SEBI Listing Regulations, we
have 3 Executive Directors and 3 Independent Directors, with one woman Independent Director on our Board of Directors.
Committees of our Board of Directors
In addition to the committees of our Board of Directors detailed below, our Board of Directors may, from time to time constitute
committees for various functions.
Audit Committee
The members of the Audit Committee are:
1. Kewal Handa (Chairman);
2. Ranjit Gobindram Shahani (Member); and
3. Gulshan Haresh Bakhtiani (Member).

186
Further, the Company Secretary and Compliance Officer of our Company shall act as secretary to the Audit Committee.
The Audit Committee was constituted by way of resolution passed by our Board of Directors in its meeting held on September
1, 2021. The scope and function of the Audit Committee is in accordance with Section 177 of the Companies Act, 2013 and the
SEBI Listing Regulations and its terms of reference include the following:
1. Oversight of the Company’s financial reporting process and the disclosure of its financial information to ensure that the
financial statement is correct, sufficient and credible;
2. Recommendation for appointment, remuneration and terms of appointment of auditors of the Company;
3. Approval of payment to statutory auditors for any other services rendered by the statutory auditors;
4. Reviewing, with the management, the annual financial statements and auditor's report thereon before submission to the
Board for approval, with particular reference to:
a) Matters required to be included in the director’s responsibility statement to be included in the Board’s report, in
terms of the Companies Act, 2013, as amended;
b) Changes, if any, in accounting policies and practices and reasons for the same;
c) Major accounting entries involving estimates based on the exercise of judgment by management;
d) Significant adjustments made in the financial statements arising out of audit findings;
e) Compliance with listing and other legal requirements relating to financial statements;
f) Disclosure of any related party transactions; and
g) Modified opinion(s) in the draft audit report.
5. Reviewing, with the management, the quarterly financial statements before submission to the Board for approval;
6. Examination of the financial statement and auditor’s report thereon;
7. Monitoring the end use of funds raised through public offers and related matters;
8. Reviewing, with the management, the statement of uses/application of funds raised through an issue (public issue, right s
issue, preferential issue, etc.), the statement of funds utilized for purposes other than those stated in the issue
document/prospectus/notice and report submitted by the monitoring agency monitoring the utilisation of proceeds of a
public or rights issue, and making appropriate recommendations to the Board to take up steps in this matter;
9. Reviewing and monitoring the auditor’s independence and performance, and effectiveness of audit process;
10. Approval or any subsequent modification of transactions of the Company with related parties;
11. Scrutiny of inter-corporate loans and investments;
12. Valuation of undertakings or assets of the Company, wherever it is necessary;
13. Evaluation of internal financial controls and risk management systems;
14. Reviewing, with the management, performance of statutory and internal auditors, adequacy of the internal control
systems;
15. Reviewing the adequacy of internal audit function, if any, including the structure of the internal audit department, staffing
and seniority of the official heading the department, reporting structure coverage and frequency of internal audit;
16. Discussion with internal auditors of any significant findings and follow up thereon;
17. Reviewing the findings of any internal investigations by the internal auditors into matters where there is suspected fraud
or irregularity or a failure of internal control systems of a material nature and reporting the matter to the Board;
18. Discussion with statutory auditors, internal auditors and cost auditors before the au dit commences, about the nature and
scope of audit as well as post-audit discussion to ascertain any area of concern;
19. To look into the reasons for substantial defaults in the payment to the depositors, debenture holders, shareholders (in
case of non-payment of declared dividends) and creditors;

187
20. To review the functioning of the whistle blower mechanism;
21. Approval of appointment of chief financial officer after assessing the qualifications, experience and background, etc. of
the candidate;
22. Carrying out any other function as may be required / mandated by the Board from time to time and/ or mandated as per
the provisions of the SEBI (Listing Obligations and Disclosure Requirements) Regulations, 2015, the Companies Act,
2013, the listing agreements to be entered into between the Company and the respective stock exchanges on which the
equity shares of the Company are proposed to be listed and/or any other applicable laws;
23. Reviewing the utilization of loan and/or advances from investment by the holding company in th e subsidiaries exceeding
₹100 crore or 10% of the asset size of the subsidiaries, whichever is lower including existing loans / advances /
investments; and
24. Considering and commenting on rationale, cost-benefits and impact of schemes involving merger, demerger,
amalgamation etc. of the Company and its shareholders.
The Audit Committee shall mandatorily review the following information:
1. management discussion and analysis of financial condition and results of operations;
2. statement of significant related party transactions (as defined by the Audit Committee), submitted by management;
3. management letters / letters of internal control weaknesses issued by the statutory auditors;
4. internal audit reports relating to internal control weaknesses;
5. the appointment, removal and terms of remuneration of the internal auditor shall be subject to review by the Audit
Committee; and
6. statement of deviations as and when becomes applicable:
a) quarterly statement of deviation(s) submitted to stock exchange(s) in terms of Regulation 3 2(1) of the SEBI (Listing
Obligations and Disclosure Requirements) Regulations, 2015, as amended.
b) annual statement of funds utilized for purposes other than those stated in the offer document/prospectus/notice in
terms of the SEBI (Listing Obligations and Disclosure Requirements) Regulations, 2015, as amended.
Risk Management Committee
The members of the Risk Management Committee are:
1. Gulshan Haresh Bakhtiani (Chairman);
2. Avani Vishal Davda (Member); and
3. Gaurav Shah (Member).
The Risk Management Committee was constituted by way of resolution passed by our Board of Directors in its meeting held
on September 1, 2021. The terms of reference of the Risk Management Committee include the following:
1. To formulate a detailed risk management policy which shall include:
a) A framework for identification of internal and external risks specifically faced by the listed entity, in particular
including financial, operational, sectoral, sustainability (particularly, ESG related risks), information, cyber security
risks or any other risk as may be determined by the Risk Management Committee;
b) Measures for risk mitigation including systems and processes for internal control of identified risks; and
c) Business continuity plan.
2. To ensure that appropriate methodology, processes and systems are in place to monitor and evaluate risks associated
with the business of the Company;
3. To monitor and oversee implementation of the risk management policy, including evaluating the adequacy of risk
management systems;
4. To periodically review the risk management policy, at least once in two years, including by considering the changing

188
industry dynamics and evolving complexity;
5. To keep the board of directors informed about the nature and content of its discussions, recommendations and actions to
be taken; and
6. The appointment, removal and terms of remuneration of the chief risk officer (if any) shall be subject to review by the
Risk Management Committee.
The Risk Management Committee shall coordinate its activities with other committees, in instances where there is any overlap
with activities of such committees, as per the framework laid down by the Board of Directors.
Nomination and Remuneration Committee
The members of the Nomination and Remuneration Committee are:
1. Ranjit Gobindram Shahani (Chairman);
2. Avani Vishal Davda (Member); and
3. Kewal Handa (Member).
The Nomination and Remuneration Committee was constituted by way of resolution passed by our Board of Directors in its
meeting held on September 1, 2021. The scope and function of the Nomination and Remuneration Committee is in accordance
with Section 178 of the Companies Act, 2013 and the SEBI Listing Regulations. The terms of reference of the Nomination and
Remuneration Committee include the following:
1. Formulating the criteria for determining qualifications, positive attributes and independence of a director and recommend
to the Board a policy relating to, the remuneration of the directors, key managerial personnel and other employees;
The Nomination and Remuneration Committee, while formulating the above policy, should ensure that:
a) the level and composition of remuneration be reasonable and suf ficient to attract, retain and motivate directors of
the quality required to run the Company successfully;
b) relationship of remuneration to performance is clear and meets appropriate performance benchmarks; and
c) remuneration to directors, key managerial personnel and senior management involves a balance between fixed
and incentive pay reflecting short and long term performance objectives appropriate to the working of the
Company and its goals;
2. Formulating criteria for evaluation of performance of independent directors and the Board of Directors;
3. Devising a policy on diversity of Board;
4. Identifying persons who are qualified to become directors and who may be appointed in senior management in
accordance with the criteria laid down, and recommend to the Board of Directors their appointment and removal and
shall specify the manner for effective evaluation of performance of the Board, its committees and individual directors to
be carried out either by the Board, by the Nomination and Remuneration Committee or b y an independent external
agency and review its implementation and compliance. The Company shall disclose the remuneration policy and the
evaluation criteria in its board report;
5. Extending or continuing the term of appointment of the independent director, on the basis of the report of performance
evaluation of independent directors;
6. Recommending to the Board, all remuneration, in whatever form, payable to senior management.
7. Administering, monitoring and formulating detailed terms and conditions of the emp loyee stock option plans or schemes
of the Company;
8. Carrying out any other function as may be required/ mandated by the Board from time to time and/ or mandated as per
the provisions of the SEBI (Listing Obligations and Disclosure Requirements) Regulation s, 2015, the Companies Act,
2013, the listing agreements to be entered into between the Company and the respective stock exchanges on which the
equity shares of the Company are proposed to be listed and/or any other applicable laws; and
9. Performing such other functions as may be necessary or appropriate for the performance of its duties.

189
Stakeholders’ Relationship Committee
The members of the Stakeholders’ Relationship Committee are:
1. Kewal Handa (Chairman);
2. Avani Vishal Davda (Member);
3. Ashraf Mohammad Biran (Member) and;
4. Mohan Ganpat Chavan (Member)
The Stakeholders’ Relationship Committee was constituted by way of resolution passed by our Board of Directors in its meeting
held on September 1, 2021. The scope and functions of the Stakeholder Relationship Committee is in accordance with Section
178 of the Companies Act, 2013 and the SEBI Listing Regulations.
The terms of reference of the Stakeholders’ Relationship Committee include the following:
1. To resolve the grievances of the security holders of the Company including complaints related to transfer/transmission
of shares, non-receipt of annual report, non-receipt of declared dividends, issue of new/duplicate certificates, general
meetings etc. and assisting with quarterly reporting of such complaints;
2. To review measures taken for effective exercise of voting rights by shareholders;
3. To review adherence to the service standards adopted by the Company in respect of various services being rendered by
the Registrar & Share Transfer Agent;
4. To review the various measures and initiatives taken by the Company for reducing the quantum of unclaimed dividends
and ensuring timely receipt of dividend warrants/annual reports/statutory notices by the shareholders of the Company;
and
5. Carrying out such other functions as may be specified by the Board from time to time or specified/provided under the
Companies Act, 2013 or the SEBI (Listing Obligations and Disclosure Requirements) Regulations, 2015, each as
amended or by any other regulatory authority.
Corporate Social Responsibility Committee
The members of the Corporate Social Responsibility Committee are:
1. Avani Vishal Davda (Chairperson);
2. Mohan Ganpat Chavan (Member); and
3. Gulshan Haresh Bakhtiani (Member).
The Corporate Social Responsibility Committee was constituted by way of resolution passed by our Board of Directors in its
meeting held on July 17, 2015 and last reconstituted pursuant to resolution passed by our Board in its meeting held on September
1, 2021. The scope and functions of the Corporate Social Responsibility Committee is in accordance with Section 135 of the
Companies Act, 2013.
The terms and reference of the Corporate Social Responsibility Committee include the following:
1. Formulation of a corporate social responsibility policy to the Board, indicating the activities to be undertaken by the
Company in areas or subjects specified in the Companies Act, 2013. The activities should be within the list of permitted
activities specified in the Companies Act, 2013 and the rules thereunder;
2. Recommending the amount of expenditure to be incurred, amount to be at least 2% of the ave rage net profit of the
Company in the three immediately preceding financial years or where the Company has not completed the period of
three financial years since its incorporation, during such immediately preceding financial years;
3. Instituting a transparent monitoring mechanism for implementation of the corporate social responsibility projects or
programs or activities undertaken by the Company;
4. Monitoring the corporate social responsibility policy from time to time and issuing necessary directions as req uired for
proper implementation and timely completion of corporate social responsibility programmes;
5. Identifying corporate social responsibility policy partners and corporate social responsibility policy programmes;

190
6. Identifying and appointing the corporate social responsibility team of the Company including corporate social
responsibility manager, wherever required; and
7. Performing such other duties and functions as the Board may require the Corporate Social Responsibility Committee to
undertake to promote the corporate social responsibility activities of the Company or as may be required under applicable
laws.

191
Management Organisation Chart

192
Key Managerial Personnel
For details in relation to the biographies of our Executive Directors, see “ – Brief biographies of Directors” on page 183.
The details of the Key Managerial Personnel of our Company are as follows:
Gaurav Shah is the Chief Financial Officer and Vice President – Finance & Legal of our Company. He holds a bachelor’s
degree in commerce from the University of Mumbai and is a certified chartered accountant from the Institute of Chartered
Accountants of India. He joined our Company with effect from December 1, 2017. He has experience in the field of finance.
Previously, he worked at Tata Starbucks Limited as finance manager and at MXC Solutions India Private Limited (now
CarTrade Tech Limited) as vice president. During Financial Year 2021, he received a remuneration of ₹ 13.30 million (including
a compensation in relation to employee stock option plan of ₹ 9.23 million).
Arindam Dutta is the Vice President – Digital & IT of our Company. He holds a bachelor’s degree in science from Jadavpur
University, a master’s degree in business administration from Fordham University and a master’s degree in computer
application from Jadavpur University. He joined our Company with effect from February 1, 2020. He has previously worked
at Tata Consultancy Services Limited as associate vice president and at Gartner India Research and Advisory Services Private
Limited as an executive partner. During Financial Year 2021, he received a remuneration of ₹ 4.17 million.
Pankaj Kumar is the Vice President - Operations of our Company. He holds a bachelor’s degree in science from the University
of Delhi and a post graduate diploma in business administration from the Symbiosis Centre for Distance Learning. He joined
our Company with effect from September 15, 2016. He has experience in sales and operations. Previously, he worked at Golden
India Expotrade Private Limited as assistant general manager of operations and at Savemax Wholesale Club Private Limited as
general manager of operations. During Financial Year 2021, he received a remuneration of ₹ 13.13 million million (including
a compensation in relation to employee stock option plan of ₹ 9.23 million).
Nidhi Vora is the Company Secretary of our Company. She passed the examination for the bachelor’s degree in commerce
from the University of Mumbai and has also passed the professional programme examination held by the Institute of Company
Secretaries of India. She joined our Company with effect from January 15, 2018. Previously, she worked at KGK Creations
Processing Priva te Limited as company secretary. During Financial Year 2021, she received a remuneration of ₹ 0.59 million.
Status of Key Managerial Personnel
All our Key Managerial Personnel are permanent employees of our Company. The attrition rate of our Company is not high as
compared to the industry.
Shareholding of Key Managerial Personnel
Except as set out below, none of our Key Managerial Personnel hold any Equity Shares in our Company:
Name of the Key Managerial Personnel Number of Equity Shares Held
Ashraf Mohammed Biran 11,226,804
Gulshan Haresh Bakhtiani 10,944,582
Mohan Ganpat Chavan 2,604,738
Gaurav Shah 40,776
Pankaj Kumar 35,736
Bonus or Profit-Sharing Plans of the Key Managerial Personnel
Our Company does not have any bonus or profit-sharing plan for our Key Managerial Personnel.
Interests of Key Managerial Personnel
Except as disclosed at “ – Interests of Directors” on page 184, none of our Key Managerial Personnel have any interest in our
Company other than to the extent of the remuneration or benefits to which they are entitled to as per their terms of appointm ent
and reimbursement of expenses incurred by them during the ordinary course of business.
Changes in the Key Managerial Personnel
The changes in Key Managerial Personnel (other than change in our Directors) in the last three years is as follows:
Name Designation Date of change Reason for change
Arindam Dutta Vice President – Digital & IT February 1, 2020 Appointed as Vice President – Digital & IT
Gaurav Shah Chief Financial Officer July 1, 2021 Appointed as Chief Financial
Officer in terms of Companies
Act

193
For details of change in the Directors of our Company, see “- Changes in our Board of Directors in the last three years” on
page 185.
Arrangements or understandings with major shareholders, customers, suppliers or others
None of our Key Managerial Personnel have been appointed pursuant to any arrangement or understanding with major
shareholders, customers, suppliers or others.
Service Contracts with Directors and Key Managerial Personnel
Other than the statutory benefits that the KMPs are entitled to, upon their retirement, Directors and the Key Managerial
Personnel of our Company have not entered into any service contracts pursuant to which they are entitled to any benefits upon
termination of employment or retirement.
Contingent and deferred compensation payable to our Key Managerial Personnel
Other than as disclosed in “– Key Managerial Personnel” and “ - Remuneration to our Directors” beginning on pages 192 and
184, respectively, our Company has not paid any compensation or granted any benefit to any of our Key Managerial Personnel
(including contingent or deferred compensation) in all capacities in Fiscal 2021. Further, there is no contingent or deferred
compensation payable to any of our Key Managerial Personnel which accrued in Fiscal 2021.
Payment or benefit to Key Managerial Personnel
Except as disclosed in this section, no non-salary amount or benefit has been paid or given to any of our officers, including Key
Managerial Personnel within the two preceding years or is intended to be paid or given, as on the date of this Draft Red Herring
Prospectus.
Employees Stock Options
For details of our employee stock options, see “Capital Structure – Employee Stock Option Scheme” beginning on page 82.

194
OUR PROMOTERS AND PROMOTER GROUP
Our Promoters are Ashraf Mohammed Biran, Gulshan Haresh Bakhtiani and Mohan Ganpat Chavan . As on the date of this
Draft Red Herring Prospectus, our Promoters, in aggregate, hold 24,776,124 Equity Shares in our Company, representing
48.81% of the issued, subscribed and paid-up Equity Share capital of our Company. For further details, see “Capital Structure
- Details of shareholding of our Promoters and members of the Promoter Group in our Company”, on page 76.
Details of our Promoters
Ashraf Mohammed Biran
Ashraf Mohammed Biran, aged 58 years, is our Promoter and is also the Executive Director
on our Board. For a complete profile of Ashraf Mohammed Biran, i.e., his date of birth,
residential address, educational qualifications, professional experience, posit ions/ posts held
in the past and other directorships, special achievements, business and other activities, see
“Our Management”, beginning on page 181.
His driving license number is MH01 20110014083. His PAN is ABPPB9259G and his
Aadhar Card number is 801986678974.
Gulshan Haresh Bakhtiani
Gulshan Haresh Bakhtiani, aged 56 years, is our Promoter and is also the Executive Director
on our Board. For a complete profile of Gulshan Haresh Bakhtiani, i.e., his date of birth,
residential address, educational qualifications, professional experience, positions/ posts held
in the past and other directorships, special achievements, business and other activities, see
“Our Management”, beginning on page 181.
His driving license number is MH01 20090001392. His PAN is ACUPB4663J and his
Aadhar Card number is 364626252039.
Mohan Ganpat Chavan
Mohan Ganpat Chavan, aged 52 years, is our Promoter and is also the Executive Director on
our Board For a complete profile of Mohan Ganpat Chavan, i.e., his date of birth, residential
address, educational qualifications, professional experience, positions/ posts held in the past
and other directorships, special achievements, business and other activities, see “Our
Management”, beginning on page 181.
His driving license number is MH01 20090131237. His PAN is ACVPC6862B and his
Aadhar Card number is 551953097818.
Our Company confirms that the PAN, bank account number and passport number of our Promoters will be submitted to the
Stock Exchanges, at the time of filing of this Draft Red Herring Prospectus with them.
Interests of Promoters and Common Pursuits
Our Promoters are interested in our Company to the extent that they have promoted our Company and to the extent of their
shareholding in our Company, directly and indirectly, the dividend payable, if any, and any other distributions in respect of the
Equity Shares held by them in our Company, from time to time. For details of the shareholding of our Promoters in our
Company, see “Capital Structure”, beginning on page 69.
Our Promoters, who are also Directors, may be deemed to be interested to the extent of their remuneration/ fees and
reimbursement of expenses, payable to them, if any. For further details, see “Our Management – Payment or benefit to Directors
of our Company – Remuneration to Executive Directors” on page 184.
Our Promoters have no interest in any property acquired by our Company during the three years immediately preceding the
date of this Draft Red Herring Prospectus or proposed to be acquired by our Company, or in any transaction by our Company
for acquisition of land, construction of building or supply of machinery.

195
No sum has been paid or agreed to be paid to any of our Promoters or to the firms or companies in which our Promoters are
interested as members in cash or shares or otherwise by any person, either to induce them to become or to qualify them, as
directors or promoters or otherwise for services rendered by our Promoters or by such firms or companies in connection with
the promotion or formation of our Company.
Except in the ordinary course of business and as disclosed in “Other Financial Information - Related Party Transactions” and
“Restated Consolidated Financial Information – Related party disclosures” on pages 289 and 271, respectively, no amount or
benefit has been paid or given to our Promoters or any of the members of the Promoter Group during the two years preceding
the filing of this Draft Red Herring Prospectus nor is there any intention to pay or give any amount or benefit to our Promoters
or any of the members of the Promoter Group other than in the ordinary course of business.
Except for (i) Ashraf Mohammed Biran, who is associated with Rakhangi General Store and New Rakhangi General Store as a
partner and with Pundol Medical NX and New Pundol Medical as a proprietor; and (ii) Gulshan Haresh Bakhtiani, who is
associated with The Parel Chemist as a partner, our Promoters do not have any interest in any venture that is involved in any
activities similar to those conducted by our Company. Our Company will adopt the necessary procedures and practices as
permitted by law to address any conflict situation as and when it arises.
Material guarantees given by our Promoters to third parties with respect to Equity Shares of our Company
Our Promoters have not given any material guarantee to any third party with respect to the Equity Shares as on the date of this
Draft Red Herring Prospectus.
For details in relation to the guarantees given by our Promoters, see “History and certain Corporate Matters – Details of
guarantees given to third parties by the Promoter Selling Shareholders” on page 180.
Companies and firms with which our Promoters have disassociated in the last three years
Except as stated below, our Promoters have not disa ssociated themselves from any companies or firms during the three
immediately preceding years.
S.
No.
Name of disassociated
entity
Promoter who has
disassociated
Reasons and circumstances leading to the
disassociation and terms of disassociation
Date of
disassociation
1. Progress Mines and
Minerals Private
Limited
Ashraf Mohammed
Biran
The entity has been struck off April 10, 2019
2. Shreeji Distributors
Pharma Private Limited
Mohan Ganpat
Chavan
The Promoter sold off his entire shareholding, and ceased
to be a promoter and director of the company and wished
to focus on other ventures.
February 22,
2021
Confirmations
Our Promoters and members of our Promoter Group have not been declared wilful defaulters b y any bank or financial institution
or consortium thereof, in accordance with the guidelines on wilful defaulters issued by Reserve Bank of India.
Our Promoters and members of our Promoter Group have not been prohibited from accessing or operating in capital markets
under any order or direction passed by SEBI or any other regulatory or governmental authority.
Our Promoters are not and have never been promoters, directors or person in control of any other company which is prohibited
from accessing or opera ting in capital markets under any order or direction passed by SEBI or any other regulatory or
governmental authority.
Change in the control of our Company
There has not been any change in the control of our Company during the last five years preceding the date of this Draft Red
Herring Prospectus.
Promoter Group
The following individuals and entities constitute our Promoter Group in terms of Regulation 2(1)(pp) of the SEBI ICDR
Regulations.
Natural persons who are part of our Promoter Group
The following table sets forth details of the natural persons who are part of our Promoter Group (due to their relationship with
our Promoters):

196
Member of the Promoter Group Relationship
Ashraf Mohammed Biran
Fouzia Biran Spouse
Parveen Kazi Sister
Shaheen Biran Sister
Yasmin Malhotra Sister
Arsh Biran Son
Insha Biran Daughter
Hassanmia Shaikh Spouse’s father
Maleka Khatoon Shaikh Spouse’s mother
Gazala Khan Spouse’s sister
Nazhat Shaikh Spouse’s sister
Sumaira Ansari Spouse’s sister
Gulshan Haresh Bakhtiani
Anita Bakhtiani Spouse
Chanda Vaz Sister
Prateek Bakhtiani Son
Shiven Bakhtiani Son
Mohanlal Jawrani Spouse’s father
Tulsidas Jawrani Spouse’s brother
Jagdish Jawrani Spouse’s brother
Aarti Motwani Spouse’s sister
Mohan Ganpat Chavan
Kanchan Chavan Spouse
Pushpanjali Thorat Sister
Raghunath Chavan Brother
Shamrao Chavan Brother
Vasant Chavan Brother
Chaitali Chavan Daughter
Nutan Chavan Daughter
Madhukar Veer Spouse’s father
Nirmala Veer Spouse’s mother
Kishore Veer Spouse’s brother
Entities forming part of our Promoter Group
1. IPC Healthcare Private Limited;
2. Jimme Foundation for Equality;
3. Lilac Insights Private Limited;
4. M/s. Rahul Pharma;
5. Noble Stones & Marbles Private Limited
6. Pinnacle Biomed Private Limited;
7. Rahul Distributors Private Limited;
8. The Parel Chemist;
9. Volcano Enterprises Private Limited; and
10. ZJ Biosys Private Limited.

197
OUR GROUP COMPANIES
In terms of the SEBI ICDR Regulations ‘group companies’ of our Company shall include (i) the companies (other than our
Subsidiary) with which there were related party transactions, in accordance with Ind AS 24, as disclosed in the Restated
Consolidated Financial Information; and (ii) such other companies as considered material by the Board pursuant to the
materiality policy.
With respect to (ii) above, our Board in its meeting held on September 27, 2021, has considered that such companies that are a
part of the promoter group (as defined in the SEBI ICDR Regulations) with which there were transactions in the most recent
financial year to be included in the offer documents (“Test Period”), which individually or in the aggregate, exceed 10% of the
total resta ted consolidated revenue of the Company for the Test Period, shall also be classified as Group Companies .
Accordingly, based on the parameters outlined above, as on the date of this Draft Red Herring Prospectus, our Company has
the following Group Companies.
1. Rahul Distributors Private Limited
2. Pinnacle Biomed Private Limited
3. Shreeji Distributors Pharma Private Limited
4. IPC Healthcare Private Limited
In accordance with the SEBI ICDR Regulations, certain financial information in relation to our Group C ompanies for the
previous three financial years, extracted from their respective audited financial statements (as applicable) are available at the
respective websites indicated below.
Our Company is providing links to such websites solely to comply with the requirements specified under the SEBI ICDR
Regulations.
None of our Company, the BRLMs or any of the Company’s or the BRLMs’ respective directors, employees, affiliates,
associates, advisors, agents or representatives have verified the information available on the websites indicated below.
Details of our Group Companies
The details of our Group Companies are provided below:
1. Shreeji Distributors Pharma Private Limited (“SDPPL”)
Registered Office
The registered office of SDPPL is situated at C-32, Royal Industrial Estate Co Operative Soc. Ltd 5B, Naigaon Cross Road,
Wadala (W), Mumbai - 400031.
Financial information
The financial information derived from the audited financial statements of SDPPL for Fiscals 2020, 2019 and 2018, as
required by the SEBI ICDR Regulations, are available on http://shreejidistributors.in/downloads/Certificate-from-Group-
Companies-Shreeji-Distributors.pdf.
2. Pinnacle Biomed Private Limited (“PBPL”)
Registered Office
The registered office of PBPL is situated at 312, Floor-3, Plot-8, Wadala Udyog Bhavan, Sewree Wadala Road No. 26,
Wadala Mumbai - 400 031.
Financial information
The financial information derived from the audited financial statements of PBPL for Fiscals 2020, 2019 and 2018, as
required by the SEBI ICDR Regulations, are available on http://www.pinnaclebiomed.com/Financial-Upload.pdf.

198
3. IPC Healthcare Private Limited (“IHPL”)
Registered Office
The registered office of IHPL is situated at A-10, Royal Industrial Estate 5B Naigaon Cross Road, Wadala West, Mumbai
– 400021.
Financial information
The financial information derived from the audited financial statements of IHPL for Fiscals 2020, 2019 and 2018, as
required by the SEBI ICDR Regulations, are available on http://www.ipchealthcare.in/downloads/Certificate-from-Group-
Companies-IPC-Healthcare.pdf.
4. Rahul Distributors Private Limited ("RDPL”)
Registered Office
The registered office of RDPL is situated at A-10/11, Royal Industrial Estate, 5B, Naigaon Cross Road, Wadala (W)
Mumbai – 400 031.
Financial information
The financial information derived from the audited financial statements of RDPL for Fiscals 2020, 2019 and 2018, as
required by the SEBI ICDR Regulations, are available on http://rahuldistributors.com/downloads/Certificate-from-Group-
Companies-Rahul-Distributors.pdf.
Nature and extent of interest of Group Companies
In the promotion of our Company
None of our Group Companies have any interest in the promotion of our Company.
In the properties acquired by our Company in the past three years before filing this Draft Red Herring Prospectus or
proposed to be acquired by our Company
None of our Group Companies are interested in the properties acquired by our Company in the three years preceding the filing
of this Draft Red Herring Prospectus or proposed to be acquired by our Company.
In transactions for acquisition of land, construction of building and supply of machinery, etc.
None of our Group Companies are interested in any transactions for acquisition of land, construction of building or supply of
machinery, etc.
Common pursuits among the Group Companies and our Company
Except for IHPL which is involved in selling surgical products at competitive prices as our Compa ny, there are no common
pursuits amongst our Group Companies and our Company.
Related Business Transactions within our Group Companies and significance on the financial performance of our
Company
Except as disclosed in “Summary of Related Party Transactions” on page 15, there are no related business transactions with the
Group Companies.
Litigation
As on the date of this Draft Red Herring Prospectus, there is no pending litigation involving our Group Companies which will
have a material impact on our Company.
Business interest of Group Companies
Except in the ordinary course of business and as stated in “Summary of Related Party Transactions” on page 15, none of our
Group Companies have any business interest in our Company.

199
Confirmations
None of our Group Companies have any securities listed on a stock exchange. Further, neither of our Group Companies has
made any public or rights issue (as defined under the SEBI ICDR Regulations) of securities in the three years preceding the
date of this Draft Red Herring Prospectus.

200
DIVIDEND POLICY
The declaration and payment of dividends on our Equity Shares, if any, will be recommended by the Board and approved by
our Shareholders, at their discretion, subject to the provisions of the AoA and other applicable law, including the Companies
Act.
The dividend policy of our Company was adopted and approved by our Board in their meeting held on September 1, 2021
(“Dividend Policy”).
There is no guarantee that any dividends will be declared or paid or that the amount thereof will not decrease in the future. For
details of risks in relation to our capability to pay dividend, see “Risk Factors – Our ability to pay dividends in the future will
depend on our earnings, financial condition, working capital requirements, capital expenditures and restrictive covenants of
our financing arrangements.”, on page 44.
The dividend, if any, will depend on a number of factors, such as:
Internal factors: Liquidity position including present and expected obligations, profits, present and future capital expenditure
plans, financial commitments with respect to outstanding borrowings, business expansion or diversification requirements, past
dividend trends, cost of borrowings and any other corporate actions.
External factors: State of the economy and capital markets, applicable taxes including dividend distribution tax and changes
in regulatory requirements
In addition, our ability to pay dividends may be impacted by a number of other factors, including restrictive covenants under
our financing arrangements which our Company has availed or which it may enter into to finance our fund requirements for
our business activities. For details, see “Financial Indebtedness”, beginning on page 290.
Equity Shares and CCPS
The details of dividend paid on equity shares and preference shares paid by our Company in the last three Fiscals and the current
Financial Year is set out in the following table:
Equity Shares
Particulars From March 31,
2021 till the date of
this Draft Red Herring Prospectus
Financial Year ended
March 31, 2021 March 31, 2020 March 31, 2019
Face value of Equity
Share (in ₹)
2 10 10 10
Number of Equity
Shares
5,07,55,716 48,09,453 47,86,941 47,86,941
Dividend per Equity
Share
- - 0.50 0.40
Dividend paid on Equity
Shares (in ₹ million)
- - 2.39 1.91
Rate of Dividend on
Equity Shares (%)
- - 5.00% 4.00%
Dividend Distribution
tax (in ₹ million)
- - 0.51 0.41
Dividend Distribution tax (%)
- - 21.17% 21.17%
Mode of payment of
dividend
- - NEFT/RTGS NEFT/RTGS
Class A equity shares
Particulars From March 31,
2021 till the date of this Draft Red
Herring Prospectus
Financial Year ended
March 31, 2021 March 31, 2020 March 31, 2019
Face value of Class A Equity Share (in ₹)
- 10 10 10
Number of Class A
Equity Shares
- 7,10,000 7,10,000 7,10,000
Dividend per Class A
Equity Share
- - 0.50 0.40
Dividend paid on Class - - 0.36 0.28

201
Particulars From March 31,
2021 till the date of this Draft Red
Herring Prospectus
Financial Year ended
March 31, 2021 March 31, 2020 March 31, 2019
A Equity Shares (in ₹ million)
Rate of Dividend on
Class A Equity Shares
(%)
- - 5.00% 4.00%
Dividend Distribution
tax (in ₹ million)
- - 0.08 0.06
Dividend Distribution
tax (%)
- - 21.17% 21.17%
Mode of payment of dividend
- NEFT/RTGS NEFT/RTGS
Class A1 equity shares
Particulars From March 31,
2021 till the date of
this Draft Red
Herring Prospectus
Financial Year ended
March 31, 2021 March 31, 2020 March 31, 2019
Face value of Class A1
Equity Share (in ₹)
- 10 10 10
Number of Class A1 Equity Shares
- 2,11,046 2,11,046 2,11,046
Dividend per Class A1
Equity Share
- - 0.50 0.40
Dividend paid on Class
A1 Equity Shares (in ₹
million)
- - 0.11 0.08
Rate of Dividend on
Class A1 Equity Shares
(%)
- - 5.00% 4.00%
Dividend Distribution
tax (in ₹ million)
- - 0.02 0.02
Dividend Distribution
tax (%)
- - 21.17% 21.17%
Mode of payment of
dividend
- - NEFT/RTGS NEFT/RTGS
Class A2 equity shares
Particulars From March 31, 2021 till the date of
this Draft Red
Herring Prospectus
Financial Year ended
March 31, 2021 March 31, 2020 March 31, 2019
Face value of Class A2 Equity Share (in ₹)
- 10 10 -
Number of Class A2
Equity Shares
- 4,61,410 4,61,410 -
Dividend per Class A2
Equity Share
- - 0.50 -
Dividend paid on Class
A2 Equity Shares (in ₹
million)
- - 0.21 -
Rate of Dividend on
Class A2 Equity Shares
(%)
- - 5.00% -
Dividend Distribution
tax (in ₹ million)
- - 0.04 -
Dividend Distribution
tax (%)
- - 21.17% -
Mode of payment of
dividend
- NEFT/RTGS -
Series A CCPS
202
Particulars From March 31,
2021 till the date of this Draft Red
Herring Prospectus
Financial Year ended
March 31, 2021 March 31, 2020 March 31, 2019
Face value of Series A CCPS (in ₹)
- 10 10 10
Number of Series A
CCPS
- 7,57,637 7,57,637 7,57,637
Dividend per Series A
CCPS
- - 0.50 0.40
Dividend paid on Series
A CCPS (in ₹ million)
- - 0.38 0.30
Rate of Dividend on
Series A CCPS (%)
- - 5.00% 4.00%
Dividend Distribution
tax (in ₹ million)
- - 0.08 0.06
Dividend Distribution
tax (%)
- - 21.17% 21.17%
Mode of payment of dividend
- - NEFT/RTGS NEFT/RTGS
Series A1 CCPS
Particulars From March 31,
2021 till the date of
this Draft Red
Herring Prospectus
Financial Year ended
March 31, 2021 March 31, 2020 March 31, 2019
Face value of Series A1
CCPS (in ₹)
- 10 10 10
Number of Series A1 CCPS
- 6,58,353 6,58,353 6,58,353
Dividend per Series A1
CCPS
- - 0.50 0.40
Dividend paid on Series
A1 CCPS (in ₹ million)
- - 0.33 0.26
Rate of Dividend on
Series A1 CCPS (%)
- - 5.00% 4.00%
Dividend Distribution tax (in ₹ million)
- - 0.07 0.06
Dividend Distribution
tax (%)
- - 21.17% 21.17%
Mode of payment of
dividend
- NEFT/RTGS NEFT/RTGS
Series A2 CCPS
Particulars From March 31,
2021 till the date of
this Draft Red Herring Prospectus
Financial Year ended
March 31, 2021 March 31, 2020 March 31, 2019
Face value of Series A2
CCPS (in ₹)
- 10 10 10
Number of Series A2
CCPS
- 1,38,954 1,38,954 1,38,954
Dividend per Series A2
CCPS
- - 0.50 0.40
Dividend paid on Series
A2 CCPS (in ₹ million)
- - 0.07 0.06
Rate of Dividend on
Series A2 CCPS (%)
- - 5.00% 4.00%
Dividend Distribution
tax (in ₹ million)
- - 0.01 0.01
Dividend Distribution tax (%)
- - 21.17% 21.17%
Mode of payment of
dividend
- - NEFT/RTGS NEFT/RTGS

203
Other than the dividends paid as set out above, no dividend was paid on the other classes of equity shares or CCPS in the Fis cals
2019, 2020 and 2021 and the period until the date of this Draft Red Herring Prospectus.
The amounts paid as dividends in the past are not necessarily indicative of our dividend policy or dividend amounts, if any, in
the future. For details in relation to the risk involved, see “Risk Factors - Our ability to pay dividends in the future will depend
on our earnings, financial condition, working capital requirements, capital expenditures and restrictive covenants of our
financing arrangements” on page 44.

204
SECTION V: FINANCIAL INFORMATION
RESTATED CONSOLIDATED FINANCIAL INFORMATION
(The remainder of this page is intentionally left blank)

DeloitteHaskins & Sells LLP
Chartered AccountantsOne International CenterTower 3, 27th -32nd Floor
Senapati Bapat MargElphinstone Road (West)
Mumbai – 400 013Maharashtra, India
Tele: + 91 22 6185 4000Fax: +91 22 6185 4001
Regd. Office. One International Center, Tower 3, 27th -32nd Floor, Senapati Bapat Marg, Elphinstone Road (West), Mumbai – 400 013, Maharashtra,India.(LLP Identification No. AAB-8737)
INDEPENDENT AUDITOR’S EXAMINATION REPORT ON RESTATEDCONSOLIDATED FINANCIAL INFORMATION
The Board of DirectorsWellness Forever Medicare Limited(formerly known as Wellness Forever Medicare Private Limited)
Dear Sirs,
1. We have examined (as appropriate, refer paragraph 5 below) the attached RestatedConsolidated Financial Information of Wellness Forever Medicare Limited (formerlyknown as Wellness Forever Medicare Private Limited) (the “Company” or the “Issuer”)and its subsidiary (the Company and its subsidiary together referred to as the“Group"), comprising the Restated Consolidated Statement of Assets and Liabilities asat March 31, 2021, 2020 and 2019, the Restated Consolidated Statements of Profitand Loss (including other comprehensive income), the Restated ConsolidatedStatement of Cash Flows, the Restated Consolidated Statement of Changes in Equityfor the years ended March 31, 2021, 2020 and 2019, the Summary of SignificantAccounting Policies, and other explanatory information (collectively, the “RestatedConsolidated Financial Information”), as approved by the Board of Directors of theCompany at their meeting held on September 27, 2021 for the purpose of inclusion inthe Draft Red Herring Prospectus (“DRHP”) prepared by the Company in connectionwith its proposed Initial Public Offer of equity shares (“IPO”) prepared in terms of therequirements of:
a) Section 26 of Part I of Chapter III of the Companies Act, 2013 (the “Act");
b) The Securities and Exchange Board of India (Issue of Capital and DisclosureRequirements) Regulations, 2018, as amended ("ICDR Regulations"); and
c) The Guidance Note on Reports in Company Prospectuses (Revised 2019) issued bythe Institute of Chartered Accountants of India (“ICAI”), as amended from time totime (the “Guidance Note”).
2. The Company’s Board of Directors is responsible for the preparation of the RestatedConsolidated Financial Information for the purpose of inclusion in the DRHP to be filedwith Securities and Exchange Board of India, relevant stock exchanges and Registrarof Companies, Maharashtra, Mumbai in connection with the proposed IPO. TheRestated Consolidated Financial Information have been prepared by the managementof the Company on the basis of preparation stated in note 2(a) to the RestatedConsolidated Financial Information. The respective Board of Directors of the companiesincluded in the Group responsibility includes designing, implementing and maintainingadequate internal control relevant to the preparation and presentation of the RestatedConsolidated Financial Information. The respective Board of Directors are alsoresponsible for identifying and ensuring that the Group complies with the Act, ICDRRegulations and the Guidance Note.
205

DeloitteHaskins & Sells LLP
3. We have examined such Restated Consolidated Financial Information taking intoconsideration:
a) The terms of reference and terms of our engagement agreed upon with you inaccordance with our engagement letter dated June 21, 2021 in connection with theproposed IPO of equity shares of the Issuer;
b) The Guidance Note. The Guidance Note also requires that we comply with theethical requirements of the Code of Ethics issued by the ICAI;
c) Concepts of test checks and materiality to obtain reasonable assurance based onverification of evidence supporting the Restated Consolidated FinancialInformation; and
d) The requirements of Section 26 of the Act and the ICDR Regulations.
Our work was performed solely to assist you in meeting your responsibilities in relation toyour compliance with the Act, the ICDR Regulations and the Guidance Note in connectionwith the IPO.
4. These Restated Consolidated Financial Information have been compiled by themanagement from:
a) Audited Consolidated Ind AS financial statements of the Group as at and for theyear ended March 31, 2021, prepared in accordance with the Indian AccountingStandards (referred to as “Ind AS”) as prescribed under Section 133 of the Actread with Companies (Indian Accounting Standards) Rules 2015, as amended, andother accounting principles generally accepted in India, which have been approvedby the Board of Directors at their meeting held on September 24, 2021. Thecomparative information for the year ended March 31, 2020 included in suchfinancial statements have been prepared by making Ind AS adjustments to theaudited consolidated financial statements of the Company as at and for the yearended March 31, 2020, prepared in accordance with the accounting standardsnotified under the section 133 of the Act (“Indian GAAP”) which was approved bythe Board of directors at their meeting held on September 24, 2021.
b) The Restated Consolidated Financial Information also contains the proformaconsolidated Ind AS financial information as at and for the year ended March 31,2019. The proforma consolidated Ind AS financial information have been preparedby making Ind AS adjustments to the audited Indian GAAP financial statements asat and for the year ended March 31, 2019 which have been approved by the Boardof Directors at their meeting held on September 27, 2021 as described in Note2(a) to the Restated Consolidated Financial Information.
5. For the purpose of our examination, we have relied on:
a) Auditors’ reports issued by us dated September 24, 2021 on the consolidated IndAS financial statements of the Group as at and for the year ended March 31, 2021as referred in Paragraph [4] above.
b) Auditors’ Report issued by the Previous Auditors dated December 4, 2020 andSeptember 17, 2019 on the consolidated Indian GAAP financial statements of theGroup as at and for the years ended March 31, 2020 and 2019, respectively, asreferred in Paragraph [4] above.
206

DeloitteHaskins & Sells LLP
The audits for the financial years ended March 31, 2020 and 2019 were conductedby the Company’s immediate previous auditor and first previous auditor,respectively, (collectively, the “Previous Auditors”), and accordingly reliance hasbeen placed on the restated consolidated statement of assets and liabilities and therestated consolidated statements of profit and loss (including other comprehensiveincome), statements of cash flows and statement of changes in equity, theSummary Statement of Significant Accounting Policies, and other explanatoryinformation and (collectively, the “Special Purpose Restated Consolidated FinancialInformation”) examined by Immediate Previous Auditors for the said years. Theexamination report included for the said years is based solely on the reportsubmitted by the Immediate Previous Auditor. They have also confirmed that the2020 and 2019 Restated Consolidated Financial Information:
i. have been prepared after incorporating adjustments for the changes inaccounting policies, material errors and regrouping/reclassificationsretrospectively in the financial year ended March 31, 2020 to reflect the sameaccounting treatment as per the accounting policies and grouping/classificationsfollowed as at and for the year ended March 31, 2021;
ii. have been prepared after incorporating proforma Ind AS adjustments to theaudited Indian GAAP financial statements as at and for the year ended March31, 2019 as described in Note 2(a) to the Special Purpose RestatedConsolidated Financial Information;
iii. do not require any adjustment for modification as there is no modification inthe underlying audit reports.
The auditor’s report on the audited financial statements as at and for the yearended March 31, 2020 includes emphasis of matter and other matterparagraphs, as follows, which does not require any corrective adjustment to theSpecial Purpose Restated Consolidated Financial Information:
Emphasis of matter:“Attention is drawn to Note No. 2 of the Financial Statements regardingmanagement’s current assessment of Company’s assets and liabilities in viewof prevailing Covid-19 pandemic and nationwide lockdown and conclusion basedon such assessment that the carrying value of the assets are recoverable andno uncertainty exists on meeting the liabilities in the foreseeable future.
Our report is not modified in respect of this matter”
Other matter:“Further to the continuous spreading of Covid-19 across India, the IndianGovernment announced a strict 21-day lockdown on March 24, 2020, whichwas further extended till June 30, 2020, across India to contain the spread ofthe virus. This has resulted in restrictions on a physical visit to the clientlocations and the need for carrying out alternative audit procedures as per theStandards of Auditing prescribed by the Institute of Chartered Accountants ofIndia (ICAI).
As a result of the above, the entire audit was carried out based on remoteaccess of the data as provided by the management. This has been carried outbased on the advisory on “Specific Considerations while conducting DistanceAudit / Remote Audit / Online Audit under current Covid-19 situation” issued bythe Auditing and Assurance Standards Board of ICAI. We have been representedby the management that the data provided for our audit purposes is correct,complete, reliable and are directly generated by the accounting system of theCompany without any further manual modifications.
207
DeloitteHaskins & Sells LLP
We bring to the attention of the users that the audit of the ConsolidatedFinancial Statements has been performed in the aforesaid conditions.
Our audit opinion is not modified in respect of the above.”
iv. have been prepared in accordance with the Act, ICDR Regulations and theGuidance Note.
6. As indicated in our audit reports referred in paragraph 5(a) above:
The comparative financial information of the Group for the year ended March 31, 2020and the transition date opening balance sheet as at April 1, 2019 prepared inaccordance with Ind AS included in these Ind AS financial statements have beenaudited by the previous auditor. The report of the previous auditor on the comparativefinancial information and the said opening balance sheet dated September 24, 2021expressed an unmodified opinion.
Our opinion on the Consolidated Ind AS Financial Statements is not modified in respectof the above matter on the comparative financial information.
7. Based on our examination and according to the information and explanations given tous and also as per the reliance placed on the examination report submitted by theImmediate Previous Auditors for the respective years, we report that the RestatedConsolidated Financial Information:
a) have been prepared after incorporating adjustments for the changes in accountingpolicies, material errors and regrouping/reclassifications retrospectively in thefinancial years ended March 31, 2020 to reflect the same accounting treatment asper the accounting policies and grouping/classifications followed as at and for theyear ended March 31, 2021, as applicable;
b) have been prepared after incorporating proforma Ind AS adjustments to theaudited Indian GAAP financial statements as at and for the year ended March 31,2019 as described in Note 2(a) to the Restated Consolidated Financial Information;
c) do not require any adjustment for modification as there is no modification in theunderlying audit reports. There are items relating to emphasis of matter and othermatter (refer paragraph 5(b)(iii) and paragraph 6 above), which do not require anyadjustment to the Restated Consolidated Financial Information; and
d) have been prepared in accordance with the Act, ICDR Regulations and the GuidanceNote.
8. We have complied with the relevant applicable requirements of the Standard on QualityControl (SQC) 1, Quality Control for Firms that Perform Audits and Reviews of HistoricalFinancial Information, and Other Assurance and Related Services Engagements.
9. The Restated Consolidated Financial Information do not reflect the effects of events thatoccurred subsequent to the respective dates of the reports on the audited consolidatedfinancial statements (except as described in Note 2(a) of the Restated ConsolidatedFinancial Information) mentioned in paragraph [4] above.
10. This report should not in any way be construed as a reissuance or re-dating of any of theprevious audit reports issued by us or the Previous Auditors, nor should this report beconstrued as a new opinion on any of the financial statements referred to herein.
208

DeloitteHaskins & Sells LLP
11. We have no responsibility to update our report for events and circumstances occurringafter the date of the report.
12. Our report is intended solely for use of the Board of Directors for inclusion in the DRHP tobe filed with Securities and Exchange Board of India, relevant stock exchanges andRegistrar of Companies, Maharashtra, Mumbai in connection with the proposed IPO. Ourreport should not be used, referred to, or distributed for any other purpose except withour prior consent in writing. Accordingly, we do not accept or assume any liability or anyduty of care for any other purpose or to any other person to whom this report is shown orinto whose hands it may come without our prior consent in writing.
For Deloitte Haskins & Sells LLPChartered Accountants
(Firm’s Registration No. 117366W/W-100018)
N. K. Jain(Partner)
(Membership No. 045474)(UDIN: 21045474AAAAFM9754)
Place: MumbaiDate: September 27, 2021
209

Wellness Forever Medicare Limited(Formerly known as Wellness Forever Medicare Private Limited)Restated Consolidated Statement of Assets and LiabilitiesAll amounts are in Rs.in millions unless otherwise stated
Note As at March 31,2021
As at March 31,2020
As at March 31,2019
(Proforma)
(a) Property, plant and equipment 6 791.04 625.00 520.99(b) Right-of-use assets 7 1,773.14 1,741.77 1,455.98(c) Capital work in progress 6.5 5.29 - -(d) Intangible assets 8 83.61 60.05 46.43(e) Financial assets
(i) Investments 9 - - -(ii) Loans 10 244.83 192.38 159.22(iii) Other financial assets 11 93.03 10.11 9.55
(f) Non-current tax assets (net) 12 15.74 6.62 6.51(g) Deferred tax assets (net) 13 172.40 62.03 68.83(h) Other non-current assets 14 33.17 47.22 -
Total non - current assets 3,212.25 2,745.18 2,267.51
Current assets(a) Inventories 15 1,554.69 1,299.71 1,063.88(b) Financial assets
(i) Investments 9 80.09 - -(ii) Trade receivables 16 285.96 232.23 210.28(iii) Cash and cash equivalents 17 170.11 162.43 59.42(iv) Bank balances other than (iii) above 18 467.55 56.70 53.16(v) Loans 10 74.18 115.01 79.64(vi) Other financial assets 11 62.33 40.78 23.70
(c) Right-to-returned-goods asset 19 3.88 2.72 2.19(d) Other current assets 14 176.51 111.21 63.25
Total current assets 2,875.30 2,020.79 1,555.52
6,087.55 4,765.97 3,823.03
Equity(a) Equity share capital 20 63.37 61.69 57.08(b) Instruments entirely equity in nature 21 21.22 15.55 15.55(c) Other equity 22 2,582.31 1,609.98 1,038.18
Total equity 2,666.90 1,687.22 1,110.81
LiabilitiesNon-current liabilities
(a) Financial liabilities(i) Borrowings 23 327.25 159.10 131.66(ii) Lease liabilities 7 1,105.53 1,110.35 973.56(iii) Other financial liabilities 24 1.91 1.91 -
(b) Provisions 25 29.80 18.51 7.16Total non - current liabilities 1,464.49 1,289.87 1,112.38
Current liabilities(a) Financial Liabilities
(i) Borrowings 23 604.99 607.70 646.98(ii) Trade payables 26
- Total outstanding dues of small enterprisesand micro enterprises
25.82 28.54 23.43
- Total outstanding dues of creditors otherthan small enterprises and microenterprises
407.77 365.91 313.32
(iii) Lease liabilities 7 750.77 659.45 523.80(iv) Other financial liabilities 24 109.82 77.36 41.90
(b) Other current liabilities 27 35.81 35.60 30.91(c) Provisions 25 21.18 14.06 13.70(d) Current tax liabilities (net) 28 - 0.26 5.80
Total current liabilities 1,956.16 1,788.88 1,599.84
6,087.55 4,765.97 3,823.03
In terms of our report attached.For Deloitte Haskins and Sells LLP For and on behalf of the Board of DirectorsChartered Accountants
Gulshan Bakhtiani Ashraf Biran Mohan ChavanN. K. Jain Director Director DirectorPartner DIN 00172374 DIN 01716606 DIN 00249979
Gaurav Shah Nidhi VoraChief Financial Officer Company Secretary
Place : Mumbai Place : MumbaiDate : September 27, 2021 Date : September 27, 2021
Non-current assets
Total assets
ASSETS
EQUITY AND LIABILITIES
Total equity and liabilities
Refer Note 1 to 50 forming part of the restated consolidated financial information.
Particulars
210

Wellness Forever Medicare Limited(Formerly known as Wellness Forever Medicare Private Limited)Restated Consolidated Statement of Profit and LossAll amounts are in Rs.in millions unless otherwise stated
Note For the year endedMarch 31, 2021
For the year endedMarch 31, 2020
For the year endedMarch 31, 2019
(Proforma)
I Revenue from operations 29 9,240.21 8,632.51 6,769.80II Other income 30 173.38 38.48 39.64
III Total income (I + II) 9,413.59 8,670.99 6,809.44
IV EXPENSES(a) Purchases of stock-in-trade 6,978.84 6,407.67 4,998.75(b) 31 (254.98) (235.83) (157.62)(c) Employee benefit expense 32 1,085.47 985.10 764.64(d) Finance costs 33 301.69 275.19 245.93(e) Depreciation and amortisation expense 34 969.90 675.86 518.15(f) Other expenses 35 789.34 604.61 469.53
Total expenses (IV) 9,870.26 8,712.60 6,839.38V Loss before tax (III - IV) (456.67) (41.61) (29.94)VI Tax expense
(1) Current tax 36 - 42.47 39.70(2) Deferred tax 36 (109.67) (30.87) (56.30)(3) Short provision for tax relating earlier years 36 1.47 - -
Total tax expense (VI) (108.20) 11.60 (16.60)VII Loss for the year (V -VI) (348.47) (53.21) (13.33)
VIII Other comprehensive incomeA Items that will not be reclassified to profit or loss
(a) Remeasurements of the defined benefit liabilities / (asset) 40 (2.63) 0.43 (3.73)36 0.70 (0.07) 1.30
(1.93) 0.36 (2.42)
IX (350.40) (52.84) (15.75)
X 37, 45(1) Basic (Rs.) (7.11) (1.16) (0.31)(2) Diluted (Rs.) (7.11) (1.16) (0.31)
Refer Note 1 to 50 forming part of the restated consolidated financial information.
In terms of our report attached.For Deloitte Haskins and Sells LLP For and on behalf of the Board of DirectorsChartered Accountants
Gulshan Bakhtiani Ashraf Biran Mohan ChavanN. K. Jain Director Director DirectorPartner DIN 00172374 DIN 01716606 DIN 00249979
Gaurav Shah Nidhi VoraChief Financial Officer Company Secretary
Place : Mumbai Place : MumbaiDate : September 27, 2021 Date : September 27, 2021
Earnings per equity share - (Face Value Rs. 2/- per share)
Particulars
Total comprehensive income for the year (VII+VIII)
Total other comprehensive income for the year
Changes in inventories of stock-in-trade
(b) Income tax on above
211

Wellness Forever Medicare Limited(Formerly known as Wellness Forever Medicare Private Limited)Restated Consolidated Statement of Changes in EquityAll amounts are in Rs.in millions unless otherwise stated
(a) Equity share capitalParticulars Amount
Balance at April 1, 2018 (proforma) 57.08Issue of equity shares -
Balance at March 31, 2019 (proforma) 57.08Issue of equity shares 4.61
Balance at March 31, 2020 61.69Issue of equity shares 1.68
Balance at March 31, 2021 63.37
(b) Instruments entirely equity in nature(i) Compulsorily convertible preference sharesParticulars Amount
Balance at April 1, 2018 (proforma) 15.55Issue of compulsorily convertible preference shares -
Balance at March 31, 2019 (proforma) 15.55Issue of compulsorily convertible preference shares -
Balance at March 31, 2020 15.55Issue of compulsorily convertible preference shares 5.67
Balance at March 31, 2021 21.22
(c) Other equity
Securities premiumreserve
ESOP outstandingreserve
Retained earnings
Balance at April 1, 2018 (proforma) 905.04 - 145.23 1,050.27Loss for the year - - (13.33) (13.33)Remeasurement of defined benefit obligation, net of income tax - - (2.42) (2.42)Total comprehensive income for the year - - (15.75) (15.75)Recognition of share based payments - 4.51 - 4.51Payment of dividends and dividend distribution tax thereon - - (0.85) (0.85)Balance at March 31, 2019 (proforma) 905.04 4.51 128.63 1,038.18Ind AS transition adjustments (Refer note 5 - Part B) - - 59.64 59.64Balance at April 1, 2019 905.04 4.51 188.27 1,097.82Loss for the year - - (53.21) (53.21)Remeasurement of defined benefit obligation, net of income tax - - 0.36 0.36Total comprehensive income for the year - - (52.85) (52.85)Securities premium on shares issued (net of share issue costs) 538.96 - - 538.96Recognition of share based payments - 29.57 - 29.57Payment of dividends and dividend distribution tax thereon - - (3.52) (3.52)
Balance at March 31, 2020 1,444.00 34.08 131.90 1,609.98Loss for the year - - (348.47) (348.47)Remeasurement of defined benefit obligation, net of income tax - - (1.93) (1.93)Total comprehensive income for the year - - (350.40) (350.40)Securities premium on shares issued (net of share issue costs) 1,303.46 - - 1,303.46Issue of equity shares - (18.20) - (18.20)Recognition of share based payments - 41.31 - 41.31Payment of dividends - - (3.84) (3.84)Balance at March 31, 2021 2,747.46 57.19 (222.34) 2,582.31
Refer Note 1 to 50 forming part of the restated consolidated financial information.
In terms of our report attached. For and on behalf of the Board of DirectorsFor Deloitte Haskins and Sells LLPChartered Accountants
Gulshan Bakhtiani Ashraf Biran Mohan ChavanN. K. Jain Director Director DirectorPartner DIN 00172374 DIN 01716606 DIN 00249979
Gaurav Shah Nidhi VoraChief Financial Officer Company Secretary
Place : Mumbai Place : MumbaiDate : September 27, 2021 Date : September 27, 2021
TotalParticularsReserves and Surplus
212

Wellness Forever Medicare Limited(Formerly known as Wellness Forever Medicare Private Limited)Restated Consolidated Statement of Cash FlowsAll amounts are in Rs.in millions unless otherwise stated
For year endedMarch 31, 2021
For year endedMarch 31, 2020
For the year endedMarch 31, 2019
(Proforma)
Cash flows from operating activitiesLoss before tax (456.67) (41.61) (29.94)Adjustments for:
Finance costs recognised in Statement of Profit or Loss 301.69 275.19 245.93Interest income recognised in Statement of Profit or Loss (53.07) (30.28) (22.81)Loss on disposal / discard of property, plant and equipment (net) 10.80 6.70 18.82Fair value gain on investments (0.09) - -Depreciation and amortisation expenses 969.90 675.86 518.15Expense recognised in respect of equity-settled share-based payments 41.31 29.57 4.51Sundry balances written back (64.26) (0.03) (0.00)Sundry balances written off 61.44 8.46 3.23Lease rent concessions (41.26) (5.64) (1.92)Provision for expected credit loss 4.86 1.50 1.77Provision for doubtful deposits 19.15 - -Provision for doubtful balances 9.27 - -Rental income (1.92) (1.05) (1.01)Income from Redemption of Mutual Fund (2.00) - -Operating profit before working capital changes 799.15 918.67 736.73
Adjustments for:(Increase)/decrease in operating assetsTrade Receivables (58.59) (23.45) (14.90)Inventories (254.98) (235.83) (157.66)Other Financial Assets [Non-Current and Current] (176.29) (127.07) (46.67)Other Assets [Non-Current and Current] (127.89) (56.95) 13.27Increase/(decrease) in operating liabilitiesTrade Payables 94.12 45.46 (29.38)Provisions [Non-Current and Current] 15.79 12.14 15.03Other Financial Liabilities [Non-Current and Current] 1.39 1.91 0.03Other Current Liabilities 0.20 4.70 13.88Changes in Working Capital (506.25) (379.08) (206.40)
Cash generated from operations 292.91 539.59 530.33
Income taxes paid (Net of Refund) (10.85) (48.12) (60.13)
Net cash generated by operating activities 282.06 491.47 470.20
Cash flows from investing activitiesPayments to acquire financial assets (742.85) (3.55) (53.16)Proceeds on sale of financial assets 254.01 - -Interest received 23.51 23.96 4.01Payments for property, plant and equipment and intangible assets (512.06) (287.73) (222.97)Proceeds from disposal of property, plant and equipment 4.92 2.16 2.95Rent received 1.92 1.04 1.01
Net cash used in investing activities (970.55) (264.10) (268.16)
Particulars
213

Cash flows from financing activitiesProceeds from issue of equity instruments 1,286.93 543.57 -Proceeds from issue of Instruments entirely equity in nature 5.67 - -Proceeds from long term borrowings 261.10 540.00 556.68Repayment of long term borrowings (64.73) (484.81) (484.82)Repayment of short term borrowings (net) (6.16) (39.29) 237.45Payment of lease liabilities (695.88) (595.83) (461.80)Dividends paid (3.84) (3.52) (0.85)Interest paid (86.92) (84.47) (76.83)
Net cash (used in) / generated by financing activities 696.17 (124.35) (230.17)
Net increase/ (decrease) in cash and cash equivalents 7.68 103.01 (28.13)Cash and cash equivalents at the beginning of the year 162.43 59.42 87.55
Cash and cash equivalents at the end of the year 170.11 162.43 59.42
Reconciliation of cash and cash equivalents with the Balance Sheet:Cash and cash equivalents at end of the year (as per note 17) 170.11 162.43 59.42
Note:
Refer Note 1 to 50 forming part of the restated consolidated financial information.
In terms of our report attached. For and on behalf of the Board of DirectorsFor Deloitte Haskins and Sells LLPChartered Accountants
Gulshan Bakhtiani Ashraf Biran Mohan ChavanN. K. Jain Director Director DirectorPartner DIN 00172374 DIN 01716606 DIN 00249979
Gaurav Shah Nidhi VoraChief Financial Officer Company Secretary
Place : Mumbai Place : MumbaiDate : September 27, 2021 Date : September 27, 2021
The above cash flow statement has been prepared under the "Indirect Method" as set out in the Indian Accounting Standard (IND AS - 7) "Statement of Cash Flow".
214

Wellness Forever Medicare Limited(Formerly known as Wellness Forever Medicare Private Limited)Notes to the Restated Consolidated Financial Information(All amounts are in Rs. in millions unless otherwise stated)
1. Group informationWellness Forever Medicare Limited (formerly known as “Wellness Forever Medicare PrivateLimited”) was originally incorporated as a private limited company on February 08, 2008, withCompany Identification No: U24239MH2008PTC178658, is converted into a public limitedcompany on July 09, 2021 with Company Identification No: U24239MH2008PLC178658. TheHolding company is engaged in the business of running chain of retail chemists shop and supermarkets in India and has various retail stores located in Maharashtra, Karnataka and Goa underthe brand name ‘Wellness Forever’. The Registered office of the Holding Company is 7th Floor,Wing A, Empire Plaza, IT Park, LBS Marg, Vikhroli (West), Mumbai - 400083, Maharashtra,India.
The Restated Consolidated Financial Information is prepared for the Holding Company and itswholly owned subsidiary (together referred to as the “Group” for each years ended March 31,2021, March 31, 2020 and March 31, 2019.
Name of Subsidiary (having 100% ofownership interest)
Country ofincorporation*
Principal activities
Amore Health Essential Private Limited India Developing,manufacturing andselling of ayurvedicmedicines in India
* Principal place of business is same as country of incorporation.
2. Summary of Significant accounting policies
(a) Basis of preparation and presentation
The Restated Consolidated Financial Information of the Group comprises of the RestatedConsolidated Statement of Assets and Liabilities as at March 31, 2021, 2020 2019, the RestatedConsolidated Statement of Profit and Loss (including Other Comprehensive Income), theRestated Consolidated Statement of Cash Flows and the Restated Consolidated Statement ofChanges in Equity for the years ended March 31, 2021, 2020 and 2019 and the Summary ofSignificant Accounting Policies and explanatory notes (collectively, the ‘Restated ConsolidatedFinancial Information’).
These Restated Consolidated Financial Information have been prepared by the Managementof the Company for the purpose of inclusion in the Draft Red Herring Prospectus (‘DRHP’)prepared by the Company in connection with its proposed Initial Public Offer (“IPO”) in termsof the requirements of:
a) Section 26 of Part I of Chapter III of the Companies Act, 2013, as amended ("the Act");b) The Securities and Exchange Board of India (Issue of Capital and Disclosure Requirements)
Regulations, 2018, as amended ("ICDR Regulations"); andc) The Guidance Note on Reports in Company Prospectuses (Revised 2019) issued by the
Institute of Chartered Accountants of India (ICAI), as amended (the “Guidance Note”).
These Restated Consolidated Financial Information have been compiled by the Managementfrom:
a) Audited Consolidated Ind AS financial statements of the Group as at and for the yearended March 31, 2021, prepared in accordance with the Indian Accounting Standards(referred to as “Ind AS”) as prescribed under Section 133 of the Act read with Companies(Indian Accounting Standards) Rules 2015, as amended, and other accounting principlesgenerally accepted in India, which have been approved by the Board of Directors at theirmeeting held on September 24, 2021. The comparative information as at and for the year
215

Wellness Forever Medicare Limited(Formerly known as Wellness Forever Medicare Private Limited)Notes to the Restated Consolidated Financial Information(All amounts are in Rs. in millions unless otherwise stated)
ended March 31, 2020 included in such financial statements have been prepared bymaking Ind AS adjustments to the audited consolidated financial statements of theCompany as at and for the year ended March 31, 2020, prepared in accordance with theaccounting standards notified under the section 133 of the Act (“Indian GAAP”) which wasapproved by the Board of directors at their meeting held on September 24, 2020.
b) The Restated Consolidated Financial Information also contains the proforma consolidatedInd AS financial information as at and for the year ended March 31, 2019. The proformaconsolidated Ind AS financial information have been prepared by making Ind ASadjustments to the audited Indian GAAP financial statements as at and for the year endedMarch 31, 2019 which have been approved by the Board of Directors at their meeting heldon September 27, 2021.
For the purpose of Proforma Ind AS consolidated financial information as at and for the yearended March 31, 2019, the Group has followed the same accounting policy and accountingpolicy choices (both mandatory exceptions and optional exemptions availed as per Ind AS 101,as applicable) as initially adopted on transition date i.e. April 1, 2019 (refer Note 2(x)).Accordingly, suitable restatement adjustments (both remeasurements and reclassifications) inthe accounting heads are made to the Proforma Ind AS consolidated financial information asat and for the year ended March 31, 2019 following accounting policies and accounting policychoices (both mandatory exceptions and optional exemptions) consistent with that used at thedate of transition to Ind AS (i.e. April 1, 2019)
The accounting policies have been consistently applied by the Company in preparation of theRestated Consolidated Financial Information and are consistent with those adopted in thepreparation of financial statements for the year ended 31 March 2021. These RestatedConsolidated Financial Information do not reflect the effects of events that occurredsubsequent to the respective dates of board meeting on the audited consolidated financialstatements mentioned above.
Subsequent to March 31, 2021, pursuant to a resolution of shareholders dated, July 9, 2021,each equity share of face value of INR 10 each of the Company has been split into 5 equityshares of face value of INR 2 each (the “Split”). Further, the Board of Directors has approvedthe issuance of 1 bonus shares of face value of INR 2 each for every 5 existing fully paid upequity share of face value of INR 2 each and accordingly 84,59,286 bonus shares were issued,which were allotted on July 24, 2021 (the “Bonus Issue”). As required under Ind AS 33 “Earningsper share” the effect of such Split and Bonus Issue are required to be adjusted for the purposeof computing earnings per share for all the periods presented retrospectively. As a result, theeffect of the Split and the Bonus Issue have been considered in these Restated ConsolidatedFinancial Information for the purpose of calculation of earnings per share (refer Note 37.2 ofthe Restated Consolidated Financial Information).
216

Wellness Forever Medicare Limited(Formerly known as Wellness Forever Medicare Private Limited)Notes to the Restated Consolidated Financial Information(All amounts are in Rs. in millions unless otherwise stated)
These Restated Consolidated Financial Information do not reflect the effects of events thatoccurred subsequent to the respective dates of Board Meeting on the Audited ConsolidatedFinancial Information mentioned above other than those described above.
The Restated Consolidated Financial Information:
a) have been prepared after incorporating adjustments for the changes in accountingpolicies, material errors and regrouping/reclassifications retrospectively in the financialyear ended March 31, 2020, to reflect the same accounting treatment as per theaccounting policy and grouping/classifications followed as at and for the year endedMarch 31, 2021;
b) have been prepared after incorporating proforma Ind AS adjustments to the auditedIndian GAAP financial statements as at and for the year ended March 31, 2019;
c) do not require any adjustment for modification as there is no modification in theunderlying audit reports.
i. The auditor’s report dated September 24, 2021 on the Consolidated Ind AS FinancialStatements as at and for the year ended March 31, 2021, includes the following OtherMatter paragraph:
“The comparative financial information of the Company for the year ended March 31,2020 and the transition date opening balance sheet as at April 1, 2019 prepared inaccordance with Ind AS included in these Ind AS financial statements have beenaudited by the previous auditor. The report of the previous auditor on thecomparative financial information and the said opening balance sheet datedSeptember 24, 2021 expressed an unmodified opinion.
Our opinion on the Consolidated Ind AS Financial Statements is not modified inrespect of the above matter on the comparative financial information.”
ii. The auditor’s report of previous auditors dated December 04, 2020 on theConsolidated Financial Statements as at and for the year ended March 31, 2020includes the following Emphasis of Matter and Other Matter paragraphs:
Emphasis of matter:“Attention is drawn to Note No. 2 of the Financial Statements regardingmanagement’s current assessment of Group’s assets and liabilities in view ofprevailing Covid-19 pandemic and nationwide lockdown and conclusion based onsuch assessment that the carrying value of the assets are recoverable and nouncertainty exists on meeting the liabilities in the foreseeable future.
Our report is not modified in respect of this matter”
Other matter:“Further to the continuous spreading of Covid-19 across India, the Indian Governmentannounced a strict 21-day lockdown on March 24, 2020, which was further extendedtill June 30, 2020, across India to contain the spread of the virus. This has resulted inrestrictions on a physical visit to the client locations and the need for carrying outalternative audit procedures as per the Standards of Auditing prescribed by theInstitute of Chartered Accountants of India (ICAI).
217

Wellness Forever Medicare Limited(Formerly known as Wellness Forever Medicare Private Limited)Notes to the Restated Consolidated Financial Information(All amounts are in Rs. in millions unless otherwise stated)
As a result of the above, the entire audit was carried out based on remote access ofthe data as provided by the management. This has been carried out based on theadvisory on “Specific Considerations while conducting Distance Audit / Remote Audit/ Online Audit under current Covid-19 situation” issued by the Auditing and AssuranceStandards Board of ICAI. We have been represented by the management that the dataprovided for our audit purposes is correct, complete, reliable and are directlygenerated by the accounting system of the Group without any further manualmodifications.
We bring to the attention of the users that the audit of the Consolidated FinancialStatements has been performed in the aforesaid conditions.
Our audit opinion is not modified in respect of the above.”The Restated Consolidated Financial Information are presented in Indian Rupees "INR" or "Rs."and all values are stated as INR or Rs. millions, except when otherwise indicated.
These notes provide a list of the significant accounting policies adopted in the preparation ofthese Restated Consolidated Financial Information. These policies have been consistentlyapplied to all the years presented.
(i) Historical Cost ConventionThe Restated Consolidated Financial Information of the Group have been prepared inaccordance with generally accepted accounting principles in India under the historical costconvention on accrual basis at the end of each reporting period except for:- Certain financial assets and liabilities that are measured at fair value (refer accounting
policies regarding financial instruments)- Defined Benefit Plans – plan assets that are measured at fair value- Share based payments – calculated using the Black and Scholes option pricing model
Historical cost is generally based on the fair value of the consideration given in exchange forgoods and services.
Fair value is the price that would be received to sell an asset or paid to transfer a liability in anorderly transaction between market participants at the measurement date, regardless ofwhether that price is directly observable or estimated using another valuation technique. Inestimating the fair value of an asset or a liability, the Group takes into account thecharacteristics of the asset or liability if market participants would take those characteristicsinto account when pricing the asset or liability at the measurement date.
In addition, for financial reporting purposes, fair value measurements are categorised intoLevel 1, 2, or 3 based on the degree to which the inputs to the fair value measurements areobservable and the significance of the inputs to the fair value measurement in its entirety,which are described as follows:
Level 1 inputs are quoted prices (unadjusted) in active markets for identical assets orliabilities that the entity can access at the measurement date,
Level 2 inputs are inputs, other than quoted prices included within Level, that areobservable for the asset or liability, either directly or indirectly, and
Level 3 inputs are unobservable inputs for the asset or liability.
218

Wellness Forever Medicare Limited(Formerly known as Wellness Forever Medicare Private Limited)Notes to the Restated Consolidated Financial Information(All amounts are in Rs. in millions unless otherwise stated)
(ii) Going concernThe directors of the Holding Company have, at the time of approving the RestatedConsolidated Financial Information, a reasonable expectation that the Group have adequateresources to continue in operational existence for the foreseeable future. Thus, they continueto adopt the going concern basis of accounting in preparing the Restated ConsolidatedFinancial Information.
(iii) Current and Non-CurrentThe Group presents assets and liabilities in the Restated Consolidated Statement of Assets andLiabilities based on current and non-current classification.
As asset is treated as current when it is:- Expected to be realized or intended to be sold or consumed in normal operating cycle- Held primarily for the purpose of trading- Expected to be realized within twelve months after the reporting period, or- Cash or cash equivalent unless restricted from being exchanged or used to settle a liability
for at least twelve months after the reporting period
All other assets are classified as non-current.
A liability is current when:- It is expected to be settled in normal operating cycle- It is held primarily for the purpose or trading- It is due to be settled within twelve months after the reporting period, or- There is no unconditional right to defer the settlement of the liability for at least twelve
months after the reporting period.The Group classifies all other liabilities as non-current.
Deferred tax assets and liabilities are classified as non-current assets and liabilities.
The operating cycle is the time between the acquisition of assets for processing and theirrealization in cash and cash equivalents. The Group has identified twelve months as itsoperating cycle.
(b) Functional and presentation currencyThe Restated Consolidated Financial Information are presented in Indian Rupees (₹), which isthe Group’s functional and presentation currency. All amounts have been rounded to thenearest Million with two decimals, unless otherwise indicated.
(c) Basis of consolidationi. The Holding Company consolidates the entity which it controls. Control is established when
the Holding Company has power over the entity, is exposed, or has rights to variable returnsfrom its involvement with the entity and has ability to affect the entity’s returns by using itspower over the entity.
ii. The Holding Company reassesses whether or not it controls an investee, if facts andcircumstances indicate that there are changes to one or more of the three elements of controllisted above. Profit or loss and each component of other comprehensive income are attributedto the owners of the Holding Company.
219

Wellness Forever Medicare Limited(Formerly known as Wellness Forever Medicare Private Limited)Notes to the Restated Consolidated Financial Information(All amounts are in Rs. in millions unless otherwise stated)
iii. Profit or loss and each component of other comprehensive income are attributed to theowners of the Holding Company and to the non-controlling interests (if any). Totalcomprehensive income of the subsidiary is attributed to the owners of the Holding Companyand to the non-controlling interests (if any) even if this results in the non-controlling interestshaving a deficit balance.
iv. Where the cost of the investment is higher than the share of equity in the subsidiary at thetime of acquisition, the resulting difference is treated as goodwill. Where the cost of the equityis lower than the share of equity in the subsidiary, the difference is treated as capital reserve.
v. The Restated Consolidated Financial Information of the Holding Company and its subsidiaryare combined on a line by line basis by adding together like items of assets, liabilities, equity,incomes, expenses and cash flows, after fully eliminating intra-group balances and intra-grouptransactions; in accordance with Ind AS.
vi. Profits or losses resulting from intra-group transactions that are recognised in assets, such asinventory and property, plant & equipment, are eliminated in full. Tax impact is given for theintra-group eliminations wherever applicable.
vii. Offset (eliminate) the carrying amount of the Holding Company’s investment in the subsidiaryand the Holding Company’s portion of equity of the subsidiary.
viii. The Restated Consolidated Financial Information are prepared using uniform accountingpolicies for like transactions and other events in similar circumstances.
(d) Property, Plant and EquipmentProperty, Plant and Equipment (PPE) are stated at cost of acquisition, including anyattributable cost for bringing the asset to its working condition for its intended use lessaccumulated depreciation and less accumulated impairment, if any. Cost includes expensesrelated directly to acquisition and installation of the concerned assets, borrowing cost duringthe construction period and estimated costs of dismantling and removing the item andrestoring the site on which it is located and excludes any duties / taxes recoverable.
Advances paid towards the acquisition of PPE outstanding at each reporting date is classifiedas Capital Advances under “Other Non-Current Assets” and assets which are not ready forintended use as on the date of Restated Consolidated Statement of Assets and Liabilities aredisclosed as "Capital Work in Progress".
Properties in the course of construction for production, supply or administrative purposes arecarried at cost, less any recognised impairment loss. Cost includes all costs incurred to bringthe assets to their present location and condition. Such properties are classified to theappropriate categories of property, plant and equipment when completed and ready forintended use. Depreciation of these assets, on the same basis as other property assets,commences when the assets are ready for their intended use.
An item of property, plant and equipment is de-recognised upon disposal or when no futureeconomic benefits are expected from its use or disposal. Gains or losses arising from de-recognition of fixed assets are measured as the difference between the net disposal proceedsand the carrying amount of the asset and are recognized in the Restated ConsolidatedStatement of Profit and Loss when the asset is derecognized.
220

Wellness Forever Medicare Limited(Formerly known as Wellness Forever Medicare Private Limited)Notes to the Restated Consolidated Financial Information(All amounts are in Rs. in millions unless otherwise stated)
Subsequent costs are included in the assets carrying amount or recognized as a separate asset,as appropriate, only when it is probable that future economic benefits associated with theitems will flow to the Group and the cost of the item can be measured reliably. All other repairsand maintenance are charged to the Restated Consolidated Statement of Profit and Lossduring the period in which they are incurred.
Depreciation on property, plant and equipmentDepreciation is provided, under the Straight Line Method basis so as to write off the originalcost of the asset less its estimated residual value over the estimated useful life. TheManagement’s estimate of useful lives is in accordance with Schedule II to the Companies Act,2013. Depreciation is charged on pro-rata basis for asset purchased / sold during the year.
Estimated useful lives of finite tangible assets are as follows:Computers 3 YearsFurniture and Fixture* 5 YearsAir Conditioner 5 YearsOffice Equipment 5 YearsVehicle 10 YearsOffice Premises 10 YearsPlant and Machinery 5 Years
*Refer Note 6.4 to the Restated Consolidated Financial Information.
The estimated residual values, useful lives and methods of depreciation of property, plant andequipment are reviewed at each financial year end and adjusted prospectively, if appropriate.
Transition to Ind ASOn transition to Ind AS, as at 1st April, 2018, the Group has not elected to apply Ind AS 101exemptions and measure its Property, Plant and Equipment by retrospective application ofIND AS 16. The values of each class of assets are accordingly adjusted.
(e) Intangible assetsAn Intangible asset is recognized when it is probable that the future economic benefits thatare attributable to the asset will flow to the Group and the cost of the asset can be measuredreliably. Intangible assets that are acquired separately are carried at cost less accumulatedamortization and accumulated impairment losses. Intangible assets are amortized over theirestimated useful life. The useful life of intangible assets is assessed as either finite or infinite.Amortization is recognized on a straight-line basis over their estimated useful lives. Theestimated useful life and amortization method are reviewed at the end of each reportingperiod, with the effect of any changes in estimate being accounted for on a prospective basis.Estimated useful lives of finite intangible assets are as follows:
Computer Software 3 yearsTrademarks 10 years
Changes in the expected useful life are considered to modify the amortization period ormethod, as appropriate, and are treated as changes in accounting estimates.
Gains or losses arising from de-recognition of an intangible asset are measured as thedifference between the net disposal proceeds and the carrying amount of the asset and arerecognized in the Restated Consolidated Statement of Profit and Loss when the asset isderecognized.
221

Wellness Forever Medicare Limited(Formerly known as Wellness Forever Medicare Private Limited)Notes to the Restated Consolidated Financial Information(All amounts are in Rs. in millions unless otherwise stated)
Transition to Ind ASOn transition to Ind AS, as at 1st April, 2018, the Group has not elected to apply Ind AS 101exemptions and measure its Intangible Assets by retrospective application of IND AS 38. Thevalues of each class of asset are accordingly adjusted.
(f) Impairment of non-financial assetsAt the end of each reporting period, the Group reviews the carrying amounts of its non-financial assets to determine whether there is any indication of an impairment loss. If any suchindication exists, the recoverable amounts are estimated in order to determine the extent ofthe impairment loss (if any). An impairment loss is recognized whenever the carrying amountof an asset or a cash-generating unit exceeds its recoverable amount. The impairment loss, ifany, is recognized in the Restated Consolidated Statement of Profit and Loss in the period inwhich impairment takes place.Recoverable amount is higher of an assets net selling price and its value in use. Value in use isthe present value of estimated future cash flows expected to arise from the continuing use ofan assets and from its disposal at the end of its useful life. Where an impairment losssubsequently reverses, the carrying amount of the assets is increased to the revised estimateof its recoverable amount, however subject to the increased carrying amount that would havebeen determined (net of amortization or depreciation) had no impairment loss beenrecognized for the asset in prior accounting periods. A reversal of an impairment loss isrecognized immediately in profit or loss to the extent that it eliminates the impairment losswhich has been recognized for the asset in prior years. When an impairment loss subsequentlyreverses, the carrying amount of the asset or a cash-generating unit is increased to the revisedestimate of its recoverable amount, but so that the increased carrying amount does not exceedthe carrying amount that would have been determined had no impairment loss beenrecognised for the asset (or cash-generating unit) earlier.
(g) InventoriesInventories are measured at lower of cost and net realizable value. Cost of inventoriescomprises all costs of purchase (net of input credits) and other costs incurred in bringing theinventories to their present location and condition. Cost is determined by the weightedaverage cost method. Costs of purchased inventory are determined after deducting rebatesand discounts.
Net realizable value represents estimated selling price in the ordinary course of business, lessestimated costs of completion and estimated costs necessary to make the sale.
Provision is made for cost of obsolescence and other anticipated losses, whenever considerednecessary by Management based on the best judgement and estimates.
(h) Cash and cash equivalentsCash and cash equivalents in the Restated Consolidated Statement of Assets and Liabilitiescomprises cash on hand, bank balances and short-term deposits with banks with an originalmaturity of three months or less which are readily convertible into cash and which are subjectto insignificant risk of changes in value.
For the purpose of the Restated Consolidated Statement of Cash Flow, cash and cashequivalents consist of cash and short-term deposits, as defined above, net of outstanding bankoverdrafts/ cash credit facilities as they are considered an integral part of the Group’s cashmanagement.
222

Wellness Forever Medicare Limited(Formerly known as Wellness Forever Medicare Private Limited)Notes to the Restated Consolidated Financial Information(All amounts are in Rs. in millions unless otherwise stated)
(i) Restated Consolidated Statement of Cash FlowCash Flows are reported using Indirect Method, whereby profit / (loss) for the year is adjustedfor the effects of transactions of a non-cash nature, any deferrals or accruals of past or futureoperating cash receipts or payments and item of income or expenses associated with investingor financing cash flows. The cash flows from operating, investing and financing activities of theGroup are segregated.
(j) Financial instrumentsA financial instrument is any contract that gives rise to financial assets of one entity andfinancial liability or equity of another entity. Financial instruments also include derivativecontracts such as foreign currency foreign exchange forward contracts, if any.
Financial assetsInitial recognition:Financial assets are recognized when a Group becomes a party to the contractual provisionsof the instruments. Financial assets are initially measured at fair value. The transaction coststhat are directly attributable to the acquisition of financial assets are added to fair value exceptfor financial asset at fair value through profit and loss (FVTPL).
Subsequent measurement of financial assets:Financial assets are subsequently classified and measured at:i. amortised costii. fair value through Profit and Loss (FVTPL)iii. fair value through Other Comprehensive Income (FVTOCI).
i. Measured at amortised cost:Financial assets that are held within a business model whose objective is to hold financialassets in order to collect contractual cash flows that are solely payments of principal andinterest, are subsequently measured at amortised cost using the effective interest rate(‘EIR’) method less impairment, if any. The amortisation of EIR and loss arising fromimpairment, if any is recognised in the Restated Consolidated Statement of Profit andLoss.
ii. Measured at Fair value through other comprehensive income (FVTOCI):Financial assets that are held within a business model whose objective is achieved by both,selling financial assets and collecting contractual cash flows that are solely payments ofprincipal and interest, are subsequently measured at fair value through othercomprehensive income. Fair value movements are recognized in the other comprehensiveincome (OCI). Interest income measured using the EIR method and impairment losses, ifany are recognised in the Restated Consolidated Statement of Profit and Loss. Onderecognition, cumulative gain or loss previously recognised in OCI is reclassified from theequity to ‘Other Income’ in the Restated Consolidated Statement of Profit and Loss.
iii. Measured at Fair Value Through profit and Loss (FVTPL):A financial asset not classified as either amortised cost or FVTOCI, is classified as FVTPL.Such financial assets are measured at fair value with all changes in fair value, includinginterest income and dividend income if any, recognised as ‘Other Income’ in the RestatedConsolidated Statement of Profit and Loss.
223

Wellness Forever Medicare Limited(Formerly known as Wellness Forever Medicare Private Limited)Notes to the Restated Consolidated Financial Information(All amounts are in Rs. in millions unless otherwise stated)
Financial assets are not reclassified subsequent to their recognition, except if and in the periodthe Group changes its business model for managing financial assets.
Loans:Loans are initially recognized at fair value. Subsequently, these assets are held atamortized cost, using the effective interest rate (EIR) method net of any expected creditlosses. The EIR is the rate that discounts estimated future cash income through theexpected life of financial instruments.
Mutual Funds:Investments in mutual fund are measured at fair value through profit or loss.
Equity Instruments:Measured at Fair Value Through profit and Loss (FVTPL):Investments in equity instruments are classified as at FVTPL, unless the Group irrevocablyelects on initial recognition to present subsequent changes in fair value in othercomprehensive income for equity instruments which are not held for trading.
Measured at Fair value through other comprehensive income (FVTOCI):On initial recognition, the Group can make an irrevocable election (on an instrument-by-instrument basis) to present the subsequent changes in fair value in other comprehensiveincome. This election is not permitted if the equity investment is held for trading. Theseelected investments are initially measured at fair value plus transaction costs.
Subsequently, they are measured at fair value with gains and losses arising from changesin fair value recognized in other comprehensive income and accumulated in the reservefor 'equity instruments through other comprehensive income'. The cumulative gain or lossis reclassified to Restated Consolidated Statement of Profit and Loss on full disposal of theinvestments.
Impairment of financial assets:
The Group applies the expected credit loss model for recognising impairment loss onfinancial assets measured at amortised cost, lease receivables, trade receivables, othercontractual rights to receive cash or other financial asset.
The Group applies the simplified approach to providing for expected credit lossesprescribed by Ind AS 109, which permits the use of the lifetime expected loss provision forall trade receivables. The Group computes the expected credit losses based on a provisionmatrix which uses historical credit loss experience of the Group. Forward-lookinginformation (including macroeconomic information) is incorporated into the determinationof expected credit losses..
Further, for the purpose of measuring lifetime expected credit loss allowance for tradereceivables, the Group has used a practical expedient as permitted under Ind AS 109. Thisexpected credit loss allowance is computed based on a provision matrix which takes intoaccount historical credit loss experience and adjusted for forward-looking information.
224

Wellness Forever Medicare Limited(Formerly known as Wellness Forever Medicare Private Limited)Notes to the Restated Consolidated Financial Information(All amounts are in Rs. in millions unless otherwise stated)
De-recognition of financial assets:The Group de-recognises a financial asset when the contractual rights to the cash flows fromthe financial asset expire, or it transfers the contractual rights to receive the cash flows fromthe asset.
Where the entity has transferred an asset, the Group evaluates whether it has transferredsubstantially all risks and rewards of ownership of the financial asset. In such cases, thefinancial asset is de-recognised. Where the Group has not transferred substantially all risksand rewards of ownership of the financial asset, the financial asset is not de-recognised.
Where the Group has neither transferred a financial asset nor retains substantially all risksand rewards of ownership of the financial asset, the financial asset is de-recognised if theGroup has not retained control of the financial asset. Where the Group retains control ofthe financial asset, the asset is continued to be recognised to the extent of continuinginvolvement in the financial asset.
Financial liabilities
Initial recognitionFinancial liabilities are recognised when the Group becomes a party to the contractualprovisions of the instrument. Financial liabilities are initially measured at the fair value. Thetransaction cost that are directly attributable to the issue of financial liabilities are deductedfrom fair value except for financial liabilities at FVTPL.In case of trade payables, they are initially recognised at fair value and subsequently, theseliabilities are held at amortised cost, using the effective interest method.
Subsequent MeasurementFinancial liabilities are subsequently measured at amortised cost using the EIR method.Financial liabilities carried at fair value through profit or loss are measured at fair value withall changes in fair value recognised in the Restated Consolidated Statement of Profit andLoss. The interest expenses using the effective interest method is recognised over therelevant period of the financial asset. The same is included under Finance cost in theRestated Consolidated Statement of Profit and Loss unless it is capitalised as part of cost ofan item of Property, Plant and Equipment.
De-recognitionA financial liability is derecognized when the obligation under the liability is discharged orcancelled or expires. When an existing financial liability is replaced by another from thesame lender on substantially different terms, or the terms of an existing liability aresubstantially modified, such an exchange or modification is treated as the de-recognition ofthe original liability and the recognition of the new liability. The difference in the respectivecarrying amounts is recognized in the Restated Consolidated Statement of Profit and Loss.
Offsetting of financial instrumentsFinancial assets and financial liabilities are offset and the net amount is reported in theRestated Consolidated Statement of Assets and Liabilities if there is a currently enforceablelegal right to offset the recognised amounts and there is an intention to settle on a net basis,to realise the assets and settle the liabilities simultaneously. The legally enforceable rightmust not be contingent on future events and must be enforceable in the normal course ofbusiness and in the event of default, insolvency or bankruptcy of the Group or thecounterparty.
225

Wellness Forever Medicare Limited(Formerly known as Wellness Forever Medicare Private Limited)Notes to the Restated Consolidated Financial Information(All amounts are in Rs. in millions unless otherwise stated)
(k) Revenue recognition
Revenue from operations is recognized to the extent that it is probable that economic benefitwill flow to the Group and the revenue can be reliably measured regardless of when thepayment is being made as per Ind AS 115. Revenue is measured at the fair value of theconsideration received or receivable, taking into account contractually defined terms ofpayment and excluding taxes or duties collected on behalf of the government.
Revenue from operationsRevenue from sale of goods is recognized on delivery of merchandise to the customer, whenthe property in the goods is transferred for a price, and significant risks and rewards have beentransferred and no effective ownership control is retained. Revenue from the sale of goods ismeasured at the fair value of the consideration received or receivable, net of returns andallowances, trade discounts and volume rebates. It is the Group’s policy to sell its products tothe end customers with a right of return. Accumulated experience is used to estimate andprovide for the discounts and returns. No element of financing is deemed present as the salesare made with normal credit days consistent with market practice.The Group has generally concluded that it is the principal in its revenue arrangements, becauseit typically controls the goods or services before transferring them to the customer.
Contract balancesTrade receivablesA receivable presents the Group’s right to an amount of consideration that is unconditional(i.e., only the passage of time is required before payment of the consideration is due). Referaccounting policy on financials assets under financials instruments.
Contract liabilitiesA contract liability is the obligation to transfer goods or services to a customer for which theGroup has received consideration (or an amount of consideration is due) from the customer.If a customer pays consideration before the Group transfers goods or services to the customer,a contract liability is recognised when the payment is made, or the payment is due (whicheveris earlier). Contract liabilities are recognised as revenue when the Group performs under thecontract.Assets and liabilities arising from right to returnThe Group has contracts with customers which entitles them the unconditional right to returncertain merchandise.
Right to return assetsA right of return gives an entity a contractual right to recover the goods from a customer(return asset), if the customer exercises its option to return the goods and obtain a refund.The asset is measured at the carrying amount of the inventory, less any expected costs torecover the goods, including any potential decreases in the value of the returned goods.
Refund liabilitiesA refund liability is the obligation to refund part or all of the consideration received (orreceivable) from the customer. The Group has therefore recognised refund liabilities in respectof customer’s right to return. The liability is measured at the amount the Group ultimatelyexpects it will have to return to the customer. The Group updates its estimate of refundliabilities (and the corresponding change in the transaction price) at the end of each reportingperiod.
The Group has presented its right to return assets and refund liabilities as required under IndAS115 in the Restated Consolidated Financial Information.
226

Wellness Forever Medicare Limited(Formerly known as Wellness Forever Medicare Private Limited)Notes to the Restated Consolidated Financial Information(All amounts are in Rs. in millions unless otherwise stated)
Income from servicesIncome from services is recognized as they are rendered based on agreements/ arrangementswith the concerned parties, and recognized net of goods and services tax/ applicable taxes.
Dividend and interest incomeDividend income from investments is recognized when the shareholder's right to receivepayment has been established.
For all financial instruments measured at amortised cost, interest income is recorded using theeffective interest rate (EIR), which is the rate that discounts the estimated future cashpayments or receipts through the expected life of the financial instruments or a shorter period,where appropriate, to the net carrying amount of the financial assets. Interest income isincluded in other income in the Restated Consolidated Statement of Profit and Loss.
(l) Employee benefitsShort-term employee benefits:All employee benefits payable wholly within twelve months of rendering the service areclassified as short-term employee benefits. Benefits such as salaries, performance incentives,etc., are recognized as an expense at the undiscounted amount in the Restated ConsolidatedStatement of Profit and Loss of the year in which the employee renders the related service. Aliability is recognised for the amount expected to be paid if the Group has a present legal orconstructive obligation to pay this amount as a result of past service provided by the employeeand the obligation can be estimated reliably.
Post-employment benefits and other employee benefits:(a) Defined contribution plans
Retirement benefit in the form of provident fund is a defined contribution plan. The Grouphas no obligation, other than the contribution payable to the provident fund. The Grouprecognizes contribution payable to the provident fund scheme as an expense, when anemployee renders the related services
(b) Defined benefit plans Gratuity
The liability or asset recognised in the Restated Consolidated Statement of Assets andLiabilities in respect of defined benefit gratuity plans is the present value of thedefined benefit obligation at the end of the reporting period less the fair value of planassets. The defined benefit obligation is calculated annually by independent actuaryusing the projected unit credit method. The present value of the defined benefitobligation denominated in INR is determined by discounting the estimated future cashoutflows by reference to market yields at the end of the reporting period ongovernment bonds that have terms approximating to the terms of the relatedobligation.
The net interest cost is calculated by applying the discount rate to the net balance ofthe defined benefit obligation and the fair value of plan assets (in case of HoldingCompany). This cost is included in employee benefit expense in the RestatedConsolidated Statement of Profit and Loss. Remeasurement gains and losses arisingfrom experience adjustments and changes in actuarial assumptions are recognised inthe period in which they occur, directly in other comprehensive income. They areincluded in retained earnings in the Restated Consolidated Statement of Changes inEquity and in the Restated Consolidated Statement of Assets and Liabilities. Changesin the present value of the defined benefit obligation resulting from plan amendmentsor curtailments are recognised immediately in the Restated Consolidated Statementof Profit and Loss as past service cost.
227

Wellness Forever Medicare Limited(Formerly known as Wellness Forever Medicare Private Limited)Notes to the Restated Consolidated Financial Information(All amounts are in Rs. in millions unless otherwise stated)
Compensated absencesA liability is recognised for benefits accruing to employees in respect of privilege leavein the period the related service is rendered at the amount benefits expected to bepaid in exchange for that service.
(m) Equity Share-Based PaymentsEmployees of the Group also receive remuneration in the form of share-based payments inconsideration of the services rendered.
The fair value determined at the grant date of the equity-settled share-based payment isexpensed on a straight-line basis over the vesting period, based on the Group’s estimate ofequity instruments that will eventually vest, with a corresponding increase in equity. The fairvalue of the options at the grant date is calculated on the basis of the Black Scholes model. Atthe end of each reporting period, the Group revises its estimates of the number of equityinstruments expected to vest. The impact of the revision of the original estimates, if any is,recognized in Restated Consolidated Statement of Profit and Loss such that the cumulativeexpenses reflect the revised estimate, with a corresponding adjustment to the shared optionoutstanding account.
When the options are exercised, the Group issues fresh equity shares.When the terms of an equity-settled award are modified, an additional expense is recognisedfor any modification that increases the total fair value of the share-based payment transaction,or is otherwise beneficial to the employee as measured at the date of modification.
(n) LeasesAs per Ind AS 116 “Leases”, the determination of whether an arrangement is (or contains) alease is based on the substance of the arrangement at the inception of the lease. Thearrangement is, or contains, a lease if fulfilment of the arrangement is dependent on the useof a specific asset or assets and the arrangement conveys a right to use the asset or assets,even if that right is not explicitly specified in an arrangement.
Effective April 1, 2018, the Group adopted Ind AS 116 “Leases” and applied the standard to alllease contracts existing on April 1, 2018, except those which are exempted under thisstandard, using the modified retrospective approach and has taken the cumulative adjustmentto retained earnings, on the date of initial application.
The following is the summary of practical expedients elected on initial application:1. Applied a single discount rate to a portfolio of leases of similar assets in similar economic
environment with a similar end date2. Applied the exemption not to recognize ROU assets and liabilities for leases with less than
12 months of lease term on the date of initial application3. Excluded the initial direct costs from the measurement of the right-of-use asset at the
date of initial application.
As a LesseeThe Group’s lease assets classes primarily consist of leases for shops, offices, warehouses andfurniture and fixtures. The Group assesses whether a contract contains a lease, at inception ofa contract. A contract is, or contains, a lease if the contract conveys the right to control theuse of an identified asset for a period of time in exchange for consideration. To assess whethera contract conveys the right to control the use of an identified asset, the Group assesseswhether:(i) the contract involves the use of an identified asset.(ii) the Group has substantially all of the economic benefits from use of the asset
through the period of the lease and
228

Wellness Forever Medicare Limited(Formerly known as Wellness Forever Medicare Private Limited)Notes to the Restated Consolidated Financial Information(All amounts are in Rs. in millions unless otherwise stated)
(iii) the Group has the right to direct the use of the asset.
At the date of commencement of the lease, the Group recognises a right-of-use asset (“ROU”)and a corresponding lease liability for all lease arrangements in which it is a lessee, except forleases with a term of twelve months or less (short-term leases) and low value leases. For theseshort-term and low value leases, the Group recognizes the lease payments as an operatingexpense on a straight-line basis over the term of the lease.
The right-of-use assets are initially recognized at cost, which comprises the initial amount ofthe lease liability adjusted for any lease payments made at or prior to the commencementdate of the lease plus any initial direct costs less any lease incentives. They are subsequentlymeasured at cost less accumulated depreciation and impairment losses.
Right-of-use assets are depreciated from the commencement date on a straight-line basis overthe shorter of the lease term and useful life of the underlying asset. The estimated useful livesof right-of-use assets are determined on the same basis as those of property and equipment.In addition, the right-of-use asset is periodically reduced by impairment losses, if any, andadjusted for certain re-measurements of the lease liability.
The lease liability is initially measured at amortized cost at the present value of the future leasepayments. The lease payments are discounted using the interest rate implicit in the lease or,if not readily determinable, using the incremental borrowing rates of these leases. Leaseliabilities are re-measured with a corresponding adjustment to the related right of use asset ifthe Group changes its assessment if whether it will exercise an extension or a terminationoption.
Lease liability and ROU asset have been separately presented in the Restated ConsolidatedStatement of Assets and Liabilities and lease payments have been classified as financing cashflows.
Lease payments under short term leases and low value leases are generally recognised as anexpense on a straight-line basis over the term of the relevant lease.
As a LessorLeases in which the Group does not transfer substantially all the risks and rewards ofownership of an asset are classified as operating leases. Rental income from operating lease isrecognised on a straight-line basis over the term of the relevant lease. Initial direct costsincurred in negotiating and arranging an operating lease are added to the carrying amount ofthe leased asset and recognised over the lease term on the same basis as rental income.Contingent rents are recognised as revenue in the period in which they are earned unless thereceipts are structured to increase in line with expected general inflation to compensate forthe expected inflationary cost increases.
Critical judgements required in the application of Ind AS 116 may include, among others, thefollowing:
Identifying whether a contract (or part of a contract) includes a lease; Determining whether it is reasonably certain that an extension or termination option will
be exercised; Classification of lease agreements (when the entity is a lessor); Determination of whether variable payments are in-substance fixed; Establishing whether there are multiple leases in an arrangement; Determining the stand-alone selling prices of lease and non-lease components.
229

Wellness Forever Medicare Limited(Formerly known as Wellness Forever Medicare Private Limited)Notes to the Restated Consolidated Financial Information(All amounts are in Rs. in millions unless otherwise stated)
Key sources of estimation uncertainty in the application of Ind AS 116 may include, amongothers, the following:
Estimation of the lease term; Determination of the appropriate rate to discount the lease payments; Assessment of whether a right-of-use asset is impaired.
(o) Borrowing costsGeneral and Specific borrowing costs directly attributable to the acquisition, construction orproduction of an asset that necessarily takes a substantial period of time to get ready for itsintended use or sale are added to the cost of those assets, until such time as the assets aresubstantially ready for their intended use or sale. Interest income earned on the temporaryinvestment of specific borrowings pending their expenditure on qualifying assets is deductedfrom the borrowing costs eligible for capitalization. All other borrowing costs are recognisedin the Restated Consolidated Statement of Profit and Loss in the period in which they areincurred.
(p) Taxes on IncomeIncome tax expense comprises current tax expense and the deferred tax during the year.Current and deferred taxes are recognised in the Restated Consolidated Statement of Profitand Loss, except when they relate to items that are recognised in other comprehensive incomeor directly in equity, in which case, the current and deferred tax are also recognised in othercomprehensive income or directly in equity, respectively.
Current taxCurrent tax is measured at the amount of tax expected to be payable on the taxable incomefor the year and any adjustments to the tax payable or receivable in respect of previous yearsas determined in accordance with the provisions of the Income Tax Act,1961 that have beenenacted or subsequently enacted at the end of the reporting period.
Current tax assets and current tax liabilities are offset when there is legally enforceable rightto set off the recognised amounts and there is an intention to settle the asset and the liabilityon a net basis or simultaneously
Deferred taxDeferred tax is recognised on temporary differences between the carrying amounts of assetsand liabilities in the Restated Consolidated Financial Information and the corresponding taxbases used in the computation of taxable profit.Deferred tax assets are recognized for unused tax losses, unused tax credits and deductibletemporary differences to the extent that it is probable that future taxable profits will beavailable against which they can be used. Deferred tax assets are reviewed at each reportingdate and are reduced to the extent that it is no longer probable that the related tax benefitwill be realized; such reductions are reversed when the probability of future taxable profitsimproves.
Unrecognized deferred tax assets are reassessed at each reporting date and recognized to theextent that it has become probable that future taxable profits will be available against whichthey can be used.
Deferred tax is measured at the tax rates that are expected to be applied to temporarydifferences when they reverse, using tax rates enacted or substantively enacted at thereporting date.
The measurement of deferred tax reflects the tax consequences that would follow from themanner in which the Group expects, at the reporting date, to recover or settle the carryingamount of its assets and liabilities.
230

Wellness Forever Medicare Limited(Formerly known as Wellness Forever Medicare Private Limited)Notes to the Restated Consolidated Financial Information(All amounts are in Rs. in millions unless otherwise stated)
(q) Provisions, Contingent Liabilities and Contingent AssetsProvisions are recognized when the Group has a present obligation as a result of a past event;it is probable that an outflow of resources embodying economic benefits will be required tosettle the obligation and when a reliable estimate of the amount of the obligation can bemade. Provisions are measured at the best estimate of the expenditure required to settle thepresent obligation at the Restated Consolidated Statement of Assets and Liabilities date. Theexpenses relating to a provision is presented in the Restated Consolidated Statement of Profitand Loss net of any reimbursement.
If the effect of the time value of money is material, provisions are determined by discountingthe expected future cash flows specific to the liability. The discount rate used to determinethe present value is a pre tax rate that reflects current market assessments of the time valueof money and the risks specific to the liability. The unwinding of the discount is recognised asfinance cost.Contingent liabilities are disclosed when there is a possible obligation arising from past events,the existence of which will be confirmed only by the occurrence or non-occurrence of one ormore uncertain future events not wholly within the control of the Group or a presentobligation that arises from past events where it is either not probable that an outflow ofresources will be required to settle the obligation or a reliable estimate of the amount cannotbe made.
A contingent asset is not recognised but disclosed in the Restated Consolidated FinancialInformation where an inflow of economic benefit is probable.
Our capital commitments and contingent obligations were comprised primarily of our BankGuarantee and Tax dues.
Provisions, contingent assets and contingent liabilities are reviewed at each RestatedConsolidated Statement of Assets and Liabilities date.
(r) Earnings Per Share (EPS)Basic EPS is calculated by dividing the net profit or loss for the period attributable to equityshareholders by the weighted average number of equity shares outstanding during the period.
Diluted EPS is computed by dividing the net profit for the year by the weighted averagenumber of equity shares outstanding during the year as adjusted for the effects of all dilutivepotential equity shares, except where the results are anti-dilutive. The dilutive potential equityshares are adjusted for the proceeds receivable had the equity shares been actually issued atfair value (i.e. the average market valueof the outstanding equity shares). Dilutive potential equity shares are deemed converted as atthe beginning of the period, unless issued at a later date. Dilutive potential equity shares aredetermined independently for each period presented.
The number of equity shares and potentially dilutive equity shares are adjusted retrospectivelyfor all periods presented for any share splits and bonus shares issues including for changeseffected prior to the approval of the financial statements bythe Board of Directors.
(s) DividendThe final dividend on shares is recorded as a liability on the date of approval by theshareholders and interim dividends are recorded as a liability on the date of declaration by theHolding Company’s Board of Directors
231

Wellness Forever Medicare Limited(Formerly known as Wellness Forever Medicare Private Limited)Notes to the Restated Consolidated Financial Information(All amounts are in Rs. in millions unless otherwise stated)
(t) Foreign Currency TransactionsIn preparing the Restated Consolidated Financial Information of the Group, transactions incurrencies other than the Group’s functional currency (foreign currencies) are recognized atthe rates of exchange prevailing at the dates of the transactions. At the end of each reportingperiod, monetary items denominated in foreign currencies are translated at the ratesprevailing at the reporting date. Non-monetary items carried at fair value that aredenominated in foreign currencies are retranslated at the rates prevailing at the date whenthe fair value was determined. Non-monetary items that are measured in terms of historicalcost in a foreign currency are not translated. Exchange differences on monetary items arerecognized in the Restated Consolidated Statement of Profit and Loss in the period in whichthey arise.
(u) Segment ReportingThe board of directors have been identified as the Chief Operating Decision Maker (CODM) bythe Group. Operating segments are reported in a manner consistent with the internalreporting provided to the CODM of the Group. The CODM assesses the financial performanceand position of the Group as a whole, and makes strategic decisions.
The Group is primarily engaged in ‘Retail Pharmacy’ business through retail stores and onlinechannels which offers pharma, surgical and FMCG products to the customers, which in theterms of Ind AS 108 on ‘Operating Segments’ constitutes a single reporting segment which isalso reviewed by the Chief Operating Decision Maker (CODM). Accordingly, informationrequired to be presented under Ind AS-108 Operating Segments has been given in notes.
(v) Fair Value MeasurementsThe Group measures financial instrument at fair value at each Restated ConsolidatedStatement of Assets and Liabilities date. Fair value is the price that would receive to sell anasset or paid to transfer a liability in an orderly transaction between market participant at themeasurement date.The fair values of the financial assets and liabilities are included at the amount at which theinstrument could be exchanged in a current transaction between willing parties, other than ina forced or liquidation sale.
The following methods and assumptions were used to estimate the fair values:
1. Fair value of cash and deposits, trade and other receivables, trade payables, other currentliabilities, short term loans from banks approximate their carrying amounts largely due toshort term maturities of these instruments.
2. The fair values of non-current borrowings are based on discounted cash flows using acurrent borrowing rate. They are classified as level 3 fair values in the fair value hierarchydue to the use of unobservable inputs, including own credit risk.
3. For financial assets and liabilities that are measured at fair value, the carrying amountsare equal to the fair values.
The Group uses the fair value hierarchy for determining and disclosing the fair value offinancial instruments:
If the inputs used to measure the fair value of an asset or a liability fall into different levels ofthe fair value hierarchy, then the fair value measurement is categorised in its entirety in thesame level of the fair value hierarchy as the lowest level input that is significant to the entiremeasurement.
232

Wellness Forever Medicare Limited(Formerly known as Wellness Forever Medicare Private Limited)Notes to the Restated Consolidated Financial Information(All amounts are in Rs. in millions unless otherwise stated)
The Group recognises transfers between levels of the fair value hierarchy at the end of thereporting period during which the change has occurred.
(w) Significant accounting judgement, estimates and assumptionThe preparation of Restated Consolidated Financial Information requires Management tomake judgments, estimates and assumptions in the application of accounting policies thataffect the reported amounts of assets, liabilities, income and expenses. The estimates andassociated assumptions are based on historical experience and other factors that areconsidered to be relevant. Actual results may differ from these estimates. Continuousevaluation is done on the estimation and judgments based on historical experience and otherfactors, including expectations of future events that are believed to be reasonable.Revisions to accounting estimates are recognized in the period in which the estimate is revisedif the revision affects only that period, or in the period of the revision and future periods ofthe revision if it affects both current and future periods.
Information about critical judgments in applying accounting policies, as well as estimates andassumptions that have the most significant effect to the carrying amounts of assets andliabilities within the next financial year, are as follows:- Determination of the estimated useful lives of tangible assets and the assessment as to
which components of the cost may be capitalized [note 2(d)]- Determination of the estimated useful lives of intangible assets [note 2(e)]- Critical judgements required in the and key sources of estimation uncertainty application
of Ind AS 116 [note 2(n)]- Recognition and measurement of defined benefit obligations [note 2(l)]- Fair valuation of employee share options [note 2(m)]- Discounting of long-term financial liabilities- Fair value of financial instruments [note 2(j)]- Recognition and measurement of provisions and contingencies, key assumptions about
the likelihood and magnitude of an outflow of resources [note 2(q)]- Measurement of Expected credit losses, provision for inventory, return liability,
Commission, etc.
(x) First-time adoption - mandatory exceptions, optional exemptions
Overall principleThe Group has prepared the opening consolidated balance sheet as per lnd AS as at April 1,2018 (the transition date) by recognizing, decognizing or reclassifying items of assets andliabilities from previous GAAP (Accounting Standards notified under Section 133 of theCompanies Act, 2013, read together with Rule 7 of the Companies (Accounts) Rules, 2014 andCompanies (Accounting Standards) Amendment Rules, 2016 and referred to as Indian GAAP)to Ind AS (Indian Accounting Standards notified under Section 133 of the Companies Act, 2013read with Companies (Indian Accounting Standards) Rules, 2015, as amended and otherrelevant provisions of the Companies Act, 2013 and referred to as Ind AS) as per therequirements set out by Ind AS, and applying Ind AS in measurement of recognised assets andliabilities. However, this principle is subject to the certain exception and certain optionalexemptions availed by the Group as detailed below.
- Derecognition of financial assets and financial liabilitiesThe Group has applied the derecognition requirements of financial assets and financialliabilities prospectively for transactions occurring on or after April 1, 2019 (the transitiondate).
233

Wellness Forever Medicare Limited(Formerly known as Wellness Forever Medicare Private Limited)Notes to the Restated Consolidated Financial Information(All amounts are in Rs. in millions unless otherwise stated)
- Impairment of financial assetsThe Group has applied the impairment requirements of Ind AS 109 retrospectively;however, as permitted by Ind AS 101, it has used reasonable and supportable informationthat is available without undue cost or effort to determine the credit risk at the date thatfinancial instruments were initially recognised in order to compare it with the credit riskat the transition date. Further, the Group has not undertaken an exhaustive search forinformation when determining, at the date of transition to lnd ASs, whether there havebeen significant increases in credit risk since initial recognition, as permitted by Ind AS101.
- Designation of previously recognised financial instrumentsThe Group has designated financial liabilities and financial assets at fair value throughprofit or loss on the basis of the facts and circumstances that exist at the date of transitionto Ind AS.
3. Adoption of new and revised standards
In the current year, the Group has applied the below amendments to Ind ASs that are effectivefor an annual period that begins on or after 1 April 2020.
(i) Amendments to Ind AS 116 - Covid-19 related rent concessionsThe Group has adopted the amendments to Ind AS 116 for the first time in the current year.The amendments provide practical relief to lessees in accounting for rent concessionsoccurring as a direct consequence of COVID-19, by introducing a practical expedient to Ind AS116. The practical expedient permits a lessee to elect not to assess whether a COVID-19-related rent concession is a lease modification. A lessee that makes this election shall accountfor any change in lease payments resulting from the COVID-19-related rent concession thesame way it would account for the change applying Ind AS 116 if the change were not a leasemodification.
The practical expedient applies only to rent concessions occurring as a direct consequence ofCOVID-19 and only if all of the following conditions are met:(a) The change in lease payments results in revised consideration for the lease that issubstantially the same as, or less than, the consideration for the lease immediately precedingthe change;(b) Any reduction in lease payments affects only payments originally due on or before 30 June2021 (a rent concession meets this condition if it results in reduced lease payments on orbefore 30 June 2021 and increased lease payments that extend beyond 30 June 2021); and(c) There is no substantive change to other terms and conditions of the lease.
The Group has applied the practical expedient retrospectively to all eligible rent concessionsand has not restated prior period figures.
(ii) Amendments to Ind AS 1 and Ind AS 8 - Definition of “material”The Group has adopted the amendments to Ind AS 1 and Ind AS 8 for the first time in thecurrent year. The amendments make the definition of material in Ind AS 1 easier to understandand are not intended to alter the underlying concept of materiality in Ind ASs. The concept of'obscuring' material information with immaterial information has been included as part of thenew definition.
234

Wellness Forever Medicare Limited(Formerly known as Wellness Forever Medicare Private Limited)Notes to the Restated Consolidated Financial Information(All amounts are in Rs. in millions unless otherwise stated)
The threshold for materiality influencing users has been changed from 'could influence' to'could reasonably be expected to influence'. The definition of material in Ind AS 8 has beenreplaced by a reference to the definition of material in Ind AS 1. In addition, the MCA amendedother Standards that contain the definition of 'material' or refer to the term ‘material’ toensure consistency.
The adoption of the amendments does not have any material impact on the disclosures or onthe amounts reported in these Restated Consolidated Financial Information.
(iii) Recent accounting and other pronouncementsOn March 24, 2021, the Ministry of Corporate Affairs ("MCA") through a notification, amendedSchedule III of the Companies Act, 2013. The amendments revise Division I, II and III ofSchedule III and are applicable from April 1, 2021. Key amendments relating to Division II whichrelate to companies whose financial statements are required to comply with Companies(Indian Accounting Standards) Rules 2015 are:
Balance Sheet:
Lease liabilities should be separately disclosed under the head ‘Financial Liabilities’, dulydistinguished as current or non-current.
Certain additional disclosures in the Statement of Changes in Equity such as changes inequity share capital due to prior period errors and restated balances at the beginning ofthe current reporting period.
Specified format for disclosure of shareholding of promoters. Specified format for ageing schedule of trade receivables, trade payables, capital work-in-
progress and intangible asset under development. If an entity has not used funds for the specific purpose for which it was borrowed from
banks and financial institutions, then disclosure of details of where it has been used. Specific disclosure under ‘additional regulatory requirement’ such as compliance with
approved schemes of arrangements, compliance with number of layers of companies,ratios, title deeds of immovable property not held in name of company, loans andadvances to promoters, directors, key managerial personnel (KMP) and related parties,details of benami property held etc.
Statement of profit and loss:
Additional disclosures relating to Corporate Social Responsibility (CSR), undisclosedincome and crypto or virtual currency specified under the head ‘additional information’ inthe notes forming part of the financial statements.
The Group will evaluate the amendments and its applicability to the Group and give effectto them as required by law.
235

(Formerly known as Wellness Forever Medicare Private Limited)
All amounts are in Rs.in millions unless otherwise stated
Note As at March 31, 2020 As at April 1, 20191,842.47 1,211.74
- Other adjustments d (1.56) 2.34- Tax adjustments 35.48 30.71
(155.25) (41.29)
1,687.22 1,170.45
Note As at March 31, 2019(Proforma)
As at April 1, 2018(Proforma)
1,211.74 1,171.98
- Other adjustments d 2.34 (2.48)- Tax adjustments 68.31 19.73
(100.93) (49.08)1,110.81 1,122.90
(iii) Reconciliation of Total Comprehensive Income for the year ended March 31, 2020 and March 31, 2019:Note For the year ended
March 31, 2020For the year ended
March 31, 2019(Proforma)
87.15 46.93
(1.72) (1.84)
b (108.65) (97.12)
c (4.45) (4.81)
e (29.57) -f (0.09) (2.48)
- Other adjustments d (0.65) (5.27)4.78 51.26
Total adjustment to profit or loss (140.36) (60.26)
(53.21) (13.33)
Remeasurement of defined benefit plans (net of deferred tax) f 0.36 (2.42)(52.85) (15.75)
Wellness Forever Medicare Limited
Notes to the Restated Consolidated Financial Information
Note 4: Reconciliation of total equity and total comprehensive income
ParticularsTotal equity (shareholder's funds) under previous GAAP
(i) Reconciliation of total equity as at March 31, 2020 and April 01, 2019 on first time adoption of Ind AS
Adjustments on account of Ind AS increase/(decrease):- Adjustment on account of revenue recognition in accordance with Ind AS 115 Revenue
and expected credit losses in accordance with Ind AS 109a (8.31) (6.58)
- Adjustment on account of transition to Ind AS 116 - Leases and security deposits inaccordance with Ind AS 109
b (116.21) (7.55)
- Adjustment on account of Ind AS 16 - Property, plant and equipment and IND AS 38 -Intangible assets
c (64.65) (60.20)
Total adjustment to equity
Total equity under Ind AS
Particulars
Profit after tax as per previous GAAPAdjustments :
a- Adjustment on account of revenue recognition in accordance with Ind AS 115 Revenue andexpected credit losses in accordance with Ind AS 109
- Tax adjustments
- Adjustment on account of transition to Ind AS 116 - Leases and security deposits in accordancewith Ind AS 109
- Adjustment on account of Ind AS 16 - Property, plant and equipment and IND AS 38 - Intangibleassets
- Adjustment on account of Ind AS 102 - Share based payments- Adjustment on account of Ind AS 19 (remeasurement of defined benefits plans classified in OCI)
Profit After Tax under Ind AS
Other Comprehensive Income
Total comprehensive income under Ind ASNote: Total Comprehensive Income was not reported under previous GAAP. Therefore the reconciliation starts with profit under previous GAAP.
(ii) Reconciliation of total equity as at March 31, 2019 and April 01, 2018 (Proforma)
Particulars
Total equity (shareholder's funds) under previous GAAPAdjustments on account of Ind AS increase/(decrease):
- Adjustment on account of revenue recognition in accordance with Ind AS 115 Revenueand expected credit losses in accordance with Ind AS 109
a (6.58) (4.59)
- Adjustment on account of transition to Ind AS 116 - Leases and security deposits inaccordance with Ind AS 109
Total adjustment to equityTotal equity under Ind AS as per restated consolidated statement of assets and liabilities
b (104.79) (6.34)
- Adjustment on account of Ind AS 16 - Property, plant and equipment and IND AS 38 -Intangible assets
c (60.20) (55.40)
236

a.
i.
ii.
b.
c.
d.
(iii) There are no material adjustments to the Statement of Cash Flows, presented under Ind AS as compared to previous GAAP.
Other adjustments includes -Dividend Payable - Under previous GAAP, the Holding Company has recorded dividend payable including dividend distribution taxes as a liability inthe period to which the same pertains to. Under Ind AS, the Holding Company has accounted the dividend payable in the year in which theobligation to pay is established.
Non Current Investments - Under previous GAAP, non-current investments were stated at cost. Where applicable, provision was made to recognisea decline, other than temporary, in valuation of such investments. Under Ind AS, equity instruments (other than investment in subsidiary) havebeen classified as Fair Value through Profit and Loss (FVTOCI) at the date of transition.
Long Term Borrowings - Under the previous GAAP, long term borrowings were recorded at their transaction value. Under Ind AS, all financialliabilities are required to be recognised at fair value. Accordingly, the Group has fair valued these long term borrowings under Ind AS. Differencebetween the fair value and transaction value has been adjusted to the long term borrowings.
Employee stock option expense – Under the previous GAAP, the cost of equity-settled employee share-based plan were recognised using theintrinsic value method. Under Ind AS, the cost of equity-settled share based plan is recognised based on the fair value of the Options as at the grantdate.
Other comprehensive income – Under Ind AS, all items of income and expense recognised during the year should be included in profit or loss forthe year, unless a standard requires or permits otherwise. Items of income and expense that are not recognised in profit or loss are shown in theStatement of Profit and Loss as “other comprehensive income”. The concept of other comprehensive income did not exist under previous GAAP.
The explanatory notes :Under Previous GAAP, the provision for bad and doubtful debt was based on management judgement and required accounting estimates. UnderIND AS the Group applies expected credit loss (ECL) model for recognising impairment loss on these financial assets.Further, as per Ind AS 115, cash discount and right to return liability has been reduced from revenue. The right to return liability has been disclosedseparately under Other Provision.
Under the previous GAAP, lease payments were recorded at their transaction value. Under IND AS, as per Ind AS 116, the Group has recognised aright-of-use-assets (an amount equal to the lease liability, adjusted by the prepaid lease rent). Further, the operating lease expenses has changedfrom rent to depreciation cost for the right of use assets and finance cost for interest accrued on lease liability. The Group has also fair valued allthe finance lease receivable under Ind AS. Difference between the fair value and transaction value of the finance lease receivable has beenrecognised as lease receivable.
Under the previous GAAP, interest free security deposits on leases (that are refundable on completion of the lease term) are recorded at theirtransaction value. Under Ind AS, all financial assets are required to be recognised at fair value. Accordingly, the Group has fair valued these securitydeposits under Ind AS. Difference between the fair value and transaction value of the security deposit has been recognised as Right to Use of Asset.
Property plant and equipments & Intangible assets – Under the previous GAAP, certain pre-operative expenses were capitalised in the cost ofproperty plant and equipment and intangible assets. Under Ind AS, these expenses have been identified and specifically excluded from the cost ofproperty, plant and equipments and intangible assets on the date of transition
237
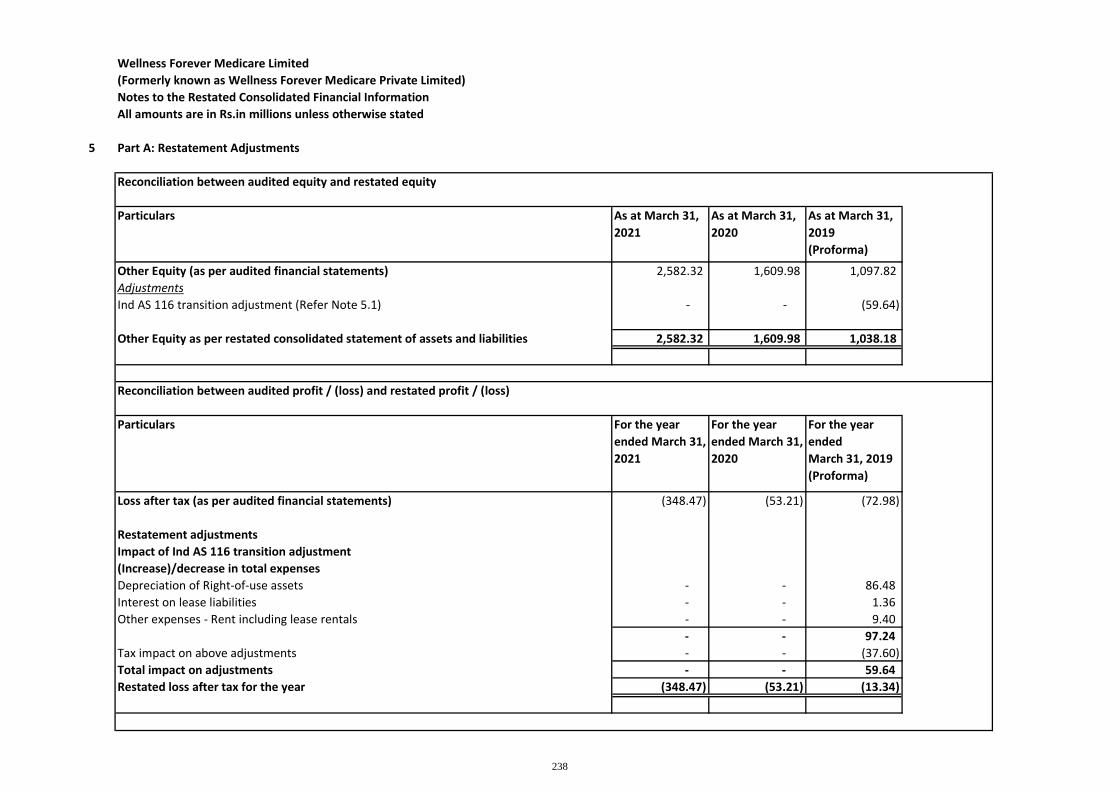
Wellness Forever Medicare Limited(Formerly known as Wellness Forever Medicare Private Limited)Notes to the Restated Consolidated Financial InformationAll amounts are in Rs.in millions unless otherwise stated
5 Part A: Restatement Adjustments
Reconciliation between audited equity and restated equity
Particulars As at March 31,2021
As at March 31,2020
As at March 31,2019(Proforma)
Other Equity (as per audited financial statements) 2,582.32 1,609.98 1,097.82AdjustmentsInd AS 116 transition adjustment (Refer Note 5.1) - - (59.64)
Other Equity as per restated consolidated statement of assets and liabilities 2,582.32 1,609.98 1,038.18
Reconciliation between audited profit / (loss) and restated profit / (loss)
Particulars For the yearended March 31,2021
For the yearended March 31,2020
For the yearendedMarch 31, 2019(Proforma)
Loss after tax (as per audited financial statements) (348.47) (53.21) (72.98)
Restatement adjustmentsImpact of Ind AS 116 transition adjustment(Increase)/decrease in total expensesDepreciation of Right-of-use assets - - 86.48Interest on lease liabilities - - 1.36Other expenses - Rent including lease rentals - - 9.40
- - 97.24Tax impact on above adjustments - - (37.60)Total impact on adjustments - - 59.64Restated loss after tax for the year (348.47) (53.21) (13.34)
238

5.1 Notes to adjustments
Particulars Restatedbalance as at
March 31, 2019
Add:Adjustment onaccount oftransition to IndAS 116
Balance as atApril 1, 2019*
Right-of-use assets 1,455.98 86.48 1,542.46Deferred tax 68.83 (37.60) 31.23Retained earnings 128.63 (59.64) 188.28Lease liability 1,497.36 21.67 1,475.69Loans (security deposit) 238.86 1.36 240.22Trade payables (rent payable) 336.75 (12.27) 349.02
Ind AS 116 - Leases effective from April 1, 2019, prescribes accounting of the lease contracts/arrangements. The Group had applied Ind AS 116 for preparing theInd AS audited financial statements for the period beginning from April 1, 2019. For the purpose of preparing Restated Consolidated Financial Information, Ind AS116 has been applied using the modified retrospective approach with effect from April 1, 2018 as prescribed by ICDR, 2018.
Effective April 1, 2018, the Group had recognised lease liability measured at an amount equal to present value of remaining lease payments and correspondingRight of Use asset at an amount equivalent to lease liability adjusted by the amount of any prepaid or accrued lease payments relating to that lease recognised inthe balance sheet immediately before April 1, 2018. ROU assets are being amortized over the period of the lease. Interest on lease liabilities are recognised ascharge following incremental rate of borrowing method and lease liabilities (including interest) are adjusted either on settlement through periodic payouts or onreversal for rent concessions negotiated with lessors.
The Group has followed the same accounting policy choices (transition options as per Ind AS 116) as adopted on April 1, 2019 for transition to Ind AS 116, whilepreparing the Restated Consolidated Financial Information for each of the year ended March 31, 2021, March 31, 2020 and March 31, 2019. As specified in theGuidance Note, the equity balance computed under Restated Consolidated Financial Information for the year ended March 31, 2019 and equity balancecomputed on transition (using modified restrospective approach) to Ind AS 116 on April 1, 2019, differs due to restatement adjustments made for year endedMarch 31, 2019. Accordingly, following balances as at March 31, 2019 of the Restated Consolidated Financial Information has not been carried forward toopening balance sheet as at April 1, 2019. The reconciliation difference is as below:
Part B : Reconciliation of total equity as per restated consolidated financial information as at March 31, 2019 with total opening equity as at April 1, 2019 asper audited financial statements as at and for the year ended March 31 2021:
* Balance as at April 1, 2019 after adjustment of impact of adoption of Ind AS 116 w.e.f April 1, 2019 as per audited financial statement for the year ended March31, 2020 (i.e. comparative figures for March 2021)
239

Part C : Non adjusting items
a) Audit qualifications for the respective years, which do not require any adjustments in the restated consolidated financial information are as follows:
Part D : Material RegroupingAppropriate re-groupings have been made in the Restated Consolidated Statement of Assets and Liabilities, Statement of Profit and Loss and Statement of cashflows, wherever required, by reclassification of the corresponding items of income, expenses, assets, liabilities and cash flows, in order to bring them in line withthe accounting policies and classification as per the Ind AS financial information of the Group for the year ended March 31, 2021 prepared in accordance withSchedule III of Companies Act, 2013, requirements of Ind AS 1 and other applicable Ind AS principles and the requirements of the Securities and Exchange Boardof India (Issue of Capital & Disclosure Requirements) Regulations, 2018, as amended.
1) There are no audit qualification in auditor's reports on the financial statements for financial years ended March 31, 2021, March 31, 2020 and March 31, 2019.Financial years ended March 31, 2020 and March 31, 2019 were audited by previous auditors.
b) Emphasis of matters not requiring adjustments to restated consolidated financial information: Refer Note 2(a)(ii) of Restated Consolidated FinancialInformation
240

Wellness Forever Medicare Limited(Formerly known as Wellness Forever Medicare Private Limited)Notes to the Restated Consolidated Financial InformationAll amounts are in Rs.in millions unless otherwise stated
6 Property, plant and equipmentParticulars Computers Air
conditionersPlant &
machineryOffice
equipmentFurniture
and fixturesVehicles Office
premisesTotal
I. Cost
Balance as at April 1, 2018 (proforma) 60.39 24.25 0.77 57.42 526.14 5.28 13.03 687.28Additions 25.23 10.97 0.37 12.25 146.20 0.27 - 195.29Disposals (3.77) (1.03) - (4.39) (29.84) - (13.03) (52.06)Balance as at March 31, 2019 (proforma) 81.85 34.19 1.14 65.28 642.50 5.55 - 830.51Additions 34.13 9.55 0.11 15.68 154.79 0.55 - 214.81Disposals (0.46) (0.24) - (0.57) (9.56) - - (10.83)Balance as at March 31, 2020 115.52 43.50 1.25 80.39 787.73 6.10 - 1,034.49Additions 85.11 33.77 - 70.13 286.82 1.12 - 476.95Disposals (5.41) (2.35) (1.25) (5.38) (22.14) - - (36.53)Balance as at March 31, 2021 195.22 74.92 - 145.14 1,052.41 7.22 - 1,474.91
II. Accumulated depreciation for the year
Balance as at April 1, 2018 (proforma) 41.67 12.81 0.02 32.10 160.88 1.55 9.93 258.96Depreciation expense for the year 12.48 4.00 0.06 8.73 54.55 0.51 0.52 80.85Eliminated on disposal of assets (3.18) (0.83) - (3.91) (11.92) - (10.45) (30.29)Balance as at March 31, 2019 (proforma) 50.97 15.98 0.08 36.92 203.51 2.06 - 309.52Depreciation expense for the year 17.83 6.04 0.08 10.57 67.19 0.58 - 102.29Eliminated on disposal of assets (0.39) (0.02) - (0.19) (1.73) - - (2.33)Balance as at March 31, 2020 68.41 22.00 0.16 47.30 268.97 2.64 - 409.48Depreciation expense for the year 30.68 8.72 0.24 14.45 233.04 0.60 - 287.73Eliminated on disposal of assets (2.14) (2.06) (0.40) (2.94) (5.80) - - (13.34)Balance as at March 31, 2021 96.95 28.66 - 58.81 496.21 3.24 - 683.87
III. Net block Balance (I-II)As on March 31, 2021 98.27 46.26 - 86.33 556.20 3.98 - 791.04As on March 31, 2020 47.11 21.50 1.08 33.09 518.76 3.46 - 625.00As on March 31, 2019 (proforma) 30.88 18.21 1.06 28.36 438.99 3.49 - 520.99As on April 1, 2018 (proforma) 18.72 11.44 0.75 25.32 365.26 3.73 3.10 428.32
Notes:6.1 Refer Note 2 (x) For first time adoption options availed by the Group on the transition to Ind AS.
6.2 Assets pledged as security for borrowings
6.3
6.4
Property, Plant and equipment in respect of Holding Company with carrying value of Rs. 788.72 millions as on March 31, 2021 (as on March 31, 2020 Rs. 603.34 millions, as on March 31, 2019 Rs.516.71 millions and as on April 1, 2018 Rs.426.78 millions) have been pledged against term loans from banks. Refer note 23- Borrowings.
There are no impairment losses recognised during the current year and previous years.
Effective April 1, 2020, the Group has revised the estimated useful lives of its Furniture and Fixture (Property, Plant and Equipment) at stores in line with average lease term i.e. 5 years, where suchfurniture and fixtures are used. Accordingly, the unamortised depreciable amounts are being depreciated over the revised remaining useful lives. These have the net impact of increasing depreciationcharge for the year by Rs. 142.92 millions.
241

6.5 Capital work-in-progressParticulars Furniture
and fixturesBalance as at April 1, 2018 (proforma) -Additions -Transfers to furniture and fixtures -Balance as at March 31, 2019 (proforma) -Additions -Transfers to furniture and fixtures -Balance as at March 31, 2020 -Additions 5.29Transfers to furniture and fixtures -Balance as at March 31, 2021 5.29
242

Wellness Forever Medicare Limited(Formerly known as Wellness Forever Medicare Private Limited)Notes to the Restated Consolidated Financial InformationAll amounts are in Rs.in millions unless otherwise stated
7 Right-of-use assetsParticulars Furniture and
fixturesPremises Total
I. Cost
Balance as at April 1, 2018 (proforma) - 951.12 951.12Additions 57.83 873.79 931.62Balance as at March 31, 2019 (proforma) 57.83 1,824.91 1,882.74Ind AS 116 transition adjustments (3.64) (336.64) (340.28)Balance as at April 1, 2019 54.19 1,488.27 1,542.46Additions 13.48 740.14 753.61Balance as at March 31, 2020 67.67 2,228.41 2,296.07Additions 37.66 701.06 738.71Disposals - (64.98) (64.98)Balance as at March 31, 2021 105.33 2,864.49 2,969.80
II. Accumulated depreciation
Balance as at April 1, 2018 (proforma) - - -Depreciation expense for the year 4.80 421.96 426.76Balance as at March 31, 2019 (proforma) 4.80 421.96 426.76Ind AS 116 transition adjustments (4.80) (421.96) (426.76)Balance as at April 1, 2019 - - -Depreciation expense for the year 13.95 540.35 554.30Balance as at March 31, 2020 13.95 540.35 554.30Depreciation expense for the year 33.58 616.69 650.27Eliminated on disposal - (7.90) (7.90)Balance as at March 31, 2021 47.53 1,149.14 1,196.67
III. Net block balance (I-II)As on March 31, 2021 57.79 1,715.35 1,773.14As on March 31, 2020 53.72 1,688.06 1,741.77As on March 31, 2019 (proforma) 53.03 1,402.95 1,455.98As on April 1, 2018 (proforma) - 951.12 951.12
243
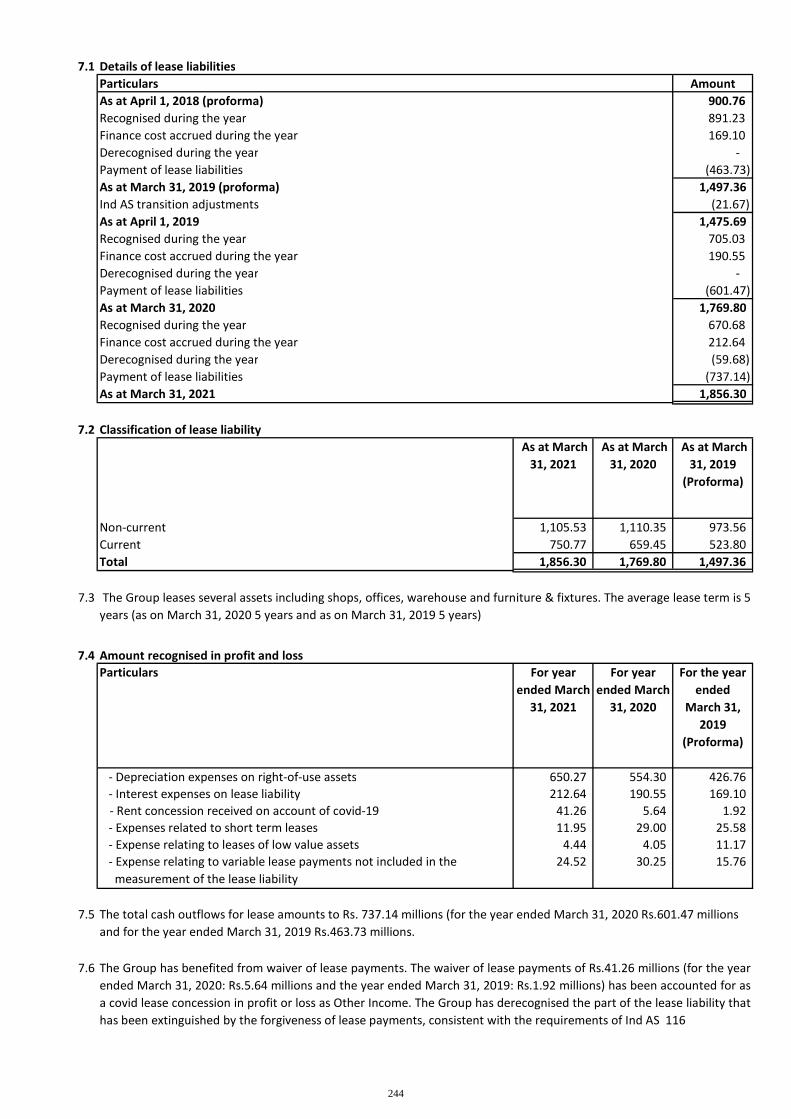
7.1 Details of lease liabilitiesParticulars AmountAs at April 1, 2018 (proforma) 900.76Recognised during the year 891.23Finance cost accrued during the year 169.10Derecognised during the year -Payment of lease liabilities (463.73)As at March 31, 2019 (proforma) 1,497.36Ind AS transition adjustments (21.67)As at April 1, 2019 1,475.69Recognised during the year 705.03Finance cost accrued during the year 190.55Derecognised during the year -Payment of lease liabilities (601.47)As at March 31, 2020 1,769.80Recognised during the year 670.68Finance cost accrued during the year 212.64Derecognised during the year (59.68)Payment of lease liabilities (737.14)As at March 31, 2021 1,856.30
7.2 Classification of lease liabilityAs at March
31, 2021As at March
31, 2020As at March
31, 2019(Proforma)
Non-current 1,105.53 1,110.35 973.56Current 750.77 659.45 523.80Total 1,856.30 1,769.80 1,497.36
7.3
7.4 Amount recognised in profit and lossParticulars For year
ended March31, 2021
For yearended March
31, 2020
For the yearended
March 31,2019
(Proforma)
- Depreciation expenses on right-of-use assets 650.27 554.30 426.76- Interest expenses on lease liability 212.64 190.55 169.10- Rent concession received on account of covid-19 41.26 5.64 1.92- Expenses related to short term leases 11.95 29.00 25.58- Expense relating to leases of low value assets 4.44 4.05 11.17- Expense relating to variable lease payments not included in the
measurement of the lease liability24.52 30.25 15.76
7.5
7.6 The Group has benefited from waiver of lease payments. The waiver of lease payments of Rs.41.26 millions (for the yearended March 31, 2020: Rs.5.64 millions and the year ended March 31, 2019: Rs.1.92 millions) has been accounted for asa covid lease concession in profit or loss as Other Income. The Group has derecognised the part of the lease liability thathas been extinguished by the forgiveness of lease payments, consistent with the requirements of Ind AS 116
The Group leases several assets including shops, offices, warehouse and furniture & fixtures. The average lease term is 5years (as on March 31, 2020 5 years and as on March 31, 2019 5 years)
The total cash outflows for lease amounts to Rs. 737.14 millions (for the year ended March 31, 2020 Rs.601.47 millionsand for the year ended March 31, 2019 Rs.463.73 millions.
244
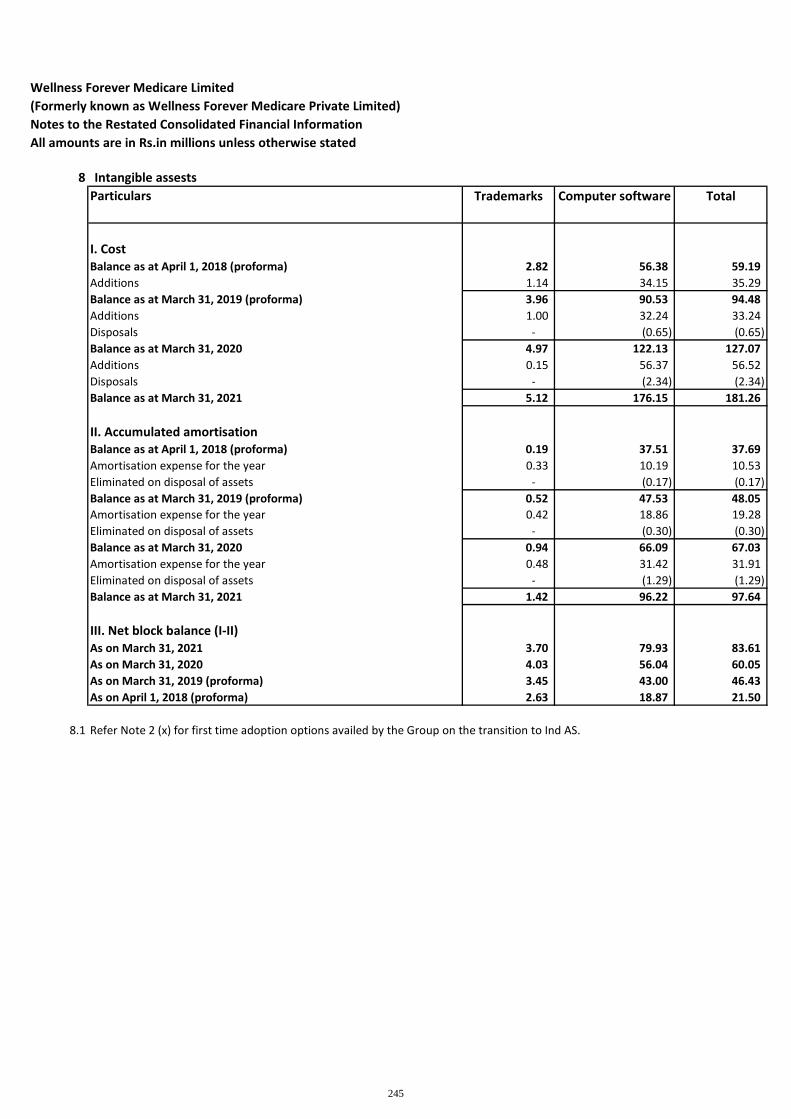
Wellness Forever Medicare Limited(Formerly known as Wellness Forever Medicare Private Limited)Notes to the Restated Consolidated Financial InformationAll amounts are in Rs.in millions unless otherwise stated
8 Intangible assestsParticulars Trademarks Computer software Total
I. CostBalance as at April 1, 2018 (proforma) 2.82 56.38 59.19Additions 1.14 34.15 35.29Balance as at March 31, 2019 (proforma) 3.96 90.53 94.48Additions 1.00 32.24 33.24Disposals - (0.65) (0.65)Balance as at March 31, 2020 4.97 122.13 127.07Additions 0.15 56.37 56.52Disposals - (2.34) (2.34)Balance as at March 31, 2021 5.12 176.15 181.26
II. Accumulated amortisationBalance as at April 1, 2018 (proforma) 0.19 37.51 37.69Amortisation expense for the year 0.33 10.19 10.53Eliminated on disposal of assets - (0.17) (0.17)Balance as at March 31, 2019 (proforma) 0.52 47.53 48.05Amortisation expense for the year 0.42 18.86 19.28Eliminated on disposal of assets - (0.30) (0.30)Balance as at March 31, 2020 0.94 66.09 67.03Amortisation expense for the year 0.48 31.42 31.91Eliminated on disposal of assets - (1.29) (1.29)Balance as at March 31, 2021 1.42 96.22 97.64
III. Net block balance (I-II)As on March 31, 2021 3.70 79.93 83.61As on March 31, 2020 4.03 56.04 60.05As on March 31, 2019 (proforma) 3.45 43.00 46.43As on April 1, 2018 (proforma) 2.63 18.87 21.50
8.1 Refer Note 2 (x) for first time adoption options availed by the Group on the transition to Ind AS.
245

Wellness Forever Medicare Limited(Formerly known as Wellness Forever Medicare Private Limited)Notes to the Restated Consolidated Financial InformationAll amounts are in Rs.in millions unless otherwise stated
9 Investments
No. ofshares
Amount No. ofshares
Amount No. ofshares
Amount
Non-currentUnquoted investments (fully paid)
(i) Investment in equity instruments
At fair value through profit and loss (FVTPL)
Zon Healthcare Consulting Private Limited(Rs. 10/- each, fully paid-up) [Refer note 9.1]
- - - - 2,000 -
Total aggregate unquoted investments - - -
Total investments - - -
Current(a) Investments in mutual funds (quoted)(at fair value through profit and loss account (FVTPL))
Aditya Birla Sun Life Savings Fund - Growth - Direct Plan 1,87,636 80.09 - - - -
Total investments 80.09 - -
Aggregate carrying amount of quoted investments 80.09 - -Aggregate market value of quoted investments 80.09 - -
9.1
9.2 Category-wise other investments- As per Ind AS 109 classificationParticular As at March
31, 2021As at March
31, 2020As at March
31, 2019(Proforma)
Investments measured at FVTPL 80.09 - -Investments carried at amortised cost - - -Investments designated at FVTOCI - equity instruments - - -
9.3 The valuation methodology for these investments is disclosed in note 44(1)
The Holding Company had made an investment of 2000 shares aggregating to Rs 3.00 millions in Zon Healthcare Consulting Private Limited (Zon) in an earlieryear, wherein it holds 20 per cent of the equity share capital of Zon. The directors of the Holding Company do not consider that the Holding Company is able toexercise significant influence over Zon as the other 80 per cent of the equity share capital is held by other shareholders, who also manages the day-to-dayoperations of that entity and hence, was not considered as an associate of the Holding Company. The fair value of Zon has been determined as Nil as on March31, 2019, which has thereafter been struck off from the Register of Companies maintained by the Registrar of Companies, Ministry of Corporate Affairs inNovember, 2019.
As at March 31, 2021 As at March 31, 2020 As at March 31, 2019(Proforma)
Particular
246

Wellness Forever Medicare Limited(Formerly known as Wellness Forever Medicare Private Limited)
Notes to the Restated Consolidated Financial InformationAll amounts are in Rs.in millions unless otherwise stated
10 LoansParticulars As at March
31, 2021As at March
31, 2020As at March
31, 2019(Proforma)
Non-current
(a) Security deposits- Unsecured, considered good 240.51 192.38 159.22- Unsecured, considered doubtful 19.15 - -
259.66 192.38 159.22Less: Provison for doubtful deposits (19.15) - -
240.51 192.38 159.22
(b) Loans to employees - Unsecured, considered cood 4.32 - -
Total 244.83 192.38 159.22
CurrentUnsecured, considered good(a) Security deposits 60.66 112.11 77.18(b) Loans to employees 13.52 2.89 2.46
Total 74.18 115.01 79.64
11 Other financial assetsParticulars As at March
31, 2021As at March
31, 2020As at March
31, 2019(Proforma)
Non-current(a) Deposits with bank
- Margin money deposits with banks (held as lien by bank) 82.40 10.11 9.55- Long term deposits with banks with remaining maturity period more
than 12 months10.63 - -
Total 93.03 10.11 9.55
Current(a) Insurance claims receivables 6.68 - -(b) Receivable for sale of asset 0.02 - -(c) Other receivables 55.63 40.78 23.70
Total 62.33 40.78 23.70
12 Non-current tax assets (net)Particulars As at March
31, 2021As at March
31, 2020As at March
31, 2019(Proforma)
Advance tax (net of provisions) 15.74 6.62 6.51
Total 15.74 6.62 6.51
247

Wellness Forever Medicare Limited(Formerly known as Wellness Forever Medicare Private Limited)Notes to the Restated Consolidated Financial InformationAll amounts are in Rs.in millions unless otherwise stated
13 Deferred tax asset (net)
13.1 Deferred tax assets/(liabilities) in relation to the year ended March 31, 2021Particulars Opening Balance
as at April 01,2020
Recognised inProfit or loss
Recognised inOther
comprehensiveincome
Recogniseddirectly in Equity
Closing balanceas at March 31,
2021
Property, plant and equipment 29.62 30.49 - - 60.11Intangible assets (12.90) (3.22) - - (16.11)Leases liability 28.60 74.37 - - 102.97FVTPL financial assets 0.62 (0.64) - - (0.02)Provision for doubtful debts 1.84 1.22 - - 3.06Defined benefit obligation 7.15 3.58 0.70 - 11.42Other financial liabilities (0.37) (0.34) - - (0.71)Share based payments 7.23 (3.69) - - 3.54Provision for refund liability 0.24 0.10 - - 0.34Provision for doubtful balances - (2.33) - - (2.33)Provision for shrinkage and near expiry - 10.12 - - 10.12Total 62.03 109.67 0.70 - 172.40
13.2 Deferred tax assets/(liabilities) in relation to the year ended March 31, 2020Particulars Opening Balance
as at April 01,2019
Recognised inProfit or loss
Recognised inOther
comprehensiveincome
Recogniseddirectly in Equity
Closing balanceas at March 31,
2020
Property, plant and equipment 31.68 (2.05) - - 29.62Intangible assets (13.32) 0.42 - - (12.90)Leases 2.59 26.01 - - 28.60FVTPL financial assets 1.05 (0.42) - - 0.62Provision for doubtful debts 2.02 (0.18) - - 1.84Defined benefit obligation 6.12 1.09 (0.07) - 7.15Other financial liabilities (0.75) 0.37 - - (0.37)Share based payments 1.58 5.65 - - 7.23Provision for refund liability 0.26 (0.02) - - 0.24Provision for doubtful balances - - - - -Provision for shrinkage and near expiry - -Total 31.23 30.87 (0.07) - 62.03
Deferred tax assets/(liabilities) as at April 01, 2019Particulars Opening Balance
as on March 31,2019
(Proforma)
Recognised inRetained earning
as on April 1,2019
Recognised inOCI
as on April 1,2019
Recogniseddirectly in Equity
As on April 1,2019
Closing balanceAs on April 1,
2019
Property, plant and equipment 31.68 - - - 31.68Intangible assets (13.32) - - - (13.32)Leases liability 40.19 (37.60) - - 2.59FVTPL financial assets 1.05 - - - 1.05Provision for doubtful debts 2.02 - - - 2.02Defined benefit obligation 6.12 - - - 6.12Other financial liabilities (0.75) - - - (0.75)Share based payments 1.58 - - - 1.58Provision for refund liability 0.26 - - - 0.26Provision for doubtful balances - - - - -Provision for shrinkage and near expiry - - - - -
Total 68.83 (37.60) - - 31.23
13.3 Deferred tax assets/(liabilities) in relation to the year ended March 31, 2019 (proforma)Particulars Opening Balance
as at April 01,2018 (Proforma)
Recognised inProfit or loss
Recognised inOther
comprehensiveincome
Recogniseddirectly in Equity
Closing balanceas at March 31,
2019 (Proforma)
Property, plant and equipment 15.65 16.02 - - 31.68Intangible assets (6.51) (6.81) - - (13.32)Leases liability 2.19 38.00 - - 40.19FVTPL financial assets 1.04 0.01 - - 1.05Provision for doubtful debts 1.39 0.63 - - 2.02Defined benefit obligation (2.86) 7.68 1.30 - 6.12Other financial liabilities 0.14 (0.88) - - (0.75)Share based payments - 1.58 - - 1.58Provision for refund liability 0.19 0.07 - - 0.26Provision for doubtful balances - - - - -Provision for shrinkage and near expiry - - - - -Total 11.22 56.30 1.30 - 68.83
248

Wellness Forever Medicare Limited(Formerly known as Wellness Forever Medicare Private Limited)Notes to the Restated Consolidated Financial InformationAll amounts are in Rs.in millions unless otherwise stated
14 Other assetsParticulars As at March 31,
2021As at March 31,
2020As at March
31, 2019(Proforma)
Non-current(a) Capital advances 33.17 47.22 -
Total 33.17 47.22 -
Current(a) Advances to suppliers and others 89.60 50.91 1.77
(b) Balances with government authorities (other than income taxes)- VAT credit receivable 0.08 13.68 23.87- GST credit receivable 75.49 24.37 27.33
75.57 38.06 51.20
(c) Prepaid expenses 11.34 22.17 10.17(d) Other assets - 0.06 0.12
Total 176.51 111.21 63.25
15 InventoriesParticulars As at March 31,
2021As at March 31,
2020As at March
31, 2019(Proforma)
Stock-in-trade (at lower of cost or net realisable value) 1,554.69 1,299.71 1,063.88
Total 1,554.69 1,299.71 1,063.88
15.1 The value of inventories in transit was Nil (as at March 31, 2020: Nil and as at March 31, 2019: Nil)
15.2
15.3
15.4 The mode of valuation of inventories has been stated in note 2(g)
The cost of inventories recognised as an expense during the year in respect of continuing operations was Rs.6,809.51 millions (forthe year ended March 31, 2020: Rs.6,302.83 millions and for the year ended March 31, 2019: Rs.4,873.85 millions
Inventories with a carrying amount of Rs. 1,533.06 millions (as on March 31, 2020: Rs.1,246.78 millions and as on March 31, 2019: Rs.1,051.19 millions) have been pledged as security for certain of the Holding Company’s cash credit facilities and workingcapital demand loan. Refer Note 23.
249

Wellness Forever Medicare Limited(Formerly known as Wellness Forever Medicare Private Limited)Notes to the Restated Consolidated Financial InformationAll amounts are in Rs.in millions unless otherwise stated
16 Trade receivablesParticulars As at March 31,
2021As at March 31,
2020As at March
31, 2019(Proforma)
Trade receivables(a) Unsecured, considered good 285.96 232.23 210.27(b) Unsecured, considered doubtful 12.15 7.29 5.78
298.11 239.52 216.06
Less: Allowance for doubtful debts (12.15) (7.29) (5.78)Total 285.96 232.23 210.28
16.1 The average credit period on sales of goods is 90 days. No interest is charged on trade receivables.
16.2
16.3 Aging of receivables
Age of receivablesAs at March 31,
2021As at March 31,
2020As at March
31, 2019(Proforma)
Within the credit period 242.27 234.72 197.451-90 days past due 48.61 3.15 18.0391-180 days past due 7.23 1.66 0.57Total 298.11 239.53 216.06
16.4 Expected credit loss rate
Trade receivables – days past dueAs at March 31,
2021As at March 31,
2020As at March
31, 2019(Proforma)
Within the credit period 0.10%-50.00% 0.10%-50.00% 0.10%-50.00%1-90 days past due 5.00%-100.00% 5.00%-100.00% 5.00%-100.00%91-180 days past due 7.50%-100.00% 7.50%-100.00% 7.50%-100.00%
16.5 Movement in the expected credit loss allowance
Particulars
For the yearended
March 31, 2021
For the yearended
March 31, 2020
For the yearended
March 31, 2019(Proforma)
Balance at beginning of the year 7.30 5.78 4.01Movement in expected credit loss allowance on trade receivables calculated 4.85 1.51 1.77
Balance at end of the year 12.15 7.29 5.78
16.6 Trade Receivables from related parties are disclosed separately under note 41.
The Group has used a practical expedient by computing the expected credit loss allowance for trade receivables based on a provisionmatrix. The provision matrix takes into account historical credit loss experience and adjusted for forward-looking information. Theexpected credit loss allowance is based on the ageing of the days the receivables are due and the rates as given in the provisionmatrix.
250

17 Cash and cash equivalentsParticulars As at March 31,
2021As at March 31,
2020As at March
31, 2019(Proforma)
(a) Cash on hand 37.70 58.08 24.80(b) Balances with banks 132.41 104.35 34.62
Total 170.11 162.43 59.4217.1
18 Bank balances other than cash and cash equivalentsParticulars As at March 31,
2021As at March 31,
2020As at March
31, 2019(Proforma)
(a) Earmarked balances with bank- Held as margin money deposits with bank 82.66 56.70 53.16
(b) Term deposits with bank (with original maturity of more than threemonths but less than twelve months)
384.89 - -
Total 467.55 56.70 53.16
19 Right-to-returned goods assetParticulars As at March 31,
2021As at March 31,
2020As at March
31, 2019(Proforma)
Right-to-returned goods asset 3.88 2.72 2.19
Total 3.88 2.72 2.19
The right to returned goods asset represents the Group’s right to recover products from customers where customers exercise theirright of return under the Group’s returns policy. The Group uses its accumulated historical experience to estimate the number ofreturns on a portfolio level using the expected value method.
As at March 31, 2021 in respect of the subsidiary company, Cash credit account with IDFC First Bank Limited is having a debit balance, hence presented under cash and cash equivalent Also refer note no. 23.1(n)
251

Wellness Forever Medicare Limited(Formerly known as Wellness Forever Medicare Private Limited)Notes to the Restated Consolidated Financial InformationAll amounts are in Rs.in millions unless otherwise stated
20 Equity share capital
Units Amount Units Amount Units AmountAuthorised capitalEquity shares of Rs 10/- each (all the series) 1,50,00,000 150.00 1,50,00,000 150.00 1,50,00,000 150.00
1,50,00,000 150.00 1,50,00,000 150.00 1,50,00,000 150.00Issued, subscribed and fully paid upEquity shares of Rs 10/- each, Ordinary Series 48,09,453 48.09 47,86,941 47.87 47,86,941 47.87Equity shares of Rs 10/- each, A Series 7,10,000 7.10 7,10,000 7.10 7,10,000 7.10Equity shares of Rs 10/- each, A1 Series 2,11,046 2.11 2,11,046 2.11 2,11,046 2.11Equity shares of Rs 10/- each, A2 Series 4,61,410 4.61 4,61,410 4.61 - -Equity shares of Rs 10/- each, A3 Series 1,45,000 1.45 - - - -
63,36,909 63.37 61,69,397 61.69 57,07,987 57.08
20.1 Rights, preferences and restrictions attached to equity shares(a) Voting rights
(b) Dividend distribution rights:
20.2 Reconciliation of the number of equity shares outstanding at the beginning and at the end of the reporting period
Equity sharesOrdinary Class shares of Rs 10/- eachAt the beginning of the year 47,86,941 47.87 47,86,941 47.87 47,86,941 47.87Add: Issued during the year 5,100 0.05 - - - -Add: Issue of equity shares under employee share option plan ( Refer Note 42) 17,412 0.17 - - - -At the end of the year 48,09,453 48.09 47,86,941 47.87 47,86,941 47.87
Equity Share Series A shares of Rs 10/- eachAt the beginning of the year 7,10,000 7.10 7,10,000 7.10 7,10,000 7.10At the end of the year 7,10,000 7.10 7,10,000 7.10 7,10,000 7.10
Equity Share Series A1 shares of Rs 10/- eachAt the beginning of the year 2,11,046 2.11 2,11,046 2.11 2,11,046 2.11At the end of the year 2,11,046 2.11 2,11,046 2.11 2,11,046 2.11
Equity Share Series A2 shares of Rs 10/- eachAt the beginning of the year 4,61,410 4.61 - - - -Add: Issued during the year - - 4,61,410 4.61 - -At the end of the year 4,61,410 4.61 4,61,410 4.61 - -
Equity Share Series A3 shares of Rs 10/- eachAt the beginning of the year - - - - - -Add: Issued during the year 1,45,000 1.45 - - - -At the end of the year 1,45,000 1.45 - - - -
For the year endedMarch 31, 2019
(Proforma)
The Holding Company has five class of equity shares namely Ordinary class, class A series, class A1 series, class A2 series, class A3 series having par value of Rs. 10 per share. All class of shareholders areeligible for one vote per share held. The dividend proposed by the Board of Directors is subject to approval of the shareholders in the ensuing Annual General Meeting. In the event of liquidation of theHolding Company, the holders of equity shares will be entitled to receive the remaining assets of the Holding Company, in proportion of their shareholding.
For the year endedMarch 31, 2020
The Holding Company in general meeting may declare dividends, but no dividend shall exceed the amount recommended by the Board.Subject to the provisions of section 123 of the Companies Act, 2013, the Board may from time to time pay to the members such interim dividends as appear to it to be justified by the profits of theHolding Company.
Particulars
ParticularsAs at March 31, 2021 As at March 31, 2020
As at March 31, 2019(Proforma)
For the year endedMarch 31, 2021
252

20.3 Details of shares held by each shareholder holding more than 5% shares:
Number ofshares held
% holding in thatclass of shares
Number ofshares held
% holding in thatclass of shares
Number ofshares held
% holding in thatclass of shares
Gulshan Bhaktiani- Equity shares - Ordinary Series 18,24,097 28.79% 18,24,097 29.57% 18,98,097 33.25%
Ashraf Biran- Equity shares - Ordinary Series 18,71,134 29.53% 18,71,134 30.33% 19,45,134 34.08%
Mohan Chavan- Equity shares - Ordinary Series 4,34,123 6.85% 4,34,123 7.04% 4,34,123 7.61%
Serum Institute of India Private Limited- Equity shares - Ordinary Series 1,95,268 3.08% 1,95,268 3.17% 1,95,268 3.42%- Equity shares - Series A 7,10,000 11.20% 7,10,000 11.51% 7,10,000 12.44%- Equity shares - Series A1 2,11,046 3.33% 2,11,046 3.42% 2,11,046 3.70%
11,16,314 17.61% 11,16,314 18.10% 11,16,314 19.56%
Rising Sun Holding Private Limited- Equity shares - Series A2 4,61,410 7.28% 4,61,410 7.48% - -- Equity shares - Series A3 1,45,000 2.29% - - - -
6,06,410 9.57% 4,61,410 7.48% - -
20.4 Share options granted under Holding Company’s share option plan
20.5 During the period of five years immediately preceeding the date as at which the Balance Sheet is prepared :- No class of shares were alloted as fully paid up pursuant to contract without payment being received in cash.- No class of shares were alloted as fully paid up by way of bonus shares for consideration other than cash and no class of shares were bought back by the Holding company.
20.6 There are no calls unpaid.
20.7 There are no forfeited shares.
Share options granted but not exercised under Holding Company’s share option plan carry no rights to dividend and no voting rights. Further details of the employee share option plan are provided innote no. 42
As at March 31, 2019(Proforma)
As at March 31, 2021, 1,15,434 equity shares (as at March 31, 2020, 1,24,128 equity shares and as at April 01, 2019, 1,43,692 equity shares) of Rs.10 each were reserved for outstanding employee shareoption granted.
As at March 31, 2021 As at March 31, 2020Class of shares / Name of shareholder
253
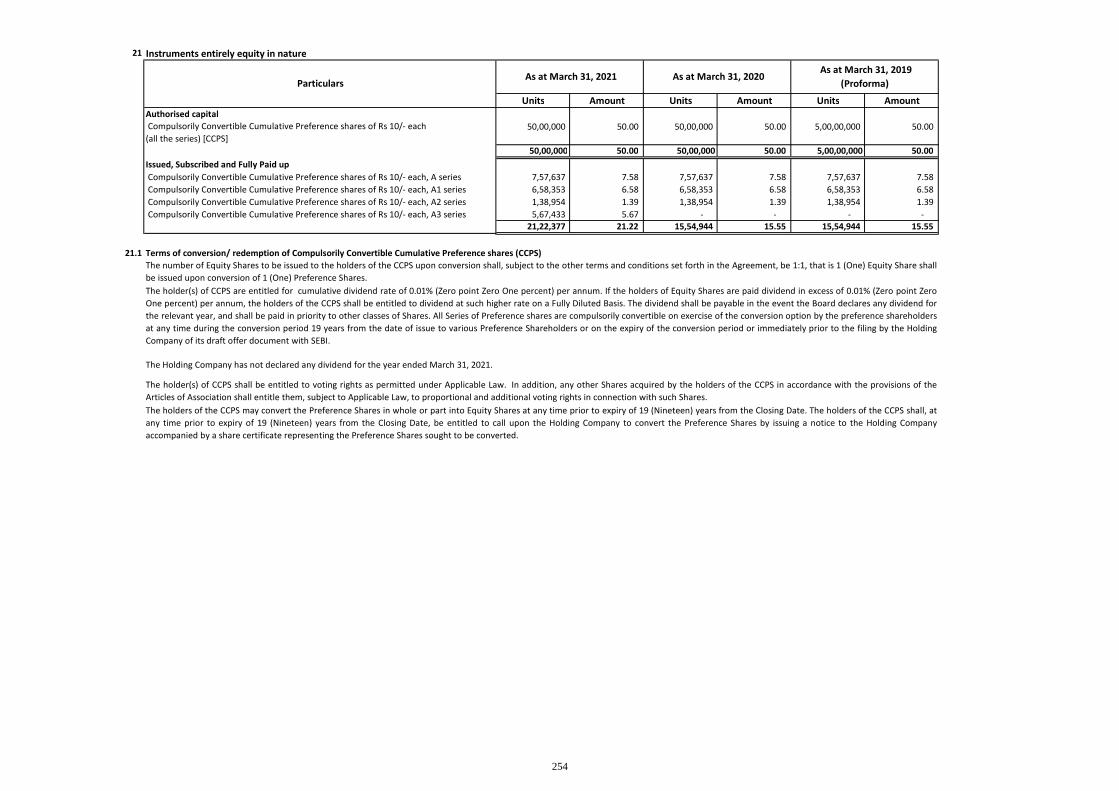
21 Instruments entirely equity in nature
Units Amount Units Amount Units AmountAuthorised capitalCompulsorily Convertible Cumulative Preference shares of Rs 10/- each
(all the series) [CCPS]50,00,000 50.00 50,00,000 50.00 5,00,00,000 50.00
50,00,000 50.00 50,00,000 50.00 5,00,00,000 50.00Issued, Subscribed and Fully Paid upCompulsorily Convertible Cumulative Preference shares of Rs 10/- each, A series 7,57,637 7.58 7,57,637 7.58 7,57,637 7.58Compulsorily Convertible Cumulative Preference shares of Rs 10/- each, A1 series 6,58,353 6.58 6,58,353 6.58 6,58,353 6.58Compulsorily Convertible Cumulative Preference shares of Rs 10/- each, A2 series 1,38,954 1.39 1,38,954 1.39 1,38,954 1.39Compulsorily Convertible Cumulative Preference shares of Rs 10/- each, A3 series 5,67,433 5.67 - - - -
21,22,377 21.22 15,54,944 15.55 15,54,944 15.55
21.1 Terms of conversion/ redemption of Compulsorily Convertible Cumulative Preference shares (CCPS)
The Holding Company has not declared any dividend for the year ended March 31, 2021.
The holder(s) of CCPS shall be entitled to voting rights as permitted under Applicable Law. In addition, any other Shares acquired by the holders of the CCPS in accordance with the provisions of theArticles of Association shall entitle them, subject to Applicable Law, to proportional and additional voting rights in connection with such Shares.
As at March 31, 2020As at March 31, 2019
(Proforma)
The number of Equity Shares to be issued to the holders of the CCPS upon conversion shall, subject to the other terms and conditions set forth in the Agreement, be 1:1, that is 1 (One) Equity Share shallbe issued upon conversion of 1 (One) Preference Shares.
ParticularsAs at March 31, 2021
The holders of the CCPS may convert the Preference Shares in whole or part into Equity Shares at any time prior to expiry of 19 (Nineteen) years from the Closing Date. The holders of the CCPS shall, atany time prior to expiry of 19 (Nineteen) years from the Closing Date, be entitled to call upon the Holding Company to convert the Preference Shares by issuing a notice to the Holding Companyaccompanied by a share certificate representing the Preference Shares sought to be converted.
The holder(s) of CCPS are entitled for cumulative dividend rate of 0.01% (Zero point Zero One percent) per annum. If the holders of Equity Shares are paid dividend in excess of 0.01% (Zero point ZeroOne percent) per annum, the holders of the CCPS shall be entitled to dividend at such higher rate on a Fully Diluted Basis. The dividend shall be payable in the event the Board declares any dividend forthe relevant year, and shall be paid in priority to other classes of Shares. All Series of Preference shares are compulsorily convertible on exercise of the conversion option by the preference shareholdersat any time during the conversion period 19 years from the date of issue to various Preference Shareholders or on the expiry of the conversion period or immediately prior to the filing by the HoldingCompany of its draft offer document with SEBI.
254

21.2 Reconciliation of the number of shares outstanding at the beginning and at the end of the reporting period
No.of Shares Amount No.of Shares Amount No.of Shares AmountCompulsorily convertible preference shares
(a) Compulsorily Convertible Cumulative Preference shares of Rs 10/- each, A series
At the beginning of the year 7,57,637 7.58 7,57,637 7.58 7,57,637 7.58At the end of the year 7,57,637 7.58 7,57,637 7.58 7,57,637 7.58
(b) Compulsorily Convertible Cumulative Preference shares of Rs 10/- each, A1 series
At the beginning of the year 6,58,353 6.58 6,58,353 6.58 6,58,353 6.58At the end of the year 6,58,353 6.58 6,58,353 6.58 6,58,353 6.58
(c) Compulsorily Convertible Cumulative Preference shares of Rs 10/- each, A2 series
At the beginning of the year 1,38,954 1.39 1,38,954 1.39 1,38,954 1.39At the end of the year 1,38,954 1.39 1,38,954 1.39 1,38,954 1.39
(d) Compulsorily Convertible Cumulative Preference shares of Rs 10/- each, A3 series
At the beginning of the year - - - - - -Add: Issued during the year 5,67,433 5.67 - - - -At the end of the year 5,67,433 5.67 - - - -
Total 21,22,377 21.22 15,54,944 15.55 15,54,944 15.55
Particulars
For the year endedMarch 31, 2019
(Proforma)
For the year endedMarch 31, 2020
For the year endedMarch 31, 2021
255

21.3 Details of shares held by each shareholder holding more than 5% shares:
Number ofshares held
% holding in thatclass of shares
Number ofshares held
% holding in thatclass of shares
Number ofshares held
% holding in thatclass of shares
Compulsorily Convertible Cumulative Preference Shares
Ahmad Ali Nalwala- Compulsorily Convertible Cumulative Preference Shares - Series A 1,51,025 7.12% 1,51,025 9.71% 1,35,421 17.87%- Compulsorily Convertible Cumulative Preference Shares - Series A1 2,23,034 10.51% 2,23,034 14.34% 1,07,832 16.38%- Compulsorily Convertible Cumulative Preference Shares - Series A2 4,018 0.19% 4,018 0.26% 2,669 1.92%
3,78,077 17.81% 3,78,077 24.31% 2,45,922 36.17%
Raay Global Investments Private Limited- Compulsorily Convertible Cumulative Preference Shares - Series A 75,199 3.54% 75,199 4.84% 75,199 9.93%- Compulsorily Convertible Cumulative Preference Shares - Series A2 12,035 0.57% 12,035 0.77% 12,035 8.66%
87,234 4.11% 87,234 5.61% 87,234 18.59%
Akshay Vijay Mansukhani- Compulsorily Convertible Cumulative Preference Shares - Series A1 65,578 3.09% 92,743 5.96% 92,743 14.09%- Compulsorily Convertible Cumulative Preference Shares - Series A2 27,835 1.31% 27,835 1.79% 27,835 20.03%
93,413 4.40% 1,20,578 7.75% 1,20,578 34.12%
Ayesha Mansukhani- Compulsorily Convertible Cumulative Preference Shares - Series A1 65,578 3.09% 92,743 5.96% 92,743 66.74%- Compulsorily Convertible Cumulative Preference Shares - Series A2 27,835 1.31% 27,835 1.79% 27,835 20.03%
93,413 4.40% 1,20,578 7.75% 1,20,578 86.77%
ACG Associated Capsules Priavte Limited- Compulsorily Convertible Cumulative Preference Shares - Series A1 84,330 3.97% 84,330 5.42% 84,330 12.81%
Vijay Mansukhani- Compulsorily Convertible Cumulative Preference Shares - Series A1 1,10,000 5.18% - - - -
Frigerio Conserva Allana Private Limted- Compulsorily Convertible Cumulative Preference Shares - Series A3 5,50,865 25.96% - - - -
Class of shares / Name of shareholder As at March 31, 2021 As at March 31, 2020 As at March 31, 2019(Proforma)
256

Wellness Forever Medicare Limited(Formerly known as Wellness Forever Medicare Private Limited)Notes to the Restated Consolidated Financial InformationAll amounts are in Rs.in millions unless otherwise stated
22 Other equityPaticulars As at March 31,
2021As at March 31,
2020As at March 31,
2019(Proforma)
Securities premium reserve 2,747.46 1,444.00 905.04Share options outstanding account 57.19 34.08 4.51Retained earnings (222.34) 131.90 128.63Total 2,582.31 1,609.98 1,038.18
22.1
Paticulars For the yearended
March 31, 2021
For the yearended
March 31, 2020
For the yearended
March 31, 2019(Proforma)
Balance at beginning of year 1,444.00 905.04 905.04Securities premium arising on issue of equity shares 1,393.57 603.25 -Share issue costs (90.11) (64.29) -Balance at end of year 2,747.46 1,444.00 905.04
22.2
Paticulars For the yearended
March 31, 2021
For the yearended
March 31, 2020
For the yearended
March 31, 2019(Proforma)
Balance at beginning of year 34.08 4.51 -Credit to equity for equity-settled share-based payments 41.31 29.57 4.51Issue of equity shares (18.20) - -Balance at end of year 57.19 34.08 4.51
22.3 Retained earnings
Paticulars For the yearended
March 31, 2021
For the yearended
March 31, 2020
For the yearended
March 31, 2019(Proforma)
Balance at beginning of year 131.90 188.28 145.23Net loss attributable to owners of the Group (348.47) (53.21) (13.33)Remeasurement of defined benefit obligation, net of income tax (1.93) 0.36 (2.42)Dividend paid during the year (3.84) (2.90) (0.74)Dividend distribution tax on above - (0.62) (0.11)Balance at end of the year (222.34) 131.90 128.63Ind AS 116 transition adjustment - - 59.65Balance as at April 1 (222.34) 131.90 188.28
Details of dividends paid / proposed:
Securities premium accountWhere Holding company issued shares at a premium, a sum equal to the aggregate amount of the premium received onthose shares shall be transferred to a “securities premium account” as per the provisions of applicable Companies Act. It canbe utilised in accordance with the provisions of the Act, to issue bonus shares, to provide for premium on redemption ofshares or debentures,write-off equity related expenses like underwriting costs, etc.
The retained earnings is used from time to time to transfer profits from retained earnings for appropriation purposes. Thereis no policy of regular transfer. As the retained earnings is created by a transfer from one component of equity to another andis not an item of other comprehensive income, items included in the retained earnings will not be reclassified subsequently toprofit or loss.
Share option outstanding account:This reserve relates to share options granted by the Holding Company to its emplyees under its employee share option plan.Further information about share based payments to employees is set out in Note no 42.
No dividend has been recommended on equity shares for year ended March 31, 2021. In the year ended March 31, 2020, thedividend proposed was Rs. 0.50 per share (total dividend Rs.3.84 millions) and the same was paid in current year. In the yearMarch 31, 2019, the dividend proposed was Rs. 40 per share (total dividend Rs.0.75 million) and the same was paid in yearended March 31, 2020.
Nature and purpose of each reserve within other equity
257

Wellness Forever Medicare Limited(Formerly known as Wellness Forever Medicare Private Limited)Notes to the Restated Consolidated Financial InformationAll amounts are in Rs.in millions unless otherwise stated
23 BorrowingsParticulars As at March 31, 2021 As at March 31, 2020 As at March 31, 2019
(Proforma)
Non-currentSecured - at amortised cost
Term loans from banks (refer notes below) 327.25 159.10 131.66
Total 327.25 159.10 131.66
CurrentSecured from banks:
Working capital loans (refer note 23.3 below) 604.79 607.50 646.78Unsecured - at amortised cost
Loans from related parties 0.20 0.20 0.20
Total 604.99 607.70 646.98
23.1 Summary of borrowing arrangements
(a)
(b)
(c)
(d)
(e)
(f)
A term loan of Rs. 59.55 millions was taken out on March 22, 2018 from Yes Bank Limited. Repayments commenced from December2018 and will continue until March 2023.The loan is secured by (i) a first pari passu charge on all moveable and immoveable fixed assets of the Holding Company, whose carryingvalue is Rs 788.72 millions (March 31, 2020 Rs. 603.35 millions and March 31, 2019 Rs. 516.71 millions) (see note 6) and; (ii) second paripassu charge on entire current assets of the Holding Company, both present and future. The loan is personally guaranteed by whole timedirectors. The loan carries interest rate in the range of 10.45 per cent to 11.30 per cent per annum.
A term loan of Rs. 36.15 millions was taken out on June 11, 2018 from Yes Bank Limited. Repayments commenced from December 2018and will continue until March 2023.The loan is secured by (i) a first pari passu charge on all moveable and immoveable fixed assets of the Holding Company, whose carryingvalue is Rs 788.72 millions (March 31, 2020 Rs. 603.35 millions and March 31, 2019 Rs. 516.71 millions) (see note 6) and; (ii) second paripassu charge on entire current assets of the Holding Company, both present and future. The loan is personally guaranteed by whole timedirectors. The loan carries interest rate in the range of 10.45 per cent to 11.30 per cent per annum.
A term loan of Rs. 18.91 millions was taken out on July 20, 2018 from Yes Bank Limited. Repayments commenced from December 2018and will continue until March 2023.The loan is secured by (i) a first pari passu charge on all moveable and immoveable fixed assets of the Holding Company, whose carryingvalue is Rs 788.72 millions (March 31, 2020 Rs. 603.35 millions and March 31, 2019 Rs. 516.71 millions) (see note 6) and; (ii) second paripassu charge on entire current assets of the Holding Company, both present and future. The loan is personally guaranteed by whole timedirectors. The loan carries interest rate in the range of 10.45 per cent to 11.30 per cent per annum.
A term loan of Rs. 25.61 millions was taken out on September 26, 2018 from Yes Bank Limited. Repayments commenced fromDecember 2018 and will continue until March 2023.The loan is secured by (i) a first pari passu charge on all moveable and immoveable fixed assets of the Holding Company, whose carryingvalue is Rs 788.72 millions (March 31, 2020 Rs. 603.35 millions and March 31, 2019 Rs. 516.71 millions) (see note 6) and; (ii) second paripassu charge on entire current assets of the Holding Company, both present and future. The loan is personally guaranteed by whole timedirectors. The loan carries interest rate in the range of 10.45 per cent to 11.30 per cent per annum.
A term loan of Rs. 4.83 millions was taken out on January 02, 2019 from Yes Bank Limited. Repayments commenced from December2018 and will continue until March 2023.The loan is secured by (i) a first pari passu charge on all moveable and immoveable fixed assets of the Holding Company, whose carryingvalue is Rs 788.72 millions (March 31, 2020 Rs. 603.35 millions and March 31, 2019 Rs. 516.71 millions) (see note 6) and; (ii) second paripassu charge on entire current assets of the Holding Company, both present and future. The loan is personally guaranteed by whole timedirectors. The loan carries interest rate in the range of 10.45 per cent to 11.30 per cent per annum.
A term loan of Rs. 95.83 millions was taken out on January 01, 2019, January 15, 2019, March 03, 2019, April 16, 2019, May 03, 2019,June 03, 2019, July 16, 2019 and September 20, 2019 from IDFC First Bank Limited. Repayments commenced from October 2019 and willcontinue until December 2023.The loan is secured by (i) a first pari passu charge on all moveable and immoveable fixed assets of the Holding Company, whose carryingvalue is Rs 788.72 millions (March 31, 2020 Rs. 603.35 millions and March 31, 2019 Rs. 516.71 millions) (see note 6) and; (ii) second paripassu charge on entire current assets of the Holding Company, both present and future. The loan is personally guaranteed by whole timedirectors. The loan carries interest rate in the range of 11 per cent to 11.25 per cent per annum.
258

(g)
(h)
(i)
(j)
(k)
(l)
(m)
(n)
A term loan of Rs. 55.60 millions was taken out on March 05, 2021 from IDFC First Bank Limited. Repayments commenced from April2022 and will continue until March 2026.The loan is secured by (i) a first pari passu charge on all moveable and immoveable fixed assets of the Holding Company, whose carryingvalue is Rs 788.72 millions (March 31, 2020 Rs. 603.35 millions and March 31, 2019 Rs. 516.71 millions) (see note 6) and; (ii) second paripassu charge on entire current assets of the Holding Company, both present and future. The loan is personally guaranteed by whole timedirectors. The loan carries interest rate at 9.00 per cent per annum.
A term loan of Rs. 65.50 millions was taken out on Feburary 26, 2021 from Yes Bank Limited. Repayments commenced from March 2022and will continue until Feburary 2026.The loan is secured by (i) a first pari passu charge on all moveable and immoveable fixed assets of the Holding Company, whose carryingvalue is Rs 788.72 millions (March 31, 2020 Rs. 603.35 millions and March 31, 2019 Rs. 516.71 millions) (see note 6) and; (ii) second paripassu charge on entire current assets of the Holding Company, both present and future. The loan is personally guaranteed by whole timedirectors. The loan carries interest rate at 8.70 per cent per annum.
Cash credits from IDFC First Bank Limited are secured by hypothecation of current assets of the subsidiary company viz. stock of finishedgoods and bills receivable (cover period of 90 days) both present and future. Currently Cash credit account with IDFC First Bank Limited ishaving a debit balance , hence presented under cash and cash equivalent .Cash credits from HDFC Bank Limited, Yes Bank Limited and IDFC First Bank Limited are secured by hypothecation of current assets ofthe Holding company viz. stock of finished goods, bills receivable, book debts, tangible movable machineries, plant machineries, fixtures,fittings other installation, furniture etc. and all other movable current assets both present and future. The loans are also supported withcollateral security of the assets / properties owned by the whole time directors and personal guarantees of whole time directors.
A term loan of Rs. 25.62 millions was taken out on September 20, 2019 from IDFC First Bank Limited. Repayments commenced fromOctober 2019 and will continue until December 2023.The loan is secured by (i) a first pari passu charge on all moveable and immoveable fixed assets of the Holding Company, whose carryingvalue is Rs 788.72 millions (March 31, 2020 Rs. 603.35 millions and March 31, 2019 Rs. 516.71 millions) (see note 6) and; (ii) second paripassu charge on entire current assets of the Holding Company, both present and future. The loan is personally guaranteed by whole timedirectors. The loan carries interest rate in the range of 11 per cent to 11.25 per cent per annum.
A term loan of Rs. 12.19 millions was taken out on October 23, 2019 from IDFC First Bank Limited. Repayments commenced fromOctober 2018 and will continue until December 2023.The loan is secured by (i) a first pari passu charge on all moveable and immoveable fixed assets of the Holding Company, whose carryingvalue is Rs 788.72 millions (March 31, 2020 Rs. 603.35 millions and March 31, 2019 Rs. 516.71 millions) (see note 6) and; (ii) second paripassu charge on entire current assets of the Holding Company, both present and future. The loan is personally guaranteed by whole timedirectors. The loan carries interest rate in the range of 11 per cent to 11.25 per cent per annum.
A term loan of Rs. 11.19 millions was taken out on November 15, 2019 from IDFC First Bank Limited. Repayments commenced fromDecember 2019 and will continue until December 2023.The loan is secured by (i) a first pari passu charge on all moveable and immoveable fixed assets of the Holding Company, whose carryingvalue is Rs 788.72 millions (March 31, 2020 Rs. 603.35 millions and March 31, 2019 Rs. 516.71 millions) (see note 6) and; (ii) second paripassu charge on entire current assets of the Holding Company, both present and future. The loan is personally guaranteed by whole timedirectors. The loan carries interest rate in the range of 11 per cent to 11.25 per cent per annum.
A term loan of Rs. 76.01 millions was taken out on December 19, 2020 from IDFC First Bank Limited. Repayments commenced fromSeptember 2021 and will continue until December 2025.The loan is secured by (i) a first pari passu charge on all moveable and immoveable fixed assets of the Holding Company, whose carryingvalue is Rs 788.72 millions (March 31, 2020 Rs. 603.35 millions and March 31, 2019 Rs. 516.71 millions) (see note 6) and; (ii) second paripassu charge on entire current assets of the Holding Company, both present and future. The loan is personally guaranteed by whole timedirectors. The loan carries interest rate at 11.15 per cent per annum.
A term loan of Rs. 63.98 millions was taken out on September 18, 2020 from IDFC First Bank Limited. Repayments commenced from June2021 and will continue until September 2025.The loan is secured by (i) a first pari passu charge on all moveable and immoveable fixed assets of the Holding Company, whose carryingvalue is Rs 788.72 millions (March 31, 2020 Rs. 603.35 millions and March 31, 2019 Rs. 516.71 millions) (see note 6) and; (ii) second paripassu charge on entire current assets of the Holding Company, both present and future. The loan is personally guaranteed by whole timedirectors. The loan carries interest rate at 11.15 per cent per annum.
259

23.2 Reconciliation of liabilities arising from financing activities
Particulars AmountAs at April 1, 2018 (proforma) 9.70Financing cash flows 159.17Non-cash changes- Interest accruals on account of amortisation (0.40)
As at March 31, 2019 proforma) 168.47Financing cash flows 55.20Non-cash changes -- Interest accruals on account of amortisation 0.16
As at March 31, 2020 223.83
Financing cash flows 196.37Non-cash changes -- Interest accruals on account of amortisation (1.33)
As at March 31, 2021 418.87
23.3 Refer Note 23.1(n)
24 Other current financial liabilitiesParticulars As at March 31, 2021 As at March 31, 2020 As at March 31, 2019
(Proforma)
Non-currentFinancial liabilities at amortised cost:Security deposits 1.91 1.91 -
Total 1.91 1.91 -
CurrentFinancial liabilities at amortised cost:Current maturities of long term loans from banks (ReferNote 23.1) 91.62 64.73 36.81Security deposits - - 0.03Creditors for capital supplies/services 16.65 12.47 4.92Other payables 1.55 0.16 0.14
Total 109.82 77.36 41.90
25 ProvisionsParticulars As at March 31, 2021 As at March 31, 2020 As at March 31, 2019
(Proforma)
Non-currentProvision for employee benefits
- Gratuity (Refer note 40) 29.80 18.51 7.16
Total 29.80 18.51 7.16
CurrentProvision for employee benefits
- Gratuity (Refer note 40) 11.42 9.33 10.21- Compensated absences 4.45 0.99 0.50
Refund liabilities (Refer note 25.1) 5.31 3.73 2.99
Total 21.18 14.06 13.70
25.1 Movement of refund liabilityParticulars As at March 31, 2021 As at March 31, 2020 As at March 31, 2019
(Proforma)
Opening Balance 3.33 3.75 0.19Add: Additional provision recognised 473.08 274.31 221.70Less: Utilisation of provision (471.10) (274.33) (218.91)Closing Balance 5.31 3.73 2.99
Refund liability relates to customers' right to return products as per company policy. As the point of sale, a refund liability and acorresponding adjustment to revenue is recognised for those products expected to be returned. The Group uses its accumulatedhistorical experience to estimate the number of returns on a portfolio level using the expected value method.
The table below details changes in the Group’s liabilities arising from financing activities, including both cash and non–cash changes.Liabilities arising from financing activities are those for which cash flows were, or future cash flows will be, classified in the Group’sstatement of cash flows as cash flows from financing activities.
260
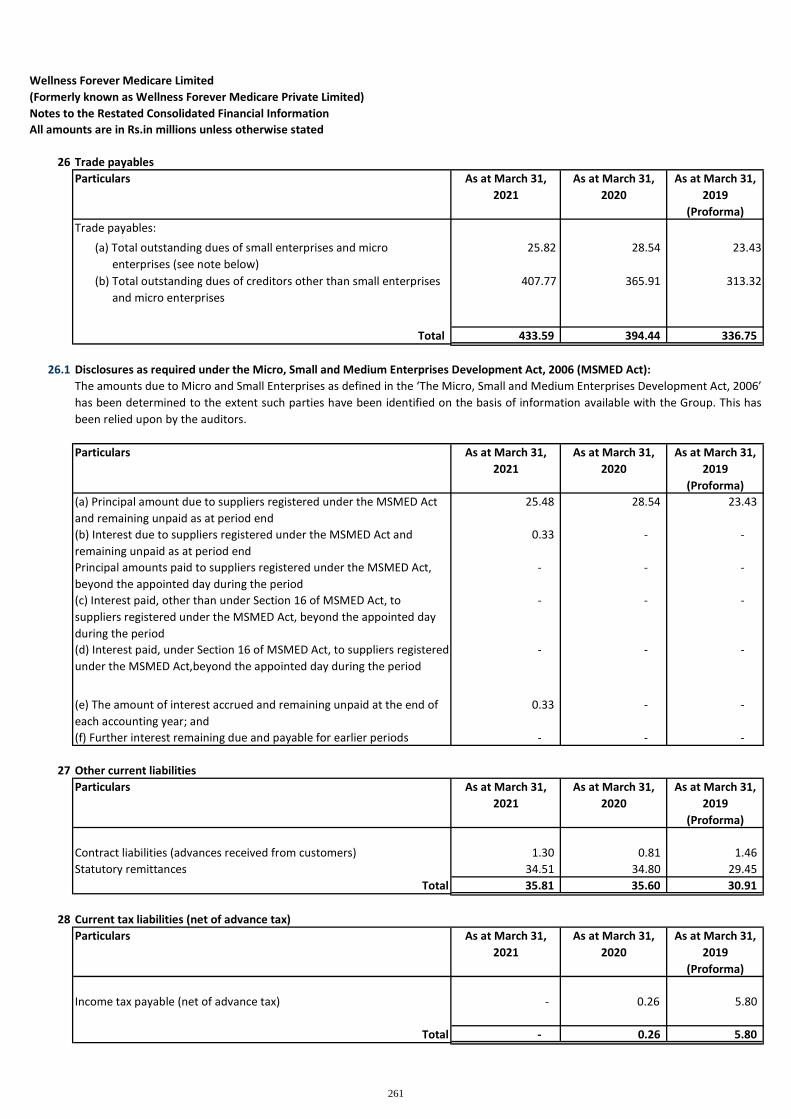
Wellness Forever Medicare Limited(Formerly known as Wellness Forever Medicare Private Limited)Notes to the Restated Consolidated Financial InformationAll amounts are in Rs.in millions unless otherwise stated
26 Trade payablesParticulars As at March 31,
2021As at March 31,
2020As at March 31,
2019(Proforma)
Trade payables:
(a) Total outstanding dues of small enterprises and microenterprises (see note below)
25.82 28.54 23.43
(b) Total outstanding dues of creditors other than small enterprisesand micro enterprises
407.77 365.91 313.32
Total 433.59 394.44 336.75
26.1
Particulars As at March 31,2021
As at March 31,2020
As at March 31,2019
(Proforma)(a) Principal amount due to suppliers registered under the MSMED Actand remaining unpaid as at period end
25.48 28.54 23.43
(b) Interest due to suppliers registered under the MSMED Act andremaining unpaid as at period end
0.33 - -
Principal amounts paid to suppliers registered under the MSMED Act,beyond the appointed day during the period
- - -
(c) Interest paid, other than under Section 16 of MSMED Act, tosuppliers registered under the MSMED Act, beyond the appointed dayduring the period
- - -
(d) Interest paid, under Section 16 of MSMED Act, to suppliers registeredunder the MSMED Act,beyond the appointed day during the period
- - -
(e) The amount of interest accrued and remaining unpaid at the end ofeach accounting year; and
0.33 - -
(f) Further interest remaining due and payable for earlier periods - - -
27 Other current liabilitiesParticulars As at March 31,
2021As at March 31,
2020As at March 31,
2019(Proforma)
Contract liabilities (advances received from customers) 1.30 0.81 1.46Statutory remittances 34.51 34.80 29.45
Total 35.81 35.60 30.91
28 Current tax liabilities (net of advance tax)Particulars As at March 31,
2021As at March 31,
2020As at March 31,
2019(Proforma)
Income tax payable (net of advance tax) - 0.26 5.80
Total - 0.26 5.80
Disclosures as required under the Micro, Small and Medium Enterprises Development Act, 2006 (MSMED Act):The amounts due to Micro and Small Enterprises as defined in the ‘The Micro, Small and Medium Enterprises Development Act, 2006’has been determined to the extent such parties have been identified on the basis of information available with the Group. This hasbeen relied upon by the auditors.
261

Wellness Forever Medicare Limited(Formerly known as Wellness Forever Medicare Private Limited)Notes to the Restated Consolidated Financial InformationAll amounts are in Rs.in millions unless otherwise stated
29 Revenue from operations
ParticularsFor the year
endedMarch 31, 2021
For the yearended
March 31, 2020
For the year endedMarch 31, 2019
(Proforma)Sale of goods (net of returns) 9,148.15 8,516.33 6,709.31
Other operating revenuesVisibility Income 91.86 116.18 60.49Franchise Income 0.20 - -
Total 9,240.21 8,632.51 6,769.80
29.1
29.2
External Revenue by timing of revenue Year endedMarch 31, 2021
Year endedMarch 31, 2020
For the year endedMarch 31, 2019
(Proforma)Goods transfer at a point in time 9,148.15 8,516.33 6,709.31Services transferred over time 92.06 116.18 60.49
29.3 Contract balances
Tradereceivables
Contractliabilities
Closing balancesAs at March 31, 2021 291.46 1.30As at March 31, 2020 270.19 0.81As at March 31, 2019 214.99 1.46
29.4
29.5
29.6 Reconciliation of revenue recognised in the consolidated statement of profit and loss with the contracted priceFor the year
endedMarch 31, 2021
For the yearended
March 31, 2020
For the year endedMarch 31, 2019
(Proforma)Revenue from contracts with customers 9,240.21 8,632.51 6,709.31Add: Discounts, rebates, refunds, credits, price concessions 622.52 397.67 218.71Refund liabilities (included under provisions in note 25.1) 5.31 3.73 2.99Contracted price with the customers 9,868.04 9,033.91 6,931.01
There are no impairment losses on trade receivable recognised in Restated Consolidated Statement of Profit and Loss for the year ended March 31,2021, March 31, 2020 and March 31, 2019
The Group presently recognises its revenue from contract with customers for the transfer of goods and services over time and at a point in time. This isconsistent with the revenue information that is disclosed for each reportable segment under IND AS 108 (refer Note on 39 Segment informationdisclosure).
The Group receives payments from customers based upon contractual billing schedules. Accounts receivable are recorded when the right toconsideration becomes unconditional.
There are no performance obligations that are unsatisfied or partially unsatisfied during the year ended March 31, 2021, March 31, 2020 and March31, 2019.
The following table provides information about receivables from contracts with customers:
262

30 Other incomeParticulars For the year
endedMarch 31, 2021
For the yearended
March 31, 2020
For the year endedMarch 31, 2019
(Proforma)Interest Income on financial assets measures at amortised cost
- From bank deposits 23.51 5.16 4.01- From security deposits 29.56 25.12 18.80
53.07 30.28 22.81Other gains and losses
- Net gain arising on short term financial investments measured at FVTPL 0.09 - -- Net foreign exchange gain - 0.08 0.11
0.09 0.08 0.11Other non-operating income
- Rental income 1.92 1.05 1.01- Income from redemption of mutual fund 2.00 - -- Profit on sale of fixed assets - - 12.24- Scrap sales 1.07 1.10 1.03- Insurance claim 9.41 - 0.50- Sundry balance written back 64.26 0.03 0.00- Lease rent concessions 41.26 5.64 1.92- Miscellaneous Income 0.28 0.30 0.01
120.21 8.11 16.72
Total 173.38 38.48 39.64
31 Changes in inventories of stock-in-trade
ParticularsFor the year
endedMarch 31, 2021
For the yearended
March 31, 2020
For the year endedMarch 31, 2019
(Proforma)Closing stock
-Stock-in-trade 1,554.69 1,299.71 1,063.88
Opening stock-Stock-in-trade 1,299.71 1,063.88 906.26
Net increase (254.98) (235.83) (157.62)
32 Employee benefits expenseParticulars For the year
endedMarch 31, 2021
For the yearended
March 31, 2020
For the year endedMarch 31, 2019
(Proforma)Salaries, wages and bonus 902.25 822.14 636.13Contribution to provident and other funds (See note 40) 81.65 76.93 61.88Share based payment transactions expenses (See note 42) 41.31 29.57 4.51Staff welfare expenses 60.26 56.46 62.12Total 1,085.47 985.10 764.64
33 Finance cost
ParticularsFor the year
endedMarch 31, 2021
For the yearended
March 31, 2020
For the year endedMarch 31, 2019
(Proforma)
Interest cost - on financial liability at amortised costi) Borrowings from banks 87.55 73.10 72.77ii) Lease liability 212.64 190.55 169.10iii) Unsecured loan 0.65 - 0.70
Interest on delayed payment of taxes/others 0.84 11.53 3.36
Total 301.69 275.19 245.93
263

34 Depreciation and amortisation expenses
ParticularsFor the year
endedMarch 31, 2021
For the yearended
March 31, 2020
For the year endedMarch 31, 2019
(Proforma)Depreciation of property, plant and equipment (refer note 6) 287.72 102.28 80.86Amortisation of intangible assets (refer note 8) 31.91 19.28 10.53Right-of-use asset (refer note 7) 650.27 554.30 426.76Total 969.90 675.86 518.15
35 Other expenses
ParticularsFor the year
endedMarch 31, 2021
For the yearended
March 31, 2020
For the year endedMarch 31, 2019
(Proforma)Advertisement and sales promotion 75.31 48.03 50.62Bank charges 6.35 8.24 6.58Brokerage and commission 56.75 72.63 21.92Communication charges 28.97 18.99 13.48Consumption of packing paterial 4.56 1.55 0.46Credit/debit card and other commision charges 17.83 11.92 16.41Electricity charges 97.34 75.61 67.24Expenses on corporate social responsibility (refer note 35.2) 2.37 1.99 0.79Insurance charges 5.33 3.57 2.02Loss on exchange difference (net) 0.10 - -Loss on sale and discard of fixed assets (net) 10.80 6.70 18.82Membership and subscription 3.48 0.88 0.71Outsourced manpower supply 49.66 22.34 6.23Payment to auditors (refer note 35.1) 6.00 1.80 1.80Postage and telegram 1.23 15.99 14.03Printing and stationery 20.20 37.88 29.69Professional and legal charges 65.16 38.03 50.28Provision for doubtful balances 9.27 - -Provision for doubtful deposit 19.15 - -Provision for expected credit loss 4.85 1.51 1.77Rates and taxes 22.32 23.28 1.90Rent including lease rentals (refer note 7.4) 31.30 53.69 46.00Repairs and maintenance: -
- Buildings 21.16 31.58 18.01- Computers 26.31 16.42 13.41- Others 4.10 4.03 4.38
Selling and distribution expenses 55.09 26.46 24.65Sundry balances written off 61.44 8.46 3.23Testing charges 0.77 - -Travelling & conveyance expenses 42.44 37.08 24.78Miscellaneous expenses 39.70 35.96 30.33Total 789.34 604.61 469.53
35.1 Auditors remuneration and out-of-pocket expenses (net of GST):For the year
endedMarch 31, 2021
For the yearended
March 31, 2020
For the year endedMarch 31, 2019
(Proforma)(i) As Auditors 6.00 1.80 1.80(ii) For taxation matters - - -(iii) For other services - - -(iv) For Certification work - - -(v) Auditors out-of-pocket expenses - - -Total 6.00 1.80 1.80
35.2 Expenses on corporate social responsibilityFor the year
endedMarch 31, 2021
For the yearended
March 31, 2020
For the year endedMarch 31, 2019
(Proforma)
Amount required to be spent as per Section 135 of the Act 2.37 1.68 1.11Amount spent during the year on:(i) Construction/acquisition of any asset - - -(ii) On purposes other than (i) above 2.20 1.99 0.79Amount not spend during the year on:(i) Construction/acquisition of any asset - - -(ii) On purposes other than (i) above 0.20 * - 0.32* Subsequently deposited to Prime Minister Care Fund on September 21, 2021
264

Wellness Forever Medicare Limited(Formerly known as Wellness Forever Medicare Private Limited)Notes to the Restated Consolidated Financial InformationAll amounts are in Rs.in millions unless otherwise stated
36 Current Tax and Deferred Tax
36.1 Income Tax Expense recognised in statement of profit and loss
Particulars
For the year ended31 March, 2021
For the year ended31 March, 2020
For the year endedMarch 31, 2019
(Proforma)
Current Tax:Current Income Tax Charge - 42.47 39.70Short provision for Tax relating to earlier years 1.47 - -
1.47 42.47 39.70
Deferred TaxIn respect of current year (109.67) (30.87) (56.30)
(109.67) (30.87) (56.30)
Total tax expense/ credit recognised in statement of profit and loss (108.20) 11.60 (16.60)
36.2 Income Tax recognised in other Comprehensive Income
Particulars
For the year ended31 March, 2021
For the year ended31 March, 2020
For the year endedMarch 31, 2019
(Proforma)
Deferred Tax (Liabilities)/Assets:Remeasurement of Defined Benefit Obligations 0.70 (0.07) 1.30Total 0.70 (0.07) 1.30
36.3 Reconciliation of income tax expense and the accounting profit multiplied by Group's domestic tax rate:
Particulars
For the year ended31 March, 2021
For the year ended31 March, 2020
For the year endedMarch 31, 2019
(Proforma)
Loss before tax from continuing operations (456.67) (41.61) (29.94)Less: income taxed at different tax rate (2.57) - -Loss Before tax (459.24) (41.61) (29.94)Income Tax using the Group's domestic Tax rate # (115.58) (10.47) (7.53)Effect of expenses that are not deductible in determining taxable profit (1.17) 7.81 -Effect of income that is not taxable in determining taxable profit 0.33 - -Effect of income taxed at different rate 0.08 - -Income tax related earlier year (1.47) - -Others 9.61 14.27 (9.07)Income tax expense recognised in profit or loss (108.20) 11.60 (16.60)
# The tax rate used for the reconciliations above is the corporate tax rate of plus surcharge (as applicable) on corporate tax, educationcess and secondary and higher education cess on corporate tax, payable by corporate entities in India on taxable profits under Income TaxAct, 1961.
In pursurance of Section 115BAA of the Income Tax Act, 1961 announced by the Government of India through Taxation Laws(Amendment) Ordinance, 2019, the Group has opted for irrevocable option of shifting to lower tax rate wef FY 19-20.
265

Wellness Forever Medicare Limited(Formerly known as Wellness Forever Medicare Private Limited)Notes to the Restated Consolidated Financial InformationAll amounts are in Rs.in millions unless otherwise stated
37 Earning per shareParticulars
Year endedMarch 31, 2021
Year endedMarch 31, 2020
Year endedMarch 31, 2019
(Proforma)
(a) Loss for the year (Rs. in millions) (348.47) (53.21) (13.33)
(b) Weighted average number of Ordinary shares outstanding for the purpose of basicearnings per share [nos.]
4,89,94,324 4,60,50,238 4,35,77,586
(c) Effect of potential Ordinary shares on Employee Stock Options outstanding [nos.] ReferNote 37.1
- - -
(d) Weighted average number of Ordinary shares in computing diluted earnings per share[nos.] [(b) + (c)]
4,89,94,324 4,60,50,238 4,35,77,586
(e) Earnings per share for the year (Face Value Rs. 2/- per share) - refer note 45 for stocksplit and issue of bonus shares subsequent to year end
– Basic [(a)/(b)] Rs. (7.11) (1.16) (0.31)– Diluted [(a)/(d)] Rs. (7.11) (1.16) (0.31)
37.1
37.2
38 Contingent liabilities and commitments (to the extent not provided for)Particulars As at March 31,
2021As at March 31,
2020As at March 31,
2019(Proforma)
(a) Contingent liabilities :(i) Income Tax Act (Refer note 38.1) 58.90 - -(ii) Bank guarantees 33.90 3.90 4.90
(b) Commitments :Estimated amount of contracts remaining to be executed on capital account and notprovided for (net of capital advances)
31.27 38.36 1.23
38.1 Future cash flow in respect of the above, if any, is determinable only on receipt of judgements/decisions pending with the relevant authorities.
38.2 The Group did not have any long-term contracts including derivative contracts for which any provision was required for foreseeable losses.
39 Segment information
39.1
39.2 The board of directors of the Holding Company have been identified as the Chief Operating Decision Maker (CODM) by the Group.
39.3 The Group operates in a single geographical environment i.e. in India.
39.4 No single customer contributed 10% or more to Group’s revenue.
39.5
• these operating segments have similar long-term gross profit margins;• the nature of the products and production processes are similar; and• the methods used to distribute the products to the customers are the same.
The Group is primarily engaged in ‘Retail Pharmacy’ business through retail stores and online channels which offers pharma, surgical and FMCG products tothe customers, which in terms of Ind AS 108 on ‘Operating Segments’ constitutes a single reporting segment which is also reviewed by the Chief OperatingDecision Maker (CODM).
The reporting segment includes a number of direct sales operations in various cities within India each of which is considered as a separate operatingsegment by the CODM. For financial statements presentation purposes, these individual operating segments have been aggregated into a single reportableoperating segment taking into account the following factors:
Stock options granted to the employees under various ESOP schemes are considered to be potential equity shares. The same is notconsidered in the determination of diluted earnings per share as they are anti-dilutive. The stock options are not included in thedetermination of basic earnings per share. The details relating to stock options are given in Note - 42.
Subsequent to March 31, 2021, pursuant to a resolution of shareholders dated, July 9, 2021, each equity share of face value of INR 10 each of the Companyhas been split into 5 equity shares of face value of INR 2 each (the “Split”) (Refer Note 47(d) of Restated Consolidated Financial Information). Further, theBoard of Directors has approved the issuance of 1 bonus share of face value of INR 2 each for every 5 existing fully paid up equity share of face value of INR 2each and accordingly 84,59,286 bonus shares were issued, which were allotted on July 24, 2021 (the “Bonus Issue”) (Refer Note pf 47(e) of RestatedConsolidated Financial Information). As required under Ind AS 33 “Earnings per share” the effect of such Split and Bonus Issue are required to be adjusted forthe purpose of computing earnings per share for all the periods presented retrospectively.As a result, the effect of the Split and the Bonus Issue have been considered in these Restated Consolidated Financial Information for the purpose ofcalculation of earnings per share.
266

Wellness Forever Medicare Limited(Formerly known as Wellness Forever Medicare Private Limited)Notes to the Restated Consolidated Financial InformationAll amounts are in Rs.in millions unless otherwise stated
40 Employee benefit plans
40.1 Defined contribution plans:
(A) Provident fund and pension
Particulars Year endedMarch 31, 2021
Year endedMarch 31, 2020
Year endedMarch 31, 2019
(proforma)i) Employer's Contribution to Provident Fund and pension 53.34 46.97 34.20ii) Employer's Contribution to Labour Fund 0.20 0.20 0.19iii) Employer's Contribution to State Insurance Corporation 16.44 19.45 21.30Total 69.98 66.63 55.69
(b) Defined Benefit Plans:Gratuity
(A)
(1) Salary risk:
(2) Interest rate risk
(3) Investment risk:
(4) Mortality risk:
Contribution to Defined Contribution Plans, recognised in the Profit and Loss for the year under employee benefits expense, are as under :
The Group participates in Provident fund as defined contribution plans on behalf of relevant personnel. Any expense recognised in relation toprovident fund represents the value of contributions payable during the period by the Group at rates specified by the rules of provident fund. The onlyamounts included in the balance sheet are those relating to the prior months contributions that were not paid until after the end of the reportingperiod.
In accordance with the Employee’s Provident Fund and Miscellaneous Provisions Act, 1952 eligible employees of the Group are entitled to receivebenefits in respect of provident fund, a defined contribution plan, in which both employees and the Group make monthly contributions at a specifiedpercentage of the covered employees’ salary. The contributions, as specified under the law, are made to the provident fund administered andmanaged by Government of India (GOI). The Group has no further obligations under the fund managed by the GOI beyond its monthly contributionswhich are charged to the statement of Profit and Loss in the period they are incurred. The benefits are paid to employees on their retirement orresignation from the Group.
Through its defined benefit plans the Group is exposed to a number of risks, the most significant of which are detailed below:
The most recent actuarial valuation of the present value of the defined benefit obligation was carried out at March 31, 2021 by an independentactuary. The present value of the defined benefit obligation, and the related current service cost and past service cost, were measured using theprojected unit credit method.
The Holding Company has an obligation towards gratuity, a funded defined benefit retirement plan covering all employees, whereas in respect ofsubsidiary company it is unfunded. The plan provides for lump sum payment to vested employees at retirement or at death while in employment or ontermination of the employment of an amount equivalent to 15 days salary, as applicable, payable for each completed year of service. Vesting occursupon completion of five years of service. The Holding Company makes annual contributions to gratuity fund managed by Life Insurance Corporation ofIndia (LIC). The Group accounts for the liability for gratuity benefits payable in the future based on an actuarial valuation.
The present value of the defined benefit plan liability is calculated by reference to the future salaries of members. As such, an increase in the salary ofthe members more than assumed level will increase the plan's liability.
A fall in the discount rate which is linked to the G.Sec. Rate will increase the present value of the liability requiring higher provision. A fall in thediscount rate generally increases the mark to market value of the assets depending on the duration of asset.
The present value of the defined benefit plan liability is calculated using a discount rate which is determined by reference to market yields at the end ofthe reporting period on government bonds. If the return on plan asset is below this rate, it will create a plan deficit. Currently, for the plan in India, ithas a relatively balanced mix of investments in government securities, and other debt instruments.
Since the benefits under the plan is not payable for life time and payable till retirement age only, plan does not have any longevity risk.
267

(B) Principal actuarial assumptions used:The principal assumptions used for the purposes of the actuarial valuations were as follows.
Particulars As at March 31, 2021 As at March 31, 2020 As at March 31, 2019(Proforma)
1. Discount rate - Holding Company 5.60%- Subsidiary Company 6.60%
2. Salary escalation - Holding Company 6.00%- Subsidiary Company 7.00%
3. Rate of Employee Turnover - Holding Company 20.00% p.a- youngerages
1.00% p.a- older ages- Subsidiary Company
5. Mortality rate - Holding Company Indian Assured LivesMortality (2006-08)
- Subsidiary Company
(C) Expenses recognised in consolidated statement of profit and lossParticulars
Year ended March31, 2021
Year ended March31, 2020
Year ended March31, 2019 (Proforma)
Service cost:Current service cost 9.44 9.96 7.65Net Interest cost 1.30 0.94 0.97Components of defined benefit cost recognised in profit or loss 10.74 10.90 8.63
(D) Net interest cost recognised in restated consolidated statement of profit and loss:Particulars
Year ended March31, 2021
Year ended March31, 2020
Year ended March31, 2019 (Proforma)
Interest cost 1.77 1.84 1.55(Interest income) (0.46) (0.91) (0.58)Net interest cost recognised in profit or loss 1.31 0.94 0.97
(E) Expenses recognized in the other comprehensive income (OCI)Particulars Year ended March
31, 2021Year ended March
31, 2020Year ended March
31, 2019 (Proforma)Actuarial (gains)/losses on obligation for the period- Due to changes in demographic assumptions - (8.65) -- Due to changes in financial assumptions (0.01) 1.37 -- Due to experience adjustment (2.32) 6.41 (3.74)Return on plan assets, excluding interest income (0.30) 0.43 0.01Change in asset ceiling - - -Net (income)/expense for the period recognized in OCI (2.63) (0.43) (3.73)
(F) Amount recognised in the balance sheetParticulars As at March 31, 2021 As at March 31, 2020 As at March 31, 2019
(Proforma)
Present value of defined benefit obligation as at the end of the year 46.31 34.99 25.23Fair value of plan assets 5.09 7.15 7.86
41.22 27.84 17.37
(G) Net asset/(liability) recognised in the balance sheetRecognised under: As at March 31, 2021 As at March 31, 2020 As at March 31, 2019
(Proforma)
Long term provision (Refer Note 25) 29.80 18.51 7.16Short term provision (Refer Note 25) 11.42 9.33 10.21Total 41.22 27.84 17.37
6.00%
Indian Assured Lives Mortality (2012-14)
20.00% p.a at younger agesreducing to 1.00% p.a% at older ages
Indian Assured Lives Mortality (2012-14)
Gratuity
The current service cost and the net interest expenses for the year are included in the 'Employee benefits expenses' line item in Profit and Loss.
Gratuity
40.00% p.a at younger agesreducing to 1.00% p.a% at older
ages
7.00%
Gratuity
5.60% 7.65%
268

(H) Movements in the present value of defined benefit obligation are as follows:Particulars Year ended March
31, 2021Year ended March
31, 2020Year ended March
31, 2019 (Proforma)
Opening defined benefit obligation 35.24 25.23 20.26Transfer in/(out) obligation 0.02 - -Current service cost 9.55 10.21 7.65Interest cost 1.77 1.84 1.55Actuarial (gains)/losses 2.33 (0.86) (3.74)Benefits paid (from the fund) (2.23) (1.18) (0.50)Closing defined benefit obligation 46.67 35.24 25.23
(I) Movements in the fair value of the plan assets are as follows:Particulars Year ended March
31, 2021Year ended March
31, 2020Year ended March
31, 2019 (Proforma)
Opening fair value of the plan assets 7.15 7.86 7.80Contributions by the employer - - -Remeasurement (gains)/losses (0.30) (0.43) (0.01)Interest income 0.46 0.91 0.58Benefits paid (2.23) (1.18) (0.50)Closing fair value of plan assets 5.08 7.15 7.86
(J) Maturity profile of defined benefit obligation:Projected benefits payable in future years from the date of reporting Year ended March
31, 2021Year ended March
31, 2020Year ended March
31, 2019(Proforma)
Year 1 Cashflow 9.41 7.06 2.25Year 2 Cashflow 8.95 5.87 2.00Year 3 Cashflow 7.78 5.90 2.22Year 4 Cashflow 6.38 5.10 2.81Year 5 Cashflow 5.75 4.13 2.96Year 6 to Year 10 Cashflow 13.15 10.61 11.85Total expected payments 51.42 38.68 24.09
(K) Sensitivity analysis
Projected benefits payable in future years from the date of reporting Year ended March31, 2021
Year ended March31, 2020
Year ended March31, 2019 (Proforma)
Projected benefit obligation on current assumptionsRate of discountingImpact of +0.5% change 45.46 34.32 24.26(% change) -2.59% -2.59% -3.84%Impact of -0.5% change 47.19 35.56 26.27(% change) 1.13% 0.93% 4.13%
Rate of salary increaseImpact of +0.5% change 47.18 35.55 26.25(% change) 1.11% 0.89% 4.04%Impact of -0.5% change 45.46 34.22 24.26(% change) -2.59% -2.88% -3.84%
Rate of employee turnoverImpact of +0.5% change 44.75 33.54 24.78(% change) -4.11% -4.82% -1.79%Impact of -0.5% change 48.02 36.36 25.68(% change) 2.90% 3.18% 1.81%
The Sensitivity analysis below has been determined based on reasonably possible change of the respective assumptions occurring at the end of thereporting period, while holding all other assumptions constant. These sensitivities show the hypothetical impact of a change in each of the liedassumptions in isolation. While each of these sensitivities holds all other assumptions constant, in practice such assumptions rarely change in isolationand the asset value changes may offset the impact to some extent. For presenting the sensitivities, the present value of the Defined Benefit Obligationhas been calculated using the projected unit credit method at the end of the reporting period, which is the same as that applied in calculating theDefined Benefit Obligation presented above. There was no change in the methods and assumptions used in the preparation of the sensitivity analysisfrom previous year.
269
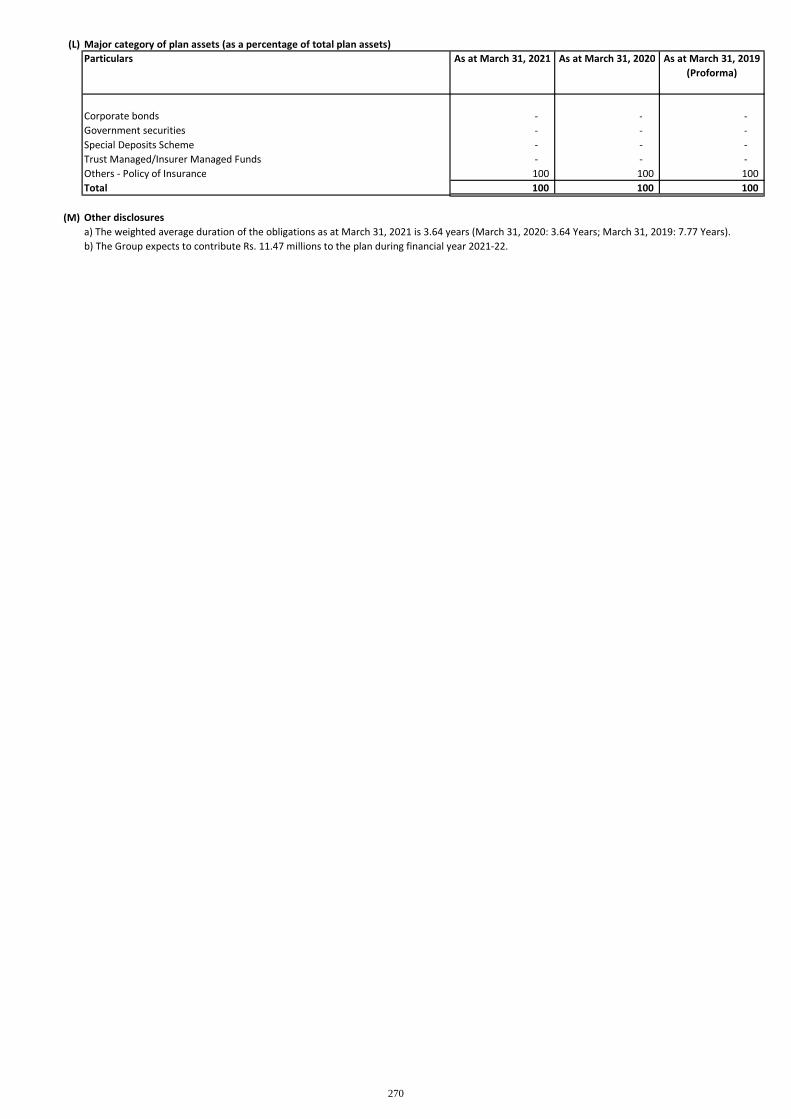
(L) Major category of plan assets (as a percentage of total plan assets)Particulars As at March 31, 2021 As at March 31, 2020 As at March 31, 2019
(Proforma)
Corporate bonds - - -Government securities - - -Special Deposits Scheme - - -Trust Managed/Insurer Managed Funds - - -Others - Policy of Insurance 100 100 100Total 100 100 100
(M) Other disclosures
b) The Group expects to contribute Rs. 11.47 millions to the plan during financial year 2021-22.a) The weighted average duration of the obligations as at March 31, 2021 is 3.64 years (March 31, 2020: 3.64 Years; March 31, 2019: 7.77 Years).
270

Wellness Forever Medicare Private Limited(Formerly known as Wellness Forever Medicare Private Limited)Notes to the Restated Consolidated Summary StatementsAll amounts are in Rs.in millions unless otherwise stated
41 Related party disclosures
41.1
Amore Health Essentials Private Limited
Gulshan Haresh BakhtianiAshraf Mohammed BiranMohan Ganpat Chavan
- Independent Director (w.e.f 12th July, 2021) Ranjit Gobindram Sahani- Independent Director (w.e.f 12th July, 2021) Avani Vishal Davda- Independent Director (w.e.f 01st September, 2021) Kewal Kundanlal Handa- Vice - President (Operations) Pankaj Kumar- Vice - President (Information Technology) Arindam Dutta- Chief Financial Officer Gaurav Chiman Shah
Shaheen BiranAnita BakhtianiKanchan ChavanFouzia BiranShree Balaji MedicalThe Parel ChemistRakhangi Medical StoreIPC Healthcare Private LimitedRahul Distributors Private LimitedPinnacle Biomed Private LimitedShreeji Distributors Pharma Private Limited
41.2 Transactions during the year with related parties
S. No.Year ended
March 31, 2021Year ended
March 31, 2020Year ended
March 31, 2019a
A.1I Amore Health Essentials Private Limited
53.68 53.41 34.95Sale of material 25.08 83.85 -Inter corporate loan 23.00 76.50 50.99Interest on inter corporate loan 0.23 12.88 7.03Equity shares issued on account of repayment of inter corporate loan - 175.21 -Lease rental expense 1.08 1.08 0.55Sale of property, plant and equipment 13.26 - -Reimburesement received 0.08 0.68 0.60
A.2Wellness Forever Medicare Private Limited
25.08 83.85 -Sale of material 53.68 53.41 34.95Inter corporate loan 23.00 76.50 50.99Interest on inter corporate loan 0.23 12.88 7.03Inter corporate loan converted to investments - 175.21 -Rent income on sub-leasing 1.08 1.08 0.55Reimbursement of Expenses 0.08 0.68 0.60Purchase of property, plant and equipment 13.26
BI Gulshan Bakhtiani
Rental payments for premises 3.66 3.90 0.38Reimbursement of Expenses - - 0.06
II Ashraf BiranRental payments for premises 27.23 19.73 10.52Deposit payments for premises 5.01 - -Reimbursement of Expenses - - 0.07
Details of transactions which are eliminated during the course of consolidation
Enterprises over which Key Management Personnel is able toexercise significant influence (where transaction have taken place)
Holding Company
Purchase of material
Key Management Personnel
Purchase of material
Details of related partiesDescription of relationship Name of the Related PartyWholly Owned Subsidiary Company (where control exist)Key Management Personnel- Whole time director- Whole time director
Particulars
Subsidiary Company
- Whole time director
Relatives of key management personnel (where transaction havetaken place)
271

S. No.Year ended
March 31, 2021Year ended
March 31, 2020Year ended
March 31, 2019CI Anita Bakhtiani
Rental payments for premises 5.06 5.40 2.85Reimbursement of Expenses - - 0.10
II Kanchan ChavanRental payments for premises 5.63 6.00 6.00Sale of property, plant and equipment - - 0.04
III Shaheen BiranRental payments for premises 1.44 1.46 1.16Deposit payments for premises 0.27 - -
IV Fouzia BiranCommission & brokerage 1.41 1.16 0.48
DI
71.51 76.55 61.10
II The Parel Chemist21.66 59.43 31.0922.35 37.80 29.41
Sale of property, plant and equipment 0.02 - -Other Operating Income - - 0.01
III0.13 - -
37.68 16.91 6.79Other Operating Income - - 0.01
IV Rahul Distributors Private Limited- - 2.92
677.52 396.30 321.35Other Operating Income 0.06 - 0.02
V Pinnacle Biomed Private Limited10.70 13.53 10.43
Rental payments for premises - - 2.50Deposit refund - - 2.16Reimbursement of Expenses of Expenses - - 0.19
VI Shreeji Distributors Pharma Private Limited55.68 11.14 14.83
C- 0.00 0.00
The transactions with related parties are made in the normal course of business and on terms equivalent to those that prevail in arm’s lengthtransactions.
Rakhangi Medical StoreSale of material
Purchase of material
Shree Balaji MedicalsSale of material
Sale of material
Relatives of Key Management Personnel
Enterprises over which Key Management Personnel is able to exercise significant
Sale of Material
Particulars
Purchase of material
Purchase of material
Purchase of material
Purchase of material
IPC Healthcare Private LimitedSale of material
272

41.3 Amounts outstanding with related partiesS. No. As at March 31,
2021As at March 31,
2020As at March 31,
2019
A.1I
4.39 3.87 4.231.11 34.09 -
175.31 175.31 0.1023.21 - 87.13
1.25 1.25 0.488.48 - -
A.2
4.39 3.87 -1.11 34.09 4.23
175.31 175.31 0.1023.21 - 87.13
1.25 1.25 0.48
8.48 - -
B
- 0.15 0.14- - 0.08
0.52 1.14 0.430.55 1.05 0.230.51 0.49 -
0.20 0.20 0.20
CI
- 0.04 0.04
B
I6.12 7.07 6.20
II13.49 16.76 11.54
1.22 0.01 0.02
III0.88 - -
- 9.93 1.390.15 - -
IV26.25 9.48 12.79
0.16 0.16 1.15
V0.72 1.49 0.44
VI21.42 0.42 1.55
VII - - 0.01Trade receivable
Pinnacle Biomed Private LimitedTrade payable
Shreeji Distributors Pharma Private Limited
Rahul Distributors Private LimitedTrade payableTrade receivable
Trade payable
Rakhangi medical store
Trade payable
IPC Healthcare Private Limited
Trade payableTrade receivable
Enterprises over which Key Management Personnel is able to exercise significantinfluence*Shree Balaji Medical
Trade receivable
The Parel ChemistTrade receivable
Gulshan bakhhtiani
Relatives of key management personnelFouzia Biran
Commission and brokerage
Gulshan bakhhtianiGaurav Chiman ShahPankaj KumarArindham Dutta
Loan
Sub-lease rent & Reimbursement of Expenses Receivable
Payable on acccount of Purchase of property, plant and equipement
Key Management PersonnelShort term employee benefit outstandingAshraf Biran
Holding CompanyWellness Forever Medicare Private Limited
Trade payableTrade receivablesInvestment in equity sharesInter corporate loan outstanding
Trade payableShare CapitalInter corporate loan outstandingBalance outstanding for sub-lease rent & Reimbursement of ExpensesReceivable on acccount of sale of property, plant and equipement
Subsidiary Company
Particulars
Amore Health Essential Private LimitedTrade receivables
Advance Receivable
273

41.4 Compensation of key managerial personnel
ParticularsYear ended
March 31, 2021Year ended
March 31, 2020Year ended
March 31, 2019Short-term employee benefits 24.64 27.02 26.28Share based payment 20.57 15.89 1.43Total 45.21 42.91 27.71
(a)
(b)
The remuneration of the the key management personnel of the Group, is set out below in aggregate for each of the categoriesspecified in Ind AS 24:
As the liabilities for defined benefit plan are provided on actuarial basis for the Group as a whole, the amount pertaining to key managerial persons arenot included.
All decisions relating to the remuneration of the directors are taken by the Board of Directors of the Holding Company, in accordance withshareholders approval, whereever necessary
274

Wellness Forever Medicare Limited(Formerly known as Wellness Forever Medicare Private Limited)Notes to the Restated Consolidated Financial InformationAll amounts are in Rs.in millions unless otherwise stated
42 Share based payments
ParticularsYear ended March 31,
2021Year ended March
31, 2020Year ended March 31,
2019(Proforma)
Employee benefit expenses 41.31 29.57 4.51
41.31 29.57 4.51
42.1 Details of the employee share option plan of the Holding Company
42.2 The vesting conditions are as follows:
Vesting ConditionESOP 2018
the date on which the Holding Company files a draft red herring prospectus with the SEBI
the date on which any liquidity event which results in the Promoter’s shareholding falling below26%, is approved by the Board, including a strategic sale and/or a Promoter stake sale
Criteria
IPO Vesting Condition
Liquidity Vesting Condition
Target Vesting Condition
The Holding Company has constituted an Employee Stock Option Plan 2018 and 2020 by way of a Board resolution of the Holding Company and shareholders’ resolution. The objective is toreward the key employees for their past association and performance as well as to motivate them to contribute to the growth and profitability of the Holding Company. The ESOP Committeewould determine the specific persons to whom the Options would be granted and their eligibility criteria.The ESOP Committee or Board will identify eligible employees based on the eligibility criteria. The Board would then grant them options to purchase shares of the Holding Company by way ofgrant intimation, on terms as are stipulated in this Scheme. The exercise price for each option is decided by the management considering various factors affecting the exercise prices. Eachoption shall be designated in the grant letter
Each employee share option converts into one equity share of the Holding Company on exercise. No amounts are paid or payable by the recipient on receipt of the option. The options carryneither rights to dividends nor voting rights. These option vest as per vesting conditions. The vesting conditions are as follows:
ESOP 2020
the date on which the Holding Companyachieves a topline of Rs. 1,260,00,00,000 and anEBITDA of Rs. 100,00,00,000 during a particularfinancial year subject to the Grantee havingcompleted 60 months of employment with theHolding Company
the date on which the Company achieves atopline of Rs. Rs. 2,700,00,00,000 (Rupees TwoThousand Seven Hundred Crores) and an EBITDAof Rs. 216,00,00,000 (Rupees TwoHundred and Sixteen crores) during thepreceding financial year subject to the Granteehaving completed 60 (sixty) months ofemployment with the Company
275

42.3
Grant Date No of Options Granted Exercise price Fair value
11,326 250.00 1,192.0011,326 250.00 1,192.00
9,000 250.00 1,192.009,000 250.00 1,192.009,000 250.00 1,192.00
49,652
January 8, 2020 8,500 250.00 1,799.00Feburary 24, 2020 5,000 250.00 1,799.00October 26, 2020 5,000 250.00 1,799.00
(e) ESOP 2018 October 28, 2020 10,000 250.00 1,799.00(f) ESOP 2020 October 29, 2020 37,282 900.00 1,799.00
65,7821,15,434
Default Ves ng Condi on if none of the IPO Vesting Condition, LiquidityEvent Vesting Condition or Target VestingCondition has occurred on or before March 31of each financial year and subject to the optiongrantee: (i) having completed one year ofemployment as on March 31 of the previousfinancial year; (ii) a minimum period of one yearshould have lapsed since the grant of options ason March 31 of the previous financial year; (iii)being on the Company’s payroll as of March 31of the previous financial year; and (iv) not havingserved notice of termination of employment ason March 31 of the previous financial year, 20%or such other number as may be determined bythe Board/Committee, at their own discretion,of the Options granted to the Option Granteeshall automatically vest on April 01 of each yearwith the first such vesting taking place on April01, 2020 or thereafter based on the aboveconditions
if none of the IPO Vesting Condition, LiquidityEvent Vesting Condition or Target VestingCondition has occurred on or before March 31 ofeach financial year and subject to theOption Grantee : (i) having completed one yearof employment as on March 31 of theprevious financial year; (ii) a minimum period ofone year should have lapsed since the grant ofoptions as on March 31 of the previous financialyear; (iii) being on the Company’s payroll as ofMarch 31 of the previous financial year; and (iv)not having served notice of termination ofemployment as on March 31 of the previousfinancial year, upto 20% or such other numberas may be determined by the Board of theOptions granted to the Option Grantee shall vestin Quarter 2 of each financial year with the firstsuch vesting taking place in F.Y. 2022-23 orthereafter based on the above conditions, as perthe discretion of the Board/Committee
Grant series
(b) ESOP 2018
December 11, 2018
Total
(c) ESOP 2018
(a) ESOP 2018
(d) ESOP 2018
The share-based payments to employees being equity-settled are measured at the fair value of the equity instruments at the grant date. The fair value determined at the grant date of theequity-settled share-based payments is expensed on a straight-line basis over the vesting period, based on the Holding Company’s estimate of equity instruments that will eventually vest, witha corresponding increase in equity.
Share options outstanding at the end of the year have the following exercise prices and fair value:
276

42.4 Fair value of share options granted in the year:
Inputs into the model ESOP 2018 ESOP 2018 ESOP 2018 ESOP 2018 ESOP 2018 ESOP 2020 ESOP 2020Grant date December 11, 2018 August 14, 2019 January 8, 2020 Feburary 24, 2020 October 26, 2020 October 28, 2020 October 29, 2020Grant date share price 1,192.00 1,192.00 1,799.00 1,799.00 1,799.00 1799 1,799.00Exercise price 250.00 250.00 250.00 250.00 900.00 900.00 900.00Expected volatility 11.99% - 13.36% 17.06% 16.81% 16.82% 26.16% 17.99% 26.15% - 26.18%Expected life of the options 3 years - 3.67 years 3.78 years 4 years 3 years 1.42 years 1.42 years 1.42 yearsExpected dividend (%) 5.00% 5.00% 5.00% 5.00% 5.00% 5.00% 5.00%Risk free interest rate(%) 6.70% - 6.89% 5.59% 5.59% 5.49% 3.91% 3.85% - 3.90% 3.85%
42.5 Basis of assumptions:
42.6 Movement of Options Granted along with Weighted average exercise priceA) Series : ESOP 2018
Particulars
Number of options Weighted averageexercise price
Number of options Weighted averageexercise price
Number of options Weighted averageexercise price
Balance at beginning of year not exercised 1,24,128 250.00 1,43,692 250.00 - -
Granted during the year 5,000 250.00 25,000 250.00 1,53,692 250.00Forfeited/cancelled during the year (43,564) 250.00 (44,564) 250.00 (10,000) 250.00Exercised during the year (17,412) 250.00 - - - -Expired during the year - - - - - -Balance at end of year 68,152 1,24,128 1,43,692Exercisable at the end of the year - - -
B) Series : ESOP 2020
Number of options Weighted averageexercise price
- -47,282 900.00
- -- -- -
47,282 900.00- Exercisable at the end of the year
Balance at beginning of year not exercisedGranted during the yearForfeited/cancelled during the yearExercised during the yearExpired during the yearBalance at end of year
ParticularsYear ended March 31, 2021
The fair value of the share options granted during the financial year 18-19 is Rs. 1,192 and in financial year 19-20 is Rs. 1,799 . Options were priced using a Black-Scholes option pricing modelwhich takes into account the exercise price, expected volatility, option’s life, the share price at grant date, expected price volatility of the underlying share, the expected dividend yield and therisk free interest rate for the term of the option.
Year ended March 31, 2020 Year ended March 31, 2019(Proforma)
Year ended March 31, 2021
1. The risk free interest rates are determined based on the return on government Securities as on October 29, 2020 for respective period.2. The expected volatility was determined based on the underlying annualized volatility of the equity share for the period of one year prior to issue of the option. Volatility calculation is based on historical stockprices using standard deviation of daily change in stock price. The historical period is taken into account to match the expected life of the option.
277
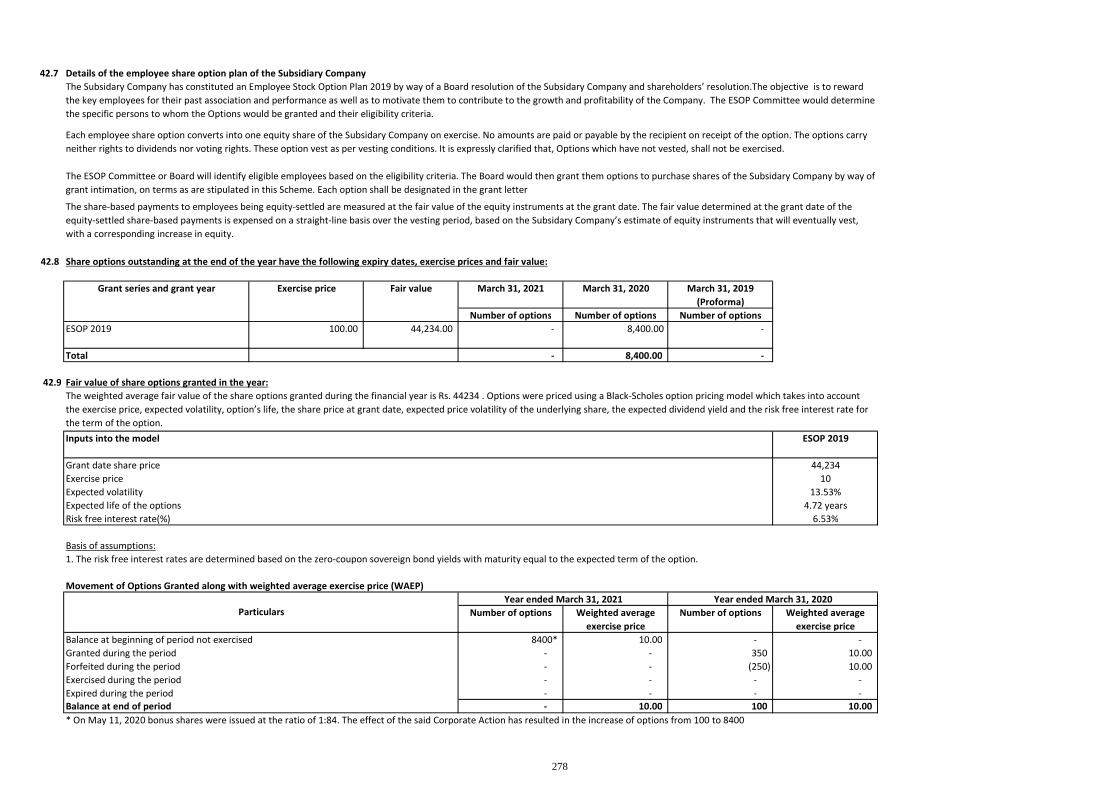
42.7 Details of the employee share option plan of the Subsidiary Company
42.8
Exercise price Fair value March 31, 2021 March 31, 2020 March 31, 2019(Proforma)
Number of options Number of options Number of optionsESOP 2019 100.00 44,234.00 - 8,400.00 -
Total - 8,400.00 -
42.9 Fair value of share options granted in the year:
44,23410
13.53%4.72 years
6.53%
Basis of assumptions:
Movement of Options Granted along with weighted average exercise price (WAEP)
Number of options Weighted averageexercise price
Number of options Weighted averageexercise price
8400* 10.00 - -- - 350 10.00
Forfeited during the period - - (250) 10.00- - - -
Expired during the period - - - -- 10.00 100 10.00
* On May 11, 2020 bonus shares were issued at the ratio of 1:84. The effect of the said Corporate Action has resulted in the increase of options from 100 to 8400
The Subsidary Company has constituted an Employee Stock Option Plan 2019 by way of a Board resolution of the Subsidary Company and shareholders’ resolution.The objective is to rewardthe key employees for their past association and performance as well as to motivate them to contribute to the growth and profitability of the Company. The ESOP Committee would determinethe specific persons to whom the Options would be granted and their eligibility criteria.
Each employee share option converts into one equity share of the Subsidary Company on exercise. No amounts are paid or payable by the recipient on receipt of the option. The options carryneither rights to dividends nor voting rights. These option vest as per vesting conditions. It is expressly clarified that, Options which have not vested, shall not be exercised.
The ESOP Committee or Board will identify eligible employees based on the eligibility criteria. The Board would then grant them options to purchase shares of the Subsidary Company by way ofgrant intimation, on terms as are stipulated in this Scheme. Each option shall be designated in the grant letter
The share-based payments to employees being equity-settled are measured at the fair value of the equity instruments at the grant date. The fair value determined at the grant date of theequity-settled share-based payments is expensed on a straight-line basis over the vesting period, based on the Subsidary Company’s estimate of equity instruments that will eventually vest,with a corresponding increase in equity.
Share options outstanding at the end of the year have the following expiry dates, exercise prices and fair value:
Grant series and grant year
Exercise priceExpected volatilityExpected life of the optionsRisk free interest rate(%)
The weighted average fair value of the share options granted during the financial year is Rs. 44234 . Options were priced using a Black-Scholes option pricing model which takes into accountthe exercise price, expected volatility, option’s life, the share price at grant date, expected price volatility of the underlying share, the expected dividend yield and the risk free interest rate forthe term of the option.Inputs into the model ESOP 2019
Grant date share price
Exercised during the period
Balance at end of period
1. The risk free interest rates are determined based on the zero-coupon sovereign bond yields with maturity equal to the expected term of the option.
ParticularsYear ended March 31, 2021 Year ended March 31, 2020
Balance at beginning of period not exercisedGranted during the period
278

Wellness Forever Medicare Limited(Formerly known as Wellness Forever Medicare Private Limited)Notes to the Restated Consolidated Financial InformationAll amounts are in Rs.in millions unless otherwise stated
43 Financial instruments and risk management43.1 Capital risk management
As at March 31, 2021 As at March 31, 2020 As at March 31, 2019(Proforma)
696.41 672.23 683.59(b) Long term debts 327.25 159.10 131.66
1,023.66 831.32 815.25Less: Cash and cash equivalents 170.11 162.43 59.42Total borrowings 853.55 668.90 755.83Equity 69.32 77.24 72.63
43.2 Categories of financial instruments
As at March 31, 2021 As at March 31, 2020As at March 31, 2019
(Proforma)
Financial assets
(a) Mandatorily measured:(i) Mutual Fund Investments 80.09 - -(ii) Investment in equity instruments - - -
Measured at amortised cost(a) Loans (including Inter Corporate Deposit) 17.85 2.89 2.46(b) Security Deposits 60.66 112.11 77.18(c) Deposits with Bank (Fixed Deposits) 93.04 10.11 9.55(d) Cash and cash equivalent 170.11 162.43 59.42(e) Bank balance other than (a) above 467.55 56.70 53.16(f) Trade receivables 285.96 232.23 210.28(g) Other financial assets 55.63 40.78 23.70
Total Financial Assets 1,230.89 617.25 435.76
Financial liabilities
Measured at amortised cost(a) Borrowings 932.24 766.80 778.64(b) Trade payables 433.59 394.44 336.75(c) Lease Liabilities 1,856.30 1,769.80 1,497.36
109.82 77.36 41.90
Total Financial Liabilities 3,331.95 3,008.40 2,654.65
The Group’s objective, when managing capital is to ensure the going concern operation and to maintain an efficient capital structure to reduce thecost of capital, support the corporate strategy and meet shareholder’s expectations. The policy of the Group is to borrow funds through banks orraise through equity which is supported by committed borrowing facilities to meet anticipated funding requirements. The Group manages its capitalstructure and makes adjustments in the light of changes in economic conditions and the requirement of financial markets. The capital structure isgoverned by policies approved by the Board of Directors, and is monitored by various metrics. The following table summarises the capital of theGroup (debts excludes lease liabilities):
(a) Short term debts (including current maturities of long term debt)
In order to achieve this overall objective, the Group’s capital management, amongst other things, aims to ensure that it meets financial covenantsattached to the interest-bearing loans and borrowings.The Group has not defaulted on any loans payable, and there has been no breach of any loan covenants.No changes were made in the objectives, policies or processes for managing capital during the year ended March 31, 2021 and March 31, 2020.
The following table provides categorisation of all financial instruments at carrying value, except non-current investments in un-quoted equityinstrument of subsidiary, which are carried at cost.
Particulars
Measured at fair value through profit or loss (FVTPL)
(d) Other financial liabilities (including current maturities of borrowings)
279

43.3 Financial risk management objectives
42.3.1 Market risk
42.3.1.1 Interest Rate Risk:
Particulars
Year ended March 31,2021
Year ended March31, 2020
Year ended March31, 2019 (Proforma)
Impact on profit or loss before tax for the year0.50% increase in Basis Point (%) (3.85) (3.54) (3.66)0.50% decrease in Basis Point (%) 3.85 3.54 3.66
42.3.1.2 Foreign currency risk management
42.3.1.3 Other price risks
Mutual fund price sensitivity analysisThe sensitivity analysis below have been determined based on Mutual Fund Investment at the end of the reporting period. If NAV has been 1% higher/ lower, the profit for year ended March 31, 2021 would increase/decrease by Rs.0.80 million (2019-2020: increase/decrease by Rs.Nil million) as aresult of the changes in fair value of mutual funds.
Mutual fund investments are susceptible to market price risk, mainly arising from changes in the interest rates or market yields which may impact thereturn and value of such investments. However, due to the very short tenor of the underlying portfolio in the liquid schemes, these do not hold anysignificant price risks.
The Group is exposed to price risks arising from mutual funds investments.The Group manages the surplus funds majorly through combination of investments in equity oriented mutual fund schemes and fixed deposits. Theprice of investment in these mutual fund Net Asset Value (NAV) declared by the Asset Management Company on daily basis as reflected by themovement in the NAV of invested schemes. The Group is exposed to price risk on such Investment schemes.
Market risk is the risk that the fair value of future cash flows of a financial instrument will fluctuate because of changes in market prices. Market riskcomprises three types of risks: interest rate risk, currency risk and other price risk. Financial instruments affected by market risk include borrowings,trade payables and trade receivables, loans.
Foreign currency risk is the risk that the fair value or future cash flows of an exposure will fluctuate because of changes in foreign exchange rates. TheGroup ’s exposure to the risk of changes in foreign exchange rates relates primarily to the Group ’s operating activities denominated in foreigncurrency.There are no such major foreign currency transactions executed by the group, the risk of foreign currency is minimal.
The assumed movement in basis points for the interest rate sensitivity analysis is based on the currently observable market environment, showing asignificantly higher volatility than in the prior years.
Interest Rate Sensitivity Analysis
The following disclosures summarize the Group ’s exposure to financial risks and information regarding use of derivatives employed to manageexposures to such risks. Quantitative sensitivity analyses have been provided to reflect the impact of reasonably possible changes in market rates onthe financial results, cash flows and financial position of the Group.
Interest rate risk is the risk that the fair value or future cash flows of debts will fluctuate because of changes in the market interest rates. The Group ’sexposure to the risk of changes in market interest rates relates primarily to the Group ’s debt obligations with floating interest rates.The Group manages its interest rate risk by having a balanced portfolio of fixed and variable rate loans and borrowings.
Interest Rate Sensitivity AnalysisThe following table demonstrates the sensitivity to a reasonably possible change in interest rates on that portion of loans and borrowings taken atfloating rates. With all other variables held constant, the Group ’s profit/ (loss) before tax is affected through the impact on floating rate borrowings,as follows:
The Group’s Corporate Treasury function provides services to the business, coordinates access to domestic financial markets, monitors and managesthe financial risks relating to the operations of the Group through internal risk reports which analyses exposures by degree and magnitude of risks.These risks include market risk (including currency risk, interest rate risk and price risk), credit risk and liquidity risk.
The Group’s financial assets comprise mainly of investments, cash and cash equivalents, other balances with banks, loans,trade receivables and otherreceivables and financial liabilities comprise mainly of borrowings, trade payables and other payables.
The Group is exposed to Market risk, Credit risk and Liquidity risk. The Board of Directors (‘Board’) oversee the management of these financial risksthrough its Risk Management Committee. The Risk Management Policy of the Group formulated by the Risk Management Committee and approvedby the Board, states the Group ’s approach to address uncertainties in its endeavour to achieve its stated and implicit objectives. It prescribes theroles and responsibilities of the Group ’s management, the structure for managing risks and the framework for risk management. The frameworkseeks to identify, assess and mitigate financial risks in order to minimize potential adverse effects on the Group ’s financial performance. The Boardhas been monitoring the risks that the Group is exposed to due to outbreak of COVID-19. The Board has taken all necessary actions to mitigate therisks identified basis the information and situation present.
280

42.3.2 Credit risk management
42.3.3 Liquidity risk management
Liquidity risk table
ParticularsUpto
1 year1-5 years Total
March 31, 2021Borrowings 696.61 2,645.69 3,342.30Trade Payables 394.44 - 394.44Lease Liabilities 750.77 1,105.53 1,856.30Other Financial Liabilities 109.82 1.91 111.73Total 1,951.63 3,753.13 5,704.76
March 31, 2020Borrowings 672.43 3,561.85 4,234.28Trade Payables 394.44 394.44Lease Liabilities 659.45 1,110.35 1,769.80Other Financial Liabilities 77.36 1.91 79.27Total 1,803.68 4,674.12 6,477.80
March 31, 2019 (Proforma)Borrowings 683.79 4,290.38 4,974.17Trade Payables 336.75 - 336.75Lease Liabilities 523.80 973.56 1,497.36Other Financial Liabilities 41.90 - 41.90Total 1,586.24 5,263.94 6,850.18
Credit risk is the risk that counterparty will not meet its obligations under a financial instrument or customer contract, leading to a financial loss. Tomanage this, the Group periodically assesses financial reliability of customers and other counterparties, taking into account the financial condition,current economic trends, and analysis of historical bad debts and ageing of financial assets. 85% of revenue from operations of the group are on cashand carry basis, the credit risk is minimal
Financial assets are written off when there is no reasonable expectations of recovery, such as a debtor failing to engage in a repayment plan with theGroup. Where loans or receivables have been written off, the Group continues to engage in enforcement activity to attempt to recover the receivabledues where recoveries are made, these are recognised as income in the Consolidated Statement of Profit and Loss.The Group is exposed to credit risk from its operating activities (primarily trade receivables and security deposits).
As at March 31, 2021, the Group has 13 customers that owed the Group more than Rs. 5.00 millions each and accounts for approximately 81.16% ofall the receivables outstanding. There are 310 customers with balances less than Rs. 5.00 millions each and accounts for approximately 18.84% of thetotal amounts receivable.An impairment analysis is performed at each reporting date on the basis of sales channel. In addition, a large number of minor receivables aregrouped into homogeneous groups and assessed for impairment collectively. The calculation is based on losses from historical data.
The Group monitors its risk of shortage of funds. The Group’s objective is to maintain a balance between continuity of funding and flexibility throughthe use of bank overdrafts, bank loans and preference shares. Approximately, 69% of the Group’s debt will mature in less than one year as at March31, 2020 (March 31, 2019: 58%) based on the carrying value of borrowings reflected in the financial statements. The Group assessed theconcentration of risk with respect to refinancing its debt and concluded it to be low. The Group has access to various sources of funding.The below tables summarises the maturity profile of the Group’s financial liabilities based on contractual payments.
The Group’s maximum exposure to credit risk for the components of the Balance Sheet as at March 31, 2021 March 31, 2020, March 31, 2019, is thecarrying amount as provided in Note - 16.
The following table details the Group's remaining contractual maturity for its non-derivative financial liabilities with agreed repayment periods. Thetables have been drawn up based on the undiscounted cash flows of financial liabilities based on the earliest date on which the Group can berequired to pay. The tables include principal cash flows along with interest. The contractual maturity is based on the earliest date on which the Groupmay be required to pay.
281

Wellness Forever Medicare Limited(Formerly known as Wellness Forever Medicare Private Limited)Notes to the Restated Consolidated Financial InformationAll amounts are in Rs.in millions unless otherwise stated
44 Fair value measurementsThis note provides information about how the Group determines fair values of various financial assets and financial liabilities.
44.1 Fair value of the Group's financial assets and financial liabilities that are measured at fair value on a recurring basis
1) Investments in Mutual funds at FVTPL 80.09 - - Level 1
2) Investments in equity instruments atFVTPL (unquoted) (see footnote (a))
- - - Level 3
(a)
(b) There were no transfers between Level 1 and 3 in the period.
44.2 Fair value of financial assets and finandalliabilities that are not measured at fair value (but fair value disclosures are required)
45 Disclosure as per Section 186 of the Companies Act, 2013
4646.1
46.2 Code of Social Security, 2020
The global spread of Covid-19 has led to an uncertain and unpredictable path ahead for all of us. Amidst the tumult of this unprecedented period,our priority has been to safeguard the health and well-being of our customers, employees and our communities while continuing our businessoperations.As the lockdown continues further, we are seeing reduced sales and lower footfalls in our stores. Reduction in variable costs will trail sales drop,abetted by higher cost of hygiene and sanitation at all our locations apart from higher absenteeism due to transport restrictions. The full extent towhich the pandemic will impact our future financial results will depend on upcoming developments, which are highly uncertain including any newinformation concerning the severity of the pandemic and the action to mitigate its spread as advised by local authorities.
The Code on Social Security, 2020 (‘Code’) relating to employee benefits during employment and post-employment benefits received Presidentialassent in September 2020. The Code has been published in the Gazette of India. However, the date on which the Code will come into effect has notbeen notified. The Group will assess the impact of the Code when it comes into effect and will record any related impact in the period when theCode becomes effective.
Investments in equity instruments - Upon the application of Ind AS 109, the Group has chosen to designate these investments in equity instrumentsas at FVTPL as the management believe that this provides a more meaningful presentation for short or medium-term strategic investments, thanreflecting changes in fair value immediately in profit or loss.
Other notes
(ii) There are no securities and guarantees provided and no guarantees given during the year.(i) Details of Investments made by the Group are given in Note 9. in the financial statement.
The details of loans, guarantees and investments under Section 186 of the Companies Act, 2013 read with the Companies (Meetings of Board and itsPowers) Rules, 2014 are as follows:
The directors consider that the carrying amounts of financial assets and financial liabilities recognised in the financial statements approximate theirfair values.
The Group has evaluated the impact of COVID-19 (including impact of second wave) on the operations of the Group, its revenue, earnings, cashflows, assets and liabilities and factored in the impact of it up to the date of approval of these financial statements on the carrying value of its assetsand liabilities. This impact on the business will depend upon future developments that cannot be predicted reliably at this stage. However, based onthe preliminary estimates, the Group does not carry any risk in the recoverability and carrying values of its assets including Property, plant andEquipment, inventory and trade receivable. The Group does not anticipate any additional liability as at the Balance Sheet date.
Some of the Group's financial assets and financial liabilities are measured at fair value at the end of each reporting period. The following table givesinformation about how the fair values of these financial assets and financial liabilities are determined (in particular, the valuation technique(s) andinputs used).
Fair value of investments in MutualFunds is based on Net asset value(NAV) declared by mutual fund housesat the reporting date.valuation has been done byconsidering the net worth of theCompany to arrive at the fair value
Impact of COVID - 19
March 31,2021
March 31,2020
Financial assets/ (Financial liabilities)Fair valuehierarchy
March 31,2019
(Proforma)
Valuation technique(s) and keyinput(s)
282

Wellness Forever Medicare Limited(Formerly known as Wellness Forever Medicare Private Limited)Notes to the Restated Consolidated Financial InformationAll amounts are in Rs.in millions unless otherwise stated
47 Event Reporting after Balance Sheet Date(a) Conversion of Holding Company From Private Limited Company to Public Limited Company
(b) Conversion of Series A, A1, A2 AND A3 CCPS
(c) Re-classification of the authorised and Paid-up Share Capital of the Holding Company
The status of the Holding Company has changed from private limited to public limited. Pursuant to the provisions of Section 18 of theCompanies Act, 2013, read with Rule 33 of the Companies (Incorporation) Rules, 2014, as amended from time to time, and videShareholders’ approval dated July 09, 2021, the name of the Company has changed from “WELLNESS FOREVER MEDICARE PRIVATELIMITED” to “WELLNESS FOREVER MEDICARE LIMITED” with effect from August 5, 2021, on which date the Registrar of Companies,Mumbai gave its approval for the said conversion.
On July 09, 2021, the Company has, vide Shareholders’ approval, converted the following fully paid Compulsorily convertiblePreference Shares of Rs. 10/- each into fully paid ordinary Equity Shares of Rs. 10/- each:
a. 757,637 Series A CCPS;b. 658,353 Series A1 CCPS;c. 138,954 Series A2 CCPS andd. 567,433 Series A3 CCPS
The outstanding, number of equity shares of the Hoilding Company pursuant to the above conversion are 84,59,286 shares.The equity shares of the Company pursuant to the conversion shall rank pari passu in all respects with the existing fully paid upEquity Shares of face value of ₹10 each of the Company.
On June 30, 2021, vide written consent from the specific class of shareholders, the following fully paid up Equity shares of Rs.10/-each are re-classified into ordinary fully paid Equity Shares of Rs.10/- each:
a. 7,10,000 Class A Equityb. 2,11,046 Class A1 Equityc. 4,61,410 Class A2 Equity andd. 1,45,000 Class A3 Equity
The outstanding, number of equity shares of the Holding Company pursuant to the above reclassification are 84,59,286 shares.
The equity shares of the Company pursuant to the reclassification shall rank pari passu in all respects with the existing fully paid upEquity Shares of face value of ₹10 each of the Company.
283

(d) Sub-Division of Face Value of Equity Shares of the Holding Company:
(e) Capitalization of Reserves and the issue of Bonus Shares to the Equity Shareholders of the Holding Company
(f) Incorporation of Wholly Owned Subsidiary
(g) Approval of Wellness Forever Employee Stock Option Plan 2021The Company has, vide Shareholders’ approval dated July 23, 2021, introduced and implemented “Wellness Forever Employee StockOption Plan 2021” (“ESOP 2021”) to create, grant, offer, issue and allot, at any time, to the present and / or future permanentemployees of the Company working in India or abroad and / or directors of the Company and any other individuals / entities asallowed under applicable rules, regulations, guidelines and laws (hereinafter referred to as “employees” or “said employees”),options not exceeding 1,81,491 (One Lakh Eighty One Thousand Four Hundred Ninety One) convertible into not exceeding 1,81,491(One Lakh Eighty One Thousand Four Hundred Ninety One) fully paid up equity shares, having face value of Rs.2/- (Rupees Two only)each, at such price, in one or more tranches, and on such terms and conditions as may be fixed or determined by the Board inaccordance with the Act and provisions of ESOP 2021.Vide board resolutions dated July 29, 201 and September 1, 2021, 2,37,000 employee benefit options were granted to employeesfrom above mentioned ESOP 2021.The Company has vide, Board Resolution dated September 1, 2021 and Shareholders Resolution dated September 23, 2021 amendedall ESOP plans to align them with SEBI (Share Based Employee Benefits) Regulations, 2014.
On July 09, 2021, the Company has, vide Shareholders’ approval, sub-divided the existing Authorised Share Capital of the Companyfrom Rs.20,00,00,000/- (Rupees Twenty Crore only) divided into 2,00,00,000 (Two Crore) Equity Shares of Rs. 10/- (Rupees Ten Only)each to Rs. 20,00,00,000/- (Rupees Twenty Crores only) divided into 10,00,00,000 (Ten Crore) Equity Shares of Rs. 2/- (Rupees TwoOnly) each.
Further pursuant to the sub-division of the Authorised Share Capital of the Company, the existing issued, paid-up and subscribedshare capital of the Company has automatically, been sub-divided from Rs. 8,45,92,860/- (Rupees Eight Crore Forty Five Lakh NinetyTwo Thousand Eight Hundred Sixty only) consisting of 84,59,286 (Eighty Four Lakh Fifty Nine Thousand Two Hundred Eighty Six)equity shares of face value of Rs. 10/- (Rupees Ten Only) each to Rs.8,45,92,860/- (Rupees Eight Crore Forty Five Lakh Ninety TwoThousand Eight Hundred Sixty only) consisting of 4,22,96,430 (Four Crore Twenty Two Lakh Ninety Six Thousand Four HundredThirty) equity shares of face value of Rs.2/- (Rupees Two only) each.
On July 9, 2021, the Company has, vide Shareholders’ approval, capitalized a sum of Rs.1,69,18,572/- (Rupees One Crore Sixty NineLakh Eighteen Thousand Five Hundred Seventy Two only) out of the Company's securities premium account and such amounts istransferred to the share capital account and is applied for issue and allotment of 84,59,286 (Eighty Four Lakh Fifty Nine ThousandTwo Hundred Eighty Six) equity shares of face value Rs.2/- (Rupees Two) each (“Equity Shares”) of the Company as bonus shares(“Bonus Equity Shares”) credited as fully paid-up, to the eligible shareholders of the Company, whose names appears in the Registerof Members as on June 30, 2021, in the proportion of 1:5, i.e. 1 (One) new Equity Share for every 5 (Five) Equity Shares held and thatthe Equity Share so issued and allotted are treated for all purposes as an increase of the nominal amount of the equity share capitalof the Company and not as an income in lieu of dividend credited.”
The Holding Company has incorporated a wholly owned subsidiary Company in India and executed a business transfer under thename and style of "Wellness Forever HealthTech Private Limited".
The Holding Company has made an investment of Rs.1,00,000/- (Rupees One Lakh only) by way of subscribing to 10,000 (TenThousand) Equity shares of Rs.10/- (Rupees Ten only) each in the above mentioned wholly owned subsidiary company, of which 9999(Nine Thousand Nine Hundred Ninety Nine) Equity Shares shall be subscribed in the very name of the Company and the 1 (one)Equity Share shall be subscribed in the name of Mr. Gulshan Bakhtiani, nominated in this behalf.
Pursuant to a business transfer agreement dated September 2, 2021 the Company has transferred, on a slump sale and as a goingconcern basis, its e-commerce business along with operation, development and maintenance of the websitewww.wellnessforever.com and “Wellness Forever” mobile application (including assets, contracts, employees, liabilities andintellectual property) to Wellness Forever HealthTech Private Limited.
284

Wellness Forever Medicare Limited(Formerly known as Wellness Forever Medicare Private Limited)Notes to the Restated Consolidated Financial InformationAll amounts are in Rs.in millions unless otherwise stated
48 Additional information
Information as at and for the year ended March 31, 2021
As % ofconsolidatednet assets
Amount As % ofconsolidated netassets
Amount As % ofconsolidatednet assets
Amount As % ofconsolidatednet assets
Amount
ParentWellness Forever Medicare Limited 104.90 2,797.56 81.24 -283.10 107.46 -2.07 81.39 -285.17SubsidaryAmore Health Essential Private Limited 0.84 22.33 12.62 -43.98 -7.46 0.14 12.51 -43.83
105.74 2,819.89 93.86 -327.08 100.00 -1.93 93.89 -329.01
Intercompany elimination and consolidation adjustments -5.74 -152.97 6.14 -21.38 - - 6.11 -21.39Total 100.00 2,666.90 100.00 -348.47 100.00 -1.93 100.00 -350.40
Information as at and for the year ended March 31, 2020
As % ofconsolidatednet assets
Amount As % ofconsolidated netassets
Amount As % ofconsolidatednet assets
Amount As % ofconsolidatednet assets
Amount
ParentWellness Forever Medicare Limited 104.42 1,761.85 -76.57 40.74 56.76 0.21 -77.48 40.94SubsidaryAmore Health Essential Private Limited 3.91 65.89 95.16 -50.63 43.24 0.16 95.52 -50.48
108.33 1,827.74 18.60 -9.89 100.00 0.36 18.04 -9.53
Intercompany elimination and consolidation adjustments -8.33 -140.51 81.40 -43.31 - - 81.96 -43.31Total 100.00 1,687.22 100.00 -53.21 100.00 0.36 100.00 -52.84
Name of the entity in Group Net Assets i.e., total assets minustotal liabilities
Share in profit or loss Share in othercomprehensive income
Share in total comprehensiveincome
Name of the entity in Group Net Assets i.e., total assets minustotal liabilities
Share in profit or loss Share in othercomprehensive income
Share in total comprehensiveincome
285

Information as at and for the year ended March 31, 2019 (Proforma)
As % ofconsolidatednet assets
Amount As % ofconsolidated netassets
Amount As % ofconsolidatednet assets
Amount As % ofconsolidatednet assets
Amount
ParentWellness Forever Medicare Limited 105.71 1,174.29 -220.35 29.38 100.00 -2.42 -171.18 26.96SubsidaryAmore Health Essential Private Limited -5.37 -59.70 301.08 -40.15 - - 254.93 -40.15
100.34 1,114.59 80.73 -10.76 100.00 -2.42 83.75 -13.19
Intercompany elimination and consolidation adjustments -0.34 -3.78 19.27 -2.57 - - 16.25 -2.56Total 100.00 1,110.81 100.00 -13.33 100.00 -2.42 100.00 -15.75
49
50
For and on behalf of the Board of Directors
Gulshan Bakhtiani Ashraf Biran Mohan ChavanDirector Director DirectorDIN 00172374 DIN 01716606 DIN 00249979
Gaurav Shah Nidhi VoraChief Financial Officer Company Secretary
Place : MumbaiDate : September 27, 2021
Previous year's figures have been regrouped wherever necessary, to conform to the current year's classification.
Name of the entity in Group Net Assets i.e., total assets minus Share in profit or loss Share in other
The restated consolidated financial statements of the Group for the year ended March 31, 2021 have been approved for issue in accordance with the resolution of the Board of Directors onSeptember 27, 2021.
Share in total comprehensive
286

Other financial information
Accounting ratios
(₹ in million, except per share data and number of equity shares, unless otherwise specified)As at March 31,2021
As at March 31,2020
As at March 31,2019(Proforma)
A. Net worth attributable to equityshareholders (Refer note 1 below)
2,609.71 1,653.14 1,106.29
B. Profit for the year (348.47) (53.21) (13.33)C. Weighted average number of ordinary
shares outstanding during the year *4,89,94,324 4,60,50,238 4,35,77,586
D. Weighted average number of dilutivepotential equity shares outstanding duringthe year (Refer note 2 below)
- - -
E. Weighted average number of ordinaryshares outstanding during the year includingdilutive potential equity shares if applicable*
4,89,94,324 4,60,50,238 4,35,77,586
F. Number of equity shares outstandingincluding CCPS
84,59,286 77,24,341 72,62,931
G. Number of dilutive potential equity shares 2,08,643 2,25,354 -
H. Number of equity shares outstandingincluding CCPS and alongwith dilutivepotential equity shares
86,67,929 79,49,695 72,62,931
I. Accounting RatiosBasic Earnings per share (B/C) (in ₹) * (7.11) (1.16) (0.31)Diluted Earnings per share (B/E) (in ₹) * (7.11) (1.16) (0.31)Return on Net worth for Equity shareholders(B/A)
-13.35% -3.22% -1.21%
Net Asset value per share excludingpotential equity shares (A/F) (in ₹)
308.50 214.02 152.32
Net Asset value per share including potentialequity shares (A/H) (in ₹)
301.08 207.95 152.32
I. EBITDA 761.76 879.16 711.33EBITDA Margin (%) 8% 10% 11%
Notes:
2) Since there is net loss for the years ended March 31, 2021, March 31, 2020 and March 31, 2019,potential equity shares are anti-dilutive in nature.
The accounting ratios derived from Restated Consolidated Financial Statements required to be disclosed under theSEBI ICDR Regulations are set forth below:
Particulars
* Pursuant to a resolution of our shareholders dated June 30, 2021,(a) Compulsorily Convertible Preference Shares (CCPS) were converted to equity shares in the ratio 1:1.(b) Each equity share of our Company of face value of ₹ 10 was split into 5 equity shares of face value of ₹2 each.(c) Bonus shares issued in the ratio 1:5All per share data has been calculated after giving effect to such stock split and bonus issue in accordancewith principles of Ind AS 33-“Earnings per share”.
1) ‘Net worth’ is the aggregate value of the paid-up share capital and all reserves created out of the profits,securities premium account and debit or credit balance of profit and loss account, after deducting theaggregate value of the accumulated losses, deferred expenditure and miscellaneous expenditure notwritten off, as per the restated balance sheet, but does not include reserves created out of revaluation ofassets, write-back of depreciation and amalgamation.
287

Reconciliation of Net Worth
As at March 31,2021
As at March 31,2020
As at March 31,2019(Proforma)
Equity share capital (A) 63.37 61.69 57.08Instruments entirely equity in nature (CCPS)(B)
21.22 15.55 15.55
Other equity- Securities Premium (C) 2,747.46 1,444.00 905.04- Retained Earnings (D) -222.34 131.90 128.63Total (E) = (C)+(D) 2,525.12 1,575.90 1,033.66
Net worth (F) = (A) + (B) + (E) 2,609.71 1,653.14 1,106.29
Note: Other equity does not include shares options outstanding account
Reconciliation of profit for the year/period to EBITDA and EBITDA margin(₹ in million, unless otherwise indicated)
March 31, 2021 March 31, 2020 March 31, 2019(Proforma)
Profit for the year (A) (348.47) (53.21) (13.33)Finance costs (B) 301.69 275.19 245.93Total tax expense for the year (C) -108.20 11.60 -16.60Depreciation and amortisation expense (D) 969.90 675.86 518.15
Other Finance incomeInterest income on bank deposits and others 53.07 30.28 22.81
Net gain arising on short term financialinvestments mandatorily measured at FVTPL
0.09 - -
Total (E) 53.16 30.28 22.81EBITDA (F) = (A)+(B)+(C)+(D)-(E) 761.76 879.16 711.33Revenue from operations (G) 9,240.21 8,632.51 6,769.80EBITDA Margin (F)/(G)*100 8.24% 10.18% 10.51%
As at fiscal ended (₹ in million)
CCPS - Compulsory convertible preference shares. These were converted to equity shares on June30, 2021
Particulars for the fiscal ended
EBITDA = Earnings before interest, taxes, depreciation and amortisation expense, which has beenarrived at by obtaining the profit / (loss) for the year and adding back finance costs, total taxexpense, depreciation and amortisation expense and reducing other finance income.
Particulars
288

289
OTHER FINANCIAL INFORMATION
The accounting ratios required under Clause 11 of Part A of Schedule VI of the SEBI ICDR Regulations are given below:
(in ₹ million, unless indicated otherwise)
Particulars As at and for the year
ended March 31, 2021
As at and for the year
ended March 31, 2020
As at and for the year
ended March 31, 2019
Restated loss for the year (A) (₹ in million) (348.47) (53.21) (13.33)
Weighted average number of equity shares in
calculating basic EPS (B) (number in million) 48.99 46.05 43.58
Weighted average number of equity shares in
calculating diluted EPS (C) (number in million) 48.99 46.05 43.58
Basic Earnings per share (in ₹) (D = A/B) (7.11) (1.16) (0.31)
Diluted Earnings per share (in ₹) (E = A/C) (7.11) (1.16) (0.31)
Total Equity (A) (₹ in million) 2,666.90 1,687.22 1,110.81
Restated loss for the year (B) (₹ in million) (348.47) (53.21) (13.33)
Return on net worth (C = B/A) (%) (13.07%) (3.15%) (1.20%)
Total Equity (A) (₹ in million) 2,666.90 1,687.22 1,110.81
Weighted average number of equity shares in
calculating basic EPS (B) (number in million) 48.99 46.05 43.58
Weighted average number of equity shares in
calculating diluted EPS (C) (number in million) 48.99 46.05 43.58
Net Asset Value per Equity Share (basic) (D = A/B) (in ₹)(3)
54.43 36.64 26.86
Net Asset Value per Equity Share (diluted)
(E = A/C) (in ₹)(3)
54.43 36.64 26.86
EBITDA(4) (₹ in million) 814.92 909.43 734.14
EBITDA Margin(4) (%) 8.66% 10.49% 10.78%
The ratios have been computed as under: 1. Basic and diluted earnings/ (loss) per equity share: Basic and diluted earnings/ (loss) per equity share are computed in acco rdance with Indian
Accounting Standard 33 notified under the Companies (Indian Accounting Standards) Rules of 2015 (as amended).
2. Return on Net Worth ratio: Profit/ (loss) for the period attributable to equity shareholders of the Company divided by the Total Equity of the Company at the end of the year.
3. Net asset value per equity share (basic/diluted) represents total equity as at the end of the fiscal year, as restated, divided by the weighted average number
of equity shares used in calculating basic/diluted EPS for the year, respectively.
4. We calculate EBITDA as: Aggregate of restated profit/(loss) after tax, tax expense, finance cost, depreciation and amortisation. We calculate EBITDA
Margin as EBITDA divided by total income. EBITDA and EBITDA Margin do not have a standardized meaning and are not recognized measures under
Ind AS or IFRS. For a reconciliation from our restated profits for the year / period to EBITDA, see “ Restated Consolidated Financial Information” on
page 204.
The audited standalone financial statements of our Company as at and for the year ended March 31, 2021, March 31, 2020, and
March 31, 2019 and the reports thereon dated September 24, 2021, December 4, 2020 and September 17, 2019, respectively
(“Audited Financial Statements”) are available at https://corporate.wellnessforever.com/investor.php. Company is providing
a link to this website solely to comply with the requirements specified under the SEBI ICDR Regulations. The Audited Financial
Statements do not constitute, (i) a part of this Draft Red Herring Prospectus; or (ii) a prospectus, a statement in lieu of a
prospectus, an offering circular, an offering memorandum, an advertisement, an offer or a solicitation of any offer or an off er
document to purchase or sell any securities under the Companies Act, the SEBI ICDR Regulations, or any other applicable law
in India or elsewhere in the world. The Audited Financial Statements should not be considered as part of information that any
investor should consider to for or purchase any securities of our Company, or any entity in which it or its shareholders have
significant influence (collectively, the “Group”) and should not be relied upon or used as a basis for any investment decision.
None of the Group or any of its advisors, nor any Book Running Lead Managers or the Selling Shareholders, nor any of their
respective employees, directors, affiliates, agents or representatives accept any liability whatsoever for any loss, direct o r
indirect, arising from any information presented or contained in the Audited Financial Statements, or the opinions expressed
therein.
Related Party Transactions
For details of the related party transactions, as per the requirements under applicable Accounting Standards, i.e., Ind AS 24 -
Related Party Disclosures read with the SEBI ICDR Regulations, for the Financial Year 202 1, Financial Year 2020, and
Financial Year 2019, see “Restated Consolidated Financial Information –Related party disclosures” on page 271.

290
FINANCIAL INDEBTEDNESS
Our Company has availed loans in the ordinary course of its business for the purposes of meeting working capital requirements
and capital expenditure requirements. Our Board is empowered to borrow money in accordance with Section 179 , Section 180
of the Companies Act and our Articles of Association.
The following table sets forth details of the aggregate outstanding borrowings of our Company, on a consolidated basis, as on
August 31, 2021.
Category of borrowing Sanctioned Amount (in ₹ million) Outstanding amount as on August
31, 2021
(in ₹ million)*
Term loans 1,010.10 567.19
Working capital 930.00 926.10
Overdraft facility 45.00 44.55
Total 1,985.10 1,537.82
* As certified by Ramesh M. Sheth & Associates, Chartered Accountants pursuant to the certificate dated September 29, 2021.
Principal terms of the borrowings availed by our Company :
The details provided below are indicative and there may be additional terms, conditions and requirements under the various
borrowing arrangements entered into by us.
1. Interest: Interest rate charged by the lenders ranges from for our term loans typically ranges from 8.70% to 11.30%.
2. Tenor: The tenor of the working capital loans typically ranges from three months to 12 months and the tenor for term
loans typically ranges from 24 months to 60 months.
3. Security: In terms of our borrowings where security needs to be created, we are typically req uired to create security
by way of:
(a) charge on all existing and future current assets of the Company;
(b) charge on fixed assets of the Company;
(c) charge on assets created out of term loan; and
(d) pledge of unencumbered shares of the Promoters of the Company.
In addition to this, some of the loans availed by our Company also require personal guarantees from our Promoters.
For details, see “History and Certain Corporate Matters – Details of guarantees given to third parties by our Promoter
Selling Shareholders” on page 180.
This is an indicative list and there may be additional requirements for creation of security under the various borrowing
arrangements entered into by us.
4. Prepayment: The lender may charge prepayment premium/penalty at such rate as may be advised by the lender at time
of request for prepayment of outstanding principal amount together with interest due in full or in part before the due
dates. The prepayment premium typically ranges up to 2% of the amount prepaid.
5. Repayment: The working capital facilities are typically repayable on demand. The repayment period for most term
loans typically ranges from three months to 60 months.
6. Key covenants:
In terms of our facility agreements and sanction letters, we are required to:
(a) utilize the facilities sanctioned by the lenders solely for the purpose for which the facilities are sanctioned;
(b) take prior consent before making any corporate investments or investments by way of share capital with any
other concern except in normal course of business;
(c) take prior consent before undertaking any new project or before any diversification, modernization or
expansion of our projects that is material in nature;
(d) take prior consent of the lenders for change in capital structure, change in shareholding pattern and

291
management control in the Company;
(e) take prior consent before permitting any transfer of controlling interest or make any drastic change in the
management set-up of the Company;
(f) take prior consent from the lenders for entering into any scheme for merger, amalgamation, compromise or
reconstruction;
(g) take prior consent of lenders before modification / amendment in the constitutional documents or change in
the constitution of our Company;
(h) take prior written permission for any reduction or change in promoter shareholding below a prescribed
threshold;
(i) take prior consent to avail any loan or stand as surety or guarantor for any third party liability or obligation or
provide any loan or advance to a third party;
(j) take prior consent of lenders for repaying loan amounts availed from shareholders and directors, and other
affiliates (as the case maybe);
(k) take prior consent of lenders for declaring dividend for any year except out of profits of the current year; and
(l) take prior consent of lenders for change in accounting systems.
7. Events of Default:
In terms of the facility agreements and sanction letters the following, among others, constitute as events of default:
(a) failure and/or breach of Company to perform any of the obligations or terms or conditions applicable under
the deed/other documents/any other agreement with any person including non -payment in full of any part of
the obligations when due or when demanded by the lender;
(b) any misrepresentation or misstatement under the agreement;
(c) initiation of proceedings pertaining to bankruptcy, liquidation or winding up;
(d) event of, winding up, failure in business, insolvency, bankruptcy, or initiations of any
proceedings/actions/notices under the applicable laws including Insolvency and Bankruptcy Code, 2016;
(e) default on any other borrowings vis-à-vis a lender;
(f) inadequacy of the insurance cover;
(g) inability of the borrower to repay debts to any person or any steps being taken by any person, accelerating
the payment obligations of the borrower or declaration by any person of an event of default under their
respective agreement with the Company;
(h) material deterioration or depreciation or decline in value of security created under the loan documents which
becomes unsatisfactory in the opinion of the lenders; and
(i) cessation of carrying out all or substantial part of its business.
8. Consequences of occurrence of events of default:
In terms of the facility agreements and sanction letters, in case of occurrence of events of default set out above, our
lenders may, among others:
(a) declare that the dues and all obligations shall immediately become due and payable irrespective of any agreed
maturity;
(b) declare that all of the undisbursed portion shall stand cancelled;
(c) enforce their security without relieving the Company of its obligations under the loan documentation;
(d) appoint a nominee/observer on the Board of the Company;
(e) restrict the Company from declaring or paying any dividend in respect of Equity Shares;
(f) levy penal interest;

292
(g) convert the outstanding due amounts under the facility into Equity Shares or other securities as prescribed
under the relevant loan documentation; and
(h) substitute or restructure the management setup of the Company.
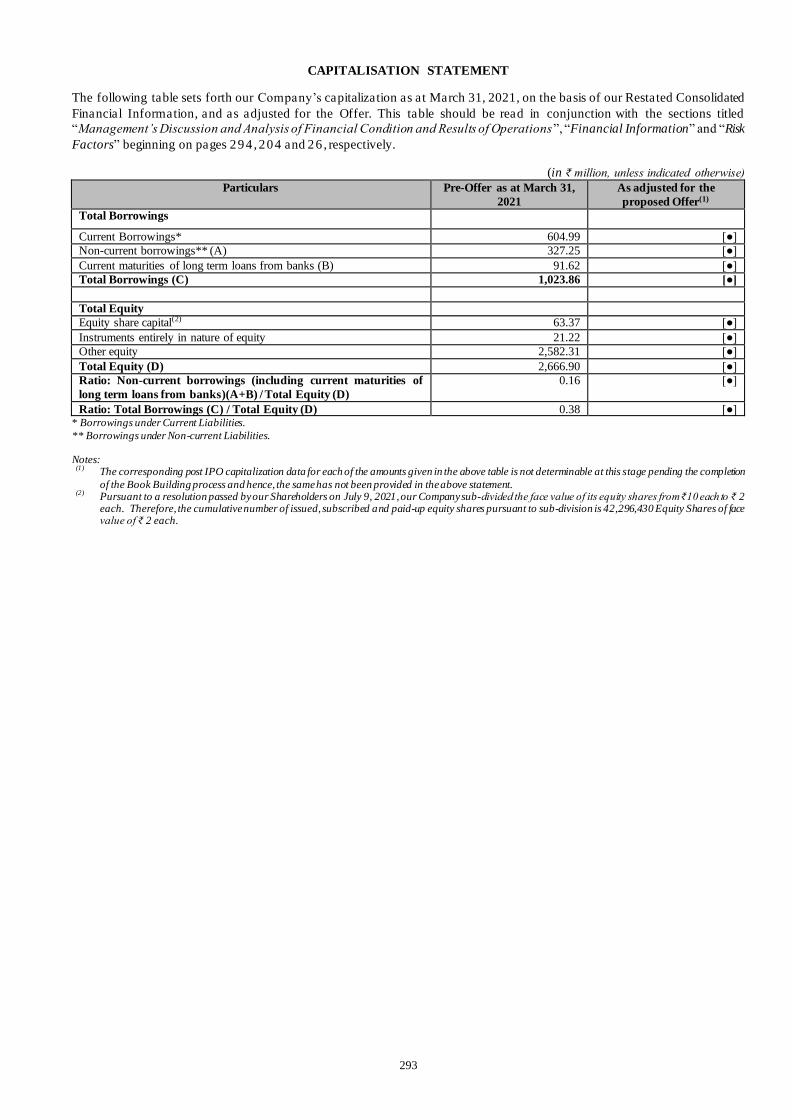
293
CAPITALISATION STATEMENT
The following table sets forth our Company’s capitalization as at March 31, 2021, on the basis of our Restated Consolidated
Financial Information, and as adjusted for the Offer. This table should be read in conjunction with the sections titled
“Management’s Discussion and Analysis of Financial Condition and Results of Operations”, “Financial Information” and “Risk
Factors” beginning on pages 294 , 204 and 26 , respectively.
(in ₹ million, unless indicated otherwise)
Particulars Pre-Offer as at March 31,
2021
As adjusted for the
proposed Offer(1)
Total Borrowings
Current Borrowings* 604.99 [●]
Non-current borrowings** (A) 327.25 [●]
Current maturities of long term loans from banks (B) 91.62 [●]
Total Borrowings (C) 1,023.86 [●]
Total Equity
Equity share capital(2) 63.37 [●]
Instruments entirely in nature of equity 21.22 [●]
Other equity 2,582.31 [●]
Total Equity (D) 2,666.90 [●]
Ratio: Non-current borrowings (including current maturities of
long term loans from banks)(A+B) / Total Equity (D)
0.16 [●]
Ratio: Total Borrowings (C) / Total Equity (D) 0.38 [●] * Borrowings under Current Liabilities.
** Borrowings under Non-current Liabilities. Notes:
(1) The corresponding post IPO capitalization data for each of the amounts given in the above table is not determinable at this stage pending the completion
of the Book Building process and hence, the same has not been provided in the above statement. (2) Pursuant to a resolution passed by our Shareholders on July 9, 2021, our Company sub-divided the face value of its equity shares from ₹10 each to ₹ 2
each. Therefore, the cumulative number of issued, subscribed and paid-up equity shares pursuant to sub-division is 42,296,430 Equity Shares of face value of ₹ 2 each.
294
MANAGEMENT’S DISCUSSION AND ANALYSIS OF FINANCIAL CONDITION AND RESULTS OF
OPERATIONS
The following discussion and analysis of our financial condition and results of operations should be read together with our
audited consolidated financial statements as of and for the fiscal years ended March 31, 2021, 2020 and 2019 as presented in
accordance with Indian Accounting Standards (“IND-AS”). Our audited consolidated financial statements as of and for the
fiscal years ended March 31, 2020 and 2019 were prepared under Indian GAAP and subsequently recasted to comply with
IND-AS for the purposes of comparison with our audited consolidated financial statements as of and for the fiscal year ended
March 31, 2021.
The following analysis and discussions include estimates and forward -looking statements that involve risks and uncertainties.
Our actual results may differ significantly from those discussed in these estimates and forward-looking statements as a result
of various factors, including, without limitation, those set forth in “Forward-Looking Statements” and “Risk Factors.”
Overview
We are India’s third largest retail pharmacy and wellness network by number of stores, with a leading position in Western India
in terms of total revenues, according to Technopak We operate a large omni-channel, hyperlocal retail network under our
“Wellness Forever” brand, serving as a one-stop solution for our customers’ wellness needs with most of our stores operating
24x7. We opened our first drugstore in 2008, and we have expanded our retail footprint to a total 236 stores in 23 cities across
the Indian states of Maharashtra, Karnataka and Goa serving a registered customer base of 6.7 million customers as of June 30,
2021. As a testament of our success, Technopak estimates that we generated the highest revenue per retail square foot in the
Indian pharmaceutical retail industry for fiscal years 2020 and 2021.
We focus on providing our customers with a retail experience that goes beyond simply purchasing medicines and key
necessities. We offer a wide assortment of merchandise comprising approximately 91,500 pharmaceutical and wellness
products, and each of our stores features an average of approximately 13,000 products per store, including fast -moving
consumer goods (“FMCG”), fast-moving health goods (“FMHG”), nutraceuticals and medical equipment, among other
products, alongside over-the-counter and prescription medicines. For the fiscal years 2019, 2020 and 2021, our revenues derived
from the sale of non-pharmaceutical products was Rs 2,407.18 million, Rs 3,122.44 million and Rs 4,087.62 million,
constituting 36.78%, 37.91% and 45.72%, of our total revenues respectively, which is significantly higher than our main
competitors in fiscal year 2021, according to Technopak.
In addition to the vast breadth and depth of our inventory, we also differentiate our brand by our selection of premium welln ess
products, which we offer through various third-party industry labels as well as our private label brands. Sales of premium
wellness products (which we define as products featuring gross margins higher than 30%), was Rs 684.92 million, Rs 1,005.42
million and Rs 1,458.63 million, respectively representing 10.47%, 12.21% and 16.32%, respectively, of our revenue from
operations for the fiscal years ended March 31, 2019, 2020 and 2021.
Our stores deliver a distinctive shopping environment and ambience for our customers. Our stores are strategically located,
most are open 24-hours a day and are on an average considerably larger in size than those of our main competitors, according
to Technopak. Most of our stores are designed in a differentiated, self -browsing format and feature qualified pharmacists
available at all times. We believe these features promote an aspirational element and help to position ourselves as a premium
wellness brand.
Our brick-and-mortar store network is complemented by our omni-channel, hyperlocal digital retail platforms, including our
website, easy-to-use mobile app and toll-free call center. We utilize our brick-and-mortar stores as a relatively quicker base for
fulfilling omni-channel orders as compared to a centralized distribution center, which allows us to target delivery of products
to our customers within two to six hours from when the order is placed. This provides our customers with the convenience of
seamlessly shopping through our omni-channel platforms around the clock and from the convenience of their homes. It also
allows us to generate synergies between our brick-and-mortar stores and our omni-channel platforms and helps to market our
brands across various retail channels.
Our business is technology-focused and supported by our IT-enabled distribution, fulfilment and other logistics capabilities. In
2014, we developed and commissioned what we refer to as our “Zero Error Distribution Center” (“ ZEDC”), which is our
principal, distribution center with an area spanning over 100,000 square feet. Moreover, our core information technology
systems are fully integrated, modern and sophisticated, which allows us to handle large volumes of merchandise and provides
efficient supply chain management that meets the complexities of our bu siness. Our inventory management system uses
statistical systems and calculations to decide when to purchase and replenish inventory at our distribution center, fulfilmen t
center and each of our stores.
Our retail network encompasses both our owned stores as well as our franchise network. We initiated expansion through the
franchise model in fiscal year 2020, and we had a total of three franchise stores as of June 30, 2021. Our franchise network
enables us to leverage the strength of our brand and accelerate our brand’s exposure to new customers at a lower cost of capital.
In addition, we believe that building out a broad franchise network can significantly enhance our fulfilment capabilities und er
our omni-channel retail strategy, with each new store serving as an additional fulfillment center for omni-channel orders.

295
We have added 116 new stores to our network during the past three fiscal years. Our total revenue from operations increased
from Rs. 6,769.80 million in fiscal year 2019 to Rs. 9,240.21 million in fiscal year 2021 at a CAGR (calculated as the mean
annual growth rate of an investment over a specified period of time longer than one year) of 16.83% and our EBITDA
(calculated as aggregate of restated profit/(loss) after tax, tax expense, finance cost, depreciation and amortisation) increased
from Rs. 734.14 million in fiscal year 2019 to Rs. 814.92 million in fiscal year 2021 at a CAGR (calculated as the mean annua l
growth rate of an investment over a specified period of time longer than one year) of 5.36%. Similarly, our sales margins (which
we define as revenue from operations less purchases of stock-in-trade and changes in inventories of stock-in-trade divided by
revenue from operations) have been at 28.49% for fiscal year 2019 to 27.23% for fiscal year 2021.
We seek to become India 's most respected chain of pharmacies and wellness stores. According to Technopak, the Indian
pharmacy retail space offers attractive opportunities for significant growth based on its India’s favorable demographic t rends
(such as increasing life expectancy), growing levels of disposable income, increased levels of digitization, greater prevalen ce
of chronic diseases, higher access to healthcare coverage and increased overall demand for pharmaceuticals and wellness
products. For more information, see “Industry Overview” on page 105. We believe we are well positioned to leverage our
competitive strengths and technological innovations to solidify our leadership in our existing markets, capitalize on India’s
growing digital health ecosystem and become a health and wellbeing partner of choice for our customers as we expand our
operations.
Principal Factors Affecting our Results of Operation
Our financial condition and results of operations have been, and are expected to be , influenced by numerous factors, including,
but not limited to, those factors described below.
Macroeconomic environment and purchasing power in India
Our performance and growth are, and will be, dependent to a large extent on the health of the Indian economy and consumption
spending by households. Economic growth in India is affected by various factors including domestic consumption and savings,
rate of inflation in India, balance of trade movements, and global economic uncertainty.
All of our business activities is conducted in India, and the macroeconomic environment in India has affected, and will continue
to affect, our results of operations. A favorable macroeconomic environment is generally characterized by, among other factors,
high gross domestic product growth; transparent, liquid and efficient capital markets; low inflation; a high level of business and
investor confidence; stable political and economic conditions; and strong business earnings. Unfavorable or uncertain economic
conditions mainly result from declines in economic growth, business activity or investor confidence; limitations on the
availability of capital or increases in the cost of credit and capital; increases in inflation, interest rates, exchange rate volatility,
default rates or the price of basic commodities, capital controls or limits on the remittance of dividends; or a combination of
these or other factors.
Our revenue is generated primarily from the sale of pharmaceutical and non-pharmaceutical wellness products (consisting
mainly of personal hygiene and beauty products). Consumer confidence, disposable income levels and overall economic growth
rates are among the main factors that often impact consumer spending behavior and demand for our products, particularly
premium and aspirational wellness products. Consumption of these products has increased as a function of increased affluence
and purchasing power of retail customers in India , which has been positively and materially affecting our operating results.
Poor economic conditions, however, tend to reduce our customers’ ability and willingness to pay, for premium and aspirational
wellness products, thus negatively impacting our sales revenues and profitability. Consequently, future changes in the Indian
economy, especially the purchasing power of consumers, is expected to directly impact our revenues and results of operations.
Effects of the COVID-19 pandemic
The outbreak of COVID-19 was recognized as a public health emergency of international concern on January 30, 2020 and as
a pandemic by the WHO on March 11, 2020. In response to the COVID-19 outbreak, the governments of many countries,
had/have taken preventive or protective actions, such as imposing country -wide lockdowns, as well as restrictions on travel and
business operations. The Government of India had announced a nation -wide lockdown on March 24, 2020 and imposed several
restrictions lasting until May 2020. While progressive relaxations have since been granted for movement of goods and people
and cautious re-opening of businesses and offices, many countries have experienced second and third wa ves of the COVID-19
outbreak even after a little over one year since COVID-19 virus first surfaced, and new strain of the coronavirus have been
discovered in the United Kingdom and India, among other countries. In particular, a second wave of COVID-19 infections in
India has severely impacted India in April and May 2021, and resulted in several state governments including Maharashtra,
Rajasthan and the National Capital Region announced partial lockdowns during the months of April and May 2021. These
measures have disrupted normal business operations both in and outside of affected areas.
As our store operations were considered by the Government of India to be an essential service, we have remained operational
during India’s lockdown in accordance with the gu idelines issued by the Ministry of Home Affairs and the relevant state
governments. During this period, our sale of sanitary products such as masks, disinfectant fluid and flu medicines significan tly
increased due to the outbreak of COVID-19; however, revenues from our stores located within hospitals and other healthcare
providers experienced a significant decline as potential customers delayed their treatments and many hospital were turned int o

296
COVID-19 wards. Overall, on a consolidated basis, the COVID-19 pandemic has led to increased revenue growth relative to
our historic trends, and has particularly accelerated our e-commerce growth. However, these results may not be indicative of
our results for future periods. Once the impact of the COVID-19 pandemic subsides, particularly as vaccines become more
widely available, and customers return to work or school or are otherwise no longer subject to the aforementioned lockdown
measures and similar mandates, a failure by us to continue capitalizing on growth oppo rtunities may result in declining revenue
and future operating results may fall below expectations.
We have incurred, and may continue to incur, certain increased expenses arising from the COVID-19 pandemic, including
additional new store opening expenses and higher employee training and development costs. We also experienced shortages of
certain medicines to treat ailments associated with COVID-19 during peak demand periods. In addition, because some of our
employees could not or were hesitant to come to the workplace, we were short of staff at some of our stores which slowed down
our logistics operations and impacted our customer service at our stores.
In coping with this situation, we have expanded our omni-channel, hyperlocal business model with a renewed emphasis on our
digital retail platforms. In particular, our digital retail platforms enabled our customers to order healthcare products via our
website, mobile app, toll-free call center or WhatsApp which orders were fulfilled by door-to-door delivery. Our e-commerce
sales generated from our mobile app and website collectively grew by 263% from fiscal year 2020 to fiscal year 2021, largely
as a result of changing consumer behaviors associated with the COVID-19 pandemic. In addition, we have undertaken several
initiatives to safeguard the safety of our employees and customers amidst the COVID-19 pandemic.
The short-term and long-term impact of epidemics and other public health crises, such as the ongoing COVID-19 pandemic,
on the Indian economy and our business, financial condition, and results of operations will depend on uncertain future
developments, including the duration, spread and intensity of the outbreak and Government responses to control the spread, al l
of which are uncertain and difficult to predict. Although a number of governments and organizations had revised India’s GDP
growth forecasts for 2021 upward as against downward forecasts for 2020 in response to the economic slowdown caused by
the spread of COVID-19, considering second wave of COVID-19 in India and announcement of partial lockdowns during the
month of April 2021 by several states, it is possible that the COVID-19 outbreak may cause a prolonged economic crisis or
recession. In spite of the vaccination drive being introduced in India, a large portion of the population remains unvaccinated
and vulnerable to the coronavirus.
The COVID-19 pandemic has not yet fully subsided, and it is not possible to predict its full impact on our business. Should
additional lockdowns or government restrictions be imposed forcing us to shut down, or which affect our counterparties
adversely and prevent them from complying with the terms of our agreements, or should the Government endorse an
interpretation of force majeure clauses that excuses our counterpa rties from discharging their obligations under our contracts,
our business may be materially and adversely affected. Additionally, although vaccination efforts are underway in India, there
can be no assurance that such vaccination efforts will be successfu l in stemming the rate of new COVID-19 infections,
especially in light of potential recurrence of infections and virus mutations.
While we believe the COVID-19 pandemic is not likely to impact recoverability of the carrying value of assets, our management
has been closely monitoring the impacts caused by COVID-19 and we will continue to operate our business as steadily and
safely as we can. Due to the continuing uncertainty around these factors, the complete impact of the COVID-19 pandemic on
our business, results of operations or financial condition cannot be reasonably estimated at this time.
Net store openings/closings
Our revenues and cost of sales have been and will continue to be materially affected by the total number of stores we operate,
especially the timing and number of new store openings and closings.
We utilize a formal review process in evaluating potential new store openings as well as the potential closing of
underperforming stores, with an aim toward realizing positive long-term financial performance for our store portfolio. Our
approach is both qualitative and quantitative in nature, based on our view of the internal and external opportunities and
challenges in our industry, as well as the performance of each of our stores, and we may increase or decrease the number of net
store closings in future periods depending on these factors.
We expanded our store network from 144 stores as of March 31, 2019 to 176 stores as of March 31, 2020, 222 stores as of
March 31, 2021 and 236 stores as of June 30, 2021. We plan to continue expanding our retail network by opening stores in new
markets, and we expect trends associated with new store opening to intensify in the near-term and medium-term as we accelerate
new store openings in line with our expansion plans.
Revenue effects
Newly opened stores have the effect of increasing our revenues and cost of sales, while store closings have the effect of
decreasing our revenues and cost of sales. We present these effects on a net basis, with the term “net store closings” referring
to the total number of store closings during a period, net of the number of store openings during that same period.
Our revenue growth can also vary according to the level of maturity of our stores, as store-level revenues depend on that store’s

297
stage of operation. Generally, revenue generated by a new store is lower at its initial stage of operation and tends to incre ase
after the first few years of operation as the store gains customer loyalty and market recognition. Following this initial stage,
growth in the revenue of a store will also depend on various factors such as the level of customer traffic, quality of store
management, extent of redecoration and renovation, and rate of growth in the local econo my.
Our stores reach their greatest potential for revenue and profit margins after 2 years in operation; accordingly, our new or
recently opened stores may not generate the expected level of revenue and profitability of our stores that have been open for
more than 1 year or stores we acquire, if at all.
Cost effects
We incur certain extraordinary expenses associated with openings and closings of our owned stores. For example, we typically
incur capital expenditures in building and setting up new owned stores, and higher than normal up-front employee training costs
during the first two months following a new store launch. With respect to owned store closings, we typically incur non-cash
asset impairments and the acceleration of certain expenses, such as lease terminations, employment terminations, licensing
costs and other exit costs associated with owned store closings.
In general, we expect our operational expenses as a percentage of sales to be higher for new stores than for mature stores ,
primarily as a result of the relatively fixed nature of our costs and the fact that marginal costs of additional sales within our
stores are significantly less than the marginal costs of initial sales at such stores. Therefore, we generally experience
disproportionate margin expansions as our same store sales increase, up to the installed sales capacity of our stores. Conversely,
we generally experience disproportionate margin contractions as our same store sales decrease, thus decreasing our operating
leverage.
However, our older stores tend to have higher operational costs in absolute terms, as these costs also include repairs which are
not capitalized. In addition, we carry out periodic renovations of our stores, which we believe are important in maintaining and
enhancing the image of our stores and in attracting customers. During renovations, we incur expenses and experience temporary
disruptions to our normal operations which may affect revenues.
On an aggregate level, an expansion of our retail network footprint enables us to benefit from economies of scale in procurement
and tends to improve our operating margin through our ability to leverage our fixed cost base.
Product assortment and sales mix
Our stores feature a wide selection of approximately 13,000 pharmaceutical and wellness products pharmaceutical and wellness
products tailored to meet the needs of our target customer demographics – India’s middle income and upper-middle income
customers. We also provide products at competitive prices to our customers and respond to their needs and tastes by optimizing
the range of products we offer.
Our profit margins also may vary across different product categories and sub-categories; accordingly, changes in the assortment
of products we sell can impact our sales and operating profit. For example, we believe our profit margin for sales of premium
wellness products is higher than that for sales of basic medicines.
The table below sets forth the revenue split and of our main product categories for the periods presented:
For the year ended
March 31, 2019 March 31, 2020 March 31, 2021
(Rs.
millions)
(%) (Rs.
millions)
(%) (Rs. millions) (%)
Pharmaceuticals 4,137.23 63.22% 5,113.59 62.08% 4,852.28 54.27%
FMCG 1,561.58 23.85% 1,902.38 23.10% 2,314.11 25.89%
Surgical 160.67 2.46% 214.64 2.61% 314.87 3.52%
Premium Label 684.92 10.47% 1,005.42 12.21% 1,458.63 16.32%
We aim to optimize our products mix and focus on offering more higher-margin, premium wellness products and significantly
improve our overall profitability. A central part of this strategy involves increasing the share of our private-label products as a
percentage of total sales. Private-label products are typically more profitable for us than their third-party counterparts. As such,
this continued effort has pushed gross margin higher.
Competition

298
The Indian retail store market has become increasingly competitive in recent years and this may increase in the future. We face
direct competition mainly from other store chains in terms of price, product lines, marketing programs and additional service s
provided to customers. We also face competition from various other competitors, including independent pharmacies, telephone
order prescription providers, supermarkets, convenience stores and other retailers operating in the e-commerce space. As
competitive pressures intensify, we may be required to expend additional resources to offer a more attractive value proposition
to our customers, and may exert downward pressures on the prices we are able to charge to our customers, which could
negatively impact our profit margins. This may require us to change our strategy, delay expansion plans or be more selective
in opening new stores. For more information, see discussions of our competition in the sections “Risk Factors” and “Our
Business” on pages 26 and 153, respectively.
Principal Components of our Income Statement
The following is a description of the principal components of our income statement
Total income
Our total revenue is comprised of (i) revenue from operations and (ii) other income.
Revenue from operations
Our revenue from operations includes revenue derived from (i) sales of branded pharmaceutical products, (ii) sales of generic
pharmaceutical products, (iii) sales of non-pharmaceutical products, which primarily include personal hygiene and beauty
products, (iv) sales of orthopedic, physiotherapy, rehabilitation and sports-based products, and (v) services provided at our
owned store operations, such as injections, blood pressure measurement and home delivery, as well as (vi) revenue from
franchising fees and services, which consist of a percentage of franchisee store revenues, plus fixed fees payable by our
franchisees for opening the stores under our franchise and fees for services provided to our franchisees, both of which do not
vary in accordance with the gross revenue of the franchisees.
Our revenue from operations do not include suppliers’ discounts or rebates, which we account for as reductions to our expenses
derived from the purchase of traded goods. Taxes on sales and services and amounts refunded to customers in connection with
the return of merchandise are deducted from our revenue from operations.
Other income
Other income includes (i) visibility income received from brand partners to strategically display their products at our stores, (ii)
supplier schemes, (iii) purchases/sales of target-based incentives from brand partners, (iv) other promotions and schemes from
our brand partners.
Total expenses
Our total expenses are comprised of (i) purchase of stock-in-trade, (ii) changes in inventories of stock-in-trade, (iii) employee
benefit expenses, (iv) finance cost, (v) depreciation & amortisation expense, (vi) lease rental expenses and (vii) other expenses.
Certain of our expenses, such as merchandise costs, fuel costs, other supply costs, credit card fees and professional services,
are variable in nature and generally increase or decrease in line with corresponding changes in our sales. In contrast, other
operating and administrative expenses, such as repairs and maintenance, fixed -rate leases for certain of our retail stores and
administrative offices, general administration and marketing are fixed in the short term. Our store operating costs include,
among others, human resource costs, utilities, and maintenance. These costs and expenses can fluctua te and also differ from
store to store depending on various factors.
Most of our stores are operated from premises acquired on a long-term lease basis. For those stores where we pay rentals, we
will continue to be affected by any future rental increases. Furthermore, when our current leases expire, we will need to re-
negotiate these leases with the relevant lessors, who may seek to impose higher costs or more onerous conditions on us.
Purchase of stock-in-trade
Our expenses derived from the purchase of traded goods include costs from our procurement of products we sell, including
pharmaceutical and non-pharmaceutical items (such as consumer, personal care and nutritional products).
Any discounts or rebates received from our suppliers are accounted for as reductions to our expenses derived from the purchase
of traded goods.
We view our expenses derived from the purchase of traded goods as an important measure of our operating performance as a
retailer. We seek to reduce expenses derived from the purchase of traded goods by actively managing our relationships with
suppliers and negotiating with them on a centralized basis for all of our retail stores. In light of our relatively large scale, we
have benefited from greater purchasing power in negotiating these volume discount contracts.

299
Changes in inventories of stock-in-trade
Our expenses derived from changes in inventories of stock include the effects of inventory increases or decreases, including
changes in traded goods.
Employee benefit expenses
Employee benefits expense consists of salaries, wages and bonus, contribution to provident and other funds, employee stock
option expense, other employee incentives, uniforms and staff welfare expenses.
Finance cost
Our financial cost primarily consists of interest expense and other borrowing costs.
Depreciation & amortisation expense
Depreciation and amortisation expense includes (i) depreciation of tangible assets, (ii) depreciation of right -of-use assets and
leases, and (iii) amortisation of intangible assets, in each case, in accordance with Ind AS.
Other expenses
Other expenses consists of repairs and maintenance, insurance, rates and taxes, rent including lease rentals, advertisement a nd
marketing, corporate social responsibility expenses, loss on disposal/ discard of fixed assets (net), training and development of
employees, last mile/delivery related expenses, digital marketing to acquire/retain customers, expenses related to the adoption
of new technologies, professional fees associated with this third party professional service providers, licensing expenses,
printing and stationery expenses and other miscellaneous expenses.
Tax expenses
Tax expense represents the tax liability owed to the government based on our income before tax and the applicable tax rate.
Our tax expense consists of current tax and deferred tax.
The Taxation Laws (Amendment) Ordinance, 2019, a new tax ordinance issued by India’s Ministry of Finance on September
20, 2019 to further amend the Indian Income Tax Act, 1961, prescribed certain changes to the income tax rate applicable to
companies in India. This ordinance provides an option for Indian companies to pay income tax at a concessional rate of 22%
(plus surcharge and cess) thus reducing the effective corporate tax rate in India to 25.17% as compared to the current effective
corporate tax rate of 34.94% subject to the condition that the companies opting for such concessional rate will not take advantage
of other tax exemptions or incentives under Indian tax laws. We have opted in favor of this voluntary concessional tax regime,
and are not permitted to subsequently opt out of it.
Critical Accounting Policies
The preparation of our financial statements is based on judgments and estimates made in accordance with our historical
experience, as well as several other factors that we believe are reasonable and material. The critical accounting policies are
those policies considered important to provide an understanding about how we form our judgments and estimates about certain
future events, including the variables and assumptions underly ing the estimates and the sensitivity of those judgments to
different variables and conditions. The adoption of critical accounting policies generally requires our management to make
certain judgments and estimates that impact the carrying value of our assets and liabilities, as well as our results of operations.
The settlement of the transactions involving such estimates can affect our net worth and financial situation, as well as our results
of the operations since the actual results could differ from our estimates.
We present below a summary of our critical accounting policies under Ind AS, including some of the variables, assumptions
and the sensitiveness to which such estimates are subject.
For information on the Company’s significant accounting policies, see Note 3 to our financial statements included elsewhere
in this Draft Red Herring Prospectus.
Recent Accounting Pronouncements
Ind As 116 – New Accounting Standard on Accounting for Leases
On March 30, 2019, the Ministry of Corporate Affairs promulga ted Ind AS 116 – Leases, the new accounting standard on
accounting for leases, which replaced the prior standard Ind AS 17 – Leases covering accounting for leases. Although Ind AS
116 was applicable to us starting from fiscal year April 1, 2019, we have given retroactive effect to Ind AS 116 for lease
accounting starting from April 1, 2018 in the preparation of our financial statements. Accordingly, all relevant figures reflected
in our financial statements have been reclassified and/or regrouped to give effect to the requirements of Ind AS 116. For more
information, see Note 7 to our financial statements included elsewhere in this Draft Red Herring Prospectus.

300
Our Results of Operations
The discussion of the following operating results is based on our audited consolidated financial statements as of and for the
fiscal years ended March 31, 2021, 2020 and 2019. The discussions relating to increases or decreases in each period were
compared to the previous period, except as otherwise stated.
Comparison of results of operations for the fiscal years ended March 31, 2021 and 2020
The following table shows a breakdown of our results of operations for the years indicated:
For the fiscal year ended March 31,
2020
2021
% change
(Rupees in millions)
Income
Revenue from operations.................................... 8,632.51 9,240.21 7.04
Other income .................................................... 38.48 173.38 350.57
Total income.................................................... 8,670.99 9,413.59 8.56
Expenses
Purchase of stock-in-trade .................................. 6 ,407.67 6 ,978.84 8.91
Changes in inventories of stock-in-trade............... (235.83) (254.98) 8.12
Employee benefit expense .................................. 985.10 1,085.47 10.19
Finance costs .................................................... 275.19 301.69 9.63
Depreciation & amortisation expense................... 675.86 969.90 43.51
Other expenses .................................................. 604.61 789.34 30.55
Total expenses ................................................. 8,712.60 9,870.26 13.29
Loss before tax......................................................... (41.61) (456.67) (997.58)
Current tax........................................................ 42.47 — —
Short provision for tax relating to earlier years...... — 1.47 —
Deferred tax...................................................... (30.87) (109.67) —
Loss for the year ...................................................... (53.21) (348.47) (554.95)
(1) Translations from Indian rupees to U.S. dollars are provided solely for the convenience of the reader. Translations were made at the
exchange rate of Rs. 73.5047 per US$1.00, being the closing exchange rate published by the Reserve Bank of India as of March 31,
2021.
Total Income
Our total income for the fiscal year ended March 31, 2021 was Rs. 9,413.59 million, a Rs. 742.60 million, or 8.56%, increase
as compared to Rs. 8,670.99 million for the fiscal year ended March 31, 2020.
Revenue from operations
Our revenue from operations for the fiscal year ended March 31, 2021 was Rs. 9,240.21 million, a Rs. 607.7 0 million, or 7.04%,
increase as compared to Rs. 8,632.51 million for the fiscal year ended March 31, 2020. This increase was primarily as a result
of a Rs. 396.30 million increase in sales due to opening of new stores. This was offset by a Rs. 24.32 million decrease in sa les
from visibility income.
Other income
Our other income for the fiscal year ended March 31, 2021 was Rs. 173.38 million, a Rs. 134.90 million, or 350.57%, increase
as compared to Rs. 38.48 million for the fiscal year ended March 31, 2020. This increase was primarily as a result of (i) a R s.
18.35 million increase in interest income on interest income on bank deposit s, (ii) a Rs. 9.41 million increase in insurance
claims received and (iii) a Rs. 35.62 million increase in income recognized lease rent concessions.
Total expenses

301
Our total expenses for the fiscal year ended March 31, 2021 was Rs. 9,870.26 million, a Rs. 1,157.66 million, or 13.29%,
increase as compared to Rs. 8,712.60 million for the fiscal year ended March 31, 2020.
Purchase of stock-in-trade
Our expenses derived from the purchase of stock-in trade were Rs. 6,978.84 million for the fiscal year ended March 31, 2021,
corresponding to a Rs. 571.17 million, or 8.91%, increase as compared to Rs. 6,407.67 million for the fiscal year ended March
31, 2020. This increase was primarily as a result of higher change in mix and higher input costs.
Changes in inventories of stock-in-trade
Our expenses derived from changes in inventories of stock-in-trade were Rs. 254.98 million for the fiscal year ended March
31, 2021, corresponding to a Rs. 19.15 million, or 8.12%, increase as compared to Rs. 235.83 million for the fiscal year ended
March 31, 2020. This increase was primarily as a result of a Rs. 254.98 million increase in closing inventory of our products
due to the second wave of COVID-19 in India.
Employee benefit expense
Our employee benefit expense were Rs. 1,085.47 million for the fiscal year ended March 31, 2021, corresponding to a Rs.
100.37 million, or 10.19%, increase as compared to Rs. 985.10 million for the fiscal year ended March 31, 2020. This increase
was primarily as a result of a Rs. 80.11 million increase in salaries, wages and bonus.
Finance costs
Our finance costs were Rs. 301.69 million for the fiscal year ended March 31, 2021, corresponding to a Rs. 26.50 million, or
9.63%, increase as compared to Rs. 275.19 million for the fiscal year ended March 31, 2020. This increase was primarily as a
result of a Rs. 22.09 million increase in interest cost on lease liabilities.
Depreciation & amortisation expense
Our depreciation & amortisation expense was Rs. 969.90 million for the fiscal year ended March 31, 2021, corresponding to a
Rs. 294.04 million, or 43.51%, increase as compared to Rs. 675.86 million for the fiscal year ended March 31, 2020. This
increase was primarily as a result of (i) a Rs. 185.44 million increase due to depreciation on property, plan t and equipment and
(ii) Rs 12.63 million increase as amortisation of intangible assets.
Other expenses
Our other expenses were Rs. 789.34 million for the fiscal year ended March 31, 2021, corresponding to a Rs. 184.73 million ,
or 30.55%%, increase as compared to Rs. 604.61 million for the fiscal year ended March 31, 2020. This increase was primarily
as a result of (i) a Rs. 28.42 million increase in provision for doubtful balances and doubtful deposits, (ii) a Rs. 27.28 million
increase in advertisement and sales promotion and (iii) a Rs 27.32 million increase in cost of outsourced manpower supply.
Loss before tax
As a result of the foregoing factors, our loss before tax was Rs. 456.67 million for the fiscal year ended March 31, 2021,
corresponding to a Rs. 415.06 million, or 997.50%, increase in losses as compared to Rs. 41.61 million for the fiscal year ended
March 31, 2020.
Tax expenses
Our tax expense was Rs. 108.20 million for the fiscal year ended March 31, 2021, corresponding to a Rs. 119.80 million, or
1,032.76%, decrease as compared to Rs. 11.60 million for the fiscal year ended March 31, 2020.
Loss for the year
As a result of the foregoing factors, our loss for the year was Rs. 348.47 million for the fiscal year ended March 31, 2021,
corresponding to a Rs. 295.26 million, or 554.90%, increase in losses as compared to Rs. 53.21 million loss for the fiscal year
ended March 31, 2020.
Comparison of results of operations for the fiscal years ended March 31, 2020 and 2019
The following table shows a breakdown of our results of operations for the years indicated:
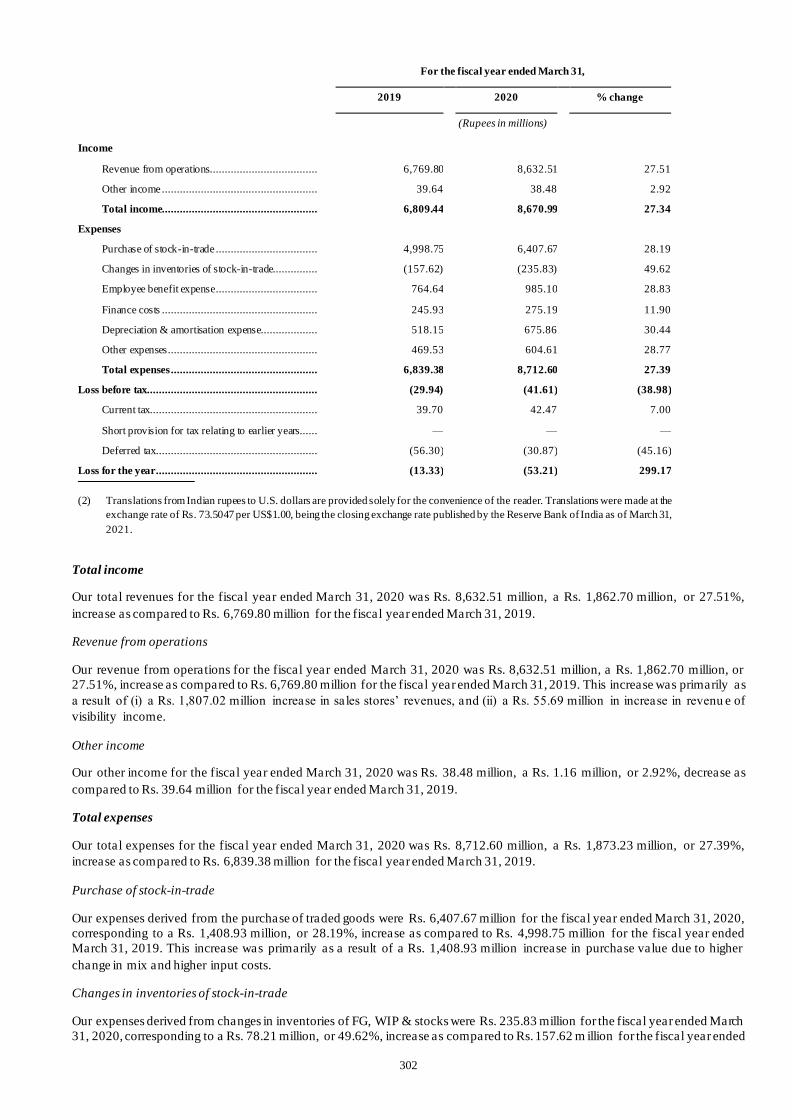
302
For the fiscal year ended March 31,
2019
2020
% change
(Rupees in millions)
Income
Revenue from operations.................................... 6,769.80 8,632.51 27.51
Other income .................................................... 39.64 38.48 2.92
Total income.................................................... 6,809.44 8,670.99 27.34
Expenses
Purchase of stock-in-trade .................................. 4,998.75 6,407.67 28.19
Changes in inventories of stock-in-trade............... (157.62) (235.83) 49.62
Employee benefit expense .................................. 764.64 985.10 28.83
Finance costs .................................................... 245.93 275.19 11.90
Depreciation & amortisation expense................... 518.15 675.86 30.44
Other expenses .................................................. 469.53 604.61 28.77
Total expenses ................................................. 6,839.38 8,712.60 27.39
Loss before tax......................................................... (29.94) (41.61) (38.98)
Current tax........................................................ 39.70 42.47 7.00
Short provision for tax relating to earlier years...... — — —
Deferred tax...................................................... (56.30) (30.87) (45.16)
Loss for the year ...................................................... (13.33) (53.21) 299.17
(2) Translations from Indian rupees to U.S. dollars are provided solely for the convenience of the reader. Translations were made at the
exchange rate of Rs. 73.5047 per US$1.00, being the closing exchange rate published by the Reserve Bank of India as of March 31,
2021.
Total income
Our total revenues for the fiscal year ended March 31, 2020 was Rs. 8,632.51 million, a Rs. 1,862.70 million, or 27.51%,
increase as compared to Rs. 6,769.80 million for the fiscal year ended March 31, 2019.
Revenue from operations
Our revenue from operations for the fiscal year ended March 31, 2020 was Rs. 8,632.51 million, a Rs. 1,862.70 million, or
27.51%, increase as compared to Rs. 6,769.80 million for the fiscal year ended March 31, 2019. This increase was primarily as
a result of (i) a Rs. 1,807.02 million increase in sales stores’ revenues, and (ii) a Rs. 55.69 million in increase in revenu e of
visibility income.
Other income
Our other income for the fiscal year ended March 31, 2020 was Rs. 38.48 million, a Rs. 1.16 million, or 2.92%, decrease as
compared to Rs. 39.64 million for the fiscal year ended March 31, 2019.
Total expenses
Our total expenses for the fiscal year ended March 31, 2020 was Rs. 8,712.60 million, a Rs. 1,873.23 million, or 27.39%,
increase as compared to Rs. 6,839.38 million for the fiscal year ended March 31, 2019.
Purchase of stock-in-trade
Our expenses derived from the purchase of traded goods were Rs. 6,407.67 million for the fiscal year ended March 31, 2020,
corresponding to a Rs. 1,408.93 million, or 28.19%, increase as compared to Rs. 4,998.75 million for the fiscal year ended
March 31, 2019. This increase was primarily as a result of a Rs. 1,408.93 million increase in purchase value due to higher
change in mix and higher input costs.
Changes in inventories of stock-in-trade
Our expenses derived from changes in inventories of FG, WIP & stocks were Rs. 235.83 million for the fiscal year ended March
31, 2020, corresponding to a Rs. 78.21 million, or 49.62%, increase as compared to Rs. 157.62 m illion for the fiscal year ended

303
March 31, 2019. This increase was primarily as a result of an increase in stocks of our Wellness brand products which increas ed
due to the COVID-19 pandemic.
Employee benefit expense
Our employee benefit expenses were Rs. 985.10 million for the fiscal year ended March 31, 2020, corresponding to a Rs. 220.46
million, or 28.83%, increase as compared to Rs. 764.64 million for the fiscal year ended March 31, 2019. This increase was
primarily as a result of a Rs. 186.01 million increase in salaries, wages and bonus.
Finance costs
Our financial costs were Rs. 275.19 million for the fiscal year ended March 31, 2020, corresponding to a Rs. 29.26 million, o r
11.90%, increase as compared to Rs. 245.93 million for the fiscal year ended March 31, 2019. This increase was primarily as a
result of (i) a Rs. 24.25 million increase in notional interest due to lease liability costs and (ii) a Rs 8.18 million incre ase due to
interest on earlier year’s assessment charges.
Depreciation & amortisation expense
Our depreciation & amortisation expense was Rs. 675.86 million for the fiscal year ended March 31, 2020, corresponding to a
Rs. 157.71 million, or 30.44%, increase as compared to Rs. 518.15 million for the fiscal year ended March 31, 2019. Th is
increase was primarily as a result of (i) Rs. 127.54 million increase due to amortisation of lease rental capitalized as righ t to use
asset, (ii) Rs. 21.01 million increase in depreciation.
Other expenses
Our other expenses were Rs. 604.61 million for the fiscal year ended March 31, 2020, corresponding to a Rs. 135.08 million ,
or 28.77%, increase as compared to Rs. 469.53 million for the fiscal year ended March 31, 2019. This increase was primarily
as a result of (i) a Rs. 50.71 million increase in brokerage and commission paid for sales promotions at retail stores and hospital
stores (ii) a Rs. 16.12 million increase in cost of outsourced manpower at our warehouse and (iii) Rs 13.57 million increase in
repairs and maintenance expenses.
Loss before tax
As a result of the foregoing factors, our loss before tax was Rs. 41.61 million for the fiscal year ended March 31, 2020,
corresponding to a Rs. 11.67 million, or 38.98%, increase as compared to a loss before tax of Rs. 29.94 million for the fiscal
year ended March 31, 2019.
Tax expenses
Our tax expense was Rs. 11.60 million for the fiscal year ended March 31, 2020, corresponding to a Rs. 28.2 0 million, or
169.93%, increase as compared to a tax credit of Rs. 16.60 million for the fiscal year ended March 31, 2019.
Loss for the year
As a result of the foregoing factors, our loss for the year was Rs. 53.21 million for the fiscal year ended March 31, 2020,
corresponding to a Rs. 39.88 million, or 299.17%, increase in losses as compared to a loss of Rs. 13.33 million for the fiscal
year ended March 31, 2019.
Liquidity and Capital Resources
Our main sources of liquidity are cash flow from our operations; short-term credit extended by suppliers; short and long-term
debt financing from financial institutions; and equity capitalization from our shareholders.
Our main liquidity requirements are investments for the construction of new retail stores, renovation and maintenance of
existing retail stores, improvements in our distribution centers, and investing in technology and logistics, including our digital
retail platforms. We also require working capital to meet our obligations with our suppliers and employees on an ongoing basis
as part of the ordinary course of our business.
As of March 31, 2021, our cash and cash equivalents totaled Rs. 170.11 million. As of March 31, 2021, our total current
liabilities were Rs. 1,956.16 million. We believe that our existing resources and the cash flow to be generated by our operations
will be sufficient to cover our liquidity needs, financial obligations and ambitious level of organic growth over the next 12
months. However, if our cash flows from operating activities are lower than expected or our capital expenditure requirements
exceed our expectations, we may be required to seek additional financing from other sources.
Cash Flows
The table below sets forth information regarding our cash flows for the periods indicated:

304
For the fiscal year ended March 31,
2019
2020
2021
(Rupees in millions)
Net cash generated by operating activities ................ 470.20 491.46 282.06
Net cash used in investing activities .......................... (268.16) (264.10) (970.55)
Net cash (used in)/ generated by financing activities.. (230.17) (124.35) 696.17
Net increase (decrease) in cash & cash equivalents.... (28.13) 103.01 7.68
Cash and cash equivalents at the beginning of the
period............................................................... 87.55 59.42 162.43
Cash and cash equivalents at the end of the period 59.42 162.43 170.11
Cash flow from operating activities
Our net cash generated from operating activities for the fiscal year ended March 31, 2021 was Rs. 282.06 million, a Rs. 209.41
million, or 42.61%, net cash decrease as compared to Rs. 491.46 million for the fiscal year ended March 31, 2020. This net
cash effect was primarily as a result of increase by 415.06 million of loss before tax which is partially offset by increase in non-
cash items depreciation and amortisation expenses of Rs. 294.04 million.
Our net cash generated from operating activities for the fiscal year ended March 31, 2020 was Rs. 491.46 million, a Rs. 21.26
million, or 4.53% %, net cash increase as compared to Rs. 470.20 million for the fiscal year ended March 31, 2019. This net
cash effect was primarily as a result of lower loss before tax of Rs. 11.86 million coupled with higher depreciation and
amortization expenses of Rs. 157.71 million which is of non-cash nature.
Cash flow from investing activities
Our net cash used in investing activities for the fiscal year ended March 31, 2021 was Rs. 970.55 million, a Rs. 706.45 million,
or 267.49%, net cash increase as compared to Rs. 264.10 million for the fiscal year ended March 31, 2020. This net cash effect
was primarily as a result of increase in payments to acquire financial assets of Rs. 739.30 million.
Our net cash used in investing activities for the fiscal year ended March 31, 2020 was Rs. 264.10 million, a Rs. 4.06 million ,
or 1.51%, net cash decrease as compared to Rs. 268.16 million for the fiscal year ended March 3 1, 2019.
Cash flow from financing activities
Our net cash generated in financing activities for the fiscal year ended March 31, 2021 was Rs. 696.17 million, a Rs. 820.52
million, or 659.85%, net cash increase as compared to a net cash use of Rs. 124.35 million for the fiscal year ended March 31,
2020. This net cash effect was primarily as a result of a Rs. 1,286.93 million inflow due to issue of equity instruments.
Our net cash used in financing activities for the fiscal year ended March 31, 2020 was Rs. 1 24.35 million, a Rs. 105.83 million,
or 29.96%, net cash decrease as compared to Rs. 230.17 million for the fiscal year ended March 31, 2019. This net cash effect
was primarily as a result of (i) a Rs. 543.57 million inflow due to due to proceeds from issu e of equity instruments, (ii) outflow
of Rs 595.83 million for lease liability.
Indebtedness
Our borrowings consist of funds obtained from secured and unsecured credit facilities, working capital loans, lease liabilities
and lease obligations entered with third-party financial institutions located inside of India. As of March 31, 2021, 2020 and
2019, our total current and non-current indebtedness was Rs. 1,023.86 million, Rs. 831.53 million and Rs. 815.45 million ,
respectively.
The table below sets forth further details on our current loan and financing obligations that were outstanding as of March 31,
2021:
Financing Instrument Currency
Applicable
Interest Rate Maturity Date
Outstanding
Amount
(Rupees in
millions)
Outstanding
Amount
(US dollars
in millions)(1)

305
Financing Instrument Currency
Applicable
Interest Rate Maturity Date
Outstanding
Amount
(Rupees in
millions)
Outstanding
Amount
(US dollars
in millions)(1)
HDFC Bank – Working Capital Demand Loan ........ INR 6.75% March 3, 2021 249.00 3.39
Yes Bank - Working Capital Demand Loan ............. INR 6.70% April 12, 2021 200.00 2.72
Axis Bank – Foreign Currency Term Loan .............. INR 7.20% April 15, 2021 150.00 2.04
Yes Bank – Term Loan ..........................................
INR 11.30%
March 22,
2023 64.47 0.88
Yes Bank – Term Loan ..........................................
INR 8.70%
February 26,
2026 65.50 0.89
IDFC First Bank – Term Loan ................................ INR 9.00% March 5, 2026 55.60 0.76
IDFC First Bank – Term Loan ................................
INR 11.25%
December 31,
2023 96.11 1.31
IDFC First Bank – Term Loan ................................
INR 11.15%
December 19,
2025 140.00 1.90
ICICI Bank – Over Draft INR 5.10% Revolving 2.33 0.03
Total current and non-current indebtedness ......... - - - 1,023.01 13.92
(3) Translations from Indian rupees to U.S. dollars are provided solely for the convenience of the reader. Translations were made at the
exchange rate of Rs. 73.5047 per US$1.00, being the closing exchange rate published by the Reserve Bank of India as of March 31,
2021.
As of March 31, 2021, 85.11% of our total current and non-current borrowings had variable interest rates, while 14.89% have
fixed interest rates.
As of March 31, 2021, 100% of our total current and non-current borrowings were denominated in Indian Rupees.
As of March 31, 2021, 100% of our total current and non-current indebtedness was secured by collateral. The collateral we
have pledged to secured payment on our indebtedness primarily includes loans from Yes Bank, Axis Bank an d IDFC First
Bank.
As of March 31, 2021, 88.16% of our total current and non-current indebtedness was guaranteed by personal guarantees given
by our 3 promoters, while 11.83% was guaranteed under the Emergency Credit Line Guarantee Scheme.
For more information, see “Financial Indebtedness” and Note 23 to our financial statements.
Capital Expenditures
Our capital expenditure requirements have historically consisted principally of investments for the construction of new retail
stores, renovation and maintenance of existing retail stores, improvements in our distribution centers, and investing in
technology and logistics, including our digital retail platforms and the construction of our warehouse and fulfillment center.
Our capital expenditures excluding right of use asset in fiscal years 2019, 2020 and 2021 totaled Rs. 222.97 million, Rs. 287 .73
million and Rs. 512.06 million, respectively. Historically, our capital expenditure needs have been financed through a
combination of the cash flow generated by our operations and debt financing from financial institutions.
As of March 31, 2021, our estimated amount of contracts remaining to be executed on capital account and not provided for (net
of capital advances) totaled Rs. 31.27 million, mostly relating to expenditures associated with the construction of our stores.
We intend to finance such amounts through term loans.
Capital Commitments and Contingent Obligations
As of March 31, 2021, our capital commitments and contingent obligations were comprised primarily of our current and non-
current borrowings, tax dues and bank guarantees.
The following table sets forth the tabular disclosure of our material capital commitments and contingent obligations in
accordance with their ma turity profile:

306
Less than One
Year
One to Three
Years
Three to Five
Years
More than
Five Years Total
Contingent Liabilities:
Income Tax Act................................................... 58.90 - - - -
Bank Guarantees ................................................. 30.00 - 3.90 - -
Commitments:
Capital Commitment............................................ 31.27 - - - -
Total.................................................................. 120.16 - 3.90 - -
(4) Relates to outstanding bank guarantees that we have provided in favor of Rashtriya Chemicals & Fertilizers Ltd and The Dean Goa
Medical College. For more information, see Note 38 to our financial statements.
As of the date of this Draft Red Herring Prospectus, other than as described above, we do not have any off –balance sheet
arrangements.
Quantitative and Qualitative Information on Market Risks
Market risk is the risk that the fair values of the future cash flows of a financial instrument fluctuate due to changes in market
prices. We are exposed to market risks arising from our normal business activities.
The principal market risks to which we are exposed comprise interest rate risk and currency risk.
Interest rate risk
Interest rate risk is the risk that the fair values or future cash flows of a financial instrument will fluctuate due to changes in
market interest rates.
Our exposure to interest rate risks primarily arises from our borrowings. As of March 31, 2021, 85.11% of our total current and
non-current borrowings had variable interest rates.
The sensitivity analysis below has been determined based on reasonably possible change of the respective assumptions
occurring at the end of the reporting period, while holding all other assumptions constant. These sensitivities show the
hypothetical impact of a change in each of the lied assumptions in isolation. While each of these sensitivities holds all other
assumptions constant, in practice such assumptions rarely change in isolation and the asset value changes may offset the impa ct
to some extent. For presenting the sensitivities, the present value of the defined benefit obligation has been calculated using the
projected unit credit method at the end of the reporting period, which is the same as that applied in calculating the Defined
Benefit Obligation presented above. There was no change in the methods and assumptions used in the preparation of the
sensitivity analysis from previous year.
Projected benefits payable in future years from the date of reporting
Year ended
March 31, 2021
Year ended March 31,
2020
Projected Benefit Obligation on Current Assumptions
Rate of Discounting
Impact of +0.5% change 45.46 34.32
Impact of -0.5% change 47.19 35.56
Rate of Salary Increase
Impact of +0.5% change 47.18 35.55
Impact of -0.5% change 45.46 34.22
Rate of Employee Turnover
Impact of +0.5% change 44.75 33.54
Impact of -0.5% change 48.02 36.36
For more information on interest rate risks to which we are exposed, see Note 40(K) to our financial statements.
Significant developments occurring after March 31, 2021
Except as disclosed below, there are no circumstances that have arisen since March 31, 2021, the date of the last financial
statements included in this Draft Red Herring Prospectus, which materially and adversely affect or is likely to affect our

307
operations or profitability, or the value of our assets or our ability to pay our material liabilities within the next twelve months.
• Our Company has incorporated its subsidiary, Wellness Forever HealthTech Private Limited, on July 23, 2021 with
an object to, inter alia, to carry on business in India or abroad for running and maintaining a portal for receiving
customer orders and selling all types of wellness and healthcare products; and
• Pursuant to a business transfer agreement dated September 2, 2021 entered into between our Company and one of its
Subsidiaries, Wellness Forever HealthTech Private Limited, our Company has transferred to Wellness Forever
HealthTech Private Limited, on a slump sale basis and as a going concern, our e-commerce business along with
operation, development and maintenance of the website www.wellnessforever.com and “Wellness Forever” mobile
application (including assets, contracts, employees, liabilities and intellectual property), which has been completed on
September 22, 2021.

308
SECTION VI: LEGAL AND OTHER INFORMATION
OUTSTANDING LITIGATION AND MATERIAL DEVELOPMENTS
Except as disclosed in this section, there are no outstanding (i) criminal proceedings; (ii) actions taken by regulatory or
statutory authorities; (iii) claims related to direct and indirect taxes; and (iv) other outstanding litigation as determined to be
material as per the materiality policy adopted pursuant to the Board resolution dated September 27, 2021, in each case
involving our Company, its Subsidiaries, Promoters and Directors (“Relevant Parties”).
For the purpose of identification of material litigation in (iv) above, our Board has considered and adopted the following policy
on materiality with regard to outstanding litigation to be disclosed by our Company in this Draft Red Herring Prospectus
pursuant to the Board resolution dated September 27, 2021. Accordingly, disclosures of the following types of litigation
involving Company, Directors, Promoters or Subsidiaries have been included.
In terms of the materiality policy, all outstanding litigation involving the Relevant Parties, other than criminal proceedings,
actions by regulatory authorities and statutory authorities, disciplinary actions including any penalty imposed by SEBI or stock
exchanges against our Promoters in the last five Fiscals including any outstanding actions as required under the SEBI ICDR
Regulations, and tax matters (direct or indirect), would be considered ‘material’ for disclosure in this Draft Red Herring
Prospectus:
(i) where the monetary amount of claim by or against the entity or person in any such pending proceeding is in excess of
1% of the total income of the Company as of March 31, 2021, as per the latest Restated Consolidated Financial
Information, being ₹ 94.13 million; or
(ii) where the outcome in one litigation is likely to affect the outcome in similar litigations, even though the amount
involved in an individual litigation may not be in excess of 1% of the total income of the Company as of March 31,
2021, as per the latest Restated Consolidated Financial Information, being ₹ 94.13 million; or
(iii) all other outstanding litigation which may not meet the specified threshold and parameters as set out in (i) and (ii)
above, or wherein a monetary liability is not quantifiable but where an adverse outcome would materially and
adversely affect the business, operations, financial position, or reputation of the Company (to be determined by the
Company).
It is clarified that for the purposes of the above, pre-litigation notices received by the Relevant Parties from third parties
(excluding those notices issued by statutory/regulatory/tax authorities) shall, unless otherwise decided by our Board, not be
considered as material until such time that the Relevant Parties, as applicable, is impleaded as defendant or respondent in
litigation proceedings before any judicial forum.
Further, except as disclosed in this section, there are no disciplinary actions including penalties imposed by the SEBI or th e
stock exchanges against our Promoters in the last five Financial Years including any outstanding action.
Except as stated in this section, there are no outstanding material dues to creditors of our Company. For this purpose, our
Board has considered and adopted a policy of materiality for identification of material outstanding dues to creditors, by way
of its resolution dated September 27, 2021. In terms of this materiality policy, outstanding dues to any creditor of our Company
having a monetary value which exceeds 5% of the total trade payables of our Company as per the Restated Consolidated
Financial Information of our Company as at March 31, 2021 disclosed in the Draft Red Herring Prospectus, shall be considered
as ‘material’. Accordingly, as on March 31, 2021, any outstanding dues exceeding ₹ 21.68 million have been considered as
material outstanding dues for the purposes of disclosure in this section.
Litigation involving our Company
Litigation against our Company
Criminal Litigation
Nil
Civil Litigation
As on date of this Draft Red Herring Prospectus, there is no outstanding civil litigation against the Company which is material
in terms of the materiality policy adopted by our Company.
Actions taken by Regulatory or Statutory Authorities
1. The Legal Metrology Officer, Chiplun from the Food, Civil Supplies and Consumer Protection Department, the Legal
Metrology Organisation, Mumbai, has filed a complaint dated July 21, 2020, against “Wellness Forever Lifestyle
Chemist” (a unit of our Company) and Mohan Ganpat Chavan, Promoter and Director of our Company, before the Court

309
of Judicial Magistrate First Class (“Legal Metrology Complaint”). The Complaint was filed for the Company being in
possession of the electronic personel scale bearing sr. no. C00797, in the absence of a ‘weights and measures dealer’s
license’, thereby violating various provisions of the Legal Meteorology Act, 2009. The electronic personnel scale had
been seized by the Legal Metrology Officer from the Company’s business premises situated at Sh op no. 5A&5B, Ajinkya
Arcade, ground floor, Shivaji Chowk, Chinch Naka , Chiplun, Ratnagiri. Pursuant to this, the Company ha d, vide its
letter dated January 9, 2020, referring to seizure receipt no. 0064807 dated January 6, 2020, and addressed to the Deputy
Controller of Legal Metrology, inter alia admitted the offence, requested for compounding of the said offence at a
departmental level instead of lodging the same in the court of law and expressed the willingness to pay the compounding
amount as imposed by the authority. The matter is currently pending.
2. Food Safety Officer, Food & Drug Administration, Satara has issued a noticed dated January 15, 2018 (“ Notice”) to
Jabbarkhan Rasidkhan Nadaf, a senior pharma cist and an employee of our Company and Mohan Ganpat Chavan,
Promoter of our Company, before the Judicial Officer, Pune Region, Food and Drugs Authority, Pune, for the sale of a
medium fat frozen dessert bearing the name “Cornetto Butterscotch” from the st ore situated at 180/1, 180 A/1,
Commercial Premises, Shop No. 5 and 6, Kasat Market, Powai Naka, Satara, which did not conform to standards as per
the Food Safety and Standards Act, 2006 (“FSS Act”), thereby violating various provisions of the FSS Act. The matter
is currently pending.
Litigation by our Company
Criminal Litigation
Nil
Civil Litigation
Nil
Litigation involving our Promoters
Litigation against Promoters
Criminal Litigation
Nil
Civil Litigation
Nil
Actions taken by Regulatory or Statutory Authorities
Mohan Ganpat Chavan
a) For details, see “ - Litigation involving our Company - Litigation filed against our Company – Actions taken by
Regulatory or Statutory Authorities” on page 308.
Litigation by Promoters
Criminal Litigation
Nil
Civil Litigation
Nil
Litigation involving our Directors
Litigation against our Directors
Criminal Litigation
Nil
Civil Litigation
Nil

310
Actions taken by Regulatory or Statutory Authorities
Mohan Ganpat Chavan
a) For details, see “ - Litigation involving our Company - Litigation filed against our Company – Actions taken by
Regulatory or Statutory Authorities” on page 308.
Litigation by our Directors
Criminal Litigation
Nil
Civil Litigation
Nil
Litigation involving our Subsidiaries
Civil/ Criminal Litigation by our Subsidiaries
Nil
Civil/ Criminal Litigation against our Subsidiaries
Nil
Actions taken by Regulatory or Statutory Authorities
Nil
Tax Claims
Except as disclosed below, there are no outstanding litigations involving claims related to direct and indirect taxes involving
our Company, Subsidiaries, Directors and Promoters:
Nature of case Number of cases Amount involved (in ₹
million)#
Litigation involving our Company
Direct Tax 4 58.90
Indirect Tax 4 43.14
Litigation involving our Subsidiaries
Direct Tax Nil -
Indirect Tax Nil -
Litigation involving our Promoters
Direct Tax Nil -
Indirect Tax Nil -
Litigation involving our Directors
Direct Tax Nil -
Indirect Tax Nil - #
To the extent quantifiable.
Outstanding dues to Creditors
As of March 31, 2021, our Company has 2,514 creditors, and the aggregate outstanding dues to these creditors by our Company
are ₹ 423.37 million.
As per the materiality policy, creditors of our Company to whom our Company owes an amount having a monetary value
exceeding 5% of the total trade payables of our Company as of March 31, 2021, (i.e., an amount exceeding ₹ 21.68 million)
have been considered as ‘material’. As of March 31, 2021, there is 1 material creditor to whom our Company owes an aggregate
amount of ₹ 26.25 million.
Based on this criteria, details of outstanding dues owed as on March 31, 2021 by our Company are set out below:
Type of Creditors Number of Creditors Amount
(in ₹ million)
Micro, small and medium enterprises 91 22.82
Material creditors 1 26.25

311
Type of Creditors Number of Creditors Amount
(in ₹ million)
Other creditors (Other than micro, small and
medium enterprises & Material Creditors)
2,422 374.30
Total 2,514 423.37
The details pertaining to outstanding dues towards our material creditors are available on the website of our Company at
https://corporate.wellnessforever.com/investor.php.
Material Developments
Other than as stated in “Management’s Discussion and Analysis of Financial Condition and Results of Operations” on page
294, there have not arisen, since the date of the last financial statement disclosed in this Draft Red Herring Prospectus, any
circumstances which materially and adversely affect, or are likely to affect, our trading, our profitability or the value of our
assets or our ability to pay our liabilities within the next 12 m onths.

312
GOVERNMENT AND OTHER APPROVALS
We have set out below a list of material approvals, consents, licences and permissions from various governmental and
regulatory authorities required to be obtained by us which are considered material and necessary for the purpose of
undertaking our business activities and operations (“Material Approvals”). In view of the approvals listed below, our Company
can undertake this Offer and its business activities, as applicable. In addition, certain of our Material Approval s may have
lapsed or expired or may lapse in their normal course and our Company has either already made applications to the appropriate
authorities for renewal of such Material Approvals or is in the process of making such renewal applications in accordan ce with
applicable requirements and procedures. Unless otherwise stated, Material Approvals as set out below, are valid as on date of
this Draft Red Herring Prospectus.
For details of risk associated with not obtaining or delay in obtaining the requisite approvals, see “Risk Factors – Our
operations require a number of permits, licenses and certifications, and our failure to obtain and maintain all of the necess ary
licenses, permits and certifications could adversely affect us” on page 39. For further details in connection with the regulatory
and legal framework within which we operate, see “Key Regulations and Policies”, beginning on page 171.
I. Incorporation details
For details in relation to the incorporation of our Company, see “History and Certain Corporate Matters”, beginning
on page 176.
II. Approvals in relation to the Offer
For the approvals and authorisations obtained by our Company in relation to the Offer, see “Other Regulatory and
Statutory Disclosures – Authority for the Offer”, beginning on page 313.
III. Tax related approvals of our Company
Our Company has obtained registrations under various central and state specific tax laws such as the Income Tax Act,
1961, goods and service tax acts, and professional tax acts. Our Company has obtained the necessary licenses and
approvals from the appropriate regulatory and governing authorities in relation to such tax laws.
IV. Material Approvals in relation to our business operations
In order to operate our stores in India, our Company requires various approvals and/or licenses under various state and
central laws, rules and regulations. These approvals and/or licenses, inter alia, include (a) licenses under the FSSA,
(b) licenses under Insecticides Act, 1968, (c) licenses under the Drugs and Cosmetics Act, 1940, (d) licenses under
Narcotic Drugs and Psychotropic Substances Act, 1985, and (e) trade, health and board licenses under state
municipality rules.
Our Company has obtained the necessary permits, licenses and approvals from the appropriate regulatory and
governing authorities required to operate our stores. Certain approvals may have lapsed in their normal course. We
have either made applications to the appropriate authorities for fresh licenses and/or approvals or for renewal of
existing licenses and/or approvals or is in the process of making such applications.
V. Registrations under Employment Laws
Our Company has obtained the relevant shops and establishments’ registrations. Certain licenses may have lapsed
under their normal course. We have either made an application to the appropriate authorities for fresh registrations or
for renewal of existing registrations, or is in the process of making such applications.
We have also obtained registration under the Employees’ Provident Funds and Miscellaneous Provisions Act, 1952
and Employees’ State Insurance Act, 1948.
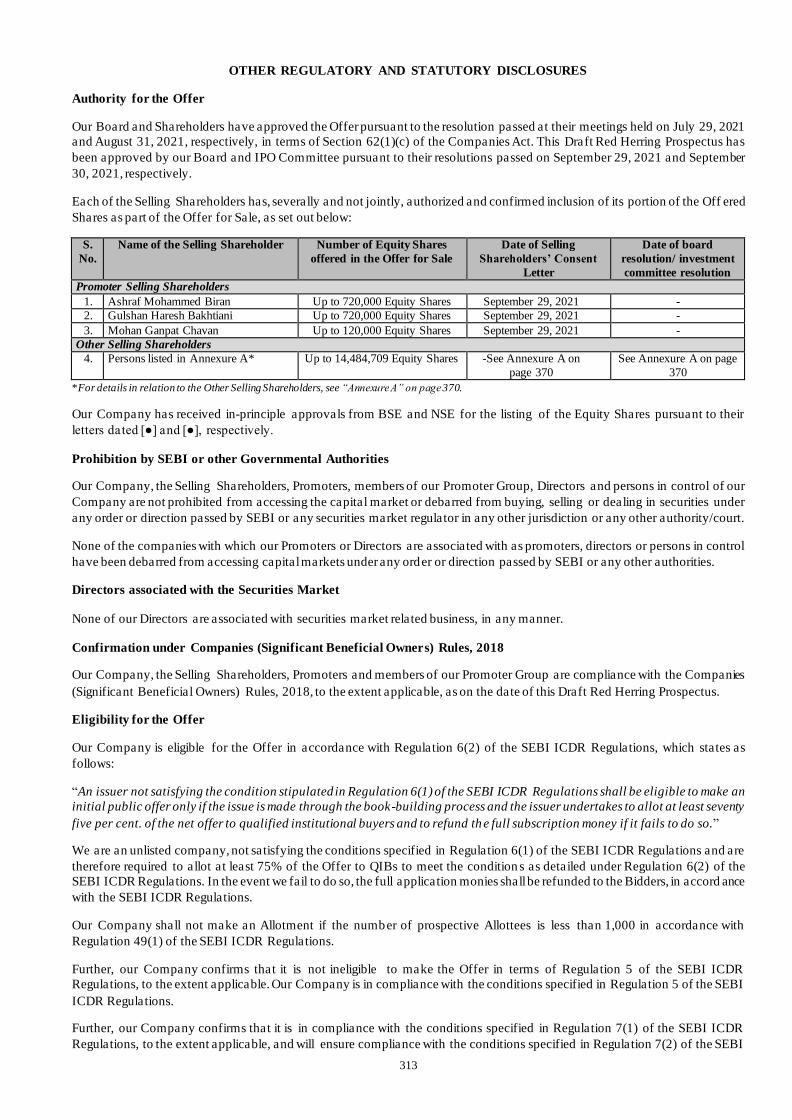
313
OTHER REGULATORY AND STATUTORY DISCLOSURES
Authority for the Offer
Our Board and Shareholders have approved the Offer pursuant to the resolution passed at their meetings held on July 29, 2021
and August 31, 2021, respectively, in terms of Section 62(1)(c) of the Companies Act. This Draft Red Herring Prospectus has
been approved by our Board and IPO Committee pursuant to their resolutions passed on September 29, 2021 and September
30, 2021, respectively.
Each of the Selling Shareholders has, severally and not jointly, authorized and confirmed inclusion of its portion of the Off ered
Shares as part of the Offer for Sale, as set out below:
S.
No.
Name of the Selling Shareholder Number of Equity Shares
offered in the Offer for Sale
Date of Selling
Shareholders’ Consent
Letter
Date of board
resolution/ investment
committee resolution
Promoter Selling Shareholders
1. Ashraf Mohammed Biran Up to 720,000 Equity Shares September 29, 2021 -
2. Gulshan Haresh Bakhtiani Up to 720,000 Equity Shares September 29, 2021 -
3. Mohan Ganpat Chavan Up to 120,000 Equity Shares September 29, 2021 -
Other Selling Shareholders
4. Persons listed in Annexure A* Up to 14,484,709 Equity Shares -See Annexure A on
page 370
See Annexure A on page
370
*For details in relation to the Other Selling Shareholders, see “Annexure A” on page 370.
Our Company has received in-principle approvals from BSE and NSE for the listing of the Equity Shares pursuant to their
letters dated [●] and [●], respectively.
Prohibition by SEBI or other Governmental Authorities
Our Company, the Selling Shareholders, Promoters, members of our Promoter Group, Directors and persons in control of our
Company are not prohibited from accessing the capital market or debarred from buying, selling or dealing in securities under
any order or direction passed by SEBI or any securities market regulator in any other jurisdiction or any other authority/court.
None of the companies with which our Promoters or Directors are associated with as promoters, directors or persons in control
have been debarred from accessing capital markets under any order or direction passed by SEBI or any other authorities.
Directors associated with the Securities Market
None of our Directors are associated with securities market related business, in any manner.
Confirmation under Companies (Significant Beneficial Owners) Rules, 2018
Our Company, the Selling Shareholders, Promoters and members of our Promoter Group are compliance with the Companies
(Significant Beneficial Owners) Rules, 2018, to the extent applicable, as on the date of this Draft Red Herring Prospectus.
Eligibility for the Offer
Our Company is eligible for the Offer in accordance with Regulation 6(2) of the SEBI ICDR Regulations, which states as
follows:
“An issuer not satisfying the condition stipulated in Regulation 6(1) of the SEBI ICDR Regulations shall be eligible to make an
initial public offer only if the issue is made through the book-building process and the issuer undertakes to allot at least seventy
five per cent. of the net offer to qualified institutional buyers and to refund th e full subscription money if it fails to do so.”
We are an unlisted company, not satisfying the conditions specified in Regulation 6(1) of the SEBI ICDR Regulations and are
therefore required to allot at least 75% of the Offer to QIBs to meet the condition s as detailed under Regulation 6(2) of the
SEBI ICDR Regulations. In the event we fail to do so, the full application monies shall be refunded to the Bidders, in accord ance
with the SEBI ICDR Regulations.
Our Company shall not make an Allotment if the number of prospective Allottees is less than 1,000 in accordance with
Regulation 49(1) of the SEBI ICDR Regulations.
Further, our Company confirms that it is not ineligible to make the Offer in terms of Regulation 5 of the SEBI ICDR
Regulations, to the extent applicable. Our Company is in compliance with the conditions specified in Regulation 5 of the SEBI
ICDR Regulations.
Further, our Company confirms that it is in compliance with the conditions specified in Regulation 7(1) of the SEBI ICDR
Regulations, to the extent applicable, and will ensure compliance with the conditions specified in Regulation 7(2) of the SEBI

314
ICDR Regulations, to the extent applicable.
The status of compliance of our Company with the conditions as specified under Regulations 5 and 7(1) of the SEBI ICDR
Regulations are as follows:
(i) Our Company, our Promoters, members of our Promoter Group, our Directors or the Selling Shareholders are not
debarred from accessing the capital markets by SEBI;
(ii) The companies with which our Promoters or our Directors are associated as a promoter or director are not debarred
from accessing the capital markets by SEBI;
(iii) Neither our Company, nor any of our Promoters, our Directors or the Selling Shareholders is a wilful defaulter (as
defined in the SEBI ICDR Regulations) and have not been declared as wilful defaulters by any bank or financial
institution or consortium thereof in accordance with the guidelines on wilful defaulters issued by the RBI ;
(iv) None of our Promoters or Directors has been declared as a fugitive economic offender under Section 12 of the Fugitive
Economic Offenders Act, 2018;
(v) There are no outstanding convertible securities of our Company or any other right which would entitle any person with
any option to receive Equity Shares of our Company as on the date of filing of this Draft Red Herring Prospectus;
(vi) Our Company along with Registrar to the Offer has entered into tripartite agreements dated August 31, 2021 and
August 30, 2021 with NSDL and CDSL respectively, for dematerialisation of the Equity Shares;
(vii) The Equity Shares of our Company held by our Promoters are in the dematerialised form;
(viii) All the Equity Shares are fully paid-up and there are no partly paid-up Equity Shares as on the date of filing of this
Draft Red Herring Prospectus;
(ix) Our Company has received in-principle approvals from BSE and NSE for the listing of the Equity Shares pursuant to
their letters dated [●] and [●], respectively; and
(x) Our Company has appointed [●] as the Designated Stock Exchange.
DISCLAIMER CLAUSE OF SEBI
IT IS TO BE DISTINCTLY UNDERSTOOD THAT SUBMISSION OF THIS DRAFT RED HERRING PROSPECTUS
TO SECURITIES AND EXCHANGE BOARD OF INDIA (“SEBI”) SHOULD NOT, IN ANY WAY, BE DEEMED OR
CONSTRUED THAT THE SAME HAS BEEN CLEARED OR APPROVED BY SEBI. SEBI DOES NOT TAKE ANY
RESPONSIBILITY EITHER FOR THE FINANCIAL SOUNDNESS OF ANY SCHEME OR THE PROJECT FOR
WHICH THE ISSUE IS PROPOSED TO BE MADE OR FOR THE CORRECTNESS OF THE STATEMENTS MADE
OR OPINIONS EXPRESSED IN THIS DRAFT RED HERRING PROSPECTUS. THE BOOK RUNNING LEAD
MANAGERS, BEING IIFL SECURITIES LIMITED, AMBIT PRIVATE LIMITED, DAM CAPITAL ADVISORS
LIMITED (FORMERLY IDFC SECURITIES LIMITED) AND HDFC BANK LIMITED, HAVE CERTIFIED THAT
THE DISCLOSURES MADE IN THIS DRAFT RED HERRING PROSPECTUS ARE GENERALLY ADEQUATE
AND ARE IN CONFORMITY WITH THE SEBI ICDR REGULATIONS. THIS REQUIREMENT IS TO
FACILITATE INVESTORS TO TAKE AN INFORMED DECISION FOR MAKING AN INVESTMENT IN THE
PROPOSED ISSUE.
IT SHOULD ALSO BE CLEARLY UNDERSTOOD THAT WHILE THE COMPANY IS PRIMARILY
RESPONSIBLE FOR THE CORRECTNESS, ADEQUACY AND DISCLOSURE OF ALL RELEVANT
INFORMATION IN THIS DRAFT RED HERRING PROSPECTUS AND THE SELLING SHAREHOLDERS WILL
BE RESPONSIBLE ONLY FOR THE STATEMENTS SPECIFICALLY CONFIRMED OR UNDERTAKEN BY
THEM IN THIS DRAFT RED HERRING PROSPECTUS IN RELATION TO THEMSELVES FOR THE OFFERED
SHARES, THE BOOK RUNNING LEAD MANAGERS ARE EXPECTED TO EXERCISE DUE DILIGENCE TO
ENSURE THAT THE COMPANY AND THE SELLING SHAREHOLDERS DISCHARGE THEIR
RESPONSIBILITIES ADEQUATELY IN THIS BEHALF AND TOWARDS THIS PURPOSE, THE B OOK
RUNNING LEAD MANAGERS HAVE FURNISHED TO SEBI, A DUE DILIGENCE CERTIFICATE DATED
SEPTEMBER 30, 2021 IN THE FORMAT PRESCRIBED UNDER SCHEDULE V (FORM A) OF THE SEBI ICDR
REGULATIONS.
THE FILING OF THIS DRAFT RED HERRING PROSPECTUS DOES NOT, HOWEVER, ABSOLVE THE
COMPANY FROM ANY LIABILITIES UNDER THE COMPANIES ACT, OR FROM THE REQUIREMENT OF
OBTAINING SUCH STATUTORY OR OTHER CLEARANCES AS MAY BE REQUIRED FOR THE PURPOSE OF
THE OFFER. SEBI FURTHER RESERVES THE RIGHT TO TAKE UP AT ANY POINT OF TIME, WITH THE
BOOK RUNNING LEAD MANAGERS, ANY IRREGULARITIES OR LAPSES IN THIS DRAFT RED HERRING
PROSPECTUS.

315
All legal requirements pertaining to the Offer will be complied with at the time of filing of the Red Herring Prospectus with the
Registrar of Companies in terms of Section 32 of the Companies Act and at the time of filing of the Prospectus with the Registrar
of Companies in terms of Sections 26, 32, 33(1) and 33(2) of the Companies Act.
Disclaimer from our Company, our Directors, the Selling Shareholders and Book Running Lead Managers
Our Company, our Directors, the Selling Shareholders and the Book Running Lead Managers accept no responsibility for
statements made otherwise than in this Draft Red Herring Prospectus or in the advertisements or any other material issued by
or at our instance and anyone placing reliance on any other source of information, including our Company’s website
https://www.wellnessforever.com, or the respective websites of any affiliate of our Company would be doing so at his or her
own risk. The Selling Shareholders, its respective directors, affiliates, associates and officers accept or undertake no
responsibility for any statements other than those specifically undertaken or confirmed by the Selling Shareholders in relation
to itself and the Offered Shares.
The Book Running Lead Managers accept no responsibility, save to the limited extent as provided in the Offer Agreement, and
as will be provided for in the Underwriting Agreement to be entered into among the Underwriters, the Selling Shareholders and
our Company.
All information shall be made available by our Company, the Selling Shareholders (to the extent of itself and the Offered
Shares) and the Book Running Lead Managers to the Bidders and the public at large and no selective or additional information
would be made available for a section of the investors in any manner whatsoever, including at road show presentations, in
research or sales reports, at the Bidding Centres or elsewhere.
None among our Company, the Selling Shareholders or any member of the Syndicate shall be liable for any failure in (i)
uploading the Bids due to faults in any software/ hardware system or otherwise; or (ii) the blocking of Bid Amount in the ASBA
Account on receipt of instructions from the Sponsor Bank on account of any errors, omissions or non -compliance by various
parties involved in, or any other fault, ma lfunctioning or breakdown in, or otherwise, in the UPI Mechanism.
Bidders will be required to confirm and will be deemed to have represented to our Company, the Selling Shareholders, the
Underwriters and their respective directors, officers, agents, affiliates, and representatives that they are eligible under all
applicable laws, rules, regulations, guidelines and approvals to acquire the Equity Shares and will not issue, sell, pledge, or
transfer the Equity Shares to any person who is not eligible under any applicable laws, rules, regulations, guidelines and
approvals to acquire the Equity Shares. Our Company, the Selling Shareholders, the Underwriters and their respective directors,
officers, agents, affiliates, and representatives accept no responsibility or liability for advising any investor on whether such
investor is eligible to acquire the Equity Shares.
The Book Running Lead Managers and their respective associates and affiliates in their capacity as principals or agents may
engage in transactions with, and perform services for, our Company, its Subsidiaries, the Selling Shareholders, their respective
affiliates or associates or third parties in the ordinary course of business and have engaged, or may in the future engage, in
commercial banking and investment banking transactions with our Company, its Subsidiaries, the Selling Shareholders their
respective affiliates or associates or third parties, for which they have received, and may in the future receive, compensation.
Disclaimer in respect of Jurisdiction
The Offer is being made in India to persons resident in India (who are competent to contract under the Indian Contract Act,
1872, including Indian nationals resident in India, HUFs, companies, other corporate bodies and societies registered under th e
applicable laws in India and authorised to invest in shares, domestic Mutual Funds, Indian financial institutions, commercial
banks, regional rural banks, co-operative banks (subject to RBI permission), or trusts under applicable trust law and who are
authorised under their constitution to hold and invest in equity shares, state industrial development corporations, insurance
companies registered with IRDAI, provident funds (subject to applicable law) and pension funds, National Investment Fund,
insurance funds set up and managed by army, navy or air force of Union of India, insurance funds set up and managed by the
Department of Posts, GoI, systemically important NBFCs registered with the RBI) and permitted Non -Residents including FPIs
and Eligible NRIs and AIFs that they are eligible under all applicable laws and regulations to purchase the Equity Shares. This
Draft Red Herring Prospectus does not constitute an offer to sell or an invitation to subscribe to Equity Shares offered here by,
in any jurisdiction to any person to whom it is unlawful to make an offer or invitation in such jurisdiction. Any person into
whose possession this Draft Red Herring Prospectus comes is required to inform him or herself about, and to observe, any such
restrictions. Any dispute arising out of the Offer will be subject to the jurisdiction of appropriate court(s) in Mumbai only. This
Draft Red Herring Prospectus does not constitute an invitation to subscribe to or purchase the Equity Shares in the Offer in any
jurisdiction, including India. Invitations to subscribe to or purchase the Equity Shares in the Offer will be made only pursuant
to the Red Herring Prospectus if the recipient is in India or the preliminary offering memorandum for the Offer, which comprises
the Red Herring Prospectus and the preliminary international wrap for the Offer, if the recipient is outside India.
No person outside India is eligible to Bid for Equity Shares in the Offer unless that person has received the preliminary
offering memorandum for the Offer, which contains the selling restrictions for the Offer outside India.
Eligibility and Transfer Restrictions

316
The Equity Shares have not been and will not be registered under the U.S. Securities Act of 1933, as amended (the U.S.
Securities Act”), or with any state securities regulatory authority of any state or other jurisdiction in the United States
(as defined in Regulation S under the U.S. Securities Act (“Regulation S”) except pursuant to an exemption from, or in
a transaction not subject to, the registration requirements of the U.S. Securities Act, the applicable securities laws of all
states and other jurisdictions of the United States. Accordingly, the Equity Shares are only being offered and sold (i)
within the United States only to persons reasonably believed to be “qualified institutional buyers” (as defined in Rule
144A under the U.S. Securities Act and referred to in this Draft Red Herring Prospectus as “U.S. QIBs”) in transactions
exempt from the registration requirements of the U.S. Securities Act, and (ii) outside the United States in “offshore
transactions” in reliance on Regulation S under the U.S. Securities Act and the applicable laws of the jurisdictions where
those offers and sales occur. For the avoidance of doubt, the term U.S. QIBs does not refer to a category of institutional
investor defined under applicable Indian regulations and referred to in this Draft Red Herring Prospectus as “QIBs”.
The Equity Shares have not been and will not be registered, listed or otherwise qualified in any other jurisdiction outside
India and may not be offered or sold, and Bids may not be made by persons in any such jurisdiction, except in compliance
with the applicable laws of such jurisdiction.
Until the expiry of 40 days after the commencement of this Offer, an offer or sale of Equity Shares within the United States by
a dealer (whether or not it is participating in this Offer) may violate the registration requirements of the U.S. Securities Act if
such an offer for sale is made otherwise than in compliance with Section 4(a)(2) or Rule 144A or another available exemption
from registration under the U.S. Securities Act.]
Equity Shares Offered and Sold within the United States
Each purchaser that is acquiring the Equity Shares offered pursuant to this Offer within the United States, by its acceptance of
this Draft Red Herring Prospectus and of the Equity Shares, will be deemed to have acknowledged, represented to and agreed
with our Company, the Selling Shareholders and the Book Running Lead Managers that it has received a copy of this Draft Red
Herring Prospectus and such other information as it deems necessary to make an informed investment decision and that:
1. the purchaser is authorized to consummate the purchase of the Equity Shares offered pursuant to this Offer in compliance
with all applicable laws and regulations;
2. the Equity Shares have not been and will not be registered under the U.S. Securities Act or with any securities regula tory
authority of any state of the United States and accordingly may not be offered or sold within the United States except
pursuant to an exemption from, or in a transaction not subject to, the registration requirements of the U.S. Securities Act;
3. the purchaser (i) is a U.S. QIB, (ii) is aware that the sale to it is being made in a transaction exempt from or not subject to
the registration requirements of the U.S. Securities Act, and (iii) is acquiring such Equity Shares for its own account or fo r
the account of a U.S. QIB with respect to which it exercises sole investment discretion;
4. the purchaser is not an affiliate of our Company or a person acting on behalf of an affiliate of our Company;
5. if, in the future, the purchaser decides to offer, resell, pledge or otherwise transfer such Equity Shares, or any economic
interest therein, such Equity Shares or any economic interest therein may be offered, sold, pledged or otherwise transferred
only (A) (i) to a person whom the beneficial owner and/or any person act ing on its behalf reasonably believes is a U.S.
QIB in a transaction meeting the requirements of Rule 144A or another exemption from the registration requirements of
the U.S. Securities Act or (ii) in an offshore transaction complying with Rule 903 or Rule 904 of Regulation S under the
U.S. Securities Act and (B) in accordance with all applicable laws, including the securities laws of the states of the United
States. The purchaser understands that the transfer restrictions will remain in effect until our Co mpany determines, in its
sole discretion, to remove them;
6. the Equity Shares are “restricted securities” within the meaning of Rule 144(a)(3) under the U.S. Securities Act and no
representation is made as to the availability of the exemption provided by Rule 144 for resales of any such Equity Shares;
7. the purchaser will not deposit or cause to be deposited such Equity Shares into any depositary receipt facility established
or maintained by a depositary bank other than a Rule 144A restricted depositary receipt facility, so long as such Equity
Shares are “restricted securities” within the meaning of Rule 144(a)(3) under the U.S. Securities Act;
8. the purchaser agrees that neither the purchaser, nor any of its affiliates, nor any person acting on behalf of the purc haser or
any of its affiliates, will make any “directed selling efforts” as defined in Regulation S under the U.S. Securities Act in t he
United States with respect to the Equity Shares;
9. the purchaser understands that such Equity Shares (to the extent they are in certificated form), unless our Company
determines otherwise in accordance with applicable law, will bear a legend substantially to the following effect:
317
THE EQUITY SHARES REPRESENTED HEREBY HAVE NOT BEEN AND WILL NOT BE REGISTERED UNDER
THE U.S. SECURITIES ACT OF 1933, AS AMENDED (THE “U.S. SECURITIES ACT”) OR WITH ANY
SECURITIES REGULATORY AUTHORITY OF ANY STATE OR OTHER JURISDICTION OF THE UNITED
STATES AND MAY NOT BE OFFERED, SOLD, PLEDGED OR OTHERWISE TRANSFERRED EXCEPT (1) TO A
PERSON WHOM THE SELLER OR ANY PERSON ACTING ON ITS BEHALF REASONABLY BELIEVES IS A
QUALIFIED INSTITUTIONAL BUYER WITHIN THE MEANING OF RULE 144A UNDER THE U.S. SECURITIES
ACT IN A TRANSACTION MEETING THE REQUIREMENTS OF RULE 144A OR ANOTHER AVAILABLE
EXEMPTION FROM THE REGISTRATION REQUIREMENTS OF THE U.S. SECURITIES ACT, OR (2) IN AN
OFFSHORE TRANSACTION COMPLYING WITH RULE 903 OR RULE 904 OF REGULATION S UNDER THE
U.S. SECURITIES ACT, IN EACH CASE IN ACCORDANCE WITH ANY APPLICABLE SECURITIES LAWS OF
ANY STATE OF THE UNITED STATES.
10. Our Company will not recognize any offer, sale, pledge or other transfer of such Equity Shares made other than in
compliance with the above-stated restrictions; and
11. the purchaser acknowledges that our Company, the Book Running Lead Managers, their respective affiliates and others
will rely upon the truth and accuracy of the foregoing acknowledgements, representations and agreements and agrees that,
if any of such acknowledgements, representations and agreements deemed to have been made by virtue o f its purchase of
such Equity Shares are no longer accurate, it will promptly notify our Company, and if it is acquiring any of such Equity
Shares as a fiduciary or agent for one or more accounts, it represents that it has sole investment discretion with respect to
each such account and that it has full power to make the foregoing acknowledgements, representations and agreements on
behalf of such account.
All Other Equity Shares Offered and Sold in this Offer
Each purchaser that is acquiring the Equity Shares offered pursuant to this Offer outside the United States, by its acceptance of
this Draft Red Herring Prospectus and of the Equity Shares offered pursuant to this Offer, will be deemed to have acknowledged,
represented to and agreed with our Company and the Book Running Lead Managers that it has received a copy of this Draft
Red Herring Prospectus and such other information as it deems necessary to make an informed investment decision and that:
1. the purchaser is authorized to consummate the purchase of the Equity Shares offered pursuant to this Offer in compliance
with all applicable laws and regulations;
2. the purchaser acknowledges that the Equity Shares offered pursuant to this Offer have not been and will not be registered
under the U.S. Securities Act or with any securities regulatory authority of any state of the United States and accordingly
may not be offered or sold within the United States except pursuant to an exemption from, or in a transaction not subject
to, the registration requirements of the U.S. Securities Act;
3. the purchaser is purchasing the Equity Shares offered pursuant to this Offer in an offshore transaction meeting the
requirements of Rule 903 of Regulation S under the U.S. Securities Act;
4. the purchaser and the person, if any, for whose account or benefit the purchaser is acquiring the Equity Shares offered
pursuant to this Offer, was located outside the United States at the time (i) the offer for such Equity Shares was made to
it and (ii) when the buy order for such Equity Shares was originated and continues to be located outside the United States
and has not purchased such Equity Shares for the account or benefit of any person in the United States or entered into any
arrangement for the transfer of such Equity Shares or any economic interest therein to any person in the United States;
5. the purchaser is not an affiliate of our Company or a person acting on behalf of an affiliate;
6. if, in the future, the purchaser decides to offer, resell, pledge or otherwise transfer such Equity Shares, or any economic
interest therein, such Equity Shares or any economic interest therein may be offered, sold, pledged or otherwise transferred
only (A) (i) to a person whom the beneficial owner and/or any person acting on its behalf reasonably believes is a U.S.
QIB in a transaction meeting the requirements of Rule 144A or another available exemption from the registration
requirements of the U.S. Securities Act or (ii) in an offshore transaction complying with Rule 903 or Rule 904 of
Regulation S under the U.S. Securities Act and (B) in accordance with all applicable laws, including the securities laws
of the States of the United States. The purchaser understands that the transfer restrictions will remain in effect until our
Company determines, in its sole discretion, to remove them;
7. the purchaser agrees that neither the purchaser, nor any of its affiliates, nor any person acting on behalf of the purchaser
or any of its affiliates, will make any “directed selling efforts” as defined in Regulation S under the U.S. Securities Act in
the United States with respect to the Equity Shares;
8. the purchaser understands that such Equity Shares (to the extent they are in certificated form), unless our Company
determine otherwise in accordance with applicable law, will bear a legend substantially to the following effect:

318
THE EQUITY SHARES REPRESENTED HEREBY HAVE NOT BEEN AND WILL NOT BE REGISTERED UNDER
THE U.S. SECURITIES ACT OF 1933, AS AMENDED (THE “U.S. SECURITIES ACT”) OR WITH ANY
SECURITIES REGULATORY AUTHORITY OF ANY STATE OR OTHER JURISDICTION OF THE UNITED
STATES AND MAY NOT BE OFFERED, SOLD, PLEDGED OR OTHERWISE TRANSFERRED EXCEPT (1) TO A
PERSON WHOM THE SELLER OR ANY PERSON ACTING ON ITS BEHALF REASONABLY BELIEVES IS A
QUALIFIED INSTITUTIONAL BUYER WITHIN THE MEANING OF RULE 144A UNDER THE U.S. SECURITIES
ACT IN A TRANSACTION MEETING THE REQUIREMENTS OF RULE 144A OR ANOTHER AVAILABLE
EXEMPTION FROM THE REGISTRATION REQUIREMENTS OF THE U.S. SECURITIES ACT, OR (2) IN AN
OFFSHORE TRANSACTION COMPLYING WITH RULE 903 OR RULE 904 OF REGULATION S UNDER THE
U.S. SECURITIES ACT, IN EACH CASE IN ACCORDANCE WITH ANY APPLICABLE SECURITIES LAWS OF
ANY STATE OF THE UNITED STATES.
9. our Company will not recognize any offer, sale, pledge or other transfer of such Equity Shares m ade other than in
compliance with the above-stated restrictions; and
10. the purchaser acknowledges that our Company, the Book Running Lead Managers, their respective affiliates and others
will rely upon the truth and accuracy of the foregoing acknowledgements, representations and agreements and agrees that,
if any of such acknowledgements, representations and agreements deemed to have been made by virtue of its purchase of
such Equity Shares are no longer accurate, it will promptly notify our Company, and if it is acquiring any of such Equity
Shares as a fiduciary or agent for one or more accounts, it represents that it has sole investment discretion with respect to
each such account and that it has full power to make the foregoing acknowledgements, representa tions and agreements on
behalf of such account.
Bidders are advised to ensure that any Bid from them does not exceed the investment limits or the maximum number of Equity
Shares that can be held by them under applicable law.
Further, each Bidder where required must agree in the Allotment Advice that such Bidder will not sell or transfer any Equity
Shares or any economic interest therein, including any off -shore derivative instruments, such as participatory notes, issued
against the Equity Shares or any similar security, other than pursuant to an exemption from, or in a transaction not subject to,
the registration requirements of the U.S. Securities Act.
European Economic Area
In relation to each Member State of the EEA (each a “Member State”), an offer to the public of any Equity Shares may not be
made in that Member State, except if the Equity Shares are offered to the public in that Member State at any time under the
following exemptions under the Prospectus Regulation (EU) 2017/1129 (and any amendment t hereto) (the “Prospectus
Regulation”):
• to any legal entity which is a qualified investor as defined in the Prospectus Regulation;
• to fewer than 150 natural or legal persons (other than qualified investors as defined in the Prospectus Regulation) subject
to obtaining the prior consent of the Book Running Lead Managers for any such offer; or
• in any other circumstances falling within Article 1(4) of the Prospectus Regulation,
provided that no such offer of Equity Shares shall result in a requirement for the publication by our Company or any of the
Book Running Lead Managers of a prospectus pursuant to Article 3 of the Prospectus Regulation and each person who initially
acquires Equity Shares or to whom any offer is made will be deemed to have represented that they are a “qualified investor” as
defined in the Prospectus Regulation. For the purposes of this section, the expression an “offer of Equity Shares to the public”
in relation to any Equity Shares in any Member State means a communication to persons in any form and by any means
presenting sufficient information on the terms of the offer and the Equity Shares to be offered so as to enable an investor t o
decide to purchase or subscribe for the Equity Shares.
In the case of any Equity Shares being offered to a financial intermediary, as that term is used in Article 5 of the Prospectus
Regulation, such financial intermediary will also be deemed to have represented, acknowledged and agreed that the Offer Shares
subscribed for or acquired by it in the Issue have not been subscribed for or acquired on a non-discretionary basis on behalf of,
nor have they been subscribed for or acquired with a view to their offer or resale to persons in circumstances which may give
rise to an offer of any Equity Shares to the public other than their offer or resale in a Member State to qualified investors (as so
defined) or in circumstances in which the prior consent of the Book Running Lead Managers has been obtained to each such
proposed offer or resale. Our Company, its directors, the Book Running Lead Managers and their affiliates, and others will rely
upon the truth and accuracy of the foregoing representation, acknowledgement and agreement. Notwithstanding the above, a
person who is not a qualified investor and who has notified the Book Running Lead Managers of such fact in writing may, with
the consent of the Book Running Lead Managers, be permitted to subscribe for or purchase Equity Shares in the Issue.

319
The Company, the Book Running Lead Managers and their affiliates, and others will rely upon the truth and accuracy of the
foregoing representation, acknowledgement and agreement.
Any offer, sale, pledge, resale or other transfer, or attempted offer, sale, pledge, resale or other transfer, of the Equity Shares
made other than in compliance with the above-stated restrictions shall not be recognized by the Company.]
United Kingdom
No Equity Shares have been offered or will be offered pursuant to the Offer to the public in the United Kingdom prior to the
publication of a prospectus in relation to the Shares which has been approved by the Financial Conduct Authority, except that
the Equity Shares may be offered to the public in the United Kingdom at any time:
• to any legal entity which is a qualified investor as defined under Article 2 of the UK Prospectus Regulation;
• to fewer than 150 natural or legal persons (other than qualified investors as defined under Article 2 of the UK Prospectus
Regulation), subject to obtaining the prior consent of the Book Running Lead Managers for any such offer; or
• in any other circumstances falling within Section 86 of the FSMA.
provided that no such offer of the Shares shall require the Company or any Manager to publish a prospectus pursuant to Sectio n
85 of the FSMA or supplement a prospectus pursuant to Article 23 of the UK Prospectus Regulation.
For the purposes of this provision, the expression an “offer to the public” in relation to the Equity Shares in the United Kingdom
means the communication in any form and by any means of sufficient information on the terms of the offer and any Equity
Shares to be offered so as to enable an investor to decide to purchase or subscribe for any Equity Shares and the expression
“UK Prospectus Regulation” means Regulation (EU) 2017 /1129 as it forms part of retained law by virtue of the European
Union (Withdrawal) Act 2018.
Disclaimer Clause of BSE
As required, a copy of this Draft Red Herring Prospectus has been submitted to BSE. The disclaimer clause as intimated by
BSE to our Company, post scrutiny of this Draft Red Herring Prospectus, shall be included in the Red Herring Prospectus and
the Prospectus prior to the RoC filing.
Disclaimer Clause of NSE
As required, a copy of this Draft Red Herring Prospectus has been submitted to NSE. The disclaimer clause as intimated by
NSE to our Company, post scrutiny of this Draft Red Herring Prospectus, shall be included in the Red Herring Prospectus and
the Prospectus prior to the RoC filing.
Listing
The Equity Shares offered through the Red Herring Prospectus and the Prospectus are proposed to be listed on BSE and NSE.
Applications will be made to the Stock Exchanges for obtaining permission for listing and trading of the Equity Shares. [●] w ill
be the Designated Stock Exchange with which the Basis of Allotment will be finalised.
Consents
Consents in writing of each of the Selling Shareholders, our Directors, our Company Secretary and Compliance Officer, Legal
Counsel to the Company as to Indian Law, Legal Counsel to the Book Running Lead Managers as to Indian Law, International
Legal Counsel to the Book Running Lead Managers, Legal Counsel to the Selling Shareholders, Bankers to our Company, the
Book Running Lead Managers, Registrar to the Offer, Statutory Auditors, Independent Chartered Accountant and Technopak,
in their respective capacities, have been obtained, and such consents have not been withdrawn up to the time of delivery of t his
Draft Red Herring Prospectus. Further, consents in writing of the Syndicate Members, Escrow Collection Bank(s)/Refund
Bank(s)/ Public Offer Account/ Sponsor Bank, to act in their respective capacities, will be obtained and filed along with a copy
of the Red Herring Prospectus with the RoC as required under the Companies Act and such consents shall not be withdrawn up
to the time of delivery of the Red Herring Prospectus for filing with the RoC.
Experts to the Offer
Except as stated below, our Company has not obtained any expert opinions:
Our Company has received written consent dated September 30, 2021 from Deloitte Haskins & Sells LLP, Chartered
Accountants to include their name as required under Section 26 (1) of the Companies Act, 2013 read with SEBI ICDR
Regulations, in this Draft Red Herring Prospectus and as an “expert” as defined under Section 2(38) of the Companies Act,
2013 to the extent and in their capacity as our Statutory Auditors, and in respect of their examination report, dated September

320
27, 2021 on our Restated Consolidated Financial Information; and such consent has not been withdrawn as on the date of this
Draft Red Herring Prospectus. However, the term “expert” and the consent thereof shall not be construed to mean an “expert”
or consent within the meaning as defined under the U.S. Securities Act.
Our Company has received written consent dated September 29, 2021, from the independent chartered accountant, namely
Ramesh M Sheth & Associates, to include their name in this Draft Red Herring Prospectus and as an “expert” as defined under
Section 2(38) of the Companies Act, 2013 in respect of their statement of specia l tax benefits available to the Company and its
shareholders dated September 29, 2021, included in this Draft Red Herring Prospectus, and such consent has not been
withdrawn as on the date of this Draft Red Herring Prospectus. However, the term “expert” and the consent thereof shall not be
construed to mean an “expert” or consent within the meaning as defined under the U.S. Securities Act.
Particulars regarding capital issues by our Company, Subsidiaries or associate entities during the last three years
Other than as disclosed in “Capital Structure” on page 69, our Company has not made any capital issues during the three years
preceding the date of this Draft Red Herring Prospectus.
None of our Subsidiaries has undertaken a capital issue in the last three years preceding the date of this Draft Red Herring
Prospectus.
Commission and Brokerage paid on previous issues of the Equity Shares in the last five years
No sum has been paid or has been payable as commission or brokerage for subscribing to or pro curing or agreeing to procure
subscription for any of the Equity Shares in the last five years.
Performance vis-à-vis objects – Public/ rights issue of our Company
Our Company has not undertaken any public issue or rights issue in the five years preceding the date of this Draft Red Herring
Prospectus.
Performance vis-à-vis objects – Public/ rights issue of the listed Subsidiaries/promoters of our Company
As on date of this Draft Red Herring Prospectus, our Company does not have any listed Subsidiaries or Promoters.

321
Price information of past issues handled by the Book Running Lead Managers
a) IIFL Securities Limited
Price information of past issues (during current financial year and two financial years preceding the current financial year) handled by IIFL Securities Limited:
S. No. Issue name Issue Size
(₹ million)
Issue price
(₹)
Listing Date Opening
Price on
listing date
(in ₹)
+/- % change in closing
price, [+/- % change in
closing benchmark]- 30th
calendar days from listing
+/- % change in closing
price, [+/- % change in
closing benchmark]- 90th
calendar days from listing
+/- % change in closing
price, [+/- % change in
closing benchmark]-
180th calendar days from listing
1. Suryoday Small Finance Bank Ltd 5,808.39 305.00(1) March 26, 2021 292.00 -18.38%,[-1.14%] -26.87%, [-98.46%] -40.20%,[+21.06%]
2. Nazara Technologies Ltd 5,826.91 1,101.00(2) March 30, 2021 1,990.00 +62.57%,[0.13%] +38.22%, [6.84%] +94.60%,[+20.26%]
3. Barbeque-Nation Hospitality Limited 4,528.74 500.00 April 7, 2021 489.85 +18.77%,[-0.64%] +76.97%, [+6.85%] N.A.
4. Macrotech Developers Ltd 25,000.00 486.00 April 19, 2021 436.00 +30.22%,[+5.21%] +75.43%,[+10.89%] N.A.
5. Shyam Metalics and Energy Ltd 9,085.50 306.00(3) June 24, 2021 380.00 +40.95%,[+0.42%] +22.65%,[+11.22%] N.A.
6. Krishna Institute of Medical Sciences
Limited
21,437.44 825.00(4) June 28, 2021 1,009.00 +48.10%;[-0.43%] +48.35%,[+12.89%] N.A.
7. Windlas Biotech Limited 4,015.35 460.00 August 16, 2021 437.00 -18.04%,[+4.93%] N.A. N.A.
8. Krsnaa Diagnostics Limited 12,133.35 954.00(5) August 16, 2021 1,005.55 -9.42%,[+4.93%] N.A. N.A.
9. Chemplast Sanmar Limited 38,500.00 541.00 August 24, 2021 550.00 +2.06%,[+5.55%] N.A. N.A.
10. Sansera Engineering Limited 12825.20 744.00(6) September 24,
2021
811.50 N.A. N.A. N.A.
Source: www.nseindia.com
(1) A discount of INR 30 per equity share on the issue price to eligible employees bidding in the employee reservation portion.
(2) A discount of INR 110 per equity was offered to eligible employees bidding in the employee reservation portion.
(3) A discount of INR 15 per Equity Share was offered to the Eligible Employees Bidding in the Employee Reservation Portion.
(4) A discount of INR 40 per Equity Share was offered to Eligible Employees Bidding in the Employee Reservation Portion.
(5) A discount of INR 93per equity share to eligible employees bidding in the employee reservation portion.
(6) A discount of INR 36 per equity share was offered to eligible employees bidding in the employee reservation portion.
Note:
a) Benchmark Index taken as CNX NIFTY. Price on NSE is considered for all of the above calculations. b) The 30
th, 90
th and 180
th calendar day from listed day have been taken as listing day plus 29, 89 and 179 calendar days, except wherever 30
th /90
th / 180
th calendar day from listing day is a holiday, the closing data of the
previous trading day has been considered. % change taken against the Issue Price in case of the Issuer.
c) The Nifty 50 index is considered as the benchmark index. d) NA means Not Applicable.
e) The above past price information is only restricted to past 10 initial public offers.

322
Summary statement of price information of past issues (during current financial year and two financial years preceding the current financial year) handled by IIFL Securities Limited:
Fiscal Total no.
of IPOs
Total amount of
funds raised
(₹ Mn.)
No. of IPOs trading at discount -
30th calendar days from listing
No. of IPOs trading at premium -
30th calendar days from listing
No. of IPOs trading at discount -
180th calendar days from listing
No. of IPOs trading at premium -
180th calendar days from listing
Over
50%
Between 25-
50%
Less than
25%
Over
50%
Between 25-
50%
Less than
25%
Over
50%
Between 25-
50%
Less than
25%
Over
50%
Between 25-
50%
Less than
25%
2021-
22
8 1,27,525.58 - - 2 - 3 2 - - - - - -
2020-
21
8 47,017.65 - - 4 2 1 1 - 1 - 3 3 1
2019-
20
5 65,827.61 - - 2 - 1 2 1 1 1 - - 2
Source: www.nseindia.com
Note:
a. Data for number of IPOs trading at premium/discount taken at closing price on NSE on the respective date. In case any of the days falls on a non-trading day, the closing price on the previous trading day has been considered.
b. NA means not applicable.

323
b) Ambit Private Limited
Price information of past issues (during current financial year and two financial years preceding the current financial year) handled by Ambit Private Limited:
S. No. Issue name Issue Size (₹ million)
Issue price (₹) Listing Date Opening Price on listing date
(in ₹)
+/- % change in closing price, [+/-
% change in closing
benchmark]- 30th
calendar days from
listing
+/- % change in closing price, [+/- % change in
closing benchmark]- 90th
calendar days from
listing
+/- % change in closing price, [+/- %
change in closing
benchmark]- 180th
calendar days from
listing
1. Ami Organics Limited 5,696.36 610.00 14-Sep-21 910.00 NA NA NA
2. Chemplast Sanmar Limited 38,500.00 541.00 24-Aug-21 550.00 2.06%, [+5.55%] NA NA
3. Anupam Rasayan India Limited 7,600.00 555.00 24-Mar-21 520.00 -0.11%, [-0.98%] 30.49%, [+8.23%] 37.12%, [+20.87%]
Source: www.nseindia.com .
Notes:
a. Issue Size derived from Prospectus/final post issue reports, as available. b. The CNX NIFTY is considered as the Benchmark Index. c. Price on NSE is considered for all of the above calculations. d. In case 30th/90th/180th day is not a trading day, closing price on NSE of the previous trading day has been considered.
e. Since 30, 90, 180 calendar days, as applicable, from listing date has not elapsed for few of the above issues, data for same is not available.

324
Summary statement of price information of past issues (during current financial year and two financial years preceding the current financial year) handled by Ambit Private Limited:
Fiscal Total no.
of IPOs
Total amount of
funds raised
(₹ Mn.)
No. of IPOs trading at discount -
30th calendar days from listing
No. of IPOs trading at premium -
30th calendar days from listing
No. of IPOs trading at discount -
180th calendar days from listing
No. of IPOs trading at premium -
180th calendar days from listing
Over
50%
Between 25-
50%
Less than
25%
Over
50%
Between 25-
50%
Less than
25%
Over
50%
Between 25-
50%
Less than
25%
Over
50%
Between 25-
50%
Less than
25%
2021-
2022*
2 44,196.36 - - - - - 1 NA NA NA NA NA NA
2020-
2021
1 7,600.00 - - 1 - - - - - - - 1 -
2019-
2020
- - - - - - - - - - - - - -
*This information is as on date of this Draft Red Herring Prospectus
Note: Since 180 calendar days, as applicable, from listing date has not elapsed for few of the above issues, data for same is not available.

325
c) DAM Capital
Price information of past issues (during current financial year and two financial years preceding the current financial year) handled by DAM Capital:
S. No.
Issue name Issue Size (₹ million)
Issue price (₹)
Listing Date Opening Price on
listing date
(in ₹)
+/- % change in closing price, [+/-
% change in closing
benchmark]- 30th
calendar days from
listing
+/- % change in closing price, [+/- % change in
closing benchmark]- 90th
calendar days from
listing
+/- % change in closing price, [+/- %
change in closing
benchmark]- 180th
calendar days from
listing
1. Mazagon Dock Shipbuilders Limited 4,436.86 145.00 October 12, 2020 214.90 +18.90%, [+5.87%] +52.90%, [+20.25%] +45.79%, [+24.34%]
2. Indian Railway Finance Corporation Limited 46,333.79 26.00 January 29, 2021 24.90 -5.19%, [+6.56%] -18.65%, [+9.02%] -11.15%, [+15.49%]
3. Laxmi Organic Industries Limited 6,000.00 130.00 March 25, 2021 155.50 +37.85%, [+0.11%] +71.96%, [+10.11%] +294.50%, [+21.45%]
4. Glenmark Life Sciences Limited 15,136.00 720.00 August 6, 2021 750.00 -6.40%, [+6.68%] Not applicable Not applicable
5. Windlas Biotech Limited 4,015.35 460.00 August 16, 2021 437.00 -18.04%, [+4.93%] Not applicable Not applicable
6. Krsnaa Diagnostics Limited 12,133.35 954.00* August 16, 2021 1,005.55 -9.42%, [+4.93%] Not applicable Not applicable
Source: www.nseindia.com. * A discount of INR 93 per equity share to eligible employees bidding in the employee reservation portion.
Notes:
a. Issue size derived from prospectus b. Price on NSE is considered for all of the above calculations c. % of change in closing price on 30th / 90th / 180th calendar day from listing day is calculated vs issue price. % change in closing benchmark index is calculated based on closing index on listing day vs closing index on
30th/ 90th / 180th calendar day from listing day.
d. Wherever 30th/ 90th / 180th calendar day from listing day is a holiday, the closing data of the previous trading day has been considered. e. The Nifty 50 index is considered as the benchmark index f. Not applicable – Period not completed

326
Summary statement of price information of past issues (during current financial year and two financial years preceding the current financial year) handled by DAM Capital:
Fiscal Total no.
of IPOs
Total amount of
funds raised
(₹ Mn.)
No. of IPOs trading at discount -
30th calendar days from listing
No. of IPOs trading at premium -
30th calendar days from listing
No. of IPOs trading at discount -
180th calendar days from listing
No. of IPOs trading at premium -
180th calendar days from listing
Over
50%
Between 25-
50%
Less than
25%
Over
50%
Between 25-
50%
Less than
25%
Over
50%
Between 25-
50%
Less than
25%
Over
50%
Between 25-
50%
Less than
25%
2021-
2022
3 31,284.70 - - 3 - - - - - - - - -
2020-
2021
3 56,770.65 - - 1 - 1 1 - - 1 1 1 -
2019-
2020
- - - - - - - - - - - - - -
Source: www.nseindia.com
Notes: a. The information is as on the date of this offer document
b. The information for each of the financial years is based on issues listed during such financial year.
c. Since 180 calendar days from listing date has not elapsed for few issues, hence data for same is not available.

327
d) HDFC Bank Limited
Price information of past issues (during current financial year and two financial years preceding the current financial year) handled by HDFC Bank Limited:
S. No. Issue name Issue Size (₹ million)
Issue price (₹) Listing Date Opening Price on listing date
(in ₹)
+/- % change in closing price, [+/-
% change in closing
benchmark]- 30th
calendar days from
listing
+/- % change in closing price, [+/- % change in
closing benchmark]- 90th
calendar days from
listing
+/- % change in closing price, [+/- %
change in closing
benchmark]- 180th
calendar days from
listing
1. Chemplast Sanmar Limited 38,500.00 541 August 24, 2021 550.00 +2.06% [+5.55% ] - -
2. G R Infraprojects Limited 9,623.34 837 July 19, 2021 1,715.85 +90.82% [+5.47% ] - -
3. Computer Age Management
Services Ltd 22,421.05 1,230 October 01, 2020 1,518.00 +5.52% [+2.37% ] +49.52% [+23.04%] +43.67% [+26.65%]
4. Metropolis Healthcare Limited 12,042.88 880 April 15, 2019 958.00 +3.75% [-4.01% ] +21.39% [-1 .18% ] +45.93% [-3.30% ]
Source: www.nseindia.com and www.bseindia.com for price information and prospectus for offer details Notes: 1. Nifty is considered as the benchmark index except for Computer Age Management Services Limited where SENSEX is considered as benchmark index
2. 30th calendar day has been taken as listing date plus 29 calendar days; 90th calendar day has been taken as listing date plus 89 calendar days; 180th calendar day has been taken as listing date plus 179 calendar days 3. In case of reporting dates falling on a trading holiday, values for immediately previous trading day have been considered 4. In G R Infraprojects Limited, the offer price to eligible employees was ₹795 after a discount of ₹42 per equity share.
5. In Computer Age Management Services Limited, the offer price to eligible employees was ₹1,108 after a discount of ₹122 per equity share.

328
Summary statement of price information of past issues (during current financial year and two financial years preceding the current financial year) handled by HDFC Bank Limited :
Fiscal Total
no. of
IPOs
Total amount
of funds
raised (₹ Mn.)
No. of IPOs trading at discount -
30th calendar days from listing
No. of IPOs trading at premium -
30th calendar days from listing
No. of IPOs trading at discount -
180th calendar days from listing
No. of IPOs trading at premium -
180th calendar days from listing
Over
50%
Between 25-
50%
Less than
25%
Over
50%
Between 25-
50%
Less than
25%
Over
50%
Between 25-
50%
Less than
25%
Over
50%
Between 25-
50%
Less than
25%
2021-2022 2 48,123.66 - - - 1 - 1 - - - - - -
2020-2021 1 22,421.05 - - - - - 1 - - - - 1 -
2019-2020 1 12,042.88 - - - - - 1 - - - - 1 -
Notes:
1. The information is as on the date of this Draft Red Herring Prospectus. 2. The information for each of the financial years is based on offers listed during such financial year.

329
Stock Market Data of Equity Shares
This being an initial public offer of Equity Shares of our Company, the Equity Shares are not listed on any stock exchange and
accordingly, no stock market data is available for the Equity Shares.
Mechanism for Redressal of Investor Grievances
The Registrar Agreement provides for the retention of records with the Registrar to the Offer for a period of at least eight years
from the date of listing and commencement of trading of the Equity Shares on the Stock Exchanges, to enable the investors to
approach the Registrar to the Offer for redressal of their grievances.
All grievances other than of Anchor Investors may be addressed to the Registrar to the Offer with a copy to the relevant
Designated Intermediary to whom the ASBA Form was submitted. The Bidder should give full details such as name of the sole
or first Bidder, ASBA Form number, Bidder DP ID, Client ID, PAN, address of the Bidder, number of the Equity Shares applied
for, ASBA Account number in which the amount equivalent to the Bid Amount was blocked or the UPI ID (for RIB who make
the payment of Bid Amount through the UPI Mechanism), date of ASBA Form and the name and address of the relevant
Designated Intermediary where the Bid was submitted. Further, the Bidder shall enclose the Acknowledgment Slip or the
application number from the Designated Intermediary in addition to the documents or information mentioned hereinabove. All
grievances relating to Bids submitted through Registered Brokers may be addressed to the Stock Exchanges with a copy to the
Registrar to the Offer.
All grievances of the Anchor Investors may be addressed to the Registrar to the Offer, giving full details such as the name of
the sole or First Bidder, Bid cum Application Form number, Bidders’ DP ID, Client ID, PAN, date of the Bid cum Application
Form, address of the Bidder, number of the Equity Shares applied for, Bid Amount paid on submission of the Bid cum
Application Form and the name and address of the Book Running Lead Managers where the Bid cum Application Form was
submitted by the Anchor Investor.
In terms of SEBI circular no. SEBI/HO/CFD/DIL2/CIR/P/2018/22, dated February 15, 2018 , SEBI circular
SEBI/HO/CFD/DIL2/CIR/P/2021/2480/1/M dated March 16, 2021 and SEBI circular SEBI/HO/CFD/DIL2/P/CIR/2021/570
dated June 2, and subject to applicable law, any ASBA Bidder whose Bid has not been considered for Allotment, due to failure
on the part of any SCSB, shall have the option to seek redressal of the same by the concerned SCSB within three months of the
date of listing of the Equity Shares. SCSBs are required to resolve these complaints within 15 days, failing which the concerned
SCSB would have to pay interest at the rate of 15% per annum for any delay beyond this period of 15 days. Further, the investors
shall be compensated by the SCSBs at the rate higher of ₹ 100 or 15% per annum of the application amount in the events of
delayed or withdrawal of applications, blocking of multiple accounts for the same UPI application, blocking of more amount
than the application amount, delayed unblocking of amounts f or the stipulated period. In an event there is a delay in redressal
of the investor grievance, the Book Running Lead Managers shall compensate the investors at a rate higher than ₹ 100 or 15%
per annum of the application amount.
The Registrar to the Offer shall obtain the required information from the SCSBs and Sponsor Bank for addressing any
clarifications or grievances of ASBA Bidders. Our Company, the Selling Shareholders, the Book Running Lead Managers and
the Registrar to the Offer accept no responsibility for errors, omissions, commission or any acts of SCSBs including any defaults
in complying with its obligations under applicable SEBI ICDR Regulations. Investors can contact our Company Secretary and
Compliance Officer, the Book Running Lead Managers or the Registrar to the Offer in case of any pre-Offer or post-Offer
related problems such as non-receipt of letters of Allotment, non-credit of allotted Equity Shares in the respective beneficiary
account, non-receipt of refund intima tions and non-receipt of funds by electronic mode.
Anchor Investors are required to address all grievances in relation to the Offer to the Book Running Lead Managers.
Disposal of Investor Grievances by our Company
Our Company has obtained authentication on the SCORES and will comply with the SEBI circular no. CIR/OIAE/1/2014 dated
December 18, 2014 in relation to redressal of investor grievances through SCORES.
Our Company estimates that the average time required by our Company and/or the Registrar to the Offer for the redressal of
routine investor grievances shall be three Working Days from the date of receipt of the complaint. In case of non -routine
complaints and complaints where external agencies are involved, our Company will seek to redress these complaints as
expeditiously as possible.
Our Company has not received any investor grievances in the last three Financial Years prior to the filing of this Draft Red
Herring Prospectus. As at the date of this Draft Red Herring Prospectus there are no outstanding investor grievances.
Our Company has also appointed Nidhi Vora , Company Secretary of our Company, as the Compliance Officer for the Offer.
For details, see “General Information” beginning on page 61.
Our Company has constituted a Stakeholders’ Relationship Committee comprising of Kewal Handa, Avani Vishal Davda,

330
Ashraf Mohammad Biran and Mohan Ganpat Chavan as members. For details, see “Our Management – Committees of our
Board of Directors - Stakeholders’ Relationship Committee” on page 189.

331
SECTION VII: OFFER INFORMATION
TERMS OF THE OFFER
The Equity Shares being offered and Allotted pursuant to the Offer shall be subject to the provisions of the Companies Act,
SEBI ICDR Regulations, SCRA, SCRR, the MoA, AoA, SEBI Listing Regulations, the terms of the Red Herring Prospectus,
the Prospectus, the abridged prospectus, the Bid cum Application Form, the Revision Form, the CAN/Allotment Advice and
other terms and conditions as may be incorporated in other documents/ certificates that may be executed in respect of the Offer.
The Equity Shares shall also be subject to laws as applicable, guidelines, rules, notifications and regulations relating to t he issue
of capital and listing and trading of securities issued from time to time by SEBI, the Government of India, the Stock Exchanges,
the RBI, RoC and/or other authorities, as in force on the date of the Offer and to the extent applicable or such other conditions
as may be prescribed by the SEBI, the RBI, the Government of India, the Stock Exchanges, the RoC and/or any other authorities
while granting its approval for the Offer, to the extent and for such time as these continue to be applicable.
Ranking of the Equity Shares
The Equity Shares being offered and transferred in the Offer shall be subject to the provisions of the Companies Act, SEBI
ICDR Regulations, SCRA, SCRR, our MoA and AoA, and shall rank pari passu with the existing Equity Shares in all respects
including dividends. The Allottees upon Allotment of Equity Shares under the Offer will be entitled to dividend and other
corporate benefits, if any, declared by our Company after the date of Allotment. For further details, see “Description of Equity
Shares and Terms of Articles of Association” beginning on page 356.
Mode of Payment of Dividend
Our Company shall pay dividends, if declared, to the Shareholders in accordance with the provisions of the Companies Act, the
MoA, AoA and provisions of the SEBI Listing Regulations and any other guidelines or directions which may be issued by the
Government in this regard. Dividends, if any, declared by our Company after the date of Allotmen t (pursuant to the transfer of
Equity Shares from the Offer for Sale), will be payable to the Bidders who have been Allotted Equity Shares in the Offer, for
the entire year, in accordance with applicable laws. For further details, in relation to dividends, see “ Dividend Policy” and
“Description of Equity Shares and Terms of Articles of Association” beginning on pages 200 and 356, respectively.
Face Value, Offer Price and Price Band
The face value of each Equity Share is ₹ 2 and the Offer Price at the lower end of the Price Band is ₹ [●] per Equity Share and
at the higher end of the Price Band is ₹ [●] per Equity Share. The Anchor Investor Offer Price is ₹ [●] per Equity Share.
The Offer Price, Price Band and the minimum Bid Lot size for the Offer will be decided by our Company, in consultation with
the Book Running Lead Managers, and advertised in all editions of [●], an English national daily newspaper, all editions of [●],
a Hindi national daily newspaper and regional edition of [●], a Marathi newspaper, Marathi being the regional language of
Maharashtra , where our Registered Office is located, each with wide circulation, at least two Working Days prior to the
Bid/Offer Opening Date and shall be made available to the Stock Exchanges for the purpose of uploading the same on their
respective websites. The Price Band, along with the relevant financial ratios calculated at the Floor Price and at the Cap Price,
shall be pre-filled in the Bid cum Application Forms available on the respective websites of the Stock Exchanges.
At any given point of time, there shall be only one denomination for the Equity Shares.
The Offer
The Offer comprises a Fresh Issue and an Offer for Sale by the Selling Shareholder.
Expenses for the Offer shall be shared amongst our Company and the Selling Shareholders in the manner specified in “Objects
of the Offer - Offer Expenses” on page 97.
Rights of the Equity Shareholders
Subject to applicable laws, rules, regulations and guidelines and the Articles of Association, our equity Shareholders shall have
the following rights:
• Right to receive dividends, if declared;
• Right to attend general meetings and exercise voting rights, unless prohibited by law;
• Right to vote on a poll either in person or by proxy, in accordance with the provisions of the Companies Act;
• Right to receive offers for rights shares and be allotted bonus shares, if announced;
• Right to receive surplus on liquidation, subject to any statutory and preferential claim being satisfied;

332
• Right of free transferability, subject to applicable laws including any RBI rules and regulations; and
• Such other rights, as may be available to a shareholder of a listed public company under the Companies Act, the SEBI
Listing Regulations and the MoA and AoA.
For a detailed description of the main provisions of the Articles of Association of our Company relating to voting rights,
dividend, forfeiture and lien, transfer, transmission and/or consolidation/splitting, see “Description of Equity Shares and Terms
of Articles of Association”, beginning on page 356.
Allotment only in dematerialised form
Pursuant to Section 29 of the Companies Act and the SEBI ICDR Regulations, the Equity Shares shall be Allotted only in
dematerialised form. As per the SEBI ICDR Regulations, the trading of the Equity Shares shall only be in dematerialised form
on the Stock Exchanges. In this context, our Company has entered into the following agreements with the respective
Depositories and Registrar to the Offer:
• Tripartite agreement dated August 31, 2021 amongst our Company, NSDL and Registrar to the Offer; and
• Tripartite agreement dated August 30, 2021 amongst our Company, CDSL and Registrar to the Offer.
Market Lot and Trading Lot
Since trading of the Equity Shares is in dematerialised form, the tradable lot is one Equity Share. Allotment in the Offer will be
in multiples of one Equity Share subject to a minimum Allotment of [●] Equity Shares.
Joint Holders
Subject to the provisions of the AoA, where two or more persons are registered as the holders of the Equity Shares, they will
be deemed to hold such Equity Shares as joint tenants with benefits of survivorship.
Nomination facility to investors
In accordance with Section 72 of the Companies Act, read with the rules notified thereunder, the sole Bidder, or the first Bidder
along with other joint Bidders, may nominate any one person in whom, in the event of the death of sole Bidder or in case of
joint Bidders, death of all the Bidders, as the case may be, the Equity Shares Allotted, if any, shall vest to the exclusion of all
other persons, unless the nomination is varied or cancelled in the prescribed manner. A person, being a nominee, entitled to the
Equity Shares by reason of the dea th of the original holder(s), shall be entitled to the same advantages to which he or she would
be entitled if he or she were the registered holder of the Equity Share(s). Where the nominee is a minor, the holder(s) may make
a nomination to appoint, in the prescribed manner, any person to become entitled to Equity Share(s) in the event of his or her
death during the minority. A nomination shall stand rescinded upon a sale/transfer/alienation of Equity Share(s) by the perso n
nominating. A nomination may be cancelled or varied by the Shareholder by nominating any other person in place of the present
nominee, by giving a notice of such cancellation. A buyer will be entitled to make a fresh nomination in the manner prescribed.
Fresh nomination can be made only on the prescribed form available on request at our Registered and Corporate Office or to
the registrar and transfer agents of our Company.
Any person who becomes a nominee by virtue of the provisions of Section 72 of the Companies Act shall upon the production
of such evidence as may be required by the Board, elect either:
a) to register himself or herself as the holder of the Equity Shares; or
b) to make such transfer of the Equity Shares, as the deceased holder could have made.
Further, the Board may at any time give notice requiring any nominee to choose either to be registered himself or herself or to
transfer the Equity Shares, and if the notice is not complied with within a period of 90 days, the Board may thereafter withh old
payment of all dividends, bonuses or other monies payable in respect of the Equity Shares, until the requirements of the notice
have been complied with.
Since the Allotment of Equity Shares in the Offer will be made only in dematerialised mode, there is no need to make a separate
nomination with our Company. Nominations registered with respective Depository Participant of the Bidder would prevail. If
the Bidder wants to change the nomination, they are requested to inform their respective Depository Participant.
Withdrawal of the Offer
Our Company, in consultation with the Book Running Lead Managers, reserves the right not to proceed with the Fresh Issue,
and the Selling Shareholders reserve the right not to proceed with the Offer for Sale, in whole or in part thereof, after the
Bid/Offer Opening Date but before the Allotment. In such an event, our Company would issue a public notice in the newspapers
in which the pre-Offer advertisements were published, within two days of the Bid/Offer Closing Date or such other time as may

333
be prescribed by SEBI, providing reasons for not proceeding with the Offer and inform the Stock Exchanges promptly on which
the Equity Shares are proposed to be listed. The Book Running Lead Managers, through the Registrar to the Offer, shall notify
the SCSBs and the Sponsor Bank (in case of RIBs using the UPI Mechanism), to unblock the bank accounts of the ASBA
Bidders and the Escrow Collection Bank to release the Bid Amounts to the Anchor Investors, within one Working Day from
the date of receipt of such notification. Our Company shall also inform the same to the Stock Exchanges on which the Equity
Shares are proposed to be listed. In terms of the UPI Circulars, in relation to the Offer, the Book Running Lead Managers will
submit reports of compliance with T+6 listing timelines and activities, identifying non-adherence to timelines and processes
and an analysis of entities responsible for the delay and the reasons associated with it. Further, in case of any delay in unblocking
of amounts in the ASBA Accounts (including amounts blocked through the UPI Mechanism) exceeding four Working Days
from the Bid/Offer Closing Date, the Bidder shall be compensated at a uniform rate of ₹ 100 per day for the entire duration of
delay exceeding four Working Days from the Bid/Offer Closing Date by the intermediary responsible for causing such delay
in unblocking. The Book Running Lead Managers shall, in their sole discretion, identify and fix the liability on such
intermediary or entity responsible for such delay in unblocking.
Notwithstanding the foregoing, this Offer is also subject to obtaining (i) the final listing and trading approvals of the Stock
Exchanges, which our Company shall apply for after Allotment; and (ii) filing of the Prospectus with the RoC. If our Company,
or the Selling Shareholders, in consultation with the Book Running Lead Managers withdraws the Offer after the Bid/Offer
Closing Date and thereafter determines that it will proceed with an issue of the Equity Shares, our Company shall file a fres h
draft red herring prospectus with SEBI.
Bid/Offer Programme
BID/OFFER OPENS ON [●](1)
BID/OFFER CLOSES ON [●](2) (1) Our Company in consultation with the Book Running Lead Managers, may consider participation by Anchor Investors. The Anchor Investor Bid/Offer
Period shall be one Working Day prior to the Bid/Offer Opening Date in accordance with the SEBI ICDR Regulations.
(2) Our Company and in consultation with the Book Running Lead Managers, may consider closing the Bid/Offer Period for QIBs one day prior to the
Bid/Offer Closing Date in accordance with the SEBI ICDR Regulations.
An indicative timetable in respect of the Offer is set out below:
Event Indicative Date
Finalisation of Basis of Allotment with the Designated Stock Exchange On or about [●]
Initiation of refunds (if any, for Anchor Investors)/unblocking of funds from ASBA Account* On or about [●]
Credit of Equity Shares to demat accounts of Allottees On or about [●]
Commencement of trading of the Equity Shares on the Stock Exchanges On or about [●] * In case of (i) any delay in unblocking of amounts in the ASBA Accounts (including amounts blocked through the UPI Mechanism) exceeding four Working Days from the Bid/Offer Closing Date for cancelled / withdrawn / deleted ASBA Forms, the Bidder shall be compensated at a uniform rate of ₹ 100 per day or 15% per annum of the Bid Amount, whichever is higher from the date on which the request for cancellation/ withdrawal/ deletion is placed in the Stock Exchanges bidding platform until the date on which the amounts are unblocked (ii) any blocking of multiple amounts for the same ASBA Form (for amounts
blocked through the UPI Mechanism), the Bidder shall be compensated at a uniform rate ₹ 100 per day or 15% per annum of the total cumulative blocked amount except the original application amount, whichever is higher from the date on which such multiple amounts were blocked till the date of actual unblock; (iii) any blocking of amounts more than the Bid Amount, the Bidder shall be compensated at a uniform rate of ₹ 100 per day or 15% per annum of the difference in amount, whichever is higher from the date on which such excess amounts were blocked till the date of actual unblock; (iv) any delay in unblocking of non-
allotted/ partially allotted Bids, exceeding four Working Days from the Bid/Offer Closing Date, the Bidder shall be compensated at a uniform rate of ₹ 100 per day or 15% per annum of the Bid Amount, whichever is higher for the entire duration of delay exceeding four Working Days from the Bid/Offer Closing Date by the SCSB responsible for causing such delay in unblocking.
The above timetable is indicative and does not constitute any obligation or liability on our Company or the Selling
Shareholders or Book Running Lead Managers.
Whilst our Company shall ensure that all steps for the completion of the necessary formalities for the listing and the
commencement of trading of the Equity Shares on the Stock Exchanges are taken within six Working Days of the
Bid/Offer Closing Date or such other period as may be prescribed, with reasonable support and co-operation of the
Selling Shareholder, as may be required in respect of its Offered Shares, the timetable may change due to various factors,
such as extension of the Bid/Offer Period by our Company in consultation with the Book Running Lead Managers,
revision of the Price Band or any delay in receiving the final listing and trading approval from the Stock Exchanges.
The commencement of trading of the Equity Shares will be entirely at the discretion of the Stock Exchanges and in
accordance with the applicable laws. The Selling Shareholders confirm that they shall extend such reasonable support
and co-operation in relation to the Offered Shares for completion of the necessary formalities for listing and
commencement of trading of the Equity Shares at the Stock Exchanges within six Working Days from the Bid/ Offer
Closing Date or such other period as may be prescribed by SEBI.
In terms of the UPI Circulars, in relation to the Offer, the BRLMs will be required to submit reports of compliance with timelines
and activities prescribed by SEBI in connection with the allotment and listing procedure within six Working Days from the
Bid/Offer Closing Date, identifying non-adherence to timelines and processes and an analysis of entities responsible for the
delay and the reasons associated with it.

334
SEBI is in the process of streamlining and reducing the post issue timeline for IPOs. Any circulars or notifications from
SEBI after the date of the Draft Red Herring Prospectus may result in changes to the above mentioned timelines.
Further, the offer procedure is subject to change to any revised SEBI circulars to this effect.
Submission of Bids (other than Bids from Anchor Investors):
Bid/Offer Period (except the Bid/Offer Closing Date)
Submission and Revision in Bids Only between 10.00 a.m. and 5.00 p.m. (Indian Standard Time (“IST”)
Bid/Offer Closing Date
Submission and Revision in Bids Only between 10.00 a.m. and 3.00 p.m. IST
On the Bid/Offer Closing Date, the Bids shall be uploaded until:
(i) 4.00 p.m. IST in case of Bids by QIBs and Non-Institutional Bidders, and
(ii) until 5.00 p.m. IST or such extended time as permitted by the Stock Exchanges, in case of Bids by RIBs .
On Bid/Offer Closing Date, extension of time may be granted by Stock Exchanges only for uploading Bids received by Retail
Individual Bidders, after taking into account the total number of Bids received and as reported by the Book Running Lead
Managers to the Stock Exchanges.
The Registrar to the Offer shall submit the details of cancelled/withdrawn/deleted applications to the SCSB’s on daily basis
within 60 minutes of the Bid closure time from the Bid/ Offer Opening Date till the Bid/Offer Closing Date by obtaining the
same from the Stock Exchanges. The SCSB’s shall unblock such applications by the closing hours of the Working Day.
It is clarified that Bids not uploaded on the electronic bidding system or in respect of which the full Bid Amount is not
blocked in the relevant ASBA Account would be rejected.
Due to limitation of time available for uploading the Bids on the Bid/Offer Closing Date, Bidders are advised to submit their
Bids one day prior to the Bid/Offer Closing Date Date and in any case no later than 1:00 p.m. IST on the Bid/ Offer Closing
Date.. Any time mentioned in this Draft Red Herring Prospectus is IST. Bidders are cautioned that, in the event a large number
of Bids are received on the Bid/Offer Closing Date, some Bids may not get uploaded due to lack of sufficient time. Such Bids
that cannot be uploaded will not be considered for allocation under the Offer. Bids and revisions in Bids will be accepted only
during Working Days. Bids will be accepted only during Monday to Friday (excluding any public holiday), during the Bid/Offer
period. Bids by ASBA Bidders shall be uploaded by the relevant Designated Intermediary in the electronic system to be
provided by the Stock Exchanges.
None among our Company, the Selling Shareholders or any member of the Syndicate is liable for any failure in (i) uploading
the Bids due to faults in any software/ hardware system or otherwise; and (ii) the blocking of Bid Amount in the ASBA Account
on receipt of instructions from the Sponsor Bank on account of any errors, omissions or non-compliance by various parties
involved in, or any other fault, malfunctioning or breakdown in, or otherwise, in the UPI Mechanism.
Our Company, in consultation with the Book Running Lead Managers reserve the right to revise the Price Band during the
Bid/Offer Period. The revision in the Price Band shall not exceed 20% on either side, i.e. the Floor Price can move up or down
to the extent of 20% of the Floor Price and the Cap Price will be revised accordingly. In case of any discrepancy in the data
entered in the electronic book vis-à-vis the data contained in the Bid cum Application Form for a particular Bidder, the details
as per the Bid file received from the Stock Exchanges shall be taken as the final data for the purpose of Allotment. The Floor
Price shall not be less than the face value of the Equity Shares.
In case of revision in the Price Band, the Bid/Offer Period shall be extended for at least three additional Working Days
after such revision, subject to the Bid/Offer Period not exceeding 10 Working Days. In cases of force majeure, banking
strike or similar circumstances, our Company may, for reasons to be recorded in writing, extend the Bid/Offer Period
for a minimum of three Working Days, subject to the Bid/Offer Period not exceeding 10 Working Days. Any revision in
Price Band, and the revised Bid/Offer Period, if applicable, shall be widely disseminated by notification to the Stock
Exchanges, by issuing a press release and also by indicating the change on the websites of the Book Running Lead
Managers and at the terminals of the Syndicate Members and by intimation to the Designated Intermediaries.
Minimum Subscription
If our Company does not receive the minimum subscription in the Offer as specified under Rule 19(2)(b) of the SCRR or the
minimum subscription of 90% of the Fresh Issue on the Bid/Offer Closing Date; or subscription level falls below aforesaid
minimum subscription after the Bid/Offer Closing Date due to withdrawal of Bids or technical rejections or any other reason;
or in case of devolvement of Underwriting, aforesaid minimum subscription is not received within 60 days from the date of
Bid/Offer Closing Date or if the listing or trading permission is not obtained from the Stock Exchanges for the Equity Shares
in the Offer, our Company shall forthwith refund the entire subscription amount received in accordance with applicable law
including the SEBI circular bearing no. SEBI/HO/CFD/DIL1/CIR/P/2021/47 dated March 31, 2021. If there is a delay beyond
335
four days after our Company becomes liable to pay the amount, our Company and every Director of our Company, who are
officers in default, shall pay interest at the rate of 15% per annum.
In the event of achieving aforesaid minimum subscription, however, there is under-subscription in achieving the total Offer
size, the Equity Shares will be Allotted in the following order:
(i) such number of Equity Shares will first be Allotted by our Company such that 90% of the Fresh Issue portion is
subscribed;
(ii) upon (i), all the Equity Shares held by the Selling Shareholders and offered for sale in the Offer for Sale will be Allotted
(in proportion to the Offered Shares being offered by each Selling Shareholder); and
(iii) once Equity Shares have been Allotted as per (i) and (ii) above, such number of Equity Shares will be Allotted by
our Company towards the balance 10% of the Fresh Issue portion;
No liability to make any payment of interest or expenses shall accrue to the Selling Shareholders unless the delay in making
any of the payments/refund hereunder or the delay in obtaining listing or trading approvals or any other approvals in relatio n to
the Offer is caused solely by, and is directly attributable to, an act or omission of the Selling Shareholders and to the extent of
its portion of the Offered Shares. Further, in terms of Regulation 49(1) of the SEBI ICDR Regulations, our Company shall
ensure that the number of Bidders to whom the Equity Shares will be Allotted will be not less than 1,000.
Arrangements for Disposal of Odd Lots
Since our Equity Shares will be traded in dematerialised form only and the market lot for our Equity Shares will be one Equit y
Share, no arrangements for disposal of odd lots are required.
Restrictions, if any on Transfer and Transmission of Equity Shares
Except for lock-in of the pre-Offer Equity Share capital of our Company, lock-in of our Promoters’ minimum contribution
under the SEBI ICDR Regulations and the Anchor Investor lock-in as provided in “Capital Structure”, beginning on page 69
and except as provided under the AoA, there are no restrictions on transfer of the Equity Shares. Further, there are no restrictions
on transmission of any shares of our Company and on their consolidation or splitting, except as provided in the AoA. For details,
see “Description of Equity Shares and Terms of Articles of Association”, beginning on page 356.

336
OFFER STRUCTURE
Offer of up to [●] Equity Shares for cash at price of ₹[●] per Equity Share (including a premium of ₹[●] per Equity Share)
aggregating to ₹[●] million comprising of a Fresh Issue of up to [●] Equity Shares aggregating up to ₹ 4,000.00 million by our
Company and an Offer for Sale of up to 16,044,709 Equity Shares aggregating up to ₹[●] million, comprising of up to 720,000
Equity Shares aggregating up to ₹[●] million by Ashraf Mohammed Biran; up to 720,000 Equity Shares aggregating up to ₹[●]
million by Gulshan Haresh Bakhtiani; up to 120,000 Equity Shares aggregating up to ₹[●] million by Mohan Ganpat Chavan
and up to 14,484,709 Equity Shares aggregating up to ₹[●] million by persons referred to in Annexure A.
The Offer shall constitute [●]% of the post-Offer paid-up Equity Share capital of our Company.
The face value of the Equity Shares is ₹ 2 each. The Offer is being made through the Book Building Process.
Particulars QIBs(1) Non-Institutional Bidders Retail Individual Bidders
Number of Equity Shares
available for Allotment or
allocation*(2)
Not less than [●] Equity Shares Not more than [●] Equity
Shares available for
allocation or Offer less allocation to QIB Bidders and
Retail Individual Bidders
Not more than [●] Equity Shares
available for allocation or Offer
less allocation to QIB Bidders
and Non-Institutional Bidders
Percentage of Offer size
available for Allotment or
allocation
Not less than 75% of the Offer being
available for allocation to QIB Bidders.
However, up to 5% of the Net QIB Portion will be available for allocation
proportionately to Mutual Funds only.
Mutual Funds participating in the Mutual
Fund Portion will also be eligible for
allocation in the remaining QIB Portion. The unsubscribed portion in the Mutual
Fund Portion will be added to the Net QIB
Portion
Not more than 15% of the
Offer or the Offer less
allocation to QIB Bidders and
Retail Individual Bidders
Not more than 10% of the Offer
or the Offer less allocation to
QIB Bidders and Non-
Institutional Bidders
Basis of Allotment if respective category is
oversubscribed*
Proportionate as follows (excluding the
Anchor Investor Portion):
(a) up to [●] Equity Shares shall be available for allocation on a
proportionate basis to Mutual
Funds only; and
(b) up to [●] Equity Shares shall be
available for allocation on a
proportionate basis to all QIBs,
including Mutual Funds receiving allocation as per (a)
above.
Up to [●] Equity Shares may be allocated
on a discretionary basis to Anchor Investors
of which one-third shall be available for
allocation to Mutual Funds only, subject to valid Bids received from Anchor Investors
at or above the Anchor Investor Allocation
Price
Proportionate The allotment to each Retail Individual Bidder shall not be
less than the minimum Bid Lot,
subject to availability of Equity
Shares in the Retail Portion and
the remaining available Equity Shares if any, shall be Allotted
on a proportionate basis. For
further details, see “Offer
Procedure”, beginning on page
338
Mode of Bid Through ASBA process only (except for Anchor Investors)
Minimum Bid Such number of Equity Shares in multiples of [●] Equity Shares such that the Bid
Amount exceeds ₹ 200,000
Such number of Equity Shares in multiples of [●]
Equity Shares such that the
Bid Amount exceeds ₹
200,000
[●] Equity Shares and in multiples of [●] Equity Shares
thereafter
Maximum Bid Such number of Equity Shares in multiples of [●] Equity Shares not exceeding the size
of the Offer, subject to applicable limits
Such number of Equity Shares in multiples of [●]
Equity Shares not exceeding
the size of the Offer
(excluding QIB portion),
subject to limits applicable to
Such number of Equity Shares in multiples of [●] Equity Shares
so that the Bid Amount does not
exceed ₹ 200,000

337
Particulars QIBs(1) Non-Institutional Bidders Retail Individual Bidders
the Bidder
Mode of Allotment Compulsorily in dematerialised form
Bid Lot [●] Equity Shares and in multiples of [●] Equity Shares thereafter
Allotment Lot [●] Equity Shares and in multiples of one Equity Share thereafter
Trading Lot One Equity Share
Who can apply(3) Public financial institutions as specified in Section 2(72) of the Companies Act,
scheduled commercial banks, multilateral
and bilateral development financial
institutions, Mutual Funds, Eligible FPIs
(other than individuals, corporate bodies and family offices), VCFs, AIFs, state
industrial development corporation,
insurance company registered with IRDAI,
provident funds with minimum corpus of ₹
250 million, pension funds with minimum corpus of ₹ 250 million, National
Investment Fund set up by the GoI,
insurance funds set up and managed by
army, navy or air force of the Union of
India, insurance funds set up and managed by the Department of Posts, India and
Systemically Important NBFCs
Resident Indian individuals, Eligible NRIs, HUFs (in the
name of the karta),
companies, corporate bodies,
scientific institutions,
societies, trusts, family offices and FPIs who are
individuals, corporate bodies
and family offices
Resident Indian individuals , Eligible NRIs and HUFs (in the
name of the karta)
Terms of Payment In case of Anchor Investors: Full Bid Amount shall be payable by the Anchor Investors at the time of
submission of their Bids(4)
In case of all other Bidders: Full Bid Amount shall be blocked by the SCSBs in the bank account of the
ASBA Bidder, or by the Sponsor Bank through the UPI Mechanism, that is specified in the ASBA Form at
the time of submission of the ASBA Form
* Assuming full subscription in the Offer. (1) Our Company in consultation with the Book Running Lead Managers, may allocate up to 60% of the QIB Portion to Anchor Investors on a discretionary
basis in accordance with the SEBI ICDR Regulations. One-third of the Anchor Investor Portion shall be reserved for domestic Mutual Funds, subject to
valid Bids being received from domestic Mutual Funds at or above the price Anchor Investor Allocation Price. In the event of under-subscription or non-Allotment in the Anchor Investor Portion, the balance Equity Shares in the Anchor Investor Portion shall be added to the Net QIB Portion. For details, see “Offer Procedure”, beginning on page 338.
(2) Subject to valid Bids being received at or above the Offer Price. This Offer is being made in accordance with Rule 19(2) of the SCRR and Regulation 6(2) of the SEBI ICDR Regulations.
(3) In case of joint Bids, the Bid cum Application Form should contain only the name of the first Bidder whose name should also a ppear as the first holder of the beneficiary account held in joint names. The signature of only such first Bidder would be required in the Bid cum Application Form and su ch first Bidder would be deemed to have signed on behalf of the joint holders. Bidders will be required to confirm and will be deemed to have represented to our Company, the Selling Shareholders, the Underwriters, their respective directors, officers, agents, affiliates and representatives that they are eligible under applicable law, rules, regulations, guidelines and approvals to acquire the Equity Shares.
(4) Full Bid Amount shall be payable by the Anchor Investors at the time of submission of the Anchor Investor Application Forms p rovided that any difference between the Anchor Investor Allocation Price and the Anchor Investor Offer Price shall be payable by the Anchor Investor Pay-In Date as indicated in the CAN.
The Bids by FPIs with certain structures as described under “Offer Procedure - Bids by FPIs” on page 342 and having same
PAN may be collated and identified as a single Bid in the Bidding process. The Equity Shares Allocated and Allotted to such
successful Bidders (with same PAN) may be proportionately distributed.
Subject to valid Bids being received at or above the Offer Price, under-subscription, if any, in any category except the QIB
Portion, would be allowed to be met with spill over from any other category or combination of categorises at the discretion o f
our Company, in consultation with the Book Running Lead Managers and the Designated Stock Exchange, on a proportionate
basis.

338
OFFER PROCEDURE
All Bidders should read the General Information Document which highlights the key rules, processes and procedures
applicable to public issues in general in accordance with the provisions of the Companies Act, the SCRA, the SCRR and the
SEBI ICDR Regulations which is part of the abridged prospectus accompanying the Bid cum Application Form. The General
Information Document is available on the websites of the Stock Exchanges and the Book Running Lead Managers. Please refer
to the relevant provisions of the General Information Document which are applicable to the Offer especially in relation to the
process for Bids by RIBs through the UPI Mechanism.
Additionally, all Bidders may refer to the General Information Document for information in relation to (i) category of investors
eligible to participate in the Offer; (ii) maximum and minimum Bid size; (iii) price discovery and allocation; (iv) payment
instructions for ASBA Bidders; (v)issuance of CAN and Allotment in the Offer; (vi) general instructions (limited to instructions
for completing the Bid cum Application Form); (vii) designated date; (viii) disposal of applications; (ix) submission of Bid cum
Application Form; (x) other instructions (limited to joint bids in cases of individual, multiple bids and instances when an
application would be rejected on technical grounds); (xi) applicable provisions of the Companies Act relating to punishment
for fictitious applications; (xii) mode of making refunds; and (xiii) interest in case of delay in Allotment or refund.
SEBI vide its circular no. SEBI/HO/CFD/DIL2/CIR/P/2018/138 dated November 1, 2018 read with its circular no.
SEBI/HO/CFD/DIL2/CIR/P/2019/50 dated April 3, 2019, has introduced an alternate payment mechanism using Unified
Payments Interface (“UPI”) and consequent reduction in timelines for listing in a phased manner. From January 1, 2019, the
UPI Mechanism for RIBs applying through Designated Intermediaries was made effective along with the existing process and
existing timeline of T+6 days. (“UPI Phase I”). The UPI Phase I was effective till June 30, 2019 .
With effect from July 1, 2019, SEBI vide its circular no. SEBI/HO/CFD/DIL2/CIR/P/2019/76 dated June 28, 2019, read with
circular bearing number SEBI/HO/CFD/DIL2/CIR/P/2019/85 dated July 26, 2019 with respect to Bids by RIBs through
Designated Intermediaries (other than SCSBs), the existing process of physical movement of forms from such Designated
Intermediaries to SCSBs for blocking of funds has been discontinued and only the UPI Mechanism for such Bids with existing
timeline of T+6 days was mandated for a period of three months or launch of five main board public issues, whichever is later
(“UPI Phase II”). Subsequently, however, SEBI vide its circular no. SEBI/HO/CFD/DIL2/CIR/P/2020/50 dated March 30,
2020 extended the timeline for implementation of UPI Phase II till further notice. However, given the prevailing uncertainty
due to the COVID-19 pandemic, SEBI vide its circular no. SEBI/HO/CFD/DIL2/CIR/P/2020/50 dated March 30, 2020, has
decided to continue with the UPI Phase II till further notice. The final reduced timeline of T+3 days will be made effective using
the UPI Mechanism for applications by RIBs (“UPI Phase III”), as may be prescribed by SEBI. The Offer will be undertaken
pursuant to the processes and procedures under UPI Phase II, subject to any circulars, clarification or notification issued b y
the SEBI from time to time. Further, SEBI vide its circular no. SEBI/HO/CFD/DIL2/CIR/P/2021/2480/1/M dated March 16,
2021 has introduced certain additional measures for streamlining the process of initial public offers and redressing investor
grievances. This circular shall come into force for initial public offers opening on/or after May 1, 2021, except as amended
pursuant to SEBI circular SEBI/HO/CFD/DIL2/P/CIR/2021/570 dated June 2, 2021, and the provisions of this circular, are
deemed to form part of this Draft Red Herring Prospectus.
Our Company, the Selling Shareholders and the Book Running Lead Managers do not accept any responsibility for the
completeness and accuracy of the information stated in this section and the General Information Document and are not liable
for any amendment, modification or change in the applicable law which may occur after the date of this Draft Red Herring
Prospectus. Bidders are advised to make their independent investigations and ensure that their Bids are submitted in
accordance with applicable laws and do not exceed the investment limits or maximum number o f the Equity Shares that can be
held by them under applicable law or as specified in th is Draft Red Herring Prospectus and the Prospectus.
Further, our Company, the Selling Shareholders and the members of the Syndicate are not liable for any adverse occurrences
consequent to the implementation of the UPI Mechanism for application in the Offer.
Book Building Procedure
The Offer is being made in terms of Rule 19(2)(b) of the SCRR, read with Regulation 31 of the SEBI ICDR Regulations,
through the Book Building Process in accordance with Regulation 6(2) of the SEBI ICDR Regulations wherein not less than
75% of the Offer shall be allocated on a proportionate basis to QIBs, provided that our Company may, in consultation with the
Book Running Lead Managers, allocate up to 60% of the QIB Portion to Anchor Investors on a discretionary basis in accordance
with the SEBI ICDR Regulations, of which one-third shall be reserved for domestic Mutual Funds, subject to valid Bids being
received from domestic Mutual Funds at or above the Anchor Investor Allocation Price. In the event of under-subscription, or
non-allotment in the Anchor Investor Portion, the balance Equity Shares shall be added to the Net QIB Portion. Further, 5% of
the Net QIB Portion shall be available for allocation on a proportionate basis only to Mutual Funds, and the remainder of the
Net QIB Portion shall be available for allocation on a proportionate basis to all QIBs (other than Anchor Investors) , including
Mutual Funds, subject to valid Bids being received at or above the Offer Price. Further, not more than 15% of the Net Offer
shall be available for allocation on a proportionate basis to Non-Institutional Bidders and not more than 10% of the Net Offer
shall be available for allocation to Retail Individual Bidders in accordance with the SEBI ICDR Regulations, subject to valid
Bids being received at or above the Offer Price.

339
Under-subscription, if any, in any category, except in the QIB Portion, would be allowed to be met with spill over from any
other category or combination of categories of Bidders at the discretion of our Company, in consultation with the Book Running
Lead Managers and the Designated Stock Exchange, subject to receipt of valid Bids received at or above the Offer Price. Under-
subscription, if any, in the QIB Portion, would not be allowed to be met with spill-over from any other category or a combination
of categories.
The Equity Shares, on Allotment, shall be traded only in the dematerialised segment of the Stock Exchanges.
Investors must ensure that their PAN is linked with Aadhaar and are in compliance with the notification by the Central
Board of Direct Taxes dated February 13, 2020 read with press releases dated June 25, 2021 a nd September 17, 2021.
Investors should note that the Equity Shares will be Allotted to all successful Bidders only in dematerialised form. The
Bid cum Application Forms which do not have the details of the Bidders’ depository account, including DP ID, Cli ent
ID, PAN and UPI ID, as applicable, shall be treated as incomplete and will be rejected. Bidders will not have the option
of being Allotted Equity Shares in physical form. However, they may get the Equity Shares rematerialized subsequent
to Allotment of the Equity Shares in the Offer, in compliance with the applicable laws.
Phased implementation of Unified Payments Interface
SEBI has issued the UPI Circulars in relation to streamlining the process of public issue of inter alia, equity shares. Pursuant
to the UPI Circulars, the UPI Mechanism has been introduced in a phased manner as a payment mechanism (in addition to
mechanism of blocking funds in the account maintained with SCSBs under ASBA) for applications by RIBs through Designated
Intermediaries with the objective to reduce the time duration from public issue closure to listing from six Working Days to u p
to three Working Days. Considering the time required for making necessary changes to the systems and to ensure complete and
smooth transition to the UPI payment mechanism, the UPI Circulars have introduced the UPI Mechanism in three phases in the
following manner:
Phase I: This phase was applicable from January 1, 2019 until March 31, 2019 or floating of five main board public issues,
whichever was later. Subsequently, the timeline for implementation of Phase I was extended till June 30, 2019. Under this
phase, a RIB had the option to submit the ASBA Form with any of the Designated Intermediary and use his/ her UPI ID for the
purpose of blocking of funds. The time duration from public issue closure to listing continued to be six Working Days.
Phase II: This phase has become applicable from July 1, 2019. SEBI vide its circular no.
SEBI/HO/CFD/DCR2/CIR/P/2019/133 dated November 8, 2019 ha d extended the timeline for implementation of UPI Phase II
till March 31, 2020. Further, SEBI vide its circular no. SEBI/HO/CFD/DIL2/CIR/P/2020/50 dated March 30, 2020 decided to
continue Phase II of UPI with ASBA until further notice. Under this phase, submission of the ASBA Form by RIBs through
Designated Intermediaries (other than SCSBs) to SCSBs for blocking of funds has been discontinued an d is replaced by the
UPI Mechanism. However, the time duration from public issue closure to listing would continue to be six Working Days during
this phase.
Phase III: The commencement period of Phase III is yet to be notified. In this phase, the time dura tion from public issue closure
to listing is proposed to be reduced to three Working Days. Accordingly, upon commencement of Phase III, the reduced time
duration shall be applicable for the Offer.
The Offer will be made under UPI Phase II of the UPI Circular, unless UPI Phase III of the UPI Circular becomes effective and
applicable on or prior to the Bid/Offer Opening Date. If the Offer is made under UPI Phase III of the UPI Circular, the same
will be advertised in all editions of [●], all editions of [●] and regional edition of [●] (which are widely circulated English daily,
Hindi daily and Marathi newspapers, respectively, Marathi also being the regional language of Maharashtra , where our
Registered office is located) on or prior to the Bid/Offer Opening Date and such advertisement shall also be made available to
the Stock Exchanges for the purpose of uploading on their websites.
All SCSBs offering the facility of making applications in public issues shall a lso provide the facility to make application using
UPI. The Company will be required to appoint one of the SCSBs as a Sponsor Bank to act as a conduit between the Stock
Exchanges and NPCI in order to facilitate collection of requests and/ or payment instru ctions of the Retail Individual Bidders
using the UPI.
For further details, refer to the General Information Document available on the websites of the Stock Exchanges and the B ook
Running Lead Managers.
Bid cum Application Form
Copies of the Bid cum Application Form (other than for Anchor Investors) and the abridged prospectus will be available with
the Designated Intermediaries at the Bidding Centres, and our Registered and Corporate Office. An electronic copy of the Bid
cum Application Form will also be a vailable for download on the websites of NSE (www.nseindia.com) and BSE
(www.bseindia.com) at least one day prior to the Bid/Offer Opening Date.

340
Copies of the Anchor Investor Application Form will be available with the Book Running Lead Managers.
All Bidders (other than Anchor Investors) shall mandatorily participate in the Offer only through the ASBA process. Anchor
Investors are not permitted to participate in the Offer through the ASBA process. The RIBs can additionally Bid through the
UPI Mechanism.
RIBs Bidding using the UPI Mechanism must provide the valid UPI ID in the relevant space provided in the Bid cum
Application Form and the Bid cum Application Forms that do not contain the UPI ID are liable to be rejected. Applications
made by the RIBs using third party bank account or using third party linked bank account UPI ID are liable for rejection.
ASBA Bidders must provide either (i) the bank account details and authorisation to block funds in the ASBA Form, or (ii) the
UPI ID (in case of RIBs) as applicable, in the relevant space provided in the ASBA Form. The ASBA Forms that do not contain
such details will be rejected.
ASBA Bidders shall ensure that the Bids are made on ASBA Forms bearing the stamp of the relevant Designated Intermediary,
submitted at the relevant Bidding Centres only (except in case of electronic ASBA Forms) and the ASBA Forms not bearing
such specified stamp are liable to be rejected. Since the Offer is made under Phase II of the UPI Circulars, ASBA Bidders may
submit the ASBA Form in the manner below:
(i) RIBs (other than the RIBs using UPI Mechanism) may submit their ASBA Forms with SCSBs (physically or online, as
applicable), or online using the facility of linked online trading, demat and bank account (3 in 1 type accounts) provided
by certain brokers.
(ii) RIBs using UPI Mechanism, may submit their ASBA Forms with the Syndicate, sub-Syndicate members, Registered
Brokers, RTAs or CDPs or online using the facility of linked online trading, demat and bank account (3 in 1 type
accounts), provided by certain brokers.
(iii) QIBs and NIBs may submit their ASBA Forms with SCSBs, Syndicate, sub -Syndicate members, Registered Brokers,
RTAs or CDPs.
ASBA Bidders are also required to ensure that the ASBA Account has sufficient credit balance such that an amount equivalent
to the full Bid Amount can be blocked by the SCSB at the time of submitting the Bid.
For Anchor Investors, the Anchor Investor Application Form will be available at the offices of the Boo k Running Lead
Managers. Anchor Investors are not permitted to participate in the Offer through the ASBA process.
The prescribed colour of the Bid cum Application Form for the various categories is as follows:
Category Colour of Bid cum Application
Form*
Resident Indians, including resident QIBs, Non-Institutional Bidders, Retail Individual Bidders and Eligible NRIs applying on a non-repatriation basis
[●]
Non-residents including Eligible NRIs, FPIs and registered bilateral and multilateral institutions applying
on a repatriation basis
[●]
Anchor Investors [●]
*Excluding electronic Bid cum Application Forms Notes: (1) Electronic Bid cum Application forms and the abridged prospectus will also be available for download on the website of NSE (www.nseindia.com)
and BSE (www.bseindia.com) (2) Bid cum Application Forms for Anchor Investors shall be available at the offices of the BRLMs
In case of ASBA Forms, Designated Intermediaries shall upload the relevant bid details in the electronic bidding system of the
Stock Exchanges.
Subsequently, for ASBA Forms (other than RIBs using UPI Mechanism), Designated Intermediaries (other than SCSBs) shall
submit / deliver the ASBA Forms to the respective SCSB where the Bidder has an ASBA bank account and shall not submit it
to any non-SCSB bank or any Escrow Collection Bank. Stock Exchanges shall validate the electronic bids with the records of
the CDP for DP ID/Client ID and PAN, on a real time basis and bring inconsistencies to the notice of the relevant Designated
Intermediaries, for rectification and re-submission within the time specified by Stock Exchanges. Stock Exchanges shall allow
modification of either DP ID/Client ID or PAN ID, bank code and location code in the Bid details already uploaded.
For RIBs using UPI Mechanism, the Stock Exchanges shall share the Bid details (including UPI ID) with the Sponsor Bank on
a continuous basis through API integration to enable the Sponsor Bank to initia te UPI Mandate Request to RIBs for blocking
of funds. The Sponsor Bank shall initiate request for blocking of funds through NPCI to RIBs, who shall accept the UPI mandate
request for blocking of funds on their respective mobile applications associated with UPI ID linked bank account. For all
pending UPI mandate requests, the Sponsor Bank shall initiate requests for blocking of funds in the ASBA Accounts of relevant
Bidders with a confirmation cut-off time of 12:00 pm on the first Working Day after the Bid/Offer Closing Date (“Cut-Off
Time”). Accordingly, RIBs Bidding using through the UPI Mechanism should accept UPI mandate requests for blocking off

341
funds prior to the Cut-Off Time and all pending UPI mandate requests at the Cut-Off Time shall lapse. For ensuring timely
information to investors, SCSBs shall send SMS alerts for mandate block and unblock including details specified in SEBI
circular no. SEBI/HO/CFD/DIL2/CIR/P/2021/2480/1/M dated March 16, 2021 as amended pursuant to SEBI circular no.
SEBI/HO/CFD/DIL2/P/CIR/2021/570 dated June 2, 2021.
The Sponsor Bank will undertake a reconciliation of Bid responses received from Stock Exchanges and sent to NPCI and will
also ensure that all the responses received from NPCI are sent to the Stock Exchanges platform with detailed error code and
description, if any. Further, the Sponsor Bank will undertake reconciliation of all Bid requests and responses throughout the ir
lifecycle on daily basis and share reports with the Book Running Lead Managers in the format and within the timelines as
specified under the UPI Circulars. Sponsor Bank and issuer banks shall download UPI settlement files and raw data files from
the NPCI portal after every settlement cycle and do a three way reconciliation with Banks UPI switch data, C BS data and UPI
raw data. NPCI is to coordinate with issuer banks and Sponsor Banks on a continuous basis.
Participation by Promoters and members of the Promoter Group of our Company, the Book Running Lead Managers
and the Syndicate Members
The Book Running Lead Managers and the Syndicate Members shall not be allowed to purchase Equity Shares in this Offer in
any manner, except towards fulfilling their underwriting obligations. However, the associates and affiliates of the Book Running
Lead Managers and the Syndicate Members may Bid for Equity Shares in the Offer, either in the QIB Portion or in the Non-
Institutional Portion as may be applicable to such Bidders, where the allocation is on a proportionate basis and su ch subscription
may be on their own account or on behalf of their clients. All categories of investors, including associates or affiliates of the
Book Running Lead Managers and Syndicate Members, shall be treated equally for the purpose of allocation to be made on a
proportionate basis.
Except as stated below, neither the Book Running Lead Managers nor any associates of the Book Running Lead Managers can
apply in the Offer under the Anchor Investor Portion
(i) Mutual Funds sponsored by entities which are associates of the Book Running Lead Managers;
(ii) insurance companies promoted by entities which are associate of Book Running Lead Managers;
(iii) AIFs sponsored by the entities which are associate of the Book Running Lead Managers; or
(iv) FPIs (other than individuals, corporate bodies and family offices) sponsored by the entities which are associates of the
Book Running Lead Managers.
Further, our Promoters and members of the Promoter Group shall not participate by applying for Equity Shares in the Offer.
Furthermore, persons related to our Promoters/ Promoter Group shall not apply in the Offer under the Anchor Investor Portion.
For the purposes of this section, a QIB who has any of the following rights shall be deemed to be a person related to our
Promoters/ Promoter Group:
(i) rights under a shareholders’ agreement or voting agreement entered into with our Promoters or Promoter Group;
(ii) veto rights; or
(iii) right to appoint any nominee director on our Board.
Further, an Anchor Investor shall be deemed to be an associate of the Book Running Lead Managers, if: (a) either of them
controls, directly or indirectly through its subsidiary or holding company, not less than 15% of the voting rights in the other; or
(b) either of them, directly or indirectly, by itself or in combination with other persons, exercises control over the other; or (c)
there is a common director, excluding a nominee director, amongst the Anchor Investor and the Book Running Lead Managers.
Bids by Mutual Funds
With respect to Bids by Mutual Funds, a certified copy of their SEBI registration certificate must be lodged along with the B id
cum Application Form. Failing this, our Company in consultation with the Book Running Lead Managers reserves the right to
reject any Bid without assigning any reason thereof.
Bids made by asset management companies or custodians of Mutual Funds shall specifically state names of the concerned
schemes for which such Bids are made.
In case of a Mutual Fund, a separate Bid can be made in respect of each scheme of the Mutual Fund registered with SEBI and
such Bids in respect of more than one scheme of the Mutual Fund will not be treated as multiple Bids provided that the Bids
clearly indicate the scheme concerned for which the Bid has been made.

342
No Mutual Fund scheme shall invest more than 10% of its NAV in equity shares or equity related instruments of any single
company provided that the limit of 10% shall not be applicable for investments in case of index funds or sector or industry
specific schemes. No Mutual Fund under all its schemes should own more than 10% of any company’s paid -up share capital
carrying voting rights.
Bids by Eligible NRIs
Eligible NRIs may obtain copies of Bid cum Application Form from the Designated Intermediaries. Only Bids accompanied
by payment in Indian Rupees or freely convertible foreign exchange will be considered for Allotment. Eligible NRI Bidders
bidding on a repatriation basis by using the Bid cum Application Form meant for Non-Residents should authorise their SCSB
to block their Non-Resident External (“NRE”) accounts (including UPI ID if activated), or Foreign Currency Non-Resident
(“FCNR”) accounts, and eligible NRI Bidders bidding on a non-repatriation basis by using resident forms should authorise
their SCSB to block their Non-Resident Ordinary (“NRO”) accounts for the full Bid Amount, at the time of the submission of
the Bid cum Application Form.
Eligible NRIs Bidding on non-repatriation basis are advised to use the Bid cum Application Form for residents ([●] in colour).
Eligible NRIs Bidding on a repatriation basis are not permitted to participate in the Offer. Eligible NRIs will be permitted to
apply in the Offer through Channel I or Channel II (as specified in the SEBI UPI Circulars). Further, subject to applicable law,
Eligible NRIs may use Channel IV (as specified in the SEBI UPI Circulars) to apply in the Offer, provided the UPI facility is
enabled for their NRE/NRO accounts.
For details of investment by NRIs, see “Restrictions on Foreign Ownership of Indian Securities”, beginning on page 354.
Participation of Eligible NRIs shall be subject to the FEMA Regulations.
Bids by HUFs
Bids by Hindu Undivided Families or HUFs, should be made in the individual name of the Karta. The Bidder/Applicant should
specify that the Bid is being made in the name of the HUF in the Bid cum Application Form/Application Form as follows:
“Name of sole or first Bidder/Applicant: XYZ Hindu Undivided Family applying through XYZ, where XYZ is the name of the
Karta”. Bids/Applications by HUFs will be considered at par with Bids/Applications from individuals.
Bids by FPIs
In terms of the SEBI FPI Regulations, the issue of Equity Shares to a single FPI including its or an investor group (which means
the same multiple entities having common ownership directly or indirectly of more than 50% or common control) must be
below 10% of our post-Offer Equity Share capital. Further, in terms of the FEMA Regulations, the total holding by each FPI,
of an investor group, shall be below 10% of the total paid-up Equity Share capital of our Company on a fully diluted basis and
the total holdings of all FPIs put together shall not exceed 49.99% of the paid-up Equity Share capital of our Company on a
fully diluted basis.
In case the total holding of an FPI or investor group increases beyond 10% of the total paid -up Equity Share capital of our
Company, on a fully diluted basis, the total investment made by the FPI or investor group will be re-classified as FDI subject
to the conditions as specified by SEBI and the RBI in this regard and our Company and the investor will be required to comply
with applicable reporting requirements.
In case of Bids made by FPIs, a certified copy of the certificate of registration issued under the SEBI FPI Regulations is req uired
to be attached to the Bid cum Application Form, failing which our Company reserves the right to reject any Bid without
assigning any reason. FPIs who wish to participate in the Offer are advised to use the Bid cum Application Form for Non-
Residents ([●] in colour).
In terms of the FEMA Regulations, for calculating the aggregate holding of FPIs in a company, holding of all regist ered FPIs
shall be included.
With effect from April 1, 2020, the aggregate limits for FPI investments are the sectoral caps applicable to our Company.
However, since one of our Subsidiaries undertakes businesses where FDI is permitted only through the Approval Route or
where FDI is not permitted, the total foreign investment in our Company cannot equate to 50% or more of our Company’s
Equity Share capital, and non-residents cannot own or control our Company. Accordingly, the aggregate limits for FPI
investments in our Company is restricted to 49.99% of the paid-up Equity Share Capital of our Company (on a fully diluted
basis). For details, see “Restrictions on Foreign Ownership of Indian Securities” on page 354.
The FEMA Non-debt Instruments Rules was enacted on October 17, 2019 in supersession of the Foreign Exchange Management
(Transfer or Issue of Security by a Person Resident Outside India) Regulations, 2017 , except as respects things done or omitted
to be done before such supersession. FPIs are permitted to participate in the Offer under Schedule II of the FEMA Non-debt
Instruments Rules, subject to compliance with conditions mentioned therein.
To ensure compliance with the above requirement, SEBI, pursuant to its circular dated July 13, 2018, has directed that at the

343
time of finalisation of the Basis of Allotment, the Registrar shall (i) use the PAN issued by the Income Tax Department of India
for checking compliance for a single FPI; and (ii) obtain validation from Depositories for the FPIs who hav e invested in the
Offer to ensure there is no breach of the investment limit, within the timelines for Offer procedure, as prescribed by SEBI from
time to time.
Subject to compliance with all applicable Indian laws, rules, regulations, guidelines and appro vals in terms of the SEBI FPI
Regulations, an FPI, may issue, subscribe to or otherwise deal in offshore derivative instruments (as defined under the SEBI
FPI Regulations as any instrument, by whatever name called, which is issued overseas by a FPI against securities held by it in
India, as its underlying) directly or indirectly, only in the event (i) such offshore derivative instruments are issued only by
persons registered as Category I FPIs; (ii) such offshore derivative instruments are issued only to persons eligible for registration
as Category I FPIs; (iii) such offshore derivative instruments are issued after compliance with ‘know your client’ norms; and
(iv) such other conditions as may be specified by SEBI from time to time.
Subject to compliance with all applicable Indian laws, rules, regulations, guidelines and approvals in terms of the SEBI FPI
Regulations, an FPI is permitted to issue, subscribe to, or otherwise deal in offshore derivative instruments, directly or in directly,
only if it complies with the following conditions:
a) such offshore derivative instruments are issued only by persons registered as Category I FPIs;
b) such offshore derivative instruments are issued only to persons eligible for registration as Category I FPIs;
c) such offshore derivative instruments are issued after compliance with the ‘know your client’ norms as specified by
SEBI; and
d) such other conditions as may be specified by SEBI from time to time.
An FPI is required to ensure that the transfer of an offshore derivat ive instruments issued by or on behalf of it, is subject to (a)
the transfer being made to persons which fulfil the criteria provided under the SEBI FPI Regulations (as mentioned above from
points (a) to (d)); and (b) prior consent of the FPI is obtained for such transfer, except in cases, where the persons to whom the
offshore derivative instruments are to be transferred, are pre-approved by the FPI.
Bids by following FPIs, submitted with the same PAN but with different beneficiary account numbers, Client IDs and DP IDs
shall not be treated as multiple Bids:
• FPIs which utilise the multi investment manager (“MIM”) structure;
• Offshore derivative instruments which have obtained separate FPI registration for ODI and proprietary derivative
investments;
• Sub funds or separate class of investors with segregated portfolio who obtain separate FPI registration;
• FPI registrations granted at investment strategy level/sub fund level where a collective investment scheme or fund has
multiple investment strategies/sub-funds with identifiable differences and managed by a single investment manager;
• Multiple branches in different jurisdictions of foreign bank registered as FPIs;
• Government and Government related investors registered as Category 1 FPIs; and
• Entities registered as collective investment scheme having multiple share classes.
The Bids belonging to any of the above mentioned seven structures and having same PAN may be collated and identified as a
single Bid in the Bidding process. The Equity Shares allotted in the Bid may be proportionately distributed to the applicant FPIs
(with same PAN). In order to ensure valid Bids, FPIs making multiple Bids using the same PAN, and with different beneficiary
account numbers, Client IDs and DP IDs, are required to provide a confirma tion along with each of their Bid cum Application
Forms that the relevant FPIs making multiple Bids utilize any of the above-mentioned structures and indicate the name of their
respective investment managers in such confirmation. In the absence of such con firmation from the relevant FPIs, such multiple
Bids shall be rejected.
The FPIs who wish to participate in the Offer are advised to use the Bid cum Application Form for non-residents.
Bids by SEBI registered VCFs, AIFs and FVCIs
The SEBI AIF Regulations prescribe, amongst others, the investment restrictions on AIFs. Post the repeal of the Securities and
Exchange Board of India (Venture Capital Funds) Regulations, 1996, the VCFs which have not re -registered as an AIF under
the SEBI AIF Regulations shall continue to be regulated by the SEBI (Venture Capital Funds) Regulations, 1996 until the
existing fund or scheme managed by the fund is wound up.

344
Category I and II AIFs cannot invest more than 25% of the corpus in one investee compa ny. A category III AIF cannot invest
more than 10% of the corpus in one investee company. A VCF registered as a category I AIF, cannot invest more than one-
third of its investible funds, in the aggregate, in certain specified instruments, including by way of subscription to an initial
public offering of a venture capital undertaking. The holding in any company by VCF registered with SEBI should not exceed
25% of the corpus of the VCF. A VCF can invest only up to 33.33% of its investible funds, in the aggregate, in certain specified
instruments, which includes subscription to an initial public offering of a venture capital undertaking or an investee company
(as defined under the SEBI AIF Regulations).
Given the sector in which our Company operates, in accordance with the FEMA Rules and the FDI Policy, AIFs or VCFs whose
sponsor and manager are not Indian owned and controlled in terms of the FEMA Rules, FVCIs and multilateral and bilateral
development financial institutions are not permitted to participate in the Offer. As per the existing policy of the Government,
OCBs cannot participate in this Offer. For more information on bids by FPIs and Eligible NRIs, see “ Restrictions on Foreign
Ownership of Indian Securities” on page 354.
All non-resident investors should note that refunds (in case of Anchor Investors), dividends and other distributions, if any, will
be payable in Indian Rupees only and net of bank charges and commission.
Our Company, the Selling Shareholders or the BRLM shall not be responsible for loss, if any, incurred by the Bidder on account
of conversion of foreign currency.
Further, the shareholding of VCFs and category I AIFs or category II AIFs holding equity shares of a company prior to an init ial
public offering being undertaken by such company, shall be exempt from lock-in requirements, provided that such equity shares
shall be locked in for a period of at least one year from the date of purchase by the venture capital fund or alternative inv estment
fund or foreign venture capital investor.
There is no reservation for Eligible NRI Bidders, AIFs and FPIs. All Bidders will be treated on the same basis with other
categories for the purpose of Allocation.
All non-resident investors should note that refunds (in case of Anchor Investors), dividends and other distributions, if
any, will be payable in Indian Rupees only and net of bank charges and commission.
Our Company, the Selling Shareholders or the Book Running Lead Managers will not be responsible for loss, if any, incurred
by the Bidder on account of conversion of foreign currency.
Bids by limited liability partnerships
In case of Bids made by limited liability partnerships registered under the Limited Liability Partnership Act, 2008, as amended
a certified copy of certificate of registration issued under the Limited Liability Partnership Act, 2008, as amended, must be
attached to the Bid cum Application Form. Failing this, our Company in consultation with the Book Running Lead Managers
reserves the right to reject any Bid without assigning any reason thereof.
Bids by banking companies
In case of Bids made by banking companies registered with RBI, certified copies of: (i) the certificate of registration issue d by
RBI, and (ii) the approval of such banking company’s investment committee are required to be attached to the Bid cum
Application Form, failing which our Company in consultation with the Book Running Lead Managers reserves the right to
reject any Bid without assigning any reason.
The investment limit for banking companies in non-financial services companies as per the Banking Regulation Act, 1949
(“Banking Regulation Act”). and the Reserve Bank of India Master Direction (Financial Services provided by Banks)
Directions, 2016, is 10% of the paid-up share capital of the investee company, not being its subsidiary engaged in non -financial
services, or 10% of the banks’ own paid-up share capital and reserves, whichever is less. Further, the aggregate investment by
a banking company in subsidiaries and other entities engaged in financial and non -financial services company cannot exceed
20% of the bank’s paid-up share capital and reserves.
However, a banking company would be permitted to invest in excess of 10% but no t exceeding 30% of the paid-up share capital
of such investee company, subject to prior approval of the RBI, if (i) the investee company is engaged in non -financial activities
permitted for banking companies in terms of Section 6(1) of the Banking Regulation Act; (ii) the additional acquisition is
through restructuring of debt, or to protect the banking company’s interest on loans/investments made to a company; (iii) hold
along with its subsidiaries, associates or joint ventures or entities directly or indirectly controlled by the bank; and mutual funds
managed by asset management companies controlled by the bank, more than 20% of the investee company’s paid up share
capital engaged in non-financial services. However, this cap doesn’t apply to the cases ment ioned in (i) and (ii) above.
The banking company is required to submit a time-bound action plan for disposal of such shares within a specified period to
RBI. A banking company would require a prior approval of RBI to make investment in a non -financial services company in
excess of 10% of such investee company’s paid-up share capital as stated in para (i) above.

345
Bids by SCSBs
SCSBs participating in the Offer are required to comply with applicable law, including the terms of the SEBI circulars (Nos.
CIR/CFD/DIL/12/2012 a nd CIR/CFD/DIL/1/2013) dated September 13, 2012 and January 2, 2013. Such SCSBs are required
to ensure that for making applications on their own account using ASBA, they should have a separate account in their own
name with any other SEBI registered SCSBs. Further, such account shall be used solely for the purpose of making application
in public issues and clear demarcated funds should be availa ble in such account for such applications.
Bids by insurance companies
In case of Bids made by insurance companies registered with the IRDAI, a certified copy of certificate of registration issued by
IRDAI must be attached to the Bid cum Application Form. Failing this, our Company in consultation with the Book Running
Lead Managers reserve the right to reject any Bid without assigning any reason thereof.
The exposure norms for insurers are prescribed under the Insurance Regulatory and Development Authority (Investment)
Regulations, 2016, as amended (“IRDAI Investment Regulations”), based on investments in the equity shares of a company,
the entire group of the investee company and the industry sector in which the investee company operates. Bidders are advised
to refer to the IRDA Investment Regulations for specific investment limits applicable to them and shall comply with all
applicable regulations, guidelines and circulars issued by IRDAI from time to time.
Bids by provident funds/pension funds
In case of Bids made by provident funds/pension funds, subject to applicable laws, with minimum corpus of ₹250 million, a
certified copy of a certificate from a chartered accountant certifying the corpus of the provident fund/pension fund must be
attached to the Bid cum Application Form. Failing this, our Company in consultation with the Book Running Lead Managers
reserves the right to reject any Bid, without assigning any reason thereof.
Bids under Power of Attorney
In case of Bids made pursuant to a power of attorney or by limited companies, corporate bodies, registered societies, Eligib le
FPIs, Mutual Funds, insurance companies, insurance funds set up by the army, navy or air force of the India, insurance funds
set up by the Department of Posts, India or the National Investment Fund and provident funds with a minimum corpus of ₹250
million (subject to applicable law) and pension funds with a minimum corpus of ₹250 million, a certified copy of the power of
attorney or the relevant resolution or authority, as the case may be, along with a certified copy of the memorandum of association
and articles of association and/or bye laws must be lodged along with the Bid cum Application Form. Failing this, our Company
in consultation with the Book Running Lead Managers reserve the right to accept or reject any Bid in whole or in part, in either
case, without assigning any reason thereof.
Our Company in consultation with the Book Running Lead Managers in their absolute discretion, reserve the right to relax the
above condition of simultaneous lodging of the power of attorney along with the Bid cum Application Form subject to the terms
and conditions that our Company in consultation with the Book Running Lead Managers may deem fit.
Bids by Systemically Important Non-Banking Financial Companies
In case of Bids made by Systemically Important NBFCs registered with RBI, certified copies of: (i) the certificate of registration
issued by RBI, (ii) certified copy of its last audited financial statements on a standalone b asis and a net worth certificate from
its statutory auditor, and (iii) such other approval as may be required by the Systemically Important NBFCs, are required to be
attached to the Bid cum Application Form. Failing this, our Company in consultation with the Book Running Lead Managers,
reserves the right to reject any Bid without assigning any reason thereof. Systemically Important NBFCs participating in the
Offer shall comply with all applicable regulations, guidelines and circulars issued by RBI from time to time.
The investment limit for Systemically Important NBFCs shall be as prescribed by RBI from time to time.
Bids by Anchor Investors
In accordance with the SEBI ICDR Regulations, the key terms for participation by Anchor Investors are provided below:
1. Anchor Investor Application Forms will be made available for the Anchor Investor Portion at the offices of the BRLMs.
2. The Bid must be for a minimum of such number of Equity Shares so that the Bid Amount exceeds ₹100 million. A Bid
cannot be submitted for over 60% of the QIB Portion. In case of a Mutual Fund, separate Bids by individual schemes of a
Mutual Fund will be aggregated to determine the minimum application size of ₹100 million.
3. One-third of the Anchor Investor Portion will be reserved for allocation to domestic Mutual Funds.

346
4. Bidding for Anchor Investors will open one Working Day before the Bid/ Offer Opening Date.
5. Our Company in consultation with the Book Running Lead Managers will finalize allocation to the Anchor Investors on a
discretionary basis, provided that the minimum number of Allottees in the Anchor Investor Portion will not be less than: (a)
maximum of two Anchor Investors, where allocation under the Anchor Investor Portion is up to ₹100 million; (b) minimum
of two and maximum of 15 Anchor Investors, where the allocation under the Anchor Investor Portion is more than ₹100
million but up to ₹2,500 million, subject to a minimum Allotment of ₹50 million per Anchor Invest or; and (c) in case of
allocation above ₹2,500 million under the Anchor Investor Portion, a minimum of five such investors and a maximum of
15 Anchor Investors for allocation up to ₹2,500 million, and an additional 10 Anchor Investors for every additional ₹2,500
million, subject to minimum allotment of ₹50 million per Anchor Investor.
6. Allocation to Anchor Investors will be completed on the Anchor Investor Bidding Period. The number of Equity Shares
allocated to Anchor Investors and the price at which the a llocation will be made available in the public domain by the
BRLMs before the Bid/ Offer Opening Date, through intimation to the Stock Exchanges.
7. Anchor Investors cannot withdraw or lower the size of their Bids at any stage after submission of the Bid.
8. If the Offer Price is greater than the Anchor Investor Allocation Price, the additional amount being the difference between
the Offer Price and the Anchor Investor Allocation Price will be payable by the Anchor Investors on the Anchor Investor
Pay-in Date specified in the CAN. If the Offer Price is lower than the Anchor Investor Allocation Price, Allotment to
successful Anchor Investors will be at the higher price, i.e., the Anchor Investor Offer Price.
9. Equity Shares Allotted in the Anchor Investor Portion will be locked in for a period of 30 days from the date of Allotment.
10. Neither the (a) the BRLMs (s) or any associate of the BRLMs (other than mutual funds sponsored by entities which are
associate of the BRLMs or insurance companies promoted by entities which are associate of the BRLMs or AIFs sponsored
by the entities which are associates of the BRLMs or FPIs, other than individuals, corporate bodies and family offices,
sponsored by the entities which are associate of the BRLMs) nor (b) the Promoters, Pro moter Group or any person related
to the Promoters or members of the Promoter Group shall apply under the Anchor Investors category. Bids made by QIBs
under both the Anchor Investor Portion and the QIB Portion will not be considered multiple Bids.
In accordance with existing regulations issued by the RBI, OCBs cannot participate in the Offer.
The above information is given for the benefit of the Bidders. Our Company, the Selling Shareholders and the Book
Running Lead Managers are not liable for any amendments or modification or changes in applicable laws or regulations,
which may occur after the date of this Draft Red Herring Prospectus. Bidders are advised to make their independent
investigations and ensure that any single Bid from them does not exceed the applicable investment limits or maximum
number of the Equity Shares that can be held by them under applicable law or regulation or as specified in the Draft
Red Herring Prospectus, Red Herring Prospectus and the Prospectus.
In accordance with existing regulations issued by the RBI, OCBs cannot participate in the Offer.
Individuals or entities named on any of the following lists are prohibited from participating in the Offer:
(i) Specially designated nationals and blocked persons list and any other publicly available list of terrorists, terrorist
organisations, narcotics traffickers or other similarly proscribed parties, maintained by the U.S. Department of
Treasury’s Office of Foreign Assets Control or by any other department or agency of the govern ment of the United
States of America or the European Union;
(ii) lists promulgated by the United Nations Security Council or its committees pursuant to resolutions issued under
Chapter VII of the United Nations Charter;
(iii) (c) list, as updated from time to time, of persons of entities ineligible to be awarded a World Bank Group-financed
contract or otherwise sanctioned by the World Bank Group sanctions board for the period indicated on the list because
they were found to have violated the fraud and corruption provisions of the World Bank Group anti-corruption
guidelines and practices.
Information for Bidders
The relevant Designated Intermediary will enter a maximum of three Bids at different price levels opted in the Bid cum
Application Form and such options are not considered as multiple Bids. It is the Bidder’s responsibility to obtain the
acknowledgment slip from the relevant Designated Intermediary. The registration of the Bid by the Designated Intermediary
does not guarantee that the Equity Shares shall be allocated/Allotted. Such Acknowledgement Slip will be non-negotiable and
by itself will not create any obligation of any kind. When a Bidder revises his or her Bid, he/she shall surrender the earlie r
347
Acknowledgement Slip and may request for a revised acknowledgment slip from the relevant Designated Intermediary as proof
of his or her having revised the previous Bid.
In relation to electronic registration of Bids, the permission given by the Stock Exchanges to use their network and software of
the electronic bidding system should not in any way be deemed or construed to mean that the compliance with various statutory
and other requirements by our Company, the Selling Shareholders and/or the Book Running Lead Managers are cleared or
approved by the Stock Exchanges; nor does it in any manner warrant, certify or endorse the correctness or completeness of
compliance with the statutory and other requirements, nor does it take any responsibility for the financial or other soundnes s of
our Company, the management or any scheme or project of our Company; nor does it in any manner warrant, certify or endorse
the correctness or completeness of any of the contents of this Draft Red Herring Prospectus or the Red Herring Prospectus; no r
does it warrant that the Equity Shares will be listed or will continue to be listed on the Stock Exchanges.
General Instructions
Please note that QIBs and Non-Institutional Investors are not permitted to withdraw their Bid(s) or lower the size of their Bid(s)
(in terms of quantity of Equity Shares or the Bid Amount) at any stage. Retail Individual Bidders can revise their Bid(s) during
the Bid/Offer Period and withdraw their Bid(s) until Bid/Offer Closing Date. Anchor Investors are not allowed to withdraw or
lower the size of their Bids after the Anchor Investor Bid/Offer Period.
Do’s:
1. Check if you are eligible to apply as per the terms of the Red Herring Prospectus and under applicable law, rules,
regulations, guidelines and approvals. All Bidders (other than Anchor Investors) should submit their Bids through the
ASBA process only;
2. Ensure that you have Bid within the Price Band;
3. Read all the instructions carefully and complete the Bid cum Application Form in the prescribed form;
4. Ensure that you (other than the Anchor Investors) have mentioned the correct details of ASBA Account (i.e. bank
account number or UPI ID, as applicable) in the Bid cum Application Form if you are not an RIB bidding using the
UPI Mechanism in the Bid cum Application Form and if you are an RIB using the UPI Mechanism ensure that you
have mentioned the correct UPI ID (with maximum length of 45 characters including the handle), in the Bid cum
Application Form;
5. RIBs using UPI Mechanism through the SCSBs and mobile applications shall ensure that the name of the bank appears
in the list of SCSBs which are live on UPI, as displayed on the SEBI website. RIBs shall ensure that the name of the
app and the UPI handle which is used for making the application appears in Annexure ‘A’ to the SEBI circular no.
SEBI/HO/CFD/DIL2/COR/P/2019/85 dated July 26, 2019;
6. Ensure that your Bid cum Application Form bearing the stamp of a Designated Intermediary is submitted to the
Designated Intermediary at the Bidding Centre within the prescribed time. RIBs using UPI Mechanism, may submit
their ASBA Forms with Syndicate, sub-Syndicate Members, Registered Brokers, RTA or CDP;
7. Ensure that you have funds equal to the Bid Amount in the ASBA Account maintained with the SCSB, before
submitting the ASBA Form to any of the Designated Intermediaries. Ensure that you use only your own bank account
linked UPI ID (only for RIBs using the UPI Mechanism) to make an application in the Offer;
8. If the first Bidder is not the bank account holder, ensure that the Bid cum Application Form is signed by the account
holder. Ensure that you have an account with an SCSB and have mentioned the correct bank account number in the
Bid cum Application Form (for all Bidders other than RIBs bidding using the UPI Mechanism);
9. Ensure that the signature of the First Bidder in case of joint Bids, is included in the Bid cum Application Forms;
10. Ensure that you request for and receive a stamped acknowledgement counterfoil or acknowledgment specifying the
application number as a proof of having accepted Bid cum Application Form for all your Bid options from the
concerned Designated Intermediary;
11. Ensure that the name(s) given in the Bid cum Application Form is/are exactly the same as the name(s) in which the
beneficiary account is held with the Depository Participant. In case of joint Bids, the Bid cum Application Form should
contain only the name of the First Bidder whose name should also appear as the first holder of the beneficiary account
held in joint names. Ensure that the signature of the First Bidder is included in the Bid cum Applicat ion Forms;
12. RIBs bidding in the Offer to ensure that they shall use only their own ASBA Account or only their own bank account
linked UPI ID (only for RIBs using the UPI Mechanism) to make an application in the Offer and not ASBA Account
or bank account linked UPI ID of any third party;

348
13. Ensure that you submit the revised Bids to the same Designated Intermediary, through whom the original Bid was
placed and obtain a revised acknowledgment;
14. Ensure that you have correctly signed the authorisation/undertaking box in the Bid cum Application Form, or have
otherwise provided an authorisation to the SCSB or Sponsor Bank, as applicable, via the electronic mode, for blocking
funds in the ASBA Account equivalent to the Bid Amount mentioned in the Bid cum Application Form, as the case
may be, at the time of submission of the Bid. In case of RIBs submitting their Bids and participating in the Offer
through the UPI Mechanism, ensure that you authorise the UPI Mandate Request, including in case of any revision of
Bids, raised by the Sponsor Bank for blocking of funds equivalent to Bid Amount and subsequent debit of funds in
case of Allotment;
15. Except for Bids (i) on behalf of the Central or State Governments and the officials appointed by the courts, who, in
terms of the SEBI circular no. MRD/Dop/Cir-20/2008 dated June 30, 2008, may be exempt from specifying their PAN
for transacting in the securities market, (ii) submitted by investors who are exempt from the requirement of
obtaining/specifying their PAN for transacting in the securities market, and (iii) Bids by persons resident in the state
of Sikkim, who, in terms of a SEBI circular no. MRD/DoP/SE/Cir- 8 /2006 dated July 20, 2006, may be exempted
from specifying their PAN for transacting in the securities market, all Bidders should mention their PAN allotted under
the IT Act. The exemption for the Central or the State Government and officials appointed by the courts and for
investors residing in the State of Sikkim is subject to (a) the Demographic Details received from the respective
depositories confirming the exemption granted to the beneficiary owner by a suitable description in the PAN field and
the beneficiary account remaining in “active status”; and (b) in the case of residents of Sikkim, the address as per the
Demographic Details evidencing the same. All other applications in which PAN is not mentioned will be rejected;
16. Ensure that the Demographic Details are updated, true and correct in all respects;
17. Ensure that thumb impressions and signatures other than in the languages specified in the Eighth Schedule to the
Constitution of India are attested by a Magistrate or a Notary Public or a Special Executive Magistrate under official
seal;
18. Ensure that the category and the investor status is indicated in the Bid cum Application Form to ensure proper upload
of your Bid in the electronic Bidding system of the Stock Exchanges;
19. Ensure that in case of Bids under power of attorney or by limited companies, corporates, trust, etc., relevant documents
are submitted;
20. Ensure that Bids submitted by any person resident outside India is in compliance with applicable foreign and Indian
laws;
21. Since the Allotment will be in demat form only, ensure that the Bidder’s depository account is active, the correct DP
ID, Client ID, the PAN, UPI ID, if applicable, are mentioned in their Bid cum Application Form and that the name of
the Bidder, the DP ID, Client ID, the PAN and UPI ID, if applicable, entered into the online IPO system of the Stock
Exchanges by the relevant Designated Intermediary, as applicable, matches with the name, DP ID, Client ID, PAN
and UPI ID, if applicable, available in the Depository database;
22. Ensure that when applying in the Offer using UPI, the name of your SCSB appears in the list of SCSBs displayed on
the SEBI website which are live on UPI. Further, also ensure that the name of the app and the UPI handle being used
for making the application is also appearing in Annexure ‘A’ to the SEBI circular no.
SEBI/HO/CFD/DIL2/CIR/P/2019/85 dated July 26, 2019;
23. RIBs who wish to revise their Bids using the UPI Mechanism, should submit the revised Bid with the Designated
Intermediaries, pursuant to which RIBs should ensure acceptance of the UPI Mandate Request received from the
Sponsor Bank to authorise blocking of funds equivalent to the revised Bid Amount in the RIB’s ASBA Account;
24. Ensure that you have accepted the UPI Mandate Request received from the Sponsor Bank prior to 12:00 p.m. of the
Working Day immediately after the Bid/ Offer Closing Date;
25. FPIs making MIM Bids using the sa me PAN, and different beneficiary account numbers, Client IDs and DP IDs, are
required to submit a confirmation that their Bids are under the MIM structure and indicate the name of their investment
managers in such confirmation which shall be submitted along with each of their Bid cum Application Forms. In the
absence of such confirmation from the relevant FPIs, such MIM Bids shall be rejected;
26. RIBs shall ensure that details of the Bid are reviewed and verified by opening the attachment in the UPI Mandate
Request and then proceed to authorise the UPI Mandate Request using his/her UPI PIN. Upon the authorisation of the
mandate using his/her UPI PIN, an RIB may be deemed to have verified the attachment containing the application
details of the RIB in the UPI Mandate Request and have agreed to block the entire Bid Amount and authorised the
Sponsor Bank to block the Bid Amount mentioned in the Bid Cum Application Form; and

349
27. Ensure that while Bidding through a Designated Intermediary, the Bid cum Application Form (other than for Anchor
Investors and RIBs bidding using the UPI Mechanism) is submitted to a Designated Intermediary in a Bidding Centre
and that the SCSB where the ASBA Account, as specified in the ASBA Form, is maintained has named at least one
branch at that location for the Designated Intermediary to deposit ASBA Forms (a list of such branches is available on
the website of SEBI at www.sebi.gov.in).
The Bid cum Application Form is liable to be rejected if the above instructions, as applicable, are not co mplied with. Application
made using incorrect UPI handle or using a bank account of an SCSB or SCSBs which is not mentioned in the Annexure ‘A’
to the SEBI circular no. SEBI/HO/CFD/DIL2/CIR/P/2019/85 dated July 26, 2019 is liable to be rejected.
Don’ts:
1. Do not Bid for lower than the minimum Bid size;
2. Do not pay the Bid Amount in cheques, demand drafts or by cash, money order, postal order or by stock invest;
3. Do not send Bid cum Application Forms by post; instead submit the same to the Designated Intermediary only;
4. Do not Bid at Cut-off Price (for Bids by QIBs and Non-Institutional Bidders);
5. Do not instruct your respective banks to release the funds blocked in the ASBA Account under the ASBA process;
6. Do not submit the Bid for an amount more than funds availab le in your ASBA account;
7. Do not submit Bids on plain paper or on incomplete or illegible Bid cum Application Forms or on Bid cum Application
Forms in a colour prescribed for another category of a Bidder;
8. Do not instruct your respective banks to release the funds blocked in the ASBA Account under the ASBA process;
9. If you are a RIB and are using UPI mechanism, do not submit more than one Bid cum Application Form for each UPI
ID;
10. Anchor Investors should not Bid through the ASBA process;
11. Do not submit the ASBA Forms to any Designated Intermediary that is not authorised to collect the relevant ASBA
Forms or to our Company;
12. Do not Bid on a Bid cum Application Form that does not have the stamp of the relevant Designated Intermediary;
13. Do not submit the General Index Register (GIR) number instead of the PAN;
14. Do not submit incorrect details of the DP ID, Client ID, PAN and UPI ID, if applicable, or provide details for a
beneficiary account which is suspended or for which details cannot be verified by the Registrar to the Offer;
15. Do not submit a Bid in case you are not eligible to acquire Equity Shares under applicable law or your relevant
constitutional documents or otherwise;
16. Do not Bid if you are not competent to contract under the Indian Contract Act, 1872 (other than minors having valid
depository accounts as per Demographic Details provided by the depository);
17. Do not submit a Bid/revise a Bid Amount, with a price less than the Floor Price or higher than the Cap Price;
18. Do not submit a Bid using UPI ID, if you are not a RIB;
19. Do not Bid on another Bid cum Application Form or the Anchor Investor Application Form, as the case may be, after
you have submitted a Bid to any of the Designa ted Intermediaries after you have submitted a Bid to the Designated
Intermediary;
20. Do not Bid for Equity Shares more than what is specified by respective Stock Exchange for each category;
21. If you are a QIB, do not submit your Bid after 3 p.m. on the QIB Bid/Offer Closing Date;
22. Do not fill up the Bid cum Application Form such that the Equity Shares Bid for, exceeds the Offer size and/or
investment limit or maximum number of the Equity Shares that can be held under applicable laws or regulations or
maximum amount permissible under applicable laws or regulations, or under the terms of the Red Herring Prospectus;
350
23. Do not withdraw your Bid or lower the size of your Bid (in terms of quantity of the Equity Shares or the Bid Amount)
at any stage, if you are a QIB or a Non-Institutional Bidder. Retail Individual Bidders can revise or withdraw their
Bids on or before the Bid/Offer Closing Date;
24. Do not submit Bids to a Designated Intermediary at a location other than Specified Locations. If you are RIB and are
using UPI Mechanism, do not submit the ASBA Form directly with SCSBs;
25. If you are an RIB which is submitting the ASBA Form with any of the Designated Intermediaries and using your UPI
ID for the purpose of blocking of funds, do not use any third party bank account or third party linked bank account
UPI ID;
26. Do not Bid if you are an OCB;
27. RIBs Bidding through the UPI Mechanism using the incorrect UPI handle or using a bank account of an SCSB and/
or mobile applications which is not mentioned in the list provided on the SEBI website is liable to be rejected;
28. Do not submit the Bid cum Application Forms to any non-SCSB bank; and
29. Do not submit a Bid cum Application Form with third party ASBA Bank Account or UPI ID (in case of Bids submitted
by RIB Bidder using the UPI Mechanism).
The Bid cum Application Form is liable to be rejected if the above instructions, as applicable, are not complied with.
Further, in case of any pre-Offer or post Offer related issues regarding share certificates/demat credit/refund orders/unblocking
etc., investors can reach out to our Company Secretary and Compliance Officer. For details of our Company Secretary and
Compliance Officer, see “General Information” beginning on page 61.
For helpline details of the Book Running Lead Managers pursuant to the SEBI/HO.CFD.DIL2/CIR/P/2021/2480/1/M dated
March 16, 2021, see “General Information -Book Running Lead Managers” on page 61.
Names of entities responsible for finalising the basis of allotment in a fair and proper manner
The authorised employees of the Designated Stock Exchange, along with the Book Running Lead Managers and the Registrar,
shall ensure that the Basis of Allotment is finalised in a fair and proper manner in accordance with the procedure specified in
SEBI ICDR Regulations.
Method of allotment as may be prescribed by SEBI from time to time
Our Company will not make any allotment in excess of the Equity Shares through the Red Herring Prospectus and the
Prospectus except in case of oversubscription for the purpose of rounding o ff to make allotment, in consultation with the
Designated Stock Exchange.
The allotment of Equity Shares to applicants other than to the Retail Individual Bidders and Anchor Investors shall be on a
proportionate basis within the respective investor categories and the number of securities allotted shall be rounded off to the
nearest integer, subject to minimum allotment being equal to the minimum application size as determined and disclosed.
The allotment of Equity Shares to each Retail Individual Bidders shall not be less than the minimum bid lot, subject to the
availability of shares in Retail Individual Bidders Portion, and the remaining available Equity Shares, if any, shall be allo tted
on a proportionate basis.
Payment into Escrow Account(s) for Anchor Investors
Our Company in consultation with the Book Running Lead Managers, in their absolute discretion, will decide the list of Anchor
Investors to whom the CAN will be sent, pursuant to which the details of the Equity Shares allocated to them in their re spective
names will be notified to such Anchor Investors. For Anchor Investors, the payment instruments for payment into the Escrow
Account(s) should be drawn in favour of:
(a) In case of resident Anchor Investors: “[●]”
(b) In case of Non-Resident Anchor Investors: “[●]”
Anchor Investors should note that the escrow mechanism is not prescribed by SEBI and has been established as an arrangement
between our Company, the Selling Shareholders and the Syndicate, the Escrow Collection Bank and the Registrar to the Offer
to facilitate collections of Bid amounts from Anchor Investors.
Pre-Offer Advertisement

351
Subject to Section 30 of the Companies Act, our Company shall, after filing the Red Herring Prospectus with the RoC, publish
a pre-Offer advertisement, in the form prescribed by the SEBI ICDR Regulations, in: (i) all editions of [●], an English national
daily newspaper, all editions of [●], a Hindi national daily newspaper and regional edition of [●], a Marathi newspaper, Marathi
being the regional language of Maharashtra, where our Registered Office is located, each with wide circulation.
In the pre-Offer advertisement, we shall state the Bid/Offer Opening Date and the Bid/Offer Closing Date. This advertisement,
subject to the provisions of Section 30 of the Companies Act, shall be in the format prescribed in Part A of Schedule X of the
SEBI ICDR Regulations.
Allotment Advertisement
Our Company, the Book Running Lead Managers and the Registrar shall publish an advertisement in relation to Allotment
before commencement of trading, disclosing the date of commencement of trading of the Equity Shares, in [●] editions of [●],
an English national daily newspaper, [●] editions of [●], a Hindi national daily newspaper and [●] editions of [●], a Marathi
newspaper, Marathi being the regional language of Maharashtra, where our Registered Office is located, each with wide
circulation.
The above information is given for the benefit of the Bidders/applicants. Our Company , the Selling Shareholders and
the members of the Syndicate are not liable for any amendments or modification or changes in applicable laws or
regulations, which may occur after the date of this Draft Red Herring Prospectus. Bidders/applicants are advised to
make their independent investigations and ensure that the number of Equity Shares Bid for do not exceed the prescribed
limits under applicable laws or regulations.
Signing of the Underwriting Agreement and the RoC Filing
(a) Our Company, the Selling Shareholders and the Underwriters intend to enter into an Underwriting Agreement on or
immediately after the finalisation of the Offer Price but prior to the filing of Prospectus.
(b) After signing the Underwriting Agreement, an updated Red Herring Prospectus will be filed with the RoC in
accordance with applicable law, which then would be termed as the ‘Prospectus’. The Prospectus will contain details
of the Offer Price, the Anchor Investor Offer Price, Offer size, and underwriting arrangements and will be complete
in all material respects.
Undertakings by our Company
Our Company undertakes the following:
• adequate arrangements shall be made to collect all Bid cum Application Forms submitted by Bidders (including
Anchor Investor Application Form from Anchor Investors);
• the complaints received in respect of the Offer shall be attended to by our Company expeditiously and satisfactorily;
• all steps for completion of the necessary formalities for listing and commencement of trading at all the Stock
Exchanges where the Equity Shares are proposed to be listed shall be taken within six Working Days of the Bid /Offer
Closing Date or such other period as may be prescribed by the SEBI;
• if Allotment is not made within the prescribed time period under applicable law, the entire subscription amount
received will be refunded/unblocked within the time prescribed under applicable law. If there is delay beyond the
prescribed time, our Company shall pay interest prescribed under the Companies Act, the SEBI ICDR Regulations
and applicable law for the delayed period;
• it shall not offer any incentive, whether direct or indirect, in any manner, whether in cash or kind or services or
otherwise to the Bidder for making a Bid in the Offer, and shall not make any payment, direct or indirect, in the nature
of discounts, commission, allowance or otherwise to any person who makes a Bid in the Offer, except for fees or
commission for services rendered in relation to the Offer;
• the funds required for making refunds (to the extent applicable) as per the mode(s) disclosed shall be made available
to the Registrar to the Offer by our Company;
• where refunds (to the extent applicable) are made through electronic transfer of funds, a suitable communication shall
be sent to the applicant within the time prescribed under applicable law, giving details of the bank where refunds shall
be credited along with amount and expected date of electronic credit of refund;
• If our Company in consultation with the Book Running Lead Managers withdraws the Offer after the Bid/Offer Closing
Date and thereafter determines that it will proceed with an issue of the Equity Shares, our Company shall file a fresh
draft red herring prospectus with SEBI.
352
Undertakings by the Selling Shareholders
The Selling Shareholders undertake that:
• the Equity Shares offered by it in the Offer for Sale are eligible for being offered in the Offer for Sale in terms of
Regulation 8 of the SEBI ICDR Regulations and shall be in dematerialized form at the time of transfer;
• it shall not offer, lend, pledge, charge, transfer or otherwise encumber, sell, dispose of any the Offered Shares until
such time that the lock-in (if applicable) remains effective save and except as may be permitted under the SEBI ICDR
Regulations;
• it shall provide reasonable assistance to our Company and the Book Running Lead Managers in redressal of such
investor grievances in relation to the Offered Shares and statements specifically made or confirmed by it in relation to
itself as a Selling Shareholder;
• it shall provide reasonable cooperation to our Company in relation to the Offered Shares, (a) for the completion of the
necessary formalities for listing and commencement of trading at the Stock Exchanges, and/ or (b) refund orders (if
applicable); and
• it shall not have recourse to the proceeds of the Offer until final approval for trading of the Equity Shares from the
Stock Exchanges has been received.
The decisions with respect to the Price Band, the minimum Bid lot, revision of Price Band, Offer Price will be taken by our
Company in consultation with the Book Running Lead Managers. The Offer Price will be decided by our Company in
consultation with the Book Running Lead Managers, on the Pricing Date in accordance with the Book Building Process and
the Red Herring Prospectus.
Only the statements and undertakings in relation to the Selling Shareholders and the Offered Shares which are specifically
“confirmed” or “undertaken” by it in this Draft Red Herring Prospectus, shall be deemed to b e “statements and undertakings
specifically confirmed or undertaken” by the Selling Shareholders. All other statements and/ or undertakings in this Draft Red
Herring Prospectus shall be statements and undertakings made by our Company even if the same relat es to the Selling
Shareholder.
Utilisation of Offer Proceeds
Our Board certifies that:
• all monies received out of the Fresh Issue shall be credited/transferred to a separate bank account other than the bank
account referred to in sub-section (3) of Section 40 of the Companies Act;
• details of all monies utilised out of the Offer shall be disclosed, and continue to be disclosed till the time any part of
the Fresh Issue proceeds remains unutilised, under an appropriate head in the balance sheet of our Company indicating
the purpose for which such monies have been utilised; and
• details of all unutilized monies out of the Fresh Issue, if any shall be disclosed under an appropriate separate head in
the balance sheet indicating the form in which such unutilized monies have been invested.
Impersonation
Attention of the Bidders is specifically drawn to the provisions of sub-section (1) of Section 38 of the Companies Act which is
reproduced below:
“Any person who—
(a) makes or abets making of an application in a fictitious name to a company for acquiring, or subscribing for, its
securities; or
(b) makes or abets making of multiple applications to a company in different names or in different combinations of his
name or surname for acquiring or subscribing for its securities; or
(c) otherwise induces directly or indirectly a company to allot, or register any transfer of, securities to him, or to any
other person in a fictitious name,
shall be liable for action under Section 447.”
The liability prescribed under Section 447 of the Companies Act for fraud involving an amount of at least ₹ 1 million or 1% of

353
the turnover of the company, whichever is lower, includes imprisonment for a term which shall not be less than six months
extending up to 10 years and fine of an amount not less than the amount involved in the fraud, extending up to three times su ch
amount (provided that where the fraud involves public interest, such term shall not be less than three years.) Further, where the
fraud involves an amount less than ₹ 1 million or one per cent of the turnover of the company, whichever is lower, and does
not involve public interest, any person guilty of such fraud shall be punishable with imprisonment for a term which may extend
to five years or with fine which may extend to ₹ 5 million or with both.
The Equity Shares have not been and will not be registered under the U.S. Securities Act or any other applicable law of
the United States and, unless so registered, may not be offered or sold within the United States, except pursuant to an
exemption from, or in a transaction not subject to, the registration requirements of the U.S. Securities Act and applicable
state securities laws. Accordingly, the Equity Shares are only being offered and sold (i) within the United States only to
persons reasonably believed to be “qualified institutional buyers” (as defined in Rule 144A under the U.S. Securities Act
and referred to in this Draft Red Herring Prospectus as “U.S. QIBs”) in transactions exempt from, or not subject to,
the registration requirements of the U.S. Securities Act, and (ii) outside the United States in offshore transactions in
compliance with Regulation S under the U.S. Securities Act and the applicable laws of the jurisdiction where those offers
and sales occur. For the avoidance of doubt, the term “U.S. QIBs” does not refer to a category of institutional investors
defined under applicable Indian regulations and referred to in this Draft Red Herring Prospectus as “QIBs”.
The Equity Shares have not been and will not be registered, listed or otherwise qualified in any other jurisdiction
outside India and may not be offered or sold, and Bids may not be made by persons in any such jurisdiction, except in
compliance with the applicable laws of such jurisdiction.

354
RESTRICTIONS ON FOREIGN OWNERSHIP OF INDIAN SECURITIES
Foreign investment in Indian securities is regulated through the Industrial Policy, 1991 of the Go vernment of India and FEMA.
While the Industrial Policy, 1991 prescribes the limits and the conditions subject to which foreign investment can be made in
different sectors of the Indian economy, FEMA regulates the precise manner in which such investment ma y be made. Under
the Industrial Policy, unless specifically restricted, foreign investment is freely permitted in all sectors of the Indian ec onomy
up to any extent and without any prior approvals, but the foreign investor is required to follow certain pre scribed procedures
for making such investment. The RBI and the concerned ministries/departments are responsible for granting approval for
foreign investment. The Government has from time to time made policy pronouncements on foreign direct investment (“ FDI”)
through press notes and press releases. The DPIIT issued the Consolidated FDI Policy Circular of 2020 (“ Consolidated FDI
Policy”), which, with effect from October 15, 2020 consolidated and superseded all previous press notes, press releases,
circulars and clarifications on FDI issued by DPIIT that were in force and effect as on October 15, 2020. The Consolidated FDI
Policy will be valid until the DPIIT issues an updated circular.
The transfer of shares between an Indian resident and a non-resident does not require the prior approval of the RBI, provided
that (i) the activities of the investee company are under the automatic route under the FDI Policy and transfer does not attract
the provisions of the Takeover Regulations; (ii) the non-resident shareholding is within the sectoral limits under the FDI policy;
and (iii) the pricing is in accordance with the guidelines prescribed by the SEBI/RBI.
Foreign Exchange Laws
The foreign investment in our Company is governed by inter alia the FEMA, as amended, the FEMA Non-debt Instruments
Rules, the FDI Policy issued and amended by way of press notes.
In terms of the FEMA Non-debt Instruments Rules, a person resident outside India may make investments into India, subject
to certain terms and conditions, and provided that an entity of a country, which shares land border with India or the benefic ial
owner of an investment into India who is situated in or is a citizen of any such country, shall invest only with government
approval.
Our Company operates a large omni-channel, hyperlocal retail network and operates in the multi -brand retail trading sector.
While, in terms of the FEMA Non-debt Instruments Rules and the FDI Policy, FDI up to 51% is permitted in the multi brand
retail trading sector, we require the prior approval of the Government to receive such FDI and are also required to meet cert ain
conditionalities set out in the FEMA Non-debt Instruments Rules and the FDI Policy. Further, one of our Subsidiaries, Wellness
Forever HealthTech Private Limited operates our website and e-commerce business (inventory based), a sector in which foreign
investment is prohibited.
As on date, our Company is a company owned and controlled by Indian residents within the meaning of the FEMA Non-debt
Instruments Rules and the FDI Policy. Accordingly, so long as our Company remains owned and controlled by Indian residents,
any foreign investment in our Company will not be considered to be ‘indirect’ or ‘downstream’ foreign investment in our
Subsidiaries. However, since our Subsidiaries undertake businesses where FDI is permitted through the Approval Route or
where FDI is not permitted, the total foreign investment in our Company must be less than 50% of our Company’s share capital,
and non-residents cannot be deemed to own or control our Company.
In accordance with the FEMA Non-debt Instruments Rules, participation by non-residents in the Offer is restricted to
participation by (i) FPIs under Schedule II of the FEMA Non-debt Instruments Rules, in the Offer subject to limit of the
individual holding of an FPI below 10% of the post-Offer paid-up capital of our Company on a fully diluted basis and the
aggregate limit for FPI investment currently not exceeding 49.99% of the paid-up capital on a fully diluted basis or the sectoral
or statutory cap, whichever is lower, as the case may be, if such investment does not result in transfer of ownership and con trol
to such FPIs; and (ii) Eligible NRIs only on non-repatriation basis under Schedule IV of the FEMA Non-debt Instruments Rules.
Further, other non-residents such as AIFs or VCFs whose sponsor and manager are not Indian owned and controlled in terms
of the FEMA Rules, FVCIs, multilateral and bilateral development financial institutions are not permitted to participate in the
Offer. For details, see “Risk Factors - Our ability to raise foreign capital may be constrained by Indian law, including in relation
to the Offer.” on page 52.
As per the existing policy of the Government, OCBs cannot participate in this Offer.
For more information on bids by FPIs and Eligible NRIs, see “Offer Procedure” on page 338.
The transfer of shares between an Indian resident and a non-resident does not require the prior approval of the RBI, provided
that (i) the activities of the investee company are under the automatic route under the Consolidated FDI Policy and transfer does
not attract the provisions of the Takeover Regulations; (ii) the non-resident shareholding is within the sectoral limits under the
FDI policy; and (iii) the pricing is in accordance with the guidelines prescribed by the SEBI and RBI.
Further, in accordance with Press Note No. 3 (2020 Series), dated April 17, 2020 issued by the DPIIT and the Foreign Exchange
Management (Non-debt Instruments) Amendment Rules, 2020 which came into effect from April 22, 2020, any investment,
subscription, purchase or sale of equity instruments by entities of a country which shares land border with India or where the

355
beneficial owner of an investment into India is situated in or is a citizen of any such country (“ Restricted Investors”), will
require prior approval of the Government, as prescribed in the Consolidated FDI Policy and the FEMA Rules. Further, in the
event of transfer of ownership of any existing or future foreign direct investment in an entity in India, directly or indirec tly,
resulting in the beneficial ownership falling within the aforesaid restriction/ purview, such subsequent change in the beneficial
ownership will also require approval of the Government. Furthermore, on April 22, 2020, the Ministry of Finance, Government
of India has also made a similar amendment to the FEMA Rules. Pursuant to the Foreign Exchange Management (Non-debt
Instruments) (Fourth Amendment) Rules, 2020, a multilateral bank or fund, of which India is a member, shall not be treated as
an entity of a particular country nor shall any country be treated as the beneficial owner of the investments of such bank of fund
in India. Each Bidder should seek independent legal advice about its ability to participate in the Offer. In the event such p rior
approval of the Government of India is required, and such approval has been obtained, the Bidder shall intimate our Company
and the Registrar to the Offer in writing about such approval along with a copy thereof within the Offer Period.
The Equity Shares have not been and will not be registered under the U.S. Securities Act of 1933, as amended (the “U.S.
Securities Act”) or with any state securities regulatory authority of any state or other jurisdiction of the United States
(as defined in Regulation S under the U.S. Securities Act (“Regulation S”) except pursuant to an exemption from, or in
a transaction not subject to, the registration requirements of the U.S. Securities Act, the applicable securities laws of all
states and other jurisdictions of the United States. Accordingly, the Equity Shares are only be ing offered and sold (i)
within the United States only to persons reasonably believed to be “qualified institutional buyers” (as defined in Rule
144A under the U.S. Securities Act and referred to in this Draft Red Herring Prospectus as “U.S. QIBs”) in transactions
exempt from, the registration requirements of the U.S. Securities Act, and (ii) outside the United States in “offshore
transactions” in reliance on Regulation S under the U.S. Securities Act and the applicable laws of the jurisdiction where
those offers and sales occur. For the avoidance of doubt, the term “U.S. QIBs” does not refer to a category of institutional
investor defined under applicable Indian regulations and referred to in this Draft Red Herring Prospectus as “QIBs”.
The Equity Shares have not been and will not be registered, listed or otherwise qualified in any other jurisdiction outside
India and may not be offered or sold, and Bids may not be made by persons in any such jurisdiction, except in compliance
with the applicable laws of such jurisdiction.
The above information is given for the benefit of the Bidders. Our Company, the Selling Shareholders and the Book Running
Lead Managers are not liable for any amendments or modification or changes in applicable laws or regulations, which ma y
occur after the date of this Draft Red Herring Prospectus. Bidders are advised to make their independent investigations and
ensure that the number of Equity Shares Bid for do not exceed the applicable limits under laws or regulations.

356
SECTION VIII: DESCRIPTION OF EQUITY SHARES AND TERMS OF ARTICLES OF ASSOCIATION
Capitalised terms used in this section have the meaning that has been given to such terms in the Articles of Association of o ur
Company. Pursuant to Schedule I of the Companies Act, and the SEBI ICDR Regulations, the main provisions of the Articles
of Association of our Company are detailed below.
Share Capital
Article 5 provides that “The authorised share capital of the Company shall be such amount, divided into such class(es)
denomination(s) and number of shares in the Company as stated in Clause V of the Memorandum of Association, with power
to increase or reduce such capital from time to time and power to divide the shares in the capital for the time being into ot her
classes and to attach thereto respectively such preferential, convertible, deferred, qualified, or other special rights, privileges,
conditions or restrictions and to vary, modify or abrogate the same in such manner as may be determined by or in accordance
with the Articles of the Company subject to the provisions of applicable law for the time being in force.”
Article 6 provides that “Except so far as otherwise provided by the conditions of issue or by these Articles, any capital raised
by the creation of new sha res shall be considered as part of the existing capital, and shall be subject to the provisions herein
contained, with reference to the payment of calls and instalments, forfeiture, lien, surrender, transfer and transmission, vo ting
and otherwise.”
Article 9 provides that “The Board of Directors may issue and allot shares of the Company as payment or part payment in full
or in part for any property purchased by the Company or in respect of goods sold or transferred or machinery or appliances
supplied or for services rendered to the Company in the acquisition and/or in the conduct of its business; and any shares which
may be so allotted may be issued as fully paid up shares and if so issued shall be deemed as fully paid up shares.”
Sub-Division, Consolidation and Cancellation of Share Certificate
Article 10 provides that “Subject to the provisions of the Act, the Company in its General Meetings may, by an Ordinary
Resolution, from time to time:
(a) increase the share capital by such sum, to be divided into shares of such amount as it thinks expedient;
(b) divide, sub-divide or consolidate its shares, or any of them, and the resolution whereby any share is sub -divided, may
determine that as between the holders of the shares resulting from such sub-division one or more of such shares have
some preference or special advantage in relation to dividend, capital or otherwise as compared with the others;
(c) cancel shares which at the date of such General Meeting have not been taken or agreed to be taken by any person and
diminish the amount of its share capital by the amount of the shares so cancelled;
(d) consolidate and divide all or any of its share capital into shares of larger amount than its existing shares; provided that
any consolidation and division which results in cha nges in the voting percentage of Members shall require applicable
approvals under the Act; and
(e) convert all or any of its fully paid-up shares into stock, and reconvert that stock into fully paid -up shares of any
denomination.”
Commission for placing shares, debentures, etc.
Article 25 provides that:
(a) “Subject to the provisions of the Act and other applicable laws, the Company may at any time pay a commission to
any person for subscribing or agreeing to subscribe (whether absolutely or conditionally) to any shares or debentures
of the Company or underwriting or procuring or agreeing to procure subscriptions (whether absolute or conditional)
for shares or debentures of the Company and provisions of the Act shall apply.
(b) The Company may also, in any issue, pay such brokerage as may be lawful.
(c) The commission may be satisfied by the payment of cash or the allotment of fully or partly paid shares or partly in the
one way and partly in the other.”
Calls on shares
Article 34 provides that “The Board may subject to the provisions of the Act and any other applicable law, from time to time,
make such call as it thinks fit upon the Members in respect of all moneys unpaid on the shares (whether on account of the
nominal value of the shares or by premium) and not by the conditions of allotment thereof made payable at fixed times. Provided
that no call shall exceed one-fourth of the nominal value of the share or be payable at less than one month from the date fixed
for the payment of the last preceding call. A call may be revoked or postponed at the discretion of the Board. The power to call

357
on shares shall not be delegated to any other person except with the approval of the shareholders in a General Meeting and as
may be permitted by law.”
Article 35 provides that “Each Member shall, subject to receiving at least fourteen (14) days’ notice specifying the time or times
and place of payment, pay to the Company, at the time or times and place so specified, the amount called on his shares.
The Board may, from time to time, at its discretion, extend the time fixed for the payment of any call in respect of one or more
Members as the Board may deem appropriate in any circumstances.”
Article 36 provides that “The Board of Directors may, when making a call by resolution, determine the date on which such call
shall be deemed to have been made, not being earlier than the date of resolution making such call, and thereupon the call sha ll
be deemed to have been made on the date so determined and if no such date is so determined a call shall be deemed to have
been made at the date when the resolution authorizing such call was passed at the meeting of the Board and may be required to
be paid in installments.”
Forfeiture of shares
Article 43 provides that “If a Member fails to pay any call, or instalment of a call or any money due in respect of any share, on
the day appointed for payment thereof, the Board may, at any time thereafter during such time as any part of the call or
instalment remains unpaid or a judgment or decree in respect thereof remains unsatisfied in whole or in part, serve a notice on
him requiring payment of so much of the call or installment or other money as is unpaid, together with any interest which may
have accrued and all expenses that may have been incurred by the Compan y by reason of non-payment.”
Article 44 provides that “The notice aforesaid shall:
(a) name a further day (not being earlier than the expiry of fourteen days from the date of services of the notice) on or
before which the payment required by the notice is to be made; and
(b) state that, in the event of non-payment on or before the day so named, the shares in respect of which the call was made
shall be liable to be forfeited.
If the requirements of any such notice as aforesaid are not complied with, any share in respect of which the notice has
been given may, at any time thereafter, before the payment required by the notice has been made, be forfeited by a
resolution of the Board to that effect.”
Article 45 provides that “Neither a judgment nor a decree in favour of the Company for calls or other moneys due in respect of
any shares nor any part payment or satisfaction thereof nor the receipt by the Company of a portion of any money which shall
from time to time be due from any Member in respect of any shares either by way of principal or interest nor any indulgence
granted by the Company in respect of payment of any such money shall preclude the forfeiture of such shares as herein provide d.
There shall be no forfeiture of unclaimed dividends before the claim becomes barred by applicable law.”
Transfer and transmission of shares
Article 58 provides that “The Company shall keep a “Register of Transfers” and therein shall be fairly and distinctly entered
particulars of every transfer or transmission of any shares. The Company shall use a common form of transfer.”
Article 59 provides that “In respect of any transfer of shares registered in accordance with the provisions of these Articles, the
Board may, at its discretion, direct an endorsement of the transfer and the name of the transferee and other particulars on the
existing share certificate and authorize any Director or Officer of the Company to authenticate such endorsement on behalf of
the Company or direct the issue of a fresh share certificate, in lieu of and in ca ncellation of the existing certificate in the name
of the transferee.”
Article 60 provides that:
(a) “The instrument of transfer of any share shall be in writing and all the provisions of the Act, and of any statutory
modification thereof for the time being shall be duly complied with in respect of all transfer of shares and registration
thereof. The Company shall use the form of transfer, as prescribed under the Act, in all cases. In case of transfer of
shares, where the Company has not issued any certificates and where the shares are held in dematerialized form, the
provisions of the Depositories Act, 1996 shall apply.
(b) The Board may decline to recognize any instrument of transfer unless-
(i) the instrument of transfer is in the form prescribed under the Act;
(ii) the instrument of transfer is accompanied by the certificate of shares to which it relates, and such other
evidence as the Board may reasonably require to show the right of the transferor to make the transfer; and
358
(iii) the instrument of transfer is in respect of only one class of shares.
(c) No fee shall be charged for registration of transfer, transmission, probate, succession certificate and letters of
administration, certificate of death or marriage, power of attorney or similar other document.”
Article 67 provides that “Subject to the provisions of the Act and these Articles, any person becoming entitled to shares in
consequence of the death, lunacy, bankruptcy or insolvency of any Members, or by any lawful means other than by a transfer
in accordance with these Articles, may with the consent of the Board (which it shall not be under any obligation to give), upon
producing such evidence as the Board thinks sufficient, that he sustains the character in respect of which he proposes to act
under this Article, or of his title, elect to either be registered himself as holder of the shares or elect to have some person
nominated by him and approved by the Board, registered as such holder or to make such transfer of the share as the deceased
or insolvent member could have made. If the person so becoming entitled shall elect to be registered as holder of the share
himself, he shall deliver or send to the Company a notice in writing signed by him stating that he so elects. Provided,
nevertheless, if such person shall elect to have his nominee registered, he shall testify that election by executing in favour of
his nominee an instrument of transfer in accordance with the provision herein contained and until he does so he shall not be
freed from any liability in respect of the shares. Further, all limitations, restrictions and provisions of these regulations relating
to the right to transfer and the registration of transfer of shares shall be applicable to any such notice or transfer as afo resaid as
if the death or insolvency of the Member had not occurred and the notice or transfer were a transfer signed by that Member.”
Article 68 provides that “A person becoming entitled to a share by transmission shall, reason of the death or insolvency of the
holder shall, subject to the Directors’ right to retain such dividends or money, be entitled to the same dividends and other
advantages to which he would be entitled if he were the registered holder of the share, except that he shall not, before bein g
registered as a Member in respect of the share, be entitled in respect of it to exercise any right conferred by membership in
relation to meetings of the Company.
Provided that the Board may at any time give a notice requiring any such person to elect either to be registered himself or t o
transfer the share and if the notice is not complied with within ninety (90) days, the Board may thereafter withhold payment of
all dividends, bonus or other moneys payable in respect of such share, until the requirements of notice have been complied
with.”
Article 71 provides that “The provisions of these Articles, shall, mutatis mutandis, apply to the transfer of or the transmission
by law of the right to any securities including, debentures of the Company.”
Alteration of capital
Article 72 provides that “The Company may issue share warrants subject to, and in accordance with provisions of the Act. The
Board may, in its discretion, with respect to any share which is fully paid up on application in writing signed by the person
registered as holder of the share, and authenticated by such evidence (if any) as the Board may from time to time require as to
the identity of the person signing the application, and the amount of the stamp duty on the warrant and such fee as the Board
may from time to time require having been paid, issue a warrant.”
Article 75 provides that “The Company may, by a special resolution as prescribed by the Act, reduce in any manner and in
accordance with the provisions of the Act—
(a) its share capital; and / or
(b) any capital redemption reserve account; and / or
(c) any share premium account
and in particular without prejudice to the generality of the foregoing power may be: (i) extinguishing or reducing the liability
on any of its shares in respect of share capital not paid up; (ii) either with or without extinguishing or reducing liability on any
of its shares, cancel paid up share capital which is lost or is unrepresented by available assets; or (ii) either with or wit hout
extinguishing or reducing liability on any of its shares, pay off any paid up share capital which is in excess of the wants of the
Company; and may, if and so far as is necessary, alter its Memorandum, by reducing the amount of its share capital and of its
shares accordingly.”
Article 77 provides that “Notwithstanding anything con tained in these Articles, but subject to all applicable provisions of the
Act or any other law for the time being in force, the Company may purchase its own shares or other specified securities.”
BORROWING POWERS
Article 129 provides that:
(a) “Subject to the provisions of the Act and these Articles, the Board may from time to time at their discretion raise or
borrow or secure the payment of any such sum of money for the purpose of the Company, in such manner and upon
such terms and conditions in all respects a s they think fit, and in particular, by promissory notes or by receiving deposits

359
and advances with or without security or by the issue of bonds, debentures, perpetual or otherwise, including
debentures convertible into shares of this Company or any other company or perpetual annuities and to secure any
such money so borrowed, raised or received, mortgage, pledge or charge the whole or any part of the property, assets
or revenue of the Company present or future, including its uncalled capital by special assignment or otherwise or to
transfer or convey the same absolutely or in trust and to give the lenders powers of sale and other powers as may be
expedient and to purchase, redeem or pay off any such securities; provided however, that the moneys to be borrowed,
together with the money already borrowed by the Company apart from temporary loans obtained from the Company’s
bankers in the ordinary course of business shall not, without the sanction of the Company by a Special Resolution at
a General Meeting, exceed the aggregate of the paid up capital of the Company and its free reserves and securities
premium. Provided that every Special Resolution passed by the Company in General Meeting in relation to the exercise
of the power to borrow shall specify the total a mount up to which moneys may be borrowed by the Board of Directors.
(b) The Directors may by resolution at a meeting of the Board delegate the above power to borrow money otherwise than
on debentures to a committee of Directors or managing Director or to any o ther person permitted by applicable law, if
any, within the limits prescribed.
(c) To the extent permitted under the applicable law and subject to compliance with the requirements thereof, the Directors
shall be empowered to grant loans to such entities at such terms as they may deem to be appropriate and he same shall
be in the interests of the Company.
(d) Any bonds, debentures, debenture-stock or other securities may if permissible under applicable law be issued at a
discount, premium or otherwise by the Company and shall with the consent of the Board be issued upon such terms
and conditions and in such manner and for such consideration as the Board shall consider to be for the benefit of the
Company, and on the condition that they or any part of them may be conv ertible into equity shares of any
denomination, and with any privileges and conditions as to the redemption, surrender, allotment of shares, attending
(but not voting) in the General Meeting, appointment of Directors or otherwise. Provided that debentures with rights
to allotment of or conversion into equity shares shall not be issued except with, the sanction of the Company in General
Meeting accorded by a Special Resolution.”
GENERAL MEETINGS
Article 78 provides that:
(a) “The Company shall in each year hold a General Meeting as its Annual General Meeting in addition to any other
meeting in that year.
(b) An Annual General Meeting of the Company shall be held in accordance with the provisions of the Act.”
Article 79 provides that: “All General Meetings other than the Annual General Meeting shall be called “Extraordinary General
Meeting”. Provided that, the Board may, whenever it thinks fit, call an Extraordinary General Meeting.”
Article 80 provides that: “The Board shall, on the requisition of Members, convene an Extraordinary General Meeting of the
Company in the circumstances and in the manner provided under the Act.”
VOTE OF MEMBERS
Article 94 provides that:
“Subject to any rights or restrictions for the time being attached to any class or classes of shares:
(a) On a show of hands every Member holding Equity Shares and present in person shall have one vote.
(b) On a poll, every Member holding Equity Shares therein shall have voting rights in proportion to his share in the paid
up equity share capital.
(c) A Member may exercise his vote at a meeting by electronic means in accordance with the Act and shall vote only
once.”
Article 95 provides that “In case of joint holders the vote of first named of such joint holders in the Register of Members who
tender a vote whether in person or by proxy shall be accepted, to the exclusion of the votes of other joint holders.”
Proxies
Article 98 provides that “Any Member entitled to attend and vote at a General Meeting may do so either personally or through
his constituted attorney or through another person as a proxy on his behalf, for that meeting.”

360
Directors
Article 102 provides that “Unless otherwise determined by General Meeting, the number of Directors shall not be less than
three (3) and not more than fifteen (15), and at least one (1) Director shall be resident of India in the previous year.
Provided that the Company may appoint more than fifteen (15) directors after passing a Special Resolution.
Article 111 provides that “At the Annual General Meeting of the Company to be h eld in every year, one third of such of the
Directors as are liable to retire by rotation for time being, or, if their number is not three or a multiple of three then th e number
nearest to one third shall retire from office, and they will be eligible for re-election. Provided nevertheless that the managing
director appointed or the Directors appointed as a debenture director under Articles hereto shall not retire by rotation unde r this
Article nor shall they be included in calculating the total number of Directors of whom one third shall retire from office under
this Article.”
Article 112 provides that “A retiring Director shall be eligible for re-election and the Company, at the Annual General Meeting
at which a Director retires in the manner aforesaid may fill up the vacated office by electing a person thereto.”
Proceedings of Board of Directors
Article 117 provides that:
(a) “The Board of Directors shall meet at least once in every three (3) months with a maximum gap of four (4) months
between two (2) meetings of the Board for the dispatch of business, adjourn and otherwise regulate its meetings and
proceedings as it thinks fit in accordance with the Act, provided that at least four (4) such meetings shall be held in
every year. Place of meetings of the Board shall be at a location determined by the Board at its previous meeting, or if
no such determination is made, then as determined by the chairman of the Board.
(b) The chairman may, at any time, and the secretary or such other Officer of the Company as may be aut horised in this
behalf on the requisition of Director shall at any time summon a meeting of the Board. Notice of at least seven (7)
days in writing of every meeting of the Board shall be given to every Director and every alternate Director at his usual
address whether in India or abroad, provided always that a meeting may be convened by a shorter notice to transact
urgent business subject to the condition that at least one independent director, if any, shall be present at the meeting
and in case of absence of independent directors from such a meeting of the Board, decisions taken at such a meeting
shall be circulated to all the directors and shall be final only on ratification thereof by at least one independent director ,
if any.
(c) The notice of each meeting of the Board shall include (i) the time for the proposed meeting; (ii) the venue for the
proposed meeting; and (iii) an agenda setting out the business proposed to be transacted at the meeting.
(d) To the extent permissible by applicable law, the Directors may participate in a meeting of the Board or any committee
thereof, through electronic mode, that is, by way of video conferencing i.e., audio visual electronic communication
facility. The notice of the meeting must inform the Directors regarding the availability of participation through video
conferencing. Any Director participating in a meeting through the use of video conferencing shall be counted for the
purpose of quorum.”
Article 122 provides that:
(a) “The Board may exercise all such powers of the Company and do all such acts and things as are not, by the Act or any
other applicable law, or by the Memorandum or by the Articles required to be exercised by the Company in a General
Meeting, subject nevertheless to these Articles, to the provisions of the Act or any other applicable law and to such
regulations being not inconsistent with the aforesaid regulations or provisions, as may be prescribed by the Company
in a General Meeting; but no regulation made by the Company in a General Meeting shall invalidate any prior act of
the Board which would have been valid if that regulation had not been made.
(b) All cheques, promissory notes, drafts, hundis, bills of exchange and other negotiable instruments, and all receipts for
monies paid to the Company, shall be signed, drawn, accepted, endorsed, or otherwise executed, as the case maybe,
by such person and in such manner as the Board shall from time to time by resolution determine.”
CAPITALISATION OF PROFITS
Article 150 provides that:
(a) “The Company in General Meeting, may, on recommendation of the Board resolve:
(i) that it is desirable to capitalise any part of the amount for the time being standing to the credit of the
Company’s reserve accounts or to the credit of the profit and loss account or otherwise available fo r
distribution; and

361
(ii) that such sum be accordingly set free for distribution in the manner specified in the sub -clause (b) amongst
the Members who would have been entitled thereto if distributed by way of dividend and in the same
proportion.
(b) The sum aforesaid shall not be paid in cash but shall be applied, subject to the provision contained in sub -clause (c)
below, either in or towards:
(i) paying up any amounts for the time being unpaid on shares held by such Members respectively;
(ii) paying up in full, unissued sha re of the Company to be allotted and distributed, credited as fully paid up, to
and amongst such Members in the proportions aforesaid; or
(iii) partly in the way specified in sub-clause (i) and partly that specified in sub -clause (ii).
(iv) A securities premium account and a capital redemption reserve account or any other permissible reserve
account may be applied as permitted under the Act in the paying up of unissued shares to be issued to
Members of the Company as fully paid bonus shares.
(v) The Board shall give effect to the resolution passed by the Company in pursuance of these Articles.”
DIVIDEND
Article 138 provides that “The Company in General Meeting may declare dividends, but no dividend shall exceed the amount
recommended by the Board.”
Article 139 provides that “Subject to the provisions of the Act, the Board may from time to time pay to the members such
interim dividends of such amount on such class of shares and at such times as it may think fit and as appear to it to be just ified
by the profits of the Company.”
Article 140 provides that “(a) Where capital is paid in advance of calls, such capital, whilst carrying interest, shall not c onfer a
right to dividend or to participate in the profits.(b) Where the Company has declared a dividend but which has not be en paid or
claimed within thirty (30) days from the date of declaration, the Company shall within seven (7) days from the date of expiry
of the said period of thirty (30) days, transfer the total amount of dividend which remains unpaid or unclaimed within the said
period of thirty (30) days, to a special account to be opened by the Company in that behalf in any scheduled bank to be calle d
“Wellness Forever Medicare Limited”. (c) Any money transferred to the unpaid dividend account of the Company which
remains unpaid or unclaimed for a period of seven (7) years from the date of such transfer, shall be transferred by the Company
to the fund known as Investor Education and Protection Fund established under the Act. (d) No unclaimed or unpaid dividend
shall be forfeited by the Board before the claim becomes barred by law. (e) All other provisions under the Act will be complied
with in relation to the unpaid or unclaimed dividend.”
Article 141 provides that “Subject to the rights of persons, if any, entitled to sh ares with special rights as to dividends, all
dividends shall be declared and paid according to the amounts paid or credited as paid on the shares in respect whereof the
dividend is paid, but if and so long as nothing is paid upon any of the shares in the Company, dividends may be declared and
paid according to the amounts of the shares”.
Article 143 provides that “(a) The Board may, before recommending any dividends, set aside out of the profits of the Company
such sums as it thinks proper as a reserve or reserves which shall at the discretion of the Board, be applied for any purpose to
which the profits of the Company may be properly applied, including provision for meeting contingencies or for equalizing
dividends and pending such application, may, at the like discretion either be employed in the business of the Company or be
invested in such investments (other than shares of the Company) as the Board may, from time to time think fit. (b) The Board
may also carry forward any profits when it may consider necessary not to divide, without setting them aside as a reserve”
WINDING UP
Article 161 provides that “Subject to the applicable provisions of the Act–
(a) If the Company shall be wound up, the liquidator may, with the sanction of a Special Resolution of the Company and
any other sanction required by the Act, divide amongst the members, in specie or kind, the whole or any part of the
assets of the Company, whether they shall consist of property of the same kind or not.
(b) For the purpose aforesaid, the liquidator may set such value as he deems fair upon any property to be divided as
aforesaid and may determine how such division shall be carried out as between the Members or different classes of
Members.
(c) The liquidator may, with the like sanction, vest the whole or any part of such assets in trustees upon such trusts for the
benefit of the contributories if he considers necessary, but so that no member shall be compelled to accept any shares
or other securities whereon there is any liability.

362
(d) Any person who is or has been a Director or manager, whose liability is unlimited under the Act, shall, in addition to
his liability, if any, to contribute as an ordinary member, be liable to make a further contribution as if he were at the
commencement of winding up, a member of an unlimited company, in accordance with the provisions of the Act.”
Indemnity
Article 163 provides that “Subject to the provisions of the Act, every Director and Officer of the Company shall be indemnified
by the Company against any liability incurred by him in defending any proceedings, whether civil or criminal, in which
judgment is given in his favour or in which he is acquitted or in which relief is granted to him by the court or the tribunal .
Provided, however, that such indemnification shall not apply in respect of any cost or loss or expenses to the extent it is finally
judicially determined to have resulted from the negligence, wilful misconduct or bad faith acts or omissions of such Director .

363
SECTION IX: OTHER INFORMATION
MATERIAL CONTRACTS AND DOCUMENTS FOR INSPECTION
The copies of the following contracts which have been entered or are to be entered into by our Company (not being contracts
entered into in the ordinary course of business carried on by our Company or contracts entered into more than two years before
the date of this Draft Red Herring Prospectus) which are or may be deemed material will be attached to the copy of the Red
Herring Prospectus/ Prospectus which will be delivered to the RoC for filing. Copies of the contracts and also the documents
for inspection referred to hereunder, may be inspected at the Registered and Corporate Office between 10 a.m. and 5 p.m. on
all Working Days from date of the Red Herring Prospectus until the Bid/Offer Closing Date.
Any of the contracts or documents mentioned in this Draft Red Herring Prospectus may be amended or modified at any time if
so required in the interest of our Company or if required by the other parties, without reference to the Shareholders, subjec t to
compliance of the provisions contained in the Companies Act and other applicable law.
a) Material Contracts for the Offer
a) Offer Agreement dated September 30, 2021 between our Company, Selling Shareholders and the Book
Running Lead Managers.
b) Registrar Agreement dated September 30, 2021 between our Company, Selling Shareholders and the
Registrar to the Offer.
c) Cash Escrow and Sponsor Bank Agreement dated [●] between our Company, the Registrar to the Offer, the
Book Running Lead Managers, the Syndicate Members and the Bankers to the Offer.
d) Share Escrow Agreement dated [●] among our Company, the Selling Shareholders, and the Share Escrow
Agent.
e) Syndicate Agreement dated [●] between our Company, the Book Running Lead Managers and Syndicate
Members.
f) Underwriting Agreement dated [●] between our Company and the Underwriters.
g) Monitoring Agency Agreement dated [●] between our Company and the Monitoring Agency.
b) Material Documents
a) Certified copies of the updated MoA and AoA of our Company as amended from time to time.
b) Certificate of incorporation dated February 8, 2008 issued to our Company, under the name “Wellness
Forever Medicare Private Limited” by the RoC .
c) Fresh certificate of incorporation dated August 5, 2021 issued by the RoC, consequent upon change from
Wellness Forever Medicare Private Limited to Wellness Forever Medicare Limited, pursuant to conversion
to a public limited company.
d) Resolution of the Board dated July 29, 2021, authorising the Offer and other related matters.
e) Resolutions of the Board and IPO Committee dated September 29, 2021 and September 30, 2021 respectively,
approving this Draft Red Herring Prospectus.
f) Shareholders’ resolution dated August 31, 2021, authorising the Offer and other related matters.
g) Copies of the annual reports of our Company for the Fiscals 2021, 2020 and 2019.
h) Consent letter dated September 30, 2021 from Deloitte Haskins & Sells LLP, Chartered Accountants to
include their name as required under Section 26 (1) of the Companies Act, 2013 read with SEBI ICDR
Regulations, in this Draft Red Herring Prospectus and as an “expert” as defined under Section 2(38) of the
Companies Act, 2013 to the extent and in their capacity as our Statutory Auditors, and in respect of their
examination report, dated September 27, 2021 on our Restated Consolidated Financial Information . However,
the term “expert” and the consent thereof shall not be construed to mean an “expert” or consent within the
meaning as defined under the U.S. Securities Act.
i) Consent letter dated September 29, 2021from the independent Chartered Accountant, namely Ramesh M
Sheth & Associates, to include their name in this Draft Red Herring Prospectus and as an “expert” as defined
under Section 2(38) of the Companies Act, 2013 in respect of their statement of special tax benefits available

364
to the Company and its shareholders dated September 29, 2021, included in this Draft Red Herring Prospectus
j) Consent letter dated September 28, 2021 from Technopak Advisors Private Limited to include their name in
this Draft Red Herring Prospectus and as an “expert” as defined under the Companies Act, 2013, in relation
to the Technopak Report with respect to our Company.
k) Consent letters of the Promoter Selling Shareholders for participation in the Offer for Sale, as detailed in “The
Offer” on page 55.
l) Consent letters of the Other Selling Shareholders for participation in the Offer for Sale, as detailed in “The
Offer” on page 55 and Annexure A on page 370.
m) The examination report of the Statutory Auditor dated September 27, 2021 on the Restated Consolidated
Financial Information.
n) The statement of special tax benefits dated September 29, 2021 from the independent Chartered Accountant
namely, Ramesh M. Sheth & Associates, Chartered Accountants.
o) Consent letters of the Directors, the Book Running Lead Managers, the Syndicate Members, Legal Counsel
to our Company as to Indian Law, Legal Counsel to the Book Running Lead Managers as to Indian Law,
Legal Counsel to the Book Running Lead Managers as to International Law, Registrar to the Offer, Escrow
Collection Banks, Public Offer Banks, Refund Banks, Sponsor Bank, Company Secretary and Compliance
Officer, to act in their respective capacities.
p) Report titled “Industry Report on Pharmacy Retail in India ” dated September 28, 2021, issued by Technopak.
q) Shareholders’ Agreement dated September 29, 2014 entered into among our Company, Promoters, Ramesh
Shantilal Mehta and certain other shareholders, as amended by the amendment to Shareholders’ Agreement
dated May 12, 2015, addendum to the Shareholders’ Agreement dated July 26, 2016, second addendum to
the Shareholders’ Agreement dated November 21, 2017, third addendum to the Shareholders’ Agreement
dated July 17, 2019, fourth addendum to the Shareholders’ Agreement dated August 13, 2020 and the
amendment cum termination agreement dated September 30, 2021.
r) Share Purchase Agreement dated November 21, 2017 entered into among our Company, Promoters, certain
Shareholders and persons purchasing the equity shares.
s) Share Purchase Agreement dated July 17, 2019 entered into among our Company, certain Promoters, certain
Shareholders and persons purchasing the equity shares.
t) Guarantees as set out under “History and Certain Corporate Matters – Details of guarantees given to third
parties by the Promoter Selling Shareholders” on page 180.
u) Wellness Forever Employee Stock Option Plan 2018
v) Wellness Forever Employee Stock Option Plan 2020
w) Wellness Forever Employee Stock Option Plan 2021
x) Due diligence certificate dated September 30, 2021 addressed to SEBI from the Book Running Lead
Managers.
y) In principle listing approvals dated [●] and [●], issued by BSE and NSE, respectively.
z) SEBI observation letter dated [●].
aa) Tripartite agreement dated August 30, 2021 between our Company, CDSL and the Registrar to the Offer.
bb) Tripartite agreement dated August 31, 2021 between our Company, NSDL and the Registrar to the Offer.
Any of the contracts or documents mentioned in this Draft Red Herring Prospectus may be amended or modified at any time if
so required in the interest of our Company or if required by the other parties, without reference to our Shareholders, subjec t to
compliance with the provisions contained in the Companies Act and other relevant statutes.
365
DECLARATION
We hereby certify and declare that all relevant provisions of the Companies Act and the rules, guidelines/regulations issued by
the Government of India or the guidelines/regulations issued by the SEBI, established under Sec tion 3 of the SEBI Act, as the
case may be, have been complied with and no statement made in this Draft Red Herring Prospectus is contrary to the provisions
of the Companies Act, the SCRA, the SCRR, the SEBI Act or rules made or guidelines or regulations issued there under, as the
case may be. We further certify that all statements in this Draft Red Herring Prospectus are true and correct.
SIGNED BY DIRECTORS OF OUR COMPANY
Ashraf Mohammed Biran
Whole-Time Director
_____________________________
Gulshan Haresh Bakhtiani
Whole-Time Director
_____________________________
Mohan Ganpat Chavan
Whole-Time Director
_____________________________
Avani Vishal Davda
Independent Director
_____________________________
Ranjit Gobindram Shahani
Independent Director
_____________________________
Kewal Handa
Independent Director
_____________________________
SIGNED BY CHIEF FINANCIAL OFFICER
______________________________
Name: Gaurav Shah
(Chief Financial Officer)
Place: Mumbai
Date: September 30, 2021

366
DECLARATION
I, Ashraf Mohammed Biran, hereby confirm that all statements, disclosures and undertakings specifically made by me in this
Draft Red Herring Prospectus in relation to myself, as a Promoter Selling Shareholder and my Offered Shares, are true and
correct. I assume no responsibility for any other statements, disclosures and undertakings including statements made or
confirmed by or relating to the Company or any other person(s) in this Draft Red Herring Prospectus.
SIGNED BY ASHRAF MOHAMMED BIRAN
_________________________________
Date: September 30, 2021
Place: Mumbai

367
DECLARATION
I, Gulshan Haresh Bakhtiani, hereby confirm that all statements, disclosures and undertakings specifically made by me in this
Draft Red Herring Prospectus in relation to myself, as a Promoter Selling Shareholder and my Offered Shares, are true and
correct. I assume no responsibility for any other statements, disclosures and undertakings including statements made or
confirmed by or relating to the Company or any other person(s) in this Draft Red Herring Prospectus.
SIGNED BY GULSHAN HARESH BAKHTIANI
_________________________________
Date: September 30, 2021
Place: Mumbai

368
DECLARATION
I, Mohan Ganpat Chavan, hereby confirm that all statements, disclosures and undertakings specifically made by me in this Draft
Red Herring Prospectus in relation to myself, as a Promoter Selling Shareholder and my Offered Shares, are true and correct. I
assume no responsibility for any other statements, disclosures and undertakings including statements made or confirmed by or
relating to the Company or any other person(s) in this Draft Red Herring Prospectus.
SIGNED BY MOHAN GANPAT CHAVAN
_________________________________
Date: September 30, 2021
Place: Mumbai

369
DECLARATION
I, Gaurav Shah, hereby confirm on behalf of the Other Selling Shareholders that all statements, disclosures and undertakings
specifically made by them in this Draft Red Herring Prospectus in relation to themselves and their Offered Shares, are true and
correct. The Other Selling Shareholders assume no responsibility for any other statements, disclosures and undertakings
including statements made or confirmed by or relating to the Company or any other person(s) in this Draft Red Herring
Prospectus.
SIGNED BY GAURAV SHAH ON BEHALF OF OTHER SELLING SHAREHOLDERS
_________________________________
Date: September 30, 2021
Place: Mumbai

370
ANNEXURE A
LIST OF OTHER SELLING SHAREHOLDERS
Sl.
No.
Name of Selling Shareholder Aggregate amount of Offer
for Sale (₹)
Number of Equity Shares
proposed to be
offered in the
Offer for Sale
Date of board
resolution
Date of consent
letter
1. ACG Associated Capsules Private Limited [●] 252,000 July 23, 2021 September 29, 2021
2. Aditya Rajendra Sah HUF [●] 48,846 - September 29, 2021
3. Ahmed Ali Nalwala [●] 2,673,822 - September 29, 2021
4. Akshay Mansukhani [●] 550,392 - September 29, 2021
5. Allana Exports Private Limited [●] 352,518 July 17, 2021 September 29, 2021
6. Allana Investments and Trading Company
Private Limited
[●] 251,682 July 17, 2021 September 29, 2021
7. Anmol Babani [●] 17,100 - September 29, 2021
8. Ayesha Mansukhani [●] 550,392 - September 29, 2021
9. Bhavna Dadlani [●] 42,000 - September 29, 2021
10. Chinar Mittal [●] 12,768 - September 29, 2021
11. Dilip Sawant [●] 5,040 - September 29, 2021
12. Frigerio Conserva Allana Private Limited [●] 1,365,498 July 31, 2021 September 29, 2021
13. Indur Dadlani [●] 140,286 - September 29, 2021
14. Jaya Dadlani [●] 42,000 - September 29, 2021
15. Karan Singh Thakral [●] 210,000 - September 29, 2021
16. Keyur Gandhi [●] 12,042 - September 29, 2021
17. Kunal Babani [●] 17,100 - September 29, 2021
18. Laxmi Investments (through its proprietor
Parikshit Kamalkishore Vaid)
[●] 162,000 - September 29, 2021
19. Manisha Pharmo Plast Private Limited [●] 53,166 July 30, 2021 September 29, 2021
20. N Gautam Kumar [●] 243,036 - September 29, 2021
21. Nailesh Gandhi [●] 24,084 - September 29, 2021
22. Ned Ventures LLP [●] 68,100 - September 29, 2021
23. Nirav Gandhi [●] 12,042 - September 29, 2021
24. Nitin Jain [●] 9,000 - September 29, 2021
25. Parikshit Vaid [●] 102,000 - September 29, 2021
26. Patni Wealth Advisors LLP [●] 75,000 - September 29, 2021
27. Photophone Comel Private Limited [●] 60,000 July 30, 2021 September 29, 2021
28. Pivot Ventures LLP [●] 8,700 - September 29, 2021
29. Pooja Deora [●] 15,882 - September 29, 2021
30. Prahlad Deora [●] 34,500 - September 29, 2021
31. Puneet Deora [●] 47,610 - September 29, 2021
32. R S Estates (through its proprietor Ramesh
Babani)
[●]
123,798
- September 29, 2021
33. RAAY Global Investments Private Limited [●] 300,000 July 31, 2021 September 29, 2021
34. Rajendra Sah [●] 152,658 - September 29, 2021
35. Rajiv Dadlani [●] 522,864 - September 29, 2021
36. Riddhymic Technologies Private Limited [●] 34,440 August 10, 2021 September 29, 2021
37. Rising Sun Holdings Private Limited [●] 1,522,672 August 6, 2021 September 29, 2021
38. Ritika Arora [●] 45,570 - September 29, 2021
39. Serum Institute of India Private Limited [●] 3,552,901 August 6, 2021 September 29, 2021
40. Sharan Babani [●] 17,100 - September 29, 2021
41. Suresh Daragshetti [●] 36,000 - September 29, 2021
42. Vikas Choudhury [●] 4,254 - September 29, 2021
43. Vijay Mansukhani [●] 665,000 - September 29, 2021
44. Vivek Rajendra Sah HUF [●] 48,846 - September 29, 2021
Total [●] 14,484,709