The Impact of Soluble Dietary Fibre on Blood Glucose, Insulin
107
The Impact of Soluble Dietary Fibre on Blood Glucose, Insulin and Gut Hormones in Obese Human Subjects by Prateek Juneja B.Sc. The University of Guelph, 2007 A Thesis Submitted in Partial Fulfillment of the Requirements for the Degree of Master of Science in The Faculty of Graduate Studies (Food Science) The University of British Columbia (Vancouver) July, 2011 © Prateek Juneja, 2011
-
Upload
khangminh22 -
Category
Documents
-
view
3 -
download
0
Transcript of The Impact of Soluble Dietary Fibre on Blood Glucose, Insulin

The Impact of Soluble Dietary Fibre on Blood Glucose, Insulin
and Gut Hormones in Obese Human Subjects
by
Prateek Juneja
B.Sc. The University of Guelph, 2007
A Thesis Submitted in Partial Fulfillment of
the Requirements for the Degree of
Master of Science
in
The Faculty of Graduate Studies
(Food Science)
The University of British Columbia
(Vancouver)
July, 2011
© Prateek Juneja, 2011

ii
ABSTRACT
The incidence of obesity and type 2 diabetes mellitus (T2D) has been on the rise and the
evidence suggests that soluble dietary fibres may be helpful for obesity management
and T2D prevention. Polyglycoplex (PGX), a novel, viscous polysaccharide, has been
shown in several studies to promote weight loss and exert positive effects on
postprandial glycemia and satiety hormone secretions. Furthermore, recent evidence
suggests a role of dietary fibres in appetite glycemic control, which may be partly
mediated by gut hormones such as glucagon-like peptide-1 (GLP-1), gastric inhibitory
polypeptide (GIP), amylin, leptin, ghrelin, peptide YY (PYY) and pancreatic
polypeptide (PP). These substances may aid weight loss and the maintenance of a
constant plasma insulin level, which is important for obese and T2D patients.
Healthy, overweight individuals (Body Mass Index (BMI) > 27 kg/m2) were
recruited for this study. Participants were randomized for 13 weeks to receive
supplements, containing either 750 mg of PGX (Treatment group, n=76) or 750 mg of
cellulose (Placebo group, n=72). The participants were asked to take six capsules with
water before each meal. At baseline (week 0) and at week 13 of the study, after 12 hours
of overnight fasting, participants consumed a test meal. Participants did not consume

iii
PGX or placebo capsules prior to breakfast on the days of a meal tolerance test. Blood
samples were collected at time 0, and at 15, 30, 45, 60, 120, and 240 min after the test
meal. Although previous studies carried out on the granular form of PGX suggest that it
may promote acute effects of weight loss and reductions in postprandial glycemia, in
this specific study, capsulated PGX did not show a statistically significant effect on
body weight, BMI, blood glucose, insulin, or other hormones, in comparison with
placebo. Nevertheless, PGX had statistically significant improvements for GIP and
showed some positive trends in changes of leptin over ghrelin through the cross-
sectional analysis. A recent study showed that PGX capsules may be more suitable for
maintaining body weight and blood glucose levels due to its delayed effects and
convenience.

iv
PREFACE
Certificates of Approval
The research involving human subjects that is reported in this thesis was performed with
ethics approval from University of British Columbia Clinical Research Ethics Board
(Certificate # H06-03930).

v
TABLE OF CONTENTS
ABSTRACT .................................................................................................................................. ii
PREFACE.....................................................................................................................................iv
TABLE OF CONTENTS...............................................................................................................v
LIST OF TABLES ...................................................................................................................... vii
LIST OF FIGURES .................................................................................................................... viii
LIST OF ABBREVIATIONS .................................................................................................... ixx
ACKNOWLEDGEMENTS .......................................................................................................... x
CHAPTER 1: GENERAL INTRODUCTION .............................................................................. 1
CHAPTER 2: HYPOTHESIS ....................................................................................................... 5
CHAPTER 3: OBJECTIVES ........................................................................................................ 6
CHAPTER 4: LITERATURE REVIEW ...................................................................................... 7
4. 1 Obesity ........................................................................................................... 7
4.1.1 Obesity: prevalence and causes. ............................................................... 8
4.1.2 Health risks of obesity. ............................................................................ 9
4.2 Dietary Supplements and Obesity Treatment ................................................. 10
4.2.1 Medium chain triglycerides. ................................................................... 10
4.2.2 Dietary fibres and their functions. .......................................................... 12
4.2.3 Polyglycoplex. ....................................................................................... 19
4.3 Blood Glucose, Insulin, and Gut Peptides ..................................................... 27
4.3.1 Insulin, glucagon, and blood glucose regulation. .................................... 27
4.3.2 Incretins. ................................................................................................ 29
4.3.3 Other gut-derived peptides. .................................................................... 31
4.3.4 Dietary fibres, hormones, and glycemic control. .................................... 35
CHAPTER 5: MATERIALS AND METHODS ......................................................................... 38
5.1 Study Population........................................................................................... 38

vi
5.2 Study Design, Products, and Procedure ......................................................... 40
5.2.1 Supplementation. ................................................................................... 40
5.2.2 Dose selection and trial parameters. ....................................................... 41
5.3 Meal Tolerance Tests .................................................................................... 43
5.4 Anthropometrics, Dietary, and Exercise Advice ............................................ 44
5.5 Compliance ................................................................................................... 44
5.6 Premature Withdrawal and Discontinuation Criteria ..................................... 45
5.7 Laboratory Biochemical Analysis Methods ................................................... 46
5.8 Statistical Analysis ........................................................................................ 48
CHAPTER 6: RESULTS AND DISCUSSION .......................................................................... 54
6.1 Results .......................................................................................................... 54
6.1.1 Participants and follow-up. .................................................................... 54
6.1.2 Participant characteristics at baseline. .................................................... 55
6.2 Data Analysis ............................................................................................... 57
6.2.1 Anthropometrics. ................................................................................... 57
6.2.2 Hormones. ............................................................................................. 58
6.2.3 Compliance and adverse events. ............................................................. 63
6. 3 Discussion .................................................................................................... 63
CHAPTER 7: CONCLUSION AND RECOMMENDATIONS ................................................. 72
REFERENCES ............................................................................................................................ 76
APPENDIX: PATTERN OF CHANGE IN BLOOD GLUCOSE, INSULIN AND GUT
HORMONES CONCENTRATIONS WITH INGESTION TIME AT WEEK 0 AND AFTER
13WEEKS....................................................................................................................................91

vii
LIST OF TABLES
Table 4.1: Descriptive summary of studied peptides and hormones ..................................... 28
Table 4.2: Descriptive summary of studied gut hormones .................................................... 29
Table 6.1: Participant characteristics at baseline ................................................................... 56
Table 6.2: Bio-physical characteristics of the participants at week 0 (Baseline) and at week
13, and their variation from baseline along with statistical significance .............. 57
Table 6.3: Analysis of different biochemical parameters for the participants of both placebo
and PGX groups and their statistical significance ................................................ 60
Table 6.4: Analysis of different peptides for the participants of both placebo and PGX
groups and their statistical significance ................................................................61

viii
LIST OF FIGURES
Figure 4.1: Schematic diagram of molecular structure of PGX components (Harding, Smith,
Lawson, Gahler, & Wood, 2010).......................................................................... 21
Figure 5.1: The systematic plan and schedule for the clinical trial ......................................... 43
Figure 6.1: Study participation and follow-up ........................................................................ 55
Figure 6.2: Change in concentrations of leptin to ghrelin ratio with ingestion time at the
baseline (week 0) and after 13 weeks in both (A) placebo (control), and (B) PGX
treatment groups................................................................................................... 62
Figure 6.3: Cross-sectional relationship graph between the change in leptin and ghrelin
concentrations with ingestion time during the whole duration of clinical trial (at
week 0 to week 13) in both (left) placebo (control), and (right) PGX treatment
groups. .................................................................................................................. 62
Figure A.1: Pattern of change in glucose concentrations with ingestion ti6+me at week 0
(empty) and after 13 weeks (filled) {Placebo (left), and PGX (right)}. ............... 93
Figure A.2: Pattern of change in insulin concentrations with ingestion time at week 0 (empty)
and after 13 weeks (filled) {Placebo (left), and PGX (right)}. ............................. 93
Figure A.3: Pattern of change in GLP-1 concentrations with ingestion time at week 0 (empty)
and after 13 weeks (filled) {Placebo (left), and PGX (right)}. ............................. 94
Figure A.4: Pattern of change in GIP concentrations with ingestion time at week 0 (empty)
and after 13 weeks (filled) {Placebo (left), and PGX (right)}. ............................. 94
Figure A.5: Pattern of change in amylin concentrations with ingestion time at week 0 (empty)
and after 13 weeks (filled) {Placebo (left), and PGX (right)}. ............................. 95
Figure A.6: Pattern of change in PYY concentrations with ingestion time at week 0 (empty)
and after 13 weeks (filled) {Placebo (left), and PGX (right)}. ............................. 95
Figure A.7: Pattern of change in PP concentrations with ingestion time at week 0 (empty) and
after 13 weeks (filled) {Placebo (left), and PGX (right)}. .................................... 96
Figure A.8: Pattern of change in ghrelin concentrations with ingestion time at week 0 (empty)
and after 13 weeks (filled) {Placebo (left), and PGX (right)} .............................. 96
Figure A.9: Pattern of change in leptin concentrations with ingestion time at week 0 (empty)
and after 13 weeks (filled) {Placebo (left), and PGX (right)} .............................. 97

ix
LIST OF ABBREVIATIONS
AUC Area Under the Curve
BMI Body Mass Index
CHD Coronary Heart Disease
CVD Cardiovascular Disease
EDTA EthyleneDiamineTetraacetic Acid
FDA Food and Dug Administrations
GIP Gastric Inhibitory Peptide (or Glucose-dependent insulinotropic peptide)
GLP-1 Glucagon-Like Peptide-1
HDL High Density Lipoprotein
IQR InterQuartile Range
LCT LDL
Long Chain Triglycerides Low Density Lipoprtoein
MCT Medium Chain Triglycerides
PGX Polyglycoplex
PP Pancreatic Polypeptide
PYY Peptide YY
SCFA T2D
Short Chain Fatty Acids Type 2 Diabetes Mellitus

x
ACKNOWLEDGEMENTS
I would like to express my sincere gratitude to my supervisor, Dr. Tim Green,
who supervised my M.Sc. research program and helped me at all stages of my research
and thesis writing. I am grateful to Dr. Michael Lyon at the Canadian Centre for
Functional Medicine for giving me the placement to work with his research team on this
project and for his valuable guidance for arranging my financial support during this
program. I also appreciate Dr. Tim Durance, who gave me the opportunity to begin my
M.Sc. program at UBC and who supervised my course work. I would like to thank Dr.
Rickey Yada at the University of Guelph for being on my committee and for offering
valuable advice during this program. I also thank Dr. Raylene Reimer from the
University of Calgary. Without her help, this project could not have been completed. I
am indebted to Mr. Roland Gahler, Chairman of the Factors Group, for his financial
support during this program. I appreciate all of the staff members at the CCFM for their
assistance and Dr. Mahendra Kapoor for his advice. Last but not the least, I wish to
convey my special gratitude to my family members and friends for their help and
encouragement.

1
CHAPTER 1: GENERAL INTRODUCTION
In the past four decades, evidence of the beneficial effects of dietary fibres in
chronic diseases such as diabetes, heart diseases, and certain type of cancer has
accumulated (Zhang et al., 2006; Lopez et al., 2007; Bingham et al., 2003). Reports of
various government agencies have indicated a great interest in the specific effects of
dietary fibres on general health. The Nutrition Labeling and Education Act (NLEA) of
1990, providing rules regarding health claims used on labels, has characterized the
relationship between food, food components, dietary ingredients or dietary supplements,
and risk of diseases (Food and Drug Administration, 1998). The adequate intake of total
dietary fibre for children, adolescents, and adults was set to 14 g dietary fibre / 1000
Kcal, by the U.S. Department of Agriculture (USDA, 2005). In many developing
countries, fibre is recognized as a shortfall nutrient that is low in the daily diet, whereas,
a majority of Western populations do not meet the recommended intake of dietary fibres.
Further, epidemiological and intervention studies suggest that the intake of certain
fibres may delay glucose uptake and attenuate insulin response (Murakami et al., 2007).
Also, dietary fibres are effective in intestinal regularity. The gastrointestinal tract is
highly sensitive to dietary fibre, and the consumption of fibre seems to relieve and
prevent constipation (Marlett et al., 2002). Dietary fibres have a number of important

2
health benefits including promoting healthy laxation, reducing the risk of T2D, and
decreasing the risk of coronary heart diseases (U.S. Department of Agriculture, 2004).
Both observational and clinical studies suggest that the intake of certain fibres
may be useful in controlling body weight (Lindstrom et al., 2006). The 2005 dietary
guidelines for Americans (USDA) stated that a higher fibre content of food, particularly
whole grains, may help individuals feel full with less calories (USDA, 2005). In the
report defining the term high fibre diets were said to delay stomach emptying, which
increases the time for energy and nutrients to be absorbed from the digestive tract.
Additionally, several important review articles provide direct support for high fibre
intake and satiety/weight control. According to the IOM (2002) report, even though the
finding that the overall data on dietary fibre intake is negatively correlated with BMI is
suggestive of a role of fibre in weight control, the studies designed to determine how
fibre intake might influence overall energy intake have not shown a major effect
(Lindstrom et al., 2006). Epidemiological studies indicate that dietary fibre intake may
also protect against the development of obesity. In studies including more than 100,000
subjects and four prospective cohort studies, also including 100,000 subjects, a positive
association was found between fibre intake and obesity (Anderson, 2008).

3
As mentioned above, fibre intake tends to delay gastric emptying and create a
sense of fullness, since increased fibre intake is associated with an increase in the
satiating gut hormones. PGX (PolyGlycopleX; α-D-glucurono-α-manno-β-D-manno-β-
D-gluco; β-Lgulurono-β-D mannurono; β-D-gluco-β-D-mannan; Inovobiologic Inc.,
Calgary, Canada) is a unique, high-viscosity functional fibre that can be used in
functional foods, and dietary and health supplements (Abdelhameed et al., 2010;
Harding, et al., 2010). The efficacy of PGX has been the subject of over a dozen human
clinical studies conducted on a number of subjects over several weeks in Canada,
Australia, and France. PGX has also been clinically proven to correct appetite and
helpful for losing weight, lowering cholesterol, and controlling and balancing blood
sugar levels (Reimer et al., 2010; Lyon, & Reichert, 2010). In contrast to other fibres,
PGX holds its highly viscous properties despite the influence of stomach acid and
digestive enzymes. Viscosity is an important factor for the dietary fibre (Lyon, &
Reichert, 2010), but the PGX viscosity develops slowly after mixing with matrices (e.g.,
water, food, or other liquids), with maximum viscosity reached after 60 to 90 min, since
rapid increase in viscosity could be unpalatable and possibly resulting in esophageal
obstruction. Also, dietary fibre that develops viscosity in the gastrointestinal tract could
be capable of addressing various aspects of food intake control. PGX, in addition to

4
different food matrices is also highly effective in lowering the glycemic index of a food
in a dose-responsive manner (Lyon, & Reichert, 2010). Although a variety of dietary
fibres have been shown to alter satiety hormone gene expression and secretion, in a
randomized, double-blind, placebo-controlled 21-day clinical study, PGX revealed a
reasonable efficacy in increasing fasting PYY levels, and significantly decreased fasting
ghrelin and insulin levels (Reimer et al., 2010). PGX has been proven safe in a human
tolerance study (54 subjects) approved by French Health Authorities and in another
genotoxicity study showing the safety of PGX (Marone et al., 2009). PGX is safe to use,
without any serious side-effects, and was recognized to be Self-Affirmed GRAS
(Generally Recognized As Safe) and a Self-Affirmed Medical Food GRAS.

5
CHAPTER 2: HYPOTHESIS
The relationship of fiber intake and its effects on the metabolism is quite complex,
which may explain why many of the fiber-health studies do not show clear relationships
between fiber intake and the outcomes, such as in prevention of type-2 diabetes,
obesity, and weight loss. In a number of clinical trials evaluating the effect of PGX
consumption against placebo (cellulose), both fasting and postprandial blood glucose
were reduced. A few studies demonstrated the promotion of satiety and insulin secretion
through increasing plasma concentrations of GLP-1, PYY, PP, and leptin, by
suppressing GIP, ghrelin, and amylin levels. Consequently, the hypothesized relational
effect of PGX consumption on weight loss or obesity is of high interest. Thus, it is
hypothesized that that prototypes PGX with high viscosity and water –holding capacity
in the capsulated form would result a significant outcomes in the prevention of weight
loss or obesity under the prescribed dose (i.e. 750 mg PGX /dose ; maximum 6
capsules/day) selection and trial parameters. It is also hypothesized that prototype
capsule containing PGX with MCT would result somewhat significant results compared
to the granular form of the PGX studied in number of previous studies.

6
CHAPTER 3: OBJECTIVES
Since the majority of evidence from PGX-related clinical trials partially supports
the hypothesis that PGX consumption aids in weight loss or obesity, an objective of this
study is to further investigate the effects of PGX on weight loss and levels of
postprandial glucose, insulin, and especially gut peptides/hormones in overweight
subjects in a randomized, double-blind 13-week clinical trial. An additional objective of
this study is to determine the relative effect of the capsule form of PGX with MCT
treatment, in comparison to the granular form. The outcome of this trial may be helpful
in preventing and managing overweight syndromes and controlling postprandial blood
glucose levels.
7
CHAPTER 4: LITERATURE REVIEW
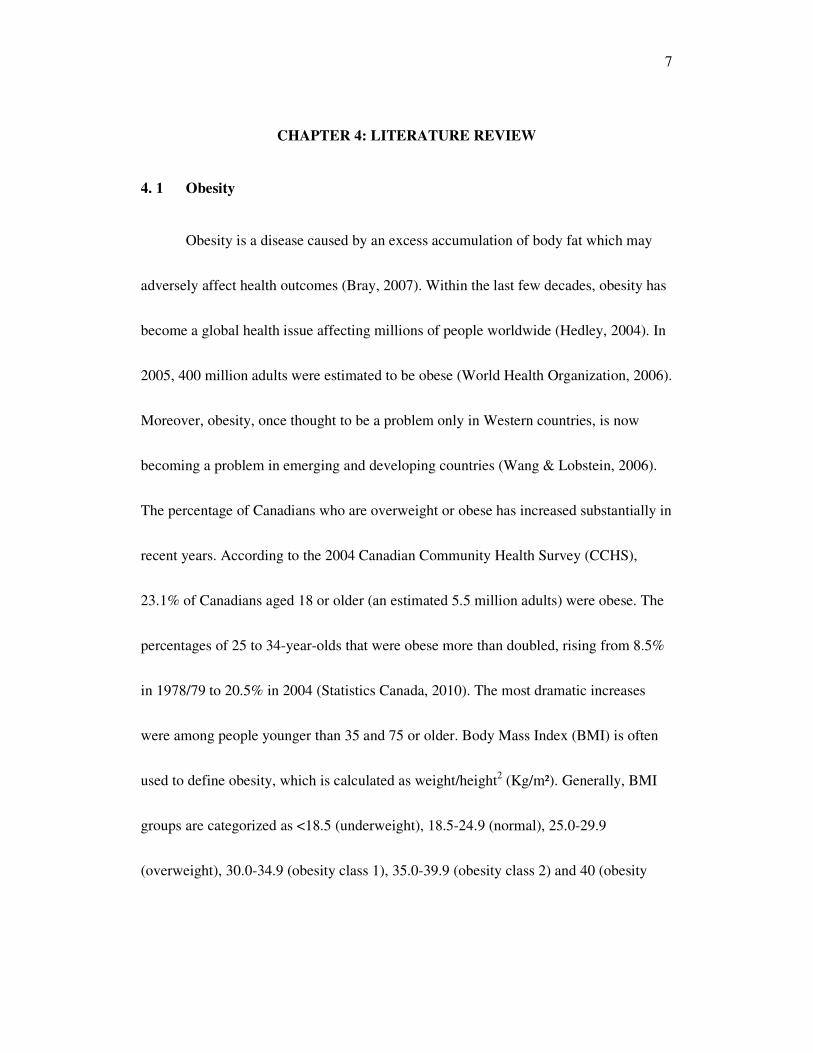
4. 1 Obesity
Obesity is a disease caused by an excess accumulation of body fat which may
adversely affect health outcomes (Bray, 2007). Within the last few decades, obesity has
become a global health issue affecting millions of people worldwide (Hedley, 2004). In
2005, 400 million adults were estimated to be obese (World Health Organization, 2006).
Moreover, obesity, once thought to be a problem only in Western countries, is now
becoming a problem in emerging and developing countries (Wang & Lobstein, 2006).
The percentage of Canadians who are overweight or obese has increased substantially in
recent years. According to the 2004 Canadian Community Health Survey (CCHS),
23.1% of Canadians aged 18 or older (an estimated 5.5 million adults) were obese. The
percentages of 25 to 34-year-olds that were obese more than doubled, rising from 8.5%
in 1978/79 to 20.5% in 2004 (Statistics Canada, 2010). The most dramatic increases
were among people younger than 35 and 75 or older. Body Mass Index (BMI) is often
used to define obesity, which is calculated as weight/height2 (Kg/m²). Generally, BMI
groups are categorized as <18.5 (underweight), 18.5-24.9 (normal), 25.0-29.9
(overweight), 30.0-34.9 (obesity class 1), 35.0-39.9 (obesity class 2) and 40 (obesity

8
class 3) (Bray, 2007). Obesity may also be measured by waist circumference and body
composition, using several different analytical techniques.
4.1.1 Obesity: prevalence and causes.
Obesity is associated with increased mortality from cardiovascular disease
(CVD), kidney failure, diabetes, and different types of cancer. According to Statistics
Canada (2004), obesity rates (BMI > 30 Kg/m²) in Canada have risen from 14% in 1978
to over 23% in 2004. In the US, obesity is estimated to cost the health care system $117
billion annually (U.S. Department of Health and Human Services, 2001). The exact
cause of obesity is not known, though it is likely an interplay of genetic and
environmental factors. The key environmental factors include: excess energy intake
and/or decreased activity (Bray, 2007).
In general, rising rates of obesity have been related to increased consumption of
sugar formulated beverages and energy dense foods. Usually, the food choices by obese
people are defined in terms of abnormal activities in biology, behavior, and physiology
(Drewnowski, 1998), where the cravings for obesogenic foods are driven by central
metabolic events. Some examples of these include an imbalance of serotonin and
dopamine, increased leptin levels, and the functioning of the endogenous opiate peptide
system.

9
4.1.2 Health risks of obesity.
Obesity places a large burden on the healthcare system and on society, with cost
estimates of between 5.3-7.0% of the annual medical expenditures of the health budget
in the US and Canada (Bray, 2007). Age-standardized results indicate that 29.7% of
Americans aged 18 or older were obese in 1999-2002, which is significantly higher than
the 2004 figure for Canada (23.1%). Most of the difference was attributable to the
situation among women. While 23.2% of Canadian women were obese, the figure for
American women was 32.6% (Wang, & Lobstein, 2006). Somewhat similar trends have
been observed worldwide. Generally, overweight people are at higher risk of disability
at work, coronary heart disease (CHD), and more likely to be on long-term medication
than their normal-weight counterparts (Bray, 2007).
Obesity is associated with other chronic diseases such as stroke, hypertension,
and type-2 diabetes (T2D) mellitus (Bray, 2007). It was reported in one study that 79%
of diabetic patients were overweight and of these 46% had BMIs that were higher than
30 kg/m² (Bray, 2007). In a recent survey, the numbers are slightly increased to 82.7%
of diabetics being overweight and 54.8% having BMIs of higher than 30 kg/m².
Although the risk of diabetes was the lowest among individuals with BMIs below 22
kg/m², the risk of T2D increased with the degree and duration of being overweight

10
(Bray, 2007). For example, at a BMI higher than 35 kg/m², the relative risk of T2D
increased 40-fold with increasing BMI (Bray, 2007).
4.2 Dietary Supplements and Obesity Treatment
4.2.1 Medium chain triglycerides.
A number of reviews have addressed the approaches and methods for treating
overweight and obesity (Daniels, 2005; Seidell, 2005; Swinburn, 2004; Bray, 2007). In
this regards, the dietary approaches, including dietary supplements, have been examined
for their efficacy in treating obesity. Most notably, dietary fibre and MCT have been
demonstrated to be helpful for weight loss in several animal and human studies (Bray,
2007; Hashim & Tantibhedyangkul, 1987; Tsuji et al., 2001; Papamandjaris et al., 2000).
It is generally known that MCT, which typically consist of fatty acids with chain lengths
of <10 carbon atoms is processed by the human body somewhat differently from long
chain triglycerides (LCT) (Babayan, 1987). It has also been shown that MCT
consumption produces a greater rise in fat oxidation, compared to that of LCTs, which
is believed to be linked to lower initial body weight and greater loss of subcutaneous
adipose tissue in a study of energy expenditure (EE) and body composition in 19
healthy overweight men aged 44.5± 2.5 years with BMI of 27.8± 0.29 kg/m2 (St-Onge,
& Bourque et al., 2003; St-Onge & Ross et al., 2003). A decrease in body weight (p <

11
0.05) by 10.3 ± 0.25 kg with MCT consumption was reported, in comparison to a
decrease to 0.62 ± 0.29 Kg with LCT consumption (St-Onge & Bourque et al., 2003). It
was also concluded that MCT consumption may stimulate EE and fat oxidation to a
lower extent in men of greater bodyweight, compared to men with lower bodyweight.
From reports in the literature on the positive effects on thermogenesis and fat deposition
with MCT consumption, MCT may be a helpful adjunct to weight loss diets. Moreover,
some reports suggest that MCT increases satiety, when compared to LCT (St-Onge &
Ross et al., 2003). The positive effect of MCT on energy balance and health benefits
have been often reported in the literature due to their fast metabolism, lack of deposition
into adipose tissue, and rapid transit into the human body, which helps to increase
energy expenditure. A recent, detailed review describes the benefits of MCT in
promoting weight loss, since MCT may increase fat oxidation and energy expenditure,
to alter body composition (Miriame, 2010). In another article, the authors revealed that
weight-loss diets that include consumption of MCT lead to a greater rate of weight and
fat mass loss, when compared to olive oil (St-Onge & Bosarge, 2008). Furthermore, the
effect of MCT on weight loss and insulin sensitivity in a group of moderately
overweight, free-living T2D Chinese subjects was reported (Han et al., 2007), which
was attributed to an involuntary reduction in energy intake (P<0.05 in repeated
12
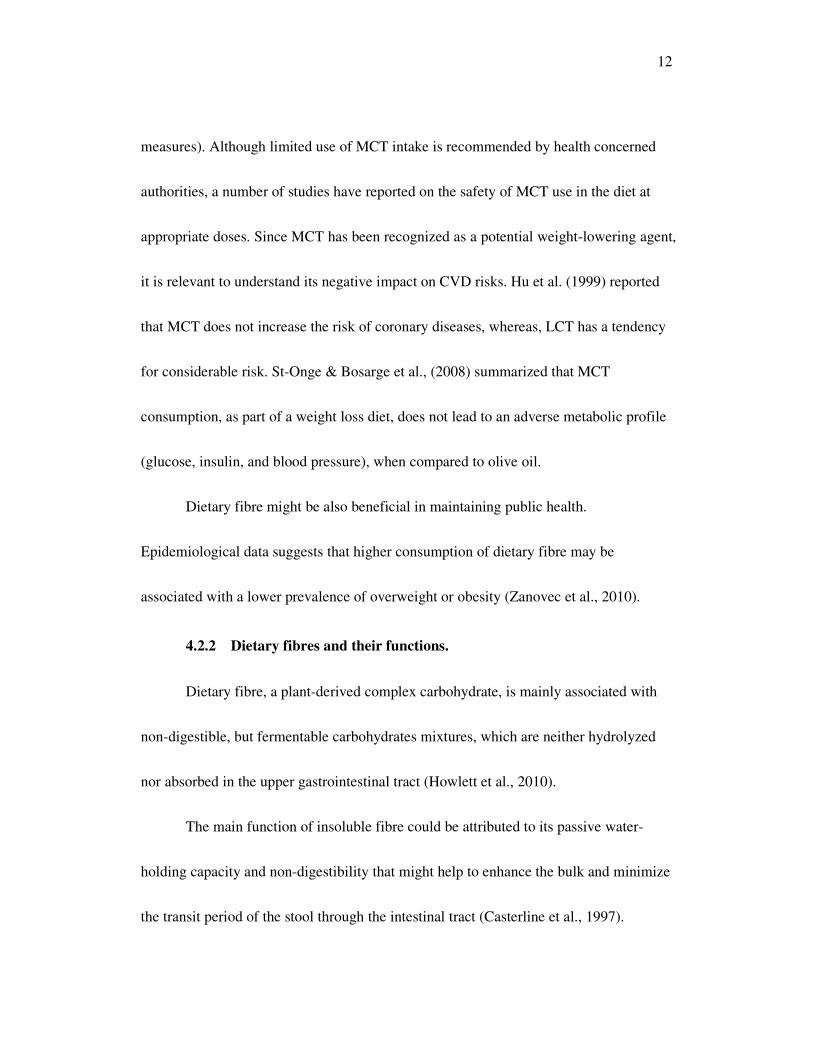
measures). Although limited use of MCT intake is recommended by health concerned
authorities, a number of studies have reported on the safety of MCT use in the diet at
appropriate doses. Since MCT has been recognized as a potential weight-lowering agent,
it is relevant to understand its negative impact on CVD risks. Hu et al. (1999) reported
that MCT does not increase the risk of coronary diseases, whereas, LCT has a tendency
for considerable risk. St-Onge & Bosarge et al., (2008) summarized that MCT
consumption, as part of a weight loss diet, does not lead to an adverse metabolic profile
(glucose, insulin, and blood pressure), when compared to olive oil.
Dietary fibre might be also beneficial in maintaining public health.
Epidemiological data suggests that higher consumption of dietary fibre may be
associated with a lower prevalence of overweight or obesity (Zanovec et al., 2010).
4.2.2 Dietary fibres and their functions.
Dietary fibre, a plant-derived complex carbohydrate, is mainly associated with
non-digestible, but fermentable carbohydrates mixtures, which are neither hydrolyzed
nor absorbed in the upper gastrointestinal tract (Howlett et al., 2010).
The main function of insoluble fibre could be attributed to its passive water-
holding capacity and non-digestibility that might help to enhance the bulk and minimize
the transit period of the stool through the intestinal tract (Casterline et al., 1997).

13
Insoluble fibres also stimulate the growth of colonic micro flora that is helpful in
increasing biomass. Soluble fibre is completely or partially fermentable in the large
intestine, via the action of colonic bacteria, to produce short chain fatty acids (SCFA)
such as butyrate, propionate, and acetate (Wong et al., 2006; Velázquez et al., 2000;
Wright et al., 1990). The SCFA positively contribute toward a number of health benefits,
from colonic health to cardiac health, via well-established biochemical pathways (Wong
et al., 2006; Velázquez et al., 2000; Wright et al., 1990). In summary, the soluble fibre
enhances the viscosity of the stomach contents, reduces absorption of fatty acids,
regulates blood sugar in the body, and helps in reducing cardiac risk factors such as
triglycerides, cholesterol, and reactive proteins (Topping, 1991). A generous intake of
dietary fibre could also reduce risk for CHD, hypertension, obesity, diabetes, stroke,
certain gastrointestinal disorders, and improve blood glucose control in diabetes,
promote regularity, help in weight loss, and improve immune functions (Whelton et al.,
2005; Steffen et al., 2003; Liu et al., 1999; Montonen et al., 2003; Lairon et al., 2005).
Presently, consumers are also more aware of the fibre benefits due to many human
research clinical trials on the health benefits of fibre and the variety of available fibre
products in the market. Therefore, a balanced diet should contain both soluble and
insoluble dietary fibres. Since dietary fibres provide similar benefits to both minors and

14
adults, the recommended dietary fibre intake for adults is 14 g/1000 kcal. Using the
energy guidelines of 2000 kcal/day for women and 2600 kcal/day for men; however, the
recommended daily dietary fibre dose is 28 g/day and 36 g/day for women and men,
respectively (U.S. Department of Agriculture, 2005). This includes the non-starch
polysaccharides, analogous carbohydrates, lignin, and associated components (DeVries
& Rader, 2005).
The purpose of this section is to outline the effects of dietary fibres on health.
Plenty of reports exist on the disease prevalence and events, that are often summarized
from epidemiological studies; however, few reports are focused on the effect of the
composition of high fibre foods or food sources of fibre. Numerous reports are also
available relating the effect of fibre supplements on serum lipids, weight management,
postprandial glycemia, or gastrointestinal functions (Keenan et al., 2002; Petruzziello et
al., 2006; Anderson et al., 2004; Brown et al., 1999; Cummings, 2001).
CVD, such as CHD, stroke, and hypertension are the leading cause of morbidity.
Moreover, high levels of dietary fibre ingestion are associated with significantly lower
prevalence rates for the aforementioned diseases. Soluble or viscous fibres may promote
significant positive effects on hypocholesterolemic status (Kirby et al., 1981). Extensive
studies with guar gum has focused on several diseases. Psyllium and oat beta-glucan

15
are also widely used sources of soluble fibre and the FDA has approved health claims
related to protection from CHD for soluble dietary fibre (U.S. Department of Health and
Human Services FDA, 1997; 1998). Some information is also available for konjac
mannan (glucomannan), suggesting its significant hypocholestrolemic effects (Chen et
al., 2003). Whereas, gum arabic, partially hydrolyzed guar gum, and methylcellulose
seem to show limited hypocholesterolmic effects (Haskell et al., 1992; Yamada et al.,
1999; Anderson & Floore, et al., 1991). According to several studies, especially with
hypertensive subjects, an increase in consumption of dietary fibre is usually
accompanied by a reduction of systolic and diastolic blood pressure. In addition to the
above, dietary fibre has favorable effects on other factors such as body weight, visceral
adiposity, insulin sensitivity, and inflammatory markers (Delzenne & Cani, 2005; Davy
& Melby, 2003; Bo et al., 2006).
The role of dietary fibres in diabetes prevention and management has been
extensively studied, in the wake of the alarming worldwide increase in diabetes, due to
the presence of metabolic syndrome (Zimmet, 2010). High levels of dietary fibres,
leading to decreased postprandial glycemia, insulinemia, and enhanced insulin
sensitivity, could prevent the metabolic syndrome, a group of abnormalities including
insulin resistance, dyslipidemia, and hypertension (Anderson, 2008). General nutrition

16
guidelines, published by nine different influential agencies, also recommended the
beneficial effects of increased fibre intake on weight management, with specific
mention that the intake of whole grain or cereal fibres can protect against the
development of obesity. Cross-sectional studies have shown that men and women with
the highest level of fibre consumption have a lower relative risk for obesity of 0.77
(95% CI), compared to those with lower fibre intake levels (Anderson, 2008). The effect
of dietary fibres on satiety and energy intake is poorly understood. Several studies have
examined changes in orexigenic or onorexigenic hormones, and more than 20 gut
hormones involved in regulation of eating style and behavior (Anderson, 2008; Haber et
al., 1977). Nevertheless, a systematic approach is needed to estimate the connection
between key gut hormones and different types and/or formulations of fibres, to provide
useful information on these issues.
Gastrointestinal functions of dietary fibre on human health are widely reported
in the literature, showing the effect of dietary fibres on the entire gastrointestinal tract.
Soluble fibres usually delay gastric emptying and the digestion of food through the
small intestine, whereas, insoluble fibres seem to produce an intestinal slurry and are
especially active in increasing fecal mass and promoting regularities (Cummings, 2001).
Some fibres bind bile acids and impede micelle formation, which increases fecal

17
excretion of bile acids and cholesterol (Kirby et al., 1981). In the colon, fermentable
fibres may act as prebiotics to promote health-promoting bacteria such as bifidobacteria
and lactobacilli (Roberfroid, 2005). Therefore, the use of fibre-rich food is
recommended for a large variety of gut disorders such as gastro-esophageal reflux
disease, duodenal ulcers, inflammatory bowel disease, irritable bowel syndrome,
constipation, hemorrhoids, and colorectal cancer (El-Serag et al., 2005; Aldoori et al.,
1997; Tsai et al., 2004; Aldoori, 1997). Among these, irritable bowel syndrome is one
of the most common gastrointestinal functional disorders worldwide with various
pathogenetic factors, including abdominal pain or discomfort, diarrhea, constipation,
and bloating (Smith, 1974). Guar gum and, possibly other soluble fibres are associated
with low levels of gastric acid production, which may protect from duodenal ulcers or
irritable bowel syndrome (Harju, 1984; Giannini et al., 2006). Most prebiotics are non-
digestible carbohydrates, which are fermented and stimulate growth of bifidobacteria in
the colon, resulting in the formation of SCFA (Wright et al., 1990). Bifidobacteria
protect against intestinal infections, lowering the pH for formation of acids after
assimilation of carbohydrates, reduce the number of potentially harmful bacteria,
produce vitamins and antioxidants, activate the intestinal functions, assist in digestion
and absorption, stimulate activity to prevent and treat constipation, stimulate the

18
immune response, and potentially reduce the risk for colorectal cancer (Wu et al., 2007).
Dietary fibres have also been used in the treatment of child obesity. In a cross-over
study of obese children, 15 g/day dietary fibre, which is added to a high-calorie diet
even showed a greater mean weight loss despite of the calorie content, compared to the
non-fibre treatment period (Gropper & Acosta, 1987). Thus, dietary fibres are certainly
one of the recommended functional ingredients, promoting positive effects in
maintaining good health and preventing many of the metabolic syndromes.
In general, various types of plants are rich in water-soluble fibre. Psyllium, guar
gum (intact or partially hydrolyzed), pectin, defatted fenugreek seed powder, and
glucomannan from konjac root all provide rich sources of fibre, and some seaweeds
provide fibres such as carrageenan and alginate. These types of dietary fibre are usually
associated with lowering cholesterol levels, reducing postprandial blood sugar levels,
and thus promoting weight loss. When consumed with enough water prior to meals,
these fibres bind to the water in the stomach and small intestine to form a gelatinous,
viscous mass, which decreases the absorption of calories by slowing down the
absorption of plasma glucose and inducing a sense of satiety (Carabin et al., 2009). In
such cases, the target population is expected to be individuals who need to regulate their
energy intake. Satiety is inferred as a decrease in hunger after consumption of fibre-rich

19
foods, leading to a reduction in energy intake (Brand-Miller et al., 2010). It is generally
accepted that an increase in satiety might be a favorable physiological effect. Therefore,
in some weight loss clinical studies, fibre supplements were found to reduce absorbed
calories by a factor of 50 to 200 calories, on a daily basis, which corresponds to a 5 to
20 pound weight loss over the course of a year. Dietary fibre supplements may exert a
dose-dependent effect in lowering body weight, and levels of cholesterol and blood
glucose. A number of clinical studies have repeatedly suggested that postprandial blood
sugar levels decrease as soluble fibre viscosity increases (Lyon, & Reichert, 2010;
Jenkins et al., 2000). These relationships have been confirmed in several physiological
benefits brought by soluble fibres, such as diminished appetite, decreased serum
cholesterol, increased insulin sensitivity, improved bowel movements, and significant
weight control.
4.2.3 Polyglycoplex.
The Polyglycoplex (PGX) is a unique and novel polysaccharide with high
viscosity, manufactured with proprietary technology under good manufacturing practice
(GMP). The product is constituted from three, highly purified water-soluble
glucomannans from konjac powder, and sodium alginate and xanthan gum.
Glucomannans [β-D-(1-4)-linked linear polymer of glucose to mannose is substituted

20
with acetate every 9 to 19 sugar units] are well known for their fermentation in the large
intestine. Alginates and xanthan gums are algal polysaccharides and a polysaccharide
produced by the bacterium Xanthomonas campestris, respectively. These compounds
are used in the food industry as stabilizers or thickening agents (Abdelhameed et al.,
2010; Harding et al., 2010). PGX is a mixture of molecules with the highest viscosity
and water-holding capacity among currently known dietary fibres, and the three
components (konjac mannan, sodium alginate, and xanthan gum) act synergistically to
form strong interactions through non-covalent bonds, to increase the viscosity level 3 to
5 times higher than any known individual polysaccharide material (Harding et al., 2010;
Lyon, & Reichert, 2010). For example, PGX is 3-fold as viscous as guar gum and nearly
8-fold as viscous as the psylliums, which are also soluble type of fibres. The overall
formula of PGX could be derived as α-D-glucurono-α-D-manno-β-D-manno-β-D-
glucan,α-L-gulurono-β-D manunuronan, β-D-gluco-β-D-mannan, α-D-glucurono-α-D-
manno-β-D-manno-β-D-manno-β-D-gluco, α-L-gulurono-β-D-mannourono, β-D-
gluco-β-D-mannan (Figure 4.1).

21
Figure 4.1: Schematic diagram of molecular structure of PGX
components (Harding et al., 2010)
To achieve the maximum benefit of dietary fibre, the recommendation is to
consume between 20 and 35 g of dietary fibre, though consuming the required amount
from daily food sources would be difficult. Individuals who suffer from insulin
resistance, diabetes, or obesity epidemic could benefit by taking PGX as a supplement,
because of its unique properties (i.e., high viscosity). In a recent review, the authors

22
claimed that 5 g of PGX is capable of absorbing nearly 1 L of water, which is
numerically equal to 5 or 6 times as much of any other dietary fibre (Lyon, & Reichert,
2010). This provides an opportunity to consume an extra amount of food material to
improve satiety without consuming unnecessary calories. PGX also helps in lowering
the absorption of carbohydrates, which has been reported to have beneficial effects to
the glycemic index. These unique characteristics of PGX may also make it useful for
lowering cholesterol, and maintaining a healthy blood glucose balance, to substantially
improve the daily use of dietary fibre in common diets. PGX significantly lowers
postprandial blood glucose (after a meal) by nearly 20% and also reduces insulin
secretion by 40%. This corresponds to an improvement of the whole body insulin
sensitivity index by nearly 50%, which is a significant accomplishment. In addition,
PGX is suggested to have effects in lowering triglyceride levels. These characteristics,
along with its excellent safety profile, place PGX as a strong supplement on the list of
functional food products for diabetics. In a series of related publications, PGX is
claimed to offer benefits in therapeutic applications related to diabetes, obesity, elevated
blood lipids (high cholesterol), heart disease, and a cluster of disorders collectively
known as metabolic syndrome (Lyon, & Reichert, 2010). Although the gel-forming
fibres (partially soluble or insoluble) with their higher viscosity have been often studied

23
for their ability to reduce CVD risk factors, particularly in overweight and obese
subjects, only a few studies have examined the usefulness of soluble fibre and mixtures
for controlling and reducing body weight, with variable results. Similarly, in a PGX trial,
significant weight loss was observed in both men and women participants, and the
results showed a reduction in several risk factors associated with moderate obesity
(Lyon, & Reichert, 2010). PGX contains 87.4% dietary fibre, of which 81.8% is a
soluble fibre (Brand-Miller et al., 2010).
In addition, the PGX complex has been well studied for its safety. In a recent,
90-day rodent feeding study, 10 male and 10 female Sprague Dawley rats were fed
viscous PGX dietary fibre (Matulka et al., 2009). The authors found no observed
adverse effect level (NOAEL) for PGX at 5% of the diet, which corresponds to an
average daily intake of 3129 and 3799 mg/kg bw/day in male and female rats,
respectively. No noticeable difference in mean organ weight, organ to body weight, or
organ to brain weight values were seen between control and treated animals (Jenkins et
al., 2000). In another human study (total of 54 participants), supplementation of the diet
with the functional PGX fibre was evaluated. The results revealed that PGX is well
tolerated as part of a regular healthy diet with limited adverse effects. The study was
designed to examine the tolerance of PGX ingestion for 21 days, to a maximum dose

24
level of 10 g/day in both healthy male (42) and female (47) participants with a mean age
of 31.6±10.5 years (Carabin et al., 2009). Moreover, Marone et al., (2009) presented a
genotoxicity study of PGX that reported no mutagenic effects when using a bacterial
reverse mutation and mouse micronucleus assay. The absence of genotoxic activity of
PGX in the bacterial reverse mutation assay and mammalian erythrocyte micronucleus
test of murine peripheral blood cells was confirmed along with a noted adaptation for
the viscosity of PGX in both procedures, which was considered to be within the normal
range for use in the food industry.
Research carried out at the University of Toronto revealed that PGX
significantly decreases the glycemic index in a dose-dependent manner with commonly
consumed foods such as cornflakes, rice, white bread, and granola (Matulka et al., 2009).
In the randomized controlled trial, two groups of 10 healthy subjects were assigned to
each group (Group 1: 5 male, 5 female; 35.6±13.2 years; 24.6±2.1 kg/m2; and Group 2:
3 male, 7 female; 33.5±11.1 years; 26.3±5.2 kg/m2). Varied contents of PGX (0, 2.5, 5,
and 7.5 g) were added to glucose drink (Group 1) or to white bread and margarine
(Group 2) and fed to subjects. Blood glucose concentrations were measured at different
durations after the start of the meal. The results indicated that the addition of a 7.5 g
dose to glucose significantly (p <0.001) reduced the blood glucose concentration, and

25
the 5 and 7.5 g doses added to white bread + margarine were also significant (p<0.001).
In another recent trial, 7.5 g of PGX novel fibre supplement was shown to reduce the
blood glucose response over a two-hour period by 50% (p< 0.001), and was capable of
reducing the postprandial response by up to 28% (p< 0.001) (Brand-Miller, Atkinson,
Gahler, Kacinik, Lyon & Wood, 2010). The trial was conducted with 10 subjects from a
pool of 16 (8 males and 8 females; age 24.4±2.6 years) and granular PGX supplement
was given at four doses (0, 2.5, 5.0, and 7.5 g) with breakfast. In a second study,
granular (5 g) and capsule (4.5 g) forms of PGX were given in single doses at -60, -45, -
30, -15, and 0 before and +15 minutes after a bread meal. In a third study, capsules of
PGX (at increasing doses: 1.5, 3.0, 4.5, and 6 g) were fed with evening meal to measure
the effects on glucose tolerance at breakfast. The overall conclusion from the study was
that PGX has biologically important, dose-related effects on acute and delayed
postprandial glycaemia.
PGX has also been reported to have significant effects on obesity treatment.
Recent studies suggest how PGX might promote weight loss and reduce the related risk
factors for developing obesity. In a randomized, double-blind study, 5 g of PGX was
added to a meal replacement, resulting in some appetite suppression, compared to a low
and a medium viscosity dietary fibre. The authors also suggested that the viscosity of
26
the fibre might have an impact on satiety by promoting the secretion of anorexigenic gut
peptide hormones such as peptide YY, glucagon-like peptide-1 (GLP-1) and
cholecystokinin (Reimer et al., 2010). In an original article, Reimer et al. showed an
increase in plasma PYY levels following the supplementation with functional PGX fibre
in healthy adults, over the 21-day trial. PGX has also been reported to reduce the risks
of metabolic syndrome, including waist circumference, improvement in insulin
sensitivity, lowering of cholesterol, and fasting and postprandial blood glucose levels
among human subjects (Reimer et al., 2010). Several other research studies have also
clearly indicated the positive effects of PGX on SCFA production, the influence on
appetite-regulating hormones for appetite control, and the stabilization of blood glucose
and insulin levels (Carabin et al., 2009). In a retrospective 14-week study, the useful
effect of novel PGX fibre was shown on lifestyle changes, short-term weight loss, and
its associated risk factors in obese and overweight adults. A total of 29 sedentary
overweight or obese adults (23 female; 6 male), ages 20-65 years, with BMIs ranging
from 25-36 kg/m2 participated (Lyon, & Reichert, 2010). Five grams of PGX with 500
mL of water was ingested 5-10 min before each meal, 2-3 times per day, for a
consecutive 14 weeks, and compared to baseline. The results showed a significant
reduction (p<0.05) of -5.79±3.55 kg, -12.07±5.56 cm, and -2.43±2.39% in weight, waist
27
circumference, and percentage body fat, respectively. Total and LDL plasma cholesterol
reduction was also significant (p< 0.05) for the PGX group.
4.3 Blood Glucose, Insulin, and Gut Peptides
4.3.1 Insulin, glucagon, and blood glucose regulation.
Insulin and glucagon are two major pancreatic hormones, which are secreted
from the pancreas for glycemic control. Insulin is encoded by the INS gene and mainly
expressed in the beta cells of the pancreas (Bell et al., 1980), plays an important role in
glucose uptake from the blood, and stores excessive glucose as glycogen in the liver and
muscle (Odegaard & Chawla, 2008). A summary is listed in Table 4.1. Usually, insulin
stimulates the synthesis of glycogen, fatty acids, amino acids, and potassium uptake,
and decreases proteolysis and lipolysis (Lomberk & Urrutia, 2009). The first-phase
response of insulin (nearly 10 min after meal intake) can be an important biomarker for
T2D, as the level of first-phase insulin secretion among T2D patients is much lower
than in normal healthy people, due to their pancreatic functioning (Caumo & Luzi,
2004; Cutfield, et al., 2000; Bertram et al., 2007). Insulin secretion is regulated through
a oscillation system, instead of through continuous secretion, with insulin release
oscillating with a period of 4-6 min. This avoids continuous insulin secretion, which
could induce down-regulation of insulin receptors (Bertram et al., 2007). Consequently,

28
mimicking the oscillation function by injecting insulin is difficult for T2D patients, so
that enhancing insulin secretion in a natural way would be ideal. Alternatively,
glucagon is released from the alpha cells during hypoglycemia, to stimulate glycogen
breakdown and increase blood glucose levels. Glucagon secretion also suppresses
insulin secretion to prevent the uptake of blood glucose (Kawamori et al., 2009).
Table 4.1: Descriptive summary of studied peptides and hormones
Gene/Cell/
Location/ Half Life/
Receptor
Characteristics Physiological
Functions
Insulin
INS Beta Cell Pancreas 70 min IRS-1
• Oscillations
• Insulin sensitivity is low among T2D patients
• Glucose uptake
• Stores glucose as glycogen
GLP-1
Proglucagon L Cell Ileum/Colon 2-5 min GLP-1 R
• Degraded by an enzyme DPP-4
• Stimulates Insulin
• Inhibits Glucagon
• Stimulates satiety, beta cell mass
• Inhibits gastric emptying, food intake, etc.
GIP
GIP K Cell Duodenum/Jejunum 7-8 min GIP R
• Resistant among T2D patients
• Stimulates postprandial insulin secretion
29
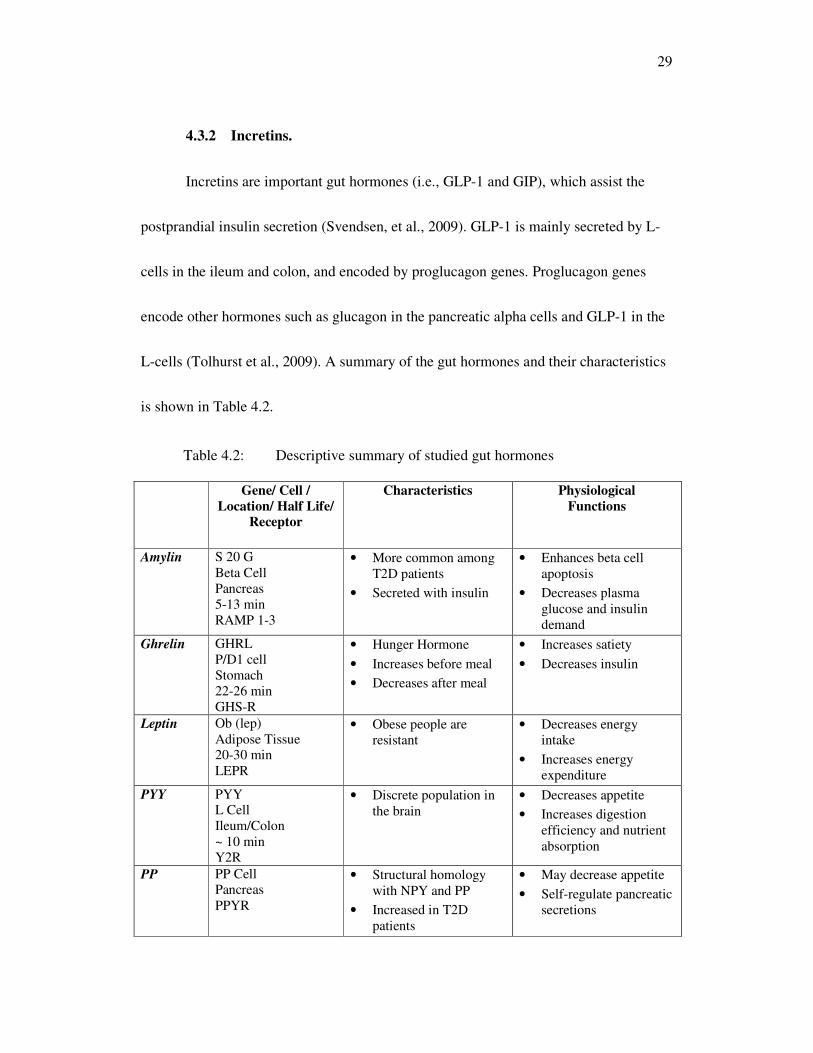
4.3.2 Incretins.
Incretins are important gut hormones (i.e., GLP-1 and GIP), which assist the
postprandial insulin secretion (Svendsen, et al., 2009). GLP-1 is mainly secreted by L-
cells in the ileum and colon, and encoded by proglucagon genes. Proglucagon genes
encode other hormones such as glucagon in the pancreatic alpha cells and GLP-1 in the
L-cells (Tolhurst et al., 2009). A summary of the gut hormones and their characteristics
is shown in Table 4.2.
Table 4.2: Descriptive summary of studied gut hormones
Gene/ Cell /
Location/ Half Life/
Receptor
Characteristics Physiological
Functions
Amylin S 20 G Beta Cell Pancreas 5-13 min RAMP 1-3
• More common among T2D patients
• Secreted with insulin
• Enhances beta cell apoptosis
• Decreases plasma glucose and insulin demand
Ghrelin GHRL P/D1 cell Stomach 22-26 min GHS-R
• Hunger Hormone
• Increases before meal
• Decreases after meal
• Increases satiety
• Decreases insulin
Leptin Ob (lep) Adipose Tissue 20-30 min LEPR
• Obese people are resistant
• Decreases energy intake
• Increases energy expenditure
PYY PYY L Cell Ileum/Colon ~ 10 min Y2R
• Discrete population in the brain
• Decreases appetite
• Increases digestion efficiency and nutrient absorption
PP PP Cell Pancreas PPYR
• Structural homology with NPY and PP
• Increased in T2D patients
• May decrease appetite
• Self-regulate pancreatic secretions
30
GLP-1 binds the GLP-1 receptor located in the pancreatic beta cells, which also
has a low affinity for GIP and glucagon, to exert several physiological functions (Wren
& Bloom, 2007). For example, when the same amount of glucose is available, oral
glucose intake stimulates insulin secretion more than does injecting glucose
intravenously, due to secretions of incretin hormones in the gut. When GLP-1 binds to
the receptor, it activates an adenylyl cyclase pathway and a number of protein kinases
(Ramos et al., 2008). Subsequently, it potentiates glucose-induced closure of the ATP-
dependent potassium channels, which stimulates membrane depolarization and an influx
of calcium ions. Finally, it facilitates the exocytosis of insulin-containing secretory
granules and releases insulin (Lomberk & Urrutia, 2009). GLP-1 also enhances satiety,
beta cell reproduction, decreases glucagon secretion, and inhibits stomach acid secretion,
gastric emptying and food intake, which could be beneficial for obese and diabetic
patients (Knop et al., 2009). One of the major problems with GLP-1 is that its half-life
is usually around 2 min, because of the degradation by dipeptidyl peptidase-IV (DPP-4),
which is found in many cells (Deacon et al., 2008). To increase plasma GLP-1 levels,
the DPP-4 activity must be inhibited. Nevertheless, DPP-4 also has a significant role in
cancer and tumor suppression through immune regulation, signal transduction, and

31
apoptosis, so that the balance in activities is critical (Wesley, 2004). Incretin mimetics,
such as Exenatide (Byetta) could be a new way to treat T2D. These agents, originally
found in the Gila monster, are GLP-1 agonists, but are not degraded by DPP-4
(Gentilella et al., 2009).
4.3.3 Other gut-derived peptides.
Amylin: Amylin is co-secreted with insulin and helps to decrease glucose
disappearance from plasma, and decrease food intake, gastric emptying, and the
digestive enzymes (Otto-Buczkowska et al., 2008; Ratner et al., 2004). Such
physiological effects would help to reduce the insulin demand. Nevertheless, the
accumulation of amylin can form amyloid, which stimulates apoptic cell death of the
insulin-producing beta cells in the pancreas, resulting in a reduction of insulin secretion
(Lorenzo, et al., 1994; Neumann, et al., 2008). For 80 years, insulin was the only
pharmaceutical product for type-1 diabetes patients, until an amylin synthetic analogue
was successfully introduced in the American market in 2005. The product, called
Symlin, can be prescribed for diabetic patients who have poor glycemic control with
insulin therapy (Edelman et al., 2008). Amylin is mainly encoded by the S20 gene by
pancreatic beta cells, which is also known to be increased in T2D patients (Pittner, et al.,
1994). Amylin is also known as islet amyloid polypeptide and it binds specific types of

32
receptors called RCMP, that contain calcitonin receptors (calcitonin is a
thyroid hormone that lowers the calcium level in the blood plasma and inhibits the
resorption of bone (Hay, et al., 2004).
Leptin: Leptin is mostly found in white adipose tissues and encoded by the Ob
(lep) gene (Brennan & Mantzoros, 2006). Leptin is well known to suppress energy
intake and enhance energy expenditure, and is capable of binding several receptors,
such as LEPR in the hypothalamus, which is considered as an appetite control center
(Ragin, et al., 2009; Palou, et al., 2009). When leptin binds the LEPR receptor, it
decreases satiety stimulating substances such as neuro-peptide Y (NPY) and Agouti-
related protein (AgRP). Thus, leptin may be used as a biomarker for body fat, since it is
widely found in adipose tissues, especially among obese people. Nevertheless, obese
people are resistant to leptin and may not be able to receive the beneficial physiological
effects of leptin (Weigle, et al., 1997). A very low calorie, short-term diet has been
reported to decrease the amount of leptin, whereas over feeding had no effect on leptin
(Dubuc, et al., 1998). Ogawa et al. (1999; 2002) developed a new type of mice called
Skinny Mice in Japan, which have 10-times more leptin than average mice. The mice
have several interesting physiological characteristics, such as less adipose tissue, low
blood glucose, high blood pressure and better insulin sensitivity.

33
Ghrelin: Ghrelin is acknowledged to be a hunger hormone, since it stimulates
hunger and it increases before food intake, and decreases after meal consumption.
Ghrelin is mainly expressed by P/D1 cells and epsilon cells, which are commonly found
in the stomach and pancreas, respectively (Inui, et al., 2004). Ghrelin is identified as
promoting food intake, fat mass, NPY production, and the consumption of addictive
substances like drug and ethanol. Ghrelin also decreases the insulin production, and
extremely high amounts of ghrelin has been observed in anorexic people. Also, obese
people tend to have relatively high amounts of ghrelin, compared to skinny and lean
people (Field, et al., 2008). Furthermore, the bariatric process has been reported to
decrease the levels of ghrelin, and short-sleep may increase ghrelin. To suppress the
amount of circulating ghrelin, several types of antibodies have been developed in a
ghrelin vaccine, for possible commercial use in the near future. Ghrelin has several
important physiological roles in human metabolism, and also decreases stress-induced
depression (Santos, et al., 2006; Lutter, et al., 2008). It is also identified as a neutrophin
in the hippocampus area, and improves memory and learning skills (Jones, 2003).
Peptide-Tyrosine-Tyrosine (PYY): PYY is an important satiety-suppressing
gut peptide, widely found in L-cells in the ileum and colon, and also has a discrete
population in the brain (Field, et al., 2008). PYY binds Y2R, an NPY receptor, and
34
decreases gastric motility, gut emptying, and satiety, and also increases digestion
efficiency and water and electrolyte absorption in the large intestine (Field, et al., 2008).
The consumption of protein and iso-flavones have also been reported to increase PYY
levels (Weickert, et al., 2006). In a study of human subjects, infusion of PYY was found
to decrease by 30% during food intake at a buffet lunch; however, no significant satiety
reduction was seen in Y2R knockout mice (Wren & Bloom, 2007; Field, et al., 2008;
Batterham, et al., 2003). In a separate animal study, the fat mass and body weight
increased in Y2R knockout mice, suggesting the need for more studies before the actual
physiological functions of PYY in humans can be determined (Field, et al., 2008).
Pancreatic Polypeptide (PP): PP is generally expressed in the pancreas and has
a structural homology with NPY and PYY (Field, et al., 2008). Circulating levels of PP
in humans are rather low in the morning, reaching the maximum level prior to sleep. In
any case, the amount of food and the caloric intake have significant effects on PP levels,
rather than time factors. Protein meals, fasting, exercise, and acute hypoglycemia are all
known to increase PP levels, though somatostatin secretion and intravenous glucose
intake can lower the amount of PP secretion. PP binds to the receptor, called PPYR, and
contributes to appetite reduction; however, this function is still controversial since PP is

35
not correlated to BMI (Field, et al., 2008). Furthermore, PP self-regulates pancreatic
secretion activities and is readily found in T2D patients.
4.3.4 Dietary fibres, hormones, and glycemic control.
In recent years, dietary fibres have been of tremendous interest with consumers
due to their potential to provide diverse health benefits. A healthy diet is recognized as
one of the most effective and safest approaches for preventing lifestyle diseases.
Evidence suggests that the consumption of certain types of dietary fibres may help
prevent and treat obesity, as well as type-2 diabetes. Soluble dietary fibre, such as inulin
and guar gum, are known to delay blood glucose absorption through gel formation,
which traps carbohydrates and allows them to be fermented in the colon with SCFA
production. In turn, this may contribute to hypercholesterolemia by attenuating
cholesterol synthesis. Thus, soluble dietary fibres may be helpful in decreasing total
cholesterol and LDL levels in humans (Weickert & Pfeiffer, 2008). Insoluble dietary
fibre, such as cellulose, may balance the intestinal pH and alleviate constipation by
speeding the passage of food and adding bulk to the stool (Gray, 1995). The properties
and health benefits have been described previously, in that both soluble and insoluble
fibres are necessary for the diet, and helpful in contributing to weight loss. Nevertheless,
clear evidence for the link between dietary fibre appetite control and obesity is still

36
lacking. Dietary fibres have been reported to be capable of stimulating incretin
production that suggests a solution for obesity and T2D management (Massimino, et al.,
1998; Reimer & McBurney, 1996; Zhou, et al., 2008; Juvonen, et al., 2009).
According to Massimino et al. (1998), high fermentable dietary fibres increase
ileal proglucagon mRNA and intestinal GLP-1 concentrations among healthy dogs.
Furthermore, the integrated area under the curve (AUC) for plasma GLP-1 and insulin
were greater than that of low fermentable fibre diet (Massimino, et al., 1998). Reimer
and coworkers (1996) reported that a dietary fibre mixture increased SCFA, and acetate,
propionate, and butyrate in the ceacum and colon, which stimulated mucosal adaptation
among rats. SCFA also altered proglucagon messenger RNA and enhanced the release
of GLP-1, and the average plasma level of insulin increased as well (Reimer &
McBurney, 1996). Moreover, Zhou et al. (2008) concluded that resistant starch could
significantly increase both GLP-1 and PYY levels, and decrease insulin secretion
among rats. The authors also suggested that fermentation of resistant starch increases
the levels of butyrate, propionate, and acetate, which may directly stimulate
proglucagon gene expression and PYY promoter activity (Zhou, et al., 2008). Juvonen
et al. (2009) reported that beta-glucan, a viscous dietary fibre found in oat bran, has a
positive influence on gastrointestinal hormonal responses among healthy humans, with

37
the beta-glucan increasing insulin, GLP-1, and PYY, and decreasing ghrelin
significantly (Juvonen, et al., 2009).

38
CHAPTER 5: MATERIALS AND METHODS
5.1 Study Population
Subjects were recruited from the lower mainland of British Columbia through
local newspapers, posters, and a clinic website. Potential subjects were pre-screened via
telephone or by an online screening questionnaires, based on inclusion and exclusion
criteria:
Participant Inclusion Criteria:
1. Ability to provide written informed consent
2. Male or female
3. Age between 20-45 years
4. BMI 27-35 kg/m2
5. Ability and willingness to complete dietary diaries and questionnaires
6. A negative result on the screening pregnancy test and agreement to use an
acceptable form of birth control during the trial.
Participant Exclusion Criteria:
1. More than 3 kg weight gain or weight loss in the past three months
2. Pulmonary, hepatic, renal disease, or known diabetes
3. Heart attack or stroke within the last six months
4. Systolic blood pressure ≥ 130 mmHg or a diastolic blood pressure ≥ 85 mmHg
combined with three or more risk factors

39
5. Total cholesterol > 6.2 mmol/L, >LDL 4.0 mmol/L, or triglycerides > 3.0
mmol/L and not on pharmacotherapy
6. Substantial neurological or psychological illness within the last six months,
including depression-necessitating hospitalization
7. History of weight loss surgery such as gastric banding or gastric bypass
8. Concomitant use of medication or supplements that have the potential to
significantly alter body weight or appetite [i.e., ephedra, synephrine, green tea
extracts, bulk fibre laxatives (e.g., psyllium, glucomannan), diuretics, orlistat,
sibutramine, antidepressants (other than those which do not typically alter
appetite), neuroleptics, cholesterol lowering medication, nicotine substitutes, and
hypoglycemic medication and others at the discretion of the physician]
9. Known eating disorder
10. Concomitant use of medication or supplements that have the potential to
significantly alter body weight or appetite
11. Substance abuse: tobacco including those who have quit smoking in the last 12
months, alcohol (>2 drinks a day), Cannabis sativa or other controlled
substances use, diuretics or laxatives
12. Pregnancy, breast-feeding, or oral contraceptives started in the last six months
prior to the start of the trial
13. Gastric and/or esophageal strictures; history of bowel obstruction
14. Other conditions such as medical, social, or geographic, which in, the judgment
of the investigator would not allow safe completion of the protocol and/or safe
administration of the investigational product
An information session was held by the investigators to answer any questions or
concerns that participants might have regarding the study. A consent form was provided
to those interested in participating in the study, who were encouraged to review it with

40
their family and family doctor. A more detailed screening visit to review the exclusion
and inclusion criteria was scheduled for those participants who were still interested in
participating in the study. Study approval was obtained from the University of British
Columbia Clinical Ethics Research Board, and written informed consent was collected
from all participants prior to the study.
5.2 Study Design, Products, and Procedure
The clinical study was conducted between September 2008 and June 2009, using
a double-blind, randomized, placebo-controlled design. Participants attended an early
morning clinic, following a 10-12 hour overnight fast. After obtaining written consent
from each participant, the height, weight, hip, and waist circumference was measured
using standard procedures. A cannula was placed into the arm and a fasting blood
sample was collected. Participants completed a four-hour meal tolerance test (details
follow) and then randomly assigned to one of two groups (Placebo or Treatment) for 13
consecutive weeks.
5.2.1 Supplementation.
Participants were provided with the supplements in capsule form. Both the
treatment (PGX) and the placebo capsules were composed of dietary fibre, oil, beeswax,
and lecithin. The capsules were identical and indistinguishable in terms of size, shape,

41
color, appearance, and nutritional content. Treatment capsules were composed of 750
mg of PGX fibre, 600 mg of MCT, 51 mg of beeswax and 24 mg of lecithin. The
Placebo capsules consisted of 750 mg of cellulose, 600 mg of soybean oil, 51 mg of
beeswax and 24 mg of lecithin. The investigators did not have access to the
randomization (treatment) code, unless a serious adverse event occurred. The
participants were provided with the supplements in plastic containers, with each
container having 126 capsules. Participants were given a two-week supply (252
capsules) all at once. The labels of every container included: contact information, trial
number, study treatment number, participant number, visit number, directions for use,
caution statement, lot number, expiry date, and address of manufacturer.
5.2.2 Dose selection and trial parameters.
The first week was a run-in phase to allow participants to adapt to the full
dosage of the product. The participants were instructed to start by taking 2 capsules, 15
min before each meal with water, and to increase the dosage by 1 capsule with each
meal every 2 days, until a maximum of 6 capsules were being consumed with each meal.
If any participant developed discomfort, side-effects, or too much appetite suppression,
they were advised to remain at, or drop down to, a minimum of three capsules per meal.
If any participant was unable to consistently tolerate a minimum of three capsules with

42
each meal, they were asked to withdraw from the study. Following the first week,
participants visited the clinic to have their anthropometric measurements taken and to
discuss any questions or concerns they might have. Thereafter, participants visited the
clinic every two weeks during the weight loss phase and asked to return non-consumed
supplements, as well as to receive a new supply of supplements for the next two weeks.
Anthropometric measurements were recorded and any physical discomfort or appetite
was discussed according to the timeline shown in Figure 5.1. After 13 weeks on
treatment, participants returned to the clinic and were asked to provide a fasting blood
sample, and completed another meal tolerance test.

43
Figure 5.1: The systematic plan and schedule for the clinical trial
5.3 Meal Tolerance Tests
The procedure for the meal tolerance test was as follows. A fasting blood sample
was collected into an evacuated tube containing EDTA. The participant was then
instructed to consume the test meal within 15 min. The test meal consisted of: a

44
McDonald’s pancake with syrup and orange juice; comprised of 9 g of protein, 14 g of
fat, 132 g of carbohydrate, and 3 g of dietary fibre (700 kcal in total). Blood samples
were collected at 15, 30, 45, 60, 120, and 240 min after the fasting blood. Participants
were encouraged to drink water during the test period. The same amount of water was
provided to each participant during the blood collection at week 13 as was provided at
week 0 (Baseline).
5.4 Anthropometrics, Dietary, and Exercise Advice
Participants were provided with written advice regarding portion control and
reduced calorie food choices. Daily physical activity was encouraged and a handout
describing appropriate exercise was provided.
5.5 Compliance
Participants were requested to comply with instructions at the beginning of the
study and were assessed for compliance throughout the trial. All participants were
required to visit the clinic every two weeks, and to return their unconsumed products to
the investigators of the clinical trial. Compliance was calculated based on a physical
count of returned supplementation products. The following formula was used for the
estimation:

45
Compliance (%)
=
Number of capsules actually consumed Since last capsule count
X 100 Number of capsules that should be theoretically
consumed during the assigned period
5.6 Premature Withdrawal and Discontinuation Criteria
"Drop-outs" were defined as those participants who discontinued the trial for
reasons not related to the treatment. "Withdrawals" were defined as those subjects who
discontinued the trial due to treatment-related reasons. In case a participant was
prematurely withdrawn from the study, the latest data on the participant was collected to
fully support the final intent-to-treat analysis and the last weight before termination was
recorded for both drop-outs and withdrawals. Appropriate documentation was filed and
entered into the study database. Also, both dropouts and withdrawals had similar close-
out exams (weight, waist circumference, and final blood work) at the completion of the
study procedures, and final visit forms.
Date of the last supplementation dose and reason for discontinuation was
recorded for all drop-outs and withdrawals. Concomitant diagnosis (i.e., medical
history) and concomitant therapy use was also documented, for participants who
discontinued due to an adverse event. All adverse events and relevant information,
which occurred when the participant had discontinued from the study, were followed

46
until the event was resolved or until the follow-up was considered sufficient, and
recorded into the study database. Unused capsules were collected from participants, and
compliance was assessed through the capsule counts. Nevertheless, all random dropouts
and withdrawals were replaced with other participants to ensure that sufficient data was
collected from the pre-set number of participants.
5.7 Laboratory Biochemical Analysis Methods
Blood collected for glucose determination was immediately centrifuged after
collection and the plasma samples were transferred into separate tubes. The plasma
samples were immediately analyzed using the YSI 2300 STAT Plus™ at the Canadian
Centre for Functional Medicine. Whole blood samples for gut hormone and insulin
analysis were collected into tubes containing EDTA, DPP-4 inhibitor (LINCO),
protease inhibitor cocktail (Sigma), and serine protease inhibitor (Pefabloc SC, Roche).
These inhibitors protect GLP-1, amylin, and ghrelin from immediate degradation. For
each test tube, 0.238 mg (17 mg/mL) of Diprotin A (ILE-PRO-ILE) (MP Biomedicals)
and 14 µL of water was mixed with 8.75 mg (0.5 mg/µL) of Pefabloc SC and 17.5 µL of
water. After mixing these inhibitors, 70 µL of protease inhibitor cocktail was added into
each tube. Blood samples were centrifuged within 30 min, plasma was removed, and

47
samples were stored at -80 °C until analyzed. The plasma samples underwent no freeze-
thaw cycles.
The analyses of the gut peptides were conducted at the University of Calgary
using a multiple gut peptide analysis kit. The plasma samples were centrifuged at 3,000
g for 10 min prior to the analysis and the multiplex assay kit (LINCO) was used for the
simultaneous quantification of GLP-1, GIP, peptide tyrosine-tyrosine (PYY), ghrelin,
pancreatic polypeptide (PP), leptin, insulin, and amylin from the blood plasma samples.
In addition, the total cholesterol, HDL cholesterol, and triglycerides were measured for
fasting plasma samples collected at weeks 0 and 13 at BC Bio-Labs located in Surrey,
BC.
Regarding quality control, two different solutions (Millipore) were used to
maintain the accuracy of the measurements. In comparison with these solutions, the
accuracy of each peptide was calculated (shown in the original protocol). The accuracy
of all peptides was above 85%. The details of the quality control can be found in Cat.
No HGT-68K (Millipore, USA).

48
5.8 Statistical Analysis
Concentration of all plasma hormones, body weight, height, BMI, and various
laboratory values, before and after treatment, were computed statistically using SAS
software (version 9.2; SAS Institute, Cary, NC) (Shiang, 2004 ). General clinical
evaluation values were expressed as Mean +/- SEM and calculated using analysis of
Wiilcoxon-Mann rank test, depending on the normality of the distribution. The
concentration of the different hormones and peptides are presented as median and
interquartile range (IQR), unless otherwise noted. A p value <0.05 was considered
significant. Statistical tests were performed on the change from baseline AUC scores,
and to express the relationship, variables were log-transformed prior to the AUC
calculation, with inclusion of the baseline as covariates.
The Wilcoxon-Mann test also known as Wilcoxon Signed-Rank Test (numerically
equivalent to the Mann-Whitney U test) is a non-parametric analog to the independent
two samples t-test and can be used to test whether the location of the measurement is
equal to a pre-specified value. Also, this is most common method for determining
whether there is a difference between two distributions. The basic requirements are that
the data must be ordinal or continuous measurements and the two samples must be
independent. Furthermore, this test can also be performed if only rankings are available.
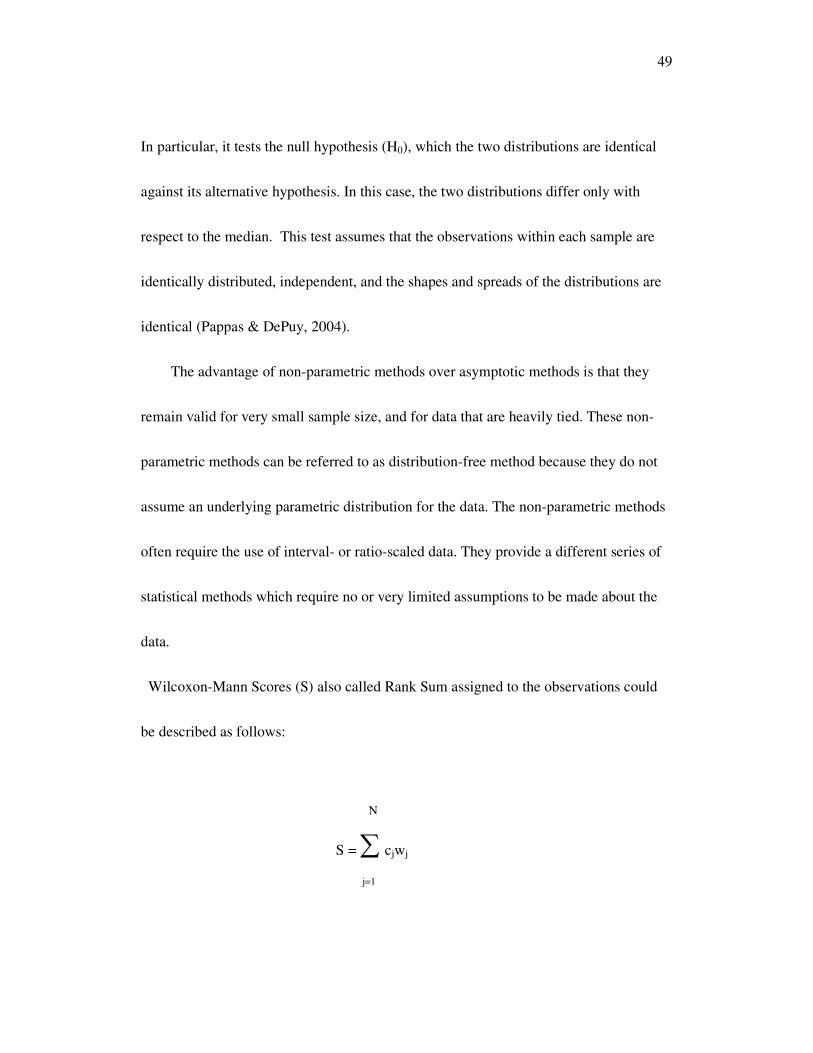
49
In particular, it tests the null hypothesis (H0), which the two distributions are identical
against its alternative hypothesis. In this case, the two distributions differ only with
respect to the median. This test assumes that the observations within each sample are
identically distributed, independent, and the shapes and spreads of the distributions are
identical (Pappas & DePuy, 2004).
The advantage of non-parametric methods over asymptotic methods is that they
remain valid for very small sample size, and for data that are heavily tied. These non-
parametric methods can be referred to as distribution-free method because they do not
assume an underlying parametric distribution for the data. The non-parametric methods
often require the use of interval- or ratio-scaled data. They provide a different series of
statistical methods which require no or very limited assumptions to be made about the
data.
Wilcoxon-Mann Scores (S) also called Rank Sum assigned to the observations could
be described as follows:
N
S = ∑ cjwj
j=1
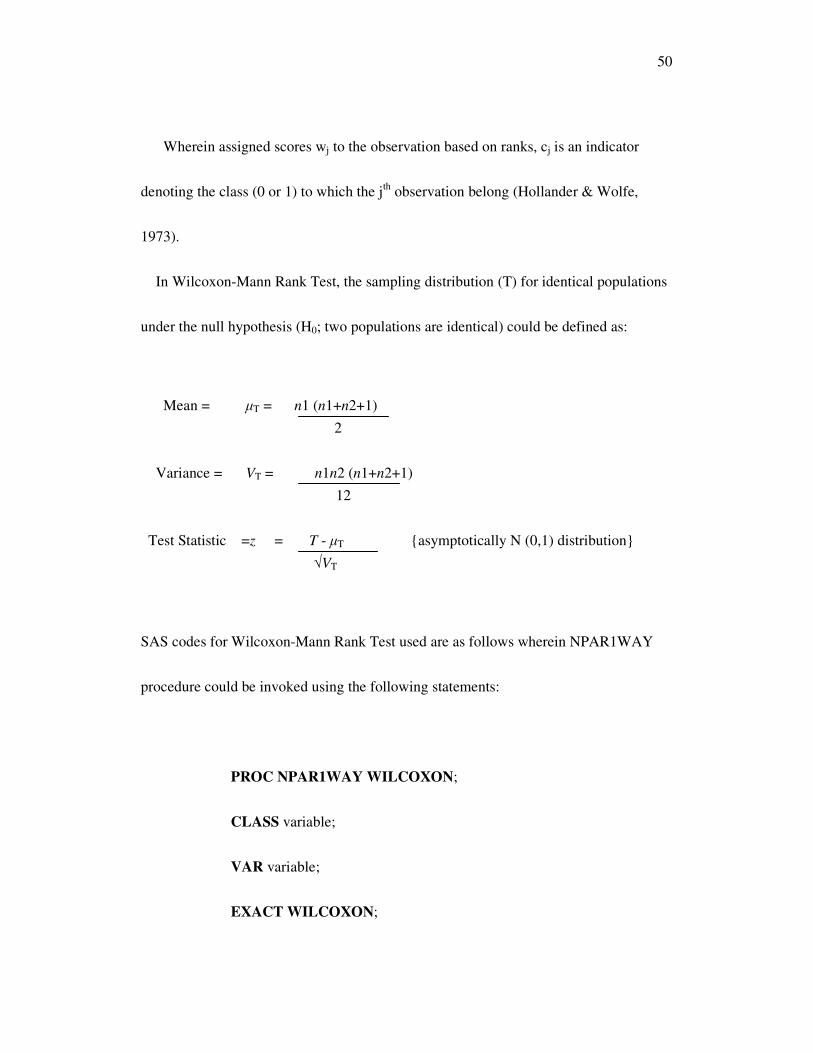
50
Wherein assigned scores wj to the observation based on ranks, cj is an indicator
denoting the class (0 or 1) to which the jth observation belong (Hollander & Wolfe,
1973).
In Wilcoxon-Mann Rank Test, the sampling distribution (T) for identical populations
under the null hypothesis (H0; two populations are identical) could be defined as:
Mean = µT = n1 (n1+n2+1)
2
Variance = VT = n1n2 (n1+n2+1)
12
Test Statistic =z = T - µT {asymptotically N (0,1) distribution}
√VT
SAS codes for Wilcoxon-Mann Rank Test used are as follows wherein NPAR1WAY
procedure could be invoked using the following statements:
PROC NPAR1WAY WILCOXON;
CLASS variable;
VAR variable;
EXACT WILCOXON;
51
The NPR1WAY procedure computes exact p-values for the simple linear rank
statistics based on the Wilcoxon–Mann score (S), provided the data are classified into
two or more levels (i.e. two or more sample tests). The outcome of the NPR1WAY
procedure is the exact one- sided and two-sided p-values for each statistic specified in
the statement. Mathematically, the one- sided (p1) and two- sided (p2) p-value can be
expressed as
p1 = P (Rank Statistic ≥ S) if S > Mean
p1 = P (Rank Statistic ≤ S) if S ≤ Mean
p2 = P (|Rank Statistic – Mean| ≥ |S – Mean|)
Wherein the S is the observed rank statistic, Mean is the expected value of the test
statistic values. There is proof to suggest that the two population medians differ if the
p-value equals less than the specified level.
The values of the Sign Test confirmed and concluded the statistically significant
difference between the observed PGX treatment and placebo control group. The Sign
Test values were used as the SAS output yields the results for both the Wilcoxon-Mann
52
Signed Rank Test and the Sign Test without use of any options (SAS/STAT User’s
Guide under the NPAR1WAY procedure; 1990).
In this study, the NPAR1WAY method is performed to test the null hypothesis
whether there is any difference in the participant response status and the option specifies
that Wilcoxon-Mann scores are used in the computation. Also, it is possible to precisely
calculate AUC (Area Under the Curve) in SAS for a binary classifier rank ordered data,
since AUC is also closely related to the Wilcoxon-Mann Rank-Sum Test. Usually, the
AUC is the area under receiver operating characteristic (ROC) curve and is an important
measurement on the accuracy of a binary classifier (Yan et al., 2003). To calculate AUC
for the SAS data set of PGX treatment and placebo control, at first it was rank ordered
by a binary classifier such as linear logistic regression), wherein the binary outcome Y
and the rank order measurements could be obtained. Aforementioned PROC
NPAR1WAY method was used to obtain Wilcoxon-Mann Rank Sum statistics and from
there it was possible to obtain an accurate measurement of AUC for this data (Cortes &
Mohri, 2004).
The relationship between AUC and Wilcoxon-Mann Rank Sum test statistics is as
follows:
AUC = (W-W0)/ (N at baseline*Nat end of trial) + 0.5
53
Wherein, N at baseline and Nat end of trial are the frequency of class Variables (PGX and
Placebo) at baseline ( 0 week) and at the end of the trial (13 weeks), and W0 is the
expected Sum of Ranks under H0: Randomly ordered (null hypothesis), and W is the
Wilcoxon-Mann Rank Sums.

54
CHAPTER 6: RESULTS AND DISCUSSION
6.1 Results
6.1.1 Participants and follow-up.
The participants that were selected for this trial, after the appropriate screening
according to the exclusion-inclusion criteria, have been summarized previously. After
the online survey and the pre-clinical assessments, 148 participants were accepted for
the clinical trial. All selected participants were randomly assigned (72 to the placebo
group and 76 to the PGX treatment group). Premature withdrawal and discontinuation
criteria were applied to those who chose to discontinue the trial for reasons related to
the treatment or for unrelated reasons. A total of 11 participants (placebo 2; PGX 9) fell
under these criteria. Therefore, 70 participants in the placebo group and 67 participants
in the PGX group completed the trial. Although compliance was above 90% in both
groups, ultimately, 42 participants finished the blood analysis test in the placebo group,
and 46 participants completed the blood analysis test in the PGX group. The statistical
analysis of the final results included the blood analysis of these participants. The
characteristic baseline was drawn and the significance of the results was compared

55
between the two groups. A general flow chart of participants in the study is shown in
Figure 6.1.
Figure 6.1: Study participation and follow-up
6.1.2 Participant characteristics at baseline.
Baseline characteristics of participants are presented in Table 6.1, which shows
the lack of difference between the groups. Nearly 86% of the participants were female.
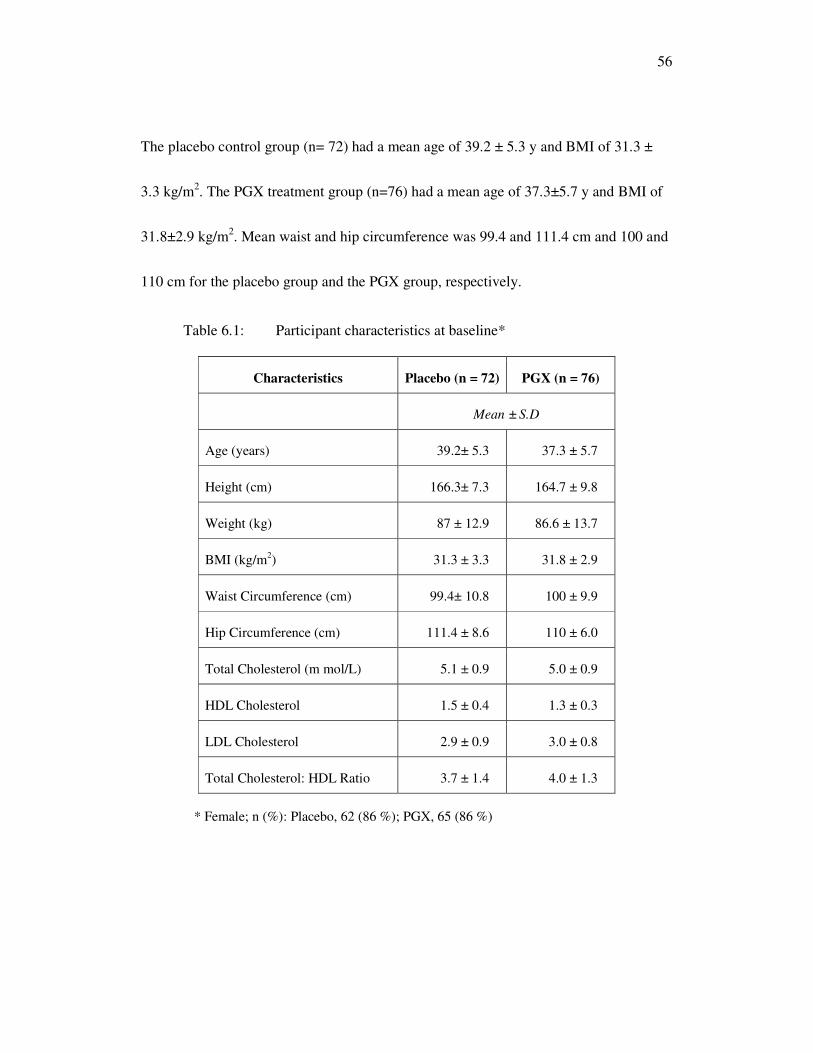
56
The placebo control group (n= 72) had a mean age of 39.2 ± 5.3 y and BMI of 31.3 ±
3.3 kg/m2. The PGX treatment group (n=76) had a mean age of 37.3±5.7 y and BMI of
31.8±2.9 kg/m2. Mean waist and hip circumference was 99.4 and 111.4 cm and 100 and
110 cm for the placebo group and the PGX group, respectively.
Table 6.1: Participant characteristics at baseline*
Characteristics Placebo (n = 72) PGX (n = 76)
Mean ± S.D
Age (years) 39.2± 5.3 37.3 ± 5.7
Height (cm) 166.3± 7.3 164.7 ± 9.8
Weight (kg) 87 ± 12.9 86.6 ± 13.7
BMI (kg/m2) 31.3 ± 3.3 31.8 ± 2.9
Waist Circumference (cm) 99.4± 10.8 100 ± 9.9
Hip Circumference (cm) 111.4 ± 8.6 110 ± 6.0
Total Cholesterol (m mol/L) 5.1 ± 0.9 5.0 ± 0.9
HDL Cholesterol 1.5 ± 0.4 1.3 ± 0.3
LDL Cholesterol 2.9 ± 0.9 3.0 ± 0.8
Total Cholesterol: HDL Ratio 3.7 ± 1.4 4.0 ± 1.3
* Female; n (%): Placebo, 62 (86 %); PGX, 65 (86 %)

57
6.2 Data Analysis
6.2.1 Anthropometrics.
At 13 weeks, no significant difference was seen in weight change from baseline
between the placebo and the PGX groups (-1.1 ± 7.6 vs. -0.6 ± 6.8 kg; p < 0.24).
Likewise, no significant difference was seen in the change from baseline for BMI (-0.4
± 0.8 vs. -0.3 ± 0.8 kg/m2; p< 0.26), waist circumference (-2.6 ± 4.2 vs. -2.0 ± 2.7 cm; p
< 0.23), hip circumference (-1.5 ± 2.0 vs. -1.0 ± 1.7 cm: p<0.13) (see Table 6.2).
Table 6.2: Bio-physical characteristics of the participants at week 0
(Baseline) and at week 13, and their variation from baseline along with
statistical significance
Parameters n Week 0
(Baseline) Week 13
Change from
baseline p-Value
Mean ± S.D
Weight (kg)
Placebo 72 87.0 ± 12.9 86.0 ± 13.5 -1.1 ± -7.6 0.24
PGX 76 86.6 ± 13.7 85.9 ± 13.9 -0.6 ± -6.8
BMI (kg/m2)
Placebo 72 31.3 ± 3.3 30.9 ± 3.4 -0.4 ± 0.8 0.26
PGX 76 31.8 ± 2.9 31.5 ± 2.9 -0.3 ± 0.8
Waist Circumference (cm)
Placebo 72 99.4 ± 10.8 96.7 ± 11.5 -2.6 ± 4.2 0.23
PGX 76 100 ± 9.9 98 ±10 -2.0 ± 2.7
Hip Circumference (cm)
Placebo 72 111.4 ± 8.6 109.9 ± 8.7 -1.5 ± 2.0 0.13
PGX 76 110 ± 6.0 108.9 ± 6.3 -1.0 ± 1.7
58
6.2.2 Hormones.
AUC was calculated for glucose, insulin, GLP-1, GIP, ghrelin, leptin, amylin,
PYY, and PP at the baseline and at week 13. The change in AUC from baseline to week
13 for each of these was also calculated. The data is presented as medians (IQR) in
Tables 6.3 and 6.4. With the exception of GIP, no significant difference was found in
AUC at 13 weeks for these hormones, in the change from baseline, between the placebo
and PGX groups (P<0.05). A significantly greater reduction was found in GIP from
baseline and at 13 weeks in the PGX group, compared with the placebo group (7 vs. -
58: p< 0.01). Changes in blood hormones and other gut peptides were practically non-
significant incremental changes over time, in the comparison between PGX and control
groups. Both ghrelin and leptin concentrations at 13 weeks were not significant when
compared to the baseline, for PGX and the control (see Appendix A). Nevertheless, the
change in concentration of leptin to ghrelin ratio with ingestion time at baseline and
after 13 weeks, in both placebo and the PGX treatment group, provides interesting
information on the behavior of ghrelin and leptin trends. Figure 6.2 shows the variation
in the ratio of leptin to ghrelin, where the ratio at baseline and after 13 weeks remained
almost the same until 30 min after ingesting either placebo or PGX treatment. The leptin
to ghrelin ratio tended to be lower at 13 weeks, for 45 to 120 min after ingestion, which

59
was somewhat more pronounced in the PGX treatment group compared to the placebo
group. Furthermore, the cross-sectional relationship between leptin and ghrelin could
explain the overall phenomenon (Figure 6.3). The changes in actual plasma ghrelin are
plotted against the changes in the actual plasma leptin levels at different times after
ingestion (0 to 240 min) with a clear difference from the baseline (0 week) to after 13
weeks (trial duration) for both the placebo and the PGX group. A positive cross-
sectional relation in the PGX group suggests that, even at relatively smaller decreases in
change in leptin values, a significant increase was seen in the corresponding change in
plasma ghrelin values. In contrast, in the placebo group, the changes in leptin levels
were least significant at the corresponding changes in the plasma ghrelin values.

60
Table 6.3: Analysis of different biochemical parameters for the
participants of both placebo and PGX groups and their statistical
significance
Glucose Insulin GLP-1 GIP
Arbitrary Units
Placebo
Baseline AUC
Median (IQR) 218
(83, 308) 333
(279, 434) 17
(5, 23) 292
(214, 366)
Week 13 AUC
Median (IQR) 210 (106, 355) 354
(252, 438) 20
(8, 39) 271
(229, 417)
Change from baseline
Median (IQR) 4
(-161, 86) 7
(-443, 277) 3
(-3, 22) 7
(-65, 109)
PGX
Baseline AUC
Median (IQR) 214
(86, 394) 356
(303, 426) 21
(10, 31) 344
(214, 429)
Week 13 AUC
Median (IQR) 225
(104, 304) 343
(276, 419) 19
(12, 36) 282
(194, 338)
Change from baseline
Median (IQR) -20
(-60, 37) -29
(-103, 62) 0
(-10, 15) -58
(-145, 28)
P-value for difference
0.65 0.36 0.41 <0.01

61
Table 6.4: Analysis of different peptides for the participants of both
placebo and PGX groups and their statistical significance
Ghrelin Leptin Amylin PYY PP
Arbitrary Units
Placebo
Baseline AUC
Median
(IQR)
111 (66, 152)
31 (18, 65)
264 (189, 316)
N/A 249
(143, 372)
Week 13 AUC
Median
(IQR)
130 (83, 169)
40 (12, 69)
272 (200, 319)
N/A 209
(105, 338)
Change from baseline
Median
(IQR)
6 (-45, 52)
1 (-20, 19)
17 (-94, 88)
N/A -20
(-157, 40)
PGX
Baseline AUC
Median
(IQR)
135 (66, 162)
18 (6, 48)
270 (213, 350)
N/A 246
(139, 414)
Week 13 AUC
Median
(IQR)
113 (50, 176)
23 (4, 64)
259 (188, 325)
N/A 192
(129, 297)
Change from baseline
Median
(IQR)
12 (-56, 53)
3 (-28, 44)
-16.9 (-91, 55)
N/A -31
(-161, 87)
P value for difference 0.86 0.71 0.26 N/A 0.8

62
Time after Ingestion (Minutes)
Initial 15 MIn 30 Min 45 Min 60 Min 120 Min 240 Min
Lep
tin/ G
hre
lin R
atio
0
100
200
300
400
Week -0
Week -13
Placebo(A)
Time after Ingestion (Minutes)
Initial 15 MIn 30 Min 45 Min 60 Min 120 Min 240 Min
Lep
tin/ G
hre
lin R
atio
0
100
200
300
400
Week -0
Week -13
Placebo(A)
Time after Ingestion (Minutes)
Initial 15 MIn 30 Min 45 Min 60 Min 120 Min 240 Min
Le
ptin/
Gh
relin
Ra
tio
0
100
200
300
400
Week -0
Week -13
PGX(B)
Time after Ingestion (Minutes)
Initial 15 MIn 30 Min 45 Min 60 Min 120 Min 240 Min
Le
ptin/
Gh
relin
Ra
tio
0
100
200
300
400
Week -0
Week -13
PGX(B)
Figure 6.2: Change in concentrations of leptin to ghrelin ratio with
ingestion time at the baseline (week 0) and after 13 weeks in both (A)
placebo (control), and (B) PGX treatment groups.
Figure 6.3: Cross-sectional relationship graph between the change in
leptin and ghrelin concentrations with ingestion time during the whole
duration of clinical trial (at week 0 to week 13) in both (left) placebo
(control), and (right) PGX treatment groups.
Change in Ghrelin (pg/mL)
-2 0 2 4 6 8
Change in L
eptin (
pg/m
L)
-1200
-800
-400
0
400
800
Placebo
Regression: 99% confidence
Change in Ghrelin (pg/mL)
6 8 10 12 14 16 18 20
Change in L
eptin (
pg/m
L)
-3000
-2000
-1000
0
1000
2000
3000
PGX
Regression: 99% confidence
63
6.2.3 Compliance and adverse events.
The compliance with the provided instructions was checked periodically during
the study as described in compliance details (section 2.5) of this report, and the average
compliance for both the placebo and PGX treatment group was > 90 %. This suggests
that tolerance to the supplementation products was adequate. No serious adverse events
were reported throughout the study and the participants successfully completed the
clinical trial. In a recent, controlled study of PGX tolerance in France, some minor
gastrointestinal (GI) symptoms were reported but not sufficiently severe to warrant user
withdrawal (Carabin et al., 2009).
6. 3 Discussion
Although the results of the study are not encouraging, some of the observed
trends support the previous clinical studies on PGX. The findings reported here suggest
that supplemental PGX capsule intake produced an effect that was not statistically
different from that of the placebo. In evaluating the range of gut peptides and hormones
for efficacy of the PGX fibre in capsule form, only GIP levels were reduced
significantly during the 13-week, placebo-controlled randomized clinical trial. Even

64
with the large number of statistical comparisons, this outcome was the only finding of
significance.
Many studies have suggested positive efficacies of PGX dietary fibre, and a
range of analytical findings have been listed and discussed in earlier sections. This
study has been unique, as it is the first to use the capsule form of PGX for
supplementation, before the recent report of Brand-Miller et al. (2010). In all earlier
studies, the granulated powder form of PGX (Carabin et al., 2009) was used in water, or
PGX fibre was used in preloaded drinks (Lyon, & Reichert, 2010). In some studies,
PGX was premixed in a solid matrix (breakfast cereals or bread) (Jenkins et al., 2000).
Earlier studies have found that the highest dose of the granulated powder form of PGX
(7.5 g) lowered blood glucose responses by 50%, when dissolved in water and taken
with a carbohydrate meal at breakfast. The effectiveness of the granulated powder form
of PGX was also related to timing, in studies where consumption was monitored after
15 min of the beginning of the meal, and glycemia was effectively reduced when PGX
was consumed with a meal (nearly 28% improvement). This effect was not observed
when PGX was ingested 45 or 60 min before the meal (Jenkins et al., 2000). According
to Brand-Miller et al. (2010), PGX capsule consumption did not show any acute effects
in lowering plasma glycemia, but had a secondary meal effect that could be comparable

65
to improved glucose tolerance at the beginning of the ingestion, with respect to the
previous evening meal. Thus, the results here, with capsule supplementation, could still
indicate that the effectiveness of capsule PGX may depend on the dose or on the timing
of the consumption.
Some quality control issues in the production of PGX capsules, such as proper
pH and pressure of PGX inside capsules, could help to explain the findings. These
issues were addressed by Brand-Miller, et al. (2010), who also reported some second
meal effects. PGX supplementation in the granulated powder form suggests that the
timing of ingestion is not critical, since intake either 15 min before or after the start of
meal was effective. Possibly, for the effect on acute postprandial glycemia, the capsule
PGX could provide a small, delayed postprandial glycemia.
In addition, the beneficial functional effects of PGX were highly dependent on
the food matrix. The supplementation of PGX in capsule form turned out to have a non-
significant effect, compared to the granulated powder form as a supplement to the food
matrix. PGX could be just as effective when sprinkled on food materials as when
dissolved in water. Moreover, no significant reduction in insulin levels was observed
with the capsule form of PGX, unlike earlier studies. When the granulated powder form
of PGX was used, fasting insulin levels decreased from 89.4 ± 44.8 pmol/L to 65.0 ±

66
33.2 pmol/L (at the p < 0.05 level). In the present study, the non-significant reduction in
insulin and postprandial glycemia levels could have been due to unchanged levels of
GLP-1 type gut hormone (p = 0.41) from the baseline (week 0) until week 13. The
increased activity of GLP-1 type hormone is usually responsible for enhancing insulin
sensitivity and decreasing postprandial glucose that, in turn, accompanies weight loss.
The precise reason for the spontaneous reduction in GIP (p=0.01), which is also related
to postprandial insulin secretion, is not entirely clear. GLP-1, which is mainly secreted
by L-cells in the ileum and colon, preferably binds the GLP-1 receptor in the pancreatic
beta cells and has a reasonably low affinity for GIP. Perhaps a poor inhibition of DPP-4
activity, caused an increase in plasma GLP-1 levels to be undetected during the trial,
which would explain the GIP levels being unaffected by GLP-1 secretion and its
binding with beta cells. On the other hand, the reduction in the fasting ghrelin level, a
hunger hormone that stimulates food intake and promotes adiposity, was somewhat
greater in the PGX group compared to the placebo group, though statistically not
significant. Also, a slight reduction in insulin would be expected, since ghrelin has been
reported to lower the insulin production. In the previous acute meal studies, a fair
reduction in the fasting ghrelin level with wheat dietary fibre was reported, but no
pronounced effect on ghrelin was seen from oat fibre or cereal fibre (Batterham, et al.,

67
2003; Weickert & Pfeiffer, 2008). Recent evidence suggests that circulating ghrelin
might perform in concert with leptin as a signal of adiposity in the central nervous
system. Therefore, any treatment for obesity that improves the activity of leptin in the
central nervous system should reduce food intake and circulating leptin, without
increasing the appetite caused by a restriction of dietary energy. Ghrelin rapidly
stimulates food intake in human subjects (Gray, 1995), and dietary-related weight loss
studies have also indicated a coordinated decrease in plasma levels of leptin with an
increase in plasma levels of ghrelin (Massimino, et al., 1998). A possible explanation
for the different outcome in this PGX capsule treatment study could be the inclusion of
MCT as an ingredient in the PGX treatment, which could provide a considerable
stimulus to additional insulin secretion. Nevertheless, we speculate that the failure of
AUC gerhlin to rise significantly may be an indicator of enhanced leptin action, which
probably suppresses the gherlin mRNA expression in the stomach with only a slight
decrease in body weight.
The primary reason for the non-significant change in amylin levels during the
trial likely depends on the alteration in insulin level, since amylin is co-secreted with
insulin. Although few studies have examined the correlation between amylin and
overweight, some studies have demonstrated that amylin concentrations are associated

68
with the degree of overweight, revealing that the basal amylin concentration is usually
higher in obese, rather than lean human subjects (Reimer & McBurney, 1996; Zhou, et
al., 2008). The data presented here also shows a reduction in insulin (median -29; IQR, -
103 to 62) and amylin (median -16.9; IQR, -91 to 55) concentrations with PGX
treatment, indicating an indirect role of amylin in inhibiting insulin secretion, which has
been reported in animal models (Juvonen, et al., 2009).
Furthermore, the composition of the soft gel capsule material could have
inhibited the effectiveness of the PGX ingredient. Also, since the time needed for the
disintegration of the capsule shell material after ingestion was unknown, a longer study
duration, refinement of dosages, and improved timings could have been useful with a
well characterized, clinically neutral and natural capsule shell material. Generally, the
PGX active treatment, consisting of 600 mg of MCT with 750 mg of PGX fibre, is well-
recognized for weight loss and weight management. At first, these components were
thought to have an synergistic effect as a combination of PGX and MCT, as both
ingredients have been extensively reported in weight loss diets. Nevertheless, since no
synergistic action was observed in this study, the effect of MCT appeared to be inert,
even in the presence of PGX fibre. To explore whether or not the properties of PGX
induced a negative interaction with MCT, suppressing its beneficial function, would

69
require further testing. Also, because of the higher water affinity of PGX, it could have
absorbed the MCT oil and restricted its functional profile for energy expenditure, which
may have influenced the effect of MCT on thermogenesis. At this time, these
explanations are highly conjectural.
Of importance is the preparation technique for the supplements used in this trial,
which were significantly different from those reported by Brand-Miller et al. (2010).
Specifically, Brand-Miller et al. used a heat treatment and applied pressure during the
filling of the supplementation capsules. Although the effect of preparation on the
product is not known, the exact physical state of the active ingredients may have an
effect of the clinical outcomes. In the study by Brand-Miller et al., the heat treatment
and pressure may have led to the optimal viscosity required for PGX efficacy. Also, the
authors clearly mentioned that the granular form of PGX dose-dependently reduced
glycemia by up to 50% (P< 0.001), but the same results were not observed, when
capsules were ingested with breakfast. Capsules containing 3, 4.5, and 6 g PGX were
reported to reduce glycemia at breakfast by up to 28% (P< 0.001) when consumed with
the evening meal. Therefore, PGX affected acute postprandial glycemia when consumed
in a granule form, and affected delayed (second meal) postprandial glycemia at
breakfast, when taken as capsules with the evening meal. Although several types of
70
soluble and insoluble fibres have been evaluated (Brighenti et al., 2006; Weickert et al.,
2005; Jenkins et al., 1990), demonstrating the secondary meal effect, because of the
higher viscosity of PGX, the effect was somewhat more pronounced. Jenkins et al.
(1978) reported that improvements in glucose and metabolism are directly proportional
to the higher viscosity of the fibres. Taking these findings into consideration, the results
of the present clinical trial could be seen as an extension of Brand-Miller et al.’s (2010)
study. In general, the results suggest some support that the effectiveness of PGX may
depend on the dosage, the timing of ingestion, and the physical properties of the
ingested matrix.
The effects of the treatment on dietary intake, with continuous glucose
monitoring, was not explored in this clinical trial, because the focus of the study was to
assess the efficacy of PGX capsule, and in combination with MCT to explore additional
synergic effects. This omission could be taken as a limitation for interpreting the
clinical data. Clinical data obtained from a probe inserted under the skin to measure the
glucose concentration and from interstitial tissues by a continuous glucose monitoring
system (CGMS) iPro would allow for measurements of blood glucose every 5 min over
the test period (Ryan et al., 2009). In the future, such data could provide more accurate

71
assessments of blood glucose concentrations than could conventional methods, and
could be the focus of future clinical trials.

72
CHAPTER 7: CONCLUSION AND RECOMMENDATIONS
Lifestyle-related diseases such as T2D and obesity, follow a socio-economic
gradient, and have risen in prevalence dramatically over the past several decades.
Nevertheless, a high level of dietary fibre intake has beneficial effects on health, and
increasing evidence suggests that certain types of dietary fibres might help prevent
obesity and T2D. In the present clinical trial, the consumption of PGX was compared
with a placebo (cellulose), with the idea that it would reduce both fasting and
postprandial blood glucose, and promote satiety and insulin secretion by increasing the
plasma concentrations of GLP1, GIP, PYY, PP, leptin, by suppressing levels of ghrelin
and amylin. As discussed in Chapter 1, Polyglycoplex (PGX) is a highly viscous blend
of soluble non-starch polysaccharides containing three complementary dietary fibres:
konjac mannan (also known as glucomannan), sodium alginate, and xanthan gum.
Recent human clinical trials have shown the positive effect of PGX on appetite control,
cholesterol lowering, and stabilization of blood glucose and insulin levels. The aim of
the present trial was determine the evidence for the influence of dietary fibre on appetite
control and obesity.

73
Although the causes of obesity may include some combination of excessive
energy intake, inactivity, and genetics, these factors all result in an imbalance between
energy intake and expenditure. Moreover, the evidence suggests that the role of fibres in
appetite control might be mediated, in part, by gut hormones.
This study has some potential limitations. The present 13-week, randomized
double-blind clinical study, with capsulated supplementation containing either 750 mg
of PGX or 750 mg of cellulose (placebo), differs distinctly from earlier PGX-
supplemented clinical trials, where participants consumed liquid or powder matrices.
This study was the first clinical trial using the capsulated form of PGX with MCT. The
inclusion of MCT as an active treatment (600 mg MCT, mainly from coconut oil)
showed no synergistic action or statistically significant effect of the active treatment,
when compared to the placebo. A complete physical absorbance of MCT oil, due to the
higher water affinity of PGX, could also explain the lack of effect. Furthermore, the use
of BMI percentile measurements, to classify overweight subjects, considered as a good
measure of obesity, is limited in being able to indirectly measure the fat mass. Since,
restrictions in dietary fat intake could produce weight loss, by increasing the sensitivity
of the central nervous system to leptin, this would allow energy intake, adipose mass,
and leptin levels to fall without an increase in appetite. The effectiveness of the

74
supplementation doses in the present clinical study could be attributed to a limited,
time-dependent delayed postprandial glycemia, or significantly dependent on the matrix
used in the capsules. In fact, the capsule form of PGX supplementation turned out to be
not significantly effective, when compared to the granulated powder form of PGX.
Although a growing body of evidence indicates that loss of fat mass causes an increase
in circulating levels of ghrelin, which coincides with decreasing leptin levels, the cross-
sectional relationship between gherlin and leptin, based on the data presented here, was
only moderate. The ability of PGX to reduce postprandial glycemia could be positively
correlated to its potential role in obesity prevention, weight management, and
adolescents.
Despite non-significant results from the present clinical trial, using
supplementation with PGX in capsules, the study had a number of strengths. A large
number of subjects were involved, and the randomized, double-blind design produced
precise and transparent results, allowing for a clear interpretation of findings. The aim
was to determine the effectiveness of PGX fibre when used in a form and in a matrix
that was not granular or liquid/solid. The PGX contained 87.4% dietary fibre, of which
81.8% was soluble fibre. It is currently available as one of two physical forms: granular
PGX, which is readily dissolved in water and can be sprinkled on food prior to

75
consumption, or soft-gelatin capsules, which can be swallowed with meals.
Overall, the study explored the effectiveness of evidence-based products that
have shown a high level of compliance and adequate tolerance. In future research, new
innovative delivery methods and different physical forms should be considered when
examining the possible beneficial health effects of PGX or other dietary fibre
supplements to help the obese population.

76
REFERENCES
Abdelhameed, A.S., Ang, S., Gordon, A.M., Smith, I., Lawson, C., Gahler, R., Wood,
S., & Harding, S.E. (2010). An analytical ultracentrifuge study on ternary
mixtures of konjac glucomannan supplemented with sodium alginate and
xanthan gum. Carbohydrate Polymers. 81(1), 145-148.
Aldoori, W.H. (1997). The protective role of dietary fibre in diverticular disease. Adv
Exp Med Biol. 427: 291-308.
Aldoori, W.H., Giovannucci, E.L., Stampfer, M.J., Rimm, E.B., Wing, A.L., & Willett,
W.C. (1997). Prospective study of diet and the risk of duodenal ulcer in men.
Am J Epidemiol. 145: 42-50.
Anderson, J.W. (2008). Dietary fibre and associated phytochemicals in prevention and
reversal of diabetes. In: V.K. Pasupuleti & J.W. Anderson, eds. Nutraceuticals,
Glycemic Health and Type 2 Diabetes. Ames, Iowa: Blackwell Publishing
Professional: 111-142.
Anderson, J.W., Floore, T.L., Geil, P.B., O’Neal, D.S., & Balm, T.K. (1991).
Hypocholesterolemic effects of different bulk-forming hydrophilic fibres as
adjuncts to dietary therapy in mild to moderate hypercholesterolemia. Arch
Intern Med. 151: 1597-1602.
Anderson, J.W., Randles, K.M., Kendall, C.W.C., & Jenkins, D.J.A. (2004).
Carbohydrate and fibre recommendations for individuals with diabetes: a
quantitative assessment and meta-analysis of the evidence. J Am Coll Nutr. 23:
5-17.
Babayan, V.K. (1987). Medium chain triglycerides and structured lipids. Lipids. 22:
417-420.
Batterham, R.L., Cohen, M.A., Ellis, S.M., Le Roux, C.W., Withers, D.J., Frost, G.S.,
Ghatel, M.A., & Bloom, S.R. (2003). Inhibition of food intake in obese subjects
by peptide YY3-36. The New England Journal of Medicine, 349(10): 941-8.
77
Bell, G.I., Pictet, R.L., Rutter, W.J., Cordell, B., Tisher, E., & Goodman, H.M. (1980).
Sequence of the human insulin gene. Nature, 284(5751): 26-32.
Bertram, R., Sherman, A., & Satin, L.S. (2007). Metabolic and electrical oscillations:
partners in controlling pulsatile insulin secretion. American Journal of
Physiology. Endocrinology and Metabolism, 293(4): E890-900.
Bingham, S.A., Day, N.E., Luben, R., Ferrari, P., Slimani, N., Norat, T. et al. (2003).
Dietary fibre in food and protection against colorectal cancer in the European
prospective investigation into cancer and nutrition: an observational study.
Lancet, 361: 1496-1501.
Bo, S., Durazzo, M., Guidi, S., Carello, M., Sacerdote, C., Silli, B. et al (2006). Dietary
magnesium and fibre intakes and inflammatory and metabolic indicators in
middle-aged subjects from a population-based cohort. Am J Clin Nutr. 84:1062-
1069.
Brand-Miller, J.C., Atkinson, F.S., Gahler, R.J., Kacinik, V., Lyon, M.R., & Wood, S.
(2010). Effects of PGX, a novel functional fibre, on acute and delayed
postprandial glycaemia. European Journal of Clinical Nutrition online doi:
10.1038/ejcn.2010.199
Bray, George A. (2007) The metabolic syndrome and obesity. New Jersey, Humana
Press.
Brennan, A.M., & Mantzoros, C.S. (2006). Drug insight: The role of leptin in human
physiology and pathophysiology – emerging clinical applications. Nature
Clinical Practice. Endocrinology & Metabolism, 2(6), 318-27.
Brighenti, F., Benini, L., Del Rio, D., Casiraghi, C., Pellegrini, N., Scazzina, F. et al
(2006). Colonic fermentation of indigestibile carbohydrates contributes to the
second-meal effect. Am J Clin Nutr. 83:817-82
Brown, L., Rosner, B., Willett, W.W., & Sacks, F.M. (1999). Cholesterol lowering
effects of dietary fibre: A meta-analysis. Am J Clin Nutr. 69: 30-42.
Carabin, I.G., Lyon, M.R., Wood, S., Pelletier, X., Donazzolo, Y., & Burdock, G.A.
(2009). Supplementation of the diet with the functional fibre PolyGlycoplex is
well tolerated by healthy subjects in a clinical trial. Nutrition Journal. 8:9

78
Casterline, J.L., Oles, C.J., & Ku, Y. (1997). In vitro fermentation of various food fiber
fractions. J. Agric. Food Chem., 45(7), 2463-2467.
Caumo, A., & Luzi, L. (2004). First-phase insulin secretion: Does it exist in real life?
Considerations on shape and function. Am J Physiol Endocrinol Metab, 287(3):
E371-385.
Chen, H.L., Sheu, W.H., Tai, T.S., Liaw, Y.P., & Chen, Y.C. (2003). Konjac
supplement alleviated hypercholesterolemia and hyperglycemia in type 2
diabetic subjects – A randomized double-blind trial. J Am Coll Nutr. 22:36-42.
Cortes, C. and Mohri, M. (2004). AUC Optimization Vs. Error Rate Minimization, p
313-320; In Advances in neural Inforamtion Processing System 16; Eds.
S.Thrun, LK.Saul and B.Scholkopf; Publisher: Massachusetts Institute of
technology.
Cummings, J.H. (2001). The effect of dietary fibre on fecal weight and composition. In:
G. Spiller, ed. Dietary Fibre in Human Nutrition. Boca Raton, FL: CRC Press;
183.252
Cutfield, W.S., Menon, R.K., Bright, G.N., & Sperling, M.A. (2000). Limitations of
first-phase insulin response to evaluate insulin secretion in children. Pediatric
Diabetes, 1(1), 3-9.
Daniels, S.R. (2005) Overweight in children and adolescents: Pathophysiology,
consequences, prevention and treatment. Circulation 111(15): 1999-2012.
Davy, B.M., & Melby, C.L. (2003). The effect of fibre-rich carbohydrates on features of
Syndrome X. J Am Diet Assoc. 103: 86-96.
Deacon, C.F., Carr, R.D., & Holst, J.J. (2008). DPP-4 inhibitor therapy: New directions
in the treatment of type 2 diabetes. Frontiers in Bioscience: A Journal and
Virtual Library, 13, 1780-94.
Delzenne, N.M., & Cani, P.D. (2005). A place for dietary fibre in the management of
the metabolic syndrome. Curr Opin Clin Nutr Metab Care. 8:636-640.
79
DeVries, J.W., & Rader, J.I. (2005). Historical perspective as a guide for identifying
and developing applicable methods for dietary fibre. J AOAC Int. 88:1349-
1366.
Drewnowski, A. (1998). Energy density, palatability, and satiety: Implications for
weight control. Nutr Rev. 56:347-353.
Dubuc, G.R., Phinney, S.D., Stern, J.S., Havel, P.J. (1998). Changes of serum leptin and
endocrine and metabolic parameters after 7 days of energy restriction in men and
women. Metabolism: Clinical and Experimental, 47(4), 429-34.
Duramed, J.H. (2008). SAS Programming to Calculate AUC in Pharmacokinetic
Studies —Comparison of Four Methods in Concentration Data. Available at:
http://www.lexjansen.com/pharmasug/2008/sp/sp06.pdf
Edelman, S., Maier, H., & Wilhelm, K. (2008). Pramlintide in the treatment of diabetes
mellitus. BioDrugs: Clinical Immunotherapeutics, Biopharmaceuticals and Gene
Therapy, 22(6), 375-86.
El-Serag, H.B., Satia, J.A., & Rabeneck, L. (2005). Dietary intake and the risk of
gastro-oesophageal reflux disease: a cross sectional study in volunteers. Gut.
54:11-17.
Field, B.C.T., Wren, A.M., Cooke, D., & Bloom, S.R. (2008). Gut hormones as
potential new targets for appetite regulation and the treatment of obesity. Drugs,
68(2), 147-63.
Food and Drug Administration (FDA) Food labeling (1998): Health claims; soluble
fibre from certain foods and coronary heart diseases. Federal Register, 63(32),
8103.
Gentilella, R., Bianchi, C., Rossi, A., & Rotella, C.M. (2009). Exenatide: A review from
pharmacology to clinical practice. Diabetes, Obesity & Metabolism. Available at:
http://www.ncbi.nlm.nih.gov/pubmed/19383034.

80
Giannini, E.G., Mansi, C., Dulbecco, P., & Savarino, V. (2006). Role of partially
hydrolyzed guar gum in the treatment of irritable bowel syndrome. Nutrition. 22:
334-342.
Gray, D.S. (1995). The clinical uses of dietary fibre. American Family Physician, 51(2),
419-26.
Gropper, S.S., & Acosta, P.B. (1987). The therapeutic effect of fibre in treating obesity.
J Am Coll Nutr. 6:533-535.
Haber, G.B., Heaton, K.W., Murphy, D., & Burroughs, L.F. (1977). Depletion and
disruption of dietary fibre: Effects on satiety, plasma glucose, and serum-insulin.
Lancet. 2:679-682.
Han, J.R., Deng, B., Sun, J., Chen, C.G., Corkey, B.E., Kirkland, J.L., Ma, J., & Guo,W.
(2007). Effects of dietary medium-chain triglyceride on weight loss and Chinese
subjects. Metabolism Clinical and Experimental, 56: 985-991.
Harding, S.E., Smith, I.H., Lawson, C.J., Gahler, R.J., & Wood, S. (2010). Studies on
macromolecular interactions in ternary mixtures of konjac glucomannan,
xanthan gum and sodium alginate. J. Carbpol 10 online
doi:10.1016/j.carbpol.2010.06.035
Harju, E. (1984). Guar gum benefits duodenal ulcer patients by decreasing gastric
acidity and rate of emptying of gastric contents 60 to 120 minutes postprandially.
Am Surg. 50: 668-672.
Hashim, S.A., & Tantibhedyangkul, P. (1987). Medium chain triglyceride in early life:
Effects on growth of adipose tissue. Lipid. 22: 429-34.
Haskell, W.L., Spiller, G.A., Jensen, C.D., Ellis, B.K., & Gates, J.E. (1992). Role of
water-soluble dietary fibre in the management of elevated plasma cholesterol in
healthy subjects. Am J Cardiol. 69:433-439.

81
Hay, D.L., Christopoulos, G., Christopoulos, A., & Sexton, P.M. (2004). Amylin
receptors: molecular composition and pharmacology. Biochemical Society
Transactions, 32(Pt 5), 865-7.
Hedley, A.A. (2004) Prevalence of overweight and obesity among US children,
adolescents and adults, 1999-2002. JAMA 291 (23):2847-2850.
Hollander, M. and Wolfe D.A. (1973), Nonparametric Statistical Methods, New
York: John Wiley & Sons.
Howlett, J.F., Betteridge, V.A., Champ, M., Craig, S.A., Meheust, A., & Jones, J.M.
(2010) The definition of dietary fiber - discussions at the Ninth Vahouny Fiber
Symposium: building scientific agreement. Food Nutr Res. Nov 1;54.
Hu, F.B., Stampfer, M.J., Manson, J.E., Ascherio, A., Colditz, G.A., Speizer, F.E.,
Hennekens, C.H., & Willett, W.C. (1999). Dietary saturated fats and their food
sources in relation to the risk of coronary heart disease in women. Am J Clin
Nutr. 70:1001-1008.
Institute of Medicine. (2002). Dietary reference intake of energy, carbohydrates, fibre,
fat, fatty acids, cholesterol, protein, and amino acids, Washington, DC: National
Academy Press.
Inui, A., Asakawa, A., Bowers, C.Y., Mantovani, G., Laviano, A., Meguid, M.M., et al.
(2004). Ghrelin, appetite, and gastric motility: the emerging role of the stomach
as an endocrine organ. The FASEB Journal: Official Publication of the
Federation of American Societies for Experimental Biology, 18(3), 439-56.
Jenkins, D.J., Jenkins, A.L., Wolever, T.M., Vuksan, V., Brighenti. F., & Testlin. G.
(1990). Fiber and physiological and potentially therapeutic effects of slowing
carbohydrate absorption. Adv Exp Med Biol. 270: 129-34
Jenkins, D.J.A., Kendall, C.W.C., Axelsen, M., Augustin, L.S.A., & Vuksan, V. (2000).
Viscous and nonviscous fibres, nonabsorbable and low glycaemic index
carbohydrates blood lipids and coronary heart disease. Current Opinion in
Lipidology, 11(1): 49-56.

82
Jenkins, D.J., Wolever, T.M., Leeds, A.R., Gassull, M.A., Haisman, P., Dilwari, J., et al.
(1978). Dietary fibres, fibre analogues, and glucose tolerance: importance of
viscosity. Br Med J. 1(6124): 1392-4.
Jones, R. (2003). Ghrelin on the brain. Nat Rev Neurosci, 4(4), 246.
Juvonen, K.R., Purhonen, A.K., Salmenkallio-Marttila, M., Lahteenmaki, L., Laaksonen,
D.E., Herzig, K.H., et al . (2009). Viscosity of oat bran-enriched beverages
influences gastrointestinal hormonal responses in healthy humans. The Journal
of Nutrition, 139(3), 461-6.
Kawamori, D., Kurpad, A.J., Hu, J., Liew, C.W., Shih, J.L., Ford, E.L., et al. (2009).
Insulin signaling in alpha cells modulates glucagon secretion in vivo. Cell
Metabolism, 9(4), 350-61.
Keenan, J.M., Pins, J.J., Frazel, C., Moran, A., & Turnquist, L. (2002). Oat ingestion
reduces systolic and diastolic blood pressure in patients with mild or borderline
hypertension: a pilot trial. J Family Practice, 51:369.375.
Kirby, R.W., Anderson, J.W., Sieling, B., Rees, E.D., Chen, W.J., Miller, R.E., et al.
(1981). Oat-bran intake selectively lowers serum low-density lipoprotein
cholesterol concentrations of hypercholesterolemic men. Am J Clin Nutr, 34:
824-829.
Knop, F.K., Vilsbøll, T., & Holst, J.J. (2009). Incretin-based therapy of type 2 diabetes
mellitus. Current Protein & Peptide Science, 10(1), 46-55.
Lairon, D., Arnault, N., Bertrais, S., Planells, R., Clero, E., Hercberg, S., et al. (2005).
Dietary fibre intake and risk factors for cardiovascular disease in French adults.
Am J Clin Nutr, 82: 1185-1194.
Lindstrom, J., Peltonen, M., Eriksson, J.G., Louheranta, A., Fogelholm, M., Uusitupa,
M., et al. (2006). High fibre, low fat diet predicts long term weight loss and
decreased type 2 diabetes risk: the Finnish Diabetes Prevention Study.
Diabetologia, 49: 912-920.
83
Liu, S., Stampfer, M.J., Hu, F.B., Giovannucci, E., Rimm, E., Manson, J.E., et al.
(1999). Whole-grain consumption and risk of coronary heart disease: Results
from the Nurses’ Health study. Am J Clin Nutr, 70: 412-419.
Lomberk, G., & Urrutia, R. (2009). Primers on molecular pathways - The insulin
pathway. Pancreatology: Official Journal of the International Association of
Pancreatology (IAP,) 9(3), 203-205.
Lopez, M.J., Williams, C., & Lairon, D. (2007). Dietary, physiological, genetic and
pathological influences on postprandial lipid metabolism. Brit. J. Nutri, 98: 458-
473.
Lorenzo, A., RAZZABONI, B., Weir, G.C. & Yanker, B.A. (1994). Pancreatic islet cell
toxicity of amylin associated with type-2 diabetes mellitus. Nature, 368(6473),
756-60.
Lutter, M., Sakata, I., Osborne-Lawrence, S., Rovinsky, S.A., Anderson, J.G., Jung, S.,
et al. (2008). The orexigenic hormone ghrelin defends against depressive
symptoms of chronic stress. Nature Neuroscience, 11(7), 752-3.
Lyon, M.R., & Reichert, R.G. (2010). The effect of a novel viscous polysaccharide
along with lifestyle changes on short-term weight loss and associated risk factors
in overweight and obese adults: An observational retrospective clinical program
analysis. Alternate Medicine Review, 15:1: 68-75.
Marlett, J.A., McBurney, M.I., & Slavin, J.L. (2002). Position of the American Dietetic
Association: Health implications of dietary fibre. Am Diet Assoc. 102: 993-1000.
Marone, P.A., Lyon, M., Gahler, R., Donath, C., Hofman-Hüther, H., & Wood, S.
(2009). Genotoxicity studies of PolyGlycopleX (PGX): A novel dietary fibre.
International Journal of Toxicology, 28(4): 318-331.
Massimino, S.P., McBurney, M.I., Field, C.J., Thomson, A.B.R., Keelan, M., Hayek,
M.G., et al. (1998). Fermentable dietary fibre increases GLP-1 secretion and
improves glucose homeostasis despite increased intestinal glucose transport
capacity in healthy dogs. The Journal of Nutrition, 128(10), 1786-93.

84
Matulka, R.A., Lyon, M.R., Wood, S., Marone, P.A., Merkel, D.J., & Burdock, G.A.
(2009). The study of PolyGlycopleX (PGX) as shown in a 90 days rodent
feeding study. Nutrition Journal, doi:10.1186/1475-2891-8-1.
MIRIAM E (2010). CLEGG Medium-chain triglycerides are advantageous in
promoting weight loss although not beneficial to exercise performance
International Journal of Food Sciences and Nutrition, 61(7): 653-679.
Montonen, J., Knekt, P., Jarvinen, R., Aromaa, A., & Reunanen, A. (2003). Whole-
grain and fibre intake and the incidence of type 2 diabetes. Am J Clin Nutr, 77:
622-629.
Murakami, K., Sasaki, S., Okubo, H., Takahashi, Y., Hosoi, Y., Itabashi, M. (2007).
Dietary fibre intake, dietary glycemic index and load, and body mass index: A
crosssectional study of 3931 Japanese women aged 18-20 years. Eur J. Cin.
Nutri, 61(8): 986-995.
Neumann, K.F., Rojo, L., Navarrete, L.P., Farlas, G., Reyes, P., & Maccioni, R.B.
(2008). Insulin resistance and Alzheimer's disease: molecular links & clinical
implications. Current Alzheimer Research, 5(5), 438-47.
Odegaard, J.I., & Chawla, A. (2008). Mechanisms of macrophage activation in obesity-
induced insulin resistance. Nature Clinical Practice. Endocrinology &
Metabolism, 4(11), 619-26.
Ogawa, Y., Masuzaki, H., Hosoda, K., Alzawa-Abe, M., Suga, J., Suda, M., et al.
(1999). Increased glucose metabolism and insulin sensitivity in transgenic
skinny mice overexpressing leptin. Diabetes, 48(9), 1822-9.
Ogawa, Y., Masuzaki, H., Ebihara, K., Shintani, M., Aizawa-Abe, M., Miyanaga, F., et
al. (2002). Pathophysiogical role of leptin in lifestyle-related diseases. Studies
with transgenic skinny mice overexpressing leptin. Journal of Diabetes and Its
Complications, 16(1), 119-22.
Otto-Buczkowska, E., Mazur-Dworzecka, U., & Dworzecki, T. (2008). [Role of amylin
in glucose homeostasis and its perspective use in diabetes management]. Przegl
Lek, 65(3), 135-9.

85
Palou, M., Sánchez, J., Rodríguez, A.M., Priego, T., Pico, C., & Palou, A. (2009).
Induction of NPY/AgRP orexigenic peptide expression in rat hypothalamus is an
early event in fasting: relationship with circulating leptin, insulin and glucose.
Cellular Physiology and Biochemistry: International Journal of Experimental
Cellular Physiology, Biochemistry, and Pharmacology, 23(1-3), 115-24.
Papamandjaris, A.A., White, M.D., Raeini-Sarjaz, M., & Jones, P.J. (2000).
Endogenous fat oxidation during medium chain versus long chain triglyceride
feeding in healthy women. Int J Obes Relat Metab Disord; 24:1158-66.
Pappas, P.A & DePuy, V. (2004). An Overview of Non-parametric Tests in SAS®:
When, Why, and How. Available at:
http://analytics.ncsu.edu/sesug/2004/TU04-Pappas.pdf
Petruzziello, L., Iacopini, F., Bulajic, M., Shah, S., Costamagna, G. (2006). Review
article: Uncomplicated diverticular disease of the colon. Aliment Pharmacol Ther,
23:1379-1391.
Pittner, R.A., Albrandt, K., Beaumont, K., Gaeta, L.S., Koda, J.E., Moore, C.X. et al.
(1994). Molecular physiology of amylin. Journal of Cellular Biochemistry, 55
Suppl, 19-28.
Ragin, C.C., Dallal , C., Okobia, M., Modugno , F., Chen, J., Garte, S., et al. (2009).
Leptin levels and leptin receptor polymorphism frequency in healthy populations.
Infectious Agents and Cancer, 4 Suppl 1, S13.
Ramos, L.S., Zippin, J.H., Kamentsky, M., Buck, J., & Levin, L.R. (2008). Glucose and
GLP-1 stimulate cAMP production via distinct adenylyl cyclases in INS-1E
insulinoma cells. The Journal of General Physiology, 132(3), 329-338.
Ratner, R.E., Dickey, R., Fineman, M., Maggs, D.G., Shen, L., Strobel, S.A., et al.
(2004). Amylin replacement with pramlintide as an adjunct to insulin therapy
improves long-term glycaemic and weight control in Type 1 diabetes mellitus: a
1-year, randomized controlled trial. Diabetic Medicine: A Journal of the British
Diabetic Association, 21(11), 1204-12.
86
Reimer, R.A., & McBurney, M.I. (1996). Dietary fibre modulates intestinal
proglucagon messenger ribonucleic acid and postprandial secretion of glucagon-
like peptide-1 and insulin in rats. Endocrinology, 137(9), 3948-56.
Reimer, R.A., Pelletier, X., Carabin, I.G., Lyon, M., Gahler, R., Parnell, J.A., & Wood,
S. (2010). Increased plasma PYY levels following supplementation with the
functional fibre PolyGlycopleX in healthy adults. European Journal of Clinical
Nutrition, 64: 1186-1191.
Roberfroid, M.B. (2005). Introducing inulin-type fructans. Br J Nutr, 93, S13-S25.
Ryan, M.T., Savarase, V.W., Hipszer, B., Dizdarevic, I., Joseph, M., Shively, N., et al.
(2009). Continuous glucose monitor shows potential for early hypoglycemia
detection in hospitalized patients. Diabetes Technol Ther. 11(11) 745-7
Santos, M., Bastos, P., Gonzaga, S., Roriz, J.M., Baptista, M.J., Nogueira-Silva. C., et al.
(2006). Ghrelin expression in human and rat fetal lungs and the effect of ghrelin
administration in nitrofen-induced congenital diaphragmatic hernia. Pediatric
Research, 59(4 Pt 1), 531-7.
SAS Institute Inc., (1990) SAS/STAT User's Guide, Volume 2, Version 6,
Fourth edition, Cary. NC: SAS Institute Inc.
Seidell, J.C. (2005). Cost-effective measures to prevent obesity: Epidemiological basis
and appropriate target groups. Proc Nutr Soc 64(1): 1-5.
Shiang, K.D. (2004). The SAS Calculations of Areas Under the Curve (AUC) for
Multiple Metabolic Readings. Available at:
http://www.lexjansen.com/wuss/2004/posters/c_post_the_sas_calculations_.pdf
Smith, B.J. (1974). The irritable bowel syndrome. Practitioner. 213:37-46.
Statistics Canada (2004). Available at: http://www.statcan.gc.ca/pub/82-620-
m/2005001/article/adults-adultes/8060-eng.htm
87
Statistics Canada (2010). Available at:
http://www.statcan.gc.ca/cgibin/imdb/p2SV.pl?Function=getSurvey&SDDS=32
26&lang=en&db=imdb&adm=8&dis=2
Steffen, L.M., Jacobs, D.R. Jr, Stevens, J., Shahar, E., Carithers, T., & Folsom, A.R.
(2003). Associations of whole-grain, refined grain, and fruit and vegetable
consumption with risks of all-cause mortality and incident coronary artery
disease and ischemic stroke: The Atherosclerosis Risk in Communities (ARIC)
Study. Am J Clin Nutr. 78:383. 390.
St-Onge, M.P., Bourque, C., Jones, P.J., Ross, R., & Parsons, W.E. (2003). Medium
versus long-chain triglycerides for 27 days increases fat oxidation and energy
expenditure without resulting in changes in body composition in overweight
women. Int J Obes Relat Metab Disord, 27:95-102.
St-Onge, M.P., Ross, R., Parsons, W.D., & Jones, P.J. (2003). Medium-chain
triglycerides increase energy expenditure and decrease adiposity in overweight
men. Obes Res, 11:395-402.
St-Onge, M-P., & Bosarge, A. (2008). Weight-loss diet that includes consumption of
medium-chain triacylglycerol oil leads to a greater rate of weight and fat mass
loss than does olive oil. Am J Clin Nutr, 87: 621-626.
St-Onge, MP, Bosarge, A., Goree, L.L.T., & Darnell, B. (2008). Medium chain
triglyceride oil consumption as part of a weight loss diet does not lead to an
adverse metabolic profile when compared to olive oil. J Am Coll Nutr. 27(5):
547-552.
Svendsen, P.F., Nilas, L., Madsbad, S., & Hoist, J.J. (2009). Incretin hormone secretion
in women with polycystic ovary syndrome: roles of obesity, insulin sensitivity,
and treatment with metformin. Metabolism: Clinical and Experimental, 58(5),
586-93.
Swinburn, B.A. (2004) Diet, nutrition and the prevention of excess weight gain and
obesity. Public Health Nutr 7(1A): 123-146.
88
Tolhurst, G., Reimann, F., & Gribble, F.M. (2009). Nutritional regulation of glucagon-
like peptide-1 secretion. The Journal of Physiology, 587(Pt 1), 27-32.
Topping, D.L. (1991). Soluble fiber polysaccharides effects on plasma cholesterol and
colonic fermentation. Nutrition reviews, 49(7): 195-203.
Tsai, C.J., Leadsman, M.F., Willett, W.C., & Giovannucci, E.L. (2004). Longterm
intake of dietary fibre and decreased risk of cholecystectomy in women. Am J
Gastroenterol. 99:1364-1370.
Tsuji, H., Kasai, M., Takeuchi, H., Nakamura, M., Okazaki, M., & Kondo, K. (2001).
Dietary medium-chain triacylglycerols suppress accumulation of body fat in a
double-blind, controlled trial in healthy men and women. J Nutr, 131: 2853-9.
U.S. Department of Agriculture (USDA), US Department of Health and Human
Services (2005). Dietary guidelines for Americans. Washington, DC: USDA
U.S. Department of Agriculture (USDA), US Department of Health and Human
Services (2004). Expert panel report on dietary guidelines: Washington, DC:
USDA.
U.S. Department of Health and Human Services (2001). The Surgeon General's (Call to
action to prevent and decrease overweight and obesity, Rockville, MD: U.S.
Department of Health and Human Services, Public Health Service, Office of the
Surgeon General.
U.S. Department of Health and Human Services FDA (1997). Health claims: oats and
coronary heart disease - final rule. Fed Regist. 62:3583-3601.
U.S. Department of Health and Human Services FDA (1998). Health claims: soluble
fibre from certain foods and coronary heart disease - final rule. Fed Regist. 63:
8103- 8121.
Velázquez, M., Davies, C., Marett, R., Slavin, J.L., & Feirtag, J.M. (2000). Effect of
oligosaccharides and fibre substitutes on short-chain fatty acid production by
human faecal microflora. Anaerobe, 6:87-92.
Wang, Y., & Lobstein, T. (2006) Worldwide trends in childhood overweight and
obesity. Into J Pediatric Obes. 1:11-25.

89
Weickert, M.O., & Pfeiffer, A.F.H. (2008). Metabolic effects of dietary fibre
consumption and prevention of diabetes. J. Nutr., 138(3), 439-442.
Weickert, M.O., & Pfeiffer, A.F.H. (2005). Preventing type 2 diabetes: What does
dietary fibre achieve? MMW Fortschr Med. 147(17):28-30.
Weickert, M.O., Reimann , M., Otto, B., Hall, W.L., Vafeiadou, K., Hallund, J., et al.
(2006). Soy isoflavones increase preprandial peptide YY (PYY), but have no
effect on ghrelin and body weight in healthy postmenopausal women. Journal of
Negative Results in Biomedicine, 5, 11.
Weigle, D.S., Duell, P.B., Connor, W.E., Steiner, R.A., Soules, M.R., & Kuijper, J.L.
(1997). Effect of fasting, refeeding, and dietary fat restriction on plasma leptin
levels. The Journal of Clinical Endocrinology and Metabolism, 82(2), 561-5.
Wesley, U.V., Tiwari, S., & Houghton, A.N. (2004). Role for dipeptidyl peptidase IV in
tumor suppression of human non small cell lung carcinoma cells. Int. J. Cancer
(109) 855-866
Whelton, S.P., Hyre, A.D., Pedersen, B., Yi, Y., Whelton, P.K., & He, J. (2005). Effect
of dietary fibre intake on blood pressure: A metaanalysis of randomized,
controlled clinical trials. J Hypertens, 23: 475- 481.
Wong, J.M.W., de Souza, R., Russell, R.D., Kendall, C.W.C., Emam, A. , & Jenkins,
D.J.A. (2006). J Clin Gastroenterol, 40(3): 235-243
World Health Organization (2006). Obesity and overweight. Fact sheet No. 311.
Available at: http://www.who.int/mediacentre/factsheets/fs311/en/index.html.
Wren, A.M., & Bloom, S.R. (2007). Gut hormones and appetite control.
Gastroenterology, 132(6), 2116-30.
Wright, R.S., Anderson, J.W., Bridges, S.R. (1990). Propionate inhibits hepatocyte lipid
synthesis. Proc Soc Exp Biol Med. 195: 26-29.
Wu, A.H., Tseng, C.C., Hankin, J., & Bernstein, L. (2007). Fibre intake and risk of
adenocarcinomas of the esophagus and stomach. Cancer Causes Control.
18:713-722.
90
Yamada, K., Tokunaga, Y., Ikeda, A., Ohkura, K., Mamiya, S., Kaku, S., et al. (1999).
Dietary effect of guar gum and its partially hydrolyzed product on the lipid
metabolism and immune function of Sprague-Dawley rats. Biosci Biotechnol
Biochem, 63: 2163-2167.
Yan, L., Dodier, R., Mozer, M.C. & Wolniewicz, R. (2003). Optimizing
Classifiers Performance Via the Wilcoxon-mann-Whitney Statastics.
In Proc. Of Int. Conf. on Machine Learning, 2003 pp. 848-855
Zanovec, M., O'Neil, C.E., Cho, S.S., Kleinman, R.E., & Nicklas, T.A. (2010).
Relationship between whole grain and fiber consumption and body weight
measures among 6- to 18-year-olds. J Pediatr, 157(4):578-83.
Zhang C, Liu, S., Solomon, C.G., & Hu, F.B. (2006). Dietary fiber intake. Dietary
glycemic load, and the risk for gestational diabetes mellitus, Diabetes Care,
29: 2223-2230.
Zhou, J., Martin, R.J., Tulley, R.T., Raggio, A.M., McCutcheon, K.L., Shen, L., et al.
(2008). Dietary resistant starch upregulates total GLP-1 and PYY in a
sustained day-long manner through fermentation in rodents. American Journal
of Physiology. Endocrinology and Metabolism, 295(5), E1160-6.
Zimmet, P. (2007). Diabetes. The biggest epidemic in human history. Available at:
http://www.ncbi.nlm.nih.gov/pmc/articles/PMC2100115/

91
APPENDIX: PATTERN OF CHANGE IN BLOOD GLUCOSE, INSULIN
AND GUT HORMONES CONCENTRATIONS WITH INGESTION TIME
AT WEEK 0 AND AFTER 13 WEEKS
Variation in blood glucose concentrations with ingestion time at the beginning
(baseline – week 0) and after 13 weeks for placebo and the PGX treatment group are
shown in Figure A.1. No significant difference was seen among the treatments at any
time during the trial period. In both cases, blood glucose concentrations reached a
maximum within 45 min of intake, and then gradually decreased to normal levels. A
similar trend was observed with plasma insulin; however, its level was maintained until
120 min after intake before leveling to the initial values (Figure A.2). While GLP-1
concentration showed a variation from week 0 to week 13, in the placebo and the PGX
treatment group (Figure A.3), the values were still not significantly different. Also, the
observed pattern of change was somewhat higher in the placebo group, compared to the
PGX group. The concentration of the gut peptide, GIP, was also found to increase after
13 weeks, reaching a maximum at 60 min after ingestion, for both the placebo and the
PGX group, with no difference between treatments (Figure A.4). While the trend of the
amylin concentration followed a similar pattern to that of plasma insulin (Figure A.5), a
noticeable dependence was observed on the insulin plasma concentration. On the other
92
hand, PYY (Figure A.6) and PP (Figure A.7) concentrations increased rapidly until 30
min, and then decreased to a certain level with increasing time. The concentrations of
PYY were higher after 13 weeks of the clinical trial, for both the placebo and the PGX
treatment group. Nevertheless, no difference was observed in the PP concentration even
after 13 weeks of the trial.
Although most of the studied hormones and gut peptides initially showed an
increasing trend after ingestion, in both placebo and PGX groups, ghrelin and leptin
concentrations decreased after ingestion of the placebo or the active PGX treatment.
The concentration of ghrelin showed an initial decrease, until 60 min after ingestion of
either placebo or PGX treatment, and then tended to increase up to the initial
concentration level (Figure A.8). The results show even higher concentrations after the
13 week trial period, when compared to the initial values at week 0 (baseline). The
leptin concentration also showed a similar trend, though the results were not statistically
significant (Figure A.9).

93
Figure A.1: Pattern of change in blood glucose concentrations with
ingestion time at week 0 (filled) and after 13 weeks (empty) {Placebo
(left), and PGX (right)}.
Figure A.2: Pattern of change in insulin concentrations with ingestion
time at week 0 (empty) and after 13 weeks (filled) {Placebo (left), and
PGX (right)}.
Time after Ingestion (Minutes)
0 30 60 90 120 150 180 210 240
Blo
od G
luco
se (
mm
ol/L)
4
5
6
7
8
Time after Ingestion (Minutes)
0 30 60 90 120 150 180 210 240
Blo
od
Glu
co
se
(m
mo
l/L
)
4
5
6
7
8
Time after Ingestion (Minutes)
0 30 60 90 120 150 180 210 240
Insulin
(p
g/m
L)
0
800
1600
2400
3200
Time after Ingestion (Minutes)
0 30 60 90 120 150 180 210 240
Insulin
(pg
/mL)
0
800
1600
2400
3200

94
Figure A.3: Pattern of change in GLP-1 concentrations with ingestion
time at week 0 (empty) and after 13 weeks (filled) {Placebo (left), and
PGX (right)}.
Figure A.4: Pattern of change in GIP concentrations with ingestion
time at week 0 (empty) and after 13 weeks (filled) {Placebo (left), and
PGX (right)}.
Time after Ingestion (Minutes)
0 30 60 90 120 150 180 210 240
GLP
-1 (
pg/m
L)
6
7
8
9
10
Time after Ingestion (Minutes)
0 30 60 90 120 150 180 210 240
GL
P-1
(p
g/m
L)
6
7
8
9
10
Time after Ingestion (Minutes)
0 30 60 90 120 150 180 210 240
GIP
(p
g/m
L)
0
10
20
30
40
50
60
70
Time after Ingestion (Minutes)
0 30 60 90 120 150 180 210 240
GIP
(pg/m
L)
0
10
20
30
40
50
60
70

95
Figure A.5: Pattern of change in amylin concentrations with ingestion
time at week 0 (empty) and after 13 weeks (filled) {Placebo (left), and
PGX (right)}.
Figure A.6: Pattern of change in PYY concentrations with ingestion
time at week 0 (empty) and after 13 weeks (filled) {Placebo (left), and
PGX (right)}.
Time after Ingestion (Minutes)
0 30 60 90 120 150 180 210 240
Am
ylin
(pg
/mL
)
0
40
80
120
160
200
240
Time after Ingestion (Minutes)
0 30 60 90 120 150 180 210 240
Am
ylin
(pg
/mL)
0
40
80
120
160
200
240
Time after Ingestion (Minutes)
0 30 60 90 120 150 180 210 240
PY
Y (
pg/m
L)
34
36
38
40
42
44
46
Time after Ingestion (Minutes)
0 30 60 90 120 150 180 210 240
PY
Y (
pg
/mL)
34
36
38
40
42
44
46

96
Figure A.7: Pattern of change in PP concentrations with ingestion time
at week 0 (empty) and after 13 weeks (filled) {Placebo (left), and PGX
(right)}.
Figure A.8: Pattern of change in ghrelin concentrations with ingestion
time at week 0 (empty) and after 13 weeks (filled) {Placebo (left), and
PGX (right)}
Time after Ingestion (Minutes)
0 30 60 90 120 150 180 210 240
PP
(pg/m
L)
0
40
80
120
160
200
240
Time after Ingestion (Minutes)
0 30 60 90 120 150 180 210 240
PP
(p
g/m
L)
0
40
80
120
160
200
240
Time after Ingestion (Minutes)
0 30 60 90 120 150 180 210 240
Ghre
lin (
pg
/mL
)
20
40
60
80
100
120
140
Time after Ingestion (Minutes)
0 30 60 90 120 150 180 210 240
Gh
relin
(p
g/m
L)
20
40
60
80
100
120
140

97
Figure A.9: Pattern of change in leptin concentrations with ingestion
time at week 0 (empty) and after 13 weeks (filled) {Placebo (left), and
PGX (right)}.
Time after Ingestion (Minutes)
0 30 60 90 120 150 180 210 240
Leptin (
pg/m
L)
10000
12000
14000
16000
18000
Time after Ingestion (Minutes)
0 30 60 90 120 150 180 210 240
Le
ptin (
pg/m
L)
10000
12000
14000
16000
18000