Triacylglycerol Fatty Acid Composition in Diet-Induced Weight Loss in Subjects with Abnormal Glucose...
10
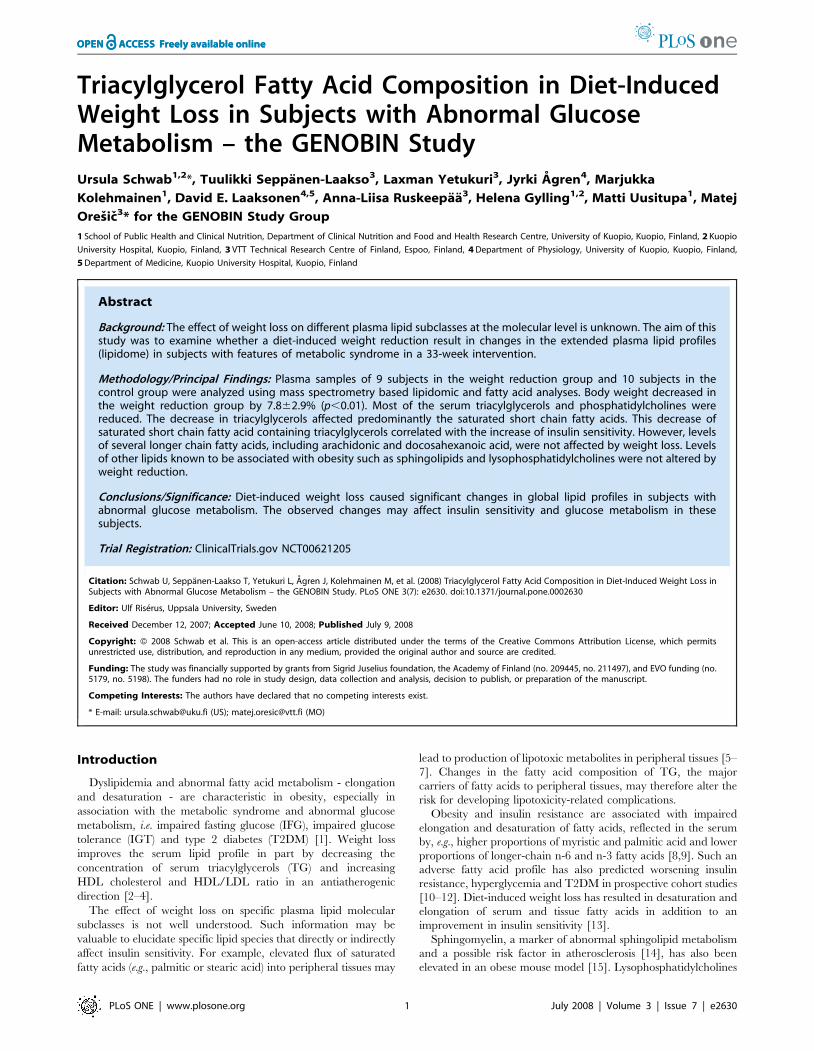
Triacylglycerol Fatty Acid Composition in Diet-Induced Weight Loss in Subjects with Abnormal Glucose Metabolism – the GENOBIN Study Ursula Schwab 1,2 *, Tuulikki Seppa ¨ nen-Laakso 3 , Laxman Yetukuri 3 , Jyrki A ˚ gren 4 , Marjukka Kolehmainen 1 , David E. Laaksonen 4,5 , Anna-Liisa Ruskeepa ¨a ¨ 3 , Helena Gylling 1,2 , Matti Uusitupa 1 , Matej Ores ˇic ˇ 3 * for the GENOBIN Study Group 1 School of Public Health and Clinical Nutrition, Department of Clinical Nutrition and Food and Health Research Centre, University of Kuopio, Kuopio, Finland, 2 Kuopio University Hospital, Kuopio, Finland, 3 VTT Technical Research Centre of Finland, Espoo, Finland, 4 Department of Physiology, University of Kuopio, Kuopio, Finland, 5 Department of Medicine, Kuopio University Hospital, Kuopio, Finland Abstract Background: The effect of weight loss on different plasma lipid subclasses at the molecular level is unknown. The aim of this study was to examine whether a diet-induced weight reduction result in changes in the extended plasma lipid profiles (lipidome) in subjects with features of metabolic syndrome in a 33-week intervention. Methodology/Principal Findings: Plasma samples of 9 subjects in the weight reduction group and 10 subjects in the control group were analyzed using mass spectrometry based lipidomic and fatty acid analyses. Body weight decreased in the weight reduction group by 7.862.9% (p,0.01). Most of the serum triacylglycerols and phosphatidylcholines were reduced. The decrease in triacylglycerols affected predominantly the saturated short chain fatty acids. This decrease of saturated short chain fatty acid containing triacylglycerols correlated with the increase of insulin sensitivity. However, levels of several longer chain fatty acids, including arachidonic and docosahexanoic acid, were not affected by weight loss. Levels of other lipids known to be associated with obesity such as sphingolipids and lysophosphatidylcholines were not altered by weight reduction. Conclusions/Significance: Diet-induced weight loss caused significant changes in global lipid profiles in subjects with abnormal glucose metabolism. The observed changes may affect insulin sensitivity and glucose metabolism in these subjects. Trial Registration: ClinicalTrials.gov NCT00621205 Citation: Schwab U, Seppa ¨nen-Laakso T, Yetukuri L, A ˚ gren J, Kolehmainen M, et al. (2008) Triacylglycerol Fatty Acid Composition in Diet-Induced Weight Loss in Subjects with Abnormal Glucose Metabolism – the GENOBIN Study. PLoS ONE 3(7): e2630. doi:10.1371/journal.pone.0002630 Editor: Ulf Rise ´ rus, Uppsala University, Sweden Received December 12, 2007; Accepted June 10, 2008; Published July 9, 2008 Copyright: ß 2008 Schwab et al. This is an open-access article distributed under the terms of the Creative Commons Attribution License, which permits unrestricted use, distribution, and reproduction in any medium, provided the original author and source are credited. Funding: The study was financially supported by grants from Sigrid Juselius foundation, the Academy of Finland (no. 209445, no. 211497), and EVO funding (no. 5179, no. 5198). The funders had no role in study design, data collection and analysis, decision to publish, or preparation of the manuscript. Competing Interests: The authors have declared that no competing interests exist. * E-mail: [email protected] (US); [email protected] (MO) Introduction Dyslipidemia and abnormal fatty acid metabolism - elongation and desaturation - are characteristic in obesity, especially in association with the metabolic syndrome and abnormal glucose metabolism, i.e. impaired fasting glucose (IFG), impaired glucose tolerance (IGT) and type 2 diabetes (T2DM) [1]. Weight loss improves the serum lipid profile in part by decreasing the concentration of serum triacylglycerols (TG) and increasing HDL cholesterol and HDL/LDL ratio in an antiatherogenic direction [2–4]. The effect of weight loss on specific plasma lipid molecular subclasses is not well understood. Such information may be valuable to elucidate specific lipid species that directly or indirectly affect insulin sensitivity. For example, elevated flux of saturated fatty acids (e.g., palmitic or stearic acid) into peripheral tissues may lead to production of lipotoxic metabolites in peripheral tissues [5– 7]. Changes in the fatty acid composition of TG, the major carriers of fatty acids to peripheral tissues, may therefore alter the risk for developing lipotoxicity-related complications. Obesity and insulin resistance are associated with impaired elongation and desaturation of fatty acids, reflected in the serum by, e.g., higher proportions of myristic and palmitic acid and lower proportions of longer-chain n-6 and n-3 fatty acids [8,9]. Such an adverse fatty acid profile has also predicted worsening insulin resistance, hyperglycemia and T2DM in prospective cohort studies [10–12]. Diet-induced weight loss has resulted in desaturation and elongation of serum and tissue fatty acids in addition to an improvement in insulin sensitivity [13]. Sphingomyelin, a marker of abnormal sphingolipid metabolism and a possible risk factor in atherosclerosis [14], has also been elevated in an obese mouse model [15]. Lysophosphatidylcholines PLoS ONE | www.plosone.org 1 July 2008 | Volume 3 | Issue 7 | e2630
-
Upload
independent -
Category
Documents
-
view
1 -
download
0
Transcript of Triacylglycerol Fatty Acid Composition in Diet-Induced Weight Loss in Subjects with Abnormal Glucose...
Triacylglycerol Fatty Acid Composition in Diet-InducedWeight Loss in Subjects with Abnormal GlucoseMetabolism – the GENOBIN StudyUrsula Schwab1,2*, Tuulikki Seppanen-Laakso3, Laxman Yetukuri3, Jyrki Agren4, Marjukka
Kolehmainen1, David E. Laaksonen4,5, Anna-Liisa Ruskeepaa3, Helena Gylling1,2, Matti Uusitupa1, Matej
Oresic3* for the GENOBIN Study Group
1 School of Public Health and Clinical Nutrition, Department of Clinical Nutrition and Food and Health Research Centre, University of Kuopio, Kuopio, Finland, 2 Kuopio
University Hospital, Kuopio, Finland, 3 VTT Technical Research Centre of Finland, Espoo, Finland, 4 Department of Physiology, University of Kuopio, Kuopio, Finland,
5 Department of Medicine, Kuopio University Hospital, Kuopio, Finland
Abstract
Background: The effect of weight loss on different plasma lipid subclasses at the molecular level is unknown. The aim of thisstudy was to examine whether a diet-induced weight reduction result in changes in the extended plasma lipid profiles(lipidome) in subjects with features of metabolic syndrome in a 33-week intervention.
Methodology/Principal Findings: Plasma samples of 9 subjects in the weight reduction group and 10 subjects in thecontrol group were analyzed using mass spectrometry based lipidomic and fatty acid analyses. Body weight decreased inthe weight reduction group by 7.862.9% (p,0.01). Most of the serum triacylglycerols and phosphatidylcholines werereduced. The decrease in triacylglycerols affected predominantly the saturated short chain fatty acids. This decrease ofsaturated short chain fatty acid containing triacylglycerols correlated with the increase of insulin sensitivity. However, levelsof several longer chain fatty acids, including arachidonic and docosahexanoic acid, were not affected by weight loss. Levelsof other lipids known to be associated with obesity such as sphingolipids and lysophosphatidylcholines were not altered byweight reduction.
Conclusions/Significance: Diet-induced weight loss caused significant changes in global lipid profiles in subjects withabnormal glucose metabolism. The observed changes may affect insulin sensitivity and glucose metabolism in thesesubjects.
Trial Registration: ClinicalTrials.gov NCT00621205
Citation: Schwab U, Seppanen-Laakso T, Yetukuri L, Agren J, Kolehmainen M, et al. (2008) Triacylglycerol Fatty Acid Composition in Diet-Induced Weight Loss inSubjects with Abnormal Glucose Metabolism – the GENOBIN Study. PLoS ONE 3(7): e2630. doi:10.1371/journal.pone.0002630
Editor: Ulf Riserus, Uppsala University, Sweden
Received December 12, 2007; Accepted June 10, 2008; Published July 9, 2008
Copyright: � 2008 Schwab et al. This is an open-access article distributed under the terms of the Creative Commons Attribution License, which permitsunrestricted use, distribution, and reproduction in any medium, provided the original author and source are credited.
Funding: The study was financially supported by grants from Sigrid Juselius foundation, the Academy of Finland (no. 209445, no. 211497), and EVO funding (no.5179, no. 5198). The funders had no role in study design, data collection and analysis, decision to publish, or preparation of the manuscript.
Competing Interests: The authors have declared that no competing interests exist.
* E-mail: [email protected] (US); [email protected] (MO)
Introduction
Dyslipidemia and abnormal fatty acid metabolism - elongation
and desaturation - are characteristic in obesity, especially in
association with the metabolic syndrome and abnormal glucose
metabolism, i.e. impaired fasting glucose (IFG), impaired glucose
tolerance (IGT) and type 2 diabetes (T2DM) [1]. Weight loss
improves the serum lipid profile in part by decreasing the
concentration of serum triacylglycerols (TG) and increasing
HDL cholesterol and HDL/LDL ratio in an antiatherogenic
direction [2–4].
The effect of weight loss on specific plasma lipid molecular
subclasses is not well understood. Such information may be
valuable to elucidate specific lipid species that directly or indirectly
affect insulin sensitivity. For example, elevated flux of saturated
fatty acids (e.g., palmitic or stearic acid) into peripheral tissues may
lead to production of lipotoxic metabolites in peripheral tissues [5–
7]. Changes in the fatty acid composition of TG, the major
carriers of fatty acids to peripheral tissues, may therefore alter the
risk for developing lipotoxicity-related complications.
Obesity and insulin resistance are associated with impaired
elongation and desaturation of fatty acids, reflected in the serum
by, e.g., higher proportions of myristic and palmitic acid and lower
proportions of longer-chain n-6 and n-3 fatty acids [8,9]. Such an
adverse fatty acid profile has also predicted worsening insulin
resistance, hyperglycemia and T2DM in prospective cohort studies
[10–12]. Diet-induced weight loss has resulted in desaturation and
elongation of serum and tissue fatty acids in addition to an
improvement in insulin sensitivity [13].
Sphingomyelin, a marker of abnormal sphingolipid metabolism
and a possible risk factor in atherosclerosis [14], has also been
elevated in an obese mouse model [15]. Lysophosphatidylcholines
PLoS ONE | www.plosone.org 1 July 2008 | Volume 3 | Issue 7 | e2630

(LPC), phospholipase A2-generated hydrolysis products of phos-
phatidylcholines (PC), regulate a range of pro-inflammatory
molecules [16]. They have been elevated in patients with T2DM
[17], atherosclerosis [18] and obesity [19]. Levels of LPC also
positively correlate with measures of subcutaneous obesity and
negatively with insulin sensitivity [19].
Analytical platforms and informatic tools have been recently
developed that afford extended and sensitive measurement of the
lipidome [20,21]. Current lipidomics platforms enable quantitative
characterization of hundreds of diverse lipid molecular species
across multiple lipid classes, including sphingolipids, phospholipids
(PL), sterol esters, and acylglycerols [21–27]. The exact fatty acid
composition for each lipid can usually be determined. It is
therefore possible to broadly characterize the effect of weight loss
on plasma lipidome, specifically in relation to features of energy
storage and signaling associated with the metabolic syndrome and
insulin resistance.
We hypothesized that the diet induced weight loss affects the
global plasma lipidomic profile, and that the observed profile
changes may provide new clues about the physiology of weight
change. The lipidomics strategy was applied to examine what
changes in lipidomic profile occur after a successful diet-induced
weight loss according to current dietary recommendations in
middle-aged and older (elderly over 75 years of age) subjects with
IFG or IGT and the metabolic syndrome in a 33-week trial [28].
Methods
The original protocol for this trial (in Finnish) and the
CONSORT checklist are available as supporting information,
Protocol S1 and Checklist S1.
ParticipantsAltogether 75 overweight or obese (BMI 28–40 kg/m2) subjects
aged 40 to 70 years were recruited to the GENOBIN study [28].
The subjects had IFG (fasting plasma glucose concentration 5.6–
7.0 mmol/l) or IGT (2-hour plasma glucose concentration 7.8–
11.0 mmol/l) and at least 2 other features of the metabolic
syndrome according to the Adult Treatment Panel III criteria
[29]: waist circumference .102 cm (males)/.88 cm (females),
fasting serum TG concentration $1.7 mmol/l, fasting serum
HDL-cholesterol ,1.0 mmol/l (males)/,1.3 mmol/l (females),
blood pressure $130/85 mmHg.
ObjectivesThe aim of this study was to examine whether a diet-induced
weight reduction and dietary changes towards current recom-
mendations result in changes in the extended plasma lipid profiles
(lipidome) in subjects with impaired fasting glucose (IFG) or
impaired glucose tolerance (IGT) and features of metabolic
syndrome in a 33-week intervention.
EthicsThe intervention was performed in accordance with the
principles of the Declaration of Helsinki. The Ethics Committee
of the District Hospital Region of Northern Savo and Kuopio
University Hospital approved the study plan, and all participants
gave their written informed consent.
InterventionsSubjects were randomly assigned to a weight reduction (WR)
group (n = 28), resistance training group (n = 14), aerobic exercise
group (n = 15) or a control group (n = 18). Subjects were matched
for age, gender, BMI and the status of glucose metabolism (IFG/
IGT). At screening, the health status and medical history of the
subjects were examined by an interview, clinical examination, and
laboratory examinations including measurements for liver, kidney
and thyroid functions. The duration of the study was
33.162.0 weeks (mean6SD). The WR group had a 12-week
intensive WR period during which they met a clinical nutritionist
for five times. A clinical nutritionist gave individual instructions
based on an interview and 4-day food records kept by the subjects
three times during the intensive period (at weeks 1, 7–8 and 12),
aiming to decrease the energy intake level and meet the American
Heart Association criteria [30]. The minimum aim for study weeks
12–33 was to maintain the reduced body weight achieved. The
subjects were asked to maintain their habitual level of physical
exercise throughout the intervention period. During the weeks 12-
33 the subjects kept 4-day food records twice (22 weeks and
32 weeks). The subjects in the control group were advised to
continue their normal lifestyle during the study, and to keep their
diet and exercise habits unchanged. Food records were kept at
weeks 0, 12 and 32.
Lipidomics analysis was performed in those subjects in the WR
and control groups whose adipose tissue samples were chosen for
the transcriptomic analysis [28]. Those subjects were chosen based
on the weight change during the intervention (Figure 1). The
inclusion criteria in the WR group was .5% from the baseline
weight and 62 kg maximum in the control group. Initially, there
were 10 subjects chosen in the WR group, but one subject was
excluded due to rheumatoid arthritis. The baseline characteristics
of these 19 subjects are presented in Table 1.
OutcomesAnthropometric measures. Body weight was measured
with a standardized electronic scale in light clothing. Height was
measured at the beginning of the study in a Frankfurt position.
The waist circumference was measured halfway between the
lowest rib and the iliac crest. Body composition was measured by a
Figure 1. CONSORT chart showing selection of subjects forlipidomic analysis.doi:10.1371/journal.pone.0002630.g001
Weight Loss Lipidomics
PLoS ONE | www.plosone.org 2 July 2008 | Volume 3 | Issue 7 | e2630

bioelectrical impedance STA/BIA Body Composition Analyzer
(Akern Bioresearch Srl, Florence, Italy).
Biochemical measures. Blood samples for biochemical
analyses were drawn at weeks 0 and 33 after a 12 hour
overnight fast from an antecubital vein while a subject was in a
sitting position. Biochemical analyses were performed using
routine methods in Clinical Laboratory Centre of the Kuopio
University Hospital and in the Clinical Unit of the University of
Kuopio. For the analysis of serum concentrations of lipoprotein
lipids, lipoproteins were separated by ultracentrifucation (Beckman
Optima L-90K, Palo Alto, Ca). Enzymatic colorimetric methods
with commercial kits (cholesterol: CHOD-PAP, TG: GPO-PAP,
Roche Diagnostics GmbH, Mannheim, Germany) were used to
determine cholesterol and TG concentrations from whole serum
and separated lipoproteins with an automated instrument (Kone
Pro Clinical Chemistry Analyzer, Thermo Clinical Labsystems,
Konelab, Espoo, Finland).
The frequently sampled intravenous glucose tolerance test
(FSIGT) was performed according to the Minimal Model Method
as previously described [31]. Insulin sensitivity index (SI) was
calculated by the MINMOD Millennium software [32].
Fatty acid analysis. Lipids from serum samples (40 ml) were
extracted by chloroform:methanol (2:1, 200 ml) after addition of
heptadecatrienoate [TG(17:0/17:0/17:0)] as internal standard. The
lower layer was separated, evaporated into dryness under nitrogen
flow and dissolved into petroleum ether (bp. 40–60uC). Bound fatty
acids were transmethylated with sodium methoxide (NaOMe, 0.5M
in methanol) by boiling at 45uC for 5 min. The mixture was
acidified by adding NaHSO4 (15% solution) and extracted with
petroleum ether [33]. The organic phase containing fatty acid
methyl esters (FAME) and free fatty acids (FFA) was separated into a
glass vial, evaporated under nitrogen, redissolved into hexane
(50 ml) and transferred into a glass insert for GC analysis.
Two ml aliquots were used for GC injection (split ratio 1:20) at
260uC. The Agilent 5890 series II GC was equipped with a 25 m
FFAP capillary column (i.d. 0.32 mm) and helium was used as carrier
gas (30 ml/min). The oven temperature was increased from 70uC to
240uC at 7uC/min and the fatty acids detected by flame ionization
detector (FID). Identification was based on retention times and GC/
MS spectra of known standards as well as on literature.
Lipidomics. The lipidomics platform based on Ultra
Performance Liquid Chromatography (UPLC) coupled to high
resolution mass spectrometry (MS) was utilized. The applied
platform affords broad screening of multiple lipid classes from total
lipid extracts within a single sample run. Because profile changes
across a diverse range of lipids such as PL and neutral lipids were
of interest, the experiment was performed in positive ion mode.
With UPLC, a run time of 12 minutes can be achieved without
significant loss in sensitivity, covering major monoacylglycerols
and PL, diacylglycerols and diacylglycero-PL, sphingolipids, TG,
and cholesterol esters. The platform has already been applied in
multiple clinical and preclinical studies [7,19,34,35]. The
analytical method utilized is the same as recently reported [34],
so the UPLC/MS based lipidomics methodology is described
below only in brief.
An aliquot (10 ml) of an internal standard mixture containing 11
lipid classes, and 0.05M sodium chloride (10 ml) was added to
plasma samples (10 ml). The lipids were extracted with chloroform/
methanol (2:1, 100 ml). A standard mixture containing 3 labeled
standard lipids was added (10 ml) to the extracts. The sample order
for LC/MS analysis was determined by randomization.
Lipid extracts were analysed on a Waters Q-Tof Premier mass
spectrometer combined with an Acquity Ultra Performance LCTM
(UPLC). The column, which was kept at 50uC, was an Acquity
UPLCTM BEH C18 10650 mm with 1.7 mm particles. The
binary solvent system included A. water (1% 1M NH4Ac, 0.1%
HCOOH) and B. LC/MS grade (Rathburn) acetonitrile/isopro-
panol (5:2, 1% 1M NH4Ac, 0.1% HCOOH). The gradient started
from 65% A/35% B, reached 100% B in 6 min and remained
there for the next 7 min. The total run time including a 5 min re-
equilibration step was 18 min. The flow rate was 0.200 ml/min
and the injected amount 0.75 ml. The temperature of the sample
organizer was set at 10uC.
The lipid profiling was carried out on Waters Q-Tof Premier
mass spectrometer using ESI+ mode. The data were collected at
mass range of m/z 300–1200 with a scan duration of 0.2 sec. The
source temperature was set at 120uC and nitrogen was used as
desolvation gas (800L/h) at 250uC. The voltages of the sampling
cone and capillary were 39 V and 3.2 kV, respectively. Reserpine
(50 mg/L) was used as the lock spray reference compound (5 ml/
min; 10 sec scan frequency).
Data were processed using MZmine software version 0.60 [36].
Lipids were identified using internal spectral library or with
tandem mass spectrometry as described previously [21]. The
normalization of lipidomics data was performed as follows: All
monoacyl lipids except cholesterol esters, such as monoacylglycer-
ols and monoacylglycero-PL were normalized with GPCho(17:0/
0:0), all diacyl lipids except ethanolamine PL were normalized
with GPCho(17:0/17:0), ceramides with Cer(d18:1/17:0), the
diacyl ethanolamine phospholipids were normalized with
GPEtn(17:0/17:0), and the TG and cholesterol esters with
TG(17:0/17:0/17:0). Other (unidentified) molecular species were
calibrated with GPCho(17:0/0:0) for retention time ,300 sec-
onds, GPCho(17:0/17:0) for retention time between 300s and
410s, and TG(17:0/17:0/17:0) for higher retention times.
Statistical methodsThe statistical analyses of biochemical data were performed
using the SPSS statistical software (v. 14.0.1, SPSS Inc., Chicago,
Table 1. Baseline characteristics of the subjects.
Weightreduction (N = 9)
Control(N = 10) p-value*
Gender (males/females) 4/5 4/6
Age (y) 5867 6268 NS
Weight (kg) 97.8619.8 86.666.6 NS
BMI (kg/m2) 34.264.3 31.862.6 NS
Blood pressure (mmHg)
Systolic 140614 13569 NS
Diastolic 9567 8467 0.001
Waist circumference (cm) 111612 10467 NS
Body fat (%) 39.766.8 38.867.4 NS
Serum cholesterol (mmol/l)
Total 5.461.1 4.960.7 NS
HDL 1.1260.17 1.2960.17 NS
LDL 3.6160.91 3.1060.52 NS
VLDL 0.6960.36 0.5160.27 NS
Serum triglycerides (mmol/l) 1.8160.84 1.6160.57 NS
SI; insulin sensitivityindex (mU/l)21min21
1.78+0.42 2.66+0.97 0.027
*Mann-Whitney’s U-test for independent samples.doi:10.1371/journal.pone.0002630.t001
Weight Loss Lipidomics
PLoS ONE | www.plosone.org 3 July 2008 | Volume 3 | Issue 7 | e2630
IL). The normality of the distributions of the variables was verified
with the Kolmogorov-Smirnov test with Lilliefors’ correction.
Mann Whitney’s U-test was used to compare the groups at
baseline. The General Linear Model (GLM) for repeated
measurements was used for analyzing the interaction of time
and group. The paired samples t-test was used to compare the
changes within the groups and an independent samples t-test was
used for comparisons between the groups. Variables with
abnormal distribution were analyzed by Wilcoxon matched pairs
signed ranks test (within the groups) and Mann Whitney’s U-test
(between the groups). The data are expressed as mean6SD, and a
p-value ,0.05 was considered as statistically significant.
The paired samples t-test was used to compare the lipid molecular
species level changes within the groups, and two-sided unpaired t-
test was applied to compare the control and intervention groups at a
specific time point. In order to correct for multiple comparisons,
False Discovery Rate (FDR) q-value was calculated [37], with
significance threshold set at q,0.05. Spearman correlation was
applied to calculate r correlation coefficient, with p-value testing the
hypothesis of no correlation against the alternative that there is a
nonzero correlation using the large-sample approximation. The box
plots used to visualize lipid levels within the groups should be
interpreted as follows: The box itself contains the middle 50% of the
data. The upper edge (hinge) of the box indicates the 75th percentile
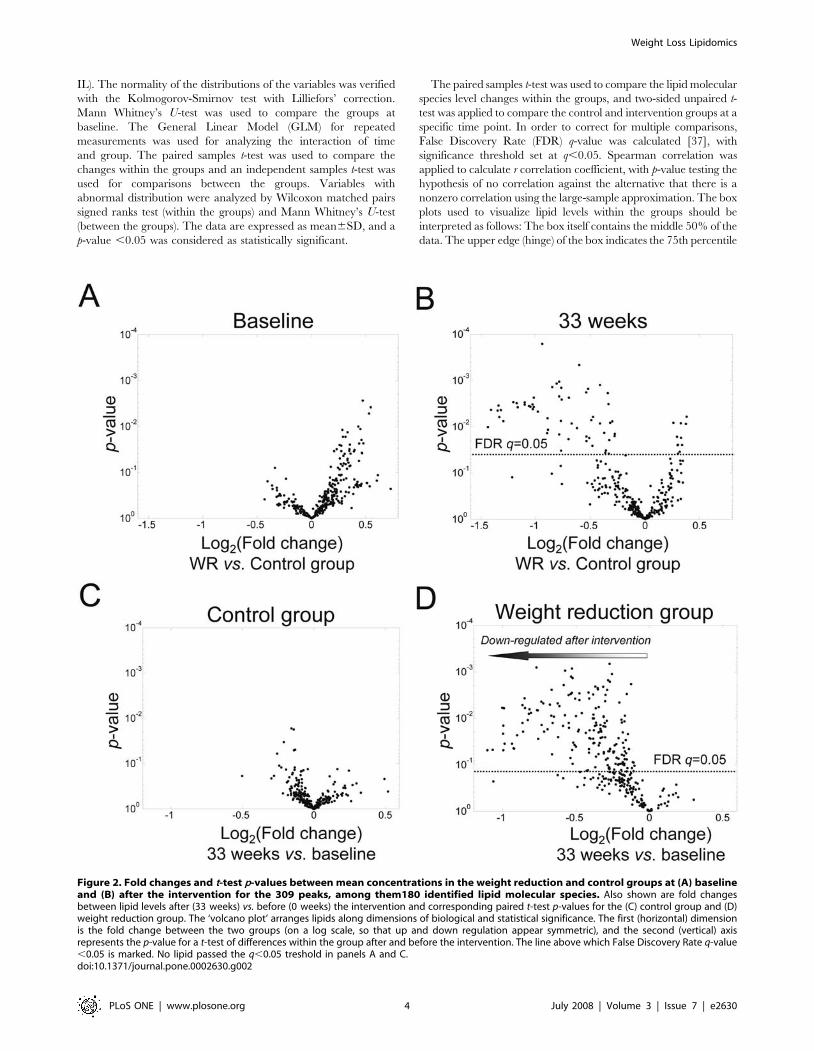
Figure 2. Fold changes and t-test p-values between mean concentrations in the weight reduction and control groups at (A) baselineand (B) after the intervention for the 309 peaks, among them180 identified lipid molecular species. Also shown are fold changesbetween lipid levels after (33 weeks) vs. before (0 weeks) the intervention and corresponding paired t-test p-values for the (C) control group and (D)weight reduction group. The ‘volcano plot’ arranges lipids along dimensions of biological and statistical significance. The first (horizontal) dimensionis the fold change between the two groups (on a log scale, so that up and down regulation appear symmetric), and the second (vertical) axisrepresents the p-value for a t-test of differences within the group after and before the intervention. The line above which False Discovery Rate q-value,0.05 is marked. No lipid passed the q,0.05 treshold in panels A and C.doi:10.1371/journal.pone.0002630.g002
Weight Loss Lipidomics
PLoS ONE | www.plosone.org 4 July 2008 | Volume 3 | Issue 7 | e2630

of the data set, and the lower hinge indicates the 25th percentile.
The line in the box indicates the median value of the data. The ends
of the vertical lines or ‘‘whiskers’’ indicate the minimum and
maximum data values, unless outliers are present in which case the
whiskers extend to a maximum of 1.5 times the inter-quartile range.
The points outside the ends of the whiskers are outliers or suspected
outliers.
Results
In the WR group the change in body weight was 27.862.9%
(27.763.3 kg) (p,0.01, week 33 vs. baseline), whereas in the
control group the change was 0.361.2% (0.361.1 kg) (p ,0.001,
WR vs. control group). The change in SI was 32.3641.9% in the
WR group and 6.3652.1% in the control group (p = 0.074, WR
vs. control group). Fasting plasma glucose concentrations de-
creased 6.969.7% in the WR group and 1.6611.0% in the
control group (p = 0.140 in GLM).
The food record data suggested that the decrease in the energy
intake was mostly due to the decrease in the intake of total and
saturated fat. However, there were no statistically significant
changes in the intake of total fat (34.766.5 vs. 31.965.4, 0 vs.
32 weeks, respectively), or saturated (13.163.0 vs. 11.562.0),
monounsaturated (11.562.5 vs. 11.262.6) or polyunsaturated
fatty acids (6.261.6 vs. 5.761.5) in the WR group as % of energy
(E%). The respective values for the control group were: total fat
32.469.8 vs. 32.765.4, saturated fat 12.764.1 vs. 12.562.0,
monounsaturated fat 10.563.9 vs. 11.262.4, and polyunsaturated
fat 5.161.8 vs. 5.161.3 E%, 0 vs. 32 weeks, respectively, p = NS.
The changes in the intake of total fat or fatty acid groups did not
differ between the groups. The intake of energy was 709662160
kJ vs. 60926702 kJ in the WR group, 0 vs. 32 weeks, respectively,
and 792361537 kJ vs. 744161421 kJ in the control group, 0 vs.
32 weeks, respectively. At 32 weeks the energy intake differed
between the groups (p = 0.02).
Concentrations of serum total and lipoprotein lipids did not change
significantly during the intervention and did not differ between the
groups, partly due to the small sample size. The mean change in
serum total cholesterol concentrations during the study were
0.38610.91% in the WR group and 3.1667.80% in the control
group (p = NS). The respective values for serum concentration of total
TG were 213.33633.32% in the WR group and 25.02620.36% in
the control group (p = NS). Regarding the changes in serum HDL
cholesterol concentration the respective values were 8.14613.75% in
the WR group and 20.80610.31% in the control group (p = NS).
There were no significant changes in serum total-to-HDL cholesterol
ratio or TG-to-HDL cholesterol ratio during the study.
To assess the lipid profiles at the molecular species level, the
lipidomic analysis was performed using the UPLC/MS platform.
Following data processing and quality control, a total of 309 lipids
were detected, of which 180 lipid molecular species were
identified. When comparing the average lipid levels between the
WR and control groups at baseline, none of the lipids differed
significantly after accounting for multiple comparisons (Figure 2A).
Most of the lipids found elevated in the WR group at baseline (at
p,0.05 using the two-sided unpaired t-test, but none at FDR
q,0.05) were sphingomyelins (Table 2). A large number of lipids
were found significantly diminished in the WR group when
comparing the lipid levels between the WR and control groups
after the intervention (Figure 2B).
When comparing within-person changes between the baseline
and after the intervention in each group separately, only modest
Table 2. Top 20 ranking lipid peaks, based on two-sided unpaired t-test statistic comparing baseline differences between the WRand control groups.
Retention time (s) mass-to-charge ratio (m/z) Identity Fold (WR vs. Ctr) p-value FDR q-value*
378 732.6122 1.39 0.003 0.28
419 817.7092 SM(d18:0/24:0) 1.46 0.004 0.28
407 809.6526 SM(d18:1/24:3) 1.44 0.005 0.28
378 731.6084 SM(d18:1/18:0) 1.35 0.010 0.28
407 788.6706 1.37 0.011 0.28
371 768.5899 GPCho(O-36:4) 1.22 0.012 0.28
463 666.6169 ChoE(18:2) 1.26 0.013 0.28
360 704.5767 1.24 0.017 0.28
371 794.6037 GPCho(O-38:5) 1.22 0.017 0.28
412 801.6835 SM(d18:1/23:0) 1.38 0.020 0.28
357 744.5556 GPEtn(36:2) 1.39 0.023 0.28
399 774.6529 1.36 0.024 0.28
384 796.6191 GPCho(O-38:4) 1.28 0.025 0.28
360 703.5732 SM(d18:1/16:0) 1.20 0.025 0.28
371 795.6085 1.21 0.026 0.28
407 787.6665 SM(d18:1/22:0) 1.27 0.031 0.28
380 787.6025 1.17 0.031 0.28
419 815.6985 SM(d18:1/24:0) 1.32 0.032 0.28
399 800.6717 1.27 0.034 0.28
378 740.6084 1.16 0.034 0.28
*Computed using algorithm by Storey et al. [37].doi:10.1371/journal.pone.0002630.t002
Weight Loss Lipidomics
PLoS ONE | www.plosone.org 5 July 2008 | Volume 3 | Issue 7 | e2630
fluctuations of the lipid levels were found in the control group, as
revealed by the volcano plot (Figure 2C), and none of the changes
were found significant after adjusting for multiple comparisons
using FDR. In contrast, a large number of lipid molecular species
decreased in the WR group (Figure 2D), with 175 out of 309 lipids
having FDR q-value ,0.05.
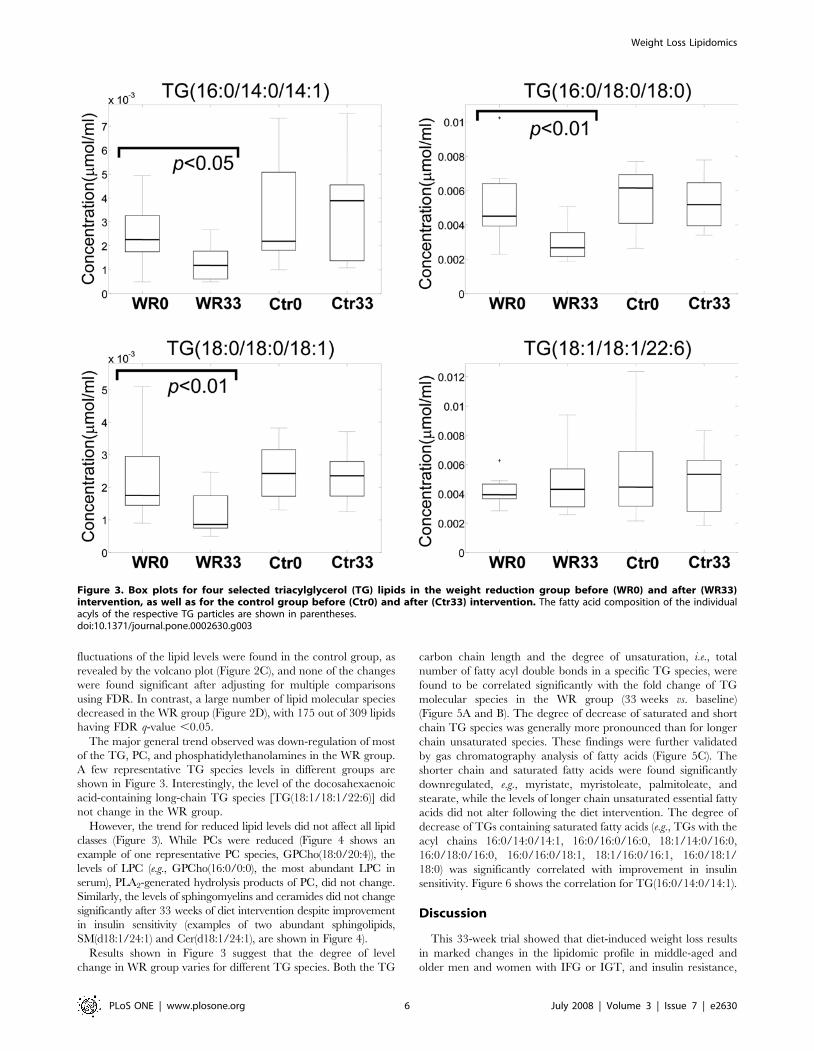
The major general trend observed was down-regulation of most
of the TG, PC, and phosphatidylethanolamines in the WR group.
A few representative TG species levels in different groups are
shown in Figure 3. Interestingly, the level of the docosahexaenoic
acid-containing long-chain TG species [TG(18:1/18:1/22:6)] did
not change in the WR group.
However, the trend for reduced lipid levels did not affect all lipid
classes (Figure 3). While PCs were reduced (Figure 4 shows an
example of one representative PC species, GPCho(18:0/20:4)), the
levels of LPC (e.g., GPCho(16:0/0:0), the most abundant LPC in
serum), PLA2-generated hydrolysis products of PC, did not change.
Similarly, the levels of sphingomyelins and ceramides did not change
significantly after 33 weeks of diet intervention despite improvement
in insulin sensitivity (examples of two abundant sphingolipids,
SM(d18:1/24:1) and Cer(d18:1/24:1), are shown in Figure 4).
Results shown in Figure 3 suggest that the degree of level
change in WR group varies for different TG species. Both the TG
carbon chain length and the degree of unsaturation, i.e., total
number of fatty acyl double bonds in a specific TG species, were
found to be correlated significantly with the fold change of TG
molecular species in the WR group (33 weeks vs. baseline)
(Figure 5A and B). The degree of decrease of saturated and short
chain TG species was generally more pronounced than for longer
chain unsaturated species. These findings were further validated
by gas chromatography analysis of fatty acids (Figure 5C). The
shorter chain and saturated fatty acids were found significantly
downregulated, e.g., myristate, myristoleate, palmitoleate, and
stearate, while the levels of longer chain unsaturated essential fatty
acids did not alter following the diet intervention. The degree of
decrease of TGs containing saturated fatty acids (e.g., TGs with the
acyl chains 16:0/14:0/14:1, 16:0/16:0/16:0, 18:1/14:0/16:0,
16:0/18:0/16:0, 16:0/16:0/18:1, 18:1/16:0/16:1, 16:0/18:1/
18:0) was significantly correlated with improvement in insulin
sensitivity. Figure 6 shows the correlation for TG(16:0/14:0/14:1).
Discussion
This 33-week trial showed that diet-induced weight loss results
in marked changes in the lipidomic profile in middle-aged and
older men and women with IFG or IGT, and insulin resistance,
Figure 3. Box plots for four selected triacylglycerol (TG) lipids in the weight reduction group before (WR0) and after (WR33)intervention, as well as for the control group before (Ctr0) and after (Ctr33) intervention. The fatty acid composition of the individualacyls of the respective TG particles are shown in parentheses.doi:10.1371/journal.pone.0002630.g003
Weight Loss Lipidomics
PLoS ONE | www.plosone.org 6 July 2008 | Volume 3 | Issue 7 | e2630

and the metabolic syndrome. These changes occurred even in the
absence of significant changes in classical lipid measures. TG and
PC levels were reduced, with no significant change in sphingolipid
and LPC levels. The degree of decrease of saturated and short
chain TG species was generally more pronounced than for longer
chain unsaturated species, and the degree of change in saturated
and short chain fatty acid-containing TG was proportional to the
improvement in insulin sensitivity.
The differences in degree of change of TG species supports the
view that diet-induced weight loss primarily affects the metabolism
of saturated fatty acids, while the metabolism of other physiolog-
ically important fatty acids such as arachidonic acid and
docosahexaenoic acid is not altered. The proportions of saturated
and polyunsaturated fatty acids in TG, cholesterol ester and
phospholipid fractions of the serum are considered to be markers
of dietary fatty acid intake [38]. Because the circulation also
delivers fatty acids from the GI tract, liver and adipose tissue to
peripheral tissues, serum fatty acid composition also reflects that of
other tissues [38]. However, obesity and insulin resistance is also
associated with increased saturation of serum and tissue fatty acids
[10,11]. Based on indirect measures, obesity seems to impair
desaturase and elongase enzyme activity [9]. Consistent with
earlier studies [13], our findings show that diet-induced weight loss
decrease the saturation of fatty acids in TG. Even though the
change in the proportion of dietary saturated and polyunsaturated
fat did not differ significantly between the WR and control groups,
the decrease in the saturation of TG may be a consequence of
changes in dietary fatty acid composition, weight loss, or more
likely, both.
Moreover, we found that the decrease in the saturation of TG
during the trial was associated with the improvement in insulin
sensitivity. Our findings are supported by epidemiological studies
of TG and serum fatty acid composition and its association with
the development of worsening glycemia, insulin resistance, the
metabolic syndrome and T2DM [10–12,39,40]. Serum fatty acid
composition predicts development of impaired fasting glycaemia
and diabetes in middle-aged men [41]. In dietary trials,
replacement of saturated fatty acids with polyunsaturated fatty
acids has improved insulin sensitivity and decreased abdominal
obesity [41], whereas substituting saturated fatty acids for
unsaturated fatty acids results in insulin resistance [42]. Because
weight loss itself may alter the fatty acid composition of serum and
tissue, decreased saturation and elongation of fatty acids may be
one of the mechanisms by which weight loss improves insulin
sensitivity. Decreased circulation of saturated fatty acids can also
be considered as beneficial because increased flux of saturated
fatty acids into peripheral tissues can lead to accumulation of toxic
lipid molecular species in these tissues [7,43,44].
Figure 4. Box plots for selected phospho- and sphingolipids in the weight reduction (WR) and control (Ctr) groups at the beginning(WR0, Ctr0) and at the end (WR33, Ctr33) of the study. GPCho, phosphatidylcholine; SM, sphingomyelin; Cer, ceramide.doi:10.1371/journal.pone.0002630.g004
Weight Loss Lipidomics
PLoS ONE | www.plosone.org 7 July 2008 | Volume 3 | Issue 7 | e2630

Figure 5. Spearman rank correlation between the fold change of triacylglycerol molecular species after and before the interventionin weight reduction group, and the corresponding (A) total TG fatty acid carbon chain length and (B) degree of TG fatty acidunsaturation. (C) Changes in esterified fatty acid composition in weight reduction and control groups, as obtained by gas chromatography basedfatty acid measurement. p-values were calculated using paired samples t-test (*p,0.05, **p,0.01).doi:10.1371/journal.pone.0002630.g005
Figure 6. Change in insulin sensitivity index SI (33 weeks vs. 0 weeks) vs. log-change of triacylglycerol TG(16:0/14:0/14:1)concentration. The Spearman rank correlation was used to calculate correlation coefficient r. The regression line is based on linear regression.doi:10.1371/journal.pone.0002630.g006
Weight Loss Lipidomics
PLoS ONE | www.plosone.org 8 July 2008 | Volume 3 | Issue 7 | e2630

Our methodology also allowed determination of the fatty acid
composition of the acyl chains of whole TG particles. Other
studies assessing the role of TG fatty acid composition in obesity,
insulin resistance and weight loss have measured the concentra-
tions of the individual fatty acid chains after separation of the TG
particles. It is not yet clear whether the measurement of the fatty
acid composition of whole TG particles will provide additional
physiologically relevant information over older methods.
Most of the common PL such as PC and phosphatidylethanol-
amines also decreased. This can be explained by the fact that these
PL are the major components of TG-carrying lipoproteins such as
VLDL, and their concentrations mirror TG levels also postpran-
dially [45,46].
LPC, lipids found in proinflammatory [47,48] and proathero-
genic conditions [49], did not decrease in the WR group. We have
found previously that obesity in weight-discordant monozygous
twins was primarily associated with elevated LPCs [19]. The lack
of change in LPC levels may in part be explained by the fact that
the weight reduction was not very dramatic or the complexity of
LPC metabolism. LPC is a major component of oxidized LDL
[50]. However, in healthy individuals LPC is most abundant in the
HDL fraction [51], and there is a high degree of LPC exchange
between HDL and oxLDL [52]. It is therefore possible that LPC
levels of oxLDL may in part be balanced by elevated HDL
[51,52]. Analyses of LPC levels in lipoprotein subfractions will
therefore be needed in future studies to provide better under-
standing of LPC regulation during diet-induced weight loss.
Sphingomyelins and ceramides did not change following weight
loss. In a recent study, plasma sphingomyelins and ceramides were
elevated in the plasma of genetically obese ob/ob mice [15].
However, in the monozygous twin study we found that in
particular very-long-chain fatty acid-containing (e.g., nervonic acid,
24:1) sphingomyelins are remarkably similar within obesity-
discordant twin co-pairs [19]. Therefore, it is plausible that the
genetic component involved in regulation of systemic sphingolipid
metabolism is more important than the effects of obesity and
weight loss.
As a potential weakness of the study, the clinical characteristics
of the two groups were not entirely similar at the baseline. The
insulin sensitivity index SI was higher in the control group than in
the WR group. As sphigomyelins are known to correlate with
fasting serum insulin [19], this may explain the observed trend
towards the elevated sphingomyelins in the WR group at baseline
(Table 2). Sphingomyelins were also modestly elevated in the WR
group after the intervention, but none of the differences reached
p,0.05. Although the weight reduction associated changes of
triacylglycerols are well supported by the data, we cannot exclude
the possibility that the observed baseline differences in specific
lipid classes, as well as small sample size, may have masked other
potential changes across different lipid classes. This clearly needs
to be investigated in further studies.
In conclusion, we demonstrated that diet-induced weight loss
led to a remarkable alteration of global lipid profiles in subjects
with impaired fasting glucose or impaired glucose tolerance. These
changes were dominated by a reduction in saturated and short-
chain fatty acid-containing triacylglycerols, which was coupled
with an improvement in insulin sensitivity. Our data also indicate
that lipidomics technology can complement classical clinical lipid
measures and can provide valuable clues about physiologically
relevant changes in lipid metabolism, even when classical lipid
measures are not significantly altered.
Supporting Information
Protocol S1 Trial Protocol. Original GENOBIN study plan (in
Finnish). The study plan was accepted by the Ethics Committee of
the Hospital District of Northern Savo (acceptance# in public
records: 152/2002).
Found at: doi:10.1371/journal.pone.0002630.s001 (0.18 MB
PDF)
Checklist S1 CONSORT Checklist
Found at: doi:10.1371/journal.pone.0002630.s002 (0.19 MB
PDF)
Acknowledgments
We thank Ayri Hyrkas and Maria Lankinen for help with sample
preparation for the lipidomics analyses, Kaija Kettunen, Tuomas
Onnukka, Erja Kinnunen and Ulla Tuovinen for assistance during the
intervention, and all the volunteers.
Author Contributions
Conceived and designed the experiments: MO MU MK US DL HG.
Performed the experiments: MK TS AR. Analyzed the data: MO US LY
JA. Contributed reagents/materials/analysis tools: MO MU DL HG.
Wrote the paper: MO MU US HG JA.
References
1. Moller DE, Kaufman KD (2005) Metabolic syndrome: a clinical and molecular
perspective. Annu Rev Med 56: 45–62.
2. Yu-Poth S, Zhao G, T E, Naglak M, Jonnalagadda S, et al. (1999) Effects of the
National Cholesterol Education Program’s Step I and Step II dietary
intervention programs on cardiovascular disease risk factors: a meta-analysis.
Am J Clin Nutr 69: 632–646.
3. Stefanick ML, Mackey S, Sheehan M, Ellswotrh N, Haskell WL, et al. (1998)
Effects of diet and exercise in men and postmenopausal women with low levels of
HDL cholesterol and high levels of LDL cholesterol. N Engl J Med 339: 12–20.
4. Metz JA, Stern JS, Kris-Etherton P, Reusser ME, Morris CD, et al. (2000) A
randomized trial of improved weight loss with a prepared meal plan in
overweight and obese patients: impact on cardiovascular risk reduction. Arch
Intern Med 160: 2150–2158.
5. Lelliott C, Vidal-Puig AJ (2005) Lipotoxicity, an imbalance between lipogenesis
de novo and fatty acid oxidation. Int J Obes relat Metab Disord 28 Suppl. 4:
S22–S28.
6. Unger R (2002) Lipotoxic diseases. Annu Rev Med 53: 319–336.
7. Medina-Gomez G, Gray S, Yetukuri L, Shimomura K, Campbell M, et al.
(2007) PPAR gamma 2 prevents lipotoxicity by controlling adipose tissue
expandability and peripheral lipid metabolism. PLoS Genet 3: e64.
8. Storlien LH, Baur LA, Kriketos AD, Pan DA, Cooney GJ, et al. (1996) Dietary
fats and insulin action. Diabetologija 39: 621–631.
9. Vessby B (2003) Dietary fat, fatty acid composition in plasma and the metabolic
syndrome. Curr Opin Lipidol 14: 15–19.
10. Laaksonen DE, Lakka TA, Lakka H-M, Nyyssonen K, Rissanen T, et al. (2002)
Serum fatty acid composition predicts development of impaired fasting
glycaemia and diabetes in middle-aged men. Diabet Med 19: 456–464.
11. Warensjo E, Riserus U, Vessby B (2005) Fatty acid composition of serum lipids
predicts the development of the metabolic syndrome in men. Diabetologia 48:
1999–2005.
12. Vessby B, Aro A, Skarfors E, Berglund L, Salminen I, et al. (1994) The risk to
develop NIDDM is related to the fatty acid composition of the serum cholesterol
esters. Diabetes 43: 1353–1357.
13. Laitinen JH, Ahola IE, Sarkkinen ES, Winberg RL, Harmaakorpi-Iivonen PA,
et al. (1993) Impact of intensified dietary therapy on energy and nutrient intakes
and fatty acid composition of serum lipids in patients with recently diagnosed
non-insulin-dependent diabetes mellitus. J Am Diet Assoc 93: 276–283.
14. Nelson JC, Jiang X-C, Tabas I, Tall A, Shea S (2006) Plasma sphingomyelin and
subclinical atherosclerosis: Findings from the multi-ethnic study of atheroscle-
rosis. Am J Epidemiol 163: 903–912.
15. Samad F, Hester KD, Yang G, Hannun YA, Bielawski J (2006) Altered adipose
and plasma sphingolipid metabolism in obesity: a potential mechanism for
cardiovascular and metabolic risk. Diabetes 55: 2579–2587.
16. Mehta D (2005) Lysophosphatidylcholine: an enigmatic lysolipid. Am J Physiol
Lung Cell Mol Physiol 289: L174–175.
17. Rabini R, Galassi R, Fumelli P, Dousset N, Solera M, et al. (1994) Reduced
Na(+)-K(+)-ATPase activity and plasma lysophosphatidylcholine concentrations
in diabetic patients. Diabetes 43: 915–919.
Weight Loss Lipidomics
PLoS ONE | www.plosone.org 9 July 2008 | Volume 3 | Issue 7 | e2630

18. Lusis AJ (2000) Atherosclerosis. Nature 407: 233–241.
19. Pietilainen KH, Sysi-Aho M, Rissanen A, Seppanen-Laakso T, Yki-Jarvinen H,
et al. (2007) Acquired obesity is associated with changes in the serum lipidomic
profile independent of genetic effects - a monozygotic twin study. PLoS ONE 2:
e218.
20. Watson AD (2006) Thematic review series: systems biology approaches to
metabolic and cardiovascular disorders. Lipidomics: a global approach to lipid
analysis in biological systems. J Lipid Res 47: 2101–2111.
21. Yetukuri L, Katajamaa M, Medina-Gomez G, Seppanen-Laakso T, Puig AV, et
al. (2007) Bioinformatics strategies for lipidomics analysis: characterization of
obesity related hepatic steatosis. BMC Syst Biol 1: e12.
22. Ekroos K, Chernushevich IV, Simons K, Shevchenko A (2002) Quantitative
profiling of phospholipids by multiple precursor ion scanning on a hybrid
quadrupole time-of-flight mass spectrometer. Anal Chem 74: 941–949.
23. Han X, Gross RW (2003) Global analyses of cellular lipidomes directly from
crude extracts of biological samples by ESI mass spectrometry: a bridge to
lipidomics. J Lipid Res 44: 1071–1079.
24. Schwudke D, Oegema J, Burton L, Entchev E, Hannich JT, et al. (2006) Lipid
profiling by multiple precursor and neutral loss scanning driven by the data-
dependent acquisition. Anal Chem 78: 585–595.
25. McAnoy AM, Wu CC, Murphy RC (2005) Direct qualitative analysis of
triacylglycerols by electrospray mass spectrometry using a linear ion trap. J Am
Soc Mass Spectrom 16: 1498–1509.
26. Hermansson M, Uphoff A, Kakela R, Somerharju P (2005) Automated
quantitative analysis of complex lipidomes by liquid chromatography/mass
spectrometry. Anal Chem 77: 2166–2175.
27. Houjou T, Yamatani K, Imagawa M, Shimizu T, Taguchi R (2005) A shotgun
tandem mass spectrometric analysis of phospholipids with normal-phase and/or
reverse-phase liquid chromatography/electrospray ionization mass spectrome-
try. Rapid Comm Mass Spectrom 19: 654–666.
28. Kolehmainen M, Salopuro T, Schwab US, Kekalainen J, Kallio P, et al. (2007)
Weight reduction modulates expression of genes involved in extracellular matrix
and cell death: the GENOBIN study. Int J Obes doi: 10.1038/sj.ijo.0803718.
29. Expert Panel on Detection E, and Treatment of High Blood Cholesterol in
Adults (2001) Executive summary of the third report of the National Cholesterol
Education Program (NCEP) expert panel on detection, evaluation, and
treatment of high blood cholesterol in adults (Adult Treatment Panel III).
J Am Med Assoc 285: 2486–2497.
30. Krauss RM, Eckel RH, Howard B, Appel LJ, Daniels SR, et al. (2000) AHA
Dietary Guidelines : Revision 2000: a statement for healthcare professionals
from the Nutrition Committee of the American Heart Association. Circulation
102: 2284–2299.
31. Sarkkinen E, Schwab U, Niskanen L, Hannuksela M, Savolainen M, et al. (1996)
The effects of monounsaturated-fat enriched diet and polyunsaturated-fat
enriched diet on lipid and glucose metabolism in subjects with impaired glucose
tolerance. Eur J Clin Nutr 50: 592–598.
32. Boston RC, Stefanovski D, Moate PJ, Sumner AE, Watanabe RM, et al. (2003)
MINMOD Millennium: a computer program to calculate glucose effectiveness
and insulin sensitivity from the frequently sampled intravenous glucose tolerance
test. Diabetes Technol Ther 5: 1003–1015.
33. Seppanen-Laakso T, Laakso I, Hiltunen R (2002) Analysis of fatty acids by gas
chromatography, and its relevance to research on health and nutrition. Anal
Chim Acta 465: 39–62.
34. Laaksonen R, Katajamaa M, Paiva H, Sysi-Aho M, Saarinen L, et al. (2006) A
systems biology strategy reveals biological pathways and plasma biomarker
candidates for potentially toxic statin induced changes in muscle. PLoS ONE 1:
e97.35. Medina-Gomez G, Virtue S, Lelliott C, Boiani R, Campbell M, et al. (2005) The
link between nutritional status and insulin sensitivity is dependent on the
adipocyte-specific Peroxisome Proliferator-Activated Receptor-{gamma}2 iso-form. Diabetes 54: 1706–1716.
36. Katajamaa M, Miettinen J, Oresic M (2006) MZmine: toolbox for processingand visualization of mass spectrometry based molecular profile data. Bioinfor-
matics 22: 634–636.
37. Storey JD (2002) A direct approach to false discovery rates. J R Stat Soc B 64:479–498.
38. Willett WC (1998) Nutritional epidemiology. New York, NY, USA: OxfordUniversity Press.
39. Tremblay AJ, Despres J-P, Piche M-E, Nadeau A, Bergeron J, et al. (2004)Associations between the fatty acid content of triglyceride, visceral adipose tissue
accumulation, and components of the insulin resistance syndrome. Metabolism
53: 310–317.40. Vessby B, Tengblad S, Lithell H (1994) Insulin sensitivity is related to the fatty
acid composition of serum lipids and skeletal muscle phospholipids in 70-year-old men. Diabetologia 37: 1044–1050.
41. Summers LKM, Fielding BA, Bradshaw HA, Ilic V, Beysen C, et al. (2002)
Substituting dietary saturated fat with polyunsaturated fat changes abdominal fatdistribution and improves insulin sensitivity. Diabetologia 45: 369–377.
42. Vessby B, Uusitupa M, Hermansen K, Riccardi G, Rivellese AA, et al. (2001)Substituting dietary saturated for monounsaturated fat impairs insulin sensitivity
in healthy men and women: The KANWU study. Diabetologia 44: 312–319.43. Shimabukuro M, Zhou Y, Levi M, Unger R (1998) Fatty acid induced beta-cell
apoptosis: a link between diabetes and obesity. Proc Natl Acad Sci USA 95:
2498–2502.44. Wei Y, Wang D, Topczewski F, Pagliassotti MJ (2006) Saturated fatty acids
induce endoplasmic reticulum stress and apoptosis independently of ceramide inliver cells. Am J Physiol Endocrinol Metab 291: E275–281.
45. Sweeney G, Nazir D, Clarke C, Goettsche G (1996) Ethanolamine and choline
phospholipids in nascent very-low-density lipoprotein particles. Clin Invest Med19: 243–250.
46. Agren JJ, Hallikainen M, Vidgren H, Miettinen TA, Gylling H (2006)Postprandial lipemic response and lipoprotein composition in subjects with
low or high cholesterol absorption efficiency. Clin Chim Acta 366: 309–315.47. Yang LV, Radu CG, Wang L, Riedinger M, Witte ON (2005) Gi-independent
macrophage chemotaxis to lysophosphatidylcholine via the immunoregulatory
GPCR G2A. Blood 105: 1127–1134.48. Shalina S, Ousman SD (2000) Lysophosphatidylcholine induces rapid
recruitment and activation of macrophages in the adult mouse spinal cord.Glia 30: 92–104.
49. Glass CK, Witzum JL (2001) Atherosclerosis: The road ahead. Cell 104:
503–516.50. Murugesan G, Fox PL (1996) Role of lysophosphatidylcholine in the inhibition
of endothelial cell motility by oxidized Low Density Lipoprotein. J Clin Invest97: 2736–2744.
51. Schmidt K, Klatt P, Graier WF, Kostner GM, Kukovetz WR (1992) High-density lipoprotein antagonizes the inhibitory effects of oxidized low-density
lipoprotein and lysolecithin on soluble guanylyl cyclase. Biochem Biophys Res
Comm 182: 302–308.52. Matsuda Y, Hirata K, Inoue N, Suematsu M, Kawashima S, et al. (1993) High
density lipoprotein reverses inhibitory effect of oxidized low density lipoproteinon endothelium-dependent arterial relaxation. Circ Res 72: 1103–1109.
Weight Loss Lipidomics
PLoS ONE | www.plosone.org 10 July 2008 | Volume 3 | Issue 7 | e2630