Abnormal Thyroid Hormone Status Differentially Affects Bone ...
11
ORIGINAL RESEARCH published: 15 May 2019 doi: 10.3389/fendo.2019.00300 Frontiers in Endocrinology | www.frontiersin.org 1 May 2019 | Volume 10 | Article 300 Edited by: Susanne Neumann, National Institutes of Health (NIH), United States Reviewed by: Maria Moreno, University of Sannio, Italy Ann Marie Zavacki, Brigham and Women’s Hospital and Harvard Medical School, United States *Correspondence: Cecilia H. A. Gouveia [email protected] Specialty section: This article was submitted to Thyroid Endocrinology, a section of the journal Frontiers in Endocrinology Received: 30 November 2018 Accepted: 26 April 2019 Published: 15 May 2019 Citation: Zaitune CR, Fonseca TL, Capelo LP, Freitas FR, Beber EH, Dora JM, Wang CC, Miranda-Rodrigues M, Nonaka KO, Maia AL and Gouveia CHA (2019) Abnormal Thyroid Hormone Status Differentially Affects Bone Mass Accrual and Bone Strength in C3H/HeJ Mice: A Mouse Model of Type I Deiodinase Deficiency. Front. Endocrinol. 10:300. doi: 10.3389/fendo.2019.00300 Abnormal Thyroid Hormone Status Differentially Affects Bone Mass Accrual and Bone Strength in C3H/HeJ Mice: A Mouse Model of Type I Deiodinase Deficiency Clarissa R. Zaitune 1,2 , Tatiana L. Fonseca 1,3 , Luciane P. Capelo 1,4 , Fatima R. Freitas 1,5 , Eduardo H. Beber 1,6 , José M. Dora 7 , Charles C. Wang 8,9 , Manuela Miranda-Rodrigues 1,10 , Keico O. Nonaka 9 , Ana L. Maia 7 and Cecilia H. A. Gouveia 1 * 1 Department of Anatomy, Institute of Biomedical Sciences, University of São Paulo, São Paulo, Brazil, 2 Institute of Healthy Sciences, Paulista University, São Paulo, Brazil, 3 Section of Adult and Pediatric Endocrinology, Diabetes and Metabolism, Department of Medicine, University of Chicago, Chigago, IL, United States, 4 Institute of Science and Technology, Federal University of São Paulo, São Paulo, Brazil, 5 Heart Institute (InCor) of Medical School Hospital, University of São Paulo, São Paulo, Brazil, 6 Department of Morphology, Health Sciences Center, Federal University of Espirito Santo, Vitoria, Brazil, 7 Endocrine Division, Hospital de Clinicas de Porto Alegre, Federal University of Rio Grande do Sul, Porto Alegre, Brazil, 8 São Carlos Institute of Physics, University of São Paulo, São Carlos, Brazil, 9 Department of Physiological Sciences, Federal University of São Carlos, São Carlos, Brazil, 10 Department of Physiology and Pharmacology, University of Western Ontario, London, ON, Canada C3H/HeJ (C3H) mice are deficient of type I deiodinase (D1), an enzyme that activates thyroid hormone (TH), converting thyroxine (T4) to triiodothyronine (T3). Nevertheless, C3H mice present normal serum T3 and a gross euthyroid phenotype. To investigate if a global D1 deficiency interferes in the TH effects on bone, we compared bone growth, bone mass accrual and bone strength of C3H and C57BL/6J (B6) mice under abnormal TH status. Four-week-old female mice of both strains were grouped as Euthyroid, Hypothyroid (pharmacologically-induced), 1xT4 and 10xT4 (hypothyroid animals receiving 1- or 10-fold the physiological dose of T4 /day/16 weeks). Hypothyroidism and TH excess similarly impaired body weight (BW) gain and body growth in both mice strains. In contrast, whereas hypothyroidism only slightly impaired bone mineral density (BMD) accrual in B6 mice, it severely impaired BMD accrual in C3H mice. No differences were observed in serum and bone concentrations of T3 between hypothyroid animals of both strains. Interestingly, treatment with 10xT4 was less deleterious to BMD accrual in C3H than in B6 mice and resulted in less elevated T3 serum levels in B6 than in C3H mice, which is probably explained by the lower D1 activity in C3H mice. In addition, hypothyroidism decreased bone strength only in C3H but not in B6 mice, while TH excess decreased this parameter in both strains. These findings indicate that D1 deficiency contributes to the TH excess-induced differences in bone mass accrual in C3H vs. B6 mice and suggest that deiodinase-unrelated genetic factors might account for the different skeleton responses to hypothyroidism between strains. Keywords: thyroid hormone, iodothyronine deiodinases, bone mass accrual, bone growth, C3H/HeJ and C57BL/6J
-
Upload
khangminh22 -
Category
Documents
-
view
3 -
download
0
Transcript of Abnormal Thyroid Hormone Status Differentially Affects Bone ...

ORIGINAL RESEARCHpublished: 15 May 2019
doi: 10.3389/fendo.2019.00300
Frontiers in Endocrinology | www.frontiersin.org 1 May 2019 | Volume 10 | Article 300
Edited by:
Susanne Neumann,
National Institutes of Health (NIH),
United States
Reviewed by:
Maria Moreno,
University of Sannio, Italy
Ann Marie Zavacki,
Brigham and Women’s Hospital and
Harvard Medical School,
United States
*Correspondence:
Cecilia H. A. Gouveia
Specialty section:
This article was submitted to
Thyroid Endocrinology,
a section of the journal
Frontiers in Endocrinology
Received: 30 November 2018
Accepted: 26 April 2019
Published: 15 May 2019
Citation:
Zaitune CR, Fonseca TL, Capelo LP,
Freitas FR, Beber EH, Dora JM,
Wang CC, Miranda-Rodrigues M,
Nonaka KO, Maia AL and
Gouveia CHA (2019) Abnormal
Thyroid Hormone Status Differentially
Affects Bone Mass Accrual and Bone
Strength in C3H/HeJ Mice: A Mouse
Model of Type I Deiodinase Deficiency.
Front. Endocrinol. 10:300.
doi: 10.3389/fendo.2019.00300
Abnormal Thyroid Hormone StatusDifferentially Affects Bone MassAccrual and Bone Strength inC3H/HeJ Mice: A Mouse Model ofType I Deiodinase DeficiencyClarissa R. Zaitune 1,2, Tatiana L. Fonseca 1,3, Luciane P. Capelo 1,4, Fatima R. Freitas 1,5,
Eduardo H. Beber 1,6, José M. Dora 7, Charles C. Wang 8,9, Manuela Miranda-Rodrigues 1,10,
Keico O. Nonaka 9, Ana L. Maia 7 and Cecilia H. A. Gouveia 1*
1Department of Anatomy, Institute of Biomedical Sciences, University of São Paulo, São Paulo, Brazil, 2 Institute of
Healthy Sciences, Paulista University, São Paulo, Brazil, 3 Section of Adult and Pediatric Endocrinology, Diabetes and
Metabolism, Department of Medicine, University of Chicago, Chigago, IL, United States, 4 Institute of Science and
Technology, Federal University of São Paulo, São Paulo, Brazil, 5Heart Institute (InCor) of Medical School Hospital, University
of São Paulo, São Paulo, Brazil, 6Department of Morphology, Health Sciences Center, Federal University of Espirito Santo,
Vitoria, Brazil, 7 Endocrine Division, Hospital de Clinicas de Porto Alegre, Federal University of Rio Grande do Sul, Porto
Alegre, Brazil, 8 São Carlos Institute of Physics, University of São Paulo, São Carlos, Brazil, 9Department of Physiological
Sciences, Federal University of São Carlos, São Carlos, Brazil, 10Department of Physiology and Pharmacology, University of
Western Ontario, London, ON, Canada
C3H/HeJ (C3H) mice are deficient of type I deiodinase (D1), an enzyme that activates
thyroid hormone (TH), converting thyroxine (T4) to triiodothyronine (T3). Nevertheless,
C3H mice present normal serum T3 and a gross euthyroid phenotype. To investigate
if a global D1 deficiency interferes in the TH effects on bone, we compared
bone growth, bone mass accrual and bone strength of C3H and C57BL/6J (B6)
mice under abnormal TH status. Four-week-old female mice of both strains were
grouped as Euthyroid, Hypothyroid (pharmacologically-induced), 1xT4 and 10xT4
(hypothyroid animals receiving 1- or 10-fold the physiological dose of T4 /day/16 weeks).
Hypothyroidism and TH excess similarly impaired body weight (BW) gain and body
growth in both mice strains. In contrast, whereas hypothyroidism only slightly impaired
bone mineral density (BMD) accrual in B6 mice, it severely impaired BMD accrual in
C3H mice. No differences were observed in serum and bone concentrations of T3
between hypothyroid animals of both strains. Interestingly, treatment with 10xT4 was
less deleterious to BMD accrual in C3H than in B6 mice and resulted in less elevated T3
serum levels in B6 than in C3H mice, which is probably explained by the lower D1 activity
in C3H mice. In addition, hypothyroidism decreased bone strength only in C3H but not
in B6 mice, while TH excess decreased this parameter in both strains. These findings
indicate that D1 deficiency contributes to the TH excess-induced differences in bone
mass accrual in C3H vs. B6 mice and suggest that deiodinase-unrelated genetic factors
might account for the different skeleton responses to hypothyroidism between strains.
Keywords: thyroid hormone, iodothyronine deiodinases, bonemass accrual, bone growth, C3H/HeJ and C57BL/6J
Zaitune et al. TH-Bone Interactions in D1 Deficiency
INTRODUCTION
Thyroid hormone (TH) is essential to bone developmentand metabolism. Hypothyroidism leads to a delay in skeletalmaturation and epiphyseal disgenesis, resulting in reducedlongitudinal growth and skeletal abnormalities (1). On theother hand, TH excess may result in accelerated skeletalmaturation with premature closure of the epiphyseal growthplates and a consequent decrease in the growth of the limbs(1, 2). In hyperthyroidism, there is also an increase inbone metabolism, where the osteoclastic activity predominatesfavoring a negative balance of calcium and bone loss (3). Ofnote, overt thyrotoxicosis is a well-recognized cause of secondaryosteoporosis (4–6). In contrast, hypothyroidism leads to reducedbone metabolism with no change or a slight increase in bonemass (7). However, animal studies show that TH deficiencygreatly impairs bone mass acquisition during development dueto an important decrease in bone formation (8, 9). Therefore,TH exerts critical anabolic actions in the bone tissue duringskeletal development.
There is a general consensus that most TH actions aremediated by its nuclear receptors (TRs), which were shown to beexpressed in skeletal cells (10–12). To exert its nuclear activity,
thyroxine (T4), which is the major secretory product of thethyroid gland, needs to be converted to triiodothyronine (T3) by
the action of type I and type II iodothyronine selenodeiodinases(D1 and D2, respectively). Since D1 is a plasma membraneprotein, it offers ready access of circulating T4 to the enzyme andfacilitates the entry of the D1-generated T3 into the plasma (13).Therefore, D1 contributes to the circulating T3 concentration,but has minimal contribution to the intranuclear T3 content (13–15). On the other hand, T3 produced via D2, an endoplasmicreticulummembrane-resident protein (14), easily reaches the cellnucleus. Therefore, D2 significantly contributes to the local (cell-tissue-organ) T3 content, besides contributing to the serum levelsof T3 (13). D1 activity is restricted to the thyroid gland, liver,and kidney, (14), whereas D2 is highly expressed in the brainand in many other tissues (16, 17) including bone and cartilage(18, 19). Given this widespread D2 expression throughout thebody, D2 activity is thought to be the major contributor forT3 serum production with a minor contribution from D1 (20).D1 is activated by T4, whereas D2 is deactivated by T4 andactivated in TH deficiency (21). Thus, in a high serum T4/T3serum ratio, TH signaling is reduced in D2-expressing tissues,whereas D1 is activated, catalyzing the T4-to-T3 conversiongreatly contributing to the elevated serum levels of T3 (13).There is a third enzyme, type III iodothyronine selenodeiodinase(D3), which catalyzes the T4-to-reverse T3 (rT3) and T3-to-T2conversion reactions. Considering that rT3 and T2 are inactivemetabolites, D3 terminates TH action (13). D3 is expressed in theskeleton during prenatal development, but not during postnataldevelopment and in mature skeleton (22).
The C3H/HeJ (C3H) inbred mouse has an inherited D1-deficiency. The mRNA expression and activity of D1 in theliver and kidney are only 5–10% of that in the C57BL/6J (B6)inbred strain, which presents higher D1 mRNA expression(23, 24). Low activity cosegregated with a series of five GCT
repeats located in the 5′-flanking region of the C3H dio1 (D1mouse gene) that impairs C3H promoter potency and provides apartial explanation for the lower D1 expression and activity (25).Despite marked D1 deficiency, the decrease in T3 production iscompensated by a decrease in T4 clearance, resulting in increasedserum T4, normal serum T3, and a gross euthyroid phenotypewith normal bone growth (23), which is also observed in micewith global gene deletion of D1 (26), and is consistent with thelack of D1 activity in the skeleton (18, 27).
It is noteworthy that C3H and B6 mice, in addition to theD1 differences, present large differences in peak bone mass (28).C3H was described as having a phenotype of high bone massbecause their peak bone density was found to be as much as 50and 9% higher in the femur and vertebrae, respectively, than thatof B6, which was characterized as presenting a phenotype of lowbone mass (28). The genetic and physiological determination fordifferences in bone mass between these two inbred mouse strainsis poorly understood and is likely to involve diverse factors.There is evidence that C3H mice have fewer osteoclasts (29),and that C3H mice presents higher intestinal calcium absorptionassociated with higher levels of 1,25 dihydroxivitamin D (28)and higher circulating levels of growth hormone and insulin-likegrowth factor-I than B6 mice (30).
To further characterize this mouse model (C3H) and toinvestigate if a global D1 deficiency could interfere in the effectsof TH on bone, we evaluated bone parameters of C3H and B6mice in situations of TH excess and deficiency. We found thatabnormal TH status differentially affects bone mass accrual andbone strength, but not bone growth in C3H vs. B6 mice. Inaddition, this study provides evidence that both D1 deficiencyand the distinct genetic background are likely to contribute tothe different skeletal responses of C3H and B6 mice to TH.
MATERIALS AND METHODS
Animals and TreatmentAll experimental procedures were performed in accordance withthe guidelines of the Standing Committee on Animal Researchof the University of Sao Paulo. Female C3H and B6 mice werepurchased from the Isogenic Mice Facility of the Departmentof Immunology, Institute of Biomedical Sciences, University ofSao Paulo and maintained under controlled conditions of lightand temperature (12/12 h dark/light cycle at 25◦C). All animalswere kept in plastic cages, five to six per cage, and had freeaccess to food (rat chow containing 1.4% Pi, 0.7% Ca, and 4.5IU/g of vitamin D) and water. In a first set of experiments,4-week old mice of both strains were randomly divided (n =
5 per group) into (i) euthyroid (Eut), untreated animals; (ii)hypothyroid (Hypo), induced by adding metimazole (MM; 0.1%)and NaClO−
4 (P; 1%) to the drinking water; (iii) 1xT4, animalstreated with MM+P receiving 1 µg/100 g BW of T4 per dayip, which is equivalent to 1 physiological dose of T4 (31); and(iv) 10xT4, animals treated with MM+P receiving 10 µg/100 gBW of T4 per day ip, which is equivalent to 10 physiologicaldoses of T4 (31). Treatment with MM+P and T4 started on thesame day. All animals were killed by cervical dislocation after 16weeks of treatment and the bones were processed for analysis.
Frontiers in Endocrinology | www.frontiersin.org 2 May 2019 | Volume 10 | Article 300

Zaitune et al. TH-Bone Interactions in D1 Deficiency
For determination of deiodinase activity and expression, 27–30-day-old C3H and B6 mice were randomly divided (n=5 pergroup) into (i) Eut; (ii) Hypo, induced as described above; and(iii) Hyper, animals receiving 10xT4 per day (ip). After 8 days oftreatment, the animals were killed by cervical dislocation and thetissues processed.
Serum Concentration of T3, T4, and TSHand Bone Concentration of T3 and T4Immediately before euthanizing the animals, the blood wascollected from the retro-orbital plexus under anesthesia withCO2. Serum was separated by centrifugation and immediatelyfrozen. Total T4 and T3 serum levels were measured bycommercial RIA kits (RIA-gnost T4 and RIA-gnost T3, CIS biointernational, France). For the T4 and T3 assays, standard curveswere generated using charcoal-stripped mouse serum. Total T4and T3 in the bone were determined accordingly to Obregónet al. (32) with modifications. Briefly, the lumbar vertebrae andboth femurs, tibias, fibulas, scapulae, humerus, radius, and ulnasof each animal were pooled together and crushed in liquidnitrogen using a steel mortar and pestle set (Fisher ScientificInternational, Inc, Hampton, NH) until the bones becamepowder. The bone powder was transferred to pre-weighedmicrofuge tubes. Methanol, with 10−3M propylthiouracil (PTU)to avoid artifactual deiodination, was added in a volume thatdoubled the weight of the bone powder (2:1). The sample wasvortexed for 2min, kept on ice for 2 h and centrifuged (30min2,000 rpm, 4◦C). The supernatant was transferred to a fresh tube(tube A) and the same volume of methanol with PTU (2:1) wasadded to the pellet. The sample was revortexed for 2min, kept onice for 15min and recentrifuged (30min, 2,000 rpm, 4◦C). Thesupernantant was transferred to tube A and dried in a Speedvac R©
at 30◦C (Eppendorf, Hamburg, Germany). one hundred fiftymicroliter of pre-tested mouse striped serum was added to tubeA. The sample was vortexed for 1min and total T4 and T3 levelswere measured by RIA as described above. The values obtainedwere normalized by the weight of the bone powder and the resultswere expressed in nanograms per gram of bone. TSH levels weremeasured by Elisa assay (Rocky Mountain Diagnostics; Rat kit)following the manufacturer’s instructions. The obtained valueswere expressed in picograms per milliliter.
D1 and D2 ActivityAfter euthanasia, both femurs and the liver of each animalwere dissected and cooled with liquid nitrogen. The boneswere freed from bone marrow, homogenized as previouslydescribed (18) and protein concentration was quantified. Theliver samples were homogenized on ice in buffer containing 1x PE (0·1M potassium phosphate and 1mM EDTA), 0.25Msucrose and 10mM dithiothreitol (DTT) (pH 6.9), and then,the protein concentration was quantified. Protein concentrationwas quantitated by Bradford assay using BSA as a standard.Deiodination activity was assayed in the extracts of bone tissueand liver as previously described (22). Briefly, D1 or D2 assayswere performed using 100–300 µg tissue protein, 1µM or1 nM unlabeled T4 in a total volume of 300 µl PE buffercontaining 20mM DTT, and approximately 100.000 cpm [125I]
T4 (Amersham Biosciences, Piscataway, NJ, USA). Incubationswere carried out at 37◦C for 60–120min. The reaction wasterminated by adding 200 µl of horse serum and 100 µl of 50%trichloroacetic acid (TCA).
RNA Isolation and PCR AnalysisThe femurs of C3H and B6 mice were dissected, processedas previously described (22), and the total RNA was thenextracted using Trizol (Invitrogen, Calbard, CA) following themanufacturer’s instructions. Total RNA was also isolated from50 to 100mg of the liver using Trizol. The RNA concentration ofeach sample was quantified by spectrophotometry and the RNAwas then visualized in agarose gels to ensure integrity. ThemRNAexpression of monocarboxylate transporter 8 (MCT8) and L-type amino acid transporters 1 and 2 (LAT1 and LAT2) and thethyroid hormone receptor alpha (TRα) and TRβ1 were analyzedby real-time PCR as previously described (33) using the followingsets of primers: MCT8 (NM_009197.2) (F:CCCTGGACTTAAGAAGATATACTTGCA; R:CCCGAAGTCCCGGCATA),LAT1 (NM_011404.3) (F:CTACTTCTTTGGTGTCTGGTGGAA; R:GAGGTACCACCTGCATCAACTTC), LAT2(NM_016972.2) (F:GACATCGGCTCGTTGCT; R:TGTAAGGATCCACAAGTCCTCAGT), TRα1 (NM_178060) (F: GCTGTGCTGCTAATGTCAACAGA; R: GCCTCCTGACTCTTCTCGATCTT),; TRβ1 (NM_001113417) (F:AAGCCACAGGGTACCACTATCG;R: GGAGACTTTTCTGAATGGTTCTTCTAA). Semiquantitative RT-PCR technique was used to determinethe expression of D1 transcripts in the RNA samples of the liveras previously described (34), using the specific oligonucleotidesderived from the coding region of the mouse D1 (sense: 5′ GCCACT TCT GCC CCG TGC TGAG 3′ and antisense: 5′ CTG CCTTGA ATG AAATCC CAG ATG T 3′).
Bone DensitometryBone mineral density (BMD) was measured by dual-energyX-ray absorptiometry (DXA)1 using the pDEXA Saber BoneDensitometer and the pDEXA Saber Software version 3.9.4(Norland Medical Systems, Inc, Fort Atkinson, WI, U.S.A.),both specially designed for small animals. The animals wereanesthetized with a ketamine-xylazine cocktail (10 and 30 mg/kgBW) and scanned in the prone position. The animals were subjectto a basal scan and to a scan every 4 weeks of treatment. Thebone regions analyzed were the total body, excluding the headand the tail; the lumbar vertebrae (L1-L6); and both femurs andtibias. The femoral and tibial BMDs were expressed as the meanof the left and right limbs for each animal. The precision in vivowas evaluated by calculating the coefficient of variation (CV =
100xSD/mean) of six repeated measurements of 2-month-oldfemale mice. The animal was repositioned after each scan. TheCV of BMD for total body, lumbar spine, femur and tibia were0.6, 1.7, 0.4, and 0.3%, respectively. The precision in vitro wasalso expressed as CV and calculated by measuring the BMD of a
1The abbreviation “DXA” was proposed by the International Society for Clinical
Densitometry (ISCD) in 2003, as an alternative to “DEXA”. DXA has been
preferentially used in the scientific articles.
Frontiers in Endocrinology | www.frontiersin.org 3 May 2019 | Volume 10 | Article 300
Zaitune et al. TH-Bone Interactions in D1 Deficiency
phantom, with a nominal density of 0.929 g/cm2. This CV was0.8% throughout the experiment.
Body, Tibia, and Femur LongitudinalGrowthThe length of the femur and tibia was measured indirectly byDXA using the ruler tool provided by the pDEXA Saber Software.The length of the femur and tibia were measured from theproximal to the distal epiphysis. Just after the DXA scan andunder anesthesia, the body length was measured directly witha ruler (Norland Medical Systems) from the tip of the snout tothe base of the tail. The longitudinal growth of each segment wascalculated by the difference of the basal to the final measurements(final length–basal length).
Three-Point Bending TestThe right femurs were submitted to the three-point bending testin an Instron testing machine (Model 4444, Instron Corporation,MA, USA). All femurs were tested in the same orientation: theanterior cortex was placed in compression and the posteriorcortex in tension during the test. Each femur was placed on twosupports spaced 6mm apart. The bending load was applied atthe midpoint, by a round loading contact with a diameter of3mm at a constant displacement rate of 5 mm/min until thebone fractured. The fracture was taken as complete loss of loadcarrying ability. A small preload (5% of the average maximalload) was applied before actual testing to stabilize the specimen.Load-displacement data were collected by a computerized dataacquisition system at a sampling rate of 80Hz during the bendingtest. The maximum load, which is a measure of strength recordedduring the test, was determined.
Statistical AnalysisOne-way analysis of variance (ANOVA) was used to comparemore than two groups and was always followed by the Student-Newman-Keuls test to detect differences between groups.Student-t test was used to compare two groups. For all tests,p < 0.05 was considered statistically significant. All results areexpressed as the mean ± standard error of the mean (SEM).For statistical analysis, we used the GraphPad Instat Software(GraphPad Software Inc., San Diego, CA, USA).
RESULTS
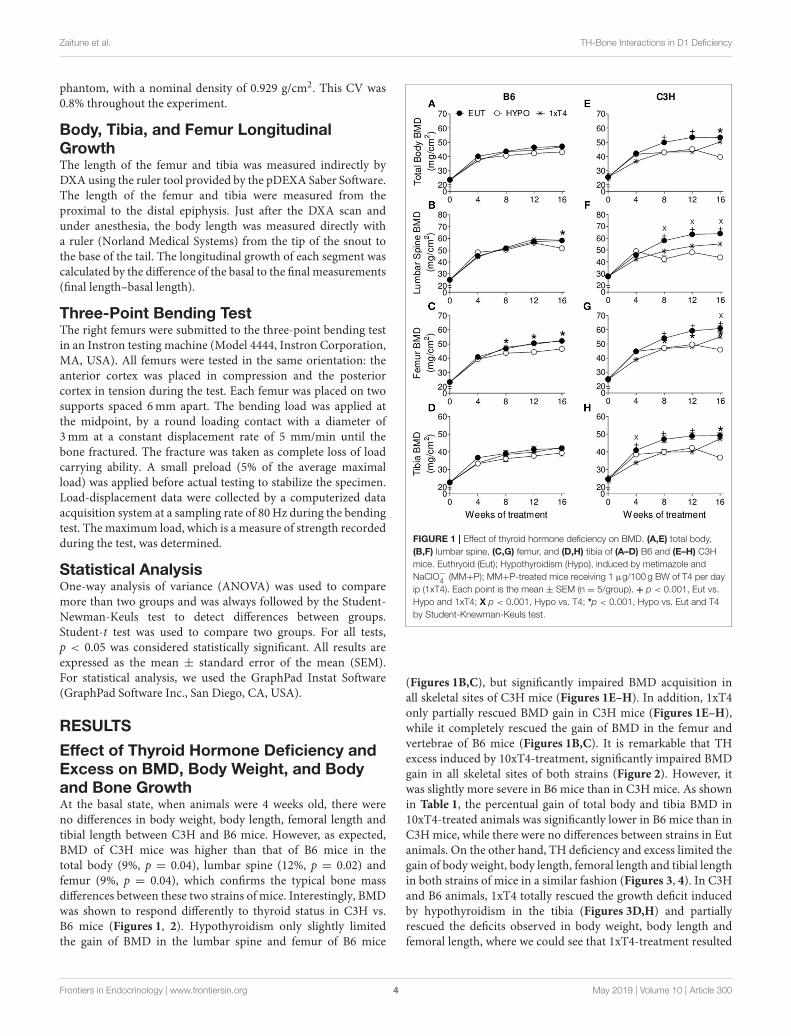
Effect of Thyroid Hormone Deficiency andExcess on BMD, Body Weight, and Bodyand Bone GrowthAt the basal state, when animals were 4 weeks old, there wereno differences in body weight, body length, femoral length andtibial length between C3H and B6 mice. However, as expected,BMD of C3H mice was higher than that of B6 mice in thetotal body (9%, p = 0.04), lumbar spine (12%, p = 0.02) andfemur (9%, p = 0.04), which confirms the typical bone massdifferences between these two strains of mice. Interestingly, BMDwas shown to respond differently to thyroid status in C3H vs.B6 mice (Figures 1, 2). Hypothyroidism only slightly limitedthe gain of BMD in the lumbar spine and femur of B6 mice
FIGURE 1 | Effect of thyroid hormone deficiency on BMD. (A,E) total body,
(B,F) lumbar spine, (C,G) femur, and (D,H) tibia of (A–D) B6 and (E–H) C3H
mice. Euthryoid (Eut); Hypothyroidism (Hypo), induced by metimazole and
NaClO−4 (MM+P); MM+P-treated mice receiving 1 µg/100 g BW of T4 per day
ip (1xT4). Each point is the mean ± SEM (n = 5/group). + p < 0.001, Eut vs.
Hypo and 1xT4; X p < 0.001, Hypo vs. T4; *p < 0.001, Hypo vs. Eut and T4
by Student-Knewman-Keuls test.
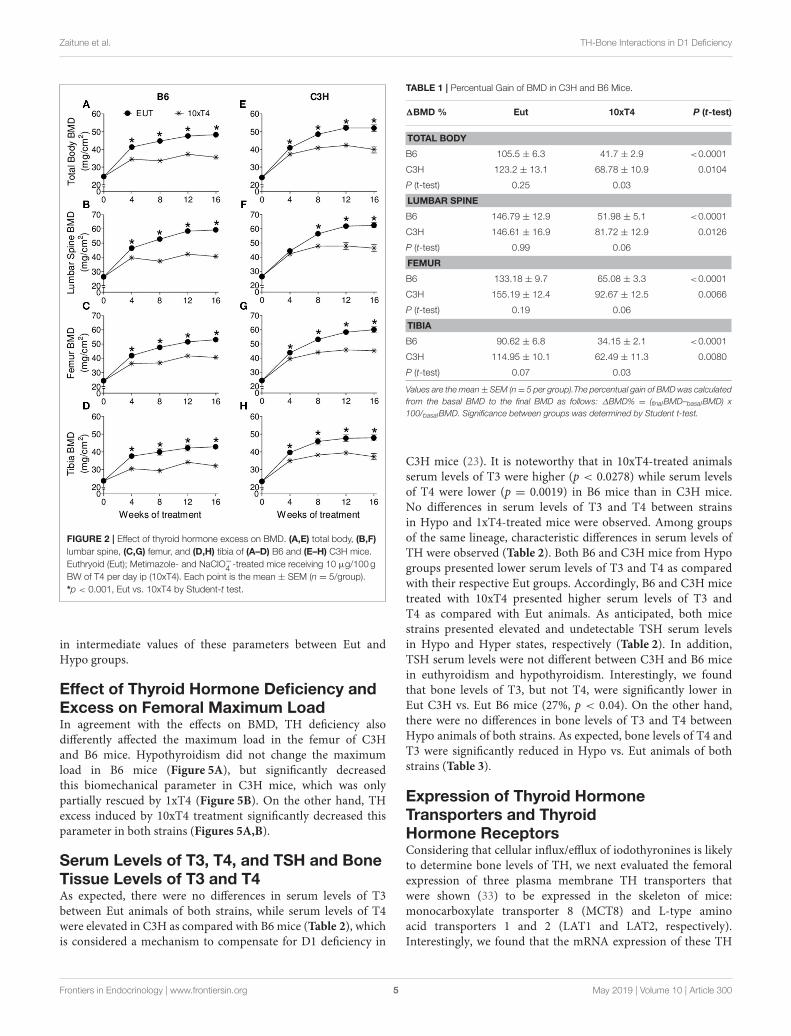
(Figures 1B,C), but significantly impaired BMD acquisition inall skeletal sites of C3H mice (Figures 1E–H). In addition, 1xT4only partially rescued BMD gain in C3H mice (Figures 1E–H),while it completely rescued the gain of BMD in the femur andvertebrae of B6 mice (Figures 1B,C). It is remarkable that THexcess induced by 10xT4-treatment, significantly impaired BMDgain in all skeletal sites of both strains (Figure 2). However, itwas slightly more severe in B6 mice than in C3H mice. As shownin Table 1, the percentual gain of total body and tibia BMD in10xT4-treated animals was significantly lower in B6 mice than inC3Hmice, while there were no differences between strains in Eutanimals. On the other hand, TH deficiency and excess limited thegain of body weight, body length, femoral length and tibial lengthin both strains of mice in a similar fashion (Figures 3, 4). In C3Hand B6 animals, 1xT4 totally rescued the growth deficit inducedby hypothyroidism in the tibia (Figures 3D,H) and partiallyrescued the deficits observed in body weight, body length andfemoral length, where we could see that 1xT4-treatment resulted
Frontiers in Endocrinology | www.frontiersin.org 4 May 2019 | Volume 10 | Article 300
Zaitune et al. TH-Bone Interactions in D1 Deficiency
FIGURE 2 | Effect of thyroid hormone excess on BMD. (A,E) total body, (B,F)
lumbar spine, (C,G) femur, and (D,H) tibia of (A–D) B6 and (E–H) C3H mice.
Euthryoid (Eut); Metimazole- and NaClO−4 -treated mice receiving 10 µg/100 g
BW of T4 per day ip (10xT4). Each point is the mean ± SEM (n = 5/group).
*p < 0.001, Eut vs. 10xT4 by Student-t test.
in intermediate values of these parameters between Eut andHypo groups.
Effect of Thyroid Hormone Deficiency andExcess on Femoral Maximum LoadIn agreement with the effects on BMD, TH deficiency alsodifferently affected the maximum load in the femur of C3Hand B6 mice. Hypothyroidism did not change the maximumload in B6 mice (Figure 5A), but significantly decreasedthis biomechanical parameter in C3H mice, which was onlypartially rescued by 1xT4 (Figure 5B). On the other hand, THexcess induced by 10xT4 treatment significantly decreased thisparameter in both strains (Figures 5A,B).
Serum Levels of T3, T4, and TSH and BoneTissue Levels of T3 and T4As expected, there were no differences in serum levels of T3between Eut animals of both strains, while serum levels of T4were elevated in C3H as compared with B6 mice (Table 2), whichis considered a mechanism to compensate for D1 deficiency in
TABLE 1 | Percentual Gain of BMD in C3H and B6 Mice.
1BMD % Eut 10xT4 P (t-test)
TOTAL BODY
B6 105.5 ± 6.3 41.7 ± 2.9 <0.0001
C3H 123.2 ± 13.1 68.78 ± 10.9 0.0104
P (t-test) 0.25 0.03
LUMBAR SPINE
B6 146.79 ± 12.9 51.98 ± 5.1 <0.0001
C3H 146.61 ± 16.9 81.72 ± 12.9 0.0126
P (t-test) 0.99 0.06
FEMUR
B6 133.18 ± 9.7 65.08 ± 3.3 <0.0001
C3H 155.19 ± 12.4 92.67 ± 12.5 0.0066
P (t-test) 0.19 0.06
TIBIA
B6 90.62 ± 6.8 34.15 ± 2.1 <0.0001
C3H 114.95 ± 10.1 62.49 ± 11.3 0.0080
P (t-test) 0.07 0.03
Values are the mean± SEM (n= 5 per group).The percentual gain of BMD was calculated
from the basal BMD to the final BMD as follows: ∆BMD% = (finalBMD–basalBMD) x
100/basalBMD. Significance between groups was determined by Student t-test.
C3H mice (23). It is noteworthy that in 10xT4-treated animalsserum levels of T3 were higher (p < 0.0278) while serum levelsof T4 were lower (p = 0.0019) in B6 mice than in C3H mice.No differences in serum levels of T3 and T4 between strainsin Hypo and 1xT4-treated mice were observed. Among groupsof the same lineage, characteristic differences in serum levels ofTH were observed (Table 2). Both B6 and C3H mice from Hypogroups presented lower serum levels of T3 and T4 as comparedwith their respective Eut groups. Accordingly, B6 and C3H micetreated with 10xT4 presented higher serum levels of T3 andT4 as compared with Eut animals. As anticipated, both micestrains presented elevated and undetectable TSH serum levelsin Hypo and Hyper states, respectively (Table 2). In addition,TSH serum levels were not different between C3H and B6 micein euthyroidism and hypothyroidism. Interestingly, we foundthat bone levels of T3, but not T4, were significantly lower inEut C3H vs. Eut B6 mice (27%, p < 0.04). On the other hand,there were no differences in bone levels of T3 and T4 betweenHypo animals of both strains. As expected, bone levels of T4 andT3 were significantly reduced in Hypo vs. Eut animals of bothstrains (Table 3).
Expression of Thyroid HormoneTransporters and ThyroidHormone ReceptorsConsidering that cellular influx/efflux of iodothyronines is likelyto determine bone levels of TH, we next evaluated the femoralexpression of three plasma membrane TH transporters thatwere shown (33) to be expressed in the skeleton of mice:monocarboxylate transporter 8 (MCT8) and L-type aminoacid transporters 1 and 2 (LAT1 and LAT2, respectively).Interestingly, we found that the mRNA expression of these TH
Frontiers in Endocrinology | www.frontiersin.org 5 May 2019 | Volume 10 | Article 300

Zaitune et al. TH-Bone Interactions in D1 Deficiency
FIGURE 3 | Effect of thyroid hormone deficiency on anthropometric
parameters. (A,E) body weight, (B,F) body length, (C,G) femoral length, and
(D,H) tibial length of (A–D) B6 and (E–H) C3H mice. Euthryoid (Eut);
Hypothyroidism (Hypo), induced by metimazole and NaClO−4 (MM+P);
MM+P-treated mice receiving 1 µg/100 g BW of T4 per day ip (1xT4). Each
point is the mean ± SEM (n = 5/group). + p < 0.001, Eut vs. Hypo and 1xT4;
X p < 0.001, Hypo vs. T4; *p < 0.001, Hypo vs. Eut and T4 by
Student-Knewman-Keuls test.
transporters was significantly increased in the femur of C3H vs.B6 mice (2.8 to 4.4 folds) (Figures 6A–C). We also compared themRNA expression of TRα1 and TRβ1 in the femur of C3H vs.B6 mice. No differences were observed between the two mousestrains for these receptors in euthyroidism (Figures 6D,E),hypothyroidism and hyperthyroidism (data not shown).
D1 and D2 mRNA Expression and ActivityConsidering that D2, but not D1, is present in the bone tissueof mice (18), we compared D2 activity in the femur of B6 andC3H mice to investigate if the differential skeletal responses ofC3H and B6 mice could be explained by a diverse D2 activitybetween strains. We first confirmed that D1 mRNA and activitywere significantly higher in the liver of B6 as compared with C3Hmice (Figures 7A,B). As it is characteristic for D2, its activitywas increased in HYPO animals and decreased in thyrotoxicanimals (treated with 10xT4) of both strains (Figures 7C,D). Itis interesting that femoral D2 activity was 50% higher in Hypo
FIGURE 4 | Effect of thyroid hormone excess on anthropometric parameter.
(A,E) body weight, (B,F) body length, (C,G) femoral length, and (D,H) tibial
length of (A–D) B6 and (E–H) C3H mice. Euthryoid (Eut); Metimazole- and
NaClO−4 -treated mice receiving 10 µg/100 g BW of T4 per day ip (10xT4).
Each point is the mean ± SEM (n = 5/group). *p < 0.001, Eut vs. 10xT4 by
Student-t test.
C3Hmice as compared with Hypo B6 mice (72± 5.9 vs. 36± 4.9fmol/min/mg prot, p < 0.01), while there were no differences inD2 activity between strains in Eut and Hyper animals.
DISCUSSION
We showed that TH deficiency and excess impaired body weightgain and the longitudinal growth of the body, femur and tibiain a similar fashion in C3H and B6 mice (Figures 3, 4). Onthe other hand, the response of bone mass accrual and bonestrength to thyroid status showed marked differences betweenthese two strains of inbred mice. While hypothyroidism onlyslightly impaired the gain of bone mass in the femur and lumbarvertebrae of B6 mice (Figure 1), it significantly impaired the gainof BMD in all skeletal sites evaluated of C3H mice (femur, tibia,lumbar spine and total body). In addition, a physiological doseof T4 (1xT4) only partially rescued BMD gain in C3H mice buttotally rescued bone mass acquisition in the femur and vertebraeof B6 mice. The analysis of bone strength in the femur by thethree-point bending test (expressed as maximum load) showed
Frontiers in Endocrinology | www.frontiersin.org 6 May 2019 | Volume 10 | Article 300

Zaitune et al. TH-Bone Interactions in D1 Deficiency
FIGURE 5 | Effect of thyroid hormone deficiency and excess on bone strength. Bone strength was evaluated by measuring the maximum load (KN) applied to the
femur of (A) B6 and (B) C3H mice by the three-point bending test. Euthryoid (Eut); Hypothyroid (Hypo), induced by metimazole and NaClO−4 (MM+P); MM+P-treated
mice receiving 1 or 10 µg/100 g BW of T4 per day ip (1xT4 and 10xT4, respectively). Bars represent the mean ± SEM (n = 5/group). *p < 0.05, **p < 0.01, ***p <
0.001 vs. Eut; x p < 0.05 vs. Hypo; + p < 0.05 vs. 1xT4 by Student-Knewman-Keuls test.
TABLE 2 | Serum Parameters.
Eut Hypo 1XT4 10XT4 P
T3 (ng/ml)
B6 0.43 ± 0.04 0.06 ± 0.03a 0.23 ± 0.03 0.99 ± 0.06b,d,e <0.0001
C3H 0.46 ± 0.03 0.13 ± 0.01b 0.29 ± 0.13 0.81 ± 0.03c,d,e <0.0001
P (t-test) n.s. n.s. n.s. 0.0278
T4 (ng/ml)
B6 42.2 ± 3.14 6.80 ± 1.42c 34.8 ± 1.07c,d 67.6 ± 3.6c,d,e <0.0001
C3H 53.1 ± 3.16 6.40 ± 2.64c 38.5 ± 1.95b,d 95.6 ± 5.0c,d,e <0.0001
P (t-test) 0.04 n.s. n.s. 0.0019
TSH (pg/ml)
B6 66.3 ± 4.23 620 ± 61.44c n.m. und. <0.0001
C3H 84.1 ± 7.93 625.5 ± 18.47c n.m. und. <0.0001
P (t-test) n.s. n.s.
Values are the mean ± SEM (n = 5 per group). Significance among groups was
determined by ANOVA followed by Student-Newman-Keuls test or by Student t-test as
specified; n.s. = non-significant; n.m. = not measured; und. = undetectable.ap < 0.05 vs. Eut.bp < 0.01 vs. Eut.cp < 0.001 vs. Eut.dp < 0.001 vs. Hypo.ep < 0.001 vs. 1xT4.
that hypothyroidism decreased bone strength only in C3H butnot in B6 mice (Figure 5). It is interesting that thyrotoxicosislimited BMD gain and decreased bone strength in both strainsbut the effects on BMD were somewhat more severe in B6 mice(Table 1). Therefore, C3H animals showed to be much moresusceptible to the deleterious effects of hypothyroidism on peakbone mass acquisition and bone strength than B6 mice. On theother hand, B6 mice showed to be more vulnerable to the effectsof thyrotoxicosis on bone mass than C3H mice.
An explanation for the distinctive effects of TH on BMD andbone strength between strains may be based on the fact that C3Hand B6 mice present basal differences on the bone remodelingrate. It was shown that C3H mice present low bone turnover,while B6 mice present a high bone remodeling rate (35). Sincehypothyroidism leads to a decrease in bone remodeling (36),followed by a marked reduction in the number of osteoblasts andin the bone formation rate (8), it is possible that TH deficiencyreduced bone formation and metabolism to a more critical level
TABLE 3 | T3 and T4 Concentration in the Skeleton.
Eut Hypo P (t-test)
T3 (ng/g)
B6 0.47 ± 0.05 0.11 ± 0.04 0.0002
C3H 0.34 ± 0.03 0.21 ± 0.05 0.04
P (t-test) 0.04 n.s.
T4 (ng/g)
B6 1.12 ± 0.21 0.42 ± 0.11 0.04
C3H 1.28 ± 0.10 0.71 ± 0.19 0.03
P (t-test) n.s. n.s.
T3 and T4 concentration in the skeleton were measured by RIA in a pool of bones (lumbar
vertebrae and both femurs, tibias, fibulas, scapulas, humerus, radius and ulnas) of each
animal. Results are expressed in nanograms per gram of bone. Values are the mean ±
SEM (n = 3–5 per group). Significance among groups was determined by Student t-test
as specified; n.s. = non-significant.
in C3Hmice than in B6 mice. On the other hand, it is known thatthyrotoxicosis increases the remodeling rate with an unbalancebetween bone formation and resorption, which leads to bone loss(3). Therefore, considering that B6 mice have a higher basal boneremodeling rate than C3H mice (35), it is also possible that THexcess increased bone turnover to a more crucial level in B6 thanin C3H mice.
Another explanation for the different responses of bone massand bone resistance to TH between strains could be a higherinduction of thyrotoxicosis in B6 mice and a higher inductionof hypothyroidism in C3H mice. In fact, we found higher serumlevels of T3 and lower serum levels of T4 in 10xT4-treated B6mice as compared with 10xT4-treated C3H mice (Table 2). It iswell-known that D1 activity is increased by T4 (13). Therefore,the conversion of T4 to T3 was certainly increased by 10xT4-treatment in C3H and B6 mice, which is confirmed by thehigher levels of T3 in 10xT4-treated mice of both strains incomparison with Eut animals (Table 2). However, the deficiencyof D1 in C3H animals probably lead to a lower conversion of T4to T3, which explains the higher levels of serum T4 and lowerlevels of serum T3 in C3H mice vs. B6 mice when treated with10xT4. These results suggest that global differences in D1 activitybetween these two strains of mice explain, at least partially, the
Frontiers in Endocrinology | www.frontiersin.org 7 May 2019 | Volume 10 | Article 300

Zaitune et al. TH-Bone Interactions in D1 Deficiency
FIGURE 6 | Femoral mRNA expression of thyroid hormone transporters (A–C) and thyroid hormone receptors (D–F) in B6 and C3H mice. (A) MCT8, (B) LAT1, (C)
LAT2, (D) TRα, and (E) TRβ1 mRNA expressions were assessed by real-time PCR and normalized to β-actin mRNA expression. Bars represent mean ± SD (n =
5/group). **p < 0.01 and ***p < 0,001 vs. B6 by Student Knewman-Keuls Test.
FIGURE 7 | Liver D1 mRNA expression and activity and femoral D2 activity.
(A) Semiquantitative RT-PCR analysis showing the levels of liver D1 and
β-actin mRNA. (B) Liver D1 activity. Effect of hypothyroidism (HYPO) and
hyperthyroidism (HYPER) on femoral D2 activity of (C) C3H and (D) B6 mice.
Bars represent mean ± SEM (n = 5/group). *p < 0.05, **p < 0.01, and ***p <
0.001 vs. Eut by Student Knewman-Keuls Test; X p < 0.01 by Student t-test.
TH excess-induced differences in serum levels of T3 and T4 andin BMD between strains. Thus, D1 seems to assume an indirectbut relevant role to bone mass when the systemic homeostasisis challenged by TH excess, regardless of its irrelevance to theskeleton under euthyroid conditions (37).
On the other hand, a higher induction of systemichypothyroidism in C3H vs. B6 mice was not confirmed since
there were no differences in serum levels of TH betweenhypothyroid animals of both strains (Table 2). We, therefore,investigated if local (bone) hypothyroidism was more intense inC3H vs. B6 mice, which was not confirmed as well. Nevertheless,it was remarkable to note that bone levels of T3 were significantlylower in Eut C3H vs. Eut B6 mice (27 %, p < 0.04). Consideringthe role of TH in activating bone metabolism (36), it is possiblethat the low bone levels of T3 (local hypothyroidism) in Eut C3Hcontributes to the characteristic low bone metabolism observedby others in this mouse model (35). It is noteworthy that femoralmRNA expression of TRs was not different between C3H andB6 mice, suggesting that the lower bone levels of T3 were notcompensated by upregulation of TRs.
To get insights if the lower concentrations of T3 in the boneof Eut C3H vs. Eut B6 mice could be related to a deficiencyin TH transport across the plasma membrane, we evaluated thefemoral expression of three TH transporters that were shown tobe expressed in the skeleton of mice, MCT8, LAT1 and LAT2(33). This appears not to be true, since the mRNA expressionof these three TH transporters was significantly increased in thefemur of C3H vs. B6mice (Figure 6), which, in turn, may reflect abone effort to increase local levels of TH. This finding is partiallycorroborated by a previous study, where we showed that MCT8mRNA expression is upregulated by low levels of TH in theskeleton of mice and in osteoblast-like cells (33).
Considering that C3H mice are D1 deficient (25) and that
D2, but not D1, is widely expressed in the skeleton of mice
(18, 19), we decided to investigate if differences in bone D2activity could explain the lower bone levels of T3 in Eut C3H
vs. Eut B6 mice and/or could play a role in the diverse skeletal
responses between both strains of mice. We first confirmed thatC3H mice presented low mRNA levels and activity of D1 in
the liver (Figures 7A,B). Next, we showed that hypothyroidism
increased while TH excess decreased D2 activity in the femurof C3H and B6 mice (Figures 7C,D), as it is characteristic for
Frontiers in Endocrinology | www.frontiersin.org 8 May 2019 | Volume 10 | Article 300

Zaitune et al. TH-Bone Interactions in D1 Deficiency
this enzyme (13). In addition, we found that there were nodifferences in femoral D2 activity between strains in both Eutand 10xT4-treated mice. This was somewhat unpredictable forthe Eut group based on previous studies that have shown thatD2 activity is about 50% lower in the brain and pituitary of C3Hanimals as compared with B6 mice, probably due to the highlevels of serum T4 (23). Nevertheless, in agreement with ourfindings, studies have shown that D2 activity in brown adiposetissue is also unaffected by higher serum levels of T4 in C3Hanimals (34). It is noteworthy, however, that hypothyroidismincreased femoral D2 activity 2-fold more in C3H vs. B6 mice,which probably explains why local levels of T3 were similar inHYPO animals of both strains in spite of being significantlylower in Eut C3H vs. Eut B6. The reason for this higherresponse of D2 to hypothyroidism in C3H mice is not clearsince both bone concentration and serum levels of T3 and T4were similar in hypothyroid animals of both strains. Altogether,these findings suggest that the regulation of bone D2 activity alsodepends on other factors than local concentration and serumlevels of TH. In fact, there is evidence that growth factors,adrenergic signaling, environmental, and nutritional factors mayinfluence deiodinase activities (13), although these enzymes aremainly regulated by thyroid hormones. Whereas, D1 activityis almost exclusively regultated by TH at the transcriptionallevel (38), D2 regulation by TH is much more complex,involving transcriptional, posttranscriptional and posttranslationmechanisms. Therefore, further studies are necessary to betterunderstand how D2 activity is regulated in the bone of mice andto reveal the mechanism whereby D2 activity is higher in C3H vs.B6 mice under hypothyroid conditions. It is noteworthy that thehigher increase in D2 activity in response to hypothyroidism inC3H vs. B6 mice probably contributed to the equal bone levels ofT3 in the hypothyroid condition between the two mouse strains.Thus, D2 activity was not a factor that contributed to the skeletaldifferences between C3H and B6mice in hypothyroid conditions.Nevertheless, the findings of the present study reinforce the ideathat D2 has a role in the maintenance of TH levels in the bone.
Considering that bone levels of TH and TR were not differentbetween hypothyroid animals (MM+P-treated mice) of bothstrains, the different genetic background of C3H and B6 miceshould contribute to the diverse effects of hypothyroidism onbonemass and function between strains. In fact, a series of studieshas shown that genetic factors influence bone mass acquisition orloss induced by non-genetic factors. Bouxsein et al. (39) showedthat estrogen deficiency induced vertebral trabecular bone loss infour strains of mice, including B6, but not in C3H. In contrast, atthe proximal tibia, C3H had a greater decline in trabecular bonevolume than B6. It was also shown that bone mass of C3H miceis practically unaffected by disuse, while bone mass of B6 miceis significantly reduced by immobilization (35, 40). Nevertheless,the lower bone concentration of T3 in Eut C3H vs .Eut B6 micemay, indeed, be an important factor to the characteristic lowerbone turnover presented by C3H animals, which in turn is likelyto contribute to the higher responsiveness of bone mass andstrength to the deleterious effects of hypothyroidism.
In summary, we found that C3H mice present a lowerconcentration of T3 in the skeleton than B6 mice, which may
contribute the previously observed lower bone turnover rate inC3H compared to B6 strain (35). Another interesting findingwas that the skeletons of C3H and B6 mice respond differentlyto TH excess and deficiency. We showed that high doses ofT4 resulted in less elevated serum levels of T3 and were lessdeleterious to the bone mass acquisition of C3H than B6 mice,which is probably explained by the lower D1 activity in C3Hmice. On the other hand, we showed that hypothyroidism barelyimpairs peak bone mass acquisition in B6 mice, but severelyaffects bone mass accrual in C3H mice, while there were nodifferences in serum and bone levels of T3 and T4 betweenhypothyroid animals of both strains. It suggests that the distincteffect of thyroid hormone deficiency between C3H and B6 micedepends on deiodinase-unrelated factors.
In conclusion, our findings show that C3Hmice present lowerbone levels of T3, which may contribute to the characteristiclow bone turnover rate of this mouse model. In addition, ourfindings suggest that D1 deficiency contributes to the TH excess-induced differences in peak bone mass accrual between C3H andB6 mice, indicating that D1 assumes an indirect but relevant roleto bone mass when the systemic homeostasis is challenged by THexcess, in spite of being irrelevant to the skeleton under euthyroidconditions. Our findings also suggest that other genetic factors,unrelated to deiodinases, but probably related to osteoblast andosteoclast activities, distribution, and physiology (41–44), andrelated to specific signaling pathways in these cells, accountfor the diverse skeleton responses to hypothyroidism betweenthese two inbred mouse strains. Therefore, further studies arenecessary to identify these genetic factors. Altogether, thesefindings highlight the caution against generalizing the skeletaleffects of TH across different mouse strains and individuals.
ETHICS STATEMENT
This study was carried out in accordance with therecommendations of the Standing Committee on AnimalResearch guideline. The protocol was approved by the StandingCommittee on Animal Research of the University of Sao Paulo.
AUTHOR CONTRIBUTIONS
CZ: conceived and performed experiments, carried out datacollection and analysis, and wrote the manuscript. TF, LC, FF,EB, JD, CW, and MM-R: performed experiments, carried outdata collection and analysis, and reviewed the manuscript. KNand AM: conceived the study and experiments, carried outdata analysis and reviewed the manuscript. CG: conceived thestudy and experiments, carried out data analysis and wrotethe manuscript.
FUNDING
This study was funded by Fundação de Amparo à Pesquisa doEstado de São Paulo (FAPESP), through the grants numbers2019/08683-6, 2004/01833-7, and 2003/07327-3.
Frontiers in Endocrinology | www.frontiersin.org 9 May 2019 | Volume 10 | Article 300

Zaitune et al. TH-Bone Interactions in D1 Deficiency
ACKNOWLEDGMENTS
This work was supported by a grant (CG) from Fundação deAmparo à Pesquisa do Estado de São Paulo–FAPESP, Brazil(04/01833-7) and by a grant (AM) from Conselho Nacional de
Desenvolvimento Científico e Tecnológico –CNPq, Brazil. TFand LC were recipients of fellowships from FAPESP (03/07327-3 and 05/59557-8) and FF, EB, and MM-R. were recipientsof fellowships from Conselho Nacional de Aperfeiçoamento dePessoal de Nível Superior–CAPES.
REFERENCES
1. Allain TJ, McGregor AM. Thyroid hormones and bone. J Endocrinol. (1993)
139:9–18. doi: 10.1677/joe.0.1390009
2. O’Shea PJ, Harvey CB, Suzuki H, Kaneshige M, Kaneshige K, Cheng SY,
et al. A thyrotoxic skeletal phenotype of advanced bone formation in mice
with resistance to thyroid hormone. Mol Endocrinol. (2003) 17:1410–24.
doi: 10.1210/me.2002-0296
3. Mosekilde L, Melsen F. A tetracycline-based histomorphometric
evaluation of bone resorption and bone turnover in hyperthyroidism
and hyperparathyroidism. Acta Med Scand. (1978) 204:97–102.
doi: 10.1111/j.0954-6820.1978.tb08406.x
4. Fraser SA, Anderson JB, Smith DA, Wilson GM. Osteoporosis
and fractures following thyrotoxicosis. Lancet. (1971) 1:981–3.
doi: 10.1016/S0140-6736(71)91383-3
5. Nagasaka S, Sugimoto H, Nakamura T, Kusaka I, Fujisawa G, Sakuma N,
et al. Antithyroid therapy improves bony manifestations and bone metabolic
markers in patients with Graves’ thyrotoxicosis. Clin Endocrinol. (1997)
47:215–21. doi: 10.1046/j.1365-2265.1997.2401045.x
6. Bours SP, van Geel TA, Geusens PP, Janssen MJ, Janzing HM, Hoffland GA,
et al. Contributors to secondary osteoporosis and metabolic bone diseases in
patients presenting with a clinical fracture. J Clin Endocrinol Metab. (2011)
96:1360–7. doi: 10.1210/jc.2010-2135
7. Eriksen EF, Mosekilde L, Melsen F. Kinetics of trabecular bone resorption and
formation in hypothyroidism: evidence for a positive balance per remodeling
cycle. Bone. (1986) 7:101–8. doi: 10.1016/8756-3282(86)90681-2
8. Freitas FR, Capelo LP, O’Shea PJ, Jorgetti V,Moriscot AS, Scanlan TS, et al. The
thyroid hormone receptor beta-specific agonist GC-1 selectively affects the
bone development of hypothyroid rats. J Bone Miner Res. (2005) 20:294–304.
doi: 10.1359/JBMR.041116
9. Bassett JH, Nordström K, Boyde A, Howell PG, Kelly S, Vennström
B, et al. Thyroid status during skeletal development determines adult
bone structure and mineralization. Mol Endocrinol. (2007) 21:1893–904.
doi: 10.1210/me.2007-0157
10. Williams GR, Bland R, Sheppard MC. Characterization of thyroid hormone
(T3) receptors in three osteosarcoma cell lines of distinct osteoblast
phenotype: interactions among T3, vitamin D3, and retinoid signaling.
Endocrinology. (1994) 135:2375–85. doi: 10.1210/en.135.6.2375
11. Abu EO, Bord S, Horner A, Chatterjee VK, Compston JE. The expression
of thyroid hormone receptors in human bone. Bone. (1997) 21:137–42.
doi: 10.1016/S8756-3282(97)00097-5
12. Ballock Rt, Mita BC, Zhou X, Chen DH, Mink LM. Expression of thyroid
hormone receptor isoforms in rat growth plate cartilage in vivo. J Bone Miner
Res. (1999) 14:1550–6. doi: 10.1359/jbmr.1999.14.9.1550
13. Bianco AC, Salvatore D, Gereben B, Berry MJ, Larsen PR. Biochemistry,
cellular and molecular biology, and physiological roles of the iodothyronine
selenodeiodinases. Endocr Rev. (2002) 23:38–89. doi: 10.1210/edrv.23.1.0455
14. Baqui MM, Gereben B, Harney JW, Larsen PR, Bianco AC. Distinct
subcellular localization of transiently expressed types 1 and 2 iodothyronine
deiodinases as determined by immunofluorescence confocal microscopy.
Endocrinology. (2000) 141:4309–12. doi: 10.1210/endo.141.11.7872
15. Toyoda N, Berry MJ, Harney JW, Larsen PR. Topological analysis of the
integral membrane protein, type 1 iodothyronine deiodinase (D1). J Biol
Chem. (1995) 270:12310–8. doi: 10.1074/jbc.270.20.12310
16. Köhrle J. Local activation and inactivation of thyroid hormones:
the deiodinase family. Mol Cell Endocrinol. (1999) 151:103–19.
doi: 10.1016/S0303-7207(99)00040-4
17. CroteauW, Davey JC, Galton VA, St. Germain DL. Cloning of the mammalian
type II iodothyronine deiodinase. A selenoprotein differentially expressed and
regulated in human and rat brain and other tissues. J Clin Invest. (1996)
98:405–17. doi: 10.1172/JCI118806
18. Gouveia CH, Christoffolete MA, Zaitune CR, Dora JM, Harney JW,
Maia AL, et al. Type 2 iodothyronine selenodeiodinase is expressed
throughout the mouse skeleton and in the MC3T3-E1 mouse osteoblastic
cell line during differentiation. Endocrinology. (2005) 146:195–200.
doi: 10.1210/en.2004-1043
19. Miura M, Tanaka K, Komatsu Y, Suda M, Yasoda A, Sakuma Y, et al.
Thyroid hormones promote chondrocyte differentiation in mouse ATDC5
cells and stimulate endochondral ossification in fetal mouse tibias through
iodothyronine deiodinases in the growth plate. J Bone Miner Res. (2002)
17:443–54. doi: 10.1359/jbmr.2002.17.3.443
20. Abdalla SM, Bianco AC. Defending plasma T3 is a biological priority. Clin
Endocrinol. (2014) 81:633–41. doi: 10.1111/cen.12538
21. Gereben B, Zavacki AM, Ribich S, Kim BW, Huang SA, Simonides
WS, et al. Cellular and molecular basis of deiodinase-regulated thyroid
hormone signaling. Endocr Rev. (2008) 29:898–938. doi: 10.1210/er.
2008-0019
22. Capelo LP, Beber EH, Huang SA, Zorn TM, Bianco AC, Gouveia CH.
Deiodinase-mediated thyroid hormone inactivation minimizes thyroid
hormone signaling in the early development of fetal skeleton. Bone. (2008)
43:921–30. doi: 10.1016/j.bone.2008.06.020
23. Berry MJ, Grieco D, Taylor BA, Maia AL, Kieffer JD, Beamer W, et al.
Physiological and genetic analyses of inbred mouse strains with a type I
iodothyronine 5’ deiodinase deficiency. J Clin Invest. (1993) 92:1517–28.
doi: 10.1172/JCI116730
24. Schoenmakers CH, Pigmans IG, Poland A, Visser TJ. Impairment of
the selenoenzyme type I iodothyronine deiodinase in C3H/He mice.
Endocrinology. (1993) 132:357–61. doi: 10.1210/endo.132.1.8419134
25. Maia AL, Berry MJ, Sabbag R, Harney JW, Larsen PR. Structural
and functional differences in the dio1 gene in mice with inherited
type 1 deiodinase deficiency. Mol Endocrinol. (1995) 9:969–80.
doi: 10.1210/mend.9.8.7476994
26. Schneider MJ, Fiering SN, Thai B, Wu SY, St. Germain E, Parlow AF,
et al.Targeted disruption of the type 1 selenodeiodinase gene (Dio1) results in
marked changes in thyroid hormone economy in mice. Endocrinology. (2006)
147:580–9. doi: 10.1210/en.2005-0739
27. Williams AJ, Robson H, Kester MHA, van Leeuwen JPTM, Shalet SM, Visser
TJ., et al. Iodothyronine deiodinase enzyme activities in bone. Bone. (2008)
43:126–34. doi: 10.1016/j.bone.2008.03.019
28. Chen C, Kalu DN. Strain differences in bone density and calcium
metabolism between C3H/HeJ and C57BL/6J mice. Bone. (1999) 25:413–20.
doi: 10.1016/S8756-3282(99)00185-4
29. Linkhart TA, Linkhart SG, Kodama Y, Farley JR, Dimai HP, Wright KR,
et al. Osteoclast formation in bone marrow cultures from two inbred strains
of mice with different bone densities. J Bone Miner Res. (1999) 14:39–46.
doi: 10.1359/jbmr.1999.14.1.39
30. Rosen CJ, Dimai HP, Vereault D, Donahue LR, Beamer WG, Farley J, et al.
Circulating and skeletal insulin-like growth factor-I (IGF-I) concentrations in
two inbred strains of mice with different bone mineral densities. Bone. (1997)
21:217–23. doi: 10.1016/S8756-3282(97)00143-9
31. Bianco AC, Silva JE. Nuclear 3,5,3’-triiodothyronine (T3) in brown
adipose tissue: receptor occupancy and sources of T3 as determined by
in vivo techniques. Endocrinology. (1987) 120:55–62. doi: 10.1210/endo-
120-1-55
Frontiers in Endocrinology | www.frontiersin.org 10 May 2019 | Volume 10 | Article 300

Zaitune et al. TH-Bone Interactions in D1 Deficiency
32. Obregon MJ, Morreale de Escobar G, Escobar del Rey F. Concentrations
of triiodo-L-thyronine in the plasma and tissues of normal rats, as
determined by radioimmunoassay: comparison with results obtained by
an isotopic equilibrium technique. Endocrinology. (1978) 103:2145–53.
doi: 10.1210/endo-103-6-2145
33. Capelo LP, Beber EH, Fonseca TL, Gouveia CH. The monocarboxylate
transporter 8 and L-type amino acid transporters 1 and 2 are expressed
in mouse skeletons and in osteoblastic MC3T3-E1 cells. Thyroid. (2009)
19:171–80. doi: 10.1089/thy.2008.0120
34. Wagner MS, Wajner SM, Dora JM, Maia AL. Regulation of Dio2 gene
expression by thyroid hormones in normal and type 1 deiodinase-deficient
C3H mice. J Endocrinol. (2007) 193:435–44. doi: 10.1677/JOE-07-0099
35. Amblard D, Lafage-Proust MH, Chamson A, Rattner A, Collet P, Alexandre
C, et al. Lower bone cellular activities in male and female mature C3H/HeJ
mice are associated with higher bone mass and different pyridinium crosslink
profiles compared to C57BL/6J mice. J Bone Miner Metab. (2003) 21:377–87.
doi: 10.1007/s00774-003-0432-8
36. Mosekilde L, Eriksen EF, Charles P. Effects of thyroid hormones on bone
and mineral metabolism. Endocrinol Metab Clin North Am. (1990) 19:35–63.
doi: 10.1016/S0889-8529(18)30338-4
37. Bassett JH, Boyde A, Howell PG, Bassett RH, Galliford TM, Archanco
M, et al. Optimal bone strength and mineralization requires the type 2
iodothyronine deiodinase in osteoblasts. Proc Natl Acad Sci USA. (2010)
107:7604–9. doi: 10.1073/pnas.0911346107
38. Maia AL, Harney JW, Larsen PR. Pituitary cells respond to thyroid hormone
by discrete, gene-specific pathways. Endocrinology. (1995) 136:1488–94.
doi: 10.1210/endo.136.4.7534701
39. Bouxsein ML, Uchiyama T, Rosen CJ, Shultz KL, Donahue LR, Turner CH,
et al. Mapping quantitative trait loci for vertebral trabecular bone volume
fraction and microarchitecture in mice. J Bone Miner Res. (2004) 19:587–99.
doi: 10.1359/JBMR.0301255
40. Judex S, Garman R, Squire M, Busa B, Donahue LR, Rubin C. Genetically
linked site-specificity of disuse osteoporosis. J Bone Miner Res. (2004) 19:607–
13. doi: 10.1359/JBMR.040110
41. Ramcharan MA, Faillace ME, Guengerich Z, Williams VA, Jepsen KJ. The
development of inter-strain variation in cortical and trabecular traits during
growth of the mouse lumbar vertebral body. Osteoporos Int. (2017) 28:1133–
43. doi: 10.1007/s00198-016-3801-6
42. Matsuda SS, Silva TL, Buzalaf MA, Rodrigues AC, de Oliveira RC. Differential
effects of fluoride during osteoblasts mineralization in C57BL/6J and
C3H/HeJ inbred strains of mice. Biol Trace Elem Res. (2014) 161:123–9.
doi: 10.1007/s12011-014-0086-5
43. Gerstenfeld LC, McLean J, Healey DS, Stapleton SN, Silkman LJ, Price
C., et al. Genetic variation in the structural pattern of osteoclast activity
during post-natal growth of mouse femora. Bone. (2010) 46:1546–54.
doi: 10.1016/j.bone.2010.02.016
44. Guntur AR, Le PT, Farber CR, Rosen CJ. Bioenergetics during
calvarial osteoblast differentiation reflect strain differences in
bone mass. Endocrinology. (2014) 155:1589–95. doi: 10.1210/en.
2013-1974
Conflict of Interest Statement: The authors declare that the research was
conducted in the absence of any commercial or financial relationships that could
be construed as a potential conflict of interest.
Copyright © 2019 Zaitune, Fonseca, Capelo, Freitas, Beber, Dora, Wang, Miranda-
Rodrigues, Nonaka, Maia and Gouveia. This is an open-access article distributed
under the terms of the Creative Commons Attribution License (CC BY). The use,
distribution or reproduction in other forums is permitted, provided the original
author(s) and the copyright owner(s) are credited and that the original publication
in this journal is cited, in accordance with accepted academic practice. No use,
distribution or reproduction is permitted which does not comply with these terms.
Frontiers in Endocrinology | www.frontiersin.org 11 May 2019 | Volume 10 | Article 300