Obesity-Associated Differentially Methylated Regions in Colon ...
13
Citation: Milner, J.J.; Chen, Z.-F.; Grayson, J.; Shiao, S.-Y.P.K. Obesity-Associated Differentially Methylated Regions in Colon Cancer. J. Pers. Med. 2022, 12, 660. https:// doi.org/10.3390/jpm12050660 Academic Editors: Shang-Ming Zhou, Ian Overton, Haider Raza and Jie Zheng Received: 4 March 2022 Accepted: 18 April 2022 Published: 20 April 2022 Publisher’s Note: MDPI stays neutral with regard to jurisdictional claims in published maps and institutional affil- iations. Copyright: © 2022 by the authors. Licensee MDPI, Basel, Switzerland. This article is an open access article distributed under the terms and conditions of the Creative Commons Attribution (CC BY) license (https:// creativecommons.org/licenses/by/ 4.0/). Journal of Personalized Medicine Article Obesity-Associated Differentially Methylated Regions in Colon Cancer John J. Milner 1, * , Zhao-Feng Chen 2 , James Grayson 3 and Shyang-Yun Pamela Koong Shiao 4 1 College of Nursing, Augusta University, Augusta, GA 30912, USA 2 Bachelor Degree Program in Pet Healthcare, Yuanpei University of Medical Technology, Hsinchu 30015, Taiwan, China; [email protected] 3 Hull College of Business, Augusta University, Augusta, GA 30912, USA; [email protected] 4 Medical College of Georgia, Augusta University, Augusta, GA 30912, USA; [email protected] * Correspondence: [email protected]; Tel.: +1-(404)-304-3528 Abstract: Obesity with adiposity is a common disorder in modern days, influenced by environmental factors such as eating and lifestyle habits and affecting the epigenetics of adipose-based gene regula- tions and metabolic pathways in colorectal cancer (CRC). We compared epigenetic changes of differ- entially methylated regions (DMR) of genes in colon tissues of 225 colon cancer cases (154 non-obese and 71 obese) and 15 healthy non-obese controls by accessing The Cancer Genome Atlas (TCGA) data. We applied machine-learning-based analytics including generalized regression (GR) as a con- firmatory validation model to identify the factors that could contribute to DMRs impacting colon cancer to enhance prediction accuracy. We found that age was a significant predictor in obese cancer patients, both alone (p = 0.003) and interacting with hypomethylated DMRs of ZBTB46, a tumor suppressor gene (p = 0.008). DMRs of three additional genes: HIST1H3I (p = 0.001), an oncogene with a hypomethylated DMR in the promoter region; SRGAP2C (p = 0.006), a tumor suppressor gene with a hypermethylated DMR in the promoter region; and NFATC4 (p = 0.006), an adipocyte differentiating oncogene with a hypermethylated DMR in an intron region, are also significant predictors of cancer in obese patients, independent of age. The genes affected by these DMR could be potential novel biomarkers of colon cancer in obese patients for cancer prevention and progression. Keywords: differentially methylated regions; colon cancer; obesity; biomarkers; generalized regression 1. Introduction Obesity, or excess adiposity and having a body mass index (BMI) ≥ 30, is a preventable and treatable condition, with lifestyle and environmental modifications, which has tripled since 1975 and now affects approximately 13% of the world population [1]. Obesity has been linked to tumorigenesis and cancer progression in various organs and a reduction in life expectancy by up to 14 years [2–7]. Mortality is increased up to 10% when obesity is present with colorectal cancer (CRC), whereas the risk of CRC is reduced up to 21% with a decrease in BMI and changes in lifestyle [8,9]. The risk of developing CRC increases with age, and 50–80% of CRC can be attributed to epigenetic changes due to lifestyle and BMI [10–14], with increased BMI as a risk factor in the proliferation of CRC [15–19]. CRC is the second most common cause of cancer death in the United States, with approximately 53,000 deaths occurring in 2021 [20]. For personalized medicine, it is clinically imperative to understand the impact of obesity on epigenetic changes to prevent the progression of CRC. DNA methylation (DNAm) is an epigenetic regulation of gene function that is impli- cated in the formation of CRC [21–24] and is impacted by obesity [25–28] and age [29–32]. DNAm occurs when a methyl group attaches to a cytosine nucleotide, usually within a CpG dinucleotide (CpG), inhibiting the expression of the nucleotide, thereby potentially altering the expression of the gene itself [33]. Differentially methylated regions (DMRs) J. Pers. Med. 2022, 12, 660. https://doi.org/10.3390/jpm12050660 https://www.mdpi.com/journal/jpm
-
Upload
khangminh22 -
Category
Documents
-
view
0 -
download
0
Transcript of Obesity-Associated Differentially Methylated Regions in Colon ...

Citation: Milner, J.J.; Chen, Z.-F.;
Grayson, J.; Shiao, S.-Y.P.K.
Obesity-Associated Differentially
Methylated Regions in Colon Cancer.
J. Pers. Med. 2022, 12, 660. https://
doi.org/10.3390/jpm12050660
Academic Editors: Shang-Ming Zhou,
Ian Overton, Haider Raza and
Jie Zheng
Received: 4 March 2022
Accepted: 18 April 2022
Published: 20 April 2022
Publisher’s Note: MDPI stays neutral
with regard to jurisdictional claims in
published maps and institutional affil-
iations.
Copyright: © 2022 by the authors.
Licensee MDPI, Basel, Switzerland.
This article is an open access article
distributed under the terms and
conditions of the Creative Commons
Attribution (CC BY) license (https://
creativecommons.org/licenses/by/
4.0/).
Journal of
Personalized
Medicine
Article
Obesity-Associated Differentially Methylated Regions inColon CancerJohn J. Milner 1,* , Zhao-Feng Chen 2 , James Grayson 3 and Shyang-Yun Pamela Koong Shiao 4
1 College of Nursing, Augusta University, Augusta, GA 30912, USA2 Bachelor Degree Program in Pet Healthcare, Yuanpei University of Medical Technology,
Hsinchu 30015, Taiwan, China; [email protected] Hull College of Business, Augusta University, Augusta, GA 30912, USA; [email protected] Medical College of Georgia, Augusta University, Augusta, GA 30912, USA; [email protected]* Correspondence: [email protected]; Tel.: +1-(404)-304-3528
Abstract: Obesity with adiposity is a common disorder in modern days, influenced by environmentalfactors such as eating and lifestyle habits and affecting the epigenetics of adipose-based gene regula-tions and metabolic pathways in colorectal cancer (CRC). We compared epigenetic changes of differ-entially methylated regions (DMR) of genes in colon tissues of 225 colon cancer cases (154 non-obeseand 71 obese) and 15 healthy non-obese controls by accessing The Cancer Genome Atlas (TCGA)data. We applied machine-learning-based analytics including generalized regression (GR) as a con-firmatory validation model to identify the factors that could contribute to DMRs impacting coloncancer to enhance prediction accuracy. We found that age was a significant predictor in obese cancerpatients, both alone (p = 0.003) and interacting with hypomethylated DMRs of ZBTB46, a tumorsuppressor gene (p = 0.008). DMRs of three additional genes: HIST1H3I (p = 0.001), an oncogene witha hypomethylated DMR in the promoter region; SRGAP2C (p = 0.006), a tumor suppressor gene witha hypermethylated DMR in the promoter region; and NFATC4 (p = 0.006), an adipocyte differentiatingoncogene with a hypermethylated DMR in an intron region, are also significant predictors of cancerin obese patients, independent of age. The genes affected by these DMR could be potential novelbiomarkers of colon cancer in obese patients for cancer prevention and progression.
Keywords: differentially methylated regions; colon cancer; obesity; biomarkers; generalized regression
1. Introduction
Obesity, or excess adiposity and having a body mass index (BMI) ≥ 30, is a preventableand treatable condition, with lifestyle and environmental modifications, which has tripledsince 1975 and now affects approximately 13% of the world population [1]. Obesity hasbeen linked to tumorigenesis and cancer progression in various organs and a reduction inlife expectancy by up to 14 years [2–7]. Mortality is increased up to 10% when obesity ispresent with colorectal cancer (CRC), whereas the risk of CRC is reduced up to 21% with adecrease in BMI and changes in lifestyle [8,9].
The risk of developing CRC increases with age, and 50–80% of CRC can be attributedto epigenetic changes due to lifestyle and BMI [10–14], with increased BMI as a risk factorin the proliferation of CRC [15–19]. CRC is the second most common cause of cancerdeath in the United States, with approximately 53,000 deaths occurring in 2021 [20]. Forpersonalized medicine, it is clinically imperative to understand the impact of obesity onepigenetic changes to prevent the progression of CRC.
DNA methylation (DNAm) is an epigenetic regulation of gene function that is impli-cated in the formation of CRC [21–24] and is impacted by obesity [25–28] and age [29–32].DNAm occurs when a methyl group attaches to a cytosine nucleotide, usually within aCpG dinucleotide (CpG), inhibiting the expression of the nucleotide, thereby potentiallyaltering the expression of the gene itself [33]. Differentially methylated regions (DMRs)
J. Pers. Med. 2022, 12, 660. https://doi.org/10.3390/jpm12050660 https://www.mdpi.com/journal/jpm

J. Pers. Med. 2022, 12, 660 2 of 13
represent groups of methylated cytosines within close range in various tissue types anddevelopmental stages [34]. DMRs located in the promoter region (first exon of a gene) werelinked to gene silencing [35–39], and the position of DMRs related to the transcription startsite (TSS) could impact transcription and gene function [40].
Hypomethylation (a reduction in methylated CpG) was associated with increasedexpression of gene function, whereas hypermethylation with decreased expression maypotentially lead to chronic diseases including cancer, especially if methylation occurs inthe promoter region of a gene [37,41–45]. Hypermethylated tumor suppressor genes (TSG)could lead to dysfunctional gene division or apoptosis, leading to abnormal cell growth;whereas hypomethylation with oncogenes causes cells to divide abnormally faster [46].Hypermethylation and reduction in TSG function of SRGAP2C (Slit-Robo Rho GTPase-activating protein 2C) [47–49] and ZBTB46 (zinc finger and born-to-bind domain containing46) [50–52] were associated with tumorigenesis and cancer metastasis. Conversely, hy-pomethylation and upregulated oncogene functions of HIST1H3I (Histone linker 1 withHistone H3.1), HIST1H3D (Histone linker 1 with Histone H3.D) [53–56], NFATC4 (Nuclearfactor of activated T-cells cytoplasmic 4) [57–60] and HOXB8 (Homeobox B8) [61–63] wereassociated with adiposity and colon cancer.
Significant research is being conducted on methylation of CpG and DMR in coloncancer [64–66], yet there is little consensus on what constitutes a significant methylationthreshold that could potentially translate to clinical significance. Whether the methylationthreshold is purely statistical using p values, or if it is a differential change measuredin a percent difference, has not yet been sufficiently documented or validated. Manystudies focus on single-gene associations with methylated CpG or DMR, some takingclinical data into context [67,68]. The genomic region of DMR and the impact on geneexpression has also been studied, showing that DMRs on promoter regions adversely affectgene function [38,39]. With advanced sequencing technology and machine-learning-basedanalytics [69–71], we conducted this study to examine DMRs in association with obesity asa significant contributing factor for colon cancer prevention.
The United States Centers for Disease Control and Prevention (CDC) has established aneed for increasing precision in cancer prevention [72]. Precision medicine takes individualdifferences in lifestyle, environment, and biology into account, requiring complex interac-tive analysis and predictive analytics, as well as standardized coding [73–75]. Therefore, weaccessed data from the Cancer Genome Atlas (TCGA) to evaluate the association of obesityin human colon tissue to locate DMR-associated genes of interest to examine the associationsof obesity with colon cancer [76]. We then applied groundbreaking machine-learning-basedpredictive analysis to locate DMRs, integrating BMI and age into the validation models, toenhance the accuracy of prediction.
2. Materials and Methods2.1. Demographic and Methylation Data
We obtained methylation data files from TCGA Colon Cancer project (COAD) version1.23.0 (https://portal.gdc.cancer.gov, accessed 16 June 2018) that were filtered to includeharmonized Illumina 450 K methylation data, BMI, age and gender from normal colon(n = 15) and colon cancer (n = 225) tissues using an R package designed for data retrieval,grouping and DMR analysis, TCGAbiolinksGUI [77–80]. The Illumina 450 K methylationarray provided data on 485,000 CpG sites, which covered approximately 1.6% of all CpGsites, (0.01% of the entire genome), and methylation information on 99% of all knowngenes [81–84]. Data included three groups of non-obese control (no cancer), non-obesecancer (BMI < 30) and obese cancer (BMI ≥ 30). At the time of data retrieval, this com-prised the entire list of cases that met the inclusion criteria. BMI was used as a groupingindependent variable and age as an independent variable in the regression model.

J. Pers. Med. 2022, 12, 660 3 of 13
2.2. DMR Bioinformatics Analysis
CpG site analysis and DMR identification were completed using additional R packageslimma (v. 3.34.9, February 2018) and bumphunter (v. 1.20.0, November 2012). Limmainvolves a matrix-type schema to analyze intra-sample variability (n = 240) per individualCpG site (n ≈ 485,000), and Bayesian corrected p values were provided between groups [85].Bumphunter includes linear regression and permutation testing to determine clusters ofDMR with significant CpG sites [86,87]. DMR with >2 CpG sites, excluding sex chro-mosomes and having ≥5% proportional change between groups of obese and non-obesecancer were annotated to protein-coding genes. A 3–10% difference in DNAm level betweengroups was noted as significant [88–91].
Gene annotation was conducted using data from the Catalogue of Somatic Mutationsin Cancer (COSMIC) v86 August 2018 (https://cancer.sanger.ac.uk/cosmic (accessed on 16June 2018)) [92,93] and the University of California, Santa Cruz (UCSC) genome browser(GRCh38/hg38, December 2013) (www.genome.ucsc.edu (accessed on 16 June 2018)) [94].Gene ontology and pathway analysis were conducted using the Database for Annotation,Visualization, and Integrated Discovery (DAVID) v 6.8 (https://david.ncifcrf.gov (accessedon 16 June 2018)) [95]. To isolate genes related to obesity, only genes in both obese andnon-obese comparison groups, and only those that could be further annotated to cancerand/or adipose-related functions through ontology or pathway analysis, were considered.
2.3. Predictive Analysis
Generalized regression (GR) was performed using JMP Pro v. 14 (SAS Institute, Cary,NC, USA). as a machine-learning tool to determine a predictive model from the genesidentified in the obese and non-obese cancer groups. To create the predictive model for GR,variables were recoded into dichotomous values based on median distribution across thevariable. The model created a prediction profile for associations between the parametersof interest and the strength of the parameters within the predictive model. Unlike logisticregression (LR), which assumed that all variables share a linear association, GR performedanalysis on each independent variable to determine associations with the dependentvariable and created a model that applied the nonlinear association to each variable in theprediction [96–98], which was then compared to the (LR) model for validation [99,100].
The final GR model was derived based on several criteria, including Akaike infor-mation criterion (AICc), misclassification rate and the area under the receiver operatingcharacteristic (ROC) curve (AUC). For internal validity of the predictive model, an AUC asclose to 1 (100%) is desired. Sensitivity refers to the number of actual cases with the findingof a positive result, whereas specificity is the number of actual cases without the findingof a negative result. AUC is a method to plot the sensitivity and specificity of test resultsto determine the accuracy of true positives versus false negatives [101]. Misclassificationrate is precision of the model by calculating the number of errors by the total number ofobservations. Ideally, this number should be low. AICc is an estimate of the fitness of themodel and should also be a low number.
To establish a GR model, 10 genes with the highest differential methylation, bothhypomethylated and hypermethylated, were analyzed using interaction profilers andregression algorithms. The prediction validation was developed using a GR adaptiveelastic net and Leave One Out (LOO) methodology with an 85% training/15% validationproportion created for machine-learning-based iterations. Interactions between factorswere examined using interaction profiler plots between parameters of genes or with age,with steps of iterations to eliminate parameters from the model that had no significance oraltered the significance of other parameters and prediction accuracy. Elastic net modelspresented a higher sensitivity and specificity than lasso [102–104], and LOO methodologywas used to eliminate insignificant parameters in the model and is suitable for analysiswith smaller sample sizes [105,106].

J. Pers. Med. 2022, 12, 660 4 of 13
3. Results
Demographic factors among control and two cancer groups of obese and non-obesewere compared (Table 1). BMI was different between obese cancer and two other groups(p < 0.0001), and cancer groups were younger in age (p < 0.05), with obese cancer being9.7 years younger and non-obese cancer being 7.7 years younger than the control group onaverage. There were no differences among three groups on gender and racial distributions.
Table 1. Demographic characteristics of the sample cases.
Cancer
Mean ± SD(Range)
Control(n = 15)
Non-Obese(n = 154)
Obese(n = 71)
BMI, Kg/m2 25.5 ± 2.7(20.1–29.8)
24.9 ± 3.1 *(14.7–29.8)
36.1 ± 2.8 *(30.0–54.1)
Age, years 81.7 ± 13.7(48–102)
74.0 ± 15.1 *(41–106)
72.0 ± 12.0 *(38–92)
Gender Female (%) 9 (60) 67 (43.5) 37 (52)Race White (%) 13 (87) 116 (75) 49 (69)
Black (%) 2 (13) 30 (19) 21 (30)Other (%) 0 8 (6) 1 (1)
Notes. BMI: Body Mass Index; * indicates p < 0.05.
3.1. Significant DMRs and Associated Genes between Groups
DMR analysis was performed to determine the number of protein-coding genes ofsignificance between groups, using a 5%, 10% and 15% methylation change between groups(Table 2), which shows a complete list of DMRs with the highest methylation differencesfor three between-groups pairs. DMR coordinates and gene functions are provided inthe supplementary tables (Tables S1 (hypomethylated) and S2 (hypermethylated). To testthe hypothetical association between obesity and CRC, gene ontology was performedwith a list of 518 genes comprising a 5% methylation change in both hypermethylated(n = 178) and hypomethylated (n = 340) genes between the obese and non-obese cancergroups. A 5% methylation difference was used due to the need for a sufficient list ofgenes for ontological analysis between the obese and non-obese cancer groups. No novelpathways with statistical significance were discovered between the obese and non-obesecancer groups; therefore, further ontological analysis was not conducted.
Table 2. Summary of differentially methylated regions (DMR) with unique protein-coding genes pergroup comparison.
Groups Non-ObeseCancer/Control Obese Cancer/Control
ObeseCancer/Non-Obese
Cancer
DifferentialMethylation Hyper Hypo Hyper Hypo Hyper Hypo
5% 4270 3744 4203 4073 178 34010% 2967 1644 2876 1909 25 4815% 2248 637 2173 828 6 10
Notes. Hypo refers to hypomethylated; Hyper refers to hypermethylated.
Table 3 shows 10 DMRs with the highest hypomethylation difference between obeseand non-obese cancer groups, and Table 4 shows the 10 DMRs with the highest hyperme-thylation between the two groups. Genes with functions linked to adiposity or glucosemetabolism, cancer-related functions, and both adiposity and cancer-related functions werenoted. Genes noted in Supplemental Tables S1 (hypomethylated) and S2 (hypermethylated)were used to derive the final GR model.

J. Pers. Med. 2022, 12, 660 5 of 13
Table 3. Genes associated with top hypomethylated differentially methylated regions (DMR) betweenobese and non-obese cancer groups.
DMRDis to TSS
DNAmGene Function
Gene # CpG Region Non-Obese Obese
HIST3H2A ‡ 25 Promoter 860 8.61 6.80 DNA repair, MMRHIST3H2BB ‡ 25 Promoter 701 8.61 6.80 DNA repair, MMR
HOXB8 † 18 Promoter −279 14.47 11.48 OncogeneHIST1H3I ‡ 11 Promoter −24 17.43 14.47 OncogeneTUBB2A ‡ 3 Intron −593 9.93 8.26 GTP bindingTMCO1 ‡ 13 Promoter 210 5.49 4.59 Calcium homeostasisPRAC2 † 4 Promoter 109 10.32 8.63 Oncogene
AMOTL2 ‡ 4 Intron −10,235 15.79 13.38 Inhibits Wnt pathwayARL4D ˆ 13 Promoter 107 8.03 6.82 Suppresses adipogenesis
HIST1H3D ‡ 13 Promoter 59 12.02 10.26 Oncogene
Notes: # CpG—number of methylated CpG sites; Dis to TSS—distance (in base pairs) to transcription start site fromDMR start; DNAm—mean methylation percent; ˆ represents genes that can be annotated to adiposity or glucose-related functions, † to cancer-related functions, and ‡ to both cancer and adipose/glucose-related functions.
Table 4. Genes associated with top hypermethylated differentially methylated regions (DMR) be-tween obese and non-obese cancer groups.
DMRDis to TSS
DNAmGene Function
Gene # CpG Region Non-Obese Obese
GNPDA2 ˆ 12 Promoter 107 7.86 9.74 Protein metabolismLSM14A † 9 Promoter 540 3.44 4.12 Immune responseZNF426 † 11 Promoter 107 21.70 25.80 Transcription regulationNFATC4 ‡ 8 Intron −466 9.98 11.52 OncogeneZNF852 † 3 Promoter 31 2.81 3.24 Transcription regulationFAM72B † 9 CDS 3021 29.19 33.34 Oncogene
SRGAP2C ‡ 9 Promoter 879 29.19 33.34 Tumor Suppression GeneTNFAIP2 † 3 Promoter 445 14.28 16.10 Mediator of inflammationZNF747 † 7 Promoter 188 7.18 8.07 Transcription regulationTUBB3 ‡ 3 Intron 2448 6.36 7.14 Oncogene, immune response
Notes: # CpG—number of methylated CpG sites; CDS—coding DNA sequence; Dis to TSS—distance (in basepairs) to transcription start site from DMR start; DNAm—mean methylation percent; ˆ represents genes that canbe annotated to adiposity or glucose-related functions, † to cancer-related functions, and ‡ to both cancer andadipose/glucose-related functions.
3.2. Significant Predictors
The most significant predictors associated with obesity between the two cancer groupswere age ≥ 76 (p = 0.004); HIST1H3I, a hypomethylated oncogene (p = 0.002); NFATC4, ahypermethylated oncogene (p = 0.027); SRGAP2C, a hypermethylated tumor suppressiongene (p = 0.025); and ZBTB46, a hypomethylated TSG interacting with age (p = 0.024),which was the only gene to have significant interaction with age in our prediction model.Variable importance analysis using independent uniform inputs shows that the order ofvariable importance is age (total effect (TE): 0.374), HIST1H3I (TE: 0.299), ZBTB46 (TE:0.295), SRGAP2C (TE: 0.184), NFATC4 (TE: 0.156), HOXB8 (TE: 0.098) and HIST1H3D (TE:0.024). Genes and interactions left in the model without significance were left to protect theintegrity of the model itself, as the removal of these predictors caused model instability(see Supplemental Figure S1).
HIST1H3I is an oncogene located on chromosome 6 that encodes a nuclear proteinresponsible for nucleosome structure and histone modification. It has been shown to havea high affinity for tumorigenesis, has been identified as a potential biomarker for CRC, andhas been isolated in adipocytes [53,54,107]. Our data (see Figure 1a) show the promoterregion DMR of HIST1H3I to have 17% hypomethylation between obese and non-obese
J. Pers. Med. 2022, 12, 660 6 of 13
cancer, and GR analysis showed no interaction between HIST1H3I and age in the predictionmodel. Mean values appear to increase from control group due to outliers in the datasamples, but GR is based on median values, which are not represented by outliers.
TSG such as ZBTB46, a zinc finger/BTB domain protein gene on chromosome 20,represses the oncogene PRDM1 and has similar functions to autoimmune regulators [50–52].Although located on an intron, the DMR affecting ZBTB46 showed a 36% reduction inmethylation between obese and non-obese cancer groups (see Figure 1b), and GR analysisshowed significant interaction with age (p = 0.024).
SRGAP2C is a SLIT-ROBO GTPase-activating tumor-suppressing gene located onchromosome 1. Changes in expression may contribute to cancer metastasis, and theSRGAP2 protein is reduced or absent in many tumor samples [47–49]. The promoter-regionDMR on SRGAP2C showed significant hypermethylation between all three groups (seeFigure 1c), with the lowest at 14% proportional change between the obese and non-obesecancer group, and it revealed a marginal interaction with age in the GR model.
NFATC4, an oncogene located on chromosome 14, encodes a protein from the nuclearfactor of an activated T-cell family, which is a DNA-binding complex, is expressed in manycancer tissues, and has been shown to enhance tumorigenesis. With obesity, NFATC4 isknown to initiate inflammatory processes, and it is associated with increased cell death inolder patients [57–60]. The significant DMR for NFATC4, located on an intron, had 15%hypermethylation between obese and non-obese cancer (see Figure 1d), and NFATC4 hada marginal interaction with age in the GR model. A large number of outliers appears tominimize the mean value differential for NFATC4, but these outliers are not factored intothe GR model.
HOXB8 located on chromosome 17 is a known oncogene that is associated with col-orectal cancer. It is downregulated in colon cancer, but downregulation has been associatedwith favorable prognosis in renal cancer [61–63,108]. HOXB8 has promoter-region DMRwith a 20% hypomethylation between groups (see Figure 1e), and a marginal interactionwith age in the prediction model.
HIST1H3D, similar to HIST1H3I, is a known oncogene also located on chromosome 6,functioning as a chromatin compactor. It is upregulated in cancer, and a reduction in itsexpression causes chromatin structure closing [55,56,109]. Figure 1f shows the HIST1H3Dpromoter-region DMR having a 14% hypomethylation between obese and non-obese cancer,with no significant age interaction in the GR model.
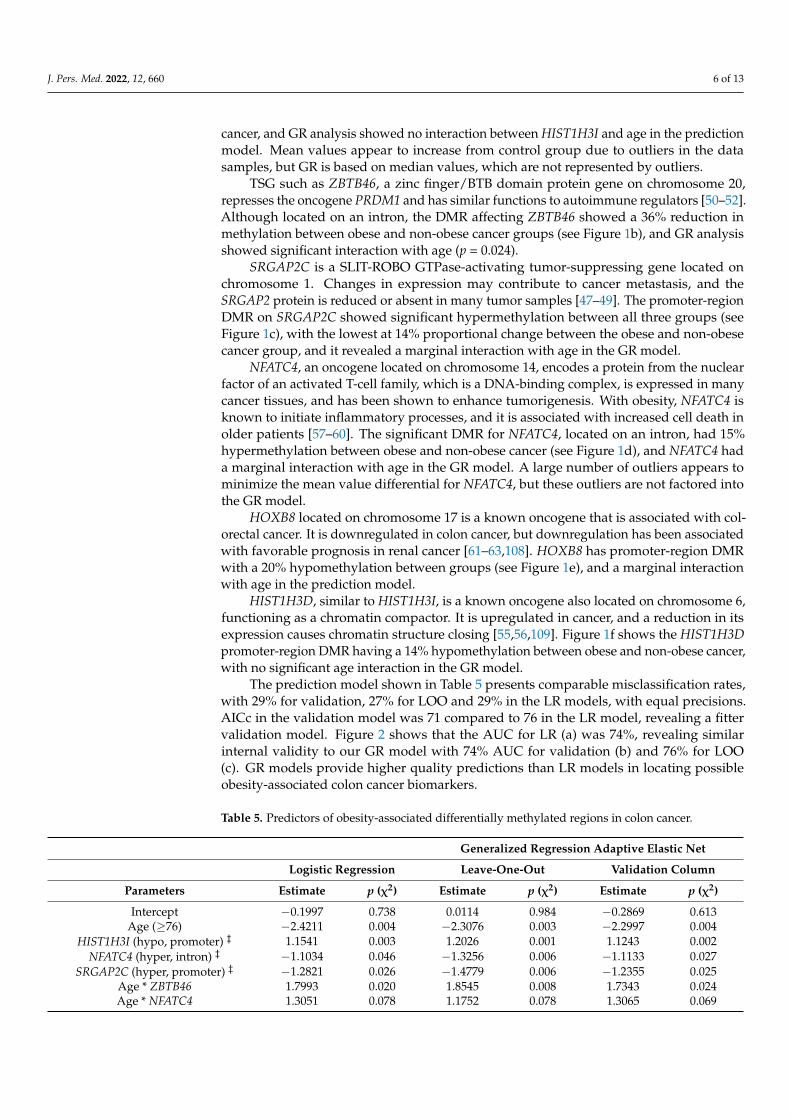
The prediction model shown in Table 5 presents comparable misclassification rates,with 29% for validation, 27% for LOO and 29% in the LR models, with equal precisions.AICc in the validation model was 71 compared to 76 in the LR model, revealing a fittervalidation model. Figure 2 shows that the AUC for LR (a) was 74%, revealing similarinternal validity to our GR model with 74% AUC for validation (b) and 76% for LOO(c). GR models provide higher quality predictions than LR models in locating possibleobesity-associated colon cancer biomarkers.
Table 5. Predictors of obesity-associated differentially methylated regions in colon cancer.
Generalized Regression Adaptive Elastic Net
Logistic Regression Leave-One-Out Validation Column
Parameters Estimate p (χ2) Estimate p (χ2) Estimate p (χ2)
Intercept −0.1997 0.738 0.0114 0.984 −0.2869 0.613Age (≥76) −2.4211 0.004 −2.3076 0.003 −2.2997 0.004
HIST1H3I (hypo, promoter) ‡ 1.1541 0.003 1.2026 0.001 1.1243 0.002NFATC4 (hyper, intron) ‡ −1.1034 0.046 −1.3256 0.006 −1.1133 0.027
SRGAP2C (hyper, promoter) ‡ −1.2821 0.026 −1.4779 0.006 −1.2355 0.025Age * ZBTB46 1.7993 0.020 1.8545 0.008 1.7343 0.024Age * NFATC4 1.3051 0.078 1.1752 0.078 1.3065 0.069

J. Pers. Med. 2022, 12, 660 7 of 13
Table 5. Cont.
Generalized Regression Adaptive Elastic Net
Logistic Regression Leave-One-Out Validation Column
Parameters Estimate p (χ2) Estimate p (χ2) Estimate p (χ2)
Age * HOXB8 1.0252 0.163 1.1410 0.084 0.9161 0.081Age * SRGAP2C 1.0565 0.153 1.1584 0.088 1.0062 0.168
HIST1H3D (hypo, promoter) ‡ −0.3225 0.401 −0.6169 0.089 −0.3119 0.419ZBTB46 (hypo, intron) † −0.2551 0.637 −0.2889 0.550 −0.2036 0.702
HOXB8 (hypo, promoter) † −0.0984 0.856 0.0115 0.979 0.0000 1.000
Misclassification rate 0.290 - 0.277 - 0.290 -AICc 76.63 - - - 71.067 -
Area under the curve 0.741 - 0.757 - 0.739 -
Notes—data not available; AICc—Akaike’s information criterion with corrections; * denotes interaction.† represents genes that can be annotated to cancer-related functions and ‡ to both cancer and adipose/glucose-related functions.
J. Pers. Med. 2022, 12, x FOR PEER REVIEW 7 of 14
(a) (b)
(c) (d)
(e) (f)
Figure 1. Methylated genes from the generalized regression model. Notes. Genes with age interac-tion show mean values by age as trendlines; genes without interaction with age show overall mean trendline. Hypomethylation and hypermethylation percent indicates change between obese and non-obese groups. Genes are ordered (a–f) based on total effect from generalized regression model; ## indicates p < 0.05 for cancer group to control; ** indicates p < 0.05 between obese and non-obese cancer.
The prediction model shown in Table 5 presents comparable misclassification rates, with 29% for validation, 27% for LOO and 29% in the LR models, with equal precisions. AICc in the validation model was 71 compared to 76 in the LR model, revealing a fitter validation model. Figure 2 shows that the AUC for LR (a) was 74%, revealing similar in-ternal validity to our GR model with 74% AUC for validation (b) and 76% for LOO (c). GR models provide higher quality predictions than LR models in locating possible obesity-associated colon cancer biomarkers.
Figure 1. Methylated genes from the generalized regression model. Notes. Genes with age interactionshow mean values by age as trendlines; genes without interaction with age show overall mean trend-line. Hypomethylation and hypermethylation percent indicates change between obese and non-obesegroups. Genes are ordered (a–f) based on total effect from generalized regression model; ## indicatesp < 0.05 for cancer group to control; ** indicates p < 0.05 between obese and non-obese cancer.

J. Pers. Med. 2022, 12, 660 8 of 13
J. Pers. Med. 2022, 12, x FOR PEER REVIEW 8 of 14
Table 5. Predictors of obesity-associated differentially methylated regions in colon cancer.
Generalized Regression Adaptive Elastic Net Logistic Regression Leave-One-Out Validation Column
Parameters Estimate p (χ2) Estimate p (χ2) Estimate p (χ2) Intercept −0.1997 0.738 0.0114 0.984 −0.2869 0.613 Age (≥76) −2.4211 0.004 −2.3076 0.003 −2.2997 0.004
HIST1H3I (hypo, promoter) ‡ 1.1541 0.003 1.2026 0.001 1.1243 0.002 NFATC4 (hyper, intron) ‡ −1.1034 0.046 −1.3256 0.006 −1.1133 0.027
SRGAP2C (hyper, promoter) ‡ −1.2821 0.026 −1.4779 0.006 −1.2355 0.025 Age * ZBTB46 1.7993 0.020 1.8545 0.008 1.7343 0.024 Age * NFATC4 1.3051 0.078 1.1752 0.078 1.3065 0.069 Age * HOXB8 1.0252 0.163 1.1410 0.084 0.9161 0.081
Age * SRGAP2C 1.0565 0.153 1.1584 0.088 1.0062 0.168 HIST1H3D (hypo, promoter) ‡ −0.3225 0.401 −0.6169 0.089 −0.3119 0.419
ZBTB46 (hypo, intron) † −0.2551 0.637 −0.2889 0.550 −0.2036 0.702 HOXB8 (hypo, promoter) † −0.0984 0.856 0.0115 0.979 0.0000 1.000
Misclassification rate 0.290 - 0.277 - 0.290 - AICc 76.63 - - - 71.067 -
Area under the curve 0.741 - 0.757 - 0.739 - Notes.—data not available; AICc—Akaike’s information criterion with corrections; * denotes inter-action. † represents genes that can be annotated to cancer-related functions and ‡ to both cancer and adipose/glucose-related functions.
(a) Logistic Regression (b) Validation column (c) Leave-one-out validation
AUC—0.741 AUC—0.739 AUC—0.757
Figure 2. Receiver operating characteristic (ROC) curve and area under the curve (AUC) for logistic and generalized regression with adaptive elastic net. (a) represents logistic regression, (b) is adaptive elastic net with validation column, and (c) is adaptive elastic net with leave-one-out validation.
4. Discussion Generalized regression is a powerful machine learning tool to capture associations
between variables, rather than assuming that one causes the other. GR eliminates varia-bles that have no effect on the final model, allowing the remaining variables to have a greater effect on the overall model. Using GR, we reduced the pool of colon cancer obesity-impacted DMR-associated genes to six (6) and determined that age was an associated var-iable when considered independently, also when interacting with several genes, most no-tably ZBTB46 (p = 0.024). We further determined that neither gender nor ethnicity were significant factors, and this is one of only a few studies to use GR in a methylation study that also used a differential methylation value of DMR.
Figure 2. Receiver operating characteristic (ROC) curve and area under the curve (AUC) for logisticand generalized regression with adaptive elastic net. (a) represents logistic regression, (b) is adaptiveelastic net with validation column, and (c) is adaptive elastic net with leave-one-out validation.
4. Discussion
Generalized regression is a powerful machine learning tool to capture associationsbetween variables, rather than assuming that one causes the other. GR eliminates variablesthat have no effect on the final model, allowing the remaining variables to have a greatereffect on the overall model. Using GR, we reduced the pool of colon cancer obesity-impacted DMR-associated genes to six (6) and determined that age was an associatedvariable when considered independently, also when interacting with several genes, mostnotably ZBTB46 (p = 0.024). We further determined that neither gender nor ethnicity weresignificant factors, and this is one of only a few studies to use GR in a methylation studythat also used a differential methylation value of DMR.
Of the list of top 10 genes containing the DMR with the largest methylation difference,HOXB8 was the only gene with a statistically significant hypomethylated DMR in the obeseto non-obese group (p = 0.026). As an oncogene, increased expression is associated withcolorectal cancer. Two genes had statistically significant DMR hypermethylation in theobese to non-obese group: ZNF426 (p = 0.049), a zinc finger protein-coding gene involvedin transcriptional regulation; and TUBB3 (p = 0.043), a beta-tubulin protein family codinggene that plays a role in axon guidance. When used in the GR model, only HOXB8 hadborderline significance, which caused model instability when it was removed.
One limitation of this study was the use of methylation data from solid tumor tissue,rendering it difficult to generalize for biomarker analysis; however, it provides significantinformation about the genomic mechanisms impacted by obesity that may be targetedby precision medicine for colon cancer patients. Further study needs to be conducted tocompare methylation changes in both solid tissue and body fluid samples, to determinewhether DNAm occurs systemically or is isolated to the cancer tissue, and further studyneeds to be conducted to determine the level that DNAm impacts the function of the gene,whether at an individual CpG site or a DMR, such that future studies can all start from aleveled analysis point. The use of a single cohort cancer database is another limitation ofthis study, which will be reduced in a follow-up study by using multiple cohorts as well assurvival analysis to validate these findings.
Using machine-learning-based tools and grouping colon cancer cases based on BMI,we have identified genes associated with obesity, related to lifestyle that may modified,potentially impacting colon cancer through methylation. HIST1H3I, ZBTB46, SRGAP2Cand HIST1H3D are all potential novel biomarkers identified through our analysis method,and using GR, multiple genes impacted by DMR can be identified with cofactors frompatient lifestyle. DNAm analysis and interpretation are becoming easier and less expensiveto perform and can provide insights into disease processes never considered feasible duringtreatment processes in the past. Combining DNAm with GR provides precision-medicine-

J. Pers. Med. 2022, 12, 660 9 of 13
based healthcare the tools necessary to focus on patient-centered treatment for cancer andchronic diseases.
Supplementary Materials: The following supporting information can be downloaded at: https://www.mdpi.com/article/10.3390/jpm12050660/s1, Figure S1: Interaction profile matrix for general-ized regression model parameters, Table S1: Genes associated with top hypomethylated differentiallymethylated regions (DMR) between groups, Table S2: Genes associated with top hypermethylateddifferentially methylated regions (DMR) between groups. Original TCGA methylation files: demo-graphics.csv, annotations.csv, methylation_betas.csv.
Author Contributions: Conceptualization and study design, J.J.M. and S.-Y.P.K.S.; acquisition andsearch of the literature, J.J.M., Z.-F.C. and S.-Y.P.K.S.; analysis and interpretation of data, J.J.M., J.G.and S.-Y.P.K.S.; writing—initial draft, J.J.M. All authors have read and agreed to the published versionof the manuscript.
Funding: This research received no external funding.
Institutional Review Board Statement: The IRB of Augusta University has determined that theresearch conducted here is not human subjects research, on 22 August 2021 (Project 1790087-1).
Informed Consent Statement: Not applicable.
Acknowledgments: Shaoyong Su from the Georgia Prevention Institute for his support in methy-lation analysis. The results published here are in whole or part based upon data generated by theTCGA Research Network: https://www.cancer.gov/tcga (accessed on 16 June 2018).
Conflicts of Interest: The authors declare no conflict of interest.
References1. WHO. Obesity and Overweight. Available online: http://www.who.int/en/news-room/fact-sheets/detail/obesity-and-
overweight (accessed on 3 January 2021).2. Almen, M.S.; Nilsson, E.K.; Jacobsson, J.A.; Kalnina, I.; Klovins, J.; Fredriksson, R.; Schioth, H.B. Genome-wide analysis reveals
DNA methylation markers that vary with both age and obesity. Gene 2014, 548, 61–67. [CrossRef] [PubMed]3. Dick, K.J.; Nelson, C.P.; Tsaprouni, L.; Sandling, J.K.; Aïssi, D.; Wahl, S.; Meduri, E.; Morange, P.-E.; Gagnon, F.; Grallert, H.; et al.
DNA methylation and body-mass index: A genome-wide analysis. Lancet 2014, 383, 1990–1998. [CrossRef]4. Printz, C. Extreme obesity may shorten life expectancy up to 14 years. Cancer 2014, 120, 3591. [CrossRef] [PubMed]5. Shiao, S.P.K.; Grayson, J.; Yu, C.H.; Wasek, B.; Bottiglieri, T. Gene Environment Interactions and Predictors of Colorectal Cancer in
Family-Based, Multi-Ethnic Groups. J. Pers. Med. 2018, 8, 10. [CrossRef]6. Jones, P.A.; Baylin, S.B. The Epigenomics of Cancer. Cell 2007, 128, 683–692. [CrossRef]7. Ayers, D.; Boughanem, H.; Macías-González, M. Epigenetic Influences in the Obesity/Colorectal Cancer Axis: A Novel Therag-
nostic Avenue. J. Oncol. 2019, 2019, 7406078. [CrossRef]8. Luo, J.; Hendryx, M.; Manson, J.E.; Figueiredo, J.C.; LeBlanc, E.S.; Barrington, W.; Rohan, T.E.; Howard, B.V.; Reding, K.;
Ho, G.Y.; et al. Intentional Weight Loss and Obesity-Related Cancer Risk. JNCI Cancer Spectr. 2019, 3, pkz054. [CrossRef]9. Wu, S.; Liu, J.; Wang, X.; Li, M.; Gan, Y.; Tang, Y. Association of obesity and overweight with overall survival in colorectal cancer
patients: A meta-analysis of 29 studies. Cancer Causes Control 2014, 25, 1489–1502. [CrossRef]10. Gao, Y.; Cao, Y.; Tan, A.; Liao, C.; Mo, Z.; Gao, F. Glutathione S-transferase M1 polymorphism and sporadic colorectal cancer risk:
An updating meta-analysis and HuGE review of 36 case-control studies. Ann. Epidemiol. 2010, 20, 108–121. [CrossRef]11. Society, A.C. Cancer Facts and Figures 2022; American Cancer Society: Atlanta, GA, USA, 2022; Volume 500822.12. Yu, M.; Hazelton, W.D.; Luebeck, G.E.; Grady, W.M. Epigenetic aging: More than just a clock when it comes to cancer. Cancer Res.
2019, 80, 367–374. [CrossRef]13. Zheng, C.; Li, L.; Xu, R. Association of Epigenetic Clock with Consensus Molecular Subtypes and Overall Survival of Colorectal
Cancer. Cancer Epidemiol. Biomark. Prev. 2019, 28, 1720–1724. [CrossRef] [PubMed]14. Islami, F.; Goding Sauer, A.; Miller, K.D.; Siegel, R.L.; Fedewa, S.A.; Jacobs, E.J.; Mc Cullough, M.L.; Patel, A.V.; Ma, J.;
Soerjomataram, I.; et al. Proportion and number of cancer cases and deaths attributable to potentially modifiable risk factors inthe United States. CA Cancer J. Clin. 2018, 68, 31–54. [CrossRef] [PubMed]
15. Andreasson, A.; Hagstrom, H.; Skoldberg, F.; Onnerhag, K.; Carlsson, A.C.; Schmidt, P.T.; Forsberg, A.M. The prediction ofcolorectal cancer using anthropometric measures: A Swedish population-based cohort study with 22 years of follow-up. UnitedEur. Gastroenterol. J. 2019, 7, 1250–1260. [CrossRef] [PubMed]
16. Bjorge, T.; Haggstrom, C.; Ghaderi, S.; Nagel, G.; Manjer, J.; Tretli, S.; Ulmer, H.; Harlid, S.; Rosendahl, A.H.; Lang, A.; et al. BMIand weight changes and risk of obesity-related cancers: A pooled European cohort study. Int. J. Epidemiol. 2019, 48, 1872–1885.[CrossRef] [PubMed]

J. Pers. Med. 2022, 12, 660 10 of 13
17. Garcia, H.; Song, M. Early-life obesity and adulthood colorectal cancer risk: A meta-analysis. Rev. Panam. De Salud Publica PanAm. J. Public Health 2019, 43, e3. [CrossRef] [PubMed]
18. Naber, S.K.; Kundu, S.; Kuntz, K.M.; Dotson, W.D.; Williams, M.S.; Zauber, A.G.; Calonge, N.; Zallen, D.T.; Ganiats, T.G.;Webber, E.M.; et al. Cost-effectiveness of risk-stratified colorectal cancer screening based on polygenic risk—current status andfuture potential. JNCI Cancer Spectr. 2019, 4, pkz086. [CrossRef]
19. Anania, G.; Resta, G.; Marino, S.; Fabbri, N.; Scagliarini, L.; Marchitelli, I.; Fiorica, F.; Cavallesco, G. Treatment of ColorectalCancer: A Multidisciplinary Approach. J. Gastrointest. Cancer 2018, 50, 458–468. [CrossRef]
20. Siegel, R.L.; Miller, K.D.; Goding Sauer, A.; Fedewa, S.A.; Butterly, L.F.; Anderson, J.C.; Cercek, A.; Smith, R.A.; Jemal, A.Colorectal cancer statistics, 2020. CA Cancer J. Clin. 2020, 70, 145–164. [CrossRef]
21. Ahn, J.B.; Chung, W.B.; Maeda, O.; Shin, S.J.; Kim, H.S.; Chung, H.C.; Kim, N.K.; Issa, J.P. DNA methylation predicts recurrencefrom resected stage III proximal colon cancer. Cancer 2011, 117, 1847–1854. [CrossRef]
22. Beaulieu, J.-F. (Ed.) Colorectal Cancer: Methods and Protocols; Humana Press: New York, NY, USA, 2018; Volume 1765, p. 348.23. Berger, S.L.; Kouzarides, T.; Shiekhattar, R.; Shilatifard, A. An operational definition of epigenetics. Genes Dev. 2009, 23, 781–783.
[CrossRef]24. Borchiellini, M.; Ummarino, S.; Di Ruscio, A. The Bright and Dark Side of DNA Methylation: A Matter of Balance. Cells 2019,
8, 1243. [CrossRef] [PubMed]25. Ajonijebu, D.C.; Abboussi, O.; Russell, V.A.; Mabandla, M.V.; Daniels, W.M.U. Epigenetics: A link between addiction and social
environment. Cell. Mol. Life Sci. CMLS 2017, 74, 2735–2747. [CrossRef] [PubMed]26. Andersen, V.; Holst, R.; Vogel, U. Systematic review: Diet-gene interactions and the risk of colorectal cancer. Aliment Pharm. 2013,
37, 383–391. [CrossRef] [PubMed]27. Crujeiras, A.B.; Morcillo, S.; Diaz-Lagares, A.; Sandoval, J.; Castellano-Castillo, D.; Torres, E.; Hervas, D.; Moran, S.; Esteller, M.;
Macias-Gonzalez, M.; et al. Identification of an episignature of human colorectal cancer associated with obesity by genome-wideDNA methylation analysis. Int. J. Obes. 2019, 43, 176–188. [CrossRef] [PubMed]
28. Carr, P.R.; Amitay, E.L.; Jansen, L.; Alwers, E.; Roth, W.; Herpel, E.; Kloor, M.; Schneider, M.; Blaker, H.; Chang-Claude, J.; et al.Association of BMI and major molecular pathological markers of colorectal cancer in men and women. Am. J. Clin. Nutr. 2020,111, 562–569. [CrossRef] [PubMed]
29. Ehrlich, M. DNA hypermethylation in disease: Mechanisms and clinical relevance. Epigenetics 2019, 14, 1141–1163. [CrossRef][PubMed]
30. Zhou, M.; Zhang, L.; Yang, Q.; Yan, C.; Jiang, P.; Lan, Y.; Wang, J.; Tang, R.; He, M.; Lei, G.; et al. Age-related gene expression andDNA methylation changes in rhesus macaque. Genomics 2020, 112, 5147–5156. [CrossRef]
31. Tharakan, R.; Ubaida-Mohien, C.; Moore, A.Z.; Hernandez, D.; Tanaka, T.; Ferrucci, L. Blood DNA Methylation and Aging:A Cross-Sectional Analysis and Longitudinal Validation in the InCHIANTI Study. J. Gerontol. A Biol. Sci. Med. Sci. 2020, 75,2051–2055. [CrossRef]
32. Harris, C.J.; Davis, B.A.; Zweig, J.A.; Nevonen, K.A.; Quinn, J.F.; Carbone, L.; Gray, N.E. Age-Associated DNA MethylationPatterns Are Shared Between the Hippocampus and Peripheral Blood Cells. Front. Genet. 2020, 11, 111. [CrossRef]
33. Cheng, X.; Hashimoto, H.; Horton, J.R.; Zhang, X. Chapter 2—Mechanisms of DNA Methylation, Methyl-CpG Recognition, andDemethylation in Mammals. In Handbook of Epigenetics; Tollefsbol, T., Ed.; Academic Press: San Diego, CA, USA, 2011; pp. 9–24.[CrossRef]
34. Neidhart, M. DNA Methylation and Complex Human Disease; Academic Press: Oxford, MA, USA, 2016. [CrossRef]35. Brenet, F.; Moh, M.; Funk, P.; Feierstein, E.; Viale, A.; Socci, N.; Scandura, J. DNA Methylation of the First Exon Is Tightly Linked
to Transcriptional Silencing. PLoS ONE 2011, 6, e14524. [CrossRef]36. Dorman, J.S.; Schmella, M.J.; Wesmiller, S.W. Primer in Genetics and Genomics, Article 1: DNA, Genes, and Chromosomes. Biol.
Res. Nurs. 2016, 19, 7–17. [CrossRef] [PubMed]37. Du, X.; Han, L.; Guo, A.Y.; Zhao, Z. Features of methylation and gene expression in the promoter-associated CpG islands using
human methylome data. Comp. Funct. Genom. 2012, 2012, 598987. [CrossRef] [PubMed]38. Poduval, D.B.; Ognedal, E.; Sichmanova, Z.; Valen, E.; Iversen, G.T.; Minsaas, L.; Lønning, P.E.; Knappskog, S. Assessment of
tumor suppressor promoter methylation in healthy individuals. Clin. Epigenet. 2020, 12, 131. [CrossRef] [PubMed]39. Quan, Y.; Liang, F.; Wu, D.; Yao, X.; Hu, Z.; Zhu, Y.; Chen, Y.; Wu, A.; Tang, D.; Huang, B.; et al. Blood Cell DNA Methylation of
Aging-Related Ubiquitination Gene DZIP3 Can Predict the Onset of Early Stage Colorectal Cancer. Front. Oncol. 2020, 10, 544330.[CrossRef]
40. Jones, P.A.; Takai, D. The role of DNA methylation in mammalian epigenetics. Science 2001, 293, 1068–1070. [CrossRef]41. Ng, J.M.; Yu, J. Promoter hypermethylation of tumour suppressor genes as potential biomarkers in colorectal cancer. Int. J. Mol.
Sci. 2015, 16, 2472–2496. [CrossRef]42. Ross, J.P.; Rand, K.N.; Molloy, P.L. Hypomethylation of repeated DNA sequences in cancer. Epigenomics 2010, 2, 245–269.
[CrossRef]43. Suzuki, M.M.; Bird, A. DNA methylation landscapes: Provocative insights from epigenomics. Nat. Rev. Genet. 2008, 9, 465–476.
[CrossRef]44. Yin, A.; Etcheverry, A.; He, Y.; Aubry, M.; Barnholtz-Sloan, J.; Zhang, L.M.; Mao, X.; Chen, W.; Liu, B.; Zhang, W.; et al. Integrative
analysis of novel hypomethylation and gene expression signatures in glioblastomas. Oncotarget 2017, 8, 89607–89619. [CrossRef]

J. Pers. Med. 2022, 12, 660 11 of 13
45. Costello, J.F.; Plass, C. Methylation Matters. J. Med. Genet. 2001, 38, 285–303. [CrossRef]46. Society, A.C. Oncogenes and Tumor Suppressor Genes. Available online: https://www.cancer.org/cancer/cancer-causes/
genetics/genes-and-cancer/oncogenes-tumor-suppressor-genes.html (accessed on 3 January 2021).47. Charrier, C.; Joshi, K.; Coutinho-Budd, J.; Kim, J.E.; Lambert, N.; de Marchena, J.; Jin, W.L.; Vanderhaeghen, P.; Ghosh, A.;
Sassa, T.; et al. Inhibition of SRGAP2 function by its human-specific paralogs induces neoteny during spine maturation. Cell 2012,149, 923–935. [CrossRef] [PubMed]
48. NCBI. SRGAP2C: SLIT-ROBO Rho GTPase Activating Protein 2C [Homo sapiens]. Gene ID: 653464. Available online: https://www.ncbi.nlm.nih.gov/gene/653464 (accessed on 1 January 2020).
49. Schmidt, E.R.E.; Kupferman, J.V.; Stackmann, M.; Polleux, F. The human-specific paralogs SRGAP2B and SRGAP2C differentiallymodulate SRGAP2A-dependent synaptic development. Sci. Rep. 2019, 9, 18692. [CrossRef] [PubMed]
50. Chen, W.Y.; Zeng, T.; Wen, Y.C.; Yeh, H.L.; Jiang, K.C.; Chen, W.H.; Zhang, Q.; Huang, J.; Liu, Y.N. Androgen deprivation-inducedZBTB46-PTGS1 signaling promotes neuroendocrine differentiation of prostate cancer. Cancer. Lett. 2019, 440, 35–46. [CrossRef][PubMed]
51. NCBI. ZBTB46: Zinc Finger and BTB Domain Containing 46 [Homo sapiens]. Gene ID: 140685. Available online: https://www.ncbi.nlm.nih.gov/gene/140685 (accessed on 1 January 2020).
52. Satpathy, A.T.; Brown, R.A.; Gomulia, E.; Briseño, C.G.; Mumbach, M.R.; Pan, Z.; Murphy, K.M.; Natkunam, Y.; Chang, H.Y.;Kim, J. Expression of the transcription factor ZBTB46 distinguishes human histiocytic disorders of classical dendritic cell origin.Mod. Pathol. 2018, 31, 1479–1486. [CrossRef]
53. Kim, J.; Daniel, J.; Espejo, A.; Lake, A.; Krishna, M.; Xia, L.; Zhang, Y.; Bedford, M.T. Tudor, MBT and chromo domains gauge thedegree of lysine methylation. EMBO Rep. 2006, 7, 397–403. [CrossRef] [PubMed]
54. NCBI. HIST1H3I: H3 Clustered Histone 11 [Homo sapiens]. Gene ID: 8354. Available online: https://www.ncbi.nlm.nih.gov/gene/8354 (accessed on 1 January 2020).
55. Tagami, H.; Ray-Gallet, D.; Almouzni, G.; Nakatani, Y. Histone H3.1 and H3.3 complexes mediate nucleosome assembly pathwaysdependent or independent of DNA synthesis. Cell 2004, 116, 51–61. [CrossRef]
56. NCBI. HIST1H3D: H3 Clustered Histone 4 [Homo sapiens]. Gene ID: 8351. Available online: https://www.ncbi.nlm.nih.gov/gene/8351 (accessed on 1 January 2020).
57. Li, X.; Wang, W.; Wang, J.; Malovannaya, A.; Xi, Y.; Li, W.; Guerra, R.; Hawke, D.H.; Qin, J.; Chen, J. Proteomic analyses revealdistinct chromatin-associated and soluble transcription factor complexes. Mol. Syst. Biol. 2015, 11, 775. [CrossRef]
58. NCBI. NFATC4: Nuclear Factor of Activated T Cells 4 [Homo sapiens]. Gene ID: 4776. Available online: https://www.ncbi.nlm.nih.gov/gene/4776 (accessed on 1 January 2020).
59. Qin, X.; Wang, X.H.; Yang, Z.H.; Ding, L.H.; Xu, X.J.; Cheng, L.; Niu, C.; Sun, H.W.; Zhang, H.; Ye, Q.N. Repression of NFAT3transcriptional activity by estrogen receptors. Cell. Mol. Life Sci. CMLS 2008, 65, 2752–2762. [CrossRef]
60. Zhang, X.; Kang, T.; Zhang, L.; Tong, Y.; Ding, W.; Chen, S. NFATc3 mediates the sensitivity of gastric cancer cells to arsenicsulfide. Oncotarget 2017, 8, 52735–52745. [CrossRef]
61. Ding, W.J.; Zhou, M.; Chen, M.M.; Qu, C.Y. HOXB8 promotes tumor metastasis and the epithelial-mesenchymal transition viaZEB2 targets in gastric cancer. J. Cancer Res. Clin. Oncol. 2017, 143, 385–397. [CrossRef]
62. NCBI. HOXB8: Homeobox B8 [Homo sapiens]. Gene ID: 3218. Available online: https://www.ncbi.nlm.nih.gov/gene/3218(accessed on 1 January 2020).
63. Shen, S.; Pan, J.; Lu, X.; Chi, P. Role of miR-196 and its target gene HoxB8 in the development and proliferation of humancolorectal cancer and the impact of neoadjuvant chemotherapy with FOLFOX4 on their expression. Oncol. Lett. 2016, 12,4041–4047. [CrossRef] [PubMed]
64. Alzahrani, S.M.; Al Doghaither, H.A.; Al-Ghafari, A.B. General insight into cancer: An overview of colorectal cancer (Review).Mol. Clin. Oncol. 2021, 15, 271. [CrossRef] [PubMed]
65. Gutierrez, A.; Demond, H.; Brebi, P.; Ili, C.G. Novel Methylation Biomarkers for Colorectal Cancer Prognosis. Biomolecules 2021,11, 1722. [CrossRef] [PubMed]
66. Sobhani, I. DNA Methylation Is a Main Key for Bacteria-Related Colon Carcinogenesis. Microorganisms 2021, 9, 2574. [CrossRef]67. Maugeri, A.; Barchitta, M.; Magnano San Lio, R.; Favara, G.; La Mastra, C.; La Rosa, M.C.; Agodi, A. The Relationship between
Body Mass Index, Obesity, and LINE-1 Methylation: A Cross-Sectional Study on Women from Southern Italy. Dis. Markers 2021,2021, 9910878. [CrossRef]
68. Moreno-Ortiz, J.M.; Jiménez-García, J.; Gutiérrez-Angulo, M.; Ayala-Madrigal, M.L.; González-Mercado, A.; González-Villaseñor,C.O.; Flores-López, B.A.; Alvizo-Rodríguez, C.; Hernández-Sandoval, J.A.; Fernández-Galindo, M.A.; et al. High frequency ofMLH1 promoter methylation mediated by gender and age in colorectal tumors from Mexican patients. Gac. Med. Mex. 2021, 157,618–623. [CrossRef]
69. Khodadadi, E.; Fahmideh, L.; Khodadadi, E.; Dao, S.; Yousefi, M.; Taghizadeh, S.; Asgharzadeh, M.; Yousefi, B.; Kafil, H.S. CurrentAdvances in DNA Methylation Analysis Methods. BioMed. Res. Int. 2021, 2021, 8827516. [CrossRef]
70. Baharudin, R.; Ishak, M.; Muhamad Yusof, A.; Saidin, S.; Syafruddin, S.E.; Wan Mohamad Nazarie, W.F.; Lee, L.H.;Ab Mutalib, N.S. Epigenome-Wide DNA Methylation Profiling in Colorectal Cancer and Normal Adjacent Colon Using InfiniumHuman Methylation 450K. Diagnostics 2022, 12, 198. [CrossRef]

J. Pers. Med. 2022, 12, 660 12 of 13
71. Paweł, K.; Maria Małgorzata, S. CpG Island Methylator Phenotype-A Hope for the Future or a Road to Nowhere? Int. J. Mol. Sci.2022, 23, 830. [CrossRef]
72. Khoury, M.J.; Bowen, M.S.; Clyne, M.; Dotson, W.D.; Gwinn, M.L.; Green, R.F.; Kolor, K.; Rodriguez, J.L.; Wulf, A.; Yu, W. Frompublic health genomics to precision public health: A 20-year journey. Genet. Med. Off. J. Am. Coll. Med. Genet. 2018, 20, 574–582.[CrossRef]
73. Khoury, M.J. No Shortcuts on the Long Road to Evidence-Based Genomic Medicine. JAMA 2017, 318, 27–28. [CrossRef] [PubMed]74. Khoury, M.J. Precision Medicine vs Preventive Medicine. JAMA 2019, 321, 406. [CrossRef] [PubMed]75. Khoury, M.J.; Engelgau, M.; Chambers, D.A.; Mensah, G.A. Beyond Public Health Genomics: Can Big Data and Predictive
Analytics Deliver Precision Public Health? Public Health Genom. 2018, 21, 244–250. [CrossRef] [PubMed]76. Tomczak, K.; Czerwinska, P.; Wiznerowicz, M. The Cancer Genome Atlas (TCGA): An immeasurable source of knowledge.
Contemp. Oncol. 2015, 19, A68–A77. [CrossRef]77. Colaprico, A.; Silva, T.C.; Olsen, C.; Garofano, L.; Cava, C.; Garolini, D.; Sabedot, T.S.; Malta, T.M.; Pagnotta, S.M.;
Castiglioni, I.; et al. TCGAbiolinks: An R/Bioconductor package for integrative analysis of TCGA data. Nucleic Acids Res. 2016,44, e71. [CrossRef]
78. Liu, Y.; Qiu, P. Integrative analysis of methylation and gene expression data in TCGA. In Proceedings of the 2012 IEEE InternationalWorkshop on Genomic Signal Processing and Statistics (GENSIPS), Washington, DC, USA, 2–4 December 2012; pp. 1–4.
79. Silva, T.C.; Colaprico, A.; Olsen, C.; D’Angelo, F.; Bontempi, G.; Ceccarelli, M.; Noushmehr, H. TCGA Workflow: Analyze cancergenomics and epigenomics data using Bioconductor packages. F1000 Res. 2016, 5, 1542. [CrossRef]
80. Silva, T.C.; Colaprico, A.; Olsen, C.; Malta, T.M.; Bontempi, G.; Ceccarelli, M.; Berman, B.P.; Noushmehr, H. TCGAbiolinksGUI: Agraphical user interface to analyze cancer molecular and clinical data. F1000 Res. 2018, 7, 439. [CrossRef]
81. Babenko, V.N.; Chadaeva, I.V.; Orlov, Y.L. Genomic landscape of CpG rich elements in human. BMC Evol. Biol. 2017, 17, 19.[CrossRef]
82. Chen, J.J.; Wang, A.Q.; Chen, Q.Q. DNA methylation assay for colorectal carcinoma. Cancer Biol. Med. 2017, 14, 42–49. [CrossRef]83. Morris, T.J.; Beck, S. Analysis pipelines and packages for Infinium HumanMethylation450 BeadChip (450k) data. Methods 2015,
72, 3–8. [CrossRef]84. Sandoval, J.; Heyn, H.A.; Moran, S.; Serra-Musach, J.; Pujana, M.A.; Bibikova, M.; Esteller, M. Validation of a DNA methylation
microarray for 450,000 CpG sites in the human genome. Epigenetics 2011, 6, 692–702. [CrossRef]85. Ritchie, M.E.; Phipson, B.; Wu, D.; Hu, Y.; Law, C.W.; Shi, W.; Smyth, G.K. limma powers differential expression analyses for
RNA-sequencing and microarray studies. Nucleic. Acids Res. 2015, 43, e47. [CrossRef]86. Jaffe, A.E.; Murakami, P.; Lee, H.; Leek, J.T.; Fallin, M.D.; Feinberg, A.P.; Irizarry, R.A. Bump hunting to identify differentially
methylated regions in epigenetic epidemiology studies. Int. J. Epidemiol. 2012, 41, 200–209. [CrossRef] [PubMed]87. Lent, S.; Xu, H.; Wang, L.; Wang, Z.; Sarnowski, C.; Hivert, M.F.; Dupuis, J. Comparison of novel and existing methods for
detecting differentially methylated regions. BMC Genet. 2018, 19, 84. [CrossRef]88. Hibler, E.; Huang, L.; Andrade, J.; Spring, B. Impact of a diet and activity health promotion intervention on regional patterns of
DNA methylation. Clin. Epigenet. 2019, 11, 133. [CrossRef] [PubMed]89. Huang, G.; Cheng, W.; Xi, F. Integrated genomic and methylation profile analysis to identify candidate tumor marker genes in
patients with colorectal cancer. Oncol. Lett. 2019, 18, 4503–4514. [CrossRef] [PubMed]90. Slieker, R.; Bos, S.; Goeman, J.; Bovee, J.; Talens, R.; Breggen, R.; Suchiman, E.; Lameijer, E.; Putter, H.; van den Akker, E.; et al.
Identification and systematic annotation of tissue-specific differentially methylated regions using Illumina 450k chips. Epigenet.Chromatin 2013, 6, 26. [CrossRef]
91. Zhang, B.; Hong, X.; Ji, H.; Tang, W.Y.; Kimmel, M.; Ji, Y.; Pearson, C.; Zuckerman, B.; Surkan, P.J.; Wang, X. Maternal smokingduring pregnancy and cord blood DNA methylation: New insight on sex differences and effect modification by maternal folatelevels. Epigenetics 2018, 13, 505–518. [CrossRef]
92. Bamford, S.; Dawson, E.; Forbes, S.; Clements, J.; Pettett, R.; Dogan, A.; Flanagan, A.; Teague, J.; Futreal, P.A.; Stratton, M.R.; et al.The COSMIC (Catalogue of Somatic Mutations in Cancer) database and website. Br. J. Cancer 2004, 91, 355–358. [CrossRef]
93. Forbes, S.A.; Beare, D.; Boutselakis, H.; Bamford, S.; Bindal, N.; Tate, J.; Cole, C.G.; Ward, S.; Dawson, E.; Ponting, L.; et al.COSMIC: Somatic cancer genetics at high-resolution. Nucleic Acids Res. 2017, 45, D777–D783. [CrossRef]
94. Kent, W.J.; Sugnet, C.W.; Furey, T.S.; Roskin, K.M.; Pringle, T.H.; Zahler, A.M.; Haussler, D. The human genome browser at UCSC.Genome Res. 2002, 12, 996–1006. [CrossRef] [PubMed]
95. Huang, D.W.; Sherman, B.T.; Lempicki, R.A. Bioinformatics enrichment tools: Paths toward the comprehensive functional analysisof large gene lists. Nucleic Acids Res. 2009, 37, 1–13. [CrossRef] [PubMed]
96. Dasgupta, A.; Sun, Y.V.; König, I.R.; Bailey-Wilson, J.E.; Malley, J.D. Brief review of regression-based and machine learningmethods in genetic epidemiology: The Genetic Analysis Workshop 17 experience. Genet. Epidemiol. 2011, 35, S5–S11. [CrossRef][PubMed]
97. Grinberg, N.F.; Orhobor, O.I.; King, R.D. An evaluation of machine-learning for predicting phenotype: Studies in yeast, rice, andwheat. Mach Learn. 2020, 109, 251–277. [CrossRef]
98. Song, L.; Langfelder, P.; Horvath, S. Random generalized linear model: A highly accurate and interpretable ensemble predictor.BMC Bioinform. 2013, 14, 5. [CrossRef]

J. Pers. Med. 2022, 12, 660 13 of 13
99. Afzali, M.H.; Sunderland, M.; Stewart, S.; Masse, B.; Seguin, J.; Newton, N.; Teesson, M.; Conrod, P. Machine-learning predictionof adolescent alcohol use: A cross-study, cross-cultural validation. Addiction 2019, 114, 662–671. [CrossRef] [PubMed]
100. Ogutu, J.O.; Schulz-Streeck, T.; Piepho, H.P. Genomic selection using regularized linear regression models: Ridge regression,lasso, elastic net and their extensions. BMC Proc. 2012, 6, S10. [CrossRef]
101. Burnham, K.P.; Anderson, D.R. Multimodel Inference:Understanding AIC and BIC in Model Selection. Sociol. Methods Res. 2004,33, 261–304. [CrossRef]
102. Chase, E.C.; Boonstra, P.S. Accounting for established predictors with the multistep elastic net. Stat. Med. 2019, 38, 4534–4544.[CrossRef]
103. Waldmann, P.; Mészáros, G.; Gredler, B.; Fuerst, C.; Sölkner, J. Evaluation of the lasso and the elastic net in genome-wideassociation studies. Front. Genet. 2013, 4, 270. [CrossRef]
104. Xiao, J.; Ding, R.; Xu, X.; Guan, H.; Feng, X.; Sun, T.; Zhu, S.; Ye, Z. Comparison and development of machine learning tools in theprediction of chronic kidney disease progression. J. Transl. Med. 2019, 17, 119. [CrossRef] [PubMed]
105. Cui, Z.; Gong, G. The effect of machine learning regression algorithms and sample size on individualized behavioral predictionwith functional connectivity features. Neuroimage 2018, 178, 622–637. [CrossRef]
106. Kirpich, A.; Ainsworth, E.A.; Wedow, J.M.; Newman, J.R.B.; Michailidis, G.; McIntyre, L.M. Variable selection in omics data: Apractical evaluation of small sample sizes. PLoS ONE 2018, 13, e0197910. [CrossRef] [PubMed]
107. Wen, H.; Li, Y.; Xi, Y.; Jiang, S.; Stratton, S.; Peng, D.; Tanaka, K.; Ren, Y.; Xia, Z.; Wu, J.; et al. ZMYND11 links histone H3.3K36me3to transcription elongation and tumour suppression. Nature 2014, 508, 263–268. [CrossRef] [PubMed]
108. Li, S.; Lu, X.; Chi, P.; Pan, J. Identification of HOXB8 and KLK11 expression levels as potential biomarkers to predict the effects ofFOLFOX4 chemotherapy. Future Oncol. 2013, 9, 727–736. [CrossRef]
109. Wang, Z.; Song, J.; Milne, T.A.; Wang, G.G.; Li, H.; Allis, C.D.; Patel, D.J. Pro isomerization in MLL1 PHD3-bromo cassetteconnects H3K4me readout to CyP33 and HDAC-mediated repression. Cell 2010, 141, 1183–1194. [CrossRef] [PubMed]