Profiling of mitochondrial associated proteins from rat colon
20
Journal of Cellular Biochemistry 103:78–97 (2008) Profiling of Mitochondrial Associated Proteins From Rat Colon Sara Padidar, 1 Charles S. Bestwick, 1 Tim P. King, 1 Garry J. Rucklidge, 2 Gary J. Duncan, 2 Martin D. Reid, 2 and Janice E. Drew 1 * 1 Gut Health Division, Rowett Research Institute, Greenburn Road, Bucksburn, Aberdeen AB21 9SB, Scotland, UK 2 Proteomic Unit, Rowett Research Institute, Greenburn Road, Bucksburn, Aberdeen AB21 9SB, Scotland, UK Abstract Mitochondrial dysfunction, damage and mutations of mitochondrial proteins give rise to a range of ill understood patterns of disease. Although there is significant general knowledge of the proteins and the functional processes of the mitochondria, there is little knowledge of difference about how mitochondria respond and how they are regulated in different organs and tissues. Proteomic profiling of mitochondria and associated proteins involved in mitochondrial regulation and trafficking within cells and tissues has the potential to provide insights into mitochondrial dysfunction associated with many human diseases. The rat colon mitoproteome analysis presented here provides a useful tool to assist in identification and interpretation of mitochondrial dysfunction implicated in colon pathogenesis. 2DPAGE followed by LC/MS/MS was used to identify 430 proteins from mitochondrial enriched fractions prepared from rat colon, resulting in 195 different proteins or approximately 50% of the resolved proteins being identified as multiple protein expression forms. Proteins associated with the colon mitoproteome were involved in calcium binding, cell cycle, energy metabolism and electron transport chain, protein folding, protein synthesis and degradation, redox regulation, structural proteins, signalling and transporter and channel proteins. The mitochondrial associated proteins identified in this study of colon tissue complement and are compared with other recently published mitoproteome analyses from other organ tissues, and will assist in revealing potentially organ specific roles of the mitochondria and organ specific disease associated with mitochondrial dysfunction. J. Cell. Biochem. 103: 78 – 97, 2008. ß 2007 Wiley-Liss, Inc. Key words: organelle proteomics; electron transport chain; mitochondrial dysfunction; flow cytometry; transmission electron microscopy Mitochondria are intracellular double membrane-bound structures that regulate energy metabolism, cell division and cell death [Scheffler, 1999, 2001]. They utilize oxygen and produce ATP through carbohydrate and fatty acid metabolism, modulate ionic homeostasis and participate in numerous other catabolic and anabolic pathways. They play a central role in the cascade of events that lead to apoptosis [Mignotte and Vayssiere, 1998; van Loo et al., 2002]. Consequently mitochondrial dysfunc- tion, damage and mutations of mitochondrial proteins gives rise to a range of ill understood patterns of disease including cancer, type 2 diabetes, cardiovascular disease, Alzheimer’s and Parkinson’s disease [Brandon et al., 2006; Schapira, 2006]. Proteomic techniques have been commonly used to investigate cellular and tissue extracts limiting analysis to only the most abundant proteins, at the expense of subproteomes and less abundant proteins. The potential importance of less abundant proteins in disease processes thus requires a targeted approach to overcome such limitations. The application of ß 2007 Wiley-Liss, Inc. Abbreviations used: 2DPAGE, two-dimensional polyacryla- mide gel electrophoresis; MPEFs, multiple protein expres- sion forms; LC/MS/MS, liquid chromatography tandem mass spectrometry; MALDI-TOF MS, matrix-assisted laser desorption/ionisation time of flight mass spectrometry. Grant sponsor: The Scottish Executive Environment and Rural Affairs Department (SEERAD); Grant number: 6411. *Correspondence to: Janice E. Drew, Gut Health Division, Rowett Research Institute, Greenburn Road, Bucksburn, Aberdeen AB21 9SB, Scotland, UK. E-mail: [email protected] Received 1 February 2007; Accepted 29 March 2007 DOI 10.1002/jcb.21391
-
Upload
independent -
Category
Documents
-
view
1 -
download
0
Transcript of Profiling of mitochondrial associated proteins from rat colon
Journal of Cellular Biochemistry 103:78–97 (2008)
Profiling of Mitochondrial Associated ProteinsFrom Rat Colon
Sara Padidar,1 Charles S. Bestwick,1 Tim P. King,1 Garry J. Rucklidge,2 Gary J. Duncan,2
Martin D. Reid,2 and Janice E. Drew1*1Gut Health Division, Rowett Research Institute, Greenburn Road, Bucksburn,Aberdeen AB21 9SB, Scotland, UK2Proteomic Unit, Rowett Research Institute, Greenburn Road, Bucksburn,Aberdeen AB21 9SB, Scotland, UK
Abstract Mitochondrial dysfunction, damage and mutations of mitochondrial proteins give rise to a range of illunderstood patterns of disease. Although there is significant general knowledge of the proteins and the functionalprocesses of the mitochondria, there is little knowledge of difference about howmitochondria respond and how they areregulated in different organs and tissues. Proteomic profiling of mitochondria and associated proteins involved inmitochondrial regulation and trafficking within cells and tissues has the potential to provide insights into mitochondrialdysfunction associatedwithmany human diseases. The rat colonmitoproteome analysis presented here provides a usefultool to assist in identification and interpretation of mitochondrial dysfunction implicated in colon pathogenesis. 2DPAGEfollowed by LC/MS/MS was used to identify 430 proteins frommitochondrial enriched fractions prepared from rat colon,resulting in 195 different proteins or approximately 50% of the resolved proteins being identified as multiple proteinexpression forms. Proteins associated with the colon mitoproteome were involved in calcium binding, cell cycle, energymetabolism and electron transport chain, protein folding, protein synthesis and degradation, redox regulation, structuralproteins, signalling and transporter and channel proteins. Themitochondrial associated proteins identified in this study ofcolon tissue complement and are compared with other recently published mitoproteome analyses from other organtissues, and will assist in revealing potentially organ specific roles of the mitochondria and organ specific diseaseassociated with mitochondrial dysfunction. J. Cell. Biochem. 103: 78–97, 2008. � 2007 Wiley-Liss, Inc.
Key words: organelle proteomics; electron transport chain; mitochondrial dysfunction; flow cytometry; transmissionelectron microscopy
Mitochondria are intracellular doublemembrane-bound structures that regulateenergy metabolism, cell division and cell death[Scheffler, 1999, 2001]. They utilize oxygen andproduce ATP through carbohydrate and fatty
acid metabolism, modulate ionic homeostasisandparticipate innumerous other catabolic andanabolic pathways. They play a central role inthe cascade of events that lead to apoptosis[Mignotte and Vayssiere, 1998; van Loo et al.,2002]. Consequently mitochondrial dysfunc-tion, damage and mutations of mitochondrialproteins gives rise to a range of ill understoodpatterns of disease including cancer, type 2diabetes, cardiovascular disease, Alzheimer’sand Parkinson’s disease [Brandon et al., 2006;Schapira, 2006].
Proteomic techniques have been commonlyused to investigate cellular and tissue extractslimiting analysis to only the most abundantproteins, at the expense of subproteomesand less abundant proteins. The potentialimportance of less abundant proteins in diseaseprocesses thus requires a targeted approach toovercome such limitations. The application of
� 2007 Wiley-Liss, Inc.
Abbreviations used: 2DPAGE, two-dimensional polyacryla-mide gel electrophoresis; MPEFs, multiple protein expres-sion forms; LC/MS/MS, liquid chromatography tandemmass spectrometry; MALDI-TOFMS, matrix-assisted laserdesorption/ionisation time of flight mass spectrometry.
Grant sponsor: The Scottish Executive Environment andRural Affairs Department (SEERAD); Grant number: 6411.
*Correspondence to: Janice E. Drew, Gut Health Division,Rowett Research Institute, Greenburn Road, Bucksburn,Aberdeen AB21 9SB, Scotland, UK.E-mail: [email protected]
Received 1 February 2007; Accepted 29 March 2007
DOI 10.1002/jcb.21391
organelle proteomics is thus a potentiallypowerful method to discover proteins involvedin specific cellular functions or disease pro-cesses and reduce sample complexity. Althoughthere is significant general knowledge of theproteins and the functional processes of themitochondria, there is little knowledge ofdifferences in how the mitochondria respondand how they are regulated in different organsand tissues. Different mammalian organ tis-sues have distinct energy needs and the numberof mitochondria per cell, structure and functionvary widely independently of the tissues’respiratory needs [Fawcett, 1981; Scheffler,1999; Mannella, 2006]. Much of our under-standing of the eukaryotic mitochondrion andits proteome has been carried out on mito-chondria extracted from heart [Taylor et al.,2003; Gaucher et al., 2004; Kiri et al., 2005;Forner et al., 2006; Hunzinger et al., 2006;Kim et al., 2006; Reifschneider et al.,2006], brain [Reifschneider et al., 2006], kidney[Forner et al., 2006; Reifschneider et al., 2006],liver [Forner et al., 2006; Miller et al., 2006;Reifschneider et al., 2006], skeletal muscle[Forner et al., 2006; Reifschneider et al., 2006]and neural chondrocytes [Ruiz-Romero et al.,2006].Recent investigations into inflammatory
bowel disease have found changes to colon andileal epithelial mitochondrial ultra structure[Soderholm et al., 2002; Nazli et al., 2004;Farhadi et al., 2005]. Studies investigatingcolon pathologies using proteomics approacheshave revealed changes to mitochondrial pro-teins in response to inflammation and disease[Cole et al., 2002; Drew et al., 2005a, 2006a;Mazzanti and Giulivi, 2006; Mazzanti et al.,2006]. Many in vitro and in vivo studiesimplicatemitochondria in colon cancer progres-sion [Rana et al., 1980; Sun et al., 1981;Pleshkwych et al., 1983; Oseroff, 1986; Mod-ica-Napolitano et al., 1989; Mancini et al., 1997;Tutton and Barkla, 1997; Heerdt et al., 1998; Liet al., 1999; Cuezva et al., 2002; Ruemmeleet al., 2003; Isidoro et al., 2004; Lakshman et al.,2004; Wang and MacNaughton, 2005]. Despitethese numerous studies implicating mitochon-dria in colon pathology, none have focused oncharacterising the colon mitochondrial pro-teome. Since rat models are commonly used tostudy colon pathologies [Corpet and Parnaud,1999; Drew et al., 2005a,b, 2006a;Mazzon et al.,2005; Yuki et al., 2006] this study was initiated
to profile mitochondrial enriched fractionsextracted from rat colon.
METHODS
Preparation of Mitochondrial Enriched Fractions
Sprague Dawley male rats weighing between515 and 580 g were fed ad libitum on Chow forRat and Mouse, CRM (Special Diet ServicesLtd., Witham, Essex, UK) prior to sacrifice withcarbon dioxide and cervical dislocation. Colonswere excised and flushed with ice-cold 250 mMsucrose/10mM Tris (pH 7.4) buffer. A 2 cmsegmentwas dissected from themid-point of thedistal two thirds of the colon for mitochondrialextraction as described below.
Mitochondrial enriched extracts were pre-pared using a mitochondrial isolation kit(MITO-ISO1, Sigma, UK) according to themanufacturers instructions. Briefly, tissueswere minced and disrupted using an ultra-turrax T25 (IKA) at 17,500 rpm, in buffer A(10 mM HEPES, pH 7.5, containing 200 mMmannitol, 70 mM sucrose, and 1 mM EGTA)supplied with the kit. Large cellular debris andnuclei were pelleted by centrifuging for 5min at600g, at 48C. Mitochondria were pelleted bycentrifuging the supernatant for 10 min at11,000g. The pellet was resuspended in 500 mlof extraction buffer A and the centrifugationsteps at 600 and 11,000g were repeated. Theresulting mitochondrial enriched fraction wasthen resuspended in storage buffer (10 mMHEPES, pH 7.4, containing 250 mM sucrose,1 mM ATP, 0.08 mM ADP, 5 mM sodiumsuccinate, 2 mM K2HPO4, and 1 mM DTT).Aliquots were extracted for protein estimationby BioRad Bradford Protein Assay, 2D pageanalysis and flow cytometric analysis. Alterna-tively, pelletswere fixed in 2.5%glutaraldehydein 0.1 M sodium cacodylate buffer (pH 7.3) fortransmission electron microscopy (TEM). Ali-quots for flow cytometrywere used immediatelyto assess inner membrane integrity by JC-1staining assay and aliquots for 2Dpage analysiswere snap frozen and stored at �808C untilrequired.
Flow Cytometric Analysis of MitochondrialEnriched Fractions
The enriched mitochondrial extracts weretested for inner membrane integrity usingthe JC-1 stain supplied with MITO-ISO1 kitaccording to the manufacturers instructions
Rat Colon Mitochondrial Associated Proteins 79

(Sigma, UK). Briefly, 20 mg of protein was usedper 1 ml of JC-1 assay buffer (20 mM MOPS,pH 7.5, containing 110 mM KCl, 10 mM ATP,10 mM MgCl2, 10 mM sodium succinate, and1 mM EGTA) containing 1 ml of JC-1 stain inDMSO. Samples were analysed using a FACSCalibur Flowcytometer G4 (Becton Dickinson,NJ) at flow rate of 35 ml/min, measuring10,000 events using FL-1 voltage 650 and FL-2voltage 557, both in logarithmic mode. Thegreen FL-1 and orange FL-2 filters were usedto detect JC-1 aggregates. One micromoleof carbonyl cyanide 3-chlorophenylhydrazone(CCCP) in DMSO, a powerful and selectivemitochondrial uncoupling agent that destroysthe inner membrane potential was added forcomparison. Data was analysed using CELL-Quest software version 3.3 (Becton-Dickinson).During data analysis intact mitochondria wereidentified with a decrease in FL-2 and anincrease in FL-1 signal.
Transmission Electron Microscopic Analysis ofMitochondrial Enriched Fractions
Mitochondrial enriched fractions wereinitially fixed in 2.5% glutaraldehyde in 0.1 Msodium cacodylate buffer pH 7.4. The fractionswere thenwashed in the cacodylate buffer, post-fixed for 1 h at room temperature in 1% osmiumtetroxide in 0.1 M sodium cacodylate bufferpH7.4,washedagain in thebuffer and embeddedin 1% agar. The agar-embedded pellet wasdehydrated in a 50%, 70%, 90% and 100%ethanol series, cleared in propylene oxide andembedded in araldite resin CY212 (Agar Scien-tific, Stansted,UK).Ultra thin sectionswere cutusing aReichertmicrotome (Leica,UK), stainedwith uranyl acetate and lead citrate andexamined in a JEOL 1200 EXB electron micro-scope (JEOL, UK) operating at 80 kV.
2D PAGE of Mitochondrial Enriched Fractions
Mitochondrial enriched protein extracts(290 mg) were loaded onto BioRad IPG strips(17 cm, pH 3–10) in 340 ml of 7 M urea, 2 Mthiourea, 4%Chaps, 2%biolyte (BioRad) and3%DTT buffer to separate the proteins in the firstdimension. A second dimension SDS-PAGEstep was run on an 18 cm� 18 cm linear SDSpolyacrylamide gradient as described pre-viously [Drew et al., 2005a]. The gels were thenstained with colloidal Coomassie Blue stainingas described by Anderson [1991]. Gels (n¼ 4)were then rinsed in deionised water and
brushed to remove particulate Coomassie Blueand imaged on a BioRad GS710 flat bed imagerfollowed by image analysis using BioRad PDQuest Version 7.1.1. The gel with highest spotnumber and quality was selected as the matchset standard. A total of 430 spots were matchedon all four gels and were cut out for trypsindigestion and identification by LC/MS/MS.
Protein Identification by Nano-LC/MS/MS
Spots cut from 2D PAGE gels were analysedusing a nano-LC system (LC Packings, Cam-berly, Surrey, UK) consisting of an ‘Ultimate’nano-LC system, pumping at 0.187ml/minwitha 625 splitter giving a column flow rate of 0.3 ml/min, a ‘Famos’ autosampler set to an injectionvolume of 5 ml and a ‘Switchos’ microcolumnswitching device. The nanocolumn was a C18PepMap100, 15 cm� 75mmi.d., 3mm,100 A (LCPackings). HPLC grade solvents were used, 2%acetonitrile and 0.1% formic acid (A) and 80%acetonitrile and 0.08% formic acid (B). Thegradient started at 5% B, going to 50% B over30 min, then ramping to 80% B over a further2 min, and holding for 10 min. The system wasequilibrated at 95%A for 9min prior to injectionof subsequent samples. The solvent used by the‘Switchos’ is 0.1% formic acid. The switchingdevice was switched on after 3 min and offafter 58 min. The flow rate of the Switchos was0.03 ml/min. Mass spectrometry was thenperformed using a Q-Trap (Applied Biosys-tems/MDS Sciex, Warrington, UK) triple quad-rupole fitted with a nanospray ion source usingparameters asdescribedpreviously [Drewet al.,2005a]. Proteins were identified from the ratdatabase, using Mascot, with individual ionscores >28 indicating identity or extensivehomology (P< 0.05). The mouse database wassearched where no significant match was madeusing the rat database. Identified proteins werethen researched using SOURCE at BioInfor-matic Harvester (http://harvester.embl.de/),and PSORT II (http://psort.ims.u-tokyo.ac.jp/form2.html) databases to identify their origin.Index of hydophobicity was calculated using theprotein grand average of hydropathy index[Kyte and Doolittle, 1982] (http://bioinformatics.org/sms2/protein_gravy.html). Proteins ID’swere compared with published mitoproteomesof Reifschneider et al. [2006], Forner et al.[2006] and Taylor et al. [2003]. Protein ID’swere BLAST searched to identify homologousproteins.
80 Padidar et al.

RESULTS
Flow Cytometric Analysis of MitochondrialEnriched Fractions
Mitochondria enriched protein extracts wereassessed for inner membrane integrity usingJC-1 assay. Extracts were found to have intactinner membrane integrity (Fig. 1A) with aloss of FL-2 upon CCCP challenge (Fig. 1C),but not with DMSO (Fig. 1B). Cytosolicfractions (Fig. 1D) did not change in fluores-cence with either DMSO (Fig. 1E) or CCCP(Fig. 1F) addition, indicating the absence ofmitochondria.
Transmission Electron Microscopic Analysis ofMitochondrial Enriched Fractions
Transmission electronmicroscopy (TEM)wasused to further confirm the presence ofintact mitochondria in extract (Fig. 2), ascharacterised by a double membrane andcristae. Rough endoplasmic reticulum, as char-acterised by ribosome-richmembranes was alsoidentified as a component of the mitochondrialenriched fractions indicative of the intimate
relationship of mitochondria with theseintracellular structures.
Proteomic Analysis of MitochondrialEnriched Fractions
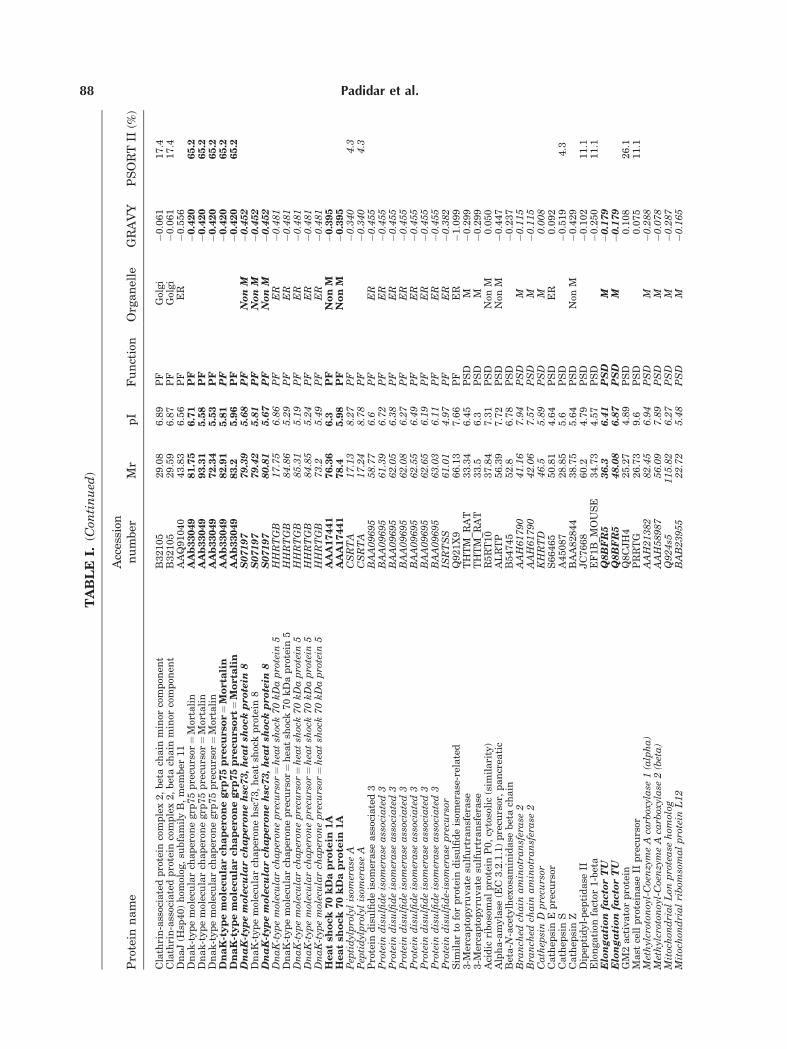
Four hundred and thirty spots (Mr 9.75–151.03, pI 4.03–9.6) were matched on all fourgels (Fig. 3). A total of 430 proteins wereidentified by LC/MS/MS, yielding 195 differentproteins categorised into 11 functional groups(Table I andFig. 4). Proteins associatedwith thecolon mitochondria were distributed over a pIrange of 4.03–9.6 and a mass range between12.35 and 151.03. Fifty-eight percent of theresolved and identified proteins were recog-nised as mitochondrial using SOURCE data-base in the BioInformatic Harvester searchengine which uses updated gene and proteindatabases to attribute information on cellularlocalisationand function.This identified101dif-ferent mitochondrial associated proteins (pI4.22–9.6, Mr 13.58–126.76). Proteins notrecognised as mitochondrial by BioInformaticHarvester were analysed by PSORT II, whichpredicts the sub-cellular localisation sites of
Fig. 1. Flowcytometric analysis ofmitochondrial enriched fractions.A,C: Loss of FL-2height and increasedFL-1 height indicates loss of mitochondrial inner membrane integrity with CCCP (in DMSO) challenge, butnot withDMSO (B). Cytosolic fractions do not changewith either DMSO (E) or CCCP (F) addition, indicatingthe absence of mitochondria in the cytosolic fraction (D).
Rat Colon Mitochondrial Associated Proteins 81

proteins from recognition of mitochondrialtargeting signals in the amino acid sequences[Nakai and Horton, 1999] by employing thediscriminate analysis ‘‘MITDISC’’. Percentages
depict the predicted percentage probability aprotein is mitochondrial using the k-nearestneighbour (k-NN) algorithm [Horton andNakai, 1997]. The probability assigned byPSORT II that a protein was localised tomitochondria is cited in Table I. Comparison ofthe proteins associatedwith the colonmitochon-dria with published mitoproteomes from otherrat organs, kidney, liver, heart, brain andskeletal muscle [Forner et al., 2006; Reifschnei-der et al., 2006], revealed both common andunique proteins (Fig. 5). Ten proteins (5%) werecommon to other published rat mitoproteomesonly (Fig. 5), 54 proteins (28%) were commonwith publishedhumanheartmitoproteome only[Taylor et al., 2003; Gaucher et al., 2004] and 62proteins (32%) were common to both publishedrat organ and human heart mitoproteomes[Taylor et al., 2003; Gaucher et al., 2004; Forneret al., 2006; Reifschneider et al., 2006] resultingin 69 proteins novel to the colon mitoproteome(Fig. 5). Proteins common to previously profiledrat and human heart mitoproteomes werelargely proteins involved in energy metabolismand oxidative phosphorylation, 61% and 50%,respectively. Novel mitochondrial associatedproteins of the colon were mainly structuralproteins such as cytokeratin 8 and thoseinvolved in protein synthesis and degradation,for example GM2 activator protein. Theseproteins although not classically associatedwith the mitochondria, still received highPSORT II predicted percentages, for examplecytokeratin 8 at 78.3% (Table I). This proteinwas found to have 12 MPEFs in the colonmitoproteome and has been previously asso-ciated with the normal functioning of the colon[Toivola et al., 2004). Twenty-three proteins(mass 9.75–131.03 kDa and pI 3.7–9.34) werenot identified by LC/MS/MS (Table I). Profileof the GRAVY values (Fig. 6) indicated thepresence of many membrane proteins (highGRAVY index) but most proteins were notassociated with membranes.
DISCUSSION
There is already considerable informationknownabout the important role ofmitochondriain regulation of apoptotic responses, energymetabolism and electron transfer. However,advances in application of proteomic analysisis now revealing further insights into themitoproteome yielding significant tissue and
Fig. 2. Transmission electron microscopic image of mitochon-drial enriched fractions.Mitochondria characterised by a doublemembrane and cristae.
Fig. 3. Proteomic analysis of mitochondrial enriched fractions.2D PAGE Coomassie Blue stained gel of colon mitochondrialenriched fractions generated over 430 spots common to fourbiological replicates (pI 4.03–9.6, Mr 9.75–151.03). Spots weretrypsin digested and identified using LC/MS/MS.
82 Padidar et al.

TABLE
I.FourHundredandThirty
Protein
sId
entifiedFrom
Two-D
imensionalGelElectrophoresisofMitochondrialEnriched
Protein
FractionsUsingLC/M
S/M
S
Protein
name
Accession
number
Mr
pI
Function
Organelle
GRAVY
PSORTII
(%)
Annexin
A2¼LipocortinII¼Calpactin
Ihea
vych
ain
ANX2_R
AT
35.7
7.97
CB
�0.533
21.7
Annexin
A2¼LipocortinII¼Calpactin
Ihea
vych
ain
ANX2_R
AT
36.02
7.34
CB
�0.533
21.7
Annexin
A2¼LipocortinII¼Calpactin
Ihea
vych
ain
ANX2_R
AT
36.26
8.29
CB
�0.533
21.7
Annexin
A4¼LipocortinIV
ANX4_R
AT
35.13
5.66
CB
�0.430
8.7
Annexin
vmutant¼LipocortinV
LURT5
34.14
5.18
CB
�0.329
4.3
Calcium
bindingprotein
I55472
67.2
5.26
CB
Golgi
�1.022
22.2
Calcium
bindingprotein
I55472
68.04
5.18
CB
Golgi
�1.022
22.2
Calpactin
Ilightch
ain
S100_R
AT
12.35
6.91
CB
�0.319
26.1
Calpactin
Ilightch
ain
S100_R
AT
13.86
4.92
CB
�0.319
26.1
Aden
ylate
kinase
2¼ATP-A
MPtransp
hosphorylase
AAH61727
30.17
7.92
CellCycle
M�0.385
HistoneH2A.1
H2A1_R
AT
15.69
7.9
CellCycle
�0.472
21.7
HistoneH2A.1
H2A1_R
AT
15.94
7.76
CellCycle
�0.472
21.7
HistoneH4
S03427
15.57
5.32
CellCycle
�0.545
8.7
Pro
hibitin
A39682
30.53
6.37
CellCyc
leM
0.009
Pro
hibitin
A39682
30.59
6.97
CellCyc
leM
0.009
Pro
hibitin
A39682
30.69
6.28
CellCyc
leM
0.009
Pro
hibitin
A39682
30.86
5.96
CellCyc
leM
0.009
Pro
hibitin
A39682
31.19
6.17
CellCyc
leM
0.009
Pro
hibitin
A39682
31.4
5.76
CellCyc
leM
0.009
Sim
ilarto
SEPTIN
6typeII
Q8C1B7
52.34
7.14
CellCycle
�0.703
8.7
2-E
noyl-coahyd
rata
sechain
A/B
S06447
29.47
7.01
EM
M�0.147
2-E
noyl-coahyd
rata
sechain
A/B
S06447
29.63
7.16
EM
M�0.147
2-E
noyl-coahyd
rata
sechain
A/B
S06447
29.96
6.65
EM
M�0.147
3-H
ydroxybutyra
tedeh
ydrogen
ase
precu
rsor
A42345
31.37
9.22
EM
M�0.242
3-H
ydroxyisob
utyra
tedeh
ydrogen
ase,mitochon
drialprecu
rsor
A32867
32.78
6.56
EM
M0.031
3-O
xoacidCoA
transferase
1Q9CV92
60.05
7.3
EM
M�0.106
4-Trimethylaminob
utyraldeh
ydedeh
ydrogen
ase
Q9JLJ3
53.95
6.88
EM
�0.065
8.7
Acetyl-CoA
C-acetyltransferase
precu
rsor,mitochon
drial
XXRTAC
42.86
9.11
EM
M0.086
Acetyl-C
oA
C-acetyltransfer
ase
pre
cursor,
mitochondrial
XXRTAC
43.07
8.99
EM
M0.086
Acetyl-C
oA
C-acetyltransfer
ase
pre
cursor,
mitochondrial
XXRTAC
43.36
8.68
EM
M0.086
Acetyl-CoA
C-acyltransferase
mitochon
drial
XXRTAC
44.22
9.18
EM
M0.086
Acetyl-CoA
C-acyltra
nsferase
mitochon
drial
XXRTAC
44.67
9.1
EM
M0.086
Aconitase
2¼Mitochon
drialaconitase
precu
rsor
Q9ER34
88.97
7.15
EM
M�0.355
Aconitase
2¼Mitochon
drialaconitase
precu
rsor
Q9ER34
93.6
7.58
EM
M�0.355
Aconitase
2¼Mitochon
drialaconitase
precu
rsor
Q9ER34
93.9
7.75
EM
M�0.355
Aconitase
2¼Mitochondrialaconitase
pre
cursor
Q9ER34
88.93
7.25
EM
M�0.355
Aconitase
hydrase
¼aconitase
2AAH61999
88.57
7.38
EM
�0.154
30.4
Aconitase
hyd
rase
¼aconitase
2AAH61999
92.7
7.9
EM
�0.154
30.4
Aconitase
hydrase
¼aconitase
2AAH61999
92.86
7.95
EM
�0.154
30.4
Aconitase
hyd
rase
¼aconitase
2AAH61999
94.02
7.8
EM
�0.154
30.4
Acyl-CoA
dehydrogenase
precurso
r,mediu
m-chain
-specifi
c,mitochondrial
DERTCM
43.74
7.12
EM
M�0.297
Acyl-CoA
dehydrogenase
precurso
r,mediu
m-chain
-specifi
c,mitochondrial
DERTCM
44.13
7.97
EM
M�0.297
Acyl-C
oA
deh
ydro
gen
ase
ver
y-long-chain
-spec
ificpre
cursor
A54872
69.12
8.28
EM
M�0.111
Acyl-C
oA
deh
ydro
gen
ase,sh
ort-chain
spec
ific,mitochondrialpre
cursor
B34252
42.06
7.79
EM
M�0.146
Acyl-C
oA
deh
ydro
gen
ase,sh
ort-chain
spec
ific,mitochondrialpre
cursor
B34252
42.25
7.15
EM
M�0.146
Acyl-C
oA
deh
ydro
gen
ase,sh
ort-chain
spec
ific,mitochondrialpre
cursor
B34252
42.34
7.34
EM
M�0.146
Acyl-C
oA
deh
ydro
gen
ase,sh
ort-chain
spec
ific,mitochondrialpre
cursor
B34252
42.39
6.98
EM
M�0.146
Acyl-C
oA
deh
ydro
gen
ase,sh
ort-chain
spec
ific,mitochondrialpre
cursor
B34252
42.65
6.7
EM
M�0.146
Acyl-CoA
synthetase
short-ch
ain
familymem
ber
1BAC40232
84.9
6.58
EM
M�0.120
(Con
tinued
)
Rat Colon Mitochondrial Associated Proteins 83

Ald
ehydedehydrogenase
2Q91Zd7
55.73
6.84
EM
M�0.111
Ald
ehydedehydrogenase
2Q91Zd7
56.78
6.4
EM
M�0.111
Ald
ehyd
edeh
ydro
gen
ase
2Q91Zd7
56.87
6.23
EM
M�0.111
Ald
ehyd
edeh
ydro
gen
ase
2(M
itochondrial)
Q8K3V8
57.61
6.1
EM
M�0.155
Ald
ehyd
edeh
ydro
gen
ase
2,Mitochondrial(F
ragmen
t)Q6Q289_R
AT
59.45
6.12
EM
M�0.160
Alphaen
olase
ENOA_R
AT
53.74
6.59
EM
�0.198
13.0
Alphaglucosidase
2Q8BHN3
117.82
6.08
EM
ER
�0.325
33.3
Carn
itineO-palm
itoy
ltransferase
IIprecu
rsor,mitochon
drial
A35447
55.97
5.04
EM
M�0.295
Carn
itin
eO-palm
itoyltransfer
ase
IIpre
cursor,
mitochondrial
A35447
73.79
7.19
EM
M�0.295
Coenzy
meQ5hom
olog
,methyltransferase
Q9D6Y6
30.3
8.35
EM
�0.382
69.6
Cre
atinekin
ase
pre
cursor,
mitochondrial
Q5BJT9_R
AT
45.66
7.58
EM
M�0.411
Cre
atinekin
ase
pre
cursor,
mitochondrial
S17189
44.08
7.79
EM
M�0.422
Cre
atinekin
ase
pre
cursor,
mitochondrial
S17189
44.51
8.09
EM
M�0.422
Cre
atinekin
ase
pre
cursor,
mitochondrial
S17189
44.55
7.55
EM
M�0.422
Cre
atinekin
ase
pre
cursor,
mitochondrial
S17189
46.3
8.07
EM
M�0.422
Dienoyl-coaisom
erase
probable
peroxisom
alen
oyl-coahyd
ratase
1DCIA
33.85
6.84
EM
M�0.059
D-Lactate
deh
ydrogen
ase
Q7TNG8
51.67
6.83
EM
M�0.127
Electrontransfer
flavop
rotein
alphach
ain
precu
rsor
A31568
33.13
7.61
EM
M0.120
Electrontransferringflavop
rotein,betapolyp
eptide
Q810V3
29.36
8.03
EM
M�0.091
Electron-tra
nsferring-flavop
rotein
deh
ydrogen
ase
AAQ67364
68.86
7.17
EM
M�0.311
Electron-tra
nsferring-flavop
rotein
deh
ydrogen
ase
AAQ67364
69.11
7.06
EM
M�0.311
Fla
vopro
tein
subunit
ofsu
ccin
ate-u
biq
uin
onere
ducta
seQ920L2
76.24
6.42
EM
M�0.254
Fla
vopro
tein
subunit
ofsu
ccin
ate-u
biq
uin
onere
ducta
seQ920L2
76.33
6.59
EM
M�0.254
Fla
vopro
tein
subunit
ofsu
ccin
ate-u
biq
uin
onere
ducta
seQ920L2
76.36
6.51
EM
M�0.254
Fru
ctose-bisphosp
hate
ald
ola
seA
ADRTA
41.33
8.42
EM
M�0.279
Fru
ctose-bisphosp
hate
ald
ola
seA
ADRTA
39.24
9.17
EM
M�0.279
Fru
ctose-bisphosp
hate
ald
ola
seA
ADRTA
39.36
8.9
EM
M�0.279
Fru
ctose-bisphosp
hate
ald
ola
seA
ADRTA
40.37
8.91
EM
M�0.279
Fumara
tehyd
rata
sepre
cursor,
mitochondrial
UFRT
46.36
8.94
EM
M�0.090
Fumara
tehyd
rata
sepre
cursor,
mitochondrial
UFRT
46.8
8.55
EM
M�0.090
Fumara
tehyd
rata
sepre
cursor,
mitochondrial
UFRT
47.34
8.16
EM
M�0.090
Glu
tamate
deh
ydro
gen
ase
[NAD(P
)]pre
cursor
S03707
48.76
8.05
EM
M�0.306
Glu
tamate
deh
ydro
gen
ase
[NAD(P
)]pre
cursor
S03707
54.33
7.44
EM
M�0.306
Glu
tamate
deh
ydro
gen
ase
[NAD(P
)]pre
cursor
S03707
54.64
7.23
EM
M�0.306
Glu
tamate
deh
ydro
gen
ase
[NAD(P
)]pre
cursor
S03707
54.64
7.71
EM
M�0.306
Glycer
ald
ehyd
e-3-phosp
hate
deh
ydro
gen
ase
(phosp
hory
lating)
DERTG
36.17
8.76
EM
�0.084
8.7
Glycerol-3-phosphate
deh
ydrogen
ase
mitochon
drialprecu
rsor
A54051
78.36
6.42
EM
M�0.195
Hydroxymeth
ylglu
taryl-CoA
synth
ase
precurso
rA35865
25.9
4.63
EM
M�0.360
Hyd
roxym
ethylglu
tary
l-CoA
synth
ase
pre
cursor
A35865
47.62
8.7
EM
M�0.360
Hyd
roxym
ethylglu
tary
l-CoA
synth
ase
pre
cursor
A35865
47.63
8.78
EM
M�0.360
Hyd
roxym
ethylglu
tary
l-CoA
synth
ase
pre
cursor
A35865
47.95
8.5
EM
M�0.360
Hyd
roxym
ethylglu
tary
l-CoA
synth
ase
pre
cursor
A35865
48.07
8.4
EM
M�0.360
Isocitra
tedeh
ydro
gen
ase
[NAD]su
bunit
alp
hamitochondrial
pre
cursor¼isocitra
tedeh
ydro
gen
ase
3alp
ha
Q99NA5
42.74
6.13
EM
M�0.397
Isocitra
tedeh
ydro
gen
ase
[NAD]su
bunit
alp
hamitochondrial
pre
cursor¼isocitra
tedeh
ydro
gen
ase
3alp
ha
Q99NA5
41.92
6.71
EM
M�0.397
Isocitra
tedeh
ydro
gen
ase
[NAD]su
bunit
alp
hamitochondrial
pre
cursor¼isocitra
tedeh
ydro
gen
ase
3alp
ha
Q99NA5
42.65
6.7
EM
M�0.397
Isocitra
tedeh
ydro
gen
ase
[NAD]su
bunit
alp
ha,mitochondrial
pre
cursor¼isocitra
tedeh
ydro
gen
ase
3alp
ha
Q99NA5
43.69
5.98
EM
M�0.073
TABLE
I.(C
ontinued
)
Protein
name
Accession
number
Mr
pI
Function
Organelle
GRAVY
PSORTII
(%)
84 Padidar et al.

Isocitra
tedeh
ydro
gen
ase
2Q8C2R9
44.9
8.88
EM
M�0.398
Isocitra
tedeh
ydro
gen
ase
2Q8C2R9
45.22
8.63
EM
M�0.398
isocitra
tedeh
ydro
gen
ase
2(N
ADPþsp
ecifi
c)
Q9EQK1
26.14
7.85
EM
M�0.400
Isocitra
tedeh
ydrogen
ase
3(N
ADþ)betaTumor-relatedprotein
Q91VA7
42.92
8.51
EM
M�0.132
Isov
aleryl-CoA
deh
ydrogen
ase
precu
rsor
C34252
44.91
6.6
EM
M�0.113
Isov
aleryl-CoA
deh
ydrogen
ase
precu
rsor
C34252
45.45
6.4
EM
M�0.113
L-L
acta
tedeh
ydro
gen
ase
chain
AA23083
34.37
8.96
EM
0.064
22.2
L-L
acta
tedehydrogenase
chain
AA23083
34.43
8.87
EM
0.064
22.2
Long-chain
-acyl-CoA
dehydrogenase
precurso
rA34252
44.59
6.96
EM
M�0.223
Long-chain
-acyl-CoA
dehydrogenase
precurso
rA34252
44.89
7.28
EM
M�0.223
Long-chain
-acyl-CoA
dehydrogenase
precurso
rA34252
45.51
6.92
EM
M�0.223
Lon
g-chain-acyl-CoA
deh
ydrogen
ase
precu
rsor
A34252
46.1
6.78
EM
M�0.223
Long-chain
-acyl-CoA
dehydrogenase
precurso
rA34252
46.15
6.93
EM
M�0.223
Mala
tedeh
ydro
gen
ase
2AAH63165
35.07
9.54
EM
M0.119
Mala
tedeh
ydro
gen
ase
2(p
recursor,
mitochondrial)
DERTMM
36.07
9.17
EM
M0.121
Methylm
alonate-sem
ialdeh
ydedeh
ydrogen
ase,family6
A44097
58
8.13
EM
M�0.048
Methylm
alonate-sem
ialdeh
ydedeh
ydrogen
ase,family6
A44097
59.58
7.76
EM
M�0.048
Methylmalonyl
CoA
epim
erase
Q9D1I5
16.15
7.41
EM
M0.055
Mitochon
drialacyl-CoA
thioestera
se1
CAA70513
46.21
7.12
EM
M�0.172
Mitochon
drialacyl-CoA
thioestera
se1
CAA70513
47.2
7.12
EM
M�0.172
NADH-u
biq
uin
oneoxid
ore
ducta
se75kDasu
bunit
Q8BM16
92.7
5.67
EM
M�0.120
NADH-u
biq
uin
oneoxid
ore
ducta
se75kDasu
bunit
Q8BM16
92.73
5.62
EM
M�0.120
Nucleoside-dip
hosp
hate
kin
ase
pre
cursor
A38369
19.14
7.37
EM
M�0.270
Ornithin
e-oxo-acid
transa
min
ase
precurso
rXNRTO
49.98
6.65
EM
M�0.113
Ornithin
e-oxo-acid
transa
min
ase
precurso
rXNRTO
50.29
6.48
EM
M�0.113
Oxoglu
tara
tedeh
ydro
gen
ase
(lip
oamid
e)¼Ogdhpro
tein
Q91WP2
109.33
6.68
EM
M�0.347
Oxoglu
tara
tedeh
ydro
gen
ase
(lip
oamid
e)¼Ogdhpro
tein
Q91WP2
115.7
6.75
EM
M�0.347
Oxoglu
tara
tedeh
ydro
gen
ase
(lip
oamid
e)¼Ogdhpro
tein
Q91WP2
116.33
6.72
EM
M�0.347
Oxoglu
tara
tedeh
ydro
gen
ase
(lip
oamid
e)¼Ogdhpro
tein
Q91WP2
117.34
6.61
EM
M�0.347
Pancrea
ticlipase
AAA79888
50.14
7.02
EM
�0.284
11.1
Pro
pionyl-C
oA
carb
oxylase
alp
hachain
pre
cursor
PCCA_R
AT
80.1
7.11
EM
M�0.217
Propionyl-CoA
carbox
ylase
alphach
ain
precu
rsor
PCCA_R
AT
81.85
6.53
EM
M�0.217
Pro
pionyl-C
oA
carb
oxylase
alp
hachain
pre
cursor
PCCA_R
AT
83.2
6.39
EM
M�0.217
Pro
pionyl-C
oA
carb
oxylase
betachain
pre
cursor
A25516
58.24
7.02
EM
M0.022
Pro
pionyl-C
oA
carb
oxylase
betachain
pre
cursor
A25516
58.47
6.89
EM
M0.022
Pro
pionyl-C
oA
carb
oxylase
betachain
pre
cursor
A25516
58.77
6.75
EM
M0.022
Pyru
vate
carbox
ylase
precu
rsor
JC4391
126.76
6.76
EM
M�0.169
Pyr
uvate
deh
ydro
gen
ase
(lip
oamid
e)(E
1)betachain
S15892
36.31
5.66
EM
M�0.304
Pyr
uvate
deh
ydro
gen
ase
(lip
oamid
e)(E
1)betachain
S15892
36.53
5.58
EM
M�0.304
Pyr
uvate
deh
ydro
gen
ase
(lip
oamid
e)alp
hachain
1pre
cursor
DERTPA
45.94
7.17
EM
M�0.304
Pyr
uvate
deh
ydro
gen
ase
(lip
oamid
e)alp
hachain
1pre
cursor
DERTPA
46.04
7.44
EM
M�0.304
Pyru
vate
deh
ydrogen
ase
(lipoa
mide)
alphach
ain
1precu
rsor
DERTPA
46.17
7.34
EM
M�0.304
Pyruvate
dehydrogenase
(lip
oamid
e)alp
hachain
1precurso
rDERTPA
46.21
7.03
EM
M�0.304
Pyr
uvate
deh
ydro
gen
ase
(lip
oamid
e)alp
hachain
1pre
cursor
DERTPA
33.39
7.72
EM
M�0.304
Pyr
uvate
kin
ase
isozy
meM2
A26186
63.42
8.03
EM
M�0.096
Sim
ilarto
3-hyd
roxyisob
utyryl-coen
zymeA
hyd
rolase
Q8QZS1
40.22
7.63
EM
M�0.214
Sim
ilarto
hypotheticalprotein
FLJ20920—Blast
search:hypotheticalprotein
LOC264895
Q8VCW8
65.08
7.39
EM
�0.154
34.8
Sim
ilarto
hypotheticalprotein
FLJ20920—Blast
search:hypotheticalprotein
LOC264895
Q8VCW8
65.28
7.2
EM
�0.154
34.8
Succinate-coenzymeA
ligase
Q8BGS6
48.64
6.15
EM
M�0.023
Succinate-sem
ialdeh
ydedeh
ydrogen
ase
¼aldeh
ydedeh
ydrogen
ase
5I6
1704
52.3
6.94
EM
M�0.019
Transk
etolase
AAA18026
70.9
7.95
EM
Non
M�0.132
Ubiquinon
ebiosynthesis
protein
¼dem
ethyl-Q
7T10806
20.45
6.29
EM
�0.183
13.0
Malicen
zyme2,NAD(þ
)-dep
enden
t,mitochon
drial
Q99KE1
64.55
7.14
EM
M�0.138
AE017189–Blast
search:similarto
cappingprotein
muscle
Z-line,
a2
AAR16292
37.9
5.94
Other
Unknow
nCarbon
icanhydrase
IICAH2_R
AT
17.9
6.43
Other
�0.532
4.3
(Con
tinued
)
Rat Colon Mitochondrial Associated Proteins 85

Coiled-coil-helix-coiled-coil-helix
dom
ain
containing3
Q9CRB9
23.76
8.42
Other
M�1.030
Com
plemen
tcompon
ent1,qsu
bcompon
entbindingprotein
CAA04531
35.33
4.32
Other
M�0.447
73.9
DNA
segmen
t,Chr10,JohnsHopkin
sUniver
sity
81ex
pre
ssed
Bla
stsearc
h:es1pro
tein
Q9D172
27.72
8.42
Other
M�0.022
GOB-4
protein
O88312
15.54
9.23
Other
�0.394
11.1
IgE-dep
enden
thistamine-releasingfactor
S00775
26.3
4.78
Other
Unknow
n�0.361
Lactose-bindinglectin
L-36
A46631
21.29
7.58
Other
�0.250
4.3
Mucosa
lpen
traxin
AAr04681
27.87
5.41
Other
Unknow
n�0.090
Nitrilase
family,mem
ber
2Q9JHW2
31.63
7.12
Other
M�0.224
Nitrilase
family,mem
ber
2Q9JHW2
32.13
7.19
Other
M�0.224
Polymerase
delta-interactingprotein
2Q91VA6
37.84
7.31
Other
�0.526
95.7
Purine-nucleosidephosphorylase
Q9D8C9
31.82
6.78
Other
�0.121
13.0
Stomatin(E
pb7.2)-like2
Q9DCG8
43.51
6.2
Oth
erM
�0.193
Thiosu
lfate
sulfurtra
nsfer
ase
S15081
36.02
8.47
Oth
erM
�0.447
Unknow
nUnknow
n17.9
3.7
Other
Unknow
nUnknow
nUnknow
n15.52
3.8
Other
Unknow
nUnknow
nUnknow
n15.69
4.16
Other
Unknow
nUnknow
nUnknow
n31.06
4.58
Other
Unknow
nUnknow
nUnknow
n24.45
5.1
Other
Unknow
nUnknow
nUnknow
n74.01
5.26
Other
Unknow
nUnknow
nUnknow
n107.03
5.63
Other
Unknow
nUnknow
nUnknow
n131.03
5.68
Other
Unknow
nUnknow
nUnknow
n103.9
5.98
Other
Unknow
nUnknow
nUnknow
n53.43
6.1
Other
Unknow
nUnknow
nUnknow
n77.13
6.17
Other
Unknow
nUnknow
nUnknow
n72.47
6.29
Other
Unknow
nUnknow
nUnknow
n61.72
7.08
Other
Unknow
nUnknow
nUnknow
n67.04
7.09
Other
Unknow
nUnknow
nUnknow
n40.82
7.09
Other
Unknow
nUnknow
nUnknow
n39.05
7.47
Other
Unknow
nUnknow
nUnknow
n39.05
7.47
Other
Unknow
nUnknow
nUnknow
n19.91
7.58
Other
Unknow
nUnknow
nUnknow
n59.78
7.69
Other
Unknow
nUnknow
nUnknow
n15.08
7.84
Other
Unknow
nUnknow
nUnknow
n16.45
7.95
Other
Unknow
nUnknow
nUnknow
n9.75
8.31
Other
Unknow
nUnknow
nUnknow
n27.34
9.34
Other
Unknow
nATP
synth
ase
betachain
mitochondrialpre
cursor
ATPB_R
AT
14.22
5.63
OXPHOS
M0.034
ATP
synth
ase
betachain
mitochondrialpre
cursor
ATPB_R
AT
26.62
4.9
OXPHOS
M0.034
ATP
synth
ase
betachain
mitochondrialpre
cursor
ATPB_R
AT
29.63
5.97
OXPHOS
M0.034
ATP
synth
ase
betachain
mitochondrialpre
cursor
ATPB_R
AT
31.39
5.43
OXPHOS
M0.034
ATP
synth
ase
betachain
mitochondrialpre
cursor
ATPB_R
AT
32.69
4.72
OXPHOS
M0.034
ATP
synth
ase
betachain
mitochondrialpre
cursor
ATPB_R
AT
54.78
5.28
OXPHOS
M0.034
ATP
synth
ase
betachain
mitochondrialpre
cursor
ATPB_R
AT
57.31
5.44
OXPHOS
M0.034
ATP
synth
ase
betachain
mitochondrialpre
cursor
ATPB_R
AT
59.15
5.07
OXPHOS
M0.034
ATP
synth
ase
betachain
mitochondrialpre
cursor
ATPB_R
AT
63.53
5.16
OXPHOS
M0.034
ATP
synth
ase
betachain
mitochondrialpre
cursor
ATPB_R
AT
54.79
5.2
OXPHOS
M0.034
ATP
synth
ase
betachain
mitochondrialpre
cursor
ATPB_R
AT
55.59
5.3
OXPHOS
M0.034
ATP
synth
ase
betachain
mitochondrialpre
cursor
ATPB_R
AT
55.61
5.13
OXPHOS
M0.034
TABLE
I.(C
ontinued
)
Protein
name
Accession
number
Mr
pI
Function
Organelle
GRAVY
PSORTII
(%)
86 Padidar et al.

ATP
synth
ase
betachain
mitochondrialpre
cursor
ATPB_R
AT
31.28
5.59
OXPHOS
M0.034
ATPsynthase
Dch
ain,mitochon
drialF0complex
ATPQ_R
AT
24.29
6.58
OXPHOS
M�0.718
ATPsynthase
Dch
ain,mitochon
drialF0complex
ATPQ_R
AT
24.61
6.22
OXPHOS
M�0.718
ATPsynthase,H
þtransp
orting,mitochon
drialF0complex,su
bunit
F6
A44861
12.89
8.38
OXPHOS
M�0.465
ATPsynthase,H
þtransp
orting,mitochon
drialF1complex,
d-su
bunit
AAC28872
17.75
4.35
OXPHOS
M0.197
ATP
synth
ase,H
þtransp
ortin
g,mitochondrialF1complex,alp
hasu
bunit
A35730
53.12
8.61
OXPHOS
M�0.090
ATP
synth
ase,H
þtransp
ortin
g,mitochondrialF1complex,alp
hasu
bunit
A35730
50.36
9.15
OXPHOS
M�0.090
ATPsynthase,H
þtransp
orting,mitochon
drialF1complex,alphasu
bunit
A35730
52.99
8.76
OXPHOS
M�0.090
ATP
synth
ase,H
þtransp
ortin
g,mitochondrialF1complex,alp
hasu
bunit
A35730
15.38
5.04
OXPHOS
M�0.090
ATP
synth
ase,H
þtransp
ortin
g,mitochondrialF1complex,alp
hasu
bunit
A35730
15.6
4.87
OXPHOS
M�0.090
ATP
synth
ase,H
þtransp
ortin
g,mitochondrialF1complex,alp
hasu
bunit
A35730
15.6
4.87
OXPHOS
M�0.090
ATP
synth
ase,H
þtransp
ortin
g,mitochondrialF1complex,alp
hasu
bunit
rA35730
15.67
4.16
OXPHOS
M�0.090
ATP
synth
ase,H
þtransp
ortin
g,mitochondrialF1complex,alp
hasu
bunit
A35730
16.73
4.91
OXPHOS
M�0.090
ATP
synth
ase,H
þtransp
ortin
g,mitochondrialF1complex,alp
hasu
bunit
A35730
17.37
7.65
OXPHOS
M�0.090
ATPsynthase,H
þtransp
orting,mitochon
drialF1complex,alphasu
bunit
A35730
53.6
8.42
OXPHOS
M�0.090
ATP
synth
ase,H
þtransp
ortin
g,mitochondrialF1complex,alp
hasu
bunit
A35730
53.6
8.42
OXPHOS
M�0.090
ATP
synth
ase,H
þtransp
ortin
g,mitochondrialF1complex,alp
hasu
bunit
A35730
53.68
8.13
OXPHOS
M�0.090
ATP
synth
ase,H
þtransp
ortin
g,mitochondrialF1complex,alp
hasu
bunit
A35730
53.81
7.91
OXPHOS
M�0.090
ATP
synth
ase,H
þtransp
ortin
g,mitochondrialF1complex,alp
hasu
bunit
A35730
55.73
8.12
OXPHOS
M�0.090
ATP
synth
ase,H
þtransp
ortin
g,mitochondrialF1complex,alp
hasu
bunit
A35730
61.84
7.86
OXPHOS
M�0.090
Cytochro
meb5micro
somalsp
liceform
CBRT5
18.62
4.77
OXPHOS
M�0.598
Cytochro
meC
oxid
ase
chain
Vapre
cursor
S04592
15.81
5.2
OXPHOS
M�0.142
CytochromeC
oxidase
subunitVb
BAA01743
16.55
5.54
OXPHOS
M�0.281
Cyto
chromec-1
BAB22380
32.32
6.94
OXPHOS
M�0.247
DLST
dih
ydro
lipoamid
esu
ccin
yltransfer
ase
componen
t(E
2)
S21766
50.94
6.24
OXPHOS
M0.034
DLST
Dih
ydro
lipoamid
esu
ccin
yltransfer
ase
componen
t(E
2)
S21766
51.89
6.23
OXPHOS
M0.034
DLST
Dih
ydro
lipoamid
esu
ccin
yltransfer
ase
componen
t(E
2)
S21766
70.9
6.02
OXPHOS
M0.034
DLSTDihydrolipoa
midesu
ccinyltransferase
compon
ent(E
2)
S21766
73.69
6.02
OXPHOS
M0.034
E3Dih
ydro
lipoamid
edeh
ydro
gen
ase
AAH62069
59.11
8.13
OXPHOS
M�0.010
E3Dih
ydro
lipoamid
edeh
ydro
gen
ase
AAH62069
61.07
7.53
OXPHOS
M�0.010
E3Dih
ydro
lipoamid
edeh
ydro
gen
ase
AAH62069
61.49
7.25
OXPHOS
M�0.010
E3Dih
ydro
lipoamid
edeh
ydro
gen
ase
AAH62069
61.94
6.93
OXPHOS
M�0.010
NADH
deh
ydrogen
ase
(ubiquinon
e)1alphasu
bcomplex5
NUFM_R
AT
13.99
7.03
OXPHOS
M�0.369
NADH
deh
ydrogen
ase
(ubiquinon
e)1alphasu
bcomplex5
NUFM_R
AT
14.2
6.79
OXPHOS
M�0.369
NADH
deh
ydro
gen
ase
1alp
hasu
bcomplex10-lik
epro
tein
Q80WE0
41.17
6.54
OXPHOS
M�0.442
NADH
deh
ydro
gen
ase
1alp
hasu
bcomplex10-lik
epro
tein
Q80WE0
41.76
6.54
OXPHOS
M�0.442
NADH
deh
ydro
gen
ase
1alp
hasu
bcomplex10-lik
epro
tein
Q80WE0
44.34
6.37
OXPHOS
M�0.442
NADH
deh
ydrogen
ase
1alphasu
bcomplex11
Q80W89
15.25
8.47
OXPHOS
M0.157
NADH2deh
ydrogen
ase
(ubiquinon
e)24K
chain
precu
rsor
A31868
30.04
5.48
OXPHOS
M�0.316
Sim
ilarto
NADH
dehydrogenase
(Ubiq
uin
one)Fe-S
protein
2Q91WD5
48.1
6.41
OXPHOS
M�0.283
Sim
ilarto
NADH
dehydrogenase
Ubiq
uin
oneflavoprotein
151kDa
Q91YT0
50.36
8.13
OXPHOS
M�0.253
Sim
ilarto
NADH
dehydrogenase
Ubiq
uin
oneflavoprotein
151kDa
Q91YT0
50.57
7.83
OXPHOS
M�0.253
Sim
ilarto
NADH
dehydrogenase
Ubiq
uin
oneflavoprotein
151kDa
Q91YT0
67.72
6.09
OXPHOS
M�0.253
Ubiq
uin
ol-cyto
chromecreducta
secoreprotein
1BAB27022
53.42
5.68
OXPHOS
M�0.189
Ubiq
uin
ol-cytochro
me-cre
ducta
secore
pro
tein
IIpre
cursor
S29510
44.24
8.51
OXPHOS
M�0.067
Ubiq
uin
ol-cytochro
me-cre
ducta
secore
pro
tein
IIpre
cursor
S29510
44.58
8.36
OXPHOS
M�0.067
Ubiq
uin
ol-cytochro
me-cre
ducta
seRiesk
eiron-sulfurpro
tein
pre
cursor
A32296
26.95
7.64
OXPHOS
M�0.108
Calreticulinprecu
rsor
JH0819
59.56
4.5
PF
ER
�1.099
Calreticulinprecu
rsor
JH0819
69.01
4.3
PF
ER
�1.099
Calreticulinprecu
rsor
JH0819
71.24
4.31
PF
ER
�1.099
Chaper
onin
gro
EL
pre
cursor¼hea
tsh
ockpro
tein
60
HHRT60
65.71
5.96
PF
M�0.085
Chaper
onin
gro
EL
pre
cursor¼hea
tsh
ockpro
tein
60
HHRT60
66.76
5.65
PF
M�0.085
Chaper
onin
gro
EL
pre
cursor¼hea
tsh
ockpro
tein
60
HHRT60
66.87
5.7
PF
M�0.085
Chaper
onin
gro
EL
pre
cursor¼hea
tsh
ockpro
tein
60
HHRT60
67.72
6.09
PF
M�0.085
Chaperon
insu
bunit
3(gamma)
AAH63178
71.4
6.84
PF
�0.271
17.4
Chaperon
insu
bunit
3(gamma)
AAH63178
71.56
6.7
PF
�0.271
17.4
Chaperon
insu
bunit
3(gamma)
AAH63178
71.56
6.78
PF
�0.271
17.4
(Con
tinued
)
Rat Colon Mitochondrial Associated Proteins 87
Clathrin-associatedprotein
complex2,betach
ain
minor
compon
ent
B32105
29.08
6.89
PF
Golgi
�0.061
17.4
Clathrin-associatedprotein
complex2,betach
ain
minor
compon
ent
B32105
29.59
6.87
PF
Golgi
�0.061
17.4
DnaJ(H
sp40)hom
olog
,su
bfamilyB,mem
ber
11
AAQ91040
43.83
6.56
PF
ER
�0.556
Dnak-typemolecularch
aperon
egrp
75precu
rsor
¼Mortalin
AAb33049
81.75
6.71
PF
�0.420
65.2
Dnak-typemolecularch
aperon
egrp
75precu
rsor
¼Mortalin
AAb33049
93.31
5.58
PF
�0.420
65.2
Dnak-typemolecularch
aperon
egrp
75precu
rsor
¼Mortalin
AAb33049
72.34
5.53
PF
�0.420
65.2
DnaK-typemolecularchaperonegrp75precurso
r¼Morta
lin
AAb33049
82.91
5.81
PF
�0.420
65.2
DnaK-typemolecularchaperonegrp75precurso
rt¼Morta
lin
AAb33049
83.2
5.96
PF
�0.420
65.2
DnaK-typ
emolecula
rchaper
onehsc
73,hea
tsh
ockpro
tein
8S07197
79.39
5.68
PF
NonM
�0.452
DnaK-typemolecularch
aperon
ehsc73,hea
tsh
ockprotein
8S07197
79.42
5.81
PF
NonM
�0.452
DnaK-typ
emolecula
rchaper
onehsc
73,hea
tsh
ockpro
tein
8S07197
80.81
5.67
PF
NonM
�0.452
DnaK-typ
emolecularch
aperon
eprecu
rsor
¼hea
tsh
ock70kDaprotein
5HHRTGB
17.75
6.86
PF
ER
�0.481
DnaK-typemolecularch
aperon
eprecu
rsor
¼hea
tsh
ock70kDaprotein
5HHRTGB
84.86
5.29
PF
ER
�0.481
DnaK-typ
emolecularch
aperon
eprecu
rsor
¼hea
tsh
ock70kDaprotein
5HHRTGB
85.31
5.19
PF
ER
�0.481
DnaK-typ
emolecularch
aperon
eprecu
rsor
¼hea
tsh
ock70kDaprotein
5HHRTGB
84.85
5.24
PF
ER
�0.481
DnaK-typ
emolecularch
aperon
eprecu
rsor
¼hea
tsh
ock70kDaprotein
5HHRTGB
73.2
5.49
PF
ER
�0.481
Heatsh
ock70kDaprotein
1A
AAA17441
76.36
6.3
PF
NonM
�0.395
Heatsh
ock70kDaprotein
1A
AAA17441
78.4
5.98
PF
NonM
�0.395
Pep
tidylprolylisom
erase
ACSRTA
17.13
8.27
PF
�0.340
4.3
Pep
tidylprolylisom
erase
ACSRTA
17.24
8.78
PF
�0.340
4.3
Protein
disulfideisom
erase
associated3
BAA09695
58.77
6.6
PF
ER
�0.455
Protein
disulfideisom
erase
associated3
BAA09695
61.39
6.72
PF
ER
�0.455
Protein
disulfideisom
erase
associated3
BAA09695
62.05
6.38
PF
ER
�0.455
Protein
disulfideisom
erase
associated3
BAA09695
62.08
6.27
PF
ER
�0.455
Protein
disulfideisom
erase
associated3
BAA09695
62.55
6.49
PF
ER
�0.455
Protein
disulfideisom
erase
associated3
BAA09695
62.65
6.19
PF
ER
�0.455
Protein
disulfideisom
erase
associated3
BAA09695
63.03
6.11
PF
ER
�0.455
Protein
disulfide-isom
erase
precu
rsor
ISRTSS
61.01
4.97
PF
ER
�0.382
Sim
ilarto
forprotein
disulfideisom
erase-related
Q921X9
66.13
7.66
PF
ER
�1.099
3-M
ercaptopyru
vate
sulfurtransferase
THTM_R
AT
33.34
6.45
PSD
M�0.299
3-M
ercaptopyru
vate
sulfurtransferase
THTM_R
AT
33.5
6.3
PSD
M�0.299
Acidic
ribosom
alprotein
P0,cytosolic(sim
ilarity)
R5RT10
37.84
7.31
PSD
Non
M0.050
Alpha-amylase
(EC
3.2.1.1)precu
rsor,pancrea
tic
ALRTP
56.39
7.72
PSD
Non
M�0.447
Beta-N
-acetylhex
osaminidase
betach
ain
B54745
52.8
6.78
PSD
�0.237
Bra
nch
edch
ain
aminotra
nsferase
2AAH61790
41.16
7.94
PSD
M�0.115
Bra
nch
edch
ain
aminotra
nsferase
2AAH61790
42.06
7.57
PSD
M�0.115
Cathep
sinD
precu
rsor
KHRTD
46.5
5.89
PSD
M0.008
Cathep
sinE
precu
rsor
S66465
50.81
4.64
PSD
ER
0.092
Cathep
sinS
A45087
28.85
5.6
PSD
�0.519
4.3
Cathep
sinZ
BAA82844
38.75
5.64
PSD
Non
M�0.429
Dipep
tidyl-pep
tidase
IIJC7668
60.2
4.79
PSD
�0.102
11.1
Elongation
factor
1-beta
EF1B_M
OUSE
34.73
4.57
PSD
�0.250
11.1
Elongationfa
ctorTU
Q8BFR5
36.3
6.41
PSD
M�0.179
Elongationfa
ctorTU
Q8BFR5
48.08
6.87
PSD
M�0.179
GM2activatorprotein
Q8CJH4
25.27
4.89
PSD
0.108
26.1
Mast
cellproteinase
IIprecu
rsor
PRRTG
26.73
9.6
PSD
0.075
11.1
Methylcroton
oyl-CoenzymeA
carboxylase
1(alpha)
AAH21382
82.45
6.94
PSD
M�0.288
Methylcroton
oyl-CoenzymeA
carboxylase
2(beta)
AAH58987
56.09
7.89
PSD
M�0.078
Mitochon
drialLon
protease
hom
olog
Q924s5
115.82
6.27
PSD
M�0.287
Mitochon
drialribom
somalprotein
L12
BAB23955
22.72
5.48
PSD
M�0.165
TABLE
I.(C
ontinued
)
Protein
name
Accession
number
Mr
pI
Function
Organelle
GRAVY
PSORTII
(%)
88 Padidar et al.

Mitochon
drialribosom
alprotein
L38
Q8BTZ1
41.43
7.68
PSD
M�0.801
Neu
rolysin(m
etallop
eptidase
M3family)
CAA60630
84.2
6.3
PSD
M�0.363
Nitrogen
fixation
gen
e1
AAK12337
47.83
7.74
PSD
M�0.222
Pep
tidase
(mitochon
drialprocessing)beta
BAA03007
52.41
6.51
PSD
M�0.178
Plasm
aglutamate
carbox
ypep
tidase
Q9Z1Y1
59.84
5.97
PSD
�0.089
17.4
Ribosom
alprotein
S12
Q6pdw1
15.82
6.83
PSD
�0.187
21.7
Translation
elon
gation
factor
EF-G
,mitochon
drial
S40780
95.19
6.3
PSD
M�0.280
Cata
lase
CATA_R
AT
65.45
7.78
Redox
M�0.643
Cop
roporphyrinog
enox
idase
Q8VD08
38.65
7.82
Red
oxM
�0.514
CuZnSuperox
idedismutase
SODC_R
AT
18.01
6.16
Red
oxM
�0.419
Peroxired
oxin
3Q9Z0v6
27.94
6.66
Red
oxM
0.013
Peroxired
oxin
3Q9Z0V6
28.13
6.5
Red
oxM
0.013
Peroxired
oxin
3Q9Z0V6
28.29
6.34
Red
oxM
0.013
Peroxired
oxin
3Q9Z0V6
28.52
6.15
Red
oxM
0.013
Peroxired
oxin
3Q9Z0V6
29.04
6.16
Red
oxM
0.013
Peroxired
oxin
4Q9Z0V5
29.43
6.36
Red
oxM
�0.249
Peroxired
oxin
5AAF03751
18.21
7.55
Red
oxM
0.191
Superoxidedismutase
Mnprecu
rsor
DSRTN
25.61
8.56
Red
oxM
�0.422
Superoxidedismutase
Mnprecu
rsor
DSRTN
25.85
8.00
Red
oxM
�0.422
Superoxidedismutase
Mnprecu
rsor
DSRTN
25.51
8.45
Red
oxM
�0.422
Thiol-sp
ecificantioxidantPeroxired
oxin
2(Prd
x2)
A57716
24.71
5.23
Red
ox�0.175
8.7
Thioredoxin
peroxidase
2mutantYESdim
mer
stru
cture
(Prd
x1)
I52425
24.9
8.05
Red
ox�0.222
8.7
Thioredoxin
peroxidase
2mutantYESdim
mer
stru
cture
(Prd
x1)
I52425
24.91
6.58
Red
ox�0.222
8.7
Thioredoxin
peroxidase
2mutantYESdim
mer
stru
cture
(Prd
x1)
I52425
25.27
8.84
Red
ox�0.222
8.7
Thioredoxin
peroxidase
2mutantYESdim
mer
stru
cture
(Prd
x1)
I52425
25.42
7.17
Red
ox�0.222
8.7
Annexin
A1
ANX1_R
AT
38.29
7.19
Signalling
�0.437
17.4
Guaninenucleotidebindingprotein
(Gprotein),betapolypep
tide2like1activated
protein
kinase
CreceptorRACK1
A36986
32.98
8.03
Signalling
�0.258
21.7
Guaninenucleotidebindingprotein
(Gprotein),betapolypep
tide2like1activated
protein
kinase
CreceptorRACK1
A36986
32.27
8.01
Signalling
�0.258
21.7
Guaninenucleotidebindingprotein,beta1
AAC72249
38.74
5.77
Signalling
Non
M�0.237
LIM
protein
JC4385
36.67
7.26
Signalling
�0.487
4.3
Actinalp
ha2,vasc
ula
rsm
ooth
musc
leA22224
39.6
6.16
Struc-
tura
lNonM
�0.233
Actin
beta
ATRTC
29.02
5.36
Structural
�0.005
8.7
Actin
beta
ATRTC
29.75
7.63
Structural
�0.005
8.7
Actin
beta
ATRTC
32.52
5.74
Structural
�0.005
8.7
Actin
beta
ATRTC
39.87
5.92
Structural
�0.005
8.7
Actin
beta
ATRTC
40.15
5.75
Structural
�0.005
8.7
Actin
beta
ATRTC
49.12
5.6
Structural
�0.005
8.7
Actin
beta
ATRTC
49.22
6Structural
�0.005
8.7
Actin
beta
ATRTC
53.57
5.62
Structural
�0.005
8.7
Actin
beta
ATRTC
72.57
7.2
Structural
�0.005
8.7
Alpha-spectrin
2AAC33127
151.03
5.72
Structura
lUnknow
n�0.789
Coron
in,actin-bindingprotein,1B
AAH61558
78.54
5.9
Structural
�0.147
26.1
Desmin
DESM_R
AT
38.39
5.06
Structura
l�0.714
21.7
Desmin
DESM_R
AT
41.1
4.95
Structura
l�0.714
21.7
Desmin
DESM_R
AT
42.76
4.98
Structura
l�0.714
21.7
Desmin
DESM_R
AT
42.81
4.9
Structura
l�0.714
21.7
Desmin
DESM_R
AT
49.08
5.49
Structura
l�0.714
21.7
Destrin
JE0223
17.73
8.51
Structura
l�0.234
4.3
Ezrin
Q8VHK3
63.96
6.92
Structura
l�0.971
8.7
Ezrin
Q8VHK3
76.69
6.23
Structura
l�0.971
8.7
Ezrin
Q8VHK3
89.94
6.39
Structura
l�0.971
8.7
F-actin
cappingprotein
betasu
bunit
B54819
32.43
5.91
Structural
�0.568
4.3
Keratin18
Q63278
44.51
5.02
Structural
�0.654
87.0
Keratin2ep
idermis
Q61869
27.8
8.11
Structural
�0.597
4.3
(Con
tinued
)
Rat Colon Mitochondrial Associated Proteins 89

Keratin2ep
idermis
Q61869
67.67
6.71
Structural
�0.597
4.3
Keratin21,typeI,cytosk
eletal
A40452
48.01
4.89
Structural
�0.727
78.3
Keratin21,typeI,cytosk
eletal
A40452
48.13
4.96
Structural
�0.727
78.3
Keratin59K
typeIcytosk
eletal(cytokeratin10)
KRMSE1
19.07
5.37
Structural
�0.695
43.5
Keratin59K
typeIcytosk
eletal(cytokeratin10)
KRMSE1
23.2
8.66
Structural
�0.695
43.5
Keratin59K
typeIcytosk
eletal(cytokeratin10)
KRMSE1
39.2
6.61
Structural
�0.695
43.5
Keratin,typeII
cytosk
eletal2(cytokeratin8)(cytokeratinen
doA)
K2C8_R
AT
42.85
5.18
Structural
�0.672
78.3
Keratin,typeII
cytosk
eletal2(cytokeratin8)(cytokeratinen
doA)
K2C8_R
AT
18.84
4.92
Structural
�0.672
78.3
Keratin,typeII
cytosk
eletal2(cytokeratin8)(cytokeratinen
doA)
K2C8_R
AT
22.44
4.89
Structural
�0.672
78.3
Keratin,typeII
cytosk
eletal2(cytokeratin8)(cytokeratinen
doA)
K2C8_R
AT
24.02
4.89
Structural
�0.672
78.3
Keratin,typeII
cytosk
eletal2(cytokeratin8)(cytokeratinen
doA)
K2C8_R
AT
27.55
5.48
Structural
�0.672
78.3
Keratin,typeII
cytosk
eletal2(cytokeratin8)(cytokeratinen
doA)
K2C8_R
AT
43.47
5.26
Structural
�0.672
78.3
Keratin,typeII
cytosk
eletal2(cytokeratin8)(cytokeratinen
doA)
K2C8_R
AT
42.16
5.04
Structural
�0.672
78.3
Keratin,typeII
cytosk
eletal8
K2C8_R
AT
42.64
5.08
Structural
�0.672
78.3
Keratin,typeII
cytosk
eletal8
K2C8_R
AT
43.81
5.19
Structural
�0.672
78.3
Keratin,typeII
cytosk
eletal8
K2C8_R
AT
51.76
5.82
Structural
�0.672
78.3
Keratin,typeII
cytosk
eletal8
K2C8_R
AT
59.23
6.24
Structural
�0.672
78.3
Keratin,typeII
cytosk
eletal8(C
ytokeratin-8)
K2C8_R
AT
41.75
5.26
Structural
�0.672
78.3
LASP-1.
Q99MZ8
39.44
6.99
Structural
�1.035
8.7
Myosin
lightch
ain
6,alkali,sm
ooth
muscle
isoform
MLC3SM
MLES_R
AT
17.16
4.38
Structural
�0.421
4.3
Myosin
lightch
ain
6,alkali,sm
ooth
muscle
isoform
MLC3SM
MLES_R
AT
17.44
4.22
Structural
�0.421
4.3
Myo
sinre
gula
tory
lightchain
2-A
,sm
ooth
musc
leisoform
(Myo
sinRLC-A
)MLRA_R
AT
19.22
4.71
Struc-
tura
l�0.809
4.3
Myo
sinre
gula
tory
lightchain
2-A
,sm
ooth
musc
leisoform
(Myo
sinRLC-A
)MLRA_R
AT
20.17
4.87
Struc-
tura
l�0.809
4.3
Myo
sinre
gula
tory
lightchain
2-A
,sm
ooth
musc
leisoform
(Myo
sinRLC-A
)MLRA_R
AT
20.24
4.65
Struc-
tura
l�0.809
4.3
Plectin
1A39638
115.67
5.63
Structural
�0.687
8.7
ProfilinI
Pro1_M
OUSE
15.11
8.85
Structura
l0.018
8.7
Saposin
precu
rsor
A28716
14.44
4.03
Structural
M�0.034
Sim
ilarto
intermediate
filament-likeprotein
MGC:2625isoform
2;
HOM-T
ES-103tu
morantigen-lik
eQ7TP27
66.79
7.28
Structura
lNonM
�0.191
Sim
ilarto
transgelin
2(SM22beta)
Q91VU2
23.22
8.83
Structura
l�0.637
21.7
Transgelin
(Smooth
muscle
protein
22-alpha)
TAGL_R
AT
79.27
5.41
Structural
�0.634
4.3
Transgelin
(Smooth
muscle
protein
22-alpha)(SM22-alpha
TAGL_R
AT
39.1
6.76
Structural
�0.634
4.3
Transgelin
SM22-alpha
TAGL_R
AT
16.74
6.6
Structural
�0.634
4.3
Transgelin
SM22-alpha
TAGL_R
AT
17.31
7.04
Structural
�0.634
4.3
Transgelin
SM22-alpha
TAGL_R
AT
17.48
6.58
Structural
�0.634
4.3
Tropom
yosin
alphaisoform
1Q923Z2
44.74
4.62
Structural
�0.992
4.3
Tropom
yosin
alphaisoform
6S34124
33.6
4.75
Structural
�1.018
17.4
Tubulinalpha-6
chain
(Alpha-tubulin6)
Q6AYZ1
63.78
5.45
Structural
�0.234
4.3
Tubulin,beta2c
AAH60597
59.62
5.18
Structural
Non
M�0.357
Vincu
lin
Q922D9
126.34
6.38
Structural
�0.421
17.4
14-3-3
pro
tein
epsilon(M
itochondrialim
port
stim
ula
tionfa
ctor
Lsu
bunit)¼tyro
sine3-m
onooxyg
enase
AAC52676
32.69
4.61
TC
NonM
�0.540
14-3-3
pro
tein
epsilon(M
itochondrialim
port
stim
ula
tionfa
ctor
Lsu
bunit)¼tyro
sine3-m
onooxyg
enase
AAC52676
33.69
4.61
TC
NonM
�0.540
Chlorideintracellularch
annel
1BAC40585
33.48
5.45
TC
�0.305
8.7
Cofi
lin-1
S49101
18.37
8.66
TC
�0.388
4.3
Ethylm
alonic
encephalopathy1
Q9DCM0
28.85
7.13
TC
M�0.096
TABLE
I.(C
ontinued
)
Protein
name
Accession
number
Mr
pI
Function
Organelle
GRAVY
PSORTII
(%)
90 Padidar et al.

Ethylm
alonic
encephalopathy1
Q9DCM0
29.14
6.54
TC
M�0.096
Flotillin
1AAC98705
49.48
7.29
TC
�0.355
21.7
Hem
oglobin
alpha-1
andalpha-2
chains
HBA_R
AT
14.14
9.08
TC
Non
M�0.130
Hem
oglobin
betach
ain,major-form
HBB1_R
AT
14.07
8.55
TC
�0.055
4.3
Hem
oglobin
betach
ain,major-form
HBB1_R
AT
14.09
8.77
TC
�0.055
4.3
Hem
oglobin
betach
ain,major-form
HBB1_R
AT
14.11
8.45
TC
�0.055
4.3
Neonatalfc
receptorch
ain
B2FRTB
13.58
7.76
TC
Non
M�0.142
Pro
tein
CGI-51homolog
Q8BGH2
57.03
7TC
M�0.206
Ribosom
ebindingprotein
1BAC98159
38.83
4.88
TC
ER
�0.923
Sim
ilarto
golgiphosphop
rotein
3(C
oat-protein)
Q8R088
35.16
6.05
TC
Golgi
�0.625
39.1
Transitionalendoplasm
icreticulu
mATPase
A55190
108.62
5.55
TC
ER
�0.354
Translocase
ofinner
mitochon
drialmem
brane50hom
olog
Q9D880
36.57
6.11
TC
M�0.383
Translocase
ofinner
mitochon
drialmem
brane50hom
olog
Q9D880
37.17
6.77
TC
M�0.383
Tumor
rejectionantigen
gp96¼hea
tsh
ockprotein
90kDa,Grp
94
Q91V38
110.97
4.92
TC
ER
�0.720
Voltage-dep
enden
tanionchannel
2Q9JI3
232.42
8.5
TC
M�0.221
Voltage-dep
enden
tanionchannel
2Q9JI3
232.9
7.03
TC
M�0.221
Voltage-dep
enden
tanionchannel
2Q9JI3
233.11
8.2
TC
M�0.221
Voltage-dep
enden
tanionchannel
2Q9JI3
233.14
7.32
TC
M�0.221
Voltage-dep
enden
tanionchannel
2Q9JI3
233.47
7.15
TC
M�0.221
Voltage-dep
enden
tanionchannel
2Q9JI3
233.57
7.01
TC
M�0.221
Voltage-dep
enden
tanionchannel
2Q9JI3
234.2
6.5
TC
M�0.221
Voltage-dep
enden
tanionchannel
2Q9JI3
234.27
7.07
TC
M�0.221
Voltage-dep
enden
tanionchannel
2Q9JI3
234.93
6.54
TC
M�0.221
Voltage-dep
enden
tanionchannel
2Q9JI3
235.46
7.04
TC
M�0.221
Voltage-dep
enden
tanion-selec
tivechannel
pro
tein
1POR1_R
AT
28.03
6.8
TC
M�0.374
Voltage-dependentanion-selectivechannelprotein
1POR1_R
AT
31
9.6
TC
M�0.374
Voltage-dep
enden
tanion-selec
tivechannel
pro
tein
1POR1_R
AT
32.05
9.07
TC
M�0.374
Proteinsare
ordered
byfunctionalg
roups.MrandpIvalues
estimatedfrom
2Dgel.E
R¼en
dop
lasm
icreticu
lum
andM
¼mitochon
drial,asaccordingto
SOURCEfrom
BioIn
form
aticHarvester
(http://harvester.em
bl.de/),wherenosu
bcellularlocalisa
tion
isstatedaPSORTII
percentages
dep
ictingthepredictedpercentageprobabilityaprotein
ismitochon
drialusingthek-nea
rest
neighbou
r(k-N
N)algorithm
[Horton
and
Nakai,
1997]is
stated
instea
d.CB¼calcium
binding,EM
¼en
ergymetabolism,OXPHOS¼ox
idativephosphorylation
,PF¼protein
folding,
PSD¼protein
synthesis
anddeg
radation
,TC¼Transp
orters
andch
annels.
Italics
represents
proteinsfoundin
humanhea
rtmitop
roteom
es[Tayloret
al.,2003;Gauch
eret
al.,2004],bold
represents
proteinsfoundin
mitop
roteom
esof
other
rattissues
[Forner
etal.,2
006;R
eifsch
neider
etal.,2
006],bold
italicsrepresents
proteinsfoundin
bothhumanhea
rtandother
rattissue
mitop
roteom
es[Tayloret
al.,2003;Gauch
eret
al.,2004;Forner
etal.,2006;Reifsch
neider
etal.,2006].
Rat Colon Mitochondrial Associated Proteins 91

organ specific differences in mitoproteomes[Taylor et al., 2003; Gaucher et al., 2004; Kiriet al., 2005; Lovell et al., 2005; Forner et al.,2006; Hunzinger et al., 2006; Kim et al., 2006;
Miller et al., 2006; Reifschneider et al., 2006;Ruiz-Romero et al., 2006]. This implies thatmitochondria may be regulated differently inspecific cells and tissues. Studies of proteinsassociated with mitochondria from theliver [Forner et al., 2006; Reifschneider et al.,2006], kidney [Reifschneider et al., 2006], brain[Reifschneider et al., 2006], heart [Taylor et al.,2003; Gaucher et al., 2004; Forner et al., 2006;Reifschneider et al., 2006] and skeletal muscle[Forner et al., 2006; Reifschneider et al., 2006]have previously been reported. These studiesprovide insights into the optimal functioningand regulation of mitochondria in thesetissues and the subsequent determination ofaltered regulation associated with dysfunctionand disease. This study is the first to profilethe proteins associated with mitochondriaextracted from rat colon and is significantconsidering that rat models are used exten-sively to studyhumancolonpathologies, such asinflammatory bowel disease and cancer [Corpetand Parnaud, 1999; Drew et al., 2005ab, 2006a;Mazzon et al., 2005; Yuki et al., 2006].
This study of mitochondria enrichedfractions from rat colon revealed resolution of
Fig. 4. Functional classification of the 430 proteins identified from rat colon mitochondrial enrichedfractions.
Fig. 5. Common multiple protein expression forms of mito-chondrial associated proteins identified in colon by LC/MS/MScompared with published mitoproteomes. * Taylor et al. [2003]and Gaucher et al. [2004]; ** Reifschneider et al. [2006] andForner et al. [2006].
92 Padidar et al.

430 proteins consisting of 195 different proteinsand 23 unknown proteins that were distributedinto 11 functional groups (see Table I andFig. 4). Hence, around 50% of the resolvedproteins from the colon mitochondrial enrichedfractions are multiple protein expression forms(MPEFs) (Table II). The number of identifiedproteins is greater than other published studiesusing 2D PAGE [Hunzinger et al., 2006;McDonald et al., 2006; Reifschneider et al.,2006]. However, Coomassie blue staining ofproteins used in this study ensures sufficientquantities of protein are available for identifica-tion, while LC/MS/MS maximises positiveidentification.
The presence of multiple protein expressionforms (MPEFs) with several spots being identi-fied as the same protein, potentially represent-ing splice variants, truncated products orco- and post-translational modifications hasbeen highlighted by Yang et al. [2005] andHunzinger et al. [2006]. Comparative proteomicstudies often fail to identify the entire comple-ment of MPEFs for a specific protein presenton a 2D gel. The current analysis of MPEFsassociated with the colon mitochondria willassist interpretation and analysis of proteomicdata from future studies employing com-parative proteomics of colon mitochondria.MPEFs present a significant problem in
TABLE II. Multiple Protein Expression Forms of Identified Proteins,Categorised by Functional Groups, From Mitochondrial Enriched
Fractions of the Rat Colon
Functional groupNo. of different
proteinsNo. of resolved
proteins % MPEFs
Calcium binding 5 9 44Cell cycle 5 11 55Energy metabolism 58 128 55Othera 14 15 7OXPHOS 20 59 66Protein folding 13 39 67Protein synthesis and degradation 25 28 10Redox 9 18 50Signalling 4 5 20Structural 27 63 57Transporters and channels 16 32 50
aTable excludes unidentified proteins.
Fig. 6. Profile of GRAVY values of mitochondrial associated proteins of rat colon. The plot shows the indexof hydrophobicity for the identified mitochondrial associated proteins calculated using Kyte and Doolittle[1982] (http://bioinformatics.org/sms2/protein_gravy.html).
Rat Colon Mitochondrial Associated Proteins 93

verifying comparative proteomic data sincewestern blotting is often not suitable forverification of these MPEFs. The two-dimen-sional patterns resolved by 2D PAGE cannot bereplicated using a one-dimensional format asthe proteins often have similar mass and pIvalues. Antibodies often do not discriminatebetween the observed MPEFs due to theextensive regions of shared amino acidsequence. Furthermore, it is often not possibleto properly interpret the biological significanceof changes in protein expression patternsrevealed by 2D gel analysis without an aware-ness of the complement and identification ofMPEFs present.
Proteins involved in energymetabolism (EM)and oxidative phosphorylation (OXPHOS)represented the major group accounting for43% of the resolved proteins (see Fig. 4),reflecting a significant function of themitochon-dria. These groups included 58 and 20 differentproteins respectively (Tables I and II) involvedin the oxidative phosphorylation machinery,for example complex I–V subunits, proteinsinvolved in theTCA cycle, for example fumaratehydratase mitochondrial precursor and thoseinvolved in fatty acid metabolism, for examplecarnitine O-palmitoyltransferase II precursor.
Sevenpercent of the proteinswere involved inprotein synthesis and degradation (Fig. 4).These 25 proteins (Tables I and II) are requiredto activate, synthesise and process precursornuclear-encoded mitochondrial proteins thatare imported into the mitochondria via trans-porters and channels, the latter accounting for7% of the proteins associated with the colonmitochondria (Fig. 4). These precursor proteinsrequire folding and 9% of the colon mitopro-teome are involved in protein folding (Fig. 4).Redox proteins, such as manganese superoxidedismutase contribute a further 4% of theresolved proteins. Mitochondrial antioxidantdefence systems play an important role inprotecting mitochondria from reactive oxygenspecies produced from oxidative phosphoryla-tion in the electron transport chain [Jezek andHlavata, 2005].
Fifteen percent of the proteins were struc-tural (see Fig. 4). This included a number ofMPEFs, that is, 63 resolved spots identified as27 different proteins. Structural proteins suchas cytoskeletal proteins (actins, intermediatefilaments and microtubules) play a central rolein many cell functions such as the maintenance
of cell shape, cell division, adhesion, signaltransduction, protein sorting, mitosis, cell andintracellular organelle anchorage, gene regula-tion, motility during migration, differentiationandwound repair [Ku et al., 1999]. Studies haveshown thatmitochondria are closely associated,transported and positioned within cells viainteraction with microtubules and actin fila-ments [Morris andHollenbeck, 1995; Ligon andSteward, 2000; Carre et al., 2002]. This impliesthat the proteins associated with mitochon-drial-enriched fractions may be indicative ofprocesses linked to normal functioning ofmitochondria in the colon. Proteins involved incalcium binding which were not previouslyassociated with mitochondria, accounted for2% for the colon mitoproteome. The presenceof these proteins reflects the intimate relation-ship between mitochondria and other vesicularmembranes such as the endoplasmic reticulumfor calcium homeostasis [Breckenridge et al.,2003]. These proteins may also work closelywith the structural proteins such as actins inexo- and endocytosis [Weinman et al., 1994;Merrifield et al., 2001]. Proteins involved in thecell cycle such as the mitochondrial innermembrane protein prohibitin made up 2% ofthe colon mitoproteome (Fig. 4). Other proteinsin this group such as the histones, although nottypically associated with mitochondria havealso been identified by Taylor et al. [2003] andmay be present due to the intimate associationbetween mitochondria and the nucleus coupledwith electrostatic interactions as suggested byTaylor et al. [2003].
The remaining 9% of proteins resolved werecategorised as other proteins (Fig. 4). Theseinclude unidentified proteins and proteins withno currently established function, for examplemucosal pentraxin [Van Der Meer-Van Kraaijet al., 2003; Drew et al., 2006b], as well asthose whose functions could not be easilycategorised into the other groups such asStomatin (Epb7.2)-like 2.
Analysis of the proteins associated withthe colon mitochondria revealed 72 proteinscommon to themitoproteomes of rat liver, heartand skeletal muscle [Forner et al., 2006;Reifschneider et al., 2006]; and kidney andbrain [Reifschneider et al., 2006] (Table I).Sixty-one percent of these common proteinsare proteins involved in energymetabolism andOXPHOS again reflecting the major role ofmitochondria in activities associated with
94 Padidar et al.

respiration and possibly the abundance of theseproteins in the mitoproteome. Comparison ofthe mitochondrial associated proteins of the ratcolon with the previously published humanheart mitoproteomes [Taylor et al., 2003; Gau-cher et al., 2004] revealed 116 proteins commonwith the colon mitoproteome, with 58 of theseproteins involved in energy metabolism andOXPHOS. Although the human heart mitopro-teome had more proteins in common with therat colon mitoproteome compared to other rattissues [Forner et al., 2006; Reifschneider et al.,2006], this may be indicative of the methodol-ogies used. Reifschneider et al. [2006] used 2Dblue native/SDS PAGE and identified theirresolved proteins using MALDI-TOF MS. For-ner et al. [2006] and Taylor et al. [2003] useda 1D gel electrophoresis followed by liquidchromatography separation and LC/MS/MSthat provides a greater degree of positiveidentification due to greater confidence of thepeptide matching scores from MASCOT com-pared with MALDI-TOF MS. Using MALDI-TOF MS we found a 10–15% identificationrate compared with 94% with LC/MS/MS(unpublished data). Hunzinger et al. [2006]recently demonstrated the 2D-IEF-SDS-PAGEresolved more spots and better separatedprotein isoforms compared with blue nativeSDS, benzyldimethyl-n-hexadecylammoniumchloride PAGE and tricine-urea/tricine SDS-PAGE. In comparative studies [Hunzingeret al., 2006; McDonald et al., 2006] LC/MS/MSprovides better identification hydrophobic pro-teins. Membrane associated proteins, such asthose of the mitochondria, have a hydrophobicprotein distribution bias, that is, a greaterdegree of hydrophobic aminoacids. This enablesa better association with the hydrophobic ‘tails’of fatty acids in the membranes themselves,particularly in protein transmembrane regions[Ho et al., 2006]. The degree of hydrophobicitycan be depicted by GRAVY values [Kyte andDoolittle, 1982]. This study has a similarGRAVY value profile (Fig. 6) compared withother published mitoproteomes [Hunzingeret al., 2006; McDonald et al., 2006; Reifschnei-der et al., 2006] with the presence of membraneassociated proteins such as malate dehydro-genase mitochondrial precursor (0.121) andtropomyosin alpha isoform 6 (�1.018). Further-more, differences in sample preparation inthese studies also potentially contributeto differences in the mitochondrial proteins
analysed. Forner et al. [2006] also excludedproteins such as actin, keratins and haemo-globin from their result set as they wereconsidered as contaminants. However, thecurrent study and Taylor et al. [2003] bothidentified these proteins and have includedthem in the dataset. Further study is requiredto establish the association of these proteins inmitochondrial functions. There were 69 pro-teins not previously identified as associatedwith mitoproteome analysis of other organsstudied [Taylor et al., 2003; Forner et al., 2006;Reifschneider et al., 2006]. Over half of thesenovel proteins were structural proteins andthose involved in protein synthesis and degra-dation and may be indicative of the differencesin the sample processing as described above, aswell as variations between mitochondrial pro-teins of differing organs.
Proteomic profiling of mitochondria and asso-ciated proteins involved in mitochondrial reg-ulation and trafficking within cells and tissueshas the potential to provide insights intomitochondrial dysfunction associated withmany human diseases. Furthermore, profilingof organ specific mitoproteomes will potentiallyreveal organ specific roles of the mitochondriaand assist in study of organ specific diseaseassociated with mitochondrial dysfunction.Thus the colon mitoproteome analysis pre-sented here provides a useful tool to assist inidentification and interpretation mitochondrialdysfunction implicated in colon pathogenesis.
ACKNOWLEDGMENTS
The authors would like to thank Dr. JulianMercer and staff at BioResources Unit, RowettResearch Institute, for their help in animal careand tissue harvest. The Scottish ExecutiveEnvironment and Rural Affairs Department(SEERAD), Scotland supported this work.
REFERENCES
Anderson L. 1991. Two dimensional electrophoresis—Operation of the ISO-DALT System. Rockville, MD,USA: Large Scale Biology Press.
Brandon M, Baldi P, Wallace DC. 2006. Mitochondrialmutations in cancer. Oncogene 25:4647–4662.
Breckenridge DG, Germain M, Mathai JP, Nguyen M,Shore GC. 2003. Regulation of apoptosis by endoplasmicreticulum pathways. Oncogene 22:8608–8618.
CarreM, AndreN, Carles G, Borghi H, Bichese L, Briand C,Braguer D. 2002. Tubulin is an inherent componentof mitochondrial membranes that interacts with the
Rat Colon Mitochondrial Associated Proteins 95

voltage-dependent anion channel. J Biol Chem 277:33664–33669.
Cole AR, Ji H, Simpson RJ. 2002. Proteomic analysis ofcolonic crypts from normal, multiple intestinal neoplasiaand p53-null mice: A comparison with colonic polyps.Electrophoresis 21:1772–1781.
Corpet DE, Parnaud G. 1999. Polyethylene glycol, a potentsuppressor of azoxymethane-induced colonic aberrantcrypt foci in rats. Carcinogenesis 20:915–918.
Cuezva JM, Krajewska M, de Heredia ML, Krajewski S,Santamaria G, Kim H, Zapata JM, Marusawa H,Chamorro M, Reed JC. 2002. The bioenergetic signatureof cancer: A marker of tumour progression. Cancer Res62:6674–6681.
Drew JE, Rucklidge GJ, Duncan G, Lufty A, FarquharsonAJ, Reid MD, Russell WR, Morrice PC, Arthur JR,Duthie GG. 2005a. A proteomic approach to identifychanges in protein profiles in pre-cancerous colon.Biochem Pharmacol 70:888–893.
Drew JE, Arthur JR, Farquharson AJ, Russell WR,MorricePC, Duthie GG. 2005b. Salicylic acid modulates oxidativestress and glutathione peroxidase activitiy in the ratcolon. Biochem Pharmacol 70:888–893.
Drew JE, Padidar S, Horgan G, Duthie GG, Russell WR,Reid M, Duncan G, Rucklidge GJ. 2006a. Salicylatemodulates oxidative stress in the rat colon: A proteomicapproach. Biochem Pharmacol 72:204–216.
Drew JE, Farquharson AJ, Keijer J, Barrera LN. 2006b.Complex regulation of mucosal pentraxin (Mptx)revealed by discrete mico-anatomical locations in colon.Biochem Biophys Acta 1762:844–848.
Farhadi A, Keshavarzian A, Van de Kar LD, Jakate S,Domm A, Zhang L, Shaikh M, Banan A, Fields JZ. 2005.Heightened responses to stressors in patients withinflammatory bowel disease. Am J Gastroenterol 100:1796–1804.
Fawcett DW. 1981. The cell. Philadelphia: WB Saunders.Forner F, Foster LJ, Campanaro S, Valle G, MannM. 2006.
Quantitative proteomic comparison of rat mitochondriafrommuscle, heart and liver. Mol Cell Proteomics 5:608–619.
Gaucher SP, Taylor SW, Fahy E, Zhang B, Warnock DE,Ghosh SS, Gibson BW. 2004. Expanded coverage of thehuman heart mitochondrial proteome using multidimen-sional liquid chromatography coupled with tandem massspectrometry. J Proteome Res 3:495–505.
Heerdt BG, Houston MA, Anthony GM, Augenlicht LH.1998. Mitochondrial membrane potential (delta psi (mt))in the coordination of p53-independent proliferation andapoptosis pathways in human colonic carcinoma cells.Cancer Res 58:2869–2875.
Ho E, Hayen A, Wilkins MR. 2006. Characterisationof organellar proteomes: A guide to subcellular pro-teomic fractionation and analysis. Proteomics 6:5746–5757.
Horton P, Nakai K. 1997. Better prediction of proteincellular localization sites with the k nearest neighborclassifier. Intell Syst Mol Biol 5:147–152.
Hunzinger C, Wozny W, Schwall GP, Poznanovic S,Stegmann W, Zengerling H, Schoepf R, Groebe K, CahillMA, Osiewacz HD, Jagemann N, Bloch M, Dencher NA,Krause F, Schrattenholz A. 2006. Comparative profilingof the mammalian mitochondrial proteome: multipleaconitase-2 isoforms includingN-formylkynureninemod-
ifications as part of a protein biomarker signature forreactive oxidative species. J Proteome Res 5:625–633.
Isidoro A, Martinez M, Fernandez PL, Ortega AD,Santamaria G, Chamorrow M, Reed JC, Cuezva M.2004. Alterations of the bioenergetic phenotype ofmitochondria is a hallmark of breast, gastric, lung andoesophageal cancer. Biochem J 378:17–20.
Jezek P, Hlavata L. 2005. Mitochondria in homeostasis ofreactive oxygen species in cell, tissues and organism.IJBCB 37:2478–2503.
Kim N, Lee Y, Kim H, Joo H, Youm JB, Park QS, Warda M,Cuong DV, Han J. 2006. Potential biomarkers forischemic heart damage identified in mitochondrialproteins by comparative proteomics. Proteomics 6:1237–1249.
Kiri AN, Tran HC, Drahos KL, Lan W, McRorie DK, HornMJ. 2005. Proteomic changes in bovine heart mitochon-dria with age: Using a novel technique for organelleseparation and enrichment. J Biomol Technol 16:371–379.
Ku NO, Zhou X, Toivola DM, Omary MB. 1999. Thecytoskeleton of digestive epithelia in health and disease.Am J Physiol 277:G1108–G1137.
Kyte J, Doolittle RF. 1982. A simple method for displayingthe hydropathic character of a protein. J Mol Biol157:105–132.
Lakshman M, Subramaniam V, Jothy S. 2004. CD44negatively regulates apoptosis in murine colonic epithe-lium via the mitochondrial pathway. Exp Mol Pathol 76:196–204.
Li YZ, Li CJ, Pinto AV, Pardee AB. 1999. Release ofmitochondrial cytochrome C in both apoptosis andnecrosis induced by beta-lapachone in human carcinomacells. Mol Med 5:232–239.
Ligon LA, Steward O. 2000. Role of microtubules and actinfilaments in the movement of mitochondria in the axonsand dendrites of cultured hippocampal neurons. J CompNeurol 427:351–361.
Lovell MA, Xiong S, Markesbery WR, Lynn BC. 2005.Quantitative proteomic analysis of mitochondria fromprimary neuron cultures treated with amyloid betapeptide. Neurochem Res 30:113–122.
Mancini M, Anderson BO, Caldwell E, Sedghinasab M,Paty PB, Hockenbery DM. 1997. Mitochondrial prolifera-tion and paradoxical membrane depolarisation duringterminal differentiation and apoptosis in a human coloncarcinoma cell line. J Cell Biol 138:449–469.
Mannella CA. 2006. The relevance of mitochondrialmembrane topology to mitochondrial function. BiochimBiophys Acta 1762:140–147.
Mazzanti R, Giulivi C. 2006. Co-ordination of nuclear andmitochondrial DNA encoded proteins in cancer andnormal colon tissues. Biochem Biophys Acta 1757:618–623.
Mazzanti R, Solazzo M, Fantappie O, Elfering S, PantaleoP, Bechi P, Cianchi F, Ettl A, Giulivi C. 2006. Differentialexpression proteomics of human colon cancer. AmJ Physiol Gastrointest Liver Physiol 290:G1329–G1338.
Mazzon E, Muia C, Paola RD, Genovese T, Menegazzi M,De Sarro A, Suzuki A, Cuzzocrea S. 2005. Green teapolyphenol extract attenuates colon injury induced byexperimental colitis. Free Radic Res 39:1017.
McDonald T, Sheng S, Stanley B, Chen D, Ko Y, ColeRN, Pedersen P, Van Eyk JE. 2006. Expanding the
96 Padidar et al.

subproteome of the inner mitochondria using proteinseparation technologies: One- and two-dimensionalliquid chromatography and two-dimensional gel electro-phoresis. Mol Cell Proteomics 5:2392–23411.
Merrifield CJ, Rescher U, Almers W, Proust J, Gerke V,Sechi AS, Moss SE. 2001. Annexin 2 has an essential rolein actin-based macropinocytic rocketing. Curr Biol 11:1136–1141.
Mignotte B, Vayssiere JL. 1998. Mitochondria and apopto-sis. Eur J Biochem 252:1–15.
Miller I, Gemeiner M, Gesslbauer B, Kungl A, Piskernik C,Haindl S, Nurnberger S, Bahrami S, Redl H, Kozlov AV.2006. Proteome analysis of rat liver mitochondria revealsa possible compensatory response to endotoxic shock.FEBS Lett 580:1257–1262.
Modica-Napolitano JS, Steele GD, Jr., Chen LB. 1989.Aberrant mitochondria in two human colon carcinomacell lines. Cancer Res 49:3369–3373.
Morris RL, Hollenbeck PJ. 1995. Axonal transport ofmitochondria along microtubules and F-actin in livingvertebrate neurons. J Cell Biol 131:1315–1326.
Nakai N, Horton P. 1999. PSORT: A program for detectingthe sorting signals of proteins and predicting theirsubcellular localization. Trends Biochem Sci 24:34–35.
Nazli A, Yang PC, Jury J, Howe K, Watson JL, SoderholmJD, Sherman PM, Perdue MH, McKay DM. 2004.Epithelia under metabolic stress perceive commensalbacteria as a threat. Am J Pathol 164:947–957.
Oseroff AR. 1986. Intramitochondrial dyes allow selectivein vitro photolysis of carcinoma cells. Proc Natl Acad SciUSA 83:9729–9733.
Pleshkwych A, Maurer TC, Porter CW. 1983. Ultrastruc-tural changes in the mitochondria of intestinal epitheliumof rodent treated with methylglyoxal-bis(guanylhydrazone).Cancer Res 43:646–652.
Rana RS, Stevens RH, Oberley L, Loven DB, Graves JM,Cole DA, Meek ES. 1980. Evidence for a defectivemitochondrial membrane in 1,20dimethylhydrazine-induced colon adenocarcinoma in rat: Enhanced lipidperoxidation potential in vitro. Cancer Lett 9:237–244.
Reifschneider NH, Goto S, Nakomoto H, Takahashi R,Sugawa M, Dencher N, Krause F. 2006. Defining themitochondrial proteomes from five rat organs in aphysiologically significant context using 2D blue-native/SDS-PAGE. J Proteome Res 5:1117–1132.
Ruemmele FM, Schwartz S, Seidman EG, Dionne S, LevyE, Lentze MJ. 2003. Butyrate induced Caco-2 cellapoptosis is mediated via the mitochondrial pathway.Gut 52:94–100.
Ruiz-Romero C, Lopez-Armada MJ, Blanco FJ. 2006.Mitochondrial proteomic characterization of human
normal articular chondrocytes. Osteoarthritis Cartilage14:507–518.
Schapira AH. 2006. Mitochondrial disease. Lancet 368:70–82.
Scheffler IE. 1999. Mitochondria. New York: Wiley-LissPublication.
Scheffler IE. 2001. Mitochondria make a come back. AdvDrug Delivery Rev 49:3–26.
Soderholm JD, Yang PC, Ceponis P, Vohra A, Riddell R,Sherman PM, Perdue MH. 2002. Chronic stress inducesmast cell-dependent bacterial adherence and initiatesmucosal inflammation in rat intestine. Gastroenterology123:1099–1108.
Sun AS, Sepkowitz K, Geller SA. 1981. A study of somemitochondrial and peroxisomal enzymes in humancolonic adenocarcinoma. Lab Invest 44:13–17.
Taylor SW, Fahy E, Zhang B, Glenn GM, Warnock DE,Wiley S, Murphy AN, Gaucher SP, Capaldi RA, GibsonBW, Ghosh SS. 2003. Characterisation of the humanheart mitochondrial proteome. Nat Biotechnol 21:281–286.
Toivola DM, Krishnan S, Binder HJ, Singh SK, OmaryMB.2004. Keratins modulate colonocyte electrolyte transportvia protein mistargeting. J Cell Biol 6:911–921.
Tutton PJ, Barkla DH. 1997. Cytotoxicity of 5,6-dihydrox-ytryptamine in dimethylhydrazine-induced carcinomasof rat colon. Cancer Res 37:1241–1244.
Van Der Meer-Van Kraaij C, Van Lieshout EM, Kramer E,Van Der Meer R, Keijer J. 2003. Mucosal pentraxin(Mptx), a novel rat gene 10-fold down-regulated in colonby dietary heme. FASEB J 17:1277–1285.
van Loo G, Saelens X, van Gurp M, MacFarlane M, MartinSJ, Vandenabeele P. 2002. The role of mitochondrialfactors in apoptosis: A Russian roulette with more thanone bullet. Cell Death Differ 9:1031–1042.
Wang H, MacNaughton WK. 2005. Overexpressed beta-catenin blocks nitric oxide-induced apoptosis in coloniccancer cells. Cancer Res 65:8604–8607.
Weinman JS, Feinberg JM, Rainteau DP, Gaspera BD,Weinman SJ. 1994. Annexins in rat enterocytes andhepatocyte: An immunogold electron-microscope study.Cell Tissue Res 278:389–397.
Yang JW, Juranville JF, Hoger H, Fountoulakis M, LubecG. 2005. Molecular diversity of rat brain proteinsas revealed by proteomic analysis. Mol Divers 9:385–396.
Yuki T, Ishihara S, Rumi MA, Ortega-Cava CF, KadowakiY, Kazumori H, Ishimura N, Amano Y, Moriyama N,Kinoshita Y. 2006. Increased expression of midkine in therat colon during healing of experimental colitis. AmJ Physiol Gastrointest Liver Physiol 291:G735–G743.
Rat Colon Mitochondrial Associated Proteins 97