
Profiling the Silent Generation
33
Profiling the Silent Generation: Preferences for Travel Lori Pennington-Gray University of Florida Recreation, Parks and Tourism 300 FLG E-mail: [email protected] Phone: 352-392-4042 Charles W. Lane University of Florida Recreation, Parks and Tourism 300 FLG E-mail: [email protected] Phone: 352-392-4042 Key Words: Silent Generation, Older Adult, Travel Preferences, Attitude, Profile Please send correspondence to: Lori Pennington-Gray, Ph.D., Recreation, Parks and Tourism, University of Florida, 325 Florida Gym, PO Box 118209, Gainesville, FL 32611-8209. Note: Special Thanks is extended to the Canadian Tourism Commission for generously donating the data for this study. The data for the Canadian (1995) Domestic Tourism Market Research Study were originally prepared by Coopers & Lybrand Consulting. Neither the preparer of the original data nor the Canadian Tourism Commission bears any responsibility for the analysis or the interpretations presented here.
Transcript of Profiling the Silent Generation

Profiling the Silent Generation: Preferences for Travel
Lori Pennington-GrayUniversity of Florida
Recreation, Parks and Tourism300 FLG
E-mail: [email protected]: 352-392-4042
Charles W. LaneUniversity of Florida
Recreation, Parks and Tourism300 FLG
E-mail: [email protected]: 352-392-4042
Key Words: Silent Generation, Older Adult, Travel Preferences, Attitude, Profile
Please send correspondence to: Lori Pennington-Gray, Ph.D., Recreation, Parks and Tourism, University of Florida, 325 Florida Gym, PO Box 118209, Gainesville, FL 32611-8209.
Note: Special Thanks is extended to the Canadian Tourism Commission for generously donating the data for this study. The data for the Canadian (1995) Domestic Tourism Market Research Study were originally prepared by Coopers & Lybrand Consulting. Neither the preparer of the original data nor the Canadian Tourism Commission bears any responsibility for the analysis or the interpretations presented here.

2 2
Abstract: The purpose of this study was to profile the travel preferences of the “Silent Generation” and to analyze whether this cohort could be segmented into specific types of travelers based on these preferences. This particular age cohort was born between 1925 and 1943 and is presently between 58 and 76 years of age. The results indicated five distinct clusters: “Active Travelers,” “Urban Mobile Travelers,” “Mobile Budget Travelers,” “Educational Cultural Travelers” and “Uninvolved Travelers.” Each segment sought unique preferences for pleasure travel. With respect to demographic differences between the five clusters of the Silent Generation, only gender and education significantly differed between the groups. Tourism suppliers and marketers must acknowledge that there are differences within cohorts as well as between cohorts and develop products and services that meet their needs.
3 3
INTRODUCTION
The senior segment of the population has had a significant impact on the leisure travel and
tourism industry (Hagan and Uysal, 1991; Travel Industry Association of America, 2001; Zimmer,
Braylet & Searle, 1995). The senior market is formidable both in terms of its present and projected
size and the financial strength of its members (Lieux, Weaver, & McCleary, 1994). Not only is an
absolute increase in the number of seniors is expected, senior’s proportion of the entire population
is expected to increase substantially (You & O’Leary, 2000). By the year 2000, the senior travel
and tourism market in the United States could number 59 million individuals. In that same year,
Canadians who are 55 years of age and older may number approximately 5.6 million (Zimmer,
Brayley & Searle, 1995).
The senior market possesses a very large share of discretionary dollars (Zimmer, et. al.,
1995). According to Linden (1986), half of the discretionary income in the United States is
controlled by people over 50 years old. In 1985, older Americans allocated $20 billion for
vacations (Lieux et. al., 1994). In fact, 76% of senior travelers take at least one pleasure trip per
year, and at least 60% take 2 or 3 pleasure trips per year (Shoemaker, 1989). According to Kelly
(2000), “eighty percent of all leisure travel is done by people older than 50” (p. S8). Rosenfeld
(1986) indicated that Americans over 50 dominate the pleasure travel and tourism market by
traveling more frequently, going farther, and staying away longer, than any other segment of the
population. In fact, we see the age profile of domestic travelers with the highest participation rates
among those who are older. Although members of the senior market clearly have the desire to
travel, little seems to be known about why they travel, how they travel, and their preferences for
pleasure travel (Shoemaker, 1989).

4 4
A predictor that reliably separates travelers from nontravelers is age. As age increases, the
tendency to travel decreases and the selection of near-by destinations increases. Two other
predictors that also have very strong differentiating ability are education and health status. As
education increases, the tendency to travel and to travel to far-away destinations increases. As
health status deteriorates, the tendency to travel decreases (Zimmer et. al., 1995).
In addition to the expected challenges of aging and passing through life’s stages, generations
are thought to share similar preferences for products, services and ideas. Shoemaker (1989)
suggests that the senior market is not one homogeneous group but, in fact, is composed of many
submarkets, each with its own needs. One submarket of the senior market is the cohort to which an
individual belongs. According to Warnick (1993), in order to understand how generations differ, we
must understand what binds them together or characterizes them as distinctly different from other
generations.
Understanding Generations in a Marketing Context
Marketers often segment consumers on factors such as age, sex, income, stage of life, and
geography. Although these methods are often successful, another innovative segmentation
technique is to group consumers into generations (Schewe, Meredith & Noble, in press). A
generation is usually 20-25 years in length and is defined by its years of birth (Schewe, et. al., in
press). Generations are large groups of individuals who are born during the same time period and
journey through life together. Individuals within a generation experience similar external events
during their lifetime (Schewe & Noble, 2000). McPherson (1991) stated that to understand the
preferences and needs of future generations of seniors, we should be studying the particular birth
cohorts.

5 5
Generational groups are highly influenced by the external events that were occurring when
they were “coming of age” (generally between the years 17-23) (Schewe et. al., in press). Each
cohort goes through life experiencing a unique social, political, technological, and economic
environment (Rentz, Reynolds, & Stout, 1983). These environments are thought to influence
individuals by imbedding values that remain throughout life. By experiencing these same
environmental effects, cohorts then share common values, attitudes, beliefs, and behaviors (Schewe
& Noble, 2000).
Cohort-formed values, attitudes, and preferences do not change as a function of age or
lifestyle, therefore, cohort effects are life-long effects (Schewe et. al., in press). Cohorts are formed
by external events occurring during formative years and can be of any length. These similarities
provide the basis for each cohort being targeted as a separate and increasingly profitable market
segment. Simply assuming that tomorrow’s seniors will respond to marketing in similar ways as
today’s seniors may have unfortunate results (Schewe & Noble, 2000).
According to Stoller and Gibson (1996), socio-historical times and membership in a cohort
shape the number and type of opportunities available to individuals. “Each cohort brings to old age
its own unique history, and this past influences the nature of the later years of cohort members”
(Foner, 1986, p. 134). As a collective group, they can be expected, over time, to participate
similarly in activities such as travel (Foot & Stoffman, 1996). In fact, Uhlenberg and Miner (1996)
argued that changes in social structure will alter how different cohorts age, because human behavior
is shaped by the opportunities and constraints imposed by the major social institutions encountered.

6 6
Strauss and Howe’s Generation Theory
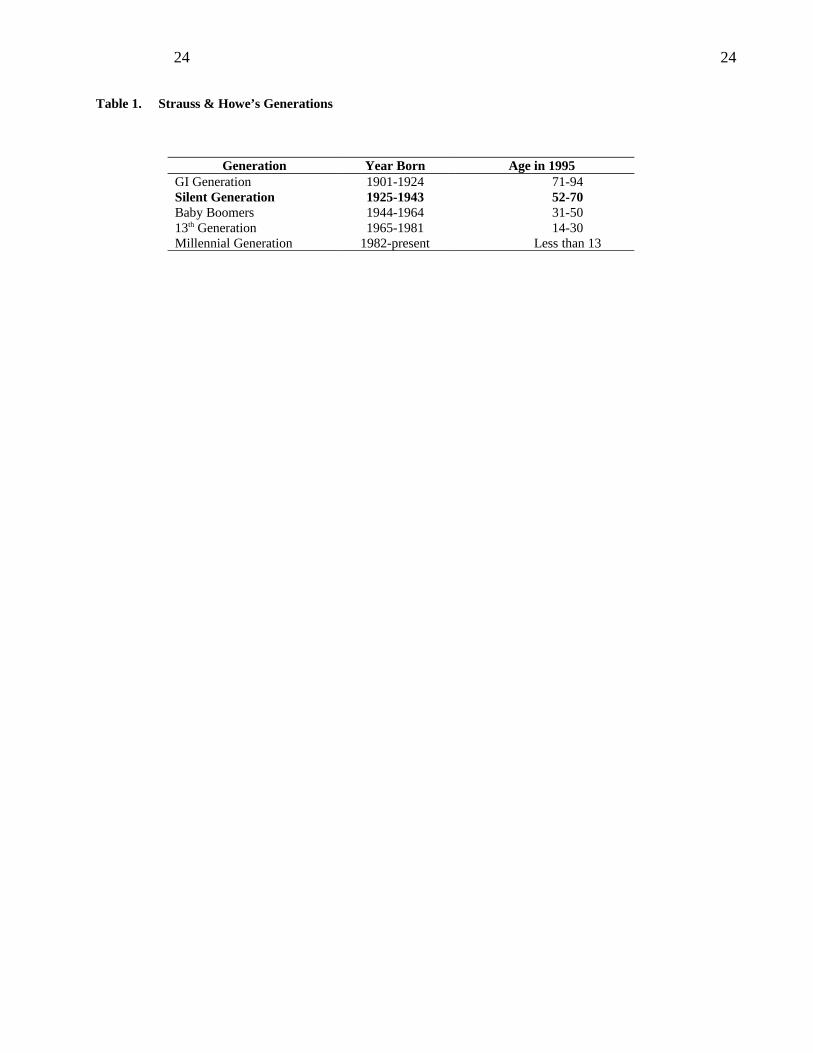
Strauss and Howe (1991) have determined that there are seven generations currently living
in the United States. Two of the generations are in the 90+ age group. The remaining five
generations fall between one year and eighty-nine years of age (Table 1). These generations are
identified by the year that they were born and by their personalities. First, there is the "GI
Generation" born between 1901 and 1924. The next generation is the "Silent Generation," followed
by the "Baby Boomers." After the Boomers, comes the "Thirteenth Generation" or "Generation X."
The last, or youngest generation, is the "Millennial Generation."
Insert Table 1
The generation that is the “youngest” of the older adult population is what Strauss and
Howe (1991) call the “Silent Generation.” They are born between 1925 and 1943. This generation
has been described as the "transitional" generation or "middle" generation. The Silent Generation is
one of caution, indifference, lack of adventure and imagination, and basically just "silent." The first
half of the generation is one born during the depression and, as a result, gives freely to charity, have
a tender social conscience and believe in a fair process more than final results. The last half of the
generation can remember World War II from their childhood, and many joined the Peace Corps to
show their generational bond.
Members of the Silent Generation are the parents of the Baby Boom Generation—one of the
largest current generations. When the Baby Boom Generation, those born roughly between 1946
and 1964, moves into the older age cohorts, a travel boom is likely to occur. The bulk of the
boomers will reach 65+ years just after 2010. Until that time, the growth in the number of seniors

7 7
in the upper age categories will be gradual, with the number of old-old, those 85+, growing much
faster (Warnick, 1993).
Strauss & Howe’s Theory Applied to the Canadian Population
According to Foot and Stoffman (1996), much of the thinking related to attitudinal and
social changes in the United States can also be applied to Canada, because the two countries have
followed a similar generational pattern. Canada’s population pyramid contains a massive bulge,
representing the huge generation of the Baby Boomers. By comparison, Canada’s GI Generation
and Silent Generation are small. The most recent generation, the Millennial Generation, (children
of the Baby Boomers) is a comparatively large generation. This generational pattern is roughly the
same as that of the United States. Therefore, Strauss and Howe’s Theory of Generations may also
be amenable to the Canadian population.
Travel and the Silent Generation
The Silent Generation cohort is a different breed of senior traveler. The Silent Generation’s
domestic travel behavior indicated a decline in participation from 1979 to 1988 (Warnick, 1993).
In 1979, the domestic travel participation rate was 65.5%, and it declined to 53.7% in 1989. The
older half of the Silent Generation, experienced a decline in domestic travel participation from
69.5% in 1979 to a low of 53% in 1986; thereafter it increased slightly to 57.5% in 1991 and
evolved into one of the hot travel market segments of the 1990s (Warnick, 1993).
Warnick (2000) used cohort analysis to track changes in participation rates in selected
recreation activities within and between age categories during the 1980s and 1990s. He concluded
that recreation activities do not have stagnant or fixed participation rates, and that while rate change
8 8
in selected activities may not be dramatic, participation may vary widely over time, by age cohort
and by generation. National trends and generational trends may differ.
Although previous studies have delineated the travel preferences of the Baby Boomer
generation (c.f., Kelly, 2000; Raymond, 2000; Thau & Heflin; 1997), very few analyses have been
conducted which focus on the Silent Generation, and the literature review indicates that none have
looked specifically at preferences for pleasure travel held by members of the Silent Generation.
Therefore, the purpose of this study was to profile the travel preferences of the “Silent Generation”
and to analyze whether this cohort could be segmented into specific types of travelers based on
these preferences.
METHODS
The Domestic Tourism Market Research Study was conducted by Coopers & Lybrand
Consulting in September and October of 1995. The objective of the study was to examine in detail
the attitudes, perceptions and behaviors of Canadians about tourism, travel opportunities and
destinations. The overall purpose of the research was “to determine how best to market Canadian
destinations and products to Canadians and examine possibilities for import substitution.” The
results were based on a combination of telephone and in-person interviews with over 3,300
Canadians in all regions of the country. The data was weighted so that each age, gender and
province was representative of the entire population.
Three sections of the Domestic Tourism Market Research Study were referenced for the
purpose of this study. The first section comprised of one question on the importance of 42
preference statements in pleasure travel planning. Using a 5-point Likert scale, ranging from 1- not
at all important to 5- extremely important, respondents were asked to indicate how important each

9 9
item was to them in their most recent decision to travel for pleasure. The second section included
one question addressing attitudes towards pleasure travel. Eighteen variables were measured on a
four point Likert scale, ranging from “strongly disagree” to “strongly agree.” Finally, section three
included six demographic characteristics: income, number of people under 18 living in the
household, number of people over 18 living in the household, marital status, education and gender.
This study used Strauss and Howe’s (1991) segments of generations. Those 55-64 made up
the “Silent Generation.” Only members of the cohort Silent Generation made up the ultimate
sample. The final sample size was 580. Due to the measurement of age in the original study
(categorical) only those who responded that they were between the ages of 55-64 were examined.
This was deemed appropriate because many demographers have suggested that individuals on either
end of the spectrum or those who are part of the “watershed” years may be different slightly from
the overall generation (Foot & Stoffman, 1995; Strauss & Howe, 1991). Therefore, the resultant age
bracket of Silent Generation members should provide a more concise picture of this generation’s
preference for pleasure travel.
Data were analyzed using the Statistical Package for the Social Sciences (SPSS). Initially,
descriptive statistics were referenced. Then, a principal components analysis with varimax rotation
was computed to determine how many dimensions of preferences existed. Alpha coefficients were
referenced to confirm the results of the principal components analysis. A cluster analysis was
performed on the resulting factors to identify groups of individuals who responded similarly to the
preference dimensions. This analysis employed a two-step sequential clustering analysis on the
factor scores to identify the cluster/segment solution. Additionally, analysis of variance and
discriminant analysis procedures were computed to better understand the cluster analysis results.
Crosstab procedures were employed to examine the relationship between the resulting clusters of

10 10
“types” of people in the Silent Generation and demographic variables. Finally, ANOVA with
Scheffe post hoc tests were employed to analyze seventeen attitude statements in relation to the five
clusters.
RESULTS
The sample over represented women slightly with 62% females and 38% males (Table 2).
The majority of the sample (73%) were married or living with someone. One half (50%) had
attended some high school or graduated from high school. A large portion (62%) of the sample
reported an annual household income of less than the $50,000 per year. Just over one quarter were
retired (26%) and approximately one quarter were employed in blue collar jobs (24%).
Insert Table 2
Descriptive statistics of the forty-two preference statements revealed that “standards of hygiene
and cleanliness” (mean=3.66) had the highest mean score, followed “personal safety” (mean=3.62)
and “nice weather.” The preference statements which were least important to the sample were
“alpine skiing” (mean=1.29), “campground and trailer parks” (mean=1.63) and “golf” (mean=1.64)
(see Appendix).
The 42 preference statements were factor analyzed using a principle components analysis with a
varimax rotation. The final solution produced twelve factors with eigenvalues greater than 1.0 and
explaining almost 60% of the variance. Based on convention, items with factor loadings greater
than .40 were selected for each factor. The original 42 preference statements loaded on the 12
factors (Table 3).
11 11
Insert Table 3
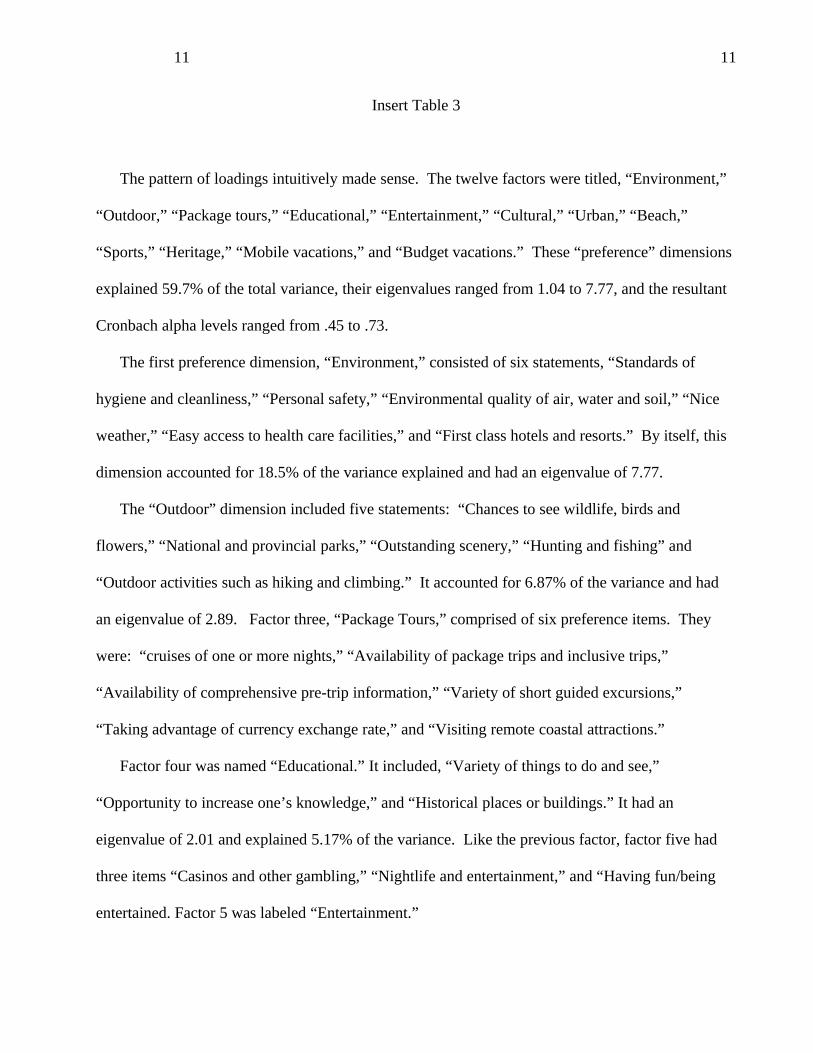
The pattern of loadings intuitively made sense. The twelve factors were titled, “Environment,”
“Outdoor,” “Package tours,” “Educational,” “Entertainment,” “Cultural,” “Urban,” “Beach,”
“Sports,” “Heritage,” “Mobile vacations,” and “Budget vacations.” These “preference” dimensions
explained 59.7% of the total variance, their eigenvalues ranged from 1.04 to 7.77, and the resultant
Cronbach alpha levels ranged from .45 to .73.
The first preference dimension, “Environment,” consisted of six statements, “Standards of
hygiene and cleanliness,” “Personal safety,” “Environmental quality of air, water and soil,” “Nice
weather,” “Easy access to health care facilities,” and “First class hotels and resorts.” By itself, this
dimension accounted for 18.5% of the variance explained and had an eigenvalue of 7.77.
The “Outdoor” dimension included five statements: “Chances to see wildlife, birds and
flowers,” “National and provincial parks,” “Outstanding scenery,” “Hunting and fishing” and
“Outdoor activities such as hiking and climbing.” It accounted for 6.87% of the variance and had
an eigenvalue of 2.89. Factor three, “Package Tours,” comprised of six preference items. They
were: “cruises of one or more nights,” “Availability of package trips and inclusive trips,”
“Availability of comprehensive pre-trip information,” “Variety of short guided excursions,”
“Taking advantage of currency exchange rate,” and “Visiting remote coastal attractions.”
Factor four was named “Educational.” It included, “Variety of things to do and see,”
“Opportunity to increase one’s knowledge,” and “Historical places or buildings.” It had an
eigenvalue of 2.01 and explained 5.17% of the variance. Like the previous factor, factor five had
three items “Casinos and other gambling,” “Nightlife and entertainment,” and “Having fun/being
entertained. Factor 5 was labeled “Entertainment.”

12 12
Factors 6, 9, 11 and 12 all had two items. They were labeled “Cultural activities,” “Sports
vacations,” “Mobile vacations,” and “Budget vacation” respectively. The ranged in variance
explained from 2.48% to 3.14%, respectively and had eigenvalues that ranged from 1.04 to 1.53.
Factor seven, “Urban Vacation” had four items, “Shopping,” “Theme parks and amusement parks,”
“Activities for the entire family,” and “Modern cities.” It accounted for 3.64% of the variance.
“Beach vacations” was the label for factor eight. It included three items “Beaches for swimming
and sunning” “Water sports,” and “Alpine skiing.” Cronbach alpha analysis revealed that
eliminating “Alpine skiing” would increase the score from .34 to .55, so this was done. The final
dimension accounted for 3.08% of the variance. Finally, factor ten “Heritage vacations” included
three items “Interesting and friendly local people,” “Opportunity to see or experience aboriginal
cultures,” and “Local cuisine.” This factor had an explained variance of 2.78% and a Cronbach
alpha of .60.
It should be noted that the most important preferences (based on overall mean score) were
Environmental factors, Educational and Heritage. The least important were Sports, Mobile and
Beach. The means on the twelve dimensions ranged from a low of 1.83 to a high of 3.45, indicating
the range in importance of the dimensions, overall.
Identification of Clusters
Cluster analysis was applied to identify groups of respondents based on similar responses to the
twelve preference dimensions. Initially, a Ward’s hierarchical clustering method was used to
determine the number of clusters. Examination of the dendrograms and agglomeration coefficients
suggested five clusters. This number was then used in a follow-up K-means cluster analysis.
13 13
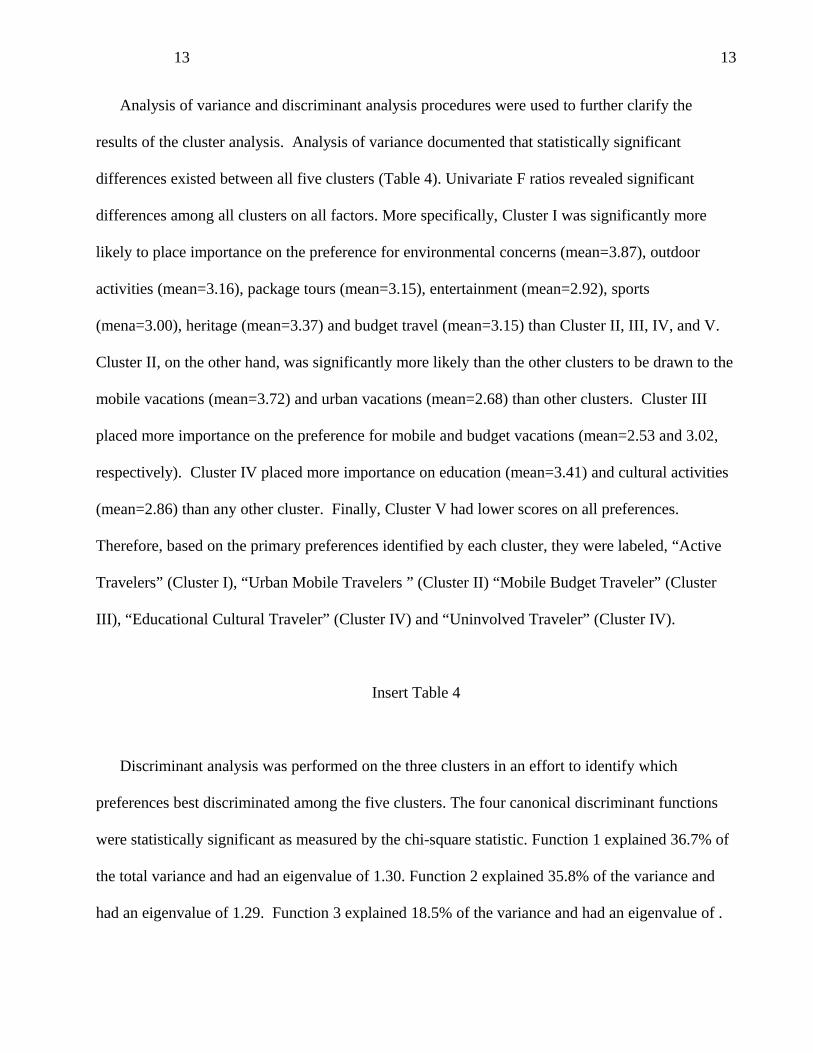
Analysis of variance and discriminant analysis procedures were used to further clarify the
results of the cluster analysis. Analysis of variance documented that statistically significant
differences existed between all five clusters (Table 4). Univariate F ratios revealed significant
differences among all clusters on all factors. More specifically, Cluster I was significantly more
likely to place importance on the preference for environmental concerns (mean=3.87), outdoor
activities (mean=3.16), package tours (mean=3.15), entertainment (mean=2.92), sports
(mena=3.00), heritage (mean=3.37) and budget travel (mean=3.15) than Cluster II, III, IV, and V.
Cluster II, on the other hand, was significantly more likely than the other clusters to be drawn to the
mobile vacations (mean=3.72) and urban vacations (mean=2.68) than other clusters. Cluster III
placed more importance on the preference for mobile and budget vacations (mean=2.53 and 3.02,
respectively). Cluster IV placed more importance on education (mean=3.41) and cultural activities
(mean=2.86) than any other cluster. Finally, Cluster V had lower scores on all preferences.
Therefore, based on the primary preferences identified by each cluster, they were labeled, “Active
Travelers” (Cluster I), “Urban Mobile Travelers ” (Cluster II) “Mobile Budget Traveler” (Cluster
III), “Educational Cultural Traveler” (Cluster IV) and “Uninvolved Traveler” (Cluster IV).
Insert Table 4
Discriminant analysis was performed on the three clusters in an effort to identify which
preferences best discriminated among the five clusters. The four canonical discriminant functions
were statistically significant as measured by the chi-square statistic. Function 1 explained 36.7% of
the total variance and had an eigenvalue of 1.30. Function 2 explained 35.8% of the variance and
had an eigenvalue of 1.29. Function 3 explained 18.5% of the variance and had an eigenvalue of .

14 14
65 and Function 4 explained 9.0% of the variance and had an eigenvalue of .32. Classification
matrices also were examined to determine whether the functions were good predictors. Table 5
indicates the high degree of classification accuracy; 89.4% of the cases were correctly classified.
Insert Table 5
In order to better understand the five clusters, the Chi-square procedure was adopted to
determine if there were any statistically significant differences among the five cluster groups. Table
6 provides the results of this analysis.
Insert Table 6
The Chi-square analysis revealed that clusters were only significantly different with regard to
education and gender. Cluster II (Urban Mobile Traveler) was comprised of less educated females
than Clusters I, III, IV and V. Cluster I (Active Travelers) was more inclined to be males who
graduated college or university. Cluster III (Mobile Budget Travelers) was made up of mostly
females with a high school diploma or less. Cluster IV (Educational Cultural Traveler) consisted
of higher educated females with higher incomes. Finally, Cluster V had the greatest number of
people with only primary school education (7.5%) and the greatest number of individuals who had
some college or university.
It is interesting to note, however, that all five clusters indicated a variety of marital statuses,
income levels and number of people living in the home. For example, Cluster I (Active Travelers)
had more widows/widowers (9.5%) and the largest portion of middle income earners (31.4%).

15 15
Cluster II (Urban Mobile Travelers) had more two household families who were married (78.0%)
earning $35,000 to $49,999 (27.5%). Cluster III (Mobile Budget Travelers) had more low income
earners (36.4%) and the greatest number of two family homes (68.0%). Cluster IV were more
likely to have high incomes (31.8%) and be single than other clusters and Cluster V was
represented by single parent homes (8.5% were single, 7.4% had 2 children under 18 years).
Identification of Attitudes of the Five Clusters
Descriptive statistics of the seventeen attitude statements revealed that “getting good value for
my money is important to me” (mean=3.72) had the highest mean score, followed “For me, money
spent on travel is well spent” (mean=3.65) and “I travel for leisure whenever I can afford to” (Table
7). The attitude statements which were least important to the sample were “I generally like to go to
the same place every year for my holiday” (mean=2.02), “Long distance travel is more of a hassle
than a holiday” (mean=1.69) and “I do not really like to travel” (mean=1.32).
Insert Table 7
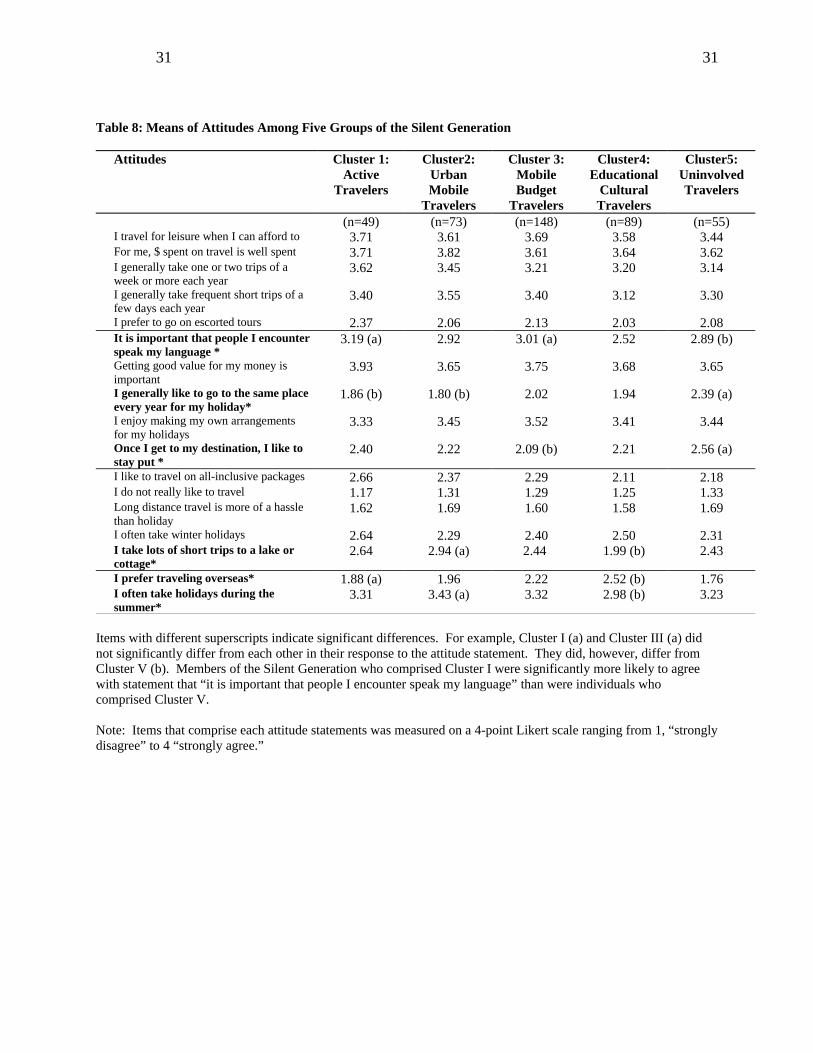
Of the seventeen attitude statements towards pleasure travel, analysis of variance revealed
differences between six statements and the five generational Clusters (Table 8). Those differences
were seen among: “It is important that people I encounter speak my language,” “I generally go to
the same place every year for my holiday,” “Once I get to my destination, I like to stay put,” “I take
lots of short trips to a lake or cottage,” “I prefer traveling overseas,” and “I often take holidays
during the summer.”
16 16
Insert Table 8
The Scheffe post hoc test revealed differences between Clusters I and III, IV. Members of the
Silent Generation who comprised Cluster I were more likely to agree with the statement “It is
important that people I encounter speak my language.” Members of Cluster V were significantly
more likely to agree that “I generally like to go to the same place every year for my holiday” than
Cluster I and II and “Once I get to my destination, I like to stay put” than Cluster III. Those who
comprised Cluster IV were more likely to agree that they preferred travelling overseas than Cluster
I and less likely to agree that they often take holidays during the summer than Cluster II. Finally,
those in Cluster II were more likely to say they take lots of short trips to a lake or cottage than
Cluster IV.
DISCUSSION
The purpose of this study was to document the preferences for pleasure travel for members of
the Silent Generation and to analyze whether they could be segmented into specific types of visitors
based on these preferences. The results indicated that generally the preferences by members of the
Silent Generation follow a traditional pattern as identified in previous research (Showemaker, 1993;
Blazey, 1986). The most important individual preference items included those related to the
environment: standards of cleanliness, safety, weather and environmental quality of air and water.
With respect to the way in which items loaded on to preference dimensions, many of the twelve
dimensions have been identified in the literature (i.e., price, outdoor recreation, beaches, culture,
package tours). Given that this sample had an overrepresentation of females, this makes sense. This
overrepresentation may be in part to the longer life span of females.

17 17
The most important preference dimension for members of the Silent Generation was the
Environmental Dimension. This dimension included such things as: safety, standards of cleanliness
and hygiene, weather and easy access to health care facilities. Again, given this generation is
dominated by females from the WWII era, this may not be surprising. Previous research as
indicated that safety is a concern for this group (Howell, Moreo & DeMicco, 1993; Martinage,
1999; Pennington-Gray, 1994).
The second interesting finding was that “Education” (which included items such as
“Opportunity to increase one’s knowledge” “Variety of things to see and do” and “Historical places
and buildings”) was the next most important factor to members of the Silent Generation. Research
has indicated that education influences one’s preference for travel (see Gitelson and Kerstetter
1990). This study supports this notion. The overall mean on this dimension was 3.07. This suggests
that the preference for learning while traveling is a large component of the older generations travel
preferences. In fact, the top activities identified by Travel Industry of America (2001) for the
“Mature Generation” (those 55+) are visiting historical places or museums (15%), attending
cultural events and festivals (12%) and gambling (11%). In addition, the growth in edu-travel
supports this finding (Holdnak & Holland, 1996). When examining the demographic profiles of this
cluster, findings revealed that this group contained more females and higher levels of education.
This finding supports previous research that indicates women tend to place high preference on
traveling for education (Pennington-Gray & Kerstetter, 1999).
The third interesting finding was the presence of the Mobile vacation dimension and the budget
vacation. These dimensions were comprised of items that focused on price and value of travel:
budget accommodations, campgrounds and trailer parks, inexpensive restaurants and high quality
restaurants. Interestingly, these issues are consistent with Strauss and Howe’s profile of the Silent

18 18
Generation. Strauss and Howe (1991) suggest that this generation tends to be frugal and price
sensitive because they were children of the depression and grew up during “sparing” times. In
addition, this issue may be more germane to the Canadian population than a U.S. population
because of relative weakness of the Canadian dollar, which influences Canadians ability to travel to
“warmer” destinations. The extent to which price plays a role in all older adults’ preference for
travel has not been adequately documented and warrants further attention.
It is not surprising that the urban vacation preference was dominated by single women with
lower incomes who live in families with children under the age of 18. Preferences for modern
cities, theme parks, shopping and activities for the entire family suggest that perhaps this segment is
the “grandmother” segment that is traveling with grandchildren. Bradford (1998) suggests that
“Grand-travel” is a viable and distinct segment of the pleasure travel market and continually
growing. He indicates that “Grand-travel” packages have reported explosive growth in demand
over the past few years (1998). Marketers would do well to recognize the preferences for this
market and to continue to develop products that respond to these preferences.
When cluster and discriminant analyses were applied to identify groups of respondents, five
distinct clusters emerged: “Active Travelers,” “Urban Mobile Travelers,” “Mobile Budget
Travelers,” “Educational Cultural Travelers” and “Uninvolved Travelers.” According to this
finding there are five distinct types of travelers, all of whom seek unique preferences for pleasure
travel. Crompton (1979) and Showemaker (1993) contended that the travel market is not
homogeneous and that individuals seek multiple preferences from their travel experiences. This
study’s findings support their arguments. The Silent Generation appears to have diverse interests
regarding their preferences and attitudes towards pleasure travel.

19 19
With respect to demographic differences between the five clusters of the Silent Generation, only
gender and education significantly differed between the groups. This is interesting in that Blazey
(1987) suggests that income would have differentiated between groups. This may be due to the fact
that this sample had a high percentage of retired individuals and was more homogeneous with
respect to income.
More revealing was the relationship between the attitude statements and the five clusters. It was
understandable that the members of the “Uninvolved Traveler” group also indicated that they
preferred to stay put once they got to their destination and that they liked going to the same
destination every year. This group appeared to be less “involved” with pleasure travel and may even
lend support to the argument that some people just don’t like to travel (Pennington-Gray & White,
in press).
In addition, the “Active Traveler”, those who preferred a variety of travel activities, indicated it
was more important that people they encounter speak their language than the “Educational Cultural
Traveler” and the “Uninvolved Traveler.” This is consistent with Cohen’s typology (1979b) of the
tourist, where the “Mass tourist” is more likely to operate in the tourist bubble and less likely to
venture out into the host’s environment.
Cluster II, the “Urban Mobile Traveler” tended to take many short trips to a lake or cottage and
often take holidays during the summer. Again, examining their preferences for modern cities, trailer
parks and campgrounds supports these attitudes. Finally, the “Educational Cultural Traveler”
indicated that they preferred traveling overseas. This makes sense when examining the
demographics of this group. Members of this group tended to have higher educational levels and
higher income levels.

20 20
The results of this study do suggest that there are some unique preferences held by members of
the Silent Generation. This is an important preliminary finding. Although previous research has
focused on the senior market or the older adult market, to date a profile of members of the Silent
Generation has not existed.
Future Research
Traditional research has suggested that aging affects one’s preference for travel. However,
“Cohort Theory” would suggest that different generations should behave differently based on
“epochal” events that have affected the attitudes and preferences. Further research must look at
comparing and contrasting these generations to see the influence of “epochal events” on one’s
preference for travel. Did growing up as depression era children, like the Silent generation did,
influence their strong preference for economical travel? Will Baby Boomers, who are reported to be
the wealthiest generation to have ever lived, also be frugal when it comes to travel? These questions
still remain to be answered.
This study has provided the first “glimpse” at the preferences and attitudes for pleasure travel
held by members of the Silent Generation. However, the question remains… How similar will the
travel preferences for this generation be to the up coming Baby Boomer generation? Can we expect
similar “profiles” of travelers in the Baby Boomer Generation? Will attitudes towards travel be
consistent among the two generations? As the first baby boomers join the 55 plus demographic next
year, future research on the similarities and differences among members of the Silent Generation
and the Baby Boomer Generation is necessary. This study has provided a profile of the existing
older adult generation. This profile may provide a basis for comparison in the years to come.
21 21
References
Cohen, E. (1979d). Sociology of tourism. Annals of Tourism Research, 6(1), 18-194 (spec. issue).
Crompton, J. L., (1979). Motivations for pleasure vacation. Annals of Tourism Research, 6 (4): 408-424.
Foot, D. & D. Stoffman. (1996). Boom, bust & echo: How to profit from the coming demographic shift Toronto: Macfarlane, Walter & Ross.
Foner, A. (1986). Aging and old age: New perspective. Englewood Cliffs, NY: Prentice Hall.
Gitelson, R. J., and Kerstetter, D. L. (1990). The Relationship between sociodemographic variables, benefits sought and subsequent vacation behavior: A case study. Journal of Travel Research, 28 (3): 24-29.
Hagan, L. A. and M. Uysal (1991). An examination of motivations and activities of pre-retirement (50-64) and post-retirement (65-99) age groups for a tourism group. Proceedings of the Twenty-Second Annual Conference of the Travel and Tourism Research Association, Long Beach, CA.
Holdnak, A. & Holland, S. (1996). Edu-Tourism: Vacationing to learn - American's quest for adventure and thirst for knowledge have created a new type of tourism where vacationers participate in educational activities as they enjoy exotic locations. Parks and Recreation Magazine, 31 (9), 72-80.
Howell, R., Moreo, P., and DeMicco, F. (1993). A qualitative analysis of hotel services desired by female business travelers. Journal of Travel and Tourism Marketing, 1 (4): 115-132.
Kelly, C. (2000). Active lifestyle central to targeting. Advertising Age. 71 (29), S8
Lieux, E. M., Weaver, P. A., & McCleary, K. W. (1994). Lodging preferences of the senior tourism market. Annals of Tourism Research, 21, 712-728.
Linden, F. The $800 billion market. American Demographics, 8(2), 5-6.
Martinage, D. A. (1999). Business women and violence. Association Management, 41 (8), 65-69.
McPherson, B. D. (1990). Aging as a social process: An introduction to individual and population
aging. Markham, ONT: Butterworths.
Pennington-Gray, L. (1994). The impact of socio-demographic and travel behavior variables on benefits sought by college educated women who travel for pleasure. Unpublished master’s thesis. The Pennsylvania State University, State College.

22 22
Pennington-Gray, L. & D. Kerstetter (1999). Perceived constraints to nature-based tourism: A case study of women living in the midwest. Travel Tourism Research Association Conference Proceedings, June 11-14, Halifax, Nova Scotia.
Pennington-Gray, L., & Kerstetter, D. L. (in press). Examining travel preferences of older Canadian adults over time. Journal of Hospitality and Leisure Marketing.
Pennington-Gray, L. & E. White (in press). The leisure behavior paradox:Profiling those who say they don’t like to travel. The Journal of Teaching in Travel and Tourism.
Raymond, J. (2000). The joy of empty nesting. American Demographics. 22 (5): 48-54.
Rentz, J. O., Reynolds, F. D., & Stout, R. G. (1983). Analyzing changing consumption patterns with cohort analysis. Journal of Marketing Research, 20, 12-20.
Rosenfeld, J. (1986). Demographics on vacation. American Demographics, 8(1), 39-41.
Schewe, C. D., Meredith, G. E., & Noble, S. M. (in press). Cohort segmentation: Where past, present and future collide. Journal of Marketing Research.
Schewe, C. D., & Noble, S. M. (2000). Market segmentation by cohorts: The value and validity of cohorts in America and abroad. Journal of Marketing Management, 16, 129-142.
Shoemaker, S. (1989). Segmentation of the senior pleasure travel market. Journal of Travel Research, 27(3), 14-21.
Strauss, W., & Howe, N. (1991). Generations: The history of America’s future, 1584-2069. New York: Quill.
Stoller, E., & Gibson, R. (1996). Worlds of difference: Equality in the aging experience (2nd ed.). Thousand Oaks, CA: Pine Forge.
Swain, M. (1995). Gender in tourism. Annals of Tourism Research, 22 (2): 247-266.
Thau, R. D. & J. S. Heflin (1997). Generations Apart. Prometheus Books: New York.
Travel Industry Association of America (2001). Newsline: February 2001. Travel Industry Association of America. Washington. D. C.
Uhlenberg, P., & Miner, S. (1996). Life course and aging: A cohort perspective. In R. Binstock & L. George (Eds.), Handbook of aging and the social sciences (pp. 208-229). San Diego: Academic Press.

23 23
Warnick, R. B. (2000). Recreation participation trends: Generational patterns and change. Trends 2000- 5 th Outdoor Recreation and Tourism Trends Symposium – Shaping the Future. Michigan State University: Department of Recreation, Parks and Tourism. East Lansing, Michigan. Conference Paper and Abstract
Warnick, R. B. (1993). U.S. domestic travel: Back to the future: The impact of an aging U.S. population on domestic travel trends. In 1993 Annual Review of Travel, Vol. 2(1) (pp. 73-89). New York: American Express Travel Related Services.
Warnick, R. (1993). Back to the Future: U.S. Domestic Travel and Generational Trends, 1979 to 1991. Paper presented at the Resort and Commercial Recreation Association, Mohonk Mountain House, New Paltz, New York, November 1993.
Warnick, Rodney B. and Dennis R. Howard. (1996). Market share analysis in selected sport and recreational activities: 1979 to 1993. Journal of Park and Recreation Administration. Vol. 14 (2).
You, X., & O’Leary, J. T. (2000). Age and cohort effects: An examination of older Japanese travelers. Journal of Travel & Tourism Marketing, 9(1/2), 21-42.
Zimmer, Z., Brayley, R. E., & Searle, M. (1995). Whether to go and where to go: Identification of important influences on seniors’ decisions to travel. Journal of Travel Research, 33 (3), 3-10.
24 24
Table 1. Strauss & Howe’s Generations
Generation Year Born Age in 1995GI Generation 1901-1924 71-94Silent Generation 1925-1943 52-70Baby Boomers 1944-1964 31-5013th Generation 1965-1981 14-30Millennial Generation 1982-present Less than 13

25 25
Table 2: Demographic Profile of the Silent GenerationCharacteristics (n=590) %Number of people per household under 18
0 84.91 8.52 4.73 or more 1.9
Number of people per household over 18 (respondent =1)
2 59.03 or more 23.21 17.8
Marital statusMarried or living with someone 72.5Separated or Divorced 11.2Widow/Widower 8.3Single 7.5
EducationGraduated from high school (grade 12) 25.9Some high school 23.2Some college or university 12.4Bachelor's degree 12.4Graduated from college 7.1Primary school (grades 1-7) 5.9Graduated from technical/vocational school 5.9Masters or Doctorate 5.4
GenderFemale 62.4Male 37.6
IncomeLess than $35,000 29.2$35,000 to $50,000 18.6$50,999 to $75,000 15.9$75,999 to $100,000 9.0over $100,000 4.2
OccupationRetired 26.1Other 25.4Blue Collar 23.7White collar 16.8Self employed 5.1Unemployed 2.9

26 26
Table 3: Factor Analysis Results of 25 Preference Statements
Preference Statements
Res
ult
ant
Fac
tor M
ean
*
Sta
nd
ard
Dev
iati
on
Val
id N
um
ber
of
Cas
es
Eig
enva
lue
Cro
nb
ach
al
ph
a
Per
cen
tage
of
vari
ance
Cu
mu
lati
ve
vari
ance
Factor 1: Environmental Conditions 3.45 0.58 465 7.77 0.71 18.5 18.5Standards of hygiene and cleanliness .78Personal safety .73Environmental quality of air, water & soil .68Nice weather .51Easy access to health care facilities .43First class hotel and resorts .37
Factor 2: Outdoor activities 2.52 0.63 471 2.89 0.66 6.87 25.4Chances to see wildlife, birds, flowers .73National or provincial parks .73Outstanding scenery .48Hunting or fishing .45Outdoor activities such as hiking, climbing .44
Factor 3: Package tours 2.43 0.68 452 2.17 0.72 5.17 30.6Cruises of one or more nights .68Availability of package trips and inclusive .61Availability of comprehensive pre-trip info. .59Variety of short guided excursions .59Taking advantage of currency exchange rate .43Visiting remote coastal attractions .41
Factor 4: Educational 3.07 0.71 471 2.01 0.71 4.79 35.4Variety of things to do and see .72Opportunity to increase one’s knowledge .69Historical places or buildings .56
Factor 5: Entertainment 2.25 0.68 474 1.55 0.57 3.69 39.1Casinos or other gambling .75Nightlife and entertainment .61Having fun/being entertained .51
Factor 6: Cultural activities 2.41 0.86 476 1.53 0.50 3.64 42.7Museums and art galleries .75Arts and cultural attractions .71
Factor 7: Urban vacation 2.38 0.67 462 1.32 0.50 3.14 45.8Shopping .69Theme parks and amusement parks .62Activities for the entire family .45Modern cities .43
Factor 8: Beach vacation 1.86 0.68 474 1.30 0.55 3.08 48.9Beaches for sunbathing and swimming .70Water sports .70Alpine skiing** .44
Factor 9: Sports vacation 1.83 0.79 475 1.24 0.73 2.95 51.9Golf .75Spectator sporting events .59
Factor 10: Heritage 2.77 0.69 469 1.17 0.60 2.78 54.7Interesting and friendly local people .67Opportunity to experience aboriginal cultures .59Local cuisine .49
Factor 11: Mobile vacation 1.85 0.88 473 1.10 0.52 2.61 57.3High quality restaurants .80Campground and trailer parks .74
Factor 12: Budget vacation 2.63 0.80 468 1.04 0.45 2.48 59.7Budget accommodations .73Inexpensive restaurants .67
* Each preference dimension was measured on a 4-point Likert scale ranging from 1, “never important” to 4 “always important.”** Item eliminated based on results of Reliability Analysis

Table 4: Means of Preference Dimensions Among Five Groups of the Silent Generation
Preference Dimension Cluster 1:Active
Travelers
Cluster 2: Urban Mobile
Travelers
Cluster 3:Mobile Budget
Travelers
Cluster 4:Educational
Cultural Travelers
Cluster 5:Uninvolved Travelers
F-ratio
Sig. level
(n=49) (n=73) (n=148) (n=89) (n=55)Factor 1: Environmental 3.87 3.76 3.49 3.28 3.21 23.5 .000Factor 2: Outdoor activities 3.16 3.05 2.49 2.35 2.23 46.6 .000Factor 3: Package tours 3.15 2.80 2.34 2.43 2.02 48.9 .000Factor 4: Educational 3.23 3.24 2.73 3.41 2.48 38.3 .000Factor 5: Entertainment 2.92 2.30 2.36 2.11 1.91 80.9 .000Factor 6: Cultural activities 2.82 2.56 2.26 2.86 1.66 46.8 .000Factor 7: Urban vacation 2.28 2.68 2.26 2.26 2.02 32.0 .000Factor 8: Beach vacation 2.70 2.09 1.77 1.87 1.53 48.7 .000Factor 9: Sports vacation 3.00 1.89 1.57 1.50 1.97 18.5 .000Factor 10: Heritage 3.37 3.08 2.64 2.86 2.32 63.9 .000Factor 11: Mobile vacation 1.65 2.72 2.53 1.38 1.32 107.1 .000Factor 12: Budget vacation 3.15 2.25 3.02 2.58 2.18 61.7 .000
Note: Items that comprise each preference dimension were measured on a 4-point Likert scale ranging from 1, “never important” to 4 “always important.”

28 28
Table 5: Classification Results
Group No. of Cases 1 2 3 4 5% % % % %
1 49 92.9 2.4 2.4 2.4 0.02 73 8.0 90.0 0.0 2.0 0.03 148 0.9 6.4 87.3 2.7 2.74 89 0.8 1.7 1.7 86.4 9.35 55 2.1 4.3 0.0 0.0 93.6
Note: 89.4% of the cases were correctly classified

29 29
Table 6: Demographic Profiles of Silent Generation Travelers
Characteristics Cluster 1:Active
Travelers
Cluster 2: Urban Mobile
Travelers
Cluster 3:Mobile Budget
Travelers
Cluster 4:Educational
Cultural Travelers
Cluster 5:Uninvolved Travelers
(n=49) (n=73) (n=148) (n=89) (n=55)Number of people under 18 % % % % %
0 78.6 88.0 85.5 85.6 88.31 16.7 6.0 6.4 9.3 4.32 2.4 6.0 7.3 2.5 7.43 2.4 0.0 0.9 2.5 0.0
Number of people over 181 23.8 16.0 20.0 14.4 17.02 42.9 68.0 57.3 61.9 63.83 33.3 16.0 22.7 23.7 19.1
Marital StatusSingle 7.1 8.0 3.6 8.5 8.5Married or live with someone 73.8 78.0 74.5 72.6 76.6Separated or Divorced 9.5 10.0 14.5 11.1 9.6Widow/Widower 9.5 4.0 7.3 7.7 5.3
Education**Primary School (grade 1-7) 4.9 0.0 7.3 2.6 7.5Some high school 12.2 28.0 20.9 14.5 19.4Graduated high school 31.7 30.0 30.0 16.2 33.3Graduated technical school 4.9 6.0 5.5 5.1 5.4Some college or university 12.2 16.0 15.5 17.9 18.3Graduate college or university 19.5 4.0 4.5 10.3 1.1Bachelor’s degree 12.2 6.0 12.7 18.8 15.1Masters or doctorate 2.4 10.0 3.6 14.5 0.0
Gender*Female 45.2 64.0 67.3 69.5 59.6Male 54.8 36.0 32.7 30.5 40.4
IncomeLess than $34,999 25.7 29.5 36.4 23.4 32.3$35,000 to $49,999 20.0 27.3 25.0 25.5 27.7$50,000 to $74,999 31.4 18.2 26.1 27.7 20.2$75,000 to $99,999 20.0 11.4 9.1 16.0 12.3Over $100,000 2.9 13.6 3.4 31.8 7.7
Note: * significant at the .05 level and ** significant at the .01 level

30 30
Table 7 : Attitudes and Travel Preferences and Resultant F Scores of The Silent Generation
Attitude Statements Mean Std. Dev. F Score Sig. Getting value for my money is important to me 3.72 0.58 2.08 0.08 For me, money spent on travel is well spent 3.65 0.57 1.49 0.24 I travel for leisure whenever I can afford to 3.58 0.68 2.26 0.06 I enjoy making my own arrangements for my holidays 3.43 0.80 0.56 0.69 I take frequent short trips of a few days each year 3.28 0.98 2.45 0.45 I generally take one or two trips of a week or more each year 3.20 1.05 0.77 0.54 I often take holidays during the summer 3.19 1.05 2.38 0.05 It is important that people I encounter speak my language 2.87 1.12 4.33 0.00 I often take winter holidays 2.45 1.16 0.93 0.45 I take lots of short trips to a lake or cottage 2.34 1.28 5.76 0.00 Once I get to my destination, I like to stay put 2.28 1.11 2.75 0.03 I like to travel on all-inclusive packages 2.26 1.14 2.09 0.08 I prefer to go on escorted tours 2.15 1.14 0.72 0.58 I prefer travelling overseas 2.10 1.12 7.17 0.00 I generally go to the same place every year for my holiday 2.02 1.01 4.29 0.00 Long distance travel is more of a hassle than a holiday 1.69 1.01 0.24 0.92 I do not really like to travel 1.32 0.73 0.49 0.74 Note: Items that comprise each attitude statement were measured on a 4-point Likert scale ranging from 1 “strongly disagree” to 4 “strongly agree.”
31 31
Table 8: Means of Attitudes Among Five Groups of the Silent Generation
Attitudes Cluster 1:Active
Travelers
Cluster2: Urban Mobile
Travelers
Cluster 3:Mobile Budget
Travelers
Cluster4:Educational
Cultural Travelers
Cluster5:Uninvolved Travelers
(n=49) (n=73) (n=148) (n=89) (n=55)I travel for leisure when I can afford to 3.71 3.61 3.69 3.58 3.44For me, $ spent on travel is well spent 3.71 3.82 3.61 3.64 3.62I generally take one or two trips of a week or more each year
3.62 3.45 3.21 3.20 3.14
I generally take frequent short trips of a few days each year
3.40 3.55 3.40 3.12 3.30
I prefer to go on escorted tours 2.37 2.06 2.13 2.03 2.08It is important that people I encounter speak my language *
3.19 (a) 2.92 3.01 (a) 2.52 2.89 (b)
Getting good value for my money is important
3.93 3.65 3.75 3.68 3.65
I generally like to go to the same place every year for my holiday*
1.86 (b) 1.80 (b) 2.02 1.94 2.39 (a)
I enjoy making my own arrangements for my holidays
3.33 3.45 3.52 3.41 3.44
Once I get to my destination, I like to stay put *
2.40 2.22 2.09 (b) 2.21 2.56 (a)
I like to travel on all-inclusive packages 2.66 2.37 2.29 2.11 2.18I do not really like to travel 1.17 1.31 1.29 1.25 1.33Long distance travel is more of a hassle than holiday
1.62 1.69 1.60 1.58 1.69
I often take winter holidays 2.64 2.29 2.40 2.50 2.31I take lots of short trips to a lake or cottage*
2.64 2.94 (a) 2.44 1.99 (b) 2.43
I prefer traveling overseas* 1.88 (a) 1.96 2.22 2.52 (b) 1.76I often take holidays during the summer*
3.31 3.43 (a) 3.32 2.98 (b) 3.23
Items with different superscripts indicate significant differences. For example, Cluster I (a) and Cluster III (a) did not significantly differ from each other in their response to the attitude statement. They did, however, differ from Cluster V (b). Members of the Silent Generation who comprised Cluster I were significantly more likely to agree with statement that “it is important that people I encounter speak my language” than were individuals who comprised Cluster V.
Note: Items that comprise each attitude statements was measured on a 4-point Likert scale ranging from 1, “strongly disagree” to 4 “strongly agree.”

32 32
AppendixPercentage Distribution, Mean Score and Standard Deviation of Responses to
Preference Statements
Preference Statement N Never Important
(1)%
Sometimes important
(2)%
Often important
(3)%
Always important
(4)%
Mean Std. Dev.
Standards of hygiene and cleanliness 477 2.1 6.1 15.3 76.5 3.66 0.69Personal safety 475 2.9 7.6 13.7 75.8 3.62 0.75Nice weather 477 3.1 11.3 23.5 62.1 3.44 0.81Interesting and friendly local people 476 2.1 14.9 28.6 54.4 3.35 0.81Destinations that provide value for my $ 473 5.1 11.4 26.8 56.7 3.35 0.87Environmental quality of air, water & soil 473 7.2 12.3 23.7 56.9 3.30 0.94Opportunity to increase one’s knowledge 473 3.8 19.5 29.2 47.6 3.21 0.88Outstanding scenery 476 3.4 18.1 33.4 45.2 3.20 0.85Easy access to health care facilities 473 8.9 14.0 25.2 52.0 3.20 0.99Variety of things to do and see 474 4.0 19.0 34.6 42.4 3.15 0.87Having fun/being entertained 475 4.4 26.5 31.4 37.7 3.02 0.91Chances to see wildlife, birds, flowers 475 5.5 29.1 30.3 35.2 2.95 0.93Taking advantage of currency exchange rate 470 16.2 18.3 21.5 44.0 2.93 1.13Availability of comprehensive pre-trip info. 473 14.2 24.3 21.1 40.4 2.88 1.10Historical places or buildings 475 6.1 31.2 33.9 28.8 2.85 0.91Shopping 476 10.7 33.2 24.4 31.7 2.77 1.01Local cuisine 474 10.8 34.6 29.5 25.1 2.69 0.97Budget accommodations 471 14.4 31.8 26.1 27.6 2.67 1.03National or provincial parks 475 13.3 34.9 28.8 22.9 2.61 0.98Inexpensive restaurants 474 12.0 37.3 30.2 20.5 2.59 0.95Activities for the entire family 463 22.5 29.4 21.2 27.0 2.53 1.11Beaches for sunbathing and swimming 476 21.8 31.7 23.1 23.3 2.48 1.07Arts and cultural attractions 477 16.1 41.5 22.2 20.1 2.46 0.99Variety of short guided excursions 474 19.8 38.2 23.4 18.6 2.41 1.01Museums and art galleries 476 18.3 43.1 23.1 15.5 2.36 0.95Visiting remote coastal attractions 473 24.1 38.3 22.0 15.6 2.29 1.00Opportunity to experience aboriginal cultures 471 25.3 38.4 19.7 16.6 2.28 1.02Modern cities 475 25.1 40.4 22.9 11.6 2.21 0.95First class hotel and resorts 474 32.7 34.0 16.7 16.7 2.17 1.06Availability of package trips and inclusive 474 35.9 30.0 16.7 17.5 2.16 1.10Outdoor activities such as hiking, climbing 475 34.5 30.9 19.4 15.2 2.15 1.06Nightlife and entertainment 476 31.7 39.7 17.9 10.7 2.08 0.96High quality restaurants 474 42.4 24.3 17.9 15.4 2.06 1.10Spectator sporting events 476 34.0 39.5 16.8 9.7 2.02 0.95Theme parks and amusement parks 475 35.4 40.6 15.2 8.8 1.97 0.93Cruises of one or more nights 467 43.5 33.2 13.1 10.3 1.90 0.98Water sports 475 51.6 25.3 13.9 9.3 1.81 1.00Hunting or fishing 475 62.3 17.9 11.2 8.6 1.66 0.98Casinos or other gambling 475 59.4 22.7 10.7 7.2 1.66 0.93Golf 475 65.1 16.6 7.6 10.7 1.64 1.01Campground and trailer parks 473 68.5 11.0 9.3 11.2 1.63 1.05Alpine skiing 475 82.5 9.9 4.0 3.6 1.29 0.71
Note: Items sorted by mean score.

33 33
Suggestions by Reviewer
In the interest of time and efficiency, the following chart has been included which addresses the major and minor suggestions and our changes.
Changes Made Major Suggestions:Alternate cites added The citation of Shoemaker (1989) is too dated. There are more recent papers that mirror
Shoemakers positions cited through the text. I would certainly not begin the article with this citation.
Paragraph rewritten More information about data collection must be added. Was 1995 the year the data was released or gathered? The time and length of data gathering is critical to place the sample at the core of the Silent Generation who were born between 1925 and 1943 and who were at the age of 55 and 64 at the time of being interviewed.Tables could have been more compact and refined, and there are too many. Consider these suggestions:
� 1. Table 2: Reduce the width of each column. May be able to make room for four columns.
Now in Appendix
2. Table 3: Remove completely or as an appendix.
Tables combined
3. Tables 4, 5 & 6: They could (and must) be combined without loss of information. For the information in Table 4, only three columns would be adequate. The statistics in Table 5 and 6 can be appended to Table 4.
� 4. Table 9: reduce the width of each column.Combined 5. Tables 10 & 11 may be combined.
“Air/water quality” substituted for
“value for money”
In the Discussion section, the 6th line in the 1st paragraph mentions "value for money". It is not clear how this variable relates to the environment. It has to be clarified or removed.
Changes Made Minor Suggestions:� Add page numbers.
Table 3 is now an appendix
In Results section, the paragraph between Insert Table 2 and Insert Table 3, there is a reference to Table 1. I think they mean Table 3.
� et. al. – no dot after et� Page 6, line 16, the comma should be dropped.� Page 7, line 2: analyzes – analyses
Passage rewritten
Page 7, line 3: “of the hundreds of articles written about the senior market” is too strong a statement, and is unlikely supported. Consider removing the statement or providing references.Page 7, line 4: “to the best of the authors knowledge none have looked specifically at preferences for pleasure travel held by members of the Silent Generation.” Consider modifying to “literature review indicates…”
Redundant sentence removed
Page 8: “Only members of the cohort Silent Generation made up the ultimate sample. The final sample size was 580. The sample for this study consisted only of members of the Silent Generation.” Redundant.
� Page 8, line 8: demographics – demographers � Page 8, line 18: two step – two-step� Text on page 11 should be reorganized to eliminate too many short paragraphs.