SPHERICAL FUNCTIONS AND CONFORMAL DENSITIES ON SPHERICALLY SYMMETRIC CAT( 1)-SPACES
Upload
independentCategory
view
2download
0
Supine and Prone Colon RegistrationUsing Quasi-Conformal Mapping
Wei Zeng, Joseph Marino, Krishna Chaitanya Gurijala, Xianfeng Gu, and Arie Kaufman, Fellow, IEEE
(a) (b)
(c) (d)
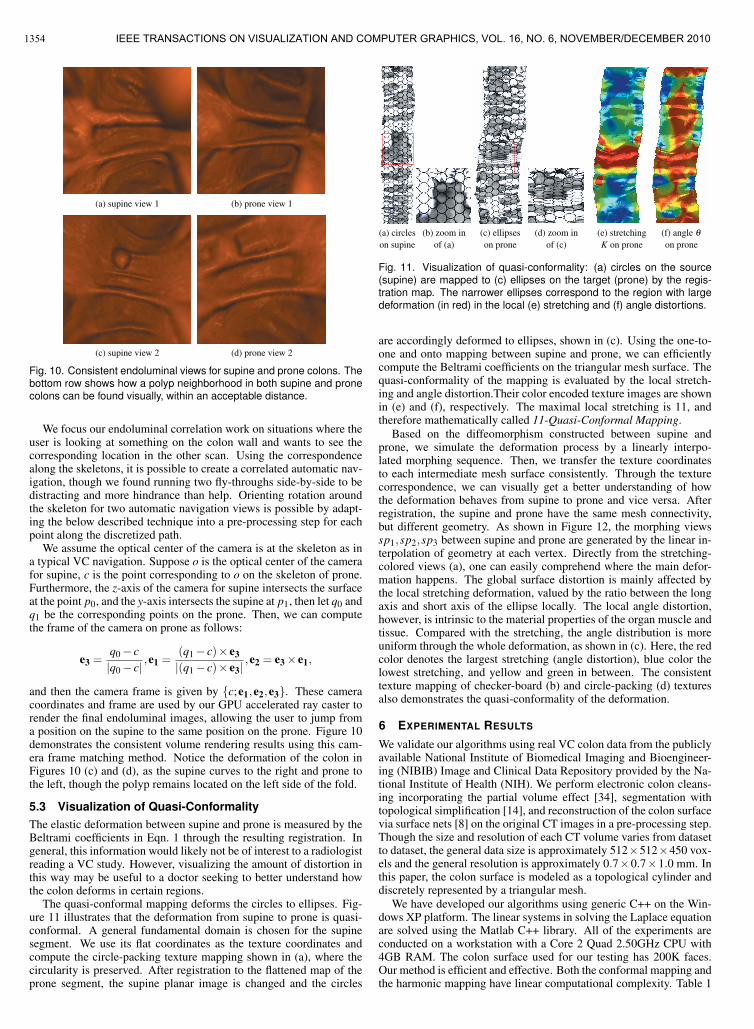
Fig. 1. Visual verification for supine-prone colon registration using volume rendering. (a) and (c) are the flattened views of theascending colon segments of the supine and prone surfaces, respectively. After registration, a polyp found on the flattened supinesurface (yellow circle in (a)) can be located on the flattened prone surface (yellow circle in (c)) at nearly the same position. (b) and (d)are enlargements of the neighborhoods of the same polyp on the supine and prone surfaces, respectively.
Abstract—In virtual colonoscopy, CT scans are typically acquired with the patient in both supine (facing up) and prone (facing down)positions. The registration of these two scans is desirable so that the user can clarify situations or confirm polyp findings at a locationin one scan with the same location in the other, thereby improving polyp detection rates and reducing false positives. However,this supine-prone registration is challenging because of the substantial distortions in the colon shape due to the patient’s changein position. We present an efficient algorithm and framework for performing this registration through the use of conformal geometryto guarantee that the registration is a diffeomorphism (a one-to-one and onto mapping). The taeniae coli and colon flexures areautomatically extracted for each supine and prone surface, employing the colon geometry. The two colon surfaces are then divided intoseveral segments using the flexures, and each segment is cut along a taenia coli and conformally flattened to the rectangular domainusing holomorphic differentials. The mean curvature is color encoded as texture images, from which feature points are automaticallydetected using graph cut segmentation, mathematic morphological operations, and principal component analysis. Correspondingfeature points are found between supine and prone and are used to adjust the conformal flattening to be quasi-conformal, such thatthe features become aligned. We present multiple methods of visualizing our results, including 2D flattened rendering, corresponding3D endoluminal views, and rendering of distortion measurements. We demonstrate the efficiency and efficacy of our registrationmethod by illustrating matched views on both the 2D flattened colon images and in the 3D volume rendered colon endoluminal view.We analytically evaluate the correctness of the results by measuring the distance between features on the registered colons.
Index Terms—Data registration, geometry-based techniques, medical visualization, mathematical foundations for visualization.
1 INTRODUCTION
Colorectal cancer is the third most incident cancer and the secondleading cause of cancer related mortality in the United States [15].Optical colonoscopy (OC), whereby precancerous polyps can be lo-cated and removed, has been recommended for screening and hashelped to greatly reduce the mortality rate of colorectal cancer [4].Virtual colonoscopy (VC) techniques have been developed as viablenon-invasive alternatives to OC for screening purposes [12, 19]. Fora VC procedure, computed tomography (CT) scans of the abdomenare commonly acquired with the patient in both supine (facing up) andprone (facing down) positions. From these scans, the colon wall can
• The authors are with the Computer Science Department at Stony BrookUniversity. E-mail: {zengwei, jmarino, gkrishna, gu, ari}@cs.sunysb.edu.
Manuscript received 31 March 2010; accepted 1 August 2010; posted online24 October 2010; mailed on 16 October 2010.For information on obtaining reprints of this article, please sendemail to: [email protected].
be extracted as in Figure 2 and visualized by the VC user as a volumerendered endoluminal view, mimicing the endoscopic view of an OC.
The use of computer-aided detection (CAD) of colonic polyps hasalso been suggested [14, 38, 39]. A CAD scheme can help to reducethe necessary reading and interpretation time of the user and can actas a second reader to improve detection rates in VC. Though variousCAD methods can achieve different accuracies, a common problemamong them is the presence of false positives in the results. A re-duction of these false positives would help the user to focus on truesuspicious areas and not waste time on unimportant regions.
In addition to the general VC and CAD techniques, researchers haveworked to find new ways of visualizing the data to aid the user inidentifying polyps or assisting with interventional needs. Volumetriccurved planar reformation has been used to aid the viewer in locatingpolyps with a 3D surface superimposed over the standard CT slices[35]. For simulating intestinal surgery, a system has been developedto visualize the colon and provide collision processing [27]. There hasalso been work in creating a correlation between the VC navigationview and the OC view based upon the different view paths [23]. In this
1348
1077-2626/10/$26.00 © 2010 IEEE Published by the IEEE Computer Society
IEEE TRANSACTIONS ON VISUALIZATION AND COMPUTER GRAPHICS, VOL. 16, NO. 6, NOVEMBER/DECEMBER 2010
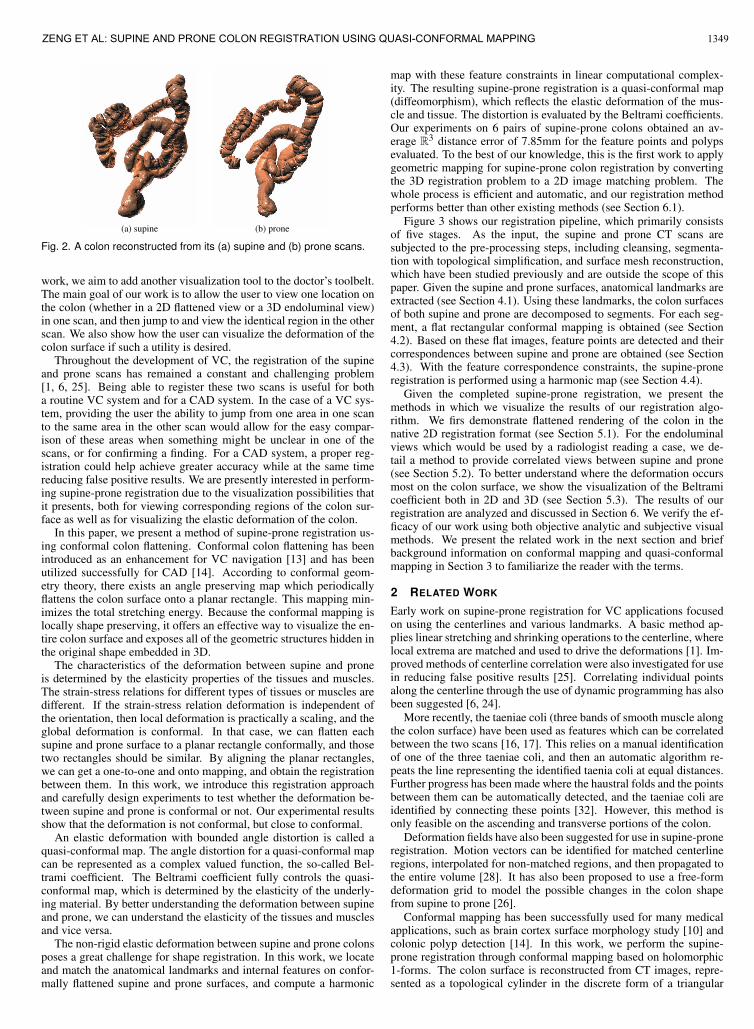
(a) supine (b) prone
Fig. 2. A colon reconstructed from its (a) supine and (b) prone scans.
work, we aim to add another visualization tool to the doctor’s toolbelt.The main goal of our work is to allow the user to view one location onthe colon (whether in a 2D flattened view or a 3D endoluminal view)in one scan, and then jump to and view the identical region in the otherscan. We also show how the user can visualize the deformation of thecolon surface if such a utility is desired.
Throughout the development of VC, the registration of the supineand prone scans has remained a constant and challenging problem[1, 6, 25]. Being able to register these two scans is useful for botha routine VC system and for a CAD system. In the case of a VC sys-tem, providing the user the ability to jump from one area in one scanto the same area in the other scan would allow for the easy compar-ison of these areas when something might be unclear in one of thescans, or for confirming a finding. For a CAD system, a proper reg-istration could help achieve greater accuracy while at the same timereducing false positive results. We are presently interested in perform-ing supine-prone registration due to the visualization possibilities thatit presents, both for viewing corresponding regions of the colon sur-face as well as for visualizing the elastic deformation of the colon.
In this paper, we present a method of supine-prone registration us-ing conformal colon flattening. Conformal colon flattening has beenintroduced as an enhancement for VC navigation [13] and has beenutilized successfully for CAD [14]. According to conformal geom-etry theory, there exists an angle preserving map which periodicallyflattens the colon surface onto a planar rectangle. This mapping min-imizes the total stretching energy. Because the conformal mapping islocally shape preserving, it offers an effective way to visualize the en-tire colon surface and exposes all of the geometric structures hidden inthe original shape embedded in 3D.
The characteristics of the deformation between supine and proneis determined by the elasticity properties of the tissues and muscles.The strain-stress relations for different types of tissues or muscles aredifferent. If the strain-stress relation deformation is independent ofthe orientation, then local deformation is practically a scaling, and theglobal deformation is conformal. In that case, we can flatten eachsupine and prone surface to a planar rectangle conformally, and thosetwo rectangles should be similar. By aligning the planar rectangles,we can get a one-to-one and onto mapping, and obtain the registrationbetween them. In this work, we introduce this registration approachand carefully design experiments to test whether the deformation be-tween supine and prone is conformal or not. Our experimental resultsshow that the deformation is not conformal, but close to conformal.
An elastic deformation with bounded angle distortion is called aquasi-conformal map. The angle distortion for a quasi-conformal mapcan be represented as a complex valued function, the so-called Bel-trami coefficient. The Beltrami coefficient fully controls the quasi-conformal map, which is determined by the elasticity of the underly-ing material. By better understanding the deformation between supineand prone, we can understand the elasticity of the tissues and musclesand vice versa.
The non-rigid elastic deformation between supine and prone colonsposes a great challenge for shape registration. In this work, we locateand match the anatomical landmarks and internal features on confor-mally flattened supine and prone surfaces, and compute a harmonic
map with these feature constraints in linear computational complex-ity. The resulting supine-prone registration is a quasi-conformal map(diffeomorphism), which reflects the elastic deformation of the mus-cle and tissue. The distortion is evaluated by the Beltrami coefficients.Our experiments on 6 pairs of supine-prone colons obtained an av-erage R
3 distance error of 7.85mm for the feature points and polypsevaluated. To the best of our knowledge, this is the first work to applygeometric mapping for supine-prone colon registration by convertingthe 3D registration problem to a 2D image matching problem. Thewhole process is efficient and automatic, and our registration methodperforms better than other existing methods (see Section 6.1).
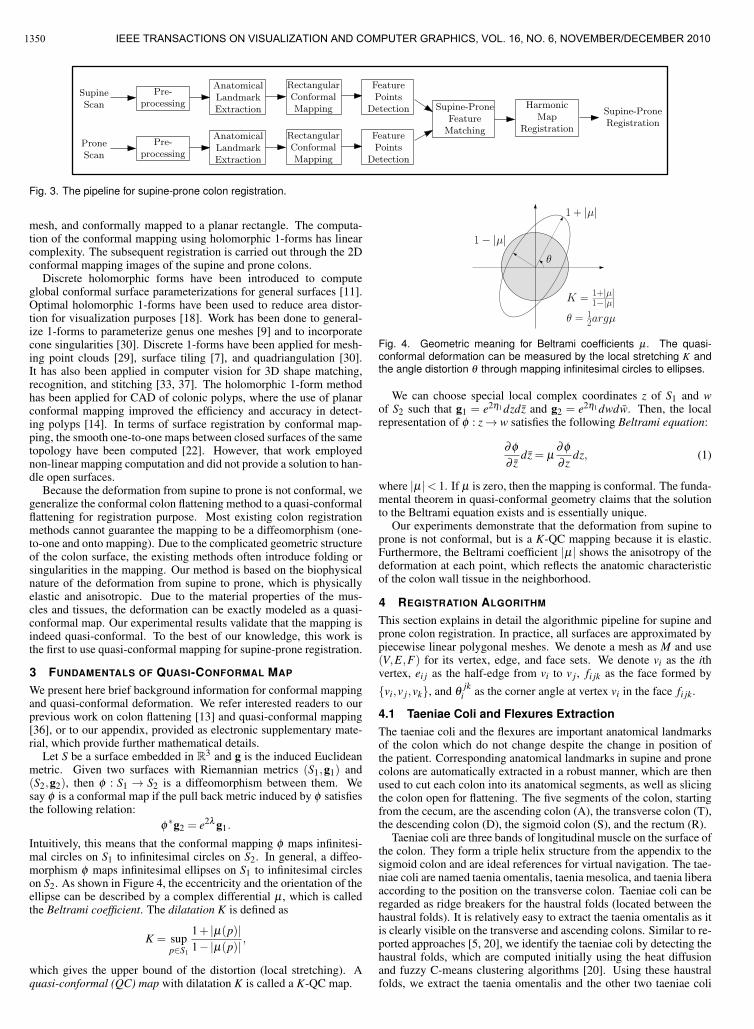
Figure 3 shows our registration pipeline, which primarily consistsof five stages. As the input, the supine and prone CT scans aresubjected to the pre-processing steps, including cleansing, segmenta-tion with topological simplification, and surface mesh reconstruction,which have been studied previously and are outside the scope of thispaper. Given the supine and prone surfaces, anatomical landmarks areextracted (see Section 4.1). Using these landmarks, the colon surfacesof both supine and prone are decomposed to segments. For each seg-ment, a flat rectangular conformal mapping is obtained (see Section4.2). Based on these flat images, feature points are detected and theircorrespondences between supine and prone are obtained (see Section4.3). With the feature correspondence constraints, the supine-proneregistration is performed using a harmonic map (see Section 4.4).
Given the completed supine-prone registration, we present themethods in which we visualize the results of our registration algo-rithm. We firs demonstrate flattened rendering of the colon in thenative 2D registration format (see Section 5.1). For the endoluminalviews which would be used by a radiologist reading a case, we de-tail a method to provide correlated views between supine and prone(see Section 5.2). To better understand where the deformation occursmost on the colon surface, we show the visualization of the Beltramicoefficient both in 2D and 3D (see Section 5.3). The results of ourregistration are analyzed and discussed in Section 6. We verify the ef-ficacy of our work using both objective analytic and subjective visualmethods. We present the related work in the next section and briefbackground information on conformal mapping and quasi-conformalmapping in Section 3 to familiarize the reader with the terms.
2 RELATED WORK
Early work on supine-prone registration for VC applications focusedon using the centerlines and various landmarks. A basic method ap-plies linear stretching and shrinking operations to the centerline, wherelocal extrema are matched and used to drive the deformations [1]. Im-proved methods of centerline correlation were also investigated for usein reducing false positive results [25]. Correlating individual pointsalong the centerline through the use of dynamic programming has alsobeen suggested [6, 24].
More recently, the taeniae coli (three bands of smooth muscle alongthe colon surface) have been used as features which can be correlatedbetween the two scans [16, 17]. This relies on a manual identificationof one of the three taeniae coli, and then an automatic algorithm re-peats the line representing the identified taenia coli at equal distances.Further progress has been made where the haustral folds and the pointsbetween them can be automatically detected, and the taeniae coli areidentified by connecting these points [32]. However, this method isonly feasible on the ascending and transverse portions of the colon.
Deformation fields have also been suggested for use in supine-proneregistration. Motion vectors can be identified for matched centerlineregions, interpolated for non-matched regions, and then propagated tothe entire volume [28]. It has also been proposed to use a free-formdeformation grid to model the possible changes in the colon shapefrom supine to prone [26].
Conformal mapping has been successfully used for many medicalapplications, such as brain cortex surface morphology study [10] andcolonic polyp detection [14]. In this work, we perform the supine-prone registration through conformal mapping based on holomorphic1-forms. The colon surface is reconstructed from CT images, repre-sented as a topological cylinder in the discrete form of a triangular
1349ZENG ET AL: SUPINE AND PRONE COLON REGISTRATION USING QUASI-CONFORMAL MAPPING
Anatomical
Landmark
Extraction
Feature
Points
Detection
Pre-
processingProne
Scan
Supine-Prone
Registration
Harmonic
Map
Registration
Supine-Prone
Feature
MatchingRectangular
Conformal
Mapping
Anatomical
Landmark
Extraction
Feature
Points
Detection
Pre-
processingSupine
Scan
Rectangular
Conformal
Mapping
Fig. 3. The pipeline for supine-prone colon registration.
mesh, and conformally mapped to a planar rectangle. The computa-tion of the conformal mapping using holomorphic 1-forms has linearcomplexity. The subsequent registration is carried out through the 2Dconformal mapping images of the supine and prone colons.
Discrete holomorphic forms have been introduced to computeglobal conformal surface parameterizations for general surfaces [11].Optimal holomorphic 1-forms have been used to reduce area distor-tion for visualization purposes [18]. Work has been done to general-ize 1-forms to parameterize genus one meshes [9] and to incorporatecone singularities [30]. Discrete 1-forms have been applied for mesh-ing point clouds [29], surface tiling [7], and quadriangulation [30].It has also been applied in computer vision for 3D shape matching,recognition, and stitching [33, 37]. The holomorphic 1-form methodhas been applied for CAD of colonic polyps, where the use of planarconformal mapping improved the efficiency and accuracy in detect-ing polyps [14]. In terms of surface registration by conformal map-ping, the smooth one-to-one maps between closed surfaces of the sametopology have been computed [22]. However, that work employednon-linear mapping computation and did not provide a solution to han-dle open surfaces.
Because the deformation from supine to prone is not conformal, wegeneralize the conformal colon flattening method to a quasi-conformalflattening for registration purpose. Most existing colon registrationmethods cannot guarantee the mapping to be a diffeomorphism (one-to-one and onto mapping). Due to the complicated geometric structureof the colon surface, the existing methods often introduce folding orsingularities in the mapping. Our method is based on the biophysicalnature of the deformation from supine to prone, which is physicallyelastic and anisotropic. Due to the material properties of the mus-cles and tissues, the deformation can be exactly modeled as a quasi-conformal map. Our experimental results validate that the mapping isindeed quasi-conformal. To the best of our knowledge, this work isthe first to use quasi-conformal mapping for supine-prone registration.
3 FUNDAMENTALS OF QUASI-CONFORMAL MAP
We present here brief background information for conformal mappingand quasi-conformal deformation. We refer interested readers to ourprevious work on colon flattening [13] and quasi-conformal mapping[36], or to our appendix, provided as electronic supplementary mate-rial, which provide further mathematical details.
Let S be a surface embedded in R3 and g is the induced Euclidean
metric. Given two surfaces with Riemannian metrics (S1,g1) and(S2,g2), then φ : S1 → S2 is a diffeomorphism between them. Wesay φ is a conformal map if the pull back metric induced by φ satisfiesthe following relation:
φ∗g2 = e2λ g1.
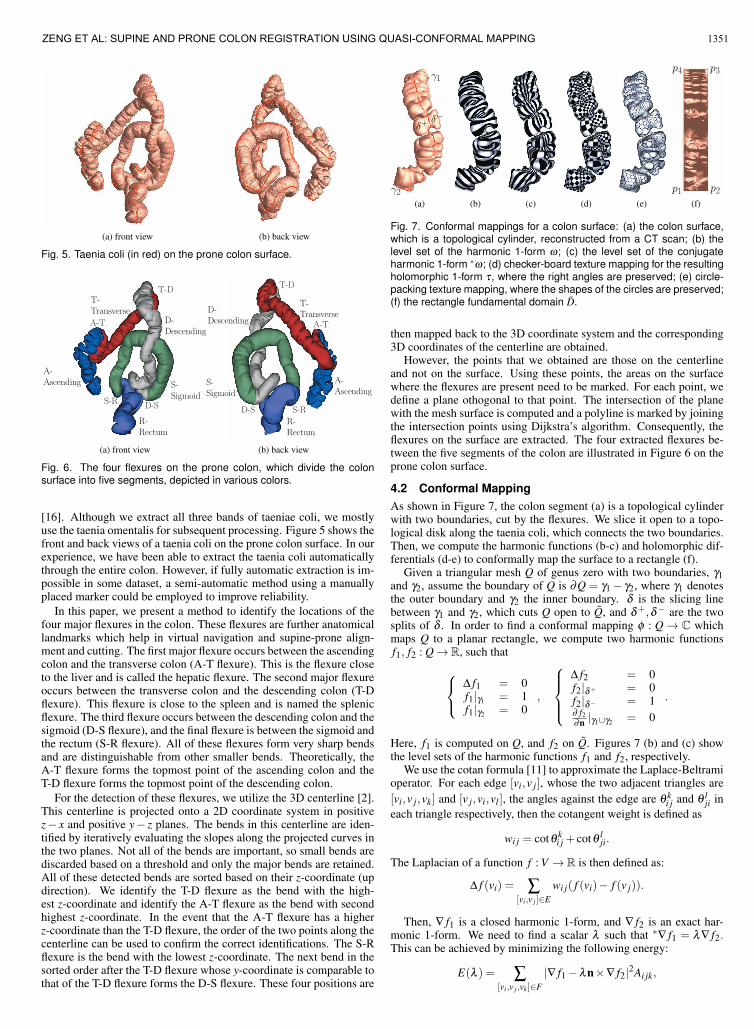
Intuitively, this means that the conformal mapping φ maps infinitesi-mal circles on S1 to infinitesimal circles on S2. In general, a diffeo-morphism φ maps infinitesimal ellipses on S1 to infinitesimal circleson S2. As shown in Figure 4, the eccentricity and the orientation of theellipse can be described by a complex differential μ , which is calledthe Beltrami coefficient. The dilatation K is defined as
K = supp∈S1
1+ |μ(p)|1−|μ(p)| ,
which gives the upper bound of the distortion (local stretching). Aquasi-conformal (QC) map with dilatation K is called a K-QC map.
1 + ∣𝜇∣
1− ∣𝜇∣
𝐾 =1+∣𝜇∣1−∣𝜇∣
𝜃
𝜃 =12𝑎𝑟𝑔𝜇
Fig. 4. Geometric meaning for Beltrami coefficients μ. The quasi-conformal deformation can be measured by the local stretching K andthe angle distortion θ through mapping infinitesimal circles to ellipses.
We can choose special local complex coordinates z of S1 and wof S2 such that g1 = e2η1 dzdz and g2 = e2η1 dwdw. Then, the localrepresentation of φ : z→ w satisfies the following Beltrami equation:
∂φ
∂ zdz = μ
∂φ
∂ zdz, (1)
where |μ |< 1. If μ is zero, then the mapping is conformal. The funda-mental theorem in quasi-conformal geometry claims that the solutionto the Beltrami equation exists and is essentially unique.
Our experiments demonstrate that the deformation from supine toprone is not conformal, but is a K-QC mapping because it is elastic.Furthermore, the Beltrami coefficient |μ | shows the anisotropy of thedeformation at each point, which reflects the anatomic characteristicof the colon wall tissue in the neighborhood.
4 REGISTRATION ALGORITHM
This section explains in detail the algorithmic pipeline for supine andprone colon registration. In practice, all surfaces are approximated bypiecewise linear polygonal meshes. We denote a mesh as M and use(V,E,F) for its vertex, edge, and face sets. We denote vi as the ithvertex, ei j as the half-edge from vi to v j , fi jk as the face formed by
{vi,v j,vk}, and θjk
i as the corner angle at vertex vi in the face fi jk.
4.1 Taeniae Coli and Flexures ExtractionThe taeniae coli and the flexures are important anatomical landmarksof the colon which do not change despite the change in position ofthe patient. Corresponding anatomical landmarks in supine and pronecolons are automatically extracted in a robust manner, which are thenused to cut each colon into its anatomical segments, as well as slicingthe colon open for flattening. The five segments of the colon, startingfrom the cecum, are the ascending colon (A), the transverse colon (T),the descending colon (D), the sigmoid colon (S), and the rectum (R).
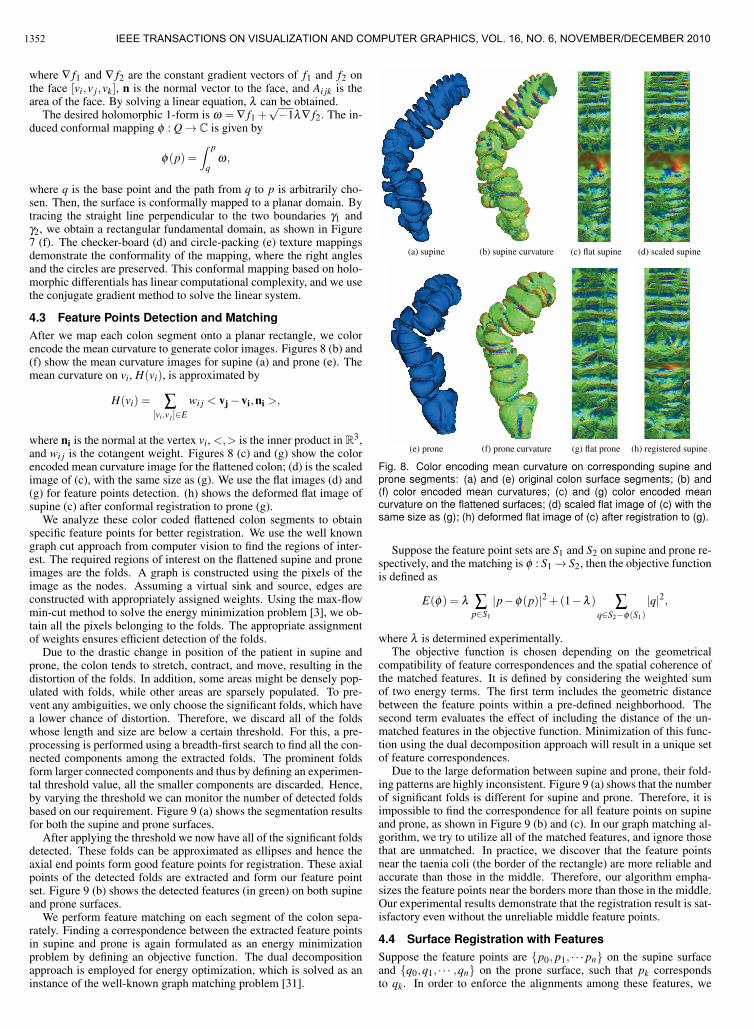
Taeniae coli are three bands of longitudinal muscle on the surface ofthe colon. They form a triple helix structure from the appendix to thesigmoid colon and are ideal references for virtual navigation. The tae-niae coli are named taenia omentalis, taenia mesolica, and taenia liberaaccording to the position on the transverse colon. Taeniae coli can beregarded as ridge breakers for the haustral folds (located between thehaustral folds). It is relatively easy to extract the taenia omentalis as itis clearly visible on the transverse and ascending colons. Similar to re-ported approaches [5, 20], we identify the taeniae coli by detecting thehaustral folds, which are computed initially using the heat diffusionand fuzzy C-means clustering algorithms [20]. Using these haustralfolds, we extract the taenia omentalis and the other two taeniae coli
1350 IEEE TRANSACTIONS ON VISUALIZATION AND COMPUTER GRAPHICS, VOL. 16, NO. 6, NOVEMBER/DECEMBER 2010
(a) front view (b) back view
Fig. 5. Taenia coli (in red) on the prone colon surface.
D-
Descending
S-
Sigmoid
R-
Rectum
A-
Ascending
A-T
T-
Transverse
T-D
D-SS-R
D-
Descending
S-
Sigmoid
R-
Rectum
A-
Ascending
A-T
T-
Transverse
T-D
D-S S-R
(a) front view (b) back view
Fig. 6. The four flexures on the prone colon, which divide the colonsurface into five segments, depicted in various colors.
[16]. Although we extract all three bands of taeniae coli, we mostlyuse the taenia omentalis for subsequent processing. Figure 5 shows thefront and back views of a taenia coli on the prone colon surface. In ourexperience, we have been able to extract the taenia coli automaticallythrough the entire colon. However, if fully automatic extraction is im-possible in some dataset, a semi-automatic method using a manuallyplaced marker could be employed to improve reliability.
In this paper, we present a method to identify the locations of thefour major flexures in the colon. These flexures are further anatomicallandmarks which help in virtual navigation and supine-prone align-ment and cutting. The first major flexure occurs between the ascendingcolon and the transverse colon (A-T flexure). This is the flexure closeto the liver and is called the hepatic flexure. The second major flexureoccurs between the transverse colon and the descending colon (T-Dflexure). This flexure is close to the spleen and is named the splenicflexure. The third flexure occurs between the descending colon and thesigmoid (D-S flexure), and the final flexure is between the sigmoid andthe rectum (S-R flexure). All of these flexures form very sharp bendsand are distinguishable from other smaller bends. Theoretically, theA-T flexure forms the topmost point of the ascending colon and theT-D flexure forms the topmost point of the descending colon.
For the detection of these flexures, we utilize the 3D centerline [2].This centerline is projected onto a 2D coordinate system in positivez− x and positive y− z planes. The bends in this centerline are iden-tified by iteratively evaluating the slopes along the projected curves inthe two planes. Not all of the bends are important, so small bends arediscarded based on a threshold and only the major bends are retained.All of these detected bends are sorted based on their z-coordinate (updirection). We identify the T-D flexure as the bend with the high-est z-coordinate and identify the A-T flexure as the bend with secondhighest z-coordinate. In the event that the A-T flexure has a higherz-coordinate than the T-D flexure, the order of the two points along thecenterline can be used to confirm the correct identifications. The S-Rflexure is the bend with the lowest z-coordinate. The next bend in thesorted order after the T-D flexure whose y-coordinate is comparable tothat of the T-D flexure forms the D-S flexure. These four positions are
𝛾1
𝛾2
𝛿+𝛿−
𝑝1 𝑝2
𝑝3𝑝4
(a) (b) (c) (d) (e) (f)
Fig. 7. Conformal mappings for a colon surface: (a) the colon surface,which is a topological cylinder, reconstructed from a CT scan; (b) thelevel set of the harmonic 1-form ω; (c) the level set of the conjugateharmonic 1-form ∗ω; (d) checker-board texture mapping for the resultingholomorphic 1-form τ, where the right angles are preserved; (e) circle-packing texture mapping, where the shapes of the circles are preserved;(f) the rectangle fundamental domain D.
then mapped back to the 3D coordinate system and the corresponding3D coordinates of the centerline are obtained.
However, the points that we obtained are those on the centerlineand not on the surface. Using these points, the areas on the surfacewhere the flexures are present need to be marked. For each point, wedefine a plane othogonal to that point. The intersection of the planewith the mesh surface is computed and a polyline is marked by joiningthe intersection points using Dijkstra’s algorithm. Consequently, theflexures on the surface are extracted. The four extracted flexures be-tween the five segments of the colon are illustrated in Figure 6 on theprone colon surface.
4.2 Conformal MappingAs shown in Figure 7, the colon segment (a) is a topological cylinderwith two boundaries, cut by the flexures. We slice it open to a topo-logical disk along the taenia coli, which connects the two boundaries.Then, we compute the harmonic functions (b-c) and holomorphic dif-ferentials (d-e) to conformally map the surface to a rectangle (f).
Given a triangular mesh Q of genus zero with two boundaries, γ1and γ2, assume the boundary of Q is ∂Q = γ1− γ2, where γ1 denotesthe outer boundary and γ2 the inner boundary. δ is the slicing linebetween γ1 and γ2, which cuts Q open to Q, and δ+,δ− are the twosplits of δ . In order to find a conformal mapping φ : Q → C whichmaps Q to a planar rectangle, we compute two harmonic functionsf1, f2 : Q→ R, such that
⎧⎨⎩
Δ f1 = 0f1|γ1 = 1f1|γ2 = 0
,
⎧⎪⎪⎨⎪⎪⎩
Δ f2 = 0f2|δ+ = 0f2|δ− = 1∂ f2∂n |γ1∪γ2 = 0
.
Here, f1 is computed on Q, and f2 on Q. Figures 7 (b) and (c) showthe level sets of the harmonic functions f1 and f2, respectively.
We use the cotan formula [11] to approximate the Laplace-Beltramioperator. For each edge [vi,v j], whose the two adjacent triangles are[vi,v j,vk] and [v j,vi,vl ], the angles against the edge are θ k
i j and θ lji in
each triangle respectively, then the cotangent weight is defined as
wi j = cotθ ki j + cotθ l
ji.
The Laplacian of a function f : V → R is then defined as:
Δ f (vi) = ∑[vi,v j ]∈E
wi j( f (vi)− f (v j)).
Then, ∇ f1 is a closed harmonic 1-form, and ∇ f2 is an exact har-monic 1-form. We need to find a scalar λ such that ∗∇ f1 = λ∇ f2.This can be achieved by minimizing the following energy:
E(λ ) = ∑[vi,v j ,vk]∈F
|∇ f1−λn×∇ f2|2Ai jk,
1351ZENG ET AL: SUPINE AND PRONE COLON REGISTRATION USING QUASI-CONFORMAL MAPPING
where ∇ f1 and ∇ f2 are the constant gradient vectors of f1 and f2 onthe face [vi,v j,vk], n is the normal vector to the face, and Ai jk is thearea of the face. By solving a linear equation, λ can be obtained.
The desired holomorphic 1-form is ω = ∇ f1 +√−1λ∇ f2. The in-
duced conformal mapping φ : Q→ C is given by
φ(p) =∫ p
qω,
where q is the base point and the path from q to p is arbitrarily cho-sen. Then, the surface is conformally mapped to a planar domain. Bytracing the straight line perpendicular to the two boundaries γ1 andγ2, we obtain a rectangular fundamental domain, as shown in Figure7 (f). The checker-board (d) and circle-packing (e) texture mappingsdemonstrate the conformality of the mapping, where the right anglesand the circles are preserved. This conformal mapping based on holo-morphic differentials has linear computational complexity, and we usethe conjugate gradient method to solve the linear system.
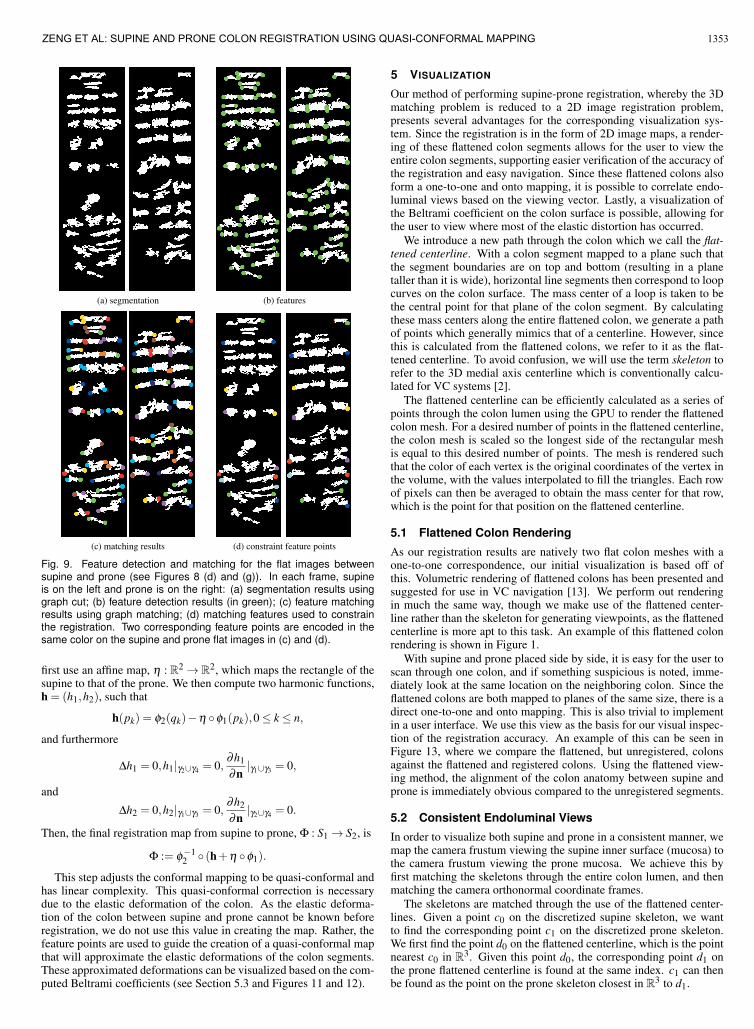
4.3 Feature Points Detection and MatchingAfter we map each colon segment onto a planar rectangle, we colorencode the mean curvature to generate color images. Figures 8 (b) and(f) show the mean curvature images for supine (a) and prone (e). Themean curvature on vi, H(vi), is approximated by
H(vi) = ∑[vi,v j ]∈E
wi j < vj−vi,ni >,
where ni is the normal at the vertex vi, <,> is the inner product in R3,
and wi j is the cotangent weight. Figures 8 (c) and (g) show the colorencoded mean curvature image for the flattened colon; (d) is the scaledimage of (c), with the same size as (g). We use the flat images (d) and(g) for feature points detection. (h) shows the deformed flat image ofsupine (c) after conformal registration to prone (g).
We analyze these color coded flattened colon segments to obtainspecific feature points for better registration. We use the well knowngraph cut approach from computer vision to find the regions of inter-est. The required regions of interest on the flattened supine and proneimages are the folds. A graph is constructed using the pixels of theimage as the nodes. Assuming a virtual sink and source, edges areconstructed with appropriately assigned weights. Using the max-flowmin-cut method to solve the energy minimization problem [3], we ob-tain all the pixels belonging to the folds. The appropriate assignmentof weights ensures efficient detection of the folds.
Due to the drastic change in position of the patient in supine andprone, the colon tends to stretch, contract, and move, resulting in thedistortion of the folds. In addition, some areas might be densely pop-ulated with folds, while other areas are sparsely populated. To pre-vent any ambiguities, we only choose the significant folds, which havea lower chance of distortion. Therefore, we discard all of the foldswhose length and size are below a certain threshold. For this, a pre-processing is performed using a breadth-first search to find all the con-nected components among the extracted folds. The prominent foldsform larger connected components and thus by defining an experimen-tal threshold value, all the smaller components are discarded. Hence,by varying the threshold we can monitor the number of detected foldsbased on our requirement. Figure 9 (a) shows the segmentation resultsfor both the supine and prone surfaces.
After applying the threshold we now have all of the significant foldsdetected. These folds can be approximated as ellipses and hence theaxial end points form good feature points for registration. These axialpoints of the detected folds are extracted and form our feature pointset. Figure 9 (b) shows the detected features (in green) on both supineand prone surfaces.
We perform feature matching on each segment of the colon sepa-rately. Finding a correspondence between the extracted feature pointsin supine and prone is again formulated as an energy minimizationproblem by defining an objective function. The dual decompositionapproach is employed for energy optimization, which is solved as aninstance of the well-known graph matching problem [31].
(a) supine (b) supine curvature (c) flat supine (d) scaled supine
(e) prone (f) prone curvature (g) flat prone (h) registered supine
Fig. 8. Color encoding mean curvature on corresponding supine andprone segments: (a) and (e) original colon surface segments; (b) and(f) color encoded mean curvatures; (c) and (g) color encoded meancurvature on the flattened surfaces; (d) scaled flat image of (c) with thesame size as (g); (h) deformed flat image of (c) after registration to (g).
Suppose the feature point sets are S1 and S2 on supine and prone re-spectively, and the matching is φ : S1 → S2, then the objective functionis defined as
E(φ) = λ ∑p∈S1
|p−φ(p)|2 +(1−λ ) ∑q∈S2−φ(S1)
|q|2,
where λ is determined experimentally.The objective function is chosen depending on the geometrical
compatibility of feature correspondences and the spatial coherence ofthe matched features. It is defined by considering the weighted sumof two energy terms. The first term includes the geometric distancebetween the feature points within a pre-defined neighborhood. Thesecond term evaluates the effect of including the distance of the un-matched features in the objective function. Minimization of this func-tion using the dual decomposition approach will result in a unique setof feature correspondences.
Due to the large deformation between supine and prone, their fold-ing patterns are highly inconsistent. Figure 9 (a) shows that the numberof significant folds is different for supine and prone. Therefore, it isimpossible to find the correspondence for all feature points on supineand prone, as shown in Figure 9 (b) and (c). In our graph matching al-gorithm, we try to utilize all of the matched features, and ignore thosethat are unmatched. In practice, we discover that the feature pointsnear the taenia coli (the border of the rectangle) are more reliable andaccurate than those in the middle. Therefore, our algorithm empha-sizes the feature points near the borders more than those in the middle.Our experimental results demonstrate that the registration result is sat-isfactory even without the unreliable middle feature points.
4.4 Surface Registration with FeaturesSuppose the feature points are {p0, p1, · · · pn} on the supine surfaceand {q0,q1, · · · ,qn} on the prone surface, such that pk correspondsto qk. In order to enforce the alignments among these features, we
1352 IEEE TRANSACTIONS ON VISUALIZATION AND COMPUTER GRAPHICS, VOL. 16, NO. 6, NOVEMBER/DECEMBER 2010
(a) segmentation (b) features
(c) matching results (d) constraint feature points
Fig. 9. Feature detection and matching for the flat images betweensupine and prone (see Figures 8 (d) and (g)). In each frame, supineis on the left and prone is on the right: (a) segmentation results usinggraph cut; (b) feature detection results (in green); (c) feature matchingresults using graph matching; (d) matching features used to constrainthe registration. Two corresponding feature points are encoded in thesame color on the supine and prone flat images in (c) and (d).
first use an affine map, η : R2 → R2, which maps the rectangle of the
supine to that of the prone. We then compute two harmonic functions,h = (h1,h2), such that
h(pk) = φ2(qk)−η ◦φ1(pk),0≤ k ≤ n,
and furthermore
Δh1 = 0,h1|γ2∪γ4 = 0,∂h1
∂n|γ1∪γ3 = 0,
and
Δh2 = 0,h2|γ1∪γ3 = 0,∂h2
∂n|γ2∪γ4 = 0.
Then, the final registration map from supine to prone, Φ : S1 → S2, is
Φ := φ−12 ◦ (h+η ◦φ1).
This step adjusts the conformal mapping to be quasi-conformal andhas linear complexity. This quasi-conformal correction is necessarydue to the elastic deformation of the colon. As the elastic deforma-tion of the colon between supine and prone cannot be known beforeregistration, we do not use this value in creating the map. Rather, thefeature points are used to guide the creation of a quasi-conformal mapthat will approximate the elastic deformations of the colon segments.These approximated deformations can be visualized based on the com-puted Beltrami coefficients (see Section 5.3 and Figures 11 and 12).
5 VISUALIZATION
Our method of performing supine-prone registration, whereby the 3Dmatching problem is reduced to a 2D image registration problem,presents several advantages for the corresponding visualization sys-tem. Since the registration is in the form of 2D image maps, a render-ing of these flattened colon segments allows for the user to view theentire colon segments, supporting easier verification of the accuracy ofthe registration and easy navigation. Since these flattened colons alsoform a one-to-one and onto mapping, it is possible to correlate endo-luminal views based on the viewing vector. Lastly, a visualization ofthe Beltrami coefficient on the colon surface is possible, allowing forthe user to view where most of the elastic distortion has occurred.
We introduce a new path through the colon which we call the flat-tened centerline. With a colon segment mapped to a plane such thatthe segment boundaries are on top and bottom (resulting in a planetaller than it is wide), horizontal line segments then correspond to loopcurves on the colon surface. The mass center of a loop is taken to bethe central point for that plane of the colon segment. By calculatingthese mass centers along the entire flattened colon, we generate a pathof points which generally mimics that of a centerline. However, sincethis is calculated from the flattened colons, we refer to it as the flat-tened centerline. To avoid confusion, we will use the term skeleton torefer to the 3D medial axis centerline which is conventionally calcu-lated for VC systems [2].
The flattened centerline can be efficiently calculated as a series ofpoints through the colon lumen using the GPU to render the flattenedcolon mesh. For a desired number of points in the flattened centerline,the colon mesh is scaled so the longest side of the rectangular meshis equal to this desired number of points. The mesh is rendered suchthat the color of each vertex is the original coordinates of the vertex inthe volume, with the values interpolated to fill the triangles. Each rowof pixels can then be averaged to obtain the mass center for that row,which is the point for that position on the flattened centerline.
5.1 Flattened Colon Rendering
As our registration results are natively two flat colon meshes with aone-to-one correspondence, our initial visualization is based off ofthis. Volumetric rendering of flattened colons has been presented andsuggested for use in VC navigation [13]. We perform out renderingin much the same way, though we make use of the flattened center-line rather than the skeleton for generating viewpoints, as the flattenedcenterline is more apt to this task. An example of this flattened colonrendering is shown in Figure 1.
With supine and prone placed side by side, it is easy for the user toscan through one colon, and if something suspicious is noted, imme-diately look at the same location on the neighboring colon. Since theflattened colons are both mapped to planes of the same size, there is adirect one-to-one and onto mapping. This is also trivial to implementin a user interface. We use this view as the basis for our visual inspec-tion of the registration accuracy. An example of this can be seen inFigure 13, where we compare the flattened, but unregistered, colonsagainst the flattened and registered colons. Using the flattened view-ing method, the alignment of the colon anatomy between supine andprone is immediately obvious compared to the unregistered segments.
5.2 Consistent Endoluminal Views
In order to visualize both supine and prone in a consistent manner, wemap the camera frustum viewing the supine inner surface (mucosa) tothe camera frustum viewing the prone mucosa. We achieve this byfirst matching the skeletons through the entire colon lumen, and thenmatching the camera orthonormal coordinate frames.
The skeletons are matched through the use of the flattened center-lines. Given a point c0 on the discretized supine skeleton, we wantto find the corresponding point c1 on the discretized prone skeleton.We first find the point d0 on the flattened centerline, which is the pointnearest c0 in R
3. Given this point d0, the corresponding point d1 onthe prone flattened centerline is found at the same index. c1 can thenbe found as the point on the prone skeleton closest in R
3 to d1.
1353ZENG ET AL: SUPINE AND PRONE COLON REGISTRATION USING QUASI-CONFORMAL MAPPING
(a) supine view 1 (b) prone view 1
(c) supine view 2 (d) prone view 2
Fig. 10. Consistent endoluminal views for supine and prone colons. Thebottom row shows how a polyp neighborhood in both supine and pronecolons can be found visually, within an acceptable distance.
We focus our endoluminal correlation work on situations where theuser is looking at something on the colon wall and wants to see thecorresponding location in the other scan. Using the correspondencealong the skeletons, it is possible to create a correlated automatic nav-igation, though we found running two fly-throughs side-by-side to bedistracting and more hindrance than help. Orienting rotation aroundthe skeleton for two automatic navigation views is possible by adapt-ing the below described technique into a pre-processing step for eachpoint along the discretized path.
We assume the optical center of the camera is at the skeleton as ina typical VC navigation. Suppose o is the optical center of the camerafor supine, c is the point corresponding to o on the skeleton of prone.Furthermore, the z-axis of the camera for supine intersects the surfaceat the point p0, and the y-axis intersects the supine at p1, then let q0 andq1 be the corresponding points on the prone. Then, we can computethe frame of the camera on prone as follows:
e3 =q0− c|q0− c|
,e1 =(q1− c)× e3
|(q1− c)× e3|,e2 = e3× e1,
and then the camera frame is given by {c;e1,e2,e3}. These cameracoordinates and frame are used by our GPU accelerated ray caster torender the final endoluminal images, allowing the user to jump froma position on the supine to the same position on the prone. Figure 10demonstrates the consistent volume rendering results using this cam-era frame matching method. Notice the deformation of the colon inFigures 10 (c) and (d), as the supine curves to the right and prone tothe left, though the polyp remains located on the left side of the fold.
5.3 Visualization of Quasi-ConformalityThe elastic deformation between supine and prone is measured by theBeltrami coefficients in Eqn. 1 through the resulting registration. Ingeneral, this information would likely not be of interest to a radiologistreading a VC study. However, visualizing the amount of distortion inthis way may be useful to a doctor seeking to better understand howthe colon deforms in certain regions.
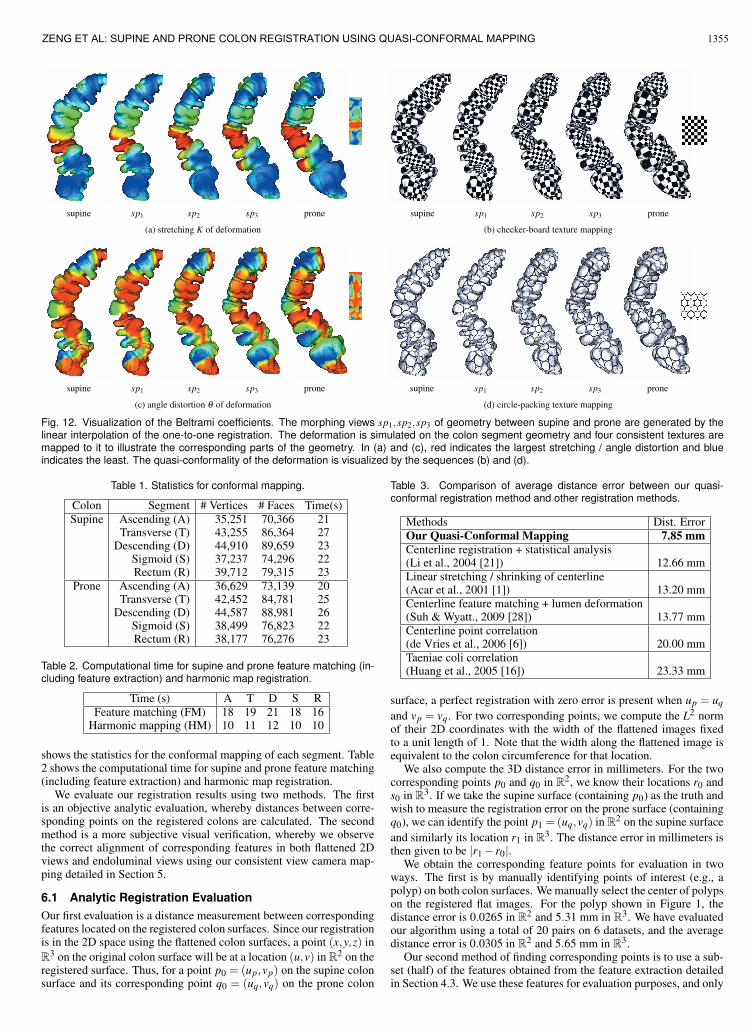
The quasi-conformal mapping deforms the circles to ellipses. Fig-ure 11 illustrates that the deformation from supine to prone is quasi-conformal. A general fundamental domain is chosen for the supinesegment. We use its flat coordinates as the texture coordinates andcompute the circle-packing texture mapping shown in (a), where thecircularity is preserved. After registration to the flattened map of theprone segment, the supine planar image is changed and the circles
(a) circles (b) zoom in (c) ellipses (d) zoom in (e) stretching (f) angle θ
on supine of (a) on prone of (c) K on prone on prone
Fig. 11. Visualization of quasi-conformality: (a) circles on the source(supine) are mapped to (c) ellipses on the target (prone) by the regis-tration map. The narrower ellipses correspond to the region with largedeformation (in red) in the local (e) stretching and (f) angle distortions.
are accordingly deformed to ellipses, shown in (c). Using the one-to-one and onto mapping between supine and prone, we can efficientlycompute the Beltrami coefficients on the triangular mesh surface. Thequasi-conformality of the mapping is evaluated by the local stretch-ing and angle distortion.Their color encoded texture images are shownin (e) and (f), respectively. The maximal local stretching is 11, andtherefore mathematically called 11-Quasi-Conformal Mapping.
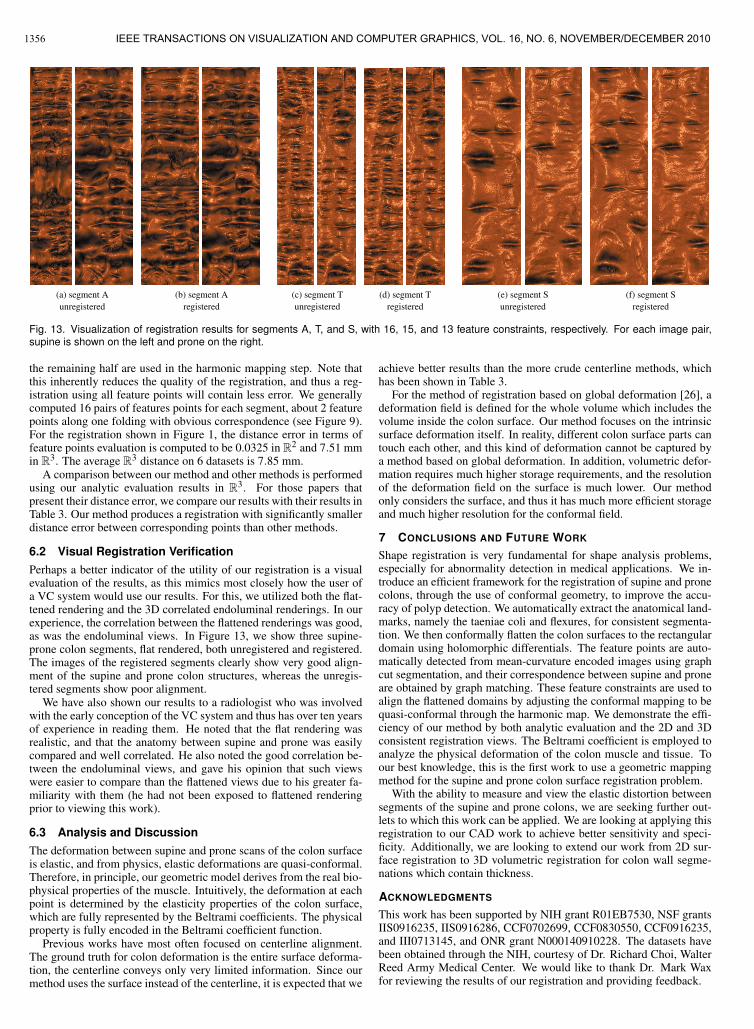
Based on the diffeomorphism constructed between supine andprone, we simulate the deformation process by a linearly interpo-lated morphing sequence. Then, we transfer the texture coordinatesto each intermediate mesh surface consistently. Through the texturecorrespondence, we can visually get a better understanding of howthe deformation behaves from supine to prone and vice versa. Afterregistration, the supine and prone have the same mesh connectivity,but different geometry. As shown in Figure 12, the morphing viewssp1,sp2,sp3 between supine and prone are generated by the linear in-terpolation of geometry at each vertex. Directly from the stretching-colored views (a), one can easily comprehend where the main defor-mation happens. The global surface distortion is mainly affected bythe local stretching deformation, valued by the ratio between the longaxis and short axis of the ellipse locally. The local angle distortion,however, is intrinsic to the material properties of the organ muscle andtissue. Compared with the stretching, the angle distribution is moreuniform through the whole deformation, as shown in (c). Here, the redcolor denotes the largest stretching (angle distortion), blue color thelowest stretching, and yellow and green in between. The consistenttexture mapping of checker-board (b) and circle-packing (d) texturesalso demonstrates the quasi-conformality of the deformation.
6 EXPERIMENTAL RESULTS
We validate our algorithms using real VC colon data from the publiclyavailable National Institute of Biomedical Imaging and Bioengineer-ing (NIBIB) Image and Clinical Data Repository provided by the Na-tional Institute of Health (NIH). We perform electronic colon cleans-ing incorporating the partial volume effect [34], segmentation withtopological simplification [14], and reconstruction of the colon surfacevia surface nets [8] on the original CT images in a pre-processing step.Though the size and resolution of each CT volume varies from datasetto dataset, the general data size is approximately 512×512×450 vox-els and the general resolution is approximately 0.7×0.7×1.0 mm. Inthis paper, the colon surface is modeled as a topological cylinder anddiscretely represented by a triangular mesh.
We have developed our algorithms using generic C++ on the Win-dows XP platform. The linear systems in solving the Laplace equationare solved using the Matlab C++ library. All of the experiments areconducted on a workstation with a Core 2 Quad 2.50GHz CPU with4GB RAM. The colon surface used for our testing has 200K faces.Our method is efficient and effective. Both the conformal mapping andthe harmonic mapping have linear computational complexity. Table 1
1354 IEEE TRANSACTIONS ON VISUALIZATION AND COMPUTER GRAPHICS, VOL. 16, NO. 6, NOVEMBER/DECEMBER 2010
supine sp1 sp2 sp3 prone supine sp1 sp2 sp3 prone
(a) stretching K of deformation (b) checker-board texture mapping
supine sp1 sp2 sp3 prone supine sp1 sp2 sp3 prone
(c) angle distortion θ of deformation (d) circle-packing texture mapping
Fig. 12. Visualization of the Beltrami coefficients. The morphing views sp1,sp2,sp3 of geometry between supine and prone are generated by thelinear interpolation of the one-to-one registration. The deformation is simulated on the colon segment geometry and four consistent textures aremapped to it to illustrate the corresponding parts of the geometry. In (a) and (c), red indicates the largest stretching / angle distortion and blueindicates the least. The quasi-conformality of the deformation is visualized by the sequences (b) and (d).
Table 1. Statistics for conformal mapping.
Colon Segment # Vertices # Faces Time(s)Supine Ascending (A) 35,251 70,366 21
Transverse (T) 43,255 86,364 27Descending (D) 44,910 89,659 23
Sigmoid (S) 37,237 74,296 22Rectum (R) 39,712 79,315 23
Prone Ascending (A) 36,629 73,139 20Transverse (T) 42,452 84,781 25
Descending (D) 44,587 88,981 26Sigmoid (S) 38,499 76,823 22Rectum (R) 38,177 76,276 23
Table 2. Computational time for supine and prone feature matching (in-cluding feature extraction) and harmonic map registration.
Time (s) A T D S RFeature matching (FM) 18 19 21 18 16
Harmonic mapping (HM) 10 11 12 10 10
shows the statistics for the conformal mapping of each segment. Table2 shows the computational time for supine and prone feature matching(including feature extraction) and harmonic map registration.
We evaluate our registration results using two methods. The firstis an objective analytic evaluation, whereby distances between corre-sponding points on the registered colons are calculated. The secondmethod is a more subjective visual verification, whereby we observethe correct alignment of corresponding features in both flattened 2Dviews and endoluminal views using our consistent view camera map-ping detailed in Section 5.
6.1 Analytic Registration Evaluation
Our first evaluation is a distance measurement between correspondingfeatures located on the registered colon surfaces. Since our registrationis in the 2D space using the flattened colon surfaces, a point (x,y,z) inR
3 on the original colon surface will be at a location (u,v) in R2 on the
registered surface. Thus, for a point p0 = (up,vp) on the supine colonsurface and its corresponding point q0 = (uq,vq) on the prone colon
Table 3. Comparison of average distance error between our quasi-conformal registration method and other registration methods.
Methods Dist. ErrorOur Quasi-Conformal Mapping 7.85 mmCenterline registration + statistical analysis(Li et al., 2004 [21]) 12.66 mmLinear stretching / shrinking of centerline(Acar et al., 2001 [1]) 13.20 mmCenterline feature matching + lumen deformation(Suh & Wyatt., 2009 [28]) 13.77 mmCenterline point correlation(de Vries et al., 2006 [6]) 20.00 mmTaeniae coli correlation(Huang et al., 2005 [16]) 23.33 mm
surface, a perfect registration with zero error is present when up = uq
and vp = vq. For two corresponding points, we compute the L2 normof their 2D coordinates with the width of the flattened images fixedto a unit length of 1. Note that the width along the flattened image isequivalent to the colon circumference for that location.
We also compute the 3D distance error in millimeters. For the twocorresponding points p0 and q0 in R
2, we know their locations r0 ands0 in R
3. If we take the supine surface (containing p0) as the truth andwish to measure the registration error on the prone surface (containingq0), we can identify the point p1 = (uq,vq) in R
2 on the supine surfaceand similarly its location r1 in R
3. The distance error in millimeters isthen given to be |r1− r0|.
We obtain the corresponding feature points for evaluation in twoways. The first is by manually identifying points of interest (e.g., apolyp) on both colon surfaces. We manually select the center of polypson the registered flat images. For the polyp shown in Figure 1, thedistance error is 0.0265 in R
2 and 5.31 mm in R3. We have evaluated
our algorithm using a total of 20 pairs on 6 datasets, and the averagedistance error is 0.0305 in R
2 and 5.65 mm in R3.
Our second method of finding corresponding points is to use a sub-set (half) of the features obtained from the feature extraction detailedin Section 4.3. We use these features for evaluation purposes, and only
1355ZENG ET AL: SUPINE AND PRONE COLON REGISTRATION USING QUASI-CONFORMAL MAPPING
(a) segment A (b) segment A (c) segment T (d) segment T (e) segment S (f) segment Sunregistered registered unregistered registered unregistered registered
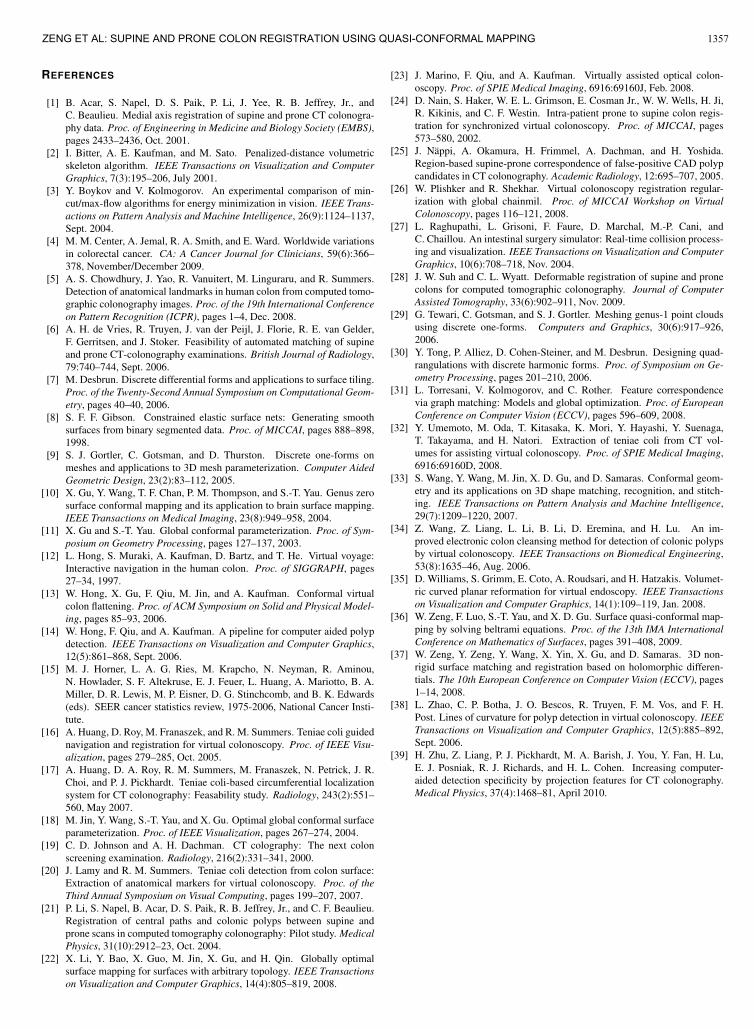
Fig. 13. Visualization of registration results for segments A, T, and S, with 16, 15, and 13 feature constraints, respectively. For each image pair,supine is shown on the left and prone on the right.
the remaining half are used in the harmonic mapping step. Note thatthis inherently reduces the quality of the registration, and thus a reg-istration using all feature points will contain less error. We generallycomputed 16 pairs of features points for each segment, about 2 featurepoints along one folding with obvious correspondence (see Figure 9).For the registration shown in Figure 1, the distance error in terms offeature points evaluation is computed to be 0.0325 in R
2 and 7.51 mmin R
3. The average R3 distance on 6 datasets is 7.85 mm.
A comparison between our method and other methods is performedusing our analytic evaluation results in R
3. For those papers thatpresent their distance error, we compare our results with their results inTable 3. Our method produces a registration with significantly smallerdistance error between corresponding points than other methods.
6.2 Visual Registration Verification
Perhaps a better indicator of the utility of our registration is a visualevaluation of the results, as this mimics most closely how the user ofa VC system would use our results. For this, we utilized both the flat-tened rendering and the 3D correlated endoluminal renderings. In ourexperience, the correlation between the flattened renderings was good,as was the endoluminal views. In Figure 13, we show three supine-prone colon segments, flat rendered, both unregistered and registered.The images of the registered segments clearly show very good align-ment of the supine and prone colon structures, whereas the unregis-tered segments show poor alignment.
We have also shown our results to a radiologist who was involvedwith the early conception of the VC system and thus has over ten yearsof experience in reading them. He noted that the flat rendering wasrealistic, and that the anatomy between supine and prone was easilycompared and well correlated. He also noted the good correlation be-tween the endoluminal views, and gave his opinion that such viewswere easier to compare than the flattened views due to his greater fa-miliarity with them (he had not been exposed to flattened renderingprior to viewing this work).
6.3 Analysis and Discussion
The deformation between supine and prone scans of the colon surfaceis elastic, and from physics, elastic deformations are quasi-conformal.Therefore, in principle, our geometric model derives from the real bio-physical properties of the muscle. Intuitively, the deformation at eachpoint is determined by the elasticity properties of the colon surface,which are fully represented by the Beltrami coefficients. The physicalproperty is fully encoded in the Beltrami coefficient function.
Previous works have most often focused on centerline alignment.The ground truth for colon deformation is the entire surface deforma-tion, the centerline conveys only very limited information. Since ourmethod uses the surface instead of the centerline, it is expected that we
achieve better results than the more crude centerline methods, whichhas been shown in Table 3.
For the method of registration based on global deformation [26], adeformation field is defined for the whole volume which includes thevolume inside the colon surface. Our method focuses on the intrinsicsurface deformation itself. In reality, different colon surface parts cantouch each other, and this kind of deformation cannot be captured bya method based on global deformation. In addition, volumetric defor-mation requires much higher storage requirements, and the resolutionof the deformation field on the surface is much lower. Our methodonly considers the surface, and thus it has much more efficient storageand much higher resolution for the conformal field.
7 CONCLUSIONS AND FUTURE WORK
Shape registration is very fundamental for shape analysis problems,especially for abnormality detection in medical applications. We in-troduce an efficient framework for the registration of supine and pronecolons, through the use of conformal geometry, to improve the accu-racy of polyp detection. We automatically extract the anatomical land-marks, namely the taeniae coli and flexures, for consistent segmenta-tion. We then conformally flatten the colon surfaces to the rectangulardomain using holomorphic differentials. The feature points are auto-matically detected from mean-curvature encoded images using graphcut segmentation, and their correspondence between supine and proneare obtained by graph matching. These feature constraints are used toalign the flattened domains by adjusting the conformal mapping to bequasi-conformal through the harmonic map. We demonstrate the effi-ciency of our method by both analytic evaluation and the 2D and 3Dconsistent registration views. The Beltrami coefficient is employed toanalyze the physical deformation of the colon muscle and tissue. Toour best knowledge, this is the first work to use a geometric mappingmethod for the supine and prone colon surface registration problem.
With the ability to measure and view the elastic distortion betweensegments of the supine and prone colons, we are seeking further out-lets to which this work can be applied. We are looking at applying thisregistration to our CAD work to achieve better sensitivity and speci-ficity. Additionally, we are looking to extend our work from 2D sur-face registration to 3D volumetric registration for colon wall segme-nations which contain thickness.
ACKNOWLEDGMENTS
This work has been supported by NIH grant R01EB7530, NSF grantsIIS0916235, IIS0916286, CCF0702699, CCF0830550, CCF0916235,and III0713145, and ONR grant N000140910228. The datasets havebeen obtained through the NIH, courtesy of Dr. Richard Choi, WalterReed Army Medical Center. We would like to thank Dr. Mark Waxfor reviewing the results of our registration and providing feedback.
1356 IEEE TRANSACTIONS ON VISUALIZATION AND COMPUTER GRAPHICS, VOL. 16, NO. 6, NOVEMBER/DECEMBER 2010
REFERENCES
[1] B. Acar, S. Napel, D. S. Paik, P. Li, J. Yee, R. B. Jeffrey, Jr., andC. Beaulieu. Medial axis registration of supine and prone CT colonogra-phy data. Proc. of Engineering in Medicine and Biology Society (EMBS),pages 2433–2436, Oct. 2001.
[2] I. Bitter, A. E. Kaufman, and M. Sato. Penalized-distance volumetricskeleton algorithm. IEEE Transactions on Visualization and ComputerGraphics, 7(3):195–206, July 2001.
[3] Y. Boykov and V. Kolmogorov. An experimental comparison of min-cut/max-flow algorithms for energy minimization in vision. IEEE Trans-actions on Pattern Analysis and Machine Intelligence, 26(9):1124–1137,Sept. 2004.
[4] M. M. Center, A. Jemal, R. A. Smith, and E. Ward. Worldwide variationsin colorectal cancer. CA: A Cancer Journal for Clinicians, 59(6):366–378, November/December 2009.
[5] A. S. Chowdhury, J. Yao, R. Vanuitert, M. Linguraru, and R. Summers.Detection of anatomical landmarks in human colon from computed tomo-graphic colonography images. Proc. of the 19th International Conferenceon Pattern Recognition (ICPR), pages 1–4, Dec. 2008.
[6] A. H. de Vries, R. Truyen, J. van der Peijl, J. Florie, R. E. van Gelder,F. Gerritsen, and J. Stoker. Feasibility of automated matching of supineand prone CT-colonography examinations. British Journal of Radiology,79:740–744, Sept. 2006.
[7] M. Desbrun. Discrete differential forms and applications to surface tiling.Proc. of the Twenty-Second Annual Symposium on Computational Geom-etry, pages 40–40, 2006.
[8] S. F. F. Gibson. Constrained elastic surface nets: Generating smoothsurfaces from binary segmented data. Proc. of MICCAI, pages 888–898,1998.
[9] S. J. Gortler, C. Gotsman, and D. Thurston. Discrete one-forms onmeshes and applications to 3D mesh parameterization. Computer AidedGeometric Design, 23(2):83–112, 2005.
[10] X. Gu, Y. Wang, T. F. Chan, P. M. Thompson, and S.-T. Yau. Genus zerosurface conformal mapping and its application to brain surface mapping.IEEE Transactions on Medical Imaging, 23(8):949–958, 2004.
[11] X. Gu and S.-T. Yau. Global conformal parameterization. Proc. of Sym-posium on Geometry Processing, pages 127–137, 2003.
[12] L. Hong, S. Muraki, A. Kaufman, D. Bartz, and T. He. Virtual voyage:Interactive navigation in the human colon. Proc. of SIGGRAPH, pages27–34, 1997.
[13] W. Hong, X. Gu, F. Qiu, M. Jin, and A. Kaufman. Conformal virtualcolon flattening. Proc. of ACM Symposium on Solid and Physical Model-ing, pages 85–93, 2006.
[14] W. Hong, F. Qiu, and A. Kaufman. A pipeline for computer aided polypdetection. IEEE Transactions on Visualization and Computer Graphics,12(5):861–868, Sept. 2006.
[15] M. J. Horner, L. A. G. Ries, M. Krapcho, N. Neyman, R. Aminou,N. Howlader, S. F. Altekruse, E. J. Feuer, L. Huang, A. Mariotto, B. A.Miller, D. R. Lewis, M. P. Eisner, D. G. Stinchcomb, and B. K. Edwards(eds). SEER cancer statistics review, 1975-2006, National Cancer Insti-tute.
[16] A. Huang, D. Roy, M. Franaszek, and R. M. Summers. Teniae coli guidednavigation and registration for virtual colonoscopy. Proc. of IEEE Visu-alization, pages 279–285, Oct. 2005.
[17] A. Huang, D. A. Roy, R. M. Summers, M. Franaszek, N. Petrick, J. R.Choi, and P. J. Pickhardt. Teniae coli-based circumferential localizationsystem for CT colonography: Feasability study. Radiology, 243(2):551–560, May 2007.
[18] M. Jin, Y. Wang, S.-T. Yau, and X. Gu. Optimal global conformal surfaceparameterization. Proc. of IEEE Visualization, pages 267–274, 2004.
[19] C. D. Johnson and A. H. Dachman. CT colography: The next colonscreening examination. Radiology, 216(2):331–341, 2000.
[20] J. Lamy and R. M. Summers. Teniae coli detection from colon surface:Extraction of anatomical markers for virtual colonoscopy. Proc. of theThird Annual Symposium on Visual Computing, pages 199–207, 2007.
[21] P. Li, S. Napel, B. Acar, D. S. Paik, R. B. Jeffrey, Jr., and C. F. Beaulieu.Registration of central paths and colonic polyps between supine andprone scans in computed tomography colonography: Pilot study. MedicalPhysics, 31(10):2912–23, Oct. 2004.
[22] X. Li, Y. Bao, X. Guo, M. Jin, X. Gu, and H. Qin. Globally optimalsurface mapping for surfaces with arbitrary topology. IEEE Transactionson Visualization and Computer Graphics, 14(4):805–819, 2008.
[23] J. Marino, F. Qiu, and A. Kaufman. Virtually assisted optical colon-oscopy. Proc. of SPIE Medical Imaging, 6916:69160J, Feb. 2008.
[24] D. Nain, S. Haker, W. E. L. Grimson, E. Cosman Jr., W. W. Wells, H. Ji,R. Kikinis, and C. F. Westin. Intra-patient prone to supine colon regis-tration for synchronized virtual colonoscopy. Proc. of MICCAI, pages573–580, 2002.
[25] J. Nappi, A. Okamura, H. Frimmel, A. Dachman, and H. Yoshida.Region-based supine-prone correspondence of false-positive CAD polypcandidates in CT colonography. Academic Radiology, 12:695–707, 2005.
[26] W. Plishker and R. Shekhar. Virtual colonoscopy registration regular-ization with global chainmil. Proc. of MICCAI Workshop on VirtualColonoscopy, pages 116–121, 2008.
[27] L. Raghupathi, L. Grisoni, F. Faure, D. Marchal, M.-P. Cani, andC. Chaillou. An intestinal surgery simulator: Real-time collision process-ing and visualization. IEEE Transactions on Visualization and ComputerGraphics, 10(6):708–718, Nov. 2004.
[28] J. W. Suh and C. L. Wyatt. Deformable registration of supine and pronecolons for computed tomographic colonography. Journal of ComputerAssisted Tomography, 33(6):902–911, Nov. 2009.
[29] G. Tewari, C. Gotsman, and S. J. Gortler. Meshing genus-1 point cloudsusing discrete one-forms. Computers and Graphics, 30(6):917–926,2006.
[30] Y. Tong, P. Alliez, D. Cohen-Steiner, and M. Desbrun. Designing quad-rangulations with discrete harmonic forms. Proc. of Symposium on Ge-ometry Processing, pages 201–210, 2006.
[31] L. Torresani, V. Kolmogorov, and C. Rother. Feature correspondencevia graph matching: Models and global optimization. Proc. of EuropeanConference on Computer Vision (ECCV), pages 596–609, 2008.
[32] Y. Umemoto, M. Oda, T. Kitasaka, K. Mori, Y. Hayashi, Y. Suenaga,T. Takayama, and H. Natori. Extraction of teniae coli from CT vol-umes for assisting virtual colonoscopy. Proc. of SPIE Medical Imaging,6916:69160D, 2008.
[33] S. Wang, Y. Wang, M. Jin, X. D. Gu, and D. Samaras. Conformal geom-etry and its applications on 3D shape matching, recognition, and stitch-ing. IEEE Transactions on Pattern Analysis and Machine Intelligence,29(7):1209–1220, 2007.
[34] Z. Wang, Z. Liang, L. Li, B. Li, D. Eremina, and H. Lu. An im-proved electronic colon cleansing method for detection of colonic polypsby virtual colonoscopy. IEEE Transactions on Biomedical Engineering,53(8):1635–46, Aug. 2006.
[35] D. Williams, S. Grimm, E. Coto, A. Roudsari, and H. Hatzakis. Volumet-ric curved planar reformation for virtual endoscopy. IEEE Transactionson Visualization and Computer Graphics, 14(1):109–119, Jan. 2008.
[36] W. Zeng, F. Luo, S.-T. Yau, and X. D. Gu. Surface quasi-conformal map-ping by solving beltrami equations. Proc. of the 13th IMA InternationalConference on Mathematics of Surfaces, pages 391–408, 2009.
[37] W. Zeng, Y. Zeng, Y. Wang, X. Yin, X. Gu, and D. Samaras. 3D non-rigid surface matching and registration based on holomorphic differen-tials. The 10th European Conference on Computer Vision (ECCV), pages1–14, 2008.
[38] L. Zhao, C. P. Botha, J. O. Bescos, R. Truyen, F. M. Vos, and F. H.Post. Lines of curvature for polyp detection in virtual colonoscopy. IEEETransactions on Visualization and Computer Graphics, 12(5):885–892,Sept. 2006.
[39] H. Zhu, Z. Liang, P. J. Pickhardt, M. A. Barish, J. You, Y. Fan, H. Lu,E. J. Posniak, R. J. Richards, and H. L. Cohen. Increasing computer-aided detection specificity by projection features for CT colonography.Medical Physics, 37(4):1468–81, April 2010.
1357ZENG ET AL: SUPINE AND PRONE COLON REGISTRATION USING QUASI-CONFORMAL MAPPING
Copyright © 2022 FDOKUMEN