profiling of commmercial agave fructooligosaccharides using ...
12
Revista Mexicana de Ingeniería Química ISSN: 1665-2738 [email protected] Universidad Autónoma Metropolitana Unidad Iztapalapa México Alvarado, C.; Camacho, R.M.; Cejas, R.; Rodríguez, J.A. PROFILING OF COMMMERCIAL AGAVE FRUCTOOLIGOSACCHARIDES USING ULTRAFILTRATION AND HIGH PERFORMANCE THIN LAYER CROMATOGRAPHY Revista Mexicana de Ingeniería Química, vol. 13, núm. 2, 2014, pp. 417-427 Universidad Autónoma Metropolitana Unidad Iztapalapa Distrito Federal, México Available in: http://www.redalyc.org/articulo.oa?id=62031508006 How to cite Complete issue More information about this article Journal's homepage in redalyc.org Scientific Information System Network of Scientific Journals from Latin America, the Caribbean, Spain and Portugal Non-profit academic project, developed under the open access initiative
-
Upload
khangminh22 -
Category
Documents
-
view
1 -
download
0
Transcript of profiling of commmercial agave fructooligosaccharides using ...
Revista Mexicana de Ingeniería Química
ISSN: 1665-2738
Universidad Autónoma Metropolitana Unidad
Iztapalapa
México
Alvarado, C.; Camacho, R.M.; Cejas, R.; Rodríguez, J.A.
PROFILING OF COMMMERCIAL AGAVE FRUCTOOLIGOSACCHARIDES USING
ULTRAFILTRATION AND HIGH PERFORMANCE THIN LAYER CROMATOGRAPHY
Revista Mexicana de Ingeniería Química, vol. 13, núm. 2, 2014, pp. 417-427
Universidad Autónoma Metropolitana Unidad Iztapalapa
Distrito Federal, México
Available in: http://www.redalyc.org/articulo.oa?id=62031508006
How to cite
Complete issue
More information about this article
Journal's homepage in redalyc.org
Scientific Information System
Network of Scientific Journals from Latin America, the Caribbean, Spain and Portugal
Non-profit academic project, developed under the open access initiative
Revista Mexicana de Ingeniería Química
CONTENIDO
Volumen 8, número 3, 2009 / Volume 8, number 3, 2009
213 Derivation and application of the Stefan-Maxwell equations
(Desarrollo y aplicación de las ecuaciones de Stefan-Maxwell)
Stephen Whitaker
Biotecnología / Biotechnology
245 Modelado de la biodegradación en biorreactores de lodos de hidrocarburos totales del petróleo
intemperizados en suelos y sedimentos
(Biodegradation modeling of sludge bioreactors of total petroleum hydrocarbons weathering in soil
and sediments)
S.A. Medina-Moreno, S. Huerta-Ochoa, C.A. Lucho-Constantino, L. Aguilera-Vázquez, A. Jiménez-
González y M. Gutiérrez-Rojas
259 Crecimiento, sobrevivencia y adaptación de Bifidobacterium infantis a condiciones ácidas
(Growth, survival and adaptation of Bifidobacterium infantis to acidic conditions)
L. Mayorga-Reyes, P. Bustamante-Camilo, A. Gutiérrez-Nava, E. Barranco-Florido y A. Azaola-
Espinosa
265 Statistical approach to optimization of ethanol fermentation by Saccharomyces cerevisiae in the
presence of Valfor® zeolite NaA
(Optimización estadística de la fermentación etanólica de Saccharomyces cerevisiae en presencia de
zeolita Valfor® zeolite NaA)
G. Inei-Shizukawa, H. A. Velasco-Bedrán, G. F. Gutiérrez-López and H. Hernández-Sánchez
Ingeniería de procesos / Process engineering
271 Localización de una planta industrial: Revisión crítica y adecuación de los criterios empleados en
esta decisión
(Plant site selection: Critical review and adequation criteria used in this decision)
J.R. Medina, R.L. Romero y G.A. Pérez
Ingeniería de alimentos Vol. 13, No. 2 (2014) 417-427
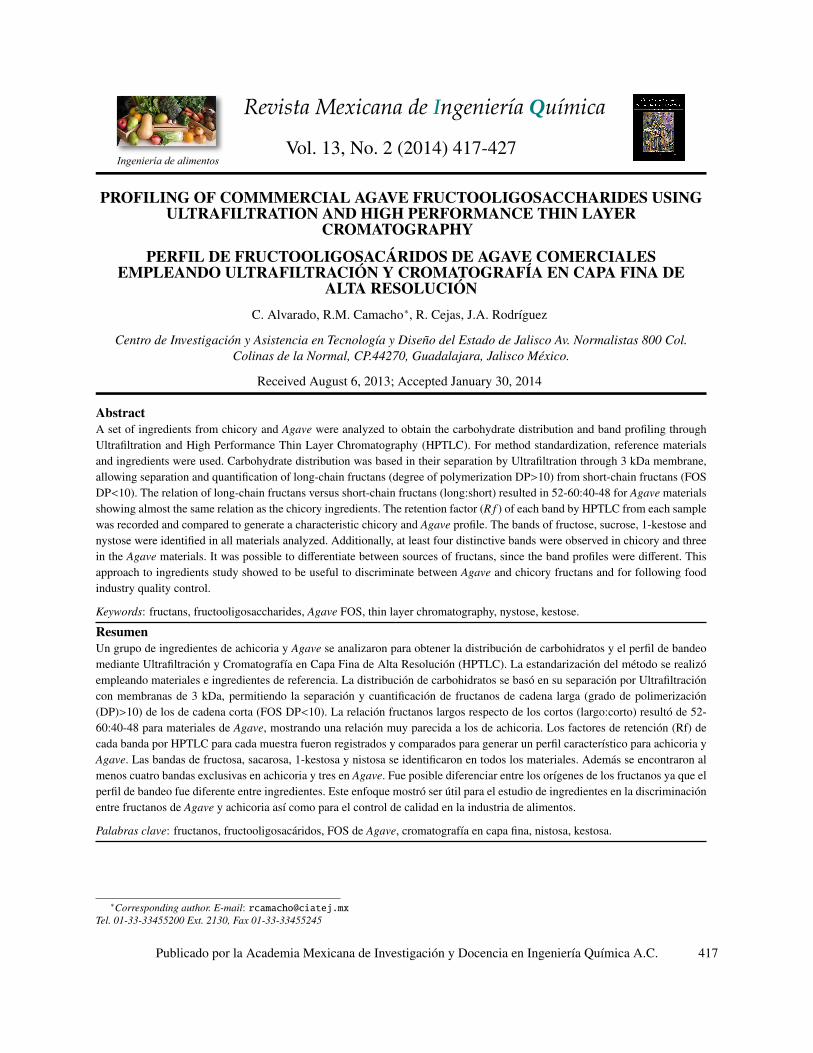
PROFILING OF COMMMERCIAL AGAVE FRUCTOOLIGOSACCHARIDES USINGULTRAFILTRATION AND HIGH PERFORMANCE THIN LAYER
CROMATOGRAPHY
PERFIL DE FRUCTOOLIGOSACARIDOS DE AGAVE COMERCIALESEMPLEANDO ULTRAFILTRACION Y CROMATOGRAFIA EN CAPA FINA DE
ALTA RESOLUCIONC. Alvarado, R.M. Camacho∗, R. Cejas, J.A. Rodrıguez
Centro de Investigacion y Asistencia en Tecnologıa y Diseno del Estado de Jalisco Av. Normalistas 800 Col.Colinas de la Normal, CP.44270, Guadalajara, Jalisco Mexico.
Received August 6, 2013; Accepted January 30, 2014
AbstractA set of ingredients from chicory and Agave were analyzed to obtain the carbohydrate distribution and band profiling throughUltrafiltration and High Performance Thin Layer Chromatography (HPTLC). For method standardization, reference materialsand ingredients were used. Carbohydrate distribution was based in their separation by Ultrafiltration through 3 kDa membrane,allowing separation and quantification of long-chain fructans (degree of polymerization DP>10) from short-chain fructans (FOSDP<10). The relation of long-chain fructans versus short-chain fructans (long:short) resulted in 52-60:40-48 for Agave materialsshowing almost the same relation as the chicory ingredients. The retention factor (R f ) of each band by HPTLC from each samplewas recorded and compared to generate a characteristic chicory and Agave profile. The bands of fructose, sucrose, 1-kestose andnystose were identified in all materials analyzed. Additionally, at least four distinctive bands were observed in chicory and threein the Agave materials. It was possible to differentiate between sources of fructans, since the band profiles were different. Thisapproach to ingredients study showed to be useful to discriminate between Agave and chicory fructans and for following foodindustry quality control.
Keywords: fructans, fructooligosaccharides, Agave FOS, thin layer chromatography, nystose, kestose.
ResumenUn grupo de ingredientes de achicoria y Agave se analizaron para obtener la distribucion de carbohidratos y el perfil de bandeomediante Ultrafiltracion y Cromatografıa en Capa Fina de Alta Resolucion (HPTLC). La estandarizacion del metodo se realizoempleando materiales e ingredientes de referencia. La distribucion de carbohidratos se baso en su separacion por Ultrafiltracioncon membranas de 3 kDa, permitiendo la separacion y cuantificacion de fructanos de cadena larga (grado de polimerizacion(DP)>10) de los de cadena corta (FOS DP<10). La relacion fructanos largos respecto de los cortos (largo:corto) resulto de 52-60:40-48 para materiales de Agave, mostrando una relacion muy parecida a los de achicoria. Los factores de retencion (Rf) decada banda por HPTLC para cada muestra fueron registrados y comparados para generar un perfil caracterıstico para achicoria yAgave. Las bandas de fructosa, sacarosa, 1-kestosa y nistosa se identificaron en todos los materiales. Ademas se encontraron almenos cuatro bandas exclusivas en achicoria y tres en Agave. Fue posible diferenciar entre los orıgenes de los fructanos ya que elperfil de bandeo fue diferente entre ingredientes. Este enfoque mostro ser util para el estudio de ingredientes en la discriminacionentre fructanos de Agave y achicoria ası como para el control de calidad en la industria de alimentos.
Palabras clave: fructanos, fructooligosacaridos, FOS de Agave, cromatografıa en capa fina, nistosa, kestosa.
∗Corresponding author. E-mail: [email protected]. 01-33-33455200 Ext. 2130, Fax 01-33-33455245
Publicado por la Academia Mexicana de Investigacion y Docencia en Ingenierıa Quımica A.C. 417
Alvarado et al./ Revista Mexicana de Ingenierıa Quımica Vol. 13, No. 2 (2014) 417-427
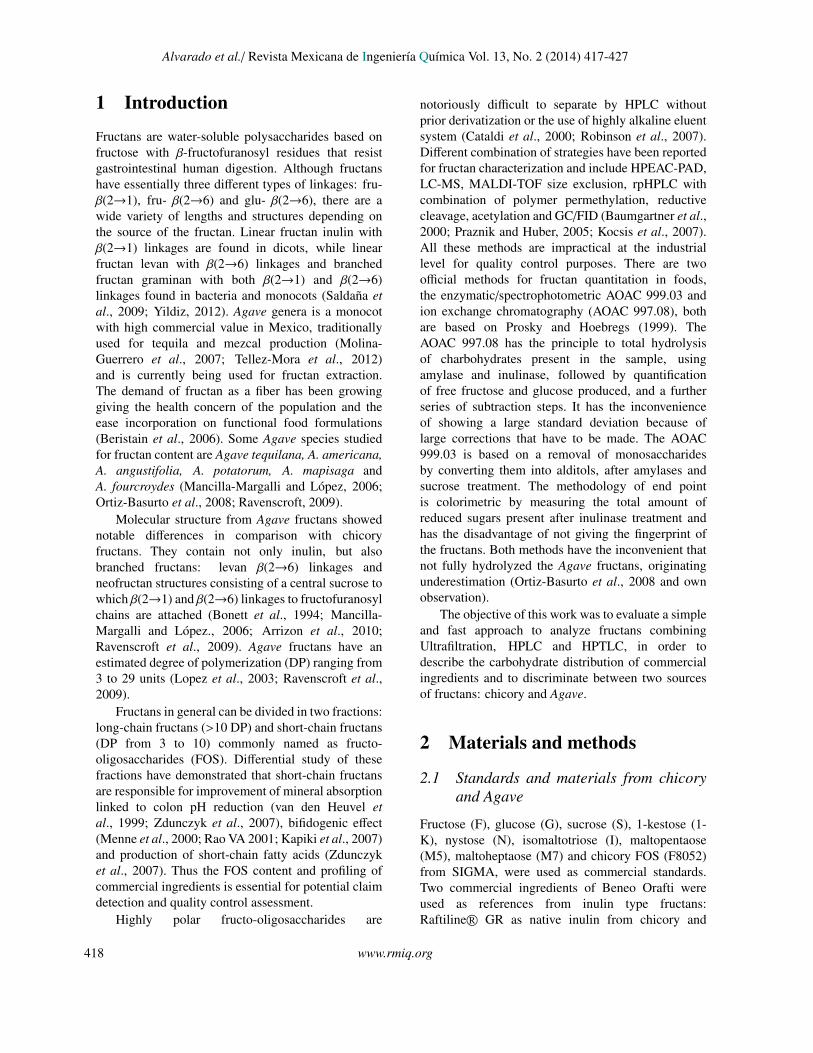
1 Introduction
Fructans are water-soluble polysaccharides based onfructose with β-fructofuranosyl residues that resistgastrointestinal human digestion. Although fructanshave essentially three different types of linkages: fru-β(2→1), fru- β(2→6) and glu- β(2→6), there are awide variety of lengths and structures depending onthe source of the fructan. Linear fructan inulin withβ(2→1) linkages are found in dicots, while linearfructan levan with β(2→6) linkages and branchedfructan graminan with both β(2→1) and β(2→6)linkages found in bacteria and monocots (Saldana etal., 2009; Yildiz, 2012). Agave genera is a monocotwith high commercial value in Mexico, traditionallyused for tequila and mezcal production (Molina-Guerrero et al., 2007; Tellez-Mora et al., 2012)and is currently being used for fructan extraction.The demand of fructan as a fiber has been growinggiving the health concern of the population and theease incorporation on functional food formulations(Beristain et al., 2006). Some Agave species studiedfor fructan content are Agave tequilana, A. americana,A. angustifolia, A. potatorum, A. mapisaga andA. fourcroydes (Mancilla-Margalli and Lopez, 2006;Ortiz-Basurto et al., 2008; Ravenscroft, 2009).
Molecular structure from Agave fructans showednotable differences in comparison with chicoryfructans. They contain not only inulin, but alsobranched fructans: levan β(2→6) linkages andneofructan structures consisting of a central sucrose towhich β(2→1) and β(2→6) linkages to fructofuranosylchains are attached (Bonett et al., 1994; Mancilla-Margalli and Lopez., 2006; Arrizon et al., 2010;Ravenscroft et al., 2009). Agave fructans have anestimated degree of polymerization (DP) ranging from3 to 29 units (Lopez et al., 2003; Ravenscroft et al.,2009).
Fructans in general can be divided in two fractions:long-chain fructans (>10 DP) and short-chain fructans(DP from 3 to 10) commonly named as fructo-oligosaccharides (FOS). Differential study of thesefractions have demonstrated that short-chain fructansare responsible for improvement of mineral absorptionlinked to colon pH reduction (van den Heuvel etal., 1999; Zdunczyk et al., 2007), bifidogenic effect(Menne et al., 2000; Rao VA 2001; Kapiki et al., 2007)and production of short-chain fatty acids (Zdunczyket al., 2007). Thus the FOS content and profiling ofcommercial ingredients is essential for potential claimdetection and quality control assessment.
Highly polar fructo-oligosaccharides are
notoriously difficult to separate by HPLC withoutprior derivatization or the use of highly alkaline eluentsystem (Cataldi et al., 2000; Robinson et al., 2007).Different combination of strategies have been reportedfor fructan characterization and include HPEAC-PAD,LC-MS, MALDI-TOF size exclusion, rpHPLC withcombination of polymer permethylation, reductivecleavage, acetylation and GC/FID (Baumgartner et al.,2000; Praznik and Huber, 2005; Kocsis et al., 2007).All these methods are impractical at the industriallevel for quality control purposes. There are twoofficial methods for fructan quantitation in foods,the enzymatic/spectrophotometric AOAC 999.03 andion exchange chromatography (AOAC 997.08), bothare based on Prosky and Hoebregs (1999). TheAOAC 997.08 has the principle to total hydrolysisof charbohydrates present in the sample, usingamylase and inulinase, followed by quantificationof free fructose and glucose produced, and a furtherseries of subtraction steps. It has the inconvenienceof showing a large standard deviation because oflarge corrections that have to be made. The AOAC999.03 is based on a removal of monosaccharidesby converting them into alditols, after amylases andsucrose treatment. The methodology of end pointis colorimetric by measuring the total amount ofreduced sugars present after inulinase treatment andhas the disadvantage of not giving the fingerprint ofthe fructans. Both methods have the inconvenient thatnot fully hydrolyzed the Agave fructans, originatingunderestimation (Ortiz-Basurto et al., 2008 and ownobservation).
The objective of this work was to evaluate a simpleand fast approach to analyze fructans combiningUltrafiltration, HPLC and HPTLC, in order todescribe the carbohydrate distribution of commercialingredients and to discriminate between two sourcesof fructans: chicory and Agave.
2 Materials and methods
2.1 Standards and materials from chicoryand Agave
Fructose (F), glucose (G), sucrose (S), 1-kestose (1-K), nystose (N), isomaltotriose (I), maltopentaose(M5), maltoheptaose (M7) and chicory FOS (F8052)from SIGMA, were used as commercial standards.Two commercial ingredients of Beneo Orafti wereused as references from inulin type fructans:Raftiline R© GR as native inulin from chicory and
418 www.rmiq.org

Alvarado et al./ Revista Mexicana de Ingenierıa Quımica Vol. 13, No. 2 (2014) 417-427
BeneoT M P95 as short-chain fructooligosaccharides(FOS) from chicory. In order to obtain a referencematerial from Agave, FOS from Agave tequilanaWeber var. azul were obtained and named as CIATEJFOS. Water soluble carbohydrates (WSC) wereobtained by the transversal cut of the Agave headsin halves, then smashed completely and mixed withwater. The mixture was blended in a mechanicaldevice of stainless steel at 70◦C for 7 h, theWSC suspension was filtered through 80-100 meshuntil a final concentration of 10-15 ◦Brix. Watersoluble carbohydrates were purified using an ionicinterchange column, resulting in a product withno color or minerals. Fructans were processed bytangential flow filtration (TFF) with a 3kDa molecularweight cut off membrane, which separates long-chainfructans (DP>10), from short-chain FOS (DP<10).The retentate containing FOS was then spray driedin order to obtain a white powder with a relativehumidity of 4.1% (w/w). Three Agave ingredientsverified by CIATEJ through audit, were obtained fromindustrial producers in order to use them as referencematerials and were named as: Fag, Fan and Faa.Ten different materials claiming Agave origin werecollected from commercial sources and compared withreference materials from Agave and chicory origin,coded as follow: Fac, Fap, Fas, Fam, Fai, Idm, Iol,Ipr, Ibn, Inv.
2.2 Sugar quantitation
S, F and G content of the different ingredients werequantified by HPLC using a BioRad Aminex 42-C column, and water as the mobile phase. Sugarconcentration was obtained using the equation relatingcalibration curve from these sugars with the area underthe curve using refraction index detector. N and 1-Kwere quantified using their calibration curves obtainedby HPTLC linearized with logarithmic equationsobtained by densitometry at 400 nm. Results werereported in dry weight.
2.3 Carbohydrate distribution
Fructans were characterized in order to obtain theirdistribution based on chain length. The sampleswere solubilized in water (40 mg/mL) and separatedby ultrafiltration, using a 3 kDa membrane, intwo different fractions: permeate (P) containingshort-chain fructans with DP≤10∼12 (FOS) andretentate (R) containing long-chain fructans withDP>10. Efficiency of the separation was confirmed
by MALDI-TOF Bruker autoflex III TOF/TOF 200.FOS content was quantified subtracting the S, G and Fconcentration from the 3 kDa permeate dry weight (P)(ec. 1). Long-chain fructans (DP>10) were obtainedthrough dry weight determination of the retentate.Total fructans ec. (2) were obtained by the addition ofFOS plus R. Protein, lipid and ash were analyzed as acontrol.
FOS = P − S −G − F (1)
Total f ructans = FOS + R (2)
2.4 High Performance Thin LayerChromatography (HPTLC)
All the solvents (HPLC grade) and reagents werepurchased from SIGMA. The HPTLC system usedwas from CAMAG, with a LINOMAT5 to load thesample into the cromatoplate, a TLC Scanner 3 toanalyze the bands by densitometry at 400 nm and thewinCATS software to evaluate the chromatogramsobtained. Stationary phase for chromatographywas HPTLC-Fertigplatten Nano-SIL NH2/UV254(Macherey-Nagel, Germany) and mobile phase wasa mixture of n-butanol:methanol:water:acetic acid,50/25/20/1 (v/v/v/v). The cromatoplate was atomizedwith a solution of ethanol/H2SO4/anisaldehyde,18/1/1 (v/v/v) and placed at 190 ◦C for 20 min forrevelation. Selection of the most suitable measurementwavelength (λmax) was conducted after scanning ofstandard solutions in a range from 360 nm to 540nm. Retention factor (Rf) was calculated with thenext formula: Rf = Distance of analyte (mm)/ Totaldistance of front solvent (mm). Calibration curvesfrom F, S, 1-K, N, M5 and M7 were done althoughonly were used for 1-K and N concentration. Precisionmeasurements were conducted through Coefficientof Variation (%CV) in repeatability conditions with5 replicates (same day, operator and apparatus) andreproducibility conditions for 4 days (different day,same operator and apparatus).
3 Results and discussion
3.1 Standardization of HPTLC method
The separation of standards was achieved successfullyby HPTLC (Figure 1) with retention factors (Rf) of0.09-0.11, 0.14-0.17, 0.25-0.27, 0.28-0.29, 0.36-039,0.42-0.47 for M7 (DP 7), M5 (DP 5), N (DP 4), 1-K(DP 3), S (DP 2) and F (DP 1), respectively (Table 1).
www.rmiq.org 419
Alvarado et al./ Revista Mexicana de Ingenierıa Quımica Vol. 13, No. 2 (2014) 417-427
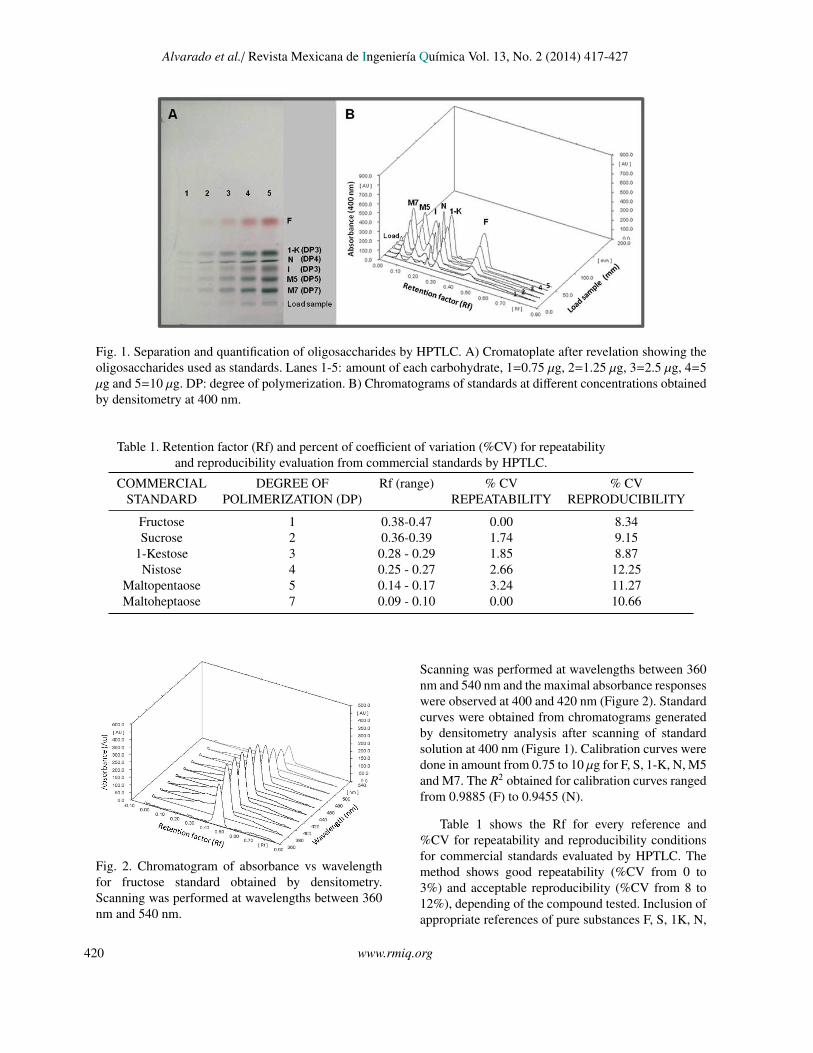
Fig. 1. Separation and quantification of oligosaccharides by HPTLC. A) Cromatoplate after revelation showing theoligosaccharides used as standards. Lanes 1-5: amount of each carbohydrate, 1=0.75 µg, 2=1.25 µg, 3=2.5 µg, 4=5µg and 5=10 µg. DP: degree of polymerization. B) Chromatograms of standards at different concentrations obtainedby densitometry at 400 nm.
Table 1. Retention factor (Rf) and percent of coefficient of variation (%CV) for repeatabilityand reproducibility evaluation from commercial standards by HPTLC.
COMMERCIAL DEGREE OF Rf (range) % CV % CVSTANDARD POLIMERIZATION (DP) REPEATABILITY REPRODUCIBILITY
Fructose 1 0.38-0.47 0.00 8.34Sucrose 2 0.36-0.39 1.74 9.15
1-Kestose 3 0.28 - 0.29 1.85 8.87Nistose 4 0.25 - 0.27 2.66 12.25
Maltopentaose 5 0.14 - 0.17 3.24 11.27Maltoheptaose 7 0.09 - 0.10 0.00 10.66
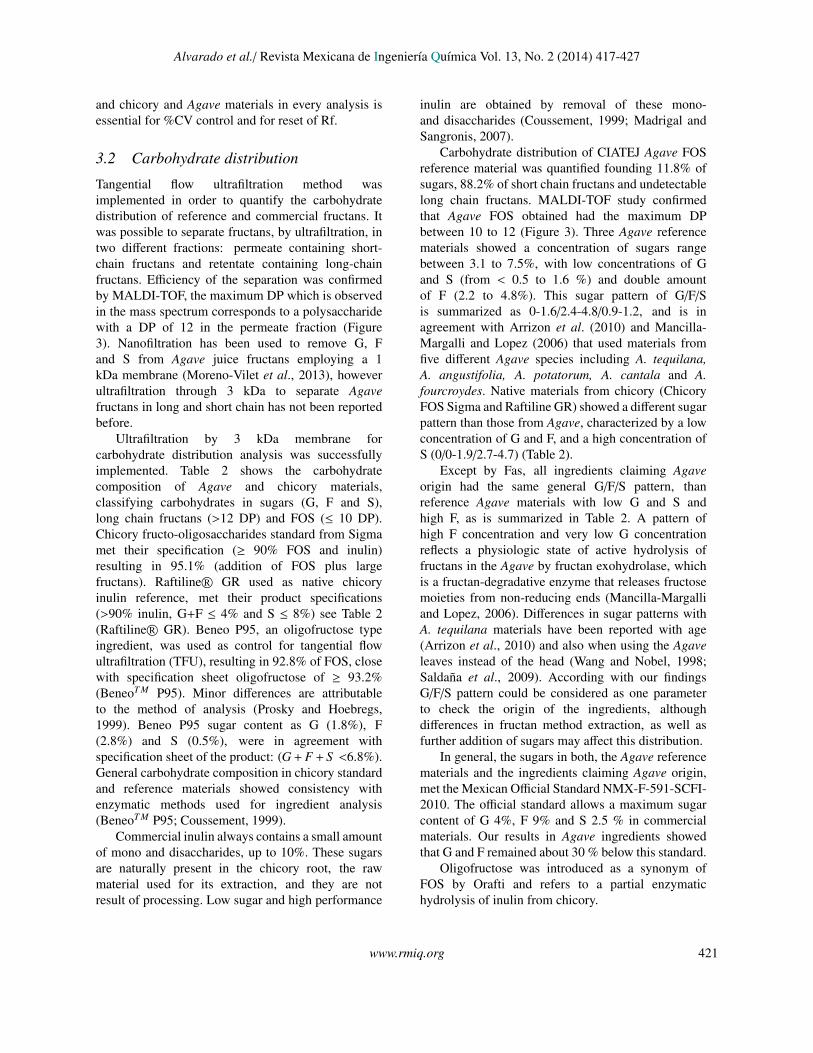
Fig. 2. Chromatogram of absorbance vs wavelengthfor fructose standard obtained by densitometry.Scanning was performed at wavelengths between 360nm and 540 nm.
Scanning was performed at wavelengths between 360nm and 540 nm and the maximal absorbance responseswere observed at 400 and 420 nm (Figure 2). Standardcurves were obtained from chromatograms generatedby densitometry analysis after scanning of standardsolution at 400 nm (Figure 1). Calibration curves weredone in amount from 0.75 to 10 µg for F, S, 1-K, N, M5and M7. The R2 obtained for calibration curves rangedfrom 0.9885 (F) to 0.9455 (N).
Table 1 shows the Rf for every reference and%CV for repeatability and reproducibility conditionsfor commercial standards evaluated by HPTLC. Themethod shows good repeatability (%CV from 0 to3%) and acceptable reproducibility (%CV from 8 to12%), depending of the compound tested. Inclusion ofappropriate references of pure substances F, S, 1K, N,
420 www.rmiq.org
Alvarado et al./ Revista Mexicana de Ingenierıa Quımica Vol. 13, No. 2 (2014) 417-427
and chicory and Agave materials in every analysis isessential for %CV control and for reset of Rf.
3.2 Carbohydrate distribution
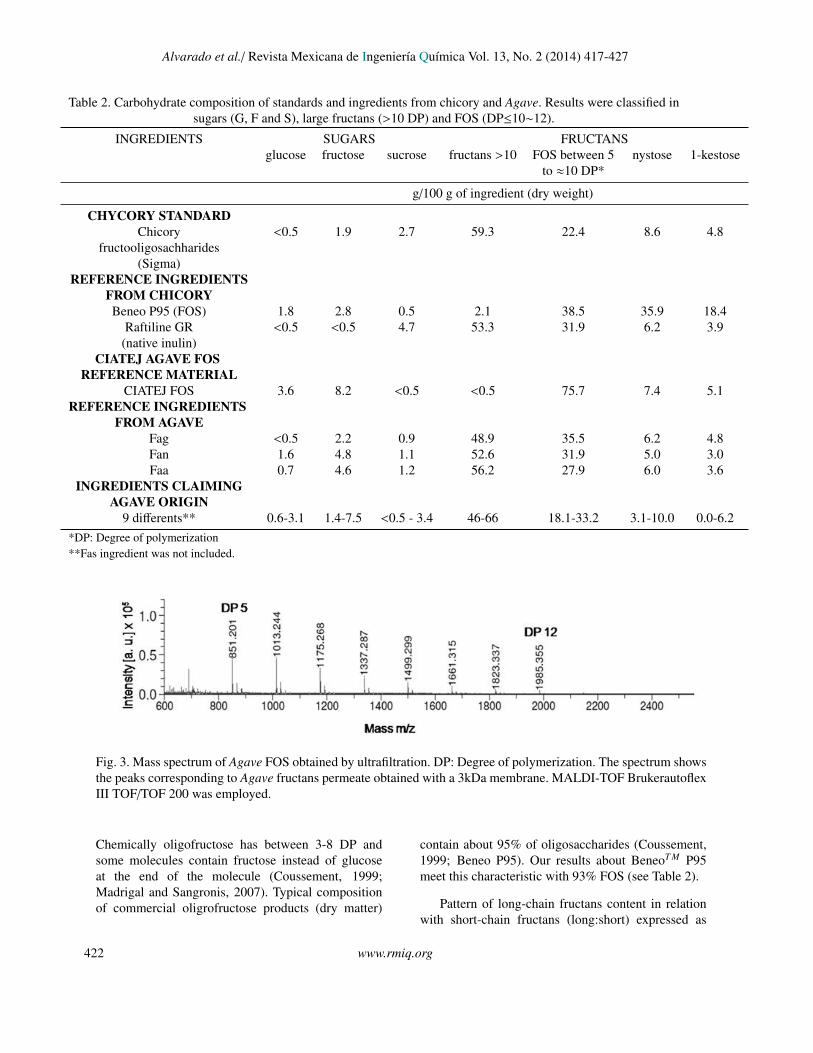
Tangential flow ultrafiltration method wasimplemented in order to quantify the carbohydratedistribution of reference and commercial fructans. Itwas possible to separate fructans, by ultrafiltration, intwo different fractions: permeate containing short-chain fructans and retentate containing long-chainfructans. Efficiency of the separation was confirmedby MALDI-TOF, the maximum DP which is observedin the mass spectrum corresponds to a polysaccharidewith a DP of 12 in the permeate fraction (Figure3). Nanofiltration has been used to remove G, Fand S from Agave juice fructans employing a 1kDa membrane (Moreno-Vilet et al., 2013), howeverultrafiltration through 3 kDa to separate Agavefructans in long and short chain has not been reportedbefore.
Ultrafiltration by 3 kDa membrane forcarbohydrate distribution analysis was successfullyimplemented. Table 2 shows the carbohydratecomposition of Agave and chicory materials,classifying carbohydrates in sugars (G, F and S),long chain fructans (>12 DP) and FOS (≤ 10 DP).Chicory fructo-oligosaccharides standard from Sigmamet their specification (≥ 90% FOS and inulin)resulting in 95.1% (addition of FOS plus largefructans). Raftiline R© GR used as native chicoryinulin reference, met their product specifications(>90% inulin, G+F ≤ 4% and S ≤ 8%) see Table 2(Raftiline R© GR). Beneo P95, an oligofructose typeingredient, was used as control for tangential flowultrafiltration (TFU), resulting in 92.8% of FOS, closewith specification sheet oligofructose of ≥ 93.2%(BeneoT M P95). Minor differences are attributableto the method of analysis (Prosky and Hoebregs,1999). Beneo P95 sugar content as G (1.8%), F(2.8%) and S (0.5%), were in agreement withspecification sheet of the product: (G + F + S <6.8%).General carbohydrate composition in chicory standardand reference materials showed consistency withenzymatic methods used for ingredient analysis(BeneoT M P95; Coussement, 1999).
Commercial inulin always contains a small amountof mono and disaccharides, up to 10%. These sugarsare naturally present in the chicory root, the rawmaterial used for its extraction, and they are notresult of processing. Low sugar and high performance
inulin are obtained by removal of these mono-and disaccharides (Coussement, 1999; Madrigal andSangronis, 2007).
Carbohydrate distribution of CIATEJ Agave FOSreference material was quantified founding 11.8% ofsugars, 88.2% of short chain fructans and undetectablelong chain fructans. MALDI-TOF study confirmedthat Agave FOS obtained had the maximum DPbetween 10 to 12 (Figure 3). Three Agave referencematerials showed a concentration of sugars rangebetween 3.1 to 7.5%, with low concentrations of Gand S (from < 0.5 to 1.6 %) and double amountof F (2.2 to 4.8%). This sugar pattern of G/F/Sis summarized as 0-1.6/2.4-4.8/0.9-1.2, and is inagreement with Arrizon et al. (2010) and Mancilla-Margalli and Lopez (2006) that used materials fromfive different Agave species including A. tequilana,A. angustifolia, A. potatorum, A. cantala and A.fourcroydes. Native materials from chicory (ChicoryFOS Sigma and Raftiline GR) showed a different sugarpattern than those from Agave, characterized by a lowconcentration of G and F, and a high concentration ofS (0/0-1.9/2.7-4.7) (Table 2).
Except by Fas, all ingredients claiming Agaveorigin had the same general G/F/S pattern, thanreference Agave materials with low G and S andhigh F, as is summarized in Table 2. A pattern ofhigh F concentration and very low G concentrationreflects a physiologic state of active hydrolysis offructans in the Agave by fructan exohydrolase, whichis a fructan-degradative enzyme that releases fructosemoieties from non-reducing ends (Mancilla-Margalliand Lopez, 2006). Differences in sugar patterns withA. tequilana materials have been reported with age(Arrizon et al., 2010) and also when using the Agaveleaves instead of the head (Wang and Nobel, 1998;Saldana et al., 2009). According with our findingsG/F/S pattern could be considered as one parameterto check the origin of the ingredients, althoughdifferences in fructan method extraction, as well asfurther addition of sugars may affect this distribution.
In general, the sugars in both, the Agave referencematerials and the ingredients claiming Agave origin,met the Mexican Official Standard NMX-F-591-SCFI-2010. The official standard allows a maximum sugarcontent of G 4%, F 9% and S 2.5 % in commercialmaterials. Our results in Agave ingredients showedthat G and F remained about 30 % below this standard.
Oligofructose was introduced as a synonym ofFOS by Orafti and refers to a partial enzymatichydrolysis of inulin from chicory.
www.rmiq.org 421
Alvarado et al./ Revista Mexicana de Ingenierıa Quımica Vol. 13, No. 2 (2014) 417-427
Table 2. Carbohydrate composition of standards and ingredients from chicory and Agave. Results were classified insugars (G, F and S), large fructans (>10 DP) and FOS (DP≤10∼12).
INGREDIENTS SUGARS FRUCTANSglucose fructose sucrose fructans >10 FOS between 5 nystose 1-kestose
to ≈10 DP*
g/100 g of ingredient (dry weight)
CHYCORY STANDARDChicory <0.5 1.9 2.7 59.3 22.4 8.6 4.8
fructooligosachharides(Sigma)
REFERENCE INGREDIENTSFROM CHICORYBeneo P95 (FOS) 1.8 2.8 0.5 2.1 38.5 35.9 18.4
Raftiline GR <0.5 <0.5 4.7 53.3 31.9 6.2 3.9(native inulin)
CIATEJ AGAVE FOSREFERENCE MATERIAL
CIATEJ FOS 3.6 8.2 <0.5 <0.5 75.7 7.4 5.1REFERENCE INGREDIENTS
FROM AGAVEFag <0.5 2.2 0.9 48.9 35.5 6.2 4.8Fan 1.6 4.8 1.1 52.6 31.9 5.0 3.0Faa 0.7 4.6 1.2 56.2 27.9 6.0 3.6
INGREDIENTS CLAIMINGAGAVE ORIGIN
9 differents** 0.6-3.1 1.4-7.5 <0.5 - 3.4 46-66 18.1-33.2 3.1-10.0 0.0-6.2*DP: Degree of polymerization**Fas ingredient was not included.
Fig. 3. Mass spectrum of Agave FOS obtained by ultrafiltration. DP: Degree of polymerization. The spectrum showsthe peaks corresponding to Agave fructans permeate obtained with a 3kDa membrane. MALDI-TOF BrukerautoflexIII TOF/TOF 200 was employed.
Chemically oligofructose has between 3-8 DP andsome molecules contain fructose instead of glucoseat the end of the molecule (Coussement, 1999;Madrigal and Sangronis, 2007). Typical compositionof commercial oligrofructose products (dry matter)
contain about 95% of oligosaccharides (Coussement,1999; Beneo P95). Our results about BeneoT M P95meet this characteristic with 93% FOS (see Table 2).
Pattern of long-chain fructans content in relationwith short-chain fructans (long:short) expressed as
422 www.rmiq.org

Alvarado et al./ Revista Mexicana de Ingenierıa Quımica Vol. 13, No. 2 (2014) 417-427
percent of total fructans resulted in a relation53-59:36-42 for native chicory inulin (Raftiline R©
GR), and 50-56:36-47 for Agave reference materials,showing almost the same relation in Agave andchicory. The characterization of FOS fraction inAgave ingredients is of great interest because it hasbeen associated to bone health and bifidogenic effect(Menne et al., 2000; van den Heuvel et al., 1999).Chicory inulin enrichment with oligofructose has beenprompted by industry, in order to achieve functionalclaims of ingredients.
3.3 HPTLC FOS profiling from chicory andAgave
Figure 4 shows the cromatoplate from Agaveand chicory fructans obtained by HPTLC, andFigure 5 shows some chromatograms performedby densitometry. This method is able to separatemolecules with DP ≤ 10∼12. Table 3 summarizes theretention factor (Rf) of the observed spots in two set ofresults: chicory and Agave.
Lanes 2, 3 and 4 from Figure 4 show chicorymaterials profiling. At least six defined bands werefound in chicory products and 1-K and N wereconfirmed. Table 3a shows F and S at Rf higher than0.34 according with Sigma standards. Figure 4 showsat lanes 5 to 8 the reference Agave materials, andfrom 9 to 11 shows ingredients claiming Agave origin.Profiling of Agave materials showed Rf coincidenceswith chicory in the bands F, S, 1-K, N and a bandwith Rf 0.11-0.12. Some bands were observed inchicory materials at Rf 0.19-0.22, 0.16-0.17 and 0.12-0.15 with no coincidence with Agave bands (Table 3).Meanwhile, a couple of coarse spots at Rf 0.18-0.20and 0.14-0.16 were found in Agave materials.
Differences between chicory and Agave profileshave been previously reported and fructans with DP4 to at least 8 have been shown in Agave materials(Mancilla-Margalli and Lopez, 2006; Ravenscroft etal., 2009; Saldana et al., 2009; Arrizon et al. 2010). Inthe CIATEJ Agave FOS MALDI-TOF, were observedoligofructans from DP 5 to 12. These molecules maybe included in Agave FOS but only five spots arepossible to evaluate by HPTLC.
Fig. 4. Cromatoplate of standards, chicory and AgaveFOS. Line 1: standards (F, fructose Rf 0.38-0.47; S,sucrose Rf 0.36-0.39; 1-K, 1-kestose Rf 0.28-0.29;N, nystose Rf 0.25-0.27; M5, maltopentaose Rf 0.14-0.17; M7, maltoheptaose Rf 0.09-0.10), 2: ChicoryFOS Sigma, 3: Orafti GR, 4: P95 Orafti, 5: CIATEJAgave FOS, 6 to 11 commercial Agave fructans, 6:Fag, 7: Fan, 8: Faa, 9: Fac, 10: Fap, 11: Fai.
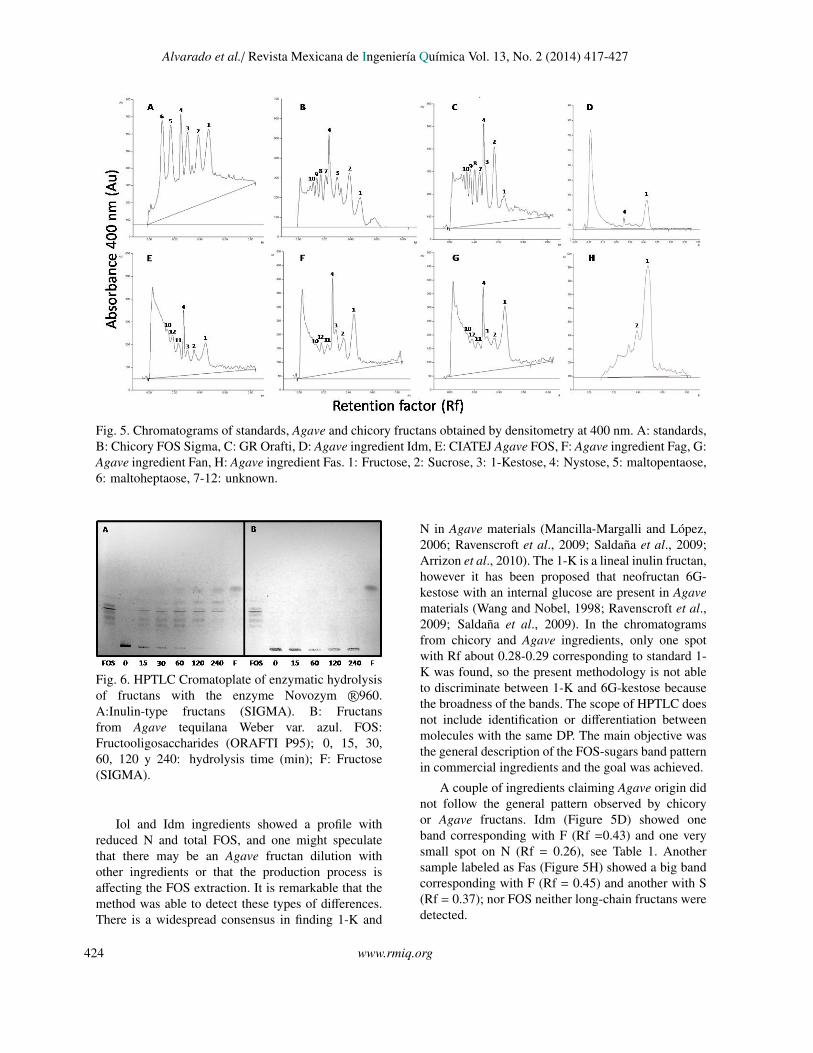
Figure 6 shows the results from a couple ofexperiments of fructan hydrolysis using the enzymecocktail Novozym R©960 (containing mainly an endo-inulinase activity) and revealed through HPTLC. A:showed the hydrolysis of inulin type fructans, theappearance over time of short fructans and thenmono and disaccharides were observed. B: showedon the other hand, a very low rate of Agave fructanshydrolysis, evidenced by the null presence of spotsin the area of short fructans as enzymatic productof hydrolysis, and a very low fructose productionat four hours of reaction. The low activity of endo-inulinases over agave fructans is in accordance withthe reported branched structure of Agave ingredients.This low hydrolysis rate may be a consequence ofsteric impediments that difficult the enzyme attack. Atthe same time, imply that the method of quantificationbased on hydrolysis with inulinase, like AOAC 997.08may be underestimating the Agave fructans contentand that HPTLC of FOS from Agave and the profilingmethod proposed in this study, represent good optionsfor ingredient evaluation with industrial purposes.
All three Agave ingredients used as referencesshowed 1-K and N, with higher proportion of Nthan 1-K (see Table 2). From nine commercialingredients claiming Agave origin, two ingredientsshowed significant differences: Iol did not show 1-K(result not shown), and Idm showed only 50% of 1-Krespect to found in the reference ingredients (Figure5D).
www.rmiq.org 423
Alvarado et al./ Revista Mexicana de Ingenierıa Quımica Vol. 13, No. 2 (2014) 417-427
Fig. 5. Chromatograms of standards, Agave and chicory fructans obtained by densitometry at 400 nm. A: standards,B: Chicory FOS Sigma, C: GR Orafti, D: Agave ingredient Idm, E: CIATEJ Agave FOS, F: Agave ingredient Fag, G:Agave ingredient Fan, H: Agave ingredient Fas. 1: Fructose, 2: Sucrose, 3: 1-Kestose, 4: Nystose, 5: maltopentaose,6: maltoheptaose, 7-12: unknown.
Fig. 6. HPTLC Cromatoplate of enzymatic hydrolysisof fructans with the enzyme Novozym R©960.A:Inulin-type fructans (SIGMA). B: Fructansfrom Agave tequilana Weber var. azul. FOS:Fructooligosaccharides (ORAFTI P95); 0, 15, 30,60, 120 y 240: hydrolysis time (min); F: Fructose(SIGMA).
Iol and Idm ingredients showed a profile withreduced N and total FOS, and one might speculatethat there may be an Agave fructan dilution withother ingredients or that the production process isaffecting the FOS extraction. It is remarkable that themethod was able to detect these types of differences.There is a widespread consensus in finding 1-K and
N in Agave materials (Mancilla-Margalli and Lopez,2006; Ravenscroft et al., 2009; Saldana et al., 2009;Arrizon et al., 2010). The 1-K is a lineal inulin fructan,however it has been proposed that neofructan 6G-kestose with an internal glucose are present in Agavematerials (Wang and Nobel, 1998; Ravenscroft et al.,2009; Saldana et al., 2009). In the chromatogramsfrom chicory and Agave ingredients, only one spotwith Rf about 0.28-0.29 corresponding to standard 1-K was found, so the present methodology is not ableto discriminate between 1-K and 6G-kestose becausethe broadness of the bands. The scope of HPTLC doesnot include identification or differentiation betweenmolecules with the same DP. The main objective wasthe general description of the FOS-sugars band patternin commercial ingredients and the goal was achieved.
A couple of ingredients claiming Agave origin didnot follow the general pattern observed by chicoryor Agave fructans. Idm (Figure 5D) showed oneband corresponding with F (Rf =0.43) and one verysmall spot on N (Rf = 0.26), see Table 1. Anothersample labeled as Fas (Figure 5H) showed a big bandcorresponding with F (Rf = 0.45) and another with S(Rf = 0.37); nor FOS neither long-chain fructans weredetected.
424 www.rmiq.org

Alvarado et al./ Revista Mexicana de Ingenierıa Quımica Vol. 13, No. 2 (2014) 417-427
Table 3. Characteristic bands and Retention factor(Rf) from a) chicory and b) Agave.
a) Chicory ingredients
Rf % area DP Matches withSigma standards
0.42-0.44 14-15 DP 1 fructose0.36-0.39 6-10% DP 2 sucrose0.28-0.29 7-12% DP 3 1-kestose0.24-0.27 13-14% DP 4 nystose0.19-0.22 6% DP ≥ 4 -0.16-0.17 6% DP ≥ 4 -0.12-0.15 5% DP ≥ 4 -0.11-0.12 5% DP ≥ 4 -
b) Agave ingredients
Rf % area DP Matches withSigma standards
0.42-0.44 14-15 DP 1 fructose0.36-0.39 6-10% DP 2 sucrose0.28-0.29 7-12% DP 3 1-kestose0.24-0.27 13-14% DP 4 nystose0.18-0.20 7-9% DP ≥ 4 -0.14-0.16 7 DP ≥ 4 -0.11-0.12 7% DP ≥ 4 -
Fas ingredient meets the characteristic of a productobtained from fructan hydrolysis. The HPTLC methodwas able to find unusual pattern profiles.
ConclusionsThe methodology for studying fructan profiles basedin ultrafiltration and HPTLC in food ingredients,was successfully implemented. In order to achievea repeatability lesser than 3% CV, every run mustinclude a mix of standards, Agave and chicorymaterials and the Rf of N and 1-K must be reset.
Although similar patterns of carbohydratedistribution in chicory and Agave ingredients werefound by ultrafiltration, this is an effective method forscreening and quality control evaluation.
The HPTLC method demonstrated effectiveselectivity of F, S, N and 1-K from the ingredients,so it is a useful method for quality control process andofficial standard evaluation. HPTLC profiling allowedthe discrimination between Agave and chicory FOS, aswell as finding uncommon profiles. A couple of coarsebands with Rf at 0.18-0.20 and at 0.14-0.16 were
found in Agave ingredients, which did not coincidewith bands from chicory materials. Studies aboutmolecular weight, type of branches and identificationof these compounds remain to be determined.
AcknowledgmentAuthors thank for financial support throughSAGARPA grant 109799.
ReferencesArrizon, J., Morel, S., Gschaedler A. and Monsan,
P. (2010). Comparison of the water-solublecarbohydrate composition and fructan structuresof Agave tequilana plants of different ages. FoodChemistry 122, 123-130.
AOAC Official Method 997.08. 2005. Fructans infood products. Ion Exchange ChromatographicMethod. First action 1997. AOAC International45.4.06A.
AOAC Official Method 999.03. 2007.Measurement of fructan in foods.Enzymatic/Spectrophotometric Method. Firstaction 1999. Final action 2005. AOACInternational 45.4.06B.
Baumgartner, S., Dax, T. G., Praznik, W. andFalk, H. (2000). Characterization of the high-molecular weight fructan isolated from garlic(Allium satimum L.). Carbohydrate Research328, 177-183.
BeneoT M P95. Hoja de especificaciones. Doc.CHA3-04-06-06.doc. Orafti. Tienen Belgium.
Beristain, C.I., Cruz-Sosa, F., Lobato-Calleros,C., Pedroza-Islas, R., Rodıguez-Hueso, M.E.,Verde-Calvo, J.R. (2006). Applications ofsoluble dietary fibers in beverages. RevistaMexicana de Ingenierıa Qımica 5, 81-95.
Bonett, G.D., Sims, I. M., Jhon, J.A. St.and Simpson, R. J. (1994). Purification andcharacterization of fructans with β-2,1 andβ-2,6-glycosidic linkages suitable for enzymestudies. New Phytologist 127, 261-269.
Cataldi, T.R.I., Campa, C. and De Benedetto,G.E. (2000). Carbohydrate analysis by high-performance anion-exchange chromatographywith pulsed amperometric detection: the
www.rmiq.org 425

Alvarado et al./ Revista Mexicana de Ingenierıa Quımica Vol. 13, No. 2 (2014) 417-427
potential is still growing. Fresenius Journal ofAnalytical Chemistry 368, 739-758.
Coussement, P.A.A. (1999). Inulin and oligofrucose:safe intakes and legal status. The Journal ofNutrition 129, 1412S-1417S.
Kapiki, A., Costalos, C., Oikonomidou,C., Triantafyllidou, A., Loukatou, EandPertrohilou, V. (2007). The effect of afructo-oligosaccharide supplemented formulaon gut flora of preterm infants. Early HumanDevelopment 83, 335-339.
Kocsis, L., Liebhard, P. andPraznik, W. (2007).Effectof seasonal changes on content and profileof soluble carbohydrates in tubers of differentvarieties of Jerusalem Artichoke (Helianthustuberosus L.). Journal of Agricultural and FoodChemistry 55, 9401-9408.
Lachenmeier, D.W., Sohnius, E.M., Attig, R.and Lopez, M.G. (2006). Quantification ofselected volatile constituents and anions inMexican Agave spirits (tequila, mezcal, sotoly bacanora). Journal of Agricultural and FoodChemistry 54, 3911-3915.
Lopez, M.G., Mancilla-Margalli, N.A. and Mendoza-Dıaz, G. (2003).Molecular structures of fructansfrom Agave tequilana Weber var. azul. Journalof Agricultural and Food Chemistry 51, 7835-7840.
Lopez, M.G. and Urıas-Silva, J.E. (2007).Agavefructans as prebiotics. Recent Advances inFructooligosaccharides Research 37, 1-14.
Madrigal, L. and Sangronis, E. (2007).Lainulina y derivados como ingredientesclaves en alimentos funcionales. ArchivosLatinoamericanos de Nutricion 57, 387-396.
Mancilla-Margalli, N. and Lopez, M. (2006).Water-soluble carbohydrates and fructan structurepatterns from Agave and Dasylirion species.Journal of Agricultural and Food Chemistry 54,7832-7839.
Menne, E.,Guggenbuhl, N. and Roberfroid, M.(2000). Fn-type chicory inulin hydrolysate hasa prebiotic effect in humans. The Journal ofNutrition 130, 1197-1199.
Meyer, D. and Stasse-Wolthuis, M. (2009). Thebifidogenic effect of inulin and oligofructoseand its consequences for gut health. EuropeanJournal of Clinical Nutrition 63, 1277-1289.Molina-Guerrero, J.A., Botello-Alvarez, J.E.,Estrada-Baltazar, A., Navarrete-Bolanos, J.L.,Jimenez-Islas, H., Cardenas-Manrıquez, M. andRico-Martınez, R. (2007). Compuestos volatilesen el mezcal. Revista Mexicana de IngenierıaQuımica 6, 41-50.
Moreno-Vilet, L., Moscosa-Santillan, M., Grajales-Lagunes, A., Gonzalez-Chavez, M., Bonnin-Paris, J., Bostyn, S. and Ruiz-Cabrera, M.(2013). Sugars and fructans separation bynanofiltration from model sugar solution andcomparative study with natural Agave juice.Separation Science and Technology 48, 1768-1776.
NMX-F-591-SCFI-2010. Alimentos - fructanosde Agave - especificaciones, etiquetadoy metodos de ensayo (prueba). DiarioOficial de la Federacion. Disponible en:http://200.77.231.100/work/normas/nmx/2010/nmx-f-591-scfi-2010.pdfAccessed in May, 2013.
Ortiz-Basurto, R. I., Porcelly, G., Doco, T.,Williams, P., Dornier, M. and Belleville,A.(2008). Analysis of the main componentsof the Aguamiel produced by the Maguey-Pulquero (Agave mapisaga) throughout theharvest period. Journal of Agricultural and FoodChemistry 56, 3682-3687.
Praznik, W. and Huber, A. (2005). De factomolecular weight distributions of glucansby size-exclusion chromatography combinedwith mass/molar-detection of fluorescencelabeled terminal hemiacetals. Journal ofChromatography B 824, 295-307.
Prosky, L. and Hoebregs, H. (1999). Methods todetermine food and oligofructose. The Journalof Nutrition 129, 1418S-1423S.
Raftiline R©GR. Product sheet. Doc. A4-03*01/02.Tienen, Belgium.
Rao, V. A. (2001). The prebiotic properties ofoligofructose at low intake levels. NutritionResearch 21, 843-848.
Ravenscroft, N., Cescutti, P., Haershaw, M.,Ramsout, R., Rizzo, R. and Timme, E. (2009).
426 www.rmiq.org
Alvarado et al./ Revista Mexicana de Ingenierıa Quımica Vol. 13, No. 2 (2014) 417-427
Structural analysis of fructans from AgaveAmericana grown in South Africa for spiritproduction. Journal of Agricultural and FoodChemistry 57, 3995-4003.
Roberfroid, M.B. (2005). Introducing inulin-typefructans. British Journal of Nutrition 93S, S13-S25.
Robinson, S., Bergstrom, E., Seymour, M.and Thomas-Oates, J. (2007). Screening ofunderivatized oligosaccharides extracted fromthe stems of Triricuma estivum using porousgraphitized carbon liquid chromatography-Massspectrometry. Analytical Chemistry 79, 2437-2445.
Saldana, O.I., Ritsema, T. and Pearce, S.R.(2009). Analysis and characterization of fructanoligosaccharides and enzymatic activities in theleaves of Agave tequilana (Weber) var. ’Azul’.Dynamic Biochemistry, Process Biotechnologyand Molecular Biology 3SI1, 40-51.
Tellez-Mora, P., Peraza-Luna, F.A., Feria-Velasco, A. and Andrade-Gonzalez, I. (2012).Optimizacion del proceso de fermentacionpara la produccion de tequila, utilizando lametodologıa de superficie de respuesta (MSR).Revista Mexicana de Ingenierıa Quımica 11,163-176.
Van den Heuvel, E.G., Muys, T., van Dokkum,W. and Schaafsma, G. (1999). The AmericanJournal of Clinical Nutrition 69, 544-548.
Wang, N. and Nobel, P.S. (1998). Phloem transportof fructans in the crassulacean acid metabolismspecies Agave deserti. Plant Physiology 116,709-714.
Yildiz, S. (2011). The metabolism offructooligosaccharides and fructooligosaccharide-related compounds in plants. Food ReviewsInternational 27, 16-50.
Zdunczyk, Z., Juskiewicz, J., Stanczuk, J.,Jankowski, J. and Krol, B. (2007). PoultryScience 86, 1133-1139.
www.rmiq.org 427